Differential infant and child mortality in three Dutch regions
38
Economic History Review , LVIII, 2 (2005), pp. 272–309 © Economic History Society 2005. Published by Blackwell Publishing, 9600 Garsington Road, Oxford OX4 2DQ, UK and 350 Main Street, Malden, MA 02148, USA. Blackwell Publishing Ltd.Oxford, UK and Malden, USAEHRThe Economic History Review0013-0117Economic History Society 20052005 LVIII 2272309Articles DUTCH DIFFERENTIAL INFANT AND CHILD MORTALITYFRANS VAN POPPEL, MARIANNE JONKER, AND KEES MANDEMAKERS Differential infant and child mortality in three Dutch regions, 1812–1909 1 By FRANS VAN POPPEL, MARIANNE JONKER, and KEES MANDEMAKERS I ince the 1980s, socio-economic inequality in mortality has become a continuous topic of academic interest, and a key issue of attention to policymakers in many European countries. The Netherlands is no exception to that rule. A bibliometric analysis showed that in The Netherlands, an explosive growth of the number of publications on the topic took place after 1980; until that year, the number of publications had fluctuated at a rather low level. 2 Interest in the issue arose in the middle of the nineteenth century, when the sanitary reformers started to point to the fact that differences in death rates between poor and rich people were very high. In their opinion, good health was not a privilege of the higher social classes, but rather something that could be claimed by everybody. 3 In particular, socio- economic inequality in the mortality of children attracted attention. This was not only because in this age group, death risks were extremely high; mortality differences between children were also regarded as less acceptable because children had no choice in their living conditions. Epidemiologists have recently become interested in the history of socio- economic inequalities in infant and child mortality, as trends over time developed into an important contemporary political issue: a possible per- sistence of mortality differences indicates that efforts to improve the health of the lowest socio-economic groups have not been fully effective. 4 Without a long-run perspective, it is not clear whether the disparities observed over, 1 This research is a part of the Early-life Conditions, Mortality and Longevity project, called Health Inequalities in Life Course Perspective . We have benefited from support from the National Institute of Health, NIH Grant no 1 P01AG18314-01A1. Earlier versions of this article were presented at the ‘Workshop on Large Databases: Results and Best Practices’, organized by the Historical Sample of The Netherlands and the International Institute for Social History (17–18 May 2001 in Amsterdam) and at the Fifth Conference of the European Association for the History of Medicine and Health, ‘Health and the Child: Care and Culture in History’, (Geneva Medical School, 13–16 September 2001). 2 Mackenbach, Stronks, and van Trirum, ‘Sociaal-economische gezondheidsverschillen’. 3 Houwaart, De hygiënisten , pp. 248–250; Van Dijk, Dol, Groothoff, and van Rossum, ‘Interest in the issue’; Mackenbach, Stronks, and van Trirum, ‘Sociaal-economische gezondheidsverschillen’. 4 Pamuk ‘Social-class inequality’; for a recent Dutch example see Sociaal-economische gezondheidsver- schillen . S
Transcript of Differential infant and child mortality in three Dutch regions

Economic History Review
, LVIII, 2 (2005), pp. 272–309
©
Economic History Society 2005. Published by Blackwell Publishing, 9600 Garsington Road, Oxford OX4 2DQ, UK and 350 Main Street,Malden, MA 02148, USA.
Blackwell Publishing Ltd.Oxford, UK and Malden, USAEHRThe Economic History Review0013-0117Economic History Society 20052005
LVIII
2272309Articles
DUTCH DIFFERENTIAL INFANT AND CHILD
MORTALITYFRANS VAN POPPEL, MARIANNE JONKER, AND KEES MANDEMAKERS
Differential infant and child mortality in three Dutch regions,
1812–1909
1
By FRANS VAN POPPEL, MARIANNE JONKER, and KEES MANDEMAKERS
I
ince the 1980s, socio-economic inequality in mortality has become acontinuous topic of academic interest, and a key issue of attention to
policymakers in many European countries. The Netherlands is no exceptionto that rule. A bibliometric analysis showed that in The Netherlands, anexplosive growth of the number of publications on the topic took place after1980; until that year, the number of publications had fluctuated at a ratherlow level.
2
Interest in the issue arose in the middle of the nineteenth century,when the sanitary reformers started to point to the fact that differences indeath rates between poor and rich people were very high. In their opinion,good health was not a privilege of the higher social classes, but rathersomething that could be claimed by everybody.
3
In particular, socio-economic inequality in the mortality of children attracted attention. Thiswas not only because in this age group, death risks were extremely high;mortality differences between children were also regarded as less acceptablebecause children had no choice in their living conditions.
Epidemiologists have recently become interested in the history of socio-economic inequalities in infant and child mortality, as trends over timedeveloped into an important contemporary political issue: a possible per-sistence of mortality differences indicates that efforts to improve the healthof the lowest socio-economic groups have not been fully effective.
4
Withouta long-run perspective, it is not clear whether the disparities observed over,
1
This research is a part of the
Early-life Conditions, Mortality and Longevity
project, called
HealthInequalities in Life Course Perspective
. We have benefited from support from the National Institute ofHealth, NIH Grant no 1 P01AG18314-01A1. Earlier versions of this article were presented at the‘Workshop on Large Databases: Results and Best Practices’, organized by the Historical Sample of TheNetherlands and the International Institute for Social History (17–18 May 2001 in Amsterdam) and atthe Fifth Conference of the European Association for the History of Medicine and Health, ‘Health andthe Child: Care and Culture in History’, (Geneva Medical School, 13–16 September 2001).
2
Mackenbach, Stronks, and van Trirum, ‘Sociaal-economische gezondheidsverschillen’.
3
Houwaart,
De hygiënisten
, pp. 248–250; Van Dijk, Dol, Groothoff, and van Rossum, ‘Interest in theissue’; Mackenbach, Stronks, and van Trirum, ‘Sociaal-economische gezondheidsverschillen’.
4
Pamuk ‘Social-class inequality’; for a recent Dutch example see
Sociaal-economische gezondheidsver-schillen
.
S

DUTCH DIFFERENTIAL INFANT AND CHILD MORTALITY
273
©
Economic History Society 2005
for example, the last four decades, are large or small by historical standards.As Ferrie has noted, these disparities might be the continuation of pooroutcomes for poor people, but they might also be a product of advance-ments in medicine and technology in the late twentieth century that havegiven a new advantage to those with the incomes to purchase them. Know-ing how health outcomes differed by economic status in an earlier era, whenmedical knowledge was rudimentary, can help distinguish between theseexplanations.
5
Historians have taken up the issue of socio-economic differences in infantand child mortality to judge more precisely how processes such as urban-ization, industrialization, and medicalization have affected the health ofsocial classes in varying degrees. Edvinsson has argued that information on(changes in) social differences in mortality might shed light on the factorsbehind the mortality decline: if it were the economically more advancedgroups that experienced the mortality decline earlier on or faster thanimpoverished groups in society, economic explanations of the decline inmortality would gain support.
6
The re-emergence of the importance of geography is central to the ongo-ing historical debate about socio-economic differences in infant and childmortality. During the last two decades, many authors have pointed to thefact that social class differences might reflect significantly the influence ofspatial factors such as the quality of sewerage, water supply, or air.
7
Differ-ences emerge because the higher social classes tended to live in the betterenvironments, and the lower classes in the poorer environments. As aconsequence of data limitations, the possibilities for disentangling the influ-ences of locality and social class are very restricted. This is even more thecase when the objective is to study socio-economic effects over time, as dataare mostly only available from the last quarter of the nineteenth centuryonwards.
A further complication is the fact that the effect of socio-economic factorsand environmental factors might differ considerably over age groups.
8
Theimpact of socio-economic factors on mortality at different ages varies,however, for modern and historical data. Changes in the cause-of-deathpanorama, as well as selection effects, might play a role in this. Studies thatexamine the way in which the relationship between socio-economic factors,locality, and mortality changes with age among children are very limited.
In this article, we try to add to our knowledge of the long-term trends insocial inequality in infant and childhood mortality. By studying data for TheNetherlands from 1812 to 1912, we are able to study a much longer time
5
Ferrie, ‘The rich and the dead’.
6
Edvinsson, ‘Social differences’.
7
Woods,
Demography of Victorian England
, pp. 203–4; Reid, ‘Locality or class’, 132–3; Garret et al.,
Changing family size
, 139–72; Spree,
Soziale Ungleichheit
, pp. 89–90; Smith ‘Mortality differentials’.
8
Garrett et al.,
Changing family size
, 196; Ferrie, ‘The rich and the dead’; Currie and Stabile,
Socioeconomic status and health
.

274
FRANS VAN POPPEL, MARIANNE JONKER, AND KEES MANDEMAKERS
©
Economic History Society 2005
period than is usually possible, and to focus on an era in which the mortalitytransition took place. By studying three provinces, each with its particularecological and economic structure, we are able to distinguish the effects ofthe environment, and those of the social class to which children belonged.Lastly, by analysing infant and early childhood mortality (for ages one tofive) separately, we are able to find out whether the relationship betweenmortality, locality, social class, and age has changed over time.
II
Most studies of trends in socio-economic differences in infant mortality onlyfocus on a very restricted time period, and most are based on secondaryanalysis of a few studies from different environments.
9
Comparisons overtime are very difficult to make because of changes in successive occupationalclassifications upon which social groups are based. The change in the diseasepanorama, from one in which poor environmental conditions were the mainfactor behind the major infant killers to one in which congenital diseaseswere the main cause of infant death, adds to the problems.
10
Antonovsky and Bernstein’s 1977 study is one of the first in which long-term trends in socio-economic differences in infant mortality were analysed.The authors argued that between 1910 and 1960, the gap in infant mortality(IMR: deaths under one year of age per 1,000 live births) between thehighest and lowest social classes in the Western world had been closing. Theclosing of this gap was primarily a product of the decline in post-neonataldeaths (second to twelfth months), the category which was and is charac-terized by the largest mortality differences between social classes. Whenpost-neonatal and neonatal mortality were viewed separately, the long-termpattern of differences by social class was characterized by a persisting inverserelationship between social class and mortality.
11
One of the hypothesessuggested to explain the persistence of the difference was the time-lagargument, which posits that as new medical knowledge, techniques, andservices become available, their benefits are likely to be felt first by the upperclasses, and only after time to filter downwards. Whether this delay is a resultof the lower level of education of the poor, their resistance to new ideas,their inability to finance such services, or the failure of the health establish-ment to provide them, is unclear. A competing explanation stresses the roleof social mobility, and suggests that women with good childhood health,education, and other assets tend to be upwardly mobile, while those lackingthese assets will be downwardly mobile. This selective reshuffle creates apermanent tendency for class rates to diverge.
Antonovsky’s study was based on a mix of data for whole countries, andseparate cities in Sweden, Austria, the USA, and Great Britain, for a variety
9
Edvinsson, ‘Social differences’; Woods, Williams, and Galley, ‘Infant mortality in England’.
10
Williams, ‘Death in its season’.
11
Antonovsky and Bernstein, ‘Social class and infant mortality’.

DUTCH DIFFERENTIAL INFANT AND CHILD MORTALITY
275
©
Economic History Society 2005
of years, and related to a period in which the mortality decline was wellunder way. Rainer Spree focused on an earlier stage of the health transition,and shifted the attention away from England.
12
Spree studied trends insocial class differences in infant mortality in Prussia from the last quarterof the nineteenth century to the first decade of the twentieth. Socialinequality before death was almost non-existent between 1875 and 1886.Between 1886 and 1903, inequality between socio-economic groupsincreased. A decrease in infant mortality took place within the professionalclass and the middle class, whereas the working class underwent a slightdeterioration of their situation. From 1902 onwards, infant mortality ratesdecreased in all social groups, but the pace of the decline differed. Therationalization of private life—in the form of birth control, the increase ofreal incomes, and a more purposeful use of available material resourcesand time—was the determining factor for the increase in the life chancesof children, and it was in the ‘new middle class’ that this process first tookplace. This rationalization process took place earlier among groups that wereintegrated in the urban-industrial world: the industrial and tertiary-sectorworking class was better off than the agrarian sector.
Spree stressed the fact that the level of socio-economic inequalitydepended on the specific socio-historical context in which individuals lived.During the industrialization period, the old rural hygiene and sanitarycustoms were no longer adequate. The failure to remove waste and sewage,and to maintain a pure water supply, provided a breeding ground forbacteria. This combined with the high population density and typical over-crowded housing to create conditions that fostered the spread of contagiousdiseases. Migration to the city, and city life itself, meant both the breakdownor weakening of extended family ties and the dissolution of the mutual helparrangements that were so essential in caring for infants and nursing thesick. The governmental assumption of responsibility for society-wide imple-mentation of sanitation reforms and hygiene programmes did redress thissituation. These reforms equalized the conditions of the social strata, andcaused an absolute and relative improvement in the position of low-statussegments.
The interplay between social class and the socio-historical environmenthas also been a key issue in several studies published in the last decade onthe socio-economic differences in mortality in England and Wales in theperiod 1890–1910. These studies were mostly based on outcomes of the1911 census. Indirect mortality techniques were applied to these data, andthe authors make it clear that this made it difficult to examine trends ininfant mortality by subgroups.
13
What the results of these studies did showwas that both environment—classified on the basis of the industrial struc-ture of the area—and social class had marked effects on the prospects for
12
Spree,
Soziale Ungleichheit
, pp. 89–90.
13
Garrett et al.,
Changing family size
, 196.
276
FRANS VAN POPPEL, MARIANNE JONKER, AND KEES MANDEMAKERS
©
Economic History Society 2005
infant survival. When both social class and environment were included in aregression analysis, the effect of environment remained largely unchanged,whereas that of social class was substantially lessened by the inclusion ofenvironment. The favourable position of the higher social classes and agri-cultural labourers was to a large extent produced by the spatial segregationof social classes: the higher social classes tended to live in the better envi-ronments, and the lower classes in the poorer environments.
14
These studiesconfirmed an earlier study by Woods and colleagues that showed thatthe aggravation of class differentials in infant mortality during the period1895–1910 in England and Wales was strongly dependent on the environ-ment.
15
Within urban areas, class differentials were greatly accentuated inneighbourhoods with poor environmental conditions. The professional classshowed the largest reduction of infant mortality, because the infants wereconcentrated in urban areas, and thus benefited disproportionately from theimprovement in urban conditions.
16
The above-mentioned studies relate mostly only to the period of declininginfant mortality—from the late nineteenth century onwards—and refer torelatively short periods. Data on socio-economic mortality differentialsbefore the health transition are rarely included. In hypotheses about trendsin social inequality, this is nonetheless a crucial element. According toSmith, the first phases of the health transition were associated with awidening of socio-economic differentials in infant mortality precisely as aconsequence of the absence or modest size of such differentials
before
thetransition.
17
In a mortality regime dominated by variations in the incidenceof infectious diseases, it was location in a spatially structured disease envi-ronment—presence of effective sewerage and treated water—that matteredmost for mortality variation, not the advantages or disadvantages dependentupon the status of individuals. As elites intermingled freely with lower-stratamembers, especially servants, and could not stay isolated from them, mor-tality risks did not differ much between the social classes. From the latenineteenth century onwards, more affluent groups distanced themselvesfrom higher mortality groups and areas—the use of servants declined, andresidential segregation increased—resulting in an increase in mortality dif-ferentials between groups.
Earlier Dutch studies contain data on socio-economic differences ininfant mortality for the period before, during, and after the health transition.They were, however, only based on data for Amsterdam and/or made useof a variety of socio-economic criteria and mortality measures, makingresults hardly comparable over time.
18
For Sweden, Edvinsson recently
14
See e.g. Reid, ‘Locality or class’, 137–8; Garrett et al.,
Changing family size
, 149–54. For an identicalconclusion based on a local study see, Williams, ‘Death in its season’.
15
Woods, Williams and Galley, ‘Infant mortality in England’.
16
Woods and Williams, ‘Must the gap widen’.
17
Smith, ‘Mortality differentials’;
idem
, ‘Differential mortality’.
18
van Poppel, ‘The relationship’; van de Mheen, Reijneveld, and Mackenbach, ‘Socioeconomicinequalities’.

DUTCH DIFFERENTIAL INFANT AND CHILD MORTALITY
277
©
Economic History Society 2005
compared infant and childhood mortality in two regions in the north ofSweden. The parishes in the regions were categorized into four groups:urban, industrial, rural, and foundries. Two periods were distinguished,before and after 1860. In the Sundsvall region, differences between socialgroups were small in the pre-industrial period, but after the start of indus-trialization, in 1860, a more distinct social pattern could be distinguished,in which the wealthiest group had the lowest infant mortality. For childhoodmortality, no clear pattern could be found in the first period, but a socialgradient became more apparent again after 1860, with the highest socialstrata having the highest survival chances for their children. Children agedfrom one to four were more sensitive to social conditions than infants. Inthe more agrarian low-mortality Skellefteå region, no clear-cut patterncould be found in the survival of children from different social classes. Theconclusion was therefore that the pattern of social inequality differreddepending on period and environment, and that childhood mortality wasmore sensitive to the social conditions than infant mortality.
19
This conclu-sion is in line with that of Garrett et al. In favourable environments, theyalso observed very little difference between the child mortality experiencesof different classes.
20
The findings presented above make it clear that it is difficult to generalizefrom the restricted number of studies on trends in socio-economic mortalitydifferences: considering more than one community or type of communityin different environments is a necessity before firm conclusions can bereached. In this article, we try to add to our knowledge of the long-termtrends in social inequality in infant and childhood mortality by studyingdata for The Netherlands from 1812 to 1912. Our study has several distinc-tive traits, which allow us to partly overcome the drawbacks of earlierstudies. First of all, we go back to the original data sources, making itpossible to gather comparative information at the micro-level on the socio-economic characteristics of the deceased, and to apply an identical occupa-tional class scheme. Second, we are able to study a long time period, duringwhich The Netherlands underwent radical changes in its economic, social,and family structure—income growth, industrialization, and urbanization.Third, we study a large part of an entire country, not a single community:three of the eleven Dutch provinces, each with its particular ecological,social, and economic structure, covering large cities, smaller cities, and ruralareas.
Although our study has mainly an exploratory character, we pay partic-ular attention to the effects of time, environment, and age on social classdifferences in mortality.
Our first hypothesis is that the relationship between social class andmortality strongly depends on the age of the persons concerned: infants are
19
Edvinsson, ‘Social differences’.
20
Garrett et al.,
Changing family size
, p. 155.

278
FRANS VAN POPPEL, MARIANNE JONKER, AND KEES MANDEMAKERS
©
Economic History Society 2005
less sensitive to social conditions than children aged one or older, becausedifferences in breast-feeding and weaning practices, which are more or lessindependent of socio-economic conditions, are more important for survivalin the first age group than strict economic factors such as access to betterquality food, housing conditions, living in residential areas with bettersanitary facilities, better access to medical support, and greater knowledgeon means to control personal illnesses. A number of studies have shownthat infant feeding practices were sufficiently important to have given eventhe most economically disadvantaged groups relatively favourable levels ofinfant mortality.
21
Mixed-fed and weaned infants living in poor sanitaryconditions faced more exposure to food-borne pathogens than similarly fedinfants in less-contaminated environments. Thus, exclusive breast-feedingcould provide greater protection to infants living in highly contaminatedenvironments.
22
We test this hypothesis by comparing infant and early-childhood mortality levels for various social classes.
The second hypothesis is that the level of social inequality in a specificenvironment depends on the presence of specific risk factors that mightaffect all social classes at the same time. This hypothesis will be tested bycomparing differences in mortality between social classes separately fordifferent regions, as well as for urban–rural regions. In particular we expectthat in two of the provinces that we study, Zeeland and much of Utrecht,social class differences will be less pronounced than in large parts ofFriesland. The reason is that the sanitary situation in the first two provinceswas generally worse than in Friesland, because of the gradual salinization,and the high water table. This rendered the restricted volume of sweet-running and well water undrinkable, and provided an ideal environment forthe larvae of the malaria-carrying mosquito, thereby making malaria virtuallyendemic in this part of The Netherlands until about 1870. The salinizationand the high level of environmental contamination of the water enormouslyincreased the risk of diarrhoea, the most important cause of death amonginfants. High and low social classes had to live with the consequences ofthis situation. The absence of strict residential segregation between socialclasses also has to be considered as part of this equalizing effect.
A second characteristic of the environment that might affect the level ofsocial differences in mortality is the urban or rural character of the region.There are reasons to expect that the health situation of the lower socialclasses differred less from that of higher classes in rural areas than in urbanareas. Factors suggesting more equity between social classes in rural areasinclude the higher level of self-sufficiency in rural areas, with a large partof the population having a section of land at its disposal on which they couldgrow their own produce, and better access to a familial network, offeringmaterial support, information on vital matters, and social contacts of an
21
Woods, Williams, and Galley, ‘Infant mortality in England’.
22
VanDerslice, Popkin, and Briscoe, ‘Drinking-water quality’.

DUTCH DIFFERENTIAL INFANT AND CHILD MORTALITY
279
©
Economic History Society 2005
emotional nature. In the cities, the low degree of residential segregationbetween the social classes hints at more equality. In densely populated areas,where communications with other places were intense, air-borne contagiousdiseases could spread rapidly, because there were many ways of becomingcontaminated, and only a few ways to isolate infected individuals. Escapingthe problems of sanitation that followed concentrations of populations wasalso more difficult for members of higher social classes in urban areas thanit was in rural regions. To study whether or not the adverse effects of livingin urban areas held only for low-class inhabitants and not for their better-off neighbours, we compared IMR and ECMR by socio-economic statusfor urban and rural areas.
Our third hypothesis deals with the development of social differences overtime. Following Edvinsson, Spree, and Smith we expect to find that differ-ences between social classes increased over time. Although the seculareconomic development in The Netherlands showed continuous improve-ment from 1864,
23
and public health policy aimed at improving publichealth and reducing health differences started after 1875, partly stimulatedby these same economic factors,
24
we expect to find that clear decreases inthe degree of social inequality in infant mortality did not take place in thelast quarter of the nineteenth century. From about the 1870s onwards,water technology was much improved, and there was a gradual improve-ment of the health situation in Zeeland and Utrecht.
25
The more wealthygroups could take advantage of the new possibilities created by medicalknowledge and improved sanitary standards at an earlier stage. Increasedsocial segregation added to the health variation between social classes.
After discussing the data, we first analyse the global development of infantand childhood mortality in the selected regions. In the second stage, wefocus on the effects of socio-economic position by analysing some descrip-tive measures. Lastly, we test the hypotheses by doing a multivariate analysisof the data.
III
The data that are used in this analysis come from the so-called ‘HistoricalSample of the Population of the Netherlands’ (HSN). The aim of thisproject is to build a national database with information on the complete lifehistory of a 0.5 percent random sample (76,700 birth records) of men andwomen born in The Netherlands between 1812 (the introduction of thevital registration system) and 1922. In all Dutch provinces, a randomsample of births was drawn, which was stratified by period of birth (11periods) and level of urbanization of the municipality.
26
In this article,
23
Vermaas, ‘Wages, salaries and income’.
24
Mackenbach,
De veren van Icarus
.
25
Wolleswinkel-van den Bosch, van Poppel, and Mackenbach, ‘Reclassifying causes of death’.
26
Mandemakers, ‘The Netherlands’.

280
FRANS VAN POPPEL, MARIANNE JONKER, AND KEES MANDEMAKERS
©
Economic History Society 2005
information is used on those three of the eleven Dutch provinces for whichthe collection of information on life histories has progressed most: Utrecht,Zeeland, and Friesland.
Utrecht, located in the centre of the country, had as its most importanttowns Amersfoort and the capital city of Utrecht. The latter city was anindustrial centre, as well as an important garrison-town, and a centre oftrade and services. In the rest of the province, agricultural employmentdominated. Much of Zeeland, a province situated at the south-westernpart of the coastal zone, was below sea level, and protected by a system ofriver- and sea-dykes. The towns of Middelburg and Vlissingen, with around15,000 inhabitants each in the 1850s, were the respective administrativeand industrial centres of the province.
27
In 1859, 60 per cent of the popu-lation was working in agriculture. In the second half of the nineteenthcentury, agricultural modernization eroded the position of the small farmerand farm labourer, leading to very high out-migration. Friesland, in thenorth-eastern part of the country, also was a mainly rural province, the onlylarger town being Leeuwarden. The relatively prosperous agricultural econ-omy was strongly commercialized. Industrial breakthrough began in theearly 1880s. Like Zeeland, it was heavily affected by the agrarian depression,leading to very high emigration in the period 1881–1915.
28
The three provinces act as a perfect illustration of the sharp dividebetween the high mortality levels of the coastal and low-lying riverinemunicipalities, and the low levels of the area in the north, characterizingThe Netherlands until late in the nineteenth century. In large parts of thewestern Netherlands, including the provinces of Zeeland and Utrecht, onein four infants were likely to die within their first year. The infant mortalityrates were very low in Friesland, where less than 100 children per 1,000live births died before reaching the age of one. It was only in the last decadesof the nineteenth century that the provinces of Zeeland and Utrecht reachedlower IMR, whereas Friesland kept its favourable position.
29
The high mortality in the west during the nineteenth century was largelya result of the specific ecological conditions of this region: the contamina-tion of the surface water because of insufficient environmental sanitation,particularly in urban and densely-populated rural areas; the salinization ofthe surface and ground water wherever seawater could penetrate inland; theresulting lack of water acceptable for household purposes; and the highfrequency of malaria. The high population density in the western part ofthe country also contributed to the high mortality level. In 1860, the ruralareas of the two Western provinces still had higher population densities thanmost provinces in the north, south, and east.
27
Wintle, ‘Aspects of religion’; Priester,
Geschiedenis van de Zeeuwse landbouw
.
28
Frieswijk,
Geschiedenis van Friesland
; Galema,
Frisians to America
.
29
van Poppel and Beekink, ‘De biometer’.

DUTCH DIFFERENTIAL INFANT AND CHILD MORTALITY
281
©
Economic History Society 2005
IV
In order to estimate infant mortality (before the age of one) and childmortality (between the ages of one and five years) data are needed on thedates of death of children who died in these age intervals, and on thenumbers of infants and children who survived the age intervals 0–1 and1–5 years. For all births in the sample, the death certificates of the munic-ipality of birth were checked for 10–20 years following the year of birth.For the provinces of Utrecht, Zeeland, and Friesland, an electronic database(under construction), with information on death records for all municipal-ities relating to the respective periods 1812–1940 and 1812–1922, was alsoavailable. For the provinces of Utrecht and Zeeland, and to a much lesserextent Friesland, municipal population registers, which combine censuslistings with vital registration in an already-linked format from 1850 until1939, were also used. In the 1930s, the population register was replacedby the personal record card, with each individual person registered. Atthe moment of death, this card is removed from the municipal files andultimately sent to the Central Genealogical Bureau. Cards of all peoplewho died between 1 January 1940 and 30 September 1994 are availablefor research. For individuals who died after that date, extracts from theso-called Municipal Basic Administration can be collected, containingthe same information. Dates of death could only be found for a part of thesample of births, because of migration. However, for many individuals, adate of marriage could be found in the marriage registers of the communityin which the person was born or in another municipality, making it possibleto conclude that the person was alive at least up to the date of marriage.Marriage registers were consulted in all three provinces.
Table 1 shows the number of births in the sample, the numbers of deathsin age groups 0–1 and 1–5, and the numbers of births for which informationabout survival status after the age ranges 0–1 and 1–5 is available (from apopulation register, a marriage certificate, or a death certificate).
Over all provinces and over the whole period taken together, the survivalstatus for the age interval 0–1 years could be reconstructed for 83 per centof all births. By subtracting the number of deaths in age group 0–1 from thenumbers of births, a maximum estimate of the number of children survivinguntil the age of one is obtained. The number of children for whom thesurvival status for the age interval 1–5 years could be reconstructed—through death after age one or through other information on survival statusafter age five—is 79 per cent of this maximum. These percentages varyconsiderably by period of birth and province. The low percentages in theoldest cohorts are because population registers are not available as a sourceof information before 1850. For the most recent cohorts, the percentagewith unknown survival status is high (mainly because a considerable propor-tion of the people born in these cohorts are still alive): it was thereforedecided to exclude children born in the period 1910–1922 from the analy-sis. This increased the percentages of children for whom information on

282
FRANS VAN POPPEL, MARIANNE JONKER, AND KEES MANDEMAKERS
©
Economic History Society 2005
Table 1.
Number of individuals in sample, and percentages with known survival status in age intervals 0–1 and 1–5 years, by period of birth and province
Zeeland
Period of birthNumber of
births
Number ofdeaths inage group
0–1
% of all birthsfor which
survival status isknown for interval
0–1 years
Number ofdeaths inage group
1–5
% of all childrenknown to havesurvived age 1
of which survivalstatus is known
for interval1–5
1811–19 320 75 72.5 20 64.11820–29 390 98 80.5 41 74.01830–39 478 125 80.1 43 73.11840–49 427 110 79.2 52 71.91850–59 476 143 80.5 53 70.61860–69 518 128 88.4 48 82.31870–79 418 92 90.9 29 85.91880–89 323 53 93.2 21 89.61890–99 359 58 94.7 19 93.41900–09 349 54 91.7 13 87.11910–22 385 28 74.2 9 68.9
Total 4443 964 83.9 348 78.2
Utrecht
Period of birthNumber of
births
Number ofdeaths inage group
0–1
% of all birthsfor which
survival status isknown for interval
0–1 years
Number ofdeaths inage group
1–5
% of all childrenknown to havesurvived age 1
of which survivalstatus is known
for interval1–5
1811–19 160 27 78.1 15 73.71820–29 228 35 86.4 20 82.41830–39 266 45 86.1 29 83.31840–49 244 54 94.7 28 92.11850–59 286 71 96.9 34 94.41860–69 291 73 97.6 39 95.91870–79 372 96 97.0 26 95.71880–89 383 88 97.7 30 96.31890–99 420 76 98.1 35 96.81900–09 450 60 90.2 22 88.51910–22 569 16 49.2 5 47.0
Total 3669 641 86.6 283 83.0
survival status was available to 86 per cent (age interval 0–1) and 82 per cent(interval 1–5). The differences between provinces reflect the fact that theHSN started in Zeeland and Utrecht, as a result of which the searchingprocedure has been going on there for a longer period. Some of the differ-ences relate to varying rates of emigration from the provinces, but only a

DUTCH DIFFERENTIAL INFANT AND CHILD MORTALITY
283
©
Economic History Society 2005
Table 1.
Continued
Friesland
Period of birthNumber of
births
Number ofdeaths inage group
0–1
% of all birthsfor which
survival status isknown for interval
0–1 years
Number ofdeaths inage group
1–5
% of all childrenknown to havesurvived age 1
of which survivalstatus is known
for interval1–5
1811–19 356 32 78.9 21 76.91820–29 497 49 83.1 36 81.31830–39 579 58 81.0 45 78.91840–49 600 60 82.2 34 80.21850–59 625 81 78.7 53 75.61860–69 716 103 81.8 54 78.81870–79 620 91 81.8 37 78.61880–89 504 50 85.9 47 84.41890–99 494 55 84.8 24 82.91900–09 308 27 79.5 13 77.61910–22 306 16 53.3 6 50.7
Total 5,605 622 80.3 369 77.8
proportion of the individuals whose deaths were not recorded had migratedto another region.
30
Because the availability of information on survival varies according toperiod of birth, social class, and region, social-class variations in mortalityover time and region partly depend on the way in which missing observa-tions—children for whom no date of death, or date of last observation sincebirth is available—are handled. The estimation of mortality rates in caseswhere the date of out-migration or the date of marriage of an individual arenot recorded is a problem, for which no standard statistical solutions areavailable. Several methods have been proposed, among others by Blum,Ruggles, and Wrigley et al. Their methods do not really apply to the presentsituation, because they were restricted to the estimation of adult mortality,using information only on the married population.
31
Jonker estimated amortality curve from which infant and childhood mortality could easily bededuced, assuming that infants and young children did not out-migrate,
32
but this method is not very useful for the data available here. Statisticalmethods that yield unbiased estimates for infant and child mortality, whensurvival status information for some births is incomplete, do not exist.
In the absence of any workable technique to deal with missing data,mortality risks are calculated under the assumption that children for whomno marriage or death certificate has been found, and for whom information
30
Galema,
Frisians to America
.
31
Blum, ‘An estimate’; Ruggles, ‘Migration’; Wrigley et al.,
English population history
.32 Jonker, ‘Maximum likelihood estimation’.

284 FRANS VAN POPPEL, MARIANNE JONKER, AND KEES MANDEMAKERS
© Economic History Society 2005
from population registers is not available, survived age intervals 0–1 and1–5. This implies that estimated infant and childhood mortality rates willbe biased downwards. The proportion of infants who died in their first year(in a certain region in a certain time period) is estimated by the ratio
(1)
and the proportion of children who died between their first and fifth year by
(2)
If there are no missing data (if a date of marriage or death is available forall individuals in the data set), the estimator in (1) is an unbiased estimatorfor the proportion of infants who die in their first year of life. In case ofmissing data, the numerator of the estimator in (1) can not be determinedexactly. Suppose an infant migrated to another community before the ageof one and died after emigration, but before reaching the age of one. If thedeath certificate for this infant is not found, this death does not contributeto the numerator, although it should. If one assumes that infants whomigrated before the age of one survived to the age of one, the numerator isestimated systematically too low, and the estimator for infant mortality willbe biased downwards. In order to get an impression of the size of the bias,one might consider the following situation. Suppose that 20 per cent of thebirths in a cohort were not observed further after their birth. Most of theseindividuals will have migrated, as registration of subsequent death for livebirths in the nineteenth century in The Netherlands is considered reliableand complete.33 As migration at very young ages was relatively rare, it wouldbe a more reasonable estimate that only 1 per cent of migrants migratedbefore the age of one; the remaining 19 percent of migrants migrated afterthe age of one.34 If infant mortality is in the order of 150 per 1,000 (amongmigrants and non-migrants), and it is assumed that individuals who out-migrated before the age of one are still alive at the end of the first year oflife, the infant mortality rate would be in the order of 148.5 per 1,000instead of 150, and the bias would be very small.35 Note that migrants whomigrated after the age of one do contribute to the denominator in (1), but
33 Deaths reported were fairly complete because no burial was allowed without written permission(See Heederik, Van kasboekregister, 171). A report by the Health Inspectorate stated that ‘there isno doubt . . . that in the Netherlands all deaths are being brought to the attention of theauthorities . . . almost certainly within the appropriate statutory period’ (Menno Huizinga andPijnappel, ‘Rapport’, p. 35).
34 Age profiles of migration for the province of Utrecht for the period 1850–1962 make it clear thatmigration started to rise from age 12 onwards, and that before that age, migration rates were extremelylow. See Kok, ‘Youth labor migration’, p. 513.
35 A comparison of infant mortality rates based on all live births with rates based only on those birthsfor which information on date of death or on survival after age one is available in general showedrelatively small differences. Differences were higher in cohorts 1811–1919 (respectively 160 versus 210per 1000) and 1910–1922 (48 versus 83 per 1000), higher in the province of Zeeland (231 versus 272per 1,000) than in Utrecht (202 versus 216 per 1,000) or Friesland (114 versus 140) and higher in the
Number of infants who died before age 1Number of live-born infants
Number of children who died in age interval 1–5Number of infants who survived their first year

DUTCH DIFFERENTIAL INFANT AND CHILD MORTALITY 285
© Economic History Society 2005
not to the numerator, because they survived to the age of one. Support forthe view that the estimation bias might be small is given by the fact that theestimates for infant mortality are in line with the published values of theIMR for the three provinces, based on vital registration data on all live birthsand children deceased before reaching the age of one.36
In a similar way, the bias of the estimates for child mortality can becalculated. The bias of the estimator for child mortality might be slightlyhigher because migration usually is more frequent between the ages of oneand five than between birth and the age of one.
Since the percentage of births for which information on death, marriage,or migration is missing varied by region, cohort, and social class, the sizeof the bias might sometimes be higher, in other cases lower. Data shown intable 2 (see below) make it clear that the survival status after the age of onefor the 1812–1909 cohorts is relatively less known for the upper class (inparticular in Friesland and Zeeland) and the white-collar middle class. The
higher social classes (166 versus 233 in the upper class and 204 versus 252 in the white-collar middleclass) than in the lower ones (151 versus 170 among farmers, 174 versus 200 among skilled manualworkers, 149 versus 179 among the petty bourgeoisie, 190 versus 218 among casual and unskilledlabourers).
36 Vandenbroeke, van Poppel, and van der Woude, ‘Le développement séculaire’.
Figure 1. Infant mortality (IMR) (per 1,000 live births) and early childhood mortality (ECMR) (per 1,000 children aged one) rates, by province and period of birthNotes: Zd = Zeeland; Ut = Utrecht; Fr = Friesland
0
50
100
150
200
250
300
350
1811
-19
1820
-29
1830
-39
1840
-49
1850
-59
1860
-69
1870
-79
1880
-89
1890
-99
1900
-09
Period
Per
100
0
ECMR ZdECMR UtECMR FrIMR ZdIMR UtIMR Fr

286 FRANS VAN POPPEL, MARIANNE JONKER, AND KEES MANDEMAKERS
© Economic History Society 2005
Figure 2. Neonatal and post-neonatal mortality per 1,000 live births, per period of birth
b. Utrecht
0
50
100
150
200
250
300
350
1811
-19
1820
-29
1830
-39
1840
-49
1850
-59
1860
-69
1870
-79
1880
-89
1890
-99
1900
-09
1811
-19
1820
-29
1830
-39
1840
-49
1850
-59
1860
-69
1870
-79
1880
-89
1890
-99
1900
-09
Per
100
0
a. Zeeland
PostneonatalNeonatal
0
50
100
150
200
250
300
350
Per
100
0
PostneonatalNeonatal

DUTCH DIFFERENTIAL INFANT AND CHILD MORTALITY 287
© Economic History Society 2005
Figure 2. Continued
0
50
100
150
200
250
300
350
1811
-19
1820
-29
1830
-39
1840
-49
1850
-59
1860
-69
1870
-79
1880
-89
1890
-99
1900
-09
Per
100
0
c. Friesland
PostneonatalNeonatal
resulting bias would lead to an overstatement of mortality differences whenthe expected social gradient in mortality is applied to the Dutch situation.
For cohorts born between 1812 and 1909, figure 1 shows what propor-tion of live births died in the first year of life (IMR) and what proportionof those who survived until the age of one died between the ages of one andfive (early childhood mortality, ECMR).
The variation in the level of IMR between the three provinces was enor-mous. Until 1860, twice as many children died during the first year of lifein Zeeland as in Friesland. IMR was on the increase in all three provincesuntil the 1860s, but after 1860 there was a steep decrease in Zeeland, anda more gradual one after 1880 in Utrecht, and therefore the differencesbetween the provinces were only small in more recent cohorts.37 The risksof dying between the ages of one and five, per 1,000 children aged one, alsochanged significantly over time. Mortality rates in Zeeland and Utrechtincreased gradually during the period 1812–70, leading to large differencesbetween these two provinces and Friesland. In this age group, Zeeland andUtrecht had again made up their arrears with Friesland by the beginningof the twentieth century.
37 This increase until the mid-nineteenth century is partly a result of an underestimation of IMR inthe oldest cohorts, but mostly is a real phenomenon also observed in other countries of western andnorthern Europe. See Perrenoud, ‘Child mortality in Francophone Europe’.

288 FRANS VAN POPPEL, MARIANNE JONKER, AND KEES MANDEMAKERS
© Economic History Society 2005
By analysing the development of neonatal (first month) and post-neonatal(months 1–12) mortality separately, it is possible to focus more specificallyon those parts of infant mortality that are more sensitive to endogenouscauses, and those that are more related to environmental factors. Viewingboth factors separately will allow us to study later in this article whether thefindings of Antonovsly and Bernstein regarding the closing of the gap ininfant mortality between the highest and lowest social classes applies to thepre-1900 period as well.38
Figure 2 reveals that the temporal changes and provincial differences inIMR were mainly caused by the change in post-neonatal mortality. Neonatalmortality in Zeeland was only clearly higher than in the other provinces inthe first half of the nineteenth century, and contributed significantly to theexcess values of IMR.
V
To study whether differences indeed existed in infant and childhood mor-tality rates between social classes, information on the father’s occupation atthe moment of the child’s birth was used. Although occupation is by far thebest single indicator of the position of individuals in the social stratificationsystem of industrializing societies, constructing meaningful occupationalgroupings for past populations from this information alone is a difficulttask. Some of the occupational titles are local expressions that are difficultto interpret; the significance of any particular designation may havechanged over time. Occupational titles may provide only partial informa-tion on the status of occupations; it is often not known whether the titlesconcern self-employed or employed individuals. For all these reasons, anyclassification based only on occupational designations as given in the birthcertificates will necessarily be imprecise. Despite these difficulties, anattempt has been made to group occupations in order to enable an explo-ration of socio-economic differentials in mortality. The classification usedhere is a slightly adapted version of the one designed by Giele andvan Oenen,39 in which six main groups were distinguished: upper class(employers in industry, lawyers, medical doctors, high civil servants; armyofficers); petty bourgeoisie (shopkeepers, small entrepreneurs and mer-chants and self-employed artisans);40 white-collar middle class (such asclerks, lower-level civil servants; foremen and supervisors, and non-
38 Antonovsky and Bernstein, ‘Social class and infant mortality’.39 Giele and van Oenen, ‘Theorie en Praktijk van onderzoek’.40 In some cases self-employed and employed could be distinguished because in the birth certificate
explicit mention was made of it (subordinate versus head). Where a job title included the word ‘assistant’or ‘master’ a distinction between the two categories could also easily be made. In other cases, theassignment to the categories of self-employed or employed has been based on the usual sizes of thebusinesses. Thus baker, butcher, etc. are included among the self-employed, cartwright, candlemakeretc. to the employed. The consequences for the mortality differences of a wrong assignment to a socialgroup depend on the social class gradient.

DUTCH DIFFERENTIAL INFANT AND CHILD MORTALITY 289
© Economic History Society 2005
commissioned officers); skilled manual workers (smiths, furniture makers,barrel-makers, diamond workers, tobacco workers, printers, spinners andweavers, service employees such as postmen, shop-assistants, and lowermilitary); casual and unskilled labourers (porters, journeymen, sailors, andagricultural labourers); and people with unknown or no occupation.41 Thethree provinces showed considerable differences in the social-class compo-sition of births: between 1.7 and 2.7 per cent of all births in all threeprovinces were of upper-class origin, while casual and unskilled labourersin Zeeland had a share of 48 per cent, in Friesland of 41 per cent, and inUtrecht of 29 per cent. Utrecht had a much higher share of skilled manualworkers and also more children from the white-collar middle class.
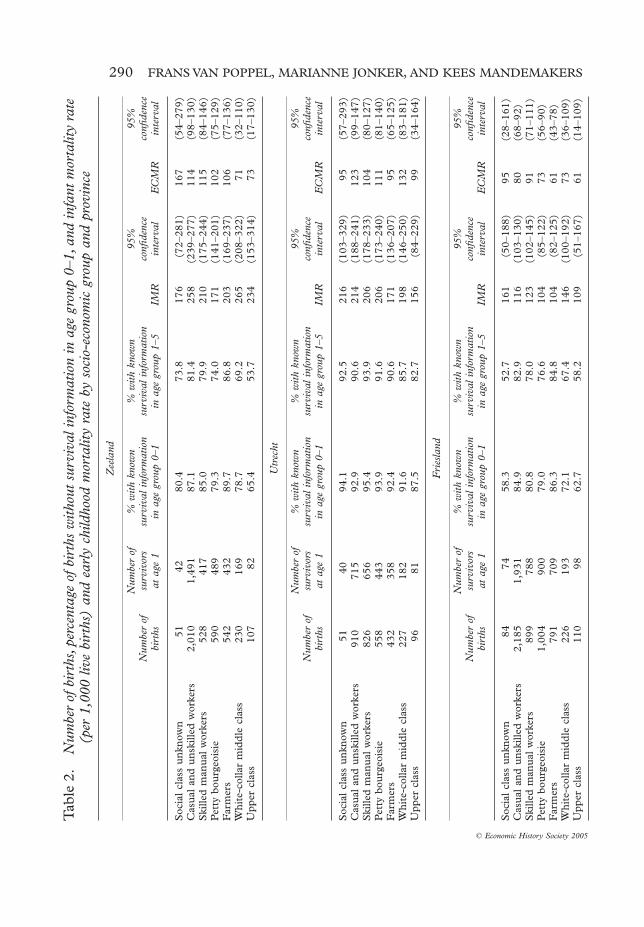
Table 2 presents infant and early childhood mortality rates for the sixsocio-economic groups and the group with unknown social-class back-ground in each of the three provinces. Data for the entire period 1812–1909are taken together to give an overall picture of social differences. Informa-tion is also given on the number of individuals in the sample (numbers ofbirths and the number of children of which the survival status at the age ofone is known respectively), and on those parts of these groups for whichsurvival information in the age intervals 0–1 and 1–5 years was complete,for each group. It is particularly in the upper class in Friesland and Zeeland,in the white-collar middle class in Friesland, and in the group with unknownsocial class, that information on survival status is not yet complete for aconsiderable proportion of births. The 95 per cent confidence intervals(given in the table) and confidence intervals for the differences between theinfant mortality rates of the various social groups (not given in the table)were also calculated.
The table reveals large differences in the pattern of social inequalitybetween the provinces, but these differences only rarely are statisticallysignificant. Only in Utrecht is there a more or less clear social gradient found,with the lowest IMRs in the upper class and among farmers, and higher ratesamong the petty bourgeoisie and casual and unskilled labourers. Only thedifferences between farmers and casual and unskilled labourers, and betweenfarmers and the group without occupation, are statistically significant.Almost no social differences were observed in Friesland (statistically signifi-cant differences were only observed between the upper class and skilledlabourers). In Zeeland the highest mortality was found among the lowest and
41 Many children in this last group were born to unwed mothers. A sizeable proportion of these infantsrelied on the mother alone for support, both financial and in the less tangible aspects of care. It isdifficult to indicate the socio-economic position of these children; they have therefore mostly beenexcluded from the analysis. As Pamuk (‘Social-class inequality’) has shown, this might have an effecton the observed pattern of inequality, as these infants are in a position of greater disadvantage thanchildren born legitimately to employed fathers, regardless of the nature of the employment. This groupis characterized by very high infant mortality rates. See Kok, van Poppel, and Kruse, ‘Mortality amongillegitimate children’. Agricultural labourers are difficult to distinguish from other casual and unskilledlabourers in those regions where agriculture is the dominant activity because many of them are simplydesignated as labourers. The number of agricultural labourers designated as such is only large enoughto study as a separate category in Zeeland.
290 FRANS VAN POPPEL, MARIANNE JONKER, AND KEES MANDEMAKERS
© Economic History Society 2005
Tab
le 2
.N
umbe
r of
bir
ths,
perc
enta
ge o
f bir
ths
with
out s
urvi
val i
nfor
mat
ion
in a
ge g
roup
0–1
, and
infa
nt m
orta
lity
rate
(p
er 1
,000
live
bir
ths)
and
ear
ly c
hild
hood
mor
talit
y ra
te b
y so
cio-
econ
omic
gro
up a
nd p
rovi
nce
Zee
land
Num
ber
ofbi
rths
Num
ber
ofsu
rviv
ors
at a
ge 1
% w
ith k
now
nsu
rviv
al i
nfor
mat
ion
in a
ge g
roup
0–1
% w
ith k
now
nsu
rviv
al i
nfor
mat
ion
in a
ge g
roup
1–5
IMR
95%
confi
denc
ein
terv
alE
CM
R
95%
confi
denc
ein
terv
al
Soc
ial
clas
s un
know
n
51 4
280
.473
.817
6(7
2–28
1)16
7(5
4–27
9)C
asua
l an
d un
skill
ed w
orke
rs2,
010
1,49
187
.181
.425
8(2
39–2
77)
114
(98–
130)
Ski
lled
man
ual
wor
kers
52
8
417
85.0
79.9
210
(175
–244
)11
5(8
4–14
6)P
etty
bou
rgeo
isie
59
0
489
79.3
74.0
171
(141
–201
)10
2(7
5–12
9)F
arm
ers
54
2
432
89.7
86.8
203
(169
–237
)10
6(7
7–13
6)W
hite
-col
lar
mid
dle
clas
s
230
16
978
.769
.226
5(2
08–3
22)
71(3
2–11
0)U
pper
cla
ss
107
82
65.4
53.7
234
(153
–314
)73
(17–
130)
Utr
echt
Num
ber
ofbi
rths
Num
ber
ofsu
rviv
ors
at a
ge 1
% w
ith k
now
nsu
rviv
al i
nfor
mat
ion
in a
ge g
roup
0–1
% w
ith k
now
nsu
rviv
al i
nfor
mat
ion
in a
ge g
roup
1–5
IMR
95%
confi
denc
ein
terv
alE
CM
R
95%
confi
denc
ein
terv
al
Soc
ial
clas
s un
know
n51
4094
.192
.521
6(1
03–3
29)
95(5
7–29
3)C
asua
l an
d un
skill
ed w
orke
rs91
071
592
.990
.621
4(1
88–2
41)
123
(99–
147)
Ski
lled
man
ual
wor
kers
826
656
95.4
93.9
206
(178
–233
)10
4(8
0–12
7)P
etty
bou
rgeo
isie
558
443
93.9
91.6
206
(173
–240
)11
1(8
1–14
0)F
arm
ers
432
358
92.4
90.6
171
(136
–207
)95
(65–
125)
Whi
te-c
olla
r m
iddl
e cl
ass
227
182
91.6
85.7
198
(146
–250
)13
2(8
3–18
1)U
pper
cla
ss96
8187
.582
.715
6(8
4–22
9)99
(34–
164)
Fri
esla
nd
Num
ber
ofbi
rths
Num
ber
ofsu
rviv
ors
at a
ge 1
% w
ith k
now
nsu
rviv
al i
nfor
mat
ion
in a
ge g
roup
0–1
% w
ith k
now
nsu
rviv
al i
nfor
mat
ion
in a
ge g
roup
1–5
IMR
95%
confi
denc
ein
terv
alE
CM
R
95%
confi
denc
ein
terv
al
Soc
ial
clas
s un
know
n
84 7
458
.352
.716
1(5
0–18
8)95
(28–
161)
Cas
ual
and
unsk
illed
wor
kers
2,18
51,
931
84.9
82.9
116
(103
–130
)80
(68–
92)
Ski
lled
man
ual
wor
kers
89
9 7
8880
.878
.012
3(1
02–1
45)
91(7
1–11
1)P
etty
bou
rgeo
isie
1,00
4 9
0079
.076
.610
4(8
5–12
2)73
(56–
90)
Far
mer
s
791
709
86.3
84.8
104
(82–
125)
61(4
3–78
)W
hite
-col
lar
mid
dle
clas
s
226
193
72.1
67.4
146
(100
–192
)73
(36–
109)
Upp
er c
lass
11
0
9862
.758
.210
9(5
1–16
7)61
(14–
109)

DUTCH DIFFERENTIAL INFANT AND CHILD MORTALITY 291
© Economic History Society 2005
the highest social classes. The causal and unskilled labourers here had asignificantly higher mortality than farmers, skilled labourers, and the pettybourgeoisie. The white-collar middle class had a statistically significant highermortality than farmers and the petty bourgeoisie. The position of the white-collar middle class was relatively unfavourable in all provinces. In Frieslandand in Zeeland, infants born in families of which the father belonged to theupper class, had only slightly lower chances of death during the first year oflife than children born in families of casual and unskilled labourers, and evenhigher risks than children born in families of farmers or the petty bourgeoisie.This conclusion gains more weight when one takes into account that in theseprovinces in the two higher social layers, a date of death is not yet known fora higher proportion of live births than in other social groups. This impliesthat the chance of finding a supplementary number of deaths during the firstyears of life is higher in these groups than in others, which might result ineven higher death rates in the highest social classes. Within the group of casualand unskilled labourers, those working in agriculture in the province ofZeeland (where the group was rather numerous) had an infant mortality ratethat was lower than that of the other casual labourers, and resembled that ofthe farmers.
Table 3 shows the neonatal and post-neonatal mortality rates separatelyby social class and province, per 1,000 live births. Differences betweensocial groups were clearly higher for post-neonatal mortality. Over all prov-inces, the highest values were observed among children from the white-collar middle class, whereas among farmers the lowest values were found.The upper class, the casual and unskilled labourers, and the skilled manualworkers had more or less the same levels of post-neonatal mortality. Forneonatal mortality, rates among causal and unskilled labourers were highest;white-collar middle class and farmers were characterized by relatively highvalues as well.
For infant mortality as a whole, all social groups in Friesland, even thosewith the worst position on the social ladder, were much better off than thebest-ranking social group in Utrecht, and incomparably better off than thebest-ranking social group in Zeeland. This shows how important the regionalenvironment was for the level of mortality in the nineteenth century.
Table 3 also shows that differentials in early childhood mortality amongsocio-economic groups were not wholly comparable to those for infantmortality. In general, one might say that during childhood a stronger socialgradient was present. Children whose parents belonged to the highest socialclasses (the upper class, the middle class, and farmers) were generally betteroff than the children of the less-well-to-do, and in particular the childrenbelonging to the category of ‘unknown social class’. Differences between thelast group and other social classes were statistically significant in Zeeland andFriesland. The smallest social differences were again found in Friesland. Asfar as the agricultural labourers are concerned, this group again had muchlower values of ECMR than the rest of the casual and unskilled labourers.

292 FRANS VAN POPPEL, MARIANNE JONKER, AND KEES MANDEMAKERS
© Economic History Society 2005
Table 4 shows the development of infant and early childhood mortalityaccording to socio-economic group over time. Differences refer to threetime periods, chosen in such a way that they cover the period of stablemortality from the beginning of the nineteenth century until 1840, theperiod of increasing mortality lasting until 1880, and the more recent periodof steep decreases in infant and early-childhood mortality risks.
Table 3. Neonatal and post-neonatal mortality rate (per 1,000 live births) by socio-economic group and province
Zeeland
Neonatal Post-neonatal N
Social class unknown 39 137 51Casual and unskilled workers 71 187 2,010Skilled manual workers 53 157 528Petty bourgeoisie 44 127 590Self-employed in agriculture 66 137 542White-collar middle class 70 196 230Upper class 56 178 107
Utrecht
Neonatal Post-neonatal N
Social class unknown 59 157 51Casual and unskilled workers 56 158 910Skilled manual workers 44 162 826Petty bourgeoisie 48 158 558Self-employed in agriculture 39 132 432White-collar middle class 44 154 227Upper class 31 125 96
Friesland
Neonatal Post-neonatal N
Social class unknown 36 83 84Casual and unskilled workers 43 74 2,185Skilled manual workers 28 96 899Petty bourgeoisie 25 79 1,004Self-employed in agriculture 37 67 791White-collar middle class 31 115 226Upper class 0 109 110
Total
Neonatal Post-neonatal N
Social class unknown 43 118 186Casual and unskilled workers 56 133 5,105Skilled manual workers 40 134 2,253Petty bourgeoisie 36 112 2,152Self-employed in agriculture 46 104 1,765White-collar middle class 48 155 683Upper class 29 137 313

DUTCH DIFFERENTIAL INFANT AND CHILD MORTALITY 293
© Economic History Society 2005
Table 4 does not give a simple and unequivocal picture. The smallnumber of observations in the upper class and the ‘social class unknown’group plays a role in this. In the first period (1812–39) and last period(1880–1909), a social gradient is visible, be it that the white-collar middleclass in the first period strongly deviates from this pattern. In the period1840–79, characterized by increased levels of mortality, the higher andlower social classes have comparably high levels of infant mortality. Farmersand the petty bourgeoisie were doing relatively well in all periods, and theywere hardly affected by the mortality crisis in the middle of the nineteenthcentury. In both groups, IMR remained almost stable over the whole period1812–1909; in particular, the farmers were only marginally involved in thestrong decrease in IMR that took place after 1880. The largest improvementtook place among the white-collar middle class and, to a lesser degree,among the skilled manual workers and the casual and unskilled workers. Inthe last period, all social groups again reached the pre-1840 values andsome—skilled manual workers, casual and unskilled workers, and white-collar middle class—even succeeded in reducing IMR values well below theearlier levels. White-collar middle-class families might be considered as theforerunners in the mortality decline.
Table 4. Infant and early childhood mortality rate (per 1,000 live births respectively per 1,000 children aged one) by socio-economic group and period
Period
1812–39 1840–79 1880–1909
IMR N IMR N IMR N
Social class unknown 173 75 165 85 133 30Casual and unskilled workers 182 1,295 205 2,825 151 1,093Skilled manual workers 154 544 204 1,223 113 548Petty bourgeoisie 142 584 162 1,163 118 458Self-employed in agriculture 144 535 153 939 148 324White-collar middle class 270 159 209 368 111 171Upper class 100 80 205 200 86 35
Period
1812–39 1840–79 1880–1909
ECMR N ECMR N ECMR N
Social class unknown 97 62 169 71 130 23Casual and unskilled workers 96 1,059 113 2,245 70 831Skilled manual workers 93 460 124 974 56 427Petty bourgeoisie 104 501 101 975 42 356Self-employed in agriculture 98 458 83 795 49 246White-collar middle class 103 116 86 291 95 137Upper class 139 72 63 159 0 30

294 FRANS VAN POPPEL, MARIANNE JONKER, AND KEES MANDEMAKERS
© Economic History Society 2005
For ECMR, the small numbers in the upper-class group distort thepicture even more than is the case among infants. Some trends can none-theless be detected. First, in the period 1812–39, differences in child mor-tality between social classes hardly existed. Second, from the middle of thenineteenth century onwards, a social gradient in ECMR becomes visible.Third, the rise in mortality in the middle of the nineteenth century waslimited to skilled manual workers, and casual and unskilled workers,whereas the petty bourgeoisie and the farmers were spared. Almost all socialclasses were affected by the decrease in mortality in 1880–1909, althoughsome did so more than others. For skilled manual workers, and for casualand unskilled workers, the risks of dying between the ages of one and fivewere almost halved after 1880.
Table 5 compares IMR and ECMR by socio-economic status for urbanand rural areas. All municipalities in the sample were classified in twocategories on the basis of the ‘urban’ character of the municipality (numberof inhabitants). In all social classes except the petty bourgeoisie, IMR washigher in urban than in rural areas, and the same applied to an even strongerdegree for ECMR. The level of inequality did not deviate much betweenthe two kinds of municipality. Farmers and unskilled workers were thegroup that profited most from living in a rural area, whereas for the pettybourgeoisie, the situation in urban areas was relatively more favourable.
VI
A more refined analysis of the socio-economic influences on mortality ispossible by supplementing the socio-economic information with data ondemographic characteristics of child and parent as given on the birth cer-tificate and applying a multivariate analysis. The primary objective is to testwhether social inequality increases or decreases under the influence of theregional and/or urban environment, the time period in which the child isborn, and the age of the child. In addition, we control for other risk factors
Table 5. Infant and early childhood mortality rate (per 1,000 live births per 1,000 children aged one) by socio-economic group and urban/rural background
IMR ECMR
Rural Urban Rural Urban
IMR N IMR N ECMR N ECMR N
Social class unknown 148 142 205 44 99 121 257 35Casual and unskilled workers 186 4,533 219 572 95 3,690 136 447Skilled manual workers 170 1,362 181 891 85 1,131 126 730Petty bourgeoisie 150 1504 145 648 81 1,278 112 554Self-employed in agriculture 149 1656 183 109 79 1,410 135 89White-collar middle class 198 415 213 268 81 333 109 211Upper class 165 212 168 101 62 177 107 84

DUTCH DIFFERENTIAL INFANT AND CHILD MORTALITY 295
© Economic History Society 2005
to which children are exposed—sex of the child, season of birth, labour-market position of mother, marital status of the mother at birth, age of thefather at birth and literacy of the father. We used logistic regression analysis,as our dependent variable (dying or surviving a given age interval) mightbe interpreted as a nominal-level variable.42 We also made use of hazardanalysis (adopting the semi-parametric approach of Cox regression). In thisapproach, the instantaneous risk of dying at age t is the product of a functionof t, and a function of the explanatory variables and unknown parameters.These covariates are supposed to act multiplicatively on the risk of dying.The same set of covariates was included in the hazard models as in thelogistic regression analysis. Using hazards does not solve the problem ofmissing survival data: it was possible, in the case of those children for whomno survival information was available, to make use of information on age atlast observation from the population registers, but this related only to verysmall numbers. These small numbers lead us to expect that for the ageintervals concerned, the outcomes of the two methods will not deviate muchfrom each other. We prefer logistic regression, as we are more interested inthe percentages of infants and children who died in their first year of life,or between their first and fifth year, depending on their socio-economicstatus, than in the question of how mortality changed as a function of age.43
Regression equations were estimated separately for three age intervals:for neonatal mortality, for post-neonatal mortality, and for the early child-hood period (from the end of the first through the end of the fifth year oflife).44 This segmentation is motivated by the differences in the nature ofthe risk to which children are exposed in these stages of life. The regressionmodels were estimated under the assumption that all children for whom noinformation on date of death was found had survived until the end of therelevant age intervals.
Information on the age of the mother at the time of the child’s birth wasonly available for a very limited group of children. Given the homogeneitybetween the ages of husband and wife, we used the age of the father as aproxy for the age of the wife. ‘Season of birth’ was introduced by distin-guishing births in the high-risk summer season (July and August) from thosein winter (January, February, and December), spring (March until June)and autumn (September until November). ‘Literacy of the father’ wasderived from the father’s ability to sign the birth certificate of the child.When the child’s father was not present at the time of birth or when thebirth came from an unwed mother, widow, or divorced woman, a separatecategory was introduced. The ‘labour market position of the mother’ was
42 Clayton and Hills, Statistical models.43 The results of the hazard analysis are available from the authors.44 The information on the age at last observation coming from the population registers showed that
between birth and the end of the first month only one child migrated; between month one and yearone, 11 children migrated; and between age one and age five, 51 migrated (compared to 1915 after agefive).

296 FRANS VAN POPPEL, MARIANNE JONKER, AND KEES MANDEMAKERS
© Economic History Society 2005
grouped into two categories: mother works or mother does not work, includ-ing ‘occupational status unknown’. Two categories were distinguished under‘household situation of the mother’, married women and other women. Thislast category included unwed mothers, widows, and divorced women, andthe few mothers for whom the marital status was not given on the birthcertificate. Three provinces were distinguished, and urban and rural areaswere distinguished from each other, following the lines described earlier.Three birth cohorts were used: 1812–39, 1840–79, and 1880–1909. Thesocio-economic group of the father was divided into eight classes, includingthe category ‘unknown and without occupation’. The results of the analysisare presented in tables 6 and 7 for neonatal, post-neonatal infant, and earlychildhood periods.
The (log) odds of dying in the first month or year of life are regressed onthe seven dummy variables representing social class, with the casual andunskilled labourers acting as a reference category. Table 6 (model 1) givesthe odds ratio for those in the selected category versus those in the omitted(reference) category. For example, the odds ratio for children born in theupper class of 0.50 implies that the odds of dying in the first month of lifeare about 0.50 times as small for those children as they are for childrenborn in the group of unskilled and casual labourers. Tests for each of thedummy coefficients bring to light which social classes are different from thecasual labourers, with reference to the odds of dying in the first year of life.
Differences between social classes were indeed statistically significant:compared to the casual and unskilled labourers, the upper class, petty bour-geoisie, and skilled workers all had much lower death risks over the wholeperiod, and for the three provinces together. For post-neonatal mortality(from month one till the end of the first year of life), the pattern was slightlydifferent as, in addition to the petty bourgeoisie, only farmers deviatedsignificantly from the casual labourers. The global test to determine whetherthe set of predictors was significant, the model chi-square test, revealed thatthe chosen variables were indeed highly significant (p < 0.001). In table 7,infant mortality as a whole is analysed. Here, the results were the same asfor post-neonatal mortality: only farmers and the petty bourgeoisie hadsignificantly lower mortality in the first year of life than the casual workers.For early-childhood mortality, farmers and agricultural labourers have sta-tistically significant lower mortality than the casual workers.
Regressions were also run on those births for which information on thedate of death was available, or for which a date of last observation wasavailable, which lay above the first month of life (for neonatal mortality),above the first year of life (for post-neonatal and for infant mortality), orabove the first five years of life (for child mortality). Only very smalldifferences in the outcomes were observed, again lending support to theview that the estimation bias is small. For neonatal mortality, the relativerisk to children from the upper class was still much lower than that ofthe reference group, but the difference was no longer significant. For

DUTCH DIFFERENTIAL INFANT AND CHILD MORTALITY 297
© Economic History Society 2005
Table 6. Logistic regression models for the odds ratios for neonatal and post-neonatal neonatal mortality, all live births respectively, all children
surviving the first month
Variable Category
Neonatal mortality (N = 12,457; Events = 586)
Post-neonatal mortality (N = 1,1871; Events 1,581)
Model 1 Model 2 Model 3 Model 1 Model 2 Model 3
Socio-economic group
Upper class 0.50 0.43 0.43 0.99 0.76 0.78White-collar
middle class0.85 0.32 0.32 1.17 0.92 0.95
Farmers 0.81 0.79 0.79 0.74 0.78 0.77Petty bourgeoisie 0.63 0.65 0.65 0.80 0.85 0.87Skilled manual
workers0.69 0.67 0.67 0.98 1.00 1.03
Casual and unskilled workers
1.00 1.00 1.00 1.00 1.00 1.00
Agricultural labourers
0.93 0.87 0.87 0.86 0.82 0.83
Without or unknown
0.75 0.82 0.82 0.85 1.13 1.21
Cohort 1812–39 1.00 1.00 1.00 1.001840–79 1.10 1.06 1.33 1.321880–1909 0.81 0.80 0.86 0.86
Province Utrecht 1.45 1.45 2.24 2.28Zeeland 1.80 1.71 2.33 2.31Friesland 1.00 1.00 1.00 1.00
Sex of child Female 1.00 1.00 1.00 1.00Male 1.24 1.24 1.11 1.11
Paternal literacy Unknown 0.00 0.00 1.57Literate 1.00 1.00 1.00Illiterate 1.11 1.10 0.98
Paternal age at birth
<25 years 1.13 1.1725–49 1.00 1.0050 or older 1.34 1.22
Level of urbanization
Urban 0.91 1.12Rural 1.00 1.00
Maternal labour force
Mother had occupation
0.81 1.22 1.21
No occupation 1.00 1.00 1.00Marital status
motherMarried 1.00 1.00Not married 0.89 0.59
Season of birth Winter 1.00 1.00Summer 1.08 1.02Autumn 0.92 1.01Spring 0.80 1.05
Intercept (exp.) 0.06 0.42 0.04 0.17 0.07 0.08Model chi-
square21.01 91.62 80.89 23.23 270.91 262.24
Degrees of freedom
7 22 14 7 22 13
Note: Items in bold are significant at 5% level

298 FRANS VAN POPPEL, MARIANNE JONKER, AND KEES MANDEMAKERS
© Economic History Society 2005
Table 7. Logistic regression models for the odds ratios for infant and early childhood mortality, all live births respectively, all children surviving age one
Variable Category
Infant mortality (N = 12,457; Events = 2,167)
Early childhood mortality (N = 10,290; Events 980)
Model 1 Model 2 Model 3 Model 1 Model 2 Model 3
Socio-economic group
Upper class 0.85 0.65 0.65 0.73 0.47 0.46White-collar
middle class1.08 0.74 0.74 0.89 0.71 0.69
Farmers 0.75 0.77 0.77 0.78 0.81 0.79Petty bourgeoisie 0.74 0.78 0.78 0.87 0.82 0.81Skilled manual
workers0.89 0.90 0.90 0.98 0.87 0.86
Casual and unskilled workers
1.00 1.00 1.00 1.00 1.00 1.00
Agricultural labourers
0.74 0.83 0.83 0.55 0.54 0.53
Without or unknown
0.87 1.04 1.04 1.36 1.17 1.15
Cohort 1812–39 1.00 1.00 1.00 1.001840–79 1.27 1.29 1.10 1.091880–1909 0.84 0.84 0.71 0.70
Province Utrecht 2.04 2.07 1.43 1.44Zeeland 2.23 2.29 1.47 1.48Friesland 1.00 1.00 1.00 1.00
Sex of child Female 1.00 1.00 1.00Male 1.15 1.15 0.97
Paternal literacy Unknown 1.12 0.66Literate 1.00 1.00Illiterate 1.01 1.08
Paternal age at birth
<25 years 1.17 1.16 0.72 0.7325–49 1.00 1.00 1.00 1.0050 or older 1.27 1.25 0.76 0.76
Level of urbanization
Urban 1.07 1.54 1.54Rural 1.00 1.00 1.00
Maternal labour force
Mother had occupation
1.10 1.24 1.25
No occupation 1.00 1.00 1.00Marital status
motherMarried 1.00 1.00Not married 0.65 1.44
Season of birth Winter 1.00 1.00 1.00Summer 1.03 1.03 1.03Autumn 0.99 1.01 1.01Spring 0.98 1.24 1.25
Intercept (exp.) 0.24 0.12 0.12 0.11 0.09 0.09Model chi-
square30.48 307.58 303.54 14.79 119.37 117.25
Degrees of freedom
7 22 14 7 22 18
Note: Items in bold are significant at 5% level
DUTCH DIFFERENTIAL INFANT AND CHILD MORTALITY 299
© Economic History Society 2005
post-neonatal mortality, the excess risks of the white-collar middle class wasnow significant, whereas that was not the case in the analysis based on alllive births. No such changes were observed for infant mortality.
In some cases a difference was visible in the direction of the relationshipbetween the covariates and the death risk of infants, depending on whetheror not live births with missing information are included. Yet this was onlythe case where relative risks fluctuated around 1.0 and levels of significancewere far from reaching statistical significance; this applied, for example, tothe upper class for post-neonatal and infant mortality, and for the groupwithout occupation for post-neonatal mortality.
In the next step, we introduced all the above-mentioned risk factors inwhich we were interested (region, urban/rural background, and time) intothe model (model 2). This led to a significant improvement compared tomodel 1 in all age groups (differences in -2 log likelihood significant atp < 0.001). Of the three characteristics in which we were interested—region,time period, and urban/rural background—the first two indeed had a verystrong effect on the risks of dying for post-neonatal mortality, for infantmortality as a whole, and for early childhood mortality. Only for neonatalmortality were changes over time not significant. Urban areas had highermortality than rural areas in all age intervals except neonatal mortality, butdifferences were only significant for children aged one to five years. It comesas no surprise that Zeeland and Utrecht fared much worse than Friesland.The situation of infants and children during the years 1840–89 was badcompared to the first period, and even worse compared to 1890–1912. Thedirection and strength of the relationship between social class and mortalityduring the first five years of life remained more or less the same. Forneonatal mortality, the only real alteration was that children from the white-collar middle-class group now also had clearly and significantly lower mor-tality risks than the reference group. For post-neonatal mortality, the pettybourgeoisie no longer differed significantly from the casual workers. Forinfant mortality as a whole, groups at the upper range of the hierarchy—upper class, white-collar middle class, farmers, and petty bourgeoisie—allhad now significantly lower mortality than the causal workers.
What about childhood mortality? Among children who had survived tothe age of one, the socio-economic position of the father also had an effect.In model 1, almost all social groups did better than the casual and unskilledlabourers, yet only farmers and agricultural labourers had a statisticallysignificant lower level of mortality. A replication of the analysis on therestricted set of data (survival status known or age at last observation abovefive) gave almost the same results: the only difference was that the excessmortality of the group with unknown occupations was now statisticallysignificant.
The use of the complete set of variables (model 2) caused some differ-ences in the effects of social class. In addition to agricultural labourers, theupper class had lower mortality, whereas values for the farmers almost

300 FRANS VAN POPPEL, MARIANNE JONKER, AND KEES MANDEMAKERS
© Economic History Society 2005
reached significance.45 Period of birth and province remained importantfactors in this age group. Urban municipalities had higher mortality in thisage group. Remarkably, the season of birth had a statistically significanteffect on early childhood mortality but not on infant mortality.46
To select a model that is more parsimonious, but captures the basicfeatures of the association in the data of model 2, a backward stepwiseprocedure was followed in order to decide which variables could be removedfrom the model. In this procedure, social class was not considered eligiblefor removal. Model 3 shows the result of this exercise. It is clear from thetable that the parameters of this model hardly changed compared with themore extensive model. The social class in which a child is born had a verystrong effect on the child’s survival prospects, those chances generally beingthe highest for children from the higher ranks of society. Children fromthe upper class, the white-collar middle-class group, farmers, and the pettybourgeoisie, did better than the unskilled and casual labourers’ children.The more restricted model—model 3—gave almost the same results foryoung children. In particular, children from the upper class, farmers, andthe petty bourgeoisie had higher survival rates. The province of birth andthe period of time remained very important for child survival.
Tables 6 and 7 show that the effects of social class were generally muchless than that of region (province) and time, but stronger than that of urban/rural background. In particular, social class has a small effect for post-neonatal mortality. This becomes clear when one compares the fit of a modelwithout social class with that of a model in which social class is included.47
The introduction of the variable social class in the model for neonatalmortality reduces the deviance (the difference in the value of -2 log likeli-hood) with 12.144 for which seven degrees of freedom are lost. The prob-ability that the reduction in deviance in the model for neonatal mortality isa result of chance instead of a systematic effect of the introduction of socialclass is more than 10 per cent (0.10 < p < 0.25). For neonatal mortality,for infant mortality as a whole, and for early childhood mortality, socialclass is more important. For the first age interval (0–1), the deviancereduction is 24.114 (p < 0.001), for infant mortality 20.262 (0.005 < p <0.001), and for the age interval one to five, 14.676 (0.05 < p < 0.025).
45 Results of the hazard analysis confirm the pattern observed for neonatal mortality; for post-neonatalmortality, the direction of the differences did not change, but there were differences in the statisticalsignificance. Compared to the logistic regression, relative risks were significantly lower for the upperclass and white-collar middle class, whereas for farmers, differences were no longer significant. Forinfant mortality as a whole, farmers now did not differ significantly from the reference group, whereasskilled manual workers did now differ significantly from the casual workers. For early childhoodmortality, again the direction of the relative risks was in line with that of the logistic regression outcomes,but more of these differences now reached statistical significance.
46 A recent study documenting effect of month of birth on lifespan after the age of 50 found thatpeople born in the second quarter of the year had a lower life expectancy. See Doblhammer and Vaupel,‘Lifespan’.
47 This can be done by calculating the difference between the log-likelihoods and the degrees offreedom of the two models.

DUTCH DIFFERENTIAL INFANT AND CHILD MORTALITY 301
© Economic History Society 2005
To judge the consistency of the relation between social class and survivalover time and region, and to study the influence of the region in which onelived and the time of birth on the level of inequality, we stratified our sample,and applied logistic regression with a restricted number of variables to ourdata. We dropped those variables that did not have a significant effect in anyof the models. In table 8 we present results for infant mortality as a whole,and for early childhood mortality.
Table 8. Logistic regression models for the odds ratios for infant and early childhood mortality by province, All live births respectively all children surviving
age one
Variable Category
Infant mortality Early childhood mortality
Zeeland Utrecht Friesland Zeeland Utrecht Friesland
Socio-economic group
Upper class 0.87 0.49 0.65 0.57 0.56 0.24White-collar
middle class0.81 0.80 0.66 0.65 0.78 0.65
Farmers 0.72 0.77 0.94 0.94 0.79 0.71Petty bourgeoisie 0.64 1.01 0.82 0.92 0.73 0.77Skilled manual
workers0.79 1.01 0.98 0.97 0.70 0.95
Casual and unskilled workers
1.00 1.00 1.00 1.00 1.00 1.00
Agricultural labourers
0.68 0.79 1.71 0.62 0.77 0.49
Without or unknown
0.62 1.34 1.41 1.07 1.41 1.12
Cohort 1812–39 1.00 1.00 1.00 1.00 1.00 1.001840–79 0.97 1.82 1.41 1.13 1.13 1.021880–1909 0.61 1.17 1.01 0.52 0.66 0.91
Sex of child Female 1.00 1.00 1.00 1.00 1.00 1.00Male 1.02 1.08 1.44 0.98 1.02 0.93
Paternal age at birth
<25 years 1.13 1.29 1.13 0.96 0.65 0.6025–49 1.00 1.00 1.00 1.00 1.00 1.0050 or older 1.52 1.04 1.31 1.03 0.50 0.77
Level ofurbanization
Urban 0.94 0.84 1.45 1.52 1.52 1.58Rural 1.00 1.00 1.00 1.00 1.00 1.00
Maternal labour force
Mother had occupation
1.25 0.70 0.72 1.27 1.29 1.12
No occupation 1.00 1.00 1.00 1.00 1.00 1.00Season of birth Winter 1.00 1.00 1.00 1.00 1.00 1.00
Summer 1.39 0.88 0.82 0.98 0.99 1.11Autumn 0.97 1.15 0.89 1.16 0.80 1.04Spring 1.03 1.00 0.89 1.18 1.18 1.34
N 3,677 2,838 4,949 2,856 2,283 4,397Intercept
(exp.)0.33 0.19 0.09 0.12 0.14 0.08
Model chi-square
78.33 44.90 54.51 45.80 3263 33.44
Degrees of freedom
17 17 17 17 17 17
Note: items in bold significant at 5% level

302 FRANS VAN POPPEL, MARIANNE JONKER, AND KEES MANDEMAKERS
© Economic History Society 2005
In all three provinces, children from the higher and middle groups(upper-class, white-collar middle class, petty bourgeoisie, and farmers) hadlower infant and childhood mortality than unskilled and casual labourers.The skilled labourers had infant mortality slightly below or at the same levelas the casual workers, whereas agricultural labourers did not show a con-
Table 9. Logistic regression models for the odds ratios for infant and early childhood mortality by period of birth, all live births respectively, all children
surviving age one
Variable Category
Infant mortality Early childhood mortality
1812–39 1840–79 1880–1909 1812–39 1840–79 1880–1909
Socio-economic group
Upper class 0.35 0.84 0.60 0.86 0.20 0.70White-collar
middle class0.93 0.82 0.60 0.87 0.47 0.96
Farmers 0.86 0.69 0.89 1.13 0.71 0.66Petty
bourgeoisie0.78 0.78 0.84 1.02 0.73 0.74
Skilled manual workers
0.90 1.00 0.80 0.85 0.95 0.74
Casual and unskilled workers
1.00 1.00 1.00 1.00 1.00 1.00
Agricultural labourers
0.81 0.99 0.84 0.20 0.53 0.83
Without or unknown
1.43 1.24 0.48 0.70 1.69 1.22
Province Zeeland 3.02 2.02 1.74 1.67 1.64 0.92Utrecht 1.54 2.27 2.05 1.44 1.64 1.17Friesland 1.00 1.00 1.00 1.00 1.00 1.00
Sex of child Female 1.00 1.00 1.00 1.00 1.00 1.00Male 1.10 1.09 1.30 0.91 0.95 1.08
Paternal age at birth
<25 years 1.11 1.08 1.38 0.94 0.61 0.6525–49 1.00 1.00 1.00 1.00 1.00 1.0050 or older 1.47 1.10 1.34 0.68 0.78 0.86
Level ofurbanization
Urban 1.47 0.92 1.05 1.84 1.64 1.12Rural 1.00 1.00 1.00 1.00 1.00 1.00
Maternal labour force
Mother had occupation
1.02 1.22 1.13 1.07 1.43 0.79
No occupation
1.00 1.00 1.00 1.00 1.00 1.00
Season of birth Winter 1.00 1.00 1.00 1.00 1.00 1.00Summer 1.11 1.00 1.07 1.06 1.03 1.01Autumn 0.97 1.00 1.02 1.07 1.06 0.87Spring 0.96 0.96 1.05 1.31 1.30 1.06
N 2,985 5,145 3,334 2,511 4,159 2,866Intercept
(exp.)0.10 0.16 0.10 0.07 0.09 0.09
Model chi-square
111.44 145.71 53.25 32.22 88.08 11.92
Degrees of freedom
17 17 17 17 17 17
Note: Items in bold significant at 5% level

DUTCH DIFFERENTIAL INFANT AND CHILD MORTALITY 303
© Economic History Society 2005
sistent pattern. The differences between farmers and petty bourgeoisie onone hand, and the unskilled labourers on the other, were only significant inZeeland. For ECMR, the direction of the social-class effects remains almostthe same, but statistically significant effects are hardly visible anymore. Onlythe upper class in Friesland deviates significantly strongly from the casualand unskilled workers.
When the period of birth is the distinguishing factor (see table 9), itappears that in 1812–39, as well as in 1840–79 and 1880–1909, all socialclasses did better than the casual and unskilled labourers. Nevertheless, thesignificance of these differences varied over time. In the first decades of thenineteenth century, only children born in upper-class families did signifi-cantly better than the reference group. In the middle of the nineteenthcentury, social inequality was higher, and the farmers and petty bourgeoisiehad significantly lower mortality, whereas in the more recent period, thewhite-collar middle class deviated significantly from the unskilled labourers.
For ECMR, the effect of social class also differed by period. In the middleof the nineteenth century, the expected pattern emerges, with the upperclass, white-collar middle class, farmers, and the petty bourgeoisie havingstatistically meaningful lower mortality than casual labourers. In the lastdecades of the nineteenth century this pattern is reconfirmed. For infantand early childhood mortality, province was a much more important factorthan social class. The effect of region has only disappeared in the lastdecades of the period.
VII
Notwithstanding the fact that, because of the small sample size and incom-plete follow-up, the results of our analysis are provisional and sometimescontradict each other, some general conclusions can be drawn. We foundlarge differences in the pattern of social inequality between the three prov-inces and over time. In all provinces, the casual and unskilled labourers hadhigher mortality than the upper and middle layers of society, whereas skilledmanual workers were somewhere in between. Farmers and petty bourgeoisiedid generally do better than the upper class and white-collar middle class.Social class had a statistically significant effect both on neonatal and onpost-neonatal mortality, with mortality higher among the lowest social classthan among the upper and middle layers. We also observed that duringchildhood, a stronger social gradient was present in all three provinces thanin infancy. Being born in a rural or urban environment had much less effecton infant and child mortality than region had. Only in Friesland did urbanareas have higher infant mortality than rural areas. For children aged oneto five, being born in an urban area had the expected increasing effect onmortality. We observed large differences between the provinces in the levelsof IMR by social group: in Friesland even the worst-ranking social groupwas much better off than the best-ranking one in Utrecht and Zeeland. This

304 FRANS VAN POPPEL, MARIANNE JONKER, AND KEES MANDEMAKERS
© Economic History Society 2005
showed the importance of the regional environment for the level of infantmortality in the nineteenth century, a finding that was confirmed time andagain in our analysis.
Changes in the social gradient over time were also observed. In the firstperiod, differences between social class were relatively small and no cleargradient was visible. In the period of increased mortality, the differencesbetween social classes were accentuated and were more in line with theexpected inverse relationship between social class and mortality. When IMRstarted to decline, the gap between the upper class and the white-collarmiddle class narrowed again.
Do the results of our study support the hypotheses that we formulatedregarding the effects of time, environment, and age on social class differ-ences in mortality?
Our first hypothesis was that infants were less sensitive to social condi-tions than children aged one or older. Our study did not confirm thishypothesis. For neonatal mortality, as well as for post-neonatal mortalityand for infant mortality, differences between social classes were found thatwere the same as those observed among children aged one to five. Thisconfirms the recent observations by Derosas and Landers that mortality inthe first month of life was caused not only by purely endogenous factors,but that the environment, social class included, played a role at this age aswell, and contradicts the generally held view.48
The second hypothesis was that the level of social inequality dependedon the characteristics of the environment. We expected that in provinceswith a low sanitary level, social class differences would be less pronouncedthan in areas with better health conditions, and that in rural areas, equitybetween social classes would be higher than in urban areas. Our analysisshowed that the environment was far more important for survival than thesocial class to which one belonged. Nonetheless, we might conclude that,in general, in low-mortality Friesland, social class differences in infantmortality were less pronounced than in the provinces characterized by veryhigh mortality. Zeeland in particular had higher degree of inequality thanFriesland. For child mortality, differences were larger in Friesland.
Our third hypothesis dealt with the development of social differences overtime. We expected that differences between social classes increased overtime, as wealthier groups could take advantage at an earlier stage ofadvances in medical knowledge and improved sanitary standards, and byincreased social segregation. If a conclusion is allowed on this aspect, thenit is that in the period 1880–1909, the effect of social class was less than itwas in the earlier periods, for infant as well as for early childhood mortality.
How do the results of our analysis compare with other studies? As far astime trends are concerned, the problem is, as was indicated earlier, that
48 Derosas, ‘Watch out’; Landers, Death, pp. 139–41. For the opposite view see e.g. Haines,‘Inequality’.

DUTCH DIFFERENTIAL INFANT AND CHILD MORTALITY 305
© Economic History Society 2005
most studies of trends in social equality have focused on a very restrictivetime period, i.e. on the last quarter of the nineteenth and the first decadesof the twentieth century. Only Swedish studies have applied a comparabletime frame. The Swedish study that was similar to ours found contradictoryresults and, in general, no clear changes in socio-economic patterns ofmortality. The results of both our own and the Swedish study do show thata limited time perspective can lead to distorted conclusions regarding thetrend in social inequality in mortality over time: there is no continuousincrease or decrease in differences, and the period that is used as the startingpoint for the analysis might have a strong effect on the conclusions that arereached.
The Antonovsky study usually taken as the standard reference whenstudying trends in social-class mortality differences has other importantdisadvantages as well: it groups together data from a variety of towns andregions over a long time period, and uses these data as the basis for thecomparison over time. What our results have in common with the studiesdone in the UK is that such a procedure is not allowed: the relation betweensocial position and infant mortality differs very strongly depending on theenvironment, and only by studying a set of varying environments over timeis it possible to reach firmer conclusions. Our analysis confirmed the con-clusions from the British studies that showed that the environment categoryis consistently able to explain more variance in infant and child mortalitythan the social class categories. However, contrary to these studies, theeffects of rural-urban differentials were not central to the spatial variationsin infant mortality in The Netherlands. This might be explained by the factthat the urban areas in the selected provinces were mostly small towns, notinundated with immigrants and beset with crowding, poor sanitation, andsubstandard housing, whereas the rural areas were characterized by highpopulation density. Furthermore, the selected provinces were part of theeconomic and cultural system of the west and north, as a consequence ofwhich, they had a relatively well-developed transportation network (water-ways), and agricultural activities that were highly market-oriented.
In line with the British studies cited in the introduction, we observed thatpoor environments did magnify the socio-economic inequalities in infantmortality. This applies to the provinces with high mortality, but also toperiods characterized by heightened levels of mortality (1840–79). Reid, aswell as Garrett and colleagues, argued that in poor environments where thethreat posed by infant and childhood diseases was high, superior resourcesand knowledge were able to offer some protection in the early years of life.In situations where the environment did not present such a virulent attackon the health of the young, the meagre resources of the lower classes offeredas effective a defence as the greater ones of the middle classes. Reid suggestedthat this could be accounted for by more effective information networks, bygreater pressure from the middle classes for sanitary improvements thatenhanced the health of the whole community, or by the fact that the middle-

306 FRANS VAN POPPEL, MARIANNE JONKER, AND KEES MANDEMAKERS
© Economic History Society 2005
class’s superior resources did not constitute much of an advantage, becausethe environment represented less of a threat to their children’s health.
We suggest that the observed contrast in social inequality in infant mor-tality between the Dutch provinces, in particular between Zeeland andFriesland, is the combined effect of differences in the sanitation level anddifferences in the diet of infants. There are many indications that in Frieslandbreast-feeding was much more widespread over the social classes, and wasutilised for a longer period than in Zeeland. A first indirect indication isthat our data show that a summer maximum in infant mortality was notobserved in Friesland, whereas such a peak was common in Zeeland. Forchildren who were bottle-fed, the summer period was generally muchriskier.49 A second indication is in cause-of-death statistics. Compared toZeeland and Utrecht, per 1,000 live births in Friesland during the period1875–99, a much smaller number of children died from convulsions,diarrhoea, and atrophy than in the other provinces.50 The low fertility inFriesland also fits a context of frequent and long breastfeeding.51 Lastly, wecan refer to several observations of contemporary medical doctors regardingFriesland, as well as Zeeland.52 It was the interaction between the lowincidence of breast-feeding and the atrocious condition of the drinking waterand sanitation that led to high mortality in Zeeland and Utrecht. InFriesland, children’s diets and the higher quality of the environment offeredeven children from poor families high chances of surviving the first year oflife; in Zeeland and Utrecht low frequencies of breast-feeding, or socialdifferences in their frequency, combined with atrocious ecological condi-tions, in particular for the lower social classes, caused larger social differ-ences in infant mortality. Such a role for infant-feeding practices is consistentwith the conclusion that for early childhood mortality, Friesland did showlarger differences.
The results of our analyses did not allow a simple and unequivocalconfirmation or rejection of the hypotheses with which we started ourarticle. Many questions regarding the evolution of, and variation in, socio-economic differences in mortality are still unanswered. To reach furtherprogress in this field, it is necessary to improve the quality and volume ofthe information on mortality at the individual and household levels, as wellas the relevant characteristics of the environment in which the child is bornand raised. This implies enlarging the existing database, by completing theinformation on children for whom at this moment no information onsurvival is available, by adding information on the characteristics of the
49 Saltet, ‘Nederlandsche maatschappij’.50 These data are based on Vijfjarig overzicht van de sterfte naar den leeftijd en de oorzaken van den dood
in elke gemeente van Nederland gedurende 1875–1879, 1880–1884,1885–1889, 1890–1894 en 1895–1899.The classification of causes of death is described in Wolleswinkel-van den Bosch, van Poppel, andMackenbach, ‘Reclassifying causes of death’.
51 Lesthaeghe, The breast-feeding hypothesis.52 Rapport der Commissie, p. 491; Fokker, ‘De volksvoeding’; Broes van Dort, Bijdrage; Coronel,
Middelburg; Helderman, ‘De kindersterfte’; Allbutt, ‘Sur la mortalité’; Coronel, ‘De volksvoeding’.

DUTCH DIFFERENTIAL INFANT AND CHILD MORTALITY 307
© Economic History Society 2005
individual, the parents, and the other household members, and by addingdata from other provinces as well. Factors such as birthplace of the mother,age of wife, parity, birth intervals, and the presence of other family mem-bers, will become available at the family level, thereby making possible ananalysis comparable with the one done for the UK for the last decade ofthe nineteenth century with census data.53 The broader geographic coverageof that study will allow us to compare regions that have a greater diversityin factors considered relevant in studying the mortality transition, includingheavily industrial environments. This will be done in a research project thatstarted in 2003, and which will be completed in the future.54 In addition tothat, information will be collected that will allow us to reconstruct somecharacteristics of the environment that might have had an effect on themortality level of the community as a whole. Included among these areindicators of water quality, income level, indicators of occupational distri-bution, population density, and migration. By studying children within thecontext of their families in a greater variety of spatially differentiated healthenvironments it might become possible to find out which individual char-acteristics in what locational circumstances play a role in the building of therelationship between social class and infant and child mortality.
Netherlands Interdisciplinary Demographic Institute (NIDI)Department of Mathematics, Faculty of Sciences, Tree University AmsterdamInternational Institute of Social History, Amsterdam
First submitted 21 February 2002Revised version submitted 5 November 2004Accepted 10 November 2004
53 Garrett et al., Changing family size.54 For more information on the project, called Life courses in context, see
http://www.lifecoursesincontext.nl
Footnote referencesAllbutt, H. A., ‘Sur la mortalité infantile et la mort prématurée’, in: Congrès périodique international des
sciences médicales, 6e session. Amsterdam Septembre 1879 Compte-rendu publié par M. Guye, et MMDe Perrot, Stokvis et Zeeman, Tome second, (Amsterdam, 1881). pp. 35–41.
Antonovsky, A. and Bernstein, J., ‘Social class and infant mortality’, Social Science and Medicine, 11(1977), pp. 453–70.
Blum, A., ‘An estimate of local adult mortality based on family cards’, Population (E), 44 (1989),pp. 39–56.
Broes van Dort, K., Bijdrage tot de kennis van de sterfte der gemeente Goes en van den gemiddelden enwaarschijnlijken levensduur harer inwoners gedurende 1830–59 (Goes, 1861).
Coronel, S., Sr., ‘De volksvoeding in Friesland’, Nederlandsch Tijdschrift voor Geneeskunde 20 (1876),pp. 103–129.
Coronel, S. Sr., Middelburg voorheen en thans (Middelburg, 1859).Currie, J. and Stabile, M., Socioeconomic status and health: why is the relationship stronger for older children?
National Bureau of Economic Research, Working paper 9098 (Cambridge, Mass., 2002).Derosas, R. ‘Watch out for the children! Differential infant mortality of Jews and Catholics in nineteenth-
century Venice’, Historical Methods, 36 (2003), pp. 109–30.

308 FRANS VAN POPPEL, MARIANNE JONKER, AND KEES MANDEMAKERS
© Economic History Society 2005
Van Dijk, J. P., Dol, G. J., Groothoff, J. W., and van Rossum, W., ‘Interest in the issue of healthdifferences in the Netherlands from 1850–1990’, Socio-economic health differences. Proceedings of asymposium held in 1991. Rotterdam, 1991, pp. 77–79.
Doblhammer, G. and Vaupel, J. W., ‘Lifespan depends on month of birth’, Proceedings of the NationalAcademy of Sciences of the United States of America, 98 (2001), pp. 2934–39.
Edvinsson, S., ‘Social differences in infant and child mortality in 19th century Sweden’, in Marco Breschiand Lucia Pozzi, eds., The determinants of infant and child mortality in past European populations (Udine,2004), pp. 67–88.
Ferrie, J. P., ‘The Rich and the Dead: Socioeconomic Status and Mortality in the United States, 1850–60’, in Dora L. Costa ed., Health and labor force participation over the life cycle: evidence from the past(Chicago, 2003), pp. 11–50.
Fokker, A. P., ‘De volksvoeding in Zeeland’, Nederlands Tijdschrift voor Geneeskunde, 21 (1877), seriesII, pp. 195–240.
Frieswijk, J., (ed.), Geschiedenis van Friesland 1750–1995 (Amsterdam, 1998).Galema, A., Frisians to America, 1880–1914: with the baggage of the fatherland (Groningen, 1996).Garrett, E., Reid, A., Schürer, K., and Szreter, S., Changing family size in England and Wales. place, class
and demography, 1891–1911 (Cambridge, 2001).Giele J. J. and van Oenen, G. J., ‘Theorie en Praktijk van onderzoek naar de sociale struktuur’, Tijdschrift
voor Sociale Geschiedenis, 2 (1976), pp. 167–85.H. (pen name D. J. Helderman), ‘De kindersterfte te Wissenkerke op Noord-beveland’, Nederlands
Tijdschrift voor Geneeskunde, 19 (1875), Series I, pp. 45–58.Haines, M. R., ‘Inequality and childhood mortality: a comparison of England and Wales, 1911, and the
United States, 1900’, Journal of Economic History, 45 (1985), pp. 885–911.Heederik, G. J., Van kasboekregister tot burgerlijke stand. Medisch-demografische aspecten van de registratie
van huwelijken, geboorte en sterfte (Meppel, 1973).Houwaart, E. S., De hygiënisten. Artsen, staat en volksgezondheid in Nederland 1840–1890. (Groningen,
1991).Jonker, M. A., ‘Maximum likelihood estimation of life-span based on censored and passively registered
historical data’, Lifetime Data Analysis, 9 (2003), pp. 35–56.Kok, J., ‘Youth labor migration and its family setting, the Netherlands 1850–1940’, The History of the
Family, 2 (1997), pp. 507–526.Kok, J., van Poppel, F., and Kruse, E., ‘Mortality among illegitimate children in mid-nineteenth-century
The Hague’, in Carlo A. Corsini and Pier Paolo Viazzo, eds., The decline of infant and child mortality.The European Experience: 1750–1990, (The Hague, 1997), pp. 193–211.
Landers, J., Death and the metropolis: studies in the demographic history of London, 1670–1830 (Cambridge,1993).
Lesthaeghe, R., The breast-feeding hypothesis and regional differences in marital fertility and infant mortalityin the Low Countries during the 19th century: comments on a debate. Brussel, Vrije universiteit, 1987.(Inter-university programme in demography; working paper; 1987–3).
Mackenbach, J. P., De veren van Icarus: over de achtergronden van twee eeuwen epidemiologische transitiesin Nederland (Utrecht, 1992).
Mackenbach J. P., Stronks, K., and van Trirum, H., ‘Sociaal-economische gezondheidsverschillen alsthema in het volksgezondheidsonderzoek in Nederland, circa 1850–1995’, Tijdschrift voor Gezond-heidswetenschappen, 76 (1998), pp. 24–31.
Mandemakers, K., ‘The Netherlands. Historical Sample of the Netherlands’, in P. Kelly Hall, R. McCaa,and G. Thorvaldsen, eds., Handbook of international historical microdata for population research(Minneapolis, 2000), pp. 149–77.
Menno Huizinga, J. and Pijnappel, M. W., ‘Rapport omtrent de inrichting der sterftestatistiek’, in: Verslagaan de Koningin van de bevindingen en handelingen van het Geneeskundig Staatstoezicht in het jaar 1898(’s-Gravenhage, 1900), pp. 33–48.
Mheen, H. van de, Reijneveld, S. A., and Mackenbach, J. P. ‘Socioeconomic inequalities in perinataland infant mortality from 1854 to 1990 in Amsterdam, the Netherlands’, European Journal of PublicHealth, 6 (1996), pp. 166–174.
Pamuk, Elsie R., ‘Social-class inequality in infant mortality in England and Wales from 1921 to 1980’,European Journal of Population, 4 (1988), pp. 1–21.
Perrenoud, A., ‘Child mortality in Francophone Europe: State of Knowledge’, in A. Bideau, B. Desjardins,and H. Pérez-Brignoli, eds., Infant and Child mortality in the past (Oxford, 1997), pp. 22–37.
van Poppel, F., ‘The relationship between socio-economic position and infant and childhood mortalityin the Netherlands in the period 1850–1940’, in IUSSP International Population Conference Manila1981. Vol. 5. Proceedings and Selected Papers. (Liége, 1983). pp. 649–89.

DUTCH DIFFERENTIAL INFANT AND CHILD MORTALITY 309
© Economic History Society 2005
van Poppel, F., and Beekink, E., ‘De biometer in kaart gebracht. Zuigelingen- en totale sterftecijfersvoor Nederlandse gemeenten, 1812–1939’, Gewina: tijdschrift voor de geschiedenis der geneeskunde,natuurwetenschappen, wiskunde en techniek, 24 (2001), pp. 18–32.
Priester, P., Geschiedenis van de Zeeuwse landbouw circa 1600–1910 (Wageningen, 1998).Rapport der Commissie belast met het onderzoek naar den toestand der kinderen in fabrieken arbeidende. Vierde
aflevering. Resultaten van het onderzoek der sterfte-statistiek. (’s-Gravenhage, 1869).Reid, A., ‘Locality or Class? Spatial and Social Differentials in Infant and Child Mortality in England
and Wales, 1895–1911’, in C. A. Corsini and P. P. Viazzo, eds., The decline of infant and child mortality.the European experience, 1750–1990 (The Hague, 1997), pp. 129–54.
Ruggles, S., ‘Migration, marriage, and mortality: Correcting sources of bias in English family reconsti-tutions’, Population Studies, 46 (1992), pp. 507–22.
Saltet, R. H., ‘Nederlandsche maatschappij tot bevordering der geneeskunst, Negen-en-vijftigste alge-meene vergadering gehouden 6, 7 en 8 juli 1908 te Rotterdam. Sectie voor Hygiëne’, NederlandsTijdschrift voor Geneeskunde, 44 (1908) series II, pp. 1162–70.
Smith, D. S., ‘Mortality differentials before the health transition’, Health transition review, 1 (1991),pp. 235–237.
Smith, D. S., ‘Differential mortality in the United States before 1900’, Journal of Interdisciplinary History,13 (1983), pp. 735–59.
Sociaal-economische gezondheidsverschillen verkleinen. Eindrapportage en beleidsaanbevelingen van de Pro-grammacommissie SEGV-II. (Den Haag, 2001).
Spree, R., Soziale Ungleichheit vor Krankheit und Tod. Zur Sozialgeschichte des Gesundheitsbereichs imDeutschen Kaiserreich (Göttingen, 1981).
Vandenbroeke, C., van Poppel, F., and van der Woude, A. M., ‘Le développement séculaire de lamortalité aux jeunes âges dans le territoire du Bénélux’, Annales de Démographie Historique, 1983(Paris, 1984), pp. 257–89.
VanDerslice, J., Popkin, B., and Briscoe, J., ‘Drinking-water quality, sanitation, and breast-feeding:their interactive effects on infant health’, Bulletin of the World Health Organization, 1984 (72),pp. 589–601.
Vermaas, A., ‘Wages, salaries and income inequality in the Netherlands, 1850–1913’, in P. Scholliersand V. Zamagni, Real wages in 19th and 20th century Europe. Historical and comparative perspectives(1985, Aldershot), pp. 138–50.
Williams, N., ‘Death in its season, class, environment and the mortality of infants in nineteenth-centurySheffield’, Social History of Medicine, 5 (1992), pp. 71–94.
Wintle, M. J., Aspects of religion and society in the province of Zeeland (Netherlands) in the nineteenthcentury (Unpublished PhD thesis, University of Hull, 1985.
Wolleswinkel-van den Bosch, J. H., van Poppel, F. W. A., and Mackenbach, J. P., ‘Reclassifying causesof death to study the epidemiological transition in the Netherlands, 1875–1992’, European Journal ofPopulation, 12 (1996), pp. 327–61.
Woods, R., Williams, N., and Galley, C., ‘Infant mortality in England-1550–1950: Problems in theidentification of long-term trends and geographical and social variations’, in C. A. Corsini andP. P. Viazzo, eds., The decline of infant mortality in Europe-1800–1950- Four national case studies(Florence, 1993), pp. 35–50.
Woods, R. and Williams, N., ‘Must the gap widen before it can be narrowed? Long-term trends in socialclass mortality differentials’, Continuity and Change, 10 (1995), pp. 105–37.
Woods, R., The demography of Victorian England and Wales (Cambridge, 2000).Wrigley, E. A., Davies, R. S., Oeppen, J. E., and Schofield, R. S., English population history from family
constitution, 1580–1837 (Cambridge, 1997).