Differential effective medium schemes for investigating the relationship between high-frequency...
13
Differential effective medium schemes for investigating the relationship between high-frequency relative dielectric permittivity and water content of soils Philippe Cosenza, Christian Camerlynck, and Alain Tabbagh UMR 7619, Sisyphe, Universite ´ Pierre et Marie Curie, CNRS, Paris, France Received 15 October 2002; revised 27 January 2003; accepted 4 April 2003; published 3 September 2003. [1] Differential effective medium (DEM) theory is presented and used to calculate the effective HF dielectric permittivity k of unsaturated soils considered as mixtures of solid and two fluid phases. In the case of coarse-grained soils for which dielectric losses are negligible, a good agreement with the empirical equation of Topp et al. [1980] is obtained using only a spherical grain shape. Moreover, results of DEM schemes have shown that ohmic losses induced by salinity modify significantly the relationship between the apparent dielectric permittivity at 120 MHz and the volumetric water content q, for NaCl concentration greater than 0.045 mol/L. In the case of clayey soils, simulations based on the same theoretical approach show that the available data can not be modeled by considering only the geometrical effect associated with the ‘‘platy’’ units and the ohmic losses associated with the surface conductivity. INDEX TERMS: 0699 Electromagnetics: General or miscellaneous; 1866 Hydrology: Soil moisture; 5112 Physical Properties of Rocks: Microstructure; KEYWORDS: relative dielectric permittivity, volumetric water content, differential effective medium theory Citation: Cosenza, P., C. Camerlynck, and A. Tabbagh, Differential effective medium schemes for investigating the relationship between high-frequency relative dielectric permittivity and water content of soils, Water Resour. Res., 39(9), 1230, doi:10.1029/2002WR001774, 2003. 1. Introduction [2] It is well known that the electromagnetic properties of soils vary as a function of water content. Since the relative permittivity of water is significantly higher than that of other materials commonly found in soils, there has been much interest in using the relative permittivity of soils as an ‘‘indirect’’ measurement of water saturation. In particular, capacitance sensors [e.g., Tran Ngoc et al., 1972], time domain reflectometry (TDR) probes [e.g., Davies et al., 1977] and ground-penetrating radar (GPR) [e.g., Chanzy et al., 1996] are often used to determine the moisture content of soils. These different types of device have been devel- oped in few dozen of MHz to 1 GHz frequency range and allow to obtain a high-frequency (HF) relative permittivity measurement. [3] In order to transform this measurement into a mois- ture content value, various empirical equations have been suggested for the relation of the HF relative permittivity k and the volumetric water content q [Birchak et al., 1974; Topp et al., 1980; Wang and Schmugge, 1980; Ruault and Tabbagh, 1980; Hallikainen et al., 1985; Alharti and Lange, 1987; Jacobsen and Schjonning, 1993; Curtis, 2001]. The most commonly used equation is that of Topp et al. [1980]: q ¼ 4:3 10 6 k 3 5:5 10 4 k 2 þ 2:92 10 2 k 5:3 10 2 ð1Þ [4] This equation is valid for a wide range of mineral soils and independent of soil bulk density, ambient temper- ature, and salt content. This led many authors to the use of the term ‘‘universal’’ for this equation with appropriate caveat that ‘‘in organic soils or heavy clay soils problems arise which may require site-specific calibration’’ [Zegelin et al., 1992]. [5] In our opinion, in order to improve the inversion of relative permittivity data for the widest range of soils and physicochemical conditions, a better understanding of the effect of the water distribution and the soil texture on the relative permittivity is required [e.g., Tabbagh et al., 2000; Robinson and Friedman, 2001]. This understanding should be based on a quantitative physical description of soils considered as a three-phase mixture at a microscopic scale. [6] A great deal of theoretical work has been devoted to the estimation of relative permittivity of heterogeneous media in terms of electromagnetic properties of the constituents and their geometrical arrangements. There are three distinct approaches: (1) statistical network models (2) numerical models and (3) effective medium approximations. [7] In the first group, the porous media is considered as a three-dimensional network of capacitors [Ansoult et al., 1984; Friedman, 1997]. The probable path of an electric charge in the network is a function of the solid, water, and air components, distributed in their volume fractions. In this statistical approach, the capacitors represent the three com- ponents and are randomly distributed in the network. Nevertheless, this approach has three limitations: (1) it includes calibration parameters with no clear physical mean- ing [e.g., Ansoult et al., 1984], (2) it does not take into account effect of texture and fluid distribution on the relation between relative permittivity and water content, (3) although an electrical analogy is established, it is not based on the Copyright 2003 by the American Geophysical Union. 0043-1397/03/2002WR001774$09.00 SBH 1 - 1 WATER RESOURCES RESEARCH, VOL. 39, NO. 9, 1230, doi:10.1029/2002WR001774, 2003
-
Upload
sorbonne-fr -
Category
Documents
-
view
0 -
download
0
Transcript of Differential effective medium schemes for investigating the relationship between high-frequency...

Differential effective medium schemes for investigating the
relationship between high-frequency relative dielectric permittivity
and water content of soils
Philippe Cosenza, Christian Camerlynck, and Alain TabbaghUMR 7619, Sisyphe, Universite Pierre et Marie Curie, CNRS, Paris, France
Received 15 October 2002; revised 27 January 2003; accepted 4 April 2003; published 3 September 2003.
[1] Differential effective medium (DEM) theory is presented and used to calculate theeffective HF dielectric permittivity k of unsaturated soils considered as mixtures of solidand two fluid phases. In the case of coarse-grained soils for which dielectric losses arenegligible, a good agreement with the empirical equation of Topp et al. [1980] is obtainedusing only a spherical grain shape. Moreover, results of DEM schemes have shown thatohmic losses induced by salinity modify significantly the relationship between theapparent dielectric permittivity at 120 MHz and the volumetric water content q, for NaClconcentration greater than 0.045 mol/L. In the case of clayey soils, simulations based onthe same theoretical approach show that the available data can not be modeled byconsidering only the geometrical effect associated with the ‘‘platy’’ units and the ohmiclosses associated with the surface conductivity. INDEX TERMS: 0699 Electromagnetics: General
or miscellaneous; 1866 Hydrology: Soil moisture; 5112 Physical Properties of Rocks: Microstructure;
KEYWORDS: relative dielectric permittivity, volumetric water content, differential effective medium theory
Citation: Cosenza, P., C. Camerlynck, and A. Tabbagh, Differential effective medium schemes for investigating the relationship
between high-frequency relative dielectric permittivity and water content of soils, Water Resour. Res., 39(9), 1230,
doi:10.1029/2002WR001774, 2003.
1. Introduction
[2] It is well known that the electromagnetic properties ofsoils vary as a function of water content. Since the relativepermittivity of water is significantly higher than that ofother materials commonly found in soils, there has beenmuch interest in using the relative permittivity of soils as an‘‘indirect’’ measurement of water saturation. In particular,capacitance sensors [e.g., Tran Ngoc et al., 1972], timedomain reflectometry (TDR) probes [e.g., Davies et al.,1977] and ground-penetrating radar (GPR) [e.g., Chanzy etal., 1996] are often used to determine the moisture contentof soils. These different types of device have been devel-oped in few dozen of MHz to 1 GHz frequency range andallow to obtain a high-frequency (HF) relative permittivitymeasurement.[3] In order to transform this measurement into a mois-
ture content value, various empirical equations have beensuggested for the relation of the HF relative permittivity kand the volumetric water content q [Birchak et al., 1974;Topp et al., 1980; Wang and Schmugge, 1980; Ruault andTabbagh, 1980; Hallikainen et al., 1985; Alharti and Lange,1987; Jacobsen and Schjonning, 1993; Curtis, 2001]. Themost commonly used equation is that of Topp et al. [1980]:
q ¼ 4:3 10�6k3 � 5:5 10�4k2 þ 2:92 10�2k� 5:3 10�2 ð1Þ
[4] This equation is valid for a wide range of mineralsoils and independent of soil bulk density, ambient temper-
ature, and salt content. This led many authors to the use ofthe term ‘‘universal’’ for this equation with appropriatecaveat that ‘‘in organic soils or heavy clay soils problemsarise which may require site-specific calibration’’ [Zegelinet al., 1992].[5] In our opinion, in order to improve the inversion of
relative permittivity data for the widest range of soils andphysicochemical conditions, a better understanding of theeffect of the water distribution and the soil texture on therelative permittivity is required [e.g., Tabbagh et al., 2000;Robinson and Friedman, 2001]. This understanding shouldbe based on a quantitative physical description of soilsconsidered as a three-phase mixture at a microscopic scale.[6] A great deal of theoretical work has been devoted to the
estimation of relative permittivity of heterogeneous mediain terms of electromagnetic properties of the constituentsand their geometrical arrangements. There are three distinctapproaches: (1) statistical network models (2) numericalmodels and (3) effective medium approximations.[7] In the first group, the porous media is considered as a
three-dimensional network of capacitors [Ansoult et al.,1984; Friedman, 1997]. The probable path of an electriccharge in the network is a function of the solid, water, and aircomponents, distributed in their volume fractions. In thisstatistical approach, the capacitors represent the three com-ponents and are randomly distributed in the network.Nevertheless, this approach has three limitations: (1) itincludes calibration parameters with no clear physical mean-ing [e.g., Ansoult et al., 1984], (2) it does not take intoaccount effect of texture and fluid distribution on the relationbetween relative permittivity and water content, (3) althoughan electrical analogy is established, it is not based on the
Copyright 2003 by the American Geophysical Union.0043-1397/03/2002WR001774$09.00
SBH 1 - 1
WATER RESOURCES RESEARCH, VOL. 39, NO. 9, 1230, doi:10.1029/2002WR001774, 2003
fundamentals of electromagnetic theory (i.e., Maxwell’sequations) governing the physical processes involved atthe microscopic scale.[8] The second group of approaches is based on a
numerical solution of Maxwell’s equations written at amicroscopic scale. This approach has been used to modeldc electrical conductivity [e.g., Adler et al., 1992] andrecently relative permittivity by using the moment method[Tabbagh et al., 2000]. These numerical models are efficienttools to study textural effects but may be time-consuming toobtain accurate solutions and often complicated to imple-ment and to validate. This is why effective medium approx-imations are often preferred.[9] In the effective medium theories, the relative permit-
tivity is calculated by using inclusion-based models thatview the porous medium as a matrix with randomlyembedded spherical or ellipsoidal inclusions representingindividual pores or solid grains [e.g., De Loor, 1983]. Themost commonly used assumptions are the dilute approxima-tion, called non-self consistent approximation, and the self-consistent approximation [e.g., Gueguen and Palciauskas,1994]. In the dilute approximation, the electromagneticinteractions between the elementary particles are neglected.In the self-consistent approximation, these interactions areoverestimated: the elementary inclusions are embedded intothe effective medium itself that includes all the othersparticles. In spite of this approximation, the latter approachhas been applied by Friedman [1998] who considered acomposite spheres model. This model gave a good agree-ment with experimental data but Friedman’s model does notallow us to study the effects of microscopic liquid distribu-tions on the dielectric properties.[10] The approach presented hereafter is based on differ-
ential schemes for the effective relative permittivity, alsocalled iterated dilute limit approximations [e.g., Sen et al.,1981; Norris, 1985]. In a two-phase composite medium, onephase is taken as a matrix and the other is added incremen-tally in a such way that the newly added material is always indilute concentration with respect to the current effectivemedium. This differential effective medium (DEM) theoryoffers three advantages: (1) it integrates the electromagneticinteractions in a more realistic way than the dilute approx-imation and the self-consistent model, (2) particle shapeeffects [e.g., Jones and Friedman, 2001] on effectiverelative permittivity can also be studied, (3) numerically,it is easy to implement. Moreover, this approach waswidely and successfully used in rocks physics in order tomodel the following properties of sedimentary rocks:(1) elastic properties related to seismic velocities [LeRavalec, 1995; Le Ravalec and Gueguen, 1996; Berrymanet al., 2002]; (2) dc electrical conductivity [Sen et al., 1981;Bussian, 1983; Revil et al., 1998]; (3) dielectric propertiesin a wide range of frequencies [Feng and Sen, 1985;Chelidze and Gueguen, 1999]. Note that a review and acomparison between the different effective medium theoriesused for modeling elastic properties [Le Ravalec, 1995; LeRavalec and Gueguen, 1996] have shown that the DEMschemes provided the best agreements with experimentaldata.[11] The DEM approach is briefly presented in the first
part of the paper. In the second and the third part, it is usedto investigate the effects of fluid distribution and ohmic
losses on the relative permittivity considering sandy soilsand clayey soils, respectively.
2. Differential Effective Medium (DEM) Theory
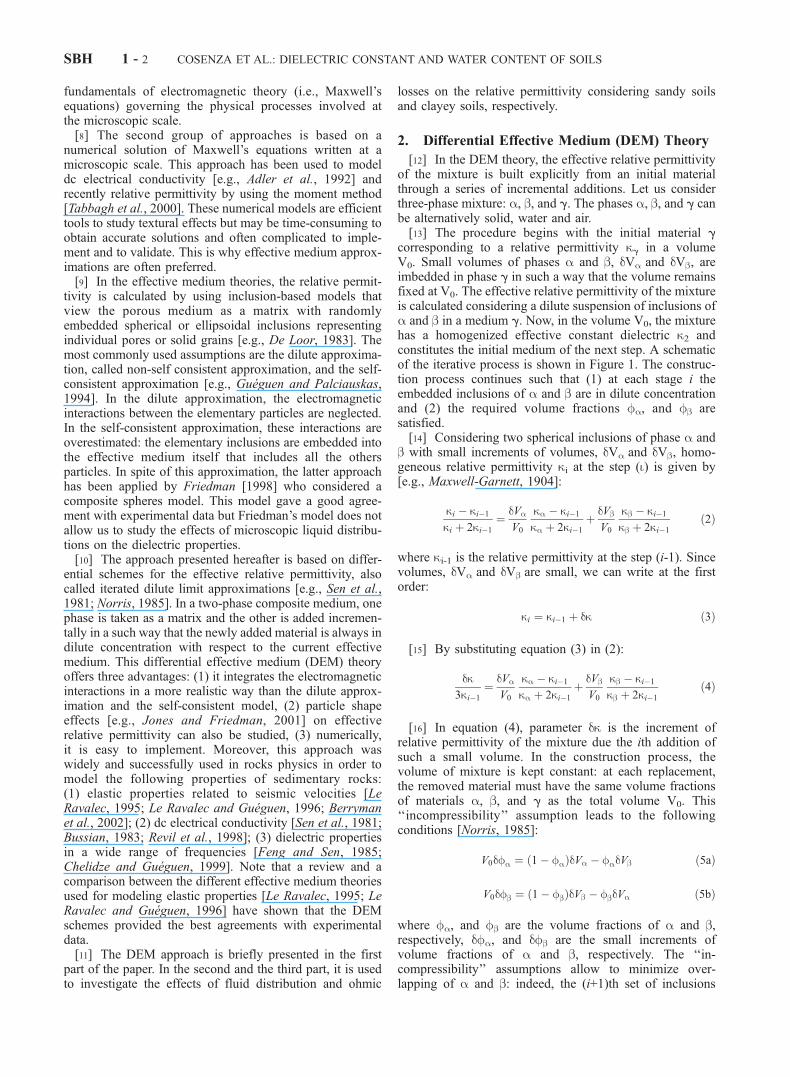
[12] In the DEM theory, the effective relative permittivityof the mixture is built explicitly from an initial materialthrough a series of incremental additions. Let us considerthree-phase mixture: a, b, and g. The phases a, b, and g canbe alternatively solid, water and air.[13] The procedure begins with the initial material g
corresponding to a relative permittivity kg in a volumeV0. Small volumes of phases a and b, dVa and dVb, areimbedded in phase g in such a way that the volume remainsfixed at V0. The effective relative permittivity of the mixtureis calculated considering a dilute suspension of inclusions ofa and b in a medium g. Now, in the volume V0, the mixturehas a homogenized effective constant dielectric k2 andconstitutes the initial medium of the next step. A schematicof the iterative process is shown in Figure 1. The construc-tion process continues such that (1) at each stage i theembedded inclusions of a and b are in dilute concentrationand (2) the required volume fractions fa, and fb aresatisfied.[14] Considering two spherical inclusions of phase a and
b with small increments of volumes, dVa and dVb, homo-geneous relative permittivity ki at the step (i) is given by[e.g., Maxwell-Garnett, 1904]:
ki � ki�1
ki þ 2ki�1
¼ dVa
V0
ka � ki�1
ka þ 2ki�1
þ dVb
V0
kb � ki�1
kb þ 2ki�1
ð2Þ
where ki-1 is the relative permittivity at the step (i-1). Sincevolumes, dVa and dVb are small, we can write at the firstorder:
ki ¼ ki�1 þ dk ð3Þ
[15] By substituting equation (3) in (2):
dk3ki�1
¼ dVa
V0
ka � ki�1
ka þ 2ki�1
þ dVb
V0
kb � ki�1
kb þ 2ki�1
ð4Þ
[16] In equation (4), parameter dk is the increment ofrelative permittivity of the mixture due the ith addition ofsuch a small volume. In the construction process, thevolume of mixture is kept constant: at each replacement,the removed material must have the same volume fractionsof materials a, b, and g as the total volume V0. This‘‘incompressibility’’ assumption leads to the followingconditions [Norris, 1985]:
V0dfa ¼ ð1� faÞdVa � fadVb ð5aÞ
V0dfb ¼ ð1� fbÞdVb � fbdVa ð5bÞ
where fa, and fb are the volume fractions of a and b,respectively, dfa, and dfb are the small increments ofvolume fractions of a and b, respectively. The ‘‘in-compressibility’’ assumptions allow to minimize over-lapping of a and b: indeed, the (i+1)th set of inclusions
SBH 1 - 2 COSENZA ET AL.: DIELECTRIC CONSTANT AND WATER CONTENT OF SOILS
a and b will essentially replace material g, but also a partof the previously added inclusions. By using equations(5a) and (5b), parameters dVa and dVb can be replaced bydfa, and dfb.[17] Consequently, a construction process is uniquely
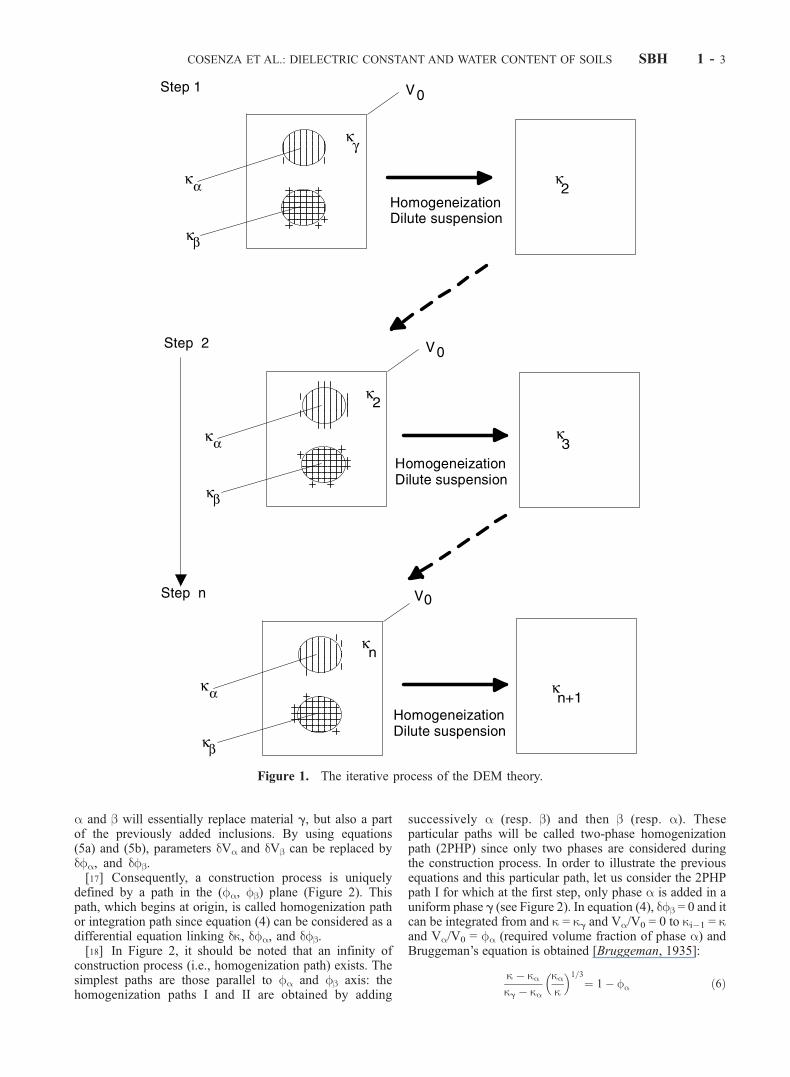
defined by a path in the (fa, fb) plane (Figure 2). Thispath, which begins at origin, is called homogenization pathor integration path since equation (4) can be considered as adifferential equation linking dk, dfa, and dfb.[18] In Figure 2, it should be noted that an infinity of
construction process (i.e., homogenization path) exists. Thesimplest paths are those parallel to fa and fb axis: thehomogenization paths I and II are obtained by adding
successively a (resp. b) and then b (resp. a). Theseparticular paths will be called two-phase homogenizationpath (2PHP) since only two phases are considered duringthe construction process. In order to illustrate the previousequations and this particular path, let us consider the 2PHPpath I for which at the first step, only phase a is added in auniform phase g (see Figure 2). In equation (4), dfb = 0 and itcan be integrated from and k = kg and Va/V0 = 0 to ki�1 = kand Va/V0 = fa (required volume fraction of phase a) andBruggeman’s equation is obtained [Bruggeman, 1935]:
k� kakg � ka
kak
� �1=3¼ 1� fa ð6Þ
Figure 1. The iterative process of the DEM theory.
COSENZA ET AL.: DIELECTRIC CONSTANT AND WATER CONTENT OF SOILS SBH 1 - 3
[19] The effective property k is the relative permittivity ofa mixture with the required fg and fa. In order to calculatethe final effective relative permittivity kf with respect to therequired fb, inclusions b are added in the previous mixture.The following equation (7) is derived from equation (6) bysubstituting parameters k, ka and kg by parameters kf, kband k, respectively:
k f � kbk� kb
kbk f
� �1=3¼ 1� fb ð7Þ
where the effective relative permittivity k is calculated fromequation (6).[20] In Figure 2, path III is the more general case: phases
a and b are added simultaneously. In the following, it willbe called three-phase homogenization path (3PHP).
3. Coarse-Grained Soils
[21] In this part, we focus on coarse-grained soils forwhich the following assumptions are satisfied. (1) Solidparticles can be considered of spherical shape. (2) Theirspecific surface area is low and consequently the boundedwater content is not significant. (3) We use a water permit-tivity of 80, a solid permittivity of 4.3 by considering quartz
grains [Weast, 1983]. (4) The pore water has a low ionicconcentration. Hence, ohmic losses are negligible.[22] Moreover, the empirical equation of Topp et al.
[1980] (equation (1)) which holds approximate for coarse-grained soils will be considered as a reference. In thefollowing sections, 2PHP and 3PHP schemes are performedto model the k(q) relationship and compared to equation (1).3.1. 2PHP Paths
[23] 2PHP paths have been previously used by Wobschall[1977] and Alharthi and Lange [1987]. However, theauthors have compared their results with a low number ofdata associated with a low saturation degree (less than 60%)and a low frequency (less than 30 MHz). Moreover,Wobschall’s approach introduced adjustable parameters,which are difficult to estimate: the dispersed water fractionand the crevice water fraction. Here, we do not considerdirectly 2PHP paths but a linear combination of 2PHPwhich will be written as follows:
k ¼ 1� Sð Þkls þ Skhs ð8Þ
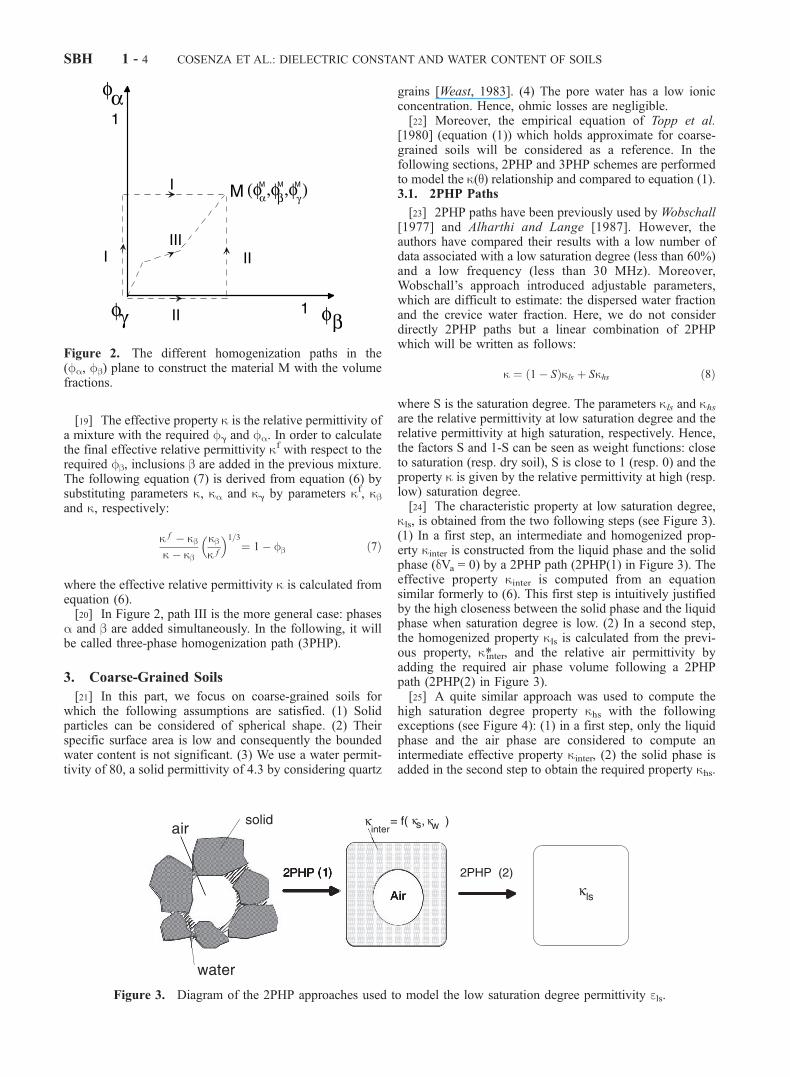
where S is the saturation degree. The parameters kls and khsare the relative permittivity at low saturation degree and therelative permittivity at high saturation, respectively. Hence,the factors S and 1-S can be seen as weight functions: closeto saturation (resp. dry soil), S is close to 1 (resp. 0) and theproperty k is given by the relative permittivity at high (resp.low) saturation degree.[24] The characteristic property at low saturation degree,
kls, is obtained from the two following steps (see Figure 3).(1) In a first step, an intermediate and homogenized prop-erty kinter is constructed from the liquid phase and the solidphase (dVa = 0) by a 2PHP path (2PHP(1) in Figure 3). Theeffective property kinter is computed from an equationsimilar formerly to (6). This first step is intuitively justifiedby the high closeness between the solid phase and the liquidphase when saturation degree is low. (2) In a second step,the homogenized property kls is calculated from the previ-ous property, k*inter, and the relative air permittivity byadding the required air phase volume following a 2PHPpath (2PHP(2) in Figure 3).[25] A quite similar approach was used to compute the
high saturation degree property khs with the followingexceptions (see Figure 4): (1) in a first step, only the liquidphase and the air phase are considered to compute anintermediate effective property kinter, (2) the solid phase isadded in the second step to obtain the required property khs.
Figure 2. The different homogenization paths in the(fa, fb) plane to construct the material M with the volumefractions.
Figure 3. Diagram of the 2PHP approaches used to model the low saturation degree permittivity els.
SBH 1 - 4 COSENZA ET AL.: DIELECTRIC CONSTANT AND WATER CONTENT OF SOILS

[26] The property k calculated from the latter 2PHPschemes and equation (8) is presented in Figure 5 andcompared to the empirical equation of Topp et al.’s [1980]equation. A good agreement is obtained.
3.2. 3PHP Path
[27] In this section, a 3PHP scheme is considered with thefollowing additional Feng and Sen’s [1985] assumption:
dVa
dVs
¼ V i!1a
V i!1s
¼ C ð9Þ
with
C ¼¼ n� q1� n
ð10Þ
where n is porosity. This assumption means that during theconstruction process, at each step, the ratio dVa/dVs is keptconstant. It allows to integrate analytically equation (4) sincedVa and dVs are related through condition (9). At step 0, thevolume V is filled with water. The same results are obtainedas in the work by Feng and Sen’s [1985], which involvedoil and gas mixtures in sedimentary porous rocks:
q ¼ Sn ¼ kwk
� �1=3 ak2 þ bkþ c
ak2w þ bkw þ c
� �1=2
� 2akþ b�ffiffiffiffiD
p
2akþ bþffiffiffiffiD
p 2akw þ bþffiffiffiffiD
p
2akw þ b�ffiffiffiffiD
p� �m
ð11Þ
with
m ¼ � 1
2ka þ 2ks þ Cð2ka þ ksÞ½ � 1ffiffiffiffi
Dp ð12Þ
and
D¼b2 � 4ac
a ¼ �2ðC þ 1Þ
b ¼ Cð2ka þ ksÞ þ ð2ks � kaÞc ¼ ð1þ CÞkaks
8><>: ð13Þ
[28] Equation (11) for which the effective property k isthe unknown, has been solved numerically with a Newton-Raphson scheme [e.g., Press et al., 1992]. The results weobtained for different volumetric water contents and fordifferent porosities are compared with the equation (1) inFigure 6. Model predictions were computed with the same
values used in section 3.1. In comparison with 2PHPschemes (Figure 5), a better agreement is obtained withthe empirical equation of Topp et al.[29] In conclusion, by considering the good agreements
we obtain in sections 3.1 and 3.2, the DEM approach seemsto capture the main physical processes involved in the k(q)relationship in simple three-phase media (i.e., coarse-grained soils and medium-textured mineral soils). Thisconclusion leads us to use the same approach for investi-gating more complex porous media: the clayey soils.
4. Clayey Soils
4.1. Phenomenological Background and Assumptions
[30] In a wide range of frequency, the permittivity ofclayey soils depends on texture (fine-grained materials) andelectrochemical/interfacial effects. Both aspects lead to thefollowing features, which do not exist in coarse-grained
Figure 4. Diagram of the 2PHP approaches used to model the high saturation degree permittivity ehs.
Figure 5. The effective relative permittivity as a functionof volumetric water content for two porosities (n = 0.4 andn = 0.6), calculated by a combination of 2PHP schemes(dashed lines). Also shown is the function of Topp et al.[1980] (solid line).
COSENZA ET AL.: DIELECTRIC CONSTANT AND WATER CONTENT OF SOILS SBH 1 - 5
soils with low pore water salinities: (1) a significantly highimaginary part of the permittivity; (2) a frequency depen-dent dielectric constant; (3) a high content of bound waterwith a low permittivity value.[31] The high imaginary part values are due to energy
losses associated with polarization and electrical conductiv-ity processes [e.g., Campbell, 1990]. Consequently, thepermittivity has to be considered as a complex quantitywith a real and imaginary component. The complex per-mittivity of clayey soils will be designated k* further and iswritten as follows:
k* ¼ k0 þ ik00 ð14Þ
where k0 and k00 are the real part and the imaginary part ofk*, respectively; i2 = �1. Note that in equation (14) bothdielectric losses and ohmic losses are included in theimaginary part k00. This unusual notation has been used inorder to obtain a clear presentation of both k0(q) and k00(q)relationships.[32] The frequency dependence of the relative permittiv-
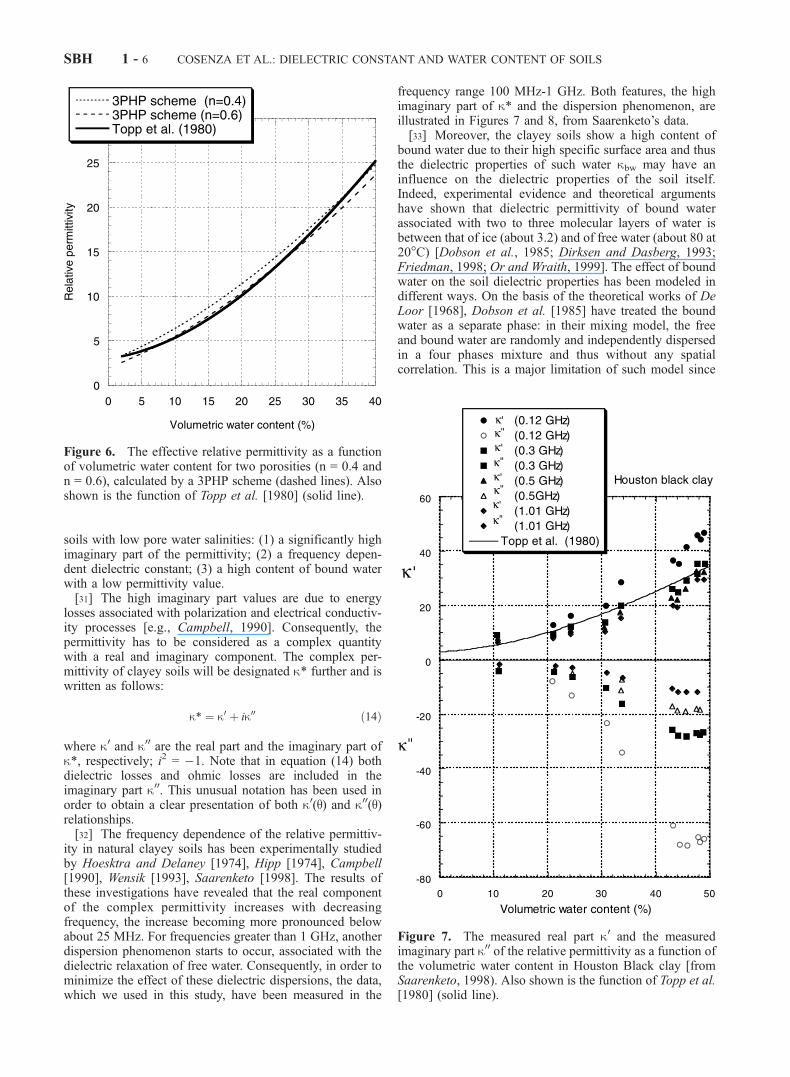
ity in natural clayey soils has been experimentally studiedby Hoesktra and Delaney [1974], Hipp [1974], Campbell[1990], Wensik [1993], Saarenketo [1998]. The results ofthese investigations have revealed that the real componentof the complex permittivity increases with decreasingfrequency, the increase becoming more pronounced belowabout 25 MHz. For frequencies greater than 1 GHz, anotherdispersion phenomenon starts to occur, associated with thedielectric relaxation of free water. Consequently, in order tominimize the effect of these dielectric dispersions, the data,which we used in this study, have been measured in the
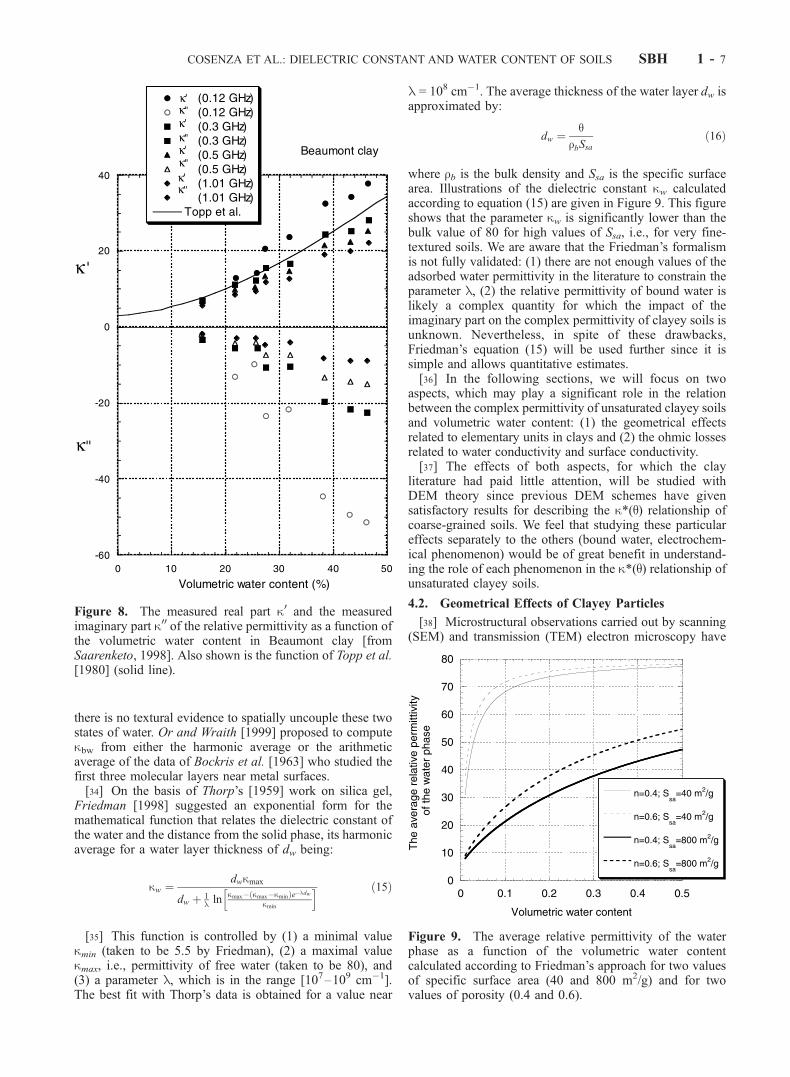
frequency range 100 MHz-1 GHz. Both features, the highimaginary part of k* and the dispersion phenomenon, areillustrated in Figures 7 and 8, from Saarenketo’s data.[33] Moreover, the clayey soils show a high content of
bound water due to their high specific surface area and thusthe dielectric properties of such water kbw may have aninfluence on the dielectric properties of the soil itself.Indeed, experimental evidence and theoretical argumentshave shown that dielectric permittivity of bound waterassociated with two to three molecular layers of water isbetween that of ice (about 3.2) and of free water (about 80 at20C) [Dobson et al., 1985; Dirksen and Dasberg, 1993;Friedman, 1998; Or and Wraith, 1999]. The effect of boundwater on the soil dielectric properties has been modeled indifferent ways. On the basis of the theoretical works of DeLoor [1968], Dobson et al. [1985] have treated the boundwater as a separate phase: in their mixing model, the freeand bound water are randomly and independently dispersedin a four phases mixture and thus without any spatialcorrelation. This is a major limitation of such model since
Figure 7. The measured real part k0 and the measuredimaginary part k00 of the relative permittivity as a function ofthe volumetric water content in Houston Black clay [fromSaarenketo, 1998). Also shown is the function of Topp et al.[1980] (solid line).
Figure 6. The effective relative permittivity as a functionof volumetric water content for two porosities (n = 0.4 andn = 0.6), calculated by a 3PHP scheme (dashed lines). Alsoshown is the function of Topp et al. [1980] (solid line).
SBH 1 - 6 COSENZA ET AL.: DIELECTRIC CONSTANT AND WATER CONTENT OF SOILS
there is no textural evidence to spatially uncouple these twostates of water. Or and Wraith [1999] proposed to computekbw from either the harmonic average or the arithmeticaverage of the data of Bockris et al. [1963] who studied thefirst three molecular layers near metal surfaces.[34] On the basis of Thorp’s [1959] work on silica gel,
Friedman [1998] suggested an exponential form for themathematical function that relates the dielectric constant ofthe water and the distance from the solid phase, its harmonicaverage for a water layer thickness of dw being:
kw ¼ dwkmax
dw þ 1l ln
kmax�ðkmax�kminÞe�ldw
kmin
h i ð15Þ
[35] This function is controlled by (1) a minimal valuekmin (taken to be 5.5 by Friedman), (2) a maximal valuekmax, i.e., permittivity of free water (taken to be 80), and(3) a parameter l, which is in the range [107–109 cm�1].The best fit with Thorp’s data is obtained for a value near
l = 108 cm�1. The average thickness of the water layer dw isapproximated by:
dw ¼ qrbSsa
ð16Þ
where rb is the bulk density and Ssa is the specific surfacearea. Illustrations of the dielectric constant kw calculatedaccording to equation (15) are given in Figure 9. This figureshows that the parameter kw is significantly lower than thebulk value of 80 for high values of Ssa, i.e., for very fine-textured soils. We are aware that the Friedman’s formalismis not fully validated: (1) there are not enough values of theadsorbed water permittivity in the literature to constrain theparameter l, (2) the relative permittivity of bound water islikely a complex quantity for which the impact of theimaginary part on the complex permittivity of clayey soils isunknown. Nevertheless, in spite of these drawbacks,Friedman’s equation (15) will be used further since it issimple and allows quantitative estimates.[36] In the following sections, we will focus on two
aspects, which may play a significant role in the relationbetween the complex permittivity of unsaturated clayey soilsand volumetric water content: (1) the geometrical effectsrelated to elementary units in clays and (2) the ohmic lossesrelated to water conductivity and surface conductivity.[37] The effects of both aspects, for which the clay
literature had paid little attention, will be studied withDEM theory since previous DEM schemes have givensatisfactory results for describing the k*(q) relationship ofcoarse-grained soils. We feel that studying these particulareffects separately to the others (bound water, electrochem-ical phenomenon) would be of great benefit in understand-ing the role of each phenomenon in the k*(q) relationship ofunsaturated clayey soils.
4.2. Geometrical Effects of Clayey Particles
[38] Microstructural observations carried out by scanning(SEM) and transmission (TEM) electron microscopy have
Figure 9. The average relative permittivity of the waterphase as a function of the volumetric water contentcalculated according to Friedman’s approach for two valuesof specific surface area (40 and 800 m2/g) and for twovalues of porosity (0.4 and 0.6).
Figure 8. The measured real part k0 and the measuredimaginary part k00 of the relative permittivity as a function ofthe volumetric water content in Beaumont clay [fromSaarenketo, 1998]. Also shown is the function of Topp et al.[1980] (solid line).
COSENZA ET AL.: DIELECTRIC CONSTANT AND WATER CONTENT OF SOILS SBH 1 - 7
shown that, the texture of clays is defined by basic units,which are dependent on the clay mineralogy. Consideringtwo extreme cases, the kaolinite clays and the smectiteclays, the basic units are for kaolinites, single crystals or forsmectites, an assemblage of elementary silicate sheets(layers) referred to as quasi-crystals or tactoids [e.g., Tessier,1991].[39] For smectites at low salt concentration, a significant
part of water is located between layers inside tactoids,i.e., in intradomain pores (Figure 10). Within tactoids orquasi-crystals, the corresponding interlayer spacing is either18.6 angstroms for Ca-smectites, or 35 to 100 angstroms forNa-smectites [Tessier, 1991]. Under similar conditions,kaolinite systems are based on elementary crystallites oraggregates of these crystallites. The pores inside aggregatesdefine also a microporosity.[40] Since this intradomain water in microporosity gov-
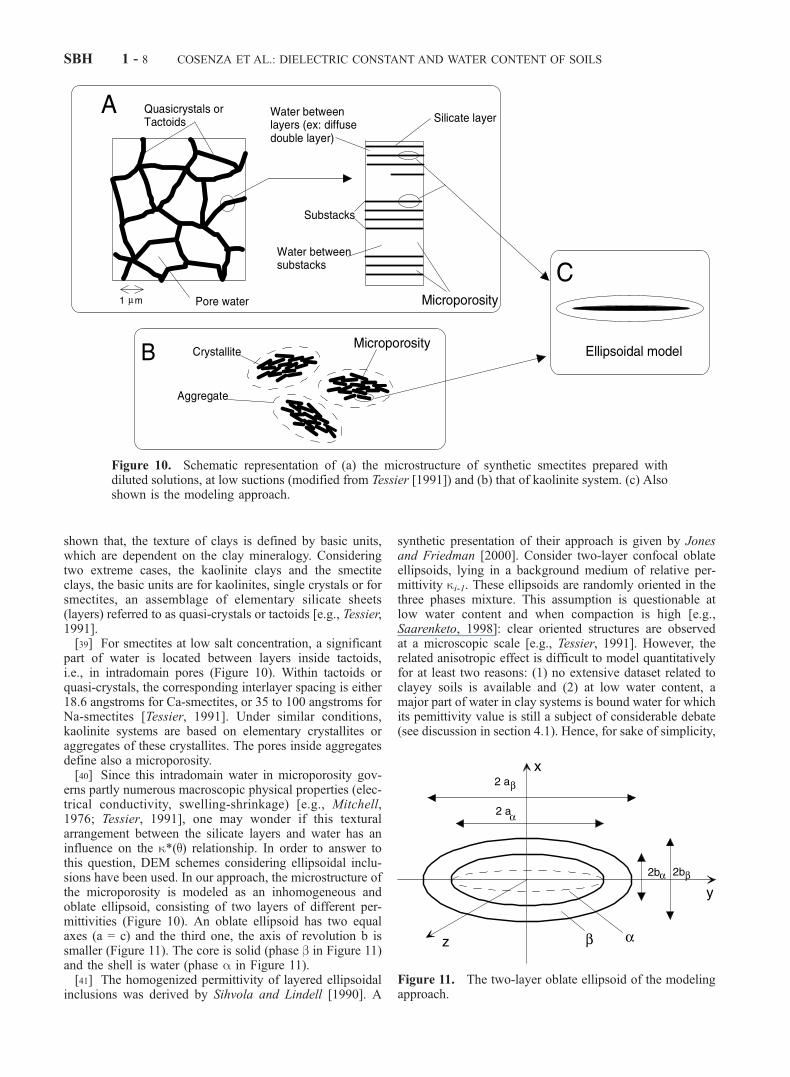
erns partly numerous macroscopic physical properties (elec-trical conductivity, swelling-shrinkage) [e.g., Mitchell,1976; Tessier, 1991], one may wonder if this texturalarrangement between the silicate layers and water has aninfluence on the k*(q) relationship. In order to answer tothis question, DEM schemes considering ellipsoidal inclu-sions have been used. In our approach, the microstructure ofthe microporosity is modeled as an inhomogeneous andoblate ellipsoid, consisting of two layers of different per-mittivities (Figure 10). An oblate ellipsoid has two equalaxes (a = c) and the third one, the axis of revolution b issmaller (Figure 11). The core is solid (phase b in Figure 11)and the shell is water (phase a in Figure 11).[41] The homogenized permittivity of layered ellipsoidal
inclusions was derived by Sihvola and Lindell [1990]. A
synthetic presentation of their approach is given by Jonesand Friedman [2000]. Consider two-layer confocal oblateellipsoids, lying in a background medium of relative per-mittivity ki-1. These ellipsoids are randomly oriented in thethree phases mixture. This assumption is questionable atlow water content and when compaction is high [e.g.,Saarenketo, 1998]: clear oriented structures are observedat a microscopic scale [e.g., Tessier, 1991]. However, therelated anisotropic effect is difficult to model quantitativelyfor at least two reasons: (1) no extensive dataset related toclayey soils is available and (2) at low water content, amajor part of water in clay systems is bound water for whichits pemittivity value is still a subject of considerable debate(see discussion in section 4.1). Hence, for sake of simplicity,
Figure 10. Schematic representation of (a) the microstructure of synthetic smectites prepared withdiluted solutions, at low suctions (modified from Tessier [1991]) and (b) that of kaolinite system. (c) Alsoshown is the modeling approach.
Figure 11. The two-layer oblate ellipsoid of the modelingapproach.
SBH 1 - 8 COSENZA ET AL.: DIELECTRIC CONSTANT AND WATER CONTENT OF SOILS
the anisotropic effect related to clayey soils will not be takeninto account.[42] Consequently, if no preferred direction is considered,
the scalar homogenized permittivity, referred as ki, is[Sihvola and Lindell, 1990]:
ki ¼ ki�1 þ
13
Pi¼x;y;z
f aip
� �
1� 13
Pi¼x;y;z
N i1
f aip
ki�1
� � ð17Þ
where the polarizability components in parentheses aregiven by:
f aip
ki�1
¼ ðja þ jbÞ�h
ðka � ki�1Þ½ka þ Nibðkb � kaÞ�
þjb
ja þ jbðkb � kaÞ ka þ Ni
aðki�1 � kaÞ� �i
=hki�1 þ Ni
aðka � ki�1Þ� �
½ka þ Nibðkb � kaÞ�
þ jbjaþjb
Niað1� Ni
aÞðka � ki�1Þðkb � kaÞi�
ð18Þ
where f is the number of ellipsoidal inclusions per unitvolume,aP
i is the polarizability for ellipsoids in the i-direction(i = x, y, z), ka and kb are the complex relative permittivity ofphases a and b, respectively, ja and jb are the volumetricfractions of phases a and b, respectively, Na
i and Nbi are the
depolarization factors of the outer and inner ellipsoids,respectively. In case of an oblate ellipsoid, given the axialratio b/a, the depolarization factors are [Sihvola and Lindell,1990]:
Nxj ¼ 1� e2
e3ðe� tan�1 eÞð j ¼ a; bÞ ð19Þ
Nyj ¼ Nz
j ¼1� Nx
j
2ð j ¼ a; bÞ ð20Þ
e ¼ffiffiffiffiffiffiffiffiffiffiffiffiffia2
b2� 1
rð21Þ
In the extreme case, that wewill consider further, aj bj (thindiscs) and therefore Nj
x � 1 and Njy = Nj
z � 0 ( j = a,b).Following the latter assumption aj bj, equation (17) can berewritten as:
dk ¼ ðja þ jbÞki ðka�kiÞkbþ
jbjaþjb
ðkb�kaÞkih i
3kakb�ðjaþjbÞ ðka�kiÞkbþjb
jaþjbðkb�kaÞki
h i8<:
þ2kakb ðka�kiÞþ
jbjaþjb
ðkb�kaÞh i
3kakb�ðjaþjbÞ ðka�kiÞkbþjb
jaþjbðkb�kaÞki
h i9=; ð22Þ
where
dk ¼ ki � ki�1 ð23Þ
[43] Considering the construction process in the DEMtheory, the parameter dk is seen as the increment of relativepermittivity of the mixture due to the ith addition of a smallvolume associated to the two-layer ellipsoidal inclusion.Hence equation (22) is equivalent to equation (4) in theconstruction process with spherical inclusions. In the DEM
schemes that we performed, three additional assumptionswere used.[44] 1. In the construction process, at the first stage
(stage 0), when there is no ellipsoidal inclusion: the effec-tive permittivity is equal to that of air (k*i=1 = k0 = 1). Waterand solid included in a two-layer ellipsoidal inclusion isadded during the next stages with the following condition:
dVw
dVs
¼ V i!1w
V i!1s
¼ C0 ð24Þ
with
C0 ¼ q1� n
ð25Þ
Hence, at each stage i of the construction process, the ratiodVw/dVs is kept constant and the current volumetricfractions ja and jb are calculated by combining equations(5a), (5b), (24), and (25).[45] 2. The dielectric constant ofwater obeys to Friedman’s
equation (i.e., equation 15) with l = 108 cm�1 and kmin = 5.5.The dielectric constant of the solid is equal to 4.3.[46] 3. The imaginary parts of water and solid are equal to
zero.[47] Considering different specific surface areas (Ssa =
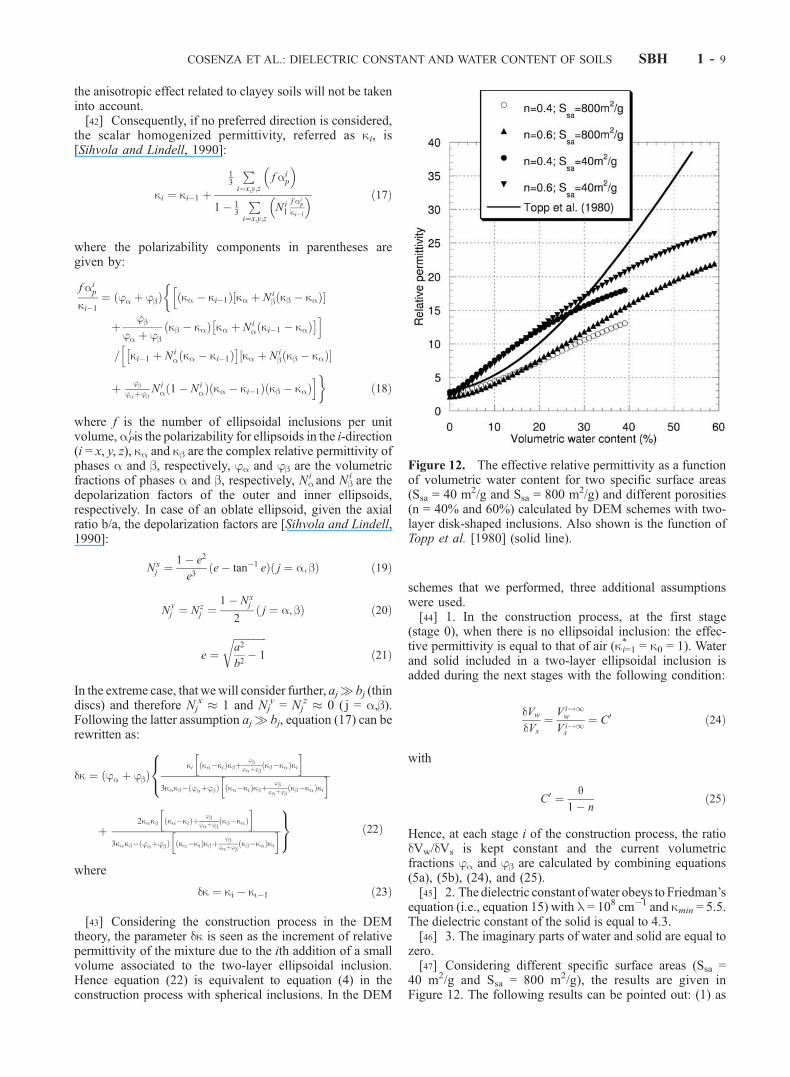
40 m2/g and Ssa = 800 m2/g), the results are given inFigure 12. The following results can be pointed out: (1) as
Figure 12. The effective relative permittivity as a functionof volumetric water content for two specific surface areas(Ssa = 40 m2/g and Ssa = 800 m2/g) and different porosities(n = 40% and 60%) calculated by DEM schemes with two-layer disk-shaped inclusions. Also shown is the function ofTopp et al. [1980] (solid line).
COSENZA ET AL.: DIELECTRIC CONSTANT AND WATER CONTENT OF SOILS SBH 1 - 9
expected, the specific surface area and hence the boundwater content have a significant influence on the k*(q)relationship, (2) there is a poor agreement between thesetheoretical results and the Saarenketo’s data given in Figures 7and 8. Nevertheless, considering the latter, it should beemphasized that it is difficult to compare both sets of resultsfor at least two reasons.[48] Firstly, at high water content, a major part of water
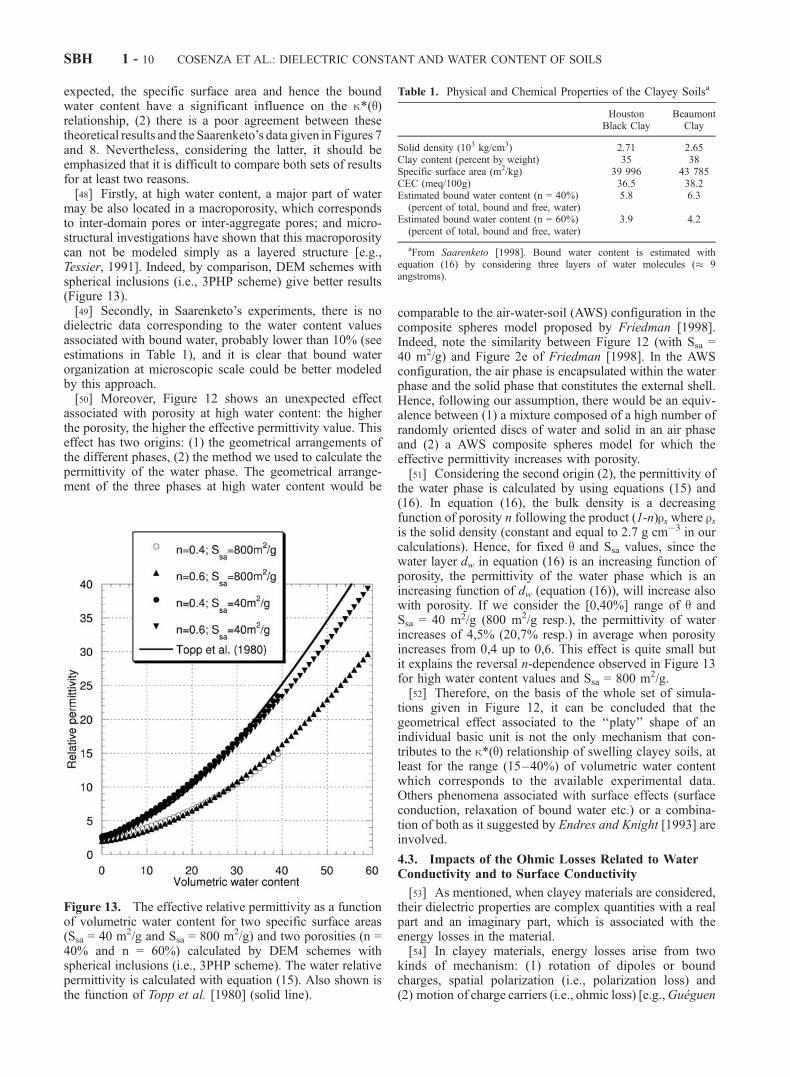
may be also located in a macroporosity, which correspondsto inter-domain pores or inter-aggregate pores; and micro-structural investigations have shown that this macroporositycan not be modeled simply as a layered structure [e.g.,Tessier, 1991]. Indeed, by comparison, DEM schemes withspherical inclusions (i.e., 3PHP scheme) give better results(Figure 13).[49] Secondly, in Saarenketo’s experiments, there is no
dielectric data corresponding to the water content valuesassociated with bound water, probably lower than 10% (seeestimations in Table 1), and it is clear that bound waterorganization at microscopic scale could be better modeledby this approach.[50] Moreover, Figure 12 shows an unexpected effect
associated with porosity at high water content: the higherthe porosity, the higher the effective permittivity value. Thiseffect has two origins: (1) the geometrical arrangements ofthe different phases, (2) the method we used to calculate thepermittivity of the water phase. The geometrical arrange-ment of the three phases at high water content would be
comparable to the air-water-soil (AWS) configuration in thecomposite spheres model proposed by Friedman [1998].Indeed, note the similarity between Figure 12 (with Ssa =40 m2/g) and Figure 2e of Friedman [1998]. In the AWSconfiguration, the air phase is encapsulated within the waterphase and the solid phase that constitutes the external shell.Hence, following our assumption, there would be an equiv-alence between (1) a mixture composed of a high number ofrandomly oriented discs of water and solid in an air phaseand (2) a AWS composite spheres model for which theeffective permittivity increases with porosity.[51] Considering the second origin (2), the permittivity of
the water phase is calculated by using equations (15) and(16). In equation (16), the bulk density is a decreasingfunction of porosity n following the product (1-n)rs where rsis the solid density (constant and equal to 2.7 g cm�3 in ourcalculations). Hence, for fixed q and Ssa values, since thewater layer dw in equation (16) is an increasing function ofporosity, the permittivity of the water phase which is anincreasing function of dw (equation (16)), will increase alsowith porosity. If we consider the [0,40%] range of q andSsa = 40 m2/g (800 m2/g resp.), the permittivity of waterincreases of 4,5% (20,7% resp.) in average when porosityincreases from 0,4 up to 0,6. This effect is quite small butit explains the reversal n-dependence observed in Figure 13for high water content values and Ssa = 800 m2/g.[52] Therefore, on the basis of the whole set of simula-
tions given in Figure 12, it can be concluded that thegeometrical effect associated to the ‘‘platy’’ shape of anindividual basic unit is not the only mechanism that con-tributes to the k*(q) relationship of swelling clayey soils, atleast for the range (15–40%) of volumetric water contentwhich corresponds to the available experimental data.Others phenomena associated with surface effects (surfaceconduction, relaxation of bound water etc.) or a combina-tion of both as it suggested by Endres and Knight [1993] areinvolved.
4.3. Impacts of the Ohmic Losses Related to WaterConductivity and to Surface Conductivity
[53] As mentioned, when clayey materials are considered,their dielectric properties are complex quantities with a realpart and an imaginary part, which is associated with theenergy losses in the material.[54] In clayey materials, energy losses arise from two
kinds of mechanism: (1) rotation of dipoles or boundcharges, spatial polarization (i.e., polarization loss) and(2) motion of charge carriers (i.e., ohmic loss) [e.g.,Gueguen
Table 1. Physical and Chemical Properties of the Clayey Soilsa
HoustonBlack Clay
BeaumontClay
Solid density (103 kg/cm3) 2.71 2.65Clay content (percent by weight) 35 38Specific surface area (m2/kg) 39 996 43 785CEC (meq/100g) 36.5 38.2Estimated bound water content (n = 40%)
(percent of total, bound and free, water)5.8 6.3
Estimated bound water content (n = 60%)(percent of total, bound and free, water)
3.9 4.2
aFrom Saarenketo [1998]. Bound water content is estimated withequation (16) by considering three layers of water molecules (� 9angstroms).
Figure 13. The effective relative permittivity as a functionof volumetric water content for two specific surface areas(Ssa = 40 m2/g and Ssa = 800 m2/g) and two porosities (n =40% and n = 60%) calculated by DEM schemes withspherical inclusions (i.e., 3PHP scheme). The water relativepermittivity is calculated with equation (15). Also shown isthe function of Topp et al. [1980] (solid line).
SBH 1 - 10 COSENZA ET AL.: DIELECTRIC CONSTANT AND WATER CONTENT OF SOILS
and Palciauskas, 1994]. The latter occurs through the inter-stitial water, which contains dissolved electrolytes and via theexchangeable cations that reside near the surface of chargedparticles. The conductivity induced by the exchangeablecations defined the so-called surface conductivity, whichplays an important role in clayey soils at low salinities.[55] Regarding the effective medium theory, the water
electrical conductivity and the surface conductivity lead tointroduce complex quantities for the components in themixture. Since it is known that the imaginary parts of eachcomponents in the mixture may influence significantly thecomplex effective permittivity [e.g., Sihvola, 2002], onemay wonder if the surface conductivity and the waterelectrical conductivity have a significant effect on thecomplex k*(q) relationship of clayey soils.[56] In order to answer to this question, a sensitivity
analysis based on DEM schemes has been performed withthe following assumptions. (1) DEM schemes with spheri-cal inclusions (i.e., 3PHP scheme) have been used sincethey have given better results than those with ellipsoidalinclusions in the previous section. (2) The real part ofwater permittivity obeys to Friedman’s equation (i.e.,equation 15) with l = 108 cm�1. In order to comparethe results to the Saarenketo’s data, the specific surface Ssais equal to 40 m2/g and n = 0.5. (3) The imaginary parts ofwater and solid are not equal to zero and correspond totheir ohmic losses, which are defined by the followingrelationship:
k00
a ¼ � sawe0
ð26Þ
with w is the pulsation, e0 is the free space permittivity andis equal to 8.85 10�12 F/m, sa is the dc conductivity ofphase a. The subscripts s and w are used for solid andwater, respectively. Considering the theoretical works ofO’Konski [1960], Bussian [1983] and Revil et al. [1998], theconductivity ss is seen as the surface conductivity. Since thepurpose of this sensitivity analysis was to study the impactof the ohmic losses of the different constituents, polarizationlosses are not taken into account in equation (26). More-over, in order to maximize the effect of ohmic losses and tocompare the simulations to Saarenketo’s data, the lowerfrequency (i.e., f = 0.12 GHz) has been chosen in thecalculations. This frequency value is also interesting since itcorresponds approximately to a mean value of the frequencyrange [10 MHz, 1 GHz] used in TDR methodology.[57] To study the relative contribution of sw and ss to the
k*(q) relationship, two extreme cases were introduced. Inthe first case, case a, the surface conductivity ss is kept to 0and the water conductivity is taken in the range [0.1, 6 S/m].This range is similar to that chosen by Rhoades et al. [1976]who have studied the effect of water conductivity on bulksoil electrical conductivity. This range corresponds to typ-ical values associated with pore water salinity in soils.Obviously, all the results related to case a will not be onlyrelevant to clayey soils but can be generalized to lowspecific surface soils.[58] In the second case, case b, the water conductivity sw is
equal to 0 and the surface conductivity ss is taken in therange [10�2, 0.2 S/m], which corresponds to a set of valuesobtained by Bussian [1983] in his modeling approach.
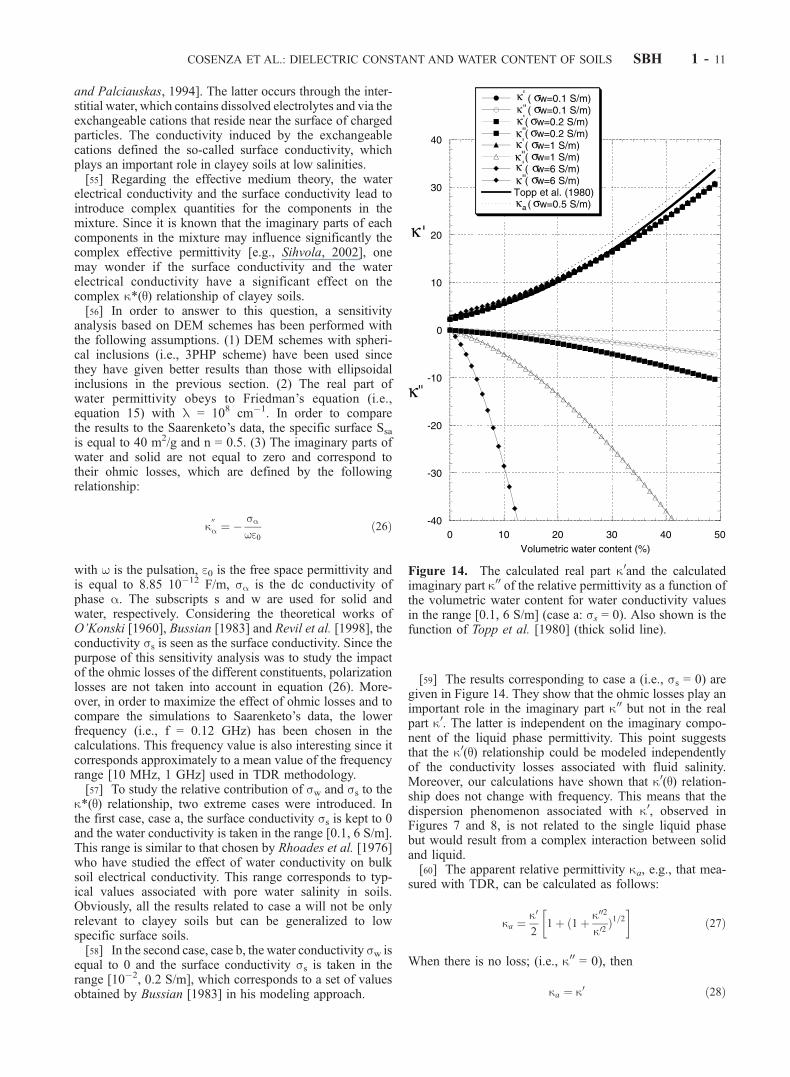
[59] The results corresponding to case a (i.e., ss = 0) aregiven in Figure 14. They show that the ohmic losses play animportant role in the imaginary part k00 but not in the realpart k0. The latter is independent on the imaginary compo-nent of the liquid phase permittivity. This point suggeststhat the k0(q) relationship could be modeled independentlyof the conductivity losses associated with fluid salinity.Moreover, our calculations have shown that k0(q) relation-ship does not change with frequency. This means that thedispersion phenomenon associated with k0, observed inFigures 7 and 8, is not related to the single liquid phasebut would result from a complex interaction between solidand liquid.[60] The apparent relative permittivity ka, e.g., that mea-
sured with TDR, can be calculated as follows:
ka ¼k0
21þ ð1þ k002
k02Þ1=2
� �ð27Þ
When there is no loss; (i.e., k00 = 0), then
ka ¼ k0 ð28Þ
Figure 14. The calculated real part k0and the calculatedimaginary part k00 of the relative permittivity as a function ofthe volumetric water content for water conductivity valuesin the range [0.1, 6 S/m] (case a: ss = 0). Also shown is thefunction of Topp et al. [1980] (thick solid line).
COSENZA ET AL.: DIELECTRIC CONSTANT AND WATER CONTENT OF SOILS SBH 1 - 11
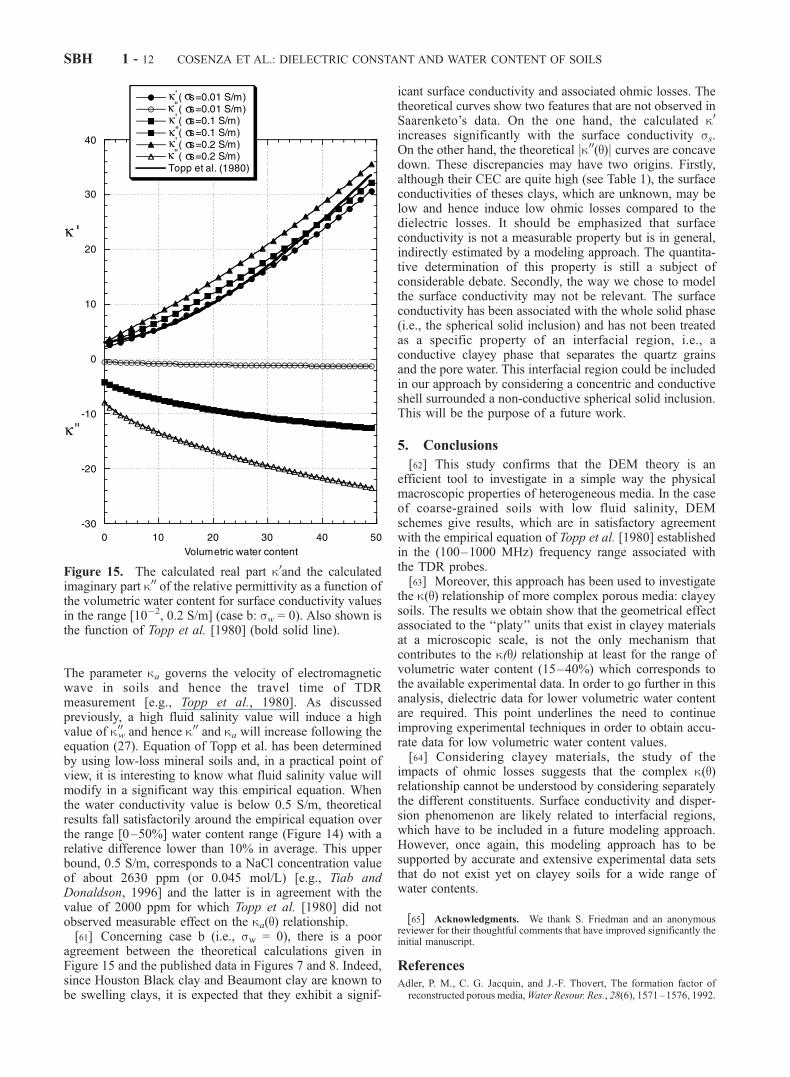
The parameter ka governs the velocity of electromagneticwave in soils and hence the travel time of TDRmeasurement [e.g., Topp et al., 1980]. As discussedpreviously, a high fluid salinity value will induce a highvalue of k00w and hence k00 and ka will increase following theequation (27). Equation of Topp et al. has been determinedby using low-loss mineral soils and, in a practical point ofview, it is interesting to know what fluid salinity value willmodify in a significant way this empirical equation. Whenthe water conductivity value is below 0.5 S/m, theoreticalresults fall satisfactorily around the empirical equation overthe range [0–50%] water content range (Figure 14) with arelative difference lower than 10% in average. This upperbound, 0.5 S/m, corresponds to a NaCl concentration valueof about 2630 ppm (or 0.045 mol/L) [e.g., Tiab andDonaldson, 1996] and the latter is in agreement with thevalue of 2000 ppm for which Topp et al. [1980] did notobserved measurable effect on the ka(q) relationship.[61] Concerning case b (i.e., sw = 0), there is a poor
agreement between the theoretical calculations given inFigure 15 and the published data in Figures 7 and 8. Indeed,since Houston Black clay and Beaumont clay are known tobe swelling clays, it is expected that they exhibit a signif-
icant surface conductivity and associated ohmic losses. Thetheoretical curves show two features that are not observed inSaarenketo’s data. On the one hand, the calculated k0
increases significantly with the surface conductivity ss.On the other hand, the theoretical jk00(q)j curves are concavedown. These discrepancies may have two origins. Firstly,although their CEC are quite high (see Table 1), the surfaceconductivities of theses clays, which are unknown, may below and hence induce low ohmic losses compared to thedielectric losses. It should be emphasized that surfaceconductivity is not a measurable property but is in general,indirectly estimated by a modeling approach. The quantita-tive determination of this property is still a subject ofconsiderable debate. Secondly, the way we chose to modelthe surface conductivity may not be relevant. The surfaceconductivity has been associated with the whole solid phase(i.e., the spherical solid inclusion) and has not been treatedas a specific property of an interfacial region, i.e., aconductive clayey phase that separates the quartz grainsand the pore water. This interfacial region could be includedin our approach by considering a concentric and conductiveshell surrounded a non-conductive spherical solid inclusion.This will be the purpose of a future work.
5. Conclusions
[62] This study confirms that the DEM theory is anefficient tool to investigate in a simple way the physicalmacroscopic properties of heterogeneous media. In the caseof coarse-grained soils with low fluid salinity, DEMschemes give results, which are in satisfactory agreementwith the empirical equation of Topp et al. [1980] establishedin the (100–1000 MHz) frequency range associated withthe TDR probes.[63] Moreover, this approach has been used to investigate
the k(q) relationship of more complex porous media: clayeysoils. The results we obtain show that the geometrical effectassociated to the ‘‘platy’’ units that exist in clayey materialsat a microscopic scale, is not the only mechanism thatcontributes to the k(q) relationship at least for the range ofvolumetric water content (15–40%) which corresponds tothe available experimental data. In order to go further in thisanalysis, dielectric data for lower volumetric water contentare required. This point underlines the need to continueimproving experimental techniques in order to obtain accu-rate data for low volumetric water content values.[64] Considering clayey materials, the study of the
impacts of ohmic losses suggests that the complex k(q)relationship cannot be understood by considering separatelythe different constituents. Surface conductivity and disper-sion phenomenon are likely related to interfacial regions,which have to be included in a future modeling approach.However, once again, this modeling approach has to besupported by accurate and extensive experimental data setsthat do not exist yet on clayey soils for a wide range ofwater contents.
[65] Acknowledgments. We thank S. Friedman and an anonymousreviewer for their thoughtful comments that have improved significantly theinitial manuscript.
ReferencesAdler, P. M., C. G. Jacquin, and J.-F. Thovert, The formation factor ofreconstructed porous media,Water Resour. Res., 28(6), 1571–1576, 1992.
Figure 15. The calculated real part k0and the calculatedimaginary part k00 of the relative permittivity as a function ofthe volumetric water content for surface conductivity valuesin the range [10�2, 0.2 S/m] (case b: sw = 0). Also shown isthe function of Topp et al. [1980] (bold solid line).
SBH 1 - 12 COSENZA ET AL.: DIELECTRIC CONSTANT AND WATER CONTENT OF SOILS

Alharthi, A., and J. Lange, Soil water saturation: Dielectric determination,Water Resour. Res., 23(4), 591–595, 1987.
Ansoult, M., L. W. De Backer, and M. Declercq, Statistical relationshipbetween apparent dielectric constant and water content in porous media,Soil Sci. Soc. Am. J., 48, 47–50, 1984.
Berryman, J. G., S. R. Pride, and H. F. Wang, A differential scheme forelastic properties of rocks with dry and saturated cracks, Geophys. J. Int.,151, 597–611, 2002.
Birchak, J. R., C. G. Gardner, J. E. Hipp, and J. M. Victor, High dielectricconstant microwave probes for sensing soil moisture, Proc. IEEE, 62,93–98, 1974.
Bockris, J. O., M. A. V. Devanathan, and K. Muller, On the structure ofcharged interfaces, Proc. R. Soc. London, Ser. A, 274, 55–79, 1963.
Bruggeman,D.A.G.,BerechnungVerschiedernerPhysikalischerKonstantenvon Hetarogenen Substanzen, Ann. Phys., 24, 636–679, 1935.
Bussian, A. E., Electrical conductance in a porous medium, Geophysics,48(9), 1258–1268, 1983.
Campbell, J., Dielectric properties and influence of conductivity in soils at 1to 50 MHz, Soil Sci. Soc. Am. J., 54, 332–341, 1990.
Chanzy, A., A. Tarussov, A. Judge, and F. Bonn, Soil water content deter-mination using a digital ground-penetrating radar, Soil Sci. Soc. Am. J.,60, 1318–1326, 1996.
Chelidze, T. L., and Y. Gueguen, Electrical spectroscopy of porous rocks -I. A review: Theoretical models, Geophys. J. Int., 137, 1–15, 1999.
Curtis, J., Moisture effects on the dielectric properties of soils, IEEE Trans.Geosci. Remote Sens., 39(1), 125–128, 2001.
Davies, J. L., G. C. Topp, and A. P. Annan, Measuring soil water content insitu using time domain reflectometry technique, Pap. Geol. Surv. Can.,77-IB, 33–36, 1977.
De Loor, G. P., Dielectric properties of heterogeneous mixtures containingwater, J. Microwave Power, 3–2, 67–73, 1968.
De Loor, G. P., The dielectric properties of wet materials, IEEE Trans.Geosci. Remote Sens., GE-21, 364–369, 1983.
Dirksen, C., and S. Dasberg, Improved calibration of time domain reflec-tometry soil water content measurements, Soil Sci. Soc. Am. J., 57, 660–667, 1993.
Dobson, M., F. Ulaby, M. Hallikainen, and M. El-Rayes, Microwavedielectric behavior of wet soil - part II: Dielectric mixing models, IEEETrans. Geosci. Remote Sens., GE-23(1), 35–46, 1985.
Endres, A. L., and R. J. Knight, A model for incorporating surface phe-nomena into dielectric response of a heterogeneous medium, J. ColloidInterface Sci., 157, 418–425, 1993.
Feng, S., and P. N. Sen, Geometrical model of conductive and dielectricproperties of partially saturated rocks, J. Appl. Phys., 58(8), 3236–3243,1985.
Friedman, S. P., Statistical mixing model for the apparent dielectric constantof unsaturated porous media, Soil Sci. Soc. Am. J., 61, 742–745, 1997.
Friedman, S. P., A saturation degree-dependent composite spheres modelfor describing the effective dielectric constant of unsaturated porousmedia, Water Resour. Res., 34(11), 2949–2961, 1998.
Gueguen, Y., and V. Palciauskas, Introduction to the Physics of Rocks,Princeton Univ. Press, Princeton, N. J., 1994.
Hallikainen, M., F. Ulab, M. Dobson, M. El-Rayes, and L. K. Wu, Micro-wave dielectric behavior of wet soil - part I: Empirical models andexperimental observations, IEEE Trans. Geosci. Remote Sens., GE-23(1), 25–34, 1985.
Hipp, J., Soil electromagnetic parameters as functions of frequency, soildensity and soil moisture, Proc. IEEE, 62, 98–103, 1974.
Hoesktra, P., and A. Delaney, Dielectric properties of soils at UHF andmicrowave frequencies, J. Geophys. Res., 79(11), 1699–1708, 1974.
Jacobsen, O. H., and P. Schjonning, A laboratory calibration of time domainreflectometry for soil water measurement including effects of bulk den-sity and texture, J. Hydrol., 151, 147–157, 1993.
Jones, S. B., and S. P. Friedman, Particle shape effects on the effectivepermittivity of anisotropic or isotropic media consisting of aligned orrandomly oriented ellipsoidal particles, Water Resour. Res., 36(10),2821–2833, 2000.
Le Ravalec, M., Vitesse et permeabilite des roches, modelisation du role desfluides et des fissures, Ph.D. dissertation, 276 pp., Univ. of Rennes I,Rennes, France, 1995.
Le Ravalec, M., and Y. Gueguen, High- and low-frequency elastic modulifor saturated porous/cracked rock-differential self-consistent and poroe-lastic theories, Geophysics, 61(4), 1080–1094, 1996.
Maxwell-Garnett, J. C., Colours in metal glasses and in metal films, Philos.Trans. R. Soc. London, Ser. B, 203, 385–420, 1904.
Mitchell, J. K., Fundamentals of Soils Behavior, John Wiley, New York,1976.
Norris, A. N., A differential scheme for the effective moduli of composites,Mech. Mater., 4, 1–16, 1985.
O’Konski, C. T., Electric properties of macromolecules. V. Theory of ionicpolarization in polyelectrolytes, J. Chem. Phys., 64, 605–619, 1960.
Or, D., and J. M. Wraith, Temperature effects on soil bulk dielectric per-mittivity measured by time domain reflectometry, Water Resour. Res.,35(2), 371–383, 1999.
Press, W. H., S. A. Teukolsky, W. T. Vetterling, and B. P. Flannery, Numer-ical Recipes in FORTRAN, Cambridge Univ. Press, New York, 1992.
Revil, A., L. M. Cathles, III, S. Losh, and J. A. Nunn, Electrical conduc-tivity in shaly sands with geophysical applications, J. Geophys. Res.,103(B10), 23,925–23,936, 1998.
Rhoades, J. D., P. A. C. Raats, and R. J. Prather, Effects of liquid-phaseelectrical conductivity, water content, and surface conductivity on bulksoil electrical conductivity, Soil Sci. Soc. Am. J., 40, 651–655, 1976.
Robinson, D. A., and S. P. Friedman, Effect of particle size distribution onthe effective dielectric permittivity of saturated granular media, WaterResour. Res., 37(1), 33–40, 2001.
Ruault, P., and A. Tabbagh, Etude experimentale de la permittivite dielec-trique des sols dans la gamme 100 MHz-1 GHz en vue d’une applicationa la teledetection de l’humidite des sols, Ann. Geophys., 36(4), 477–490,1980.
Saarenketo, T., Electrical properties of water in clay and silty soils, J. Appl.Geophys., 40, 73–88, 1998.
Sen, P. N., C. Scala, and M. H. Cohen, A self-similar model for sedimentaryrocks with application to the dielectric constant of fused glass beads,Geophysics, 46(5), 781–795, 1981.
Sihvola, A., How strict are the theoretical bounds for dielectric properties ofmixtures?, IEEE Trans. Geosci. Remote Sens., 40(4), 880–886, 2002.
Sihvola, A., and V. Lindell, Polarizability and effective permittivity oflayered and continuously inhomogeneous dielectric ellipsoids, J. Electro-magn. Waves Appl., 4(1), 1–26, 1990.
Tabbagh, A., C. Camerlynck, and P. Cosenza, Numerical modeling forinvestigating the physical meaning of the relationship between relativedielectric permittivity and water content of soils, Water Resour. Res.,36(9), 2771–2776, 2000.
Tessier, D., Behaviour and microstructure of clays minerals, in Soil Colloidsand Their Associations in Aggregates, NATO Sci. Ser., Ser. B, vol. 215,edited by M. de Boodt, M. H. B. Hayes, and A. Herbillon, pp. 387–415,Plenum, New York, 1991.
Thorp, J. M., The dielectric behaviour of vapours adsorbed on poroussolids, Trans. Faraday Soc., 55, 442–454, 1959.
Tiab, D., and C. E. Donaldson, Petrophysics, Gulf, Houston, Tex., 1996.Topp, G. C., J. L. Davis, and A. P. Annan, Electromagnetic determination ofsoil water content: Measurements in coaxial transmission lines, WaterResour. Res., 16(3), 574–582, 1980.
Tran Ngoc, L., P. Chaigne, and A. Philippe, Experimentation d’unemethode capacitive pour l’evolution de l’humidite des sols, Bull. LiaisonLab. Ponts Chaussees, 60, 155–165, 1972.
Wang, J., and T. Schmugge, An empirical model for the complex dielectricpermittivity of soils as a function of water content, IEEE Trans. Geosci.Remote Sens., GE-18(4), 288–295, 1980.
Weast, R. C., (Ed.), CRC Handbook of Chemistry and Physics, 63rd ed.,CRC Press, Boca Raton, Fla., 1983.
Wensik, W. A., Dielectric properties of wet soils in the frequency range1–3000 MHz, Geophys. Prospect., 41, 671–696, 1993.
Wobschall, D., A theory of the complex dielectric permittivity of soil con-taining water: The semidisperse model, IEEE Trans. Geosci. Electron.,GE-15(1), 49–60, 1977.
Zegelin, S. J., I. White, and G. F. Russel, A critique of the time domainreflectometry technique for determining soil water content, in Advancesin Measurement of Soil Physical Properties: Bringing Theory into Prac-tice, edited by G. C. Topp, W. D. Reynolds, and R. E. Green, SSSA Spec.Publ., 30, 187–208, 1992.
����������������������������C. Camerlynck, P. Cosenza, and A. Tabbagh, UMR 7619, Sisyphe,
Universite Pierre et Marie Curie, CNRS, case 105, 4 place Jussieu, 75252Paris Cedex 5, France. ([email protected])
COSENZA ET AL.: DIELECTRIC CONSTANT AND WATER CONTENT OF SOILS SBH 1 - 13