Istorija Sombora u prvoj deceniji posle Austro-ugarske nagodbe

ORIGINAL INVESTIGATION
Kumarasamy Thangaraj Æ Vempati Sridhar
Toomas Kivisild Æ Alla G. Reddy Æ Gyaneshwer Chaubey
Vijay Kumar Singh Æ Suminder Kaur Æ Pooja Agarawal
Amit Rai Æ Jalaj Gupta Æ Chandana Basu Mallick
Niraj Kumar Æ Thrimulaisamy P. Velavan
Rajanbabu Suganthan Æ Divi Udaykumar
Rashmi Kumar Æ Rachana Mishra
Arif Khan Æ Chitikineni Annapurna Æ Lalji Singh
Different population histories of the Mundari- and Mon-Khmer-speakingAustro-Asiatic tribes inferred from the mtDNA 9-bp deletion/insertionpolymorphism in Indian populations
Received: 18 August 2004 / Accepted: 13 January 2005 / Published online: 17 March 2005� Springer-Verlag 2005
Abstract Length variation in the human mtDNA in-tergenic region between the cytochrome oxidase II(COII) and tRNA lysine (tRNAlys) genes has been
widely studied in world populations. Specifically,Austronesian populations of the Pacific and Austro-Asiatic populations of southeast Asia most frequentlycarry the 9-bp deletion in that region implying theirshared common ancestry in haplogroup B. Further-more, multiple independent origins of the 9-bp deletionat the background of other mtDNA haplogroups hasbeen shown in populations of Africa, Europe, Austra-lia, and India. We have analyzed 3293 Indian individ-uals belonging to 58 populations, representing differentcaste, tribal, and religious groups, for the lengthvariation in the 9-bp motif. The 9-bp deletion (onecopy) and insertion (three copies) alleles were observedin 2.51% (2.15% deletion and 0.36% insertion) ofthe individuals. The maximum frequency of the dele-tion (45.8%) was observed in the Nicobarese inassociation with the haplogroup B5a D-loop motif thatis common throughout southeast Asia. The lowpolymorphism in the D-loop sequence of the Nicoba-rese B5a samples suggests their recent origin and afounder effect, probably involving migration fromsoutheast Asia. Interestingly, none of the 302 (exceptone Munda sample, which has 9-bp insertion) fromMundari-speaking Austro-Asiatic populations fromthe Indian mainland showed the length polymorphismof the 9-bp motif, pointing either to their independentorigin from the Mon-Khmeric-speaking Nicobareseor to an extensive admixture with neighboring Indo-European-speaking populations. Consistent withprevious reports, the Indo-European and Dravidicpopulations of India showed low frequency of the9-bp deletion/insertion. More than 18 independentorigins of the deletion or insertion mutation could beinferred in the phylogenetic analysis of the D-loop se-quences.
K. Thangaraj Æ V. Sridhar Æ A. G. Reddy Æ G. ChaubeyV. K. Singh Æ S. Kaur Æ L. Singh (&)Centre for Cellular and Molecular biology,Uppal Road, Hyderabad, 500 007, IndiaE-mail: [email protected].: +91-40-27160789Fax: +91-40-27160591
T. KivisildEstonian Biocenter, Riia23, Tartu, 51010, Estonia
P. Agarawal Æ T. P. Velavan Æ D. UdaykumarInstitute of Microbiology & Biotechnology,Barkatullah University, Bhopal, India
A. Rai Æ N. KumarDepartment of Biotechnology, VBS Purvanchal University,Jaunpur, India
J. Gupta Æ R. Suganthan Æ R. KumarDepartment of Biotechnology,Bundelkhand University, Jhansi, India
C. B. MallickDepartment of Biotechnology,APS University, Rewa, India
R. MishraDepartment of Biotechnology,Allahabad Agricultural University,Allahabad, India
A. KhanDepartment of Biosciences,Sardar Patel University,Vallabh Vidyanagar, India
C. AnnapurnaDepartment of Biotechnology,Kandaswamy Kandars College, P. Velur, India
Hum Genet (2005) 116: 507–517DOI 10.1007/s00439-005-1271-6

Introduction
Indian populations, consisting of approximately 4635culturally and anthropologically differentiated groups,can broadly be divided into four different linguisticfamilies, namely, Austro-Asiatic, Dravidian, Tibeto-Burman, and Indo-European. Each population, affili-ated to one of these linguistic families, has its own socialand cultural identity, and practices endogamy, whichhelps to maintain its genetic architecture. Several studieshave been carried out with maternally inherited mito-chondrial DNA (mtDNA) markers to understand thepopulation structure and genetic origins of Indian pop-ulations (Torroni et al. 1998; Watkins et al. 1999;Kivisild et al. 1999, 2002, 2003; Clark et al. 2000;Roychoudhury et al. 2001; Cordaux et al. 2003;Thangaraj et al. 2003). These studies have shown thatIndians are readily distinguishable from Europeans andeast Asians and interestingly, despite the linguistic(Austro-Asiatic languages) and cultural (the spread ofrice-based economies) links, share few lineages in com-mon with neighboring southeast Asian populations(Kumar and Reddy 2003). For example, haplogroup B,which is defined by a 9-bp deletion in the intergenic re-gion V of mtDNA, is characteristically frequent insoutheast Asia, reaching almost fixation in some Poly-nesian populations and, in contrast, is totally absent inmost populations of India examined so far.
Most humans have inherited two tandem copies ofthe 9-bp motif (CCCCCTCTA), located in the non-coding region V, between the cytochrome oxidase II(COII) and tRNA lysine (tRNAlys) genes, from themitochondrial ‘‘Eve’’. Initially, deletion of one copy of9-bp was characterized as an Asian-specific marker,since it was reported only in Asian populations and washypothesized to have originated in China (Horai et al.1987; Stoneking and Wilson 1989; Ballinger et al. 1992;Harihara et al. 1992; Yao et al. 2000) and to have spreadfrom there to America (Schurr et al. 1990; Ward et al.1991, 1993; Torroni et al. 1992) and Polynesia (Hertz-berg et al. 1989; Hagelberg and Clegg 1993; Hagelberget al. 1994; Redd et al. 1995). However, several sub-sequent studies have reported variable frequencies of the9-bp deletion in other non-Asian populations, such asAfrican Pygmies (Vigilant et al. 1991), primarily Bantu-speaking sub-Saharan Africans (Soodyall et al. 1996),and aboriginal Australians (Betty et al. 1996).
Although Majumder (2001) has indicated the absenceof the 9-bp deletion in most Indian populations (prob-ably because of the few groups studied and the smallsample size), some recent studies have found it to bepresent in some tribal and caste groups with frequenciesreaching up to 50% in some small south Indian tribalgroups (Watkins et al. 1999; Clark et al. 2000; Prasadet al. 2001; B. M. Reddy, personal communication).However, there is no comprehensive study of the 9-bppolymorphism in Indian populations of differentlinguistic and ethnic groups, distributed throughout
India. Therefore, we have carried out a phylogeographicanalysis of the 9-bp deletion/insertion polymorphism inIndian populations, covering the entire Indian subcon-tinent, including 350 samples from Austro-Asiaticpopulations, represented both by the Mundari andMon-Khmer linguistic branches. Previous studies ofIndian populations have suggested that the presence of9-bp deletion variants in India is likely through multipleindependent occurrences of the mutation (Watkins et al.1999; Clark et al. 2000). In order to gain more insightsinto the phylogenetic affiliation of the samples with 9-bplength variation, we have analyzed the first hypervari-able segment (HVS-I) of the D-loop and coding regionsingle-nucleotide polymorphism (SNPs; Rieder et al.1998; Quintana-Murci et al. 1999; Kivisild et al. 2003;Kong et al. 2003a, 2003b) to compare them againstexisting data sets for south and southeast Asia (Kivisildet al. 1999, 2003; Roychoudhury et al. 2001; Prasad et al.2001; Comas et al. 1998; Melton et al. 1998; Pfeifferet al. 1998; Seo et al. 1998; Lee et al. 1999; Nishimakiet al. 1999; Yao et al. 2000, 2002a, 2002b; Fucharoenet al. 2001; Tsai et al. 2001; Oota et al. 2002; Kong et al.2003a, 2003b).
Materials and methods
We have analyzed a total of 3293 individuals from 58endogamous populations of India (Table 1). A bloodsample (5–10 ml) was collected from each individualwith informed written consent. DNA was isolated byusing protocols described elsewhere (Thangaraj et al.2002). The non-coding intergenic region between mito-chondrial genes COII and tRNALys was amplified(Thomas et al. 1998) and size-fractionated in an 8%polyacrylamide gel. The 9-bp deletion and insertion werefurther confirmed by direct sequencing (Thangaraj et al.2003). We sequenced the first hypervariable segment(HVS-I) of the D-loop and determined informativecoding region SNPs (Rieder et al. 1998; Quintana-Murciet al. 1999; Kivisild et al. 2003; Kong et al. 2003a,2003b). Phylogenetic relationships between the observedhaplotypes were reconstructed by using the NETWORKprogram (Bandelt et al. 1999; http://www.fluxus-engi-neering.com).
Results
Of the 3293 individuals studied, the deletion or insertionof 9-bp was observed in 71 (2.15%) and 12 (0.36%)samples, respectively (Table 1). Both deletion andinsertion frequencies varied highly between populations;their distribution among populations is depicted inFig. 1. Out of 58 endogamous populations analyzed, 18populations showed the 9-bp deletion (single copy of theCCCCCTCTA motif). The maximum frequency of the9-bp deletion was observed in the Nicobarese (45.8%),an Austro-Asiatic tribe of Andaman and Nicobar Is-
508
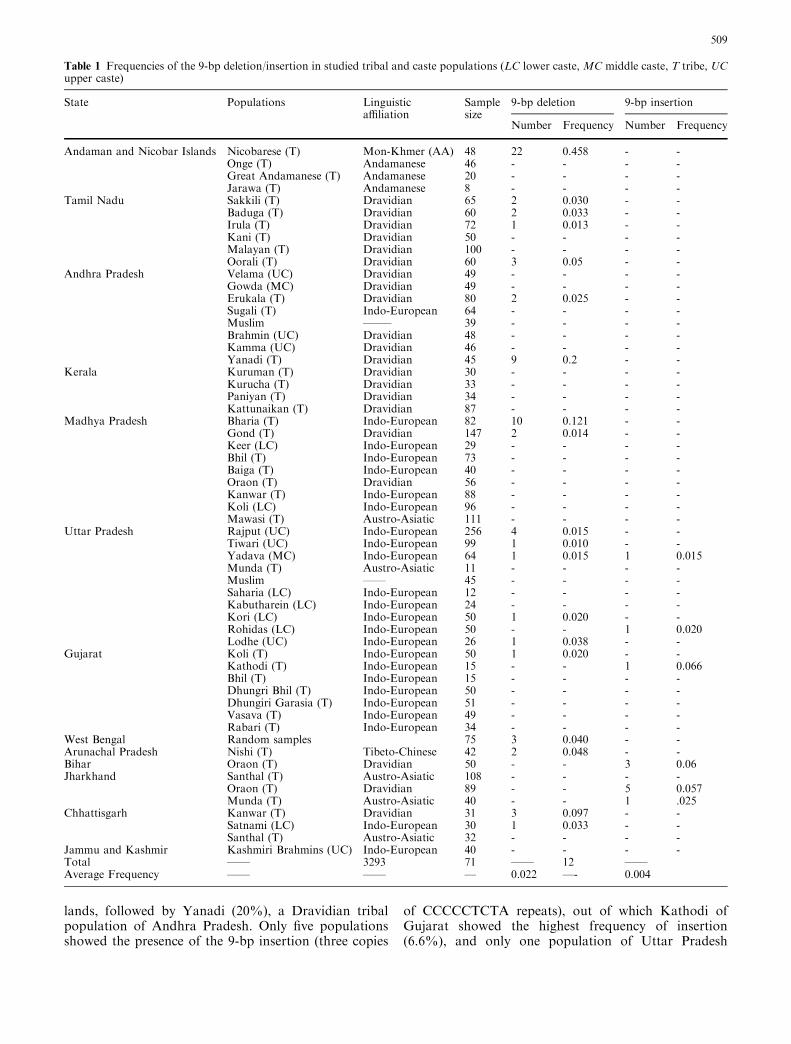
lands, followed by Yanadi (20%), a Dravidian tribalpopulation of Andhra Pradesh. Only five populationsshowed the presence of the 9-bp insertion (three copies
of CCCCCTCTA repeats), out of which Kathodi ofGujarat showed the highest frequency of insertion(6.6%), and only one population of Uttar Pradesh
Table 1 Frequencies of the 9-bp deletion/insertion in studied tribal and caste populations (LC lower caste, MC middle caste, T tribe, UCupper caste)
State Populations Linguisticaffiliation
Samplesize
9-bp deletion 9-bp insertion
Number Frequency Number Frequency
Andaman and Nicobar Islands Nicobarese (T) Mon-Khmer (AA) 48 22 0.458 - -Onge (T) Andamanese 46 - - - -Great Andamanese (T) Andamanese 20 - - - -Jarawa (T) Andamanese 8 - - - -
Tamil Nadu Sakkili (T) Dravidian 65 2 0.030 - -Baduga (T) Dravidian 60 2 0.033 - -Irula (T) Dravidian 72 1 0.013 - -Kani (T) Dravidian 50 - - - -Malayan (T) Dravidian 100 - - - -Oorali (T) Dravidian 60 3 0.05 - -
Andhra Pradesh Velama (UC) Dravidian 49 - - - -Gowda (MC) Dravidian 49 - - - -Erukala (T) Dravidian 80 2 0.025 - -Sugali (T) Indo-European 64 - - - -Muslim ——– 39 - - - -Brahmin (UC) Dravidian 48 - - - -Kamma (UC) Dravidian 46 - - - -Yanadi (T) Dravidian 45 9 0.2 - -
Kerala Kuruman (T) Dravidian 30 - - - -Kurucha (T) Dravidian 33 - - - -Paniyan (T) Dravidian 34 - - - -Kattunaikan (T) Dravidian 87 - - - -
Madhya Pradesh Bharia (T) Indo-European 82 10 0.121 - -Gond (T) Dravidian 147 2 0.014 - -Keer (LC) Indo-European 29 - - - -Bhil (T) Indo-European 73 - - - -Baiga (T) Indo-European 40 - - - -Oraon (T) Dravidian 56 - - - -Kanwar (T) Indo-European 88 - - - -Koli (LC) Indo-European 96 - - - -Mawasi (T) Austro-Asiatic 111 - - - -
Uttar Pradesh Rajput (UC) Indo-European 256 4 0.015 - -Tiwari (UC) Indo-European 99 1 0.010 - -Yadava (MC) Indo-European 64 1 0.015 1 0.015Munda (T) Austro-Asiatic 11 - - - -Muslim —— 45 - - - -Saharia (LC) Indo-European 12 - - - -Kabutharein (LC) Indo-European 24 - - - -Kori (LC) Indo-European 50 1 0.020 - -Rohidas (LC) Indo-European 50 - - 1 0.020Lodhe (UC) Indo-European 26 1 0.038 - -
Gujarat Koli (T) Indo-European 50 1 0.020 - -Kathodi (T) Indo-European 15 - - 1 0.066Bhil (T) Indo-European 15 - - - -Dhungri Bhil (T) Indo-European 50 - - - -Dhungiri Garasia (T) Indo-European 51 - - - -Vasava (T) Indo-European 49 - - - -Rabari (T) Indo-European 34 - - - -
West Bengal Random samples 75 3 0.040 - -Arunachal Pradesh Nishi (T) Tibeto-Chinese 42 2 0.048 - -Bihar Oraon (T) Dravidian 50 - - 3 0.06Jharkhand Santhal (T) Austro-Asiatic 108 - - - -
Oraon (T) Dravidian 89 - - 5 0.057Munda (T) Austro-Asiatic 40 - - 1 .025
Chhattisgarh Kanwar (T) Dravidian 31 3 0.097 - -Satnami (LC) Indo-European 30 1 0.033 - -Santhal (T) Austro-Asiatic 32 - - - -
Jammu and Kashmir Kashmiri Brahmins (UC) Indo-European 40 - - - -Total —— 3293 71 —— 12 ——Average Frequency —— —— — 0.022 —- 0.004
509

(Yadava) showed both the deletion and insertion(Table 1).
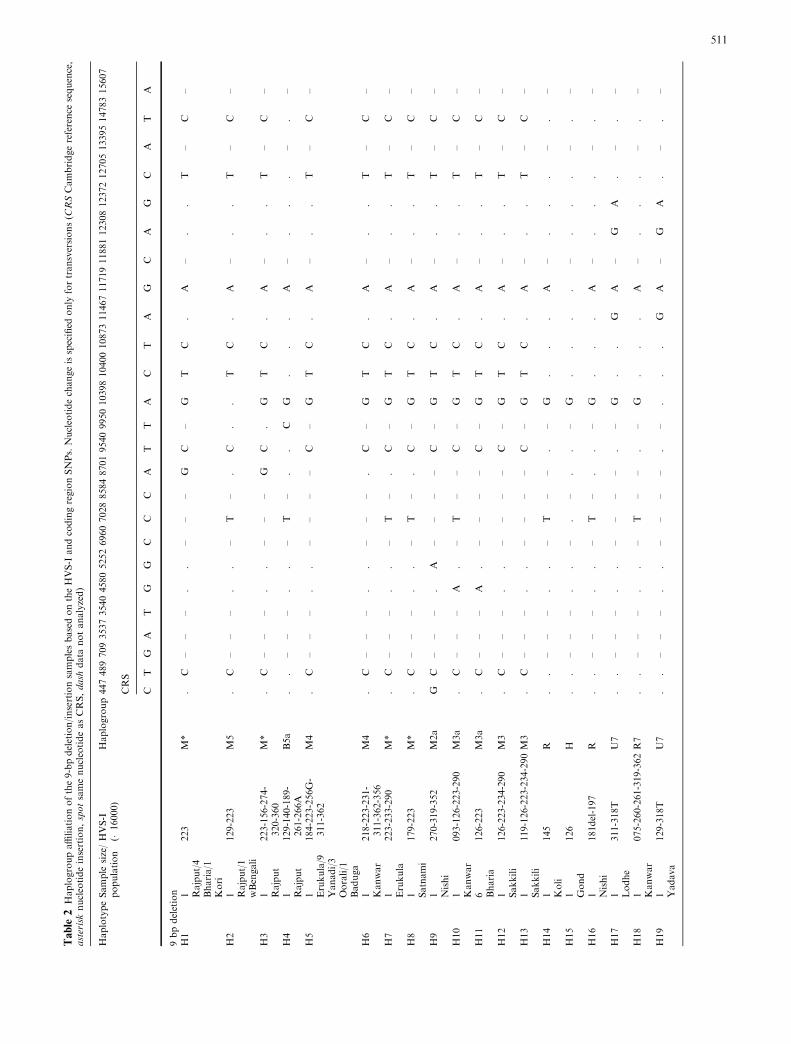
By using HVS-I sequence information, 35 differenthaplotypes were observed among the 83 samples thatshowed length variation in the COII-tRNALys region(Table 2). Of these, nine haplotypes occurred in two ormore individuals. All 22 Nicobarese samples with the 9-bp deletion, except for two that differed from the othersonly by an extra C in the C-stretch at nucleotide posi-tions 16184–16193, shared one common haplotype(H25; Table 2). HVS-I sequences exactly matching tothe type observed in the Nicobarese have also beenfound in Austro-Asiatic, Daic, Austronesian, and Ti-beto-Burman populations of southeast Asia and Ocea-
nia (Sykes et al. 1995; Redd et al. 1995; Yao et al. 2002a,2002b; Oota et al. 2001, 2002; Fucharoen et al. 2001).Interestingly, however, none of the other 302 samplestaken from five Mundari group of Austro-Asiatic pop-ulations on mainland India showed the presence of the9-bp deletion (Table 1). Partial sequencing of the codingregion of the Nicobarese samples with the 9-bp deletionrevealed their close phylogenetic relationship (as indi-cated in Fig. 3) with the B5a complete sequence fromChina (Kong et al. 2003a, 2003b).
The frequency of the 9-bp polymorphism in mainlandDravidic and Indo-European-speaking populations wasrelatively low (Table 1). Analysis of the HVS-I se-quences and coding region SNP information indicated atleast six independent origins of the deletion in haplo-group M, at the M2a, M3, M3a, M4, M5, and M*background. Furthermore, four sub-clades of M—M4,
Fig. 1 Frequencies and distribution of the 9-bp deletion/insertionamong Indian populations
510
Table
2Haplogroupaffiliationofthe9-bpdeletion/insertionsamplesbasedontheHVS-I
andcodingregionSNPs.Nucleotidechangeisspecified
only
fortransversions(C
RSCambridgereference
sequence,
asterisknucleotideinsertion,spotsamenucleotideasCRS,dash
data
notanalyzed)
HaplotypeSample
size/
population
HVS-I
(�16000)
Haplogroup4474897093537354045805252696070288584870195409950103981040010873114671171911881123081237212705133951478315607
CRS
CT
GA
TG
GC
CC
AT
TA
CT
AG
CA
GC
AT
A
9bpdeletion
H1
1 Rajput/4
Bharia/1
Kori
223
M*
.C
––
–.
.–
––
GC
–G
TC
.A
–.
.T
–C
–
H2
1 Rajput/1
wBengali
129-223
M5
.C
––
–.
.–
T–
.C
..
TC
.A
–.
.T
–C
–
H3
1 Rajput
223-156-274-
320-360
M*
.C
––
–.
.–
––
GC
.G
TC
.A
–.
.T
–C
–
H4
1 Rajput
129-140-189-
261-266A
B5a
..
––
–.
.–
T–
..
CG
..
.A
–.
..
–.
–
H5
1 Erukula/9
Yanadi/3
Oorali/1
Baduga
184-223-256G-
311-362
M4
.C
––
–.
.–
––
–C
–G
TC
.A
–.
.T
–C
–
H6
1 Kanwar
218-223-231-
311-362-356
M4
.C
––
–.
.–
––
.C
–G
TC
.A
–.
.T
–C
–
H7
1 Erukula
223-233-290
M*
.C
––
–.
.–
T–
.C
–G
TC
.A
–.
.T
–C
–
H8
1 Satnami
179-223
M*
.C
––
–.
.–
T–
.C
–G
TC
.A
–.
.T
–C
–
H9
1 Nishi
270-319-352
M2a
GC
––
–.
A–
––
–C
–G
TC
.A
–.
.T
–C
–
H10
1 Kanwar
093-126-223-290
M3a
.C
––
–A
.–
T–
–C
–G
TC
.A
–.
.T
–C
–
H11
6 Bharia
126-223
M3a
.C
––
–A
.–
––
–C
–G
TC
.A
–.
.T
–C
–
H12
1 Sakkili
126-223-234-290
M3
.C
––
–.
.–
––
–C
–G
TC
.A
–.
.T
–C
–
H13
1 Sakkili
119-126-223-234-290M3
.C
––
–.
.–
––
–C
–G
TC
.A
–.
.T
–C
–
H14
1 Koli
145
R.
.–
––
..
–T
––
.–
G.
..
A–
..
.–
.–
H15
1 Gond
126
H.
.–
––
..
–.
–.
.–
G.
..
.–
..
.–
.–
H16
1 Nishi
181del-197
R.
.–
––
..
–T
–.
.–
G.
..
A–
..
.–
.–
H17
1 Lodhe
311-318T
U7
..
––
–.
.–
––
–.
–G
..
GA
–G
A.
–.
–
H18
1 Kanwar
075-260-261-319-362R7
..
––
–.
.–
T–
–.
–G
..
.A
–.
..
–.
–
H19
1 Yadava
129-318T
U7
..
––
–.
.–
––
–.
–.
..
GA
–G
A.
–.
–
511

Table
2(C
ontd.)
HaplotypeSample
size/
population
HVS-I
(�16000)
Haplogroup
4474897093537354045805252696070288584870195409950103981040010873114671171911881123081237212705133951478315607
CRS
CT
GA
TG
GC
CC
AT
TA
CT
AG
CA
GC
AT
A
H20
1 Baduga/1
Irula
CRS
U.
.–
––
..
–T
––
.–
..
.G
A–
GA
.–
.–
H21
1 wBengali
129-189
B.
.–
––
..
––
–.
.–
..
..
A–
..
.–
.–
H22
1 Tiwari
147-217-235
B4
..
––
–.
.–
––
–.
–.
..
.A
–.
..
–.
–
H23
1 wBengali
147-189-235
B4
..
––
–.
.–
––
–.
–.
..
.A
–.
..
–.
–
H24
2 Nicobarese
140-183C-266A
B5a1
..
AG
C.
.T
–A
–.
CG
..
.A
T.
..
G.
–
H25
20
Nicobarese
140-183C-189-266A
B5a1
..
AG
C.
.T
–A
–.
CG
..
.A
T.
..
G.
–
H26
1 Gond
129-140-189-243
B5b
..
––
–.
.–
––
–.
–G
..
.A
–.
..
––
–
9bpinsertion
H27
1 Oraon
050-190-223-311-357M4a
.C
––
–.
.–
––
–C
–G
TC
.A
–.
.T
–C
–
H28
2Oraon
048-223-311-357
M4a
.C
––
–.
.–
––
–C
–G
TC
.A
–.
.T
–C
–
H29
2Oraon/1
Yadava
129-223-291
M5a
.C
––
–.
.–
––
–C
–G
TC
.A
–.
.T
–C
–
H30
1Oraon
223-295-318T-325
M18
.C
––
–.
.–
––
.C
–G
TC
.A
–.
.T
–C
–
H31
1Oraon
223-318T-325
M18
.C
––
–.
.–
––
–C
–G
TC
.A
–.
.T
–C
–
H32
1Oraon
093-223-256-261
M.
C–
––
..
––
––
C–
GT
C.
A–
..
T–
C–
H33
1Munda
111-223-311-316-362M4
.C
––
–.
.–
––
–C
–G
TC
.A
–.
.T
–C
–
H34
1Kathodi
192-311
R.
.–
––
..
–T
–G
.–
G.
..
A–
..
.–
.–
H35
1Rohidas
126-294-296-325
T.
.–
––
..
–T
–G
.–
G.
..
A–
..
.–
.G
512

M4a, M5a, and M18 showed the presence of three copiesof the 9-bp motif (insertion). One independent event ofthe 9-bp insertion has also been found on the unresolvedM background (Table 2). Altogether, haplogroup Msamples covered 46 out of the 61 individuals with lengthvariation in the COII-tRNALys region in India, exclud-ing the Nicobarese (Fig. 2). In addition to haplogroupB, six additional independent origins of the 9-bp deletion
[twice at different branches of haplogroups R* and U,and one each in R7 (Palanichamy et al. 2004) and H] andtwo of the insertions were inferred in phylogeneticanalysis of haplogroup N lineages (one in the R and onein the T lineage; Fig. 3). A high proportion of sampleshaving 9-bp deletion (22 Nicobarese, two West Bengali,one Tiwari, one Rajput, and one Gond) fell in haplo-group B. All the Nicobarese with one Rajput fell intohaplogroup B5a, whereas one Gond sample fell intohaplogroup B5b. One West Bengali and one Tiwarisample fell into haplogroup B4, whereas one WestBengali sample was defined as unresolved haplogroup B(Fig. 3).
Discussion
Our comprehensive study of Indian populations fromvarious geographic zones with respect to the lengthvariation in the COII-tRNALys region has revealed that
Fig. 2 The phylogenetic placement of haplotypes of haplogroup Massociated with length variation in the COII-tRNALys intergenicregion in India. Substitutions in HVS-I or in the coding region areshown along the branches. Nucleotide change is specified only fortransversions (circle with solid color 9-bp deletion, stripes insertion,white circles control samples with two copies of the 9-bp repeat).The sample names marked in red are the control samples in thisstudy, whereas the sample names marked in black are the samples ofKivisild et al. 1999 (Ind;Lam;Lob;Bog;Bv;By;Bn;K;Ktk;J;Ks;M;ML;VS;WB;Y) and our unpublished data (San;Lm;Nai;KO).M*-del is a potentially paraphyletic grouping of all 9-bp deletedlineages in haplogroup M and did not resolve into sub-cladesdefined by stable coding region markers. Nucleotide positions (boldand underlined) are the haplogroup-defining mutation sites
513

2.51% (2.15% deletion and 0.36% insertion) of 3293individuals have the 9-bp length variation, and that thefrequency of the 9-bp deletion/insertion does not varysignificantly across the different ethnic and linguisticpopulations. The sharing of a common haplotype foundin all of the 9-bp deleted samples of Yanadi (nine), in thethree Oorali, and one each in the Baduga and Erukula inM4, together with the Koya and Irula samples (Watkinset al. 1999; Kivisild et al. 2003), all of which belong toDravidian linguistic group and inhabit southern India,suggest either a common origin or maternal gene flowbetween these populations. Further, the sharing of one
of the haplotypes of Sakkili with the Dravidian MariaGond and Chenchu populations (Watkins et al. 1999;Kivisild et al. 2003) in addition to the sharing of the 9-bpdeleted haplotype on an M3a background by two Indo-European populations of central India (Kanwar ofChhattisgarh; Bharia of Madhya Pradesh) suggest that,although there is maternal gene flow between thesepopulations, it is low and limited by geographic dis-tance, ethnicity, and language.
Consistent with the high frequency of the haplogroupM in India, the analysis of the coding markers in indi-viduals with length variation in the COII-tRNALys re-gion has shown that most of the individuals (46 out of83) belong to this haplogroup (Fig. 2). Interestingly,both samples with the ancestral (M3) and derived (M3a)allele at nucleotide position 4580 include lineages withthe 9-bp deletion (Fig. 2). As the majority consensus ofboth M3 and M3a includes individuals without thedeletion or insertion (two copies of the 9-bp motif;Kivisild et al. 2003; unpublished), the deletion haspresumably occurred at least twice on the haplogroupM3 background. Relatively high sequence variation of
Fig. 3 Phylogenetic placement of haplotypes of haplogroup Nassociated with length variation in the COII-tRNALys intergenicregion in India. Substitutions in HVS-I or in the coding region areshown along the branches. Nucleotide change is specified only fortransversions (circle with solid color 9-bp deletion, stripes insertion,white circles represent the control samples with two copies of the9-bp repeat). The sample names marked in red are the controlsamples in this study, whereas the samples name marked in blackare the samples taken from Kivisild et al. 1999 (Ind;Lam;Ktk;Pak)and our unpublished data (Ao;Rm;Pn). Nucleotide positions (boldand underlined) are the haplogroup-defining mutation sites
514

the 9-bp deletion in the paraphyletic cluster M*, whichincludes all unclassified branches of M, probably reflectthe lack of adequate phylogenetic resolution and there-fore might be inflated by several additional independentoccurrences of the 9-bp deletions. Seven independentorigins of the 9-bp deletion and two occurrences of theinsertion were inferred in the background of haplogroupN (Fig. 3). Taken together, these results in Indian pop-ulations indicate that the length variation in the COII-tRNALys intergenic region can be highly recurrent, evenwithin a single sub-continent.
Based on the coding region SNPs, a large proportionof Nicobarese (22), two West Bengali samples, and oneTiwari, one Gond, and one Rajput sample having the9-bp deletion could be classified within two knownbranches of haplogroup B. All the Nicobarese with oneRajput and one Gond sample fell into haplogroups B5aand B5b, whereas the West Bengali and the Tiwari (anIndo-European-speaking high caste group from UttarPradesh) samples fell into haplogroup B4. Although, nostudy until now has reported haplogroup B in mainlandIndia, the presence of southeast-Asian-specific haplo-group B4 and B5b lineages at marginally low frequency(Fig. 3) on the Indian mainland suggest low levels ofadmixture with populations of southeast Asian origin.Intriguingly, among the Austro-Asiatic groups, only theNicobarese harbor haplogroup B5a at significant pro-portions, and none of the 302 mainland Mundari-speaking groups possess either haplogroup B or the9-bp length polymorphism (except for one sample thathas the 9-bp insertion). Thus, one may postulate thatMundari-speaking Austro-Asiatic populations frommainland India have independently migrated/originatedfrom the Mon-Khmeric-speaking Nicobarese or exten-sive admixture occurred with the neighboring Indo-European and Dravidian populations.
Low haplotype diversity in Nicobarese B5a individu-als suggests a recent founder effect. This observationconcurs with the hypothesis that the 9-bp deletion in theNicobarese is probably rooted in China and expandedvia Cambodia and Thailand to the Nicobar Islands (Yaoet al. 2000). This migration could have occurred in theNeolithic era during the demic expansion of Neolithicagriculturalists in southeast Asia as inferred in the studiesof Thangaraj et al. (2003) and Underhill et al. (2000)based on results from Y-chromosome markers. Codingregion analysis also supports the theory, based on mor-phometric and linguistic data, that the Nicobarese are ofsoutheast Asian origin. The presence of haplogroup R10and F1a in the Nicobarese (Prasad et al. 2001; unpub-lished) and in the Thailand samples (Oota et al. 2001;Fucharoen et al. 2001) further strengthens the view thatthe Nicobarese, Thai, and Chinese might have a commonorigin. Further analysis of the coding region of B5asamples from Burma, Myanmar, and Thailand and fromother adjoining south Asian countries may provide uswith further insights into the origin of the Nicobarese.
In conclusion, we provide here a complete geneticreview of the 9-bp polymorphism in Indian populations;
this suggests a total of 20 independent origins of the 9-bpdeletion and insertion. These events are not population-specific and its frequency varies between the popula-tions. Although the caste and tribes of India are wellknown for strictly adhering to and practicing endogamy,the sharing of 9-bp-deleted haplotypes suggests maternalgene flow, albeit low, between populations of the samelinguistic family and geographic region and not acrosslinguistic or geographic groups. Further, our resultsstrongly corroborate the existing hypothesis that theNicobarese may have arrived on the Andaman andNicobar islands of India from southeast Asia during theNeolithic period, unlike the Mundari groups, whichhave been conjectured to have arrived in India fromAfrica around 50,000 years ago (Kumar and Reddy2003). Intriguingly, haplogroup B5a, which bears wit-ness to the link between the Nicobarese and the south-east Asian population, is totally absent in the mainlandAustro-Asiatic tribes indicating that this genetic tag doesnot relate all existing Austro-Asiatic speakers.
Electronic Database Information
Accession numbers and URL for data presented hereinare as follows: GenBank, http://www.ncbi.nlm.nih.gov/Genbank/ (for mtDNA HVS-I, accession numbersAY255133–AY255180; for mtDNA HVS-II, accessionnumbers AY370779-AY370829)
Acknowledgements We thank Peter A. Underhill, V. Kumar, V. R.Rao, and M. W. Pandit for their valuable comments during thepreparation of this manuscript. We are grateful to the students andstaff of various colleges and universities, who actively participatedin this study by collecting samples from the various ethnic groups.This study was supported by the Council of Scientific and Indus-trial Research (CSIR), Government of India, New Delhi.
References
Andrews RM, Kubacka I, Chinnery PF, Lightowlers RN, TurnbullDM, Howell N (1999) Reanalysis and revision of the Cam-bridge reference sequence for human mitochondrial DNA. NatGenet 23:147
Ballinger SW, Schurr TG, Torroni A, Gan YY, Hodge JA, HassanK, Chen KH, Wallace DC (1992) Southeast Asian mitochon-drial DNA analysis reveals genetic continuity of ancient Mon-goloid migrations. Genetics 130:139–152
Bandelt H, Forster P, Rohl A (1999) Median joining networks forinferring intraspecific phylogenies. Mol Biol Evol 16:37–48
Betty DJ, Chin-Atkins AN, Croft L, Sraml M, Easteal S (1996)Multiple independent origins of the COII/tRNA (Lys) inter-genic 9-bp mtDNA deletion in aboriginal Australians. Am JHum Genet 58:428–433
Clark VJ, Sivendren S, Saha N, Bentley GR, Aunger R, SirajuddinSM, Stoneking M (2000) The 9-bp deletion between the mito-chondrial lysine tRNA and COII genes in tribal populations ofIndia. Hum Biol 72:273–285
Comas D, Calafell F, Mateu E, Pe’rez-Lezaun A, Bosch E, Mar-ty’nez-Arias R, Clarimon J, Facchini F, Fiori G, Luiselli D,et al (1998) Trading genes along the Silk Road: mtDNA se-quences and the origin of central Asian populations. Am J HumGenet 63:1824–1838
515

Cordaux R, Saha N, Bentley GR, Aunger R, Sirajuddin SM,Stoneking M (2003) Mitochondrial DNA analysis reveals di-verse histories of tribal populations from India. Eur J HumGenet 11:253–264
Fucharoen G, Fucharoen S, Horai S (2001) Mitochondrial DNApolymorphisms in Thailand. J Hum Genet 46:115–125
Hagelberg E, Clegg JB (1993) Genetic polymorphisms in prehis-toric Pacific islanders determined by analysis of ancient boneDNA. Proc R Soc Lond [Biol] 252:163–170
Hagelberg E, Quevedo S, Turbon D, Clegg JB (1994) DNA fromancient Easter Islanders. Nature 369:25–26
Harihara S, Hirai M, Suutou Y, Shimizu K, Omoto K (1992)Frequency of a 9-bp deletion in the mitochondrial DNA amongAsian populations. Hum Biol 64:161–166
Hertzberg M, Mickleson KN, Serjeantson SW, Prior JF, Trent RJ(1989) An Asian-specific 9-bp deletion of mitochondrial DNA isfrequently found in Polynesians. Am J Hum Genet 44:504–510
Horai S, Gojobori T, Matsunaga E (1987) Evolutionary implica-tions of mitochondrial DNA polymorphisms in human popu-lations. In: Vogel F, Sperling K (eds) Human genetics:proceedings of the 7th International Congress. Springer, BerlinHeidelberg New York, pp 177–181
Kivisild T, Bamshad MJ, Kaldma K, Metspalu M, Metspalu E,Reidla M, Laos S, Parik J, Watkins WS, Dixon ME, Papiha SS,Mastana SS, Mir MR, Ferak V, Villems R (1999) Deep com-mon ancestry of Indian and western-Eurasian mitochondrialDNA lineages. Curr Biol 9:1331–1334
Kivisild T, Tolk HV, Parik J, Wang Y, Papiha SS, Bandelt H-J,Villems R (2002) The emerging limbs and twigs of the eastAsian mtDNA tree. Mol Biol Evol 19:1737–1751
Kivisild T, Rootsi S, Metspalu M, Mastana S, Kaldma K, Parik J,Metspalu E, Adojaan M, Tolk HV, Stepanov V, Golge M,Usanga E, Papiha SS, Cinnioglu C, King R, Cavalli-Sforza L,Underhill PA, Villems R (2003) The genetic heritage of theearliest settlers persists both in Indian tribal and caste popula-tions. Am J Hum Genet 72:313–332
KongQP, YaoYG, SunC, Bandelt H-J, Zhu CL, Zhang YP (2003a)Phylogeny of east Asian mitochondrial DNA lineages inferredfrom complete sequences. Am J Hum Genet 73:671–676
Kong QP, Yao YG, Liu M, Shen SP, Chen C, Zhu CL, Pala-nichamy MG, Zhang YP (2003b) Mitochondrial DNA se-quence polymorphisms of five ethnic populations from northernChina. Hum Genet 113:391–405
Kumar V, Reddy BM (2003) Status of Austro-Asiatic groups in thepeopling of India: an exploratory study based on the availableprehistoric, linguistic and biological evidences. J Biosci 28:507–522
Majumder PP (2001) Ethnic populations of India as seen from anevolutionary perspective. J Biosci 26:533–545
Melton T, Clifford S, Martinson J, Batzer M, Stoneking M (1998)Genetic evidence for the proto-Austronesian homeland in Asia:mtDNA and nuclear DNA variation in Taiwanese Aboriginaltribes. Am J Hum Genet 63:1807–1823
Nishimaki Y, Sato K, Fang L, Ma M, Hasekura H, Boettcher B(1999) Sequence polymorphism in the mtDNA HVS-I region inJapanese and Chinese. J Leg Med 1:238–249
Oota H, Settheetham-Ishida W, Tiwawech D, Ishida T, StonekingM (2001) Human mtDNA and Y-chromosome variation iscorrelated with matrilocal versus patrilocal residence. NatGenet 29:20–21
Oota H, Kitano T, Jin F, Yuasa I, Wang L, Ueda S, Saitou N,Stoneking M (2002) Extreme mtDNA homogeneity in conti-nental Asian populations. Am J Phys Anthropol 118:146–153
Palanichamy MG, Sun C, Agrawal S, Bandelt H-J, Kong Q-P,Khan F, Wang C-Y, Chaudhuri TK, Palla V, Zhang Y-P (2004)Phylogeny of mitochondrial DNA macrohaplogroup N in In-dia, based on complete sequencing: implications for the peo-pling of South Asia. Am J Hum Genet 75:966–978
Pfeiffer H, Steighner R, Fisher R, Yoon C-L, Mornstad H, HollandMM (1998) Mitochondrial DNA extraction and typing fromisolated dentin – experimental evaluation in a Korean popula-tion. Int J Leg Med 111:309–313
Prasad BV, Ricker CE, Watkins WS, Dixon ME, Rao BB, NaiduJM, Jorde LB, Bamshad M (2001) Mitochondrial DNA varia-tion in Nicobarese islanders. Hum Biol 73:715–725
Quintana-Murci L, Semino O, Bandelt H-J, Passarino G, McEl-reavey K, Santachiara-Benerecetti AS (1999) Genetic evidenceof an early exit of Homo sapiens sapiens from Africa througheastern Africa. Nat Genet 23:437–441
Redd AJ, Takezaki N, Sherry ST, McGarvey ST, Sofro AS,Stoneking M (1995) Evolutionary history of the COII/tRNA-Lys intergenic 9 base pair deletion in human mitochondrialDNAs from the Pacific. Mol Biol Evol 12:604–615
Rieder MJ, Taylor SL, Tobe VO, Nickerson DA (1998)Automating the identification of DNA variations using quality-based fluorescence re-sequencing: analysis of the human mito-chondrial genome. Nucleic Acids Res 26:967–973
Roychoudhury S, Roy S, Basu A, Banerjee R, Vishwanathan H,Usha Rani MV, Sil SK, Mitra M, Majumder PP (2001)Genomic structures and population histories of linguisticallydistinct tribal groups of India. Hum Genet 109:339–350
Schurr TG, Ballinger SW, Gan YY, Hodge JA, Merriwether DA,Lawrence DN, Knowler WC, Weiss KM, Wallace DC (1990)Amerindian mitochondrial DNAs have rare Asian mutations athigh frequencies, suggesting they derived from four primarymaternal lineages. Am J Hum Genet 46:613–623
Seo Y, Stradmann-Bellinghausen B, Rittner C, Takahama K,Schneider PM (1998) Sequence polymorphism of mitochon-drial DNA control region in Japanese. Forensic Sci Int 97:155–164
Soodyall H, Vigilant L, Hill AV, Stoneking M, Jenkins T (1996)MtDNA control-region sequence variation suggests multipleindependent origins of an ‘‘Asian-specific’’ 9-bp deletion in sub-Saharan Africans. Am J Hum Genet 58:595–608
Stoneking M, Wilson AC (1989) Mitochondrial DNA. In: Hill A,Serjeantson S (eds) The colonization of Pacific: a genetic trial.Oxford University Press, Oxford, pp 215–245
Sykes B, Leiboff A, Low-Beer J, Tetzner S, Richards M (1995) Theorigins of the Polynesians: an interpretation from mitochon-drial lineage analysis. Am J Hum Genet 57:1463–1475
Thangaraj K, Joshi MB, Reddy AG, Gupta NJ, Chakravarty B,Singh L (2002) CAG repeat expansion in the androgen receptorgene is not associated with male infertility in Indian popula-tions. J Androl 23:815–818
Thangaraj K, Singh L, Reddy AG, Rao VR, Sehgal SC, UnderhillPA, Pierson M, Frame IG, Hagelberg E (2003) Genetic affinitiesof the Andaman islanders, a vanishing human population. CurrBiol 13:86–93
Thomas MG, Cook CE, Miller KW, Waring MJ, Hagelberg E(1998) Molecular instability in the COII-tRNA(Lys) intergenicregion of the human mitochondrial genome: multiple origins ofthe 9-bp deletion and heteroplasmy for expanded repeats. Phi-los Trans R Soc Lond Biol 353:955–965
Torroni A, Schurr TG, Yang C, Szathmary EJ, Williams RC,Schanfield MS, Troup GA, Knowler WC, Lawrence DN, WeissKM, Wallace DC (1992) Native American mitochondrial DNAanalysis indicates that the Amerind and the Nadene popula-tions were founded by two independent migrations. Genetics130:153–162
Torroni A, Bandelt H-J, D‘Urbano L, Lahermo P, Moral P, Sel-litto D, Rengo C, Forster P, Savontaus ML, Bonne-Tamir B,Scozzari R (1998) MtDNA analysis reveals a major latePaleolithic population expansion from southwestern to north-eastern Europe. Am J Hum Genet 62:1137–1152
Tsai LC, Lin CY, Lee JC, Chang JG, Linacre A, Goodwin W(2001) Sequence polymorphism of mitochondrial D-loopDNA in the Taiwanese Han population. Forensic Sci Int15:239–247
Underhill PA, Shen P, Lin AA, Jin L, Passarino G, Yang WH,Kauffman E, Bonne-Tamir B, Bertranpetit J, Francalacci P,Ibrahim M, Jenkins T, Kidd JR, Mehdi SQ, Seielstad MT,Wells RS, Piazza A, Davis RW, Feldman MW, Cavalli-SforzaLL, Oefner PJ (2000) Y chromosome sequence variation andthe history of human populations. Nat Genet 26:358–361
516

Vigilant L, Stoneking M, Harpending H, Hawkes K, Wilson AC(1991) African populations and the evolution of human mito-chondrial DNA. Science 253:1503–1507
Ward RH, Frazier BL, Dew-Jager K, Paabo S (1991) Extensivemitochondrial diversity within a single Amerindian tribe. ProcNatl Acad Sci USA 88:8720–8724
Ward RH, Redd A, Valencia D, Frazier B, Paabo S (1993) Geneticand linguistic differentiation in the Americas. Proc Natl AcadSci USA 90:10663–10667
Watkins WS, Bamshad M, Dixon ME, Bhaskara Rao B, NaiduJM, Reddy PG, Prasad BV, Das PK, Reddy PC, Gai PB,Bhanu A, Kusuma YS, Lum JK, Fischer P, Jorde LB (1999)Multiple origins of the mtDNA 9-bp deletion in populations ofSouth India. Am J Phys Anthropol 109:147–158
Yao YG, Watkins WS, Zhang YP (2000) Evolutionary history ofthe mtDNA 9-bp deletion in Chinese populations and its rele-vance to the peopling of east and southeast Asia. Hum Genet107:504–512
Yao YG, Kong QP, Bandelt H-J, Kivisild T, Zhang YP (2002a)Phylogeographic differentiation of mitochondrial DNA in HanChinese. Am J Hum Genet 70:635–651
Yao YG, Nie L, Harpending H, Fu YX, Yuan ZG, Zhang YP(2002b) Genetic relationship of Chinese ethnic populations re-vealed by mtDNA sequence diversity. Am J Phys Anthropol118:63–76
517
Copyright © 2022 FDOKUMEN