Different Plasma Markers of Inflammation Are Influenced by Immune Recovery and cART Composition or...
15
RESEARCH ARTICLE Different Plasma Markers of Inflammation Are Influenced by Immune Recovery and cART Composition or Intensification in Treated HIV Infected Individuals Marta Massanella 1,2 , Dan Ouchi 1 , Silvia Marfil 1 , Josep M. Llibre 3 , Maria C. Puertas 1 , Marı ´a J. Buzo ´n 1 , Douglas D. Richman 2 , Elisa Orna 4 , Mario Stevenson 5 , Josep M. Gatell 6 , Pere Domingo 7 , Euge ` nia Negredo 3,8 , Javier Martinez-Picado 1,8,9 , Bonaventura Clotet 1,3,8 , Julia ` Blanco 1,8 * 1. AIDS ResearchInstitute IrsiCaixa-HIVACAT, Institut d’Investigacio ´ en Cie `ncies de la Salut Germans Trias i Pujol, UAB, Badalona, Spain, 2. VA San Diego Healthcare System and Departments of Pathology and Medicine, University of California San Diego (UCSD), San Diego, United States of America, 3. ‘‘Lluita contra la SIDA’’ Foundation, University Hospital Germans Trias i Pujol, Institut d’Investigacio ´ en Cie ` ncies de la Salut Germans Trias i Pujol, Badalona, Spain, 4. Hematology Department, University Hospital Germans Trias i Pujol, Badalona, Spain, 5. University of Miami, Miami, United States of America, 6. Hospital Clı ´nic-IDIBAPS, Barcelona, Spain, 7. Hospital de Sant Pau, Barcelona, Spain, 8. Universitat de Vic-UCC, Vic, Spain, 9. Institucio ´ Catalana de Recerca i Estudis Avanc ¸ats (ICREA), Barcelona, Spain * [email protected] Abstract Background: HIV-1 infection increases plasma levels of inflammatory markers. Combination antiretroviral therapy (cART) does not restore inflammatory markers to normal levels. Since intensification of cART with raltegravir reduced CD8 T-cell activation in the Discor-Ral and IntegRal studies, we have evaluated the effect of raltegravir intensification on several soluble inflammation markers in these studies. Methods: Longitudinal plasma samples (0–48 weeks) from the IntegRal (n567, 22 control and 45 intensified individuals) and the Discor-Ral studies (44 individuals with CD4 T-cell counts,350 cells/ml, 14 control and 30 intensified) were assayed for 25 markers. Mann-Whitney, Wilcoxon, Spearman test and linear mixed models were used for analysis. Results: At baseline, different inflammatory markers were strongly associated with HCV co-infection, lower CD4 counts and with cART regimens (being higher in PI- treated individuals), but poorly correlated with detection of markers of residual viral replication. Although raltegravir intensification reduced inflammation in individuals with lower CD4 T-cell counts, no effect of intensification was observed on plasma markers of inflammation in a global analysis. An association was found, however, between reductions in immune activation and plasma levels of the coagulation OPEN ACCESS Citation: Massanella M, Ouchi D, Marfil S, Llibre JM, Puertas MC, et al. (2014) Different Plasma Markers of Inflammation Are Influenced by Immune Recovery and cART Composition or Intensification in Treated HIV Infected Individuals. PLoS ONE 9(12): e114142. doi:10.1371/journal.pone. 0114142 Editor: Shilpa J. Buch, University of Nebraska Medical Center, United States of America Received: May 28, 2014 Accepted: November 3, 2014 Published: December 2, 2014 Copyright: ß 2014 Massanella et al. This is an open-access article distributed under the terms of the Creative Commons Attribution License, which permits unrestricted use, distribution, and repro- duction in any medium, provided the original author and source are credited. Data Availability: The authors confirm that, for approved reasons, some access restrictions apply to the data underlying the findings. Data are part of two clinical trials. All relevant data shown in the manuscript and/or supporting information are avail- able on request to researchers who meet the criteria for access to confidential data. Please contact the Trial Monitor Roser Escrig ( [email protected]) or alternatively the Hospital Germans Trias i Pujol Ethics Committee ( http://www.ceicgermanstrias.cat) to request data. Funding: This work was supported by HIVACAT program; the RD12/0017/0002 project as part of the Plan Nacional R + D + I cofinanced by Instituto de Salud Carlos III-Subdireccio ´n General de Evaluacio ´n y el Fondo Europeo de Desarrollo Regional (FEDER); the European Community’s Seventh Framework Program (FP7/2007-2013) under the Project ‘‘Collaborative HIV and Anti-HIV Drug Resistance Network (CHAIN)’’ grant agree- ment n ˚ 223131, by the Department of Veterans Affairs, the UCSD Center for AIDS Research (P30 AI36214), the CARE Collaboratory (U19 AI096113) and the James B. Pendleton Charitable Trust and by an unrestricted grant from Merck Sharp & Dohme (MSD 40527). The funders had no role in study design, data collection and analysis, decision to publish, or preparation of the manuscript. Competing Interests: BC, JB, JMP, JML, EN, MS and DDR have received fees for consultancy from BMS, GILEAD, ViiV or Jansen outside the submitted work. MSD grant 40527 (Principal Investigator JB) funded the project through the PI’s institution (IRSICAIXA). This does not alter the PLOS ONE | DOI:10.1371/journal.pone.0114142 December 2, 2014 1 / 15
-
Upload
independent -
Category
Documents
-
view
3 -
download
0
Transcript of Different Plasma Markers of Inflammation Are Influenced by Immune Recovery and cART Composition or...

RESEARCH ARTICLE
Different Plasma Markers of InflammationAre Influenced by Immune Recovery andcART Composition or Intensification inTreated HIV Infected IndividualsMarta Massanella1,2, Dan Ouchi1, Silvia Marfil1, Josep M. Llibre3, Maria C. Puertas1,Marıa J. Buzon1, Douglas D. Richman2, Elisa Orna4, Mario Stevenson5,Josep M. Gatell6, Pere Domingo7, Eugenia Negredo3,8, Javier Martinez-Picado1,8,9,Bonaventura Clotet1,3,8, Julia Blanco1,8*
1. AIDS Research Institute IrsiCaixa-HIVACAT, Institut d’Investigacio en Ciencies de la Salut Germans Trias iPujol, UAB, Badalona, Spain, 2. VA San Diego Healthcare System and Departments of Pathology andMedicine, University of California San Diego (UCSD), San Diego, United States of America, 3. ‘‘Lluita contra laSIDA’’ Foundation, University Hospital Germans Trias i Pujol, Institut d’Investigacio en Ciencies de la SalutGermans Trias i Pujol, Badalona, Spain, 4. Hematology Department, University Hospital Germans Trias iPujol, Badalona, Spain, 5. University of Miami, Miami, United States of America, 6. Hospital Clınic-IDIBAPS,Barcelona, Spain, 7. Hospital de Sant Pau, Barcelona, Spain, 8. Universitat de Vic-UCC, Vic, Spain, 9.Institucio Catalana de Recerca i Estudis Avancats (ICREA), Barcelona, Spain
Abstract
Background: HIV-1 infection increases plasma levels of inflammatory markers.
Combination antiretroviral therapy (cART) does not restore inflammatory markers to
normal levels. Since intensification of cART with raltegravir reduced CD8 T-cell
activation in the Discor-Ral and IntegRal studies, we have evaluated the effect of
raltegravir intensification on several soluble inflammation markers in these studies.
Methods: Longitudinal plasma samples (0–48 weeks) from the IntegRal (n567, 22
control and 45 intensified individuals) and the Discor-Ral studies (44 individuals
with CD4 T-cell counts,350 cells/ml, 14 control and 30 intensified) were assayed
for 25 markers. Mann-Whitney, Wilcoxon, Spearman test and linear mixed models
were used for analysis.
Results: At baseline, different inflammatory markers were strongly associated with
HCV co-infection, lower CD4 counts and with cART regimens (being higher in PI-
treated individuals), but poorly correlated with detection of markers of residual viral
replication. Although raltegravir intensification reduced inflammation in individuals
with lower CD4 T-cell counts, no effect of intensification was observed on plasma
markers of inflammation in a global analysis. An association was found, however,
between reductions in immune activation and plasma levels of the coagulation
OPEN ACCESS
Citation: Massanella M, Ouchi D, Marfil S, LlibreJM, Puertas MC, et al. (2014) Different PlasmaMarkers of Inflammation Are Influenced by ImmuneRecovery and cART Composition or Intensificationin Treated HIV Infected Individuals. PLoSONE 9(12): e114142. doi:10.1371/journal.pone.0114142
Editor: Shilpa J. Buch, University of NebraskaMedical Center, United States of America
Received: May 28, 2014
Accepted: November 3, 2014
Published: December 2, 2014
Copyright: � 2014 Massanella et al. This is anopen-access article distributed under the terms ofthe Creative Commons Attribution License, whichpermits unrestricted use, distribution, and repro-duction in any medium, provided the original authorand source are credited.
Data Availability: The authors confirm that, forapproved reasons, some access restrictions applyto the data underlying the findings. Data are part oftwo clinical trials. All relevant data shown in themanuscript and/or supporting information are avail-able on request to researchers who meet the criteriafor access to confidential data. Please contact theTrial Monitor Roser Escrig ([email protected]) oralternatively the Hospital Germans Trias i PujolEthics Committee (http://www.ceicgermanstrias.cat)to request data.
Funding: This work was supported by HIVACATprogram; the RD12/0017/0002 project as part ofthe Plan Nacional R + D + I cofinanced by Institutode Salud Carlos III-Subdireccion General deEvaluacion y el Fondo Europeo de DesarrolloRegional (FEDER); the European Community’sSeventh Framework Program (FP7/2007-2013)under the Project ‘‘Collaborative HIV and Anti-HIVDrug Resistance Network (CHAIN)’’ grant agree-ment n 223131, by the Department of VeteransAffairs, the UCSD Center for AIDS Research (P30AI36214), the CARE Collaboratory (U19 AI096113)and the James B. Pendleton Charitable Trust andby an unrestricted grant from Merck Sharp &Dohme (MSD 40527). The funders had no role instudy design, data collection and analysis, decisionto publish, or preparation of the manuscript.
Competing Interests: BC, JB, JMP, JML, EN, MSand DDR have received fees for consultancy fromBMS, GILEAD, ViiV or Jansen outside thesubmitted work. MSD grant 40527 (PrincipalInvestigator JB) funded the project through the PI’sinstitution (IRSICAIXA). This does not alter the
PLOS ONE | DOI:10.1371/journal.pone.0114142 December 2, 2014 1 / 15
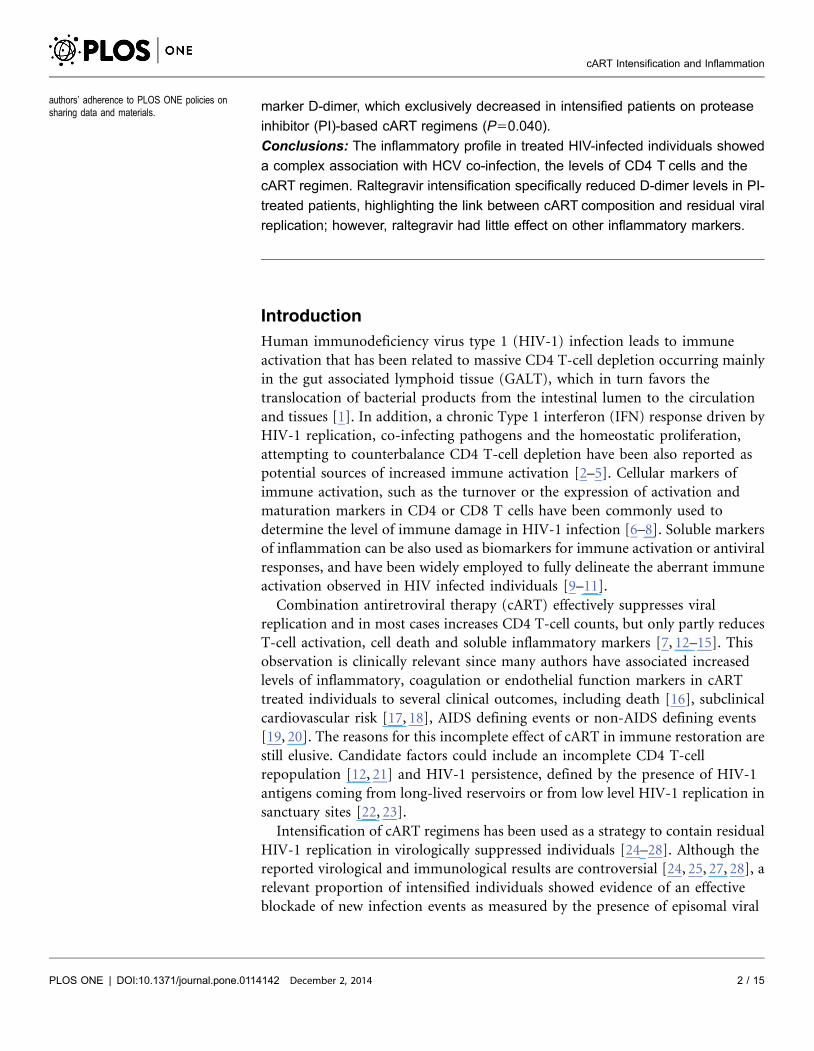
marker D-dimer, which exclusively decreased in intensified patients on protease
inhibitor (PI)-based cART regimens (P50.040).
Conclusions: The inflammatory profile in treated HIV-infected individuals showed
a complex association with HCV co-infection, the levels of CD4 T cells and the
cART regimen. Raltegravir intensification specifically reduced D-dimer levels in PI-
treated patients, highlighting the link between cART composition and residual viral
replication; however, raltegravir had little effect on other inflammatory markers.
Introduction
Human immunodeficiency virus type 1 (HIV-1) infection leads to immune
activation that has been related to massive CD4 T-cell depletion occurring mainly
in the gut associated lymphoid tissue (GALT), which in turn favors the
translocation of bacterial products from the intestinal lumen to the circulation
and tissues [1]. In addition, a chronic Type 1 interferon (IFN) response driven by
HIV-1 replication, co-infecting pathogens and the homeostatic proliferation,
attempting to counterbalance CD4 T-cell depletion have been also reported as
potential sources of increased immune activation [2–5]. Cellular markers of
immune activation, such as the turnover or the expression of activation and
maturation markers in CD4 or CD8 T cells have been commonly used to
determine the level of immune damage in HIV-1 infection [6–8]. Soluble markers
of inflammation can be also used as biomarkers for immune activation or antiviral
responses, and have been widely employed to fully delineate the aberrant immune
activation observed in HIV infected individuals [9–11].
Combination antiretroviral therapy (cART) effectively suppresses viral
replication and in most cases increases CD4 T-cell counts, but only partly reduces
T-cell activation, cell death and soluble inflammatory markers [7, 12–15]. This
observation is clinically relevant since many authors have associated increased
levels of inflammatory, coagulation or endothelial function markers in cART
treated individuals to several clinical outcomes, including death [16], subclinical
cardiovascular risk [17, 18], AIDS defining events or non-AIDS defining events
[19, 20]. The reasons for this incomplete effect of cART in immune restoration are
still elusive. Candidate factors could include an incomplete CD4 T-cell
repopulation [12, 21] and HIV-1 persistence, defined by the presence of HIV-1
antigens coming from long-lived reservoirs or from low level HIV-1 replication in
sanctuary sites [22, 23].
Intensification of cART regimens has been used as a strategy to contain residual
HIV-1 replication in virologically suppressed individuals [24–28]. Although the
reported virological and immunological results are controversial [24, 25, 27, 28], a
relevant proportion of intensified individuals showed evidence of an effective
blockade of new infection events as measured by the presence of episomal viral
authors’ adherence to PLOS ONE policies onsharing data and materials.
cART Intensification and Inflammation
PLOS ONE | DOI:10.1371/journal.pone.0114142 December 2, 2014 2 / 15

DNA (2-long terminal repeat [2-LTR] circles) that was accompanied by a decrease
in some markers of immune activation or inflammation [24, 25].
The IntegRal [24, 26, 29] and Discor-Ral [30, 31] studies explored the effect of
intensification of cART with the integrase inhibitor raltegravir in virologically
suppressed individuals. While the IntegRal study focused on patients with proper
immune recovery, the Discor-Ral study investigated patients with unsatisfactory
immune recovery (defined by a CD4 T-cell count below 350 cells/mL). Both
studies offered an opportunity to address the contribution of incomplete immune
recovery and low level HIV-1 replication under cART to the inflammatory status
of virologically suppressed HIV-infected individuals.
We analyzed inflammation in baseline samples from these studies to evaluate
the association of inflammation and incomplete immune recovery. In addition
longitudinal analysis was used to test the effect of the blockade of low level HIV-1
replication under cART in the inflammatory status of virologically suppressed
HIV-infected individuals. In order to cover a large number of potential markers,
we evaluated a collection of 25 cytokines in baseline and longitudinal samples
from both studies. We included pro-inflammatory mediators of innate immunity
(i.e. TNF-a, IL-1b, IL-6, IL-10, IL-12, IL-15, type I interferon, such as IFN-a, a-
and b-chemokines, such as IL-8, MCP-1 and MIP-1b) or adaptive immunity (i.e.
IL-2, IL-4, IL-5, IL-13, IL-17 and IFN-c), pro-apoptotic inductors (TRAIL),
stimulators of hematopoiesis (i.e. GM-CSF and G-CSF), monocyte activation
(sCD14), endothelium inflammation (sICAM and sVCAM) and hypercoagulation
markers (D-dimer, a fibrin degradation product that can be increased with
inflammation). Our data suggest a link between systemic inflammatory markers
and CD4 T-cell recovery and also with the composition of cART regimens.
Indeed, a specific beneficial effect of raltegravir intensification could be identified
in individuals receiving protease inhibitor (PI)-based regimens.
Materials and Methods
Ethics statement
The Discor-Ral study is a prospective, open-label, randomized study (Clinical-
Trials.gov number NCT00773708) to assess the effect of raltegravir addition to
standard antiretroviral therapy for 48 weeks in immunodiscordant individuals
(Discor-Ral Study) carried out in the Hospital Universitari Germans Trias i Pujol
(Badalona, Spain) [30, 31]. The IntegRal study is a prospective, controlled, open-
label study that includes HIV-1-infected subjects on suppressive HAART for at
least 1 year (ClinicalTrials.gov number NCT00554398) carried out in three
university hospitals in Barcelona [24, 26, 29]. The Ethics Committee of the
Hospital Germans Trias i Pujol approved The Discor-Ral Study, while the
IntegRal study was approved by the Ethics Committee of the Hospital Germans
Trias I Pujol (Badalona, Spain), the Ethics Committee of the Hospital Clinic
(Barcelona, Spain) and the Ethics Committee of the Hospital de Sant Pau
cART Intensification and Inflammation
PLOS ONE | DOI:10.1371/journal.pone.0114142 December 2, 2014 3 / 15

(Barcelona, Spain). All participants provided written informed consent to
participate in these studies.
Samples
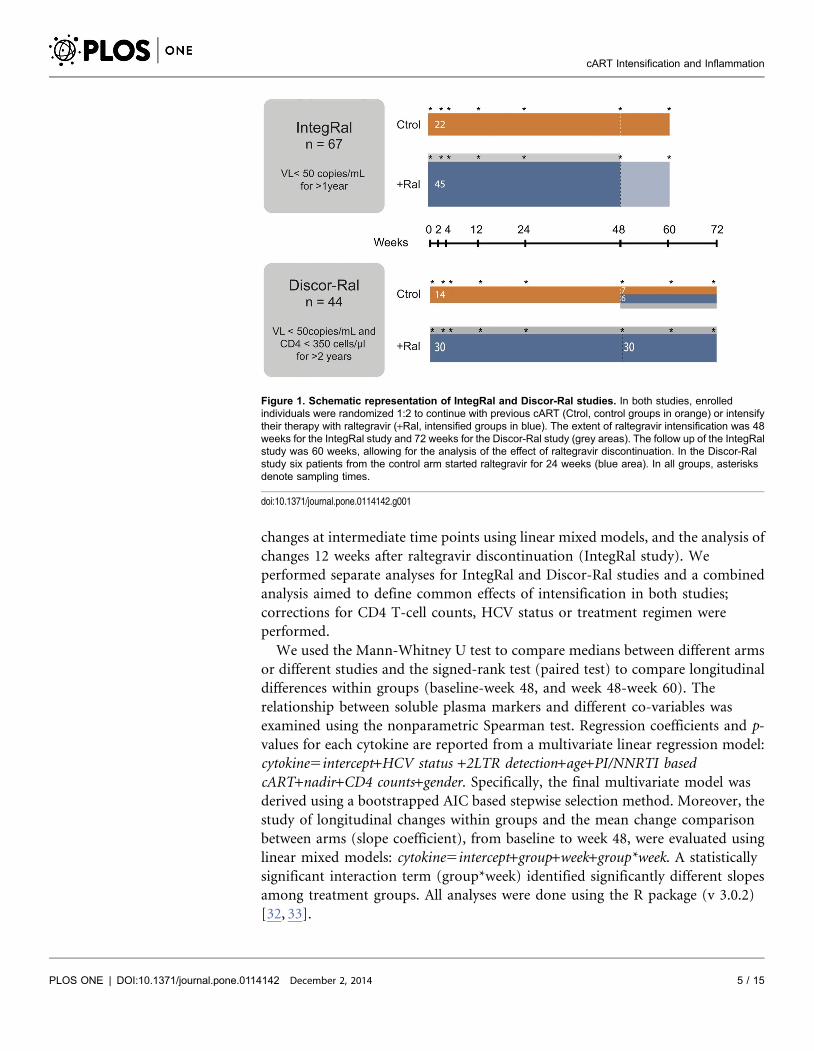
Plasma samples were obtained from EDTA-treated blood, aliquoted and stored at
–80 C at specified time points during the IntegRal and the Discor-Ral studies
(Figure 1). Samples from the IntegRal study cover the full intensification period
of 48 weeks [26] and an additional 12-week period after raltegravir disconti-
nuation, to assess the stability of the effect of the drug [29]. Samples from the
Discor-Ral study included longer intensification periods (up to 60 weeks), but
lack additional samples after raltegravir discontinuation [31]. Inclusion criteria
were similar for both studies, except that the IntegRal study had no enrollment
restriction in terms of CD4 T-cell counts [26], while the Discor-Ral study was
restricted to patients with CD4 T-cell counts below 350 cells/ml during the
previous two years [30, 31]. In both studies, HIV-1-infected subjects were eligible
if they were 18 years of age or older, received a cART regimen composed of two
nucleos(t)ide reverse transcriptase inhibitors (NRTIs), and a protease inhibitor
(PI) or a non-NRTI (NNRTI), and were naive to integrase inhibitors. Their
plasma HIV-1 RNA levels had to be below 50 copies/mL at baseline and during at
least the previous year for the IntegRal or two years in the Discor-Ral study with
more than 4 determinations. In both studies, subjects were randomly assigned 2:1
to add raltegravir (400 mg twice daily) or continue their cART regimen.
Quantification of soluble markers
Frozen plasma samples were thawed and assayed for the levels of different
cytokines and inflammation mediators using Luminex technology. Plasma
samples were analyzed (dilution J) using a Bio-Plex Pro Human Cytokine panel
(BioRad, Hercules, CA) that included the determination of the following human
cytokines: MIP-1b, IP-10, TRAIL, TNF-a, IFN-c, IFN-a, G-CSF, GM-CSF, MCP-
1, IL-1b, IL-2, IL-4, IL-5, IL-6, IL-7, IL-8 IL-10, IL-12, IL-13, IL-15 and IL-17. For
the determination of soluble VCAM-1 (sVCAM-1) and soluble ICAM-1 (sICAM-
1) plasma samples were diluted 1/200 and tested using a BioPlex pro human
cytokine 2-plex also from BioRad. Plasma levels of D-dimer were analyzed using
the HemosIL D-Dimer HS 500 quantitative kit in an ACL TOP equipment (both
from Instrumentation Laboratory, Bedford, MA). Plasma levels of soluble CD14
(sCD14) were analyzed as previously described [26, 30] using a commercial ELISA
kit (Diaclone, Besancon, France).
Statistical analysis
Correlation analysis of soluble plasma markers with immune activation, CD4 T-
cell counts and other variables at baseline was performed; however, the primary
endpoint was the assessment of changes of soluble plasma biomarkers at week 48
in raltegravir intensified patients. Secondary endpoints were the analysis of
cART Intensification and Inflammation
PLOS ONE | DOI:10.1371/journal.pone.0114142 December 2, 2014 4 / 15
changes at intermediate time points using linear mixed models, and the analysis of
changes 12 weeks after raltegravir discontinuation (IntegRal study). We
performed separate analyses for IntegRal and Discor-Ral studies and a combined
analysis aimed to define common effects of intensification in both studies;
corrections for CD4 T-cell counts, HCV status or treatment regimen were
performed.
We used the Mann-Whitney U test to compare medians between different arms
or different studies and the signed-rank test (paired test) to compare longitudinal
differences within groups (baseline-week 48, and week 48-week 60). The
relationship between soluble plasma markers and different co-variables was
examined using the nonparametric Spearman test. Regression coefficients and p-
values for each cytokine are reported from a multivariate linear regression model:
cytokine5intercept+HCV status +2LTR detection+age+PI/NNRTI based
cART+nadir+CD4 counts+gender. Specifically, the final multivariate model was
derived using a bootstrapped AIC based stepwise selection method. Moreover, the
study of longitudinal changes within groups and the mean change comparison
between arms (slope coefficient), from baseline to week 48, were evaluated using
linear mixed models: cytokine5intercept+group+week+group*week. A statistically
significant interaction term (group*week) identified significantly different slopes
among treatment groups. All analyses were done using the R package (v 3.0.2)
[32, 33].
Figure 1. Schematic representation of IntegRal and Discor-Ral studies. In both studies, enrolledindividuals were randomized 1:2 to continue with previous cART (Ctrol, control groups in orange) or intensifytheir therapy with raltegravir (+Ral, intensified groups in blue). The extent of raltegravir intensification was 48weeks for the IntegRal study and 72 weeks for the Discor-Ral study (grey areas). The follow up of the IntegRalstudy was 60 weeks, allowing for the analysis of the effect of raltegravir discontinuation. In the Discor-Ralstudy six patients from the control arm started raltegravir for 24 weeks (blue area). In all groups, asterisksdenote sampling times.
doi:10.1371/journal.pone.0114142.g001
cART Intensification and Inflammation
PLOS ONE | DOI:10.1371/journal.pone.0114142 December 2, 2014 5 / 15
Results
Baseline characteristics of patients enrolled in the IntegRal and
Discor-Ral studies
The individuals enrolled in the IntegRal and Discor-Ral studies are described in
Table 1. No major differences were observed at baseline among control and
intensified groups in each study, except for the previously reported higher
prevalence of hepatitis C virus (HCV) infection in the control group of the
Discor-Ral study [30, 31]. As expected, participants in the Discor-Ral study had
lower nadir and baseline CD4 T-cell counts than participants in the IntegRal
study, but also were significantly older, were infected longer and had a higher
percentage of PI-based regimens (Table 1).
All plasma markers examined were detectable in most samples, except for IL-2,
IL-15 and IFN-a, which were undetectable in.80% of plasmas tested, hampering
a proper analysis of these cytokines. A comparison of detectable soluble plasma
markers among control and intensified groups in each study at baseline showed
no major differences (data not shown). However, when the IntegRal and Discor-
Ral studies were compared at baseline, significantly higher levels of most markers
were noticed in the latter study (Figure S1). Since several factors could account for
these differences (including lower CD4 T-cell counts and cART composition), we
analyzed the association of the levels of soluble plasma markers with
demographic, immunological and virological factors (Figure 2). Univariate
analysis showed some relationship of soluble markers with age, the detection of 2-
LTR circles during intensification and with HCV co-infection, while inflammatory
status appeared to be more related to sex, cART composition (only when PI-based
vs NNRTI-based regimens were compared), nadir and current CD4 T-cells values.
A multivariate analysis maintained strong associations between HCV infection
and levels of IP-10, sICAM-1 and sVCAM-1, between age and sCD14 and an
inverse association between CD4 T-cell counts and IL-12 (Figure 2, red boxes).
Moreover, the presence of 2-LTR circles, the administration of PI-containing
regimens, CD4 T-cell counts, the CD4 nadir, and age were also independently
associated with several inflammatory markers (Figure 2, orange boxes). However,
while markers of inflammation showed positive and negative associations with the
detection of 2-LTR circles, a more consistent scenario was observed for other
parameters: higher plasma levels were identified in patients on a PI-based cART
(positive correlations) and in individuals with low CD4 T-cell counts or with low
nadir CD4 T cell values (negative correlations). Interestingly, sCD14 was the
marker with the highest number of significant associations: 2LTR detection, age
and nadir CD4 T-cell counts.
Effect of raltegravir intensification
Longitudinal analyses of soluble plasma markers were performed by comparing
baseline and week 48 data and by fitting linear mixed models that included
intermediate time points (Figure 1), as reported for the evolution of CD4 T cells
cART Intensification and Inflammation
PLOS ONE | DOI:10.1371/journal.pone.0114142 December 2, 2014 6 / 15

Table 1. Baseline characteristics of the control and raltegravir-intensified individuals.
IntegRal Discor-Ral P-value
Control Intensified P-value Control Intensified P-value Between
n522 n545 Between n514 n530 Between Studies b
Groups a Groups a
Age, years, Median [IQR] 45 [37–50] 44 [41–49] 0.569 48 [42–51] 45 [44–53] 0.221 0.007
Females n (%) 6 (27.3) 6 (9.0) 0.187 3 (13.3) 4 (14.3) 0.932 1
Hepatitis C co-infection, n (%) 5 (22.7) 13 (28.1) 0.810 7 (50.0) 6 (20.0) 0.005 0.830
PI-based ART at Baseline, n (%) 8 (36.4) 14 (31.1) 0.878 8 (57.1) 18 (60.0) 0.878 0.010
Time from HIV-1 diagnosis,years, Median [IQR]
10 [5–15] 11 [8–17] 0.795 15 [5–20] 14 [7–21] 0.678 0.020
Time with suppressive (VL,50)ART, years, Median [IQR]
5 [3–8] 7 [3–7] 0.311 6 [4–10] 6 [4–9] 0.868 0.070
CD4 T cell at baseline,(cell/ml), Median [IQR]
503[371–600]
530[434–678]
0.333 242[188–292]
253[208–301]
0.668 ,0.0001
Nadir CD4 T-cell count,(cell/ml), Median [IQR]
84[41–254]
251[85–405]
0.060 67[14–108]
90[24–117]
0.435 ,0.0001
PI, protease inhibitors; ART, antiretroviral treatment; VL, plasma viral load (HIV-1 RNA copies/ml);a p-value between groups: Mann-Whitney U test,b p-value of the comparison of patients enrolled in the IntegRal (n567) and DIscor-Ral (n544) studies: Mann-Whitney U test.
doi:10.1371/journal.pone.0114142.t001
Figure 2. Analysis of baseline levels of soluble plasma markers. Heat map of the association of baseline levels of the different soluble plasma markersanalyzed with the following parameters: HCV co-infection (HCV column), presence of 2-LTR during the study period (2-LTR column), the presence of PIs onthe cART regimen (PI column, PI51, NNRTI50), age, Nadir CD4 T-cell counts (nadir column), gender (male column, male51, female50) and CD4 T-cellcounts at study baseline (CD4 columns). Left part shows results from a univariate analysis (spearman test), while right side data correspond to a multivariateanalysis carried out using the AIC-based stepwise procedure. In all cases, color codes are as follow: no color means p-value.0.1, yellow 0.1.p-value.0.05; orange 0.05.p-value.0.01 and red p-value,0.01. Upward arrowheads (D) indicate positive correlations while downward arrowheads indicatenegative correlations.
doi:10.1371/journal.pone.0114142.g002
cART Intensification and Inflammation
PLOS ONE | DOI:10.1371/journal.pone.0114142 December 2, 2014 7 / 15

or immune activation markers [26]. The direct comparison of baseline and week
48 levels of plasma soluble markers showed minimal changes in the IntegRal
study. Only D-dimer, G-CSF, IL-6 and TRAIL showed significant decreases in the
intensified group that were not observed in control individuals (Figure 3). In
contrast, the Discor-Ral study showed a more pronounced effect of raltegravir
intensification upon cytokines including IFN-c, IL-13, IL-1b, IL-4, IL-5, IL-7 and
IP-10, probably due to higher baseline values. Since changes were not fully
consistent in both studies, we explored potential common effects of raltegravir by
performing a combined analysis of both studies. This combined analysis showed
specific changes induced by raltegravir in D-dimer, IFN-c and TRAIL in
intensified, but not in control individuals, with trends for IL-4, IL-5, IL-8 and IL-
13. A more powerful analysis using linear mixed models that included all
longitudinal data was also applied (Figure S2). This approach detected significant
decreases of IP-10, G-CSF, GM-CSF, IFN-c, IL-1b, IL-4, IL-5, IL-7 and IL-8 but
failed to show significant differences among slopes calculated in control and
intensified groups for these cytokines (Figure 3, right columns). A significant
increase of sICAM-1, was seen in both the raltegravir and control groups
(Figure 3). Similar results were observed when analyses were performed including
corrections for CD4 T-cell counts, HCV status or treatment regimen (data not
shown). Analysis of plasma markers 12 weeks after raltegravir discontinuation in
the IntegRal study showed no statistically significant changes compared to week
48 values in any marker.
Association of changes in immune activation and soluble markers
We previously reported that raltegravir intensification of treated subjects with
suppressed viremia induced a specific decrease in markers of immunological
activation in CD8 T cells, particularly for CD38 [26, 30]. Thus, we explored in the
current study whether these changes were associated with soluble markers of
inflammation. In this analysis, no significant association between CD8 T-cell
activation, as measured by CD38 expression, and inflammatory markers were
observed. However, a trend for association with the levels of D-dimer (p-
value50.09) was seen, which was stronger in the IntegRal study (p-value50.07,
data not shown).
To better understand this partial association, we have classified individuals
undergoing treatment intensification according to the detection of 2-LTR circles
with raltegravir intensification or to the presence of a PI in their cART regimen,
which has been also related to the detection of 2-LTR circles [24, 25]. No
significant changes in plasma levels of D-dimer were observed when these
individuals were grouped according to the detection of 2-LTR circles (data not
shown). However, a significant decrease was observed in patients treated with a
PI-based regimen in the IntegRal study (p-value50.045). Although a similar
comparison in the Discor-Ral study did not achieve statistical significance, the
combined analysis of both studies confirmed a significant effect of raltegravir on
the levels of D-dimer in PI-treated patients (p-value50.040), that was not
cART Intensification and Inflammation
PLOS ONE | DOI:10.1371/journal.pone.0114142 December 2, 2014 8 / 15

observed in raltegravir intensified individuals on NNRTI therapy or in control
individuals irrespective of their cART regimen (Figure 4). Consistent with the
small changes in inflammatory markers induced by raltegravir intensification, no
major increase in inflammation was noticed after raltegravir discontinuation (data
not shown), as reported for immune activation in the IntegRal study [29].
Discussion
The impact of raltegravir intensification of suppressive cART regimens on soluble
plasma markers might provide new clues regarding the contribution of residual
viral replication to the subclinical inflammatory status of treated HIV-1 infected
individuals. Our analysis of two separate studies (IntegRal and Discor-Ral) points
Figure 3. Longitudinal analysis of soluble plasma markers. Left part shows the heat map of the p-values obtained by comparing the levels of plasmasoluble markers at baseline and week 48 in the IntegRal and Discor-Ral studies or in a global analysis of both studies. P-values are given for the control(Ctrol) and intensified (+ Ral) groups as indicated. Right part shows the results from a linear mixed model analysis showing p-values for slope (change ofevery marker per week) for control and intensified groups and the interaction slope/group that indicates the existence of significant difference among groups.As in Figure 2, color codes are as follow: no color means p-value.0.1, yellow 0.1.p-value.0.05; orange 0.05.p-value.0.01 and red p-value,0.01.Upward arrowheads (D) indicate positive correlations while downward arrowheads indicate negative correlations.
doi:10.1371/journal.pone.0114142.g003
cART Intensification and Inflammation
PLOS ONE | DOI:10.1371/journal.pone.0114142 December 2, 2014 9 / 15

to a poor association between plasma inflammatory markers and the detection of
residual viral replication (assessed by 2-LTR circles) in treated individuals with
chronic HIV infection. Instead, we have identified a complex but strong
relationship between these markers and other immunological and virological
parameters, including CD4 T-cell restoration.
Although we observed a significant association between several cytokines and
the number of circulating CD4 T cells, this observation could be influenced by the
higher prevalence of PI-based regimens in individuals with low CD4 T-cell counts,
a phenomenon previously observed in different cohorts [14]. A multivariate
approach performed to identify independent associations confirmed that some
plasma markers (including IL-5, IL-7, IL-12, IL-13, TRAIL or IP-10) were
independently associated with the number of CD4 T cells. In addition, this
analysis also revealed other factors influencing inflammation. Among them, Nadir
CD4 T-cell values that showed independent association with sCD14 and IL-17
levels. And the detection of 2-LTR circles and baseline that showed a more
Figure 4. Longitudinal changes in plasma level of D-dimer according to cART regimen. Individuals from both the IntegRal and Discor-Ral studies wereclassified according to their cART regimen, PI- or NNRTI-based. The level of D-dimer in plasma at baseline and after 48 weeks of study was compared. Thefigure shows changes for Control individuals on PI-based regimens (A, n515), control individuals on NNRTI-based regimens (B, n517), raltegravir-intensified individuals on PI-based regimens (C, n527) and raltegravir-intensified individuals on NNRTI based regimens (D, n533). Comparisons wereperformed using the signed-rank test (paired test) and p-values are shown for each group.
doi:10.1371/journal.pone.0114142.g004
cART Intensification and Inflammation
PLOS ONE | DOI:10.1371/journal.pone.0114142 December 2, 2014 10 / 15
complex association with the levels of inflammation. The interpretation of these
data is probably limited by the biased sample selection; namely, a high
representation of individuals with low Nadir CD4 T-cell counts (in the Discor-Ral
but also in the IntegRal study) and a low number of patients whose mononuclear
cells had 2-LTR circles, especially in the Discor-Ral study. New technologies such
as droplet digital PCR [34], may help to overcome technical limitations to detect
2-LTR circles and to better identify individuals with residual viral replication [25].
However, the complex relationship of inflammatory markers with several
immunological and virological variables may complicate their use as predictors
for residual HIV replication under cART.
Indeed, our baseline analysis confirmed the strong association of sCD14 with
age [35], the link of HCV co-infection with three soluble markers (IP-10, sICAM-
1 and sVCAM-1) [36], and identified a striking association of several cytokines,
TRAIL and TNF-a among other, with the cART regimen (PI- or NNRTI-based).
In all cases, this latter association revealed higher levels of inflammation in
individuals treated with PI-based regimens, an observation that is consistent with
previously reported data [11, 18]. However, the mechanisms leading to this
increased inflammation are unclear. PI-treated individuals are known to display
altered lipid metabolism, resulting in higher levels of plasma lipids and higher
cholesterol accumulation in macrophages that may result in higher levels of
inflammation and endothelial dysfunction markers in plasma [37–39]. In fact,
switching PI-based to raltegravir-based cART results in specific reductions of
some of these markers [37]. In addition to metabolic interference of PIs, an
alternate explanation for the increased inflammation in these patients can be
related to the poor tissue penetration of these compounds that may favor low level
viral replication [40, 41]. This hypothesis is supported by the higher prevalence of
the detection of 2-LTR circles in PI-treated individuals [24, 25], and may also
explain the reduction in inflammation induced by switching PI to raltegravir
treatment [37]. However, this could suffer a clinical bias, as treating physicians
often include PIs in more advanced or immuno-discordant patients.
In our longitudinal analysis raltegravir was added to PI- or NNRTI-based cART
and therefore, no metabolic benefits are expected. Despite this, some significant
changes were observed in intensified individuals in the Discor-Ral study, which
showed higher baseline levels of inflammatory markers. However, a combined
analysis of the Discor-Ral and IntegRal studies failed to identify a general decrease
in inflammatory markers associated with raltegravir intensification. In fact, several
cytokines showed decreasing trends over time in both control and intensified
groups. The observation that most of decreasing cytokines (namely IP-10, TRAIL
or IL-7) are also associated with lower CD4 T-cell counts suggests that the
observed decrease could be the consequence of slow but significant increases in
CD4 T-cell counts reported in both the IntegRal and Discor-Ral studies [26, 31].
However, raltegravir induced a significant reduction of the coagulation marker D-
dimer that was exclusively observed in PI-treated individuals. D-dimer levels
reflect HIV-induced perturbations of the coagulation cascade, contributing to
thrombus formation and cardiovascular morbidity [42]. This observation is
cART Intensification and Inflammation
PLOS ONE | DOI:10.1371/journal.pone.0114142 December 2, 2014 11 / 15

consistent with data reported by Hatano et al. [25] and suggests a specific
beneficial effect of raltegravir on PI-treated individuals regarding cardiovascular
morbidities. Since no drug switch exists in our study, and the effect is not general
to all intensified individuals, it seems to be the consequence of a better in vivo
antiviral profile of raltegravir rather than a non-specific anti-inflammatory
activity of this drug. Consistent with this specific effect, no changes in raltegravir-
intensified patients were observed for other inflammatory markers such as IL-6,
whose levels have been recently shown to predict non-AIDS-defining morbid
events during suppressive HAART [43]. Finally, the reduction in D-dimer levels
induced by raltegravir was more evident in individuals with high CD4 T-cell
counts (IntegRal study) than in patients with CD4 T-cell counts below 350
(Discor-Ral study), although those were more likely on PI-based regimens. This
apparent paradox could be related to the low level of 2-LTR circle detection [30].
Alternatively, the profound immunological abnormalities found in patients with
low CD4 T-cell counts that are not reversed by raltegravir [12] [31] may sustain
D-dimer levels in these patients.
In summary, our data suggest that soluble inflammatory markers show a
complex relationship with several factors (age, co-infections, antiretroviral
regimen and immune recovery) that may render the use of these markers to
identify individuals with residual viral replication under cART poorly reliable. In
fact, the detection of 2-LTR circles is poorly related to inflammation, and
raltegravir intensification has only minor effects on inflammatory markers. These
observations confirm the minimal clinical effect of intensification in terms of
standard follow up (CD4 T-cell counts), but highlight the substantial role of cART
composition in inflammation and the detection of 2-LTR circles, emphasizing the
need for cART regimens with optimal effects on inflammatory markers that may
reduce the risk of clinical events in HIV-1 infected individuals.
Supporting Information
Figure S1. Baseline plasma levels of soluble inflammatory markers. The levels of
the indicated soluble markers were assessed prior to raltegravir intensification in
patients recruited in the IntegRal (n567, blue symbols) or the Discor-Ral (n544,
red symbols) studies. Control and intensified individuals were grouped for this
baseline analysis.
doi:10.1371/journal.pone.0114142.s001 (TIFF)
Figure S2. Linear models for changes in plasma markers. Data from the Discor-
Ral and IntegRal studies were pooled and analyzed as described in methods (linear
mixed models). Longitudinal evolution of CD4 T-cell counts and immune
activation (CD38+HLA-DR+ CD8 T cells) were included for reference (bottom
right graphs).
doi:10.1371/journal.pone.0114142.s002 (TIFF)
cART Intensification and Inflammation
PLOS ONE | DOI:10.1371/journal.pone.0114142 December 2, 2014 12 / 15
Acknowledgments
We thank Rafaela Ayen, Eulalia Grau, Elisabeth Garcia from IrsiCaixa and Lidia
Ruiz from Hematology Department of HUGTiP for technical assistance and
sample processing. We are grateful to BIOKIT SA and IZASA SA for support in D-
dimer determination. We also thank Adriana Capdevila from Col?legi Sant Miquel
dels Sants (Vic, Spain) for preliminary statistical analysis. We finally thank
patients and physicians for participating this study.
Author ContributionsConceived and designed the experiments: MS JMG JML PD JMP EN JB BC.
Performed the experiments: MM MCP MJB SM EO. Analyzed the data: MM DO.
Wrote the paper: MM DDR JB.
References
1. Brenchley JM, Price DA, Schacker TW, Asher TE, Silvestri G, et al. (2006) Microbial translocation isa cause of systemic immune activation in chronic HIV infection. Nat Med 12: 1365–1371.
2. Harris LD, Tabb B, Sodora DL, Paiardini M, Klatt NR, et al. (2010) Downregulation of robust acutetype I interferon responses distinguishes nonpathogenic simian immunodeficiency virus (SIV) infection ofnatural hosts from pathogenic SIV infection of rhesus macaques. J Virol 84: 7886–7891.
3. Rotger M, Dalmau J, Rauch A, McLaren P, Bosinger S, et al. (2011) Comparative transcriptomics ofextreme phenotypes of human HIV-1 infection and SIV infection in sooty mangabey and rhesusmacaque. J Clin Invest 121: 2391–2400.
4. Catalfamo M, Di Mascio M, Hu Z, Srinivasula S, Thaker V, et al. (2008) HIV infection-associatedimmune activation occurs by two distinct pathways that differentially affect CD4 and CD8 T cells. ProcNatl Acad Sci U S A 105: 19851–19856.
5. Hatano H, Hayes TL, Dahl V, Sinclair E, Lee T-H, et al. (2011) A Randomized, Controlled Trial ofRaltegravir Intensification in Antiretroviral-treated, HIV-infected Patients with a Suboptimal CD4+ T CellResponse. J Infect Dis 203: 960–968.
6. Vujkovic-Cvijin I, Dunham RM, Iwai S, Maher MC, Albright RG, et al. (2013) Dysbiosis of the gutmicrobiota is associated with hiv disease progression and tryptophan catabolism. Sci Transl Med 5:193ra91.
7. Lederman MM, Calabrese L, Funderburg NT, Clagett B, Medvik K, et al. (2011) Immunologic failuredespite suppressive antiretroviral therapy is related to activation and turnover of memory CD4 cells.J Infect Dis 204: 1217–1226.
8. Appay V, van Lier RAW, Sallusto F, Roederer M (2008) Phenotype and function of human Tlymphocyte subsets: consensus and issues. Cytometry A 73: 975–983.
9. Kuller LH, Tracy R, Belloso W, De Wit S, Drummond F, et al. (2008) Inflammatory and coagulationbiomarkers and mortality in patients with HIV infection. PLoS Med 5: e203.
10. Strategies for Management of Antiretroviral Therapy (SMART) Study Group, El-Sadr WM,Lundgren JD, Neaton JD, Gordin F, et al. (2006) CD4+ count-guided interruption of antiretroviraltreatment. N Engl J Med 355: 2283–2296.
11. Cassol E, Misra V, Holman A, Kamat A, Morgello S, et al. (2013) Plasma metabolomics identifies lipidabnormalities linked to markers of inflammation, microbial translocation, and hepatic function in HIVpatients receiving protease inhibitors. BMC Infectious Diseases 13: 203.
12. Massanella M, Negredo E, Clotet B, Blanco J (2013) Immunodiscordant responses to HAART -mechanisms and consequences. Expert Rev Clin Immunol 9: 1135–1149.
cART Intensification and Inflammation
PLOS ONE | DOI:10.1371/journal.pone.0114142 December 2, 2014 13 / 15
13. Massanella M, Negredo E, Perez-Alvarez N, Puig J, Ruiz-Hernandez R, et al. (2010) CD4 T-cellhyperactivation and susceptibility to cell death determine poor CD4 T-cell recovery during suppressiveHAART. AIDS 24: 959–968.
14. Negredo E, Massanella M, Puig J, Perez-Alvarez N, Gallego-Escuredo JM, et al. (2010) Nadir CD4 Tcell count as predictor and high CD4 T cell intrinsic apoptosis as final mechanism of poor CD4 T cellrecovery in virologically suppressed HIV-infected patients: clinical implications. Clin Infect Dis 50: 1300–1308.
15. Massanella M, Curriu M, Carrillo J, Gomez E, Puig J, et al. (2013) Assessing main death pathways inT lymphocytes from HIV infected individuals. Cytometry A 83: 648–658.
16. Sandler NG, Wand H, Roque A, Law M, Nason MC, et al. (2011) Plasma levels of soluble CD14independently predict mortality in HIV infection. J Infect Dis 203: 780–790.
17. Deeks SG (2011) HIV infection, inflammation, immunosenescence, and aging. Annu Rev Med 62: 141–155.
18. Madden E, Lee G, Kotler DP, Wanke C, Lewis CE, et al. (2008) Association of antiretroviral therapywith fibrinogen levels in HIV-infection. AIDS 22: 707–715.
19. Boulware DR, Hullsiek KH, Puronen CE, Rupert A, Baker JV, et al. (2011) Higher levels of CRP, D-dimer, IL-6, and hyaluronic acid before initiation of antiretroviral therapy (ART) are associated withincreased risk of AIDS or death. J Infect Dis 203: 1637–1646.
20. Unemori P, Leslie KS, Hunt PW, Sinclair E, Epling L, et al. (2013) Immunosenescence is associatedwith presence of Kaposi’s sarcoma in antiretroviral treated HIV infection. AIDS 27: 1735–1742.
21. Gazzola L, Tincati C, Bellistrı GM, Monforte A, Marchetti G (2009) The absence of CD4+ Tcell countrecovery despite receipt of virologically suppressive highly active antiretroviral therapy: clinical risk,immunological gaps, and therapeutic options. Clin Infect Dis 48: 328–337.
22. Massanella M, Martinez-Picado J, Blanco J (2013) Attacking the HIV Reservoir from the Immune andViral Perspective. Curr HIV/AIDS Rep 10: 33–41.
23. Deeks SG, Autran B, Berkhout B, Benkirane M, Cairns S, et al. (2012) Towards an HIV cure: a globalscientific strategy. Nat Rev Immunol 12: 607–614.
24. Buzon MJ, Massanella M, Llibre JM, Esteve A, Dahl V, et al. (2010) HIV-1 replication and immunedynamics are affected by raltegravir intensification of HAART-suppressed subjects. Nat Med 16: 460–465.
25. Hatano H, Strain MC, Scherzer R, Bacchetti P, Wentworth D, et al. (2013) Increase in 2-long terminalrepeat circles and decrease in D-dimer after raltegravir intensification in patients with treated HIVinfection: a randomized, placebo-controlled trial. J Infect Dis 208: 1436–1442.
26. Llibre JM, Buzon MJ, Massanella M, Esteve A, Dahl V, et al. (2012) Treatment intensification withraltegravir in subjects with sustained HIV-1 viraemia suppression: a randomized 48-week study. AntivirTher 17: 355–364.
27. Gandhi RT, Zheng L, Bosch RJ, Chan ES, Margolis DM, et al. (2010) The effect of raltegravirintensification on low-level residual viremia in HIV-infected patients on antiretroviral therapy: arandomized controlled trial. PLoS Med 7: e1000321.
28. Byakwaga H, Kelly M, Purcell DFJ, French MA, Amin J, et al. (2011) Intensification of antiretroviraltherapy with raltegravir or addition of hyperimmune bovine colostrum in HIV-infected patients withsuboptimal CD4+ T-cell response: a randomized controlled trial. J Infect Dis 204: 1532–1540.
29. Massanella M, Esteve A, Buzon MJ, Llibre JM, Puertas MC, et al. (2013) Dynamics of CD8 T-CellActivation after Discontinuation of HIV Treatment Intensification. J Acquir Immune Defic Syndr 63: 152–160.
30. Massanella M, Negredo E, Puig J, Puertas MC, Buzon MJ, et al. (2012) Raltegravir intensificationshows differing effects on CD8 and CD4 T cells in HIV infected HAART-supressed individuals with poorCD4 T-cell recovery. AIDS 26: 2285–2293.
31. Negredo E, Massanella M, Puertas MC, Buzon MJ, Puig J, et al. (2013) Early but limited effects ofraltegravir intensification on CD4 T cell reconstitution in HIV-infected patients with an immunodiscordantresponse to antiretroviral therapy. J Antimicrob Chemother 68: 2358–2362.
cART Intensification and Inflammation
PLOS ONE | DOI:10.1371/journal.pone.0114142 December 2, 2014 14 / 15
32. bates D, Maechler M, Bolker B (2012) lme4: Linear mixed-effects models using S4 classes. R packageversion 0.999999-0. Available: http://CRAN.R-project.org/package5lme4 and http://CRAN.R-project.org/package5lme4.
33. R Core Team (2012) R: A language and environment for statistical computing. R Foundation forStatistical Computing, Vienna, Austria. ISBN 3-900051-07-0. Available: http://www.R-project.org/ andhttp://www.R-project.org/.
34. Strain MC, Lada SM, Luong T, Rought SE, Gianella S, et al. (2013) Highly precise measurement ofHIV DNA by droplet digital PCR. PLoS One 8: e55943.
35. Reiner AP, Lange EM, Jenny NS, Chaves PHM, Ellis J, et al. (2013) Soluble CD14: genomewideassociation analysis and relationship to cardiovascular risk and mortality in older adults. ArteriosclerThromb Vasc Biol 33: 158–164.
36. Roe B, Coughlan S, Hassan J, Grogan A, Farrell G, et al. (2007) Elevated serum levels of interferon-gamma -inducible protein-10 in patients coinfected with hepatitis C virus and HIV. J Infect Dis 196:1053–1057.
37. Martınez E, D’Albuquerque PM, Llibre JM, Gutierrez F, Podzamczer D, et al. (2012) Changes incardiovascular biomarkers in HIV-infected patients switching from ritonavir-boosted protease inhibitors toraltegravir. AIDS 26: 2315–2326.
38. Wu X, Sun L, Zha W, Studer E, Gurley E, et al. (2010) HIV protease inhibitors induce endoplasmicreticulum stress and disrupt barrier integrity in intestinal epithelial cells. Gastroenterology 138: 197–209.
39. Reingold J, Wanke C, Kotler D, Lewis C, Tracy R, et al. (2008) Association of HIV infection and HIV/HCV coinfection with C-reactive protein levels: the fat redistribution and metabolic change in HIVinfection (FRAM) study. J Acquir Immune Defic Syndr 48: 142–148.
40. Fletcher CV, Staskus K, Wietgrefe SW, Rothenberger M, Reilly C, et al. (2014) Persistent HIV-1replication is associated with lower antiretroviral drug concentrations in lymphatic tissues. Proc NatlAcad Sci U S A 111: 2307–2312.
41. Letendre SL, Capparelli EV, Ellis RJ, McCutchan JA (2000) Indinavir population pharmacokinetics inplasma and cerebrospinal fluid. The HIV Neurobehavioral Research Center Group. Antimicrob AgentsChemother 44: 2173–2175.
42. Funderburg NT, Mayne E, Sieg SF, Asaad R, Jiang W, et al. (2010) Increased tissue factor expressionon circulating monocytes in chronic HIV infection: relationship to in vivo coagulation and immuneactivation. Blood 115: 161–167.
43. Tenorio AR, Zheng Y, Bosch RJ, Krishnan S, Rodriguez B, et al. (2014) Soluble markers ofinflammation and coagulation, but not T-cell activation, are predictors of non-AIDS-defining morbidevents during suppressive antiretroviral treatment. J Infect Dis 210: 1248–1259.
cART Intensification and Inflammation
PLOS ONE | DOI:10.1371/journal.pone.0114142 December 2, 2014 15 / 15