Differences in Antibody Responses Between Trivalent Inactivated Influenza Vaccine and Live...
10
MAJOR ARTICLE Differences in Antibody Responses Between Trivalent Inactivated Influenza Vaccine and Live Attenuated Influenza Vaccine Correlate With the Kinetics and Magnitude of Interferon Signaling in Children Raquel G. Cao, 1 Nicolas M. Suarez, 1 Gerlinde Obermoser, 4 Santiago M. C. Lopez, 1 Emilio Flano, 1 Sara E. Mertz, 1 Randy A. Albrecht, 5,6 Adolfo García-Sastre, 5,6,7 Asuncion Mejias, 1,2,3 Hui Xu, 4 Huanying Qin, 4 Derek Blankenship, 4 Karolina Palucka, 4 Virginia Pascual, 4 and Octavio Ramilo 1,2,3 1 Center for Vaccines and Immunity, The Research Institute, and 2 Department of Pediatrics, Division of Infectious Diseases, Nationwide Children’s Hospital; and 3 The Ohio State University College of Medicine, Columbus, Ohio; 4 Baylor Institute for Immunology Research, Baylor Research Institute, Dallas, Texas; and 5 Department of Microbiology, 6 Global Health and Emerging Pathogens Institute, and 7 Department of Medicine, Division of Infectious Diseases, Icahn School of Medicine at Mount Sinai, New York, New York Background. Live attenuated influenza vaccine (LAIV) and trivalent inactivated influenza vaccine (TIV) are effective for prevention of influenza virus infection in children, but the mechanisms associated with protection are not well defined. Methods. We analyzed the differences in B-cell responses and transcriptional profiles in children aged 6 months to 14 years immunized with these 2 vaccines. Results. LAIV elicited a significant increase in naive, memory, and transitional B cells on day 30 after vaccina- tion, whereas TIV elicited an increased number of plasmablasts on day 7. Antibody titers against the 3 vaccine strains (H1N1, H3N2, and B) were significantly higher in the TIV group and correlated with number of antibody-secreting cells. Both vaccines induced overexpression of interferon (IFN)–signaling genes but with different kinetics. TIV in- duced expression of IFN genes on day 1 after vaccination in all age groups, and LAIV induced expression of IFN genes on day 7 after vaccination but only in children <5 years old. IFN-related genes overexpressed in both vaccinated groups correlated with H3N2 antibody titers. Conclusions. These results suggest that LAIV and TIV induced significantly different B-cell responses in vacci- nated children. Early induction of IFN appears to be important for development of antibody responses. Keywords. Influenza vaccine; LAIV; TIV; children; interferon; HI antibodies; neutralizing antibodies. Influenza viruses cause annual epidemics and intermit- tent pandemics worldwide. Studies have demonstrated that in addition to children with underlying conditions, influenza also causes significant morbidity and mortality in healthy children [1–4]. In the United States, influenza vaccination is recommended for all individuals aged ≥6 months [5]. There are 2 major types of influenza vaccines ap- proved for children in United States: trivalent inactivat- ed influenza vaccine (TIV) and live attenuated influenza vaccine (LAIV). Both vaccines are efficacious in reduc- ing influenza virus infection in children [6–9]. Some studies, however, suggest that LAIV has a higher effica- cy than TIV in young children [10–12]. The immune mechanisms by which these vaccines induce immune protection are not well understood. We conducted a prospective study in children immunized with TIV or Received 25 November 2013; accepted 27 January 2014; electronically published 4 February 2014. Presented in part: IDWeek, San Diego, California, 17–21 October 2012. Poster 1514, Abstract 36073. Correspondence: Octavio Ramilo, MD, Division of Pediatric Infectious Diseases and Center for Vaccines and Immunity, The Research Institute at Nationwide Child- ren’s Hospital, The Ohio State University College of Medicine, 700 Children’s Dr, W4021, Columbus, OH 43205 ([email protected]). The Journal of Infectious Diseases 2014;210:224–33 © The Author 2014. Published by Oxford University Press on behalf of the Infectious Diseases Society of America. All rights reserved. For Permissions, please e-mail: [email protected]. DOI: 10.1093/infdis/jiu079 224 • JID 2014:210 (15 July) • Cao et al at Ohio State University Prior Health Sciences Library on July 25, 2014 http://jid.oxfordjournals.org/ Downloaded from
Transcript of Differences in Antibody Responses Between Trivalent Inactivated Influenza Vaccine and Live...
M A J O R A R T I C L E
Differences in Antibody Responses BetweenTrivalent Inactivated Influenza Vaccine and LiveAttenuated Influenza Vaccine Correlate With theKinetics and Magnitude of Interferon Signalingin Children
Raquel G. Cao,1 Nicolas M. Suarez,1 Gerlinde Obermoser,4 Santiago M. C. Lopez,1 Emilio Flano,1 Sara E. Mertz,1
Randy A. Albrecht,5,6 Adolfo García-Sastre,5,6,7 Asuncion Mejias,1,2,3 Hui Xu,4 Huanying Qin,4 Derek Blankenship,4
Karolina Palucka,4 Virginia Pascual,4 and Octavio Ramilo1,2,3
1Center for Vaccines and Immunity, The Research Institute, and 2Department of Pediatrics, Division of Infectious Diseases, Nationwide Children’s Hospital;and 3The Ohio State University College of Medicine, Columbus, Ohio; 4Baylor Institute for Immunology Research, Baylor Research Institute, Dallas, Texas;and 5Department of Microbiology, 6Global Health and Emerging Pathogens Institute, and 7Department of Medicine, Division of Infectious Diseases, IcahnSchool of Medicine at Mount Sinai, New York, New York
Background. Live attenuated influenza vaccine (LAIV) and trivalent inactivated influenza vaccine (TIV) areeffective for prevention of influenza virus infection in children, but the mechanisms associated with protectionare not well defined.
Methods. We analyzed the differences in B-cell responses and transcriptional profiles in children aged 6 monthsto 14 years immunized with these 2 vaccines.
Results. LAIV elicited a significant increase in naive, memory, and transitional B cells on day 30 after vaccina-tion, whereas TIV elicited an increased number of plasmablasts on day 7. Antibody titers against the 3 vaccine strains(H1N1, H3N2, and B) were significantly higher in the TIV group and correlated with number of antibody-secretingcells. Both vaccines induced overexpression of interferon (IFN)–signaling genes but with different kinetics. TIV in-duced expression of IFN genes on day 1 after vaccination in all age groups, and LAIV induced expression of IFNgenes on day 7 after vaccination but only in children <5 years old. IFN-related genes overexpressed in both vaccinatedgroups correlated with H3N2 antibody titers.
Conclusions. These results suggest that LAIV and TIV induced significantly different B-cell responses in vacci-nated children. Early induction of IFN appears to be important for development of antibody responses.
Keywords. Influenza vaccine; LAIV; TIV; children; interferon; HI antibodies; neutralizing antibodies.
Influenza viruses cause annual epidemics and intermit-tent pandemics worldwide. Studies have demonstratedthat in addition to children with underlying conditions,
influenza also causes significant morbidity and mortalityin healthy children [1–4]. In the United States, influenzavaccination is recommended for all individuals aged ≥6months [5].
There are 2 major types of influenza vaccines ap-proved for children in United States: trivalent inactivat-ed influenza vaccine (TIV) and live attenuated influenzavaccine (LAIV). Both vaccines are efficacious in reduc-ing influenza virus infection in children [6–9]. Somestudies, however, suggest that LAIV has a higher effica-cy than TIV in young children [10–12]. The immunemechanisms by which these vaccines induce immuneprotection are not well understood. We conducted aprospective study in children immunized with TIV or
Received 25 November 2013; accepted 27 January 2014; electronically published4 February 2014.
Presented in part: IDWeek, San Diego, California, 17–21 October 2012. Poster1514, Abstract 36073.
Correspondence: Octavio Ramilo, MD, Division of Pediatric Infectious Diseasesand Center for Vaccines and Immunity, The Research Institute at Nationwide Child-ren’s Hospital, The Ohio State University College of Medicine, 700 Children’s Dr,W4021, Columbus, OH 43205 ([email protected]).
The Journal of Infectious Diseases 2014;210:224–33© The Author 2014. Published by Oxford University Press on behalf of the InfectiousDiseases Society of America. All rights reserved. For Permissions, please e-mail:[email protected]: 10.1093/infdis/jiu079
224 • JID 2014:210 (15 July) • Cao et al
at Ohio State U
niversity Prior Health Sciences L
ibrary on July 25, 2014http://jid.oxfordjournals.org/
Dow
nloaded from

LAIV to characterize the differences in (1) B-cell populations byflow cytometry, (2) serum antibody titers by hemagglutinationinhibition (HAI) assay and virus neutralization assay (VNA),and (3) whole-blood transcriptional profiles to determinewhether early changes in expression of certain immune relatedgenes correlated with antibody responses.
MATERIALS AND METHODS
Experimental DesignThis was a prospective cohort of previously healthy childrenaged 6 months to 14 years enrolled from October 2011 to Feb-ruary 2012. Forty children were initially randomly assigned toreceive 1 dose of LAIV (FluMist, MedImmune) or TIV (Flu-zone, Sanofi Pasteur). Three children in the TIV cohort with-drew from the study, so the analyzed study cohort included37 children (LAIV, n = 20; TIV, n = 17). Two exceptions wereapplied to the randomization: 4 children <2 years old and 4 chil-dren with controlled asthma received TIV, in accordance withCenters for Disease Control and Prevention recommendations.One child aged 6 months at enrollment received 2 vaccine doseswith a 1-month interval, since it was his first influenza vaccina-tion. In this child, all immunologic studies were performed onlyafter the initial vaccine dose. All other children had received in-fluenza vaccine during the previous season (ie, 2010–2011), andprecise data on the previous season’s vaccination were collected.Demographic data are presented in Table 1. Exclusion criteria
included chronic conditions, except asthma, immunodeficien-cies, and use of systemic steroids in the previous 2 weeks. Chil-dren with history of fever or respiratory symptoms within 4weeks before enrollment were also excluded.
Blood samples were collected on day 0 before vaccination and1 day, 7 days (range, 6–8 days), and 30 days (range, 27–33 days)after vaccination to measure B cells, antibody responses, andgene expression profiles. This study used a 2011–2012 vaccineformulation containing the following influenza virus strains: A/California/7/2009(H1N1)-like, A/Perth/16/2009(H3N2)-like,and B/Brisbane/60/2008-like. Data on adverse events were col-lected by the investigators at each study visit. The study was ap-proved by the institutional review board at NationwideChildren’s Hospital (IRB09-00262) and Baylor Institute for Im-munology Research (IRB011-221). Written informed consentwas obtained from the parents of all participants.
Flow CytometryPeripheral-whole-blood samples were analyzed with the follow-ing antibody panel to identify the B-cell populations: CD45(Pacific Orange, Invitrogen), CD14 (Alexa Fluor 700), CD20(Pe-Cy5), immunoglobulin D (FITC), CD24 (PE, BD Pharmin-gen), CD19 (ECD, Beckman-Coulter), CD27 (APC-Cy7, BioL-egend), CD38 (Pe-Cy7), and CD138 (APC, BD BioScience).The staining protocol is described elsewhere [13]. Events werecollected on a LSRII instrument (BD Biosciences, San Jose, CA),and analysis was performed using FlowJo software (Treestar,version 9.4.11). Total cell numbers were calculated using theroutine white blood cell counts collected at each time point.
HAI Assay and VNASerum samples were collected at 2 time points, day 0 and day 30after vaccination. The HAI assay was performed as previouslydescribed [14]. The hemagglutination inhibition (HI) titer wasdefined as the reciprocal of the highest dilution of serum thatinhibits red blood cell hemagglutination. VNA was performedas previously described [15]. The viral neutralization (VN)titer was defined as the reciprocal of the highest dilution ofserum that neutralizes 200 plaque-forming units of influenzavirus. Seroconversion was based on the following criteria: a 4-fold increase in antibody titers between the prevaccination andthe convalescent-phase serum samples or an increase of anti-body titers from <10 to ≥40 for the prevaccination and conva-lescent-phase serum samples [16–18].
Microarray Data and Statistical AnalysisBlood samples were collected in Tempus tubes (Applied Biosys-tems, CA) and stored at −20°C. RNA was hybridized into Illu-mina HumanWG-6 V4 beadchips (47 323 probes) and scannedon the Illumina Beadstation 500 [19, 20]. Data are deposited inthe National Center for Biotechnology Information GeneExpression Omnibus (accession number GSE52005).
Table 1. Demographic Data of Enrolled Subjects Who ReceivedLive Attenuated Influenza Vaccine (LAIV) or Trivalent InactivatedInfluenza Vaccine (TIV)
CharacteristicLAIV Group(n = 20)
TIV Group(n = 17) P
Age, y
Mean ± SD 9.89 ± 4.6 8.47 ± 4.98 .24a
Median (IQR) 11.44 (4.2–14.0) 10.94 (3.7–12.9)Group .29b
5–14 15 (75) 10 (58.9)
<5 5 (25) 7 (41.2)Male sex 10 (50) 8 (47.1) .85b
Race .70b
White 16 (80) 13 (76.5)Asian 1 (5) 2 (11.8)
African American 1 (5) 0 (0)
White/AfricanAmerican
2 (1) 2 (11.8)
Non-Hispanic ethnicity 19 (95) 17 (100) .35b
Received influenzavaccine in 2010
19 (95) 16 (94) .9b
Abbreviation: IQR, interquartile range.a Mann–Whitney U test.b χ2 test.
TIV- and LAIV-Associated Ab Responses and IFN • JID 2014:210 (15 July) • 225
at Ohio State U
niversity Prior Health Sciences L
ibrary on July 25, 2014http://jid.oxfordjournals.org/
Dow
nloaded from

Analyses were performed using GeneSpring GX 7.3 software(Agilent Technologies) [21, 22]. Transcripts were first selected ifpresent in >10% of all samples and were then filtered to selectthe most variable probes. We used several analytical tools. First,we used GeneSpring for supervised analysis with all samples(140 samples), using statistical filtering and class comparisonsto identify transcripts differentially expressed between studygroups. The nonparametric Mann–Whitney test for compari-sons across groups was used, with a P < .05.
Second, we performed functional analyses of differentiallyexpressed genes using modular analysis [23]. Gene expressionlevels were compared between each time point after vaccinationand baseline (before vaccination) on a module-by-module basis.Modular transcript content and annotations are available at:http://www.biir.net/public_wikis/module_annotation/V2_Trial_8_Modules.
Third, to confirm the findings from the modular analyses,gene expression values were log2 transformed and analyzedusing a linear mixed model for the LAIV and TIV cohorts sep-arately. Specifically, time was included in the model as a cate-gorical variable, with a spatial power covariance matrix toaccount for correlation because subjects had repeated measure-ments. Each time point was then compared to baseline. JMPGenomics 6.0 software (SAS Institute, Cary, NC) was used forthis analysis. Genes with a P value of <.01 were considered dif-ferentially expressed [24].
Statistical analysis of demographic data was performed usingGraph Pad Prism. Mann–Whitney tests were used for continuousvariables, and χ2 and Fisher exact tests were used for categoricalvariables. Antibody titer correlations were performed using theSpearman nonparametric test on Sigma Plot. Flow cytometry datawere analyzed using the linear mixed model approach describedfor microarray data. The data were log2 transformed, and a Bon-ferroni correction was used to adjust for multiple testing.
RESULTS
Immunization With LAIV and TIV Induce Distinct Changes in BCell PopulationsWe immunized 20 children who received LAIV and 17 childrenwho received TIV (Table 1). Sequential flow cytometry samplesfrom all 4 time points were available for 16 in the LAIV groupand 13 in the TIV group. Fourteen of 37 children (7 from eachgroup) had adverse events after vaccination, all of which wereupper respiratory tract symptoms.
In the LAIV group, we found a significant increase at 30 daysafter vaccination in the absolute numbers of naive, memory,and transitional B cells, compared with baseline (P < .05), butthere were no significant differences in the numbers of plasma-blasts and plasma cells. Children immunized with TIV showeda significant increase in absolute numbers of plasmablasts atday 7 after vaccination (P < .01) but no significant changes
in the numbers of naive, memory, and transitional B cells(Figure 1A–J).
TIV Induces a More Robust Serum Antibody Response ThanLAIVAntibody responses were measured in 34 of 37 subjects enrolled(LAIV group, n = 18; TIV group, n = 16). HI and VN titers foreach of the 3 influenza virus strains contained in both vaccineswere measured in serum samples obtained at days 0 and 30.
TIV induced a significantly greater increase in HI titers thanLAIV for the 3 vaccine strains (P < .01; Figure 1K). TIV eliciteda greater rate of seroconversion (70% for H1N1, 70% for H3N2,and 30% for B) than LAIV (5% for H1N1, 2% for H3N2, and0% for B). Children <5 years old had the highest rate of serocon-version among TIV vaccinees. When we measured the maxi-mum fold-change in HI titers against any of the 3 vaccinestrains, the mean HI response to TIV was 8-fold higher thanthe response to LAIV (P < .001).
With respect to VN titers, TIV vaccinees showed a significantlygreater increase in serum VN titers for the 3 vaccine strains, com-pared with subjects in the LAIV group (P < .05). In LAIV vaccines,there was a significant increase in titers against the B strain(P < .05) and an increasing trend for the H3N2 strain (P = .05),which was not observed on HAI analysis (Figure 1L). The rates ofseroconversion for VNAwere 75% for H1N1, 81% for H3N2, and62% for B among TIV vaccinees and 16% for H1N1, 27% forH3N2, and 33% for B among LAIV vaccines (Table 2).
We examined the impact of age on antibody responses andfound that children younger than 5 years had similar antibodyresponses than older children. Likewise, children with asthma(n = 4) showed similar antibody responses than the rest of thechildren immunized with TIV.
Antibody-Secreting Cells Correlate With Antibody Titers on TIVRecipientsNext, we examined the correlations between the number ofplasmablasts and plasma cells with antibody titers. For correla-tions with HI titers, we only included TIV vaccinees, because ofthe low responses after LAIV. We found a significant correlationbetween the number of plasmablasts and plasma cells on day 7after immunization and fold-increases of HI titers to H3N2 andB strains. Despite good rates of seroconversion for the H1N1strain among TIV vaccinees, we did not find any significant cor-relation between the number of plasmablasts and plasma cellsand H1N1 titers (Figure 2A). We also found significant corre-lations between the numbers of plasma cells on day 7 after TIVreceipt and VN titers against the 3 vaccine strains, as well as thenumber of plasmablasts 7 days after vaccination and VN titersonly against the B strain (Figure 2B). There was a significantcorrelation in the fold-increase of HI and VN titers amongTIV vaccinees for the 3 vaccine strains (H1N1, r = 0.594[P < .05]; H3N2, r = 0.815 [P < .001]; and B, r = 0.694 [P < .05]).
226 • JID 2014:210 (15 July) • Cao et al
at Ohio State U
niversity Prior Health Sciences L
ibrary on July 25, 2014http://jid.oxfordjournals.org/
Dow
nloaded from

Although there were no significant differences in the numbers ofantibody-secreting cells over time in LAIV vaccinees, we ob-served a significant correlation between absolute numbers ofplasmablasts on day 7 after LAIV receipt and H3N2 VN titers30 days after vaccination (r = 0.668; P < .05).
TIV and LAIV Induce Distinct Immune Transcriptional ProfilesWe analyzed whole blood gene expression profiles in 32 chil-dren (18 in the LAIV group, and 14 in the TIV group) at base-line (day 0) and at days 1, 7, and 30 after vaccination(Supplementary Figure 1A and 1B). Samples obtained at base-line were used as the reference for subsequent comparisons.
Statistical group comparisons identified a significantly largernumber of differentially expressed transcripts among TIV vac-cinees on days 1 and 7 after vaccination, compared with chil-dren who received LAIV (day 1, 777 genes in the TIV groupvs 402 in the LAIV group; day 7, 812 genes in TIV group vs
453 in the LAIV group). On day 30, we observed the oppositepattern, as LAIV vaccinees had 790 differentially expressedtranscripts, whereas TIV recipients had 462. Overall, forLAIV vaccinees, there was a predominance of underexpressedgenes at all 3 time points, compared with day 0, whereas forTIV vaccines, we observed a higher proportion of overexpressedgenes on days 1 and 7 but a predominant pattern of underex-pressed genes on day 30 (Supplementary Figure 1C)
Next, we compared the significant top 10 overexpressed andunderexpressed transcripts per time point per vaccine type.Among the top overexpressed transcripts identified on day 1after TIV receipt, the majority were interferon (IFN)–relatedgenes, whereas in the LAIV group there was overexpression ofgenes related to cell cycle activity. On day 7 after vaccination, wefound overexpression of plasma cell–related genes and underex-pression of inflammation genes in the TIV group, whereasLAIV vaccinees displayed overexpression of IFN and cell
Figure 1. A–I, B-cell immune responses after immunization with live attenuated influenza vaccine (LAIV) or trivalent inactivated influenza vaccine (TIV).Whole-blood samples obtained from healthy children were stained for naive B cells (CD19+IgD+CD27−), memory B cells (CD19+IgD−CD27+), transitional Bcells (CD19+CD24+CD38+), plasmablasts (CD19+CD27+CD38+), and plasma B cells (CD19+CD27+CD38+CD138) and analyzed by flow cytometry on day 0 (ie,baseline) and days 1, 7, and 30 after vaccination. Data are 16 LAIV vaccinees and 13 TIV vaccinees. The graphs consist of column scatter plots representingabsolute numbers of B-cell populations over the different 4 time points. A, Naive B cells in LAIV vaccinees. B, Memory B cells in LAIV vaccinees. C,Transitional B cells in LAIV vaccinees. D, Plasmablasts in LAIV vaccinees. E, Plasma B cells in LAIV vaccinees. F, Naive B cells in TIV vaccinees. G, MemoryB cells in TIV vaccinees. H, Transitional B cells in TIV vaccinees. I, Plasmablasts in TIV vaccinees. J, Plasma B cells in TIV vaccinees. Linear mixed modelwith Bonferroni correction (*P < .05 and **P < .01; NS, no statistical significance). Bars represent median values. K and L, Fold-increase of hemagglutinationinhibition (HI) and viral neutralization (VN) titers before and after vaccination in LAIV and TIV recipients. Serum samples obtained on day 0 and 30 days aftervaccination from each subject were assayed for HI and VN titers. Data are for 18 LAIV vaccinees and 16 TIV vaccinees. K, Column scatter plot representingfold-increase of HI titers among TIV and LAIV vaccinees for H1N1, H3N2, and B vaccine strains. L, Column scatter plot representing fold-increase of VN titersamong TIV and LAIV vaccinees for H1N1, H3N2, and B vaccine strains. *P < .05, by the Mann–Whitney test. Bars represent median values.
TIV- and LAIV-Associated Ab Responses and IFN • JID 2014:210 (15 July) • 227
at Ohio State U
niversity Prior Health Sciences L
ibrary on July 25, 2014http://jid.oxfordjournals.org/
Dow
nloaded from

cycle–related transcripts. On day 30 after vaccination, cellcycle–related transcripts were overexpressed and inflammationtranscripts were underexpressed in LAIV vaccinees, whereas inthe TIV group we did not identify significant underexpressionor overexpression of transcripts with well-defined function(Supplementary Table 1).
TIV and LAIV Induce Expression of IFN-Related Genes WithDifferent KineticsTo better understand the differences of immune-related genesinduced by both vaccines, we performed modular analysis[23, 25].Gene expression levels were compared between samplesobtained at the different time points and at baseline (day 0) on amodule-by-module basis. For each module, the percentage ofgenes significantly expressed (P < .05, by the Mann–Whitneytest) are shown in the modular map, derived independentlyfor LAIV and TIV vaccinees (Figure 3A–I) [23]. In the TIVgroup but not the LAIV group, the IFN-related modules(M1.2, M3.4, and M5.12) were overexpressed on day 1 after vac-cination and included genes coding for IFN-inducible proteins,such as OASL, OAS3, IFIT1, IFIT3, IFI44L, RSAD2, ISG15, theguanylate-binding proteins GBP1 GBP4, and LOC400759 (Fig-ure 3B). To assess whether age influenced the host response toLAIV and TIV, subjects were stratified in 2 groups: those <5years old and those ≥5 years old (LAIV group, n = 4 and 14, re-spectively; TIV group, n = 4 and 10, respectively). TIV inducedoverexpression of the IFN-related modules in both age groups 1day after vaccination, although the IFN overexpression was morepronounced in younger children (median expression, 2.11 [inter-quartile range {IQR}, 1.52–2.91] in younger children vs 1.35 [IQR,1.14–1.59] in older children; P < .001; Figure 3C–D). On the otherhand, only in TIV vaccinees >5 years of age was there overexpres-sion of B-cell–related genes (M4.10; including genes related to B-
cell differentiation, such as BLK, CD79A, and CD79B) 7 daysafter vaccination, which coincided with the peak antibody-secret-ing cell count measured by flow cytometry.
Transcriptional profiles in LAIV vaccinees were more atten-uated. We observed overexpression of the IFN-related moduleson day 7 after vaccination and only for younger children (me-dian expression, 2.25 [IQR, 1.45–4.41] in younger children vs1.00 [IQR, 0.96–1.08] in older children; P < .001), which also in-cluded genes coding for IFN-inducible antiviral proteins, suchas OASL, OAS1, OAS2, IFIT1, IFIT3, IFITM3, RSAD2, RTP4,GBP1, GBP5, and tumor necrosis factor–induced proteinTNFAIP6 (Figure 3F–I).
Expression of IFN-related modules on day 30 after vaccina-tion was not significantly different than in baseline samples inchildren vaccinated with both LAIV and TIV. Kinetics of IFN-related modules expression stratified by age and vaccine type issummarized on Supplementary Figure 2.
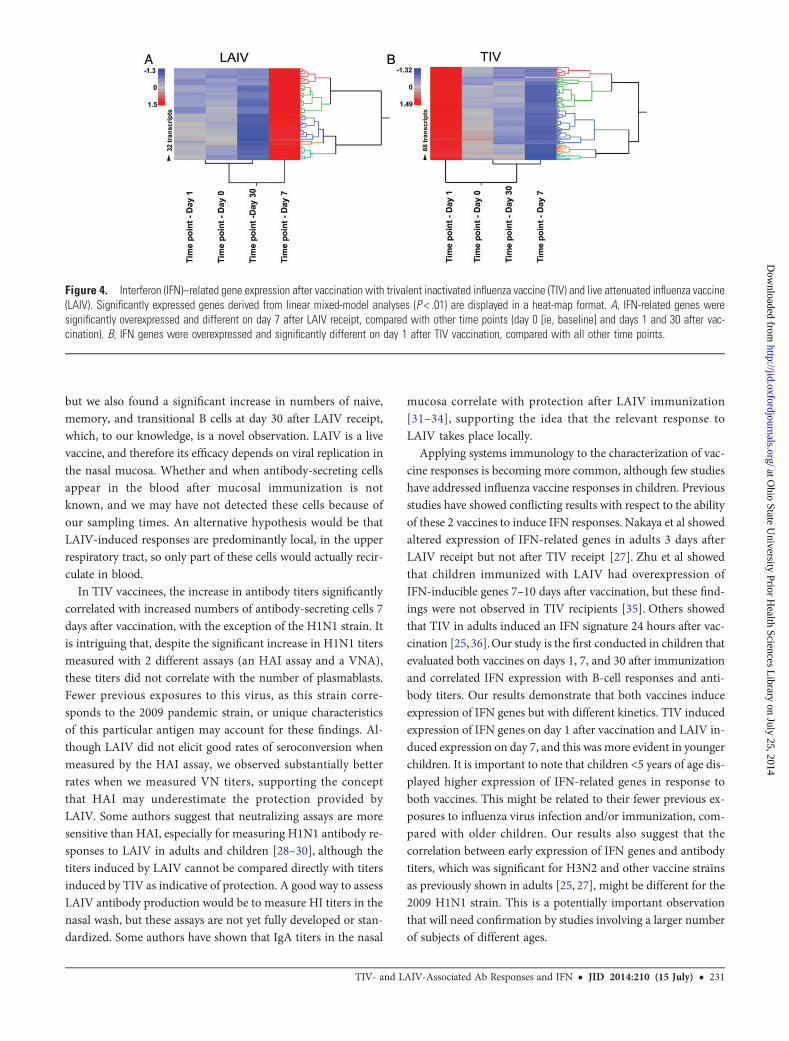
To validate the IFN profile induced by both vaccines overtime, we used linear mixed-model analyses. As observed withthe modular analysis, IFN-related genes were overexpressedon day 1 after vaccination with TIV and on day 7 after vaccina-tion with LAIV (Figure 4). Linear mixed models identified 25and 6 IFN-related genes after TIV and LAIV receipt, respective-ly, that passed the statistical cutoff P value of <.01, confirmingthat TIV induces a more robust overexpression of IFN genes inblood. These significantly expressed genes were also identifiedin the modular analyses described above.
Expression of IFN Genes Correlates With Antibody ProductionNext, we examined the correlations between IFN-inducible geneexpression and antibody production. For this analysis, we cor-related the fold-increase of HI and VN antibody titers with IFN-inducible gene expression per individual modules (M1.2, 36
Table 2. Hemagglutinin Inhibition and Viral Neutralization Antibody Titers at Baseline and 30 Days After Receipt of Live AttenuatedInfluenza Vaccine (LAIV) or Trivalent Inactivated Influenza Vaccine (TIV)
Assay
Titer Fold-Increase
LAIV Group TIV Group LAIV Group TIV Group
Baseline Day 30 Baseline Day 30 Mean Median Mean Median
HAI assay
H1N1 34.2 44.8 29.5 293.4a 0.5 0.0 20.9 8.0H3N2 32.9 54.4 21.8 190.2a 2.6 0.0 9.7 12.0
B 10.0 12.1 11.3 30.8a 0.3 0.0 3.8 2.0
VNAH1N1 96.9 100.7 64.4 640.0a 2.6 0.0 28.7 12.0
H3N2 68.5 172.8 91.1 794.7a 10.7 2.0 15.1 12.0
B 63.4 166.2a 83.5 586.8a 5.8 1.0 14.3 8.0
Titers are geometric means.
Abbreviations: HAI, hemagglutinin inhibition; VNA, virus neutralization assay.a P < .05.
228 • JID 2014:210 (15 July) • Cao et al
at Ohio State U
niversity Prior Health Sciences L
ibrary on July 25, 2014http://jid.oxfordjournals.org/
Dow
nloaded from

transcripts; M3.4, 62 transcripts; and M5.12, 63 transcripts),combinations of IFN modules (161 transcripts), and specifictop 10 overexpressed IFN genes on day 1 after TIV vaccinationand on day 7 after LAIV vaccination (Table 3). For LAIV vac-cinees, we were able to perform correlations only with VN titers,since HI titers were too low. Among TIV vaccinees, H3N2 HItiters consistently correlated with all the IFN-related modulesand 6 of 10 genes tested. Only expression of IFN-inducedGBP1 significantly correlated with H3N2 and B VN titers.Among LAIV vaccinees, we also observed significant correla-tions only between H3N2 VN titers and all IFN-related mod-ules, as well as 9 of the top 10 selected genes.
DISCUSSION
We still lack a full understanding of the signaling pathways re-sponsible for the protective immune responses induced by these
2 influenza vaccines. The goal of this study was to compare theB-cell populations, antibody responses, and transcriptional im-mune profiles elicited after immunization with LAIV and TIVin children. Our results show that both vaccines evoked differ-ent responses in all 3 parameters analyzed. While TIV elicitedan early increase in antibody-secreting cells and robust anti-body titers, LAIV elicited an increase in naive and memory Bcells, no increase in antibody-secreting cells, and less robust an-tibody responses. Both vaccines induced expression of IFN-related genes, but with different kinetics. TIV inducedoverexpression of IFN genes 1 day after vaccination, whereasthe effect of LAIV on IFN-inducible genes was detected 7days after vaccination.
Previous studies showed that TIV induced greater increase inplasmablasts and antibody responses than LAIV [26, 27]. Like-wise, we found higher antibody titers and a significant increasein numbers of plasmablasts in children immunized with TIV,
Figure 2. Correlations between hemagglutination inhibition (HI) and viral neutralization (VN) titers and plasmablast and plasma B cells among trivalentinactivated influenza vaccine (TIV) vaccinees. A, Each plot represents the correlation between absolute numbers of plasmablasts and plasma B cells 7 daysafter vaccination with TIV and fold-increases of H1N1, H3N2, and B HI titers from day 0 (ie, baseline) to day 30 after vaccination. B, Each plot represents thecorrelation between absolute numbers of plasmablasts and plasma B cells 7 days after vaccination with TIV and fold-increases of H1N1, H3N2, and B VNtiters from day 0 to day 30 after vaccination.
TIV- and LAIV-Associated Ab Responses and IFN • JID 2014:210 (15 July) • 229
at Ohio State U
niversity Prior Health Sciences L
ibrary on July 25, 2014http://jid.oxfordjournals.org/
Dow
nloaded from

Figure 3. Transcriptional profiles of children immunized with trivalent inactivated influenza vaccine (TIV) and live attenuated influenza vaccine (LAIV) arecharacterized by activation of interferon (IFN). A, Statistical group comparison (P < .05, by the Mann Whitney test) between the TIV group (n = 14) on day 1after vaccination versus baseline (ie, day 0) yielded 777 differentially expressed genes. Transcripts were organized by hierarchical clustering, where eachrow represents a single transcript and each column represents an individual subject. Normalized expression levels are indicated by red (overexpressed) orblue (underexpressed), compared with the median expression at baseline (yellow). B, Modular analysis 1 day after TIV receipt showed significant over-expression of IFN-related modules (M1.2, M3.4, and M5.12). The color intensity of the spots represents the percentage of significantly overexpressed genes(red), the percentage of significantly underexpressed genes (blue), or no differences (blank), compared with healthy controls (P < .05, by the Mann–Whitneytest). C and D, Heat maps and modular maps from TIV vaccinees stratified by age. Both groups displayed overexpression of the IFN-related modules, withoverexpression more pronounced in the younger group (n = 4). E, Modular map legend. F, Statistical group comparison (P < .05, by the Mann–Whitney test)between the LAIV group (n = 18) on day 7 after vaccination versus day 0 yielded 453 differentially expressed genes. G, Modular analysis 7 days after LAIVreceipt. No modules were found to be significantly overexpressed or underexpressed. H and I, Heat maps and modular maps from LAIV vaccinees stratified byage. Only younger children (n = 4) displayed significant overexpression of the IFN-related modules (M1.2, M3.4, and M5.12). Abbreviation: NK, natural killer.
230 • JID 2014:210 (15 July) • Cao et al
at Ohio State U
niversity Prior Health Sciences L
ibrary on July 25, 2014http://jid.oxfordjournals.org/
Dow
nloaded from
but we also found a significant increase in numbers of naive,memory, and transitional B cells at day 30 after LAIV receipt,which, to our knowledge, is a novel observation. LAIV is a livevaccine, and therefore its efficacy depends on viral replication inthe nasal mucosa. Whether and when antibody-secreting cellsappear in the blood after mucosal immunization is notknown, and we may have not detected these cells because ofour sampling times. An alternative hypothesis would be thatLAIV-induced responses are predominantly local, in the upperrespiratory tract, so only part of these cells would actually recir-culate in blood.
In TIV vaccinees, the increase in antibody titers significantlycorrelated with increased numbers of antibody-secreting cells 7days after vaccination, with the exception of the H1N1 strain. Itis intriguing that, despite the significant increase in H1N1 titersmeasured with 2 different assays (an HAI assay and a VNA),these titers did not correlate with the number of plasmablasts.Fewer previous exposures to this virus, as this strain corre-sponds to the 2009 pandemic strain, or unique characteristicsof this particular antigen may account for these findings. Al-though LAIV did not elicit good rates of seroconversion whenmeasured by the HAI assay, we observed substantially betterrates when we measured VN titers, supporting the conceptthat HAI may underestimate the protection provided byLAIV. Some authors suggest that neutralizing assays are moresensitive than HAI, especially for measuring H1N1 antibody re-sponses to LAIV in adults and children [28–30], although thetiters induced by LAIV cannot be compared directly with titersinduced by TIV as indicative of protection. A good way to assessLAIV antibody production would be to measure HI titers in thenasal wash, but these assays are not yet fully developed or stan-dardized. Some authors have shown that IgA titers in the nasal
mucosa correlate with protection after LAIV immunization[31–34], supporting the idea that the relevant response toLAIV takes place locally.
Applying systems immunology to the characterization of vac-cine responses is becoming more common, although few studieshave addressed influenza vaccine responses in children. Previousstudies have showed conflicting results with respect to the abilityof these 2 vaccines to induce IFN responses. Nakaya et al showedaltered expression of IFN-related genes in adults 3 days afterLAIV receipt but not after TIV receipt [27]. Zhu et al showedthat children immunized with LAIV had overexpression ofIFN-inducible genes 7–10 days after vaccination, but these find-ings were not observed in TIV recipients [35]. Others showedthat TIV in adults induced an IFN signature 24 hours after vac-cination [25,36].Our study is the first conducted in children thatevaluated both vaccines on days 1, 7, and 30 after immunizationand correlated IFN expression with B-cell responses and anti-body titers. Our results demonstrate that both vaccines induceexpression of IFN genes but with different kinetics. TIV inducedexpression of IFN genes on day 1 after vaccination and LAIV in-duced expression on day 7, and this was more evident in youngerchildren. It is important to note that children <5 years of age dis-played higher expression of IFN-related genes in response toboth vaccines. This might be related to their fewer previous ex-posures to influenza virus infection and/or immunization, com-pared with older children. Our results also suggest that thecorrelation between early expression of IFN genes and antibodytiters, which was significant for H3N2 and other vaccine strainsas previously shown in adults [25, 27], might be different for the2009 H1N1 strain. This is a potentially important observationthat will need confirmation by studies involving a larger numberof subjects of different ages.
Figure 4. Interferon (IFN)–related gene expression after vaccination with trivalent inactivated influenza vaccine (TIV) and live attenuated influenza vaccine(LAIV). Significantly expressed genes derived from linear mixed-model analyses (P < .01) are displayed in a heat-map format. A, IFN-related genes weresignificantly overexpressed and different on day 7 after LAIV receipt, compared with other time points (day 0 [ie, baseline] and days 1 and 30 after vac-cination). B, IFN genes were overexpressed and significantly different on day 1 after TIV vaccination, compared with all other time points.
TIV- and LAIV-Associated Ab Responses and IFN • JID 2014:210 (15 July) • 231
at Ohio State U
niversity Prior Health Sciences L
ibrary on July 25, 2014http://jid.oxfordjournals.org/
Dow
nloaded from

Our study has some limitations. First, there was a relativelysmall number of subjects enrolled, mainly in the youngergroup, because of the challenge of obtaining sequential samplesin infants. Nevertheless, the robustness and consistency of thebiological changes and immune responses measured beforeand after vaccination indicate that LAIV and TIV elicit differentblood transcriptional, cellular, and serological responses. Wewere not able to define whether all of the vaccine strains or apredominant strain was driving the IFN responses, but the cor-relations among fold-changes in antibody titers and IFN-relatedgenes were found mainly with the H3N2 strain, suggesting thatthis strain is a more robust vaccine antigen or that the vaccinees
have been exposed more often to this antigen. Last, we were un-able to measure responses in nasal wash samples, owing to thechallenge of consistently obtaining a sufficient number of cellsfor flow cytometry analyses and to the lack of standardized as-says to characterize mucosal antibody responses.
In summary, we have uncovered profound differences in B-cell populations elicited by 2 influenza vaccines over time andhave established their relatedness to antibody responses to theunique components of these vaccines. In addition, we havefound significant kinetic differences in IFN responses betweenthese vaccines and showed the influence of age in theseresponses.
Supplementary Data
Supplementary materials are available at The Journal of Infectious Diseasesonline (http://jid.oxfordjournals.org/). Supplementary materials consist ofdata provided by the author that are published to benefit the reader. Theposted materials are not copyedited. The contents of all supplementarydata are the sole responsibility of the authors. Questions or messages regard-ing errors should be addressed to the author.
Notes
Acknowledgments. We thank the study participants, for their enroll-ment into this study; and S. Farley and P. Davies, for enrolling the studyparticipants.R. C. performed and analyzed flow cytometry experiments. G. O., E. F., and
S. L. developed panels for the flow cytometry assay. R. C. and N. S. performed
Table 3. Correlations Between Fold-Increase of HemagglutininInhibition and Virus Neutralization Titers and Interferon (IFN)–Related Modules and Genes, by Vaccine and Time After VaccineReceipt
Variable
Median Expression, Fold-Increase
H1N1 H3N2 B
r P r P r P
HI titer 1 d after TIV receipt
IFN (161genes)
−0.22 .444 0.531 .049 −0.112 .742
M1.2 −0.134 .637 0.633 .013 −0.0745 .844
M3.4 −0.244 .39 0.531 .049 −0.0373 .913
M5.12 −0.179 .532 0.592 .024 0.0745 .844OASL −0.141 .615 0.695 <.01 −0.186 .612
OAS3 −0.271 .34 0.493 .069 −0.0373 .913
IFIT1 −0.0941 .738 0.571 .032 −0.112 .742IFIT3 −0.114 .693 0.585 .026 0 .983
IFI44L −0.184 .521 0.578 .029 −0.0373 .913
RSAD2 −0.224 .435 0.507 .061 −0.0373 .913ISG15 0.0291 .916 0.659 .010 −0.149 .676
GBP1 0.125 .659 0.566 .033 0.224 .55
GBP4 −0.152 .594 0.469 .087 0.0373 .913LOC400759 −0.213 .453 0.393 .157 0.0373 .913
VN titer 1 d after TIV receipt
IFN (161genes)
0.075 .792 0.372 .199 0.346 .219
M1.2 0.0417 .878 0.468 .102 0.487 .074
M3.4 0.0861 .764 0.372 .199 0.373 .184M5.12 0.136 .643 0.476 .093 0.459 .094
OASL 0.158 .591 0.378 .192 0.466 .087
OAS3 0.114 .696 0.358 .221 0.403 .148IFIT1 0.161 .591 0.4 .166 0.444 .109
IFIT3 0.0611 .835 0.471 .097 0.351 .212
IFI44L 0.103 .723 0.42 .148 0.496 .069RSAD2 0.0667 .821 0.4 .166 0.493 .069
ISG15 0.211 .481 0.48 .093 0.505 .0636
GBP1 0.0139 .949 0.664 .012 0.568 .032
GBP4 −0.0889 .764 0.414 .154 0.38 .173
LOC400759 −0.383 .186 0.324 .269 0.199 .482
Table 3 continued.
Variable
Median Expression, Fold-Increase
H1N1 H3N2 B
r P r P r P
VN titer 7 d after LAIV receipt
IFN (161genes)
−0.616 .233 0.934 <.001 0.581 .087
M1.2 −0.41 .45 0.889 <.001 0.641 .058
M3.4 −0.462 .45 0.921 <.001 0.359 .308
M5.12 −0.616 .233 0.83 <.001 0.419 .243OASL −0.462 .45 0.937 <.001 0.641 .058
OAS1 −0.359 .517 0.74 <.01 0.197 .58
OAS2 0.205 .683 0.762 <.01 0.65 .050IFIT1 −0.103 .783 0.762 <.01 0.522 .138
IFIT3 −0.41 .45 0.921 <.001 0.41 .243
IFITM3 −0.616 .233 0.791 <.01 0.624 .067RSAD2 −0.41 .45 0.889 <.001 0.641 .058
RTP4 −0.718 .133 0.525 .107 0.539 .124
GBP1 −0.872 .083 0.869 <.001 0.641 .058GBP5 −0.205 .683 0.701 .021 −0.00855 .948
IFN, 161 genes (M1.2 +M3.4 +M5.12). M1.2: IFN module. M3.4: IFN module.M5.12: IFN module.
Abbreviations: LAIV, live attenuated influenza vaccine; TIV, trivalent inactivatedinfluenza vaccine.
232 • JID 2014:210 (15 July) • Cao et al
at Ohio State U
niversity Prior Health Sciences L
ibrary on July 25, 2014http://jid.oxfordjournals.org/
Dow
nloaded from
microarray analysis. R. C., S. L., and S. M. organized and managed the vaccinestudy and the collection of samples. R. A. and A. G.-S. analyzed antibody titersand reviewed the manuscript. D. B. and G. O. contributed to the statisticalanalysis. R. C. and O. R. wrote the manuscript. G. O., E. F., A. M., K. P.,V. P., and O. R. designed the study and reviewed the manuscript.Financial support. This work was supported by the National Institutes
of Health (grant U19 AI089987), Nationwide Children’s Hospital (intramu-ral funds), and Conselho Nacional de Desenvolvimento Científico e Tecno-lógico (grant 201277/2011-5 to R. C., from the Brazilian government).Potential conflicts of interest. All authors: No reported conflicts.All authors have submitted the ICMJE Form for Disclosure of Potential
Conflicts of Interest. Conflicts that the editors consider relevant to the con-tent of the manuscript have been disclosed.
References
1. Izurieta HS, Thompson WW, Kramarz P, et al. Influenza and the ratesof hospitalization for respiratory disease among infants and young chil-dren. N Engl J Med 2000; 342:232–9.
2. Neuzil KM, Zhu Y, Griffin MR, et al. Burden of interpandemic influen-za in children younger than 5 years: a 25-year prospective study. J InfectDis 2002; 185:147–52.
3. Heikkinen T, Silvennoinen H, Peltola V, et al. Burden of influenza inchildren in the community. J Infect Dis 2004; 190:1369–73.
4. Poehling KA, Edwards KM, Weinberg GA, et al. The under-recognized burden of influenza in young children. N Engl J Med2006; 355:31–40.
5. Fiore AE, Uyeki TM, Broder K, et al. Prevention and control of influen-za with vaccines: recommendations of the Advisory Committee onImmunization Practices (ACIP), 2010. MMWR Recomm Rep 2010;59:1–62.
6. Negri E, Colombo C, Giordano L, Groth N, Apolone G, La Vecchia C.Influenza vaccine in healthy children: a meta-analysis. Vaccine 2005;23:2851–61.
7. Rhorer J, Ambrose CS, Dickinson S, et al. Efficacy of live attenuated in-fluenza vaccine in children: A meta-analysis of nine randomized clinicaltrials. Vaccine 2009; 27:1101–10.
8. Zangwill KM, Belshe RB. Safety and efficacy of trivalent inactivated in-fluenza vaccine in young children: a summary for the new era of routinevaccination. Pediatr Infect Dis J 2004; 23:189–97.
9. Jefferson T, Rivetti A, Harnden A, Di Pietrantonj C, Demicheli V. Vac-cines for preventing influenza in healthy children. Cochrane DatabaseSyst Rev 2008: CD004879.
10. Ashkenazi S, Vertruyen A, Aristegui J, et al. Superior relative efficacy oflive attenuated influenza vaccine compared with inactivated influenzavaccine in young children with recurrent respiratory tract infections. Pe-diatr Infect Dis J 2006; 25:870–9.
11. Fleming DM, Crovari P, Wahn U, et al. Comparison of the efficacy andsafety of live attenuated cold-adapted influenza vaccine, trivalent, withtrivalent inactivated influenza virus vaccine in children and adolescentswith asthma. Pediatr Infect Dis J 2006; 25:860–9.
12. Belshe RB, Edwards KM, Vesikari T, et al. Live attenuated versus inac-tivated influenza vaccine in infants and young children. N Engl J Med2007; 356:685–96.
13. Wrammert J, Smith K, Miller J, et al. Rapid cloning of high-affinityhuman monoclonal antibodies against influenza virus. Nature 2008;453:667–71.
14. Wang S, Taaffe J, Parker C, et al. Hemagglutinin (HA) proteins fromH1and H3 serotypes of influenza A viruses require different antigendesigns for the induction of optimal protective antibody responses asstudied by codon-optimized HA DNA vaccines. J Virol 2006;80:11628–37.
15. Steel J, Lowen AC, Pena L, et al. Live attenuated influenza viruses con-taining NS1 truncations as vaccine candidates against H5N1 highlypathogenic avian influenza. J Virol 2009; 83:1742–53.
16. Brady RC, Treanor JJ, Atmar RL, et al. Safety and immunogenicity ofa subvirion inactivated influenza A/H5N1 vaccine with or without
aluminum hydroxide among healthy elderly adults. Vaccine 2009;27:5091–5.
17. Keitel WA, Campbell JD, Treanor JJ, et al. Safety and immunogenicity ofan inactivated influenza A/H5N1 vaccine given with or without alumi-num hydroxide to healthy adults: results of a phase I-II randomizedclinical trial. J Infect Dis 2008; 198:1309–16.
18. Center for Biologics Evaluation and Research, Food and Drug Admin-istration, Department of Health and Human Services. Guidance forindustry: clinical data needed to support the licensure of seasonal inac-tivated influenza vaccines. US Department of Health and HumanServices, FDA, Rockville, MD 2007; 1–16.
19. Berry MP, Graham CM, McNab FW, et al. An interferon-inducible neu-trophil-driven blood transcriptional signature in human tuberculosis.Nature 2010; 466:973–7.
20. Banchereau R, Jordan-Villegas A, Ardura M, et al. Host immune tran-scriptional profiles reflect the variability in clinical disease manifesta-tions in patients with Staphylococcus aureus infections. PLoS One2012; 7:e34390.
21. Allantaz F, Chaussabel D, Stichweh D, et al. Blood leukocyte microar-rays to diagnose systemic onset juvenile idiopathic arthritis and followthe response to IL-1 blockade. J Exp Med 2007; 204: 2131–44.
22. Ramilo O, Allman W, Chung W, et al. Gene expression patterns inblood leukocytes discriminate patients with acute infections. Blood2007; 109:2066–77.
23. Chaussabel D, Quinn C, Shen J, et al. A modular analysis framework forblood genomics studies: application to systemic lupus erythematosus.Immunity 2008; 29:150–64.
24. Wang L, Chen X, Wolfinger RD, Franklin JL, Coffey RJ, Zhang B. A uni-fied mixed effects model for gene set analysis of time course microarrayexperiments. Stat Appl Genet Mol Biol 2009; 8:1–18.
25. Obermoser G, Presnell S, Domico K, et al. Systems scale interactive ex-ploration reveals quantitative and qualitative differences in response toinfluenza and pneumococcal vaccines. Immunity 2013; 38:831–44.
26. Sasaki S, Jaimes MC, Holmes TH, et al. Comparison of the influenzavirus-specific effector and memory B-cell responses to immunizationof children and adults with live attenuated or inactivated influenzavirus vaccines. J Virol 2007; 81:215–28.
27. Nakaya HI, Wrammert J, Lee EK, et al. Systems biology of vaccinationfor seasonal influenza in humans. Nat Immunol 2011; 12:786–95.
28. Lee MS, Mahmood K, Adhikary L, et al. Measuring antibody responsesto a live attenuated influenza vaccine in children. Pediatr Infect Dis J2004; 23:852–6.
29. Veguilla V, Hancock K, Schiffer J, et al. Sensitivity and specificity of se-rologic assays for detection of human infection with 2009 pandemicH1N1 virus in US populations. J Clin Microbiol 2011; 49:2210–5.
30. Papenburg J, Baz M, Hamelin ME, et al. Evaluation of serological diag-nostic methods for the 2009 pandemic influenza A (H1N1) virus. ClinVaccine Immunol 2011; 18:520–2.
31. Belshe RB, Gruber WC, Mendelman PM, et al. Correlates of immuneprotection induced by live, attenuated, cold-adapted, trivalent, intrana-sal influenza virus vaccine. J Infect Dis 2000; 181:1133–7.
32. Clements ML, Betts RF, Tierney EL, Murphy BR. Serum and nasal washantibodies associated with resistance to experimental challenge with in-fluenza A wild-type virus. J Clin Microbiol 1986; 24:157–60.
33. Ambrose CS, Wu X, Jones T, Mallory RM. The role of nasal IgA in chil-dren vaccinated with live attenuated influenza vaccine. Vaccine 2012;30: 6794–801.
34. Barria MI, Garrido JL, Stein C, et al. Localized mucosal response to in-tranasal live attenuated influenza vaccine in adults. J Infect Dis 2013;207:115–24.
35. Zhu W, Higgs BW, Morehouse C, et al. Awhole genome transcriptionalanalysis of the early immune response induced by live attenuated andinactivated influenza vaccines in young children. Vaccine 2010;28:2865–76.
36. Bucasas KL, Franco LM, Shaw CA, et al. Early patterns of gene expres-sion correlate with the humoral immune response to influenza vaccina-tion in humans. J Infect Dis 2011; 203:921–9.
TIV- and LAIV-Associated Ab Responses and IFN • JID 2014:210 (15 July) • 233
at Ohio State U
niversity Prior Health Sciences L
ibrary on July 25, 2014http://jid.oxfordjournals.org/
Dow
nloaded from