OPTIMUM REPLACEMENT DEPTH TO CONTROL HEAVE OF SWELLING CLAYS
Upload
independentCategory
view
1download
0
Dielectric, Thermal, and Swelling Properties of CalciumIon-Crosslinked Sodium Alginate Film
Seda Bekin,1 Shokat Sarmad,1 Koray G€urkan,2 G€okcen Yenici,1 G€on€ul Keceli,3 G€ulten G€urda�g1
1 Department of Chemical Engineering, Faculty of Engineering, Istanbul University, 34320, Avcilar, Istanbul,Turkey
2 Department of Electrical and Electronics Engineering, Faculty of Engineering, Istanbul University, 34320,Avcilar, Istanbul, Turkey
3 Department of Chemistry, Faculty of Engineering, Istanbul University, 34320, Avcilar, Istanbul, Turkey
In this study, Ca21-crosslinked sodium alginate (SA) gelfilms (SA-Ca/SA2-Ca) have been prepared, and theirstructural and thermal characterizations were investi-gated using fourier transform infrared spectroscopy, X-ray diffraction, differential scanning calorimetry, andthermogravimetric analysis, respectively. Dielectriccharacterization was performed at room temperature inthe frequency range of 12 Hz–100 kHz. The equilibriumswelling value (ESV) of gel films was determined both indistilled water and in 0.1 M sodium chloride (NaCl) solu-tion at room temperature. Sodium alginate films (SA/SA2) were also prepared for use as reference. The effectof the crosslinking of sodium alginate on the dielectricand thermal properties of gel films was investigated bycomparing the properties of gel films with those of SA/SA2 films. Although ESV of Ca21-crosslinked SA film indistilled water is about 350 gH2O/gpolymer, it decreasedinto one third in 0.1 M NaCl solution. The crosslinking ofSA did not significantly affect the thermal properties,but it decreased the b-relaxation associated with thepolar side groups. Frequency spectra of electric modu-lus, impedance and Cole-Cole plots confirmed thehigher conductance values of SA-Ca films at low fre-quencies than those of SA film due to the presence ofby-product of crosslinking. POLYM. ENG. SCI., 54:1372–1382, 2014. VC 2013 Society of Plastics Engineers
INTRODUCTION
Sodium alginate (SA) is a low cost, environmentally
safe, nontoxic, weak acidic, and an anionic, linear-chained
natural polysaccharide. In recent years, it has gained more
importance due to its excellent properties and gel-forming
ability with polyvalent metal ions or glutaraldehyde, and it
has been used in various applications such as controlled
drug delivery [1–3]; in the dehydration of some organic
solvents by pervaporation [4–7]; the removal of dyes or
heavy metal ions from aqueous solutions [8–10]; in textile
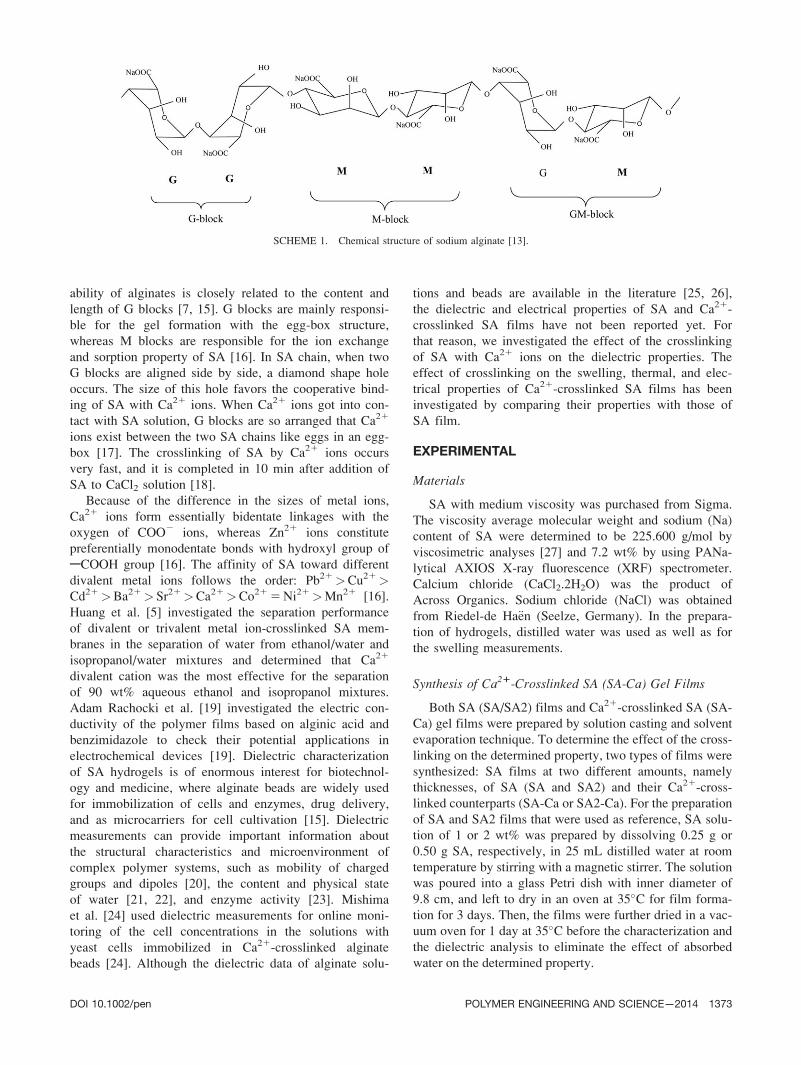
industry [11]; and in food industry [12]. SA is a binary
copolymer of b-(1–4)-linked-D-mannuronic acid (M) and
a-(1–4)-linked-L-guluronic acid (G) units with varying
contents of M and G blocks. These two blocks exist in SA
chains as homopolymeric MM and GG blocks and hetero-
polymeric MG or GM blocks [13]. The physical properties
of alginates in aqueous medium depend not only on the M/
G ratio in SA chain but also on the distribution of M and G
units along the polymer chain. The stiffness of alginate
chains as well as complex formation with calcium ions
depends on the chemical composition and sequence of the
blocks along the polymeric chains [12]. The reactivity of
homopolymeric blocks: GG, MM and heteropolymeric
GM/MG blocks increases in the following order: GM or
MG<MM<GG. This order is also valid for the flexibility
of the different blocks in SA chain. The complexes of SA
with Ca21 ion obtained at stoichiometric ratio of Ca21/
ACOOH are usually insoluble, and they can be used in the
forms of films, fibers, or capsules for various applications
in food industry and biomedicine [13]. It was reported that
the rigidity of these blocks decreases along in the order:
GG>MM>MG [13].
The preparation of calcium alginate films is a complex
process and it depends on the type of alginate, the extent
of reaction between alginate and calcium ions, the source
of calcium ion (chloride, phosphate, and lactate), and the
preparation method [14]. The crosslinking of SA with
polyvalent metal ions can improve the properties of film
such as water resistance, mechanical and barrier proper-
ties, cohesiveness, and rigidity [12]. The gel-forming
Correspondence to: G€ulten G€urda�g; e-mail: [email protected]
Contract grant sponsor: Scientific and Technical Research Council of
Turkey (TUBITAK); contract grant number: MAG/110M444; contract
grant sponsor: The Fund of Scientific Research Projects of Istanbul Uni-
versity; contract grant number: 29207.
DOI 10.1002/pen.23678
Published online in Wiley Online Library (wileyonlinelibrary.com).
VC 2013 Society of Plastics Engineers
POLYMER ENGINEERING AND SCIENCE—2014
ability of alginates is closely related to the content and
length of G blocks [7, 15]. G blocks are mainly responsi-
ble for the gel formation with the egg-box structure,
whereas M blocks are responsible for the ion exchange
and sorption property of SA [16]. In SA chain, when two
G blocks are aligned side by side, a diamond shape hole
occurs. The size of this hole favors the cooperative bind-
ing of SA with Ca21 ions. When Ca21 ions got into con-
tact with SA solution, G blocks are so arranged that Ca21
ions exist between the two SA chains like eggs in an egg-
box [17]. The crosslinking of SA by Ca21 ions occurs
very fast, and it is completed in 10 min after addition of
SA to CaCl2 solution [18].
Because of the difference in the sizes of metal ions,
Ca21 ions form essentially bidentate linkages with the
oxygen of COO2 ions, whereas Zn21 ions constitute
preferentially monodentate bonds with hydroxyl group of
ACOOH group [16]. The affinity of SA toward different
divalent metal ions follows the order: Pb21>Cu21>Cd21>Ba21> Sr21>Ca21>Co21 5 Ni21>Mn21 [16].
Huang et al. [5] investigated the separation performance
of divalent or trivalent metal ion-crosslinked SA mem-
branes in the separation of water from ethanol/water and
isopropanol/water mixtures and determined that Ca21
divalent cation was the most effective for the separation
of 90 wt% aqueous ethanol and isopropanol mixtures.
Adam Rachocki et al. [19] investigated the electric con-
ductivity of the polymer films based on alginic acid and
benzimidazole to check their potential applications in
electrochemical devices [19]. Dielectric characterization
of SA hydrogels is of enormous interest for biotechnol-
ogy and medicine, where alginate beads are widely used
for immobilization of cells and enzymes, drug delivery,
and as microcarriers for cell cultivation [15]. Dielectric
measurements can provide important information about
the structural characteristics and microenvironment of
complex polymer systems, such as mobility of charged
groups and dipoles [20], the content and physical state
of water [21, 22], and enzyme activity [23]. Mishima
et al. [24] used dielectric measurements for online moni-
toring of the cell concentrations in the solutions with
yeast cells immobilized in Ca21-crosslinked alginate
beads [24]. Although the dielectric data of alginate solu-
tions and beads are available in the literature [25, 26],
the dielectric and electrical properties of SA and Ca21-
crosslinked SA films have not been reported yet. For
that reason, we investigated the effect of the crosslinking
of SA with Ca21 ions on the dielectric properties. The
effect of crosslinking on the swelling, thermal, and elec-
trical properties of Ca21-crosslinked SA films has been
investigated by comparing their properties with those of
SA film.
EXPERIMENTAL
Materials
SA with medium viscosity was purchased from Sigma.
The viscosity average molecular weight and sodium (Na)
content of SA were determined to be 225.600 g/mol by
viscosimetric analyses [27] and 7.2 wt% by using PANa-
lytical AXIOS X-ray fluorescence (XRF) spectrometer.
Calcium chloride (CaCl2.2H2O) was the product of
Across Organics. Sodium chloride (NaCl) was obtained
from Riedel-de Ha€en (Seelze, Germany). In the prepara-
tion of hydrogels, distilled water was used as well as for
the swelling measurements.
Synthesis of Ca21-Crosslinked SA (SA-Ca) Gel Films
Both SA (SA/SA2) films and Ca21-crosslinked SA (SA-
Ca) gel films were prepared by solution casting and solvent
evaporation technique. To determine the effect of the cross-
linking on the determined property, two types of films were
synthesized: SA films at two different amounts, namely
thicknesses, of SA (SA and SA2) and their Ca21-cross-
linked counterparts (SA-Ca or SA2-Ca). For the preparation
of SA and SA2 films that were used as reference, SA solu-
tion of 1 or 2 wt% was prepared by dissolving 0.25 g or
0.50 g SA, respectively, in 25 mL distilled water at room
temperature by stirring with a magnetic stirrer. The solution
was poured into a glass Petri dish with inner diameter of
9.8 cm, and left to dry in an oven at 35�C for film forma-
tion for 3 days. Then, the films were further dried in a vac-
uum oven for 1 day at 35�C before the characterization and
the dielectric analysis to eliminate the effect of absorbed
water on the determined property.
SCHEME 1. Chemical structure of sodium alginate [13].
DOI 10.1002/pen POLYMER ENGINEERING AND SCIENCE—2014 1373
For preparation of mixed sodium/calcium alginate
(SA-Ca or SA2-Ca) gel films, 0.25 or 0.50 g of SA was
dissolved in 25 or 50 mL distilled water, respectively.
Then, 5 or 10 mL calcium chloride (CaCl2) solutions at
the same concentration (4.6 g/L) was added drop wise to
0.25 g SA/25 mL or 0.50 g SA/50 mL solution, respec-
tively, and the mixture was stirred with a magnetic stirrer
at room temperature. The amount of Ca21 ions added to
SA or SA2 solution is equal to bind 40 mol% of
ACOONa groups in both solutions. The content of
ACOONa group of SA was determined to be 3.13 3
1023 mol ACOONa per gram of SA by using the content
of Na. Afterward, the mixed sodium/calcium alginate
(SA-Ca or SA2-Ca) gel films were obtained by drying the
mixture in an oven at 35�C for 3 days long, which was
taken a glass petri dish, and then in vacuum oven at 35�Cfor 1 day under the same conditions with those of SA
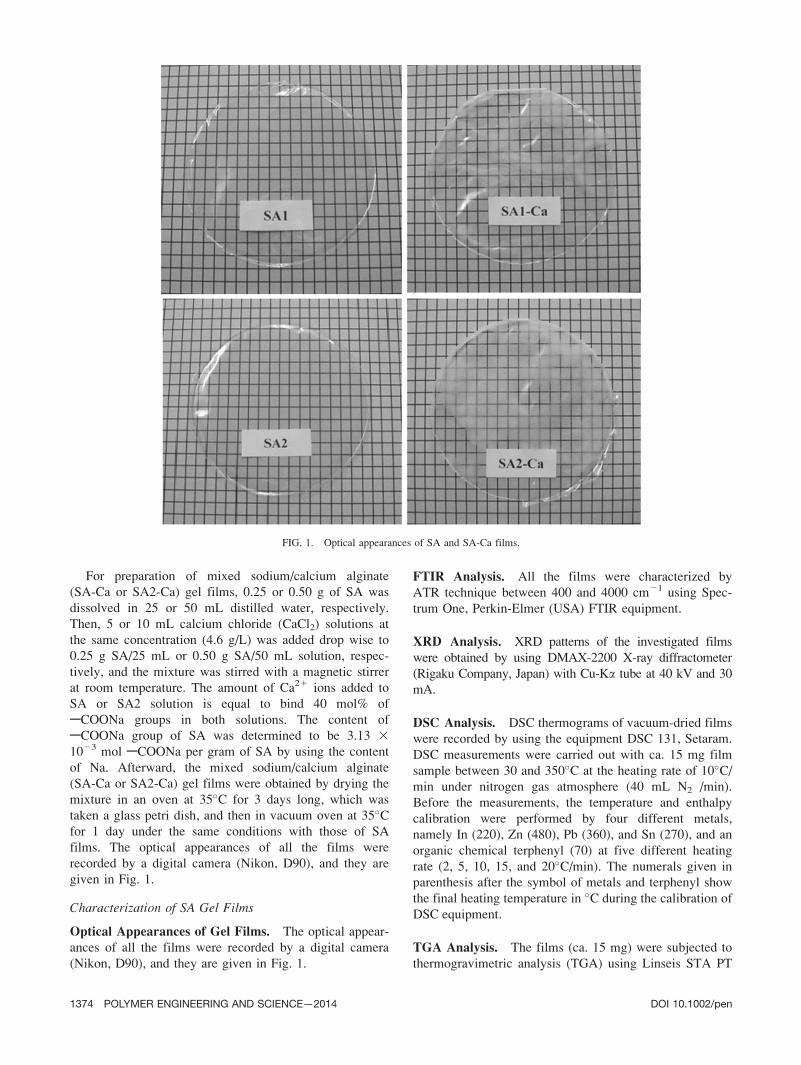
films. The optical appearances of all the films were
recorded by a digital camera (Nikon, D90), and they are
given in Fig. 1.
Characterization of SA Gel Films
Optical Appearances of Gel Films. The optical appear-
ances of all the films were recorded by a digital camera
(Nikon, D90), and they are given in Fig. 1.
FTIR Analysis. All the films were characterized by
ATR technique between 400 and 4000 cm21 using Spec-
trum One, Perkin-Elmer (USA) FTIR equipment.
XRD Analysis. XRD patterns of the investigated films
were obtained by using DMAX-2200 X-ray diffractometer
(Rigaku Company, Japan) with Cu-Ka tube at 40 kV and 30
mA.
DSC Analysis. DSC thermograms of vacuum-dried films
were recorded by using the equipment DSC 131, Setaram.
DSC measurements were carried out with ca. 15 mg film
sample between 30 and 350�C at the heating rate of 10�C/
min under nitrogen gas atmosphere (40 mL N2 /min).
Before the measurements, the temperature and enthalpy
calibration were performed by four different metals,
namely In (220), Zn (480), Pb (360), and Sn (270), and an
organic chemical terphenyl (70) at five different heating
rate (2, 5, 10, 15, and 20�C/min). The numerals given in
parenthesis after the symbol of metals and terphenyl show
the final heating temperature in �C during the calibration of
DSC equipment.
TGA Analysis. The films (ca. 15 mg) were subjected to
thermogravimetric analysis (TGA) using Linseis STA PT
FIG. 1. Optical appearances of SA and SA-Ca films.
1374 POLYMER ENGINEERING AND SCIENCE—2014 DOI 10.1002/pen

1750 TGA analyzer in the temperature range of 25–
350�C at a heating rate of 10�C/min, with air flushed at
0.1 L/min to determine their thermal stability and decom-
position characteristics.
Determination of the Equilibrium Swelling Value
(ESV) and the Solubility of SA-Ca Films. The solubil-
ity and ESV of Ca21-crosslinked SA gel films were deter-
mined by gravimetric method using three replicates. A
given amount (Wd1) of dry gel film was immersed into
distilled water or in 0.1 M sodium chloride solution at
25�C for 24 h. The swollen gel films were removed from
the distilled water or salt solution gently wiped with a fil-
ter paper to remove excess water at the surface and
weighed (Ws). Finally, the swollen gel films were dried at
35�C for 2 days (1 day in oven and then 1 day in vacuum
oven). The dried gel films were reweighed (Wd2). The
solubility of the films in percentage was calculated
according to the equation:
Solubility ð%Þ5 1002 Wd2=Wd1ð Þ½ �3100 (1)
The ESV of the gel films was calculated by using the
equation:
ESV gH2O=gpolymer
� �5 Ws2Wd1ð Þ=Wd1 (2)
Dielectric Measurement. Dielectric property or the per-
mittivity of a material, in fact, is a complex unit which is
defined as following equation:
e�5e02je00 (3)
where e0, which is the real part of e*, represents energy
storage property or relative permittivity, and e00, which is
the imaginary part of e*, represents energy dissipation
property or dielectric loss. The ratio of dielectric loss to
relative permittivity gives the dissipation factor (D) or
loss tangent of material:
tan dð Þ5 e00
e0(4)
To measure complex permittivity of a material, parallel
plate method can be used. In this method, material with a
thickness of d is placed between two parallel metal plates
with a surface area of A. This dielectric cell structure can
be electrically modeled by a parallel RC network. Electri-
cal impedance (Z) of this network is defined as;
Z xð Þ5 R
11 xRCð Þ22j
xR2C
11 xRCð Þ25Zreal2jZimag
5jZ xð Þj/h xð Þ(5)
where x52pf is the angular frequency, Zreal and Zimag are
the real and imaginary parts, |Z(x)| is the magnitude and
h(x) is the phase of Z(x). The equations for the dielectric
constant, e0 and the dielectric loss, e00 are given below:
e05Zimag
xCO Z2real1Z2
imag
� � (6)
e005Zreal
xCO Z2real1Z2
imag
� � (7)
Here Co 5 eoA/d and eo is the permittivity of free
space. These equations require the measurement of modu-
lus (|Z(x)|) and the phase (h(x)) of impedance. Loss tan-
gent is defined as
tan dð Þ5D5Zreal
Zimag
51
xRC(8)
Thus, if C and D values can be measured directly, the
relative permittivity, dielectric loss, and the conductivity
(r) can be easily calculated using following equations:
e05C
CO(9)
e005De0 (10)
r5d
RA5eOe00x (11)
From dielectric studies, for a closer evaluation of con-
duction mechanism, electric modulus can also be ana-
lyzed. The electric modulus is basically the reciprocal of
permittivity;
M�51
e�5e0
e0ð Þ21 e00ð Þ21j
e00
e0ð Þ21 e00ð Þ25M01jM00 (12)
To calculate the complex dielectric constant, the elec-
tric modulus and the conductance, capacitance (C) and
loss tangent (D) of the dielectric cell which consists of
SA/SA2 or SA-Ca/ SA2-Ca films were measured at room
temperature in the frequency range 12 Hz–100 kHz by a
4-terminal LCR-meter (Instek LCR-819) equipped with a
copper-plated parallel plate-type cell. The films, which
were cut into size 2 3 3 cm2, were sandwiched between
two rectangular (2 3 3 cm2) copper plates. Measurement
mode of the LCR-meter was adjusted to capacitance
mode with equivalent parallel RC circuit, and the ampli-
tude of the measuring signal to 1 V. Capacitance and loss
tangent values were obtained from the averages of 10 sets
of measurements. The thicknesses of the films were meas-
ured by a micrometer screw gauge (“a” brand, 60.001
mm), and the measurements were taken from at four
TABLE 1. The thicknesses of SA/SA2 and SA-Ca/SA2-Ca films.
Film code Thickness of the film (mm)
SA 0.023 6 0.002
SA2 0.041 6 0.003
SA-Ca 0.031 6 0.004
SA2-Ca 0.047 6 0.004
DOI 10.1002/pen POLYMER ENGINEERING AND SCIENCE—2014 1375
different positions over the film surface using four films
and the mean values given in Table 1 were used in the
calculation of dielectric parameters. All measurements
were carried out by the films dried in vacuum oven at
35�C for 24 h just before the measurements to eliminate
the effect of water on the electrical properties of films.
RESULTS AND DISCUSSION
Characterization of the Films
Although the thickness of SA2 film (0.041 mm) is
nearly the twice that of SA film (0.023 mm), the ratio of
their crosslinked counterparts is 1.5 (Table 1). The cross-
linking slightly increased the thickness of the film, and
the increase in the thickness of the SA-Ca film is slightly
higher than that of SA2-Ca film. Although SA/SA2 films
are transparent, SA-Ca/SA2-Ca films are partly transpar-
ent as can be seen in Fig. 1 and had good flexibility.
After drying, no adhesion of both SA/SA2 and SA-Ca/
SA2-Ca gel films to glass Petri dish was observed, and
they could be peeled off from the Petri dish as one piece
(circular film) without any problem.
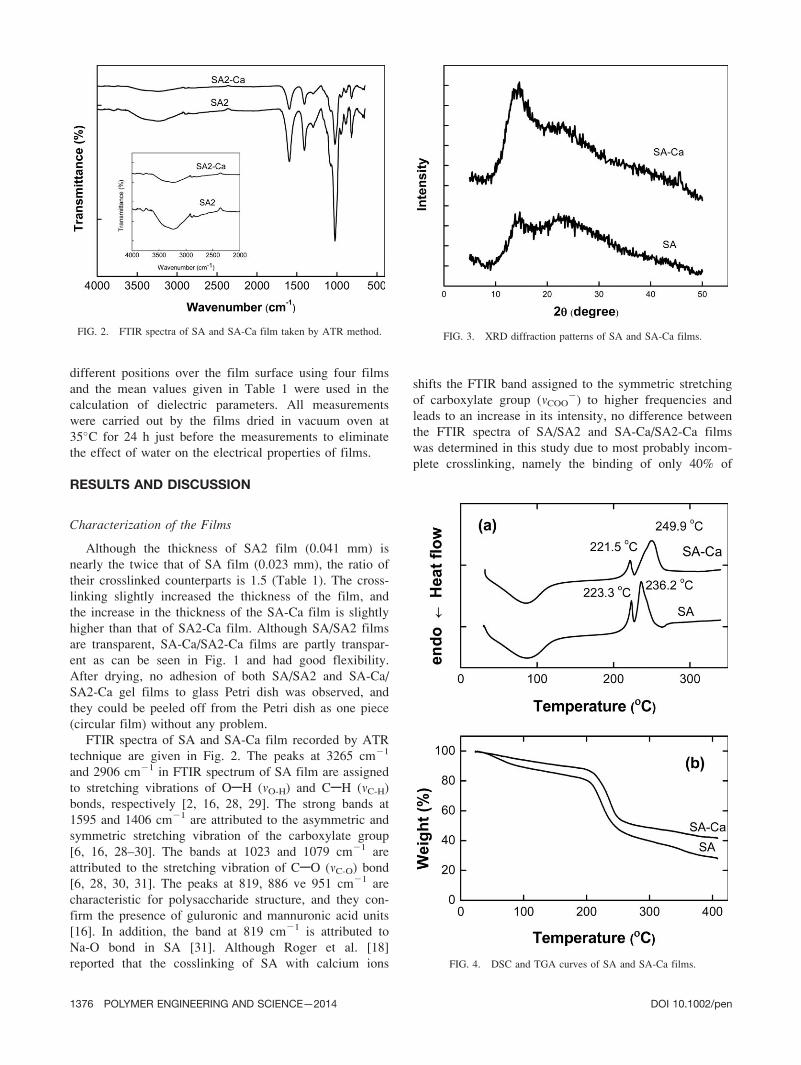
FTIR spectra of SA and SA-Ca film recorded by ATR
technique are given in Fig. 2. The peaks at 3265 cm21
and 2906 cm21 in FTIR spectrum of SA film are assigned
to stretching vibrations of OAH (mO-H) and CAH (mC-H)
bonds, respectively [2, 16, 28, 29]. The strong bands at
1595 and 1406 cm21 are attributed to the asymmetric and
symmetric stretching vibration of the carboxylate group
[6, 16, 28–30]. The bands at 1023 and 1079 cm21 are
attributed to the stretching vibration of CAO (mC-O) bond
[6, 28, 30, 31]. The peaks at 819, 886 ve 951 cm21 are
characteristic for polysaccharide structure, and they con-
firm the presence of guluronic and mannuronic acid units
[16]. In addition, the band at 819 cm21 is attributed to
Na-O bond in SA [31]. Although Roger et al. [18]
reported that the cosslinking of SA with calcium ions
shifts the FTIR band assigned to the symmetric stretching
of carboxylate group (mCOO2) to higher frequencies and
leads to an increase in its intensity, no difference between
the FTIR spectra of SA/SA2 and SA-Ca/SA2-Ca films
was determined in this study due to most probably incom-
plete crosslinking, namely the binding of only 40% of
FIG. 2. FTIR spectra of SA and SA-Ca film taken by ATR method. FIG. 3. XRD diffraction patterns of SA and SA-Ca films.
FIG. 4. DSC and TGA curves of SA and SA-Ca films.
1376 POLYMER ENGINEERING AND SCIENCE—2014 DOI 10.1002/pen

ACOONa groups of SA by Ca21 ions. Thus, the charac-
teristic peaks of crosslinked SA films appeared at the
same wave numbers as those of SA film. FTIR spectra of
SA-Ca/SA2-Ca films prepared in this work are in good
agreement with those of Ca21-crosslinked SA obtained by
Li et al. [32]. In addition, Huang et al. [5] did not
observed any difference between the FTIR spectra of Co-
alginate and Na-alginate due to crosslinking of Na-
alginate with Co21 ion, and our finding is consistent with
the literature findings.
The X-ray diffraction patterns of SA and SA-Ca films
are shown in Fig. 3. There is a weak and broad diffrac-
tion peak at 2h 5 14.6� in the diffractogram of SA film,
and it indicates the amorphous structure of SA. There is
no apparent difference between the XRD patterns of SA
and Ca21-crosslinked SA (Sa-Ca/SA2-Ca) films. As the
intensity of the peak at 2h 5 14.6� in XRD pattern of SA-
Ca film is slightly higher than that of SA film, it can be
concluded that ionic crosslinking of SA leads to a slight
increase in the crystallinity.
The thermal properties of SA and SA-Ca films were
investigated by DSC and TGA techniques, and DSC and
TGA curves of the films are given in Fig. 4a and b. In
DSC curve of SA film, there are one endothermic peak at
86.5�C and two exothermic peaks at 223.3 and 236.2�C.
The former (endothermic) peak is attributed to the loss of
adsorbed moisture from the film which could not be com-
pletely removed during drying [30, 33].
In DSC curve of Ca21 -crosslinked SA film (Fig. 4a),
the exothermic peaks appear at 221.5 and 249.9�C.
Because of the stiffening effect of the crosslinking, the
second peak for the decomposition of SA shifts from
236.2�C to higher (�250�C) temperature; however, no
great difference was determined between the DSC curves
of linear-chained SA and crosslinked SA films. Figure 4b
shows the weight loss of SA and crosslinked SA films as
a function of temperature. These thermograms show that
SA undergoes thermal degradation in two-stages. A total
of 15 and 20% weight losses for SA2-Ca40 and SA films,
respectively, observed in the temperature range 50–150�Ccan be attributed to the loss of moisture [34–37]. Because
the polysaccharides have a strong affinity for water, and
SA contains two hydroxyl segments and one carboxylate
segment, the water molecules can be bound to SA by the
hydrophilic ACOONa and –OH groups. Because 40% of
ACOONa groups of SA is bound by Ca21 ions, SA-Ca
film adsorbs less amount of moisture than SA film, and
for that reason, a lower amount of weight loss due to the
loss of moisture was determined for SA-Ca film than that
for SA film. The second-stage of thermal degradation
observed in the temperature range 200–260�C is attrib-
uted to the decomposition of side chains of SA [34, 37].
Further decomposition of main chain of SA occurs at
450�C [34]. During the thermal decomposition of SA, the
carboxylate side chains are eliminated at first from the
polymer chain at the temperatures between 200 and
250�C, and then hydroxyl groups beginning from 300�C
[36]. For the second step of decomposition, the initial
decomposition temperature for SA and SA-Ca films
increases from 190.28 to 195.98�C, respectively. The
weight losses in the second step of thermal degradation
for SA1 and SA2-Ca films between the temperatures of
195 and 270 are 38.4% and 35.5%, respectively, and they
are nearly the same. It means that the weight loss in the
second step of decomposition occurs due to degradation
of SA chain, namely the elimination of carboxylate
groups by CO2 release [37]. It is known that at medium
temperatures, SA decomposes to Na2CO3 [30, 38]. In the
case of mixed sodium/calcium alginate, namely SA-Ca
film, it will decompose to Na2CO3 and CaCO3 which
their content depend on the crosslink density. The weight
loss values at 400�C for SA and SA2-Ca films are 72 and
58%, respectively, and the residue remaining after the
degradation of crosslinked SA film (42%) is higher than
that (28%) of SA film as expected since the former con-
tains Ca21 ions and they can oxidate to CaCO3 under air
atmosphere.
In consistent with the findings of DSC analysis, there
is no great difference between the TGA curves of SA and
SA-Ca films as expected because all the carboxylate
groups of SA are not crosslinked. This clearly shows that
the incomplete (40%) crosslinking of SA did not appa-
rently change the thermal properties.
Swelling Measurements
The equilibrium swelling value (ESV) and the solubil-
ity percentages determined both in distilled water and in
0.1 M NaCl solution are given in Table 2. Almost 50 and
8% of crosslinked gel films were dissolved in distilled
water and in 0.1 M NaCl solution, respectively, and the
rest remained in the crosslinked film. Although the ESV
of Ca21-crosslinked SA films in distilled water was �350
gH2O/gpolymer, it decreased to �100 gH2O/gpolymer in salt
solution due to the decrease in the driving force for swel-
ling, namely the difference between the osmotic pressures
of water in the gel film and that in the surrounding salt
solution.
Dielectric Measurements
The dielectric properties are considered as an impor-
tant tool in studying structural transitions and molecular
TABLE 2. Percentage of solubility and equilibrium swelling values
(ESV) of crosslinked SA films in distilled water and in 0.1 M NaCl
solution.
Solubility (%) in ESV(gH2O/gpolymer) in
Film code
Distilled
water
NaCl solution
(0.1 M)
Distilled
water
NaCl solution
(0.1 M)
SA-Ca 56 6 2 5.9 6 0.2 375 6 12 104 6 2
SA2-Ca 49 6 1 9.3 6 0.3 315 6 10 107 6 3
DOI 10.1002/pen POLYMER ENGINEERING AND SCIENCE—2014 1377

mobility in polymers. Dielectric measurements were per-
formed at room temperature and the average humidity of
40%. The dielectric constant (e0), the dielectric loss (e00),and the conductivity (r) of the films as a function of fre-
quency are given in Fig. 5a–c. It is clear from the Fig. 5a
and b that both e0 and e00 of SA/SA2 film as well as SA-
Ca/SA2-Ca films decreased with the increase in fre-
quency. The dielectric constant (e0) indicates the amount
of the dipole alignment both induced and permanent. The
decrease in the dielectric constant with the increase in fre-
quency is due to the fact that the rotational motions of
the polar molecules of SA and SA-Ca films are not suffi-
ciently rapid as that of the change in the direction of elec-
tric field, and the polyelectrolyte molecules cannot keep
up with the increase in rate of change in the direction of
AC electric field. As a result, the polarization decreases
and reaches a constant value. It means that at higher fre-
quencies, the rotational motions of the molecules lag
behind the electric field. Therefore, the dielectric constant
decreases with the frequency [39, 40]. As seen from Fig.
5a that at the frequencies higher than 60 Hz, the dielectric
constant of SA film is higher than that of SA-Ca film
because crosslinking leads to decrease in the polarization
of the film. This behavior is displayed by many polymer
dielectrics and is resulting from the dielectric relaxation
phenomena of the polymers. Within the frequency range
FIG. 5. (a) Dielectric constant, (b) dielectric loss, and (c) conductance values of SA and SA-Ca films
toward frequency.
1378 POLYMER ENGINEERING AND SCIENCE—2014 DOI 10.1002/pen

investigated in that work, the dielectric relaxation
involves the dipolar (rotational) polarization, which
depends on the molecular structure of the material. In the
case of SA polymer, the dielectric constant is due to the
b-relaxation induced by polar groups on the side chains
[41, 42]. This relaxation with a secondary mechanism is
associated with a dipole component such as polar side
chains of SA, namely ACOO2 groups [43]. Although the
b-relaxation process is resulting from the multiple relaxa-
tions and its origin is not well understood yet [42], it is
clear from Fig. 5a that an apparent decrease in the dielec-
tric constant of SA is observed at the frequencies higher
than �1 kHz. In addition, it can be said that SA film
polarizes more than crosslinked SA film as expected. The
loss graph (Fig. 5b) displays a shoulder at about 10 kHz,
which confirms the presence of a well known b-
relaxation process in polymers [41]. The crosslinking of
SA makes difficult the b-relaxation because important
part (40%) of carboxylate (ACOO2) groups is bound by
Ca21 ions. Figure 5c shows the variation in conductivities
of the films with frequency. The conductivity of the films
generally increased at high frequencies. Below 1 kHz, the
conductivity of SA film is lower than SA-Ca film, how-
ever, at 1 kHz conductivities are almost the same, and at
the frequencies higher than 1 kHz, the conductivity of SA
film is higher than that of SA-Ca film. It means that in
FIG. 6. (a) Real (M0) and (b) imaginary parts (M00) of the electric modulus of SA and SA-Ca films toward
frequency.
FIG. 7. Cole-Cole plots of SA and SA-Ca films.
DOI 10.1002/pen POLYMER ENGINEERING AND SCIENCE—2014 1379
crosslinked films, the mobility of ions decreases at high
frequencies. In other words, the crosslinking of SA film
leads to more compact structure, and subsequently limited
(suppressed) the mobility of ions which is more effective
at high frequencies. The similar behavior was observed in
the dielectric loss values as seen from Fig. 5b. Figure 6
shows the frequency dependence of the real (M0) and the
imaginary parts (M00) of the electric modulus of the films.
Electric modulus is the reciprocal of the complex permit-
tivity, and its imaginary part (M00) gives information about
the relaxation time and the conductivity of the material
investigated. Very small values of M0 at lower frequencies
indicate the removal of electrode polarization. In the stud-
ied frequency range, no relaxation peaks in M0 or M00 vs
frequency graphs were observed for SA or SA-Ca films.
If we could able to measure dielectric properties at fre-
quencies higher than 100 kHz or we could crosslinked all
ACOONa groups of SA, a relaxation peak would be
observed in modulus (M00) graphs of SA-Ca films in the
investigated frequency range. Although the peak values in
modulus (M00) and frequency graphs of SA and SA-Ca
films are not clearly seen, it can easily be said that the
peak frequency for the imaginary part of the electric mod-
ulus (M00) of Ca21-crosslinked SA films is about 100 kHz
and it is obviously lower than that of SA film. The shift
in peak frequency to lower values indicates the increase
in the relaxation time and the conductivity [44, 45]. It
means that the relaxation time of linear chained SA mole-
cules is shorter than that of crosslinked SA film due to
decrease in the mobility of crosslinked SA molecules. As
known, the relaxation time can be defined as the time
which is required for the molecules to return from the
polarized form due to the electric field to random oriented
(disordered) form when the electric field was removed
[46]. Figure 7 shows the Cole-Cole plots of SA and SA-
Ca films. The impedance spectra show a semicircle
behavior corresponding to the charge-transfer process.
The diameter of the semicircle represents the charge-
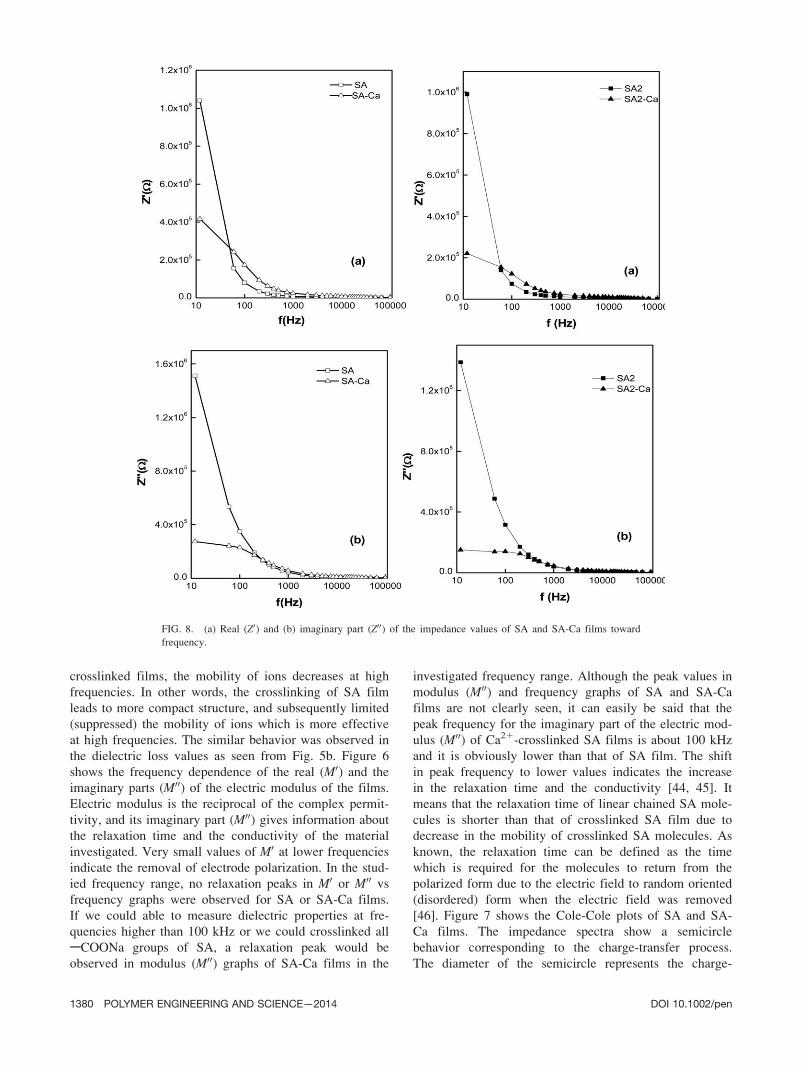
FIG. 8. (a) Real (Z0) and (b) imaginary part (Z00) of the impedance values of SA and SA-Ca films toward
frequency.
1380 POLYMER ENGINEERING AND SCIENCE—2014 DOI 10.1002/pen
transfer resistance, and the higher the diameter the higher
the charge transfer resistance of the material is. SA-Ca/
SA2-Ca film has a lower charge-transfer resistance than
SA/SA2 film due to presence of the by-product of cross-
linking reaction between SA and CaCl2, namely, Na1 and
Cl2 ions. Figure 8 shows the variation of calculated real
(Z0) and imaginary (Z00) parts of impedance of the films
with frequency. Both Z0 and Z00 values decrease with the
increase in frequency. At low frequencies (Fig. 8b), SA/
SA2 film has higher Z00 values compared to SA-Ca/SA2-
Ca film, and it means that SA/SA2 is less conductive
than the crosslinked SA film.
CONCLUSIONS
SA and Ca21-crosslinked SA gel films were prepared
and characterized by FTIR, XRD, DSC, and TGA meth-
ods. The effects of crosslinking on the thermal and dielec-
tric behaviors of SA films were investigated. All the
films were transparent in appearance. No apparent differ-
ence was determined between the thermal properties of
SA and Ca21-crosslinked SA films. The increase in peak
intensity in XRD patterns of SA-Ca film in comparison to
that in SA film confirmed the slight increase in the crys-
tallinity or ordered structure of the film. Dielectric con-
stant and dielectric loss values of both SA and SA-Ca
films decreased with the increase in frequency. The cross-
linking of SA with Ca21 ions decreased the b-relaxation
associated with the carboxylate groups of SA. Frequency
spectra of electric modulus, impedance and Cole-Cole
plots confirmed the higher conductance values of SA-Ca
films at low frequencies than those of SA film due to the
presence of by-product of crosslinking reaction between
SA and CaCl2.
REFERENCES
1. J.P. Zhang, Q. Wang, X.L. Xie, X. Li, and A.Q. Wang,
J. Biomed. Mater. Res. B, 92B, 205 (2010).
2. V.R. Babu, K.S.V.K. Rao, M. Sairam, B.V.K. Naidu, K.M.
Hosamani, and T.M. Aminabhavi, J. Appl. Polym. Sci., 99,
2671 (2006).
3. O. Sanli, N. Ay, and N. Isiklan, Eur. J. Pharm. Biopharm.,65, 204 (2007).
4. M. Saraswathi, K.M. Rao, M.N. Prabhakar, C.V. Prasad, K.
Sudakar, H.M.P.N. Kumar, M. Prasad, K.C. Rao, and
M.C.S. Subha, Desalination, 269, 177 (2011).
5. R.Y.M. Huang, R. Pal, and G.Y. Moon, J. Membr. Sci.,160, 101 (1999).
6. H. Sudhakar, C.V. Prasad, K. Sunitha, K.C. Rao, M.C.S.
Subha, and S. Sridhar, J. Appl. Polym. Sci., 121, 2717
(2011).
7. A.S. Reddy, S. Kalyani, N.S. Kumar, V.M. Boddu, and A.
Krishnaiah, Polym. Bull., 61, 779 (2008).
8. N.M. Mahmoodi, B. Hayati, and M. Arami, Ind. Crop.Prod., 35, 295 (2012).
9. K. Maxim, K. Valeri, and K. Yuri, J. Environ Sci-China,
20, 827 (2008).
10. R.M.P. Silva, J.P.H. Manso, J.R.C. Rodrigues, and R.J.L.
Lagoa, J. Environ Sci. Heal A, 43, 1311 (2008).
11. F. Lv, P. Zhu, C. Wang, and L. Zheng, J. Appl. Polym. Sci.,126, E383 (2012).
12. E.M. Zactiti and T.G. Kieckbusch, J. Food Eng., 77, 462
(2006).
13. H. Daemi and M. Barikani, Sci. Iran., 19, 2023 (2012).
14. E.M. Zactiti and T.G. Kieckbusch, Packag. Technol. Sci.,22, 349 (2009).
15. M. Esch, V.L. Sukhorukov, M. Kurschner, and U.
Zimmermann, Biopolymers, 50, 227 (1999).
16. S.K. Papageorgiou, E.P. Kouvelos, E.P. Favvas, A.A.
Sapalidis, G.E. Romanos, and F.K. Katsaros, Carbohydr.Res., 345, 469 (2010).
17. S.J. Rendevski and A.N. Andonovski, Polym. Bull., 54, 93
(2005).
18. S. Roger, D. Talbot, and A. Bee, J. Magn. Magn. Mater.,305, 221 (2006).
19. A. Rachocki, K. Pogorzelec-Glaser, C. Pawlaczyk, and J.
Tritt-Goc, Carbohydr. Res., 346, 2718 (2011).
20. P. Hedvig, Dielectric Spectroscopy of Polymers. Adam
Hilger, Bristol, (1977).
21. D.B.K. Ronald Pethig, Phys. Med. Biol., 32(8), 933 (1987).
22. H.P. Schwan, Ferroelectrics, 86(1), 205 (1988).
23. S. Yoshioka, Y. Aso, and T. Terao, Pharm. Res., 9, 607
(1992).
24. K. Mishima, A. Mimura, Y. Takahara, K. Asami, and T.
Hanai, J. Ferment. Bioeng., 72, 291 (1991).
25. S. Ikeda and H. Kumagai, J. Agr. Food Chem., 45, 3452
(1997).
26. S. Ikeda, H. Kumagai, and K. Nakamura, Carbohydr. Res.,301, 51 (1997).
27. A. KELCO, Alginate products for scientific water control,Division of Merck&Co.Inc., England (1992).
28. G. Taskın, O. Sanlı, and G. Asman, Appl. Surf. Sci., 257,
9444 (2011).
29. S.R. Kim, S.H. Yuk, and M.S. Jhon, Eur. Polym. J., 33,
1009 (1997).
30. J. Ostrowska-Czubenko and M. Gierszewska-Dru _zy�nska,
Carbohydr. Polym., 77, 590 (2009).
31. D. Solpan, M. Torun, and O. G€uven, J. Appl. Polym. Sci.,108, 3787 (2008).
32. X.X. Li, H.G. Xie, J.Z. Lin, W.Y. Xie, and X.J. Ma, Polym.Degrad. Stab., 94, 1 (2009).
33. B. Smitha, S. Sridhar, and A.A. Khan, Eur. Polym. J.,41(8), 1859 (2005).
34. C.B. Xiao, L.H. Weng, and L.N. Zhang, J. Appl. Polym.Sci., 84(13), 2554 (2002).
35. T.S. Pathak, J.H. Yun, S.J. Lee, D.J. Baek, and K.J. Paeng,
Carbohydr. Polym., 78, 717 (2009).
36. A. Sand, M. Yadav, and K. Behari, J. Appl. Polym. Sci.,118, 3685 (2010).
37. T.M.M. Swamy, B. Ramaraj, and Siddaramaiah, J. Macro-mol. Sci. Part A, 47, 877 (2010).
38. J.P. Soares, J.E. Santos, G.O. Chierice, and E.T.G.
Cavalheiro, Ecl�etica Qu�ımica, 29, 57 (2004).
DOI 10.1002/pen POLYMER ENGINEERING AND SCIENCE—2014 1381

39. M.J. Zhan, R.P. Wool, and J.Q. Xiao, Compos. Part A-Appl.S, 42, 229 (2011).
40. N.N. Rozik, S.L. Abd-El Messieh, A.A. Yaseen, and A.-E.-
H.A. Shouk, Polym. Eng. Sci., 53, 874 (2013).
41. C. Jean-Mistral, A. Sylvestre, S. Basrour, and J.J. Chaillout,
Smart Mater. Struct., 19, 075019 (9 pp) (2010).
42. J.P. Runt and J.J. Fitzgerald, Dielectric Spectroscopy ofPolymeric Materials, Fundamentals and Applications,
American Chemical Society, Washington, DC (1997).
43. P. Sommer-Larsen, G. Kofod, M.H. Shridhar, M.
Benslimane, and P. Gravesen, Smart Structures and Materi-
als 2002: Electroactive Polymer Actuators and Devices
(Eapad) 4695, 158 (2002).
44. M.G. Han and S.S. Im, J. Appl. Polym. Sci., 82, 2760
(2001).
45. J.J. Liu, C.G. Duan, W.G. Yin, W.N. Mei, R.W. Smith, and
J.R. Hardy, J. Chem. Phys., 119, 2812 (2003).
46. T. Blythe and D. Bloor, Electrical Properties of Polymers,
Cambridge University Press, New York (2005).
1382 POLYMER ENGINEERING AND SCIENCE—2014 DOI 10.1002/pen
Copyright © 2022 FDOKUMEN