Development of EST-SSR Markers by Data Mining in Three Species of Shrimp: Litopenaeus vannamei ,...
16
Development of EST-SSR Markers by Data Mining in Three Species of Shrimp: Litopenaeus vannamei, Litopenaeus stylirostris, and Trachypenaeus birdy Franklin Pe ´rez, 1 Juan Ortiz, 1 Mariuxi Zhinaula, 1 Cesar Gonzabay, 1 Jorge Caldero ´n, 1 Filip A.M.J. Volckaert 2 1 Fundacio ´ n CENAIM-ESPOL, Km. 30.5 Via ´ Perimetral, Campus Polite ´cnico, Guayaquil, Ecuador 2 Katholieke Universiteit Leuven, Laboratory of Aquatic Ecology, Ch. de Be ´riotstraat 32, B-3000, Leuven, Belgium Received: 4 August 2004 / Accepted: 8 February 2005 / Online publication: 14 July 2005 Abstract We report on the data mining of publicly available Litopenaeus vannamei expressed sequence tags (ESTs) to generate simple sequence repeat (SSRs) markers and on their transferability between related Penaeid shrimp species. Repeat motifs were found in 3.8% of the evaluated ESTs at a frequency of one repeat every 7.8 kb of sequence data. A total of 206 primer pairs were designed, and 112 loci were amplified with the highest success in L. vannamei. A high percentage (69%) of EST-SSRs were transfer- able within the genus Litopenaeus. More than half of the amplified products were polymorphic in a small testing panel of L. vannamei. Evaluation of those primers in a larger testing panel showed that 72% of the markers fit Hardy-Weinberg equilibrium, which shows their utility for population genetic analysis. Additionally, a set of 26 of the EST-SSRs were eval- uated for Mendelian segregation. A high percentage of monomorphic markers (46%) proved to be poly- morphic by singles-stranded conformational poly- morphism analysis. Because of the high number of ESTs available in public databases, a data mining approach similar to the one outlined here might yield high numbers of SSR markers in many animal taxa. Key words: Data mining — EST-SSR — linkage mapping — Litopenaeus — population genetics — type I markers Introduction Microsatellites or simple sequence repeats (SSRs) are highly polymorphic sequences present in plant and animal species (Toth et al., 2000). By virtue of their codominant nature, SSRs have a wide range of applications including genetic mapping, quantitative trait loci (QTL) association, kinship analysis, popu- lation genetics, and evolutionary studies. Most of the markers developed by this approach correspond to type II markers that lack known functions (Weber, 1990). Although their usefulness for genetic analysis has been widely demonstrated, orthodox approaches to their development require considerable invest- ment. Traditionally, SSR isolation has relied on the screening of genomic libraries using repetitive probes and sequencing of positive clones in order to develop locus-specific primers. Expressed sequence tags (ESTs) are generated by single-pass sequencing of complementary DNA clones obtained by reverse transcription of messen- ger RNA (Putney et al., 1983). High throughput sequencing generates information on thousands of ESTs, which can be compared with other DNA or protein sequences available in public databases. At the same time the new sequences are made acces- sible in various databases, increasing the growing information on gene expression. As ESTs are the direct product of gene expression, their analysis leads directly to description of the transcriptome, which is not the case with whole genome sequenc- ing projects. The use of ESTs as genetic markers can extend their utility beyond gene expression studies. Mouse sequences corresponding to the 5¢ untranslated regions have demonstrated the usefulness of EST se- quences and single-stranded conformational poly- Correspondence to: Franklin Pe ´rez; E-mail: franklin@cenaim. espol.edu.ec 554 DOI: 10.1007/s10126-004-5099-1 Volume 7, 554–569 (2005) Springer Science+Business Media, Inc. 2005
Transcript of Development of EST-SSR Markers by Data Mining in Three Species of Shrimp: Litopenaeus vannamei ,...

Development of EST-SSR Markers by Data Mining in Three Speciesof Shrimp: Litopenaeus vannamei, Litopenaeus stylirostris, andTrachypenaeus birdy
Franklin Perez,1 Juan Ortiz,1 Mariuxi Zhinaula,1 Cesar Gonzabay,1 Jorge Calderon,1
Filip A.M.J. Volckaert2
1Fundacion CENAIM-ESPOL, Km. 30.5 Via Perimetral, Campus Politecnico, Guayaquil, Ecuador2Katholieke Universiteit Leuven, Laboratory of Aquatic Ecology, Ch. de Beriotstraat 32, B-3000, Leuven, Belgium
Received: 4 August 2004 / Accepted: 8 February 2005 / Online publication: 14 July 2005
Abstract
We report on the data mining of publicly availableLitopenaeus vannamei expressed sequence tags(ESTs) to generate simple sequence repeat (SSRs)markers and on their transferability between relatedPenaeid shrimp species. Repeat motifs were found in3.8% of the evaluated ESTs at a frequency of onerepeat every 7.8 kb of sequence data. A total of 206primer pairs were designed, and 112 loci wereamplified with the highest success in L. vannamei.A high percentage (69%) of EST-SSRs were transfer-able within the genus Litopenaeus. More than half ofthe amplified products were polymorphic in a smalltesting panel of L. vannamei. Evaluation of thoseprimers in a larger testing panel showed that 72% ofthe markers fit Hardy-Weinberg equilibrium, whichshows their utility for population genetic analysis.Additionally, a set of 26 of the EST-SSRs were eval-uated for Mendelian segregation. A high percentageof monomorphic markers (46%) proved to be poly-morphic by singles-stranded conformational poly-morphism analysis. Because of the high number ofESTs available in public databases, a data miningapproach similar to the one outlined here mightyield high numbers of SSR markers in many animaltaxa.
Key words: Data mining — EST-SSR — linkagemapping — Litopenaeus — population genetics —type I markers
Introduction
Microsatellites or simple sequence repeats (SSRs) arehighly polymorphic sequences present in plant andanimal species (Toth et al., 2000). By virtue of theircodominant nature, SSRs have a wide range ofapplications including genetic mapping, quantitativetrait loci (QTL) association, kinship analysis, popu-lation genetics, and evolutionary studies. Most ofthe markers developed by this approach correspondto type II markers that lack known functions (Weber,1990). Although their usefulness for genetic analysishas been widely demonstrated, orthodox approachesto their development require considerable invest-ment. Traditionally, SSR isolation has relied on thescreening of genomic libraries using repetitiveprobes and sequencing of positive clones in order todevelop locus-specific primers.
Expressed sequence tags (ESTs) are generated bysingle-pass sequencing of complementary DNAclones obtained by reverse transcription of messen-ger RNA (Putney et al., 1983). High throughputsequencing generates information on thousands ofESTs, which can be compared with other DNA orprotein sequences available in public databases. Atthe same time the new sequences are made acces-sible in various databases, increasing the growinginformation on gene expression. As ESTs are thedirect product of gene expression, their analysisleads directly to description of the transcriptome,which is not the case with whole genome sequenc-ing projects.
The use of ESTs as genetic markers can extendtheir utility beyond gene expression studies. Mousesequences corresponding to the 5¢ untranslatedregions have demonstrated the usefulness of EST se-quences and single-stranded conformational poly-
Correspondence to: Franklin Perez; E-mail: [email protected]
554 DOI: 10.1007/s10126-004-5099-1 � Volume 7, 554–569 (2005) � Springer Science+Business Media, Inc. 2005
morphism (SSCP) analysis for generating large num-bers of polymorphic markers and their use in geneticmapping (Brady et al., 1997). The drawing on ESTswithout polarity selection rendered a high numbers ofpolymorphic markers in L. monodon useful for link-age mapping and population genetics studies (Tong etal., 2002). Intron sequences are also highly polymor-phic, and the design of primers flanking those areas,based on in silico comparisons of ESTs with completegene sequences available for different species, is pos-sible using ESTs in the target species. This approachhas been termed exon-primed intron-crossing (EPIC)polymerase chain reaction (PCR) (Bierne, 2000). Sim-ilar to noncoding DNA, EST sequences also containSSR sequences, which can be used to developed SSRmarkers (Liu et al., 1999; Whan et al., 2000; Eujayl etal., 2002; Karsi et al., 2002).
A high percentage of publicly available plant ESTsequences, (between 1.1% and 4.8%) have SSRs (Sahaet al., 2003). Although the percentage of positiveclones containing SSRs in nonenriched genomic li-braries might be higher, information on ESTs isreadily accessible and can be immediately used fordevelopment of specific markers known as EST-SSRs. As EST-SSRs are based on exon sequences,which are highly conserved, they are theoreticallytransferable between taxa. Furthermore, BLASTcomparison with protein databases leads to the rapidputative identification of gene function of the EST-derived markers.
The use of molecular markers in shrimp geneticscan ensure the long-term sustainability of breedingprograms, speed up the genetic gain rate, and lowerthe costs. Here we report on the development ofEST-SSR markers in the shrimps Litopeanaeusvannamei, L. stylirostris and Trachypenaeus birdy(Penaeidae, Crustacea) by data mining. EST-SSRsproved to be an effective approach for the develop-ment of transferable molecular markers. We alsodemonstrate the usefulness of EST-SSRs for popula-tion genetics studies and linkage mapping.
Materials and Methods
Data Mining. We downloaded 5832 L. vannameiEST sequences from the Marine Genomics reposi-tory (http://www.marinegenomics.org). Redundantclones were removed using a local nucleotide BLASTsearch with Bioedit Sequence Alignment EditorSoftware Version 7.0.1 (Hall, 1999). Short tandemrepeats were identified using Tandem Repeats Finder(TRF) software (Benson, 1999) set to report tandemareas with a minimum alignment score of 20 bp(equivalent to finding repeats of 10-bp minimumlength) containing mono-, di-, tri-, tetra-, and pen-
tanucleotide repeats. The minimum number ofmismatches and indels were 3 and 7, respectively.The results for each positive hit were exported fromthe individual Web page to a data sheet. Sequencescontaining poly(A) tails or tandem repeats with lessthan 30 bases far from the start or end of their ESTsequences were excluded from further analysis.
PCR Analysis. Primer design using Primer Pre-mier Software 5.0 (Premier Biosoft International,Palo Alto, Calif.) was carried out for each suitableEST-positive hit. Primers were designed with thedefault software parameters for a minimum andmaximum length of 16 and 18 bp, respectively. PCRamplification for each primer was carried out underthe following conditions: MgCl2 2 mM, 1· PCRbuffer (Promega), 200 lM of each dNTP, 0.008 ll oftaq polymerase per microliter of reaction (5 U/ll,Promega), and 0.4 lM of forward and reverse primer.Each reaction was carried out in 6 ll of PCR mixwith 0.75 ll of DNA sample. The PCR reaction wascarried out using a touchdown protocol (Don et al.,1991), as follows: initial denaturation at 94�C for 3minutes, 12 cycles with denaturation at 92�C for 30seconds, annealing at 55�C for 30 seconds in the firstcycle, diminishing 1�C each cycle, and extension at72�C for 1 minute. An additional 18 PCR cycles wererun using the same program with annealing at 43�Cand the denaturation and extension conditions aspreviously indicated. The program was finished witha final extension at 72�C for 1 minute.
PCR products were separated in nondenaturing6% polyacrylamide gels (29:1 acrylamide-bisacryla-mide mix in 1· TBE buffer) in vertical sequencingchambers at room temperature. Band visualizationfor all products was accomplished by silver staining(Dinesh et al., 1995). Gel documentation was carriedout by a digital camera (Olympus Camedia C-5000)in Tiff mode. The picture was transformed to a grayscale and 16 bit mode with Adobe Photoshop 6.0.The Gene Profiler software 4.05 (Scanalytics Inc.,Fairfax, Va.) was used for image analysis.
Primary Primer Screening. Primer pairs wereinitially evaluated in a multi species test panelcontaining 6 L. vannamei (2 parentals of a linkagemapping panel and 4 wild individuals), 2 wildL. stylirostris, and 2 wild T. birdy. Wild sampleswere collected along the Ecuadorian coast. DNA wasextracted following a CTAB-based protocol (Shahja-han et al., 1995).
Analysis of Genetic Diversity and MendelianSegregation. Genetic diversity was tested using aset of 16 wild L. vannamei collected in Pedernales
FRANKLIN PEREZ ET AL.: DATA MINING FOR EST-SSRS IN PENAEID SHRIMPS 555

(00� 05¢ N; 80� 06¢ W), Ecuador. Samples were DNAextracted with a fat protocol: 400 ll of 5% Chelexplus 2 ll of proteinase K (20 mg/ll), heating at 65�Cfor 2 hours, boiling for 3 minutes, centrifugation at12,000 rpm for 10 minutes, and transfer of thesupernatant to 96-well plates. DNA was stored at)20�C for 9 months. This set was amplified with atotal of 59 primers that showed polymorphism in theinitial screening. Expected and observed heterozyg-osities, and Hardy-Weinberg equilibrium (HWE)were tested statistically by an empirical test (MonteCarlo simulation with 10 batches and 1000 permu-tations per run) using TFPGA software (Miller 1997).
Mendelian segregation was tested in a smallmapping panel comprising both parents and 14progeny, with the primers showing segregation inthe initial primer screening. These DNA sampleswere extracted by the CTAB method (Shahjahanet al., 1995). A v2 test was used to evaluate the seg-regation hypothesis suggested by the parental geno-types.
SSCP Analysis. Monomorphic markers from theinitial screening were amplified in a test panelcomprising 14 wild individuals and 2 parentals of amapping panel. DNA was extracted by the CTABmethod (Sbahjahan et al., 1995). PCR samples wereloaded with 2 ll of formamide 37% and 3 ll of bluedye, heated at 94�C in a thermocyeler for 5 minutes,and ice cooled. Product separation was carried out in8% nondenaturating gels (29:1 acrylamide-bis-acrylamide mix in 1· TBE buffer) at 10� to 15�C in arefrigerator. Staining, documentation, and gel anal-ysis were accomplished as previously explained.
BLAST Analysis of Amplified Markers. Allamplified marker sequences were compared againstthe GenBank nonredundant protein database usingthe Web-based HT BLAST Service (Wang and Mu,2003) (http://mammoth.bii.a-star.edu.sg/webservic-es/htblast/index.html). All positive hits with scoreslarger than 60 and e-values lower 1 · 10)10 were in-cluded in our report.
Results
Data Mining. Out of 5832 downloaded ESTs 2848were nonredundant. A total of 475 EST sequenceshad microsatellite-type repeats, Of these sequences138 displayed mononucleotide repeats that mightcorrespond to the cDNA poly(A) tail close to thestart or the end of the sequence. Fifty-three se-quences were eliminated from the analysis becausethe vicinity of the repeats to the start or the end ofthe sequence precluded primer design. A total of 284sequences containing 89 different repeat motifs wereisolated (Table 1). The most frequent repeat motifswere trinucleotides, followed by mononucleotidesand dinucleotides, respectively. The number of re-peats ranged from a minimum of 3 for pentanucle-otide repeats to a maximum of 143 for a dinucleotidesequence. A total of 1353 kb of Litopeanaeusvannamei EST data was screened for the presence ofrepeat motifs, giving a frequency of one SSR every4.01 kb (this calculation includes the 53 ESTs thatshowed repeats too close to the start or end of thesequence).
Two hundred six primers pairs were designedfrom the 284 SSR-containing sequences. These re-sults showed that 7.2% of the nonredundant ESTsequences had repeats appropriate for primer design.
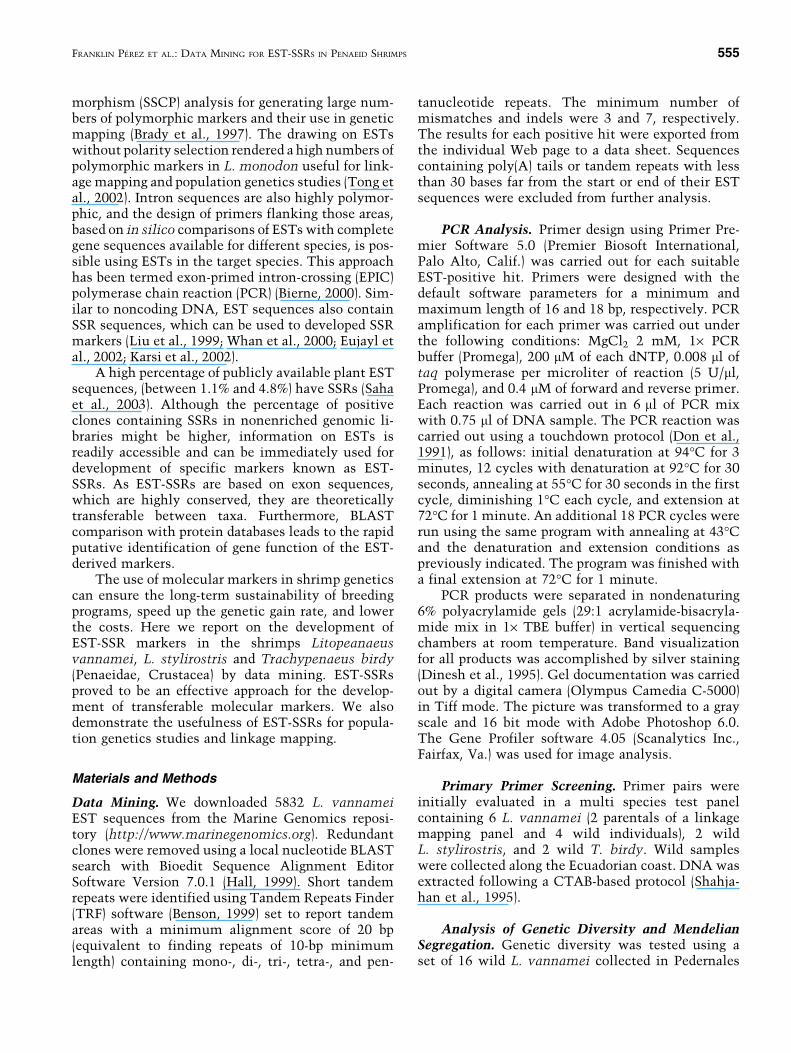
Primary Primer Screening. Of the 206 designedprimers, 112 (54%) yielded PCR products (Table 2).The highest success rate of PCR amplification wasobserved for L. vannamei (105 primer pairs ampli-fied; 2 showing multiple bands), followed byL. stylirostris (76 primers; 8 with multiple bands)and Trachypenaeus birdy (29 primers; 12 showingmultiple bands).
The number of polymorphic markers in the pri-mary screening was high despite the reduced numberof individual samples per species. In L. vannamei,56% of the amplified products (59 products)displayed between 2 and 9 alleles, whereas inL. stylirostris 32% (24 products) gave between 2 and4 alleles. In T. birdy the percentage of polymorphic
Table 1. SSR Motifs Found by Data Mining of Litopenaeus vannamei EST Sequencesa
Number Number ofNumber of repeats
Motif type of ESTs different motifs Three most frequent motifs Min Max
Mononucleotides 69 3 T(66); A(1); C(2) 15 55Dinucleotides 60 10 AT(14); GT(13);AG(12) 8 143Trinucleotides 74 30 ATT(10);GCT(8);CTT(7) 5 25Tetranucleotides 38 27 AAAG(4); ATTT(4); TACA(3) 4 30Pentanucleotides 43 19 AAAAT(6); AGGTT(5); GTTTT(4) 3 14Total 284 89aData are reported including reverse and complementary SSR sequences without further elaboration.
556 FRANKLIN PEREZ ET AL.: DATA MINING FOR EST-SSRS IN PENAEID SHRIMPS

Tab
le2.
EST
-SSR
Mar
ker
san
dP
oly
morp
his
mIn
form
atio
nD
evel
oped
from
Lit
op
en
aeu
svan
nam
ei
EST
sin
aSm
all
Mu
ltis
pec
ies
Tes
tin
gpan
elof
L.van
nam
ei,
L.
styli
rost
ris,
and
T.
bir
dy
a
Locu
sE
ntr
yP
rim
ers
5¢-
3¢
Repeat
seq
uen
ce
Expecte
dL
.van
am
ei
L.
styli
rost
ris
T.
byrd
i
CN
M-M
G332
>2403
AC
TG
GA
CT
AA
GC
AA
GG
(T)5
C(T
)8G
(T)5
196
204(1
)219–2
37(3
)G
AT
TT
AC
AA
CA
AG
AA
GA
AA
(T)7
CN
M-M
G334
>2578
GA
GT
TC
CA
AT
GT
AA
GT
AG
(A)7
T(A
)3G
(A)T
124
129(1
)129(1
)A
AA
AT
GT
AG
GT
CG
GT
C(A
)4T
(A)4
CN
M-M
G335
>3955
AG
CC
AG
GA
AG
AG
GA
GG
(GA
GC
)112
112(1
)112(1
)112(1
)C
AT
CG
CC
AG
AA
AG
AC
AG
CN
M-M
G338
>4799
TG
CT
CA
AG
TC
GT
TA
CT
(TT
TG
)4116
119(1
)119(1
)G
AG
GT
TT
CT
GT
TC
TA
TA
AC
NM
-MG
339
>6023
AA
AC
AA
CA
TA
TT
GC
AG
TT
C(A
CA
AA
)4162
159–1
91(8
)A
AG
CG
TC
AG
AT
TC
CA
GC
NM
-MG
344
>7025
TT
AC
GG
GT
GA
AG
TG
TT
(AC
)7289
309(1
)304–3
09(2
)T
TT
AT
GC
TT
CC
CT
AC
CC
NM
-MG
345
>8364
GA
AG
TG
AG
CT
TG
GC
AT
CC
A(T
C)4
CC
(TC
)5109
(MB
)(M
B)
(MB
)G
TA
GA
GC
AG
CG
AG
CC
AG
CC
NM
-MG
347
2630
TG
AT
CG
CA
AC
AA
TA
AA
G(T
GA
)6287
309–3
16(3
)G
TC
GA
AG
CT
GG
AA
AC
TC
NM
-MG
350
>5810
AC
AG
AA
AA
CC
AA
GC
AA
(GT
)4T
T(G
T)6
TT
245
256–2
76(3
)A
CG
GG
AT
CA
TA
GA
CA
GC
(GT
)2A
T(G
T)3
AT
(GT
)C
NM
-MG
351
>6093
GC
AA
AC
AG
GA
GA
CA
AT
(T)2
0218
216–2
27(4
)233(1
)C
GG
AC
TC
TA
GC
AA
TA
AC
NM
-MG
354
>7065
AA
GA
CA
GA
AA
GG
GT
GA
(T)1
5190
203–2
14(4
)214(1
)C
AA
GA
GG
GA
GA
AA
GT
AG
CN
M-M
G355
>7175
TG
GC
AT
TC
AT
CT
TT
GG
(AA
AT
)A
TA
T262
274–2
30(2
)275–2
79(2
)277(1
)A
AG
AG
GC
AC
TT
CA
TC
C(A
AA
T)2
AA
TT
(AA
AT
)C
NM
-MG
356
>7188
TG
CG
TT
CA
CA
TT
TC
CA
(GA
TA
)G
AG
A(G
AT
A)3
177
180–1
92(2
)A
AT
TG
AG
TG
TC
CC
TT
GC
GA
CN
(GA
TA
)3C
NM
-MG
357
>7190
GC
TT
GA
AT
CG
CT
AC
TG
C(C
TG
)6C
TA
(CT
G)3
278
287–2
90(2
)288(1
)G
TT
GC
TG
CC
AC
TC
AT
TC
NM
-MG
359
>7229
TG
AC
AG
TA
AC
TC
CC
AA
AT
(GA
TT
)3195
204(1
)254(1
)G
AA
TG
CA
GG
AA
AC
AT
GC
NM
-MG
362
>2630
TA
CT
TG
GA
CC
TC
AG
TC
A(A
AA
AC
)A
AA
199
192–2
24(7
)G
CA
CG
CT
TA
GT
CT
CA
A(A
AA
AC
)2C
NM
-MG
363
>5567
TG
CC
TA
AA
CC
CA
AG
TC
(AT
)2A
C(A
T)3
GT
113
121(1
)C
AG
TG
GA
AT
AT
GA
AA
TA
AG
AA
A(A
T)7
CN
M-M
G364
>5587
CG
TC
GT
AG
TC
AC
AA
GA
T(T
A)2
TC
(TA
)7166
170–1
73(2
)C
AG
TA
TC
AA
TA
CC
GT
CC
TC
NM
-MG
365
>5998
CT
TC
AT
AC
CC
AT
TC
TT
TC
T(C
TT
C)4
300
305(1
)300(1
)G
CA
AT
AG
GC
TA
CA
GT
TC
CC
NM
-MG
366
>6145
TC
AC
TT
TC
CA
AA
TC
AA
AA
C(A
G)3
AA
(AG
)2196
199(1
)C
TA
GC
AA
TC
TT
AT
TA
TT
AC
TA
CC
GG
(AG
)7C
NM
-MG
367
>6328
AA
AC
CA
CC
CT
GA
CC
AT
C(A
TT
TT
)4284
281–3
08(9
)256(1
)C
TG
TG
CC
AA
AT
TA
CA
AG
C
(con
tin
ued
)
FRANKLIN PEREZ ET AL.: DATA MINING FOR EST-SSRS IN PENAEID SHRIMPS 557

Tab
le2.C
on
tin
ued
Locu
sE
ntr
yP
rim
ers
5¢-
3¢
Repeat
seq
uen
ce
Expecte
dL
.van
am
ei
L.
styli
rost
ris
T.
byrd
i
CN
M-M
G369
>6676
AG
CA
AG
CA
TT
CC
TC
CT
A(T
)19
239
251–2
55(2
)249–2
51(2
)T
TG
TG
GT
CG
AA
CC
TA
AA
CC
NM
-MG
370
>7353
AT
AG
CG
GA
CC
AC
CT
AG
(AC
AA
)2A
AT
AA
228
239(1
)C
TT
CC
GT
AA
AT
CT
TG
G(A
CA
A)3
CN
M-M
G371
>7446
CC
AA
GA
GG
GA
GT
AG
AA
A(T
A)6
TG
(TA
)A
A268
292–2
97(2
)G
GA
TA
AA
CA
CG
AA
AC
C(T
A)3
T(T
A)2
CN
M-M
G372
>7462
TG
GA
TT
TG
CC
GA
TT
GA
(TT
A)5
252
265–2
92(2
)265(1
)T
CC
CA
GC
AC
TT
GT
CA
TC
CN
M-M
G373
>7527
GA
TG
TC
TT
AT
TG
GA
AA
(AA
GA
A)3
170
177(1
)C
AG
AG
CA
GA
TA
TG
GA
AC
NM
-MG
374
>7553
TT
GA
AA
AG
CA
AA
GA
AC
(AT
)7200
209(1
)209(1
)C
TT
GG
CA
GG
AG
TA
GT
AC
NM
-MG
378
>2496
AA
GG
GT
GA
AG
CA
TA
T(C
A)4
GA
(CA
)5199
207(1
)207(1
)291(1
)G
TG
TT
TG
GG
TT
GG
TA
TC
NM
-MG
379
>2545
GC
AC
GA
TG
GT
TC
AG
TA
(TG
)3(T
T)2
(TG
)2248
257–2
60(2
)C
CA
AT
GC
AA
AA
TA
CA
GA
(TT
)(T
G)5
TA
(TG
)4C
NM
-MG
380
>5602
CG
AG
CG
TT
AT
CA
AA
TG
(AT
T)3
GT
T(A
TT
)5238
237–2
60(6
)257–2
61(2
)G
AA
AT
GA
TG
GG
GA
AG
AC
NM
-MG
383
>6156
TT
CC
TC
GT
CA
TT
TC
AC
(TA
)2T
G(T
A)4
C(T
A)4
268
247–2
83(3
)T
GC
TT
AC
AC
CG
CC
AG
AC
A(T
A)2
CN
M-M
G384
>6534
AT
CG
GG
AA
TA
CA
AT
CG
(AA
AC
A)5
227
227–2
47(5
)A
AC
CC
TA
AC
AA
AC
AA
TA
AG
CN
M-M
G386
>6623
CG
AG
CA
CA
GG
AA
GA
TA
(AA
AA
C)3
257
271–2
74(2
)273(1
)339(1
)T
CT
GG
GA
GA
AG
GG
AT
AC
NM
-MG
387
>6636
CA
GC
TC
AT
AC
GG
AG
AC
(AA
CA
)2T
AT
A221
212–2
23(3
)223(1
)C
TT
GC
GT
GA
AA
TT
GT
T(A
AC
A)2
AG
CA
(AA
CA
)C
NM
-MG
390
>7251
CG
TA
AG
AT
GT
GC
CA
GT
(TG
A)5
248
254–2
60(2
)254(1
)C
AG
TT
AT
AA
AG
TC
AA
AA
GT
AC
NM
-MG
393
>2113
TT
TG
AC
GG
AA
TG
AG
CA
(TT
TT
C)
(T)8
(TT
TT
C)5
267
293–2
99(3
)G
GG
GA
AA
TT
AG
TT
AG
AG
GC
NM
-MG
396
>2518
GT
TC
TC
GA
AC
AT
GG
GA
(AA
AC
)3295
319(1
)326–3
35(2
)G
GG
TG
AT
GC
AA
CC
TA
TC
NM
-MG
397
>2809
GA
CT
TG
GA
AG
GG
AA
CT
G(A
GA
AA
A)
AA
100
105(1
)105(1
)101–1
05(2
)A
GA
AA
TA
AA
GG
CT
CT
AT
GC
(AG
AA
AA
)2A
AC
NM
-MG
398
>2880
GG
GA
AG
AA
TA
TG
TA
AT
G(A
GA
A)2
(CA
TA
)5178
177–1
97(6
)T
AA
CA
AG
TG
CC
TG
AA
AC
NM
-MG
401
>7364
GA
CA
TG
AG
GT
AT
AG
CC
AT
TA
(TT
GT
)4208
212(1
)268(1
)214(1
)T
AT
GC
AC
CC
TG
CT
GA
CC
NM
-MG
402
>7415
CT
TT
TG
GC
TG
GC
TT
AC
(AG
AA
A)3
178
187–1
94(3
)T
TC
CT
TT
TG
AT
CT
AC
AT
TG
CN
M-M
G403
>7540
TT
TC
TT
GA
GA
AG
GG
AG
(TA
A)5
T(T
AA
)4285
299(1
)G
CA
AT
CT
TA
CA
TG
GT
GG
CN
M-M
G405
>7789
GT
GA
CT
GC
CC
TT
TC
TA
CC
(GA
)17
251
298–3
17(4
)320–3
46(2
)C
TT
CC
TT
GC
AC
GA
TT
TT
(con
tin
ued
)
558 FRANKLIN PEREZ ET AL.: DATA MINING FOR EST-SSRS IN PENAEID SHRIMPS

Tab
le2.C
on
tin
ued
Locu
sE
ntr
yP
rim
ers
5¢-
3¢
Repeat
seq
uen
ce
Expecte
dL
.van
am
ei
L.
styli
rost
ris
T.
byrd
i
CN
M-M
G406
>7797
GA
TA
AA
GA
AG
CG
AG
AA
CG
(GA
)18
256
318–3
54(8
)333–3
63(2
)C
TA
TG
GC
TA
GA
TC
CG
AG
AC
NM
-MG
407
>2077
GT
CT
CC
TT
GC
CC
GT
GT
C(T
TT
CT
)4286
293–2
96(2
)C
GA
GT
CC
GT
TG
AT
CC
TT
CN
M-M
G408
>2272
AT
GT
AG
TC
CT
TA
AC
CC
AT
TC
(T)1
6263
(MB
)G
GT
CA
TC
AG
TC
CT
GC
TC
TC
NM
-MG
412
>5818
GC
CA
TT
TG
AT
TG
CT
CT
(GT
)8235
236–2
45(2
)235(1
)T
GA
CT
TG
GT
CT
TT
GT
TA
GC
NM
-MG
416
>6631
TG
CC
AG
TG
CC
AT
TT
GA
(TA
T)4
TT
T(T
AT
)2258
286–2
88(2
)C
CT
CC
TC
CT
CC
CA
AC
TC
NM
-MG
417
>7337
TA
AG
TT
TC
CG
TA
GT
CT
CA
(AT
G)2
GT
G(A
TG
)4205
212(1
)294(1
)C
AT
CA
TT
AT
CA
TT
AT
CG
TT
GA
TA
(AT
G)2
AT
AC
NM
-MG
418
>7393
TA
GC
CA
AC
GA
AC
AA
GC
(TA
A)6
280
291–2
95(3
)G
AT
TA
GT
TG
AT
TA
GC
AG
GA
CN
M-M
G421
>7555B
TT
TC
TG
CC
AC
GG
AG
TT
(AA
T)5
144
148–1
63(3
)149(1
)C
TG
TT
GC
CC
AA
AT
AG
CC
NM
-MG
422
GC
AA
CT
AT
TT
AT
CA
TC
TA
AC
(AT
)9153
156(1
)164(1
)T
TC
TG
GA
AG
AC
TG
TG
GC
NM
-MG
423
>7572
TT
TG
AT
GG
GC
AA
GG
AG
(TA
AA
)4257
270(1
)270(1
)A
GT
GG
AG
TG
GC
TG
GA
AC
NM
-MG
425
TA
AC
CC
AA
GC
AG
AA
TG
(T)1
5249
288(1
)286(1
)T
GA
TC
AA
TG
CA
AG
AA
AC
NM
-MG
426
>2278
AG
GG
AG
GC
TG
AG
GA
CG
(TT
C)
205
209(1
)211–2
17(2
)252–2
56(2
)C
AA
TT
AG
CA
GT
GT
AT
TA
TT
TC
GC
NM
-MG
430
>5553
GG
GA
AG
CC
CA
AA
TA
AG
A(C
T)3
CA
TT
(CT
)6199
187–2
21(9
)A
AA
GA
AG
AG
GA
AA
GG
GA
TA
GC
A(C
T)5
CN
M-M
G431
>5616
AT
GA
AA
AG
AC
GA
AA
TG
(TA
A)5
TA
GC
AA
246
248–2
68(3
)267–2
71(2
)A
CG
AG
CG
TT
AT
CA
AA
T(T
AA
)2C
NM
-MG
432
>7343
TA
GA
AG
GC
AA
AG
CA
GT
(AA
AG
)4275
291–3
01(3
)284–3
02(3
)A
TT
CT
AT
CA
CC
AC
CG
TC
NM
-MG
433
>7374
TA
GA
TC
CC
TT
CT
AG
TT
TC
(AA
T)3
...
(AA
T)2
292
317(1
)(M
B)
CT
TT
AG
AC
AG
CC
AA
TT
AG
T(A
AT
)4C
NM
-MG
434
>7390
AC
AG
GG
CA
GG
AC
AA
TA
(AT
TT
T)3
237
247
(1)
247
(1)
247
(1)
GT
TA
AC
TG
AG
CC
AT
AC
TT
TC
NM
-MG
435
>7525
CA
CT
GA
TT
GG
CT
GT
TC
(AA
AG
)3A
AA
A235
244(1
)240–2
51(4
)246(1
)T
AC
TG
CT
CC
TA
CT
GT
TT
C(A
AA
G)
CN
M-M
G436
>7567
AG
AA
GT
TG
CG
GC
CT
AT
(TA
)10
295
320–3
31(5
)T
AC
CG
AG
TT
AT
TC
TT
GC
TG
CN
M-M
G437
>7568
CA
AC
CA
GG
AA
AT
AG
AA
CA
G(C
AA
)6135
133–1
36(2
)230–2
44(4
)G
CA
GC
CT
TA
CC
AC
GA
CC
NM
-MG
439
>7830
TG
GC
TA
GA
TC
CG
AG
AC
T(T
C)1
7225
291–3
24(6
)288–3
35(3
)C
AA
CA
TC
CC
TT
CA
CA
AA
CC
NM
-MG
443
>2501A
GA
GG
CA
AG
TC
AA
AG
GG
(CC
A)2
(CC
TC
CA
CC
226
225(1
)225(1
)225(1
)T
CT
GG
CG
TA
TC
AA
TG
TG
TC
CA
)2(C
CA
)
(con
tin
ued
)
FRANKLIN PEREZ ET AL.: DATA MINING FOR EST-SSRS IN PENAEID SHRIMPS 559

Tab
le2.C
on
tin
ued
Locu
sE
ntr
yP
rim
ers
5¢-
3¢
Repeat
seq
uen
ce
Expecte
dL
.van
am
ei
L.
styli
rost
ris
T.
byrd
i
CN
M-M
G444
>2501B
CG
TA
CA
AG
GC
AT
TG
GG
(GT
T)4
278
274–2
94(5
)243–2
65(4
)260–3
31(2
)G
CA
TC
TA
CT
TT
GA
CG
CA
CT
CN
M-M
G447
>2687
TG
AT
GA
GC
AC
CT
TG
AC
(TA
CA
)2T
AA
(TA
CA
)2240
252(1
)252(1
)252(1
)C
AC
TA
GA
GG
CT
TA
TA
CC
A..
.(T
AC
A)3
CN
M-M
G450
>6344
AC
TG
AC
AC
CT
GC
AT
TG
(TA
T)
TG
T(T
AT
)2213
222(1
)244(1
)C
AC
AG
GC
AC
AG
GA
AT
A..
.(T
AT
)C
AT
(TA
T)3
CN
M-M
G451
>6655
TC
CA
CC
AT
AG
CC
TC
CA
(CC
A)3
CC
T(C
CA
)3169
313
(MB
)306(M
B)
342(M
B)
CC
GC
TG
CA
AT
GA
AC
CA
(TC
A)3
(CC
A)2
CN
M-M
G452
>6739
AG
CC
CA
GC
CC
CG
TG
TT
(AA
C)2
AG
C(A
AC
)3489
534–5
40(2
)524(1
)T
GA
CA
AT
AA
AG
CC
TG
AA
CN
M-M
G455
>7414
GA
GC
GT
AT
CT
AA
CC
TC
A(A
AA
AT
)4284
307–3
16(2
)314(1
)T
AT
GG
CT
AT
TG
TA
AC
TC
TT
CC
NM
-MG
456
>2157
TT
CT
TC
AC
AT
AT
TG
CC
CT
AC
(TT
C)6
AT
C(T
CC
)2238
252(1
)234251(3
)G
AT
TC
CG
TC
GC
CA
AC
TG
TC
(TT
C)2
CN
M-M
G457
>2450
CA
AT
CT
TC
TG
GT
GG
TT
C(T
C)8
243
247(1
)222–2
36(3
)T
AT
GG
CT
CG
GG
TG
TA
TC
NM
-MG
459
>2461
AT
CA
TG
TA
AG
GG
TA
TT
TG
G(T
)14
136
134–1
39(3
)133–1
36(2
)C
AT
TT
AT
TC
GG
CG
TT
TT
CN
M-M
G460
>4295
TT
CC
AT
AA
TG
CT
GA
AT
C(T
A)9
134
238(1
)C
TG
AG
CG
AA
AG
AC
GA
GC
NM
-MG
462
>5766
AG
AT
AC
GC
TT
CC
TA
AT
GA
T(A
TG
)6157
192(1
)192(1
)G
CT
AG
TT
CC
TG
CT
CC
CC
NM
-MG
463
>5798
AA
CG
CA
GC
GC
AG
AA
GA
(AG
C)6
268
265–2
83(5
)273–2
84(3
)T
GG
AA
TT
GT
GA
GC
GG
AT
AC
NM
-MG
465
>6596
AA
GT
CC
AG
AC
AA
CG
AG
(TT
A)5
256
300(1
)308(1
)T
AA
CC
TT
TA
GC
AA
CC
TC
NM
-MG
467
>7413
CT
TA
TT
AC
TA
CT
GC
TG
CT
AG
(TT
A)4
TT
G(T
TA
)3226
229(1
)229(1
)A
GG
CT
GG
AC
TT
CT
TG
TC
TA
(TT
A)
CN
M-M
G470
>7997
AA
GT
AA
CT
TG
GG
TG
AA
A(T
TT
A)6
252
296(1
)T
AG
GG
CA
TA
GA
CC
AT
CC
NM
-MG
471
>4532
AA
GT
GT
TG
CT
GG
GT
AT
G(G
AT
)3
GA
G(G
AT
)3256
270–2
84(5
)259–2
72(3
)G
CG
GA
CG
AC
AA
GG
TT
TG
AG
(GA
T)
2C
NM
-MG
472
>4550
CC
CT
TC
CA
CC
GT
GT
TG
(AA
AG
)2A
(AA
AG
)C
196
243–2
45(2
)250–2
57(2
)242–2
53(2
)C
AG
CC
TT
GC
CC
TT
CT
T(A
AA
G)2
CN
M-M
G474
>5631
CT
GG
CT
TG
TG
GA
AT
GG
(T)1
5195
193–2
00(2
)C
AA
CG
AA
AG
GC
AG
AT
GG
CN
M-M
G477
>6643
TG
AT
GA
TG
AC
GA
CG
AT
G(G
AT
)6(G
AC
)3A
TT
366
353(1
)258–2
69(3
)A
TT
CT
TG
GG
AG
AT
GT
TG
(GA
T)3
GG
T(G
AT
)C
NM
-MG
479
>6674B
GT
GA
AG
TT
GG
GA
TT
AT
AG
(T)1
6102
96–1
06(4
)C
TG
CC
AG
TT
TA
GC
GA
CC
NM
-MG
483
>7908
AT
TT
CG
CT
AC
AT
AT
CA
TC
AC
(T)7
A(T
)11
281
294–3
03(4
)A
AG
AG
GC
AA
TA
AG
GG
TC
NM
-MG
484
>8015
TC
AC
CA
TC
GC
CA
GA
AA
(GC
TC
)4115
117(1
)117(1
)C
CA
GG
GA
AG
AG
GA
GG
A
(con
tin
ued
)
560 FRANKLIN PEREZ ET AL.: DATA MINING FOR EST-SSRS IN PENAEID SHRIMPS

Tab
le2.C
on
tin
ued
Locu
sE
ntr
yP
rim
ers
5¢-
3¢
Repeat
seq
uen
ce
Expecte
dL
.van
am
ei
L.
styli
rost
ris
T.
byrd
i
CN
M-M
G487
>3977
GA
CA
GA
CA
GT
GG
TG
GC
G(G
GC
)6297
288–3
09(7
)653–6
87(M
B)
622–7
15(M
B)
CG
TT
CT
CC
TT
GC
GT
GA
TG
CN
M-M
G488
>4104
GC
TG
AA
AC
GC
TC
GT
CA
(AA
AA
T)3
265
266–6
20(2
B)
266–6
20(2
B)
TG
GG
CA
TA
CT
GG
GA
AA
CN
M-M
G489
>4141
GA
CA
GC
CA
CC
AC
GA
TA
AG
(AA
CT
G)3
233
236–2
45(2
)222–2
28(M
B)
219–6
37(M
B)
GC
AA
GG
AG
GG
AC
AG
GA
TC
NM
-MG
494
>7935
AC
CA
CT
GA
CT
CC
CA
CG
(AC
)5A
G(A
C)2
AT
289
293–3
15(8
)325–3
37(4
)C
AG
GG
TC
AA
AG
CA
AG
AG
G(A
C)
(AC
GC
)3C
NM
-MG
496
>7993
TG
TC
AC
TG
TT
GA
GC
CC
TA
CT
(TG
G)4
CG
G(T
GG
)203
379–3
87(5
)C
AG
AT
TC
CT
CA
GC
CT
CC
TC
NM
-MG
498
>8181
TT
GC
TG
CT
TA
CT
GT
CT
TG
C(T
GG
)5297
719–7
41(4
)560–5
66(2
)453(1
)C
AT
CA
TC
CG
AC
TC
TT
CC
TC
NM
-MG
507
>5040
GA
TC
CC
GA
TG
CC
GT
AG
C(G
CT
)4A
CT
(GC
T)3
228
365–3
75(3
)T
GT
TT
AC
CA
GT
TG
GG
TC
CA
TC
NM
-MG
508
>5063
GC
AG
CA
CT
AC
AG
GT
AA
(TG
)4C
A(T
G)5
TA
(TG
)118
119(1
)120(1
)105(1
)A
AT
TG
CA
CA
AG
AC
TT
CA
TT
A(T
G)3
TA
(TG
)2C
NM
-MG
512
>5625
TG
GA
AA
CC
TG
GC
TT
GA
(AT
GT
)G
TG
TA
AG
T240
249–2
57(4
)421–6
88(3
)T
CC
TA
AA
TA
CA
CG
GA
CA
CT
(AT
GT
)3C
NM
-MG
514
>8069
TG
GA
GA
AG
AC
TG
CC
TG
AT
(T)1
5298
292–3
04(4
)G
AT
TT
AG
CC
AT
AC
CT
TT
CA
CN
M-M
G516
>8230
GT
GC
CT
AT
GG
TG
GT
TC
(GC
T)6
148
301(1
)T
CA
AT
TT
AC
TT
CT
TG
GA
TC
CN
M-M
G518
>4876
CA
CA
GT
GC
GA
GA
TG
GC
(GC
AA
)4169
169(1
)167(1
)T
AC
CG
AA
CA
AG
GA
AT
AC
AA
TC
NM
-MG
521
>5012
GG
GA
TA
CA
GC
AA
TA
AC
(TA
)2T
GA
(TA
)3299
319(1
)315(1
)A
TT
GG
AA
CA
GA
CA
AG
TA
TT
(TA
)5C
NM
-MG
522
>5027
GC
CT
TT
GG
TG
GT
TC
TC
(GC
T)6
143
270(1
)A
AT
TA
CT
TC
TT
GG
AT
CC
TC
CN
M-M
G526
>5175
TC
TA
TA
AC
AA
CA
CG
TC
CA
CT
AG
(TT
TT
G)3
183
186(1
)188(1
)C
AC
GA
AC
GA
CT
TG
CT
CC
CN
M-M
G527
>5200
TA
GC
AT
TG
TA
GG
GT
CA
(AT
T)3
A(A
TT
)188
198–2
05(2
)202(1
)C
CT
TA
CA
TT
GC
CT
TT
GT
(AT
T)3
CN
M-M
G528
>5286
GG
GG
AG
TT
GA
GC
AT
TG
(CA
C)3
CT
AC
(CA
C)2
158
383–4
68(M
B)
GG
TT
TA
CG
GC
GG
AG
AA
CN
M-M
G529
>5329
TT
GC
TG
CT
TA
CT
GT
CT
TG
C(T
GG
)5
296
724–7
55(4
)555–5
59(M
B)
555–6
20(M
B)
AT
CA
TC
CG
AC
TC
TT
CC
TC
TC
NM
-MG
531
>4282
GT
TC
TG
TT
TA
CA
AT
TG
GT
TC
(CA
C)5
206
728(1
)483–6
79(M
B)
409–7
88(M
B)
GA
GG
AG
GA
CT
GA
GG
GT
GC
NM
-MG
532
>5026
TT
GC
GG
CA
GC
GG
TA
AA
GG
(GG
A)3
GG
T(G
GA
)3108
106(1
)(M
B)
(MB
)G
AC
GG
CC
AA
GC
CA
AG
AC
AC
NM
-MG
533
>5825
CG
GG
CG
GG
TA
CA
AG
CT
(AG
C)
5137
417–4
14(2
)G
TC
GC
TG
AA
AA
TA
AT
GC
CN
M-M
G535
>6792
AC
AC
TA
CA
AG
CA
AC
CA
(T)1
7280
334–3
45(3
)602–7
51(M
B)
TC
CC
AA
AA
TA
AA
CT
CA
CN
M-M
G543
>8410
TG
AA
GC
CA
TT
GT
CT
GT
(AT
T)5
263
294(1
)294(1
)
(con
tin
ued
)
FRANKLIN PEREZ ET AL.: DATA MINING FOR EST-SSRS IN PENAEID SHRIMPS 561
markers was lower, 21% (6 products) with a maxi-mum of 3 alleles.
Two L. vannamei samples from the primaryscreening panel corresponded to the parents of amapping panel developed in our lab. Twenty-sixEST-SSR sequences were polymorphic betweenthose individuals. All those markers were tested forMendelian segregation as explained below.
PCR amplification of EST-based markers canlead to the amplification of products with sizes dif-ferent from the expected values, relative to the po-sition of the primers in the original sequence. Sizeslarger than expected might occur due to the presenceof an intron in the genomic DNA. In Table 3 wesummarize the PCR products with markers showinga minimum difference of 50 bp from the expectedsize product. In L. vannamei, 10 of the 109 PCRproducts showed sizes with 50 or more extra basesthan expected. In L. stylirostris, 17 of the 79 primersshowed unexpected sizes. In T. birdy 11 of the 31amplified products showed differences from the ex-pected size.
Genetic Diversity and Mendelian Segrega-tion. Forty-seven (80%) of the 59 primers evaluatedfor HWE amplified DNA of 7 or more individuals inthe wild animal test panel. Fourteen primers wereexcluded from the analysis because they showed lessthan 7 amplifications. Table 4 shows the observedand expected heterozygosities and P value of HWE.Thirteen loci showed significant deviations fromequilibrium (P < 5%). Average number of alleles perprimer was 6.8, with a minimum and a maximum of2 and 24 alleles, respectively.
Twenty-six primers showing polymorphism be-tween the mapping panel parentals were evaluatedfor Mendelian segregation (Table 5). Evidence for thepresence of null alleles was found for 5 primers(CNM-MG-362, -371, -383, -416, and -487).
SSCP Analysis. Forty-five markers that weremonomorphic in the primary primer screening wereevaluated under SSCP conditions. A variable numberof polymorphic products (2 to 8) were detected in 21(47%) of the markers. Eight markers were polymor-phic between the parents of the mapping panel.
Sequence Identification. Twelve percent of thedeveloped markers (n = 13) showed significant sim-ilarities with known protein sequences (Table 6).Three of the positive hits corresponded to ribosomalproteins. Eight of the positive hits corresponded toarthropod genes, and 2 positive hits were shrimpantimicrobial peptides of the penaeidin precursortype.T
ab
le2.C
on
tin
ued
Locu
sE
ntr
yP
rim
ers
5¢-
3¢
Repeat
seq
uen
ce
Expecte
dL
.van
am
ei
L.
styli
rost
ris
T.
byrd
i
TT
GT
GG
GA
GA
TG
AT
GC
CN
M-M
G548
>5851
AC
AA
CT
TC
AA
AG
CT
AC
A(A
AA
T)4
252
287–3
03(2
)285(1
)T
CA
GT
CT
CA
TC
TT
CC
AT
CN
M-M
G554
>7410
TT
TA
GC
TG
GG
CG
AC
TT
(AA
AA
G)3
126
927–1
466(M
B)
1420–1
442(M
B)
GT
AT
GC
AG
CC
TT
CC
CT
TO
TA
L112
106
77
29
aIn
each
spec
ies
the
ran
geof
the
ban
dsi
zean
dth
en
um
ber
of
alle
les
(in
par
enth
ese)
ispre
sen
ted.
MB
indic
ates
mu
ltip
leban
ds.
562 FRANKLIN PEREZ ET AL.: DATA MINING FOR EST-SSRS IN PENAEID SHRIMPS

Discussion
We report the development of EST-SSR markersderived from publicly available EST sequences bydata mining: A similar approach has been used invarious species of animals (Yue et al., 2001; Rohreret al., 2002; Yue and Orban 2002; Yue et al., 2004)and plants (Kantety et al., 2002; Gupta et al., 2003;Woodhead et al., 2003; and others). In our initial insilico screening, we found a frequency of one re-peat every 4.018 kb in the screening of 1353 kb ofnonredundant Litopenaeus vannamei ESTs. Datamining of EST-SSRs in wheat and barley showedclose values with one SSR every 9.2 and 6.3 kb,respectively (Gupta et al., 2003; Thiel et al., 2003).The frequency of SSRs in L. vannamei genomiclibraries varied according to the motifs and theirnumber between one for every 1.43 kb and one forevery 206 kb (Meehan et al., 2003). In Penaeusmonodon the repeat frequency in two genomic li-braries varied from one for every 93 kb to one forevery 164 kb (Tassanakajon et al., 1998). Thehigher frequency of microsatellite-type repeats inEST sequences in L. vannamei in comparison withshrimp genomic libraries demonstrates the viabil-
ity of the approach for large-scale SSR developmentin shrimp.
The most frequent type of repeats inL. vannamei EST sequences corresponded to trinu-cleotide motifs, followed by mononucleotide motifs(Table 1). Our results are in contrast with reportsfrom genomic libraries in other Penaeid shrimpspecies in which dinucleotide repeats dominated(Tassanakajon et al., 1998; Meehan et al., 2003;Wuthisuthimethavee et al., 2003). Data on perfectmicrosatellite motifs in a wide range of eukaryoticgenomes demonstrated that the frequencies ofmononucleotides and dinucleotides are very similar(around 42%) and outnumber the frequency of tri-nucleotides in intergenic and intron regions. How-ever, the frequency of trinucleotides in exonicregions (95%) largely surpassed the frequency ofmononucleotides and dinucleotides (Toth et al.,2000). In our work we did not find such predomi-nance of trinucleotide motifs. Differences in the datamining methods such as stringency of terms fordeclaring a microsatellite and the level of tolerancefor nonperfect repeats might explain this difference.
SSR isolation in shrimp species has been shownto render variable yields. Pongsomboona et al.
Table 3. EST-SSR Markers Developed from Litopeanaeus vannamei EST Sequences Showing Products of Unexpected Size(50 bp or greater difference from expected size) in Three Shrimp Species
Observed – Expected size difference (bp)
Locus Expected size (bp) L. vannamei L. stylirostris T. birdy
CNM-MG 359 195 59CNM-MG 378 199 92CNM-MG 386 82CNM-MG 401 208 60CNM-MG 405 251 69CNM-MG 406 256 62 77CNM-MG 417 205 89CNM-MG 437 135 95CNM-MG 439 225 66 63CNM-MG 451 169 144 137 173CNM-MG 460 134 104CNM-MG 465 256 52CNM-MG 472 196 54CNM-MG 477 366 )108CNM-MG 487 297 356 325CNM-MG 496 203 176CNM-MG 498 297 422 263 156CNM-MG 507 228 137CNM-MG 512 240 181CNM-MG 516 148 153CNM-MG 522 143 127CNM-MG 528 158 225CNM-MG 529 296 428 259 259CNM-MG 531 206 522 277 203CNM-MG 533 137 280CNM-MG 535 280 54 322Total of putative introns 10 17 11
FRANKLIN PEREZ ET AL.: DATA MINING FOR EST-SSRS IN PENAEID SHRIMPS 563

(2000) screened a P. monodon nonenriched genomiclibrary with trinucleotide and tetranucleotideprobes obtaining 79 positive clones and developed 6polymorphic markers. The success rate fromsequencing to polymorphic microsatellites was7.6%. In L. vannamei, 251 positive clones derivedfrom a nonenriched library and screened with di-,tri-, and tetranucleotide probes allowed the devel-
opment of 93 polymorphic markers. In this case thesuccess rate between positive clones to polymor-phic microsatellites was 36.7% (Mehan et al., 2003).Following a similar protocol, Cruz et al. (2002)developed 5 microsatellites out of 68 positiveclones with a success rate of 7.4%. In L. schmittiEspinosa et al. (2001) report the development of 2microsatellites from 30 positive sequenced clones,
Table 4. Litopenaeus vannamei EST-SSR Primer Polymorphism and Hardy-Weinberg Equilibrium in a Testing Panel ofWild Samplesa
Primer Indiv. Alleles Min Max He Ho P SE
CNM-MG-339 14 9 150 192 0.86 0.86 0.694 0.009CNM-MG-347 11 8 300 344 0.67 0.55 0.204 0.012CNM-MG-350 14 12 230 302 0.88 0.79 0.002 0.002CNM-MG-351 16 15 212 238 0.92 0.88 0.167 0.013CNM-MG-354 15 10 200 210 0.84 0.80 0.206 0.007CNM-MG-355 15 4 274 280 0.62 0.47 0.066 0.007CNM-MG-356 11 4 180 192 0.55 0.18 0.003 0.002CNM-MG-357 16 4 308 319 0.41 0.13 0.000 0.000CNM-MG-362 15 21 189 224 0.94 0.93 0.439 0.016CNM-MG-364 13 7 166 186 0.75 0.85 0.374 0.017CNM-MG-367 16 6 285 308 0.82 0.94 0.874 0.008CNM-MG-369 15 7 251 260 0.78 0.80 0.025 0.005CNM-MG-371 13 10 284 309 0.86 0.31 0.000 0.000CNM-MG-372 14 7 261 307 0.66 0.57 0.263 0.014CNM-MG-379 14 2 256 260 0.48 0.36 0.571 0.013CNM-MG-380 11 7 236 266 0.76 0.55 0.161 0.007CNM-MG-383 7 5 273 286 0.72 0.29 0.004 0.002CNM-MG-384 13 9 226 257 0.87 0.77 0.219 0.012CNM-MG-386 13 4 273 293 0.33 0.23 0.005 0.001CNM-MG-387 14 4 217 230 0.70 0.29 0.004 0.002CNM-MG-390 16 5 259 268 0.53 0.35 0.007 0.003CNM-MG-402 12 2 188 194 0.41 0.25 0.196 0.008CNM-MG-405 9 12 269 333 0.88 0.89 0.634 0.020CNM-MG-406 16 24 286 403 0.94 0.88 0.189 0.012CNM-MG-407 16 2 290 297 0.06 0.06 1.000 0.000CNM-MG-412 16 5 243 256 0.50 0.31 0.008 0.002CNM-MG-416 10 7 294 324 0.80 0.80 0.216 0.010CNM-MG-418 13 2 287 292 0.39 0.23 0.161 0.012CNM-MG-421 15 4 145 153 0.24 0.27 1.000 0.000CNM-MG-430 16 13 194 227 0.89 0.82 0.264 0.014CNM-MG-431 11 8 247 274 0.80 0.64 0.280 0.006CNM-MG-436 14 11 309 335 0.88 1.00 0.201 0.015CNM-MG-437 16 2 133 136 0.17 0.19 1.000 0.000CNM-MG-444 16 3 278 284 0.55 0.31 0.064 0.008CNM-MG-455 16 5 303 332 0.60 0.50 0.085 0.007CNM-MG-474 16 7 189 201 0.58 0.38 0.095 0.008CNM-MG-479 16 12 96 109 0.85 0.56 0.001 0.001CNM-MG-483 16 3 296 299 0.17 0.13 0.094 0.010CNM-MG-487 15 7 287 305 0.80 0.73 0.278 0.015CNM-MG-489 16 2 237 247 0.22 0.25 1.000 0.000CNM-MG-494 12 9 290 311 0.74 0.33 0.000 0.000CNM-MG-496 15 5 380 392 0.68 0.60 0.228 0.015CNM-MG-498 10 2 717 727 0.10 0.10 1.000 0.000CNM-MG-507 15 4 360 370 0.54 0.33 0.033 0.006CNM-MG-512 16 6 210 265 0.71 0.88 0.964 0.007CNM-MG-527 13 3 199 205 0.42 0.54 1.000 0.000CNM-MG-548 15 2 280 288 0.28 0.33 1.000 0.000aNumber individuals amplified, number of alleles, minimum and maximum allele size (bp), expected and observed heterozygosities, Pvalue, and standard error of the exact test for Hardy-Weinberg equilibrium are shown.
564 FRANKLIN PEREZ ET AL.: DATA MINING FOR EST-SSRS IN PENAEID SHRIMPS

giving a success rate of 6.6%. Xu et al. (1999) ob-tained a 12.5% success rate when they developed 10microsatellites out of 83 P. monodon positive se-quenced clones. Wuthisuthimethavee et al., (2003)developed 102 microsatellites out of 253 sequencedclones derived from a P. monodon enriched library,giving a 40.3% success rate from sequencing topolymorphic markers.
In our work we designed 206 primer pairs out of282 SSR-containing EST sequences and generated112 PCR amplifications (Table 2). The percentage ofpolymorphic markers reached 56%, 32%, and 21%of the amplified products for L. vannamei,L. stylirostris, and Trachypenaeus birdy, respec-tively. The success rate from designed primers topolymorphic markers was 27% in L. vannamei, 11%in L. stylirostris and 2.4% in T. birdy. However ourdata on polymorphism from the primary screeningshould be judged cautiously because they are theproduct of a small screening panel consisting of 6L. vannamei, 2 L. stylirostris, and 2 T. birdyindividuals.
A theoretical advantage of SSR markers devel-oped from EST sequences is the high transferabilitybetween related species. In our research of the EST-SSRs that amplified products in L. vannamei 69%gave products in L. stylirostris and 21% in T. birdy(Table 2). Xu et al. (1999) report that 3 SSRs from aset of 10 SSRs developed in P. monodon showed PCRproducts in L. vannamei. Pongsomboona et al.,(2000) report weak products obtained in 3 of 6primers developed in the same species. Ball et al.,(1998) showed that 4 of 6 SSRs developed for P. se-tiferus amplified in P. aztecus, P. duorarum, L.vannamei, and L. stylirostris. Although transfer-ability of genomic SSR markers in shrimp remains tobe tested on a broader scale, we have demonstratedthat EST-SSRs give a higher rate of transferabilitybetween two closely related species than the geno-mic SSRs reported to date.
Table 5. Mendelian Segregation Model and P Values for thev2 Test in a Set of EST-SSR Markers Evaluated in aLitopenaeus vannamei Segregating Panel
Primer Model P Value
CNM-MG-339 1:1:1:1 0.84CNM-MG-347 1:1 1.00CNM-MG-351 1:1 0.29CNM-MG-355 1:2:1 0.30CNM-MG-362 1:1:1:1 0.01CNM-MG-379 1:2:1 0.28CNM-MG-380 1:1:1:1 0.18CNM-MG-384 1:1:1:1 0.84CNM-MG-398 1:1:1:1 0.37CNM-MG-402 1:1 0.29CNM-MG-406 1:1:1:1 0.46CNM-MG-418 1:1 0.11CNM-MG-430 1:1:1:1 0.11CNM-MG-431 1:1:1:1 0.09CNM-MG-437 1:2:1 0.48CNM-MG-439 1:1:1:1 0.46CNM-MG-459 1:1 0.29CNM-MG-479 1:1:1:1 0.02CNM-MG-483 1:1 0.59CNM-MG-494 1:1:1:1 0.46CNM-MG-496 1:1 0.11
Table 6. Litopenaeus vannamei EST Markers with Positive Homologies to Known Proteins Identified from a SequenceHomology Search (BLAST)
Primer Protein Accesion Function Probability Score Species
CNM-MG 365 Q9VXKO NipSnap protein 5 · 10–23 105 Drosophila melanogasterCNM-MG 369 P29341 Polyadenylate-binding
protein5 · 10–25 113 Mus musculus
CNM-MG 390 CAB41634.1 Iron regulatory protein1–like protein
9 · 10–23 106 Pacifastacus leniusculus
CNM-MG 412 NP_501503 Polynucleotide 5¢-kinase3¢-phosphatase
6 · 10–30 132 Caenorhabditis elegans
CNM-MG 416 P18262 Ras-like protein 6 · 10–23 105 Artemia salinaCNM-MG 426/463 Q59296 Catalase 2 · 10–11 68 Campylobacter jejuniCNM-MG 462 NPJ02777 Proteasome a1 subunit
isoform 28 · 10–20 98 Homo sapiens
CNM-MG 474 P81058 Penaeidin-3a precursor 3 · 10–28 124 Litopenaeus vannameiCNM-MG 496 P02402 60S acidic ribosomal
protein9 · 10–26 114 Artemia salina
CNM-MG 512 P81057 Penaeidin-2a precursor 1 · 10–20 99 Litopenaeus vannameiCNM-MG516/522 Q9NB34 60S ribosomal protein
L343 · 10–25 67 Ochlerotatus triseriatus
CNM-MG 528 AAO92284 Putative b thymosin 9 · 10–30 132 Dermacentor variabilisCNM-MG 529 Q29315 60 S acidic ribosomal
protein P21 · 10–15 80 Sus scrofa
FRANKLIN PEREZ ET AL.: DATA MINING FOR EST-SSRS IN PENAEID SHRIMPS 565

In initial primer screening we found that al-though we had designed primers based onL. vannamei EST sequences, 10 SSR sequences didnot amplify in our target species but showed PCRproducts in L. stylirostris and T. birdy (Table 2). Apossible explanation might be the presence ofintrons that hinder PCR amplification. PCR prod-ucts amplified in nontargeted species but not inL. vannamei show on average products much largerthan expected from the original EST sequences. Infact, taking as cutoff values a difference of 50 bpfrom the expected size, we found evidence for puta-tive introns in 10 L. vannamei SSR amplified prod-ucts. Six PCR products with 50 bp or greaterdifference from the product expected size thatamplified in L. vannamei also showed products in L.stylirostris (Table 3). Since we did not sequence anyof the amplicons obtained in this work, we cannotrule out the possibility that some of the productswith unexpected size correspond to different geno-mic regions than those targeted by the designedprimers. However, where introns were amplified,such markers are equivalent to the EPIC markersdeveloped by the design of primers flanking specificintron sequences (Bierne et al., 2000).
High-resolution fingerprinting for populationgenetic studies requires large numbers of moderatelypolymorphic microsatellites. Hence we tested theutility of our EST-SSRs, evaluating HWE with 59primers in a testing panel of wild animals. Thosesamples were DNA extracted with a fast Chelexprotocol and stored for 9 months at )20�C. We usedChelex to select markers suitable for large-scaletesting with an easy extraction method that avoidsthe cost and labor associated with more elaborateextraction methods. From the 59 tested primers, weobtained satisfactory PCR amplifications for 47primers. The interaction between DNA quality andprimers influences PCR amplification (our ownobservations and Coombs et al., 1999), which mightexplain the failure in 14 of our markers.
A high percentage of the evaluated primers (72%)did not show significant departures from HWE at the0.01 P value (Table 4). Ball and Chapman (2003) re-ported a survey in L. setiferus in which 5 of the 6microsatellites showed significant deviation fromHWE that might be explained by the presence of nullalleles and the Wahlund effect. In a population studyin P. monodon in the Philippines, 6 microsatellitesshowed significant deviations from HWE. In thiscase the presence of null alleles was invoked but alsothe presence of allele scoring errors and geneticchanges in the cultured populations evaluated (Xuet al., 2001). In L. vannamei a heterozygosity deficitin 4 of 5 evaluated microsatellites was also explained
by the presence of null alleles (Cruz et al., 2002).In contrast, 6 polymorphic loci evaluated inL. schmittii gave no deviation from HWE (Maggioniet al., 2003). Although we used a small testing panel,the conformation to HWE and the small standarderror of the P value of most of our markers pointstoward their utility for wider use in population ge-netic surveys of L. vannamei.
The number of alleles in our HWE testing panelvaried from 2 to 24 (Table 4). When compared withSSR developed from genomic libraries, the EST-SSRlevel of polymorphism is lower. In other shrimpspecies SSR allele number varies from one allele(Maggioni et al., 2003; Meehan et al., 2003) to amaximum of 76 alleles (Ball et al., 2003). Some of theevaluated loci corresponded to SSRs with mononu-cleotide repeats, which can hamper allele scoring inpopulation genetic studies. However, they can beuseful for linkage mapping where allele sizes areknown from the parental genotypes.
Mendelian segregation of EST-SSRs developed inthis research was evaluated for 26 primers. Fiveprimers showed evidence of null alleles in the seg-regating individuals. All 5 null alleles correspondedto a homozygous parental (4 for the male and one forthe female parent) that did not segregate according tothe expected model (data not shown). However,assuming the presence of null alleles, all primersmight be useful for linkage analysis. As more EST-SSRs are developed and the amplified region is se-quenced, the cause of null alleles in shrimp might beclarified.
With EST-SSRs, as with other PCR-based mark-ers, SSCP analysis can disclose polymorphism whereconventional polyacrylamide gel electrophoresis(PAGE) fails. This variability corresponds to singlenucleotide polymorphism, whereas PAGE unveilslength polymorphism. In our work 46% of EST-SSRmarkers that were monomorphic in the primaryscreening were found to be polymorphic by SSCPanalysis. The presence of 8 markers that showeddifferential bands between the parentals of themapping panel points toward the utility of these ESTmarkers for genetic mapping. In P. monodon 30% ofthe EST markers were polymorphic and useful forpopulation genetics and linkage mapping studies(Tong et at., 2002). Our higher rate of polymorphicmarkers might be explained by the low temperatureand the higher polyacrylamide gel percentages,which are known to affect SSCP sensitivity(Humphries et al., 1997).
Thirteen markers showed significant homologywith known proteins by BLAST comparison. Tonget al., (2002) found that 23% of P. monodon EST se-quences corresponded to known proteins, which is
566 FRANKLIN PEREZ ET AL.: DATA MINING FOR EST-SSRS IN PENAEID SHRIMPS
twice the percentage we found for L. vannamei ESTs.Because we used close BLAST cutoff values, the rea-son for this difference is not clear. However, bothcases demonstrate the feasibility of using EST se-quences in shrimp genetics to produce type I markers.
In this work we have shown the utility of datamining for the development of molecular markers in3 shrimp species in which type I markers have notbeen reported previously. EST-SSR and EST-SSCPmarkers have been developed from publicly availablesequences. These markers are highly transferable, atleast between the evaluated species, and might proveuseful for different research tasks in shrimp genetics.Genetic mapping by AFLPs has demonstrated thatthe L. vannamei genome covers around 4000 cM(Perez et al., 2004). QTL analysis will require around300 codominant markers or, alternatively, around100 codominant markers plus a set of dominantmarkers in order to cover the genome at a 20 cMaverage space. The availability of EST sequences invarious shrimp species is high in public databases. Aline of work similar to the one presented here mightrender a high volume, in the order of hundreds, ofnew markers useful for shrimp genetics.
Use of data mining in plant-derived ESTs hasidentified hundreds of SSR markers in differentspecies (Thiel et al., 2003). Although a fair number ofEST-SSRs generated by data mining of publiclyavailable ESTs has been previously reported in swine(Rohrer et al., 2002), animal geneticists have yet totake full advantage of EST data mining where largenumbers of molecular markers are in order.Availability of EST sequences for different animalspecies is high (http://www.ncbi.nlm.nih.gov/dbEST/dbEST_summary.html). With the use of anew Web-based service for finding repeat motifs anddesigning primers (http://hornbill.cspp.latrobe.edu.au/cgi-binpub/index.pl) (Robinson et al., 2004), SSRisolation can become a straightforward task. Toillustrate this point we examined 1000 ESTs fromeach of 3 different species (chicken Gallus gallus, pigSus scrofa, and Atlantic salmon Salmon salar) andgenerated EST-SSR primers for 6.8%, 8.5%, and 5.7%of the sequences analyzed, respectively. In the spe-cific case of the anadromous Salmo salar, whoselinkage map comprises 64 markers (Gilbey et al.,2004), by April 2004 there were 87,982 EST se-quences deposited at NCBI. Assuming a 1% successrate in marker development, around 900 EST-SSRmarkers could be tested for polymorphism andlinkage with the available EST information. Per-centages of EST-SSRs in chicken, pig, salmon, andshrimp are in the same range as those in plant spe-cies (Saha et al., 2003), which points toward a richsource of useful information.
The abundance of EST information availablegives EST-SSR development by data mining variousadvantages over conventional development of geno-mic microsatellites. First, the cost of data mining forEST-SSRs is very low because it avoids the expensivework associated with the initial steps of microsatel-lite development—namely, library construction andsequencing. Second, as EST-SSR markers are deriveddirectly from gene expression, product identity andfunction can be identified by comparison with pro-tein databases, generating type I markers. Third, aswe and others (Gupta et al., 2003; Thiel et al., 2003)have demonstrated, EST-SSRs are highly transferableacross species. Transferability means that the netcost per developed marker will be even lower if theyare used for different species. Expression studiesusing cDNA libraries might be carried out on a maintarget species, and EST-SSR data mining might beused to generate markers on different species. Thisapproach will integrate transcriptome studies andmarker development in a single task and open ave-nues in linkage mapping, population genetics, andkinship analysis of species for which funding mightbe scarce. Fourth, although the level of EST-SSRpolymorphism might be lower than for genomic mi-crosatellites isolated with conventional methods, theuse of SSCP analysis might disclose single nucleotidepolymorphism, further increasing the percentage ofuseful EST-SSR markers.
We conclude that, depending on genome lengthand EST availability, data mining can generate en-ough EST-SSR markers for a variety of genetics tasksin many organisms. For new projects, a quickdownload of ESTs from the species of interest orclosely related taxa, combined with the appropriatein silico analysis, might save money and months ofbench work.
Acknowledgments
We are grateful to Dr. Paul Gross and the researchteam at Marine Genomics for their work on ESTdevelopment on Litopenaeus vannamei. Withouttheir publicly available sequences, this researchcould have not been accomplished. This work wascarried out with financial support from the Ecuado-rian Science and Technology Foundation (FUNDA-CYT-SENACYT) under Project PFN-084 and theBelgian Technical Cooperation (BTC). We thankS. Sonnenholzner for the facilities provided duringsampling of wild animals.
References
1. Ball AO, Chapman RW (2003) Population geneticanalysis of white shrimp, Litopenaeus setiferus, using
FRANKLIN PEREZ ET AL.: DATA MINING FOR EST-SSRS IN PENAEID SHRIMPS 567

microsatellite genetic markers. Mol Ecol 12, 2319–2330
2. Ball AO, Leonard S, Chapman RW (1998) Charater-ization of (GT)n microsatellites from native whiteshrimp (Penaeus setiferus). Mol Ecol 7, 1251–1253
3. Benson G (1999) Tandem Repeats Finder: a programto analyze DNA sequences. Nucleic Acids Res 27,573–580
4. Bierne N, Lehnert SA, Bedier E, Bonhomme F, MooreSS (2000) Screening for nitron-length polymorphismsin penaeid shrimps using exon-primed intron-cross-ing (EPIC)–PCR. Mol Ecol 9, 233–235
5. Brady KP, Rowe LB, Her H, Stevens TJ, Eppig J,Sussman DJ, Sikela J, Beier DR (1997) Genetic map-ping of 262 loci derived from expressed sequences in amurine interspecific cross using single-strand con-formational polymorphism analysis. Genome Res 7,1085–1093
6. Coombs NJ, Gough AC, Primrose JN (1999) Optimi-sation of DNA and RNA extraction from archivalformalin-fixed tissue. Nucleic Acids Res 27, e12
7. Cruz P, Mejia-Ruiz CH, Perez-Enriquez R, Ibarra AM(2002) Isolation and characterization of microsatel-lites in Pacific white shrimp Penaeus (Litopenaeus)vannamei. Mol Ecol Notes 2, 239–241
8. Dinesh KR, Chan WK, Lim TM, Phang VP (1995)RAPD markers in fishes—an evaluation of resolutionand reproducibility. Asia-Pacific J Mol Biol Biotech 3,112–118
9. Don RH, Cox PT, Wainwright BJ, Baker K, Mattick JS(1991) ‘Touchdown’ PCR to circumvent spuriouspriming during gene amplification. Nucleic Acids Res19, 4008
10. Espinosa G, Jager M, Garcıa-Machado E, Borell Y,Corona N, Robainas A, Deutsch J (2001) Microsatel-lites from the white shrimp Litopenaeus schmitti(Crustacea, Decapada). Biotec Aplicada 18, 232–234
11. Eujayl I, Sorrells ME, Baum M, Wolters P, Powell W(2002) Isolation of EST-derived microsatellite mark-ers for genotyping the A and B genomes of wheat.Theor Appl Genet 104, 399–407
12. Gilbey J, Verspoor E, McLay A, Houlihan D (2004) Amicrosatellite linkage map for Atlantic salmon(Salmo solar). Anim Genet 35, 98–105
13. Gupta PK, Rustgi S, Sharma S, Singh R, Kumar N,Balyan HS (2003) Transferable EST-SSR markers forthe study of polymorphism and genetic diversity inbread wheat. Mol Genet Genomes 270, 315–323
14. Hall TA (1999) BioEdit: a user-friendly biological se-quence alignment editor and analysis program forWindows 95/98/NT. Nucleic Acids Symp Ser 41, 95–98
15. Humphries SE, Gudnason V, Whittall R, Day IN(1997) Single-strand conformation polymorphismanalysis with high throughput modifications, and itsuse in mutation detection in familial hypercholes-terolemia. Clin Chem 43, 427–435
16. Kantety RV, La Rota M, Matthews DE, Sorrells ME(2002) Data mining for simple sequence repeats in
expressed sequence tags from barley, maize, rice,sorghum and wheat. Plant Mol Biol 48, 501–510
17. Karsi A, Cao D, Li P, Patterson A, Kocabas A, Feng J,Ju Z, Mickett KD, Liu Z (2002) Transcriptome anal-ysis of channel catfish (Ictalums punctatus): initialanalysis of gene expression and microsatellite-con-taining cDNAs in the skin. Gene 285, 157–168
18. Liu Z, Karsi A, Dunham RA (1999) Development ofpolymorphic EST markers suitable for genetic linkagemapping of catfish. Mar Biotechnol 1, 437–447
19. Maggioni R, Rogers AD, Maclean N (2003) Popula-tion structure of Litopenaeus schmitti (Decapoda:Penaeidae) from the Brazilian coast identified usingsix polymorphic microsatellite loci. Mol Ecol 12,3213–3217
20. Meehan D, Xu Z, Zuniga G, Alcivar-Warren A (2003)High frequency and large number of polymorphicmicrosatellites in cultured shrimp, Penaeus(Litopenaeus) vannamei. Mar Biotechnol 5, 311–330
21. Miller MP (1997) Tools for Population GeneticsAnalyses (TFPGA) 1.3: a Windows program for anal-ysis of allozyme and molecular population data.Computer software distributed by the author
22. Perez F, Erazo C, Zhinaula M, Calderon J, Volckaert F(2004) A sex specific linkage map of the whiteshrimp, Penaeus vannamei. Aquaculture 242, 105–118
23. Pongsomboona S, Whanb V, Mooreb SS, TassanakajonA (2000) Characterization of tri- and tetranucleotidemicrosatellites in the black tiger prawn, Penaeusmonodon. Science Asia 26, 1–8
24. Putney SD, Herlihy WC, Schimmel P (1983) A newtroponin T and cDNA clones for 13 different muscleproteins, found by shotgun sequencing. Nature 302,718–721
25. Robinson AJ, Love CG, Batley J, Barker G, Edwards D(2004) Simple sequence repeat marker loci discoveryusing SSR primer. Bioinformatics 20, 1475–1476
26. Rohrer GA, Fahrenkrug SC, Nonneman D, Tao N,Warren WC (2002) Mapping microsatellite markersidentified in porcine EST sequences. Anim Genet 33,372–376
27. Saha S, Karaca M, Jenkins JN, Zipf AE, Reddy O,Umesh K, Kantety RV (2003) Simple sequence repeatsas useful resources to study transcribed genes ofcotton. Euphytica 130, 355–364
28. Shahjahan RM, Hughes KJ, Leopold RA, DeVault JD(1995) Lower incubation temperature increases yieldof insect genomic DNA isolated by the CTABmethod. Biotechniques 19, 332–334
29. Tassanakajon A, Tiptawonnukul A, Supungul P,Rimphanitchayakit V, Cook D, Jarayabhand P,Klinbunga S, Boonsaeng V (1998) Isolation and char-acterization of microsatellite markers in the blacktiger prawn, Penaeus monodon. Mol Mar Biol Bio-technol 7, 55–61
30. Thiel T, Michalek W, Varshney RK, Graner A (2003)Exploiting EST databases for the development andcharacterization of gene-derived SSR-markers in bar-
568 FRANKLIN PEREZ ET AL.: DATA MINING FOR EST-SSRS IN PENAEID SHRIMPS
ley (Hordeum vulgare L.). Theor Appl Genet 106,411–422
31. Tong J, Lehnert SA, Byrne K, Kwan HS, Chu KH(2002) Development of polymorphic EST markers inPenaeus monodon: applications in penaeid genetics.Aquaculture 208, 69–79
32. Toth G, Gaspari Z, Jurka J (2000) Microsatellites indifferent eulcaryotic genomes: survey and analysis.Genome Res 10, 967–981
33. Wang J, Mu Q (2003) Soap-HT-BLAST: high through-put BLAST based on Web services. Bioinformatics 19,1863–1864
34. Weber JL (1990) Informativeness of human (dC-dA)nÆ(dG–dT)n polymorphisms. Genomics 7, 524–530
35. Whan VA, Wilson KJ, Moore SS (2000) Two poly-morphic microsatellite markers from novel Penaeusmonodon ESTs. Anim Genet 31, 143–144
36. Woodhead M, Russell J, Squirrell J, HollingsworthPM, Cardle L, Ramsay L, Gibby M, Powell W (2003)Development of EST-SSRs from the Alpine lady-fern, Athyrium distentifolium. Mol Ecol Notes 3,287–290
37. Wuthisuthimethavee S, Lumubol P, Vanavichit A,Tragoonrung S (2003) Development of microsatellitemarkers in black tiger shrimp (Penaeus monodonFabricius). Aquaculture 224, 39–50
38. Xu Z, Dhar AK, Wyrzykowski J, Alcivar-Warren A(1999) Identification of abundant and informativemicrosatellites from shrimp (Penaeus monodon)genome. Anim Genet 30, 150–156
39. Xu Z, Primavera JH, Pena LD, Pettit P, Belak J,Alcivar-Warren A (2001) Genetic diversity of wild andcultured black tiger shrimp (Penaeus monodon) inthe Philippines using microsatellites. Aquaculture199, 13–40
40. Yue GH, Orban L (2002) Microsatellites from genesshow polymorphism in two related Oreochromisspecies. Mol Ecol Notes 2, 99–100
41. Yue GH, Li Y, Orban L (2001) Characterization ofmicrosatellites in the IGF-2 and GH genes of Asianseabass (Lates calcarifer). Mar Biotechnol 3, 1–3
42. Yue GH, Ho MY, Orban L, Komen J (2004) Micro-satellites within genes and ESTs of common carp andtheir applicability in silver crucian carp. Aquaculture234, 85–98
FRANKLIN PEREZ ET AL.: DATA MINING FOR EST-SSRS IN PENAEID SHRIMPS 569