Evaluation of microalgae diets for Litopenaeus vannamei larvae using a simple protocol

This article was originally published in a journal published byElsevier, and the attached copy is provided by Elsevier for the
author’s benefit and for the benefit of the author’s institution, fornon-commercial research and educational use including without
limitation use in instruction at your institution, sending it to specificcolleagues that you know, and providing a copy to your institution’s
administrator.
All other uses, reproduction and distribution, including withoutlimitation commercial reprints, selling or licensing copies or access,
or posting on open internet sites, your personal or institution’swebsite or repository, are prohibited. For exceptions, permission
may be sought for such use through Elsevier’s permissions site at:
http://www.elsevier.com/locate/permissionusematerial

Autho
r's
pers
onal
co
py
Behavioral response to selected feed attractants and stimulants inPacific white shrimp, Litopenaeus vannamei
Alberto J.P. Nunes a,⁎, Marcelo V.C. Sá a, Francisco Felipe Andriola-Neto a,Daniel Lemos b,1
a Instituto de Ciências do Mar (Labomar), Laboratório de Nutrição de Camarão (LNC), Av. da Abolição, 3207-Meireles,Fortaleza, Ceará, 60.165-081, Brazil
b Instituto Oceanográfico, Universidade de São Paulo, C.P. 66149, São Paulo, São Paulo, 05.315-937, Brazil
Received 7 March 2006; accepted 20 June 2006
Abstract
Nine commercial feeding attractants and stimulants forLitopenaeus vannameiwere evaluated by observation of behavioral responsesin animals allotted in one Y-maze aquarium apparatus. In the validation phase, fishmeal–Brazilian origin (FMBO); fishmeal–Peruvianorigin (FMPO); blood meal (BM), meat and bone meal (MBM), squid meal (SM), fish oil (FO) and fish solubles (FS) were evaluated.There was also a control without stimulatory rawmaterial. The testedmaterials were included at 3% in neutral gelatin pellets (wet basis).In each behavioral observation, two different ingredients were offered at the same time in equal quantities, being allotted in the end ofeach chamber's arm. In Phase II after system validation, the following commercial attractants were tested: 80% crude protein (CP)vegetable dried biomass (VDB80), 68% CP vegetable dried biomass+glutamate+betaine (VDB68), complex of amino acids (alanine,valine, glycine, proline, serine, histidine, glutamic acid, tyrosine and betaine) with enzymatically digested bivalve mollusk (CAA),condensed fish soluble protein (CFSP), squid liver meal (SLM), betaine (Bet), dried fish solubles–low biogenic amines (DFSLB), driedfish solubles–high biogenic amines (DFSHB) andwhole squid protein hydrolysate (WSPH). Attractants were used at a 3% level wet basiswith neutral gelatin, without any additional ingredient source available. The best four commercial attractants from this phase (CAA,CFSP, SLM and WSPH) were compared under 0.5% and 1.0% levels. In Phase I of the study, a higher percentage of choices wereobserved for FMPO and FMBO. BM and FO were the least chosen ingredients. In Phase II, the worst results were observed for Bet,DFSHB and,mainly, forVDB80 andVDB68.When two-by-two comparisonswere performed, results suggested that CFSP andCAAwerethe best commercial attractants tested. In the last phase, bothCFSP andCAAat 1.0% levelwere significantlymore chosen by shrimp thanCFSP (0.5%), SLM (0.5 or 1.0%) orWSPH (0.5 or 1.0%). At both 0.5% and 1.0% levels, shrimp spent a similar amount of time feedingon CFSP and CAA. However, only CAA was statistically better than SLM and WSPH together. Further work is required to betterelucidate the chemical drivers of chemostimulation for L. vannamei for each one of the attractants tested.© 2006 Elsevier B.V. All rights reserved.
Keywords: Attractants; Stimulants; Feed additives; Food preference; Litopenaeus
1. Introduction
As inclusion of fishmeal is confronted in commercialshrimp feeds, the role of chemoattractants becomes
Aquaculture 260 (2006) 244 –254www.elsevier.com/locate/aqua-online
⁎ Corresponding author. Tel./fax: +55 85 32298718.E-mail addresses: [email protected] (A.J.P. Nunes),
[email protected] (D. Lemos).1 Tel.: +55 11 3091 6605; fax: +55 11 3032 3092.
0044-8486/$ - see front matter © 2006 Elsevier B.V. All rights reserved.doi:10.1016/j.aquaculture.2006.06.027

Autho
r's
pers
onal
co
py
crucial to preserve feed attractiveness. High inclusion oflow-cost vegetable protein sources, such as soybeanmeal, in shrimp diets is often linked with poorperformance. This can be the result of decreased feedconsumption led by low food attractability and palat-ability. Identifying the chemosensory stimuli whichshrimp normally find palatable may assist in improvingingestion of formulated diets (Holland and Borski,1993). Arousal of shrimp feed intake can also minimizeleaching of feed nutrients caused by the animal's slowfeeding behavior (Peñaflorida and Virtanen, 1996).
Behavioral, physiological, and electrophysiologicalresponses have been employed in testing chemosensi-tivities of decapods (Heinen, 1980). Most aquaticchemical signals identified so far among aquatic animalsare soluble molecules relatively small, where aminoacids predominate. Evidence that mixtures can be morestimulatory than single compounds, by either additive orsynergistic interactions, has accumulated in bothbehavioral and electrophysiological studies (reviewedby Lee and Meyers, 1997).
Specialized literature on dietary attractants andstimulants for marine shrimp is scarce. Smith et al.(2005) examined squid, crustacean and krill meals, fishand krill hydrolysates and a betaine product asstimulants in black tiger shrimp Penaeus monodondiets. These authors concluded that P. monodon showeda significantly greater preference for feeds containingcrustacean or krill meal. Huang et al. (2003) conductedan experiment to investigate the dietary selectivity inChinese shrimp, Fenneropenaeus chinensis. The exper-imental diets contained one of the following ingredients:fish flesh, shrimp flesh, clam foot or polychaete worm.A commercial formulated diet and a mixed diet werealso utilized. The results showed that specific growthrates were highest in the mixed diet fed group, and foodconversion efficiencies were highest at polychaeteworm fed group. The authors stated that Chinese shrimppossess the ability to discriminate different diets.
Artificial diets for crustaceans must be chemicallyattractive to induce their location and feeding, andaddition of small amounts of chemostimulants mightincrease ingestion rates and improve growth, survival,and food conversion (Carr, 1988). The present work wascarried out to evaluate nine commercial attractants and/or stimulants in Litopenaeus vannamei diets. Behavioralresponses of individuals allotted in a Y-maze aquariumapparatus were monitored. The objectives were (1) toknow whether the Y-maze apparatus is a validmethodology to evaluate attractiveness in L. vannamei;and (2) to measure and compare feeding stimuli ofcommercial attractants fed to this species.
2. Materials and methods
2.1. Shrimp and conditioning period
Attractability behavior assays were carried out withjuvenile shrimp L. vannamei ranging in size between 6and 12 g in body weight. Animals were collected from acommercial shrimp farm and transported alive to thelaboratory. Animals were then stocked in a 1.000-l tankequipped with a biological filter and continuousaeration. Prior to any behavioral evaluations of attract-ability, shrimp were first subjected to an acclimationperiod of 1 week to adapt to laboratory rearingconditions. During the conditioning period, animalswere fed ad libitum with a 35% crude protein diet(Camaronina 35 hp, Agribrands Purina do Brasil Ltda.,São Lourenço da Mata, Pernambuco, Brazil).
2.2. Shrimp behavioral evaluations
To start attractability sessions, shrimp were trans-ferred to a 50-l glass aquarium equipped with a rubbercarpet laid over a biological sand filter fixed on the tankbottom. To stimulate more rapid responses in feedingarousal, animals were starved for 24-h prior to anybehavior observations. Attractability bioassays began bystocking one starved animal at a time in a double choiceaquarium containing filtered and disinfected seawater at33‰ salinity.
The aquarium resembled a Y-maze and measured1.3 m×0.3 m×0.4 m (length×width×height). TheY-maze apparatus was equipped with an acclimationchamber, isolated by a removable glass guillotine anda rubber bottom to facilitate shrimp locomotoryactivity (Fig. 1). During each session, no waterexchange was used to avoid the reotaxis influenceover the animal's orientation towards the food source.Aeration was only used right before the delivery ofthe ingredient in water. For each observation, twoingredients were compared. They were offeredseparately in similar amounts (2 g), placed individu-ally in the perimeter of one of the Y-maze apparatusarms. Prior to behavioral evaluations, shrimp wasstocked in the acclimation chamber and allowed toacclimate to the Y-maze system for 10 min.
For each ingredient tested, one different specimen ofL. vannamei was used. In case food was not detectedwithin a 7-min time limit, observation was interruptedand the animal replaced by another acclimated speci-men. After each session, water was discarded andcompletely replaced by new filtered seawater at 78 l oftotal aquarium volume.
245A.J.P. Nunes et al. / Aquaculture 260 (2006) 244 –254
Autho
r's
pers
onal
co
py
2.3. Measurement of behavioral responses to feedingstimuli
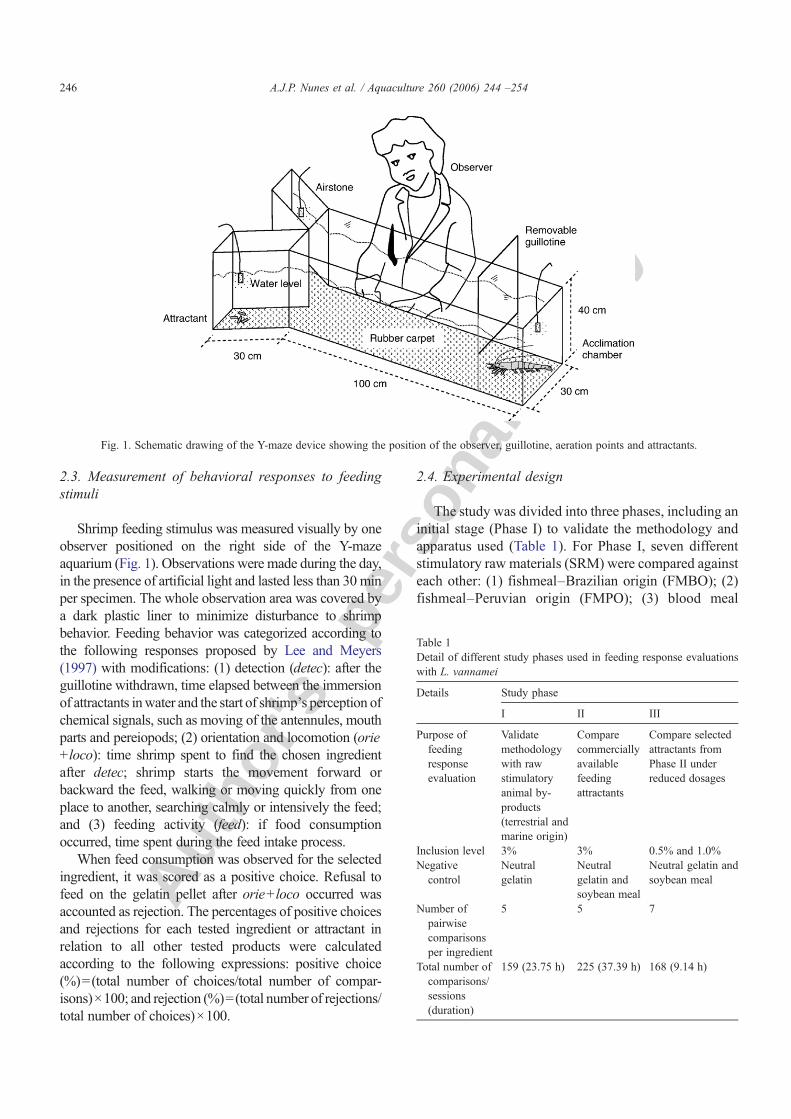
Shrimp feeding stimulus was measured visually by oneobserver positioned on the right side of the Y-mazeaquarium (Fig. 1). Observations were made during the day,in the presence of artificial light and lasted less than 30 minper specimen. The whole observation area was covered bya dark plastic liner to minimize disturbance to shrimpbehavior. Feeding behavior was categorized according tothe following responses proposed by Lee and Meyers(1997) with modifications: (1) detection (detec): after theguillotine withdrawn, time elapsed between the immersionof attractants inwater and the start of shrimp's perception ofchemical signals, such as moving of the antennules, mouthparts and pereiopods; (2) orientation and locomotion (orie+ loco): time shrimp spent to find the chosen ingredientafter detec; shrimp starts the movement forward orbackward the feed, walking or moving quickly from oneplace to another, searching calmly or intensively the feed;and (3) feeding activity (feed): if food consumptionoccurred, time spent during the feed intake process.
When feed consumption was observed for the selectedingredient, it was scored as a positive choice. Refusal tofeed on the gelatin pellet after orie+loco occurred wasaccounted as rejection. The percentages of positive choicesand rejections for each tested ingredient or attractant inrelation to all other tested products were calculatedaccording to the following expressions: positive choice(%)=(total number of choices/total number of compar-isons)×100; and rejection (%)=(total number of rejections/total number of choices)×100.
2.4. Experimental design
The study was divided into three phases, including aninitial stage (Phase I) to validate the methodology andapparatus used (Table 1). For Phase I, seven differentstimulatory raw materials (SRM) were compared againsteach other: (1) fishmeal–Brazilian origin (FMBO); (2)fishmeal–Peruvian origin (FMPO); (3) blood meal
Fig. 1. Schematic drawing of the Y-maze device showing the position of the observer, guillotine, aeration points and attractants.
Table 1Detail of different study phases used in feeding response evaluationswith L. vannamei
Details Study phase
I II III
Purpose offeedingresponseevaluation
Validatemethodologywith rawstimulatoryanimal by-products(terrestrial andmarine origin)
Comparecommerciallyavailablefeedingattractants
Compare selectedattractants fromPhase II underreduced dosages
Inclusion level 3% 3% 0.5% and 1.0%Negativecontrol
Neutralgelatin
Neutralgelatin andsoybean meal
Neutral gelatin andsoybean meal
Number ofpairwisecomparisonsper ingredient
5 5 7
Total number ofcomparisons/sessions(duration)
159 (23.75 h) 225 (37.39 h) 168 (9.14 h)
246 A.J.P. Nunes et al. / Aquaculture 260 (2006) 244 –254

Autho
r's
pers
onal
co
py
(BM); (4) meat and bone meal (MBM); (5) squid meal(SM); (6) fish oil (FO); and (7) fish solubles (FS). Therewas also a control (CON) without SRM. SRM wereincluded at 3% wet basis and tested for at least fivedifferent specimens of L. vannamei. Animals werediscarded after each session.
Phase II of the study consisted of comparing ninecommercially available attractants for shrimp at a 3%level wet basis. Each commercial attractant was testedwith five different specimens of L. vannamei of 9.2±2.47 g body weight. Attractants used in this phase were asfollows: (1) 80% crude protein (CP) vegetable driedbiomass (VDB80); (2) 68% CP vegetable dried biomass+glutamate+betaine (VDB68); (3) complex of aminoacids (alanine, valine, glycine, proline, serine, histidine,glutamic acid, tyrosine and betaine) with enzymaticallydigested bivalve mollusk (CAA); (4) condensed fishsoluble protein (CFSP); (5) squid liver meal (SLM); (6)betaine (Bet); (7) dried fish solubles–low biogenic amines(DFSLB); (8) dried fish solubles–high biogenic amines(DFSHB); and (9) whole squid protein hydrolysate(WSPH).
The four best attractants from Phase II were selectedand compared in Phase III at 0.5 and 1% inclusion levelswet-basis. Each inclusion level and individual attractantwas tested with seven different specimens of L. vannameiof 9.4± 3.47 g body weight. In Phases II and III, ingre- dients were compared against each other, as well as against
a negative control. In this case, soybean meal at 3%inclusion wet basis was used as the negative control(CON), without any additional ingredient source available.
2.5. Preparation of gelatin pellets
Each SRWand commercial attractant was weighed to1.73 g and individually mixed with 50 ml of water and7.5 g of neutral gelatin. This solution was homogenizedin a magnetic stirrer with heating during 5 min. Aftermixture, the solution was then transferred to a smallcontainer with plastic straws intended to give acylindrical shape which was then kept under refriger-ation until gelatinization. Gelatin pellets were thenexpelled from straws and sliced to a size of 5.5 mm inlength. All pellets were kept frozen at −20 °C until use.
2.6. Statistical analyses
For each Phase, positive and rejection data derivedfrom comparisons carried out among all ingredients orattractants were submitted to the chi-square analysis.Whenever possible, paired comparisons were conductedwith the z-test if differences were statistically significant(P<0.05). The times for detection (detec), orientation
Table 2Number of comparisons and percentages of positive choices andrejections of individual stimulatory raw materials (SRM) offered to L.vannamei juveniles (6–8 g)
Attractant⁎ Number ofComparisons
Positivechoices⁎⁎, ⁎⁎⁎ (%)
Rejection⁎⁎⁎⁎
CON 35 2.9g 100.0MBM 44 54.5af 8.3SM 44 59.1ad 0.0FMPO 41 75.6a 0.0FMBO 41 65.9ac 0.0BM 35 45.7bcdef 25.0FO 35 25.7b 44.4FS 41 58.5ae 8.3
Chi-square P <0.001 – #
Each comparison represents the response of one animal submittedsimultaneously to two SRM in a Y-maze apparatus.
⁎ Control (no addition of SRM; neutral gelatin plus water),MBM (meat and bone meal), SM (squid meal), FMPO (fishmeal–Peruvian origin), FMBO (fishmeal–Brazilian origin), BM (bloodmeal), FO (fish oil) and FS (fish solubles).
⁎⁎ Positive choice (%)=(number of choices/number of compar-isons)×100.⁎⁎⁎ Values in column which do not share the same superscript
letter are statistically different by the z-test (P<0.05).⁎⁎⁎⁎ Rejection (%)=(number of rejections/number of choices)×100.
# Not applicable.
Table 3Frequency of positive choices (%) of individual stimulatory rawmaterials (SRM) in L. vannamei juveniles (6–8 g) stocked in a Y-mazeapparatus
Attractant a Control MBM SM FMPO FMBO BM FO FS
CON – 100(5)
100(5)
100(5)
100(5)
100(5)
80(5)
100(5)
MBM 0 (5) – 75(8)
80 (5) 75 (8) 20(5)
20(5)
38(8)
SM 0 (5) 25 (8) – 50 (8) 63 (8) 20(5)
20(5)
40(5)
FMPO 0 (5) 20 (5) 50(8)
– 20 (5) 20(5)
0 (5) 38(8)
FMBO 0 (5) 25 (8) 38(8)
80 (5) – 80(5)
0 (5) 20(5)
BM 0 (5) 80 (5) 80(5)
80 (5) 20 (5) – 40(5)
80(5)
FO 20 (5) 80 (5) 80(5)
100(5)
100(5)
60(5)
– 80(5)
FS 0 (5) 38 (8) 60(5)
63 (8) 80 (5) 20(5)
20(5)
–
Frequency of choice of the SRM is presented as the value in rowcompared against the SRM value in column. Data in parenthesesindicate number of comparisons conducted for each comparison.a Control (no addition of SRM; neutral gelatin plus water), MBM
(meat and bone meal), SM (squid meal), FMPO (fishmeal–Peruvianorigin), FMBO (fishmeal–Brazilian origin), BM (blood meal), FO(fish oil) and FS (fish solubles).
247A.J.P. Nunes et al. / Aquaculture 260 (2006) 244 –254

Autho
r's
pers
onal
co
py
and locomotion (orie+ loco) and feeding activity (feed)were subjected to one-way or two-way ANOVA,followed by Turkey's Multiple Range Test if the nullhypothesis was rejected (P<0.05).
3. Results
3.1. Validation of the Y-maze methodology
Water quality during behavioral sessions with L.vannamei were kept at 4.6±0.47 mg/L dissolvedoxygen, 27.9±0.15 °C temperature and 31.3±1.03‰salinity. The negative gelatin pellet (CON) wassignificantly less chosen by shrimp than any of theSRM tested (P<0.05; Table 2). A higher percentage ofpositive choices was observed for FMPO and FMBOwhich were significantly different from the valuesreported for BM and FO (Table 2). Blood meal (BM)and FO exhibited the poorest results for positivechoices. Additionally, the percentage rejection waslow for all SRM tested except for FO. There were nosignificant differences between the positive choices forFMPO and FMBO and those reported for FS, SM andMBM. Fishmeal–Peruvian origin (FMPO), FMBO andSM were not rejected by L. vannamei in any occasion.
Paired comparisons carried out between the SRMconfirm these results (Table 3). The negative controlgelatin pellet (CON) was chosen only once whencompared with FO. Fishmeal–Peruvian origin (FMPO),FMBO and SM scored the highest choices among allSRM tested. FMPO always prevailed in shrimp choices
Fig. 2. Time L. vannamei juveniles spent in detection, orientation and locomotion and feeding activity of SRM (stimulatory raw material). Datapresented as mean±S.D. of SRM against the control diet (neutral gelatin plus water). Bar values which do not share the same superscript arestatistically different by Turkey's Multiple Range Test (P<0.05). MBM, meat and bone meal; SM, squid meal; FMPO, fishmeal–Peruvian origin;FMBO, fishmeal–Brazilian origin; BM, blood meal; FO, fish oil, and; FS, fish solubles.
Table 4Number of comparisons and percentages of positive choices andrejections of nine commercial attractants fed to L. vannamei juveniles(9.2±2.47 g)
Attractant⁎ Number ofcomparisons
Positive choices(%)⁎⁎, ⁎⁎⁎
Rejection(%)⁎⁎⁎⁎
CON# 45 20.0f 22.2VDB80 45 35.6ef 37.5VDB68 45 40.0def 27.8CAA 45 66.7ab 0.0CFSP 45 73.3a 3.0SLM 45 62.2abcd 0.0Bet 45 42.2cde 15.8DFSLB 45 53.3abcde 8.3DFSHB 45 46.7bcde 19.0WSPH 45 60.0abcd 0.0
Chi-square P <0.001 – †
Attractants were tested at a 3% level wet basis. Each result representsthe response of one animal exposed simultaneously to two attractantsin a Y-maze apparatus.
⁎ VDB80: 80% CP vegetable dried biomass; VDB68: 68% CPvegetable dried biomass+glutamate+betaine; CAA: complex ofamino acids (alanine, valine, glycine, proline, serine, histidine,glutamic acid, tyrosine and betaine) with enzymatically digestedbivalve mollusk; CFSP: condensed fish soluble protein; SLM: squidliver meal; Bet: betaine; DFSLB: dried fish solubles–low biogenicamines; DFSHB: dried fish solubles–high biogenic amines; WSPH:whole squid protein hydrolysate.
⁎⁎ Positive choice (%)=(number of choices/number of compar-isons)×100.⁎⁎⁎ Values in the column which do not share the same superscript
are statistically different by the z-test (P<0.05).⁎⁎⁎⁎ Rejection (%)=(number of rejections/number of positivechoices)×100.
# Control, 3% soybean meal+neutral gelatin.† Not applicable.
248 A.J.P. Nunes et al. / Aquaculture 260 (2006) 244 –254
Autho
r's
pers
onal
co
py
except when compared with SM. When FMPO andFMBO were compared, shrimp chose the former moreoften (Table 3). In general, SRMof terrestrial sourceswereless preferred by L. vannamei than from marine origin.
Analysis of variance indicated significant differencesin time spent in detection, orientation+locomotion andfeeding among SRM tested (Fig. 2; P<0.05). Shrimpspent longer to detect FO than all other SRM tested exceptMBM.Conversely, a shorter periodwas required to detectFMPO and FMBO when compared to MBM. Shrimpspent longer time in orie+ locowhen fed FO than all other
SRM, except when exposed to BM and FS. Shrimp spentsignificantly more time feeding on FMPO than when fedMBM, FO and FS (P<0.05).
3.2. Evaluation of commercial attractants and stimulants
In shrimp feeding responses to commercial attractants, astatistically higher number of positive choices wasachieved with CFSP when compared to VDB80, VDB68,Bet, DFSHB and CON (P<0.05; Table 4). On the otherhand, there were no significant differences between the
Table 5Frequency of positive choices (%) of nine commercial attractants fed to L. vannamei (9.2±2.47 g) stocked in a Y-maze apparatus
Attraca CONb VDB80 VDB68 CAA CFSP SLM Bet DFSLB DFSHB WSPH
CONb – 40 20 0 0 20 40 20 20 20VDB80 60 – 40 20 0 20 60 40 40 40VDB68 80 60 – 20 20 20 40 40 40 40CAA 100 80 80 – 60 80 40 60 40 60CFSP 100 100 80 40 – 60 60 80 80 60SLM 80 80 80 20 40 – 60 60 80 60Bet 60 40 60 60 40 40 – 20 40 20DFSLB 80 60 60 40 20 40 80 – 60 40DFSHB 80 60 60 60 20 20 60 40 – 20WSPH 80 60 60 40 40 20 80 60 80 –
Five comparisons were carried out for each pair of attractants. Frequency of choice of the attractant is presented as the value in each row comparedagainst the attractant value in each column.a Commercial attractant: VDB80: 80% CP vegetable dried biomass; VDB68: 68% CP vegetable dried biomass+glutamate+betaine; CAA:
complex of amino acids (alanine, valine, glycine, proline, serine, histidine, glutamic acid, tyrosine and betaine) with enzymatically digested bivalvemollusk; CFSP: condensed fish soluble protein; SLM: squid liver meal; Bet: betaine; DFSLB: dried fish solubles–low biogenic amines; DFSHB:dried fish solubles–high biogenic amines; WSPH: whole squid protein hydrolysate.b 3% soybean meal+neutral gelatin.
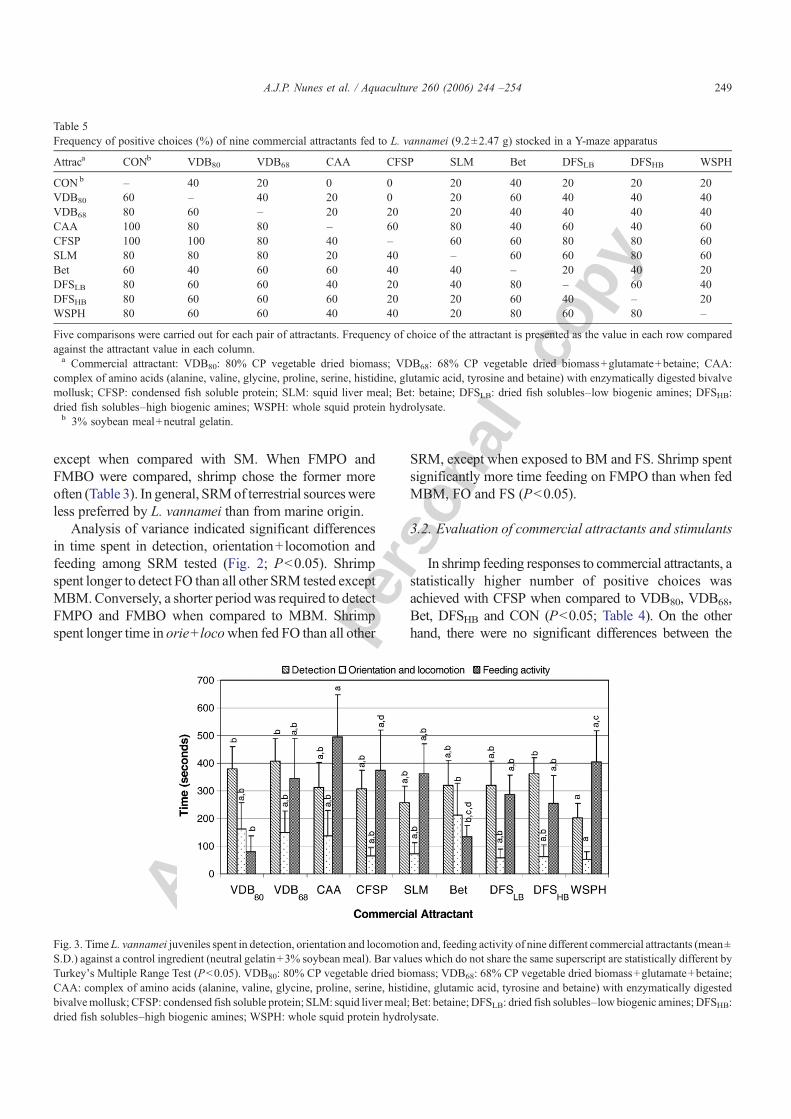
Fig. 3. Time L. vannamei juveniles spent in detection, orientation and locomotion and, feeding activity of nine different commercial attractants (mean±S.D.) against a control ingredient (neutral gelatin+3% soybean meal). Bar values which do not share the same superscript are statistically different byTurkey's Multiple Range Test (P<0.05). VDB80: 80% CP vegetable dried biomass; VDB68: 68% CP vegetable dried biomass+glutamate+betaine;CAA: complex of amino acids (alanine, valine, glycine, proline, serine, histidine, glutamic acid, tyrosine and betaine) with enzymatically digestedbivalvemollusk; CFSP: condensed fish soluble protein; SLM: squid liver meal; Bet: betaine; DFSLB: dried fish solubles–low biogenic amines; DFSHB:dried fish solubles–high biogenic amines; WSPH: whole squid protein hydrolysate.
249A.J.P. Nunes et al. / Aquaculture 260 (2006) 244 –254

Autho
r's
pers
onal
co
pyCFSP positive choices and those verified for CAA, SLM,DFSLB and WSPH. Level of shrimp rejection for CFSPreached 3%.
Gelatin pellets with the complex of amino acids (CAA)were significantly more chosen by shrimp than VDB80,VDB68, Bet and CON. However, the differences betweenCAA positive choices and those found for CFSP, SLM,DFSLB, DFSHB and WSPH were not statisticallysignificant (P<0.05; Table 4). No rejection was observedfor the complex of amino acids (CAA).
Squid liver meal (SLM) and WSPH were signifi-cantly more chosen by shrimp only when compared withVDB80 and CON. Nevertheless, SLM and WSPHresults for positive choices were not significantlydifferent than those verified for VDB68, CAA, CFSP,Bet, DFSLB and DFSHB (Table 4). Furthermore, norejection was observed for both SLM and WSPH.
Dried fish solubles–low biogenic amines (DFSLB)showed a significantly higher positive choice only whencompared with CON (soybean meal+neutral gelatin).Although positive choices for DSFLB did not differ fromother commercial attractants tested (Table 4), itexhibited an 8.3% shrimp rejection. The worst resultswere observed for Bet, DFSHB and, mainly, for VDB80
and VDB68. These commercial attractants presented ahigh rejection by shrimp, which ranged from 15.8% to37.5%. Moreover, shrimp choices for VDB80 andVDB68 were not significantly different from thoseverified for the negative control ingredient (no attrac-tant; P>0.05).
When two-by-two comparisons were performed(Table 5), results suggested that CFSP and CAA werethe best commercial attractants evaluated. Considering aminimum frequency of choices of 60%, CFSP and CAAwere chosen preferentially in 8 and 7 out of 9 compari-sons, respectively. Gelatin pellets containing condensed
Table 6Number of comparisons and percentages of positive choices andrejections of four selected commercial attractants fed to L. vannameijuveniles (9.4±3.47 g)
Attractant ⁎ Inclusion level(%)
Positivechoices ⁎⁎, ⁎⁎⁎ (%)
Rejection ⁎⁎⁎⁎
CON# 3.0 8.9e 20.0CAA 0.5 51.8ab 0.0
1.0 67.9a 2.6CFSP 0.5 44.6bc 8.0
1.0 71.4a 5.0SLM 0.5 21.4de 8.3
1.0 30.4cd 0.0WSPH 0.5 17.9de 20.0
1.0 21.4de 8.3Chi-square P <0.001 –†
Attractants were challenged at 0.5% or 1.0% level. Each resultrepresents the response of one animal submitted simultaneously to twoattractants in a Y-maze apparatus. A total of 56 observations werecarried out for each paired comparison.
⁎ CAA: complex of amino acids (alanine, valine, glycine,proline, serine, histidine, glutamic acid, tyrosine and betaine) withenzymatically digested bivalve mollusk; CFSP: condensed fishsoluble protein; SLM: squid liver meal; WSPH: whole squid proteinhydrolysate.
⁎⁎ Positive choice (%)=(number of choices/number of compar-isons)×100.⁎⁎⁎ Values in the column which do not share the same superscript
are statistically different by the z-test (P<0.05).⁎⁎⁎⁎ Rejection (%)= (number of rejections/number of positivechoices)×100.
# Soybean meal+neutral gelatin.† Not applicable.
Table 7Frequency of choice (%) of four selected commercial attractants challenged at 0.5 or 1.0% level with L. vannamei juveniles (9.4±3.47 g) stocked in aY-maze apparatus
Att a CONb CAA0.5 CAA1.0 CFSP0.5 CFSP1.0 SLM0.5 SLM1.0 WSPH0.5 WSPH1.0
CON – 14.3 0.0 28.6 28.6 28.6 14.3 28.6 28.6CAA0.5 85.7 – 28.6 42.9 28.6 71.4 42.9 71.4 42.9CAA1.0 100.0 71.4 – 57.1 42.9 71.4 71.4 71.4 71.4CFSP0.5 71.4 57.1 42.9 – 14.3 57.1 28.6 42.9 42.9CFSP1.0 71.4 71.4 57.1 85.7 – 71.4 71.4 71.4 71.4SLM0.5 71.4 28.6 28.6 42.9 28.6 – 42.9 71.4 42.9SLM1.0 85.7 57.1 28.6 71.4 28.6 57.1 – 71.4 71.4WSPH0.5 71.4 28.6 28.6 57.1 28.6 28.6 28.6 – 57.1WSPH1.0 71.4 57.1 28.6 57.1 28.6 57.1 28.6 42.9 –
Seven comparisons were carried out for each combination of attractant and inclusion level. Frequency of choice of selected attractant is presented asthe value in each row compared against the attractant value in each column.3Frequency of choice of the attractant in the column when compared with the attractant in the row.a Commercial attractant: CAA: complex of amino acids (alanine, valine, glycine, proline, serine, histidine, glutamic acid, tyrosine and betaine)
with enzymatically digested bivalve mollusk; CFSP: condensed fish soluble protein; SLM: squid liver meal; WSPH: whole squid proteinhydrolysate.b Control: soybean meal+neutral gelatin.
250 A.J.P. Nunes et al. / Aquaculture 260 (2006) 244 –254

Autho
r's
pers
onal
co
pyfish soluble protein (CFSP) was not preferentiallychosen only when confronted with CAA.
In the opposite end, commercial attractants with theworst results were VDB80 and VDB68. These attractantsshowed very low frequency of choice (20% or 0%)when compared individually with other attractants(Table 5). Gelatin pellets with 80% CP or 68% CPvegetable dried biomass+glutamate+betaine (VDB80
and VDB68, respectively) were more chosen by shrimponly when compared with the control ingredient(soybean meal) or with Bet.
The time elapsed until attractant detection by shrimpwas significantly lower for WSPH when compared withDFSHB, VDB80 or VDB68 (P<0.05; Fig. 3). However,differences were not significant between WSPH andDFSLB, Bet, SLM, CFSP and CAA (P>0.05). Timeshrimp spent in orie+ loco was significantly lower whenWSPH was compared with Bet (P<0.05; Fig. 3). Therewere no statistically significant differences for all othercomparisons among attractants evaluated (P>0.05).
Finally, shrimp spent longer feeding on CAA whencompared with VDB80 or Bet (P<0.05; Fig. 3).Accordingly, the time of feed for CAAwas not statisticallydifferent from VDB68, CFSP, SLM, DFSLB, DFSHB andWSPH (P>0.05). The time shrimp spent feeding on thewhole squid protein hydrolysate (WSPH) was onlystatistically higher than VDB80 (P<0.05).
3.3. Selected commercial attractants and stimulantsunder reduced dosages
Both CFSP and CAA at 1.0% level (CAA1.0) weresignificantlymore chosen by shrimp thanCFSP0.5, SLM0.5,SLM1.0, WSPH0.5 and WSPH1.0 (Table 6; P<0.05). Theresults of positive choices forCFSP0.5 andCAA0.5were notas clear as those reported for the 1.0% inclusion level,particularly for CFSP1.0, SLM0.5, WSPH0.5 or WSPH1.0.These were chosen as only a few times as the CON and nostatistical differences were reported between them.
When CFSP1.0 was confronted with CAA1.0 therewas a slightly higher preference for CFSP1.0 (Table 7).This trend was kept even when all comparisons wereconsidered. However, no statistical analysis was possi-ble in this case.
Statistical differences with higher responsivenesswere observed for feed (Table 8). Hence, at lowerinclusion levels, feed appeared to be a better indicator ofattractiveness in L. vannamei than detec and orie+ loco.When tested at 1.0% level, CFSP1.0 showed an increasedorie+loco compared to other attractants tested (CAA,SLM and WSPH). The time required for detec ofCFSP1.0 was significantly higher than for CFSP0.5.
At 0.5% level, CFSP0.5 and CAA0.5 showed a similartime of feed (Table 8). In this case, it seemed thatCFSP0.5 was a better attractant than CAA0.5 since onlythe first has produced a significantly higher time of feedwhen compared to SLM0.5 and WSPH0.5 (P<0.05). Onthe other hand, at 1.0% level, the opposite was observed.CFSP1.0 and CAA1.0 had again comparable results offeeding activity but only CAA1.0 was statistically betterthan SLM1.0 and WSPH1.0 together.
4. Discussion
4.1. Validation phase
The very low percentage of positive choices and the100% rejection observed for the CON (gelatin+water)have fully demonstrated the suitability of the negativecontrol in attractiveness studies with L. vannamei.
The major components of feeding stimuli reportedover the years have been relatively small, water-soluble
Table 8Time L. vannamei juveniles spent in detection (detec), orientation andlocomotion (orie+ loco) and, feeding activity (feed) when fed fourselected commercial attractants (mean±S.D.; n=7) at two inclusionlevels (0.5% or 1.0%) compared with a control ingredient (neutralgelatin+3% soybean meal)
Time requiredfor
Attractant Time (seconds) a, b
0.5% level 1.0% level
detec CAA 307±91 291±51CFSP 312±80 330±90SLM 364±80 269±48WSPH 309±57 274±75
orie+ loco CAA 91±46 aX 70±39 bXCFSP 85±50 aX 150±50 aYSLM 86±55 aX 64±34 bXWSPH 64±22 aX 48.3±29 bX
feed CAA 191±33 acX 281±65 aYCFSP 224±56 aX 248±56 acXSLM 105±19 bX 204±39 bcYWSPH 153±36 bcX 170±45 bX
ANOVA P detec orie+ loco feedAttractant Ns 0.003 <0.001Level Ns Ns <0.001Attractant× level Ns 0.021 0.035
CAA: complex of amino acids (alanine, valine, glycine, proline,serine, histidine, glutamic acid, tyrosine and betaine) with enzymat-ically digested bivalve mollusk; CFSP: condensed fish soluble protein;SLM: squid liver meal; WSPH: whole squid protein hydrolysate.a For the same variable, means in a column which do not share the
same lowercase letter are statistically different by Turkey's MultipleRange Test (P<0.05).b For the same variable, means in a row which do not share the
same uppercase letter are statistically different between them by theTurkey's Multiple Range Test (P<0.05).
251A.J.P. Nunes et al. / Aquaculture 260 (2006) 244 –254

Autho
r's
pers
onal
co
py
chemicals, such as amino acids, mainly taurine, glycine,arginine, glutamic acid and alanine; small peptides,amines, nucleotides and nucleosides, and quaternaryammonium bases, such as betaine (Lee and Meyers,1997). Protein-rich ingredients of marine origin, such asfishmeal and squid meal contain these substances whichare feeding effectors for shrimp (Smith et al., 2005).Hence, the present results for FMPO and FMBO wereexpected and confirm the superior ability of marinefishmeal to stimulate L. vannamei chemoreceptors.
Fat- or oil-based materials are generally immisciblein water and therefore are not optimal chemicals toattract, stimulate or trigger shrimp feeding responses.The minimal content of water-soluble compounds in FOmakes it poorly effective as a feeding activator for fishor crustaceans feeds (Zimmer-Faust, 1989). Therefore,the results reported herein for FO demonstrate itprovided no or only a minimum feeding stimuli forL. vannamei.
Comparable positive feeding responses observed forFMPO and SM agree with previous studies whichindicate their beneficial effect in stimulating feed intakeand (or) growth (Fenucci et al., 1980). Results from thepresent study reiterate the ability of SM to stimulateshrimp feeding responses.
The quality and nutrient composition of fishmealmay vary highly according to the freshness and type ofthe raw material and the processing conditions adopted.Raw material freshness is best described by the contentof biogenic amines in fishmeal. Shrimp feeds containingfishmeal with increased levels of biogenic aminescaused a decrease in feed intake (Ricque-Marie et al.,1998; Mundheim et al., 2004). In our study, the higherpreference of L. vannamei for FMPO in comparisonwith FMBO suggests that FMBO had a poorer freshnesscondition, able to inhibit shrimp feeding activity to somelevel. FMBO is obtained from local fish processing by-products. Therefore, a higher degree of spoilage andhydrolysis may be expected compared to whole fishprocessed FMPO.
Proteins of terrestrial origin, such MBM, contain lessof these appetizing small water-soluble substances (Limand Dominy, 1991). Lee and Meyers (1997) havereported that some feedstuffs and chemical compoundscan function as feed intake inhibitors, especially thosewith high ammonia level. Ammonia is generally volatilewhen subjected to thermal action during the dryingprocess. In some cases, the volatile nitrogenous contentis used as an indicator of freshness of dietary feedstuffsand by-products included in animal feeds.
In view of the fact the validation phase results are inreasonable agreement with the results reported in
previous works (Fenucci et al., 1980; Lim and Dominy,1991; Holland and Borski, 1993; Lee and Meyers, 1997;Smith et al., 2005), the use of the Y-maze chamber maybe considered as a valid methodology to evaluatechemical feeding effectors in L. vannamei.
4.2. Commercial attractant evaluation
When overall results are analyzed, it can be seen thatCFSP, CAA and WSPH stimulated higher feedingresponses in L. vannamei in relation to other commercialattractants tested. On the other hand, VDB80 and VDB68
produced the worst results for almost all experimentalindicators observed. The other remaining attractants,i.e., SLM, Bet, DFSLB and DFSHB, can be categorizedas medium performance feeding stimulants.
Fish solubles are produced as a by-product of fishcanning and fish oil production industries. During theprocessing of fish to recover the oil fraction a mixture ofwater and oil is produced. This mixture is then centrifugedto remove the oil. The residual aqueous phase can be drawnoff and much of the water evaporated from it to producecondensed fish solubles (as CFSP) or dried fish solubles (asDFSLB andDFSHB). Fish solubles are high inwater-solublevitamins and have been used as a source of unidentifiedgrowth factors in poultry and swine feeding (Soares et al.,1970). As with water-soluble vitamins, fish solubles arealso high in water-soluble substances with boosted feedingstimuli response, such as amino acids (Smith et al., 2005).So the higher attractiveness for CFSP observed in our studyis supported by the accepted premise of feeding attractantsfor aquatic animals. On the other hand, results for DFSLBand DFSHB were not as good as those for CFSP. This mayindicate that the drying processing to which DFSLB andDFSHB were subjected has possibly damaged theirchemicals with attractiveness abilities.
Fish solubles–high biogenic amines (DFSHB)showed a higher level of rejection than DFSLB and itwas chosen relatively less than the latter. Cadaverine,histamine and putrescine are foul-smelling moleculesproduced by protein hydrolysis during putrefaction ofanimal tissue. Depending on the concentration it may bea toxic diamine, being the decarboxylation product ofthe amino acids lysine, histidine and arginine, respec-tively (Pike, 1993). Differences in fishmeal quality dueto variability in raw material freshness may be evaluatedby the content of biogenic amines left in fishmeal(Aksnes and Mundheim, 1997). Therefore, the presentresults suggest that raw material freshness affects thebioefficacy of the commercial attractant produced.
As previously mentioned analyses of natural fluids orof extracts of attractive natural materials to crustaceans
252 A.J.P. Nunes et al. / Aquaculture 260 (2006) 244 –254

Autho
r's
pers
onal
co
py
have generally shown that major stimulants are sub-stances of low molecular weight. They have chemicalproperties consistent with the hypothesis that they areamino acids or closely related substances (Heinen, 1980).In addition, Holland and Borski (1993) have suggestedthere are low-molecular-weight compounds other thanamino acids (e.g., nucleotides, tertiary amines, peptides)that contribute to the effectiveness of the <1000 MWfraction. There are also palatability factors in the whole(shrimp-head offal) extract that add to the low-molecular-weight stimulatory compounds to create the total palat-ability of the natural extract.
The superior results of attractiveness for the commer-cial complex of AA used in our work confirm the che-mosensory ability of amino acids to elicit positive feedingresponses in L. vannamei. Further, when CAA's resultswere contrasted with those obtained for betaine, itevidenced that amino acids pools are better attractantsfor L. vannamei than isolated ones.
However, the present results for betaine do not agreewith Smith et al. (2005) who found that betaine includedat 2% in the diet produced a significantly higher totalapparent daily feed intake in P. monodon. Although thatdisagreement can be attributed to the different method-ologies carried out in the two studies, it is pointed outthat two distinct sources of betaine were used. Thebetaine used by Smith et al. (2005) contained additionalamino acids from hydrolysed protein, whereas thesource used in the present study was composed ofbetaine alone. So the specific technological processesemployed to manufacture betaine products may havestrong impact on its stimulatory effects.
The increased feeding responses that WSPH and SLMhave provided in the present study indicate that whole orliver squid are effective attractants for L. vannamei.Results also indicate that the protein hydrolysis process towhich WSPH was submitted has produced even betterresponses. These observations agree with the positiveresponses reported in other studies with squid meal(Fenucci et al., 1980; Akiyama, 1986; Holland andBorski, 1993), but contrast with Smith et al. (2005). Theselatter authors observed that when more squid meal wasincluded in P. monodon feed there was a decrease in totaldaily feed intake. In the present study, the better results forWSPH are supported by Refstie et al. (2004), withAtlantic salmon, Córdova-Murueta and García-Carreño(2002), with L. vannamei, and Anggawati et al. (1990),with P. monodon.
The poor stimulatory effects of SRM from plantsources (VDB80 and VDB68) in our study suggest that(1) sources of vegetable origin have no or very lowstimulatory power; (2) high crude protein levels are not
necessarily indicators of attractiveness; and (3) the sup-plementation of vegetable sources with certain aminoacids (glutamate and betaine) may prove useless to stim-ulate feeding responses in L. vannamei.
4.3. Feeding responses to reduced dosages withcommercial attractants
Feeding attractants have been usually included inshrimp and prawn diets at levels ranging from 0.5% to5.0%, depending on the attractant type and the compo-sition of the diet (Hartati and Briggs, 1993). Smith et al.(2005), for instance, observed in P. monodon betterresponses for krill hydrolysate, fish hydrolysate, crusta-cean meal and krill meal when they were included in thediet at 1%, 2%, 5% and 5%, respectively. Felix andSudharsan (2004) tested glycine betaine included at 0.5%,1.0% or 1.5% in diets forMacrobrachium rosenbergii. Asa general rule, lower dietary inclusion levels of additivesare preferred, although this will depend on their cost,market availability and nutritional composition.
On the other hand, the “growth enhancer” approachallows higher dietary inclusion levels of ingredientswith boosted gustatory properties. In this context, up to15% of the growth promoting ingredient can be includedin the shrimp diet (Córdova-Murueta and García-Carreño, 2002). Here, it is expected that the so-calledenhancer has both feeding stimuli and nutritional impacton the diet.
The positive response observed for CAA in thepresent study is supported by Coman et al. (1996) whofound that the mixture of amino acids tested was aneffective stimulant to P. monodon. These authorshighlight that such strong response is consistent withsynergistic interactions of mixtures. However, it wasseen in our work a level effect in regards to CAA'sefficacy. The best results were only observed whenCAAwas used at 1.0% level. So these findings suggestthat no matter how effective an attractant is if itsinclusion is below the optimum level, shrimp stimula-tory feeding responses will be weaker.
CFSP1.0 has proven itself as the best commercialattractant evaluated in the present work for L. vannamei,followed near by CAA1.0. According with Carr andDerby (1986), the chemical and physical characteristicsowned by powerful stimulatory substances are thefollowing: low molecular weight, high water solubility,a source of N, non-volatility, and exhibit acidic or basicproperties. Assuming as a valid premise that the abilityof an attractant to elicit positive feeding responses maybe better estimated at lower inclusion levels, the longertime spent in feeding activity seen for CFSP0.5 is useful.
253A.J.P. Nunes et al. / Aquaculture 260 (2006) 244 –254

Autho
r's
pers
onal
co
py
However, the much longer time required for shrimp inorientation and locomotion when fed CFSP0.5 warrantsfurther examination.
When challenged by lower inclusion levels (0.5% or1.0%), SLM and WSPH did not show responses as goodas those verified in the previous phase (3.0% level).Hence, a reduction in inclusion level may be a usefulway to compare two or more attractants. Chemicalanalyses are further required to attain a more detailedunderstanding of the factors that caused the inferiorresults for SLM and WSPH in the challenging phase.Perhaps the amino acid profile in CAA and CFSPcontained more stimulatory effectors for L. vannameithan in SLM and WSPH. This is a question that remainsto be evaluated that is presently under consideration inour laboratory.
Acknowledgments
D. Lemos is grateful to the support of FAPESP (05/50578-2) and CNPq/SEAP (504031/2003-1).
References
Akiyama,D.M., 1986. The development of a purified feed and nutritionalrequirement of lysine in penaeid shrimp. Ph.D. Dissertation. TexasA&M University, College Station, Texas, USA, 80 pp.
Aksnes, A., Mundheim, H., 1997. The impact of raw material freshnessand processing temperature for fishmeal on growth, feed efficiencyand chemical composition of Atlantic halibut (Hippoglossushippoglosus). Aquaculture 149, 87–106.
Anggawati, A.M., Murtini, J.T., Heruwati, E.S., 1990. The use ofhydrolyzed protein concentrate in practical diets for Penaeusmonodon juveniles. Research Report. Research Institute for FishTechnology, Palmerah Jakarta, Indonesia. 12 pp.
Carr, W.E.S., 1988. The molecular nature of chemical stimuli in theaquatic environment. In: Atema, J., Fay, R.R., Popper, A.N.,Tavolga, W.N. (Eds.), Sensory Biology of Aquatic Animals.Springer-Verlag, New York, USA, pp. 3–27.
Carr, W.E.S., Derby, C.D., 1986. Chemically stimulated feeding inmarine animals: the importance of chemical mixtures and theinvolvement of mixture interactions. J. Chem. Ecol. 12, 987–992.
Coman, G.J., Sarac, H.Z., Fielder, D., Thorne, M., 1996. Evaluation ofcrystalline amino acids, betaine and AMP as food attractants of thegiant tiger prawn (Penaeus monodon). Comp. Biochem. Physiol.,A 113, 247–253.
Córdova-Murueta, J.H., García-Carreño, F.L., 2002. Nutritive value ofsquid and hydrolysed protein supplement in shrimp feed. Aquacul-ture 210, 371–384.
Felix, N., Sudharsan, M., 2004. Effect of glycine betaine, a feedattractant affecting growth and feed conversion of juvenile
freshwater prawn Macrobrachium rosenbergii. Aquac. Nutr. 10,193–197.
Fenucci, J.L., Zein-Eldin, Z.P., Lawrence, A.L., 1980. The nutritionalresponse of two penaeid species to various levels of squid meal in aprepared feed. Proc. World Maric. Soc. 11, 403–409.
Hartati, R., Briggs, M.R.P., 1993. Effect of feeding attractants on thebehavior and performance of juvenile Penaeus monodon Fabricius.Aquac. Fish. Manage. 25, 13–624.
Heinen, J.M., 1980. Chemoreception in decapod Crustacea andchemical feeding stimulants as potential feed additives. Proc.World Maric. Soc. 11, 319–334.
Holland, K.N., Borski, R.J., 1993. A palatability bioassay fordetermining ingestive stimuli in the marine shrimp Penaeusvannamei. Aquaculture 109, 153–164.
Huang, G.Q., Dong, S.L., Wang, F., Ma, S., 2003. Selection and use ofdifferent diets in a study on Chinese shrimp, Fenneropenaeuschinensis. J. Shellfish Res. 22, 547–553.
Lee, P.G., Meyers, S.P., 1997. Chemoattraction and feeding stimula-tion. In: D'Abramo, L.R., Conklin, D.E., Akiyama, D.M. (Eds.),Crustacean Nutrition. Advances in World Aquaculture, vol. 6. TheWorld Aquaculture Society, Baton Rouge, USA, pp. 292–352.
Lim, C., Dominy, W.G., 1991. Utilization of plant proteins bywarmwater fish. In: Akiyama, D.M., Tan, R.K.H. (Eds.),Proceedings of the Aquaculture Feed Processing and NutritionWorkshop, 19–25 September 1991, Thailand and Indonesia.American Soybean Association, Singapore, Republic of Singa-pore, pp. 80–98.
Mundheim, H., Aksnes, A., Hope, B., 2004. Growth, feed efficiencyand digestibility in salmon (Salmo salar L.) fed different dietaryproportions of vegetable protein sources in combination with twofishmeal qualities. Aquaculture 237, 315–331.
Peñaflorida, V., Virtanen, E., 1996. Growth, survival and feed conversionof juvenile shrimp (Penaeus monodon) fed a betaine/amino acidadditive. Isr. J. Aquac.-Bamidgeh 48, 3–9.
Pike, I.H., 1993. Freshness of fish for fishmeal—effect on growth ofsalmon. In: Kaushik, S.J., Luquet, P. (Eds.), Fish Nutrition inPractice. INRA, Paris, pp. 843–846.
Refstie, S., Olli, J.J., Standal, H., 2004. Feed intake, growth, andprotein utilization by post-smolt Atlantic salmon (Salmo salar) inresponse to graded levels of fish protein hydrolysate in the diet.Aquaculture 239, 331–349.
Ricque-Marie, D., Abdo-de La Parra, M.I., Cruz-Suárez, L.E., Cuzon,G., Cousin, M., Pike, I.H., 1998. Raw material freshness, a qualitycriterion for fish meal fed to shrimp. Aquaculture 165, 95–109.
Smith, D.M., Tabrett, S.J., Barclay, M.C., Irvin, S.J., 2005. Theefficacy of ingredients included in shrimp feeds to stimulate intake.Aquac. Nutr. 11, 263–271.
Soares, J.H., Miller, D., Ambrose, M.E., 1970. Chemical compositionof Atlantic and gulf menhaden fish solubles. Feedstuffs 42, 65.
Zimmer-Faust, R.K., 1989. The relationship between chemoreceptionand foraging behavior in crustaceans. Limnol. Oceanogr. 34,1367–1374.
254 A.J.P. Nunes et al. / Aquaculture 260 (2006) 244 –254
Copyright © 2022 FDOKUMEN