Development of E-Money in Malaysia
12
Development of E-Money in Malaysia Sockalingam R.Ramasamy, Balachandher Krishnan Guru, Mahendhiran Nair and Santha Vaithilingam Paper Presented at the National Statistics Conference, Putrajaya International Convention Centre, Putrajaya, Malaysia, 4-5th Sept 2006 Abstract This paper examines the consumer reactions to the various e-money initiatives in Malaysia and also examines the short and long run effects of the alternative payment mechanisms on the currency in circulation. With regards to consumer reactions, there are positive signs which are however, marred by the lack of support by the issuers particularly in relation to reload facilities and general acceptability of the e-money initiatives. The study also indicated significant short and long run effect of e-money and several other payment alternatives on the currency in circulation. The evidence seems to support the belief that payment alternatives such as e-money and credit cards would displace currency in circulation both in the short run and in the long run. 1. Introduction Over the years, money as we know it has been undergoing transformation. The shape and form of money has changed from precious metals to metal coins and paper money with no intrinsic value and today it presents us with a formless form in the name of digital or e-money. The digitization of money appears to be inevitable in the light of the recent developments with regards to the Internet and the various e-commerce opportunities presented by the world wide web. The future of e-commerce depends to a great extent on the appropriate development and diffusion of e-money. However, economists and policy makers are concerned with the macroeconomic implications of the implementation of e- money. To this extent, this paper explores the development of e-money in Malaysia and the extent of its usage and it also examines the impact of e-money on money supply. To this extent, the study is divided into two parts. First a survey was carried out to evaluate the Malaysian consumers’ reaction to the various e-money initiatives undertaken in the country. The second part of this study is an effort to evaluate the impact of alternative payment mechanisms such as credit card and other e-money initiatives on the Malaysian money supply. 2. E-Money Initiatives in Malaysia In essence e-money refers to a variety of payment mechanisms used to make payments at retail outlets and over the internet through computer based communication technologies. The Bank for International Settlements (BIS,1996), has defined electronic money as the monetary value measured in currency units stored in electronic form on an electronic device in the consumer's possession. For the purpose of this study a working definition of e-money in the Malaysian context, is taken to include electronic purse initiatives such as MEPS cash and stored value cared such as Touch ‘n Go cards. The first attempt at e-money implementation in Malaysia was in 1999 with the introduction of MEPS cash in the Klang Valley. The initial response was not encouraging at all. The facilities to reload the cards with cash was limited, the outlets where MEPS cash was accepted was also few in numbers. However, the situation is quite different today where almost every ATM machine in the country is equipped with the ability to reload MEPS cash. 1
-
Upload
independent -
Category
Documents
-
view
0 -
download
0
Transcript of Development of E-Money in Malaysia
Development of E-Money in Malaysia Sockalingam R.Ramasamy, Balachandher Krishnan Guru, Mahendhiran Nair and
Santha Vaithilingam Paper Presented at the National Statistics Conference, Putrajaya International Convention Centre, Putrajaya, Malaysia, 4-5th Sept 2006
Abstract This paper examines the consumer reactions to the various e-money initiatives in Malaysia and also examines the short and long run effects of the alternative payment mechanisms on the currency in circulation. With regards to consumer reactions, there are positive signs which are however, marred by the lack of support by the issuers particularly in relation to reload facilities and general acceptability of the e-money initiatives. The study also indicated significant short and long run effect of e-money and several other payment alternatives on the currency in circulation. The evidence seems to support the belief that payment alternatives such as e-money and credit cards would displace currency in circulation both in the short run and in the long run. 1. Introduction Over the years, money as we know it has been undergoing transformation. The shape and form of money has changed from precious metals to metal coins and paper money with no intrinsic value and today it presents us with a formless form in the name of digital or e-money. The digitization of money appears to be inevitable in the light of the recent developments with regards to the Internet and the various e-commerce opportunities presented by the world wide web. The future of e-commerce depends to a great extent on the appropriate development and diffusion of e-money. However, economists and policy makers are concerned with the macroeconomic implications of the implementation of e-money. To this extent, this paper explores the development of e-money in Malaysia and the extent of its usage and it also examines the impact of e-money on money supply. To this extent, the study is divided into two parts. First a survey was carried out to evaluate the Malaysian consumers’ reaction to the various e-money initiatives undertaken in the country. The second part of this study is an effort to evaluate the impact of alternative payment mechanisms such as credit card and other e-money initiatives on the Malaysian money supply. 2. E-Money Initiatives in Malaysia In essence e-money refers to a variety of payment mechanisms used to make payments at retail outlets and over the internet through computer based communication technologies. The Bank for International Settlements (BIS,1996), has defined electronic money as the monetary value measured in currency units stored in electronic form on an electronic device in the consumer's possession. For the purpose of this study a working definition of e-money in the Malaysian context, is taken to include electronic purse initiatives such as MEPS cash and stored value cared such as Touch ‘n Go cards.
The first attempt at e-money implementation in Malaysia was in 1999 with the introduction of MEPS cash in the Klang Valley. The initial response was not encouraging at all. The facilities to reload the cards with cash was limited, the outlets where MEPS cash was accepted was also few in numbers. However, the situation is quite different today where almost every ATM machine in the country is equipped with the ability to reload MEPS cash. 1
Another effort in implementing electronic money in Malaysia came in the form of the Touch and Go cards offered by Rangkaian Segar which is a private company. The Touch ‘n Go cards were originally intended for toll payments along the Malaysian highways. The cards may either be linked to ones credit or bank card with automatic reload facilities to a stipulated maximum level once the amount on the cards fall to a predetermined minimum level. The cards may also be reloaded at some of the toll booths or at some banks ATM terminals. Despite the availability of these cards, it is not surprising to find long queues during peak hours along the cash booths along the local highways. Nevertheless, it is interesting to note that today the Touch ‘n Go cards are also used for other payments such as parking bays and train and bus fares. In addition, to the private initiatives undertaken with regards to the introduction of e-money in Malaysia, the Malaysian government too has undertaken initiatives towards the development of an electronic purse. The development of the national e-purse is one of the objectives under the Multimedia Super Corridor (MSC) concept managed by the Multimedia Development Corporation of Malaysia (MDC). This e-purse will have the capability of storing MEPS cash for retail payments. In this context, it must be noted that all Malaysian citizens are issued an identity card which is also a chip based multipurpose card. However, the extent to which the full potentials of these cards are exploited by the typical Malaysian citizen is questionable.
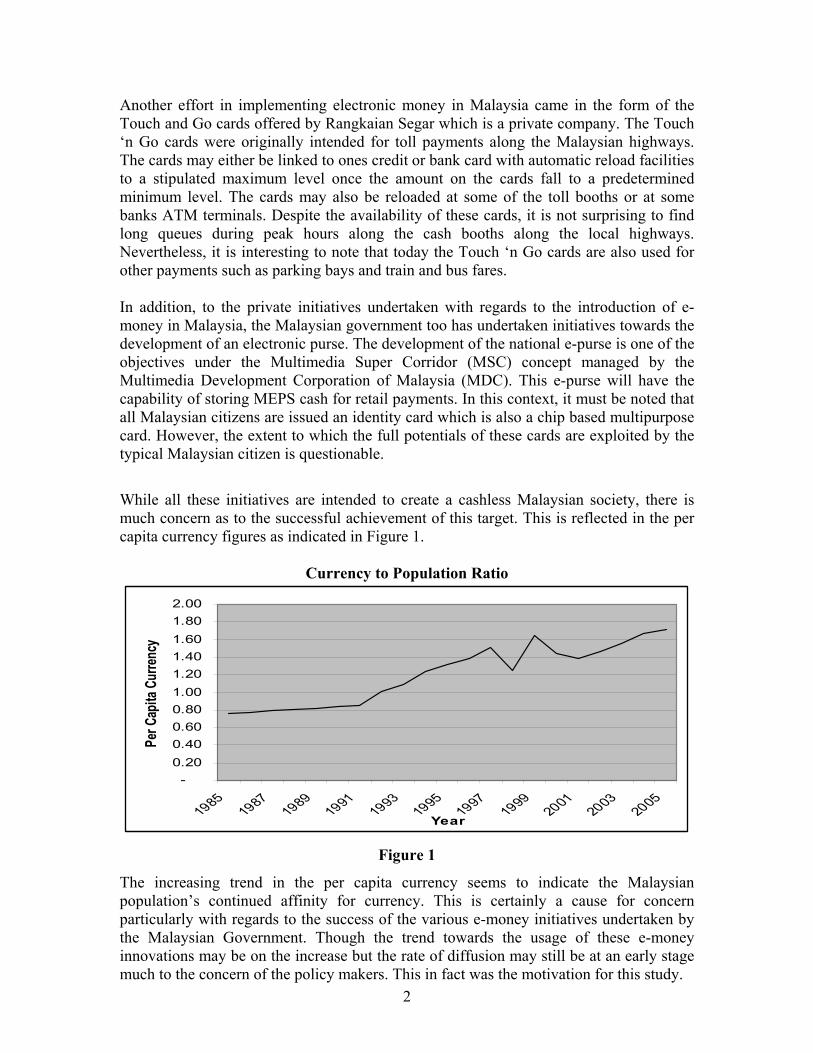
While all these initiatives are intended to create a cashless Malaysian society, there is much concern as to the successful achievement of this target. This is reflected in the per capita currency figures as indicated in Figure 1.
Currency to Population Ratio
-0.200.400.600.801.001.201.401.601.802.00
19851987
19891991
19931995
19971999
20012003
2005Year
Per C
apita
Cur
rency
Figure 1
The increasing trend in the per capita currency seems to indicate the Malaysian population’s continued affinity for currency. This is certainly a cause for concern particularly with regards to the success of the various e-money initiatives undertaken by the Malaysian Government. Though the trend towards the usage of these e-money innovations may be on the increase but the rate of diffusion may still be at an early stage much to the concern of the policy makers. This in fact was the motivation for this study. 2

3. An Evaluation of the Awareness and Utilization of the E-Money Initiatives
A survey was carried out to evaluate the Malaysian consumer reactions to the various e-money initiatives undertaken in Malaysia. To this extent, a structured self administered questionnaire was used to collect data. The questionnaires were administered via snail mail, e-mail, the Internet and personal interviews. A combination of quota and convenience sampling was used. It resulted in a total of 543 completed questionnaire from a total of about 2000 questionnaires sent out, thus representing a response rate of about 27.15%. Some of the interesting findings with regards to the e-money initiatives undertaken in Malaysia are presented as follows.
First with regards to the preferred modes of payment as indicated in Table 1, it is interesting to note that cash ranked second from the bottom. The results indicate an increasingly technology savvy Malaysian population preferring credit cards and cheques far more than cash. This is reflective of a positive indications of Malaysia’s move towards becoming a cashless society.
Table 1: Preferred Modes of Payments Payment Mode Mean Rank Overall Rank
Cash 1.46 2 Cheques 2.80 5 Credit Cards 3.06 6 Smart Cards/MEPS Cash 1.64 3 Debit Card 1.23 1 Charge Card 2.38 4 1= Least Preferred, 2= Next Preferred . . . 6=Most Preferred The next step was to evaluate the awareness and utilization of the various e-money initiatives available in Malaysia. It can be seen from Table 2 that the awareness of each of the card based e-money in Malaysia is generally higher than the level of utilization. The Gaps between awareness and utilization is rather significant indicating that there is still room for much improvement with regards to utilization given the existing levels of awareness. This calls for initiatives on the part of the card issuers and operators to promote further utilization of these cards both in terms of usability, infrastructure and most of all value to the consumers.
Table 2: E-money Awareness –Utilization Gap Analysis
Mean Scores E-Money Initiatives Awareness Utilization
T-Statistic
P-Value
Touch ‘n Go 3.69 2.43 11.29 0.0000 Phone Cards 3.52 2.01 14.52 0.0000 Smart Tag 3.18 1.39 17.26 0.0000 Photostat Machine Cards 2.35 1.30 10.60 0.0000 MEPS Cash 2.69 1.52 13.28 0.0000 It is also interesting to note from Table 3 that 67% of the survey respondents were holders or subscribers of MEPS cash. However it is rather worrying to note that of these
3

people who held MEPS cash about 72% of them had never used it for any transactions. In fact only 10.1% of these holders of MEPS cash were found to be active frequent users.
Table 3: MEPS Cash Utilization
Utilization of MEPS Cash Subscribe or Hold MEPS cash Never Used Sometimes Frequent
Use
Total
Yes 262 65 37 364 No 58 65 56 179 Total 320 130 93 543 The average monthly use of MEPS cash by the respondents who were subscribers of MEPS cash is presented in Figure 2 is also encouraging indicating in view of the wide continuum of usage. It is indicative that MEPS cash may be used for both small and large value items.
0.0
2.04.0
6.08.0
10.0
12.014.016.0
%
Under50
101-150
201-250
301-350
401-500
RM
Mothly Use of MEPS Cash
Figure 2
Despite the high awareness, the general lack of utilization can be attributed to many reasons. Some of these reasons as indicated by the respondents survey are as listed in Table 4 below. The most common problem is with ease of reloading MEPS cash followed by unsuitable and limited outlets where MEPS cash is accepted.
Table 4: Reasons for Not Using MEPS Cash
4
Type of Problem Number % Limited Outlets 82 14.5 Unsuitable Outlets 96 17.0 Problem Loading Cash 114 20.2 Don’t know how to use 68 12.1 Don’t know which Merchants Accept MEPS Cash
80 14.2
Merchants reluctant to accept MEPS Cash
55 9.8
Inconvenient 69 12.2 Total 564 100%
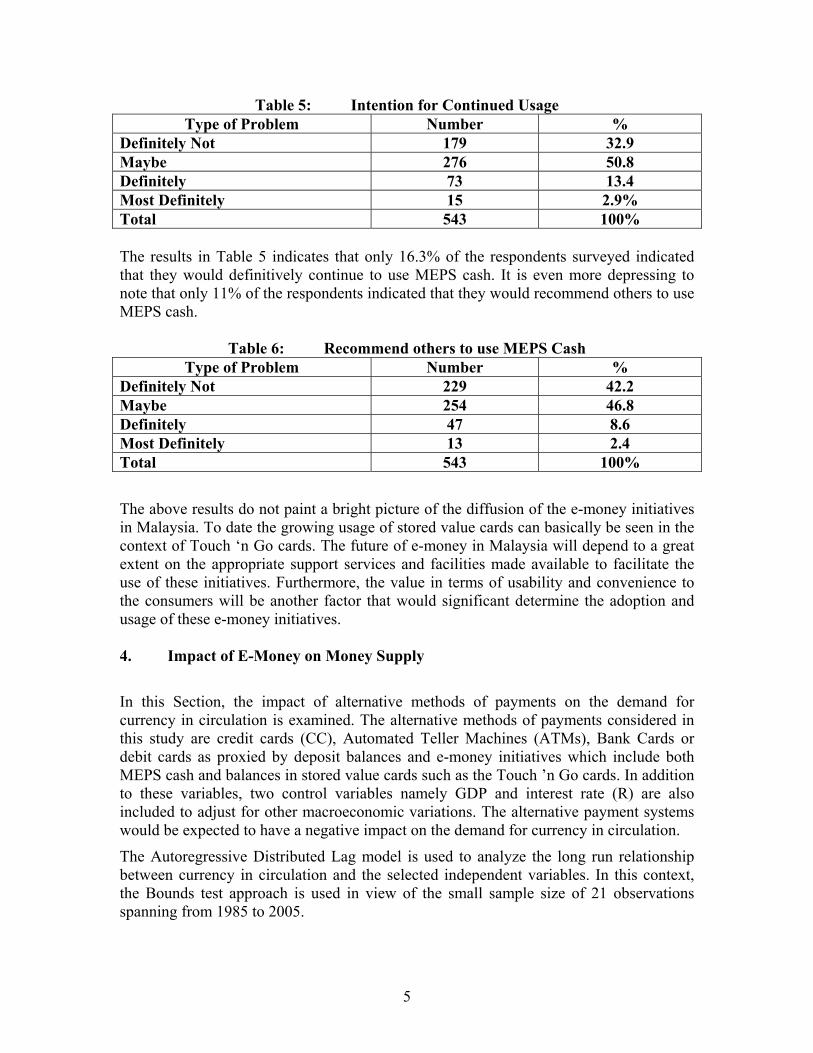
Table 5: Intention for Continued Usage Type of Problem Number %
Definitely Not 179 32.9 Maybe 276 50.8 Definitely 73 13.4 Most Definitely 15 2.9% Total 543 100%
The results in Table 5 indicates that only 16.3% of the respondents surveyed indicated that they would definitively continue to use MEPS cash. It is even more depressing to note that only 11% of the respondents indicated that they would recommend others to use MEPS cash.
Table 6: Recommend others to use MEPS Cash
Type of Problem Number % Definitely Not 229 42.2 Maybe 254 46.8 Definitely 47 8.6 Most Definitely 13 2.4 Total 543 100%
The above results do not paint a bright picture of the diffusion of the e-money initiatives in Malaysia. To date the growing usage of stored value cards can basically be seen in the context of Touch ‘n Go cards. The future of e-money in Malaysia will depend to a great extent on the appropriate support services and facilities made available to facilitate the use of these initiatives. Furthermore, the value in terms of usability and convenience to the consumers will be another factor that would significant determine the adoption and usage of these e-money initiatives. 4. Impact of E-Money on Money Supply
In this Section, the impact of alternative methods of payments on the demand for currency in circulation is examined. The alternative methods of payments considered in this study are credit cards (CC), Automated Teller Machines (ATMs), Bank Cards or debit cards as proxied by deposit balances and e-money initiatives which include both MEPS cash and balances in stored value cards such as the Touch ’n Go cards. In addition to these variables, two control variables namely GDP and interest rate (R) are also included to adjust for other macroeconomic variations. The alternative payment systems would be expected to have a negative impact on the demand for currency in circulation.
The Autoregressive Distributed Lag model is used to analyze the long run relationship between currency in circulation and the selected independent variables. In this context, the Bounds test approach is used in view of the small sample size of 21 observations spanning from 1985 to 2005.
5
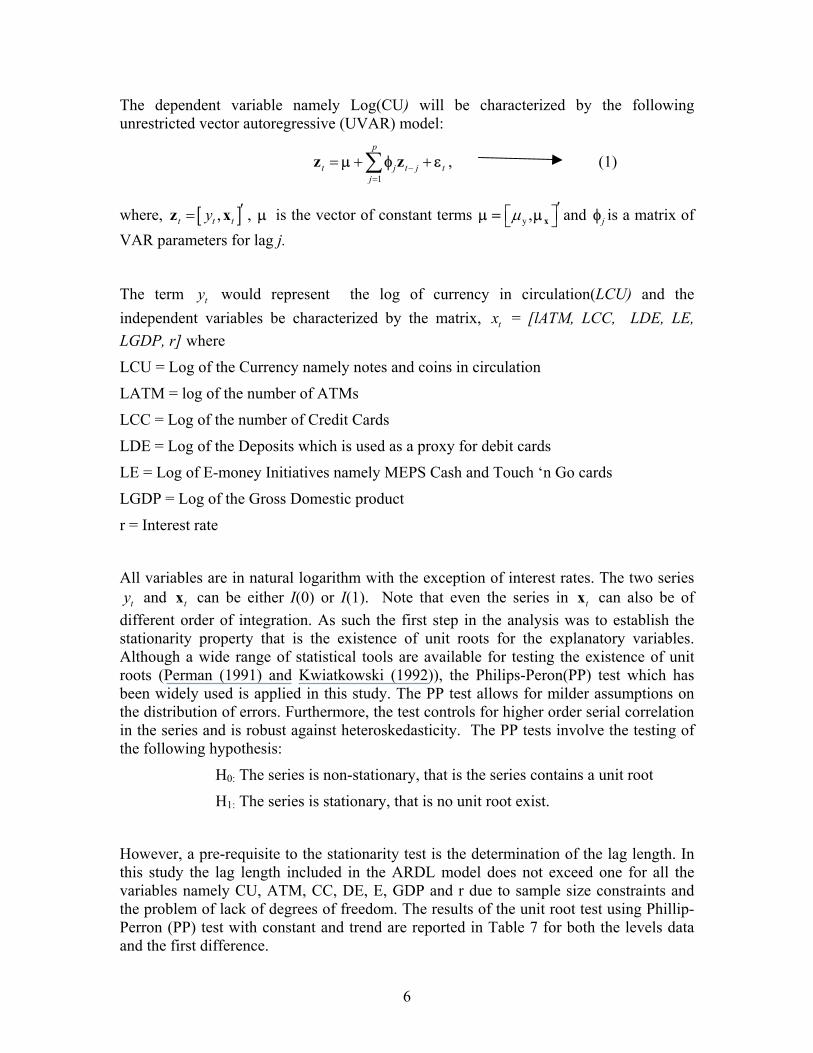
The dependent variable namely Log(CU) will be characterized by the following unrestricted vector autoregressive (UVAR) model:
1
p
t j tj
−=
j t= +∑z z +µ φ ε , (1)
where, , is the vector of constant terms [ ,t t ty ′=z x ] µ y ,µ ′ xµ = µ and is a matrix of VAR parameters for lag j.
jφ
The term would represent the log of currency in circulation(LCU) and the independent variables be characterized by the matrix,
ty
tx = [lATM, LCC, LDE, LE, LGDP, r] where
LCU = Log of the Currency namely notes and coins in circulation
LATM = log of the number of ATMs
LCC = Log of the number of Credit Cards
LDE = Log of the Deposits which is used as a proxy for debit cards
LE = Log of E-money Initiatives namely MEPS Cash and Touch ‘n Go cards
LGDP = Log of the Gross Domestic product
r = Interest rate
All variables are in natural logarithm with the exception of interest rates. The two series and can be either I(0) or I(1). Note that even the series in x can also be of
different order of integration. As such the first step in the analysis was to establish the stationarity property that is the existence of unit roots for the explanatory variables. Although a wide range of statistical tools are available for testing the existence of unit roots (Perman (1991) and Kwiatkowski (1992)), the Philips-Peron(PP) test which has been widely used is applied in this study. The PP test allows for milder assumptions on the distribution of errors. Furthermore, the test controls for higher order serial correlation in the series and is robust against heteroskedasticity. The PP tests involve the testing of the following hypothesis:
ty tx t
H0: The series is non-stationary, that is the series contains a unit root
H1: The series is stationary, that is no unit root exist.
However, a pre-requisite to the stationarity test is the determination of the lag length. In this study the lag length included in the ARDL model does not exceed one for all the variables namely CU, ATM, CC, DE, E, GDP and r due to sample size constraints and the problem of lack of degrees of freedom. The results of the unit root test using Phillip-Perron (PP) test with constant and trend are reported in Table 7 for both the levels data and the first difference.
6
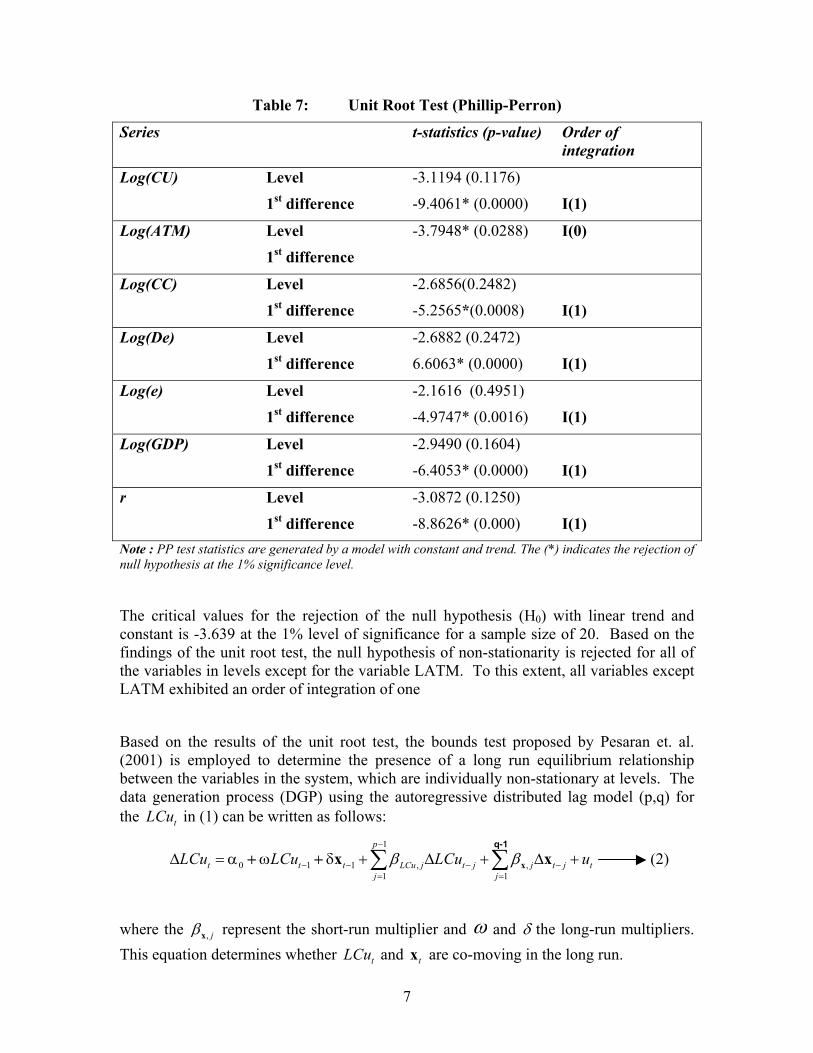
Table 7: Unit Root Test (Phillip-Perron)
Series t-statistics (p-value) Order of integration
Log(CU) Level
1st difference
-3.1194 (0.1176)
-9.4061* (0.0000)
I(1)
Log(ATM) Level
1st difference
-3.7948* (0.0288)
I(0)
Log(CC) Level
1st difference
-2.6856(0.2482)
-5.2565*(0.0008)
I(1)
Log(De) Level
1st difference
-2.6882 (0.2472)
6.6063* (0.0000)
I(1)
Log(e) Level
1st difference
-2.1616 (0.4951)
-4.9747* (0.0016)
I(1)
Log(GDP) Level
1st difference
-2.9490 (0.1604)
-6.4053* (0.0000)
I(1)
r Level
1st difference
-3.0872 (0.1250)
-8.8626* (0.000)
I(1) Note : PP test statistics are generated by a model with constant and trend. The (*) indicates the rejection of null hypothesis at the 1% significance level.
The critical values for the rejection of the null hypothesis (H0) with linear trend and constant is -3.639 at the 1% level of significance for a sample size of 20. Based on the findings of the unit root test, the null hypothesis of non-stationarity is rejected for all of the variables in levels except for the variable LATM. To this extent, all variables except LATM exhibited an order of integration of one
Based on the results of the unit root test, the bounds test proposed by Pesaran et. al. (2001) is employed to determine the presence of a long run equilibrium relationship between the variables in the system, which are individually non-stationary at levels. The data generation process (DGP) using the autoregressive distributed lag model (p,q) for the in (1) can be written as follows: tLCu
1
0 1 1 , ,1 1
p
t t t LCu j t j j tj j
LCu LCu LCu uβ β−
− − − −= =
∆ = α ω δ + ∆ + ∆ +∑ ∑ xx x+ +q-1
j t (2)
where the , jβx represent the short-run multiplier and ω and δ the long-run multipliers. This equation determines whether and are co-moving in the long run. tLCu tx
7
The ordinary least squares (OLS) method is used to estimate the model represented by equation (2) . Then to assess the validity for the existence of a long-run relationship between and , the F-test (Wald-type test) is used by testing for the exclusion of the lagged levels of and . This is done by imposing restrictions on the coefficients of and to be zero in line with the null hypothesis of the absence of a long-run relationship between and . In this context, the null hypothesis and the alternative hypothesis, are
tLCu tx
t−
1tLCu −
1−tx1−tx
LCu1LCu
t tx
0 : a ,0 nd H ω δ= = 0 and : 0 and ,aH ω δ≠ ≠ 0 respectively where 0 is a vector of zeroes. The non rejection of the null hypothesis would imply that has no long run impact on x .
(6 1× )tLCu t
If the computed F statistics under the null hypothesis is above the upper critical value given in Pesaran et al.(2001), then it would imply that the LCu is cointegrated with its determinants and thus there exist a stable long-run relationship between and . tLCu tx
0t tLCu vtθ= + +x1θ (3)
where 00 1, α δθ
ω ω= − = −θ and is a mean zero stationary process. Note that θ is the
long-run elasticity with respect to the determinants (Bardsen (1989)).
tv 1
On the other hand, if the computed F statistics falls below the lower critical value, then it can be concluded that LCut is not cointegrated with its determinants. However, if the computed F-statistics falls within the critical bounds, the results would be considered to be inconclusive. In this case, it would be necessary to determine the orders of integration before any conclusions can be drawn.
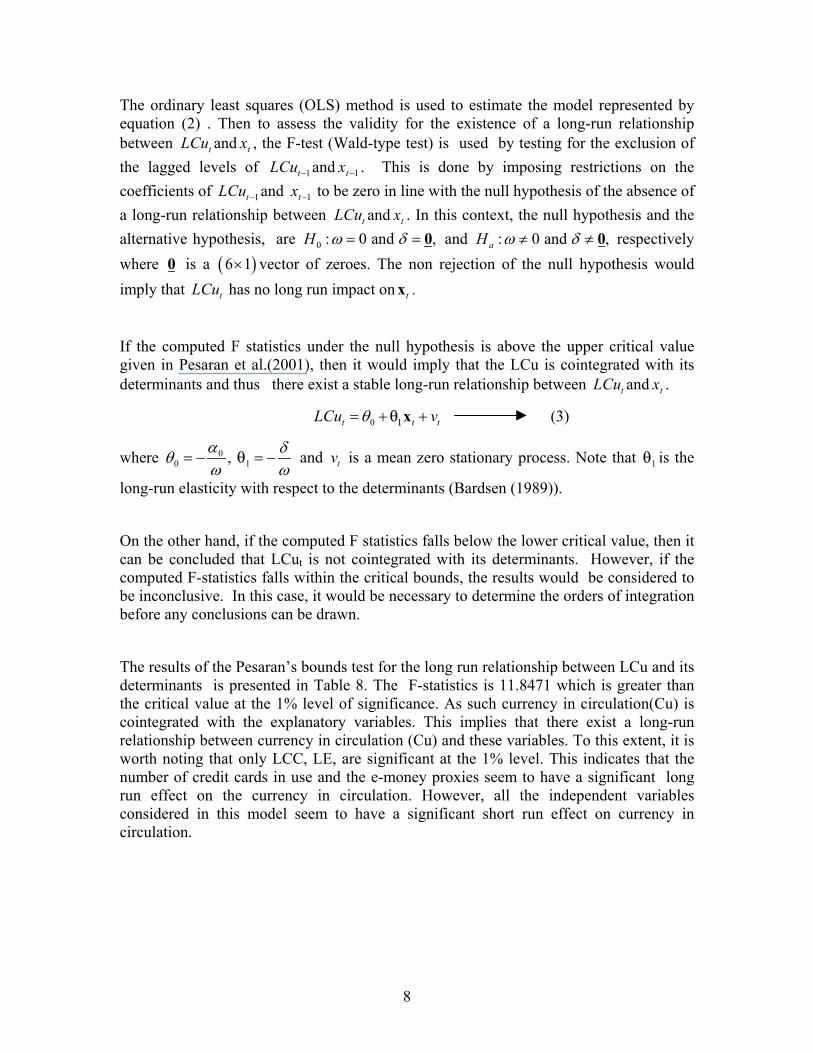
The results of the Pesaran’s bounds test for the long run relationship between LCu and its determinants is presented in Table 8. The F-statistics is 11.8471 which is greater than the critical value at the 1% level of significance. As such currency in circulation(Cu) is cointegrated with the explanatory variables. This implies that there exist a long-run relationship between currency in circulation (Cu) and these variables. To this extent, it is worth noting that only LCC, LE, are significant at the 1% level. This indicates that the number of credit cards in use and the e-money proxies seem to have a significant long run effect on the currency in circulation. However, all the independent variables considered in this model seem to have a significant short run effect on currency in circulation.
8
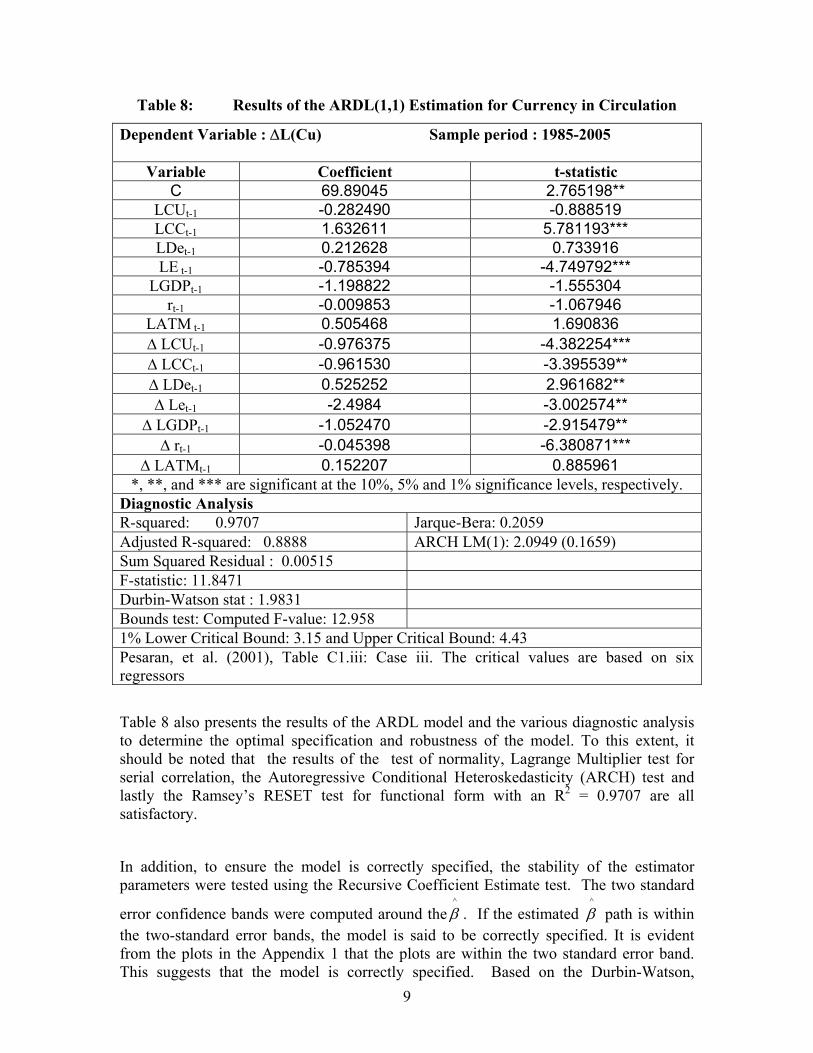
Table 8: Results of the ARDL(1,1) Estimation for Currency in Circulation
Dependent Variable : ∆L(Cu) Sample period : 1985-2005
Variable Coefficient t-statistic C 69.89045 2.765198**
LCUt-1 -0.282490 -0.888519 LCCt-1 1.632611 5.781193*** LDet-1 0.212628 0.733916 LE t-1 -0.785394 -4.749792***
LGDPt-1 -1.198822 -1.555304 rt-1 -0.009853 -1.067946
LATM t-1 0.505468 1.690836 ∆ LCUt-1 -0.976375 -4.382254*** ∆ LCCt-1 -0.961530 -3.395539** ∆ LDet-1 0.525252 2.961682** ∆ Let-1 -2.4984 -3.002574**
∆ LGDPt-1 -1.052470 -2.915479** ∆ rt-1 -0.045398 -6.380871***
∆ LATMt-1 0.152207 0.885961 *, **, and *** are significant at the 10%, 5% and 1% significance levels, respectively.
Diagnostic Analysis R-squared: 0.9707 Jarque-Bera: 0.2059 Adjusted R-squared: 0.8888 ARCH LM(1): 2.0949 (0.1659) Sum Squared Residual : 0.00515 F-statistic: 11.8471 Durbin-Watson stat : 1.9831 Bounds test: Computed F-value: 12.958 1% Lower Critical Bound: 3.15 and Upper Critical Bound: 4.43 Pesaran, et al. (2001), Table C1.iii: Case iii. The critical values are based on six regressors
Table 8 also presents the results of the ARDL model and the various diagnostic analysis to determine the optimal specification and robustness of the model. To this extent, it should be noted that the results of the test of normality, Lagrange Multiplier test for serial correlation, the Autoregressive Conditional Heteroskedasticity (ARCH) test and lastly the Ramsey’s RESET test for functional form with an R2 = 0.9707 are all satisfactory.
In addition, to ensure the model is correctly specified, the stability of the estimator parameters were tested using the Recursive Coefficient Estimate test. The two standard
error confidence bands were computed around the^β . If the estimated
^β path is within
the two-standard error bands, the model is said to be correctly specified. It is evident from the plots in the Appendix 1 that the plots are within the two standard error band. This suggests that the model is correctly specified. Based on the Durbin-Watson, 9
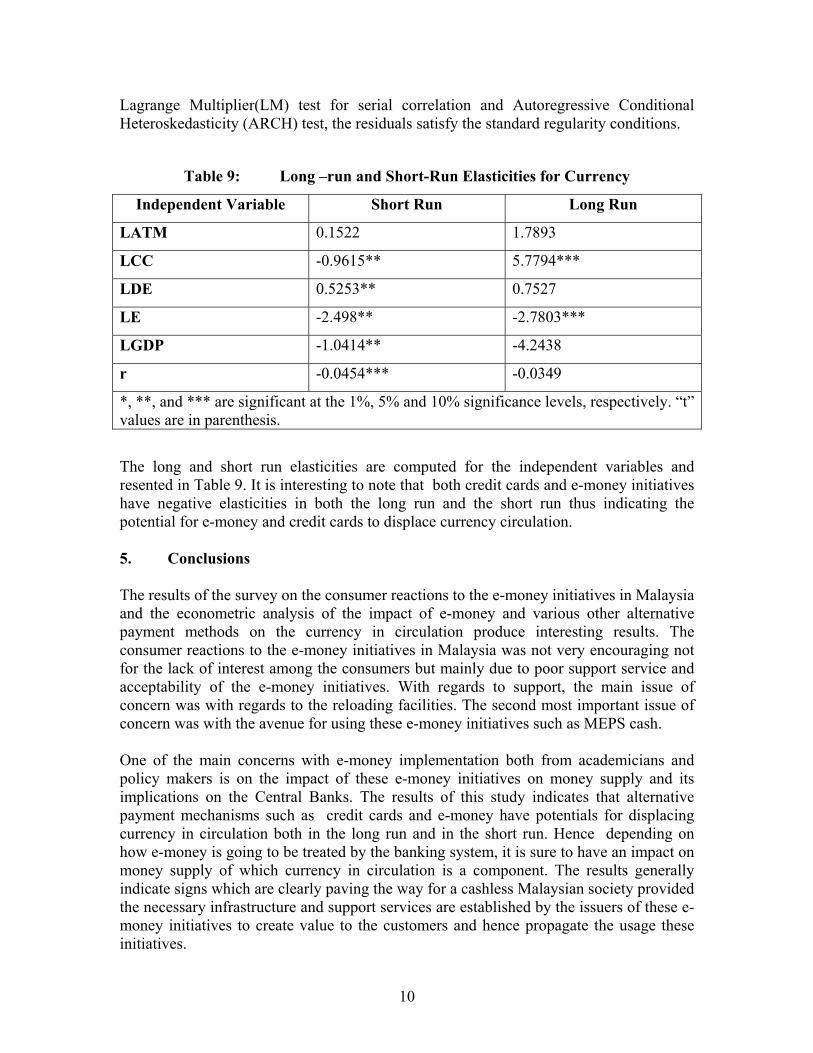
Lagrange Multiplier(LM) test for serial correlation and Autoregressive Conditional Heteroskedasticity (ARCH) test, the residuals satisfy the standard regularity conditions.
Table 9: Long –run and Short-Run Elasticities for Currency
Independent Variable Short Run Long Run
LATM 0.1522 1.7893
LCC -0.9615** 5.7794***
LDE 0.5253** 0.7527
LE -2.498** -2.7803***
LGDP -1.0414** -4.2438
r -0.0454*** -0.0349
*, **, and *** are significant at the 1%, 5% and 10% significance levels, respectively. “t” values are in parenthesis.
The long and short run elasticities are computed for the independent variables and resented in Table 9. It is interesting to note that both credit cards and e-money initiatives have negative elasticities in both the long run and the short run thus indicating the potential for e-money and credit cards to displace currency circulation. 5. Conclusions The results of the survey on the consumer reactions to the e-money initiatives in Malaysia and the econometric analysis of the impact of e-money and various other alternative payment methods on the currency in circulation produce interesting results. The consumer reactions to the e-money initiatives in Malaysia was not very encouraging not for the lack of interest among the consumers but mainly due to poor support service and acceptability of the e-money initiatives. With regards to support, the main issue of concern was with regards to the reloading facilities. The second most important issue of concern was with the avenue for using these e-money initiatives such as MEPS cash. One of the main concerns with e-money implementation both from academicians and policy makers is on the impact of these e-money initiatives on money supply and its implications on the Central Banks. The results of this study indicates that alternative payment mechanisms such as credit cards and e-money have potentials for displacing currency in circulation both in the long run and in the short run. Hence depending on how e-money is going to be treated by the banking system, it is sure to have an impact on money supply of which currency in circulation is a component. The results generally indicate signs which are clearly paving the way for a cashless Malaysian society provided the necessary infrastructure and support services are established by the issuers of these e-money initiatives to create value to the customers and hence propagate the usage these initiatives.
10
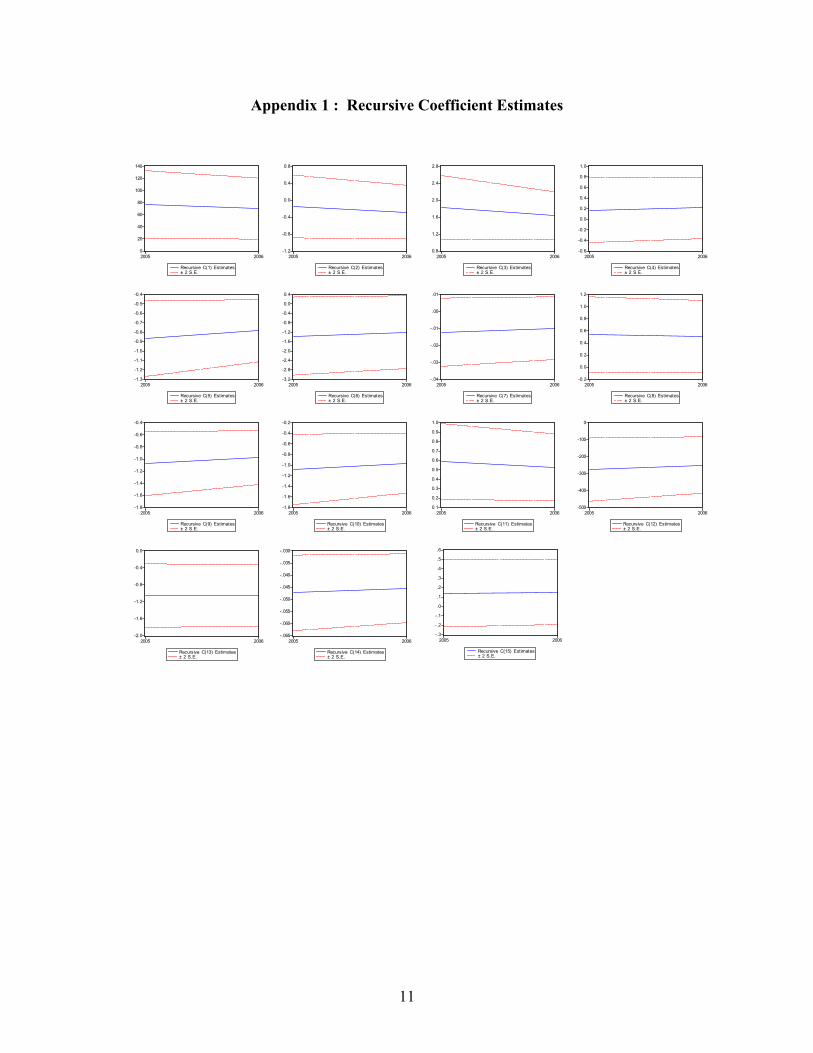
Appendix 1 : Recursive Coefficient Estimates
0
20
40
60
80
100
120
140
2005 2006
Recursive C(1) Estimates± 2 S.E.
-1.2
-0.8
-0.4
0.0
0.4
0.8
2005 2006
Recursive C(2) Estimates± 2 S.E.
0.8
1.2
1.6
2.0
2.4
2.8
2005 2006
Recursive C(3) Estimates± 2 S.E.
-0.6
-0.4
-0.2
0.0
0.2
0.4
0.6
0.8
1.0
2005 2006
Recursive C(4) Estimates± 2 S.E.
-1.3
-1.2
-1.1
-1.0
-0.9
-0.8
-0.7
-0.6
-0.5
-0.4
2005 2006
Recursive C(5) Estimates± 2 S.E.
-3.2
-2.8
-2.4
-2.0
-1.6
-1.2
-0.8
-0.4
0.0
0.4
2005 2006
Recursive C(6) Estimates± 2 S.E.
-.04
-.03
-.02
-.01
.00
.01
2005 2006
Recursive C(7) Estimates± 2 S.E.
-0.2
0.0
0.2
0.4
0.6
0.8
1.0
1.2
2005 2006
Recursive C(8) Estimates± 2 S.E.
-1.8
-1.6
-1.4
-1.2
-1.0
-0.8
-0.6
-0.4
2005 2006
Recursive C(9) Estimates± 2 S.E.
-1.8
-1.6
-1.4
-1.2
-1.0
-0.8
-0.6
-0.4
-0.2
2005 2006
Recursive C(10) Estimates± 2 S.E.
0.1
0.2
0.3
0.4
0.5
0.6
0.7
0.8
0.9
1.0
2005 2006
Recursive C(11) Estimates± 2 S.E.
-500
-400
-300
-200
-100
0
2005 2006
Recursive C(12) Estimates± 2 S.E.
-2.0
-1.6
-1.2
-0.8
-0.4
0.0
2005 2006
Recursive C(13) Estimates± 2 S.E.
-.065
-.060
-.055
-.050
-.045
-.040
-.035
-.030
2005 2006
Recursive C(14) Estimates± 2 S.E.
-.3
-.2
-.1
.0
.1
.2
.3
.4
.5
.6
2005 2006
Recursive C(15) Estimates± 2 S.E.
11
References Engle, R.F. and Granger, C.W.J.(1987) “Cointegration and error correction: Representation, estimation and testing, Econometrica, 55, 251-76. Johansen, S., & Juselius, K. (1990). Maximum likelihood estimation and inference on cointegration with applications to the demand for money. Oxford Bulletin of Economics and Statistics, 52, 169-210. Kwiatkowski, D., Phillips, P.C.B., Schmidt, P. and Shin, Y. (1992). Testing Null Hypothesis of Stationarity Against the Act of a Unit Root. Journal of Econometrics, Vol. 54, pp. 159-178. Mah, J.S., “An empirical examination of the disaggregated import demand of Korea- The case of information technology products”, Journal of Asian Economics, 11, 2000, 237-244.
Perman, R. (1991). Cointegration : An Introduction to the Literature. Journal of Economic Studies, Vol. 18(3), pp. 3-30. Pesaran,H., Shin, Y. and Smith,R.J. (2001), “ Bounds testing approaches to the analysis of level relationships”, Journal of Applied Econometrics, 16, 289-326 Phillips, P.C.B and P.Perron (1988),‘Testing for a unit root in Time Series Regression’, Biometrika, 75, pp 335-46.
12