Development of a Machine Learning Based Web Application ...
30
Citation: Villavicencio, C.N.; Macrohon, J.J.; Inbaraj, X.A.; Jeng, J.-H.; Hsieh, J.-G. Development of a Machine Learning Based Web Application for Early Diagnosis of COVID-19 Based on Symptoms. Diagnostics 2022, 12, 821. https:// doi.org/10.3390/diagnostics12040821 Academic Editor: Damiano Caruso Received: 17 February 2022 Accepted: 24 March 2022 Published: 27 March 2022 Publisher’s Note: MDPI stays neutral with regard to jurisdictional claims in published maps and institutional affil- iations. Copyright: © 2022 by the authors. Licensee MDPI, Basel, Switzerland. This article is an open access article distributed under the terms and conditions of the Creative Commons Attribution (CC BY) license (https:// creativecommons.org/licenses/by/ 4.0/). diagnostics Article Development of a Machine Learning Based Web Application for Early Diagnosis of COVID-19 Based on Symptoms Charlyn Nayve Villavicencio 1,2, * , Julio Jerison Macrohon 1 , Xavier Alphonse Inbaraj 1 , Jyh-Horng Jeng 1 and Jer-Guang Hsieh 3 1 Department of Information Engineering, I-Shou University, Kaohsiung City 84001, Taiwan; [email protected] (J.J.M.); [email protected] (X.A.I.); [email protected] (J.-H.J.) 2 College of Information and Communications Technology, Bulacan State University, Malolos City 3000, Philippines 3 Department of Electrical Engineering, I-Shou University, Kaohsiung City 84001, Taiwan; [email protected] * Correspondence: [email protected]; Tel.: +886-958-450-028 Abstract: Detecting the presence of a disease requires laboratory tests, testing kits, and devices; however, these were not always available on hand. This study proposes a new approach in disease detection using machine learning algorithms by analyzing symptoms experienced by a person without requiring laboratory tests. Six supervised machine learning algorithms such as J48 decision tree, random forest, support vector machine, k-nearest neighbors, naïve Bayes algorithms, and artificial neural networks were applied in the “COVID-19 Symptoms and Presence Dataset” from Kaggle. Through hyperparameter optimization and 10-fold cross validation, we attained the highest possible performance of each algorithm. A comparative analysis was performed according to accuracy, sensitivity, specificity, and area under the ROC curve. Results show that random forest, support vector machine, k-nearest neighbors, and artificial neural networks outweighed other algorithms by attaining 98.84% accuracy, 100% sensitivity, 98.79% specificity, and 98.84% area under the ROC curve. Finally, we developed a web application that will allow users to select symptoms currently being experienced, and use it to predict the presence of COVID-19 through the developed prediction model. Based on this mechanism, the proposed method can effectively predict the presence or absence of COVID-19 in a person immediately without using laboratory tests, kits, and devices in a real-time manner. Keywords: COVID-19; COVID-19 symptoms; disease detection; machine learning algorithms; hy- perparameter optimization; cross-validation; online disease diagnosis; online symptom checker; web application 1. Introduction A global pandemic called coronavirus disease (COVID-19) is a contagious disease caused by SARS-CoV-2 virus. COVID-19 carriers will experience mild to moderate respira- tory illness, while some may experience serious symptoms that requires immediate medical attention, especially older people with underlying comorbidities [1]. What is alarming about COVID-19 is that anyone who gets infected with this virus may be seriously ill or die at any age. However, there were many ways to prevent and slow down COVID-19 transmission. According to the World Health Organization (WHO), getting vaccinated, practicing social distancing for at least one meter, wearing masks properly, staying in well-ventilated places, frequent hand washing, using alcohols, and covering your nose and mouth when coughing or sneezing can prevent an individual from getting infected [1]. As of 16 February 2022, there were 416,014,373 confirmed COVID-19 cases and 5,856,697 reported deaths worldwide [2]. Confirmed cases increased by almost 100% in just a span of 5 months as reported last 30 September 2021 with 234,057,967 COVID-19 cases [3]. Diagnostics 2022, 12, 821. https://doi.org/10.3390/diagnostics12040821 https://www.mdpi.com/journal/diagnostics
-
Upload
khangminh22 -
Category
Documents
-
view
8 -
download
0
Transcript of Development of a Machine Learning Based Web Application ...

�����������������
Citation: Villavicencio, C.N.;
Macrohon, J.J.; Inbaraj, X.A.; Jeng,
J.-H.; Hsieh, J.-G. Development of a
Machine Learning Based Web
Application for Early Diagnosis of
COVID-19 Based on Symptoms.
Diagnostics 2022, 12, 821. https://
doi.org/10.3390/diagnostics12040821
Academic Editor: Damiano Caruso
Received: 17 February 2022
Accepted: 24 March 2022
Published: 27 March 2022
Publisher’s Note: MDPI stays neutral
with regard to jurisdictional claims in
published maps and institutional affil-
iations.
Copyright: © 2022 by the authors.
Licensee MDPI, Basel, Switzerland.
This article is an open access article
distributed under the terms and
conditions of the Creative Commons
Attribution (CC BY) license (https://
creativecommons.org/licenses/by/
4.0/).
diagnostics
Article
Development of a Machine Learning Based Web Applicationfor Early Diagnosis of COVID-19 Based on SymptomsCharlyn Nayve Villavicencio 1,2,* , Julio Jerison Macrohon 1 , Xavier Alphonse Inbaraj 1, Jyh-Horng Jeng 1
and Jer-Guang Hsieh 3
1 Department of Information Engineering, I-Shou University, Kaohsiung City 84001, Taiwan;[email protected] (J.J.M.); [email protected] (X.A.I.); [email protected] (J.-H.J.)
2 College of Information and Communications Technology, Bulacan State University,Malolos City 3000, Philippines
3 Department of Electrical Engineering, I-Shou University, Kaohsiung City 84001, Taiwan; [email protected]* Correspondence: [email protected]; Tel.: +886-958-450-028
Abstract: Detecting the presence of a disease requires laboratory tests, testing kits, and devices;however, these were not always available on hand. This study proposes a new approach in diseasedetection using machine learning algorithms by analyzing symptoms experienced by a personwithout requiring laboratory tests. Six supervised machine learning algorithms such as J48 decisiontree, random forest, support vector machine, k-nearest neighbors, naïve Bayes algorithms, andartificial neural networks were applied in the “COVID-19 Symptoms and Presence Dataset” fromKaggle. Through hyperparameter optimization and 10-fold cross validation, we attained the highestpossible performance of each algorithm. A comparative analysis was performed according to accuracy,sensitivity, specificity, and area under the ROC curve. Results show that random forest, supportvector machine, k-nearest neighbors, and artificial neural networks outweighed other algorithms byattaining 98.84% accuracy, 100% sensitivity, 98.79% specificity, and 98.84% area under the ROC curve.Finally, we developed a web application that will allow users to select symptoms currently beingexperienced, and use it to predict the presence of COVID-19 through the developed prediction model.Based on this mechanism, the proposed method can effectively predict the presence or absence ofCOVID-19 in a person immediately without using laboratory tests, kits, and devices in a real-timemanner.
Keywords: COVID-19; COVID-19 symptoms; disease detection; machine learning algorithms; hy-perparameter optimization; cross-validation; online disease diagnosis; online symptom checker;web application
1. Introduction
A global pandemic called coronavirus disease (COVID-19) is a contagious diseasecaused by SARS-CoV-2 virus. COVID-19 carriers will experience mild to moderate respira-tory illness, while some may experience serious symptoms that requires immediate medicalattention, especially older people with underlying comorbidities [1]. What is alarmingabout COVID-19 is that anyone who gets infected with this virus may be seriously ill ordie at any age. However, there were many ways to prevent and slow down COVID-19transmission. According to the World Health Organization (WHO), getting vaccinated,practicing social distancing for at least one meter, wearing masks properly, staying inwell-ventilated places, frequent hand washing, using alcohols, and covering your nose andmouth when coughing or sneezing can prevent an individual from getting infected [1].As of 16 February 2022, there were 416,014,373 confirmed COVID-19 cases and 5,856,697reported deaths worldwide [2]. Confirmed cases increased by almost 100% in just a span of5 months as reported last 30 September 2021 with 234,057,967 COVID-19 cases [3].
Diagnostics 2022, 12, 821. https://doi.org/10.3390/diagnostics12040821 https://www.mdpi.com/journal/diagnostics

Diagnostics 2022, 12, 821 2 of 30
COVID-19 has mutated into several variants, and the Centers for Disease Control andPrevention (CDC) recorded two variants of concern (VOC). VOC refers to a variant that hasevidence of increased transmissibility and severity of the disease, significant reduction inneutralization against a person’s antibodies, reduced effectivity of treatments or vaccines,or failures in the diagnosis [4]. A VOC requires more appropriate and immediate publichealth actions as its outbreak will cause danger to human lives. The first VOC was the deltavariant as labeled by the WHO, which was first identified in India [4]. The delta varianthas evidence of increased transmissibility and resistance to the developed vaccines. Thesecond VOC was labeled the omicron variant, which was first identified in South Africawith potential increase of the virus transmissibility as well as reduction in neutralization byantibodies and vaccines [4].
Since COVID-19 is a contagious disease and has mutated into several variants thatreported increased transmissibility, it is necessary to prioritize its early detection. Throughearly diagnosis of the virus, isolation can be immediately imposed to prevent the spreadof the virus. A COVID-19 positive person can be identified through the use of testing kitssuch as COVID-19 real-time reverse transcription–polymerase chain reaction (RT-PCR)and antigen testing. However, these testing kits have costs and are not always availableon hand. Due to the virus outbreak, limited access to COVID-19 testing kits hinder theearly diagnosis of the disease [3]. In line with this, an accessible and real-time COVID-19prediction model is necessary.
This study focuses on developing a machine learning-based web application forthe early diagnosis of COVID-19. Many research attempts utilizing machine learningalgorithms to detect the presence of COVID-19 e were published, and we devised a list inTable 1.
Table 1. COVID-19 Prediction Models.
References COVID-19 Prediction Predictors Used Algorithms Accuracy
[5] COVID-19 prediction usinglaboratory findings Laboratory findings Convolutional Neural
Network (CNN) 76.00%
[6] Prediction of the severity ofCOVID-19 using blood test results Blood test results Multiple-criteria
decision-making (MCDM) 82.00%
[7] COVID-19 prediction using X-rayimages X-ray images Visual Geometry Group
(VGG16) 98.60%
[8] Prediction of the mortality of apatient Blood samples Extreme Gradient Boosting
(XGBoost) 90.00%
[9] COVID-19 prediction using CTimages
Computed tomography(CT) images
DenseNet201 FeaturePyramid Network (FPN) 98.96%
[10] COVID-19 prediction using X-rayimages X-ray images Deep Neural Network
(DNN) 90.50%
Proposed Method COVID-19 prediction based onsymptoms COVID-19 symptoms Supervised Machine
Learning Algorithms 98.84%
Based on previous researches, it is evident that machine learning can be utilized todetect the presence of COVID-19, reduce the spread of the virus, predict cases, minimize thedeath counts, and most of all, take over some of the workload of doctors and nurses duringthe pandemic. Predictors utilized to detect COVID-19 presence were laboratory findings,blood test results, X-ray images, and CT Images; however, none has focused specificallyon detecting COVID-19 presence using symptoms without the need of laboratory tests.Since COVID-19 demands early diagnosis to prevent the transmission to other people, aCOVID-19 prediction model that will allow users to provide the current symptoms beingexperienced will be proposed in this study. In this way, the potential beneficiaries of thisprediction model can be notified with immediate results as to whether they are COVID-19positive or negative. This application does not require any laboratory tests, and it is accessi-ble anywhere even at home as long as the user is connected to the internet. The model willbe developed by applying a supervised machine learning algorithm through analyzing

Diagnostics 2022, 12, 821 3 of 30
COVID-19 symptoms using the Python programming language. Google colab research(Mountain View, CA, USA) was used in developing the model, and the developed modelwas integrated in the web application using the Django Framework (Django Software Foun-dation, Atlanta, GA, USA). The source codes and the prediction model will be deployedusing the Github repository (San Francisco, CA, USA) and Azure Web Services (Microsoft,Redmond, WA, USA) to make it available for public use.
The rest of this study was organized as follows: Section 2 discusses the methodologyof this study including the machine learning modeling steps. Section 3 is the results anddiscussion section, which briefly explains the development process of a machine learning-based web application integrating the developed model and its workflow. Section 3 alsodiscusses the overview on how to use the web application, and the deployment of theproject to make it accessible online. Lastly, Section 4 is the conclusions section.
2. Materials and Methods
The machine learning modeling process was performed using Google colab research,which is a platform used to write and execute Python codes, with free access to a GraphicsProcessing Unit (GPU) that is well suited for data science [11]. The process of machinelearning modeling can be seen in the block diagram shown in Figure 1.
Diagnostics 2022, 12, x FOR PEER REVIEW 3 of 31
of this prediction model can be notified with immediate results as to whether they are COVID-19 positive or negative. This application does not require any laboratory tests, and it is accessible anywhere even at home as long as the user is connected to the internet. The model will be developed by applying a supervised machine learning algorithm through analyzing COVID-19 symptoms using the Python programming language. Google colab research (Mountain View, CA, USA) was used in developing the model, and the devel-oped model was integrated in the web application using the Django Framework (Django Software Foundation, Atlanta, GA, USA). The source codes and the prediction model will be deployed using the Github repository (San Francisco, CA, USA) and Azure Web Ser-vices (Microsoft, Redmond, WA, USA) to make it available for public use.
The rest of this study was organized as follows: Section 2 discusses the methodology of this study including the machine learning modeling steps. Section 3 is the results and discussion section, which briefly explains the development process of a machine learning-based web application integrating the developed model and its workflow. Section 3 also discusses the overview on how to use the web application, and the deployment of the project to make it accessible online. Lastly, Section 4 is the conclusions section.
2. Materials and Methods The machine learning modeling process was performed using Google colab research,
which is a platform used to write and execute Python codes, with free access to a Graphics Processing Unit (GPU) that is well suited for data science [11]. The process of machine learning modeling can be seen in the block diagram shown in Figure 1.
Figure 1. The Block Diagram of the process of machine learning modeling. Figure 1. The Block Diagram of the process of machine learning modeling.
In Figure 1, the 10 phases of the development of a COVID-19 prediction model weredisplayed. The steps were importing dependencies, loading the dataset, data analysis, fea-ture selection, data balancing, data splitting, modeling, comparative analysis, serialization,and finally, the developed prediction model to determine the presence of COVID-19.
Diagnostics 2022, 12, 821 4 of 30
2.1. Importing Dependencies and Loading the Dataset
We used the pandas, numerical python (Numpy), matplotlib, sea-born, and sci-kitlearn (sklearn) packages in developing the model. The Pandas package is a fast and easydata manipulation tool that can be used in data analysis, from reading the data fromthe spreadsheet to devising data frames for facilitating the presentation of the data [12].Together with Pandas, the Numpy package was also used to perform mathematical andscientific calculations as well as perform high-level mathematical functions on its multi-dimensional arrays and matrices [13]. The data distribution of every column in the datasetmust be performed to give a glimpse on how the data are distributed throughout the dataset,and each column must be analyzed according its relationship with random attributespresent in the dataset. The data distribution and the correlation coefficient plot can besuccessfully made through importing the Matplotlib package, particularly the pyplotfunction, which is intended to perform interactive and programmatic plot generationin a MATLAB-like way [14]. To provide attractive and informative data visualizationgraphs [15], the Seaborn package was imported, particularly the distplot and heatmapfunctions. Lastly, the sklearn package was imported since it supports both supervised andunsupervised machine learning by providing various tools for splitting the dataset, modelselection, model’s performance evaluation by computing statistical measures, and manyother useful functions [16].
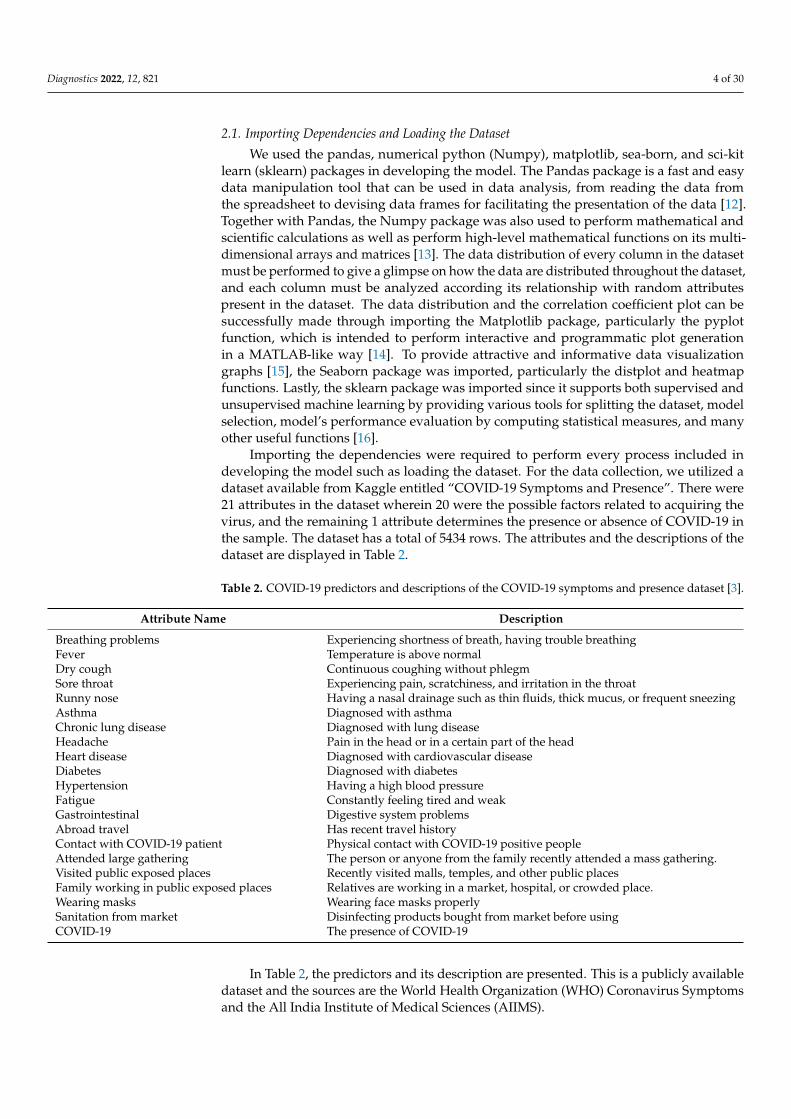
Importing the dependencies were required to perform every process included indeveloping the model such as loading the dataset. For the data collection, we utilized adataset available from Kaggle entitled “COVID-19 Symptoms and Presence”. There were21 attributes in the dataset wherein 20 were the possible factors related to acquiring thevirus, and the remaining 1 attribute determines the presence or absence of COVID-19 inthe sample. The dataset has a total of 5434 rows. The attributes and the descriptions of thedataset are displayed in Table 2.
Table 2. COVID-19 predictors and descriptions of the COVID-19 symptoms and presence dataset [3].
Attribute Name Description
Breathing problems Experiencing shortness of breath, having trouble breathingFever Temperature is above normalDry cough Continuous coughing without phlegmSore throat Experiencing pain, scratchiness, and irritation in the throatRunny nose Having a nasal drainage such as thin fluids, thick mucus, or frequent sneezingAsthma Diagnosed with asthmaChronic lung disease Diagnosed with lung diseaseHeadache Pain in the head or in a certain part of the headHeart disease Diagnosed with cardiovascular diseaseDiabetes Diagnosed with diabetesHypertension Having a high blood pressureFatigue Constantly feeling tired and weakGastrointestinal Digestive system problemsAbroad travel Has recent travel historyContact with COVID-19 patient Physical contact with COVID-19 positive peopleAttended large gathering The person or anyone from the family recently attended a mass gathering.Visited public exposed places Recently visited malls, temples, and other public placesFamily working in public exposed places Relatives are working in a market, hospital, or crowded place.Wearing masks Wearing face masks properlySanitation from market Disinfecting products bought from market before usingCOVID-19 The presence of COVID-19
In Table 2, the predictors and its description are presented. This is a publicly availabledataset and the sources are the World Health Organization (WHO) Coronavirus Symptomsand the All India Institute of Medical Sciences (AIIMS).

Diagnostics 2022, 12, 821 5 of 30
2.2. Data Analysis and Feature Selection
To be able to depict the distribution of data across the whole dataset, the displotfunction of the Seaborn package was used along with the Matplotlib. This function plotsthe data by a histogram combined with a line on it, representing the univariate distributionof a variable against the density distribution [17]. The distplot of the collected dataset canbe seen in Figure 2.
Diagnostics 2022, 12, x FOR PEER REVIEW 5 of 31
In Table 2, the predictors and its description are presented. This is a publicly available dataset and the sources are the World Health Organization (WHO) Coronavirus Symp-toms and the All India Institute of Medical Sciences (AIIMS).
2.2. Data Analysis and Feature Selection To be able to depict the distribution of data across the whole dataset, the displot func-
tion of the Seaborn package was used along with the Matplotlib. This function plots the data by a histogram combined with a line on it, representing the univariate distribution of a variable against the density distribution [17]. The distplot of the collected dataset can be seen in Figure 2.
Figure 2. The distplot of the collected dataset.
In Figure 2, 20 columns in the dataset were presented, which were referred to as the COVID-19-related symptoms, namely breathing problems, fever, dry cough, sore throat, runny nose, asthma, chronic lung disease, headache, heart disease, diabetes, hypertension, fatigue, gastrointestinal, abroad travel, contact with a COVID-19 patient, attended a large gathering, visited public areas, family working in public areas, wearing masks, and sani-tization of things bought from the market. The vertical labels (y-axis) represent the density of the samples in the dataset, while the horizontal labels (x-axis) represent the classes wherein 0 or the indicated symptom is not present in the person, while number 1 means yes or currently being experienced by the person. Based on the distribution plot, a prelim-inary intuition can be drawn such as the majority of the samples in the dataset were hav-ing breathing problems, fever, dry cough, sore throat, runny nose, headache, fatigue, and visited public areas. Meanwhile, some samples in the dataset do not have asthma, chronic
Figure 2. The distplot of the collected dataset.
In Figure 2, 20 columns in the dataset were presented, which were referred to as theCOVID-19-related symptoms, namely breathing problems, fever, dry cough, sore throat,runny nose, asthma, chronic lung disease, headache, heart disease, diabetes, hyperten-sion, fatigue, gastrointestinal, abroad travel, contact with a COVID-19 patient, attendeda large gathering, visited public areas, family working in public areas, wearing masks,and sanitization of things bought from the market. The vertical labels (y-axis) representthe density of the samples in the dataset, while the horizontal labels (x-axis) represent theclasses wherein 0 or the indicated symptom is not present in the person, while number 1means yes or currently being experienced by the person. Based on the distribution plot, apreliminary intuition can be drawn such as the majority of the samples in the dataset werehaving breathing problems, fever, dry cough, sore throat, runny nose, headache, fatigue,and visited public areas. Meanwhile, some samples in the dataset do not have asthma,chronic lung disease, heart disease, diabetes, hypertension, gastrointestinal, abroad travelhistory, attended a large gathering, and family working in public areas. Dataset samples
Diagnostics 2022, 12, 821 6 of 30
have a slightly close density of having contact with COVID-19 patients, while wearingmasks and sanitization from the market have only one content that is 0 or no.
We used the variance threshold to perform feature selection to remove the attributevalues that do not have significant variance or have the same value for all samples [18]. Weused 80% as the threshold and found out that the attributes wearing masks and sanitizationfrom the market exceeded the threshold, since the values were the same for all samples.These columns were removed from the dataset having only 18 features left.
Another feature selection method, which is the Pearson Correlation Coefficient (PCC),was applied in the dataset. This is a statistical measure to determine the correlation of tworandom attributes [19]. The formula used in this method can be seen in Equation (1).
r = ∑(xi − x)(y− y)√∑(xi − x)2 ∑(y− y)2
(1)
where r is the Pearson correlation coefficient, xi is the variable’s samples, x is the samplemean, yi is the samples of another variable, and y is the value of its sample. The valueof r ranges from −1 to +1. PCC was applied to measure the correlation of the attributesto the target variable, which is the COVID-19 attribute and to know which features werepositively and negatively correlated to the target class. By doing this, we can have intuitionon what features must be retained in training the model, and the results are displayed inTable 3.
Table 3. The correlation of predictors to COVID-19 attributes.
Attribute Name Correlation Value
Sore Throat 0.503Dry Cough 0.464Abroad Travel 0.444Breathing Problems 0.444Attended a Large Gathering 0.390Contact with COVID-19 Patient 0.357Fever 0.353Family Working in Public 0.160Visited Public Exposed Places 0.112Hypertension 0.103Asthma 0.090Diabetes 0.041Heart Disease 0.027Gastrointestinal −0.003Runny Nose −0.006Headache −0.028Fatigue −0.044Chronic Lung Disease −0.057
In Table 3, the correlation values of each feature toward the target variable were listed.The highest correlation goes to the symptom sore throat having 0.503 correlation, next is theDry Cough with 0.464 correlation value, and the Abroad Travel and Breathing Problemshave a 0.444 correlation value. Having a positive correlation means that the variables werepositively correlated: as x increases, the value of y also increases, and vice versa. In contrast,the negative correlation means that the variables were negatively correlated: when thevalue of x decreases, the value of y increases, and vice versa [20]. Symptoms that werefound to be negatively correlated to the target variable were gastrointestinal, runny nose,headache, fatigue, and chronic lung disease. Features that have very low correlation tothe COVID-19 variable were asthma, diabetes, and heart disease, which were mostly weretermed as comorbidities.
After studying the correlation of the predictors to the target, we also took into consid-eration the collinearity. Collinearity happens when two predictors are linearly associated

Diagnostics 2022, 12, 821 7 of 30
or having a high correlation to each other, and both were used as predictors of the targetvariable [21]. Multicollinearity may also happen, which is a situation wherein the variablehas collinearity with more than one predictors in the dataset. We used the Variance InflationFactor (VIF) to detect the collinearity of the predictors in the dataset. The VIF starts from 1to infinity, and the value of 1 means that the features were not correlated. VIF values lessthan 5 are moderately correlated, while VIF values of 10 and above are highly correlatedand a cause of concern [21]. The VIF values of each predictor in the dataset can be seen inTable 4.
Table 4. VIF of predictors in the dataset.
Attribute Name VIF
Dry cough 5.38Fever 4.95Sore throat 4.79Breathing problems 3.48Contact to COVID patient 2.28Abroad travel 2.19Runny nose 2.17Attended a large gathering 2.12Visited public 2.09Headache 2.06Hypertension 2.01Asthma 1.95Diabetes 1.94Fatigue 1.93Gastrointestinal 1.89Heart disease 1.85Family working in public 1.84Chronic lung disease 1.76
Table 4 displays the VIF of each predictor in the dataset. The highest is dry coughat 5.38, which is not surprising, since it is one of the most common symptoms of COVID-19 [22]. Predictors such as fever, sore throat, and breathing problems attained the nexthighest VIF having scores lower than 5. A VIF of 1 to 5 means that the predictors were notcorrelated and can be considered in building the COVID-19 prediction model. However,we still consider including the dry cough as a predictor in the building of the COVID-19prediction model even if it has a VIF of 5.38, since this symptom can contribute to predictingCOVID-19 in a person, and it is included in the most common symptoms declared by theWorld Health Organization (WHO).
Aside from the variance threshold, PCC, and VIF, we also used the WHO websiteto determine the common symptoms of the disease because it has been validated by theexperts in the medical field and is updated regularly. Table 5 shows the most common, lesscommon, and serious symptoms of COVID-19.
Table 5. Symptoms of COVID-19 [22].
Most Common Less Common Serious
Fever Sore throat Difficulty in breathingCough Headache, aches and pains Shortness of breathFatigue Diarrhea Loss of speech or mobilityLoss of smell Rashes/discoloration of skin, fingers or toes ConfusionLoss of taste Red or irritated eyes Chest pain
Table 5 displays the list of symptoms from the WHO’s website. According to theWHO, people who suffer from serious symptoms may cause danger to human lives, so itis necessary to go the nearest hospital to seek immediate medical attention. People who

Diagnostics 2022, 12, 821 8 of 30
experience mild symptoms but are still healthy may manage themselves at home [22]. It isnecessary to undergo self-isolation immediately to prevent the virus from spreading and toprevent possible transmission until tested COVID-19 negative through a Polymerase ChainReaction (PCR) test.
Based on the findings in the feature selection process, the feature combination that canbe used in building the prediction model was devised, which is composed of the positivecorrelation features. Negatively correlated symptoms were also included but with respectto the symptoms declared by the WHO. The features that will be included in the trainingprocess were the sore throat, dry cough, abroad travel, breathing problems, attended alarge gathering, contact with COVID-19 patient, fever, family working in public, visitedpublic exposed places, hypertension, asthma, diabetes, heart disease, runny nose, headache,and fatigue.
2.3. Data Balancing and Dataset Splitting
In preprocessing the dataset, we used data balancing, which is important to promote abalanced prediction rate. Dataset splitting was utilized to divide the samples into trainingand testing datasets. For the COVID-19 Symptoms and Presence dataset, the classes havea 4:1 class imbalance [3], and to address this, we make use of a data balancing techniquenamed “Synthetic Minority Oversampling Technique” (SMOTE) proposed by Chawla et al.in 2002 to perform oversampling in the minority dataset. SMOTE generates additionalinstances for the minority group by generating additional synthetic samples based ona selected number of neighbors of a random sample [23]. By doing this, the class withfewer samples in the dataset will be increased. It is necessary to balance the dataset toobtain a high accuracy rate, very low error rate, and to avoid classification bias. A bar plotrepresenting the class distribution of the target variable can be seen in Figure 3.
Diagnostics 2022, 12, x FOR PEER REVIEW 8 of 31
Table 5. Symptoms of COVID-19 [22].
Most Common Less Common Serious Fever Sore throat Difficulty in breathing Cough Headache, aches and pains Shortness of breath Fatigue Diarrhea Loss of speech or mobility
Loss of smell Rashes/discoloration of skin, fingersor toes
Confusion
Loss of taste Red or irritated eyes Chest pain
Table 5 displays the list of symptoms from the WHO’s website. According to the WHO, people who suffer from serious symptoms may cause danger to human lives, so it is necessary to go the nearest hospital to seek immediate medical attention. People who experience mild symptoms but are still healthy may manage themselves at home [22]. It is necessary to undergo self-isolation immediately to prevent the virus from spreading and to prevent possible transmission until tested COVID-19 negative through a Polymer-ase Chain Reaction (PCR) test.
Based on the findings in the feature selection process, the feature combination that can be used in building the prediction model was devised, which is composed of the pos-itive correlation features. Negatively correlated symptoms were also included but with respect to the symptoms declared by the WHO. The features that will be included in the training process were the sore throat, dry cough, abroad travel, breathing problems, at-tended a large gathering, contact with COVID-19 patient, fever, family working in public, visited public exposed places, hypertension, asthma, diabetes, heart disease, runny nose, headache, and fatigue.
2.3. Data Balancing and Dataset Splitting In preprocessing the dataset, we used data balancing, which is important to promote
a balanced prediction rate. Dataset splitting was utilized to divide the samples into train-ing and testing datasets. For the COVID-19 Symptoms and Presence dataset, the classes have a 4:1 class imbalance [3], and to address this, we make use of a data balancing tech-nique named “Synthetic Minority Oversampling Technique” (SMOTE) proposed by Chawla et al. in 2002 to perform oversampling in the minority dataset. SMOTE generates additional instances for the minority group by generating additional synthetic samples based on a selected number of neighbors of a random sample [23]. By doing this, the class with fewer samples in the dataset will be increased. It is necessary to balance the dataset to obtain a high accuracy rate, very low error rate, and to avoid classification bias. A bar plot representing the class distribution of the target variable can be seen in Figure 3.
Figure 3. Bar plot of COVID-19 variable class distribution in the raw dataset. Figure 3. Bar plot of COVID-19 variable class distribution in the raw dataset.
In Figure 3, the COVID-19 variable class distribution was presented according to thenumber of samples in the raw dataset collected from Kaggle. The vertical labels indicate thefrequency or the number of the samples, while the horizontal label 1 implies the COVID-19positive samples, and the label 0 indicates COVID-19 negative samples. The total number ofsamples in the dataset is 5434, where COVID-19 positive samples were 4383 and COVID-19negative samples were 1051. This kind of dataset will cause prediction bias because a lotof samples were in the COVID-19 positive class, making it well known to the classifier,and there is a high chance that the majority of the data may be predicted as COVID-19positive. To address this, we used the available imbalanced-learn python package, whichoffers several re-sampling techniques that can be applied in datasets showing strong dataimbalance [24]. This package must be installed in the Google colab research notebook; then,from its oversampling module, the SMOTE function was imported and was applied to thedataset, and the result is presented in Figure 4.

Diagnostics 2022, 12, 821 9 of 30
Diagnostics 2022, 12, x FOR PEER REVIEW 9 of 31
In Figure 3, the COVID-19 variable class distribution was presented according to the number of samples in the raw dataset collected from Kaggle. The vertical labels indicate the frequency or the number of the samples, while the horizontal label 1 implies the COVID-19 positive samples, and the label 0 indicates COVID-19 negative samples. The total number of samples in the dataset is 5434, where COVID-19 positive samples were 4383 and COVID-19 negative samples were 1051. This kind of dataset will cause predic-tion bias because a lot of samples were in the COVID-19 positive class, making it well known to the classifier, and there is a high chance that the majority of the data may be predicted as COVID-19 positive. To address this, we used the available imbalanced-learn python package, which offers several re-sampling techniques that can be applied in da-tasets showing strong data imbalance [24]. This package must be installed in the Google colab research notebook; then, from its oversampling module, the SMOTE function was imported and was applied to the dataset, and the result is presented in Figure 4.
Figure 4. Bar plot of COVID-19 variable class distribution in the balanced dataset.
In Figure 4, the dataset is presented in a balanced number of samples as a result of the SMOTE function. The total number of samples in the dataset after applying SMOTE became 8766 where 4383 still belongs to the COVID-19 positive class, and the remaining 4383 samples belong to the COVID-19 negative class. Now that the dataset is balanced, we divided the dataset using a ratio of 7:3; 70% of the samples will be used as the training dataset to develop the COVID-19 prediction model, and the remaining 30% will be used for testing the performance of the model. The data-splitting process was performed using the “train_test_split” function from the sklearn’s “model_selection” module, which ran-domly splits the given samples, arrays, and matrices into training and testing subsets [16].
By applying the train_test_split function, 6136 samples were included in the training dataset, and the remaining 2630 samples were taken to be used as the testing dataset, which makes the dataset ready for the next process, which is the modeling. We used the 10-fold cross-validation resampling method for all the experiments.
2.4. Modeling of the COVID-19 Prediction Model Using Supervised Machine Learning Algo-rithms
The modeling phase of this study discusses the process of how to develop a COVID-19 prediction model including the hyperparameter optimization, training, testing and evaluation. After data processing using the variance threshold, PCC, VIF, feature selection techniques, and finally, the SMOTE data balancing technique, several models were built
Figure 4. Bar plot of COVID-19 variable class distribution in the balanced dataset.
In Figure 4, the dataset is presented in a balanced number of samples as a result ofthe SMOTE function. The total number of samples in the dataset after applying SMOTEbecame 8766 where 4383 still belongs to the COVID-19 positive class, and the remaining4383 samples belong to the COVID-19 negative class. Now that the dataset is balanced,we divided the dataset using a ratio of 7:3; 70% of the samples will be used as the trainingdataset to develop the COVID-19 prediction model, and the remaining 30% will be used fortesting the performance of the model. The data-splitting process was performed using the“train_test_split” function from the sklearn’s “model_selection” module, which randomlysplits the given samples, arrays, and matrices into training and testing subsets [16].
By applying the train_test_split function, 6136 samples were included in the trainingdataset, and the remaining 2630 samples were taken to be used as the testing dataset, whichmakes the dataset ready for the next process, which is the modeling. We used the 10-foldcross-validation resampling method for all the experiments.
2.4. Modeling of the COVID-19 Prediction Model Using Supervised Machine Learning Algorithms
The modeling phase of this study discusses the process of how to develop a COVID-19 prediction model including the hyperparameter optimization, training, testing andevaluation. After data processing using the variance threshold, PCC, VIF, feature selectiontechniques, and finally, the SMOTE data balancing technique, several models were builtusing the Google colab research utilizing different supervised machine learning algorithms,namely, J48 DT, RF, SVM, k-NN, NB, and ANN.
1. J48 Decision Tree
The first algorithm we included in this study is the DT, which is an algorithm thatcreates a tree-like plot wherein nodes represent a condition for any classification task.A generated tree starts with a root node that tests a given sample; an example of a testcondition is whether the person has a dry cough or not. After testing the samples using acondition, branches will be generated that separate the samples into their respective classes.J48 DT is a kind of decision tree algorithm primarily utilized in classification tasks.
To attain the highest possible performance of the J48 DT algorithm, we performedhyperparameter tuning using GridSearchCV and 10-fold cross validation for all the experi-ments. The following hyperparameters were tuned: For the maximum depth of the decisiontree, we used the values 2, 3, 5, 10, and 20. In terms of the minimum samples required to bein the leaf node, we used 5, 10, 20, 50, and 100. Lastly, to measure the information gain orthe purity of the nodes of the decision tree, the criterion we used were the Gini index andentropy. An innovation of this algorithm was made using several decision trees known asrandom forest.

Diagnostics 2022, 12, 821 10 of 30
2. Random Forest
The RF algorithm provides a significant amount of improvement in the classificationaccuracy of a model because it is capable of producing multiple decision trees. Eachdecision tree will generate a result about the sample, and the final result will be generatedaccording to the results of the majority of the decision trees [25]. To obtain the highestpossible performance of the RF algorithm, we performed hyperparameter tuning usingGridSearchCV and 10-fold cross validation for all the experiments. We also tuned same setof hyperparameters as what we tuned in the DT wherein the maximum depth values of thedecision trees to be created are 2, 3, 5, 10, and 20, and the minimum samples required tobe in the leaf node, we used 5, 10, 20, 50, and 100. To measure the quality of the split ofeach node, the criterion we used were the Gini index and entropy. Since the RF algorithmproduces several decision trees, we used the number of estimators to set how many treesto be created in the forest. The values used for this hyperparameter were 100, 200, and300. Each decision tree learns from random sets of samples from the dataset and usingbootstrap means that the samples were drawn with replacement [26]. The hyperparameterbootstrap was also tuned with the values either True or False; the entire dataset was usedto build a decision tree if the bootstrap parameter was set to False. The next algorithm usedin this study is the SVM.
3. Support Vector Machine
Generating hyperplanes is a significant part of the SVM algorithm. Hyperplanes areutilized by SVM in separating the samples in the dataset according to their respective classes.SVM prioritizes in maximizing the distance of each group to the dividing hyperplane.Through the use of hyperplanes, we can minimize the errors in separating the instances. [27].The kernels used in the experiment were the linear, radial, polynomial, and sigmoid kernels;these kernels will help the SVM algorithm determine which are the best hyperplanes thatcan separate the dataset into COVID-19 positive and negative classes. A mathematicaltrick called the “Kernel trick” allows the SVM to create a higher dimensional space from alow-dimensional space dataset; specifically, a single-dimensional data will be convertedinto two-dimensional data according to their respective classes [28].
A radial basis function (RBF) is one of the most popular among all the kernels, for itcan be used to separate datasets that are not linearly separable by adding curves or bumpsin the data points. Next is the polynomial kernel function, whose result depends on thedirection of the two vectors, and it is the only kernel that has the hyperparameter named“degree”, which determines the flexibility of the decision boundary [29]. The sigmoidkernel which is a quite popular kernel that originated in the neural networks field wasalso included. The selection of kernel to be used in the classifier depends on the kind ofclassification to be done; it is not fixed [28]. In line with this, we included linear, radial,polynomial, and sigmoid kernels in the hyperparameter optimization process to find outwhich kernel will perform better.
The regularization parameter C, which is a hyperparameter common to all the ker-nels that regulates the misclassification of the samples and the simplicity of the decisionboundaries, was tuned. The C values used in the hyperparameter optimization were 0,0.01, 0.5, 0.1, 1, 2, 5, and 10. The gamma was also considered, which determines how muchinfluence a training sample has. The values used for the gamma were 1, 0.1, 0.01, and0.001. Large values of gamma means that the other examples are closer to be affected [30].Another supervised machine learning algorithm used is the k-NN, which uses a number ofneighbors or samples surrounding a random sample in the dataset.
4. K-Nearest Neighbors
k-NN uses a sample’s nearest neighbors in the dataset to determine to which class itbelongs. k-NN is an old and simple supervised machine learning algorithm used to solveclassification tasks [31]. To determine a sample’s nearest neighbor, k-NN uses distance

Diagnostics 2022, 12, 821 11 of 30
metrics, which are Euclidean and Manhattan distance. The most commonly used distancemetric of k-NN is the Euclidean distance, which can be expressed in Equation (2).
d(
xi, xj)=√
∑nr=1 wr
(ar(xi)− ar
(xj))2 (2)
where x = (a1, a2, a3 . . . an) is a sample in the dataset in a vector format, the number ofthe sample’s attributes is expressed as n, ar is the rth attribute, the weight is expressed aswr, and xi and xj are the two samples. Another distance metric used is the Manhattandistance. The Manhattan distance is also called “Taxicab Geometry” and “City BlockDistance” [32]. A Minkowski distance formula is used to find the Manhattan distance thatworks by calculating the distance between the samples in a grid-like path.
Hyperparameter optimization was used to determine the k-NN algorithm configu-ration that will yield the best possible performance of the model. The total number ofneighbors used in the hyperparameter optimization were 3, 5, 7, 9, 11, and 13. The weightshyperparameters used were the uniform and distance. Uniform weights means that allthe points in each neighborhood of the sample are weighted equally, while the distanceweight allocates points by the inverse of their distance. The closer neighbors of the samplewill have more influence than the other neighbors, which are more distant [33]. The nextsupervised machine learning algorithm used in this study is the naïve Bayes which is basedon Bayes’ theorem.
5. Naïve Bayes
NB is another supervised machine learning algorithm based on the Bayes theoremby Thomas Bayes, an English mathematician, which was created in 1763 [34]. The NBalgorithm is called naïve because it does not depend on the existence of other parameters;its formula can be expressed in Equation (3).
P(A|B) = P(B|A) P(A)
P(B)(3)
In Equation (3), the priori probability is expressed as P(A), which means the probabilityof event A happening. The marginal probability is expressed as P(B), which means theprobability of the event B happening. Then, the expression P(A|B) means the posteriorprobability or probability of A happening given that B has occurred. The expression P(B|A)means the likelihood probability, which is the probability of B happening given that A istrue [35]. Dividing the product of the likelihood and priori probability by the marginalprobability will determine the posterior probability [35].
We used the GausianNB, which is a special kind of NB algorithm, and tuned itsonly parameter, the variance smoothing. Variance smoothing is another form of Laplacesmoothing, which is a technique that helps in the problem of zero probability in the NB.In using high values of alpha, it will push the likelihood toward a value of 0.5 [36]. Weused np.logspace(0, −9, num = 100) as the var_smothing value in the GridSearchCVhyperparameter tuning function.
6. Artificial Neural Network
The last machine learning algorithm we used is the multilayer perceptron (MLP)artificial neural network, which is one of the most commonly used architectures of neuralnetwork because of its versatility in classification and regression problems [37]. We plottedan illustration of MLP including the input layer, hidden layer, and the output layer; it canbe seen in Figure 5.

Diagnostics 2022, 12, 821 12 of 30
Diagnostics 2022, 12, x FOR PEER REVIEW 12 of 31
smoothing, which is a technique that helps in the problem of zero probability in the NB. In using high values of alpha, it will push the likelihood toward a value of 0.5 [36]. We used np.logspace(0, −9, num = 100) as the var_smothing value in the GridSearchCV hy-perparameter tuning function. 6. Artificial Neural Network
The last machine learning algorithm we used is the multilayer perceptron (MLP) ar-tificial neural network, which is one of the most commonly used architectures of neural network because of its versatility in classification and regression problems [37]. We plot-ted an illustration of MLP including the input layer, hidden layer, and the output layer; it can be seen in Figure 5.
Figure 5. A sample topology of multilayer perceptron with 4 inputs, 3 hidden layers with size of 4, 3, and 4 neurons, respectively, and 2 neurons as the output layer [37].
In Figure 5, the first and the last layer are called the input layer and the output layer, respectively. The input layer introduces the MLP to the predictors given in the dataset. The output layer carries the final classification result as computed and processed by the hidden layers. The layers in between are called the hidden layers, where all the data pro-cessing and the classification of the predictors take place. Commonly, two hidden layers is enough to perform a classification task, but additional hidden layers are recommended to solve more complicated classifications and to discover deeper patterns from the predic-tors.
We tuned the following hyperparameters to attain the highest possible performance of the MLP ANN. As for the hidden layer sizes, first, there are 3 hidden layers with the size of 50, 50, 50; next, there are 3 hidden layers of 50, 100, and 50 sizes, and lastly, there is 1 hidden layer with the size of 100 neurons. For the activation function of the hidden layer, the “tanh” or hyperbolic tan function and relu rectified linear unit or “relu” were used. For weight optimization solver, we used “sgd” or the stochastic gradient descent. In addition, the solver adam was used, which is the default solver in the MLP classifier of sci-kit learn, which performs well in the training and validation of large datasets. Alpha values are 0.0001 and 0.05. Lastly, the learning rate is either constant or adaptive.
There are a few methods to fine-tune parameters, e.g., grid search, random search, and Bayesian optimization. Grid search requires defined values of the hyperparameters to be evaluated, which performs generally well especially in spot checking combinations [38]. Random search defines a search space wherein random points will be evaluated; it performs great in discovering good hyperparameters combinations not particularly guessed by the developers; hence, it requires more time to execute [38]. Lastly, the Bayes-ian optimization algorithm is used for more complex optimization problems such as
Figure 5. A sample topology of multilayer perceptron with 4 inputs, 3 hidden layers with size of 4, 3,and 4 neurons, respectively, and 2 neurons as the output layer [37].
In Figure 5, the first and the last layer are called the input layer and the output layer,respectively. The input layer introduces the MLP to the predictors given in the dataset. Theoutput layer carries the final classification result as computed and processed by the hiddenlayers. The layers in between are called the hidden layers, where all the data processingand the classification of the predictors take place. Commonly, two hidden layers is enoughto perform a classification task, but additional hidden layers are recommended to solvemore complicated classifications and to discover deeper patterns from the predictors.
We tuned the following hyperparameters to attain the highest possible performanceof the MLP ANN. As for the hidden layer sizes, first, there are 3 hidden layers with thesize of 50, 50, 50; next, there are 3 hidden layers of 50, 100, and 50 sizes, and lastly, thereis 1 hidden layer with the size of 100 neurons. For the activation function of the hiddenlayer, the “tanh” or hyperbolic tan function and relu rectified linear unit or “relu” wereused. For weight optimization solver, we used “sgd” or the stochastic gradient descent.In addition, the solver adam was used, which is the default solver in the MLP classifier ofsci-kit learn, which performs well in the training and validation of large datasets. Alphavalues are 0.0001 and 0.05. Lastly, the learning rate is either constant or adaptive.
There are a few methods to fine-tune parameters, e.g., grid search, random search, andBayesian optimization. Grid search requires defined values of the hyperparameters to beevaluated, which performs generally well especially in spot checking combinations [38].Random search defines a search space wherein random points will be evaluated; it performsgreat in discovering good hyperparameters combinations not particularly guessed by thedevelopers; hence, it requires more time to execute [38]. Lastly, the Bayesian optimizationalgorithm is used for more complex optimization problems such as global optimizationthat finds an input that determines the lowest or the highest cost of a given objectivefunction [39].
We aim to discover the best configuration of the supervised machine learning al-gorithms in developing the COVID-19 prediction model using defined values of the hy-perparameters, and with that, the grid search method was selected. We make use ofthe GridSearchCV function from sklearn’s model_selection package. GridSearchCV willtraverse through the defined hyperparameter values and use those configurations to fitthe classifier onto the training set [40]. The hyperparameter optimization will begin bycreating a dictionary of the hyperparameters to be tuned including the desired values of it.Then, the GridSearchCV function will execute all the combinations of the given values andevaluate it using cross-validation. In this study, we used 10-fold cross-validation for all theexperiments.

Diagnostics 2022, 12, 821 13 of 30
The results of this process were the accuracy or loss of each combination, and fromthere, we can choose the hyperparameter combination that will bring out the best possibleperformance of the algorithm for both the training and testing dataset [40].
2.5. Comparative Analysis Serialization and COVID-19 Prediction Model
Accuracy alone is not enough to choose the best model to be used, and other per-formance results of the model must be taken into consideration [41]. Moreover, accuracyworks best if the dataset is symmetric or has close or equal counts of samples per class [42].In lieu of comparative analysis, the performance measures used in finding the model thatwill serve as the most appropriate machine learning algorithm to be used in building aCOVID-19 prediction model are as follows.
2.5.1. Performance Criteria
We performed a comparative analysis of the performances of different supervisedmachine learning algorithms using 10-fold cross-validation, and the important criteria usedin this phase are the following:
1. Accuracy
Accuracy is the measurement of all the correctly predicted instances over the totalpredictions made by the model [3]. It computes the ratio of the correctly classified samples,which are true positives (TP) and true negatives (TN), over the total number of predictions,which includes the TP, TN, and misclassified predictions such as false positives (FP) andfalse negatives (FN). The formula for accuracy can be seen in Equation (4).
Accuracy =TP + TN
TP + TN + FP + FN(4)
2. Sensitivity
Sensitivity is the ratio of correctly classified COVID-19 positive samples to all of theCOVID-19 positive samples in the dataset. The sensitivity of the classifier is also known asthe True Positive Rate (TPR), which can be computed using Equation (5) [43].
Sensitivity =TP
TP + FN(5)
3. Specificity
Specificity is the proportion of the COVID-19 negative cases that were correctly clas-sified as COVID-19 negative, which is also known as the True Negative Rate (TNR). Thespecificity score can be computed using the following formula shown in Equation (6) [43].
Speci f icity =TN
TN + FP(6)
Specificity is the inverse of the False Positive Rate (FPR), which can be computed usingEquation (7) [44].
FPR = 1− Speci f icity =FP
TN + FP(7)
4. AUC
In computing the AUC, the Receiver Operating Characteristics (ROC) curve mustbe devised first, which is a graphical representation of the model’s performance withrespect to various thresholds used in classifying the samples [44]. By analyzing the ROCcurve, the model’s capability to classify the samples will be determined. It is plotted usingthe sensitivity or the TPR on the y-axis against the FPR, which is plotted on the x-axis. Ahigher AUC means that the developed COVID-19 prediction model can successfully predictCOVID-19 positive samples as positive and COVID-19 negative samples as negative.

Diagnostics 2022, 12, 821 14 of 30
2.5.2. Hyperparameter Optimization, Comparative Analysis, and Serialization
This study aims to compare supervised machine learning algorithms to determinewhich is the most appropriate algorithm to be used in developing a COVID-19 predictionmodel; however, the optimal performance of an algorithm can be achieved if the bestconfiguration has been utilized in the modeling process. As a result of this, we performedhyperparameter optimization to determine the values at which the algorithm will performbest using the COVID-19 Presence and Symptoms dataset. We utilized the GridSearchCVmethod using 10-fold cross validation. For the J48 DT algorithm, we tuned the criterion,minimum samples of leaf, and maximum depth hyperparameters. The results are displayedin Table 6.
Table 6. J48 DT algorithm hyperparameter optimization results.
No Criterion Min Samples in the Node Maximum Depth Accuracy Ranking
1 Gini 20 5 98.52 12 Gini 10 5 98.52 13 entropy 20 5 98.48 34 entropy 10 5 98.48 35 entropy 20 10 98.27 56 entropy 10 10 98.27 57 Gini 20 10 98.16 78 Gini 10 10 98.16 79 entropy 20 20 97.08 910 entropy 10 20 97.08 9
In Table 6, 10 experimental results for the hyperparameter optimization of J48 DT weredisplayed, describing the values for the hyperparameters criterion, minimum samples inthe node, maximum depth hyperparameters, the attained accuracy for each combination,and the ranking. Based on the results of J48 hyperparameter optimization, we found 2hyperparameter combinations that attained the highest accuracy, which is 98.52. The firstcombination is Gini criterion, a minimum of 20 samples in the node and a maximum depthof 5. The next hyperparameter combination is Gini criterion, a minimum of 10 samplesin the node, and a maximum depth of 5 as well. The criterion entropy also yielded highscores around 97–98. In this study, the configuration defined in the row in bold format wasutilized in building the COVID-19 prediction model. The same condition was applied forthe rest of the tables.
The next algorithm used was the RF algorithm; we tuned the criterion, max depth,minimum samples in the node, number of estimators, and bootstrap hyperparameters. Theresults of the hyperparameter optimization of the RF algorithm are displayed in Table 7.
Table 7. Random forest algorithm hyperparameter optimization results.
No Criterion Max Depth Min Samples in theNode
No. ofEstimators Bootstrap Accuracy Ranking
1 Gini 20 5 200 False 98.75 12 entropy 20 5 300 True 98.73 23 Gini 20 5 300 True 98.71 34 entropy 20 5 300 False 98.71 45 entropy 20 5 200 True 98.70 56 entropy 20 5 100 True 98.70 57 Gini 20 5 100 False 98.70 78 Gini 10 5 300 False 98.70 79 Gini 20 5 100 True 98.70 910 Gini 10 5 200 False 98.70 9

Diagnostics 2022, 12, 821 15 of 30
In Table 7, 10 experimental results for hyperparameter optimization of RF are dis-played, describing the values for the criterion, maximum depth, minimum samples in thenode, the number of estimators, and bootstrap hyperparameters. Table 7 also displays theattained accuracy for each combination and the ranking. For RF, we found out that thecriterion Gini, maximum depth of 20, minimum of 5 samples in the node, 200 trees in theforest, and no bootstrapping will attain the highest accuracy of 98.75. The RF accuracy is0.23 higher than the J4 DT algorithm in this experiment.
The next algorithm tested was the SVM, and we tuned the regularization parameter C,degree, gamma, and kernel hyperparameters. The results of hyperparameter optimizationfor the SVM algorithm are shown in Table 8.
Table 8. Support Vector Machine algorithm hyperparameter optimization results.
No C Degree Gamma Kernel Accuracy Ranking
1 5 - 1 Radial BasisFunction 98.84 1
2 1 2 1 Polynomial 98.84 13 10 - 1 Radial Basis Function 98.84 14 2 - 1 Radial Basis Function 98.84 15 10 - 0.1 Radial Basis Function 98.84 16 5 - 0.1 Radial Basis Function 98.84 17 10 2 1 Polynomial 98.84 18 5 - 0.1 Radial Basis Function 98.84 19 10 - 1 Radial Basis Function 98.84 1
10 1 3 1 Polynomial 98.84 1
In Table 8, 10 experimental results for the hyperparameter optimization of SVM weredisplayed, describing the values for the C, degree, gamma, kernel, the attained accuracy,and the ranking. For SVM, we found out that the first 10 high-performing classifiers wereattained using various hyperparameter combinations, for the hyperparameter C, 1, 2, 5,and 10, and for the degrees 2 and 3. For the kernels hyperparameter, the polynomial andradial basis function yielded the best possible performance of the classifier. As reflectedin Table 8, all the accuracies attained were the same, having 98.84, all the hyperparametercombinations presented were placed in the first ranking. The row in bold format was theconfiguration utilized in training the prediction model.
For the k-NN, the distance functions used were Euclidean and Manhattan metrics,and the neighbors and weights hyperparameters were also tuned. The results of thehyperparameter optimization for k-NN are presented in Table 9.
Table 9. K-nearest neighbors algorithm hyperparameter optimization results.
No Metric Neighbors Weights Accuracy Ranking
1 Manhattan 9 distance 98.83 12 Manhattan 7 distance 98.83 13 Manhattan 5 distance 98.83 14 Manhattan 11 distance 98.79 45 Manhattan 3 distance 98.78 56 Manhattan 13 distance 98.76 67 Manhattan 3 uniform 98.75 78 Manhattan 5 uniform 98.58 89 Manhattan 7 uniform 98.39 910 Manhattan 9 uniform 98.14 10
In Table 9, 10 experimental results for the hyperparameter optimization of k-NNwere displayed, describing the values for the metric, neighbors, weights hyperparameters,the attained accuracy for each combination, and the ranking. For k-NN, we found 3hyperparameter combinations that obtained the highest score, which is 98.83. For the

Diagnostics 2022, 12, 821 16 of 30
hyperparameter metric, the Manhattan distance function was listed for all the top 10results. The values 9, 7 and 5 for the neighbors and “distance” as the value for the weightshyperparameter were the best configurations. For the weights hyperparameter, the value“uniform” can also be used and will also obtain a good accuracy of 98.14 to 98.75.
For the naïve Bayes algorithm, we tuned the var smoothing hyperparameter; theresults are displayed in Table 10.
Table 10. Naïve Bayes algorithm hyperparameter optimization results.
No Variance Smoothing Accuracy Ranking
1 0.1 95.08 12 0.123 95.08 13 0.231 95.06 34 0.043 95.05 45 0.187 95.05 56 0.152 95.05 57 0.053 95.03 78 0.066 95.03 89 0.081 95.01 910 0.285 95.01 10
In Table 10, 10 experimental results for the hyperparameter optimization of NB weredisplayed, describing the values for the variance smoothing hyperparameter, the attainedaccuracy for each combination, and the ranking. Based on the results, we found that 2variance smoothing alpha values of 0.1 and 0.123 obtained the highest score of 95.08.
We also examined the ANN regarding its performance in the experiment; the hyper-parameters tuned were the number of hidden layers, activation function, solver, alpha, andlearning rate. The results for the hyperparameter optimization for the ANN were displayedin Table 11.
Table 11. Artificial neural network algorithm hyperparameter optimization results.
No Hidden Layer Sizes Activation Solver Alpha Learning Rate Accuracy Ranking
1 (50, 100, 50) relu adam 0.0001 constant 98.84 12 (50, 100, 50) tanh adam 0.0001 constant 98.84 13 (50, 100, 50) relu adam 0.05 constant 98.84 14 (50, 100, 50) relu adam 0.0001 adaptive 98.84 15 (50, 50, 50) tanh adam 0.05 constant 98.84 16 (50, 50, 50) relu adam 0.0001 adaptive 98.83 67 (50, 50, 50) relu adam 0.05 adaptive 98.81 78 (50, 50, 50) tanh adam 0.05 adaptive 98.79 89 (50, 100, 50) tanh adam 0.05 constant 98.78 910 (50, 50, 50) relu adam 0.0001 constant 98.76 10
In Table 11, 10 experimental results for the hyperparameter optimization of ANN aredisplayed, describing the values for the size of hidden layers, activation function, solver,alpha, and learning rate. For comparison, Table 11 displays the attained accuracy for eachcombination and the ranking. For ANN, we found 5 hyperparameter combinations thatobtained the highest accuracy, which is 98.84. Hidden layers sizes of (50, 100, 50) and (50,50, 50), activation function of relu and tanh, adam solver, alpha values of 0.0001 and 0.05,and the constant and adaptive learning rate were the most appropriate hyperparametercombinations to attain the highest possible accuracy of the ANN algorithm.
After the hyperparameter optimization process, we used the results in deciding whatis the best configuration for each algorithm that will yield the highest possible accuracy.For the comparative analysis, the supervised machine learning algorithms using the bestconfigurations were utilized in building a model that will predict the presence of COVID-19
Diagnostics 2022, 12, 821 17 of 30
in person. The developed models were evaluated using the training and testing datasetwherein the results were discussed in Section 3, which is the Results and Discussion section.Then, we used the serialization function to transform the developed model into a file thatcan be transmitted to other platforms. The joblib serializing package was installed, havingthe dump() and load() functions; this package has the capability of compiling a modelinto a file object, which is compatible and can be integrated in the next phase of this study,which is the development of a machine learning-based web application.
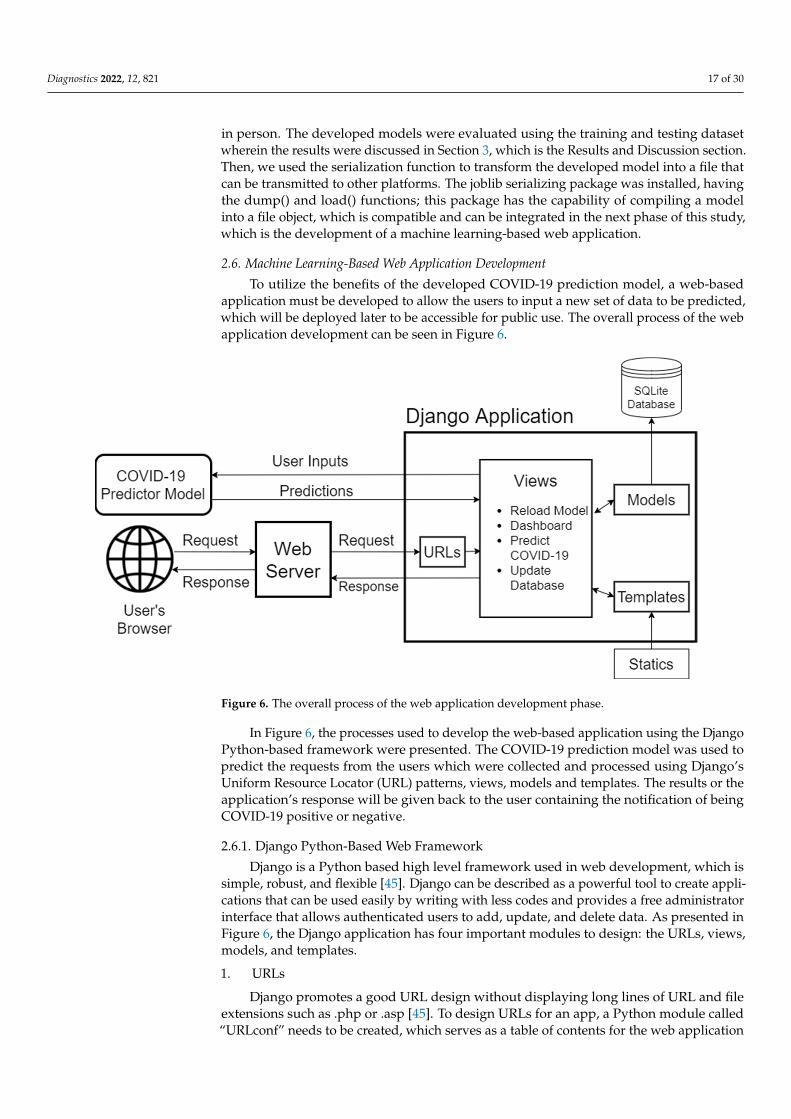
2.6. Machine Learning-Based Web Application Development
To utilize the benefits of the developed COVID-19 prediction model, a web-basedapplication must be developed to allow the users to input a new set of data to be predicted,which will be deployed later to be accessible for public use. The overall process of the webapplication development can be seen in Figure 6.
Diagnostics 2022, 12, x FOR PEER REVIEW 18 of 31
Figure 6. The overall process of the web application development phase.
In Figure 6, the processes used to develop the web-based application using the Django Python-based framework were presented. The COVID-19 prediction model was used to predict the requests from the users which were collected and processed using Django’s Uniform Resource Locator (URL) patterns, views, models and templates. The results or the application’s response will be given back to the user containing the notifica-tion of being COVID-19 positive or negative.
2.6.1. Django Python-Based Web Framework Django is a Python based high level framework used in web development, which is
simple, robust, and flexible [45]. Django can be described as a powerful tool to create ap-plications that can be used easily by writing with less codes and provides a free adminis-trator interface that allows authenticated users to add, update, and delete data. As pre-sented in Figure 6, the Django application has four important modules to design: the URLs, views, models, and templates. 1. URLs
Django promotes a good URL design without displaying long lines of URL and file extensions such as .php or .asp [45]. To design URLs for an app, a Python module called “URLconf” needs to be created, which serves as a table of contents for the web application where the users can call for a particular page and returns error code 404 if the requested page was not found. 2. Views
A Django view is capable of returning a response, raising an exception such as error code 404, and giving the result of the functions or computations defined in the program. A Django view can collect data according to the defined parameters, load a web-page template, and display the web page according to the template together with the collected data. In views, the web-applications processes were defined such as the reloading of the COVID-19 prediction model, displaying of the dashboard, predicting COVID-19, predic-tion results notification, and the updating of the database. The COVID-19 prediction model discussed in Section 2 was also loaded in the views module using the joblib load() function. This process integrates the capability of the model to predict COVID-19 positive
Figure 6. The overall process of the web application development phase.
In Figure 6, the processes used to develop the web-based application using the DjangoPython-based framework were presented. The COVID-19 prediction model was used topredict the requests from the users which were collected and processed using Django’sUniform Resource Locator (URL) patterns, views, models and templates. The results or theapplication’s response will be given back to the user containing the notification of beingCOVID-19 positive or negative.
2.6.1. Django Python-Based Web Framework
Django is a Python based high level framework used in web development, which issimple, robust, and flexible [45]. Django can be described as a powerful tool to create appli-cations that can be used easily by writing with less codes and provides a free administratorinterface that allows authenticated users to add, update, and delete data. As presented inFigure 6, the Django application has four important modules to design: the URLs, views,models, and templates.
1. URLs
Django promotes a good URL design without displaying long lines of URL and fileextensions such as .php or .asp [45]. To design URLs for an app, a Python module called“URLconf” needs to be created, which serves as a table of contents for the web application

Diagnostics 2022, 12, 821 18 of 30
where the users can call for a particular page and returns error code 404 if the requestedpage was not found.
2. Views
A Django view is capable of returning a response, raising an exception such as errorcode 404, and giving the result of the functions or computations defined in the program.A Django view can collect data according to the defined parameters, load a web-pagetemplate, and display the web page according to the template together with the collecteddata. In views, the web-applications processes were defined such as the reloading of theCOVID-19 prediction model, displaying of the dashboard, predicting COVID-19, predictionresults notification, and the updating of the database. The COVID-19 prediction modeldiscussed in Section 2 was also loaded in the views module using the joblib load() function.This process integrates the capability of the model to predict COVID-19 positive andCOVID-19 negative samples by reconstructing a Python object from the serialized COVID-19 prediction model file.
3. Models
Django can be used with or without using a database, though it provides an object-relational mapper for systems that require a database layout, which can be described inPython codes [45]. We used the SQLite database, which is a lightweight disk-based databaseused in storing the data from the users, which can be used in the future as additionaltraining samples to further improve the prediction rate of the COVID-19 prediction model.
4. Templates
The templates module is where the designed web-pages were located, which canbe seen by the end users. Django has a good mechanism in handling the templates thancan minimize the redundancy among the templates by using the benefits of “templateinheritance”, where a base model can be developed that can be inherited by the rest ofthe templates [45]. In this way, the updating of the information and the design of thewebsite can be done by just updating a single file. In the templates, Django also providesstatic file management to serve additional files used in web designing such as images,JavaScript (JS), or Cascading Style Sheets (CSS). Moreover, we make use of the Bootstrap toobtain professional-looking templates; currently, it is the world’s most popular front-endopen-source toolkit used to quickly design and customize web and mobile responsive webpages [46].
From the user’s browser, a request of predicting the inputted data will then be sentto the web server, and the web server will give inputted data to the Django applicationfor processing. The above-mentioned modules will work hand in hand to collect, process,and predict the submitted data using the COVID-19 prediction model loaded in the viewsmodule. The collected data together with the predicted result, either COVID-19 positive ornegative, will be stored in the SQLite database. Then, a response will be made available tobe transmitted to the user.
2.6.2. Web-Based Application Workflow and the Developed System
The workflow of the developed web-based application can be seen in Figure 7.In Figure 7, the process starts from the user inputting the symptoms currently being
experienced; then, the system will process the data to be ready for the prediction process,and then, the predicted results will be displayed in the user’s browser. The user of theapplication can access the application using a browser, in a desktop, mobile phone, or anydevice.

Diagnostics 2022, 12, 821 19 of 30
Diagnostics 2022, 12, x FOR PEER REVIEW 19 of 31
and COVID-19 negative samples by reconstructing a Python object from the serialized COVID-19 prediction model file. 3. Models
Django can be used with or without using a database, though it provides an object-relational mapper for systems that require a database layout, which can be described in Python codes [45]. We used the SQLite database, which is a lightweight disk-based data-base used in storing the data from the users, which can be used in the future as additional training samples to further improve the prediction rate of the COVID-19 prediction model. 4. Templates
The templates module is where the designed web-pages were located, which can be seen by the end users. Django has a good mechanism in handling the templates than can minimize the redundancy among the templates by using the benefits of “template inher-itance”, where a base model can be developed that can be inherited by the rest of the templates [45]. In this way, the updating of the information and the design of the website can be done by just updating a single file. In the templates, Django also provides static file management to serve additional files used in web designing such as images, JavaScript (JS), or Cascading Style Sheets (CSS). Moreover, we make use of the Bootstrap to obtain professional-looking templates; currently, it is the world’s most popular front-end open-source toolkit used to quickly design and customize web and mobile responsive web pages [46].
From the user’s browser, a request of predicting the inputted data will then be sent to the web server, and the web server will give inputted data to the Django application for processing. The above-mentioned modules will work hand in hand to collect, process, and predict the submitted data using the COVID-19 prediction model loaded in the views module. The collected data together with the predicted result, either COVID-19 positive or negative, will be stored in the SQLite database. Then, a response will be made available to be transmitted to the user.
2.6.2. Web-Based Application Workflow and the Developed System The workflow of the developed web-based application can be seen in Figure 7.
Figure 7. The workflow of the developed web-based application.
In Figure 7, the process starts from the user inputting the symptoms currently being experienced; then, the system will process the data to be ready for the prediction process, and then, the predicted results will be displayed in the user’s browser. The user of the application can access the application using a browser, in a desktop, mobile phone, or any device.
Figure 7. The workflow of the developed web-based application.
2.7. Deploying Django Services to Microsoft Azure Web Applications
After the development of the machine learning-based web application, it is now readyfor the deployment to make it available for public use. To deploy the web application,we used the GitHub Repository and Microsoft Azure. The process of deploying the webapplication is described in Figure 8.
Diagnostics 2022, 12, x FOR PEER REVIEW 20 of 31
2.7. Deploying Django Services to Microsoft Azure Web Applications After the development of the machine learning-based web application, it is now
ready for the deployment to make it available for public use. To deploy the web applica-tion, we used the GitHub Repository and Microsoft Azure. The process of deploying the web application is described in Figure 8.
Figure 8. The process of deploying the web application in GitHub Repository and Microsoft Azure.
In Figure 8, the process of deploying the web application in GitHub Repository and Microsoft Azure was displayed. PyCharm is an Integrated Development Environment (IDE) for Python programming language; it makes the coding easier, for it comes with smart code completion, code inspections, automatic error highlighting, debugging sug-gestions, and deployment capabilities. Moreover, PyCharm has first-class support for var-ious web development technologies such as JavaScript, HTML/CSS, AngularJS, Node.js, and more, and it supports a number of web development frameworks such as Django [47]. We make use of the features of PyCharm IDE from the development of the web applica-tion using the Django framework, integration of the machine learning model, up to the deployment to GitHub Repository using the commit and push functionalities.
GitHub is popular, and it is considered as the world’s largest software development platform that hosts millions of repositories by providing cloud storage for source codes, and it supports all popular programming languages [48]. GitHub also provides a collab-oration platform for its users to make code sharing, working with the same files, and merging projects easier. We utilized the commit and push features of GitHub, which is also available in PyCharm Professional to upload the prediction model and the source codes to the GitHub repository. The prediction model and the source codes are publicly accessible using the link provided in the Supplementary Materials section.
Microsoft developed Microsoft Azure, which is a cloud computing platform used specifically for building, deploying, and managing intelligent applications and services [49]. Upon logging in to Microsoft Azure, we created a web app resource and used covid-ai-predictor as the web application name and used Python as the runtime stack. To deploy and build code from GitHub, we logged into the GitHub account, chose to create a repos-itory for the COVID-19 prediction application, and connected to the master branch. Dur-ing the building and deployment, the requirements.txt file created using the “pip freeze” command was used in installing the dependencies of the project to allow the application to run smoothly.
Figure 8. The process of deploying the web application in GitHub Repository and Microsoft Azure.
In Figure 8, the process of deploying the web application in GitHub Repository andMicrosoft Azure was displayed. PyCharm is an Integrated Development Environment(IDE) for Python programming language; it makes the coding easier, for it comes with smartcode completion, code inspections, automatic error highlighting, debugging suggestions,and deployment capabilities. Moreover, PyCharm has first-class support for various webdevelopment technologies such as JavaScript, HTML/CSS, AngularJS, Node.js, and more,and it supports a number of web development frameworks such as Django [47]. We makeuse of the features of PyCharm IDE from the development of the web application using theDjango framework, integration of the machine learning model, up to the deployment toGitHub Repository using the commit and push functionalities.
GitHub is popular, and it is considered as the world’s largest software developmentplatform that hosts millions of repositories by providing cloud storage for source codes, andit supports all popular programming languages [48]. GitHub also provides a collaboration

Diagnostics 2022, 12, 821 20 of 30
platform for its users to make code sharing, working with the same files, and mergingprojects easier. We utilized the commit and push features of GitHub, which is also availablein PyCharm Professional to upload the prediction model and the source codes to theGitHub repository. The prediction model and the source codes are publicly accessible usingthe link provided in the Supplementary Materials section.
Microsoft developed Microsoft Azure, which is a cloud computing platform usedspecifically for building, deploying, and managing intelligent applications and services [49].Upon logging in to Microsoft Azure, we created a web app resource and used covid-ai-predictor as the web application name and used Python as the runtime stack. To deploy andbuild code from GitHub, we logged into the GitHub account, chose to create a repositoryfor the COVID-19 prediction application, and connected to the master branch. During thebuilding and deployment, the requirements.txt file created using the “pip freeze” commandwas used in installing the dependencies of the project to allow the application to runsmoothly.
3. Results and Discussion
The results of this study include two main subdivisions. The first one is the results ofthe comparative analysis for the developed prediction model presented in Section 3.1. Thebest prediction model was utilized in building a machine learning-based web application.The user interface screenshots of the developed web application can be seen in Section 3.2.
3.1. Results for Comparative Analysis
We used the hyperparameter optimization results shown in Tables 6–11 to perform acomparative analysis to determine which supervised machine learning algorithm to useand its best hyperparameter configuration for training and testing the COVID-19 predictionmodel.
These results were indispensable in the comparative analysis process; we used thesevalues as deciding factors in determining the most appropriate algorithm to be utilized inbuilding a COVID-19 prediction model. The developed model’s performance evaluationresult during the training process is summarized in Table 12.
Table 12. Developed model’s performance evaluation result (training).
Algorithm Accuracy Sensitivity Specificity AUC
J48 DT 98.60 100.00 97.20 98.60RF 98.84 100.00 97.69 98.84
SVM 98.84 100.00 97.69 98.84k-NN 98.84 100.00 97.69 98.84
NB 95.05 96.71 93.38 95.05ANN 98.84 100.00 97.69 98.84
In Table 12, the developed model’s performance evaluation results in the trainingdataset were displayed. Based on the results, the RF, SVM, k-NN, and ANN using tunedhyperparameters were the most appropriate supervised machine learning algorithms to beutilized in developing the COVID-19 prediction model. These three algorithms obtainedthe score of 98.84% accuracy, 100% sensitivity, 97.69% specificity, and 98.84% AUC appliedin the COVID-19 Symptoms and Presence dataset. The confusion matrix results for theexperiments performed during the model training are presented in Tables 13–15.
Table 13. Confusion matrix for J48 DT model (training).
Actual Predicted Negative Predicted Positive
Negative 3068 0Positive 86 2982

Diagnostics 2022, 12, 821 21 of 30
Table 14. Confusion matrix for RF, SVM, k-NN, and ANN models (training).
Actual Predicted Negative Predicted Positive
Negative 3068 0Positive 71 2997
Table 15. Confusion matrix for NB model (training).
Actual Predicted Negative Predicted Positive
Negative 2967 101Positive 203 2865
In Table 13, the confusion matrix result in the training dataset of the model using J48DT was presented. Based on the prediction results, the 3068 samples that belong to theNegative class were successfully predicted. Whereas for the Positive class, among 3068samples, the developed model successfully predicted 2982 samples, and the remaining 86samples were classified as Negative.
In Table 14, the confusion matrix results of the models in the training dataset usingRF, SVM, and k-NN algorithms are presented for these three algorithms, and the resultsobtained were the same. The 3068 samples that belong to Negative class were successfullypredicted. Whereas for the Positive class, among 3068 samples, the developed modelsuccessfully predicted 2997 samples, and the remaining 71 samples were classified asNegative.
In Table 15, the confusion matrix result in the training dataset of the model usingJ48 DT was presented. For the 3068 samples that belong to the Negative class, 2967 weresuccessfully predicted, but 101 samples were predicted as positive, which is the onlyalgorithm that had misclassifications on the Negative class. For the Positive class, among3068 samples, the developed model successfully predicted 2865 samples, but the remaining203 were classified as Negative, which is the highest misclassification compared to theperformance of the other algorithms.
After the training, the developed models were also evaluated using the test dataset,and the results of the model’s accuracy performance, sensitivity, specificity, and AUC aredisplayed in Table 16.
Table 16. Developed model’s performance evaluation result (training).
Algorithm Accuracy Sensitivity Specificity AUC
J48 DT 98.40 100.00 96.81 98.40RF 98.75 100.00 97.49 98.75
SVM 98.75 100.00 97.49 98.75K-NN 98.75 100.00 97.49 98.75
NB 94.94 96.12 93.76 94.94ANN 98.75 100.00 97.49 98.75
In Table 16, the developed model’s performance evaluation results in the test datasetwere displayed. Based on the results, the RF, SVM, k-NN, and ANN using tuned hy-perparameters were the most appropriate supervised machine learning algorithms to beutilized in developing the COVID-19 prediction model, using the same intuition as whatwe drew from the training dataset. These algorithms obtained the score of 98.75% accuracy,100% sensitivity, 97.49% specificity, and 98.75% AUC applied in the devised testing dataset.The confusion matrix results for the experiments performed during the model testing arepresented in Tables 17–19.

Diagnostics 2022, 12, 821 22 of 30
Table 17. Confusion matrix for J48 DT model (testing).
Actual Predicted Negative Predicted Positive
Negative 1315 0Positive 42 1273
Table 18. Confusion matrix for RF, SVM, k-NN, and ANN models (testing).
Actual Predicted Negative Predicted Positive
Negative 1315 0Positive 33 1282
Table 19. Confusion matrix for NB model (testing).
Actual Predicted Negative Predicted Positive
Negative 1264 51Positive 82 1233
In Table 17, the confusion matrix results of the model using J48 DT in the test datasetare presented. The 1315 samples that belong to the Negative class were successfullypredicted as Negative. Whereas for the Positive class, among 1315 samples, the developedmodel successfully predicted 1273 samples, and the remaining 42 samples were classifiedas Negative.
In Table 18, the confusion matrix results of the models using RF, SVM, k-NN, andANN algorithms are presented. The 1315 samples that belong to the Negative class weresuccessfully predicted as Negative. Whereas for the Positive class, among 1315 samples,the developed model successfully predicted 1282 samples as Positive, only 33 samples wereclassified as Negative.
In Table 19, the confusion matrix results in the training dataset of the model usingJ48 DT are presented. For the 1315 samples that belong to the Negative class, 1264 weresuccessfully predicted, but 51 samples were predicted as positive. For the Positive class,among 3068 samples, the developed model successfully predicted 1233 samples, but theremaining 82 were classified as Negative.
Based on the results of the comparative analysis, it can be drawn that RF, SVM, k-NN, and ANN were the most appropriate algorithms to be considered in developing theCOVID-19 prediction model outweighing the performance of the J48 DT and NB algorithms.The best configuration of the algorithms was also determined using the hyperparameteroptimization grid search method and 10-fold cross-validation. The results obtained wereused to achieve the highest possible performance of the models. For the hyperparameteroptimization, RF, SVM, and ANN yielded the best score, 98.84%, while the k-NN obtained98.83%. In using the training dataset, the RF, SVM, k-NN, and ANN algorithms yielded98.84% accuracy, 100% sensitivity, 97.69%, specificity, and 98.84% AUC.
3.2. The Developed Machine Learning-Based Web Application
The dashboard of the web application is presented in Figure 9.In Figure 9, the email address, contact number, location, and social media links of the
researcher were displayed for communication purposes. There were several links that theuser could choose: Home, About, Prediction, Statistics, Contact, and Get Predictions. TheAbout portion displays information about the COVID-19 prediction model and informativelinks that redirect to the WHO’s website, which can be accessed by clicking the “ReadMore”, including a list of COVID-19 symptoms, the WHO’s advice to the public, and theWHO’s COVID-19 website’s dashboard. The WHO’s dashboard consists of an interactivemap in a color-coded scheme regarding the number of cases, a country can be selected inthe map, and information such as confirmed cases, deaths, and vaccine doses’ administered
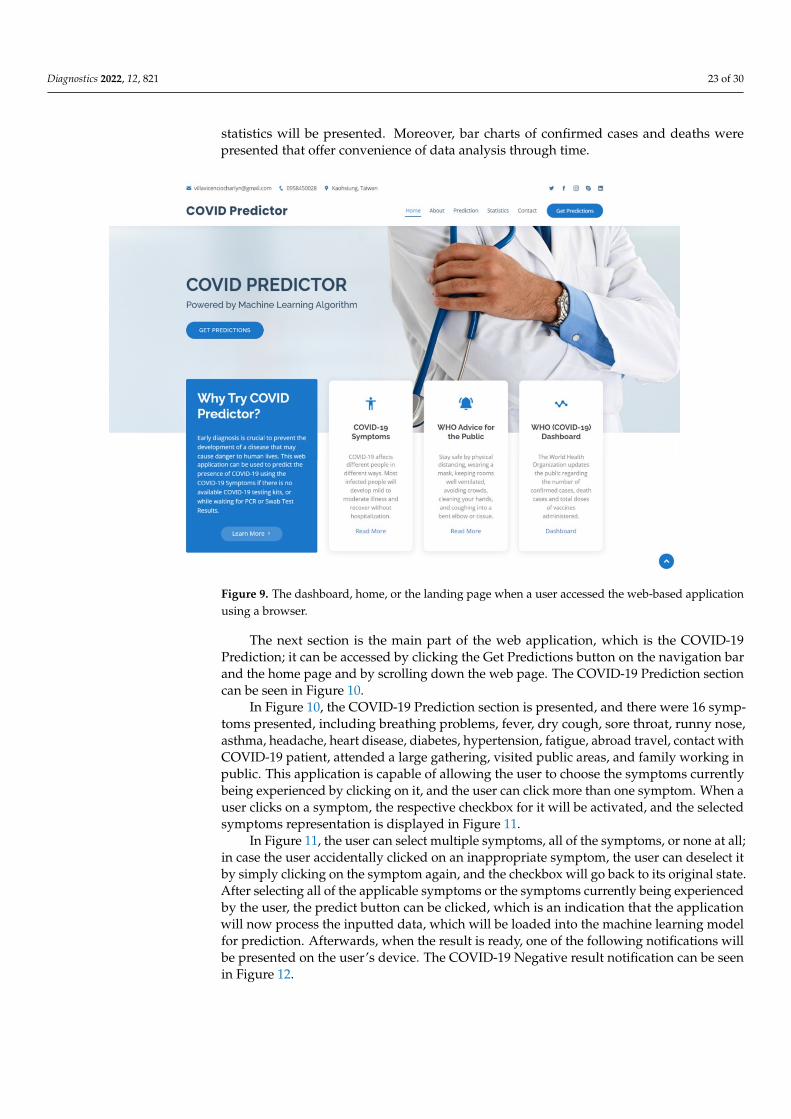
Diagnostics 2022, 12, 821 23 of 30
statistics will be presented. Moreover, bar charts of confirmed cases and deaths werepresented that offer convenience of data analysis through time.
Diagnostics 2022, 12, x FOR PEER REVIEW 24 of 31
Figure 9. The dashboard, home, or the landing page when a user accessed the web-based application using a browser.
In Figure 9, the email address, contact number, location, and social media links of the researcher were displayed for communication purposes. There were several links that the user could choose: Home, About, Prediction, Statistics, Contact, and Get Predictions. The About portion displays information about the COVID-19 prediction model and informa-tive links that redirect to the WHO’s website, which can be accessed by clicking the “Read More”, including a list of COVID-19 symptoms, the WHO’s advice to the public, and the WHO’s COVID-19 website’s dashboard. The WHO’s dashboard consists of an interactive map in a color-coded scheme regarding the number of cases, a country can be selected in the map, and information such as confirmed cases, deaths, and vaccine doses’ adminis-tered statistics will be presented. Moreover, bar charts of confirmed cases and deaths were presented that offer convenience of data analysis through time.
The next section is the main part of the web application, which is the COVID-19 Pre-diction; it can be accessed by clicking the Get Predictions button on the navigation bar and the home page and by scrolling down the web page. The COVID-19 Prediction section can be seen in Figure 10.
Figure 9. The dashboard, home, or the landing page when a user accessed the web-based applicationusing a browser.
The next section is the main part of the web application, which is the COVID-19Prediction; it can be accessed by clicking the Get Predictions button on the navigation barand the home page and by scrolling down the web page. The COVID-19 Prediction sectioncan be seen in Figure 10.
In Figure 10, the COVID-19 Prediction section is presented, and there were 16 symp-toms presented, including breathing problems, fever, dry cough, sore throat, runny nose,asthma, headache, heart disease, diabetes, hypertension, fatigue, abroad travel, contact withCOVID-19 patient, attended a large gathering, visited public areas, and family working inpublic. This application is capable of allowing the user to choose the symptoms currentlybeing experienced by clicking on it, and the user can click more than one symptom. When auser clicks on a symptom, the respective checkbox for it will be activated, and the selectedsymptoms representation is displayed in Figure 11.
In Figure 11, the user can select multiple symptoms, all of the symptoms, or none at all;in case the user accidentally clicked on an inappropriate symptom, the user can deselect itby simply clicking on the symptom again, and the checkbox will go back to its original state.After selecting all of the applicable symptoms or the symptoms currently being experiencedby the user, the predict button can be clicked, which is an indication that the applicationwill now process the inputted data, which will be loaded into the machine learning modelfor prediction. Afterwards, when the result is ready, one of the following notifications willbe presented on the user’s device. The COVID-19 Negative result notification can be seenin Figure 12.

Diagnostics 2022, 12, 821 24 of 30Diagnostics 2022, 12, x FOR PEER REVIEW 25 of 31
Figure 10. The COVID-19 Prediction section.
In Figure 10, the COVID-19 Prediction section is presented, and there were 16 symp-toms presented, including breathing problems, fever, dry cough, sore throat, runny nose, asthma, headache, heart disease, diabetes, hypertension, fatigue, abroad travel, contact with COVID-19 patient, attended a large gathering, visited public areas, and family work-ing in public. This application is capable of allowing the user to choose the symptoms currently being experienced by clicking on it, and the user can click more than one symp-tom. When a user clicks on a symptom, the respective checkbox for it will be activated, and the selected symptoms representation is displayed in Figure 11.
Figure 11. The activated checkbox of the selected symptoms.
Figure 10. The COVID-19 Prediction section.
Diagnostics 2022, 12, x FOR PEER REVIEW 25 of 31
Figure 10. The COVID-19 Prediction section.
In Figure 10, the COVID-19 Prediction section is presented, and there were 16 symp-toms presented, including breathing problems, fever, dry cough, sore throat, runny nose, asthma, headache, heart disease, diabetes, hypertension, fatigue, abroad travel, contact with COVID-19 patient, attended a large gathering, visited public areas, and family work-ing in public. This application is capable of allowing the user to choose the symptoms currently being experienced by clicking on it, and the user can click more than one symp-tom. When a user clicks on a symptom, the respective checkbox for it will be activated, and the selected symptoms representation is displayed in Figure 11.
Figure 11. The activated checkbox of the selected symptoms. Figure 11. The activated checkbox of the selected symptoms.

Diagnostics 2022, 12, 821 25 of 30
Diagnostics 2022, 12, x FOR PEER REVIEW 26 of 31
In Figure 11, the user can select multiple symptoms, all of the symptoms, or none at all; in case the user accidentally clicked on an inappropriate symptom, the user can dese-lect it by simply clicking on the symptom again, and the checkbox will go back to its orig-inal state. After selecting all of the applicable symptoms or the symptoms currently being experienced by the user, the predict button can be clicked, which is an indication that the application will now process the inputted data, which will be loaded into the machine learning model for prediction. Afterwards, when the result is ready, one of the following notifications will be presented on the user’s device. The COVID-19 Negative result notifi-cation can be seen in Figure 12.
Figure 12. The notification for the COVID-19 Negative result.
In Figure 12, we used the phrase “You seem fine and COVID-19 Negative”, which indicates that the developed COVID-19 classifier’s prediction regarding the inputted symptoms by the user is COVID-19 Negative. Even though the result is negative, the user is still expected to observe safety precautions against the virus and be informed about the WHO’s advice to the public. It is also indicated that the COVID-19 prediction results are unofficial, and to obtain the official PCR test certification, it is suggested to follow the usual process and undergo PCR testing. Another notification that the user may possible receive is the COVID-19 positive notification, and the message can be seen in Figure 13.
Figure 13. The notification for the COVID-19 Positive result.
In Figure 13, we opted to use a gentle phrase “It seems like you need help as you are potentially COVID-19 Positive” which indicates that the classifier’s prediction with re-spect to the selected symptoms by the user is COVID-19 Positive. The notification highly suggests to call a medical provider immediately to seek proper medical attention; this re-sult is unofficial, and it is necessary to undergo PCR testing as soon as possible to obtain official results and to promote the safety of the user and other people. Lastly, a predict-again hyperlink was provided to enable users who wish to use the COVID-19 prediction again.
A contact section was also provided in the last portion of the web application; it dis-plays the researcher’s email, and the university contact number. Moreover, a contact form
Figure 12. The notification for the COVID-19 Negative result.
In Figure 12, we used the phrase “You seem fine and COVID-19 Negative”, whichindicates that the developed COVID-19 classifier’s prediction regarding the inputted symp-toms by the user is COVID-19 Negative. Even though the result is negative, the user is stillexpected to observe safety precautions against the virus and be informed about the WHO’sadvice to the public. It is also indicated that the COVID-19 prediction results are unofficial,and to obtain the official PCR test certification, it is suggested to follow the usual processand undergo PCR testing. Another notification that the user may possible receive is theCOVID-19 positive notification, and the message can be seen in Figure 13.
Diagnostics 2022, 12, x FOR PEER REVIEW 26 of 31
In Figure 11, the user can select multiple symptoms, all of the symptoms, or none at all; in case the user accidentally clicked on an inappropriate symptom, the user can dese-lect it by simply clicking on the symptom again, and the checkbox will go back to its orig-inal state. After selecting all of the applicable symptoms or the symptoms currently being experienced by the user, the predict button can be clicked, which is an indication that the application will now process the inputted data, which will be loaded into the machine learning model for prediction. Afterwards, when the result is ready, one of the following notifications will be presented on the user’s device. The COVID-19 Negative result notifi-cation can be seen in Figure 12.
Figure 12. The notification for the COVID-19 Negative result.
In Figure 12, we used the phrase “You seem fine and COVID-19 Negative”, which indicates that the developed COVID-19 classifier’s prediction regarding the inputted symptoms by the user is COVID-19 Negative. Even though the result is negative, the user is still expected to observe safety precautions against the virus and be informed about the WHO’s advice to the public. It is also indicated that the COVID-19 prediction results are unofficial, and to obtain the official PCR test certification, it is suggested to follow the usual process and undergo PCR testing. Another notification that the user may possible receive is the COVID-19 positive notification, and the message can be seen in Figure 13.
Figure 13. The notification for the COVID-19 Positive result.
In Figure 13, we opted to use a gentle phrase “It seems like you need help as you are potentially COVID-19 Positive” which indicates that the classifier’s prediction with re-spect to the selected symptoms by the user is COVID-19 Positive. The notification highly suggests to call a medical provider immediately to seek proper medical attention; this re-sult is unofficial, and it is necessary to undergo PCR testing as soon as possible to obtain official results and to promote the safety of the user and other people. Lastly, a predict-again hyperlink was provided to enable users who wish to use the COVID-19 prediction again.
A contact section was also provided in the last portion of the web application; it dis-plays the researcher’s email, and the university contact number. Moreover, a contact form
Figure 13. The notification for the COVID-19 Positive result.
In Figure 13, we opted to use a gentle phrase “It seems like you need help as youare potentially COVID-19 Positive” which indicates that the classifier’s prediction withrespect to the selected symptoms by the user is COVID-19 Positive. The notification highlysuggests to call a medical provider immediately to seek proper medical attention; this resultis unofficial, and it is necessary to undergo PCR testing as soon as possible to obtain officialresults and to promote the safety of the user and other people. Lastly, a predict-againhyperlink was provided to enable users who wish to use the COVID-19 prediction again.
A contact section was also provided in the last portion of the web application; itdisplays the researcher’s email, and the university contact number. Moreover, a contactform was made available that can be used to contact the researcher and improve theapplication by sharing messages, comments, suggestions, or report bugs encountered inthe system. The contact section can be seen in Figure 14.
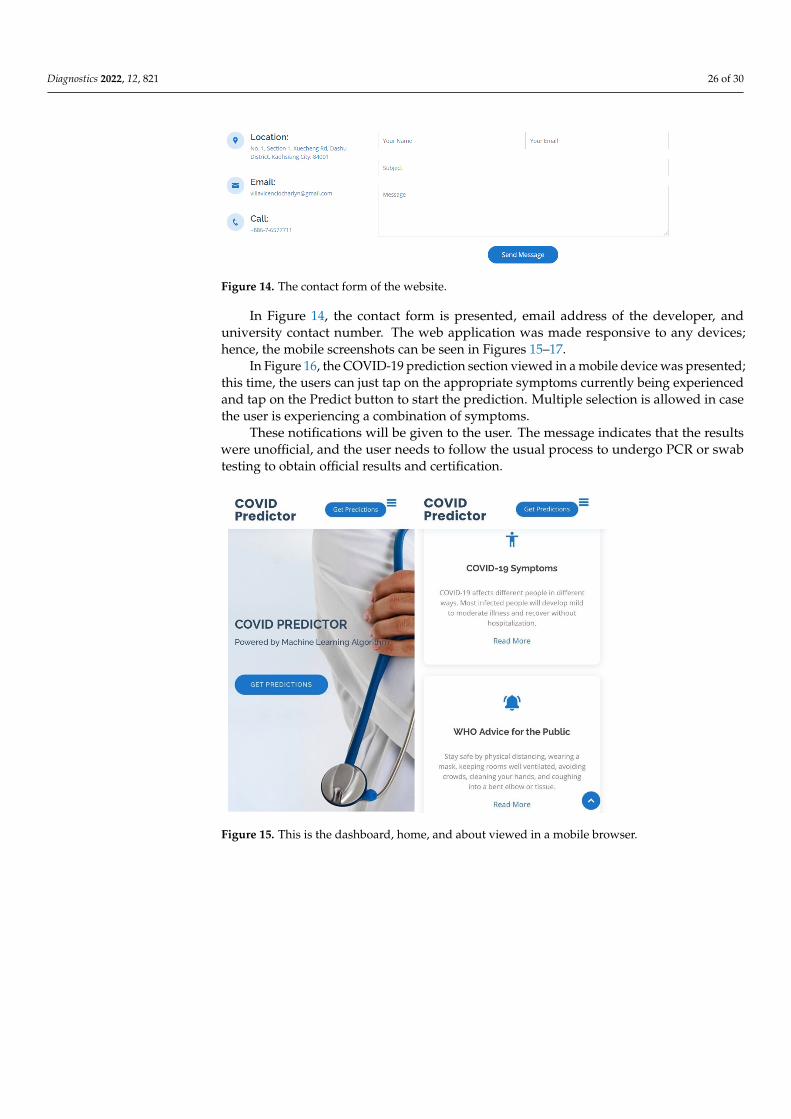
Diagnostics 2022, 12, 821 26 of 30
Diagnostics 2022, 12, x FOR PEER REVIEW 27 of 31
was made available that can be used to contact the researcher and improve the application by sharing messages, comments, suggestions, or report bugs encountered in the system. The contact section can be seen in Figure 14.
Figure 14. The contact form of the website.
In Figure 14, the contact form is presented, email address of the developer, and uni-versity contact number. The web application was made responsive to any devices; hence, the mobile screenshots can be seen in Figures 15–17.
Figure 15. This is the dashboard, home, and about viewed in a mobile browser.
Figure 14. The contact form of the website.
In Figure 14, the contact form is presented, email address of the developer, anduniversity contact number. The web application was made responsive to any devices;hence, the mobile screenshots can be seen in Figures 15–17.
In Figure 16, the COVID-19 prediction section viewed in a mobile device was presented;this time, the users can just tap on the appropriate symptoms currently being experiencedand tap on the Predict button to start the prediction. Multiple selection is allowed in casethe user is experiencing a combination of symptoms.
These notifications will be given to the user. The message indicates that the resultswere unofficial, and the user needs to follow the usual process to undergo PCR or swabtesting to obtain official results and certification.
Diagnostics 2022, 12, x FOR PEER REVIEW 27 of 31
was made available that can be used to contact the researcher and improve the application by sharing messages, comments, suggestions, or report bugs encountered in the system. The contact section can be seen in Figure 14.
Figure 14. The contact form of the website.
In Figure 14, the contact form is presented, email address of the developer, and uni-versity contact number. The web application was made responsive to any devices; hence, the mobile screenshots can be seen in Figures 15–17.
Figure 15. This is the dashboard, home, and about viewed in a mobile browser. Figure 15. This is the dashboard, home, and about viewed in a mobile browser.

Diagnostics 2022, 12, 821 27 of 30Diagnostics 2022, 12, x FOR PEER REVIEW 28 of 31
Figure 16. The COVID-19 prediction section responsive view section using a mobile device.
Figure 17. The COVID-19 negative and positive notifications viewed in a mobile device.
In Figure 16, the COVID-19 prediction section viewed in a mobile device was pre-sented; this time, the users can just tap on the appropriate symptoms currently being ex-perienced and tap on the Predict button to start the prediction. Multiple selection is al-lowed in case the user is experiencing a combination of symptoms.
These notifications will be given to the user. The message indicates that the results were unofficial, and the user needs to follow the usual process to undergo PCR or swab testing to obtain official results and certification.
4. Conclusions This study aimed to build a COVID-19 prediction model by applying supervised ma-
chine learning algorithms. J48 decision tree, random forest, support vector machine, k-nearest neighbors, naïve Bayes, and artificial neural network were the algorithms used in this study. The most appropriate configurations were successfully determined through
Figure 16. The COVID-19 prediction section responsive view section using a mobile device.
Diagnostics 2022, 12, x FOR PEER REVIEW 28 of 31
Figure 16. The COVID-19 prediction section responsive view section using a mobile device.
Figure 17. The COVID-19 negative and positive notifications viewed in a mobile device.
In Figure 16, the COVID-19 prediction section viewed in a mobile device was pre-sented; this time, the users can just tap on the appropriate symptoms currently being ex-perienced and tap on the Predict button to start the prediction. Multiple selection is al-lowed in case the user is experiencing a combination of symptoms.
These notifications will be given to the user. The message indicates that the results were unofficial, and the user needs to follow the usual process to undergo PCR or swab testing to obtain official results and certification.
4. Conclusions This study aimed to build a COVID-19 prediction model by applying supervised ma-
chine learning algorithms. J48 decision tree, random forest, support vector machine, k-nearest neighbors, naïve Bayes, and artificial neural network were the algorithms used in this study. The most appropriate configurations were successfully determined through
Figure 17. The COVID-19 negative and positive notifications viewed in a mobile device.
4. Conclusions
This study aimed to build a COVID-19 prediction model by applying supervisedmachine learning algorithms. J48 decision tree, random forest, support vector machine,k-nearest neighbors, naïve Bayes, and artificial neural network were the algorithms usedin this study. The most appropriate configurations were successfully determined throughhyperparameter optimization and 10-fold cross-validation. A comparative analysis wasconducted by evaluating each model’s performance in terms of its accuracy, sensitivity,specificity, and area under ROC curve, using the Google colab research. The resultsshow that random forest, support vector machine, k-nearest neighbor, and artificial neuralnetwork were the best algorithms to be utilized in building the COVID-19 prediction model.These algorithms yielded 98.84% accuracy, 100% sensitivity, 97.69% specificity, and 98.84%area under the ROC curve score. The developed models were successfully integrated in the

Diagnostics 2022, 12, 821 28 of 30
development of a machine learning based web application using the Django Framework,which was written in Python programming language using the PyCharm professional IDE.The source codes were deployed in the GitHub repository, and Microsoft Azure Web Appservice features were used to make the web application accessible online. The output ofthis study is a COVID-19 prediction application that allows the user to input appropriatesymptoms currently being experienced and automatically receive a notification indicatingthe result of the classifier: either COVID-19 positive or negative. This study can serve as anadditional tool for people who wish to manage their health status with regard to COVID-19in a real-time manner without the need for laboratory tests.
Supplementary Materials: The prediction model and the source codes used to develop the machinelearning-based web application can be downloaded at https://github.com/dearcharlyn/covid_predictor (accessed on 23 March 2022).
Author Contributions: Conceptualization, C.N.V. and J.J.M.; methodology, C.N.V. and J.J.M.; valida-tion, J.J.M. and X.A.I.; formal analysis, C.N.V. and J.J.M.; writing—original draft preparation, C.N.V.;writing—review and editing, J.J.M., X.A.I. and J.-H.J.; visualization, C.N.V.; supervision, J.-H.J. andJ.-G.H.; project administration, J.-H.J. and J.-G.H. All authors have read and agreed to the publishedversion of the manuscript.
Funding: This research received no external funding.
Institutional Review Board Statement: Ethical review and approval were waived for this study,because the aim of this study is to analyze symptoms available in a public dataset to determineif there is a possibility of the presence COVID-19 or not. The authors do not have access to anyinformation concerning the identities of the subjects in this study.
Informed Consent Statement: Patient consent was waived due to the anonymity of their identities,and the dataset used in this study is open for public use.
Data Availability Statement: The dataset utilized in this study is available at https://www.kaggle.com/hemanthhari/symptoms-and-covid-presence (accessed on 30 June 2021). The prediction modeland the source codes used to develop the machine learning-based web application is publicly accessi-ble through this GitHub repository https://github.com/dearcharlyn/covid_predictor (accessed on30 June 2021).
Acknowledgments: This work was supported in part by Ministry of Science and Technology, Taiwan,under grant MOST 110-2221-E-214-019.
Conflicts of Interest: The authors declare no conflict of interest.
References1. Coronavirus Disease by World Health Organizations. Available online: https://www.who.int/health-topics/coronavirus
(accessed on 16 February 2022).2. COVID Live Update Worldometers Info. Available online: https://www.worldometers.info/coronavirus/ (accessed on 16
February 2022).3. Villavicencio, C.N.; Macrohon, J.J.E.; Inbaraj, X.A.; Jeng, J.-H.; Hsieh, J.-G. COVID-19 Prediction Applying Supervised Machine
Learning Algorithms with Comparative Analysis Using WEKA. Algorithms 2021, 14, 201. [CrossRef]4. SARS-CoV-2 Variant Classifications and Definitions. Available online: https://www.cdc.gov/coronavirus/2019-ncov/variants/
variant-info.html (accessed on 16 February 2022).5. Turabieh, H.; Karaa, W.B.A. Predicting the Existence of COVID-19 using Machine Learning Based on Laboratory Findings. In
Proceedings of the WiDSTaif 2021, Taif, Saudi Arabia, 30 March 2021.6. Luo, J.; Zhou, L.; Feng, Y.; Bo, L.; Guo, S. The selection of indicators from initial blood routine test results to improve the accuracy
of early prediction of COVID-19 severity. PLoS ONE 2021, 16, e0253329. [CrossRef] [PubMed]7. Rangarajan, A.; Krishnaswamy, R.; Krishnan, H. A preliminary analysis of AI based smartphone application for diagnosis of
COVID-19 using chest X-ray images. Expert Syst. Appl. 2021, 183, 115401. [CrossRef] [PubMed]8. Yan, L.; Zhang, H.-T.; Goncalves, J.; Xiao, Y.; Wang, M.; Guo, Y.; Sun, C.; Tang, X.; Jing, L.; Zhang, M.; et al. An interpretable
mortality prediction model for COVID-19 patients. Nat. Mach. Intell. 2020, 2, 283–288. [CrossRef]9. Qiblawey, Y.; Tahir, A.; Chowdhury, M.E.; Khandakar, A.; Kiranyaz, S.; Rahman, T.; Ibtehaz, N.; Mahmud, S.; Al Maadeed, S.;
Musharavati, F.; et al. Detection and Severity Classification of COVID-19 in CT Images Using Deep Learning. Diagnostics 2021, 11,893. [CrossRef] [PubMed]
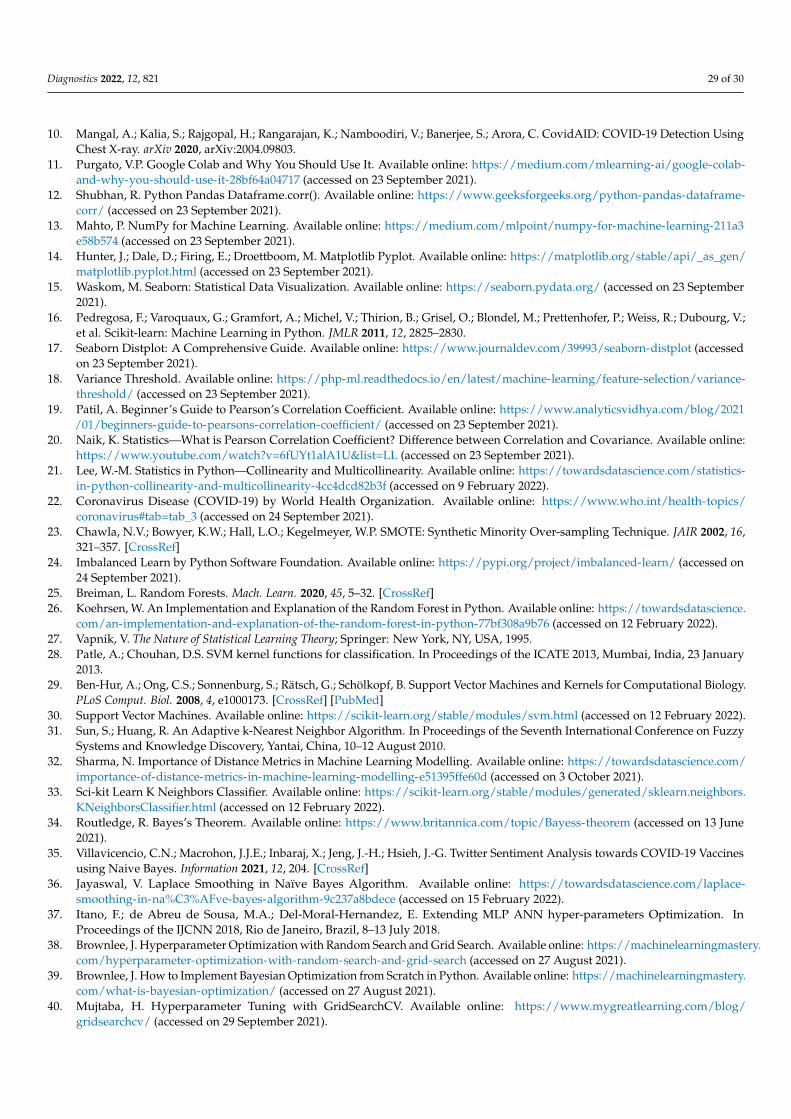
Diagnostics 2022, 12, 821 29 of 30
10. Mangal, A.; Kalia, S.; Rajgopal, H.; Rangarajan, K.; Namboodiri, V.; Banerjee, S.; Arora, C. CovidAID: COVID-19 Detection UsingChest X-ray. arXiv 2020, arXiv:2004.09803.
11. Purgato, V.P. Google Colab and Why You Should Use It. Available online: https://medium.com/mlearning-ai/google-colab-and-why-you-should-use-it-28bf64a04717 (accessed on 23 September 2021).
12. Shubhan, R. Python Pandas Dataframe.corr(). Available online: https://www.geeksforgeeks.org/python-pandas-dataframe-corr/ (accessed on 23 September 2021).
13. Mahto, P. NumPy for Machine Learning. Available online: https://medium.com/mlpoint/numpy-for-machine-learning-211a3e58b574 (accessed on 23 September 2021).
14. Hunter, J.; Dale, D.; Firing, E.; Droettboom, M. Matplotlib Pyplot. Available online: https://matplotlib.org/stable/api/_as_gen/matplotlib.pyplot.html (accessed on 23 September 2021).
15. Waskom, M. Seaborn: Statistical Data Visualization. Available online: https://seaborn.pydata.org/ (accessed on 23 September2021).
16. Pedregosa, F.; Varoquaux, G.; Gramfort, A.; Michel, V.; Thirion, B.; Grisel, O.; Blondel, M.; Prettenhofer, P.; Weiss, R.; Dubourg, V.;et al. Scikit-learn: Machine Learning in Python. JMLR 2011, 12, 2825–2830.
17. Seaborn Distplot: A Comprehensive Guide. Available online: https://www.journaldev.com/39993/seaborn-distplot (accessedon 23 September 2021).
18. Variance Threshold. Available online: https://php-ml.readthedocs.io/en/latest/machine-learning/feature-selection/variance-threshold/ (accessed on 23 September 2021).
19. Patil, A. Beginner’s Guide to Pearson’s Correlation Coefficient. Available online: https://www.analyticsvidhya.com/blog/2021/01/beginners-guide-to-pearsons-correlation-coefficient/ (accessed on 23 September 2021).
20. Naik, K. Statistics—What is Pearson Correlation Coefficient? Difference between Correlation and Covariance. Available online:https://www.youtube.com/watch?v=6fUYt1alA1U&list=LL (accessed on 23 September 2021).
21. Lee, W.-M. Statistics in Python—Collinearity and Multicollinearity. Available online: https://towardsdatascience.com/statistics-in-python-collinearity-and-multicollinearity-4cc4dcd82b3f (accessed on 9 February 2022).
22. Coronavirus Disease (COVID-19) by World Health Organization. Available online: https://www.who.int/health-topics/coronavirus#tab=tab_3 (accessed on 24 September 2021).
23. Chawla, N.V.; Bowyer, K.W.; Hall, L.O.; Kegelmeyer, W.P. SMOTE: Synthetic Minority Over-sampling Technique. JAIR 2002, 16,321–357. [CrossRef]
24. Imbalanced Learn by Python Software Foundation. Available online: https://pypi.org/project/imbalanced-learn/ (accessed on24 September 2021).
25. Breiman, L. Random Forests. Mach. Learn. 2020, 45, 5–32. [CrossRef]26. Koehrsen, W. An Implementation and Explanation of the Random Forest in Python. Available online: https://towardsdatascience.
com/an-implementation-and-explanation-of-the-random-forest-in-python-77bf308a9b76 (accessed on 12 February 2022).27. Vapnik, V. The Nature of Statistical Learning Theory; Springer: New York, NY, USA, 1995.28. Patle, A.; Chouhan, D.S. SVM kernel functions for classification. In Proceedings of the ICATE 2013, Mumbai, India, 23 January
2013.29. Ben-Hur, A.; Ong, C.S.; Sonnenburg, S.; Rätsch, G.; Schölkopf, B. Support Vector Machines and Kernels for Computational Biology.
PLoS Comput. Biol. 2008, 4, e1000173. [CrossRef] [PubMed]30. Support Vector Machines. Available online: https://scikit-learn.org/stable/modules/svm.html (accessed on 12 February 2022).31. Sun, S.; Huang, R. An Adaptive k-Nearest Neighbor Algorithm. In Proceedings of the Seventh International Conference on Fuzzy
Systems and Knowledge Discovery, Yantai, China, 10–12 August 2010.32. Sharma, N. Importance of Distance Metrics in Machine Learning Modelling. Available online: https://towardsdatascience.com/
importance-of-distance-metrics-in-machine-learning-modelling-e51395ffe60d (accessed on 3 October 2021).33. Sci-kit Learn K Neighbors Classifier. Available online: https://scikit-learn.org/stable/modules/generated/sklearn.neighbors.
KNeighborsClassifier.html (accessed on 12 February 2022).34. Routledge, R. Bayes’s Theorem. Available online: https://www.britannica.com/topic/Bayess-theorem (accessed on 13 June
2021).35. Villavicencio, C.N.; Macrohon, J.J.E.; Inbaraj, X.; Jeng, J.-H.; Hsieh, J.-G. Twitter Sentiment Analysis towards COVID-19 Vaccines
using Naive Bayes. Information 2021, 12, 204. [CrossRef]36. Jayaswal, V. Laplace Smoothing in Naïve Bayes Algorithm. Available online: https://towardsdatascience.com/laplace-
smoothing-in-na%C3%AFve-bayes-algorithm-9c237a8bdece (accessed on 15 February 2022).37. Itano, F.; de Abreu de Sousa, M.A.; Del-Moral-Hernandez, E. Extending MLP ANN hyper-parameters Optimization. In
Proceedings of the IJCNN 2018, Rio de Janeiro, Brazil, 8–13 July 2018.38. Brownlee, J. Hyperparameter Optimization with Random Search and Grid Search. Available online: https://machinelearningmastery.
com/hyperparameter-optimization-with-random-search-and-grid-search (accessed on 27 August 2021).39. Brownlee, J. How to Implement Bayesian Optimization from Scratch in Python. Available online: https://machinelearningmastery.
com/what-is-bayesian-optimization/ (accessed on 27 August 2021).40. Mujtaba, H. Hyperparameter Tuning with GridSearchCV. Available online: https://www.mygreatlearning.com/blog/
gridsearchcv/ (accessed on 29 September 2021).

Diagnostics 2022, 12, 821 30 of 30
41. Brownlee, J. Classification Accuracy Is Not Enough: More Performance Measures You Can Use. Available online: https://machinelearningmastery.com/classification-accuracy-is-not-enough-more-performance-measures-you-can-use/ (accessed on27 May 2021).
42. Ghoneim, S. Accuracy, Recall, Precision, F-Score & Specificity, Which to Optimize on? 2 April 2019. Available online: https://towardsdatascience.com/accuracy-recall-precision-f-score-specificity-which-to-optimize-on-867d3f11124 (accessed on 25 May2021).
43. Ul Haq, A.; Li, J.P.; Memon, M.H.; Khan, J.; Malik, A.; Ahmad, T.; Ali, A.; Nazir, S.; Ahad, I.; Shahid, M. Feature Selection Basedon L1-Norm Support Vector Machine and Effective Recognition System for Parkinson’s Disease Using Voice Recordings. IEEEAccess 2019, 7, 37718–37734. [CrossRef]
44. Narkhede, S. Understanding AUC-ROC Curve. Available online: https://towardsdatascience.com/understanding-auc-roc-curve-68b2303cc9c5 (accessed on 25 September 2021).
45. Forcier, J.; Bissex, P.; Chun, W.J. Python Web Development with Django; Addison-Wesley: Boston, MA, USA, 2009.46. Bootstrap: The Most Popular CSS, and JS Library in the World. Available online: https://getbootstrap.com/ (accessed on 25
September 2021).47. PyCharm Features. Available online: https://www.jetbrains.com/pycharm/features/ (accessed on 26 September 2021).48. Kachur, L. 5 Reasons Why Devs Love GitHub (and Microsoft Buys It). Available online: https://dzone.com/articles/5-reasons-
why-devs-love-github-and-microsoft-buys (accessed on 26 September 2021).49. What Is Azure? Available online: https://azure.microsoft.com/en-us/overview/what-is-azure/ (accessed on 26 September
2021).