DEVELOPMENT INTERACTIONS Edited by John I Clarke and ...
432
POPULATION - ENVIRONMENT - DEVELOPMENT INTERACTIONS Edited by John I Clarke and Léon Tabah Vue de HONG-KONG 1995
-
Upload
khangminh22 -
Category
Documents
-
view
0 -
download
0
Transcript of DEVELOPMENT INTERACTIONS Edited by John I Clarke and ...

POPULATION - ENVIRONMENT - DEVELOPMENT
INTERACTIONS
Edited by
John I Clarke and Léon Tabah
Vue de HONG-KONG
1995

POPULATION - ENVIRONMENT - DEVELOPMENT
INTERACTIONS
Edited
by
John I Clarke and Léon Tabah
1995


LIST OF CONTENTS
Chapter Page
Editors' Preface
Foreword by Philippe Collomb
List of Contents
List of Figures
1 John Clarke: Introduction 11
I. CONCEPTS, THEORIES AND METHODS OF ANALYSIS
2 Léon Tabatr. Les interrelations population- 33environnement-développement: état de la question etperspectives.
3 Nathan Keyfitz. Building a productive, equitable and 67sustainable society: a three-key opening to assured andcontinuing development.
4 Marc Debuisson et Michel Poulain: Pression des 83populations humaines sur l'environnement: aspectsdémographiques dans les pays occidentaux.
5 George Martine: The relations between population and 95environment in the context of globalization: preliminaryconsiderations.
6 Jean-Philippe Peemansr. Population and environment in 117the 1990s: the need for a substantive development link.
7 Wolfgang Lutz. Analyzing the role of population 137parameters in sustainable national development andoptions for influencing them.
8 Michel Picouet Méthodes et analyses de la relation 167population-milieux naturels dans les campagnes: leprogramme DYPEN en Tunisie.
II. POLLS, PERCEPTIONS AND POUCIES
9 J. Mayone Stycos: Population and environment: polls, 181policies and public opinion.
10 Ismael Sirageldirr. Population dynamics, environment and 205conflict. What are the connections?
11 Ligia Gonzalez Garcia de Alba: Spatial population 227distribution in Mexico: strategic micro-regions andenvironmental characteristics.

12 Daniel Hogarr. Population and environment in Brazil: a 245changing agenda
13 Keshari Thapa and Richard Bilsborrow. Frontier migration 253and the environment in developing countries: the policycontext and research issues.
14 Hyacinth I. Ajaegbir. Local community approach to the 273study of population-environment interrelationships anddisharmony: the relevance for Africa.
III. MORTALITY AND HEALTH IN URBAN ANDINDUSTRIALIZED ENVIRONMENTS
15 Daniel Noin: Mortality and the environment: observations 289on the geography of mortality.
16 Alina Potrykowska: The effects of environmental pollution 307for population in Poland.
17 Parveen Nangia, Kamla Gupta, T.K. Roy and Rajiva 325Prasad Health and perception of people about pollutionaround the industrial zone of Bombay.
18 Sudesh Nangia: Slums and the urban environment: Study 339of a squatter settlement in Delhi.
19 Djuhari Wirakartakusumah: How migrants perceive 349environmental conditions: a case study in Jakarta, Bogor,Tangerang and Bekasi, Indonesia.
IV. SOME POPULATION - ENVIRONMENT -DEVELOPMENT PROBLEMS
20 Hassan Musa Yousif. Rural population settlements and 361the environment in Central Sudan.
21 Basia Zaba and Hilda Kiwasila: Domestic water supply 377trends in Tanzania* rural and urban contrasts.
22 Riga Adiwoso Suprapto: The dynamics of land use and 403land cover change as a manifestation of population-development-environment linkage: work in progress inIndonesia.
23 Maurice D. Van Arsdol Jr. Douglas J. Sherman, Angela 413Constable, Jinkang Wang and Louise Rollin: Impacts ofglobal sea level rise on California coastal populationresources.

EDITORS' PREFACE
This volume arises from the second conference on the important contemporary themeof 'Population and Environment' organized by the Comité International de Coopérationdans les Recherches Nationales en Démographie (CICRED) with the support of theInternational Union for the Scientific Study of Population (IUSSP) Committee onPopulation and Environment and the International Institute for Applied SystemsAnalysis (IIASA). The conference was held during two and a half days from 24 to 26November 1993 at IIASA in Laxenburg, Austria.
This book is not a report of the conference. The conference was specifically designedfor the participants to present papers on the research progress made by theirdemographic centres on the theme of population and environment during the two yearssince the first CICRED conference on 'Population and Environment' held during 7-9November 1991 at the Universite Catholique de Louvain-la-Neuve, Belgium (seeCICRED, Population and Environment, Paris, 1992, 63pp.). Although the chapters inthis book have been written by some of the 31 participants at the Laxenburgconference, including all members of the IUSSP Committee, not all of the participantshave contributed chapters. Moreover, most chapters reflect individual concepts andresearch rather than the work of their research centres, which vary greatly in size,orientation and disciplinary complexity. In consequence, it is hoped that the volumehas more coherence than a mere conference report.
On the other hand, recognition has to be given to the stimulus of the conference held atthe excellent headquarters of IIASA at Laxenburg and admirably arranged by WolfgangLutz as local organizer ably supported by Marilyn Brandi and Judith Albert. Léon Tabahacted as President of the conference and John Clarke as Co-ordinator - hence theireditorial responsibilities. Of the 31 participants, seven were from the active population-development-environment research group at IIASA, five from the USA, three fromCICRED, two each from Belgium, Brazil, France, India, Indonesia and the UnitedKingdom, and one each from Mali, Mexico, Poland and Sudan. About one-half of theparticipants had attended the Louvain-la-Neuve meeting, but geographical distributionof participants was not quite the same as unfortunately for various reasons inviteesfrom four other countries were unable to attend. To everyone involved in theconference, the editors express their heartfelt thanks for their cooperation andcollaboration, and hope that this volume is a useful contribution to the growingliterature on population-environment-development interrelationships.
The editors wish to give their special thanks to Mayssa Powell of the Centre forOverseas Research and Development (CORD), Geography Department of DurhamUniversity who undertook the arduous secretarial task of harmonizing the varioussubmitted texts, and to Arthur Comer, David Hume and Steven Allan of the sameDepartment who improved greatly a number of the figures. They are also most gratefulto Hartati Ayral of CICRED for all her help in facilitating the two conferences and thisvolume.
John CLARKE and Léon TABAH
November, 1994

AVANT PROPOS
La relation entre population environnement et développment est d'une telle complexitéque le sujet même est fréquemment négligé, sous prétexte que des relations simpleset stables ne peuvent être clairement décelées. Le sujet tend à être négligé alorsmême que la conciliation entre croissance démographique encore rapide etdéveloppement véritablement durable est un défi majeur des prochaines décennies.Les ressources en patrimoine génétique, en terre et en eau suffiront-elles poursatisfaire les besoins des générations futures? La croissance économique que lespays en développement souhaite la plus forte possible ne risque-t-elle pas d'aggraversérieusement la dégradation de l'environnement ? Le progrès technique, qui a permisd'échapper à la «< trappe malthusienne » ne génère-t-il pas lui-même d'autresproblèmes écologiques? Autant de questions auxquelles l'humanité est confrontée etdoit apporter des « réponses » c'est à dire des actions susceptibles d'infléchir destendances lorsqu'elles s'avèrent inquiétantes.
La complexité des relations entre population environnement et développement tientnotamment à l'existence de nombreuses interactions, à la sensibilité des relations àl'échelle d'observation, à l'importance du contexte et des comportements face à laproduction et à la consommation. On ne peut ignorer que la croissance démographiquerapide accroît la pression sur l'environnement mais les sociétés gèrent de diversesmanières cette pression. La qualité des sols et leur plus ou moindre grande fragilité,notamment, permettront un accroissement plus ou moins important des densités. Lesrelations entre population et développement ne se présentent pas dans les mêmestermes à une échelle locale et globale. Le lien entre accroissement de la population,pauvreté et deforestation peut être clairement établi dans un espace donné sans queles conséquences pour l'environnement global de la deforestation puissent êtrevraiment précisées. Les modes de production et de consommation déterminent l'effetfinal sur l'environnement d'une multiplication des habitants de la planète. Selon le typede progrès technique incorporé à la croissance économique, selon le degréd'urbanisation et ses formes, un équilibre population-ressources respectueux del'environnement sera maintenu plus ou moins aisément dans les différents pays dumonde.
Sujet complexe à l'origine d'un défi majeur, les relations entre populationenvironnement et développement doivent faire l'objet d'une expertise renforcée. C'estd'ailleurs ce que recommande Y Agenda 21 dans son chapitre V. Le CICRED ne peutpar conséquent que se réjouir de la publication de réflexions riches et diverses sur cethème. Et ceci d'autant plus que ce thème figure parmi les « orientationsdémographiques prioritaires » qu'il s'est définies pour les prochaines années.
Cet ouvrage qui aborde le thème population, environnement et développement d'unemanière intégrée est une contribution d'importance. Il ouvre de nombreuses pistesprometteuses pour l'avenir.
Philippe COLLOMB et Jacques VERON

LIST OF FIGURES
John I Clarke:
Fig. 1. Model relating P-E to development. Natural resources, together with otherfactors, enter the production process. Population affects directly consumptionand labour.
Fig. 2. Model identifying the relationships between population dynamics andenvironment, some of which are direct and others indirect through a complexsystem of intermediate variables and mechanisms.
Marc Debuisson et Miche! Poulain:
Fig. 1. Un schéma conceptuel simple de l'interaction entre la population etl'environnement.
Wolfgang Lutz:
Fig. 1. Determinants and basic characteristics of changing population patterns by age,sex and place of residence.
Fig. 2. Basic structure of the population model with seven states for women. For menit is identical except for births.
Fig. 3. The "box approach" to studying population and environment.
Fig. 4. Population embedded in a socio-economic sphere and in environment.
Fig. 5. Basic structure of the general PDE model.
Fig. 6. Total fertility rate, per capita income and population size in Mauritius, 1950-1990.
Fig. 7. Annual domestic freshwater resources per person and per kmz in Mauritius anda variety of other countries.
Fig. 8. Relationship between per capita income and fertility in a sample of developingcountries (1970-1990) and in Mauritius (1950-1990).
Fig. 9. Relationship between female literacy rates and total fertility rates in a sample ofdeveloping countries with a total fertility rate above 6.0 in 1950 (1950-1990).
J. Mayone Stycos:
Fig. 1. "Sociofile" citations: population, environment and totals (1974-91), compiledfrom Soc/o//7e(Silverplatter), April 1993.
Fig. 2. "Popline" citations: population, environment and totals (1974-91), compiledfrom Popline (Silverplatter) April 1993.
Ismael Sirageldin:
Fig. 1. Recent changes in fertility rates in some developing countries, after Robey,Rutstein and Morris, 1993.
Fig. 2. Projected age structures of India, 1995 and 2025, after UN, 1993.

Fig. 3. Some sources and consequences of renewable resource scarcity, afterHomer-Dixon, Boutwell and Rathjens, 1993.
Fig. 4. The role of population dynamics in the Philippines, after Homer-Dixon,Boutwell and Rathjens, 1993.
Ligia Gonzalez Garcia de Alba:
Fig. 1. Principal interstate migratory flows in Mexico 1965-70, produced by CONAPObased on INEGI. IX Censo general de población y vivienda, 1970.
Fig. 2. Principal interstate migratory flows in Mexico 1985-1990, produced byCONAPO.
Fig. 3. Population density in Mexico, 1990. Sources: OSIC, IX Censo general depoblación 1970; INEGI, XI Censo general de población y vivienda 1990.
Fig. 4. Micro-regions in Mexico with capacity to absorb population. Source: CONAPO,Sistema de Ciudades y Distribución Espacial de la Población en Mexico. Temo1, Mexico, 1992.
Fig. 5. Micro-regions in Mexico with capacity to retain population. Source: CONAPO,ibid, 1992.
Fig. 6. Micro-regions with critical capacity to retain population. Source: CONAPO,ibid, 1992.
Fig. 7. Priority macro-regions for attracting and maintaining population. Source:CONAPO, ibid, 1992.
Fig. 8. Climatic zones of Mexico. Sources: CONAPO, ibid, 1992; Poder Ejecutivo.Federal. Programa Nacional de Ecología 1984-1988, Mexico, 1994.
Hyacinth I. Ajaegbu:
Fig. 1. Schema of the phases of P-E relationships in African local communities.
Daniel Noin:
Fig. 1. Number of casualties due to earthquakes, 1970-90. Source: Paucton, 1992.
Fig. 2. Number of casualties due to volcanic eruptions, 1900-90. Source: Paucton,1992.
Fig. 3. Number of casualties due to violent atmospheric phenomena, 1970-90.Source: Paucton, 1992.
Fig. 4. Number of casualties due to floods, 1970-90. Source: Paucton, 1992.
Fig. 5. Number of casualties due to landslides, 1970-90. Source: Paucton, 1992.
Fig. 6. Number of casualties due to avalanches, 1970-90. Source: Paucton, 1992.
Fig. 7. Number of victims due to natural disasters since 1900. Source: Paucton, 1992.
Fig. 8. Male standardized mortality index from (a) respiratory diseases and (b) silicosisin the Nord-Pas-de-Calais region, France, 1979-86. Regional average = 1. •non-significant figure. Source: Lacoste, 1990.
Fig. 9. Standardized mortality rate from lung cancer for (a) males and (b) females inseveral European countries, 1974-78. Source: Lange, 1992.
8

Fig. 10. Standardized mortality rate from cancer of the oesophagus for (a) males and(b) females in several European countries, 1974-78. Source: Lange, 1992.
Alina Potrykowska:
Fig. 1. Hazardous environmental pollution in Poland. Source: Rolewicz, 1993.
Fig. 2. Crude death rates, Poland, 1950-90. Source: Various DemographicYearbooks, Warsaw, GUS.
Fig. 3. (a) Standardized death rates Poland, 1988, and (b) Deaths per 100,000inhabitants.
Fig. 4. Transboundary pollution of SO2 in Poland. Average annual concentration, 1978.Source: Carter, 1989.
Fig. 5. Environmental protection in Poland. Source: Regional Policies in Poland, 1991.
Fig. 6. "Green lungs" of Europe. Source: Degorska, 1993.
Parveen Nangia et al.:
Fig. 1. Residential population density in big grids (weighted average density) in 5kmzone around Rashtriya Chemicals and Fertilizers (RCF), Greater Bombay,October 1990.
Hassan Musa Yousif:
Fig. 1. Main ecological zones and average rainfall in Sudan.
Basia Zaba and Hilda Kiwasila:
Fig. 1. Regression of growth in the number of rural area households with an internalwater supply or a piped supply of any kind against total household growth.
Fig. 2. Regression of growth in the number of urban area households with an internalwater supply or a piped supply of any kind against total household growth.
Maurice D. Van Arsdol et al.:
Fig. 1. California coastal counties, by definitions of the U.S. National Oceanic andAtmospheric Administration (NOAA).
Fig. 2. Decennial population growth of State of California and coastal counties:enumerated 1940-90 and projected 2000-40.
Fig. 3. Median rent and housing unit value, and household income by coastal censustracts, non-coastal census tracts and 20 coastal counties, California, 1970-90.
Fig. 4. California coastal population: enumerated 1940-90 and projected 2000-40.
Fig. 5. Enhanced risk zone and Oxnard plain, Ventura County, California, 1994.


CHAPTER 1
INTRODUCTION
John I. Clarke(North Durham Health Authority, U.K.)
As mentioned in the Preface, this volume follows from two international conferencesabout research into the interrelationships between population and environment, atwhich researchers from many different demographic centres around the worlddiscussed research fields and research progress. Some of the papers presented areincluded in this volume; other papers are individual studies reflecting personalapproaches rather than collective research. It is worthwhile, therefore, to record howunderstanding about this research field evolved during the two CICRED conferences.
1. Recap of Louvain-la-Neuve Conference
1.1. Background Issues
The meeting organized by CICRED at Louvain-la-Neuve in Belgium in November1994 explored the vast diversity of population-environment (P-E) interrelationshipswithin the world, which may be examined at a variety of levels from the local to theglobal (CICRED, 1992). P-E diversity arises from the multiplicity of populations withdiffering distributions, densities, dynamics and compositions; and the plethora ofenvironments, reflecting the varying influences of factors such as continentality,latitude, altitude, climate, vegetation, geology, soils, slope and drainage. The P-Ediversity also arises from a considerable number of intervening political, social andeconomic variables (e.g. policies, cultures, technology, institutions, development,consumption, trade) whose variations greatly affect the perceptions and utilization ofenvironments by populations.
Stress was laid on the two-way nature of P-E relationships - that environmentinfluences population and that population influences environment - although this is asimplistic view. With the passage of time, there has been great growth in population,technology, consumption and human-induced environmental changes overtaking - inthe more developed world at least - many of the environmental constraints imposedupon humanity. Low densities and low consumption of early societies had localimpacts, responding to environmental conditions more than altering their environments.With the growth of agriculture, industries, transportation, energy use, services, citiesand population, human impacts have been transformed not only locally but alsoglobally. The evolution of a global economic system with transcontinental movement ofresources has greatly affected the global ecosystem, its lands, seas, atmosphere andbiosphere.
Since the middle of this century, the growth of global awareness, arising from dramaticchanges in transportation, telecommunications, transnational production, trade, travel
11

and tourism (Alger, 1988) and the emergence of the space age, has attractedmankind's attention to global issues - world population growth, urbanization, ruraldepopulation, income inequalities, gender inequalities, environmental degradation,ethnic conflicts, and flows of refugees - and increasingly on the interrelatedness ofprocesses and phenomena, in particular global environmental change (GEC). Scientificattention has been focused upon the main disturbances in natural physical systemsand their potential effects (Jacobson and Price, 1990) - climate change, ozonedepletion, acid rain and loss of biodiversity - as well as on the human systems causingsuch phenomena: fossil fuel consumption; biomass fuel consumption; land usechange; agricultural activities and halocarbon production and release. Public attention,however, has often been drawn to the links, sometimes direct but generally moreindirect, between population growth and environmental change although the links haveoften been portrayed in a facile and over-simplified manner. It is the exploration ofthose complex links which was the focus of our attentions at Louvain-la-Neuve,especially as the interrelationships of demographic, economic and ecologicalprocesses have been inadequately researched.
The global rates of population growth and development - aggregates of immenselydiverse local rates - are now so rapid that there is much anxiety about the future, whenthe pressures of population upon the environment will be much greater. One certaintyis that there can be no simple correlation between population, development andenvironment, as their patterns have diverse influences and there are considerabledifficulties of scale linkage. Whereas demographic transition in more developedcountries (MDCs) was associated with rapid economic development, especiallyindustrialization and urbanization, in less developed countries (LDCs) it has been lesscaused by economic development than by social and political factors. On the otherhand, many of the major environmental problems in the world today arise from theenormous resource demands of the MDCs or from upsetting the delicate balancebetween population numbers and many fragile environments in LDCs, particularly thearid and semi-arid lands, tropical forests and over-populated mountains and coastalzones, where natural or man-made disasters are common.
1.2. Proposed Research Fields
With this background in mind, at Louvain-la-Neuve there was wide-rangingdiscussion by CICRED centres about research themes in P-E interrelationships; fromthose who emphasized the need to focus upon the environmental impact upondemographic dynamics to those who considered that the key issues, which had beenmuch neglected, were demographic influences upon the environment. An intermediategroup stressed the need for integrated approaches, and that the field necessitatedinterdisciplinary research. In general, it appeared that previously CICRED centres hadanalyzed more the effects of population upon environment than the environment uponpopulation.
In his introductory note as Coordinator of the conference, John Clarke had submittedan initial list of proposed broad research fields:
12

1. P-E data issues
2. Population concentration
3. Identification and analysis of P-E crisis areas
4. P-E relationships in settlement systems
5. Migration in P-E relationships
6. Health and environmental degradation
7. Fertility and the environment
8. Women and children in the environment
Although by no means a comprehensive taxonomy of research areas, it provided abasis for discussions, especially as most were already being tackled by the smallsample of CICRED centres represented at Louvain-la-Neuve. However, discussantsamplified this list by an even longer one:
1. P-E modelling
2. P-E policies
3. P-E education
4. Environmental quality and quality of life
5. Perception of P-E relationships
6. P-E relationships in historical perspective
7. Impact assessment of positive and negative, planned and unplanned effectsof P-E relationships
8. Analysis of energy/water consumption in P-E relationships
9. P-E projections
10. P-E sanitation and community health
11. P-E relationships under different occupational and family systems
12. Field analyses of the Malthusian and Boserupian hypotheses
Views about these 20 proposed P-E research areas were varied, and in the course ofdiscussions a number of notable general points were made:
- importance of the time dimension;- crisis and long-term issues should be examined under the 3 key demographic
variables: fertility, mortality, migration;- crisis issues are region and country-specific;- regional strategies should be in the context of global strategies;- researchers should be aware of planning strategies for both population and
environment;- concept of sustainable development important, but not easily defined;- large-scale modelling not very useful;- need to define demo-ecological indicators;- emphasis should be given to micro-studies of P-E relationships;- methodology required with both quantitative and qualitative approaches, a
theoretical framework and guidance on use and acquisition of data; and- literature review necessary.
13

Eventually, it was decided to give further consideration to three broad researchthemes:-
A. theoretical framework and methodology
B. crisis issues
C. long-term issues
which were examined in more detail by three working groups.
A. The group concerned with theoretical framework and methodology produced anumber of descriptive analytical models in particular (a) relating P-E todevelopment (Fig. 1) and (b) identifying the relationships between populationdynamics and the environment (Fig. 2). They also proposed the following threegroups of research issues:
1. Population, territorial distribution and environment: concentration, settlementsystems, in-migration and out-migration, coastal areas, communities, etc.
2. Population, development and environment: the impact of work processesand technologies in the primary, secondary and tertiary sectors.
3. Population, welfare and environment: education, communication, health,nutrition.
B. The working group looking at crisis issues distinguished between the macro,meso and micro levels, pointing out that micro-level issues can escalate tohigher levels.
They also grouped them into six broad categories according to their relatedness:
1. Mega-cities and conurbations
2. Natural disasters and catastrophes
3. Drought and desertification
4. Deforestation
5. Agriculturally caused disasters
6. Global issues
They suggested that these issues should be studied with a view todetermining how populations contribute to the processes involved in theissues through their size, growth, concentration etc. and how they are affectedby and respond/adapt to catastrophes and disasters. The first four wererecommended as key crisis issues for proposed research by CICRED centresalong with the growth of contrasting consumption patterns.
C. As for the Working Group looking at long-term research issues in P-Erelationships, they found the Malthusian and Boserupian positions central to theirdiscussions but some found these too dichotomous and polarized. They went onto specify seven themes, examining the effects of:
1. Rising population on land management and agricultural productivity
2. Rising population on water management and availability
3. Climate changes on long-term population distribution
4. Migration and urbanization on the environment
14

5. Environmental change on migration6. Pollution and environmental degradation on maternal and child morbidity
and mortality
7. Population growth on local biodiversity through increasing cropspecialization and/or loss of wildlife habits.
15

EXTERNALINFLUENCES
> f y
ECOSYSTEMWITH LIMITED
REGENERATINGCAPACITY
POLICY RESPONSES ATVARIOUS LEVELS :
International, national, local
ALLOCATION OF OUTPUTConsumptionInvestmentEnvironmental protection
PRODUCTIONNatural resourcesCapitalTechnologyLabourOrganisations POPULATION
CONSUMPTIONStandard of LivingPopulation
E X T E R N A L I T I E S
Fig. 1. Model relating P-E to development. Natural resources, together with otherfactors, enter the production process. Population affects directly consumptionand labour.
16

P O P U L A T I O N D Y N A M I C S
Fertility Health Migration Size
-t—f-DemographicResponses
POLICY
Distribution Structure
PROXIMATE P-E RELATIONSTerritorial DistributionDevelopmentWelfare
OTHER DETERMINANTSEconomieSocialCultural
DemographicConsequences
N A T U R A L R E S O U R C E S
Air Water Land Energy
E n v i r o n m e n t a l c o n c e r n s
Fig. 2. Model identifying the relationships between population dynamics andenvironment, some of which are direct and others indirect through a complex systemof intermediate variables and mechanisms.
17

These various research themes identified at Louvain-la-Neuve were recommended toCICRED centres interested in P-E research, without of course being mandatory.Some were already being studied, and in addition the IUSSP Committee onPopulation and Environment, which was well represented at Louvain-la-Neuve, hadalready decided that apart from its overall concerns with P-E relationships, exploredat its joint meetings with the British Society for Population Studies (BSPS) at Londonand Oxford in 1991 and 1992 respectively (Zaba and Clarke, 1994) and subsequentlyat Montreal in 1993, it would examine particularly the following:
1. Population and deforestation (Campinas seminar, 1992)
2. Population and environment in arid regions (Amman seminar, 1994)
3. Population and environment in heavily industrialized regions (Warsaw/Cracovseminar, 1994)
4. Gender-environment issues (Dakar seminar, 1993 and Oaxaca seminar, 1994in collaboration with the IUSSP Committee or Gender and Population).
Moreover, some members of the IUSSP Committee were also involved in theInternational Social Science Council (ISSC). Working Group on Population Data andGlobal Environmental Change which had been commissioned to look at the manifoldproblems of linking population and environmental data (Clarke and Rhind, 1992).
2. Other Major Issues
Although wide-ranging and a considerable stimulus to research activity in the field ofP-E relationships, the Louvain-la-Neuve conference was not exhaustive of such abroad research field, partly because CICRED centres tend to have specificallynational viewpoints, and partly because the debate is constantly moving on. Infocusing upon research topics, a number of major issues received relatively littleattention in these discussions, given their importance in the literature. Such issuesinclude:
- diversity of human impacts upon the environments;- population and disasters, discontinuities and limits;- population and resource depletion;- the concept of sustainable development; and- poverty and the environment.
2.1. Diversity of Human Impacts on Environment
Among demographers concerned with P-E relationships, there is perhaps aninevitable tendency to focus upon a few of the more striking examples of GEC, andthis was so even at the Louvain-la-Neuve meeting. However, the range, variety andlocal/regional/global significance of human impacts upon the environment isimmense. Not all are negative, and not all may be lumped under the crude umbrellaof 'environmental degradation', which is usually undefined and often ambiguous.Some of the more important impacts are listed below, amplifying an initial list madeby Goudie (1984:312-3):
18

- Animal and plant dispersal- Animal and plant domestication- Reduced biodiversity- Conservation of species- Tropical deforestation and secondary rainforest formation- Origin of mid-latitude grasslands and savannas- Expansion of deserts- Development of Mediterranean scrub- Soil erosion- Tropical soil infertility- Salinization of soils through irrigation- Altered infiltration rates- Groundwater depletion- Changes in river flows, flooding, channels and sediment- Water shortages- Pollution of rivers, lakes, seas and oceans- Eutrophication of lakes- Rising sea levels- Global warming- Ozone depletion- Acid rain- Atmospheric pollution- Urban heat islands- Waste disposal- Quarrying and mining- Land subsidence- Initiation of mass movement on slopes- Coastal erosion and deposition
The impact of humanity, whether deliberate or inadvertent, is not the only cause ofsuch environmental changes. Environments are constantly changing, but vary insensitivity and the changes take place over millions of years. Human impact isgeologically recent, but its acceleration has been recorded arid analyzed in detail onlyduring the last few decades when improved instrumentation has become available. Notsurprisingly, therefore, environmental data are historically limited, and it is difficult todetermine the relative significance of human and natural causes in changing theenvironment. As Goudie (1984: 314) has emphasized, different processes can lead tothe same result - the principle of equifinality - and he gives examples of pavements,pediments and desert crusts.
Goudie (1993) has also emphasized the huge areas of uncertainty about futureenvironmental change particularly in biodiversity, atmospheric chemistry and climaticchange. He finds the roots of this uncertainly in a variety of factors:
- complexity of natural systems;- existence of thresholds and non-linear response to change;- imperfection of models (e.g. general circulation model);- lack of knowledge about background levels and trends of various phenomena;- potential role of catastrophic or extreme events;- potential role of unsuspected mechanisms (like CFCs);
19

-problem of predicting crucial factors (e.g. precipitation) which affect otherenvironmental phenomena; and
- problems of definition (e.g. deforestation, desertification).
An immense effort is being made to reduce this uncertainty by new models, improvedobservations and increased research, but perhaps Glantz (1993) is correct when heasserts that "there will always be scientific uncertainty surrounding environmentalissues". Hence the debates surrounding the quantitative projections concerning suchissues as global warming, ozone depletion and desertification as well as the earth'slimits to population growth.
2.2. Population and Disasters, Discontinuities and Limits
Although some consideration was given to the topic of disasters at Louvain-la-Neuve,its significance was perhaps rather neglected given that the 1990s have been declaredby the United Nations as the International Decade for Natural Disaster Reduction(IDNDR).
Disasters are not readily definable, but generally they are accepted as suddencatastrophes affecting human life. Unfortunately, there is no widely accepted definitionof the time-scale or size of such catastrophes (Clarke, et al., 1989).
Environmentalists have laid great stress upon natural hazards, such as earthquakes,volcanoes, hurricanes, tidal waves and droughts. Disasters, however, result not onlyfrom environmental extremes but also from a large number of human actions -technological, social, economic and political - affecting the environment to a greater orlesser extent: warfare, over-cultivation, overgrazing, deforestation, excess populationpressure, pollution, mining, quarrying, etc. Frequently, a combination of variousenvironmental and human factors trigger disasters, as for example in the Sahel of WestAfrica, the Horn of East Africa, the deltas of Bangladesh and the mountains of Nepalwhere populations are poor and ecosystems are particularly fragile.
Disasters vary greatly in their human cost, and generally man-made disasters aremuch more devastating and more widespread than natural disasters. They are alsomore common, not only because we hear and see them more often on our televisionscreens, but also because population growth and technological change have putpressure on places incapable of sustaining it.
This has led to the concepts of environmental discontinuities/thresholds at which thereis an abrupt "downturn in the capacity of environmental resources to sustain humancommunities at current levels of well-being" (UN/ESC/E/CONF.84/PC/4), and there isa 'jump effect' whereby the ecosystem becomes severely disrupted. The effects of acidrain upon coniferous forests and fresh-water systems in Europe and North Americaare cited as examples. Fuelwood shortages affecting perhaps a billion people indeveloping countries are another.
Discontinuities naturally raise the vexed question of limits, so heatedly discussedusually at the global level, partly because they are easier to examine in a closedsystem than in an open one. Generally limits have been discussed in terms ofeconomic viability rather than environmental degradation; the ability of an area tosupport a population with the resources available. Hence the terms 'optimum
20

population* and 'overpopulation* have been popularly and loosely used, speciallybeloved by those who see things as clear-cut.
The concept of 'carrying capacity' is also concerned with limits, and is often referred toas critical carrying capacity. Derived from the work of biologists, the concept has cometo mean not merely population-supporting capacity but also population-sustainingcapacity, i.e. the ability of an area to sustain a population over a long period withoutmajor environmental discontinuities or irremediable damage to the environment. Inshort, the concept has become more environmental and less economic. It is suggestedthat populations must learn to live off the 'interest* of environmental resources ratherthan their 'principal' (UN/ESC/E/CONF.S^PCM), because particularly in many parts ofthe developing world rapid population growth means that carrying capacities areexceeded, especially where renewable resources like fisheries and forests, upon whichthere is heavy dependence, are not easily replaced.
Carrying capacities have been frequently calculated for the world as a whole, but thediversity of findings - from 7.5 to 50 billion - is so great that they are regardedscientifically with much scepticism. At a much more local scale, calculations have beenoften made for rural populations in developing countries heavily dependent uponagricultural production and natural resource stocks, whose depletion could causeproblems. More difficult is the calculation of carrying capacity for countries, becausethe growth of the global economy has made them, especially the MDCs, less and lessdependent upon their own resource stocks and more and more upon those of the restof the world; the G7 countries and the 'tigers' of the Pacific rim are obvious examples.Many rich countries (e.g. Japan, UK) have relatively few natural resources, while manypoor countries have many (e.g. Sudan, Zaire).
Resource depletion is therefore a global problem, an aggregation of growing resourceuse and misuse, and cannot easily be related to population at national level as neitherresources nor populations are really constrained.
2.3. Population and Resource Depletion
Another reason why the ratio of population growth to resource depletion is not a simpleone is that resources acquire economic significance only as a function of technologicalknowledge. That knowledge has increased phenomenally, especially since theIndustrial Revolution, and it constantly gathers speed. Increased technology has led togreat expansion of the resource base as non-renewable and renewable resources arebrought into use; changes in energy demand and use exemplify this well, as seen inthe movement from fuelwood to wind and water power, coal, hydro-electric power, oil,solar power and nuclear power. Increased technology has also been associated withdematerialization (i.e. the substitution of bulky and costly materials throughsophisticated design methods), increased technical efficiency (e.g. engines) and theproduction of new materials (e.g. polymers). In particular, during the past few decadesimmense progress has been made in reducing the relative amount of energy neededfor economic growth, especially in the MDCs but also in a number of LDCs like China,Brazil and the Philippines.
In consequence, strategic technologies are gradually replacing strategic materials inthe MDCs, where heavy infrastructures are well developed; in most LDCs, however,
21

where basic infrastructures are limited, the demands for development are different, forthey need both the technologies and the materials. Inevitably, there is a considerableproblem of technology transfer, but the effort to raise the living standards of the rapidlygrowing populations of the LDCs will pose major problems of resource provision anddepletion.
Energy efficiency improvement is vital to reduce pressures on environments withminimal net economic or social cost. There are, however, great variations fromimproving the efficiency of a power plant to that of household energy use, and usuallythere are greater short-term benefits to poorer people in effecting the latter. Certainly,the whole field of energy efficiency is vital, not only in the context of resource depletionand environmental degradation but also in the development of the developingcountries.
2.4. The Concept of Sustainable Development
Although widely used, the terms sustainable development, sustainable use andsustainability received scant attention at Louvain-la-Neuve despite (or perhapsbecause of) their fashionability. Sustainable development is of course a grand ideal,but is sometimes scorned or discarded as too vague and ambiguous. It is ratherelusive of quantifiable definition - globally, nationally, locally and for specific resources- and so putting it into practice is difficult. Unfortunately, individual, community,national and global interests tend to conflict, and too often society at large pays for thepollution and self-interest of the few.
Different specialists also have different views about what is to be sustained. Whilebiologists stress the preservation of the environment and biosphere, economists stresseconomic growth and consumption levels, and sociologists stress demands on theenvironment that are culturally determined. Thus, some interpretations are moreenvironmental than others.
The great value of the concept is that it may be an integrative approach requiring awhole basket of measures, among which efforts to reduce fertility rates are vital,especially through improving the social status, health and education of women. AsTetrault (1992: 31-5) has stated for the Canadian International Development Agency(CIDA), "establishing a sustainable relationship between people, resources,environment and development hinges upon several commitments such as:
- Tackling poverty and the debt issue- Planning the human family- Investing in people- Achieving food security and preserving soils and forests- Caring for biodiversity, water and oceans- Making sound energy choices".
2.5. Poverty and the Environment
Poverty is a major factor in P-E relationships in developing countries, at every levelfrom the individual and household upwards. A great deal of environmental degradationin the LDCs results from poor people searching for the basic essentials of life: food,
22

water, fuel and fodder. In growing numbers they are pressing upon the margins,destroying the resources upon which they depend and assisting in the processes ofsoil erosion, desertification, deforestation and water shortage. In the least developedand poorest countries, notably of Sub-Saharan Africa, poverty is a critical factor in
* out-migration to cities and in environmentally induced migration, sometimes calledenvironmental/ ecological/resource refugees, though none of these concepts has anystanding in international law (Richmond, 1993). The poor also suffer from unhealthyenvironments, lacking adequate sanitation, housing, water supplies and wastedisposal, and so they are greatly affected by many of the environmental diseases (e.g.
^ TB, diarrhoea, trachoma, worms, respiratory infections) which have been drasticallydiminished in MDCs.
With continuation of present fertility declines in the South and economic growth in anumber of newly industrializing countries in populous Asia, some expect that absolutepoverty should diminish in the 21st century, though relative poverty and inequality mayincrease (Gilbert, 1993). Although the poor will continue to be mostly rural, the
* numbers living in cities are rising fast, ensuring that P-E problems in cities will alsoincrease. Without major improvements in the infrastructure of LDC cities manyenvironmental problems will become increasingly intractable.
Stress has been laid on the need to use the synergism between rapid populationgrowth, the persistence of poverty and environmental degradation by targeting the
• poor, to assist them by making environmental investments (e.g. reforestation, irrigation,terracing) which would be in their long-term interest, as well as investments ineducation and health which would eventually promote demographic transition.
It is this synergism which is valuable in the development of population-environmenteducation which is less narrow than either population education or environmental
# education and is capable of linking local and global issues at various levels in theeducational curriculum (Clarke, 1992). :
3. Changing Attitudes
3.1. The Rio Conference
During the period between the CICRED conferences at Louvain-la-Neuve andLaxenburg the United Nations Conference on Environment and Development (UNCED)at Rio in 1992 revealed the yawning and perhaps widening gap in perceptions of theP-E problem between MDCs (the North) and LDCs (the South), however imperfectthat dichotomy. It was fuelled (a) by the reluctance of the rich countries to assist thepoor countries in coping with their more difficult environmental and developmentalchallenges, by means of debt relief, technology transfer and open trade; and (b) bytheir persistent emphasis upon population control programs for LDCs, which many(especially women) in LDCs see as sacrificing their reproductive rights in order topreserve the welfare of rich children in the MDCs (Merrick, 1993). On the other hand,perhaps the real difference at Rio was not between the North and the South, or evenbetween the governments and the NGOs, but between those who feel that theenvironmental crisis could be solved by technology and better pricing of natural
23
resources and those who believe that a major shift in values is required and a changein the world's economic system giving greater emphasis to the health and livelihood ofall.
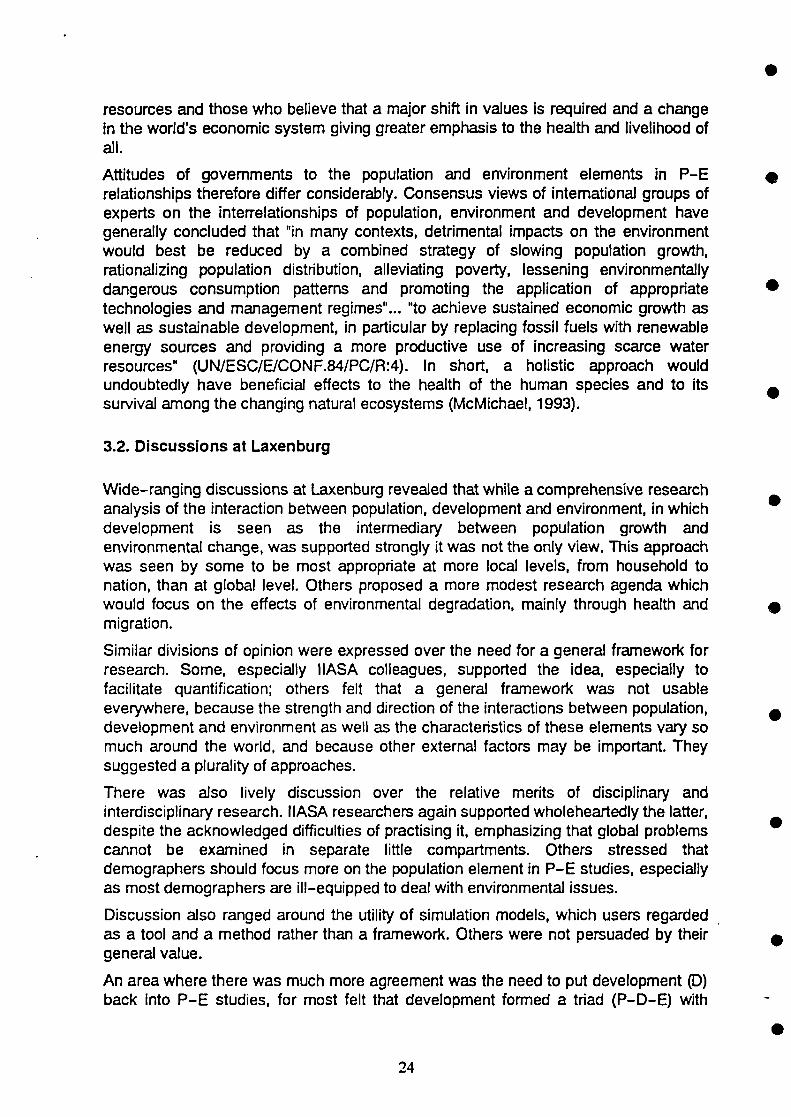
Attitudes of governments to the population and environment elements in P-Erelationships therefore differ considerably. Consensus views of international groups ofexperts on the interrelationships of population, environment and development havegenerally concluded that "in many contexts, detrimental impacts on the environmentwould best be reduced by a combined strategy of slowing population growth,rationalizing population distribution, alleviating poverty, lessening environmentallydangerous consumption patterns and promoting the application of appropriatetechnologies and management regimes"... "to achieve sustained economic growth aswell as sustainable development, in particular by replacing fossil fuels with renewableenergy sources and providing a more productive use of increasing scarce waterresources" (UN/ESC/E/CONF.84/PC/R:4). In short, a holistic approach wouldundoubtedly have beneficial effects to the health of the human species and to itssurvival among the changing natural ecosystems (McMichael, 1993).
3.2. Discussions at Laxenburg
Wide-ranging discussions at Laxenburg revealed that while a comprehensive researchanalysis of the interaction between population, development and environment, in whichdevelopment is seen as the intermediary between population growth andenvironmental change, was supported strongly it was not the only view. This approachwas seen by some to be most appropriate at more local levels, from household tonation, than at global level. Others proposed a more modest research agenda whichwould focus on the effects of environmental degradation, mainly through health andmigration.
Similar divisions of opinion were expressed over the need for a general framework forresearch. Some, especially IIASA colleagues, supported the idea, especially tofacilitate quantification; others felt that a general framework was not usableeverywhere, because the strength and direction of the interactions between population,development and environment as well as the characteristics of these elements vary somuch around the world, and because other external factors may be important. Theysuggested a plurality of approaches.
There was also lively discussion over the relative merits of disciplinary andinterdisciplinary research. IIASA researchers again supported wholeheartedly the latter,despite the acknowledged difficulties of practising it, emphasizing that global problemscannot be examined in separate little compartments. Others stressed thatdemographers should focus more on the population element in P-E studies, especiallyas most demographers are ill-equipped to deal with environmental issues.
Discussion also ranged around the utility of simulation models, which users regardedas a tool and a method rather than a framework. Others were not persuaded by theirgeneral value.
An area where there was much more agreement was the need to put development (D)back into P-E studies, for most felt that development formed a triad (P-D-E) with
24

population and environment, the targets being sustainable development and improvedquality of life.
Certainly CICRED centres are well positioned for research in this area, and it wassuggested that CICRED's role should be identified on the assumptions that itsmultinational character favours a comparative approach, that it is demography-drivenand policy-driven, and that the centres are often multidisciplinary and interdisciplinary.On this basis CICRED centres felt that the following topics pose particular researchinterest for students of population:
- Long-term collaborative work on comparable ecosystems;-Development of methodology, such as rapid assessment and geographical
information systems (GIS);- Fertility and the environment in the context of sustainable development;- Health and the environment;- Migration and the environment;- Urbanization and the environment, especially in a regional context;- P-E aspects of growing concentration of population;- Quality of space per capita;- Linkages between urban and rural P-E problems; and- Micro-studies of families/households and environment.
They are also aware that such research should be action-orientated.
4. Contents of this Volume
This volume presents a selection of papers presented at Laxenburg along with anumber of others which are revised versions of research reports submitted there onbehalf of centres. The range is by no means comprehensive of the range of researchundertaken by CICRED research centres, but it incorporates a considerable variety ofissues of general and specific interest, including theoretical and methodologicalmatters, varied perceptions and policies, mortality and health in urban andindustrialized environments, as well as land use and carrying capacity.
The papers do not fall naturally into clear-cut sections, but the first part of the volumeis devoted to concepts, theories and methods of analysis and opens with a wide-ranging study of the interrelationships between population, environment anddevelopment by Léon Tabah (Chap. 2). He explores those ideas which are generallyaccepted, looks at the part played by population in environmental degradation, andthen considers the future of world population and its consequences upon theenvironment. It is a valuable overview of an extensive literature, and tries to answermany of the major questions in the population, environment and development debate.
At the Laxenburg conference, Léon Tabah's opening address stimulated a usefuldiscussion on the value of interdisciplinary studies and methods, a theme taken up inChapter 3 by Nathan Keyfitz, then a resident researcher at IIASA, who postulates aninterdisciplinary model based upon employment and unemployment as an approach tothe problem of building a productive, sustainable and equitable society. Keyfitz givesemphasis to the underlying issues under discussion, including the dangers of utopias
25

based upon politics alone and the 'drive for justice' in LDCs, engendering the rise offundamentalism.
Marc Debuisson and Michel Poulain in Chapter 4 also favour an interdisciplinaryapproach, stressing the inseparability of the concepts of environment and humanpopulation and their complex interactions, both impacting upon each other. Inparticular, they examine the influence of specific demographic characteristics.
George Martine (Chap. 5) points out that the relationships between population andenvironment have generated much controversy and debate, but little clarity. In an effortto contribute to clarification, he provides a brief review of the main schools of thought;proffers a framework for the identification of conditions under which given types ofpopulation dynamics generate critical environmental consequences; argues thatpopulation - environment interactions must be analyzed in terms of economicglobalization; and claims that this shifts the locus of environmental concern to a greateremphasis on the densely populated urban areas.
Jean-Philippe Peemans (Chap. 6) also explores the interlinkages between population,environment and development at various levels, and how they have been differentlyperceived over time. He stresses that they have to be tackled in a dynamic andhistorical approach, and that global problems can actually be understood at a morelocal level, where peoples in communities have to be seen as actors in the quest for abetter balance of population and environment. States have to help communities toorganize themselves, in contrast to past modernization theories which regardedtraditional societies as immutable. Unfortunately, the dominant model of developmentat global level leads to much local environmental degradation.
Wolfgang Lutz in Chapter 7 explains how he and his team of researchers at MASAhave developed a valuable operational analytical framework for studying the effects ofdifferent population trends on socio-economic and environmental conditions, and howthey used this Population-Development-Environment (PDE) approach in a majorproject on population and sustainable development in the Indian Ocean island ofMauritius, which experienced the world's most rapid national fertility decline around1970. In particular he stresses the importance of long-term decision-making andinvestment in human capital, especially in the status of women.
Michel Picouet in Chapter 8 explains how he and his various colleagues in five differentTunisian and French research institutions have tackled the problem of analyzing therelationships between population and natural environment in the Tunisian countrysideby the DYPEN programme. It does not bring results which are assimilable everywherein Tunisia but has been valuable in examining arid, semi-arid and forest regions.
The second part of the volume comprises a number of chapters which focusparticularly upon polls, perceptions, attitudes and policies. It opens with a study by J.Mayone Stycos, who argues in Chapter 9 that scholarly productivity on theenvironment has grown faster than that on population, while treatment of P-Einterrelationships has been limited. International polls that have included manyquestions about environmental attitudes have included far fewer on population. Thefew surveys on population attitudes have ignored the environment. The World FertilitySurvey (WFS) and the Demographic and Health Survey (DHS) are regarded as poormodels for P-E research, while others also have limitations. Stycos makes out a case
26

for a new multinational public and elite opinion survey on population and environmentin order to facilitate policy formation.
Ismail Sirageldin in Chapter 10 explores the difficult area of relationships betweenpopulation dynamics in LDCs and political conflict. He comes to the conclusion thatthey have a significant effect mainly indirectly through proximate factors such as thegrowing scarcity of renewable resources, reduced economic productivity, out-migrationor the weakening of state authority. He stresses that population change may reducethe adaptive capacity of countries and thus induce conflict, especially where minoritiesand inequalities exacerbate the situation. He uses a number of case studies fromBangladesh/Assam, Mauritania/ Senegal and the Middle East to exemplify the findings.
The next chapter (11) is devoted to a more specific study of population-environmentpolicies in Mexico. Ligia Gonzalez Garcia de Alba explains how the NationalPopulation Council of Mexico has developed a spatial population distribution policybased on regional development criteria. Following detailed analysis, some 44 strategicmicro-regions have been selected (from more than 200 identified) to encouragechange in population distribution by taking advantage of their development possibilitieswithin a framework of environmental protection. Most are coastal and a considerabledistance from Mexico City and the northern border, but have their own central cities. Itis an interesting example of an integrated policy-orientated regional study linkingpopulation and environment though economic activity.
Daniel Hogan in Chapter 12 discusses how there is a new urgency to the population-environment question in Brazil brought about by dramatic changes in social thoughtand in the importance of environmental issues. He tries to explain why there was suchgreat initial resistance, and how the situation has evolved under the influence of recentpolitical history and the debate on models of economic development. The rapidity ofrecent fertility decline has surprised everybody, as it was achieved without a nationalfamily planning programme and appears unrelated to economic growth.
Following the theme of P-E issues in LDCs, Keshari Thapa and Richard Bilsborrow inChapter 13 assess the causes and environmental consequences of frontier migrationin poor countries, using the results of their research in Nepal and Ecuador. Migrationfrom highland to lowland prevails in both countries, stimulated by rapid populationgrowth, unequal land distribution, lack of alternative employment opportunities andgovernment resettlement policies, and this has been the proximate cause ofdeforestation. The desire for land is the main cause for migration, but there areimportant differences between the two countries, and they can learn from each other'ssuccesses and mistakes.
On another general pol icy-orientated theme, Hyacinth Ajaegbu in Chapter 14 adopts alocal community approach to the study of population-environment interrelationshipswith reference to Africa, particularly Nigeria. In particular he presents a model whichdistinguishes five separate phases of population dynamics, resource use andenvironmental change, ranging from primitive balance and harmony through phases ofchange to either relative balance and sustainability on irreversible imbalance. He pointsout the great complexities in population-environment interrelationships, their diversityamong different communities, and those groups which are particularly vulnerable topopulation-environment problems.
27

The next part of the volume switches to a number of studies which focus uponmortality/morbidity and the environment, especially problems associated withindustrialized environments and mega-cities of LDCs. In Chapter 15 Daniel Noinstresses the methodological problems in linking mortality with the environment,especially because the causes of mortality are often multiple and it is difficult to isolateenvironmental factors. He shows that natural disasters have accounted for only 0.16per cent of total estimated deaths during 1970-90, and that in MDCs the role of theenvironment in mortality has been generally overtaken by social and cultural factors,except in heavily industrialized regions such as those in Eastern Europe.
As an example of the latter, Alina Potrykowska in Chapter 16 examines the case ofPoland, which is said to be facing an environmental disaster at a time of radical changein its national economic system when it has very little funds to do anything about it.Some 27 P-E crisis areas have been identified encompassing 11 per cent of the areaand incorporating 35 per cent of the population. Poland is now reshaping itsenvironmental policy to a broader goal of sustainable development, so thatcomprehensive environmental policies have to be developed and effective methods ofimplementing them.
India poses different problems of morbidity and mortality, but in Chapter 17 ParveenNangia, Kamla Gupta, T.K. Roy and Rajiva Prasad present the graphic results of asurvey of population and health in a 5km zone around the Rashtria Chemicals andFertilizers (RCF) plant in Bombay where about 2.23 millions live, many suffering fromchronic ill-health, especially the elderly. They make recommendations to mitigatesuffering, to reduce the level of pollution and to meet catastrophes.
The contiguity of industries and population are not the only problem of Indian cities. InChapter 18, Sudesh Nangia examines a squatter settlement of 1500 households inDelhi, including the consequences to the quality of the environment and themaintenance of basic services in neighbouring areas. It is a salutary reminder of P-Eissues in mega-cities, when it is realized than Delhi is dotted with nearly 900 squattersettlements accommodating nearly 200,000 people.
Of course, the P-E problems of mega-cities are growing annually, and in Chapter 19Djuhari Wirakartakusumah is concerned with how rapid industrialization in the urbancentres of Indonesia attracts migrants, who come to live in slums because they cannotafford to live elsewhere. He reports on a study of a number of suburban residentialareas which encourage people to relocate from the capital city, Jakarta, though theycontinue to commute daily to jobs there. He goes on to analyze why people migrate,their environmental and residential conditions and how the migrants perceived theirenvironment. He concludes that major improvements in transportation and housing arevital, though his suggestion of putting housing close to industries may not be asatisfactory solution in the case of dirty industries.
Part IV is concerned with a selection of population-environment problems which revealthe diversity of the research field. Hassan Musa Yousif in Chapter 20 studies therelationship between population settlement patterns and the environment in centralSudan. On the one hand, there is a heterogeneous mix of rural settlements, reflectinghistorical, tribal, religious, political and environmental factors, as well as a considerablenomadic population. On the other is the influence of land, water and biomass fuelavailability. The supply of water and rainfall permitted cash crop production to progress
28

against livestock and forestry, so that many rural people have been pushed to dry duneareas, where there is overgrazing and immense pressure on the environment.Obviously this is an area of considerable environmental fragility increased by rapidpopulation growth.
Basia Zaba and Hilda Kiwasila in Chapter 21 examine in some detail the relationshipbetween population growth in rural and urban areas of Tanzania and changes indomestic water supply during the intercensal period 1978-88, when there was asubstantial decline in the population of households obtaining drinking water from pipedsupplies and from sources internal to their dwellings or compounds. In brief, they showthat rapid population growth may be a contributory factor in this decline in urban areas,but it is not true for rural areas.
In Chapter 22, Riga Adiwoso-Suprapto considers the factors influencing land usecover change (LUCC) among six communities in three locations in Indonesia - in WestJava, Irian Jaya and Flores. She examines the dynamic process of communitydecision-making regarding land use at the micro-level; how the community negotiatesinternal and external pressures for land use change through its value systems andinstitutional mechanisms. It is a study which is more data-driven than model-driven,and looks at the various driving forces for change.
Finally, in a very different research field Maurice D. Van Arsdol Jr and colleagues(Chapter 23) describe how local changes in sea level tied to climate and global changeare expected to decrease the base of California's coastal zone available for settlementat a time when coastal population is increasing and a larger area is at risk from erosionand flooding. They are assessing the available coastal land base to support futurepopulation in shoreline areas, and project populations from 1990 to 2040. It is the lastof a wide variety of contributions to our understanding of population-environment-development interactions.
References
Alger CF., 1988. Perceiving, analyzing and coping with the local-global nexus,International Social Science Journal, 117, The Local-Global Nexus, 322-40.
CICRED. 1992. Population and Environment, Paris: CICRED.
Clarke J.I., P. Curson, S.L Kayastha and P. Nag, eds. 1989. Population and Disaster,Oxford: Basil Blackwell.
Clarke J.I. 1992. Education, population, environment and sustainable development,International Review of Education, 39(1), 41-49.
Clarke. J.I. and D.W. Rhind. 1992. Population Data and Global Environmental Change,ISSC/UNESCO Series: 5.
Gilbert, A. 1993. The quality of life in the Third World (abstract^ 27th internationalGeographical Conference, Washington, 1992,126-7.
Glantz, M.H. 1993. Environmental backlash: scientists go public, Network Newsletter(UNEP), vol. 8, 4, July, editorial.
Goudie, A. 1993. Environmental uncertainty, Geography, 78(2), 137-41.
29

Goudie, A. 1984. The Nature of the Environment, Oxford: Basil Blackwell.
Jacobson, H.K. and M.F. Price. 1990. A Framework for Research on the HumanDimensions of Global Environmental Change, ISSC/UNESCO Series: 3.
McMichael, A.J. 1993. Planetary Overload: Global Environmental Change and theHealth of the Human Species, Cambridge: Cambridge University Press.
Merrick, T.W. 1993. From Rio to Cairo: population and sustainable development(abstract), 27th International Geographical Conference, Washington, 1992,128-9.
Richmond, A H . 1993. Environmental refugees and reactive migration: a humandimension of global change. Paper presented at IUSSP Congress at Montreal,August 1993.
Tabah, L 1992. Population prospects with special reference to environment, inCICRED, Population and Environment, Paris: CICRED.
Tetrault, M. 1992. Environment and Development: the Crucial Decade, Development,CIDA, Spring.
UN/ESC/E/CONF.84/PC/4. 1992. Preparations for the International Conference onPopulation and Development. Recommendations of the Expert Group Meeting onPopulation, Environment and Development, 28 August.
UN/ESC/E/CONF.84/PC12. 1993. Synthesis of the Expert Group Meetings Convenedas part of the Substantive Preparations for the International Conference onPopulation and Development. 10-12 May 1993.
Zaba, B. and J.I. Clarke, eds. 1994. Environment and Population Change, Liège:Ordina.
30

PART I
CONCEPTS, THEORIES AND METHODS OF ANALYSIS


CHAPTER 2
LES INTERRELATIONS POPULATION-ENVIRONNEMENT-DEVELOPPEMENT: ETAT DE LA QUESTION ET
PERSPECTIVES
Léon Tabah(L'ancien Président de CICRED)
1.Quelques idées généralement acceptées
Commençons par quelques idées qui semblent recueillir l'assentiment de lacommunauté internationale des chercheurs, sans attribuer une hiérarchie entre elles.
1.1. Les relations quantitatives, qualitatives, la notion d'irréversibilité
La première idée qui vient à l'esprit lorsque l'on aborde les interrelations entre lapopulation et l'environnement est simple: la population ne cesse de croître tandis quel'environnement est limité, et au surplus se détériore, comme chacun en convientaujourd'hui. Le monde donne l'impression de se dégrader et de se rétrécir par rapport àune population dont la croissance ne connaît pas de répit. Mais il serait de touteévidence abusif d'attribuer entièrement la détérioration de l'environnement à lacroissance démographique. Bien d'autres facteurs sont en jeu, souvent en conjonctionavec la population, et nous verrons ce qu'il faut en penser dans le cours de ce rapport.
Les deux facteurs population et environnement sont fondamentaux, et comme tous lesfacteurs fondamentaux, ils doivent être analysés dans le très long terme. Nous devonsnous sentir concernés dans cette analyse par la préparation non seulement du XXI e
siècle, mais aussi du XXe.
Il y a entre la population et l'environnement de très nombreuses et complexes relationsde type à la fois quantitatif et qualitatif que nous ne comprenons pas toujours très bien.Mais il est certain qu'arrive un moment où les changements quantitatifs induisent deschangements qualitatifs. Cela conduit à la notion de seuil. L'accumulation dechangements de l'environnement peut finir par entraîner des irréversibilités. L'exemplele plus cité est l'accroissement de gaz carbonique dans l'atmosphère qui, s'il continueau rythme de ces 25 dernières années, peut devenir tel que l'absorption naturelle par laphotosynthèse des plantes et des océans pourrait ne plus suffire à maintenir un tauxtolerable dans un avenir qu'il est impossible de prévoir. La capacité régénératrice seraitépuisée.
Pour ce qui est de la démographie, une croissance continue très élevée, et constante,disons un taux supérieur à 2 pour cent, pourrait rendre le monde inhabitable au bout dequelques décennies, et des mesures de conservation prises en cours de route nepourraient suffire à redresser la situation. Pour Malthus,au-delà d'un certain point.unecroissance démographique crée de la pauvreté. Il est donc aussi des évolutions
33
démographiques qui peuvent créer des situations irréversibles. Un exemple est levieillissement de toutes les populations, dont on ne voit pas le retournement avant trèslongtemps. Des mesures prises trop tardivement ne pourraient empêcher une évolutionqui se développerait inexorablement.
1.2. La qualité de la vie, notion toute relative
La détérioration de l'environnement conjuguée à un accroissement excessif de lapopulation peut entraîner à son tour des changements dans la qualité de la vie despopulations. L'environnement est un des facteurs essentiels de la qualité de la vie.Certes, cette dernière n'est pas une donnée immédiatement objective. C'est laperception que l'on a de notre vécu. Elle est une donnée subjective, mais aussifortement influencée par notre milieu, et donc hautement variable d'une population àune autre. Il faut faire un grand effort par la pensée pour saisir ce que ces motssignifient dans le jugement d'un habitant d'un pays riche et dans celui d'un habitantd'un pays pauvre. La qualité de la vie pour le premier peut être compromise par unesimple atteinte au confort, alors que pour le second la notion même de confort estdérisoire, voire absente, et la priorité majeure est de faire face à des situationsd'urgence et de subvenir aux besoins fondamentaux immédiats, même si cela a desconséquences négatives sur le milieu. Les horizons diffèrent entièrement. Nousdevons constater une fois de plus que les pays riches et les pays pauvres n'ont pas lesmêmes problèmes à résoudre, et que leurs visions de ces problèmes sont trèsdifférents. Il serait non seulement injuste, mais aussi faux de prétendre que lespauvres sont eux-mêmes responsables de leurs malheurs.
1.3. Les relations population-environnement étaient autrefois indépendantes del'activité humaine, aujourd'hui elles ne le sont plus
Le problème démographique actuel réside dans le fait que la croissance s'est faite defaçon indépendante des écosystèmes, alors que dans le passé la dépendance étaittrès grande: une mauvaise récolte avait pour conséquence une augmentation du prixdu blé, comme l'a montré par exemple pour la France du XVI e au XVIIIe (Meuvret,1965), et celle-ci était associée à des crises de mortalité. Pendant longtemps ladémographie a varié en fonction des changements de l'environnement, qui lui-mêmecommandait les ressources. Elsworth Huntington, a attribué en 1907 la migration desMongols aux modifications du climat et, comme nous le noterons plus loin, bien desmigrations commencent à être causées par des détériorations du milieu du fait desactivités humaines. Les changements de climat, s'expliquaient, comme l'a encoremontré Leroy Ladurie, (1967), depuis le XI e, par des facteurs non humains, alors quedans les temps modernes, ils s'expliquent essentiellement par l'activité humaine:industrialisation, deforestation, avec des conséquences qui semblent plus rapidesqu'autrefois sur l'histoire de la biosphère. Nous ignorons l'aboutissement de processusque nous avons suscités et que nous ne maîtrisons pas.
34

1.4. La dimension planétaire
Nous assistons, dit-on, à la mondialisation des problèmes fondamentaux, etnotamment ceux de l'environnement. Le monde contemporain se trouve aux prisesavec des défis qui ne peuvent être surmontés dans le cadre d'une nation ou d'unepopulation particulière. On le voit bien avec les nuages transportant des pluies acidesà travers les frontières, le réchauffement menaçant l'atmosphère, bien commun desriches comme des pauvres, la déchirure de la couche d'ozone, même si certains encontestent la réalité, la pollution des océans, la perte de biodiversité, etc. Nul ne peutdésormais se désintéresser de ce qui se passe en dehors des frontières de son pays.
Il faudra bien un jour surmonter l'incompatibilité entre la division du monde en Etatssouverains et le caractère international de décisions nécessaires à l'échelle del'humanité.
On commence à percevoir l'interdépendance des problèmes en matière dedémographie sous la forme des migrations internationales des zones les plus pauvreset les moins développées vers les plus riches. Mais autant la mondialisation desproblèmes est de plus en plus acceptée pour ce qui touche à l'environnement, autantelle est refusée pour la démographie. Les pays riches continueront de se défendrecontre les migrations clandestines en érigeant des barrières aux frontières, aussi peuefficaces soient-elles. Il suffit d'une infiltration faible chaque année pour créer à lalongue, par un processus cumulatif, des groupes ethniques d'importance plus ou moinsgrande, avec les dangers de conflits internes, et par contre-coup internationaux, quecela amène tôt ou tard en l'absence d'intégration. L'histoire, et même l'actualité,fourmille d'exemples.
On peut concevoir des accords internationaux sur la protection de l'environnement,comme ce fut le cas à Rio pour les deux conventions sur la biodiversité et sur le climat,récemment aux Nations unies pour arrêter la deforestation, ou pour la protection desocéans, ou celle des espèces menacées d'extinction, pour le rejet des déchetsnucléaires. Certes, la volonté de faire appliquer ces conventions est mise en doute, lesdécideurs s'abritant derrière le principe des souverainetés nationales, par exemplepour ce qui touche à la biodiversité. Mais on n'est même jamais parvenu aux Nationsunies à des objectifs chiffrés et datés sur le ralentissement de la croissancedémographique, qu'il s'agisse de la première Conférence internationale sur lapopulation de Bucarest de 1974, en dépit des efforts du Secrétariat, ou celle de Mexicode 1984. Et il y a fort à parier qu'il en sera de même de la Conférence sur la Populationet le Développement du Caire, en préparation pour cette année.
L'interdépendance entre les pays en matière d'environnement est devenue telle queceux faisant d'importants efforts de protection sont agacés par l'incurie de leursvoisins, sans pouvoir en appeler à l'opinion publique internationale. Cela peut créer àl'avenir des sources de friction entre les Etats. Le monde ne s'est pas donné uneautorité en la matière. A côté de catastrophes écologiques locales ou nationales, onassiste à des problèmes d'environnement globaux. Des accords internationaux enmatière d'environnement apparaîtront désormais de plus en plus indispensables.
Par contre, en matière de population, on ne peut concevoir d'accords sur la croissancedes uns et des autres. Tout au plus des recommandations. Avec toutes les précautionsde langage que cela requiert.
35

Les pays, qu'ils soient développés ou en développement, sont très sourcilleux sur lasauvegarde de leurs frontières. Celles-ci doivent être transmises intactes auxgénérations futures. Personne ne met en doute le droit à la souveraineté des Etats surleur territoire. Le paradoxe, comme le fait remarquer Keyfitz (1989a, 1994), est que cesEtats n'hésitent pas à vendre à l'étranger des richesses qu'ils ne pourront tranmettreaux prochaines générations, qui plus est, des richesses non renouvelables, comme lepétrole, les minéraux. La qualité du sol transmis pourra elle-même être dégradée àforce de déboisement, de surpaturage pour produire plus de viande d'exportation,entraînant une désertification, etc. La transmission d'un environnement sain, sansgaspillage des ressources non renouvelables, devrait être un objectif aussi impérieuxque la transmission de frontières intactes.
L'une des idées les plus transcendantes de ce siècle est que désormais nous avons lapossibilité de rendre notre monde inhabitable, soit instantanément, par énergienucléaire, soit par doses plus ou moins fortes mais prolongées de pollution.
Faut-il rappeler cette vérité d'évidence que c'est dans la guerre, qui tue à la fois lespopulations et l'environnement, que la démographie et l'écologie se rejoignent?
1.5. La perception des problèmes de l'environnement et de la démographie
Comme on pouvait s'y attendre, les perceptions sur l'environnement sont vives dansles pays industriels, plus d'ailleurs dans les symptômes que dans les causes, et cellessur la démographie sont sensibles dans le Tiers monde.
Les symptômes de la détérioration de l'environnement sont perçus plusimmédiatement que de ceux de l'excessive croissance démographique, moinstangibles. La pollution se voit, elle se respire. Les bébés, même lorsqu'ils sontnombreux et mal nourris, ne gênent personne, sinon les consciences.
Dans une enquête sur la perception de l'environnement faite en France en 1992 parCollomb, Guérin-Pace, et Berian, 84 pour cent des personnes interrogées ont réponduque "l'homme a le pouvoir de perturber définitivement l'état de la nature" (1993). Et unefaible minorité (10 pour cent) pense que la nature peut se rétablir d'elle-même. L'idéed'irréverssibilité en matière d'environnement est donc bien ancrée dans les esprits, toutau moins dans les pays industriels qui, il est vrai, sont aussi les premiers responsablesde la dégradation de l'environnement.
La perception des questions sur l'environnement dans les pays industriels est si fortequ'elle s'exprime sous la forme de partis politiques, les "verts", avec force appuimédiatique. Il y a peu d'exemples équivalents dans les pays du Tiers monde.
La perception des questions de l'environnement commence cependant à êtrepolitiquement très sensible dans certains pays du Tiers monde. C'est le cas du Brésiloù l'on se refuse à ce que l'opinion internationale conteste le déboisement del'Amazonie sous le prétexte qu'une forte proportion du gaz carbonique de l'atmosphèreest enmagasinée dans les forêts de l'Amazonie (Kosinski, 1991).
La perception des questions démographiques est plus discrète, mais peut aussi semanifester de façon très sensible dans les opinions publiques des pays endéveloppement. On se souvient des événements qui ont affecté l'Inde où, au vu desrésultats décevants de la politique démographique, une certaine nervosité s'était
36

emparée des décideurs. Ceux-ci avaient décrété en juin 1975 "l'état d'urgence"matérialisé notamment par une politique d'exhortation plus ou moins forcée à lastérilisation. La question fit l'objet d'une vive controverse dans l'opinion publiquependant la campagne électorale de 1977, et fit tomber le gouvernement de Mme IndiraGandhi. La leçon que l'on peut tirer de l'expérience indienne est qu'en régimedémocratique vouloir "forcer" l'évolution de la population par des mesures coercitives,et centrer les efforts sur une seule méthode, au surplus une méthode "dure" commel'est la stérilisation masculine, risque de créer des conditions qui se retournent contreles promoteurs de cette politique.
La question démographique peut revêtir de fortes connotations politiques. A laConférence internationale sur la population de Bucarest de 1974, la politiquedémographique fut étroitement liée au "Nouvel ordre économique international" que leTiers monde avait réussi à faire voter quelques mois auparavant par l'Assembléegénérale.
On ne sait pas quel lien existe dans l'opinion publique entre les questions de lapopulation et celles de l'environnement. La liaison commence seulement à être perçuepar les écologistes eux-mêmes, comme l'a montré la Conférence de Rio surl'environnement, alors que la Conférence de Stockholm de 1972 s'était bien gardéed'évoquer la démographie. Par contre, les Conférences sur la population de Bucarestde 1974 et de Mexico de 1984 avaient été précédées par des groupes d'expertschargés d'étudier les liaisons entre environnement et population.
A la Conférence de Rio le sujet population-environnement fut à nouveau le prétexted'une vive controverse politique Nord-Sud. Le Tiers monde a souhaité mettre sur lasellette la consommation débridée des pays riches, et ces derniers ont tenté d'esquiverl'accusation en opposant l'excessive croissance démographique du Tiers monde. Cefut une nouvelle façon d'éluder les problèmes, et de profiter de l'occasion pour viderd'autres contentieux. Deux ans après la conférence de Rio peu de recommandationssont suivies d'applications concrètes.
1.6. Conscience locale et conscience globale
On ne sait pas non plus quel lien existe dans l'opinion publique entre les problèmeslocaux de l'environnement et les planétaires, les premiers étant cependant toujours lescauses des seconds. Mais toute perturbation globale se répercute localement, par unprocessus de va-et-vient, sur les êtres vivants et leur environnement. Autrement-dit,toute perturbation locale fait courir des dangers bien au-delà, et jusqu'au planétaire,pour retourner à l'échelle locale.
Les causes des perturbations locales, nous le verrons plus loin, sont souvent d'ordresocial et politique. Ceci conduit nécessairement aux façons d'aborder concrètementces problèmes. La formule de René Dubos (1965) "penser globalement, agirlocalement" devrait guider l'action tant dans le domaine de la population, que danscelui de l'environnement.
37

1.7. L'anachronique accès gratuit aux biens communs
Bien des auteurs ont dénoncé l'anachronisme consistant à accorder un accès libre etgratuit aux biens communs que sont l'air, l'eau, comme s'ils étaient infinis et nondégradables, avec la conséquence prévisible d'un gaspillage et d'une détériorationinéluctable de ces biens communs. Les économistes commencent à reconnaître que ladétérioration de ces biens communs devrait être inscrite dans les compteséconomiques, au même titre que les autres biens et services. S'en tenir au PNB pourquantifier le progrès économique est une façon trompeuse de mesure de ce progrès.Ces ressources que sont les biens communs n'ont pas de valeur marchande, elles nefont pas l'objet d'appropriation. De plus, l'analyse des conséquences est difficile à fairecar celles-si sont non seulement locales mais aussi globales. Cela ne devrait pas faireobstacle au principe que "les pollueurs seront les payeurs". Parmi ces auteurs il fautciter, notamment Lee (1990), Das Gupta et Maler (1990) et Keyfitz (1989b, 1990,1993).
Pour Lee, une des conséquences les plus notables de la pression excessive de lapopulation porte sur les ressources de l'environnement. Une gestion optimale de cesressources devrait inclure une politique optimale de population.
1.8. Conscience macro et conscience micro. Le faux ou le vrai dilemme entredéveloppement et environnement
On dit parfois que le coût de la préservation et de l'entretien de l'environnementcompromet les chances de développement du Tiers monde, car il viendrait s'ajouter aucoût des projets de développement, et que certains projets de développement peuventcontrevenir à une saine gestion de l'environnement. Il y aurait une incompatibilité entrela protection de l'environnement et l'amélioration du bien-être et de la santé de lapopulation.
Apparemment les réponses à ces questions ne sont ni claires, ni univoques. Certes,chacun convient que non seulement il n'y aurait pas de conflit entre développement etpréservation de l'environnement, mais qu'il ne pourrait y avoir de développementdurable sans préservation et entretien de l'environnement.
Mais ce qui dans l'immédiat peut paraître prioritaire pour les uns peut ne pas l'être pourd'autres. Pour bien des pays du Tiers monde la priorité est le développement, commece fut le cas pour les pays industriels à leur époque de plein développement sansconsidération pour l'environnement. Il est vrai que ce souci n'a émergé dans laconscience collective qu'à partir des années 60. Le Brésil souhaite coloniser les terresamazoniennes car celles-ci sont indispensables à son développement, quels quesoient les points de vue d'autres pays pour qui les forêts et la biomasse de la régionrecèlent un quart de tout le gaz carbonique de la planète. L'Amazonie serait aussi leréservoir biogénétique le plus vaste de la planète. Les intérêts nationaux et mondiauxne s'accordent pas nécessairement.
Les problèmes globaux de l'environnement ou de la démographie sont perçusdifféremment par les pays industriels et par le Tiers monde.
38

Ce serait trop demander au Tiers monde de freiner son développement jusqu'à ce quele Nord trouve des substituts "propres" et bon marché à l'énergie fossile (Sachs, 1992).
Certains pays du Tiers monde se plaignent que les précautions à apporter àl'environnement exigées par des bailleurs de fonds internationaux pour certains projetspeuvent rendre ces projets irréalisables.
Il est certain que les questions de l'environnement, lorsqu'elles dépassent l'aire locale,comme par exemple celles touchant à un possible réchauffement de la terre, ou à ladéchirure de la couche d'ozone, peuvent paraître abstraites et étrangères au petitpaysan ou à l'habitant pauvre du Tiers monde. Il y a conflit entre une conscience àl'échelle macro et une conscience à l'échelle micro des questions de l'environnement.L'on ne pourra sortir de ce conflit tant que l'on n'aura pas lutté efficacement contre lapauvreté.
1.9. Les phénomènes "pervers", les externantes
En fait, on se trouve en présence avec les détériorations de l'environnement, dephénomènes "pervers", comme disent les sociologues (Boudon, 1977), en ce sens quec'est l'agrégation d'actes individuels qui provoque des résultats que personne nevoulait, ou en présence d'extemalités, comme disent les économistes. Les individussont à la fois libres et conscients de leurs actes individuels, mais souvent inconscientsdes effets collectifs que provoque leur agrégation. Mais si le sens d'une responsabilitécollective commence à émerger pour ce qui touche à l'environnement, cetteresponsabilitée est encore totalement absente pour ce qui touche à la démographie.Or, en démographie aussi, on peut parler d'externalité. Une forte fécondité des unsaffecte les conditions d'autres moins prolifiques. On le voit bien en ce qui concerne lesretraites par exemple, puisque les droits à la retraite ne tiennent pas compte desfécondités individuelles.
1.10. L'impossible continuation et généralisation du mode de vie occidental.Discrimination à rencontre des pauvres?
On est bien obligé de remarquer que le monde est toujours embrayé sur la croissancedémographique et sur celle de la production. Le monde est resté sourd aux appelsd'une remise en question complète des choix de développement et de consommationdes pays riches, ¡I y a déjà 25 ans, même si l'argumentation fut souvent récusée, telsceux: de Sicco Mansholt, alors président de la CEE, dans une lettre fameuse incitantles pays riches à une croissance économique nulle; des Meadows et du Club de Rome(1972); des Ehrlich (1990); des alertes répétées de l'agronome René Dumont auteur denombreux ouvrages, et notamment il y a une trentaine d'années "L'Afrique est malpartie" (Dumont, 1962); des oeuvres d'un des économistes les plus respectés del'époque (Myrdal, 1968), qui a exhorté les pays riches à déclarer un moratoire sur leurcroissance. Plus récemment les rapports nombreux de la Banque mondiale (1984); lerapport Global 2000 au président des Etats Unis (1980); le rapport commun de laRoyal Society of London et la U. S. National Academy of Sciences des Etats Unis en1992; les nombreux écrits de Keyfitz, démographe de renom (1990, 1991a, 1991b,1993); les appels répétés de Lévi-Strauss pour qui "ce fut un luxe insoupçonné pour
39

l'humanité, et une chance pour toutes les formes de vie, quand deux ou trois milliardsseulement d'individus habitaient la planète" (1991). Face à ces déclarations de hautespersonnalités et institutions il faut reconnaître que l'on trouve moins de points de vueopposés. On doit noter l'attitude de Sauvy (1949), dont l'audience fut considérable, quicombattit longtemps le concept même de population mondiale, les écrits récents deCommoner (1990, 1991, 1992), pour qui la responsabilité de la démographie dans ladétérioration de l'environnement est exagérée, et de Simon (1981) résolument opposéà toute attitude malthusienne.
Aucun auteur sérieux n'a jamais pensé, à moins d'aveuglement volontaire, oud'ignorance improbable, que l'espèce humaine continuerait de se multiplier comme ellel'a fait au cours des cinquante dernières années, et que le taux de croissance de laproduction observée de 1945 à 1965 se prêtait à une extrapolation indéfinie.
De fait, les problèmes vitaux sont tous des problèmes d'équilibre. Il suffit de regarderautour de soi. Dans tous les systèmes vitaux et les cycles, dans le corps humain, dansles océans, les forêts, dans les espèces rien, jamais ne croît indéfiniment sansqu'émerge un phénomène d'autorégulation spontané d'adaptation et d'ajustement desécosystèmes. Il n'y a pas de raison de penser qu'un nouvel équilibre ne sera pasatteint, mais dans les circonstances actuelles on ne voit pas comment cet équilibre seformera si une prise de conscience des problèmes n'est pas suivie d'une actionefficace pour enrayer une évolution que chacun redoute.
La dure réalité est que la généralisation du type de développement des pays richesdans le Tiers monde est une éventualité qui s'éloigne de plus en plus de l'horizon,quelles que soient les perspectives optimistes des successives "Décennies dudéveloppement" des Nations unies. Il est inconcevable que dans la période où nousentrons l'égalité puisse s'établir au plus haut, puisque si elle est combinée àl'accroissement démographique, dont nous discutons plus loin les perspectives desNations unies, elle conduirait à une augmentation par cinquante ou soixante de laconsommation, avec tout ce que cela implique pour l'environnement. Un demi milliardd'automobiles sont actuellement enregistrées dans le monde, principales causes del'effet de serre. Imagine-t-on ce qu'il en serait avec plusieurs milliards de véhiculescirculant sur les routes et les villes dans les deux hémisphères pour satisfaire lesaspirations de tous? Le confort occidental ne peut être généralisé rapidement sansgraves atteintes à l'environnement. Il doit être considéré comme un épisode très brefde l'histoire du monde. Il doit laisser la place à des formes de vie plus frugales, etmême plus austères. Une croissance économique "allégée" et une démographiestabilisée des pays riches pendant plusieurs décennies, associée à une croissancedémographie ralentie du Tiers monde, sont des conditions indispensables à latransmission d'un héritage que les générations précédentes nous ont elles-mêmeslégué.
1.11. La perte de biodiversité
Les biologistes et les entomologistes nous assurent que chaque année des centaines,voire des milliers, d'espèces animales disparaissent du fait de la deforestation, de lapollution des océans, des changements dans les pratiques agricoles, de l'urbanisationaccélérée. Les agronomes nous disent que la même perte de diversité est observée
40

dans le monde végétal du fait des monocultures en remplacement des culturesvivrières, des engrais chimiques et pesticides. On compterait 1, 4 million (Sioli, 1985) à1.7 million d'espèces décrites à ce jour (Chauvet et Olivier, 1993) sur un total estiméentre 10 et 30 millions. Les pays du sud sont détenteurs de la majeure partie desressources biologiques. Ils ont donc un rôle considérable à jouer dans la protection deces ressources.
On ne peut qu'éprouver un sentiment d'angoisse devant tout ce qui menace la survie,le maintien de la diversité du monde animal ou des plantes. Il est exclu qu'une espèceanimale ou végétale disparue, synthèse complexe et unique, puisse être remplacéepar une espèce équivalente, et nous agissons à leur égard avec la même désinvoltureque pour la consommation de matières minérales non renouvelables, dont la formationet la concentration se sont poursuivies pendant plusieurs ères géologiques. Pour neciter qu'un exemple, ayant valeur de symbole, on dit que la population des pandas enChine au cours des quatre dernières décennies s'est réduite à quelques milliersd'animaux perdant graduellement leur couleur blanche, alors qu'elle a été florissantependant des milliers d'années. Elle est décimée par le manque de bambous quiconstituent l'essentiel de leur nourriture, alors que la population humaine en doublantpendant la même période a remplacé les terres de bambous par des cultures propres àsa propre nourriture. Et que dire de l'extinction progressive des grandes baleinesbleues, et de bien d'autres vies animales, moins visibles, mais peut-être plus vitalespour la survie de notre planète. Nous ne cessons de casser des chaînes decomplémentarité qui font la force des écosystèmes.
Il faut reconnaître que nous n'avons encore qu'une faible compréhension desinteractions entre les systèmes biologiques et les agents chimiques et physiques.
La démographie aurait une part de responsabilité dans ces phénomènes, et nousdiscuterons ce point plus loin dans ce rapport.
1.12. L'interdépendance entre les écosystèmes
La crise est salutaire car elle a révélé que l'on avait négligé les lois gérant lesécosystèmes (Morin, 1978). D'une part, la biosphère est un contenu vivant à la foistrès robuste et très fragile fait d'intégrations éco-organisatrices entre unicellulaires,végétaux, animaux, humains, et l'ensemble des conditions géophysiques, pouvant êtregravement endommagé si on lui injecte trop de poisons qui dégradent sans être eux-mêmes dégradés. D'autre part, comme tous les êtres vivants, l'homme est un système"ouvert" dépendant des autres écosystèmes.
1.13. Le progrès des connaissances
Dans le domaine complexe des relations population-environnement notreconnaissance est très fragmentée. Et cependant, elle appelle une démarche et desréponses distinctes des problèmes anciens. Que sait-on au juste, que ne sait-on paset que devrions-nous savoir?
L'analyse des problèmes population-environnement est tributaire au premier chef desdonnées sur chacun des deux éléments.
41

La population se présente sous trois aspects: volume, croissance et migrations.L'environnement se présente, lui, sous une myriade de facteurs: air, eau, terre, mondevégétal et animal, et chacun de ces facteurs se décompose en une série d'éléments.En fait, on ne connaît pas très bien les frontières de l'environnement. Comme écriventTeitelbaum et Winter (1993), le terme "environnement" est vague et ambigu. Il ne fautpas s'étonner si nous disposons de données plus abondantes et plus sûres sur lapopulation que sur l'environnement. Il est vrai que la recherche démographique a unehistoire plus longue que celle sur l'environnement. L'Essai de Malthus fut publié il y apresque deux siècles (1796), alors que le terme écologie, dû au biologiste allemandHaekel, n'est apparu qu'en 1906, et la recherche dans ce domaine est encore trèsrécente.
L'examen de la littérature montre que celle-ci a fait récemment des progrèsconsidérables pour s'adapter aux observations nouvelles. Pendant longtemps cettelittérature était restée théorique, abstraite, s'exprimant en controverses plus ou moinsstériles entre malthusianistes et populationistes, basées souvent sur des modèlesthéoriques (Coale-Hoover, Domar, Bachue, etc) peu opérationnels, visant parfois lesseuls aspects globaux de l'environnement, sans référence aux conséquences sur labiosphère. Au cours de ces dernières années, et notamment à l'occasion de lapréparation de la Conférence sur l'Environnement et le Développement de Rio deJaneiro (juillet 1992), les recherches sont devenues plus concrètes, basées souvent surdes observations et analyses à l'échelle locale. Deux ouvrages, l'un dû à NormanMyers (1992), l'autre dû à Mary Barbies (1993) ont donné des vues d'ensembleintéressante de la littérature. Il faut ajouter les travaux scientifiques de synthèse de laDivision de la population des Nations unies, notamment ceux d'un groupe d'experts envue de la préparation de la conférence mondiale sur la population (UN, 1992), lespublications du FNUAP (1992). Ceux, enfin, de la commission dite CommissionBrundland qui fait autorité en plaçant les problèmes dans le cadre du développement.
1.14. La Commission Brundtland
La commission Brundtland, du nom de son président, Mme Gro Brundtland, premierministre de Norvège, a été établie par l'Assemblée générale des Nations unies de 1987sous le nom de Commission sur l'Environnement et le Développement.
La Commission a défini ce que désormais on appelle le "développement durable",c'est-à-dire la capacité de gérer l'interaction entre les activités humaines etl'environnement physique et biologique, afin de préserver et promouvoir la qualité de lavie des générations actuelles et futures, sans menacer l'intégrité des écosystèmesnaturels dont dépendent toutes les formes de vie. L'idée majeure est que l'accélérationdes progrès et des techniques dans les pays riches, et plus généralement des atteintesà l'environnement, qu'elles viennent des pays riches ou des pays pauvres, risquent deprovoquer des chocs en retour. Il faut s'attacher, certes, à la solution des problèmesactuels, mais sans pour autant faire confiance aux ressources illimitées de latechnique pour résoudre plus tard ceux qui se dessinent à l'horizon, mis en quelquesorte en réserve, jusqu'à ce qu'ils se présentent à leur tour aux générations futures quiseraient "prises de court" inéluctablement. Ces idées étaient déjà en germe dans unouvrage célèbre de Barbara Ward et René Dubos Only One Earth (1972), en vue de laConférence mondiale sur l'environnement de Stockholm de 1972. Le titre de la
42

publication des travaux de la Commission Our Common Future est lui-même voisin decelui de Ward et Dubos.
La Commission a souligné le fait que les problèmes de l'environnement sontdirectement liés à ceux de la démographie, de la pauvreté et du statut de la femme,affirmant l'existence de liens de causalité entre ces facteurs. Elle a souligné, ce quenous avons antérieurement discuté, le caractère international des problèmes posés. Leconcept du principe de la souveraineté nationale est remis en question par les réalitésde l'interdépendance écologique et économique.
2. La part de la démographie dans la détérioration del'environnement
II faut commencer par rappeler que les travaux sérieux, s'ils attribuent uneresponsabilité variable à la démographie dans la détérioration de l'environnement,s'accordent cependant à dire qu'il existe un faisceau complexe de facteursresponsables, dont la logique interne échappe à l'analyste. Nombre de ces facteurssont d'ordre économique, social, politique, autant que démographique, sans qu'il soitpossible d'établir une hiérarchie entre eux.
On peut d'ailleurs citer des dégradations n'ayant rien à voir avec la démographie,comme les désastres naturels, la décharge de déchets nucléaires dans les océans. Siun gouvernement stimule la vente de bois à destination commerciale, ou pourl'exportation, cela peut avoir des conséquences sur l'environnement, mais la causen'en est pas démographique. C'est notamment le cas de l'Indonésie, et même dansune certaine mesure de l'Amazonie brésilienne pour la construction d'hébergementsdes colons, ou de la région du Sahel, comme le font observer Repetto et Holmes(1993). L'agriculture intensive, fondée sur l'usage intensif de la chimie épuisant lafertilité des sols, en vue de la commercialisation des récoltes, n'a également rien à voiravec la démographie.
La tendance est aussi souvent à dramatiser des situations au demeurant dégradées.C'est ainsi qu'un rapport de 1978 d'une institution internationale, qui à l'époque eut ungrand retentissement, estimait que si le taux de déboisement des contreforts du Népaldevait continuer au même rythme, la région serait totalement déboisée en 15 ans, cequi, bien entendu, n'est pas observé. En fait, une étude du gouvernement a montré quele taux de déboisement était exagéré. Il y a un risque de tout réduire au problèmestrictement démographique, ou strictement écologique, ou même strictementéconomique, social, politique, alors que les facteurs en jeu sont toujours nombreux etinterconnectés.
Cependant, le déboisement de bien des pays du Tiers monde est incontestable. Seuleson étendue est discutée. Pendant longtemps la forêt tropicale était considérée commen'ayant aucune valeur économique, et que de nombreux profits pouvaient être tirés deson déboisement, puis de son remplacement par des cultures, pour nourrir despopulations croissantes.
Donnons quelques exemples de déboisement. La forêt aurait disparu dans laproportion de 43 pour cent au Guatemala, de 74 pour cent au Soudan (Bilsborrow andDelargy, 1990). Selon Dennis Manar, cité par Foyet et Daly (1992), la zone déboisées
43

de l'Amazonie indienne serait passée de 125 000km2 en 1980 à 600 000km2 en 1988.Barberis (1993) a réuni une impressionnante documentation sur le déboisement enInde, en Indonésie, au Népal, aux Philippines, en Thaïlande. Dans ce dernier pays laforêt couvrait 55 pour cent des superficies en 1961, et seulement 28 pour cent en1989. Myers (1989, 1990) a également donné de nombreuses estimations du taux dedéboisement dans le monde. Toutes les estimations recueillies et les analyses tendentà montrer que la croissance démographique et la transformation de la forêt en terrescultivées ont eu pour conséquence un appauvrissement des sols. Allen et Barnes(1985), en se fondant sur des données de la FAO pour nombre de pays du Tiersmonde, ont confirmé cette conclusion au moyen d'une analyse statistique. C'est auSalvador que la deforestation et l'érosion des sols ont été les plus poussées, passantde 90 pour cent à 3 pour cent des superficies, au point que 90 pour cent du bois estmaintenant importé (Bilsborrow, 1992). Selon la FAO (1986) et la Banque mondiale(Mink, 1993) la destruction de forêts, estimée par ¡mages satellitaires, atteindrait de 17à 20 millions d'hectares par an, dont environ la moitié en Amérique latine, et le taux dedeforestation dans le Tiers monde serait de l'ordre de 1 à 1.5 pour cent par an. Il nes'agit que d'une moyenne, et l'on cite des taux dépassant 10 pour cent au Nigeria et enCote d'Ivoire.
S'il n'existe aucune certitude sur la part de chacun des facteurs en cause sur ladégradation de l'environnement, cela peut à l'évidence inhiber l'action. Cependant, biendes experts répondent: "si nous attendons d'avoir des certitudes, l'accumulation rendrale traitement du phénomène quasi impossible, en tout cas ne fera que rendre celui-ciplus coûteux". C'est un peu le pari de Pascal. Traiter les causes des détériorations del'environnement ne peut que présenter des avantages, quelles que soient les parts dechacune d'elles.
2.1. Les deux sources de la détérioration de l'environnement: richesse etpauvreté
On s'accorde à dire que la détérioration de l'environnement est le fait, d'une part, despopulations riches, ou qui tendent à le devenir, notamment par la production et laconsommation de produits industriels et, d'autre part, de la pauvreté.
Pour ce qui est des pays riches une abondante documentation sur la consommation dematières premières et sur la pollution entraînée par l'industrialisation, et par lamodernisation de l'agriculture, montrent à l'évidence une responsabilité de ces paysdépassant de loin celle du Tiers monde dans la détérioration de l'environnement.Citons quelques chiffres ayant valeur synthétique, ceux de la CommissionIntergouvernementale sur le Changement de Climat (Intergovernmental Panel onClimate Change, IPCC). Les émissions de gaz carbonique dans le monde en 1985auraient été de 5.15 milliards de tonnes, dont 3.83 par les pays développés et 1.33 parles pays en développement. Par tête les chiffres seraient de 3.83 tonnes par habitantde pays développé et 0.36 par habitant du Tiers monde (IPCC, 1991). Nousreviendrons plus en détail sur ces chiffres.
Pour ce qui concerne le Tiers monde, la majorité des auteurs, notamment Bilsborrow(1992) et Martine (1993a, 1993b), montrent que l'augmentation des bouches à nourriret la pauvreté poussent souvent les paysans à cultiver plus intensément des terres
44

marginales, à déboiser, à diminuer les périodes de jachère, à faire du surpaturage, àrépéter les cultures sur brûlis, contribuant ainsi à l'appauvrissement des sols.
La forte croissance démographique peut entraîner une augmentation de la demandealimentaire avec plusieurs sortes de conséquences:
- Déboisement de terres converties à l'agriculture pour nourrir une populationcroissante avec tout ce que cela peut impliquer pour l'environnement: perte dematières organiques sur les terrains défrichés, appauvrissement de labiodiversité, intensification de l'érosion, finalement diminution de la fertilité dessols. Le déboisement peut raréfier l'offre de bois, et augmenter son prix, si bienque par un cercle vicieux le déboisement se trouve accéléré.
- Usage plus intensif des terres déjà consacrées à l'agriculture au moyen defertilisants chimiques et de pesticides, et expansion de l'agricuture vers desterres marginales pauvres ou déboisées, ou dont la productivité estartificiellement rehaussée au moyen également d'engrais chimiques et pesticides.
- Utilisation plus intensive des terres de petits fermiers pauvres et chargés defamille, amenés pour leur survie aux pratiques que nous venons de décrire. Celafait partie de ce que Bilsborrow (1987) appelle une "stratégie de survie duménage" ("household survival strategy").
- Conversion de forêts tropicales en pâturage pour la production de viande.
- Migration de fermiers vers de nouvelles terres, ou des terres marginales, ou nonconsacrées jusque là à l'agriculture. La migration peut aussi être le fait desenfants du fermier dont les terres ne peuvent suffire à un partage entre tous lesenfants survivants, et dont le nombre a pu augmenter en raison de la baisse de lamortalité. Certes, la migration est souvent une façon efficace de soulager lapression démographique dans certaines terres, ou pour pallier la mauvaisedistribution des terres fertiles, mais bien des auteurs ont montré combien lamigration d'aires rurales vers d'autres aires rurales a pour conséquence undéboisement de terres nouvelles ou marginales.
- Eviction de terres exploitées par des populations autochtones par les migrantscolonisant les "nouvelles" terres, ou par les grands propriétaires.
- Concentration des propriétés, les petits fermiers étant conduits du fait de leurpauvreté, et de leur charge de famille, ou parce que ne pouvant supporter laconcurrence avec les grandes propriétés, à vendre leur lopin de terre à de richesfermiers, ce qui aurait pour conséquence d'augmenter la concentration despropriétés. Et l'on sät que les grands propriétaires à la recherche de profitsmaximum utilisent des méthodes culturales intensives et dommageables àl'environnement. Les lois du marché sont souvent plus responsables de laconcentration des propriétés que les facteurs démographiques, ou s'ajoutent àces derniers.
- Excès de pêche dans des eaux qui peuvent devenir polluées par les déchargesindustrielles ou autres.
Derrière les facteurs démographiques se profilent d'autres facteurs moins apparents,ayant une incidence indirecte, mais pouvant avoir un impact considérable surl'environnement. Ces facteurs peuvent être d'ordre économique, social, politique. Cesont les facteurs "sociaux inhérents" ("socially constructed") (Bilsborrow, 1992).
45

Parmi ces facteurs on doit citer le coût élevé de l'énergie incitant la population àdéboiser pour obtenir du bois de chauffe, l'absence de réforme agraire, l'incitation desgouvernements à la colonisation de nouvelles terres, l'insuffisance du titre de propriétédes petits fermiers dont la situation juridique devient précaire, les subventions desgouvernements à l'exportation de bois, les incitations des autorités au remplacementdes cultures vivrières par des cultures destinées à l'exportation, notamment de viande,les mécanismes du marché.
Prenons l'exemple souvent cité de l'Amazone brésilienne. On y trouve une conjonctionde tous les facteurs cités, démographiques ou "socially constructed": la fortecroissance démographique du Nord-Est, et la croissance désordonnée de villesgéantes d'où émanent nombre d'immigrants, ainsi que l'insuffisance des services deplanning familial dans ces zones. Ces facteurs sont les causes primaires del'immigration dans cette partie de l'Amazone et de la détérioration de sonenvironnement. Cependant, d'autres facteurs ont joué de façon indirecte: la pauvretécar le déboisement constitue l'opportunité la plus attirante pour les nouveaux venusdans la force de travail, ne requérant aucun capital et aucune qualification particulière;l'insuffisante réforme agraire dans le Nord-Eest et le Sud-Est du pays; les incitationsdu gouvernement à l'émigration des populations du Nord-Est et à la colonisation del'Amazone; les déplacements massifs facilités par l'aménagement du réseau routier(Trans-Amazonia Highway); les subventions à l'exportation de bois exotiques ou debois de construction, encourageant ainsi le déboisement; l'expansion des culturesextensives et la réorganisation des systèmes de production agricole; l'inégalité socialepoussant les petits fermiers à exploiter des terres marginales pour leur survie quelsqu'en soient les dommages à l'environnement. Aucun de ces facteurs ne peut à lui seulexpliquer la détérioration de l'environnement dans ces zones.
De nombreuses études corroborent ces analyses, telles celles de Bilsborrow etDelargy (1990) pour le Guatemala et le Soudan, de Stonich (1989) pour l'Amériquecentrale, Barberis (1993) pour Java, Cruz et al. (1992) pour les Philippines et CostaRica, Panayotou (1989) pour la Thaïlande, et de façon générale les synthèses deBarberis (1993), les nombreux rapports de la FAO et de la Banque mondiale.
Bilsborrow et Geores (1991), dans une analyse statistique portant sur 85 pays endéveloppement, ont obtenu une corrélation élevée et significative entre le taux dedéboisement et le taux d'accroissement de la population rurale de ces pays.
Pour ce qui concerne l'Afrique sub-saharienne, les habitants y vivent dans unenvironnement difficile, et qui s'est dégradé au cours des dernières décennies au pointque la région arrive de moins en moins à couvrir ses besoins alimentaires. Si l'onexclut les aires désertiques, les zones sèches couvrent 43 pour cent des superficiesoù vivent 66 pour cent de la population. La désertification de l'Afrique, dont l'étendueest hautement contestée et le mécanisme encore peu compris, est imputée parpresque tous les auteurs, et comme pour les autres régions du Tiers monde, à unfaisceau de facteurs: certains structurels, liés au développement social et économique,climat, activité humaine, conflits ethniques, croissance démographique des humains etdes animaux. On ne sait pas si la désertification, phénomène certain, mais complexe,et dont l'ampleur est mal estimée, est réversible. Selon la FAO (1992) la désertificationserait un aspect d'une détérioration générale des écosystèmes sous l'effet combiné defacteurs climatiques et de changements dans les pratiques agricoles.
46

2.2. L'effet de l'environnement sur la démographie
On peut distinguer trois effets de l'environnement sur la démographie: les catastrophesnaturelles, la santé et la migration.
Les catastrophes naturelles
II peut paraître banal de dire que l'une des sources les plus fortes d'iniquité réside dansla qualité de l'environnement "naturel" et dans la base des ressources du pays danslequel chacun est né, ou dans lequel il réside. Dans la plus grande partie del'hémisphère Nord, et notamment en Europe, l'environnement "naturel" est relativementfavorable, alors qu'il est souvent préjudiciable à la santé, et plus généralement à laqualité de la vie, dans l'hémisphère Sud où les conditions climatiques sont dures et lesterres moins fertiles, particulièrement dans les tropiques. On pourrait presque ajouterque l'environnement est dans l'hémisphère Sud un obstacle au bien-être despopulations et au développement économique. Le Tiers monde est, d'ailleurs, bien malarmé pour affronter les calamités naturelles, ou autres, qu'il s'agisse des séismes oud'inondations ou d'accidents industriels graves comme celui de Bhopal en Inde.
De plus, c'est dans l'hémisphère Sud que la croissance démographique est la plusrapide, la distribution géographique des populations la plus déséquilibrée avec desvilles gigantesques, et pour lesquelles les projections des Nations Unies (1993)prévoient une croissance encore plus forte à l'avenir en raison, soit de l'accroissementnaturel, soit du fort potentiel d'immigration des milieux ruraux.
Redresser les "iniquités naturelles" créées par l'environnement serait une tâcheredoutable. Ce devrait être un des thèmes de coopération entre pays inégalementtraités par l'environnement. Protéger Hanoï contre les inondations est concevable,mais protéger le Bangladesh pris entre les inondations de l'Océan indien au sud et duGange à l'intérieur est une oeuvre de Titan. Il est cependant des travaux dont le coût-bénéfice peut paraître à la portée de la communauté internationale. Donnons l'exempledes populations souffrant de déficit en iode. Selon l'OMS (1990) des centaines demillions d'habitants sont atteints de cette déficience, essentiellement dans des pays endéveloppement, par manque de ce minéral dans les plantes sur des sols pauvres eniode. Cependant des solutions simples et peu coûteuses, sont envisageables:iodinisation du sel ou dans les puits (OMS, 1988; Fisch et al. 1993). Aucune mesuren'a encore été prise à l'échelle nationale ou internationale.
De nombreuses autres sources "d'iniquité naturelle" peuvent être citées, comme leshabitats dans des aires présentant des risques écologiques (aires menacéesd'inondation, de glissement de terrain, de tremblement de terre, désertification), parceque ces aires sont impropres à un habitat sain, ou parce que la surpopulation et lapauvreté ne laissent aucun autre choix. Nous avons tous à l'esprit le récenttremblement de terre (octobre 1993) qui a frappé l'ouest de l'Inde et fit des milliers demorts et des destructions considérables. A peu près au même moment Q'anvier 1994)un tremblement de terre à Los Angeles de même intensité (5. 8 dans l'échelle deRichter) fit une soixantaine de morts et moins de familles sans abri.
47

Lasante
Les altérations de santé sont parmi les plus importantes conséquencesdémographiques de la qualité de l'environnement ou des changements del'environnement. De fait, la première, et la plus grande, lutte des humains contrel'environnement, a été une pollution biologique aux effets meurtriers et facilementdiscernables: les grandes épidémies, dont il fallut attendre l'ère pasteurienne pour ensaisir les causes et trouver des moyens efficaces d'action.
L'un des dangers les plus menaçants pour la santé est la rareté grandissante de l'eaudue, en grande partie à la croissance démographique, et sa contamination. L'eau estdélicate, si délicate qu'elle est tombée elle-même malade à force d'absorber duphosphore, de l'azote, du mercure, de l'arsenic, du plomb. Elle peut être extrêmementdangereuse si elle n'est pas convenablement traitée, ce qui suppose d'importantsmoyens économiques. On se souvient de l'état d'une population japonaise gravementatteinte à Minamata en 1968 par de l'eau contaminée d'oxyde de mercure. Desmaladies qu'on croyait vaincues par l'amélioration des systèmes d'approvisionnementen eau ont fait récemment leur réapparition, comme l'épidémie de choléra qui a touchéde nombreux pays latino-américains en 1991.
Le Groupe d'Experts des Nations unies sur la Population, l'Environnement et leDéveloppement (United Nations, 1992), a estimé que 88 pays en développement, soit40 pour cent de la population mondiale, tous avec des taux de croissancedémographique comprises entre 2. 5 et 3. 8 pour cent par an, souffraient de rareté del'eau. Mais il est bien évident que si le facteur démographique joue un rôle important,l'absence de développement joue également un rôle, au moins pour la qualité de l'eau.On pourra se reporter sur l'importante question de l'eau aux travaux de Falkenmark(1989a, 1989b).
L'OMS (1992) a publié un important rapport sur la santé et l'environnement en vue dela préparation de la Conférence de Rio de Janeiro sur l'environnement. Cette fois il nes'agit pas de catastrophes naturelles inévitables, mais du fait que des millions depersonnes perdent la vie ou la santé à cause de maladies pourtant evitables queprovoque le milieu dans lequel elles vivent: pollution de l'air dans les logements ou àl'extérieur, causée par l'utilisation de combustibles de la biomasse et d'autres formesd'énergie, pollution atmosphérique dans les villes où s'est développée l'industrie, décèsde 4 millions de nourrissons et d'enfants en bas âge dus chaque année à des maladiesdiarrhéiques, transmises par l'eau ou la nourriture contaminée, décès de plus d'unmillion de personnes annuellement causés par le paludisme, et infections nouvelles de276 millions de personnes, etc. Les conditions de travail sont également responsablesde maladies respiratoires, mais pour lesquelles le facteur démographique est peuresponsable. L'OMS (1993) a récemment publié une Stratégie mondiale OMS pour laSanté et l'Environnement conçue essentiellement dans un esprit de prévention.
Les migrations
On observe de plus en plus des mouvements de population dus aux changements del'environnement. Il existe de nombreux exemples de "réfugiés dus à l'environnement"("environmental refugees"), notamment dans des zones tropicales affectées par une
48

très haute croissance démographique, la sécheresse, le déficit en eau, ou la diminutionde la fertilité des sols entraînée par la deforestation, l'épuisement des sols et, de façongénérale dans toute aire qualifiée "d'écologiquement instable". Les perspectivesparaissent inquiétantes avec la possibilité d'un réchauffement du climat, la montée duniveau de la mer pour les millions de personnes vivant près des côtes. Et l'on sait que60 pour cent de la population mondiale vit à moins de 80 kilomètres des côtes.
3. L'avenir de la population mondiale et ses conséquences surl'environnement
3.1. Les projections démographiques des Nations unies
La croissance démographique est bien mesurée à peu près partout dans le monde, etdes projections à très long terme sont périodiquement effectuées par les Nations unieset par la Banque mondiale. Les derniers calculs des Nations unies portent sur une trèslongue durée puisqu'ils vont pour la première fois jusqu'en 2150 par grandes régions(Grinblat, 1993). L'hypothèse fondamentale est que les populations tendent l'une aprèsl'autre vers une situation stationnaire, hypothèse commode, commune à toutes lespopulations, mais qui ne repose sur aucun argument théorique, ou même historique.C'est cependant la seule que l'on puisse retenir actuellement. Pour la première foisaussi 7 variantes sont distinguées, allant d'une fécondité basse à une féconditéconstante. Les résultats sont donc très ouverts, allant de 5.3 milliards d'habitants en1990, à 694,2 milliards en 2150 dans la variante "fécondité constante" et à 4,3 milliardsdans la variante "basse" qui suppose donc des baisses subtantielles de fécondité.
3.2. La plausibilité des hypothèses
Ces deux variantes étant de toute évidence aussi peu crédibles l'une que l'autre,intéressons-nous plutôt aux deux variantes intermédiaires "moyenne" et "moyennehaute". La première donne 11,5 milliards en 2150, et la seconde 20,8 milliards. Et,cependant, les deux variantes diffèrent assez peu dans les hypothèses d'évolution dela fécondité: de l'ordre de 7 pour cent en 1990-95, pour monter jusqu'à 21 pour cent en2025-30, et redescendre jusqu'à 5 pour cent de 2100 à 2150. En moyenne, ladifférence de fécondité est de 10 pour cent. On n'est guère surpris qu'un écart de cetteampleur conduise à des résultats si divergents puisque la durée de la projection esttrès longue. Mais cela montre une fois de plus l'extrême sensibilité de l'évolutiondémographique future aux changements de fécondité, et l'importance qu'il faut attacheraux succès, ou aux échecs, des programmes de planification des naissances, si l'onsouhaite qu'une variante plutôt qu'une autre se rapproche de la réalité future. Bienentendu, nous ne saurions attribuer les changements de fécondité exclusivement auxpolitiques de planification familiale, mais celles-ci jouent un rôle important, voiredécisif, dans le Tiers monde.
On peut concevoir que fa croissance démographique soit gérable dans le cas de lavariante "moyenne" si des mesures d'accompagnement sont prises suffisamment àtemps sur le développement, l'entretien de l'environnement, la conservation des
49

ressources. Après tout, un doublement en 150 ans est un accroissement semblable àcelui que le monde a connu en seulement 42 ans entre 1950 (2,5 milliards d'habitants)et 1992 (5,4 milliards), il est vrai à une époque où le taux de croissance de lapopulation était parvenu à des sommets (2 pour cent) qu'on ne reverra sans doutejamais à l'échelle des générations actuelles, ou même prochaines. D'aucuns peuventlégitimement douter du bien fondé de l'assertion selon laquelle la croissancedémographique supposée dans cette variante serait gérable, puisqu'au cours de ces42 années l'environnement s'est déjà notablement détérioré, et la variante "moyenne",si mesurée soit-elle, peut paraître constituer elle-même un obstacle au progrèséconomique et social, et à un environnement sain.
Par contre, on peut se risquer à dire que la variante "moyenne haute", qui verrait à peuprès un quadruplement de la population entre 1990 (5,4 milliards) et 2150 (20,8milliards) créerait une situation intolérable avant le terme de la projection.
Le choix des hypothèses qui préside aux variantes est hautement spéculatif. Mais sil'on se réfère à la baisse continue de la fécondité des pays industriels au cours de cestrente dernières années on a toutes raisons de penser que pour ces pays la variante"moyenne haute", qui amènerait la population de ces pays à doubler entre 1990 et2150, passant de 1090 à 2156 millions, serait assez peu plausible. L'avenirdémographique des pays industriels est très difficile à projeter, mais il semble plusvraisemblable de s'en tenir à une variante"moyenneH qu'à une variante "moyennehaute". Au surplus, on imagine aisément la réaction des écologistes et de tous ceuxqu'inquiète l'inégalité des conditions de vie dans le monde devant la perspective devoir doubler les habitants des pays riches qui consomment infiniment plus deressources naturelles et qui polluent cinq fois plus l'environnement que les paysactuellement en développement.
Par contre, pour les pays en développement il convient de retenir les deux variantes"moyenne" et "moyenne haute" qui, en fait, comme nous l'avons dit, ne diffèrent quepeu dans l'évolution de la fécondité, avec les distinctions qui suivent.
La population de l'Afrique, estimée à 642 millions en 1990, passerait à 2265 millions en2050 et à 3090 millions en 2150, selon la variante "moyenne", et à 5640 millions en2150 selon la variante "moyenne haute", soit une multiplication par 3, 5 d'ici à 2050 et4, 8 d'ici à 2150 selon la variante "moyenne", et 8, 8 d'ici à 2150 selon la variante"moyenne haute". La densité moyenne actuellement de 25 au kilomètre carrépasserait, selon la variante "moyenne", à 75 en 2050 et à 102 en 2150. Quelle que soitla variante choisie et la durée de la projection, on ne pourra bientôt plus parierd'espaces vides dans le continent africain, comme on l'a souvent fait dans le passé.
L'accroissement de la population de l'Inde serait presque aussi spectaculaire de cellede la population africaine. Selon la variante "moyenne" la population de 853 millions en1990 passerait à 1699 millions en 2050 et à 1949 millions en 2150. La densitéactuellement de 275 au kilomètre carrés passerait à 520 en 2050 et à 596 en 2150,soit proche de celle du Bangladesh d'aujourd'hui. Et bien plus, selon la variable"moyenne haute".
La Chine, quant à elle, a subi un véritable traitement de choc depuis 1980 avec lapolitique rigoureuse que l'on sait, et elle aurait une croissance bien moindre au coursdu prochain siècle. Le chiffre de la population passerait de 1139 millions en 1990 à unsommet de 1521 millions en 2050, pour redescendre à 1389 millions en 2150, toujours
50

selon la variante "moyenne". Par contre, selon la variante "moyenne haute", lapopulation continuerait de croître jusqu'à 2367 millions en 2150. L'exemple de la Chinemontre, ici encore, combien une politique efficace de réduction de la natalité peut avoirdes effets sur le chiffre de la population puisque les deux variantes "moyenne" et"moyenne haute" conduisent à des chiffres qui peuvent différer de un milliard environ. Ilparaît plausible de ne pas retenir la variante "moyenne haute", car si le payss'engageait sur cette trajectoire on peut gager que le gouvernement interviendrait avecles moyens et le succès que l'on sait pour freiner la croissance.
Selon les deux variantes, la population de l'Inde dépasserait de très loin celle de laChine dès 2050. Or, la superficie de l'Inde est trois fois inférieure à celle de la Chine,qui comporte il est vrai plus d'espaces désertiques et montagneux.
Le gigantisme de nombre de pays asiatiques ira en s'accentuant, non seulement pource qui concerne l'Inde et la Chine, mais encore le Bangladesh, l'Indonésie, le Japon, lePakistan, les Philippines, la Thaïlande, pays qui compteront tous une ou plusieurscentaines de millions d'habitants avant la fin du prochain siècle. Ce sera une desdonnées essentielles des 21ième et 22ième siècle, car cela va inéluctablement avoirdes conséquences, d'abord sur les densités, ensuite sur l'urbanisation, alors quenombre de villes ont des populations atteignant déjà une dizaine, voire une vingtainede millions d'habitants, sur les migrations internes et internationales, surl'environnement dans les villes, sur les échanges commerciaux, la plupart étant déjàentrés dans un processus de croissance économique plus rapide même que celui despays actuellement développés. La région va constituer un énorme bassin deconsommateurs et de producteurs qui ont déjà démontré une capacité d'adaptation auxtechnologies les plus modernes.
Nous assistons à un déplacement du centre de gravité mondial vers la région Asie-Pacifique pour des raisons à la fois économiques et démographiques. La population del'Asie, selon la projection "moyenne" des Nations unies, continuera de représenterenviron la moitié de la population mondiale pendant encore 150 ans. On peut tablerque la mutation démo-économique de la région Asie-Pacifique devrait permettre, enl'espace d'une vie, de sortir de la pauvreté des millions d'habitants de la région.
Mais l'on pense évidemment aussi aux conséquences des densités élevées du pointde vue des catastrophes naturelles, comme les inondations qui affligent déjà leBangladesh, les typhons aux Philippines, les tremblements de terre qui menacent àpeu près tous les pays de la région. Chaque année on compte 120 tremblements deterre dans le monde, dont l'intensité, mesurée en échelle de Richter, est compriseentre 6 et 6,9.
Les projections démographiques posent bien d'autres interrogations. Tenons-nous enencore à la variante "moyenne", quel que soit le scepticisme que l'on puisse éprouver àson endroit. On est pris de doute sur l'hypothèse du déclin de la fécondité pourl'Afrique, compte tenu de l'absence de conditions économiques et sociales devantaccompagner ce déclin selon ce qu'enseigne la théorie de la transition démographique.L'indice synthétique de fécondité diminuerait de moitié en 30 ans, passant de 6 à 3naissances par femme entre 1990-95 et 2020-25. Cela passe encore pour l'Afrique duNord où le taux de prévalence de la contraception atteint ou dépasse 60 pour cent.Mais cela est peu admissible pour l'Afrique sub-saharienne où le taux de prevalenceest de l'ordre de 10 pour cent seulement.
51

De même, l'Inde, dont l'indice de fécondité a très lentement baissé ces dernières 40années, en dépit de l'attitude très favorable à la contraception des gouvernements,atteindrait selon la variante "moyenne" dès 2020-25 un niveau assurant tout juste lerenouvellement des générations. Le Bangladesh serait dans la même situation. Or, labaisse de la fécondité dans ce pays, l'un des plus défavorisés par son environnement,vient à peine de commencer.
3.3. Une nouvelle interprétation de la théorie de la transition démographique
Une nouvelle interprétation de la théorie de la transition pourrait venir à l'appui deshypothèses de baisse de la fécondité en l'absence d'amélioration suffisante desconditions économique et sociales (Tabah, 1983, 1993). Jusqu'ici l'adoption depratiques contraceptives était conditionnée par un "terrain d'accueil" fait d'une certaineamélioration du niveau d'éducation, du statut de la femme, et de façon générale demeilleures conditions de vie. Il n'est pas exclu que nous assistions à ce que l'onpourrait appeler le développement d'une "contraception de pauvreté", facilitée par ladiffusion intensive de la propagande en faveur de la limitation des naissances aumoyen de communications de masse de plus en plus puissants, et atteignant toutesles couches de la population. On peut gager qu'à l'avenir les moyens modernes decontraception seront à la portée de toutes les populations, riches ou pauvres, et queles facteurs d'inhibition de leur utilisation disparaîtront progressivement. De tellespropagandes sont déjà à l'oeuvre en Asie, en Amérique latine, et même au nord duSahara. Par contre, elles sont très timides, sinon inexistantes, au sud du Sahara.
Autant on peut penser que les hypothèses sur la baisse de la fécondité des projectionsdes Nations unies paraissent plausibles pour les nouveaux pays industriels de l'Asie(Chine, Indonésie, Malaisie, Philippines, Thaïlande), le Viet Nam, l'Afrique du Nord,l'Amérique latine presque entière, autant ces hypothèses paraissent peuvraisemblables pour l'Afrique sub-saharienne, l'Inde, le Bangladesh, le Pakistan,l'Afghanistan, certains pays du Proche-orient.
Cela nous amène à une observation d'une grande portée du point de vue des relationsentre la croissance démographique et l'environnement.
Les pays de la première catégorie, ceux pour lesquels nous pensons que la baisse dela fécondité dans la variante "moyenne" est plausible, sont déjà largement entrés dansla transition démographique, et ils parviendront dans les prochaines décennies auterme de cette transition.
Considérons, en effet, pour ces populations le moment où l'indice synthétique defécondité tomberait à 2,5 naissances par femme, soit un niveau semblable à celui despays actuellement développés, vers 1965, et le chiffre des habitants à ces moments,toujours selon la projection "moyenne" des Nations unies (1988, 1990). Le calcul estprésenté dans une étude de Tabah (?).
On constate, d'abord, qu'en 1985 très peu de pays du Tiers monde avaient un taux defécondité inférieur à 2,5, en dehors du cas du pays actuellement le plus peuplé dumonde, la Chine, ou de petits pays, tels Ile Maurice, Hong Kong, Barbado, Cuba,Martinique, Porto-Rico. Entre 1985 et 1990, ce sont encore des pays de dimensionrelativement faible, à part la Corée du sud avec 44 millions d'habitants et la Thaïlande,avec 46 millions d'habitants, qui étaient dans cette catégorie, tels Sri Lanka, Guyane,
52

Jamaïque. Vers la fin de ce siècle de grands pays entreraient dans la catégorie,presque essentiellement en Asie et Amérique latine: Indonésie, Viet Nam, Malaisie,Fidji, Turquie, Argentine, Chili, Colombie, Mexique, Costa Rica, Panama. Entre 2010 et2020 de nombreux pays feraient à leur tour leur entrée dans la catégorie: en Afrique duNord (Algérie, Egypte, Maroc), en Amérique latine (Brésil, République Dominicaine,Equateur, Pérou), ou en Asie (Inde, Philippines, Myanmar, Koweit, Bahrein). Enfin, en2020-25, on trouverait trois pays africains seulement (Afrique du Sud, Ghana, Cap-Vert), certains pays du Proche -Orient (Iran, Jordanie, Emirats Arabes Unis), et surtouttrois grands pays asiatiques: Bangladesh, Pakistan, Cambodge.
Vers 2025, une longue liste de pays en développement se trouverait dans unedeuxième catégorie: ceux qui seraient encore très loin d'achever leur transitiondémographique. On trouve dans cette liste 40 pays africains, 8 latino-américains et 8asiatiques d'importance numérique relativement faible (dont 5 du Proche-Orient).
3.4. Quatre groupes de pays
On peut dès lors diviser le monde de 2025, du point de vue démographique, en quatregroupes selon les situations dans la transition démographique:
Premier groupe. Les pays actuellement développés au-delà de la transitiondémographique (Europe, Amérique du Nord, Océanie, ancienne URSS) dont lapopulation serait estimée à 1237 millions d'habitants en 2025 et 1191 en 2100.
Deuxième groupe. Les pays nettement entrés dans la transition démographique, maisappartenant encore au Tiers monde, et qui seront les premiers à s'en détacher: laChine et d'autres pays d'importance démographique faible, tels Ile Maurice, HongKong, Barbade, Cuba, Martinique, Porto Rico, République de Corée. Pour simplifierl'analyse nous ne retiendrons dans ce groupe que la Chine. Bien que les taux defécondité soient faibles, de l'ordre de 2 naissances par femme, ou peu supérieurs, lestaux de croissance sont encore nettement positifs en raison du potentield'accroissement accumulé dans les structures par âge. La population de la Chine en2025 serait de 1513 millions, et 1405 en 2100, toujours selon la variante "moyenne".
Troisième groupe. Il est constitué de pays qui seraient en 2025 sur le point deparvenir à l'achèvement de la transition, ce qui ne veut pas dire, ¡ci encore, que leurcroissance serait nulle à cette date en raison du potentiel acquis et qui demanderaencore plusieurs décennies pour s'éteindre complètement. Ils sont dans ce que Keyfitz(1994) appelle une "transition intermédiaire". La population du groupe en 2025 serait de3922 millions, avec la répartition suivante: Afrique 306 (dont Afrique sub-saharienne105, Afrique du Nord 201), Amérique latine 573 (dont Caraïbes 24, Amérique centrale159, Amérique tempérée 70 et Amérique tropicale 320), Asie 3043. La population dugroupe serait de 5860 millions en 2100.
Quatrième groupe II serait constitué de pays dont la fécondité serait en 2025supérieure à 2,5, donc encore loin d'achever leur transition démographique. Ilcomprendrait 1832 millions d'habitants en 2025, avec la répartition la suivante (enmillions d'habitants):Afrique 1292 (dont Afrique sub-saharienne 1218, Afrique du Nord73), Amérique latine 184 (dont Caraïbe 26, Amérique centrale 54, Amérique tropicale
53

104), Asie 357. On peut considérer qu'en 2100 seule l'Afrique sub-sahariennesubsisterait dans le groupe. Il comporterait alors 2730 millions d'habitants.
Du point de vue de l'importance numérique le Groupe 1, celui des pays actuellementdéveloppés, est le plus faible et il le resterait selon toutes probabilités jusqu'en 2025, etbien au-delà, jusqu'à la fin du siècle.
Le Groupe 2, constitué par la Chine, serait à lui seul en 2025 d'importance déjà trèssupérieure à celle des pays actuellement développés.
Le Groupe 3, celui des pays du Tiers monde entrés dans la transition démographique àune allure qui peut être qualifiée de rapide, et dans lequel l'Asie aurait une partdominante, serait le plus nombreux en 2025, et le resterait au moins jusqu'à la fin duprochain siècle et le milieu du 22ième siècle. Il comporterait 1322 millions d'habitantsen 1990, 3922 millions en 2025 et 5860 millions en 2100.
Le Groupe 4, dans lequel l'Afrique sub-saharienne aurait une part dominante, aurait,en 2025, 1832 millions d'habitants. Il serait celui qui croîtrait le plus rapidement au-delà de 2025, puisque l'Afrique seule atteidrait 2730 millions d'habitants à la fin duprochain siècle. Et, cependant, comme nous l'avons vu, l'hypothèse de la baisse de lafécondité de la région dans la variante "moyenne" des projections nous a paruoptimiste.
On peut penser que les populations de ces quatre groupes exerceront des pressionsdifférentes sur les ressources et l'environnement.
Le Groupe 1 et le Groupe 4 sont relativement homogènes. Le premier représente, dupoint de vue de l'environnement, tous les risques inhérents à la richesse. Il est celui quiconsomme le plus de ressources naturelles et pollue le plus par son industrialisation,son agriculture intensive, et ses normes de consommation. Il y a tout lieu de penserque cette situation continuera au cours des décennies à venir, mais on peut penseraussi que ce groupe est le mieux équipé pour développer des technologiesappropriées pour faire face aux problèmes créés. Seront-elles suffisantes etdisponibles en temps opportun? C'est la question fondamentale qu'il faut se poser.
Le Groupe 3 est très hétérogène. Il comporte des pays parvenus à une forme avancéed'industrialisation, fortement compétitifs avec ceux du Groupe 1 sur le planéconomique. C'est notamment le cas de la Corée du sud, de Taïwan, Hong Kong,Singapour. L'industrialisation y a été facilitée par des réformes agraires, comme ce futle cas de la Corée dès après la guerre de 1950-53. Leur fécondité est basse, et en faitpresque plus rien ne les distingue des pays riches sur le plan démographique commesur le plan économique. On aurait dû les ranger dans la catégorie des pays riches il y adix ou vingt ans, dont ils ont toutes les caractéristiques: usines avec chaînes demontage, éducation de masse, fort développement des mass media, urbanisationélevée avec embouteillages, pollution. D'autres pays de ce deuxième groupe ont uneéconomie dont la dominante reste agraire, comme l'Inde, mais qui s'industrialisentaussi rapidement, et occupent une place grandissante sur la scène économiqueinternationale, notamment ceux que l'on appelle les nouveaux pays industriels de l'Asie(Indonésie, Thailande, Malaisie). Il en est de même du Brésil, du Mexique, de laColombie. L'hétérogénéité intérieure dans ces pays est aussi très grande. On y trouvesimultanément une économie agraire, une économie industrielle souvent poussée, et
54

un développement des services, avec les formes de pollution caractéristiques de cestrois phases.
Les Groupe 2 et 3 méritent bien l'appellation de "pays en développement". Ils sontimpressionnants par leurs dimensions démographiques actuelles et potentielles, et parles changements dans les modes de vie. En seulement 35 ans le Groupe 3 sortirait dela transition démographique, qui historiquement s'est toujours caractérisée par unprocessus d'industrialisation, et il entrerait nécessairement, si ce n'est déjà le cas,dans un enchaînement industrialisation-pollution et consommation accrue deressources naturelles. C'est la situation qui prévaut depuis des décennies dans leGroupe 1, mais sans que ces pays disposent encore de technologies et de moyens deconservation de l'environnement, ou encore sans volonté politique de les utiliser. Dès2025 le rapport des populations entre le Groupe 1, d'une part, et l'ensemble desGroupe 2 et 3, d'autre part, serait de 1 à 3. En 2050 le rapport dépasserait 1 à 5, et 1 à6 à la fin du siècle prochain.
Enfin, le Groupe 4, présente les risques pour l'environnement inhérents à la pauvreté.Ces risques vont trouver des limites contrairement à ceux du premier groupe. Il necesserait d'augmenter démographiquement jusqu'au dernier quart du siècle prochain. Ilest affligé de problèmes déjà graves d'environnement (désertification, déboisement,insuffisance et pollution d'eau, etc). La priorité majeure est de subvenir aux besoinsfondamentaux immédiats, plutôt que de préserver un futur dont l'horizon est court et secompte en termes de jours ou de semaines de subsistances. On peut considérer queseule l'Afrique sub-saharienne demeurerait dans ce groupe à la fin du siècle prochain.
En résumé, les poids démographiques seraient les suivants:
Année
Groupe 1
Groupe 2
Groupe 3
Groupe 4
Total
(chiffres en millions)
1990
1089
1139
1322
1742
5292
2025
1237
1513
3922
1832
8504
2100
1191
1405
5860
2730
11186
3.5. Projections sur la pollution et le réchauffement du globe
Dans divers modèles traitant de l'évolution du climat il est supposé que l'émission degaz carbonique dépend de cinq facteurs: volume de la population; PNB par tête;intensité d'énergie, c'est-à-dire rapport entre la consommation d'énergie et le PNB;intensité du charbon, c'est-à-dire rapport entre la consommation de charbon et laconsommation totale d'énergie fossile; deforestation.
On prend généralement le taux d'émission du gaz carbonique comme indicateur dudegré de pollution, car il serait responsable pour deux-tiers de la pollution, et on établitune relation entre le degré de pollution et le réchauffement du globe.
55

Nous nous baserons sur les scénarios du Comité Intergouvernemental sur leChangement de Climat (IPCC, 1991) établi sous les auspices du Programme desNations unies pour l'Environnement et l'Organisation Météorologique Mondiale, ainsique le Rapport au Congrès des Etats-Unis présenté par l'Agence Américaine pour laProtection de l'Environnement (EPA) discutés par N. Birdsail (1992), Bongaarts (1992)et par le Réseau d'Action sur le Climat (Climate Action Network, CAN, 1993).
Les calculs sont effectués en termes de tonnes de gaz carbonique émis. On peut faireles observations suivantes:
- Sur 5.15 milliards de tonnes émises en 1985, 3.83 furent le fait des paysdéveloppés et 1. 33 des pays en développement. Les différences par tête furentbeaucoup plus marquées:3.12 et 0.36 millions de tonnes respectivement.
- Entre 1985 et 2025, la quantité de gaz carbonique émise devrait plus quedoubler, et la croissance aurait été beaucoup plus vive dans le Tiers monde quedans les pays actuellement industrialisés. Le chiffre global serait de 12.43milliards de tonnes en 2025, répartis entre 6.95 pour les pays actuellementdéveloppés et 5.48 pour les pays actuellement en développement. L'émissiondes pays asiatiques serait déjà en 2025 l'équivalent de l'émission des paysdéveloppés en 1985 (3.83 milliards de tonnes pour les pays développés en 1985,et 3.90 pour l'Asie en 2025). La Chine seule émettrait 1.80 milliards de tonnes en2025, soit plus que les Etats-Unis de 1985 (1.34 milliards de tonnes). Les paysasiatiques constituent ce que nous avons appelé le Groupe 2 (Chine) et les troisquarts du Groupe 3 (3043 millions d'habitants sur les 3922 millions quecompterait ce groupe).
- L'émission de gaz carbonique par tête ne cesserait d'augmenter d'ici à 2025, cequi montre bien que le facteur démographique est loin d'être seul en jeu. Mêmeen l'absence de croissance démographique les émissions de gaz carboniquecontinueraient. La croissance d'émission par tête serait plus forte dans le Tiersmonde que dans les pays actuellement développés. Les émissions par têteseraient pour les pays actuellement développés de 3.12 tonnes en 1985 et 4.65en 2025. Pour les pays actuellement en développement les chiffres seraientrespectivement de 0.36 tonnes et 0.84 tonnes. On assiste ainsi à un processusde "rattrapage" du Tiers monde par rapport aux pays riches dans la pollution. Cesscénarios contredisent donc la convention signée sur le climat à Rio demandantl'arrêt des émissions.
- La relation quantité de gaz carbonique émise par rapport à un dollar de PNB, ceque nous avons appelé intensité d'énergie, est beaucoup plus élevée dans lespays du Tiers monde qu'elle ne l'est dans les pays riches. Alors que l'émissionserait de 276 grammes pour un dollar de PNB dans les pays riches, elle serait de2024 grammes en Chine, de 655 grammes en Inde, 374 grammes en Républiquede Corée et 170 grammes au Brésil. Les chiffres élevés de la Chine et de l'Indes'expliquent en partie par le fait que ces deux pays fondent leur développementsur le charbon plutôt que sur d'autres formes d'énergie, autrement-dit ont uneintensité charbon élevée. N. Birdsall (1992) explique que les pays du Tiersmonde dans les premières périodes de leur développement, passant d'uneéconomie agraire à une économie plus industrielle, utilisent plus d'énergie parunité de PNB produite que les pays riches, dont l'évolution tend à passer desindustries aux services nécessitant moins d'énergie. Mais, ce qui importe pour le
56

réchauffement du globe c'est moins les émissions nouvelles-les flux- que lesconcentrations-les stock accumulés-car les gaz sont retenus dans l'atmosphèrependant de longues périodes, et pour le moment les concentrations sont plus lefait des pays riches que des pauvres.
- On considère que les émissions entraînées par le déboisement constituentenviron 20 pour cent du gaz carbonique émis et 50 pour cent du gaz émis parl'ensemble des gaz. Cependant, il y a des limites à cette source d'émission, carle déboisement a atteint dans bien des pays des taux très élevés et ne peutcontinuer au même rythme. Ces émissions vont se poursuivre pendant encorequelques décennies. Elles sont surtout le fait de ce que nous avons appelé leGroupe 4, et pour une part décroissante du Groupe 3.
- L'émission de gaz carbonique est appelée à s'accroître en tout état de cause,même si les pays développés parvenaient à émettre moins de gaz par dollarproduit, et si les pays du Tiers monde ajustaient leurs émissions au même niveauque les pays riches en 2100. Dans I' hypothèse relativement optimiste, oùl'émission tendrait partout vers 1.2 tonnes par tête, soit l'émission moyenneactuelle, N. Birsdall (1992) calcule que l'émission totale en 2100 serait encore de12.0 milliards de tonnes, soit plus de deux fois l'émission de 1985. Cettehypothèse suppose que des mesures portant sur les cinq facteurs retenusresponsables de l'émission de gaz carbonique seraient dès maintenantcommencées. Or, ce n'est malheureusement pas ce que l'on observe deux ansaprès la Conférence de Rio.
- Les modèles de l'IPCC et de l'EPA conduisent à un réchauffement de la planèted'ici à 2100 de 2.5 degrés si les émissions sont stabilisées au niveau de 1990 etde 4. 2 degrés si la stabilisation est ajournée à 2075. Cette stabilisation devraitintervenir simultanément dans tous les pays, riches ou en développement.
Bongaarts (1992), en discutant ces modèles, est parvenu à la conclusion quel'accroissement démographique contribuerait pour 35 pour cent à l'émission de gazcarbonique dans l'atmosphère entre 1985 et 2100. La part des pays en développementdans l'émission totale passerait de 36 pour cent en 1985 à 44 pour cent en 2025 et 54pourcenten2100.
4. Conclusions et recommandations
Ce qui frappe d'abord dans cette vue d'ensemble de la littérature récente traitant desinterrelations entre la population, les ressources et l'environnement, est l'absence devues fondamentalement divergentes de la part des chercheurs, contrairement à ce quel'on observe dans les débats politiques. Les incertitudes et les doutes sur le planscientifique ne manquent cependant pas et il en sera ainsi tant que l'on n1 aura pas faitun réel inventaire des problèmes de l'environnement de la planète, un bilan de santé,comme on dit. Les données sont, en effet, encore fragiles, surtout dans le Tiersmonde. Et, sans nul doute, faut-il commencer par améliorer la collecte des donnéesdans un cadre théorique de référence encore absent. En protégeant la diversité dessources d'information.
Quel est le degré d'information sur les questions des interrelations entre la populationet l'environnement? Une grande enquête comparative mondiale sur des données
57

objectives de l'environnement, nécessairement limitée à quelques points, relatifs à ladémographie, ou sur la perception des problèmes de l'environnement, comme on l'afait pour la fécondité, avec une quarantaine de pays en développement et la presquetotalité des pays industriels, s'avérerait hautement désirable.
La priorité devrait porter sur la collecte de données dans les zones particulièrementfragiles écologiquement, où la pression démographique est forte. Il faut aussi identifierles groupes de population particulièrement vulnérables parce que résidant dans ceszones et qui nécessitent donc une assistance technique et financière. Il faut porter uneattention particulière aux groupes de population susceptibles de doubler rapidement,ou au contraire celles en bonne voie de décélération, et observer les comportements etattitudes du point de vue de la consommation et de l'environnement de ces groupes.
Toutes les recherches montrent que le facteur démographique joue un rôle importantdans la détérioration de l'environnement, en conjonction avec bien d'autres variables,notamment économiques, sociales, politiques. Aucune de ces variables n'agitindépendamment des autres.
L'analyse des projections démographiques des Nations unies et de la Banquemondiale est d'une exceptionnelle importance. Ces projections montrent, une fois deplus, la très grande sensibilité de l'évolution démographique mondiale à l'évolution dela fécondité, et elles mettent ainsi en évidence tout l'intérêt qu'il faut attacher auxprogrammes de planification des naissances dans le Tiers monde. Ces programmespermettent d'accélérer la transition démographique sans attendre le pleindéveloppement. Leur succès permettrait d'éviter que la stabilisation de la population nes'effectue à des niveaux très élevés et dommageables pour l'environnement. Mais, enmême temps, en accélérant la transition démographique, et donc la consommation, ilsrendent plus urgentes les mesures de conservation de l'environnement. C'est pourquoiil paraît indispensable d'associer étroitement les politiques de maîtrise de la croissancedémographique et les actions de protection de l'environnement. Les deux actionsdevraient être indissociablement liées. Ce qui implique de meilleures liaisons entre lesinstitutions nationales et internationales traitant de ces questions, qu'il s'agisse del'assistance terchnique ou financière.
Du point de vue du développement, comme de la préservation de l'environnement,l'action doit veiller à ce que la variante "moyenne" plutôt que la "moyenne haute" desprojections démographiques des Nations s'inscrive dans le futur. Ce devrait être unerecommandation fondamentale. Cette recommandation devrait s'appliquer en toutepriorité aux pays actuellement développés (Groupe 1) car la variante "moyenne haute",au reste assez peu plausible pour ces pays, amènerait les populations à doubler d'ici àla fin du siècle prochain. Ces pays sont déjà responsables des deux tiers desémissions de gaz carbonique dans l'atmosphère, et donc de l'effet de serre et duréchauffement de la planète.
Mais ces projections montrent aussi que la grande masse du Tiers monde estégalement en voie d'achever la transition démographique vers 2025. Certains peuavant, d'autres peu après. Ce serait le cas du Groupe 2 (Chine) et du Groupe 3(presque l'ensemble des autres pays asiatiques et des principaux pays d'Amériquelatine). Ces deux groupes formeraient alors les deux tiers de la population mondiale,soit une masse de 5435 millions d'habitants dès 2025, qui s'ajouterait aux 1237millions du Groupe 1, et 7265 millions en 2100 s'ajoutant aux 1191 millions du Groupe
58

1. Or, qui dit fin de la transition démographique dit aussi nécessairement croissance deconsommation, industrialisation, et donc aussi pollution. Et, de fait, les dernièresstatistiques économiques du Tiers monde font état de progrès économiques rapides,au prix ¡I est vrai d'un coût social élevé, dépassant souvent nettement ceux des paysriches. Ce que nous avons tous appelé de nos voeux depuis longtemps. C'est d'abordle cas de la Chine dont le taux de croissance démographique est tombé aux alentoursde 1 pour cent, mais aussi des "nouveaux pays industriels" de l'Asie (Hong Kong,Indonésie, Malaisie, Singapour, Tailande), et même de l'Inde, plus récemment du VietNam, des grands pays d'Amérique latine (Argentine, Brésil, Chili, Colombie, Mexique,Pérou). On observe, pour la première fois, nombre de pays du Tiers monde dont lestaux de croissance du PNB sont très supérieurs aux taux de croissance de lapopulation. Certes, ces pays ont encore un long chemin à parcourir pour réduire ladistance sur le plan économique et social qui les séparent du Groupe 1. Leurshabitants vont pendant longtemps polluer chacun moins que ne le font ceux des paysriches, car les consommations ont encore du retard. Mais la pression surl'environnement sera considérable par la masse démographique. Ces deux groupesdeviendraient responsables de 44 pour cent des émissions de gaz carbonique dès2025, et de 54 pour cent à la fin du prochain siècle, comme le montrent les modèlesdes institutions internationales spécialisées sur le climat.
Quant au Groupe 4, dans lequel l'Afrique sub-saharienne occupe une placedominante, il présente toutes les caractéristiques d'une "pollution de pauvreté",occasionnée surtout par le déboisement. Pour le moment sa contribution auxémissions de gaz carbonique dans le monde est relativement faible et, d'autre part,cette source de pollution va connaître des limites car le déboisement est souventdevenu tel que la forêt est réduite à cause même du déboisement. Le groupe estdépourvu de moyens permettant de prendre des mesures pour la conservation dessois qui sont la base même de la survie des populations. Les dégradations causéessont d'une plus grande gravité pour la région que pour le reste du monde, etnotamment pour son agriculture. Elles continueront tant que l'on aura pas éradiqué lapauvreté elle-même.
Le temps presse car les évolutions à la fois démographiques et écologiques sontrapides à l'échelle de l'histoire de la biosphère. Il est urgent que les pays riches"remboursent" en quelque sorte leur "dette écologique", en transférant ressources ettechnologies moins polluantes au Tiers monde, même s'ils maîtrisent encore eux-mêmes très imparfaitement ces technologies. Il faut pour cela une volonté politiqueplanétaire, qui malheureusement n'a pas été réellement démontrée à la Conférence deRio sur l'environnement de 1992.
Une stabilisation immédiate des émissions de gaz carbonique dans l'atmosphère estassez peu réaliste, car on ne possède pas encore les technologies appropriées.D'autre part, le Tiers monde revendique un certain délai pour mettre en oeuvre lesmesures de conservation et d'aménagement de l'environnement sans compromettreles efforts de développement. Cependant, les deux objectifs devraient être menés defront si l'on vise un développement durable.
Cela ne veut évidemment pas dire que le Tiers monde devrait attendre, pourcommencer une oeuvre d'assainissement de l'environnement, que les ressources etles technologies venues de l'extérieur soient disponibles.
59

Bien entendu, on aurait tort de tout réduire aux questions techniques et penser qu'ilsuffit de colmater les brèches de l'environnement, et de distribuer dans le Tiers mondedes contraceptifs. La technique ne peut être qu'un remède partiel. Il faut agir plus auniveau des motivations qu'au niveau des moyens Diffuser la contraception dans leTiers monde sans agir sur les facteurs du milieu societal serait une entrepriseirrémédiablement vouée à l'échec.
Il importe de mettre en lumière l'intérêt croissant d'une action qui se situerait en amontdes détériorations de l'environnement.
Il faut élever le niveau de conscience des populations par un effort pédagogiquemontrant qu'au niveau de chacun on ne peut plus séparer révolution démographiquedes espèces vivantes de l'éco-évolution de la biosphère qui nous entoure.
On devrait faire une distinction entre les problèmes qui devraient être traitésimmédiatement, tels les combats contre la deforestation, la désertification, et toutessortes de pollutions (air, eau, sols), et ceux au niveau societal, comme l'insuffisanced'accès au planning familial, la lutte contre l'inégalité sociale, ou ce qui concernel'inégalité de condition entre les deux sexes, la réforme agraire, le ralentissement desflux d'immigrants vers les villes insalubres et surpeuplées, ainsi que l'a proposé uneréunion du CICRED (1992).
Il faut donner au terme population un contenu qui ne soit pas purementdémographique, élargissant considérablement son acception. Il faut aussi donner auterme environnement un sens dynamique en le considérant comme le support d'unpotentiel de ressources qu'il appartient de valoriser par l'application de technologiesappropriées sans cesse renouvelées. Les actions de correction du milieu, ou lesactions de conservation des ressources, ne peuvent se concevoir en dehors duconcours de la population, notamment à travers ces corps intermédiaires que sont lescommunautés de villages ou de villes qui sont des instruments puissants de libérationdes capacités d'innovation. "A portée de voix" si l'on peut dire. Pour la première fois,l'action sur l'environnement donne une chance à la population d'agir elle-même pourinfluencer l'avenir de la communauté à laquelle chacun appartient. Il faut redonnervigueur aux citoyennetés locales.
Il faudra donc s'appuyer sur les systèmes locaux d'organisation et de gestion descommunautés, tirer le meilleur parti possible des technologies et des ressourceslocales, tant pour affronter les questions d'environnement que de population.
Enfin, il convient d'agir auprès des organisations capables d'apporter une coopérationà l'échelle locale, nationale ou internationale. Dans la mesure où il existe desinstitutions nationales consacrées aux questions de l'environnement il faudraits'enquérir de la place et du rôle dévolus à la démographie par ces institutions.
Toutes les recommandations du Groupe d'experts sur La Population, l'Environnementet le Développement réuni du 20 au 24 janvier 1992, aux Nations unies à New york, envue de la préparation de la Conférence mondiale sur la population et le développementqui se tiendra au Caire en septembre de cette année, ne peuvent que retenir notreentière adhésion. Aussi nous invitons le lecteur à s'y reporter.
60

Références
Allen, J. and D. F. Barnes. 1985. The causes of deforestation in developing countries,Annals of the Association of American Geograohers, 75(2), 163-84.
Barberis, M. 1993. Issues in sustainable development: population, poverty and theenvironment. Prepared for the Round Table on Population, Environment andSustainable Development at the International Academy of the Environment,October, Geneva, Switzerland, 136.
Bilsborrow R. 1987. Population pressures and agricultural development in developingcountries: A conceptual framework and recent evidence, World Development,15(2), 183-203.
Bilsborrow, R. E. 1992. Rural Poverty, Migration, and the Environment in DevelopingCountries, Three Cases Studies, World Bank, Washington, D. C.
Bilsborrow, R. E. and P. F. DeLargy, 1990. Land use, migration, and natural resourcedeterioration: the experience of Guatemala and the Sudan. In K. Davis and M.S.Bernstam, eds. Resources, Environment, and Population. Present Knowledge,Future Options, A supplement to Population and Development Review, 16, NewYork: The Population Council, O.U.P., 125-47.
Birdsall, N. 1992. Another look at population and global warming. Paper presented atthe Experts Group Meeting on Population, Environment and Development, UnitedNations New York, January 20-24, New York.
Bongaarts, J. 1992. Population growth and global warming, Population andDevelopment Review, 18(2), 299-319.
Chauvet, M. et L Olivier. 1993. La biodiversité, enjeu planétaire, Paris: Editions Sangde la terre.
CICRED. 1992. Population and Environment. Inter-Center Cooperative ResearchProgramme, Paris: CICRED.
Collomb, Ph., F. Guérin-Pace, M. Berlan. 1993. Perceptions de l'environnement. InPopulations et Sociétés, juin, 280,1-3.
Commoner, B. 1990. Making Peace with the Planet, New York: Pantheon Books.
Commoner, B. 1991. Rapid population growth and environmental stress. InConsequences of Rapid Population Growth in Developing Countries. New York:Taylor and Francis, 161-190.
Commoner, B. 1992. Population, development and the environment: trends and keyissues in the developed countries. United Nations, Expert Group Meeting onPopulation, Environment and Development, New York, 20-24 January.
Cruz, M., C. Meyer, C. Repetto, R. Woodward. 1992. Population Growth, Poverty andEnvironment Stress: Frontier Migration in the Philippines and Costa Rica. WorldResources Institute, Washington, D. C.
Dasgupta, P. and Maler, K. G. 1990. The environment and emerging developmentissues, in Proceedings of the World Bank. Annual Conference on DevelopmentEconomics, 1990. Supplement to The World Bank Economic Review, 101-52.
61

Dubos, R. 1965. Man Adapting. New Haven: Yale University Press.
Dumont, R. 1962. L'Afrique est mal partie. Paris.
Ehrlich, P. R. and A. H. Ehrlich, 1990. 777e Population Explosion. New York: Simonand Schuster.
Environmental Protection Agency, US. Policy Options for Stabilizing Global Climate:Report to Congress, Washington, D.C.
Falkenmark, M. 1989a. Water scarcity much more than droughts: a study of waterresource constraint in African development. Paper prepared for the Conference onHuman Demography and Natural resources, Hoover Institute, Stanford University,1-3 February.
Falkenmark, M. 1989b. The massive water penury now threatening Africa, Ambio, 18,112-18.
FAO. 1986. African Agriculture: The Next Twenty-Five Years, Rome.
FAO. 1992. Potential population-supporting capacity of lands: environmental aspects.Paper presented at the Experts Group Meeting on Population, Environment andDevelopment, United Nations, New York, 20-24 January.
Fisch, A. E. Pichard, T. Prazuck, R. Sebbag, G. Torres, G. Gemez, M. Gentilini, 1993.A new approach to combatting iodine deficiency in developing countries: thecontrolled release of Iodine in water by a silicone elastomer, American Journal ofPublic Health, 83(4), 540-45.
Foyet, G. and H. Daly. 1992. The economic causes of ecological disorder in BrazilianAmazonia: allocation, distribution, and scale, in LA. Kosinski, ed. EcologicalDisorder in Amazonia, UNESCO/ISSC/ Educam, Interface 2000, Brazil, 49-75.
Geores M. and R. Bilsborrow 1991. Deforestation and Internal Migration in DelectedDeveloping Countries, paper presented at the Annual Meeting of the SouthernDemographic Association, Jacksonville, Florida, October 10-12, 8 p. cited by MaryBarberis, voir référence 45.
Grinblat, J. A. 1993. Population in the 22nd century, from the United Nations longrange projections. Union Internationale pour l'Etude Scientifique de la Population,Montreal, 249-58.
Intergovernmental Panel on Climate Change (IPCC), 1991. Climate Change: The IPCCResponse Stratégies, World Meteorological Organisation and The United NationsEnvironmental Programme.
Keyfitz, N. 1989a. The growing human population, Scientific American, 261:119-26.
Keyfitz, N. 1989b. Reconciling economic and ecological theory on population, IIASA,Laxenburg, V, 23.
Keyfitz, N. 1990. Toward a theory of population-development interaction. In K. Davisand M.S. Bemstam, eds . Resources, Environment, and Population. PresentKnowledge, Future Options. Supplement to Population and Development Review,16. New York. The Population Council, O.U.P. 295-314.
Keyfitz, N. 1991a. Population and development within the ecosphere: One view of theliterature, Population Index, 57(1), 5-22.
62

Keyfitz, N. 1991b. From Malthus to Sustainable Growth. NASA, Laxenburg, VI, 33.
Keyfitz, N. 1993. Are there Ecological Limits to Population ? Laxenburg, IIASA, VII-16.
Keyfitz, N. 1994. Background: people and development. In: W. Lutz, ed. Population-Development-Environment. Understanding Interactions in Mauritius. Berlin:Springer-Verlag for IIASA.
Kosinski, LA., ed. 1991. Ecological Disorder in Amazonia. UNESCO/ ISSC/Educam.Interface 2000, Brazil.
Kosinski, LA. 1992. Ecological Disorder in Amazonia. Social Aspects. UNESCO/ISSC/ Educam. Interface 2000, Brazil.
Lee, R. 1990. Comment: The second tragedy of the commons. In Davis and M. S.Bernstam, eds. Resources, Environment, and Population. Present Knowledge,Future Options. Supplement to Population and Development Review, 16. NewYork, The Population Council, O.U.P., 315-22.
Le Roy Ladurie, E. 1967. Histoire du climat depuis l'an mil. Paris: Flammarion.
Le Roy Ladurie, E. 1971. Times of Feast, Time of Famine, A History of Climate sincethe Year 1000. New York: Doubleday.
Lévi-Strauss, C. 1991. Entretien avec Claude Lévi-Strauss. Le Monde, Paris, 8octobre.
Martine, G. 1993a. The phases of agricultural modernisation in Brazil, in G. D. Ness,W. D. Drake, and S. R. Brechhin, eds. Population-Environment Dynamics, Ideasand Observations. Ann Arbor University of Michigan Press.
Martine, G. 1993b. Populaçao, Meló Ambiente e Desenvolvimento. Verdades eContradigoes. Editorada Unicamp.
Meadows, D. H. et ai., 1972. 777e Limits To Growth: A Report for the Club of Rome'sProject on the Predicament of Mankind. New York: Univers Books.
Meuvret, J. 1965. Demographic Crisis in France from the Sixteenth to the EighteenthCentury in Population History. 507-522.
Mink, S.D. 1993. Poverty, Population, and the Environment. World Bank DiscussionPapers, 189, Washington, D.C.
Morin, E. 1978. L'Unité de l'homme, Paris: Seuil.
Myers, N. 1989. Deforestation Rates in Tropical Forests and Their ClimaticImplications, London: Friends of the Earth.
Myers, N. 1990. The world forests, and human populations: the environmentalinterconnections, in K. Davis and M. S. Bernstam, eds. Resources, Environment,and Population. Present Knowledge, Future Options. A supplement to Populationand Development Review, 16, New York: Population Council, O.U.P., 237-51.
Myers, N. 1992. Population/environment linkages: dicontinuities ahead? Paperpresented at U.N. Expert Group on Population, Environment and Development,New York, 20-24 January, 1992.
Myrdal, G. 1968. Asian Drama. New York: Pantheon Books.
63

OMS (WHO). 1988. Guidelines for a National Programme for the Control of IodineDeficiency Disorders in the Eastern Mediterranean Region.
OMS (WHO). 1990. Report to the 43rd World Health Assembly. GenevaWHO.
OMS (WHO). 1992. Notre Planète, notre santé. Rapport de la Commission OMS Santéet Environnement Genève: OMS.
OMS (WHO). 1993. Stratégie Mondiale OMS pour la Santé et l'environnement.Genève: OMS.
Panayotou T. 1989. Natural Resources and the Environment in the Economies of Asiaand the Near East: Growth, Strutural Change and Policy. Cambridge, Mass.
Repetto, R. and T. Holmes, 1993. The role of population in resource depletion indeveloping countries, Population and Development Review, 9(4), 609-32.
Royal Society of London, U.S. National Academy of Sciences, 1992. PopulationGrowth, Resource Consumption, and a Sustainable World. A Joint Statement.
Sachs, 1.1992. Equitable Development on a Healthy Planet. Transition Strategy for the21st century. Synthesis Report for Discussion. On the Request of the UnitedNations Conference on Environment and Development. Paris, mimeo.
Simon, J. 1981. The Ultimate Resource, Princeton: Princeton University Press.
Sioli, H. 1985. The effects of deforestation in Amazonia, The Geographical Journal,151(2), 197-203.
Stonich S. C. 1989. The dynamics of social processes and environmental destruction:A Central American case study Population and Development Review, 15(2), 269-96.
Tabah, L World Population IIASA.
Tabah, L 1983. Quelques réflexions en vrac sur les interrelations entre la population,les ressources, l'environnement et le développement, Tiers Monde Revue, PUFXXIV N*94, avril-juin, 421-450.
Tabah, L 1993. L'avenir de la population mondiale. Union Internationale pour l'EtudeScientifique de la Population, Montreal, 235-47.
Teitelbaum, M. and J. Winter, 1993. The missing links: the population-environmentdebate in historical perspective. In G.D. Ness, W.D. Drake, and S.R. Brechin,eds., Population-Environment Dynamics. Ideas and Observations. Ann Arbor TheUniversity of Michigan Press.
The Climate Action Network (CAN). 1993. Exploding the Population Myth.Consumption versus Population. Which is the Climate Bomb? Brussels, July,mimeo.
UNFPA. 1992. State of the World Environment.
United Nations. 1988. World Population Prospects. New York: United Nations.
United Nations. 1990. World Population Prospects. New York: United Nations.
64

United Nations. 1992. Population, Environment and Development. Proceedings of theUnited Nations Experts Group Meeting on Population, Environment andDevelopment, New York, 20-24 January (ST/ESA/SER. R:129).
United Nations. 1993. World Urbanization Prospects. The 1992 Revision, New York.
World Bank. 1984. World Development Report, New York: Oxford University Press.
World Bank. 1988. World Development Report, 1988, New York: Oxford UniversityPress.
65


CHAPTER 3
BUILDING A PRODUCTIVE, EQUITABLE ANDSUSTAINABLE SOCIETY: A THREE-KEY OPENING TO
ASSURED AND CONTINUING DEVELOPMENT
Nathan Keyfitz(American Academy of Arts and Sciences, Cambridge Mass., USA)
1. Introduction
Three qualities are needed for a society to be workable in our late 20th century. It has tobe productive, it has to divide its benefits, i.e. the consumption that productivenessmakes possible, in a way that will be perceived as fair, and the nature of its system ofproduction and consumption have to be such that it is not eating into the capital thatnature has placed at its disposal. Not only is any one of these qualities insufficient butso are any two—all three are absolutely indispensable. The thesis of the paper is that ifany one is missing a breakdown is inevitable. In different ways population is related toall three.
It takes two keys to open a bank deposit vault, and a few years back we heard about atwo-key system for the nuclear deterrent, the discussion being always dominated bythe need for security. The system had to work if the occasion ever required, and it hadto be proof against accidental or criminal triggering. I argue that three keys are neededfor a present-day society, and if one is missing a breakdown will occur, the nature ofthe breakdown being different for different missing elements.
The three locks that have to be opened are easily named: one is the laws of economics,one is the laws of political change, one is the access to natural wealth. The threeessentials for development cannot be ranked in importance, for they areincommensurable with one another, all independently indispensable. Nor is there anyother major requirement; with these three keys durable development will click intoplace.
Examples are plentiful of actual or potential disaster when one or two of the threeessential elements is lacking. In the Shah's Iran there was high productivity, but noconcern for equity. In the USSR there was plenty of concern—at least in theory—forequity but none at all for sustainability, and productivity was neglected to the pointwhere especially in recent years it fell sharply. The current condition of Russia if presentpolicies do what is expected of them will probably eventuate in high productivity ofthose who exercise initiative, but very low equity, and the political pressures that wouldupset it are very much in sight today. Japan is high on productivity and equity—its ratioof executive to worker pay is lower than in most European countries and far lower thanin the United States—but it does have environmental problems, and its effectiveness indealing with these is crucial for its continued success.
67

The United States is high on productivity and environment, but low on equity, and it willface increasingly serious internal conflict if equity is not dealt with. Currently proposedhealth legislation has essentially nothing to do with health, but only with the financingof a level of care for those of average and below average income that is alreadyenjoyed by those better off. No one is complaining about the quality of Americanmedical facilities, but only about their availability. We see intense political activity onthe matter of access, and indeed most American politics are concerned with just thismatter of equality; as Richard Lewontin (1994:31) says
"The central social agony of American political and social life since the founding ofthe Republic has been caused by the problem of equality. ...[There is] manifestinequality of status, wealth, and power in a society whose chief claim tolegitimacy has been its devotion to equality".
2. Population: The Economic Aspect1
This provides the framework for treatment of population, that enters each of the threeconditions for development.
In its economic aspect, the relation of population to development has changed with thegenerations. During the first half of this century it was still dominated by Malthus: thereis so much land, and so much only, and population has to stop growing at a certainpoint, which is not far off, or there will be starvation. A paper by Richard Nelson (1956),an economist in good standing, described the equilibrium that would result if food set alimit to population increase, and it was well received.
Then for a generation agricultural productivity was rising rapidly, and it seemed asthough Malthus's food constraint no longer applied, but one quoted Arthur Lewis(1955), Ansley Coale (1958) and others who saw capital as limited, so that morepeople would each have less of the capital that was available. After all, the newentrants into the labor market have to be equipped if the workforce as a whole is tomaintain its productivity. It was as though physical capital was not made by people (inany case not by the people in the less developed countries (LDCs)), but it had to bebought (mostly from the United States at the time when this view was current). If therewas only so much money from exports, borrowings, etc., then the amount of capitalwould be inextensible, i.e. would not increase with the number of people, so therewould be less per capita as population grew. Capital was treated somewhat as landhad been treated in the previous (Malthusian) theory.
And in the most recent period there is a further change in the economic perspective.Land is still not constraining, but capital also has become less important. For one thing,extensive research on the development of the presently rich countries failed to accountfor any large part of their progress by the amount of capital they employed. Beyond that,the LDC has a rich asset in its low-paid labor, and internationally oriented enterprisesseek to establish factories where labor is cheap; the labor should draw the capital. Andthis is indeed what we see happening as secondary industry flourishes in East andSoutheast Asia, largely through Japanese and American direct investment. And evenmore basic than that, Adam Smith's (1776) specialization that is made possible by alarger market, would by itself encourage increased population. With this theory alone,
68

omitting the questions of equity and ecology, population can continue to growindefinitely.
This last has been called" revisionism." But apparently it is in turn being revised. AllenKelley and Robert Schmidt have looked hard at the economic data and they find that asamong countries in the most recent period those with high economic growth tended onthe whole to have lower population growth. A very useful survey of the literature isprovided by Kelley (1988). It is a fair treatment of the diverse views within the discipline.
So it is not easy to say what economics thinks about population. Smith's size of themarket, Malthus's limits, indefinite possibilities for stretching land and capital, thenatural condition of full employment irrespective of the size of population, no relationand negative relation between population growth and economic growth, are all currentlyreferred to. If one is bound to describe the view of the majority of economists today,then it is that population does not make much difference to the economy, that makingbirth control available is as much a matter of human rights as of economics. But on thewhole, taking the corpus of economic literature as a whole, it appears that neithertheory nor data provide a conclusive indication of the effect of population. One aspect ofthe uncertainty arises from disagreement on the possibility of genuine involuntary long-term unemployment—if there is no such thing as unemployment then a largerpopulation will always be able to add something to the social product that it shares.
3. Population: Equality
Economic theory in general is stronger on total and average income than it is ondistribution, but in this matter there is an important theorem that does tell us a greatdeal. Ricardo's law of rent applies wherever land is important: with increasingpopulation on the given territory the landowner will be better off, the farmer worse off. Ifwe settle on Ricardo's tightly argued theory then one who favors equality would want asfew people as possible.
More up to date, there is a strong and justified suspicion that the dual economy resultsfrom density of population, and that the two parts become increasingly separated withthe growth of population (Todaro, 1989). If there are any limits at all on land and capital,and property rules apply, especially if there is inheritance through older sons, thenumber of the disinherited will increase rapidly once a certain size of population isattained. Latin American and other landlords wanted more people at any cost—withoutmasses of people they would have to work their lands themselves. Their pressure forimmigration only came to be tempered when the immigrants gathered in cities andbecame an independent political force.
What we see throughout the Third World is a growth of cities far more rapid than that ofthe population as a whole. In them is an accumulation of people who are dissatisfiedwith the living they can earn as landless laborers in their original rural communities. Yetthe difficulty of finding a job in Jakarta or Calcutta, even for an educated young man orwoman, is formidable. The unemployment of the 1930s in the West suggests the kind ofdifficulty one faces getting into the production circuits of Mexico City or Sao Paulo.
69

Led by their more educated members the excluded become a more and more powerfulforce for instability, capable of throwing the whole development process off the track.Examples will be given below.
4. Population: Sustainability
The connection of population with sustainability is the closest and most direct of all. Atany given level of the human-determined elements—productivity and equity—there isonly so much of the nature-determined quantities. If beyond a certain point weconsume natural capital we will be living on what our descendants would need if theyare to live as well as we do. But the matter is more complex.
It is true that more people make possible the creation of more nature—people can planttrees, they can breed fish in ponds when the oceans become desert, under thepressure of population they can substitute common materials for scarce ones, theyseem to be able to invent substitutes for nearly everything. What is awkward is thatthese activities modifying nature are never fully under control. At any given stagescientific knowledge is necessarily incomplete; we know something about cutting downtropical forests and replanting, but we do not know what species of the tropical forestsurvive with the change. (In any case there is insufficient economic and politicalincentive to replant fully.) As in fairy tales, science persuades nature to grant us ourwishes, but then there turns out to be associated changes that make our conditionworse than before.
Examples of this capacity of nature to hit back when we think we have it under controlare everywhere (Wilson, 1992). We thought we had won out over disease forever withantibiotics, but now measles has come in as a serious adult disease, and malaria isincreasing rapidly. A host of ailments that did not exist or were too rare to bediagnosed—AIDS and other venereal diseases, Lyme disease, legionnaires disease,are among those mentioned in the press. Our commercial activities are constantlyupsetting one ecological balance or another. Fire ants are in the news at the moment;brought up from Argentina (where they are controlled by numerous enemies) with ashipment of plants, they have spread from Alabama north and west over the course ofyears, and now it looks as though they will reach California soon. With an incrediblerate of increase and no enemies in the US capable of keeping them down, we seem tohave tried chemicals that only made them spread faster, and now an attempt is beingmade at biological control. That means bringing up a selection of their enemies fromArgentina, and it has to be done with circumspection, lest these in turn become pests.
It is based on experience such as this that scientists do not share the popular view thatscience can do everything. In its 1993 Statement, the National Academy of Sciences ofthe United States and the Royal Society of London have come as close as any suchbodies have to speaking for the community of those who will produce the science thatwill make these marvelous transformations. The spirit of that document is given bysuch a statement as,
" If current predictions of population growth prove accurate and patterns of humanactivity on the planet remain unchanged, science and technology may not be able
70

to prevent either irreversible degradation of the environment or continued povertyfor much of the world (Atiyah and Press, 1992)."
With their small numbers and their simple and stable techniques for gaining alivelihood, our hunting ancestors who emerged one or two million years ago did notgreatly disturb the natural environment in which they lived. Say Lee and Devore(1968:3) of human existence before the Neolithic,
" The hunting way of life has been the most successful and persistent adaptationman has ever achieved."
The adaptation was based on a very long experience—people have lived by hunting ahundred times as long as they have lived by agriculture, and several thousand times aslong as they have lived by industry.
But what those hunting cultures could not adapt to was the agricultural world ofincreasing populations and expanding economies. We need not speculate on whetherthe increasing population forced the change to agriculture, or whether agriculture,making food supplies more reliable, lowered mortality and so facilitated an increasingpopulation. The fact was that at that relatively recent point in time—at most 10,000years ago—the human race set off on its career of active intervention in the ecology ofthe planet and initiated our career of achievement and of destruction. Biologists do notsay so, but one might think of a biological utopia that would consist of an evolutionstarting branching off from the pre-neolithic and taking a path very different from theagricultural-industrial trajectory that we know. I say this only to make a symmetry withthe utopia of equality, that is equally unworkable, and is mentioned only to show that wedo not get anywhere by unlocking any one of the three doors of this paper.
5. The Three Academic Disciplines
I have chosen the title of this paper not because it is grandiose, which it unfortunatelyis, but in order to suggest the three disciplines that are needed for the study ofdevelopment. On productivity it is economics that has most to say, on sustainabilitybiology, and on equity political science and sociology. I submit that any one of thesedisciplines, notwithstanding its long history and distinguished practitioners, becomesgrossly incompetent, even talks nonsense, when it professes to give the whole answerto the difficult questions arising out of the present predicament of individual countriesand of our planet as a whole.
Think of two of the tests of a viable lifestyle: that all the world's inhabitants have aprospect of sharing it, and when so shared it can continue indefinitely. The pre-neolithic hunting and gathering culture failed only on the productivity test and so no oneproposes choosing it as the model. But in covering only two of the three conditions—equality and sustainability—when productivity also is needed, leaves it entirelydisqualified. No one proposes following the equity and environmental criteria andomitting the economic; is it similarly unjustified to follow the production criterion alone?
A completely free economy is as much an absurdity as a completely directed economy.If anyone wants evidence they can go to Russia, that was persuaded that "shocktherapy" would enable it to go from communism to capitalism, and that it wouldimmediately replicate the rise of the United States to its condition of high
71

productiveness. That was the application of pure economics to deal with a conditionthat was partly political, partly ecological. The economics could have been forecast tofail without the previous establishment of an infrastructure—means of communication,cadastral surveys, a reliable judiciary. No one seems to have made the distinctionbetween free enterprise that serves the social interest on the one hand, and freeenterprise in crime on the other.
For wanting to make a profit, to truck and trade, is natural as Adam Smith (1776) said,but he had in mind his pious Scottish countrymen, bred in a calvinistic tradition, whowould feel constraints on what was permitted under freedom even if there had been nolaws to tell them. Confining themselves to what was permitted by law was secondnature for them, but it is evidently not natural for people who lost their internalguidelines in the course of two or three generations of communism. If people do nothave a sense of what is legal and ethical bred into them from earliest years, then noamount of policing will keep them in order. When people will steal from their neighbourany time no one is looking, then the apparatus of justice is impotent, and this wouldapply even if there was an incorruptible police. It is sad to say, but without some socialsense bred into the large majority of citizens the only way that order can be kept is bysheer terror. That is why I call free enterprise without any constraints of ethics andwithout effective constraints of law a capitalist utopia that is as unlikely to succeed asits opposite the communist utopia.
6. How Much Knowledge From Metaphors?
When a metaphor such as that of this paper is presented as a mode of exposition it isharmless enough; when it has no other backing, and pretends by itself to constituteevidence or proof it ceases to have a place in social science. Its unsupported use canbe an indication that there is not a more conclusive way of dealing with the subject. Igive some examples, particularly of matters relating to equity.
Economics deals straightforwardly and seriously with productivity, but it finds itsmethods less effective on employment and more generally on equity, as well asenvironment. Both equity and environment are difficult for it and it finds public concernwith them exaggerated. When equity comes up in discussion economics tends to assertthat people in rich communities may be temporarily excluded, but sooner or later willhave their share of the nation's wealth. As the world become richer the poor, both thosewithin rich countries and those of the countries where nearly everyone is now poor, willalso benefit. True that the rich get the benefits of increased productivity and freer tradefirst, but all will benefit in the end so those who are left out initially should work and bepatient.
One hears of "trickle down" and "a rising tide raises all boats", persuasive andreassuring images but hardly explaining how the economy works. What we know is thatwhen the economy produces more goods they will somehow have to be disposed of; allthose automobiles and washing machines have to be sold if production is to continue,but there is no agreement on whether the purchasing power needed for their purchasewill suffice to move the increasing production off the dealer's shelves. That is why somethink trade unions or other political means of forcing distribution are needed, not only tobenefit labor, but to dispose of goods and so keep the productive machine going,
72

including the flow of income to the rich. Others favor fiscal remedies through taxationand redistribution, and others again consider that enabling consumers and producers toborrow more cheaply will do the trick.
We all know and fear the political instability engendered by failure to sell the productand the consequent dismissal and unemployment of the workers who have beenproducing them. Calling the dismissals "restructuring" (another metaphor) in theinterests of efficiency does nothing to console those affected, and even generousunemployment compensation cannot make them overlook the symbolic meaning of theirbeing dropped. It is worth taking a moment to see why unemployment, that affects onlya minority—about 10 per cent in Europe, less in the United States—excites suchconcern. I will argue that losing one's job, or the mere possibility that one might loseone's job and not be able to find another, is to contemplate a disaster of which the lossof income may be only a small part.
To lose the sense of self-worth that derives from the day by day performance oftypesetting or assembling of television sets; to lose the social connections with othersdoing similar work; to sense that now one is living on the cold and formal charity of theState; these are not easy to take. The only thing worse than having to get up in themorning and leave home to go to work is not having any reason for getting up and noplace to go. That is for the older workers who are let out; for the younger who cannotget themselves inserted in the circuits of production and consumption there is sheerdesperation, called to public attention by widespread demonstrations in the cities ofFrance as this is being written. Showing itself in statistics of crime everywhere, andnowhere more than in the United States. It is true that US crime levels as a whole havestabilized, but crime by young males has risen sharply in the last few years.
Because of so-called social legislation mandating large severance payments, olderworkers in Italy are typically not dismissed before retiring age, but corresponding to thisyounger would-be workers, including many highly qualified, suffer especially longperiods of waiting to "insert themselves" (a favorite Italian metaphor at the present time)into the productive system. We know that people's most useful skills are not learned atschool or at home, but at work; kept from work they become month by month lesscapable of holding a job.
Rostow's "take-off of a plane as an ¡mage of development is as persuasive as therising tide that raises all boats, and ultimately just as unhelpful. His "stages" ofdevelopment—preparation, accelerating down the runway, etc.—are attractive becausethey imply that once under way the continuance of development is virtually inevitable.But now that we see Brazil's promising industrialization of the 1970s so rudely checked,and the same in many other Latin American countries, we are ready to believe thatadvance on the economic front can be very easily stopped by bad policies dictated bypolitical forces.
Allowing one's thinking to be captured by such images is one of the hazards of all socialscience and by no means of economics alone. So we must protect ourselves againstthem by seeing them as means of communication, never accepting them as evidenceor proof unless they are closer to the phenomenon in question than Rostow's airplane.
73

7. The Expansiveness of Disciplines
Disciplines do not take well to division of labor among themselves. Each wants to dealwith real problems, and tries to incorporate within itself all the elements necessary to doso, neglectful that some other discipline has been working on them. Let us examine oneinstance of many—the attempt of economics to embrace ecology.
When economics incorporates ecology it runs up against two major difficulties. Forenvironment to enter economics, for example to be calculated into the Gross DomesticProduct (GDP), it must be quantified, expressed in terms of money. One distinguishedeconomist is quoted by the press as saying that at worst the damage being done to theenvironment now and in prospect could lower GDP by 1/4 per cent below what it wouldotherwise be. Yet climatologists who have devoted their lives to such matters as theglobal temperature, one component of the estimate of environmental damage, do notknow whether there will be warming or whether our release of carbon dioxide will beoffset by other things we are doing; if there is warming what its effects will be on theoceans and on various localities on land; and even if we knew the effects exactly wewould only with much difficulty be able to estimate the cost of repairing the damage forsome particular effect like rise of the oceans. Thus there are three wide gaps ofknowledge in the special sciences dealing with these matters over which economicshas to leap before it can deal with this particular question of environment: whether netdamage will result from our practices at all, what the net damage will be, and how muchwill it cost to fix up.
But beyond these is a question of values that no discipline can deal with: since thedamage and its repair will mostly occur in the future, how much the cost of what we aredoing now has to be discounted in order to estimate the amount of present income weought to be sacrificing to avoid or repair the effects of present activities. That raises thesubject of social discount rates—to discount at commercial interest makes the futureunimportant, while to discount at zero interest, for which a strong argument can bemade, gives such high numbers that financing out of present income would beimpossible. Moreover the calculation is more difficult than this implies, for it must alsotake into account the discounted help we will get from inventions that will enable us toavoid damage in the future, inventions not yet in sight and not even specifiable.
The ozone layer, another environmental element subject to damage, offers its ownspecial difficulty: no one can forecast our effect on it, but suppose we somehow foundout that what we are doing to make it thinner and so reducing its protective effect raisescancer rates by 10 per cent; how many dollars does the resulting rise in mortalitysubtract from GDP? For that matter how much does one additional death subtract? Ifwe ask what is the loss when a lake becomes eutrophic we at least have the marketprice of fish as a guide, but many decisions on environment involve theincommensurables of lives versus dollars2.
Similar observations can be made on overfishing the oceans, draining wetlands,destroying species as tropical forests are exploited.
In short, if we don't know how much a marginal change in emission of carbon dioxide,or a marginal loss of ozone, or other side-effects of industry, cost the economy, howcan we calculate what expense we should go to in modifying the economy to avoid
74

those side-effects? The sophisticated and powerful apparatus of economics seemshere to be impotent.
Not so, it will be said. Economics has thought of ail these things, dealing with manyecological problems under the head of externalities, and this concept does indeeddiagnose the problem. If producers and consumers were somehow prevented fromcharging to neighbours or the community as a whole any part of the costs of theiractivities then the incentive to do many of the things that worry ecologists woulddisappear (collecting the benefits to the community resulting incidentally from one'sactivities, positive externalities, is out of our scope). So the answer would seem to bethe political authority taxing producers and consumers amounts equal to the ecologicalcosts of their activities, and then distributing the funds so collected to those who sufferthe side effects of the activity. The principle is correct, and there are indeed examples,in the cleaning up of the Rhine and other rivers, in which it has been applied and foundto work.
There are two major practical difficulties, however. If one does not know what the costsof ecological damage are, both over the short and the long run, particularly the costsimposed on later generations, then there is no way of assessing the amount of taxnecessary for the offsetting of those costs. More important, the proposal to makegovernment responsible throws the matter into the realm of politics. Economics has(rightly) been warning us for more than two hundred years against trusting governmentwith responsibility for administering the economy. It knows that once a question isthrown into the arena of politics the outcome is unlikely to accord with principles ofrationality that are the strength of economics. Adam Smith (1776, book IV, ch. 9)expressed with eloquence this justifiable distrust of government:
"The sovereign is completely discharged from a duty ... for the proper performanceof which no human wisdom or knowledge could ever be sufficient: the duty ofsuperintending the industry of private people."
Governments necessarily work on a political calculus. They are not required to takeproductivity and environment into account, though they are required to pretend to doso. Yet the matters that fall under the heading "protection of the environment" areespecially sensitive politically, as we know in the United States from the effort to taxgasoline even at the trifling (compared with Europe) amount of 7 cents a gallon. And itis precisely on these matters where government is least competent to devise andexecute policy that the concept of externalities would nominate governments to takeresponsibility. We have no right to think it would be more efficient here than it has beenat price fixing or curing unemployment. We know among other things that whenofficials are appointed to control economic agents they are too often captured by thoseagents. And all this is especially true when there is disagreement on the extent of thedanger or what to do about it.
Beyond all these difficulties at the national level, many of the most importantexternalities extend across international boundaries. That applies to pollution ininternational rivers, to fisheries on the high seas, to transboundary air pollution. Ifnational governments have difficulty handling such matters within their own countries,think of the difficulties facing international authorities, with their extremely limited abilityto mandate anything or to penalize violations. I have no alternative proposal, but
75

suggest that we need study in both the economics and the politics of environment andnatural resources, all carried out with due respect for the biology involved.
8. The Danger of Utopias Based on Politics Alone
Few will disagree on the impracticality of an ecological utopia that consists in goingback to the hunting and gathering stage, before agriculture transformed the ecologicalsetting of mankind. But a political utopia has seemed practical enough to attract goodminds to its support over the past century or more, yet in the end its last form,communism, turned out to be very nearly as impractical as going back to the pre-neolithic. Some said that if we had a single agency entrusted with both production andresponsibility for the environment, and free from the pressure of competition or the needto make a profit it would choose production methods that did the least damage andotherwise could reconcile its two functions. It also had a third related function: it was theagency that collected and disseminated information, including statistics, on botheconomic and ecological questions. In the Utopian view, it would orient its statisticalcollections to bringing bad conditions to public attention, so that it would secure generalsupport in dealing with them promptly and effectively.
Something must be wrong with this logic, as we see now that the USSR is dissolvedand its methods exposed to view. The advantage of a single authority in all threedomains—economic, environmental, and informational—is more than offset by thedisadvantage of such an agency having constant preoccupation with its own self-protection, its perpetual seeking of short-term objectives and concealing statistics thatmight reveal the long-term and hidden costs of what it is doing. Georgei Golitsyn, adistinguished Russian atmospheric physicist, tells some of what went on in the USSRwhen the whole country was under a single manager:
"... people lacked real responsibility for the environmental, and very often theeconomic, consequences of their actions...the manufacturers were interestedonly in a quantitative increase in production, not in qualitative improvement....Theuniqueness of a plant producing a particular item ... makes it impossible to closethe plant in the event of it causing an ecological hazard, even for a relatively shortperiod of time...the amount of intermediate products produced per final product isabout 2.5 times larger than in developed countries [a measure of waste inproduction (Golitsyn, 1992:125)]."
This is not to be taken as a warning against communism alone. It is a warning againstconsolidating economic, ecological, and political authority, against a single politicalauthority that will deal with everything. We have certainly not reached the end of history,as has been erroneously asserted, but we have probably reached the end of a series ofpolitical utopias extending back into the 16th century.
9. The Drive for 'Justice1 That is Rocking Many of the LDCs
The center-right and center-left governments of Europe have on the whole promotedeconomic rationality (for instance on tariffs and immigration) and in this are leaving theirelectorates behind. Italy has other problems, but it is still worth noting that in the recent
76

election the far left and the far right gained at the expense of the center, and this is inline with the tendency of recent elections throughout Europe. The French farmers haveshown how violent can be the reaction to the widening of markets. We intellectualsmostly do not approve of violence, but must concede that the threat of it is as real a factas the increase of production that will follow from the wider market. However it is insome of the LDCs that the drive for "justice" is outlined most sharply.
The demand for equity in the rich countries expresses itself in the form of restlessnessin the face of unemployment. Developing countries cannot afford unemployment in theGerman style; people have to find something to do or go hungry. They may live withrelatives; they may beg on the streets; they may sort through garbage. But the fact thatunemployment is hidden, not officially recognized or compensated, not evenmeasurable, does not make it easier to bear. For many developing countries our pressreports violent protest against the liberal order. Those excluded from the economy turnto one extremism or another. Iran, Algeria, Egypt, Indonesia, listed in order of thenumber of incidents manifesting fundamentalism as reported in the press, show thetrend. Other countries are not far behind these.
The watchword of the excluded is "justice", by which they mean equity and participationin society. Of all the elements that constitute 'participation' none is more important thana job at the level of one's training and ability. And that is what is desperately lacking inmany of the developing countries, even in some that are rapidly increasing in averageincome.
It is worth looking at the revolution that took place in Iran in 1979, since one fears that itshows a path that some other countries could well follow.
10. Response to Progress Without Equity: The Case of Iran
Among the countries that made what looked like real progress was Iran under theShah. Let us disregard here the democracy and human rights sides of the Shah'sregime, for the new rulers who brought him down are even less attentive to theseissues. The Shah went excessively for import substitution, now seen as the wrongpath, but again we do not blame him for following what was the fashion of his time.
His economic policies seemed on the whole to be accepted internally and approved byoutside observers. Says one of these, writing just after the crash but before itssignificance was understood, and approvingly describing the policies of the Shah'sregime:
" the goal of using oil to build a self-sustaining economic structure, which is set outin the Third, Fourth, and Fifth Development Plans, has been espoused bysuccessive governments and by contending political groups" (Lieberman, 1979).
This was written some months after the Shah had been deposed, and the new regime,under the Ayatollah Khomeini, had taken over the reins of government, a good time tosurvey the gains of the Shah's regime. Lieberman continued:
* Iran now produces a wide range of consumer durables and non-durables, alongwith certain...capital goods. Progress has been noteworthy in the production oftextiles, shoes, vehicles, tyres, and electrical machinery for industrial and non-
77

industrial use. The integrated iron and steel mill in Isfahan, a heavy machine toolplant and an aluminium smelting plant in Arak, the tractor factory in Tabriz...."
And the social side was not wholly neglected:
" gains in the literacy, health, and security of the population, and specifically in thestatus and well-being of women should be noted."
What LDC would not envy these achievements, admittedly due to oil but with excellentprospects that before oil deposits were exhausted the economy would have taken off.
Lieberman thought that some small changes might take place under the new regime,especially in the direction of more support for small farming, but on the whole he tookfor granted that the main track established by the Shah, his rational and enlightenedguidance of the economy towards greater and greater wealth, would be followed.Religion would not be discarded, but it would be confined to its own separate domain.No need here to recount how wrong that has proven to be; Islamic fundamentalism isthoroughly established, and if there is any movement in prospect it is towardsapplication of more extreme measures of Islamic law. We read currently about conflictof aims: fundamentalism versus contact with Europe and America, but up to now it isthe former that dominates.
That Iran should be among the first countries to have fallen off the development track isespecially remarkable given that its economy has been one of the most successful. By1980 it had attained an income per capita of over $2000 current dollars, as against $380in 1970. During the same decade its population grew from 28 to 38 million. It is true thatits elite took a considerable share of the benefits of development, but much of what theelite took was in turn invested in development projects.
It has not been easy to secure detailed figures on Iran for the recent period, that hasbeen complicated by the Iran-Iraq war, but clearly there has been a reversion back tosmall-scale farming, continuation of industry as far as the Shah took it, but littledisposition to continue the expansion.
11. Other Countries may be Following Iran
Algeria's income per capita is not very different from Iran's and it would have followedIran and substituted another ideology from that of development by now if it was notrestrained by a firm government willing to suspend democratic institutions. Thatgovernment called off an election in 1992 that the fundamentalists would certainly havewon, and it has put many of the opposition leaders in jail. Such measures disappointedWestern governments, or so they professed; one is not sure whether it was the firmaction or the need to take firm action that they were really protesting about. TheAlgerian public largely opposes the drastic measures taken, but so far the currentregime remains in the saddle. Says L'Express (Feb. 17, 1994:19) in a special sectiondevoted to Algeria:.
"The great majority of Algerians has no illusions left; the Islamists will sooner orlater take power...The present regime [say some, not even very pious] is like atick that sucks blood—it should be torn out."
78

Indonesia is not as well off as either Iran or Algeria, with an income per capita that at itspeak reached $610 current dollars per capita (1983), and yet it too has been makinggreat progress in recent years in building export industries that ultimately would replaceits oil. It is under considerable pressure from the fundamentalists. The Economist (Mar.13,1993:65) comments on
"the country [being] 88 per cent Muslim—and increasingly conscious of the fact."
Some observers fear that the non-ideological and more or less secular leaders now incharge will have to apply increasing force if they are to prevent the country from fallingoff the development track as Iran has done and Algeria would have done if itsdemocracy had not been suspended. A sign of what may be coming is the effectivedemotion of the economic leaders who have brought Indonesia to its present promisingcondition based on its low-cost labor, and their replacement at the centre of power byproponents of highly capitalized industries, starting with aircraft manufactures. Shiftingfrom textiles to aircraft does not correspond to Indonesia's relative advantage, but itdoes correspond to national pride.
Egypt has only relatively small oil resources, and so its economic prospects are not thesame as those of Iran, Algeria, and Indonesia, but nonetheless it is subject to some ofthe same political pressures.
12. Fundamentalism
The question for us here is whether such phenomena are part of the reality that socialscience should take account of? The economist sincerely considers that he has givenhis answer—that development is a matter of investment, of human capital, and othervariables within the discipline of economics, and if fundamentalism enters, and theterrorism that it justifies, that is sheer irrationality that no scholar can be expected todeal with. Yet we bear in mind that science deals even with schizophrenia and themental processes of chimpanzees, which are more extreme manifestations ofirrationality than fundamentalism.
Fundamentalisms have been the subject of a major research project sponsored by theAmerican Academy of Arts and Sciences and based in the University of Chicago'sDivinity School under Martin Marty. It is providing a better understanding of "why theyhave sprung up with such force at the end of the 20th century, and what they hope toachieve (Economist, Mar. 27 - Apr. 2, 1993:51)."
" The movements...aim either for political power or to change society In someradical respect... All see themselves as 'fighting back', using violence ifnecessary, against the forces of secularism and modernism. ...Foremost amongfundamentalists aspiration is a 'return' to family values', with women as mothersand housewives and men as the principal or only breadwinners..."
" Causes of the new religious activism include the collapse of Marxism, the failureof national governments to honor promises made after independence, and theemergence of a world market...Fundamentalist ideologies...stress social justiceand the redistribution of wealth (Ibid.)."
79

An inner fury is evidently aroused in many parts of the world, poor but evidently not thevery poorest, by what they see of development as it is actually taking place. That furyis expressed in politics without civility, in armed uprisings, in retreat tofundamentalisms that provide divine sanction for violent and irrational behavior.Dispensing what will be interpreted by the crowds, say in Algeria, as justice is noteasy, for though the authorities have to provide more equity than at present they mustnot remove individual incentives. And their problem is accentuated by their felt need tomake expensive provision for themselves and their families. When equity is lacking thefundamentalists can claim to have justice on their side; when incentives are lackingprogress stops.
Expressed or unexpressed, implicit in the discussion of development, is this tensionbetween incentives and equity. In short, incentives that are too strong lead to uprisingsof those who cannot compete, complete equality leads to stagnation.
13. The Practical Meaning
I believe I have shown that development, if it is to be permanent, requires not one butthree keys, that are held by different disciplines. Without going as far into detail as Iwould have liked, I have sketched utopias of production, of equality, and ofsustainability, and suggested that all three forms are equally unworkable.
That means that elements of all three are required for a system to be workable. If onestarts with economics it has to be tempered with provision for equity and forenvironment, whose secrets are locks that political scientists can open if anyone can. Atleast one can say that their bafflement is more sophisticated and professional than thatof people who do not know the literature of the field. And similarly if one starts with theenvironment, one must build the system with consideration for the economy and forequity. If economists start to do biology that is a vote of non-confidence in professionalbiology; if biologists start to do economics they are saying that economists are notdoing their job. Such assertions are hardly the way to initiate interdisciplinary study thatis necessary in prescribing solutions for real problems.
Footnotes
'We are indebted to Allen Kelley for a survey of the oscillations of economic thinkingon population (See Kelley, 1993).
^Though heroic and highly commendable efforts have been made to infer how societyvalues incommensurables. The International Institute for Applied Systems Analysis(MASA) has been a leader in this work, especially in the writings of Joanne Linnerooth-Bayer.
80

References
Atiyah, M. and F. Press. 1992. Population growth, resource consumption and asustainable world. A Joint Statement by the Officers of the Royal Society ofLondon and the US National Academy of Sciences.
Coale, A. J. and E.M. Hoover. 1958. Population Growth and Economic Development inLow-Income Countries. Princeton, New Jersey: Princeton University Press.
Golitsyn, G.S. 1992. Environmental aspects of the transformation of centrally plannedeconomies. In Science and Sustainability, Laxenburg: IIASA.
Kelley, A.C. 1988. Economic consequences of population change in the Third World.Journal of Economic Literature, 26(4): 1685-1728.
Kelley, A.C. 1993. Revisionism revisited: on essay on the population debate inhistorical perspective. In Rolf Ohlsson, ed. Population, Development and Welfare:The Nobel Jubilee Symposium in Economics. Berlin: Springer-Vertag.
Lee, R.B. and I. Devore, eds. 1968. Man the Hunter. Chicago: Aldine.
Lewis, W. Arthur. 1955. The Theory of Economic Growth. London: Allen and Unwin.
Lewonton, R.C. 1994. The politics of women's biology. The New York Review ofBooks, 41(7).
Lieberman, S.S. 1979. Prospects for development and population growth in Iran.Population and Development Review, 5(2):293-317.
Nelson, R.R. 1956. A theory of the low-level equilibrium crop in underdevelopedeconomies. The American Economic Review, 46:894-908.
Smith, A. 1776. Wealth of Nations. Book IV, Ch. 9.
Todaro, M.P. 1989. Economic Development in the Third World. 4th ed. New York andLondon: Longman.
Wilson, E.0.1992. The Diversity of Life. Cambridge, Mass.: Harvard University Press.
81


CHAPTER 4
PRESSION DES POPULATIONS HUMAINES SURL'ENVIRONNEMENT: ASPECTS DEMOGRAPHIQUES DANS
LES PAYS OCCIDENTAUX
Marc Debuisson et Michel Poulain(Institut de Démographie, Université Catholique de Louvain, Belgique)
1. Un environnement pour qui ?
Peut-on parler d'environnement en faisant abstraction de la population humaine ? Leterme environnement semble par moment avoir été amputé de son qualificatif humainalors que c'est par rapport à la population humaine que la notion d'environnementprend toute sa dimension. En effet, l'intérêt que nous portons à l'environnement n'a desens que dans son interaction avec l'homme.
De tout temps, la nature, dans sa globalité, a été marquée par des équilibres qui nousapparaissent a posteriori comme immuables. En fait, ces équilibres sont au sens deséquilibres écologiques, des équilibres cycliques (Lamotte, 1985:149-52) que seulespouvaient perturber les catastrophes naturelles telles que volcaniques ou d'ordrestellaire (météorites...). Telle est brièvement la situation au moment de l'apparition desprimates et de l'homme. En se distinguant progressivement de l'ensemble du règnevégétal et animal, les primates (Moscovici, 1976) et, plus encore, par la suite, l'homme,ont introduit un élément perturbateur dans un équilibre à évolution tendancielle lente.
Ainsi, l'homme a introduit le feu, organisé l'élevage et l'agriculture, utilisé la force del'eau, exploité les minerais et autres ressources naturelles. De la sorte, au fil du temps,l'impact de l'homme, devenu élément perturbateur (au sens où il perturbe l'évolutionhabituelle de la nature), s'est accru de façon considérable et deux facteurs rendentcompte, de façon complémentaire, de cette augmentation qui a pris une allure quasi-exponentielle:
- l'accroissement exponentiel du nombre des hommes peuplant la planète;
- révolution de son comportement qui a tendance à modifier de plus en plusintensément le cours normal de la nature notamment par l'introduction detechniques toujours plus agressives vis-à-vis de l'environnement.
L'impact de l'homme sur son environnement est d'autant plus évident dans les régionsde vieille industrialisation dont les paysages ont été largement travaillés par la main del'homme. Nous avons donc hérité d'un environnement naturel soit, mais déjàtransformé. Les modifications se sont intensifiées dès le XIIIe siècle avec le défrichageintensif de la forêt qualifiée à l'époque d'impénétrable, l'extraction du fer et de la houilleet l'urbanisation galopante soutenue par l'industrialisation sauvage renforcent encorece processus agressif.
83

Notre environnement est le résultai d'activités successives de l'homme qui s'estapproprié l'espace (et ses ressources naturelles) avec comme objectif prioritaire, celuide survivre. Le lien entre croissance démographique et apparition de techniquesnouvelles est évident. Aussi les déboisements massifs du Moyen-Age ont eu unimpact sur l'environnement naturel aussi bien par une augmentation manifeste dunombre des hommes que par le recours concomitant à des techniques nouvelles quise sont avérées plus agressives pour le milieu naturel. Toutefois, il est fort probableque ces changements intervenus au Moyen-Age aient été perçus uniquement commeéléments majeurs d'une stratégie de survie et non comme une atteinte àl'environnement naturel et une dégradation de celui-ci. Le contexte de la révolutionindustrielle au XIXe siècle est assez similaire puisqu'on y retrouve la croissancedémographique, la volonté de survivre, l'introduction de techniques nouvelleslargement plus agressives et une insensibilité assez générale à la dégradation del'environnement.
C'est en milieu urbain densément peuplé que le concept de dégradation del'environnement est apparu en premier lieu, semble-t-il, et a donné lieu à unprocessus d'assainissement et de déconcentration des centres urbains. Lesconséquences néfastes sur la qualité de la vie de la révolution industrielle et del'urbanisation massive et rapide de certaines contrées n'apparaîtront que trèsprogressivement. Somme toute, la qualité de la vie et la dégradation del'environnement sont les deux éléments clé de l'interaction entre population etenvironnement.
Plus récemment, la stratégie de survie a laissé progressivement la place à celle d'unmieux-vivre. Cette nouvelle stratégie fut aussi, dans une première étape, une grandeconsommatrice d'espace, avant de se tourner, forcée, vers un respect incontournablede l'environnement. L'époque marquée par l'exploitation non réfléchie de la nature etde ses ressources semble révolue, pour le moins dans les pays développés. Uneperception nouvelle est apparue, la pensée qu'une limite a été atteinte, s'est faite jour.Dès lors, la nécessité de préserver notre environnement, voire de l'améliorer, estdevenue un enjeu de société. On pourrait affirmer que la revalorisation du niveau debien-être général des populations s'est faite de pair avec une perception plus nette dela qualité de l'environnement. Cette attitude nouvelle est-elle issue d'un caprice denotre génération prospère ou plutôt d'une prise de conscience de responsabilitésnouvelles vis-à-vis des générations futures ?
2. Quel environnement ?
L'environnement est à la mode, il est conjugué à tous les temps et recouvre desréalités variables. Dans ses travaux, l'Union Européenne envisage l'environnement, defaçon large et englobante, comme l'ensemble des éléments qui, dans la complexité deleurs relations, constituent le cadre, le milieu, les conditions de vie pour l'homme. Deson côté, le Petit Robert (1991) est plus restrictif et définit l'environnement commel'ensemble des conditions naturelles (physiques, chimiques, biologiques) et culturelles(sociologiques) susceptibles d'agir sur les organismes vivants et les activitéshumaines. Enfin, dans certains milieux scientifiques mais également de décideurspolitiques, le concept d'environnement est plus restreint encore, en se bornant aux
84

seules interrelations entre les conditions naturelles et les activités humaines. Dans cedomaine, c'est principalement la gestion des ressources naturelles qui monopolise laquasi-totalité des actions. Tel est bien le risque ultim: confiner l'environnement à laseule étude de l'impact des activités humaines sur l'état des rescousses naturelles.Cette approche restreinte ne tiendrait pas compte de l'homme si ce n'est dans sonapport négatif de pollueur, de consommateur immodéré des ressources naturelles etde destructeur de l'environnement. A l'inverse, il est urgent de traiter le problème enétablissant la relation dans les deux sens: l'influence des populations surl'environnement, d'une part, mais également celle de l'environnement sur lespopulations, d'autre part. Il est ainsi primordial de rejoindre une "écologie humaine" quiproposerait une approche cohérence et non "réductionniste" des questionsd'environnement (Poucet, 1992:23).
Ne perdons pas de vue que l'échelle du niveau d'analyse est également importante etvariable selon le problème environnemental traité, en passant de l'individu, à lacommunauté villageoise, à la région, voire à l'ensemble de la planète, seul niveau où leréchauffement du climat et l'influence de la couche d'ozone se doivent d'être analysés.Lorsque la complexité des analyses sera vaincue par de réelles approchesinterdisciplinaires dans les études de cas bien définis, mettant en jeu une société etune population précises en interaction avec un écosystème déterminé, l'heure seravenue d'établir des généralisations.
3. [.'interrelation entre population et environnement: les prémissesd'une réponse à une question en suspens?
La communauté scientifique s'est penchée ces dernières années sur le problème desinterrelations entre population et environnement, mais, à quelques exceptions près, il aété envisagé soit globalement, à l'échelle planétaire, soit dans des cas spécifiquesémanant des pays en développement1. Dès lors, le cadre conceptuel déployé dans cesapproches n'est pas nécessairement le plus approprié pour ce qui regarde notreproblématique, celle de l'examen des interrelations "population - environnement", dansnos pays occidentaux.
Nous proposons ci-dessous un schéma conceptuel simple, en accord avec les travauxde Thilgès et Tabutin (1992) et Tabutin (1993) sur les pays du Sud, construit de façontout à fait générale, et qui peut très bien s'appliquer à la réalité de notre région.
85

Population
Technologie <r
Environnement
Comme le laisse pressentir ce diagramme, l'interaction entre la population etl'environnement est complexe puisqu'elle est à la fois directe et indirecte. Avant del'aborder avec plus de précision, il convient de fixer le concept de population.
Le concept de population
II est utile de préciser ici que nous entendons le concept de population de façonrestreinte, strictement démographique, c'est-à-dire en privilégiant les points suivants:
- le nombre des êtres humains en un lieu donné et dans un écosystème précis;
- leurs structures démographiques par sexe, âge et éventuellement par nationalité,état matrimonial...;
- le mouvement de la population par le biais des naissances et des décès, maiségalement des entrées et sorties du territoire considéré.
Seuls les comportements d'ordre démographique sont pris en compte afin d'expliquerles propensions relatives à la fécondité, mortalité et mobilité spatiale. Lescomportements relatifs au respect de l'environnement ne sont considérés que de façonindirecte dans la mesure où ils sont différents d'une sous-population à une autre. Dèslors, toute modification de la structure démographique se traduira par un"comportement moyen" distinct et un impact différent sur l'environnement.
L'impact de l'environnement sur la population
Bien que notre objectif se cantonne dans une mise en évidence des effets desvariables démographiques sur l'environnement, on ne peut ignorer l'impact inverse.Ainsi, l'environnement exerce une influence sur la population et ce, de manièresdiverses. Il existe, tout d'abord, un impact naturel de l'environnement sur les hommes.Le climat dans ses variations extrêmes (sécheresses, inondations, tornades...) (Veyretet Pech, 1993: 135-222) ou sa moyenne (type de climat tempéré ou continental....),
86

les catastrophes naturelles comme les tremblements de terre mais également desphénomènes telles que l'émission radioactive naturelle.
L'environnement de plus en plus dégradé à la suite des activités humaines exerce àson tour une pression sur les populations humaines, principalement en matière demorbidité et de mortalité, mais également dans le domaine de la fécondité2 et de lamobilité. Les différents éléments démographiques en seront à leur tour affectés: taille,composantes du mouvement des populations et structures démographiques.
L'historique de la pression de l'environnement sur les populations laisse transparaîtrele rôle prépondérant du concept de qualité de vie (Poelmans-Kirschen et al., 1973:18-21) comme médiateur entre environnement et population. On constate biensouvent que les besoins de l'homme sont mis en concurrence: plus il accapare sonmilieu pour assouvir ses besoins, plus il le détruit et plus sa propre qualité de vie sedétériore. Cette chaîne de conséquences arrive même à modifier les comportementsde la dynamique démographique. Quand l'espace de vie ne répond plus à l'image quel'homme en attend, d'autres espaces plus conformes aux désirs sont occupés par lui,par le biais de la migration.
4. L'impact de la population sur l'environnement
II est très malaisé de parler d'une action directe de la population sur l'environnementcar, dans bien des cas, les sphères dénommées "technologie" et "société" jouent unrôle d'intermédiaires et modulent l'impact direct entre population et environnement.Prenons un exemple concret pour illustrer le schéma conceptuel. L'accroissement dunombre d'individus sur un territoire se traduira, à comportement humain constant, parun accroissement similaire des déplacements de la population. L'augmentation dutrafic routier, par exemple, entraînera, à technologie également constante, uneaugmentation de la pollution atmosphérique. Parallèlement, l'apparition de technologiesnouvelles pourra se traduire par une diminution de la pollution per capita et compenseren quelque sorte, tout ou en partie, l'augmentation due à l'accroissementdémographique. En outre, une société pourra faire le choix d'une consommation pluspropre et favoriser le recours à ces technologies nouvelles, par le biais d'unelégislation appropriée. Finalement, l'impact de l'accroissement du nombre d'individussur l'environnement devra prendre en compte à la fois le rôle des technologiesnouvelles et le choix de société visant à favoriser le recours à celles-ci.
L'impact démographique de la population sur l'environnement est-ellemesurable ?
Un débat scientifique s'est développé aux États-Unis, il y a plus d'une vingtained'années, sur l'estimation de l'impact de la croissance démographique, par rapport à latechnologie. Les principaux artisans, Paul Ehrlich et Barry Commoner, se sontquerellés par l'intermédiaire d'articles scientifiques (Marden et Hodgson, 1975:37-128)sur le poids de la croissance de la population dans l'augmentation des pollutions. Lafinalité du débat consiste à évaluer la part du facteur humain et celle du facteurtechnologique dans la dégradation de l'environnement. Cette querelle vaut la peine de
87

s'y attarder, car elle est très symptomatique de la difficulté de distinguer et d'estimerl'impact direct de la population sur l'environnement.
De façon synthétique, ce débat se résume comme suit. Paul Ehrlich avance l'idée quela croissance de population est le facteur majeur qui explique la dégradation del'environnement, alors que Barry Commoner argumente en faveur d'autres variables,principalement technologiques, comme responsables de la pollution.
Selon Ehrlich, depuis que les sociétés humaines sont devenues agricoles ettechnologiques, chaque être humain a un impact négatif sur l'environnement parce qu'ilparticipe à l'utilisation des ressources, qu'elles soient renouvelables ou non. Dès lors, ilétablit une relation ou I, l'impact total négatif ou niveau global de pollution correspondau produit de l'effectif de la population, P, et d'une fonction F qui mesure cet impact surl'environnement par tête d'habitant. Cette fonction F est la résultante des effetstechnologiques sur l'environnement. Elle inclut, entre autres, l'exploitation desressources non renouvelables, l'utilisation de technologies non polluantes...
Commoner prolonge cette même idée en introduisant le rôle intermédiaire de laconsommation par tête d'habitant à l'aide de la relation suivante:
I = P. A . Toù P est la taille de la population, A, la consommation d'un produit donné par têted'habitant, T, la pollution par unité de production de ce produit et I, le niveau total depollution ou l'impact négatif sur l'environnement.
Cet auteur établit alors une liste de productions technologiques nuisibles en rapportavec leur consommation par habitant. En établissant une équivalence entre productionet consommation, il détermine l'impact total sur l'environnement. Il montre ainsi que,depuis la fin de la seconde guerre, la croissance de la consommation-production partête d'habitant est la principale responsable de la pollution. Dans un article plus récent,il constate néanmoins que le poids de la population est loin d'être négligeable bien qu'ill'estime comme étant trois fois moindre que celui de la technologie (Commoner, 1988)
Finalement, Ehrlich reprenant également l'équation I = P.A.T, démontrent l'importance,pour les pays en développement, de réduire la croissance de la population P,puisqu'elle est le facteur le plus important de l'augmentation de la pollution (Ehrlich etEhrlich, 1990:57-58)\ Par contre, pour les pays développés, l'important, selon lui, estde réduire le facteur T, la pollution par unité de production, pour chacun des produitsde consommation à caractère polluant.
Un exemple chiffré fourni par Commoner (1992:74) permettra de mieux cerner ce typed'approche dans le domaine de l'utilisation d'engrais azotés en agriculture. La questionposée est la suivante: 'Quelle est la part de l'accroissement de population, del'accroissement de consommation par individu et l'évolution de la quantité d'engraisutilisée par unité de production pour rendre compte de l'augmentation de l'utilisationd'engrais azotés en agriculture ?"Au total, de 1975 à 1986, l'utilisation d'engrais s'estaccrue de 9,3% pour l'ensemble de la Belgique et du Luxembourg. Dans le mêmetemps, la population s'est accrue de 0,6%, la production agricole, de 14,3% etl'utilisation d'engrais par unité de production s'est réduite de 5%. Force est deconstater que, dans cet exemple précis, la population en tant que variabledémographique, joue un rôle négligeable. L'augmentation de la pollution des sols

cultivés résultant de l'utilisation d'engrais azotés y est essentiellement due àl'accroissement de la consommation, accroissement en partie compensé par desprogrès biotechnologiques (réduction de la quantité d'engrais azotés nécessaires parunité produite).
Cette approche nous paraît simpliste et étonnement réductrice. Personne ne nousconvaincra qu'il est désormais possible de faire la part des choses entre ce qui est dûà la variable "population" et ce qui ne l'est pas, car les mécanismes en cause sontmanifestement plus complexes. Même en étendant cette approche à d'autres types deproduction et de pollution, il semble impossible, de façon sûre, de délimiter le partagedes responsabilités entre l'évolution de la population, celle de la consommation et celledes progrès technologiques. Isoler l'effet "pur" de la variable "population" reste, selonnous, du domaine du mythe scientifique.
Les concepts de capacité de charge et de densité de population
La littérature scientifique propose également une mesure de la pressiondémographique sur l'environnement par le biais du concept de la capacité de charge,ou carrying capacity (Smith, 1976:58-60, 74-6) en anglais. Initialement, cette notion aété introduite par les agronomes qui souhaitaient déterminer la taille maximale de lapopulation que pouvaient nourrir les ressources agricoles potentielles d'une zonedonnée. Cette notion débouche sur celle de densité démographique maximale, qui, defaçon théorique, se base exclusivement sur les besoins alimentaires des populations.Elle est d'application uniquement pour les sociétés traditionnelles vivant en autarcieagricole sur un territoire bien délimité. Ce concept est caduque pour nos sociétés, carla potentialité productive de l'écosystème et les méthodes agricoles ne sont pas seulesà influencer la densité du peuplement. De nos jours, les systèmes politiques en placeet le type d'échanges commerciaux, dans un marché économique à dimensionplanétaire, importent largement plus.
Dans le cadre des travaux du Club de Rome, ce concept a été élargi pour inclure laconsommation énergétique quotidienne liée à tous les aspects de la vie humaine:alimentation, chauffage, transport, consommation de produits industriels (Delaunay,1972). En outre, le concept de carrying capacity inclut une comptabilité desphénomènes écologiques tels que la dégradation de l'environnement et l'épuisementdes ressources naturelles. Ce nouveau type d'approche cherche à déterminer quellessont les limites physiques et démographiques au développement durable d'unesociété, sur un territoire donné. Ainsi, on aboutit à un concept plus approprié pour notrepropos et plus adéquat pour appréhender les interactions entre population etenvironnement: la capacité de charge démographique. C'est le seuil démographique derupture d'une société face à son environnement sur un territoire donné, ce seuildémographique n'étant pas fixé uniquement en terme de nombre d'individus, maiségalement en tenant compte des structures de la population.
Ainsi, devant l'impossibilité de déterminer cette capacité de charge, on se tournegénéralement vers la notion de densité de population. Néanmoins, la densité telle quecalculée en habitants au kilomètre carré est une pauvre mesure de la pressiondémographique. Les populations humaines comme les populations de plantes oud'animaux, n'occupent pas tout l'espace géographique puisque celui-ci n'est pas
89

entièrement disponible à l'implantation humaine (cours d'eau et dénivellation tropimportante...). De plus, l'entité spatiale de référence cache souvent des disparitésimportantes au sein de son territoire, des zones urbaines côtoyant des espacesagricoles. La densité est-elle dès lors un indicateur efficace de mesure de la pressiondémographique ?
5. L'effet de la densité de population ou celui de la croissancedémographique ?
La densité de peuplement dont il vient d'être question a-t-elle une influence surl'environnement ? Et si l'on considère que les fortes densités ont une influencenégative, cette question laisse place à la suivante: l'environnement urbain est-il plussensible à la dégradation que celui des campagnes ? Dans la perspective historique, laqualité de vie urbaine a toujours connu des difficultés même si elle s'estconsidérablement améliorée au cours du dernier siècle. Une forte densité depeuplement humain induit ipso facto la présence d'industries de productionénergétique, mais également d'autres industries productives situées traditionnellementà proximité des grands centres de peuplement, pourvoyeurs de main-d'oeuvre. Aussi,la pollution industrielle est-elle indissociable de la pression susceptible d'être attribuéeaux hautes densités de peuplement.
Plus spécifiquement, quel est l'impact d'une forte densité d'êtres humains, de par leuractivités domestiques et leur vie de tous les jours ? C'est la pollution atmosphériquepar le chauffage domestique et le gaz d'échappement des véhicules automobiles qui,la première, vient à l'esprit. Actuellement, la pollution de l'air due au trafic routierdépasse largement celle provenant du chauffage domestique et constitue la premièrecause de la concentration de la pollution en milieu urbain. L'environnement urbainsouffre également de la pollution des eaux des ruisseaux traversant les villes et devantaccueillir un volume d'eaux usées en relation avec le chiffre de la population. Demême, l'élimination des déchets ménagers est une tâche dont l'ampleur s'accroît, aumême titre que les risques de pollution qui en résultent, avec la densité depeuplement. Par ailleurs, le bruit constitue également une pollution urbaine qui affectela qualité de la vie et indirectement la santé. Globalement, nous pouvons supposer, entoute première analyse, que l'intensité de ces pollutions est en relation directe avec ladensité de peuplement.
Bien que ce point se trouve à la marge de notre approche, on ne peut ignorer qu'ilexiste, dans les centres urbains, beaucoup plus qu'ailleurs, des besoins urgents deréaménagement de friches abandonnées, de quartiers délabrés, en vue de promouvoirune certaine esthétique urbaine indispensable à la qualité de l'environnement urbain.Ce type de dégradation de l'environnement est également associé à la densité depeuplement, mais il doit être rattaché, plus encore que les autres, à un ensemble decomportements humains qui peuvent être favorisés ou enfreints par les incitations despouvoirs locaux.
L'hypothèse selon laquelle le risque de dégradation de l'environnement urbain,notamment de la qualité de l'air, de celle de l'eau et de tout ce qui touche à la gestiondes déchets, serait proportionnelle à la densité de peuplement est faite en l'absence derecours à des techniques plus appropriées à de fortes densités de population et de
90

consommateurs. Or, il ne fait aucun doute que les investissements technologiques telsque les transports en commun à énergie électrique, les murs antibruits, les systèmesde contrôle de la qualité de l'air etc. sont généralement orientés, de façon prioritaire,vers les zones critiques à haute densité de peuplement. En outre, la préoccupation desgestionnaires locaux est vraisemblablement plus sensible aux problèmesd'environnement, de telle sorte que l'action politique en la matière pourrait très bieneffacer, tout ou en partie, cet impact négatif de la densité de peuplement sur l'état del'environnement urban.
Qui plus est, la perception du respect de l'environnement varie selon l'âge et le sexedes intéressés, mais également selon le milieu urbain ou rural (Collomb et Guérin-Pace, 1993 et 1994) II en résulte souvent une prise de conscience de la populationplus forte en milieu de haute densité, avec, pour conséquence, l'apparition de courantsd'opinions et de comportements plus favorables au respect de l'environnement.Somme toute, dans la plupart des pays occidentaux, on masque partiellement ce quenous supposions, dans un premier temps, être une proportionnalité entre densité depeuplement et risque de dégradation de l'environnement. Même si l'on pressent qu'uneintensité du peuplement plus élevée peut se traduire par une pression plus forte surl'environnement, la densité de population ne constitue qu'un indicateur assez imparfaitpour quantifier cet impact: la variable "population" n'est qu'une variable parmi tantd'autres à prendre en compte pour analyser ce système complexe qui caractérisel'environnement urbain.
Ainsi, la densité de population ne constitue qu'un indicateur assez imparfait si l'ondésire traduire la pression démographique sur l'environnement d'un territoire donné.Qu'en est-il de la croissance démographique ? Même si le débat reste ouvert quant àsavoir si la croissance démographique considérée globalement, en tant que telle, a unimpact direct ou indirect sur l'environnement, il est indéniable que les mouvementsmigratoires lorsqu'ils sont importants, sont également conséquents et se traduisentclairement par un tel effet. De nombreuses situations observées au niveau local, dansles pays occidentaux, démontrent qu'une forte croissance due principalement auxcourants migratoires peut donner lieu à une dégradation substantielle del'environnement.
Ainsi la croissance démographique, par suite des mouvements migratoires, intervientau moins autant que le niveau de densité de peuplement pour rendre compte de ladégradation de l'environnement en un écosystème donné.
6. La pression sur l'environnement exercée par les différentescomposantes du mouvement de la population
Si la croissance naturelle des populations dans les pays industrialisés, l'excédent denaissances sur les décès, n'a vraisemblablement, de nos jours, aucun impact sur l'étatde l'environnement, on se doit toutefois d'examiner l'effet potentiel des mouvementsmigratoires lorsque ceux-ci sont importants et conséquents. En effet, les taux demigration positifs augmentent la pression de la population là où, bien souvent, larichesse de cet environnement est perçu comme un attrait. Les espaces moinspeuplés sont, en général, privilégiés dans le choix d'un nouveau logement. Seuls lesjeunes de 15 à 24 ans se tournent plus volontiers vers les zones urbaines. Les
91

personnes âgés de 25 à 39 ans s'installent de préférence dans les régions rurales enfrange des métropoles alors que les personnes plus âgées auront tendance à se dirigervers des endroits de villégiature plus lointains.
Dans de nombreuses zones rurales, une arrivée massive de nouveaux résidants peutexercer une pression démographique sur des écosystèmes restés, sociologiquementpariant, traditionnels. Des nouveaux bâtiments, de plus en plus nombreux sont érigésen milieu rural, de nouveaux lotissements empiètent sur les terres agricoles et leshabitats naturels, en augmentant démesurément l'espace occupé par les activitéshumaines. Ces tendances récentes se perçoivent rapidement en analysant l'évolutionde la superficie bâtie ou plus généralement l'espace occupé par l'homme à l'exclusionde celui réservé aux activités agricoles et forestières. La croissance démographiquedans ces régions pourrait, tout autant, avoir un effet sur les infrastructuresd'assainissement et d'élimination des déchets et, dans certains cas, elle posera desproblèmes de pollution des cours d'eau et d'accroissement significatif du niveau debruit. En même temps, la pression urbanistique sur les régions rurales pourraitentraîner, d'une part, une perturbation des activités agricoles par le biais demécanismes d'érosion et de détérioration de sols productifs et, d'autre part, unemodification de biodiversité liée à une utilisation différente des espaces naturels.
L'environnement, sous ses formes diverses, est susceptible d'être affecté par suite dela modification rapide de la taille de la population et de la difficulté d'adapter dessituations et des mécanismes agissant, de façon équilibrée, depuis des décennies. Enrevanche, le phénomène inverse est tout à fait plausible, car les nouveaux arrivés sontprobablement nettement plus sensibilisés à la protection d'un certain typed'environnement auquel ils ont été attentifs en choisissant de venir résider à lacampagne. Le rôle moteur que peuvent être amenés à jouer, au sein des collectivitéslocales, certains nouveaux arrivants par l'apport d'idées neuves et d'un dynamismeactif peut orienter les choix pris par la communauté locale. Dans ce contexte, lesrisques nouveaux de pollution peuvent être maîtrisés au même titre que certainessituations plus anciennes que l'immobilisme des anciens ne cherchait pas à résoudre.Dans ce cas de figure, l'effet des mouvements migratoires deviendra largement positif,nous empêchant de la sorte toute généralisation en la matière. Seule une démarchescientifique articulée sur la base d'enquête et d'analyse de cas concrets serait à mêmede faire progresser la question.
La pression sur l'environnement fait intervenir le nombre d'êtres humains sur unterritoire donné et leur type de comportement, le tout étant intégré dans un contextesocio-économique réglé par des choix de société. De là, vient la difficulté de mesurerquantitativement l'impact de la pression démographique puisqu'elle intervient surl'environnement, conjointement avec d'autres facteurs dont il est difficile d'évaluer lapart. Certes, la croissance démographique, par suite des mouvements migratoires, etle niveau élevé de densité de peuplement doivent être considérés pour rendre comptedu risque potentiel de dégradation de l'environnement en un écosystème donné. Mais,Interrelation entre population et environnement est un problème que l'on ne peut isolerde façon expérimentale telle qu'on la pratique couramment dans les sciences exactes.Ici, certains mécanismes physico-chimiques interviennent au même titre que lecomportement humain, le choix societal et le système économique de production etconsommation. Dans une complexité telle qu'il eut été illusoire d'envisager de la
92

décrire ici, il convient d'admettre que la variable "population" au sens démographiquedu terme joue un impact sur l'état de l'environnement qu'il est impossible d'isoler.
7. Quel rôle pour les démographes dans le débat "population-environnement" ?
Après ce tour d'horizon, bien loin d'être exhaustif, du rôle de la variable "population" surl'environnement dans les pays occidentaux, il est utile de se poser la question de latâche que les démographes sont amenés à jouer dans ce débat scientifique. Il seraitillusoire de croire que ce rôle soit fondamental et que, par conséquent, rien ne se ferasans cette intervention. Bien des approches développées par les chercheurs dessciences exactes incluent la variable "population" dans leurs modèles, sans se soucierle plus souvent de ce qu'en pensent les démographes. Il serait malsain de réagir à cetétat de fait par le développement d'approches où la variable population seraitl'articulation centrale, en introduisant de nombreux indices caractérisant la qualité del'environnement et parmi lesquels, nous aurions tout l'embarras du choix et la difficultéde l'interprétation. La seule façon de progresser dans cette recherche consiste en uneapproche interdisciplinaire, au sein de laquelle, ayons l'humilité de le reconnaître, lesdémographes ne maîtrisent, tant bien que mal, qu'une seule variable. Certes, elle estfondamentale, mais, pour les écologues des sciences exactes traitant la questiondepuis de nombreuses années déjà, la tentation est grande de simplifier le rôle de lavariable "population", sans se soucier de tout l'apport spécifique de la démographie.Une insertion dans un débat qui prend, de nos jours, une importance considérable, nese fera que si nous faisons l'effort de simplifier les langages spécifiques et de rendreplus accessible la compréhension des théories et des modèles démographiques.S'intéresser à la relation entre population et environnement pour un démographeimplique sans conteste l'obligation de vouloir une interdisciplinarité vraie et nondéguisée.
Notes
'Voyez à ce sujet les travaux de la Commission "Population et Environnement" del'Union pour l'Etude Scientifique de la Population (UIESP, Liège) et du ComitéInternational des Centres de Recherche en Démographie (CICRED, Paris) ainsi queles recherches de Wolfgang Lutz (NASA, Autriche).zUne émission de la télévision francophone du Canada (Radio Canada), Télé Journalmentionnait le 17 février 1994 que la fertilité des hommes dans certaines zones autourdes grands lacs américains s'était réduite de façon importante depuis une quarantained'années. Le facteur incriminé serait un élément chimique présent dans les rejetsindustriels.3Ce débat est repris pour le cas de CO2 dans Bartiaux et Van Ypersele (1993).
93

Références
Bartiaux, F. et Van Ypersele, J-P. 1993. The role of population growth in globalwarming, International Population Conference, lUSSP, 33-54.
Collomb, Ph. et Guérin-Pace, F. 1993 et 1994. L'âge et les perceptions del'environnement, Populations et Sociétés, 280,1-3, 289,1-2.
Commoner, B. 1988. Rapid population growth and environmental stress. InConsequences of Rapid Population Growth in Developing Countries, UN ExpertGroup Meeting, New York, 231-63.
Commoner, B. 1992. Population, development and the environment. Trends and keyissues in the developed countries. In UN Expert Group Meeting on Population andDevelopment, New York.
Delaunay, J. 1972. Halte à Croissance. Paris: Fayard.
Ehrlich, P. et Ehrlich, A. 1990. The Population Explosion. New York: Simon andSchuster.
Lamotte, M. 1985. Fondements rationnels de l'aménagement d'un territoire. Paris:Masson.
Marden, P.G. et Hodgson, D. 1975. Population, Environment and Quality of Life. NewYork: Wiley.
Moscovici, S. 1976. La sociétés contre nature. Paris: Union Générale.
Poelmans-Kirschen, J., Tollet, R. et Vandermotten, C. 1973. Les 'Responsables"Belges et L'environnement. Résultats d'une enquête. Bruxelles: Editions deL'Université de Bruxelles.
Poucet, T. 1992. L'Environnement. Le comprendre pour le construire, Bruxelles:Editions Vie Ouvrière-Formation Education Culture.
Smith, R.L. 1976. The Ecology of Man: an Ecosystem Approach. Second Edition, NewYork: Harper & Row.
Tabutin, D. 1993. Démographie et environnement dans le Sud et en AfriqueMéditerranéenne. Faits, doctrines et approches. Louvain-la-Neuve; Les Cahiersdu Monde Arabe, 105.
Thilgès, E. et Tabutin, D. 1992. Population et environnement. Une synthèse des faits,doctrines et politiques dans les pays du Sud. Louvain-la-Neuve: Cahiers duCIDEP, 15.
Veyret, Y. et Pech, P. 1993. L'homme et L'environnement Paris: PressesUniversitaires de France.
94

CHAPTER 5
THE RELATIONS BETWEEN POPULATION ANDENVIRONMENT IN THE CONTEXT OF ECONOMIC
GLOBALIZATION: PRELIMINARY CONSIDERATIONS
George Martine(Institute for the Study of Society, Population and Nature, Brasilia, Brazil)
1. Introduction
Population issues have rapidly become a major theme in the global environmentalagenda. During the UNCED-92 Conference, for instance, the world's media networksgave considerable coverage to the presumed role of demographic growth inenvironmental degradation. Meanwhile, participants in the parallel events of the GlobalForum hotly debated population-related topics. This contrasted sharply with the officialdiscussions, wherein the scant and diplomatically-worded consideration given topopulation matters actually attested to the intensity of emotion on the topic.
Increased attention, however, has failed to generate consensus. Indeed,population/environment (P/E) issues are fraught with controversy and the debate, ashas been observed, sheds more heat than light. Hence, despite the real significance ofpopulation matters in the context of development/environment problems, intensedebate on population issues often ends up retarding objective analysis and discussionof more complicated and transcendental politico-economic dilemmas.
This is unfortunate since environmental problems are, by general consensus,becoming increasingly urgent. The role of population in the gestation or aggravation ofenvironmental problems needs to be spelt out more clearly. Real issues need to beidentified and artificial ones discarded.
In the interests of contributing to such clarification, this paper addresses four inter-related questions. First, it will provide a brief but critical review of the main schools ofthought in the current P/E debate. Without purporting to cover systematically the vastliterature generated by this debate in recent years - and much less over the last twohundred years - it focuses on the main and common limitations of both the alarmistand revisionist schools.
Second, an attempt will be made to proffer a more discriminating framework for theidentification of conditions under which given types of population dynamics generatecritical environmental consequences. To this purpose, the paper will submit apreliminary typology of environmental problems according to their magnitude anddegree of criticality; this will be used to help determine more precisely the manner andform of population impacts on the environment.
Third, the paper will argue that the more significant P/E interactions must be analyzedin terms of the current development scenario; more specifically, P/E has to be
95

examined in the light of ongoing economic growth efforts throughout the world. In thepresent historical moment, this means that significant P/E interactions must beexamined within the framework of ongoing economic globalization.
Finally, the argument will be made that placing P/E relations appropriately within thecontext of current development efforts - and therefore of economic globalization trends- shifts the locus of environmental concern in population studies to a greater emphasison urban-related issues. That is, the prevailing emphasis on rural-related preservationand on primary sector activities should be complemented, in this perspective, by amore encompassing concern with densely populated urban areas.
2. The Limitations of the Present Debate on P/E
Several recent overviews have provided a balanced perspective of different aspects inthe P/E relation (e.g. Bongaarts, 1993; Cassen, 1993; Tabah, 1991; Harrison, 1992;McNicoll, 1992; Shaw, 1989; Hogan, 1992; Lutz, 1994; Teitelbaum and Winter, 1993).Whatever their starting points and theoretical basis, it is generally acknowledged thatP/E interactions are but one facet of a broader set of issues involving population,environment and development.
Although the connection of P/E with development is seen as crucial by all sides, theinterpretations of development's role and manner of impact on this relation vary greatly.Moreover, the more influential schools in this debate generally fail to take intoconsideration the specificities of development in the present historical scenario andhow they will affect P/E interactions. In particular, they fail to consider the politicaleconomics of the current development context and how the latter influencespopulation's impact on environmental outcomes.
Efforts at advancing the comprehension of P/E interfaces are largely bogged down inthe ideological/disciplinary debate between "limitationists" and "expansionists".Although both camps have a variety of defendants and postures, the followingdiscussion focuses on the two more visible sub-schools - which we can simplisticallyrefer to as "alarmist biologists" and "revisionist economists". Brief reference to thisdebate is useful as background for the suggestion of an alternative approach.
2.1 The Alarmist Biologists
A sizeable segment of the literature on population and environment during the last 25years has taken the ubiquitous I = PAT equation (Environmental Impact = Population xAffluence x Technology) as a starting point for discussion. This equation was initiallyformulated in 1971 by Ehrlich and Holdren; at the time, it substituted an earlier formula(I = P x F), wherein F represented a somewhat vague function of "per capita impact"1.
Both expressions were coined in the context of a widely-publicized debate which theseauthors were waging with another noted biologist, Barry Commoner. The latter hadbeen arguing that "pollution" had little relation with either population or consumption;instead, it was determined by the pattern of economic growth - which, in turn, wasmediated mainly by technology (Commoner, Corr and Stamler, 1971; Commoner,1972). The IPAT formulation correctly intended to move the debate away from concern
96

with pollution to that with more widespread environmental impacts. Moreover, it wishedto emphasize the fact that it is necessary to deal simultaneously with overpopulation,excessive affluence and faulty technology2.
Although originally intended to be little more than the centerpiece of a rejoinder in aheated debate with a rival biologist, the IPAT formulation has survived the ensuingyears; indeed, it has appeared as the obligatory starting point for much of the P/Edebate.
This formula is undoubtedly a useful tool for calling the layman's attention to some ofthe key factors in the P/E relation, but like the simplistic formulation which it criticized,it also belies the underlying political and socioeconomic complexities of the question.
In recent years, several reviewers have been increasingly critical of the IPAT formulaand its derivatives (e.g. Shaw, 1992; Stern, 1993; Bartiaux and van Ypersele, 1993;Lutz, 1994). Criticism is directed to its interpretation of statistical association ascausation, to the frequent use of incorrect aggregations and to the linear extrapolationof trends in the projection of population, environment and development trends; therein,for instance, the responsibilities of poor and rich people are lumped together insweeping generalizations; meanwhile, technology and per capita consumption areassumed to be uniformly distributed throughout the world. Moreover, despite theauthors' statements that the factors are causally interrelated, the equation treatspopulation as a simple aggregate quantity, whose evolution is independent of"Affluence" or Technology".
More importantly, from this paper's standpoint, the IPAT formulation overlooks the factthat all of the elements in that equation themselves depend on a much more complexconstellation of social, political, economic and institutional factors. Thus, it gives littleregard to historical conditions or to the extreme variability of social groups. Inevitablyomitted in such formulations are exactly those elements which make the subject matterof social scientists so variable, irrational, imprecise and unpredictable - differences inaspirations, values, norms, folkways, behavior patterns and culture; adaptability ofhuman populations to changing circumstances; variations in social structure, politicalorganization, land tenure, social stratification and income distribution; conflicts ofinterest, ignorance, greed, lust and diverse forms of anti-social behavior; politicalconduct, manipulation, struggles for power, and so forth.
The same criticism can be levelled at the synthetic formulations of Barry Commoner,the IPAT formulators' arch-rival3. In short, synthetic formulations such as IPAT inviteus to think of P/E in mechanistic and a historical terms. Although cognizant that eachfactor in the equation hides considerable complexity, the attempt at synthesisoversimplifies the issue4. Coined by natural scientists, IPAT has an aura whichemulates their heralded precision but reduces complex social phenomena tooversimplified relations on a limited gamut of poorly-defined variables.
The inability to situate "Affluence" and "Technology" within the context of their socio-political and economic framework helps set up the relatively straightforward"Population" variable as the obvious culprit of "Impact". By the same token, the relativesimplicity of "Population" solutions is enticing, particularly in comparison to thecomplexities involved in dealing with the other factors in the IPAT equation. Attemptsto deal effectively with the determinants of "Affluence" and Technology" would requireaddressing extremely complex, diffuse and politically-loaded issues; the very nature of
97

modern civilization would probably have to be brought into question. By comparison,efforts to change irrational and obsolete reproductive patterns are obviously muchsimpler.
In reaction to criticisms, subsequent writings of Ehrlich and others have attempted toaccount for the complexity of interactions and variations which influence the way manpressures the environment. Holdren (1991:5-6), for instance, has acknowledged thatthe I PAT formulation should be upgraded by adding on other variables such as culture,political factors, urbanization and other "causative and modulating factors*. However, indoing so, the IPAT equation would lose its appealing simplicity and risk becoming amulti-syllabic oxymoron. The way in which it is suggested that such complexitiesshould be handled is typical of a natural sciences' approach: Holdren (1991:4-5)suggests that we should begin by cataloguing and integrating our understanding ofthese other "threats to ecosystem services". Amassing more and better evidence onhow mankind endangers the environment is thus seen as the key element in any futureresearch agenda
Such an approach evidently ignores the fact that each of these factors is itselfinterlinked with more encompassing political, socio-economic and institutional factors;moreover, it prejudges the issue since it again assumes, a priori, that more mankindnecessarily produces more environmental degradation. Indeed, the same authorexplicitly states elsewhere that almost every region in nearly every country hasexcessive population growth (Holdren, 1992). In short, although considerable effort ismade to account for social complexity, the profound and aprioristic conviction of theIPAT school that population size and growth are primarily responsible forenvironmental degradation nullifies such effort.
In sum, despite attempts at incorporating a more integrated view of the multipledeterminants of environmental degradation, the IPAT formulation is inherentlyinadequate. Nevertheless, it continues to be frequently cited by policy-makinginstitutions - particularly those in the population control or family planning field - asclear evidence of the need for widespread fertility control measures.
In this sense, it is interesting to observe that, although the use and interpretation of theIPAT formulation does not necessarily have to be neo-malthusian, its initial and lastingthrust has almost universally been interpreted as the very essence of controlism. Partof this is due to the incessant and well-publicized crusade of its principal authors infavor of population control. However, part is also due to the fact that these authorsprovide a much better characterization of population dynamics and of their allegedimplications for policy formulation than of the other elements in the IPAT formula.Indeed, although the "Affluence" and "Technology" parts of the equation refer (albeit,vaguely) to the role of industrial civilization in environmental degradation, theexplanation of these factors and of their policy derivatives pales by comparison to thevivid descriptions of population's roles and of the need for population control. This iswhy the vast majority of efforts aimed at limiting population growth for environmentalreasons are legitimized with a referral to the standard IPAT contention.
98

2.2 The Revisionist Economists
During the past few decades, the most outspoken opposition to neo-Malthusianism,viewed as a generic approach, has come from the self-entitled "revisionists". Thisgroup is mostly composed of North American economist-demographers who make adistinctly "non-alarmist" assessment of the consequences of population size andgrowth. Most revisionists agree that the Third World would benefit from a slower rate ofpopulation growth but consider that its alleged role in resource depletion isexaggerated.
The evolving prominence of this school of thought would, in itself, constitute aninteresting study. The works of Boserup (1981) and Simon (1981) have received themost attention in this context; their frontal disagreement with the population controlthesis has generated considerable controversy in the mostly hostile milieu whichprevails outside of American economics. However, a large number of other paperssimilarly argue the basic irrelevance of population factors to environmental degradation(Kelley, 1988, forthcoming; Srinivasan, 1988; Weir, 1988; Johnson, 1993).
The revisionist school currently considers the famous 1953 "D and C" publication bythe Population Division of the United Nations as a seminal contribution to its position(UN, 1953). However, the most important documents produced by the revisionists wereprobably the 1971 and 1986 reports commissioned by the National Research Councilof the National Academy of Sciences (NAS) of the United States- These studiesconstitute important landmarks in the debate. True, the 1971 report appears to beclearly alarmist, particularly in its more widely-disseminated executive summary.Nevertheless, this is because the summary basically contradicts the tenor of the majorscholarly papers which underlie the report and which basically fail to find anysignificant association between population growth and economic development (Kelleyand McGreevey, 1994). That is, the summary was apparently manipulated and did notreflect the position of the majority of the scholars involved in its preparation.
The subsequent 1986 report commissioned by the NAS unequivocally states a non-alarmist position. Nevertheless, it has, by comparison, been given much less play inpopulation circles and in the mass media than the executive summary of itspredecessor report. The 1986 study basically considers that concern with populationgrowth as the cause of resource exhaustion, of savings and investment constraints andof shifts away from productive physical capital formation, is largely misplaced. Theother side of this argument is, of course, that markets (also referred to as "ModemEconomic Growth") will eventually solve everything, including rapid rates of populationgrowth and environmental degradation.
Given the multifaceted political reinforcements which the market currently commandson the international scene, this view has gained considerable venue. In light of thecurrent neo-liberal ethos of current economic growth strategies (i.e.- opening up ofnational and internal boundaries to the free flow of market forces), the importance ofpopulation growth logically has to be down played5. The school of thought whichquestions the validity of the predominant notion that higher rates of population growthhave adverse effects upon economic well-being has thus been making increasingheadway.
99

The perspective adopted in the present paper is that economic revisionism, likebiological controlism, is conducive to oversimplified generalizations with respect topopulation's role in environmental degradation or well-being. Actually, if taken literally,its implications for environmental outcomes can be considered as potentially moredangerous than those of the population control school. Even if we concurred that all ofhumanity's current problems stem from market imperfections, the laissez-faireattitudes which it encourages are, to say the least, potentially risky. In other words,should market mechanisms take longer than expected to correct both population andenvironmental trajectories, the toll on humanity could be enormous. In the words ofHerman Daly (1993:50) "...my major concern about my profession today is that ourdisciplinary preference for logically beautiful results over factually grounded policieshas reached such fanatical proportions that we economists have become dangerous tothe earth and to its inhabitants.".
In short, the revisionist perspective does a good job of down-playing populationgrowth's direct role in resource depletion or in constraining economic growth.Nevertheless, it cuts corners, overstates its case and oversimplifies the issue. Onecould also argue that it is misleading as to the historical role played by the State ineconomic growth, or that it exaggerates the practical possibilities of a free marketwithout externalities or political constraints - but that would take us far afield. Forpresent purposes, it can be criticized for assuming that disembodied market forces:
a) are capable of generating acceptable growth and equity in all situations andcontexts, or;
b) that they are universally capable of overcoming the environmental constraintsimposed by rapid population growth.
2.3 Alarmists and Revisionists: An Overview
From the foregoing, it can be argued that neither of the two dominant approaches tothe understanding of P/E interactions provides a balanced outlook which is conduciveto realistic solutions.
The population control solutions suggested by IPAT-type formulations appear to bemore appealing and have probably had considerably more influence on public opinionand on policymaking at the world-wide level. Such approaches apparently constitutethe "safe" outlook in the sense that, ceteris paribus, early reductions in populationgrowth - while the dimensions of the population mass are still manageable - wouldappear to be a more prudent course than waiting for a possible world catastrophe. Yet,it also detracts attention from what this paper argues to be the key issue - namely thevery nature of "development" in the future.
Meanwhile, the revisionist outlook is undoubtedly isomorphic with the current trend ofdevelopment. It has had an important influence in downplaying the exaggeratedemphasis placed on population's role in environmental degradation, and it hasrevalidated the very real importance of economic and technological factors in societalchange. Nevertheless, its blind faith in market mechanisms and its understatement ofprobable future difficulties reads as a dangerous combination of natural law andfatalism.
100

3. Levels and Significance of P/E Interactions
The main contention of this section is that in order to understand how, when, and inwhat ways population dynamics have an influence on environmental outcomes, it isnecessary, first of all, to differentiate between types and levels of environmentalproblems. Second, it is necessary to link their evolution to ongoing economic growthefforts (Martine, 1993).
There are a great variety of environmental problems differentially affected bypopulation growth, size and distribution. In turn, these constitute threats of widely-differentiated significance to the survival of humankind on planet earth. A basicweakness of the dominant P/E literature is its tendency to lump all environmentalproblems into the same undifferentiated category, without attempting to discriminateserious and generalized problems from minor and localized ones. Little effort has beenmade to rank the various manifestations of environmental problems and their sources.This failure makes it exceedingly difficult to gauge the significance of population's realcontribution to environmental degradation.
The argument being made here is that the contribution of population factors toenvironmental problems has to be measured in terms of the tatter's degree of intensity,gravity and reversibility. In order to illustrate the importance of such a distinction for theadvancement of our knowledge of P/E relations, a simple and dichotomous separationcan be made. On one side, a list of critical and global environmental problems will bedrawn up; on the other, secondary and localized or temporary problems will becatalogued. Then, an attempt will be made to identify how, and to what extent,population factors affect each of these sets of problems.
For present purposes, critical/global environmental problems can be defined as thosewhich adversely affect humankind's very ability to survive comfortably on planet earthand which can be expected to pervade, sooner or later, all (or the majority) of theplanet's inhabited sub-regions. In addition, there is no known antidote or technologywhich can safely and economically counteract the effect of the problems describedhere as critical/global.
By contrast, secondary environmental problems are those which either do notendanger humankind's very survival or do so within a limited time or spatial framework.This category also includes problems which could threaten all or a majority of theworld's population if left unchecked but for which technological solutions already existor are in the offing.
There is evidently no generalized consensus as to the exact order or contents ofenvironmental problems affecting humankind. Nevertheless, it can be suggested thatthe great majority of scientists would acknowledge that the more critical problemsendangering humankind's survival on planet earth include, at least, the following: thedepletion of the ozone layer, global climate changes, the accumulation of toxicchemical or radioactive wastes coupled with the exhaustion of unfilled sinks, thehuman over-appropriation of biomass, and the loss of biodiversity.
Secondary problems, by comparison, include a wide variety of environmental crises ofvariable gravity, durability, extension and reversibility. They are variously caused bythe use of inappropriate technologies, maladministration of natural resources,
101

population growth, poverty or a combination of these factors. However, they are lessacute and/or are restricted to a given part of the earth's surface. Moreover, they aresubject to reversion, correction or prevention through development, political will,increased investment by the public or private sectors and/or foreseeable technologicalbreakthroughs.
Under this category, varied forms of environmental degradation can be listed. Thesewould include such problems as individual instances of nuclear accidents and otherspecific forms of radioactive contamination, acid rain, air and water pollution,desertification and other forms of land degradation, depletion of natural resources, andfloods, inter alia. Each of these is undoubtedly serious in and of itself, while alsocontributing to the formation of global problems in the long run; however, their spatial ortemporal restriction, as well as their susceptibility to control and reversion, place themin a less critical category.
What is the point of this (or another analogous) classification of critical versussecondary problems within the context of the P/E debate? Basically, such a taxonomyhelps us to clarify the role and extent of population's influence on environmentalproblems. The following discussion attempts to illustrate this.
Most of the critical/global problems listed above presently derive not from populationsize or rate of growth but, rather, from the production and consumption patternsassociated with industrialization; hence, they are largely attributable to development inhigh-income countries and, to a lesser but growing extent, to economic growth effortsof the less developed world.
In this connection, the following summary evidence reported by the UNFPA (1991:14)is worth repeating.
"With barely 25 per cent of the world's population, developed countries consume75 per cent of all energy used, 79 per cent of all commercial fuels, 85 per cent ofall wood products and 72 per cent of all steel production. In addition, developedcountries generate nearly three quarters of all carbon dioxide emissions whichaccount for half of the greenhouse gases in the atmosphere."
Given the dimensions of energy consumption and of non-renewable resources, of theemission of carbon dioxide, CFCs as well as other gases, and of the production oftoxic wastes in developed countries, it is correct to assert that, at the present time, atleast three of the five critical/global problems - depletion of the ozone layer, climatechanges and the accumulation of non-disposable toxic wastes - stem directly fromindustrial civilization as experienced by the developed countries; only China, India andBrazil (the latter due only to deforestation, which is decreasing) need be mentioned inconnection with ozone depletion and climate changes.
The over-appropriation of human biomass is probably divided fairly evenly betweendeveloped and developing areas. Hence, only the loss of biodiversity is clearlyassociated with poor countries having high population growth rates. Again, however, itis important to point out that this occurs because only the southern hemisphere hasany biodiversity ' left to speak of. Even then, efforts at modern agricultural growththrough the adoption of Green Revolution technology in various countries of thesouthern hemisphere are probably much more instrumental than population growth orpoverty in total biodiversity loss.
102

By contrast, secondary/local/temporary problems are found, though in varying mannersand proportions, in both developing and developed countries. Some of these (e.g.nuclear contamination and acid rain) are more characteristically found in developedregions, whereas deforestation, erosion and desertification are more common in poorcountries. Still others, such as depletion of natural resources and floods, are found inboth, although often linked to different causes.
A main point highlighted by this discussion is that population size and rate of growthper se cannot be blamed for the major environmental problems affecting humankindtoday. This is not to say that population is irrelevant. On the contrary, populationfactors are clearly associated with the aggravation of several forms of environmentalproblems classified here as secondary. Moreover, they unquestionably catalyze andcontribute indirectly to the aggravation of critical global problems.
More importantly, however, the above discussion serves to point out that populationdynamics fundamentally affect the dimension and gravity of environmental problemsthrough efforts made by countries to achieve development. This occurs in two forms: 1)through population growth in the developed countries - where higher per capitaconsumption multiplies the impacts of each incremental person, and 2) through theincrease in per capita consumption in developing countries, particularly in those havinga large population and/or a high population growth rate.
The relevance of this point for the P/E issue is straightforward but, nevertheless,extremely important. Under present technological and environmental control levels,both population growth and economic growth in developed countries areenvironmentally dangerous. On the other hand, if the per capita consumption levels ofthe relatively small and slow-growing countries (under the same technological andenvironmental control conditions) were to be achieved by some of the large and/orrapidly-growing countries, the serious environmental problems of planet earth wouldinevitably multiply.
In both cases, then, population factors are unquestionably important. However, theircontribution to the expansion of critical/global problems is conditioned by the shapeand rate of development. In brief, population's contribution to global environmentalproblems will depend on:
a) the rate and degree of incorporation, by poor countries, of the production andconsumption patterns (i.e. economic growth) which currently prevail inindustrialized countries;
b) the size and rate of population growth in countries which manage to achieve ormaintain high levels of economic growth;
c) the rhythm of development and adoption of technologies which will permit moreenvironmentally-friendly patterns of production and consumption, both indeveloped and developing countries - but particularly in large, populous ones.
The key issue, therefore, is that global environmental outcomes will dependfundamentally on the nature and on the success of development efforts undertaken byspecific countries, particularly large and populous ones. There is undoubtedly auniversal quest throughout the world for development. This is increasingly beingdefined, in practice, as economic growth; indeed, the quasi-philosophical discussionssurrounding the nature of development have been largely silenced by the thrust of
103

efforts to achieve economic growth, which is seen to be, in practice, the source ofother benefits.
The crucial issue in this context is thus: what are the prospects for economic growth intoday's developing countries, particularly in large or fast-growing ones? Can thesecountries readily attain economic growth in the immediate or foreseeable future? Withwhat consequences?
In turn, this brings up the question - what is the framework within which economicgrowth efforts are taking place now and in the foreseeable future? At the present time,there seems to be little doubt that the principal feature of the macro framework whichwill dominate the development scenario - and thus the nature and outcomes of P/Einteractions - is the process of economic globalization. The next section discussessome of the ways in which globalization may affect this equation.
4. P/E Interactions within the Context of Development: theImportance of Globalization
A central contention of this paper is that in order to understand how P/E interfaces willaffect humankind, it is necessary to situate them within the context of currentdevelopment efforts. Evidently, relating P/E to development is, in itself, nothing new6.However, the interpretation of which aspects of development are critical differs herefrom the prevailing statement in the literature; more specifically, it is suggested herethat P/E interactions must be situated concretely within the current scenario ofeconomic globalization.
The point being made here is that P/E interactions must be analyzed, not merely interms of their relationships with a specific sub-set of variables which are commonlytaken as proxies or indicators of some aspect of development - such as affluence ortechnology - but rather within the more integrated and complex framework ofdevelopment (i.e. economic growth) efforts such as they are construed today. In turn,this basically means inserting P/E relations within the evolving political and economiccontext of globalization. The next paragraphs discuss this phenomenon and some of itsprobable implications for P/E interactions.
The world is being progressively integrated and homogenized by communications,technology, financial flows, consumption patterns, cultural and behavioral patterns andeven recreational habits. More recently, the disintegration of centrally-plannedeconomies has added a catalytic factor to all previous forms of globalization - namely,the spreading ideology and practice of market economics. As a result of these recenttransformations, the international division of labor is being altered and the flow ofresources between countries and continents is being accelerated - with significantimplications for the nature and gravity of global and local environmental problems.
Economic globalization has its roots in the structural crisis of the 1970s, caused jointlyby the deterioration of the international monetary situation and the oil crises. Therestructuring of capitalism in response to these predicaments generated three maintypes of world-wide consequences. First, capital/labor relations were modified tobenefit a greater appropriation of surplus by capital through higher productivity,reduced wages and benefits, as well as decentralization of production. Second, the
104

role of the state was reduced in the internal sphere and yet modified to favor capitalaccumulation on an international plane. Third, economic processes were swiftlyinternationalized in order to increase profitability and expand markets (Castells, 1989).
The interaction of these three processes has greatly enhanced the legitimacy andfeasibility of profit-seeking on a world-wide scale. Several historical occurrencesconverged in the 1980s to strengthen this trend. First, shifting political winds, resultedin the elections of Ronald Reagan and Margaret Thatcher, whose apparent successesin implementing neo-liberal policies in the USA and UK, respectively, providedconsiderable leverage to the ideological underpinnings of globalization.
Meanwhile, the gravity and duration of the world economic crisis in the 1980s forcedmost developing countries to redefine their economic policies. Widespread andintensive debt negotiations boosted the prominence of international financialinstitutions and gave their standard neo-liberal prescription for structural adjustmentenormous political clout. The strength of the market ideology was further enhanced bythe collapse of most centrally-planned economies. Similarly, the conspicuouseconomic success of a few Asian countries which had apparently adopted the tenets ofneo-liberalism provided additional stimuli - despite the fact that more careful analysisshows the crucial role played by the State in the take-off of these countries.
Lacking any feasible alternative and driven by the exigencies of bilateral andmultilateral international agencies, poor countries now have a single approach todevelopment at their disposal, namely, the removal of all barriers to the free flow ofcapital and resources. The greater or lesser acceptance of this simple deregulationformula by a progressively increasing number of the world's countries has allowedcapital to seek the most favorable conditions for investment and production anywherein the world. The resulting free flow of resources for purposes of increasing profit andproductivity is the essence of ongoing economic globalization.
As a result of this process, the rate at which capital circulates in its relentless 24-hoursearch for the most favorable conditions has speeded up enormously. In the interim,the financial and information industries have succeeded manufacturing as the keyeconomic sectors at the world-wide level. At the same time, given the ease andrapidity of capital flows, investments, production and markets have become extremelyvolatile (Castells, 1989: chap. 1).
Of what importance is the process of globalization for the understanding of P/Erelations? The basic issues at play here are twofold:
a) will globalization of market forces, in fact, generate rapid economic growth -particularly in large, populous countries?
b) will globalization contribute significantly to environmental degradation, particularlyas concerns critical/global problems, or will it, on the contrary, help to alleviatesuch problems?
Without pretending to answer either of these complex and hotly-debated questionshere, the following points can be made.
105

4.1. The Prospects for Economic Growth
Traditional paradigms may be of relatively little use in predicting the outcomes ofcurrent economic growth efforts in the context of globalization. Standard market theoryasserts that the removal of market imperfections on a world-wide basis will promotegeneralized economic growth. Indeed, deregulated international commerce, based oninternational specialization according to comparative advantages, constitutes the onlyavailable recipe for development today. Presumably, since the free flow of marketforces heightens world-wide competition, each country or region will increasinglyexploit its comparative or locational advantages to the extent possible in order toenhance its competitiveness.
Such advantages are not equally spread throughout the world. It can be postulated thatthe ability to generate or adopt new technologies determines the primary level ofcompetitiveness on a world-wide scale. Yet, historically-accumulated advantages - inthe area of financial or human resources, entrepreneurial savoir-faire, technology ornatural resources - will not only continue to prevail, but will also tend to increase in thecontext of globalized competition.
The key issue for the present discussion is - what factors will increasecompetitiveness at the secondary tier of competition, (i.e. among those countrieshaving little capacity to generate or adopt new technologies in the foreseeable future)?What are the comparative and locational advantages of less developed countries in aglobalized world, given that they possess relatively little by way of capital,technological capacity or trained human resources?
Some of the comparative or locational advantages which different developing regionstraditionally held may tend to lose their significance. For instance, the availability of acheap and bountiful supply of manpower is an advantage which tends to become lessimportant. On the one side, technological development greatly reduces the demand formany types of cheap and untrained labor. On the other, current global populationincreases of close to 100 million a year - most of which accrues to poor and highly-populated countries - greatly reduces the significance of large and untrained laborstocks.
Under these circumstances, the main question is: what instruments will developingcountries use to compete in international markets? Development agencies exhortcountries to increase competition and thereby reduce costs. But, as Daly (1993) pointsout, competition can reduce costs in two ways: by increasing efficiency, or by loweringstandards in pollution control, worker wages, health care and so on.
Hence, environmental and social dumping are both realistic probabilities in the contextof globalized competition. In other words, developing countries may be pushed to acompetition based on spurious advantages by their lack of real comparativeadvantages. What will be the environmental outcomes of the strategies adopted bydifferent countries to increase their participation in global economic activities? Will thewillingness to part with natural resources, to ignore environmental outcomes ofeconomic activity, or to serve as repositories for toxic wastes be a significantcomponent of the secondary tier of competitiveness?
106
4.2. Economic Growth Efforts and the Environment
The quest for economic growth and development is practically universal in the end ofcentury scenario. The approved path for economic growth suggests that poor countriesshould broadly emulate the production and consumption patterns of industrializednations. Yet, this is a sobering prospect from an environmental standpoint. Indeed suchproduction and consumption patterns are largely responsible for the critical and globalforms of environmental destruction observed today. Technological improvements andchanging consumption practices could greatly alleviate this situation in rich countries,even using only current knowledge. However, political will for such widespread changeis still incomplete. This is basically because environmental preservation often clasheswith short-term economic interests.
In some high-income countries, the value increasingly being placed on environmentalquality and the related strengthening of environmentalist movements can conceivablylead to significant improvements in the relations between the economy and theenvironment in the foreseeable future. Improved technology, changing values andconsumption habits can conceivably generate momentous changes in the near future.
However, to what extent can such advances be incorporated by developing countries?Their overwhelming priority is economic growth to create jobs, generate income andprovide minimum sustenance and shelter. Their access to technology tends to be ageneration late. Environmental preservation almost inherently involves investment andcosts; hence it constitutes a luxury. Consequently, international differences inenvironmental standards are inevitable. Under such circumstances, is it realistic toexpect that poor and middle-income countries will be willing to invest in environmentaltechnology and protection during their take-off stages? Are there particular facets builtinto the free trade model which will necessarily benefit environmental causes?
There is still little consensus on this point. Economists and environmentalists arecurrently engaged in a heated debate concerning the probable implications of freetrade. Some of the main arguments formulated at opposing extremes of the spectrumcan be summarily sketched out7.
One side basically argues that the adverse effects of economic growth onenvironmental degradation can be greatly reduced. In this view, static assumptionsabout technology, waste and environmental investments are what underlie thepessimistic projections of growth impacts. The key is not to produce less butdifferently. Secular increases in the productivity of resource use will eventually produceabsolute declines in resource throughput and pollution. Liberalized trade could actuallyspeed up the diffusion of environmentally-preferred technologies and practices. Byaltering the structure of goods and services that are being produced, substituting awayfrom resources that are becoming scarce and adopting clean technologies andmanagement practices, economic growth is perfectly compatible with environmentalconservation.
The alternate view holds that any prospect of economic growth is inherentlythreatening to source capacities and, more importantly, to environmental sink capacity.Trade and environment inevitably have different priorities. Economic growth in poorcountries will only occur if there is even further growth by the rich, high-consumptionsocieties, thereby increasing damage to global life support systems (as well as
107

sharpening existing inequalities). Markets feed on war, waste, planned obsolescenceand the encouragement of superfluous consumption. Market mechanisms provide onlylimited and localized incentives to substitution of resources, technology and practices.Market incentives to migration of polluting industries and toxic wastes and marketabhorrence of regulations can ultimately defeat conservation efforts made in higher-income countries.
Evidently, such perceptions are not easily reconcilable. The economists' view isoptimistic with regard to the markets' capacity to generate technological solutions andpromote their adoption. Environmentalists generally fail to see grounds for suchoptimism in either markets or human nature.
Without delving into this discussion at length here, the view taken in this paper is that,despite auspicious instances of technological breakthroughs, resource substitution andchanges in consumption patterns, there is little cause for optimism. The inequalities ofthe globalized economy inherently favor the use of environmental and social non-regulation as leverage in international competition. Markets are ultimately governed byprofit motives - which will generally react to environmental stimuli only whenconsumers and/or legislators oblige them. In many cases, this may be too late.
In short, the view of this paper is that the more probable scenario is one in which, leftto their own devices, trade-offs between environmental and economic interests willoften tend to be resolved in favor of the latter. The critical question in this connection -and one which again would take us far afield - is how social and environmentalmovements could alter the timing of environmentally favorable decisions. In order tohave a meaningful impact, it is essential that, inter alia, such movements addresscritical issues. The next section deals with this question within a limited context -namely, the implications of globalization for the definition of research priorities.
5. The Locus of the Environmental Agenda
The 1980s marked a historic upsurge in environmental awareness all over the world.Throughout, most of the attention of environmentalists, policymakers, donors andresearchers has been focused on rural-based ecosystems, tropical forests and thepreservation of species - i.e. The Green Agenda. It will be argued here that greateremphasis needs to be placed on the interface between economic development effortsand global environmental problems, particularly within the context of densely populatedurban areas, whose livelihood depends basically on secondary and tertiary sectoractivities - i.e. The Brown Agenda.
The two agendas are, in fact, inextricably linked. Preservation of biodiversity and oftropical ecosystems is indisputably critical to the survival of humankind on planet earth.Yet, such preservation will be extremely difficult to achieve if strategic and fragile landareas - such as tropical forests, wetlands and mangroves - are overrun due to thelack of viable economic alternatives. That is, the expansion of jobs in rural areas exertsdirect pressure on natural resources.
Hence, without realistic development perspectives in other less fragile or less strategicareas, the long-range requisites of the Green Agenda seriously risk being overrun bynear-sighted profit ventures or by the survival strategies of societies' poorer segments.
108
This happens, for instance, whenever large population contingents burn down theforests to engage in subsistence agriculture, or, whenever logging becomes asignificant source of revenue in the context of a given nation's economy.
Hence, development issues are paramount for environmental conservation. This typeof reflection sets the entire P/E agenda squarely within the framework of the currentdevelopment scenario discussed above. The protection of biodiversity and of naturalecosystems is likely to depend on real development alternatives, primarily in non-primary sector activities and densely populated areas.
The urban context will thus be crucial in the evolution of future global environmentalproblems. On the one hand, cities will congregate an increasingly larger segment of theworld's population and they will be more and more critical in future economicdevelopment efforts. On the other, environmental outcomes will be Increasinglydependent on the trajectory of economic and demographic growth in the cities.
Traditionally, population concentrations have held the key to economic dynamism.Within the framework of globalized markets, the locus of economic growth will, in themajority of countries, be progressively more urban. The importance of the cities'comparative advantages tends to be greatly accrued in this scenario.
Thus, the World Bank estimates that between now and the year 2000, some 80 percent of Third World GDP growth will originate in towns and cities; moreover,productivity will probably continue to be correlated with city size (UNDP/World Bank/UNCHS, 1993). Consumption will also be increasingly concentrated in cities. In thislight, it appears inevitable that the Brown Agenda will have to be given greaterattention; the future of both preservation and global environmental changes aredependent on urban-based outcomes.
From a demographic standpoint, cities have long been growing at a much faster ratethan rural areas. By the early 21st century, they will contain more than half of theworld's population. Urban growth is particularly significant in poor and developingcountries. By the year 2000, it is expected that there will be 21 cities of over 10 millioninhabitants; some 17 of these will be in poor and developing countries (UN, 1991).
Several countries have an enormous potential for rapid urban growth. This isparticularly true of large, populous countries such as China, India, Nigeria, Indonesia,Pakistan and Bangladesh which have, at this time, a predominantly rural base. One outof every four persons on earth now lives in a rural area of China or India. The case ofChina is particularly significant: one-seventh of the world's population lives in thiscountry's rural areas, but the current economic revolution is breaking up traditionalstructures and transforming hundreds of millions of people into potential migrants.Efforts to understand and anticipate the probable environmental implications of suchtransformations are urgently needed.
In other regions, particularly Latin America, the rapid urban growth of the last fewdecades has already generated severe environmental problems which bear analysisand appropriate action. Rapid urbanization without economic development can produceenormous negative environmental impacts due to the lack of basic infrastructure,sanitation or health services. The homes of poor urban families constitute one of themost degraded and harmful environments to be found anywhere (e.g. Hardoy andSatterthwaite, 1989; ILO, 1992; Hogan, 1992).
109

Yet, the majority of people living in Third World cities are poor or living in miserableconditions. The rapid city growth of coming years will inevitably be associated withincreasing numbers and proportions of such people. Moreover, environmentaJdegradation during coming years will inevitably be hardest on the poor people in citiesof Third World countries.
Nevertheless, it is fundamental to recognize that curbing urban growth is not thesolution to either environmental or social problems. On the whole, past policies in thearea of internal migrations and spatial redistribution have generally reflected an anti-urban bias. Concentration has commonly been viewed as undesirable. An implicitassumption underlying such policies seems to be that territorial equity, somehow helpsto promote social equity (Martine, 1992).
As a result of this philosophy, déconcentration and interiorization through explicitpolicies has been systematically promoted in the development efforts of the last threedecades. To this purpose, strategies such as growth poles, colonization of openspaces, regional development, industrial disincentives and the like have been common.
By contrast, implicit redistribution policies, whose impact is derived from theunintended consequences of productive investments, have generally favoredconcentration. That is, productive investments, even those made by the public sector,tend to be oriented by market mechanisms, and hence are channelled to those areaswhich hold comparative advantages. Given the fact that migration flows - and,therefore, the spatial distribution of societies - accompany the allocation ofinvestments, economic activities and jobs over space, implicit policies have been moreinfluential. That is, concentration has resulted, in large part, from the free flow ofmarket forces - despite the systematic efforts of governments to the contrary.
Since, on a world-wide scale, the current politico-ideological scenario and, thus, theforeseeable future, favors market mechanisms even more, it can be expected that thepropensity to concentrate investments and activities in urban areas will beaccentuated. Hence, migration flows to the cities will continue.
This should not be discouraged outright since - contrary to the conviction which hasprevailed for many years - the concrete possibilities for economic growth, and thus forthe resolution of economic and social problems of the poor, inevitably lie in theoutcomes of development efforts in urban areas. By the same token, evenenvironmental outcomes are directly dependent on the ability of urban areas to absorbpopulation productively and thereby to generate the necessary resources, technologyand political will for environmental improvement. Consequently, concentration is bothinevitable and desirable; nevertheless, much greater explicit effort will have to bedirected to the cities before they can achieve their potential in terms of resolving social,economic and environmental problems.
Social and environmental problems are closely linked. Poor people in urban areas facecritical survival problems associated with the lack of safe water, sanitation anddrainage. Moreover, the problems generated by inadequate waste management,uncontrolled emissions and environmental accidents directly affect the living conditionsand the health of the poor.
Cities are also major centers of pollution and resource degradation. Urban warming isitself a major source of concern. Urban emissions not only contaminate the air
110

consumed by the urban population but, they also represent an increasingly significantshare of the gases responsible for global climactic changes and the depletion of theozone layer.
As major centers of production and consumption, cities also rely on a very high input ofresources such as fossil fuels and water. Unless important precautionary andcorrective investments are made, the water that cities use in industrial activity isreturned to rivers and lakes at lower quality. Urban sprawl uses up valuable agriculturalland and creates the need for energy-intensive transportation systems.
In short, there are several powerful reasons why P/E interactions should begin to beaddressed preferentially within the framework of urban settings. This is of considerablesignificance for the agenda of P/E studies. It also should help redirect the thrust ofenvironmental movements and their supporters.
6. Conclusion
The current debate on population and environment is largely at a standstill. Not onlyare many of the participants deaf to each other's arguments but the main thrust of thecontroversy fails to take account of how P/E relations will be affected by the principalphenomenon in the current end-of-century scenario - namely, economic globalization.
This paper has argued that deregulation and increasingly internationalized competitionare exceedingly important for global environmental outcomes. To understand the roleplayed by population dynamics within that context, it is helpful to distinguish betweencritical/global versus secondary/localized/reversible environmental problems and toidentify the contribution of population dynamics to both of these within the context ofongoing development efforts. This exercise highlights the fact that population's centralcontribution to environmental degradation is basically channelled through economicgrowth.
Hence, the nature, form and timing of the impact which population dynamics have oncritical environmental problems are dependent, to a large extent, on P/E interfaces inindustrialized countries, and on whether poorer countries will achieve a similareconomic growth. In turn, the trajectory of economic growth will be determined by theevolution of ongoing globalization.
Such reflections argue for the need to review the terms of the population/environmentdebate. They also counsel a shift in the terms of the environmental agenda, away fromwhat can sometimes be perceived as a quasi-exclusive concern with rural-basedecosystems, to a greater emphasis on social and environmental outcomes in denselypopulated urban areas. Cities will not only hold a majority of the world's population inthe 21st century but they will also harbor most of its economic activity. Hence, thetrajectory of economic growth, the resolution of social problems, the definition ofenvironmental issues - in sum, the kind of world we are to live in - will be defined inthe cities.
Neither blind faith in the power of markets nor in population control are conducive togenerating the kinds of technical information, nor the magnitude of social, political andenvironmental awareness which are necessary to begin dealing with the awesomedimensions of this challenge.
I l l

Note: An earlier version of parts of this paper was presented at the Third Conferenceon Environmental Security, Tufts University, 31 May - 4 June, 1994, under the title of"Population/environment relations and international security: the impacts ofglobalization."
Footnotes
1"The total negative impact of an [agricultural or technological] society on theenvironment can be expressed, in the simplest terms, by the relation I = P x F, where Pis the population, and F is a function which measures the per capita impact" (Ehrlichand Holdren, 1971). The actual IPAT equation was first used in late 1971 andpublished by Ehrlich and Holdren in Environment, April 1972.2"ln fixing the blame for environmental deterioration on faulty technology alone,Commoner's position is uncomplicated, socially comfortable and, hence, seductive. Butthere is little point in deluding the public on these matters; the truth is that we mustgrapple SIMULTANEOUSLY with overpopulation, excessive affluence, and faultytechnology" (Ehrlich and Holdren, 1972), (emphasis in original).3Actually, Commoner's formulas appear to be even more simplistic. His most recentattempt at redefining his [Pollution = Population x Good/Population x Pollution/Good] issingularly unconvincing (Cf. Commoner, 1992).4A recent formulation along the lines of the basic IPAT argument illustrates the natureof the problem. This states that: "A single measure - population times per capitaresource consumption - encapsulates what is needed to achieve sustainability"(Goodland, Daly and El Serafy, 1992.). Although the author of this phrase is perfectlyaware of differential consumption patterns - and castigates the rich for their destructiverates of consumption in other parts of his text - population control ends up being theonly cogent proposal to the solution to environmental problems. Other (and moredirectly important) aspects of the problem are inadequately discussed.5There are, of course, ambiguities amongst the defenders of this school of thought. Forinstance, the World Bank - along with most multilateral development agencies - haslong been a defender of the need for population control. At the same time, it is one ofthe strategic champions of the advantages of market economics. The Bank's 1992World Development Report, for instance, makes an explicit defense of both outlooks.6The United Nations Expert Group on Population and Environment, for instance,explicitly introduced the term "development" in the title of its meeting. Nevertheless, asCommoner (1994:64) points out - "It is now widely appreciated that there are importantrelations linking population, economic development and the environment. There is,however, little agreement about the nature of those links, and what guidance they canprovide about the relevant policy options.7The rather oversimplified and somewhat caricatural sketch presented in the next twoparagraphs are composites based on arguments from many readily-available sources.
112

References
Bartiaux, F. and J.P. van Ypersele. 1993. The role of population growth in globalwarming. Internationa! Population Conference, IUSSP, Montreal, 4,33-54.
Bongaarts, J. 1993. Population Growth and the Food Supply: Conflicting Perspectives.New York: Population Council, Working Papers, 53.
Boserup, E. 1981. Population and Technological Change. Chicago: Chicago UniversityPress.
Cassen, R.H. 1993. Economic implications of demographic change. Transactions ofthe Royal Society of Tropical Medicine and Hygiene, 87:13-18.
Castells, M. 1989. The Informational City: Information Technology, EconomicRestructuring and the Urbanization Process. Oxford: Blackwell.
Commoner, B. 1972. The environmental costs of economic growth. Chemistry inBritain, 8(2).
Commoner, B. 1994. Population, development and the environment: trends and keyissues in the developed countries. In UN, Population, Environment andDevelopment, 20-24 January, 1992, UN, New York.
Commoner, B., M. Carr and PJ. Stamler. 1971. The causes of pollution. Environment,April.
Daly, H. 1993. The perils of free trade. Scientific American, November: 50.
Ehrlich, P. and J. Holdren. 1971. Impact of population growth. Science, 171:1212-7.
Goodland, R., H.E. Daly and S. El Serafy. 1992. Population, Technology and Lifestyle:the Transition to Sustainability. Washington, D.C.: Island Press.
Hardoy, J. and D. Satterthwaite, 1989. Squatter Citizen: Life in the Urban Third World.London: Earthscan.
Harrison, P. 1992. The Third Revolution: Environment, Population and a SustainableWorld. London and New York: I.B. Tauris.
Hogan, D. 1992a. The impact of population growth on the physical environment.European Journal of Population, 8:109-23.
Hogan, D. 1992b. Migration dynamics, environmental degradation and health in SâoPaulo. In The Peopling of the Americas: Proceedings, VeraCruz, Brussels: IUSSP,vol. 2, 270-99.
Holdren, J.P. 1991. Report of the planning meeting on biological effects of humanactivities. Commission on Behavioral and Social Sciences and Education and theBoard of Biology, Irvine, California, 11-12 October.
Holdren, J.P. 1992. The definition of sustainability. Keynote address delivered at theInternational Conference on the Definition and Measurement of Sustainability, TheBiophysical Foundation, Washington, D.C.
International Labour Office (ILO). 1992. Environmental implications of rapid urbanpopulation growth, unemployment and poverty: the large metropolic in the third
113
world. Paper presented at UN Expert Group Meeting on Population, Environmentand Development, 20-24 January, New York.
Johnson, D. Gale. 1993. Can There be Too Much Human Capital? Is There a WorldPopulation Problem? Chicago: University of Chicago, Office for AgriculturalEconomics Research, Paper No. 92.
Kelley, A. 1988. Economic consequences of population change in the third world.Journal of Economic Literature, 36:1685-1728.
Kelley, A. Forthcoming. Revisionism revisited: an essay on the population debate inhistorical debate. In R. Ohlsson, ed. Population, Development and Welfare: theNobel Jubilee Symposium in Economics. Berlin: Springer - Vertag.
Kelley, A. and W.P. McGreevey. 1994. Population and development in historicalperspective. In R. Cassen, ed. Population and Development: Old Debates, NewConclusions. US - Third World Perspectives Series, 19, Overseas DevelopmentCouncil, Transaction Books.
Lutz, W. 1994. What do we need more urgently: better data, better models or betterquestions? In B. Zaba and J.I. Clarke, eds. Environment and Population Change.Liège: Ordina: 47-62.
Martine, G. 1992. Population redistribution and state policies. In C. Goldscheider, ed.Migration, Population Structure and Redistribution Policies. Boulder, San Franciscoand Oxford: Westview, 207-28.
Martine, G. 1993. Population, environment and development: the national and globalscenario. In G. Martine, ed. Population, Environment and Development: Truths andContradictions. Campinas: Editora da Unicamp, 21-42.
McNicoll, G. 1992. The agenda of population studies: a commentary and complaint.Population and Development Review, 18(3) 399-415.
National Academy of Sciences. 1971. Rapid Population Growth: Consequences andPolicy Implications. Baltimore: Johns Hopkins, 2 vols.
National Research Council. 1986. Population Growth and Economic Development:Policy Questions. Washington, D.C.: National Academy Press.
Shaw, P. 1989. Rapid population growth and environmental degradation: ultimateversus proximate factors. Environmental Conservation, 16(3).
Shaw, P. 1992. The impact of population growth on environment: the debate heats up.Environmental Impact Assessment Review, 12.
Simon, J. 1981. The Ultimate Resource. Princeton: Princeton University Press.
Srinivasan, T.N. 1988. Population growth and economic development. Journal of PolicyModelling, 10(1) 7-28.
Stern, P. 1993. A second environmental science: human-environment interactions.Science, 260, 1897-99.
Tabah, L 1991. Population prospects with special reference to environment. InCICRED Population and Environment, 25-43.
114

Teitelbaum, M. and J. Winter. 1993. The missing links: the population-environmentdebate in historical perspective. In G.D. Ness, W. Drake and S. Brechin, eds.Population-Environment Dynamics: Ideas and Observations. Ann Arbor MichiganUniversity Press, 17-32.
UN. 1953. The Determinants and Consequences of Population Trends, Department ofSocial Affairs, Population Studies 50, 2 vols, New York.
UN. 1991. World Urbanization Prospects 1990. New York, Population Division.
UNDP/World Bank/UNCHS. 1993. Toward Environmental Strategies for Cities: PolicyConsiderations for Urban Environmental Management in Developing Countries.Urban Development Division, The World Bank.
UNFPA. 1991. Population and Environment: The Challenges Ahead New York:UNFPA.
Weir, D. 1988. A historical perspective on the economic consequences of rapidpopulation growth. In U.N. Consequences of Rapid Population Growth inDeveloping Countries, Proceedings of the UN Expert Group Meeting, New York,August: 1988.
115


CHAPTER 6
POPULATION AND ENVIRONMENT IN THE 1990s: THENEED FOR A SUBSTANTIVE DEVELOPMENT LINK
J. Ph. Peemans(Institut d'Etudes du Développement, Université Catholique de Louvain, Belgium)
1. Introduction
Population and environment studies have known an impressive rhythm of expansion inrecent years, and valuable efforts have been made in the quantitative assessment ofrelevant aggregates.
Many participants in these debates do however recognize the need for new breakthrough in the conceptual approach. In this respect, one has indeed to recognize thatmost of the topics and concepts have been already explored or encompassed in thefields of population and development and of development and environment studies.One has even the impression that in many cases the conceptual framework drawsheavily upon even older references, which have influenced the study of population anddevelopment. It seems that there is a certain continuity between the mainstreampopulation-development doctrines of the 1960s and the mainstream vision of therelation between population and environment in the 1980s.
If many international organizations do agree upon the necessity to integrate populationand environmental aspects (UNEP, World Bank, UNFPA), the proposed type ofintegration is often rooted upon rather simplistic assumptions. Most of the internationalorganizations share the view that population growth does play a crucial role not only inthe reduction of resources availability for development, but also in the destruction ofthe environment.
Such a conviction provides a new basis to justify the need for very active policies inthe field of fertility control. One can therefore have the impression that for many in the1980s "environment" has simply replaced "economic growth" as a new justification forpopulation control. The latest is looked as ever as a simple and easy tool (for instancethrough a sharp rise in budgets devoted to family planning) to reach some quickresults, and even when some recognize that a slower population growth will not solveall the economic and environmental problems they give a high value to its contributionto face "the urgency" (World Bank, 1991).
Many scientific contributions in the field of population and environment follow the samepath of reasoning. One well known example is the sequence of versions of the Ehrlichand Holdren equations: I = P A T, where I is a negative impact on the environment, Pthe population size, A affluence or the per capita consumption, and T is "an index ofthe environmental disruptivenèss of the technologies that provide the goodsconsumed". (Ehrlich & Ehrlich, 1990). One can remember that according to the
117

Ehrlichs, the I = P A T equation is a key to understanding the role of population growthin the environmental crisis, and there is no practical way to achieve the necessaryreduction in greenhouse emissions without population control. Without elaboratingmuch more, it is obvious that the " link" between population and environment in thiscase is a very rough vision of "development" rooted upon hugely aggregated patternsof energy consumption at the world level.
The above mentioned positions illustrate the fact that in reality, a certain developmentvision is always present in the studies relating population and environment. Most of thetime, it is implicit, which renders any assessment very complicated. Even when areference is made explicitly to development, it is often in relation with one or othermainstream definition of development. Then, willingly or unwillingly, the population andenvironment topic is drawn in the framework of mainstream development theories, as ifthey were a sort of natural or "common sense" evidence. This in fact may contribute toa certain poverty of the conceptual framework, and to an insufficient exploitation ofinteresting insights concerning the linkages between population and environment.
The central idea of the present contribution is that the conceptual framework ofpopulation-environment studies could be enriched considerably, if not uniquely,through the multiplication of linkages between the three fields of population,environment and development. An effort has to be made however to overcome thebottlenecks associated with the fact that binary approaches of the three fields haveprevailed until very recently. Most of the literature has been centred around populationand development, development and environment, and then population andenvironment. This has been made more or less in a succession of stages, with manyshadowy areas left between the three fields and with a growing confusion.
In order to escape that confusion and before exploring more explicit linkages betweenthe three fields, an effort has to be made towards clarification. This is required becausedespite the past preference for binary approaches, the three fields have beenintertwined through the pervasive influence of paradigms. These have shaped thethree fields in different ways of thinking along common visions or prejudices, whichdivide them according to differences in global perception, rather than along disciplinaryfrontiers.
Finally the three fields can be regrouped along competing paradigms. A very simpleway of approaching these categories could be to classify them in mainstream andcounterpoint ones. This contribution will try to show that behind the sequences offormal binary approaches, the three fields can be regrouped in these sorts ofintellectual frameworks, corresponding in some cases to elaborated schools ofthinking. The prevalence or obsolescence of the different frameworks and paradigmscan be associated with different historical contexts. One has indeed to insist upon theindependency which links the theoretical aspects with the political dimensions. Theproblem is not simply to find the "good methodological path toward interdisciplinarity".
"Real world" constraints have linked the search for interdisciplinarity and the need foraction. The dominant binary approach of the past has been heavily influenced by thegeo-political international context and by political controversies which have ragedabout North-South relationships.
These points can be illustrated by a brief survey of "mainstream" and "counterpoint"approaches in the three fields. Such a survey could help to much needed clarification
118

in the present controversies. It could perhaps contribute to highlight the role of somenew pragmatic tendencies in the three fields. That pragmatic evolution could in thefuture promote better linkages or even integration between the fields, through a moresubstantive definition of the development framework.
2. Population, Development and Environment in the Framework of"Dogmatic Modernization" before 1980
In the last fifty years, which have seen the rise and blossoming of contemporarydevelopment thinking, "mainstream" development studies have been heavily influencedby the "modernization school" paradigm. For that mainstream tendency, developmentwas a sort of universal process, with different stages through which all countries andsocieties were supposed to reach a final stage of prosperity so well popularized by theRostovian view (Berthoud, 1990).
According to that conception, development is symmetrical to the rise and consolidationof a modern sector which has to absorb progressively the traditional sector through aprocess of social and institutional differentiation, cultural secularization, and anincreasing division of labour supported by the increase of the investment rate (Rist,1990).
In the field of population, mainstream theories were always very close to the vision ofthe modernization school. The demographic transition theory has been a part of it andhas contributed to provide a vision of the "backwardness" of traditional societies whichhave to catch up with the "modem" pattern of demographic behaviour already reachedby industrial societies (Higgins, 1968). Demographers try to grasp the universalpatterns of change toward progress, and to provide a formal structure of transitionanalysis. Like development economists they have had a paramount influence in themodernization school, because they were keen to provide a quantitative assessment oftheir theoretical propositions (anteriority of mortality fall; a two phased model ofreproductive transition with marriage limitations predating birth limitations).
Demographers and development economists of the modernization school sharedcommon beliefs about the interdependency between the demographic and economicaspects of transition. For demographers sustained economic growth is seen as a keyfactor to foster the decline in population growth (Notestein, 1953). Traditionalbehaviours were held responsible for the delays in the "normal" pattern of transition.Development economists gave a key role to the demographic variable. For the"pessimists" population growth was a major obstacle to the so-called "take-off" in thefield of economic growth, because population increases divert the gains in incomesfrom saving and investment to consumption (Meier & Baldwin, 1957). There weremany variants of the same perspective, from the "low level equilibrium trap theory" tothe "stationary state" theory (Nelson, 1956). For the "optimists", in "dualistic societies"threatened by the "Malthusian trap", sound policies could mobilize the "labour surplus"from the traditional sector to foster economic growth in the modem one.
One has also to underline here that in the modernization view, there was a strongimplicit link between development and environment, as nature was seen simply as asort of unlimited stock of material resources, which had to be taken away from an
119

inefficient traditional society (the "tragedy of the commons" story being one of themany versions of that approach) and be mobilized for a greater productivity with therise of a modem industrial sector.
Modernization was really an interdisciplinary paradigm, with a pervasive and longlasting influence upon all the disciplines having contributed to population anddevelopment thinking. Development being defined mainly as structural changesfunctional with rapid economic growth, all other dimensions of society and nature werelooked at from an instrumental perspective. This was especially conspicuous in thefield of population studies, people being looked upon as variables in models ofbehaviours defined exogenously from the living contexts. Societal structures wereanalysed mainly through some privileged aggregates of macroeconomic anddemographic variables.
All disciplines were obsessed with a conceptualization of the development process interms of a rapid and even violent breakdown with the past, be it a "take-off", a "bigpush" or a "big spurt". They were also very eager to propose some universal patternsof modernization rooted upon some sort of teleological vision of history.
Due to the mounting contradictions between its predictions and the "reality of theworld", "dogmatic modernization" entered a period of crisis in the second half of the1960s. That crisis has entailed the rise of "counterpoint" tendencies, the two mostconspicuous being the "dependency school" and the "ecological" or "ecodevelopment"tendency.
For the dependency school the roots of underdevelopment had to be sought in thehistorical process of capital accumulation at the world level, leading to growinginequalities between social classes and especially between "center and periphery"countries (Palma, 1978). Active policies against underdevelopment required stronginstitutional reforms inside nation-states, and among states (through an increasingrole of UN institutions like UNCTAD) to redress the growing imbalance between Northand South. The radical version of the dependency school, close to the Chineserevolutionary vision of that time, was strongly opposed to any proposed negative linkbetween population growth and development (Finkle & Crane, 1985).
The ecological counterpoint tendency has begun, at the same time, to question theclose association made between economic growth and development, with a specialemphasis about the negative impact of accelerated growth upon natural resources. Itwas clearly asserted, in opposition to the modernization school view, that theexhaustion of natural resources could result from wasteful types of economic growthas well as from uncontrolled population growth (Sachs, 1993).
The crisis of the dogmatic modernization tendency has however stimulated reactionsinside the modernization school itself. An even more aggressive version ofmodernization was elaborated. It proposed to foster economic growth by a clear cutreorientation from inward-looking industrialization strategies to more outward orientedactivities, with less subsidies given to industry in order to give priority to themodernization of agriculture (Green Revolution policies). At the same time this neworientation gave an even greater priority to birth control policies, giving much publicityto very gloomy perspectives upon population growth running ahead of food outputgrowth.
120

That vision was not independent from geopolitical contingencies, as clearly expressedby Benedick, a former coordinator for Population Affairs at the State Department inWashington:
"United States government preoccupation with population problems is based upona keen interest for economic development and political stability at the world level.Disequilibrium and changes entailed by an unprecedented rate of populationgrowth do contribute to an increasing risk of political instability, social unrest,extremism, mass migrations and international conflicts concerning scarceresources of the earth" (Benedick, 1984).
The "ping-pong" diplomacy initiated at the beginning of the 1970 by the United Statesand China has had an impact upon these controversies and upon the fate of populationand development linkages. Finally, in the wake of the 1974 Bucharest Conference,some sort of compromise was made between the anti-Malthusian and the neo-Malthusian tendencies. It was accepted, at least in principle, by both sides, that thebest link between population and development was the acceleration of economicgrowth, especially in poor countries. Growth had to be coupled with specificredistribution policies, in order to alleviate poverty, recognized as the main cause ofpopulation growth. In this context, the priority being given again to economic growth,conventional modernization ideas have reasserted their dominance in the 1970s, witha spectacular reversal in that direction by China itself.
Population and development strategies superseded in the short term the environmenttopic, even if government paid lip services to it, by adhering to the conclusions of the1972 Stockholm Conference. In these conditions, counterpoint preoccupationsdeveloped mainly in the field of environment, with a multi-faceted search for an "otherdevelopment".
During the 1970s, counterpoint thinking sharply criticized the modernizing vision ofnature as an unlimited stock of resources which could simply be mobilized for growth.This led to a revision of the modernization assertions about the inability of "traditionalsocieties" to manage their environment. This was supported by efforts to understandthe specific features of non-western socio-economic systems which enabled them toreproduce themselves in the long run. They were attempts to show how their"substantive" rationality was geared to the construction of complex institutionalsystems to ensure the management of both nature and society. That led to the searchfor more endogenous forms of development, respectful of the cultural identity ofpopulations having a specific cultural heritage (Verfielst, 1987).
For counterpoint theorists in the 1970s, the opposition between tradition and modernitywas a artificial one, which lacks historical and anthropological evidence. There is noevidence that tradition is responsible for hampering modernization, but on the contrarymany facts point towards the negative consequences of modernization upon viablesocial structures and environment (Diakite, 1985). Such an evolution in counterpointthinking had a far reaching, even if inconspicuous, impact upon the concept of the
. relation between population and development.
Many studies insisted upon the negative externalities, associated with rapidmodernization policies, and their destabilizing effects upon local populations. Macro-level strategies of industrialization as well as micro-level agricultural projects coulddestroy the life environment of numerous populations, rendering them more fragile and
121

prone to impoverishment, migration, and disease (Upton, 1989). Population in thisrespect is no more only a "variable to control" (like in the modernization view), or the"popular masses to mobilize" (like in the more radical versions of the dependencyschool), but is looked upon as "people", whose needs and demands for better life domatter.
Even if counterpoint tendencies of the 1970s had no great weight in the "real-politik"decision making process, one has to recognize their contribution to a more open andricher definition of development, with new insights about its potential relation withpopulation and environment.
3. Development, Environment, Population and the Rise of the "Neo-Modernization" Paradigm since 1980
The basic principles of the modernization theory have exerted a strong influence in the1980s, even it is in a different context and with a different overtone. The global visioninspiring adjustment or "adjustment with growth policies" so influentially proposed bythe powerful Bretton Woods institutions is rooted in the same basic principles of themodernization school.
There is a universalist vision and search for a global order. But now that vision is moreconstraining than in the past: one has simply to adjust to it. At the same time, theweight of the economic dimension is heavier than in the past. Then economicmodernization was a component, among others, of the nation-building process; now itis an hegemonic principle of organization, which does impose its norms to all the othercomponents of the social and political system.
One can say that one has evolved from the "national modernization dogmatism to thetransnational neo-modernization dogmatism" (Peemans, 1992a). In the latter, theinternational does command the national, the enterprise norms command the state, theprivate sector imposes its priorities upon the public sector, and modem sectoreconomic growth is seen as the result of an efficient adaptation to the constraints ofthe international economy.
In the population and development field, the 1980s have seen some contradictoryevolutions inside the mainstream framework. On one side, one has seen the rise of apowerful neo-conservative tendency, initially in anglo-saxon countries, which playedan ever greater role in the definition of what development ought to be. Its ideologicalstand was forceful, with an exacerbated anti-state bias, excessive state interventionbeing presented as the main factor for the poor performances of most developingcountries. State intervention has to be reduced in economic activities as in social ones,with appropriate cuts in anti-poverty programmes and even family planningprogrammes. Starting with the prejudice that poverty as well as unchecked family sizeare the results of irresponsible individual behaviours, that ideological tendency doesassert that extended anti-poverty programmes can only stimulate the poor to havemore children. Moreover, it opposes birth control programmes, because it wouldenlarge the scope of state intervention and extend its power over individual lives(Simon, 1981). For that line of thought, these arguments seem to be even more
122

powerful than the traditional fears about unchecked population growth in the ThirdWorld.
On the other side, the neo-liberal tendency shared the anti-state bias with the neo-conservatives along with a strong sympathy for a deregulated and globalized freemarket economy under the aegis of transnational corporations. However, this line ofthought has continued to give support to population policies, because high populationgrowth rates are seen as obstacles to adjustment efforts. Therefore, they have acommon attitude with the main multilateral institutions, which favour the allocation of amore important part of severely adjusted state budgets to birth reduction programmes(World Bank, 1987).
In this respect, one can conclude, that for the mainstream approach in the 1980s, therelations between population and development are still very close to the ideasprevailing thirty years ago. In the framework of " dogmatic global neo-modernization"population is a tool, a variable or an obstacle for adjustment and globalizing growthpolicies, whereas for " dogmatic national modernization", it played the same role, butinside the frontiers of the nation-state.
The population-development nexus has contributed in the 1980s to reinsert a greaterpart for environment thinking in the mainstream approach. This is linked with theincreased importance given by influential environmentalists, especially in the USA, topopulation growth as a cause of the environment destruction (Brown, 1991).
Due to the interest of many neo-conservative circles for the conservationist approachto environment problems, the way neo-Malthusian environmentalists focused upon thepopulation-environment link has helped to bridge the gap between mainstreamtendencies. The insistence with which the irresponsibility of Third World countries wasunderlined in the destruction of environment helped also to attract sympathy from theneo-conservatives. The ranks of the mainstream tendencies were therefore enlarged,encompassing now some new environmentalist recruits.
In this context it is obvious that mainstream environment views are close to the neo-modernization approach in the field of development. For the most open and long-termminded neo-liberals, environment is a part of sound growth policies, which require arational management of exhaustible natural, energy and biological resources.Environment is encompassed in a naturalistic and holistic approach. The main topicsare therefore climatic changes, protection of the atmosphere (including the ozonelayer), deforestation and desertification, the management of wastes, and the protectionof the oceans and of biodiversity (UNCED, 1991). A sustainable growth requires also arational management of its impact upon the great natural and climatic equilibria(Barbier, 1989). According to that view, growth and environment can adjust to eachother in the long run, through a continuous flow of new "clean" technologies (Pezzey,1989). As that approach shares the prejudices of the neo-Malthusian current,economic growth is seen as a condition for environment protection in the long runbecause of its supposed positive consequences upon the reduction of populationgrowth and mass poverty in developing countries.
Environment can become itself a component of world growth in the long run, byopening new opportunities for huge investment in pollution cleaning equipment andindustries. Moreover, according to certain representatives of that mainstream tendencya rational and balanced approach of the relations between growth and environment at
123
the world level would encourage the transfer of polluting industries toward countrieswith lower wages and human costs, where there is a "deficit of pollution in terms ofeconomic efficiency". A transfer of polluting industries from the North to the East or theSouth, where, with the ongoing equipment, pollution is higher for less economicefficiency, would contribute to the reduction of global pollution at the world level(Summers, 1992).
It seems therefore obvious that, for mainstream tendencies in the three fields"sustainable development" is only another word for "sustained growth". Population andenvironment are absorbed as subsidiaries of sustained growth. Conventional growthstrategies are promoted as the sole engine of poverty alleviation and therefore ofdemographic problems. At the same time, "clean" growth strategies will ensure theirlong-run sustainability.
Mainstream tendencies in the three fields have kept the same dogmatic approachwhich was proposed more than forty years ago by modernization theorists. They areeven still more normative and single minded, with a will to reorganize societies aroundthe world, according to the principles of the neo-modernization paradigm. That sort ofconceptual bottleneck of mainstream tendencies has worried an increasing number ofindependent observers, and entailed the search for new ways of sustainabledevelopment.
4. The Search for a Sustainable Development Approach in the1980s, and its Influence upon Population and EnvironmentStudies
If at the beginning of the 1980s, the discourse on adjustment has monopolized thereading of development problems, it has become obvious for many observers, at theend of the same period, that adjustment policies cannot cope with the new pattern ofthe accelerated and deregulated globalization of the world economy, nor with its hugedestabilizing effects upon existing social and political structures (Bergeron, 1992).
Facing the pervasive dogmatism of mainstream tendencies, one has therefore seen agrowing dissatisfaction and an increasing scepticism about the relations they establishbetween the three fields. This has entailed a new counterpoint approach which hasraised many questions that have influenced the way of thinking of many othertheorists. It has tried to escape the pitfalls where the dogmatic approaches have ledthrough oversimplistic attempts to establish direct and global links between populationgrowth, economic backwardness and/or environmental degradation.
One of the most useful contributions of the counterpoint thinking has been to show thatsingle-minded definitions of development in terms of economic growth andperformance according to international standards, are unable to encompass thecontradictory impact of internationalization upon the complex web of social life, areality which matters in terms of development. The new realities of the globalizedeconomy can not be reduced naively to increased performances in terms of profit-making activities. They are also enmeshed with growing tendencies toward socialpolarization and fragmentation (Mingione, 1991), with new forms of urban and agrariancrisis (Bernstein, 1990), with unpredicted types of social anomy and lack of identity
124

(Mazlich, 1991), of social violence and conflicts (Bula, 1990), which cannot anymorebe explained by the resistance of traditional structures.
New counterpoint tendencies are also pointing to the devastating consequences ofglobalized growth upon environment at the world level, but with an especially negativeimpact upon developing countries (Smith, 1990). According to that view theunconstrained logic of accumulation is per se a wasteful process of resources andspace consumption. The new and harsher features of competition between performinggrowth poles at the world level entail an accelerated destruction of environment, inindustry as in agriculture (Redclift, 1987).
Negative social and environmental externalities are growing at a faster rate with theaccelerated internationalization of the economy (Lele, 1991). This can be attributedpartly to an increasing tendency toward deregulation, many states trying to enhancetheir attractiveness to foreign capital through the softening of the national regulatoryframework, and with no powerful enough compensating regulatory structures at thesupranational level (Daly, 1990). According to that line of thought, they are newperverse linkages between environmental and social costs, as the new features ofglobalized growth are entailing new forms of mass exclusion and marginalization. Inmany cases, that new type of "global poverty", endogenous to "global growth", leadsnecessarily to some savage survival practices of local populations, with very negativeconsequences upon the local environment.
For counterpoint observers, the neo-Malthusian direct relation between population andenvironment has no explanatory power in face of these realities. On the one hand, thatdirect relation is rooted upon a vision of mass poverty as a residual of the "traditionalsociety" which has to be met by accelerated growth policies. It can therefore not tacklethe contradictory aspects of "globalized growth". On the other hand, its catastrophicpredictions rely upon macro projections of incomes and pollution associated with thatglobalized growth, and with demographic macro-projections about "tradition andpoverty ridden populations". As these "traditional populations" have still to "catch up"with the "global modern", the conclusion is then obvious: the threatening environmentalplight could be alleviated only by a greater effort toward population control.
For some authors, that neo-Malthusian view is misleading because it makesevaluations of population, environment and development macro tendencies at agrossly inappropriate level of aggregation. That aggregation problem, has beenaddressed recently by different studies. For instance, splitting the world population intofour groups, each having supposedly homogenous demographic patterns and CO2
emissions, it has been demonstrated that the extension of the UN medium variantpopulation projection results in only a 20 per cent increase of total carbon emissionsover the next 60 years assuming constant per capita emissions (Lutz, 1992). This ismuch less than the 86 per cent increase that results from treating the whole world asone homogenous region.
In the same vein, attempts have been made to quantify the role of population growth inpast CO2 emissions by presenting the results of a set of scenarios that show howimportant the world CO2 emissions from fossil fuel and cement would have been hadthe population and/or the CO2 per capita followed different paths of evolution during theperiod 1950-1990. The scenario results tend to show that, for industrial CO2 emissionsbetween 1950 and 1990, past population increases in developing countries have
125

contributed much less to the CO2 increases than either increases in consumption orpopulation growth in MDCs. They also remind that past and present emissions percapita in developed countries are not extendible to the rest of the world, even ifpopulations had been blocked at the 1950 level, since they dramatically increasealready excessive emissions. The scenarios with the lowest total emissions imply theextension of LDC consumption patterns to MDCs as well, with or without populationcontrol, illustrating in a striking manner the very small CO2 emissions per capitaassociated with the way of life of LDC inhabitants (Bartiaux & van Ypersele, 1993).
These exercises about numbers illustrate in a striking manner the concept of"differentiated responsibilities" introduced in the 1992 Rio Convention. Firstly, since thefraction of the world population which grows at the fastest rate is also the one with thelowest per capita emissions, using average population growth rate and average percapita emissions will overestimate world emissions. To assess the relation betweenpopulation and development, one has to include specific features of production andconsumption patterns associated with huge differences in income levels betweendifferent types of populations at the world level. Secondly, since changes inconsumption patterns are affected by a weaker structural inertia than population, itmay be argued that it would be more rapidly effective to put the emphasis on changingthe energy and resource consumption patterns especially in rich countries. Suchreduction can be necessary to allow a sustainable development while waiting for theoutcome of the reduction of population growth.
At that global level, historical evidence does show that a small minority of the worldpopulation located in the northern hemisphere does bear a huge responsibility forcurrent problems of pollution, resource depletion, and negative effects of a productionpattern heavily and long dependent upon a disproportionate share of world fossilenergy consumption (Commoner, 1991).
There is a growing recognition that to be serious about "sustainable development" onehas to address the very nature of development processes. "Hard growth" productionand consumption patterns are inextricably intertwined with a huge destructive impactupon the environment. This is especially the case in the North where voraciousconsumption'patterns are associated with massive overcrowding and congestion ofurban spaces, destruction of rural landscapes and degradation of the historical heritage(Gallopinefa/., 1989).
In recent years, counterpoint tendencies seem to have certainly enlarged theirinfluence upon the normative search for sustainability. They have contributed tounderline that the definition of sustainability criteria requires a sort of holisticperspective, which could be an alternative to the very normative approach ofmainstream thinking.
That search for an alternative normativity points to the question of assessing differentglobal scenarios of development styles. It leads also to the necessity of finding newways of linking the relations between population and environment to the relationsbetween population and development, and even to the question of the nature of thedevelopment process itself.
126

5. The Contribution of Pragmatic Approaches to the Search forIntegration Between Population, Environment and Development,with Special Reference to the African Context
There is thus no firm ground to establish at the theoretical level a direct relationshipbetween population growth and environment degradation, and one has to avoidextrapolation from a strictly mechanical and numerical approach of demographicproblems at a global level. There is no methodological reason to propose a direct linkbetween population and environment and to isolate them from the global setting ofsocial, economic, institutional and political aspects with which they are interplaying. Bywidening the range of mechanisms which can affect the process of environmentaldegradation or destruction, one can also enlarge the scope for policy and increase thenumber of tools for intervention (Thiltges & Tabutin, 1992). On the contrary, an obviousconsequence of a narrow minded approach is that in countries where there is somelack of conviction or even reluctance about the current policies proposed byinternational organizations in the field of population, one is devoid of instruments totackle the need for improvement in the relations between population and environment.
This is particularly true in the case of many African countries which until the beginningof the 1980s were ready to implement some sorts of "basic need" policies, with apositive impact upon population as well as environment problems (child and mothercare policies with a positive impact upon child mortality rate, or water quality policieswith a positive impact on both health and environmental aspects). These were in factindirect sectoral policies which could be substitutes for direct population and evenenvironmental policies with a positive impact in both fields. But during the eighties, dueto the constraints of adjustment policies and the reduction of state ability to financesuch projects, this sectoral approach has been greatly weakened and one is left with avacuum in the field of appropriate population policies.
The same is true in the field of environment. Few African governments have takenglobal measures to protect and improve the quality of environment. Some of them havemade real and interesting efforts in that direction. This is the case of some interstateorganizations, like CILSS (Comité permanent inter-Etats du Lutte contre lasécheresse du Sahel), which have undertaken important sectoral programmes with apractical positive impact upon environmental problems (land and water conservationand anti-desert programmes and integrated resources management programmeslinked with rural and agricultural development projects). The global results of theseactions are however limited for a number of interacting factors. The internationaleconomic context has not been favourable: to say the least, the decline of primaryproduct export prices, the persistent high interest rates and the reduction of aidfinancial flows have constrained heavily the intervention potential of nation-states.
At the same time, many capital intensive agricultural development projects undertakenin previous decades have, during the 1980s, definitely shown their negative impact onpopulation and environment problems. In West Africa for instance, some ambitiousprogrammes devoted to the settlement of new lands (North-East Benoue and VoltaValleys projects) to solve overpopulation problems in some areas, have been unable atthe same time to control the migration flows and to foster the adaptation by theresettled population of techniques adapted to the new ecological context. The global
127

result has henceforth been an economic failure, and contributed to a new kind ofpopulation and environment mess, created by an unsuitable "development" policy.
To escape the failures linked with the oversimplistic approach of an immediate relationbetween population and environment, one has to shift toward a more complexapproach, and recognize the interdependent linkages between population, environmentand development processes, embedded in specific social and cultural contexts.
If at the world level, a mechanistic exercise about projections and sheer numbers doesprovoke sometimes apocalyptic comments, they have no explanatory power at theregional level, where a simple would-be causation between population growth andenvironment destruction does seem irrelevant (Thiltges & Tabutin, 1992). There is anurgent need for an improvement of basic knowledge about the linkages betweenecosystems, cultural and social systems at the relevant level of their interdependencewhich can be often different from the administrative units or economic regions taken intraditional development approaches for data collection.
Such relevance of a regional or even local framework of study has been given anincreasing attention by what may be called a "pragmatic approach". This regional levelof integration is seen as a way to escape abstract macro-level linkages and arbitrarysegmentation of sectoral problems. Population and environment are henceforth tackledat the level where they are interlinked through the numerous intricacies which shapethe development profile of a region. These pragmatic approaches take in considerationnumerous different aspects of development: evolution of the agrarian systems, waterand forest resources management, the links between regional poverty and migrations,urbanization problems and living conditions of urban populations, etc. (Loriaux, 1990).The pragmatic approach provides a way to escape from oversimplification, because itis often oriented to a "problem solving approach" at a more local or regional level: atthat level "global theorizing" about the virtue of "going global" appear of a more limitedrelevance. A problem solving approach does require the recognition of the complexityof the reality and cannot satisfy itself from "hyper-global" theorizing.
People who are involved in development projects, programmes or policies do needsome analytical instrument at a level suited for action, and this at the same timeprovides a methodological solution. Action is finally always involved in some sort oflocal or regional context, where one has to tackle the complexity of the relationsbetween economy, society, politics and culture which together shape a certain type ofdevelopment process in a specific spatial and historical context. All those aspectscontribute at the same time, to shape the actual framework of integration betweenpopulation and environment problems.
So, action-oriented research contributes also to solve the methodological question.One needs an interdisciplinary or even transdisciplinary approach to explore thecomplex interiinkages between population and environment (Peemans, 1992c).
An even more important aspect of such an approach is that action is no more restrictedto the work of development specialists or even field experts. At the local or regionallevel, population can not be reduced to the "magic of the numbers", or to a soleinstrument of a demographic policy. At that level population has to be recognized alsoas "people", which means as potential or actual actors of a development policy whichcould enhance a higher qualitative equilibrium between the conditions of reproductionin the long run of a given population in a given environment. In that perspective,
128

demographic problems are part of the development dynamic of a specific population ina given territory, with its own features and historical identity. They have to be seen asa part of the numerous problems which have to be tackled and discussed by peoplethemselves. They are a part of a decision process, in order to enable these people todefine the future path of their own development in a particular context they are themost able to understand and master.
One has therefore to multiply case studies about the actual integration of population,development and environment in regional or local contexts. One has to look carefullyat the ways a local "eco-social-system" reflects the impact of more global problems,and one has to assess its own dynamics of change, improvement or crisis. One has topay attention to the role played by social actors at the level of a region, be it a macro ora micro-region, in the actual integration of population, environment and developmentproblems. One has also to evaluate the main features of that path of integration (orabsence of integration) in relation with some sustainability criteria.
Recent local studies have tried to make such an assessment for different regions,especially in Africa. This has been the case, for instance, of insightful explorations ofthe links between population, environment and development in the Sahel region. In thepast, the Sahel has been often the victim of a simplistic diagnosis of environmentdegradation linking degradation only with the consequences of rapid increases inhuman and animal populations and with extensive agricultural practices. In reality, it isthe result of very long-term processes which affect both society and nature. Its studyrequires an interdisciplinary approach at different spatial levels (global, regional andlocal) and with different time scales.
Actually, environment degradation is linked with regional migrations, which reflectproblems in the region of emigration and create new ones in the place of destination.Migrants are transferring practices entailing ecological degradation from saturatedareas to new "pioneer fronts" where the population density is lower (Mathieu, 1992).
Sahelian countries are in a difficult transition period, where former extensive practicesare no more suited to the new social conditions, but at the same time the changetoward more intensive practices is hampered by many intertwined elements: thebreak-up of large lineages diminishes the capacity to mobilize an important labour-force, and there is a lack of appropriate technologies which could lead to a progressiveand endogenous adaptation of a more intensive agriculture. Therefore, many peasanthouseholds shift toward substitution strategies, by acquiring private land in "pioneerfronts" in order to anticipate the increasing scarcity of land.
In Burkina Faso, the institutional aspects play a large role in the relation betweenpopulation growth (be it natural or through migration) and environment degradation.When former communal or extended family type institutional arrangements aredisappearing, under the pressure of outside events (like the introduction of unrealistic"modern" land laws), there is a shift from a relatively intensive type of agriculture,respectful of the long run equilibrium of local ecosystems, to a more extensive andmore predatory type of agriculture, which exhausts soil and natural resources. Butthese practices are the result of adaptive and rational behaviour by the peasants, atthe individual level, under the pressures of increasing constraints resulting from socialand economic transformations. Peasants and shepherds have no power to impeach
129

these outside elements. In order to adapt themselves, "they have to destroy theirenvironment in order to delay their own destruction" (Mathieu, 1992).
This tendency toward extensification is linked with an accelerated trend toward landprivatization, absentee landlordism, social differentiation and polarization and theappearance of landless peasants. Land rights insecurity is linked with that changingsocial and economic context, and contributes to impede intensification in a private anda community level framework.
The need for going farther than a simple mechanical "carrying capacity" assessment tounderstand the relations between population and environment has been illustrated alsofor Central Africa, with the multiplication of small-scale sub-regional studies. Forinstance, it has been recently demonstrated that in some micro-regions of Burundi, theso-called type of Boserupian path is linked with an increasing rate ofcommercialization and of non-farm activities in the total family income. A moreintensive use of the labour force is not linked with the use of new techniques, and theimprovement in terms of income does depend upon the shift toward a new mix of cashcrops adapted to the evolution of relative prices and markets. This type of adaptationby trial and error does seem to be a defensive strategy. Peasants do not want to takeundue risks which could destabilize the conditions of reproduction of the family farmsin the long run: performances are not linked with the structures of the exploitations,and the peasant economy does not want to maximize gains, but to reach "equilibriumlevels" for basic food and money requirements. Peasants try to resist the dominance ofthe market, and they want to keep their autonomy, but that resistance, combined withinsufficient or unadapted efforts made to support the peasantry, is leading to growingbottlenecks and food insecurity (Verhaegen & Degand, 1993).
Such local studies demonstrate the extraordinary complex web of dynamicinterlinkages which have to be understood in order to assess the population-environment problem in a given region. They point also to the need to look atpopulation not as a simple variable, but as an actor of change, with all the features ofrational and strategic behaviours. Change in family structures, man-land ratios andmigrations are influenced by deep structural constraints and by adaptative behavioursof populations embedded in a specific context. All together they have a huge impactupon environmental change, which in turn affect the future of structural evolution andits consequences upon adaptative behaviours.
6. The Need for New Linkages through a "SubstantiveDevelopment" Approach
If at world level, mass poverty in the southern hemisphere can be associated withincreasing negative consequences upon the environment (Brundlandt Report, 1987), atthe regional and local levels, actual observations show that there is always someintermediary societal or cultural behavior which will play a key role to give the specificanswer of a peculiar population to an emerging constraint or problem and thereforecontribute to the shape of a specific relationship between population and environment.One has always to raise questions about specific social, economic or political elementswhich have led in specific contexts and specific historical conditions to a peculiar typeof relationships among cooperating or competing social actors. Their rational and
130

strategic behaviours are embedded in such contexts, and are an unavoidable part ofintricated population-environment problems.
This leads us to recognize the need for a more substantive approach of the relationsbetween population, environment and development. "Substantive" here has simply thewell known meaning given by Polanyi and Arensberg (1957), rejuvenated by recentdiscussions about the concept of "embeddedness" (Granovetter, 1985).
Progress toward that substantive approach has to be made at different levels. At themethodological level, a systemic approach of the integration between the three fieldscan help to link global, regional and local aspects of the needed articulation.Propositions inspired by the "theory of the hierarchical integration" have made somerecent contribution in that direction. According to these propositions one has todistinguish four stages in the integration process, with each stage representing a stepforward ¡n the direction of a more open definition of the development concept and amore active involvement of what is called population.
In the first stage, the "technical integration stage", population is looked at as "thedemographic variable" of "economic development programmes", in the most traditionalfashion of the mainstream approaches inspired by the modernization theory.
In the second stage, the "scientific integration stage", population studies are linked witha more open definition of development, and one has to try to show the diverse types ofinterplay which can link population changes and development processes.
The third stage, the "political integration stage", utilizes the results provided by thesecond stage, but tries to combine the possible scenarios of evolution with the"political projects" of a particular society. Those projects depend on the type ofinteraction which exists between the state and some sort of coalition of social actorswho can influence the definition of the development pattern in one way or another.
The fourth stage, the "human and social-cultural stage", is rooted upon the results andrealities of the previous ones, but looks at the population explicitly as "people", menand women, citizens, who have to participate actively in the definition of thedevelopment process as actors and not as objects, mass or variable (Loriaux, 1990).
Going from one stage to another, does mean at the same time less global-universalmodels and more local-regional models, less single causality and more systemicapproach, less quantification but more need for a qualitative approach.
Systemic approaches have however to be completed by an historical perspective, andto evolve toward some sort of "historical systemic approach". Simplistic propositionsfor integration, inspired by different versions of the modernization paradigm, havealways been rooted upon truncated interpretations of history. The "take off"interpretation of the British Industrial Revolution, the various theories about the"European model of demographic transition", the dualistic model of interpretation of the"Japanese and East Asian miracles" are all based upon reconstructions of past history,which have been very much questioned in recent years (Peemans, 1992b).
Another perspective upon history is playing a major role to disentangle the narrowminded approach of the modernization framework. It can offer new perspectives uponlong-term dimensions of articulation of different sub-systems in a specificdevelopment process.
131

A fresh sociological approach to population problems is also required to foster newways of substantive integration between the three fields. This means that behindnumbers and trends, one has to recognize they are living people who have to belooked at as social actors with some purpose in their action. That would lead to therecognition of the importance of values and culture as key components of an overallapproach explicitly embedded in a specific historical context. In that perspective, thesearch for integration between population and development is deliberately actionoriented. An "action oriented holism" would give another meaning to the need forinterdisciplinarity.
The ultimate goal is to help people to elucidate the conditions of their greaterparticipation in the decision making process, which can affect their lives and thedevelopment path, at the local and national level (Gerard, 1993). That perspective hasbeen reinforced by the new reality of the 1980s which has seen the multiplication ofinitiatives taken by populations at local level for survival, or even in some cases towardnew forms of organizations to try to promote a better life.
These experiences provide new references to seek other substantive linkages betweenpopulation, development and environment. Development is henceforth seen as theincreasing capacity to consolidate and improve social relations inside communitieswithin a given territory (Hettne & Friberg, 1988). It is linked with the capacity of thosepopulations to manage their natural environment in a sustainable way, through theconstruction of a given territory with an appropriate institutional framework and throughthe promotion of its cultural identity (Wade, 1988). Some authors are going as far assaying that development is linked with an increasing diversity of development paths,respecting the multiple types of interlinkages which can exist between diversepopulations inside diverse ecosystems (Chambers, 1988). In that perspective of"development from within" one is shifting from the concept of "modernizing state" to theconcept of "an enabling state" (Taylor & Mackenzie, 1992). There is a need for aredefinition of the relations between the state and local territories in the direction of theempowerment of the latter (Friedmann, 1992).
A substantive approach of integration between population, environment anddevelopment does therefore need to pay special attention to the institutionalframework. This for instance has a crucial importance in the question of land usemanagement in Africa, with multifaceted consequences upon population-environmentrelations in Africa.
In the modernization school view, traditional land use systems are an obstacle todevelopment, whereas a modern land use system, favouring private land ownership,would stimulate it (Hesseling et al., 1993). Recent studies have however shown thatland right securization has not to be interpreted solely in the direction of individualownership of the land, which, in some cases, could even be counterproductive, forinstance in the Sahelian context. The ongoing development process in Sahel reflectsgrowing tensions among different social actors. Some social groups, generally the"better off", do favour privatization, but others, generally the unfavoured ones, likewomen, try to assert their rights through new types of collective rights establishedthrough new forms of voluntary associations.
It would be constructive to recognize that diversity of social demand. The institutionalsetting would have to be sufficiently decentralized to allow local communities to find
132

appropriate land rights arrangements (Hesseling etal., 1993). That could entail positiveconsequences upon the relation between population and environment through a bettercontrol of people upon the conditions of their development at the local level. Tocontribute to foster the drive toward a labour-using intensification, a consolidation ofland use rights has to be flexible and adapted to local contexts (including the right ofaccess to land to all local actors) and to establish a proper equilibrium between privateand collective land use, in order to ensure the same security which was provided bytraditional land use practices (Mathieu, 1992).
7. Conclusions
Recent contributions from counterpoint as well from pragmatic tendencies show acommon concern to give great importance to the study of complex interlinkages, whichcan, at the local and regional level, influence the relationships between population andenvironment. These relationships have to be tackled in a dynamic and historicalapproach which shows how global environmental and population problems can actuallybe understood at a more relevant level for an action-oriented research. That approachfocuses upon the interplay between institutions, economic and social structures, andeven culture in appropriate space and time settings. There is also a commonrecognition that populations have to be looked at as actors for the search for animproved balance between people and environment.
Almost all the studies point to the need to consolidate or improve the regional and localinstitutional framework, through a greater decentralization, to allow local people tohave a better control of the local environment. According to that perspective, the statehas to support the development of territories by helping local communities to organizethemselves through decentralized forms of democratic planning and throughappropriate rules, price policies and tax incentives. In the field of rural and agriculturaldevelopment for instance, this could help to diffuse techniques able to promote an"ecological style of intensification" which requires an appropriate institutionalframework, at the community level, to succeed (Peemans, 1992a). Combined with anadequate effort in the field of education and formation, this could give greater securityto local communities and favour the adaptation of techniques conducive to greateragricultural intensification and to better environment management and also generateemployment and incomes in the local context.
Such a convergence does point to the fact that a positive integration betweenpopulation and environment does depend upon an appropriate "style of development".It is in line with recent evolution in development thinking (Peemans, 1993). Theevolution since the end of the 1980s has been toward a reinforcement of doubts castsince the 1970s about the way modernization theorists discarded the so-calledtraditional societies as immutable and stagnant. There is a drive toward recognizingthe vitality and creativity of "always evolving traditional" societies when studied in amore relevant regional or local framework and proper historical context.
A more open vision of development, than the dogmatic views provided by themodernization or neo-modernization schools can help in that respect. Another view ofdevelopment is a crucial element, once it is recognized that the dominant model of
133

growth at the world level plays a decisive role in environment degradation and that itcannot therefore be a credible perspective for the future.
References
Barbier, E. 1989. The contribution of environmental and resource economics to aneconomics of sustainable development, Development and Change, 20:424-59.
Bartiaux, F. et J.P. van Ypersele. 1993. The role of population growth in globalwarming. Paper prepared for the IUSSP Conference, Montreal.
Benedick, R. 1984. World population growth and economic development, World AffairsJournal, 3.
Bergeron, R. 1992. L'anti-développement, Le prix du libéralisme, Paris: L'Harmattan.
Bernstein, H. et al. éd. 1990. The Food Question: Profits versus People? London:Earthscan.
Berthoud, G. 1990. Modernity and development, The European Journal ofDevelopment Research, 2:22-35.
Brown, L., C. Flavin and S. Postel. 1991. Saving the Planet, How to Shape anEnironmentally Sustainable Global Economy? New York: Norton.
Bula, J. 1990. Violence, démocratie et développement dans le Tiers-Monde. Paris:L'Harmattan.
Chambers, R. 1988. Bureaucratie reversais and local diversity, IDS Bulletin, 19(4), 4,50-6.
Commoner, B. 1991. Croissance démographique rapide et pression surl'environnement. In G. Tapinos, D. Blanchet et D. Horlacher, (eds.) Conséquencede la croissance économique rapide dans les pays en développement, INED.
Daly, M. 1990. Sustainable growth: an impossibility theorem, Development, Journal ofthe S. I. D., 4:45-7.
Diakite, S. 1985. Violence technologique et développement, Paris: L'Harmattan.
Ehrlich, P. and A. Ehrlich. 1990. 777e Population Explosion, New York: Simon andSchuster.
Finkle, J. and B. Crane. 1985. Ideology and politics at Mexico City: the United Statesat the 1984 Internationa] Conference on Population, Population and DevelopmentReview, 11(1)1-28.
Friedmann, J. 1992. Empowerment: The Politics of Alternative Development,Cambridge Mass.: Basil Blackwell.
Gallopin, G. era/., 1989. Appauvrissement à l'échelle du globe, développement durableet environnement: une perspective théorique, Revue Internationale des SciencesSociales, 121:414-37.
Gerard, H. 1993. Intégrer population et développement: refondation cidépienne,Gridep, Document de travail 7.
134

Granovetter, M. 1985. Economic action and social structure, American Journal ofSociology, 3.:481-510.
Hettne, B. and M. Friberg. 1988. La mobilisation au niveau local et la politique dusystème mondial, Revue internationale des sciences sociales, 117:381-402.
Hesseling, G., B. M. Ba, P. Mathieu, M. Freudenberger and S. Soumare, 1993. Lefoncier et la gestion des ressources naturelles au Sahel, Synthèse régionale,CILSS/Club du Sahel, juin.
Higgins, B. 1968. Economie Development, Principles, Problems and Policies, NewYork: Constable, 2nd ed.
Lele, S. M. 1991. Sustainable development: a critical review, World Development,19(6)607-21.
Upton, M. 1989. New Seeds and Poor People, London: Unwin Hyman.
Loriaux M. 1990. La fin des certitudes. Modèles démo-socio-économiques à réformer,systèmes informationnels à inventer, Cahiers du Cidep, 4, Louvain-la-Neuve.
Lutz, W. 1994. Population and Environment-What do we need more urgently: betterdata, better models or better questions ? In B. Zaba and J.I. Clarke, (eds.)Environment and Population Change. Liège: Ordina, 47-62.
Mathieu, P. 1992. Population, environnement et enjeux fonciers des politiquesagricoles: le cas des pays du Sahel, Gridep, Document de travail 3, Louvain-la-Neuve.
Mazlich, B. 1991. The breakdown of connections and modem development, WorldDevelopment, 19(1) 31-44.
Meier, G. and R. Baldwin. 1957. Economie Development, Theory, History, Policy, NewYork: Wiley & Sons.
Mingione, E. 1991. Fragmented Societies. A Sociology of Economic Life Beyond theMarket Paradigm, Oxford: Blackwell.
Nelson, A. 1956. A theory of the low-level equilibrium trap in the underdevelopedeconomies, The American Economic Review, Dec. 894-908
Notestein, F. W. 1953. The economics of population and food supplies. Economicproblems of population change. In Proceedings of the 8th International Conferenceof Agricultural Economists, London, 13-31.
Palma, G. 1978. Dependency: A formal theory of underdevelopment or a methodologyfor the analysis of concrete situations of underdevelopment? World Development,6,881-94.
Peemans, J.Ph. 1992a. Impacto social de las tecnologías de energía y alimentos,Centro Interdisciplinary de Estudios y Desarollo regional, Concepción.
Peemans, J.Ph. 1992b. La dimension "population" dans les débats, théories etprocessus de développement depuis les années 1950, Chaire Quetelet, Institut deDémographie, Louvain-la-Neuve.
135

Peemans, J.Ph. 1992c. Les grands courants dépensée en matière de développement,environnement et population: une note introductive, Gridep, Document de travail 1,Louvain-la-Neuve.
Peemans, J.Ph. 1993. Quelques enjeux théoriques et politiques de l'internationalisationen rapport avec les dynamiques de longue période, Paris: Gemdev.
Pezzey, J. 1989. Economie Analysis of Sustainable Growth and SustainableDevelopment, WP, World Bank, Washington.
Polanyi, K. and C. Arensberg. 1957. Les systèmes économiques dans l'histoire et lathéorie, Paris: Larousse.
Redclift, M. 1987. Sustainable Development: Explaining the Contradictions, London:Methuen.
Rist, G. 1990. "Development" as part of the Western Myth: the Western socio-culturaldimension of development, European Journal of Development Research, 2(1).
Sachs, 1.1993. L'écodéveloppement, Paris: Syros.
Simon, J. 1981. The Ultimate Resource, Princeton University Press.
Smith, N. 1990. Uneven Development, Nature, Capital and the Production of Space,Cambridge Mass.: Basil Blackwell.
Summers, L. 1992. Internal World Bank Memorandum, Dec 12, 1991, quoted in TheEconomist, Feb. 8-14.
Taylor, D. and F. Mackenzie, (eds.). 1992. Development from Within, Survival in RuralAfrica, London: Routledge.
Thiltges, E. and D. Tabutin. 1992. Population et environnement, Une synthèse desfaits, doctrines et politiques dans les pays du Sud, Cahiers du Cidep, 15, Louvain-la-Neuve.
UNCED. 1991. Preparatory Committee, PREPCOM 3, Geneva, August 1991, ABOSReport, Brussels.
Verhaegen E. and J. Degand. 1993. Dynamique évolutive des systèmes de productionagricole dans une région du Burundi, Cahiers du Cidep, 17.
Verhelst, Th. 1987. Des racines pour vivre, Sud-Nord: identités culturelles etdéveloppement, Duculot, Gembloux.
Wade, R. 1988. Village Republics: Economie Conditions for Collective Action in SouthIndia, Cambridge University Press.
World Bank. 1987. Environment, Growth and Development, OCP 14, Washington.
World Bank. 1991. World Development Report, Washington.
136

CHAPTER 7
ANALYZING THE ROLE OF POPULATION PARAMETERS INSUSTAINABLE NATIONAL DEVELOPMENT AND OPTIONS
FOR INFLUENCING THEM
Wolfgang Lutz(IIASA, Laxenburg, Austria)
This paper will present an operationalized analytical framework for studying theimpacts of alternative population trends on socio-economic and environmental factors.This Population-Development-Environment (PDE) approach has been developed for aUNFPA-sponsored project on population and sustainable development in Mauritius,which recently resulted in a piece of software and a book (Population-Development-Environment: Understanding Interactions in Mauritius (W. Lutz, Ed., Springer Verlag,forthcoming) from which this paper largely draws. With some modifications the modelcan also be applied to other countries. The following points will be based on theanalytical insights and empirical results gained from the Mauritius study, which is thefirst and only of its kind so far. At the end we will also look at policy priorities that followfrom this analysis.
The paper is structured in six sections:
First, the population parameters, which are considered relevant for the study ofPDE interactions, will be discussed. In addition to the genuine demographicvariables, levels of education and labor force participation will be included asadditional highly-relevant, population-based variables.
Section 2 discusses how population parameters should be related to economicand environmental aspects. Here the basic philosophy and structure of the PDEapproach will be introduced and discussed.
Section 3 then considers the question of the impacts of declining fertility onsociety, economic and environment in broad terms as well as in the specific caseof Mauritius, which experienced the world's most rapid national fertility declinearound 1970. This is also illustrated through hypothetical scenarios calculatingwhat would have happened if fertility had not declined.
Section 4 looks into the future and summarizes the major prerequisites forsustainable development as derived from the Mauritius case study includingissues of water supply, agricultural and industrial production, tourism as well aspopulation and labor force. It also addresses the dependence on global economicand environmental changes.
Section 5 addresses policies and considers broadly the question: What triggeredthe rapid fertility decline in Mauritius? From this some important lessons about thedeterminants of fertility decline can be learned.
137

The final section discusses policy priorities for the future, concluding that the mostimportant priority under longer term development criteria is the investment inhuman capital with special emphasis on the status of women.
1. Population Dynamics Including Education and Labor ForceParticipation
Figure 1 gives some general aspects of the relationship between input and outputparameters in a population model for a case that considers only age, sex, and place ofresidence. Only certain characteristics of the population have an effect on the economyand the environment. The basic characteristics are total size, growth rate, density, agedistribution (including mean age and demographic dependency ratios), sex ratio, andregional distribution of the population. These supposedly relevant characteristics of thepopulation, however, cannot not be influenced directly but only through changes in oneof the three basic determinants of population change, namely fertility, mortality, andmigration.
The effects of changes in fertility, mortality, and migration on population characteristicsare not always immediate, but they follow the laws on population dynamics. Even adrastic food shortage or certain epidemics do not directly diminish total population sizebut work through age and sex-specific death rates, and to some extent also fertilityrates, that are applied to the given population structure. Different structures may leadto different numbers of people dying. This dependence on the age structure is stillmore obvious in the case of fertility where a rapid decline in age-specific fertility ratesfor instance is applied to a very young age structure of the population. It can take quitea while until it results in significantly declining growth rates. This is the momentum ofpopulation growth which can be nicely illustrated in the case of Mauritius where fertilityin the late 1980 was already below replacement level but the growth rate of thepopulation was still above 1 per cent per year. The simple reason for this was thatmore and more young women that were born during the high fertility 1960s entered theprime childbearing ages.
The population module of PDE model as described below can be used eitherindependently to study population dynamics by age, sex, education and labor forceparticipation or as an integral part of the PDE model. It represents a summary of themost important aspects of population dynamics with respect to the four basicdimensions of population structure (age, sex, education, labor force participation) thatare considered relevant for any interaction between the population and its environment.
There is no space here to summarize the huge demographic literature on these fourdimensions of demographic structure and change. Instead the population module willbe presented here as a proposed basic demographic model including the essentialsthat a demographer would consider appropriate. Certainly there are many otherimportant demographic dimensions, most notably marital status, marital duration,parity, household composition, etc., but we assume that few demographers wouldchallenge the choice of those four dimensions.
138

POPULATION DYNAMICS
Determinants
Fertility Mortality Migration
Structured by
- A g e- S e x- Distribution
over region
Characteristics
Total SizeGrowth RateDensityAge DistributionSex RatioRegional Distribution
/\ /\ /\ A
Figure 1. Determinants and basic characteristics of changing population patterns byage, sex, and place of residence.
Age and sex are at the very base of demographic analysis and of immediate relevancefor population growth. A good example for this is the momentum of population growththat can only be understood and modeled when the age structure of the population isconsidered. The sex composition by age is essential for the fertility and also veryrelevant for mortality because male and female mortality patterns tend to be quitedifferent. Migration also tends to vary strongly with both age and sex. For thesereasons age and sex would be the absolute minimum to be considered in a populationmodule that any self-respecting demographer could accept. However the (non-demographic) literature of demo-economic and other modeling is full with examples ofmodels that only consider total population size and the crude birth and death rates, i.e.the number of births and deaths per thousand persons in the population. Because theydo not consider the effect of the age structure on the birth rate (that is independentfrom the number of children per woman) their findings are sometimes greatlymisguided.
Education is not a demographic variable in the strict sense but it is a populationcharacteristic that is more and more considered one of the most relevant aspects fornot only fertility, mortality, and migration but also economic productivity andtechnological change. The empirical evidence of the relevance of education on thesevariables is overwhelming both at the micro- and at the macro-level. Generally bettereducation leads to lower fertility, lower mortality, higher migration and higherproductivity. The measurement of education, however is less straightforward than themeasurement of age and sex.
139

Mostly two criteria for the distinction between educational groups can be found: adistinction by reading and writing skills (literacy) or by years of formal educationcompleted. The usefulness of the two approaches depends on the status of thespecific population in the process of social development. In an industrialized societywhere almost everybody can read and write the distinction by formal education is muchmore useful, whereas in a country with still large proportions illiterate, reading andwriting skills are the most important criterion. In the case of Mauritius where already inthe 1960s large proportions of the population were literate it was decided to distinguishbetween primary, secondary and tertiary education. For another application of PDE thiscould well be different.
Labor force participation is probably the least self-suggestive of the four dimensionsconsidered. It is a dichotomous variable that indicates whether a person is part of alabor force or not. Generally this is defined as a population based measure that isindependent from the question of actual employment. Hence the labor force includesall people who are actually working (including those on sick or maternity leave) and theunemployed. Somewhat loosely one can say that the labor force consists of all peoplethat want to work. Obviously the numerical measurement of this also depends onnational definitions, that may differ from one country to another. For example ahousewife who is theoretically willing to work but does not take any concrete steps forfinding a job because she considers it hopeless and does not register as unemployedbecause she is not entitled for benefits may be considered as part of the labor force insome cases and as outside the labor force in others. But despite these problems ofdefinition, major changes in labor force participation rates still indicate major socialchanges that have significant impact on the economy at various levels, as we will seein the economic module below.
One prominent demographic variable that is omitted in this population module is maritalstatus. Because marriage is still closely related to fertility in most countries of the worldchanges in marriage patterns have immediate consequences on birth rates. This isalso true for Mauritius where it was demonstrated that the rapid fertility decline in thelate 1960s and early 1970s was to a significant extent due to increases in the age atmarriage. But despite this explanatory importance of marriage it is here of interest onlyas an intermediate variable influencing fertility and not in its own right as it would be forinstance in social security considerations. For this reason it was decided not to specifymarital status as an independent variable but be aware of the fact that all scenarioassumptions on fertility include the marital status dimension.
Considerable attention was also given to the question whether household size andstructure should be explicitly treated in the model. A strong argument in favor of this isthat private consumption patterns are usually defined in terms of householdconsumption and not individual consumption. There is, however, no feasible way toconvert information based on individuals (such as given in the chosen form of thepopulation module) directly into information on households. Even if these two differentaspects could be matched for the starting year there is no way to guarantee consistentchanges in both when patterns are projected into the future. For this reason thepopulation module will stick to the individual as the unit of analysis and in the economicpart, consumption patterns will also be defined on an individual basis.
The traditional cohort component method of population projection is only designed toforecast populations by age and sex. If we want to include the two additional
140
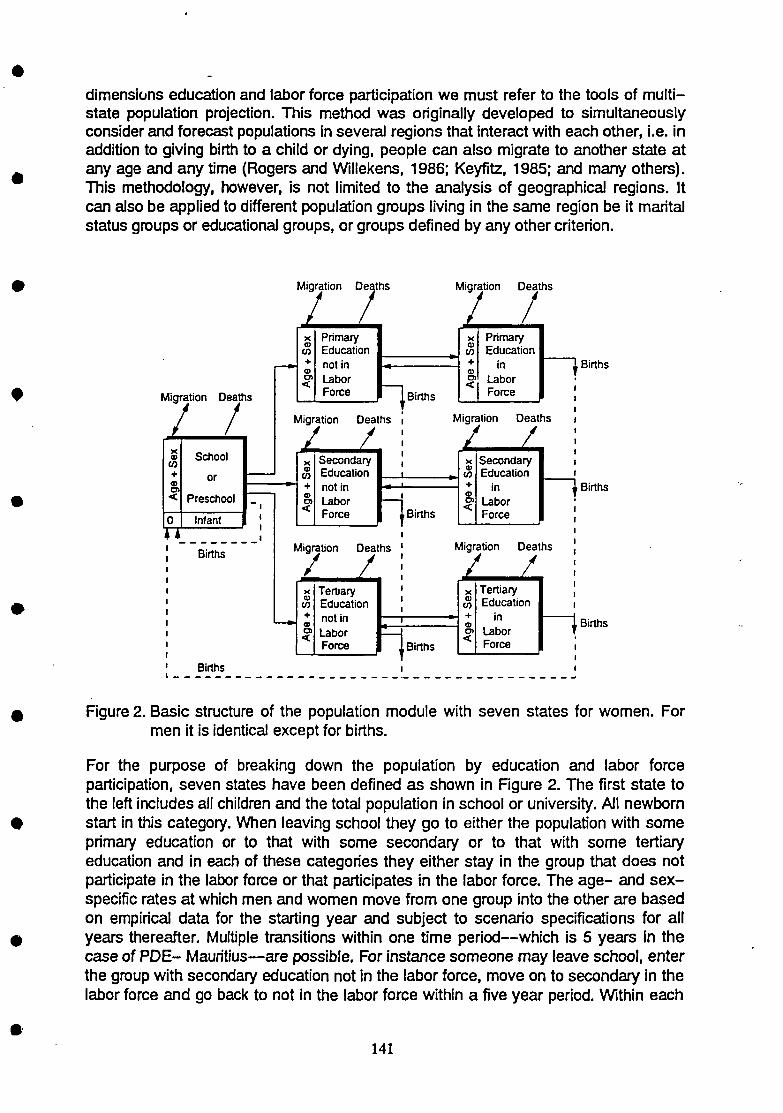
dimensions education and labor force participation we must refer to the tools of multi-state population projection. This method was originally developed to simultaneouslyconsider and forecast populations in several regions that interact with each other, i.e. inaddition to giving birth to a child or dying, people can also migrate to another state atany age and any time (Rogers and Willekens, 1986; Keyfitz, 1985; and many others).This methodology, however, is not limited to the analysis of geographical regions. Itcan also be applied to different population groups living in the same region be it maritalstatus groups or educational groups, or groups defined by any other criterion.
Migration Deaths
School
or
Preschool
Infant
Births
TTV)
PrimaryEducationnot inLaborForce
T 7Births
PrimaryEducation
inLaborForce
Migration Deaths
/SecondaryEducationnot inLaborForce ,Births
Migration Deaths
TertiaryEducationnot inLaborForce
Migration Deaths
SecondaryEducation
inLaborForce
Migration Deaths
Births
Births
TertiaryEducation
inLaborForce
.Births
Births
Births
Figure 2. Basic structure of the population module with seven states for women. Formen it is identical except for births.
For the purpose of breaking down the population by education and labor forceparticipation, seven states have been defined as shown in Figure 2. The first state tothe left includes all children and the total population in school or university. All newbornstart in this category. When leaving school they go to either the population with someprimary education or to that with some secondary or to that with some tertiaryeducation and in each of these categories they either stay in the group that does notparticipate in the labor force or that participates in the labor force. The age- and sex-specific rates at which men and women move from one group into the other are basedon empirical data for the starting year and subject to scenario specifications for allyears thereafter. Multiple transitions within one time period—which is 5 years in thecase of PDE- Mauritius—are possible. For instance someone may leave school, enterthe group with secondary education not in the labor force, move on to secondary in thelabor force and go back to not in the labor force within a five year period. Within each
141

group women have children according to the schedule of age-specific fertility rates thatcan be defined separately for each group and that may change over time according toscenario specifications. The newborn children do not enter the group of their motherbut all start at age zero in the group of children and students.
In addition to the possible transition to another group—where the model is semi-hierarchical because not all transitions go in both directions—people can leave thestates by either emigration from Mauritius or death. New people may also enter thestates by immigration. Age- and sex-specific death rates can also be definedseparately for each group. Because of the lack of empirical information on differentialsin these rates, however, the default in the program is identical mortality rates in allstates. Migration is specified in terms of absolute numbers and assumed to differsubstantially with educational groups, with the most educated showing the highestmobility.
Most of the effects of population size and structure on the environment work via theeconomy: higher education directly increases labor force participation; consumption ismade dependent on educational level and age; the supply of labor is given byeducational groups; and government expenditures are directly dependent on the agestructure (pensions, health, and educational expenditures). There are also directeffects of population size on the land use module with respect to land demand forhousing and on the water module with respect to gross water intake by privatehouseholds.
2. The Population Module Embedded in the Economic andEnvironmental Spheres
Formal models on computer are a tool to support the human brain. In the same waythat a pencil can help the scientist remember his present thoughts, a computer modelcan help the scientist consider simultaneously more variables and interdependenciesthan he could manage even with a well-trained mind. Because population-development-environment interactions are highly complex, a non-formal, non-computerized analysis such as that presented in the previous section can onlysequentially describe relevant aspects and discuss interactions one after the other.This approach may be appropriate for understanding the history and describing thecourse of events that have already taken place and that will not be altered by themodel of the scientist, although its interpretation may well be altered. When attemptingto project possible future trends, on the other hand, the simultaneous consideration ofall important interactions between the variables is absolutely essential. Any one-dimensional projection of a trend that disregards likely influences of other variables isbound to be wrong in the sense that reality will be different. Hence, at least for thefuture we need to use computer modeling to combine and evaluate complex sets ofassumptions about individual variables and specific linkages. Despite its superiority inmany aspects to a purely mental model, a computer model will always be far short ofan exact representation of reality. The best thing one can hope for is to capture themost relevant aspects of the system.
Any design of a model includes difficult choices of variables and assumedmechanisms. The results of the model will crucially depend on those choices. The
142

challenge for our attempt to design the PDE model was to be as broad and flexible aspossible in the basic (hard-wired) structure of the model and stick to unambiguousrelationships which can hardly be debated even by scientists with greatly conflictingviews. In the "soft" part of the model, which is operationalized through the tools ofscenario setting, all the less straightforward and controversial linkages may be defined.A comparison of the outcomes of alternative specifications then can help to betterunderstand the system and put into perspective differences in opinion expressed in theliterature.
In short, the PDE model is a flexible and user-friendly computer tool to betterunderstand the relationships between population change (P), socio-economicdevelopment (D) and environmental factors (E). It gives a broad accounting frameworkwhich quantitatively specifies the most important and immediate effects of somesectors of the system on others. It is flexible in the sense that the user is free tochoose different values for a large number of parameters, and to define anycombination of possible trends and policies—as well as feedback mechanisms—through the tools of time-dependent interactive scenario setting. The PDE model aimsat enhancing scientific understanding and demonstrating the longer termconsequences of alternative policies or external developments. It has no immediateadvocacy purpose.
When discussing the philosophy and basic structure of PDE models, it is important todistinguish between the general PDE approach, which could be applied to othercountries or regions, and the specific form of PDE-Mauritius. The latter was made to fitspecific Mauritian conditions ranging from the climate to economic structure, dataavailability and time constraints in the completion of the model. The Mauritius modelshould be seen as a first attempt and a prototype of a PDE application.
The first letter in PDE refers to population, the second to development and the third toenvironment. This sequence is not arbitrary; it expresses the basic philosophy of themodel. Population is taken as the point of departure as one of the basic driving forcesthat—together with many other factors—has an impact on development withinenvironmental constraints.
Frequently, scholars addressing population-environment issues tend to view them interms of two independent boxes (see Figure 3) with a causal arrow between the boxes.While the population box can be defined as a distinct entity (the number of people in acertain region), it is usually unclear what the environment box should contain. It mightbe one very specific aspect of environmental change, such as deforestation or airpollution. But generally the environment must not be represented by an independentbox for two reasons: First, environment and the laws of nature are everywhere and noline can be drawn around nature; second, nothing is independent from theenvironment, including the human population that is part of nature and in all basic life-supporting functions depending on the environment.
Population<c
Environment
Figure 3. A misleading "box approach" to studying population and environment.
143
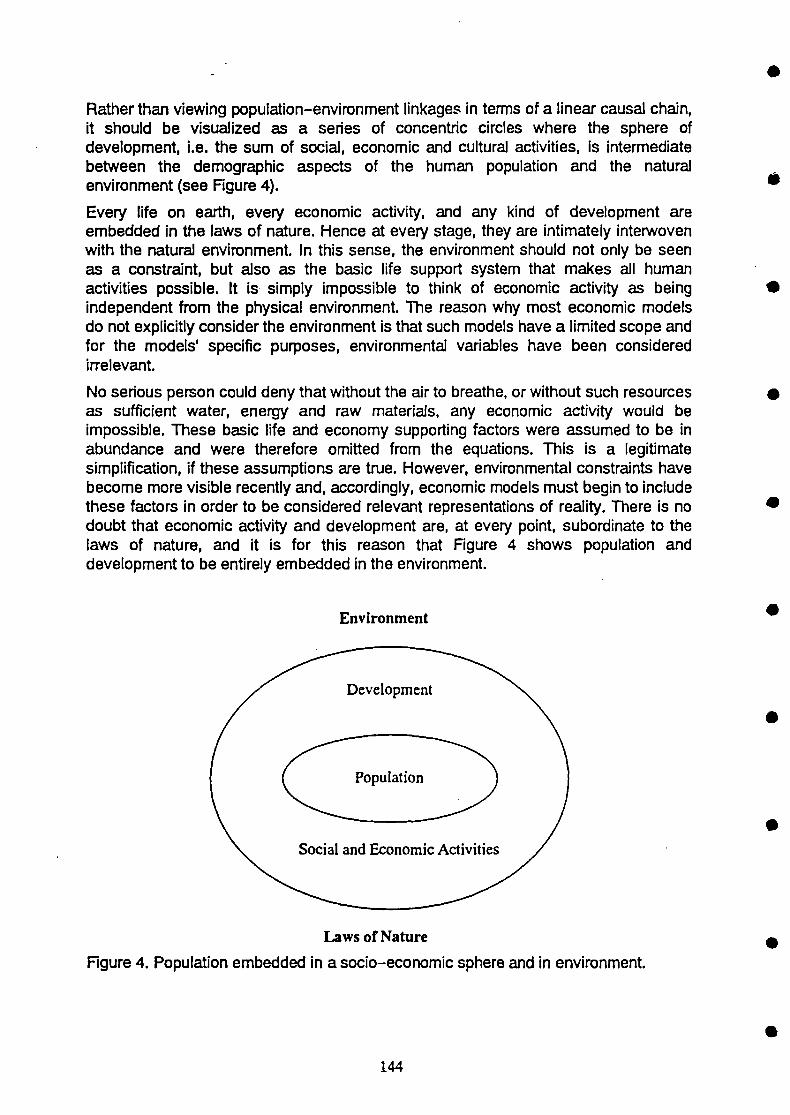
Rather than viewing population-environment linkages in terms of a linear causal chain,it should be visualized as a series of concentric circles where the sphere ofdevelopment, i.e. the sum of social, economic and cultural activities, is intermediatebetween the demographic aspects of the human population and the naturalenvironment (see Figure 4).
Every life on earth, every economic activity, and any kind of development areembedded in the laws of nature. Hence at every stage, they are intimately interwovenwith the natural environment. In this sense, the environment should not only be seenas a constraint, but also as the basic life support system that makes all humanactivities possible. It is simply impossible to think of economic activity as beingindependent from the physical environment. The reason why most economic modelsdo not explicitly consider the environment is that such models have a limited scope andfor the models1 specific purposes, environmental variables have been consideredirrelevant.
No serious person could deny that without the air to breathe, or without such resourcesas sufficient water, energy and raw materials, any economic activity would beimpossible. These basic life and economy supporting factors were assumed to be inabundance and were therefore omitted from the equations. This is a legitimatesimplification, if these assumptions are true. However, environmental constraints havebecome more visible recently and, accordingly, economic models must begin to includethese factors in order to be considered relevant representations of reality. There is nodoubt that economic activity and development are, at every point, subordinate to thelaws of nature, and it is for this reason that Figure 4 shows population anddevelopment to be entirely embedded in the environment.
Environment
Social and Economic Activities
Laws of Nature
Figure 4. Population embedded in a socio-economic sphere and in environment.
144

Within the sphere of development and economic activity, people are the agents. Theyare the ones who conduct the activities, develop routines, traditions, cultures,knowledge and infrastructure. These economic activities are necessary for humansurvival. Again, there is no doubt that any human life is dependent on certain forms ofsocial and economic activities, and that further development of these activities makeslife on earth possible for a larger number of people. This is why the population isconstantly embedded in the sphere of development, along with social and economicactivities. However, it is also clear that the demographic characteristics of thepopulation are not the only determinants of these activities. It is mostly such qualitativeaspects of the population as human skills and knowledge, along with accumulatedinfrastructure (capital) and the sum of environmental influences (traditional productionfactor "land"), that determine development. In the long run, the human resource factor(human capital in its quantitative and qualitative aspects) seems to be the mostrelevant for development. For this reason PDE assigns population a key role in theanalysis of development within the ecosphere. Certainly, there is a large number ofsignificant other factors that influence development, which are specified as exogenousand endogenous variables in the economic module of PDE.
The environment is everywhere; but how should it be meaningfully captured in aquantitative model? Most of the analyses which claim to consider the environment inthe context of development select one or two very specific aspects of the environment,be it CO2 emissions or rates of deforestation. These specific analyses can be useful asillustrations for certain impacts, but they cannot claim to capture comprehensivelydevelopment-environment interactions. A lot of attention is currently being given tocarbon emission, because of the fear of climate warming, and to the level of CFCsbecause of the ozone layer. Tomorrow, however, new environmental priorities maycome up, such as immediate problems of water supply, toxic waste, radiation orpossible new and unbeatable diseases. Because such a disjointed and fractionalapproach to environmental questions could turn out to be rather short lived—hencemissing some of the more important interactions—the PDE approach attempts to beas holistic as possible by, at least in theory, giving attention to all possibleenvironmental aspects.
When thinking of how to find a meaningful differentiation of the environment as itrelates to human life on earth, it can be instructive to go back to the very origins ofoccidental thinking in ancient Milet, around 600 B.C. There Anaximander, who hadsupposedly drawn the first map of the world, claimed that four elements—water, air,fire and earth—made up the world and stayed in some kind of balance. These earlyattempts to understand nature and the environment of people may also be useful instructuring our thinking in how to identify relevant environmental aspects for themodeling of population-environment interactions. Water, air and land can readily betaken as environmental subsystems that deserve special treatment and will bedescribed by separate modules in the environmental segment of PDE. Fire can beinterpreted as energy that is also worth separate treatment. Another environmentalsystem which is not mentioned by Anaximander is the sum of living species on earth.For our purposes it is useful to distinguish between the human species, the population,and other species with special attention to the change in biodiversity.
When attempting to translate these general ideas into an operational quantitativemodel for the computer, a large number of specifications and definitions are required.
145

In this we tried to follow three basic principles of modeling which we had chosen for thePDE approach:
1. The model should only include relevant aspects which could potentially make adifference in the specific case considered.
2. The model should be as simple and straightforward as possible, avoiding 'magic'black boxes.
3. Only unambiguous and direct relationships should be hard-wired in the model. Allother aspects should be treated as part of the soft model structure, as expressedby scenario settings.
While there is little new about the first two principles, the third may need someexplanation. Our approach here is based on one of the lessons we think we havelearned from the global modeling of the 1970s and early 1980s. The system should notbecome an artificial world in itself which, due to many pre-defined feedback loops,develops its own life and takes off in directions that can hardly be followed by commonsense and have little to do with reality. We wanted to avoid hard-wired unchangeablefeedback loops that are based only on ambiguous theory and scattered empiricalevidence.
An example of this is the question whether fertility and mortality levels should be madedirect functions of any other demographic, economic or environmental parameters inthe model. Because the vast literature on socio-economic fertility determinants doesnot suggest any clear and simple functional relationship between fertility and a set ofnon-demographic parameters, we decided not to specify such a relationship when itcould hardly be defended. Instead, the user can decide when and how in the course ofrunning the model the fertility levels in the different population groups should bechanged, based on either altering socio-economic or environmental conditions, orsimply on assumptions about relevant cultural and behavioral change. This possibilityof user-defined feedback through scenario assumptions is called the soft model, asopposed to the hard-wired, predefined hard model. With respect to fertility, there arealso several hard-wired aspects which work through the changing educationalcomposition of the population. If the user assumes different fertility levels for differenteducational groups, a change in the educational composition of the population—whichis also influenced by economic and government policy parameters—has a directimpact on the average fertility level in the population. This is a simple consequence ofchanging weights. Similar distinctions between hard and soft parts of the model can befound for many different sectors of the model.
Following these general thoughts, Figure 5 presents a model proposed as a generalguideline for the PDE approach. At the center one finds the population broken down—in the first instance—by age and sex. This gives the traditional age pyramid with men(on the left) and women (on the right), with the lowest age group at the bottom and thehighest at the top. Although some models deal primarily with total population size, webelieve that age structure, in particular, is an essential feature of the population whichhas immediate effects on the economy and society. Furthermore, over time,disregarding the population age structure would make it impossible to capture themomentum of population growth which—in most less developed countries—isquantitatively an extremely significant phenomenon. The growth rate of the populationcan only be indirectly affected through fertility rates, and with the population structure
146

exerting momentum. As will be shown in the following chapters, Mauritius gives a goodillustration of this point.
As discussed above, age, gender, education, and labor force participation are cross-classified in a multi-state population model. This form of the population module seemsto be relatively unambiguous, with respect to both substance and methodology. It is anattempt to summarize, in one compact unit, the essentials of population dynamics thatcan be handed over to the rest of the model for economic, environmental and policyconsiderations. Parameters of change in the population module are fertility, mortalityand migration in each subgroup, as well as schooling and labor force entry and exit.
In Figure 5 the population parameters are embedded at every point in the sphere ofsocial and economic activities, including accumulated knowledge and infrastructurethat may be summarized by the notion of development. This includes models ofproduction and consumption by economic sectors as well as imports, exports anddomestic trade. Obviously savings, investments, and government expenditures alsoneed to be considered. Finally government policies play a crucial role in all social,economic and even environmental aspects.
Unlike most other similar models, the PDE model does not want to be primarily aneconomic model. Its emphasis is on the population-environment relationship. Butbecause population factors hardly ever directly interact with environmental factors, theeconomic module is intended to serve as a linkage between the two. In designing theeconomic module, one is faced with a dilemma: on the one hand, the philosophy of thePDE approach asks for as simple a model as possible to serve the purpose of linkingpopulation to the environment, whereas on the other hand one is in competition with alarge number of very sophisticated economic models that do not attempt to provide thislinkage. For the Mauritius application, a form of the input-output table has beencombined with certain features of general equilibrium models. The final product stillreflects the evolution of thinking and development and, although it is functional, it couldwell be improved for another application. In particular, it may be necessary toreconsider whether the advantages of an input-output table are worth its limitations.
147

ENVIRONMENT
DEVELOPMENT
Domestic- Changes in Composition-Winds-Humidity- Temperature
by: Sourceand Use
by: Age/Gender Education/Labor Force ParticipationChanges throughFertility/Mortality /Migration/Schooling/Labor Force Entryand Exits
by: EconomicSector
by: EconomicSector
Water-Rainfall- Streamflow- Groundwater- Lakes and Sea- Man-made Systems
Government PolicySocialEconomicEnvironmental
Soil CompositionTopographyLand Cover and Use
Figure 5. Basic structure of the general PDE model.
But no matter which approach to economic modeling is chosen, certain features shouldbe retained. These are reflected in the Mauritius model, as described below. Withregard to the linkage of the economic module to the population module, all of theselected basic population characteristics—sex, age, education and labor forceparticipation —must be reflected in the economic input parameters and must make adifference on the results. In the Mauritius application, age, gender, and labor forceparticipation determine the size of the active population, as opposed to the dependentpopulation (children, elderly, housewives). Higher labor force participation reduces thesize of dependent population. The educational composition of the population also hasimportant independent effects on the economy. Firstly, higher education is assumed toincrease economic productivity and, as a consequence, the competitiveness on theworld market, and lead to faster technological progress. Secondly, consumptionpatterns are assumed to depend on age and education. Because the populationmodule can only provide such information about individuals that cannot be directlytranslated into household distributions, consumption is also defined for individuals byage instead of the usual household definition.
Another general criterion for the economic module is that it should consider the majorcomponents of the economy separately, in order to allow the analysis of changes in theeconomic structure. But a model of the world market for relevant export goods (such assugar in Mauritius) is not being attempted. It would be a very complex task in itself.Instead external factors—such as export demand—will be treated through scenario-defined input parameters. The economic module should also produce some basicindicators of material well-being, quantify government expenditures and investment invarious important aspects of infrastructure, education and social security, and provideunemployment figures. Finally, the economic module is expected to produce—asoutput variables—the input parameters for the various environmental modules. These
148

would include such parameters as water demand figures, water pollution, solid waste,changes in land use, etc.
Figure 5 finds the environment broken down into four basic environmental sectors: air,water, land and energy. The air module should be concerned with the chemicalcomposition of the air, along with air temperatures and humidity, and the direction,speed and seasonality of winds. The specific aspects and models selected to describerelevant aspects of atmospheric change depend, to a great degree, on the country orregion chosen. In urban and industrial areas in particular, emphasis would be placedon air pollution which displays immediate implications on human health and on thehealth of the vegetation, especially forests. For more global considerations, attentionwould probably be directed at greenhouse gases along with those gases responsiblefor ozone depletion. In the specific case of Mauritius, the fundamental modelingprinciple— of only including variables that are assumed to have an effect on theoutcome—resulted in the decision to omit the air module altogether. As will bedescribed in the following section, the almost permanent winds in the area willimmediately transport any kind of air pollution over the vast Indian Ocean. Some minorlocal air pollution problems, located near sugar mills, did not justify an extensiveconsideration of air quality questions. We will, however, present calculations oncontributions of Mauritius to global CO2 emissions. The questions of air temperatureand humidity, relevant to the water balance of Mauritius, are extensively dealt with inthe water module.
The water module is probably the most relevant of the environmental aspects, due toits direct links to human life support systems. Problems with water supply can, in boththe short and long term, lead directly to health problems such as those caused by lackof food production or by the consumption of contaminated water. Because mostregions have different semi-independent water systems such as rivers, groundwater,lakes, and coastal waters, the water module should consist of several sub-modulesthat describe and model the dynamics of the systems relevant for life in the specificregions. For each of these subsystems, two important and different aspects of waterneed to be considered: the quantity and the quality of water. Both aspects areimportant, and problems with either one may cause problems for the system. However,quantity and quality are not independent. The quality of a given amount of pollutedwater can be improved by adding clean water. Hence, quantity can solve the qualityproblem.
Hydrological modeling is a large scientific field in itself. After a review of the relevantliterature, the following approach was chosen: The surface freshwater model isbasically concerned with the balance of water requirements (demand) and wateravailability (supply) at a given user-defined minimum water quality standard. Supplyand demand for water are specified in terms of physical quantities. The chosen waterquality standard, together with the user's decision about investments ¡n waste watertreatment, determines the dilution flow component of water demand. In this way, waterquantity and quality have been linked into a common system. The freshwater supply isbased on information about precipitation, evaporation and historical flow data. Thewater supply is measured in terms of aggregated minimum flow which the user canchoose to increase by investing in storage capacities.
In the specific case of Mauritius, the approach described above was applied, taking theisland as one more or less homogeneous region. In other, more heterogeneous, cases
149

one would certainly have to specify a more complex multi-regional model to accountfor the possibility of water being transported by rivers from one region to another. ForMauritius the water module also includes a separate module on water dynamics andsedimentation in the lagoons surrounding large parts of Mauritius.
Theoretically, the land module includes all aspects of surface structure, vegetation andsoil composition. In cases where soil degradation and erosion are serious problems,appropriate models which describe these phenomena in physical terms need to bechosen. In the case of Mauritius, the land module is mostly concerned with questionsof land use and regional distribution which are closely tied to economic changes andthe values of different categories of land. This module distinguishes between fourmajor types of land use: urban use (including settlements and industries), sugar canefields, other agriculture, and beaches which, because of the tourist industry have by farthe highest value per land unit. There are also protected lands (crown lands) andhardly usable areas on Mauritius. The land use module reconciles competition fromdifferent users, and puts constraints on the economic module and other environmentalmodules.
The influence of all non-human living things (other species) can be very relevant forthe man-environment interaction. This includes considerations of biodiversity as wellas the changing distribution of species ranging from bacteria to whales. It is not onlyrelevant for the basic life support systems but also for the disease environment thataffects human mortality and partly also fertility. In the case of Mauritius, however,these questions were not considered in the quantitative model because of principlenumber 1, i.e. changes in other species are generally not considered to make a bigdifference for Mauritius over the next six decades. Special attention will be given to thecorals, however, and certainly the vegetation is considered in the land use module.
Energy, the fourth of the basic elements mentioned by Anaximander, could be treatedeither as a separate module or as part of the economic module. Because of its closerelationship to the economy, it was decided to initially treat energy considerations aspart of the economic module. If more sophisticated and independent energy modelingwere to be considered desirable, a separate energy module would have the advantagethat energy could be treated on physical instead of monetary terms as is done, forinstance, by the ECCO models (see King, 1991). The same is true for agriculture,which in the PDE-Mauritius model is considered as one of several economic sectors.In a predominantly agricultural country it might make sense, however, to create aseparate agricultural module, possibly in conjunction with the land module.
The specific form of the PDE approach chosen for the PDE-Mauritius consists of foursemi-independent modules population, economy, water and land use. The populationand water modules can also be used as fully independent models in themselves ifscenarios are defined for parameters designed to be imported from other modules. Inthe specific Mauritian PDE application, the land use module is so closely tied to theeconomic module that it makes no sense to run the two independently.
150

3. Did the World's Most Rapid Fertility Decline Make a Difference toEconomic Development on Mauritius?
This section deals with the consequences of fertility decline on economic development.More specifically we will look at the following questions: Did fertility decline and theslowing population growth rate exert a positive influence on the start of the economicboom of the 1980s? Does the traditional Coale/Hoover (1958) argument on capitalshortage due to many children hold for Mauritius, or were other mechanisms dominantduring the past three decades?
On an international level the aggregate empirical evidence on this issue seems to bevery mixed depending to a large degree on the choice of variables. In their 1986 reportthe U.S. National Academy of Sciences presented a summary of recent research onthe economic consequences of population growth in developing countries. Most of thatreport focuses on the question whether slowing population growth is advantageousunder certain economic and resource availability criteria. The conclusions distinguishbetween short-term and long-term consequences. For the short-term the reportgenerally sees beneficial consequences of slower population growth. But for the longrun, it stresses the possibility of positive effects of population growth due to incentivesfor improved organization and technology.
Such general statements on the long-term behavior of highly complex and hardlyunderstood societal and economic systems, however, are largely based on mentalconcepts with little possibility for empirical support. Consequently the report alsoconcludes:
" In short, the effects of rapid population growth are likely to be conditioned by thequality of markets, the nature of government policies, and features of the naturalenvironment. Since the effects are so dependent on these conditions, a reliableassessment of many of the net effects of population growth can best be carriedout on the national level..." (U.S. National Academy of Sciences, 1986:89).
3.1. Fertility, Population Growth and Income
Figure 6 plots the evolution of three basic variables in Mauritius: per capita income,population size and fertility. Already the timing of changes in those variables can giveimportant indications of their relationship. The first observation on the demographicside is that despite dramatic fertility decline, total population size is rather inert andincreases steadily. This is due to the momentum of population growth and the fact thatmortality also improved.
Because of the almost linear trend in population size between 1950 and 1990, it isdifficult to make any argument directly related to GNP which, on a per capita basis,was almost constant between 1950 and 1970 and then shows two big jumps in the1970s and the late 1980s. If increasing population size should have induced economicgrowth, one must make the unlikely assumption that some magic population densitythresholds were reached in 1970 and 1985. Based on the Mauritian evidence, it isequally difficult to make the point that total population size was an obstacle toeconomic growth.
151

oin
(ACDCD
a.
a.reOQ.OO
1950 1955 1960 1965 1970 1975 1980 1985 1990
Real GDP/Cap at factor costs in
1,000 of 1987 Mauritian rupees
Population size
times 50.000
TFR
Figure 6. Total fertility rate, per capita income and population size in Mauritius, 1950-1986.
It is much more instructive, however, to study the relationship of income to fertilityinstead of total population growth, which is quite a different question because ofdifferent assumed mechanisms of causation. (Looking at population growth rates wouldbe a mixture of these two aspects.) It is remarkable to see that the first big increase inincome followed immediately after the first big fertility decline. The second jump inincome followed another moderate fertility decline that brought fertility down toreplacement level.
There are important non-demographic factors associated with the phases of economicdevelopment. For the late 1980s the introduction of the Export Producing Zone policiesseems to be the overwhelming determinant. For the 1970s the external reasons for therapid income growth are less clear. It coincides with Mauritian independence, with firstindustrialization efforts, favorable international conditions and stable sugar prices. Butthe preceding fertility decline may have well been instrumental for this economictakeoff.
We can think of two arguments aside from the Coale/Hoover savings argument thatwould support a causal effect from declining fertility to increasing income. The firstrelates to the labor force by freeing young women to work in the new factories insteadof being locked at home with children. And indeed, female labor force participationrates in Mauritius increased from 20 per cent in 1972 to 28 per cent in 1983. For young
152

women (aged 20-24) this increase was even much stronger, reaching 40 per cent in1983. Mostly in textile factories but also in the service sector, the rapidly increasingyoung female labor force contributed substantially to economic growth. With traditionalhigh fertility and young age at marriage, this could not have happened. Certainly, to beeffective, such a development requires the availability of new jobs for women, whichwas the case in Mauritius.
The second argument is much broader. It relates to the view that the fertility transitionis essentially based on a mental transition, on a change from aiming at quantity ofchildren to quality (skills, higher status). This refers to the first of Coale's basicconditions for a sustained marital fertility decline as discussed above. Some even call ita transition from fatalism to individual rationality. Now the argument is, once individualrational choice has been introduced into one's private life, it is this mental transitionthat consequently results in longer term investments into the future, including training(of oneself and of children) and economic activities. Such longer term investments onindividual as well as on familial and societal levels are also the basis for any economicdevelopment. In this sense the fertility decline may be seen as being closely related toa takeoff in economic development.
There are several other countries where the sequence of fertility decline and economicgrowth is similar to Mauritius (most notably China) but as shown above, the twodevelopments may also be simultaneous or in specific cases (such as some Arab oilexporting states) in reversed order.
3.2. What Would Have Happened Without Fertility Decline?
The PDE-Mauritius model developed for this study allows not only projections into thedistant future but can also be used to construct alternative histories. In this case 1962(a census year) is chosen as the initial state. Thereafter the observed development for25 years (up to 1987) is reconstructed as one scenario. But several hypotheticalalternative scenarios also have been calculated, four of which will be briefly discussedhere for a quantitative assessment of the role of population variables in income growth.
Table 1 shows that the observed development between 1962 and 1987 brought a 101per cent increase in per capita GNP. If no development at all had taken place—i.e. alldemographic, social and economic parameters would have remained at their 1962level—GNP per capita would have declined to almost half of the already very low levelby 1987. If, however, fertility had declined and education improved with otherwiseconstant parameters, per capita income would have only declined by 22 per cent.Hence a fertility decline would have made the bad situation somewhat better.
In the case of assuming progress in the economic parameters along the line actuallyobserved between 1962 and 1987 but without a fertility decline, per capita incomewould have increased 'only' by 63 per cent instead of 101 per cent, i.e. one-third less.If one also assumed no social development which mostly refers to observed education,GNP per capita would have increased by 'only' 61 per cent, i.e. somewhat more thanhalf of the observed increase.
Because there are many other relevant economic variables such as unemployment,government deficit and trade balance, that develop differently under the variousscenarios, the figures on GNP in 1987 demonstrate only part of the economic
153

consequences of alternative demographic and educational developments. But thedirections and the orders of magnitude are clear. Between 1962 and 1987 theexogenous economic parameters had a larger relative influence on Income than directeffects of fertility decline that are clearly visible nevertheless. When extending thesehypothetical histories to 2002 the negative relative effect of higher fertility and lowereducation comes out even stronger. The given calculations, however, include onlydirect "hard-wired" effects and do not include more indirect effects of the kinddescribed in the previous subsection which, under the PDE approach, belong to the"soft" model that is implemented by means of a user-defined scenario setting.
Table 1. Observed and hypothetical effects of declining fertility under differentsocial (mostly education) and economic scenarios on per capita incomein constant Mauritian Rupees.
1962
Observed development 8,958
All 1962 parameters constant
No economic development but fertility decline
and social development
Economic development but...
... no fertility decline
... no fertility decline and no social development
1987
17,999
5,886
6,987
14,620
14,403
% Change
+101
-34
-22
+63
+61
In short, there are several reasons to assume that the fertility decline in Mauritius had arole in triggering the subsequent economic boom. Despite the fact that economic andpolitical variables are the most visible determinants of economic growth, the modelalso shows that without a fertility decline, Mauritius would be clearly worse off today.On a deeper level mental changes associated with the fertility transition may beessential for economic development.
154

4. Alternative Scenarios for the Future
This section highlights some key aspects of the future dynamics of the population-development-environment interactions as derived from the findings of the MauritiusCase Study.
4.1. Water as the Basic Physical Constraint Even on a Tropical Island
The international discussion on resource availability has recently given more attentionto the management of renewable resources since the concern about non-renewableresources has somewhat diminished. Water is a very special kind of renewableresource because its local availability is essentially determined by the climate andtopography, and can only be transported over longer distances under specificconditions. On Mauritius total freshwater availability must essentially be considered asa fixed resource with significant seasonal and annual variations.
120
110
100
90
80
70
2 60
& 50
40
30
20
10
0
New Zealand
Canada
CongoNorway
. Equatorial Guinea1 • LaoPDR
Central African Rep
• Bolivia -Venezue la—-Brazil
l l e - Guinea• Zaire
-Colombia•guinea-Bissau
" c u a d o r
jíTiDlandAustralia - • Cameroon
* • USSR.
CologuineaBi"Ecuador
Honduras
' . -Cambc4 l r e l a n d -Guatemala '• "Austria mm -Nepal
l . ^ \ m - - ; »MAURI!
1 Nicaragua
'Malaysia M y a
1 Indonesia
Panama
1 Costa Rica
0.2 0.4 0.6
IMAURITIUS _ ^
0.8 1 1.2 1.4 1.6
Water/km 2
1.8
Figure 7. Annual internal freshwater resources per person and per km2 in all countriesof the world (except for five extreme outliers).
Whether Mauritius has scarce or plentiful fresh water resources depends on the pointof view, whether we consider water per person or water per land area. Figure 7 showsa cross classification of a number of countries according to these two variables.Mauritius is found in the lower right corner of this graph, indicating that because of itstropical climate and mountains, Mauritius has more water per km2 than most othercountries in the world, whereas it has very low per capita water resources. Thediscrepancy results from the very high population density on Mauritius.
The set of future scenarios consistently shows that water availability at a given highstandard of quality is the essential environmental constraint to unlimited economic
155

growth on Mauritius. Whether this constraint will actually inhibit economic growthdepends on the investment made into water storage and treatment. Underenvironmental laissez-faire policies together with an export-driven economic boom,the limits will be met relatively soon. But the model also shows that timely investmentinto water management infrastructure will make possible even very rapid furthereconomic growth. This is especially the case when growth is not based on irrigation-intensive sugar cane but rather on industry and services. Among the many relevantaspects of water management waste water treatment comes out as the mostsignificant.
Another aspect which is considered in the water module of the PDE model is the waterquality of the lagoon which surrounds large parts of Mauritius and is an importantnatural asset, not least for tourism. It also affects the survival of the coral reef which isalready partly damaged. It is shown that enforced legislation on water treatment andwaste disposal can make a big difference here.
4.2. Future Agriculture and Industrial Production
Sugar cane has traditionally been the backbone of the Mauritian economy. Sugar fieldsand sugar factories still dominate the Mauritian landscape. Only in recent yearsindustrial exports (especially textiles) have surpassed sugar exports. Over the pastdecades sugar prices and quantities guaranteed to Mauritius by the EuropeanCommunity were a very important element of stability during the onset of the recenteconomic boom in Mauritius. But prospects for the future are unclear if not shaky.Sugar exports to the US have significantly declined due to changes in diet, and it is notclear how the European market, where domestic sugar beet is a serious competitor,will develop. The recent labor scarcity in Mauritius and the general increase in salariesalso affect the labor intensive sugar plantations negatively.
Several scenarios have been calculated that assume drastic changes in internationalsugar demand and domestic factors such as a sugar policy for reasons of traditionrather than profitability. The general result is that it does not make much sense tofurther intensify sugar growing (which already has a very high fertilizer and irrigationinput) for economic and environmental reasons. Sugar refining, however, can be mademore efficient especially by using the large energy potential of bagasse. To prohibit theconversion of sugar land for industrial or urban use is neither economical nor practical,but the present land conversion tax that depends on the fertility of the soil is aninteresting solution.
Future industrial growth is assumed to be mostly driven by export demand. Whenstaying in the same export market dominated by textiles, per capita income could stillgrow significantly to about five times the present GNP/capita by the year 2050.Through a structural change in the economy toward higher value added products andespecially services, however, economic growth could potentially be even more rapid(following the example of the Asian tigers) and result in income levels by 2050 that arehigher than today's European levels. Because of a move toward less polluting and lesswater-intensive industries, this would also be possible from an ecological perspective.Aside from favorable international conditions one domestic prerequisite for such a rapidand sustainable development is a highly skilled labor force.
156

4.3. Role of Tourism
Despite the rapid growth of international tourism on Mauritius over the past years, in1990 foreign exchange earnings from tourism comprised only 15 per cent of the totalexports and an estimated 3.3 per cent of the GDP. But there are also important indirectbenefits from tourism. Mauritius has made a clear choice for high quality expensivehotels and has put an upper limit on the number of hotel rooms. Because of the limitedavailability of attractive beaches there is an inherent conflict between private and publicaccess that requires careful management.
In an international perspective Mauritius is still in an early stage of a hypotheticaltourist resort cycle (see Debbage, 1991) in which very rapid expansion may befollowed by stagnation and even decline because of loss of attractiveness. To avoid anultimately destructive development such as on the Bahamas, Mauritius must makeefforts to regulate and limit the expansion of tourism. The present policy of high costand quantitative limitations (no charter flights are allowed to land in Mauritius) seem tomove in the right direction. But to remain internationally competitive in the future,attention must also be given to water quality in the lagoon, the status of the protectivereefs, the preservation of original landscapes and cultural attractions.
In a way high level selective tourism in international competition turns out to beconducive to environmental protection. It provides a very quick economic feedbackmechanism that cannot be ignored even in short-term politics. Already small signs ofenvironmental destruction and pollution may cause tourists to go to cleaner islanddestinations instead.
4.4. Population and Labor Force
The role of population variables in actual and hypothetical past developments has beendiscussed above. Mauritius now has passed the fertility transition and it cannot beimagined that fertility would return to high premodem levels in the future. Thepopulation presently still grows by 1 per cent per year which is entirely due to themomentum of population growth, i.e. the young age structure of the population andsome mortality improvements. For the future, alternative fertility assumptions areconsidered separately for all three educational groups of women that result in fertilitylevels somewhat above replacement level ("traditional") or below replacement level("modern"). Fertility is also influenced by changing educational compositions for thepopulation. In the traditional case the total population size of Mauritius would increasefrom presently 1.1 million to 1.9 million by 2050; in the "modern" case it would onlyincrease to 1.25 in 2020 and then decline to 1.12 by 2050.
These alternative population sizes and structures also have a sizable impact on thefuture trends in the economic variables of the model. When comparing the twoscenarios, which both have the "boom" assumptions in the economic sector and the"garden" assumptions in the environmental sector, the "modern" assumptions in thepopulation-education sector result in twice as much per capita income in 2050 as theone using the "traditional" assumptions. Hence stagnation in the social developmentthat brings lower fertility and higher productivity through better education would haveserious negative effects even under otherwise very favorable economic conditions.
157

Size and quality of the labor force are of special concern. For the past two decades theWorld Bank has identified the Mauritian labor force, including an increasing number ofeducated women, as "the engine of economic growth". If Mauritius is to be successfulin expanding into new markets requiring higher technology, the quality of the laborforce once again will be the key for success. For this reason the economicdevelopment plans of the government put high emphasis on further technical training ofthe labor force. As long as the local expertise is flexible enough to adjust to newtechnologies, investment into human capital will be one of the most effective and mostrobust strategies for sustainable economic development in Mauritius.
4.5. Dependence on the Global Economy and the Global Environment
While Mauritius is rather isolated geographically, it is heavily interwoven into the globaleconomy. The overwhelming dependence on export earnings and imports of food andmost other consumer goods has a long tradition. A change of this situation does notseem to be possible without a significant loss in welfare. Especially with a furtherdiversification of export and import markets that makes Mauritius less vulnerable topossible crises in different world regions, the benefits of such an internationalorientation outweigh the risks by far. But, as indicated for the question of food self-sufficiency above, a maximum of flexibility in the change of markets and necessaryimports is an important component of resilient development strategies.
In the case of the environment, Mauritius is hardly affected by any transport ofpollutants from other countries, but it would certainly be affected by changes in theglobal climate. The Mauritian contribution to global warming is negligible not onlybecause of its small population but because of one of the lowest CO2 emissions perGNP in the world. Present general circulation models are not yet detailed enough tostudy the impact of a double CO2 climate on rainfall and temperature, given theMauritian topography. For the region the various models tend to show a temperatureincrease of 2-3 degrees Celsius and also some increase in precipitation in the alreadywet months. Effects of a possible increase in the sea level depends among others onthe question whether the coral reefs are healthy enough to grow with the same speed.Probably the most relevant question for Mauritius is the future of cyclones, sinceMauritius is situated in the usual path of cyclones through the Indian ocean. If theintensity of cyclones increased, this would be destructive; if their paths changed itmight be advantageous; and if the frequency increased with lower intensity, this mayalso be good because of more rain.
4.6. Conclusion: Towards a Prosperous Garden Island
The scenario that combines all the "good" assumptions in the three segments of thePDE-Mauritius ("modern" for the population sector, "boom" for the economy, and"garden" for the environment) can be called the "Prosperous Garden Island Scenario".This scenario points the direction towards sustainable development. It is called "gardenisland" because Mauritius has little original nature left and already has a largely man-made environment. For this reason the metaphor of a man-made well-kept garden isseen as appropriate for Mauritius. It also reflects the high population density and neednot be in conflict with economic growth and prosperity. In fact some wealth is
158
necessary to sustain the garden. It also requires wise environmental legislation, goodinfrastructure as well as the skills and willingness of the population to take good care ofthe garden. In most of these aspects Mauritius presently seems to be on the righttrack.
5. Past Policies: What Triggered the Rapid Fertility Decline?
While most of the previous discussions were concerned with the effects of populationparameters on the rest of the system, we will now focus on the determinants of thesedemographic parameters. In specific, we will look at fertility and again study theremarkable Mauritian experience. The total fertility rate in Mauritius declined from alevel of 6.2 in 1963 to only 3.2 in 1972. This decline happened essentially parallelwithin all ethnic groups. This is assumed to be one of the most rapid fertility declines inthe world. In this section, an attempt is made to identify the most important factors thatcontributed to this drastic change in reproductive patterns.
5.1. Social and Economic Development before the Fertility Decline
A most remarkable feature of the Mauritian fertility decline is that it happened in theabsence of any economic growth. Per capita income was very low and stagnant duringthe 1950s and 1960s (see also Figure 6). This contradicts the popular view thateconomic development is the major reason for a decline in desired family size andconsequently fertility. Figure 8, however, shows that the relationship betweeneconomic growth and fertility decline is varied across developing countries. In somecases such as Mauritius, Bangladesh and to some extent Thailand, the fertility declinepreceded economic growth. The historical fertility transitions of some Europeancountries (e.g. Finland) also showed this pattern. In a number of countries fertilitydeclined simultaneously with increasing income, and in a third group (mostly Arabcountries) income grew without much fertility decline. This comparison shows that onan empirical basis, it is hard to argue that income growth is an essential determinant ofdeclining fertility. Similar diversity of the fertility-income relationship is also shown atindividual levels (such as in the World Fertility Survey, Cleland and Scott, 1987).
159

2 -
0
Algeria
Botswana
Honduras
500
Egypt
Kenya
Brazil
1,000
Syrian Arab Rep.
Ghana
Domin. Rep.
1.500GNP/CAP
Tunisia
Mauritius
Colombia
2,000
Bangladesh
Thailand
Ecuador
2.500
Jordan
Mexico
Peru
3.000
Malaysia
El Salvador
Figure 8. Relationship between per capita income and fertility in a sample ofdeveloping countries 1970-1990 and in Mauritius 1950-1990.
In Mauritius, income had not grown in the years prior to the onset of the fertility decline,but social development and especially education were well advanced by this time.Already in 1960 universal primary education had been nearly achieved in Mauritius andaspirations for secondary education for girls almost equaled that for boys. This higheducational status of the younger generation and especially of younger women comesout as probably the single most important factor in explaining the Mauritian fertilitydecline. This assumed effect of female education on fertility can be seen as operatingthrough three different mechanisms: first, it increases the age at marriage, and indeedit could be shown that about half of the steep fertility decline in Mauritius is attributableto changing marriage patterns; second, education is likely to change the value systemby putting more emphasis on the life opportunities of children and women than on alarge number of children; finally, there is evidence that education increases theacceptance of family planning methods by women and increases the relative status ofa woman within the family to carry through her own (usually lower) desired family size.
In sharp contrast to the non-relationship between fertility and income in Figure 8,Figure 9 shows that the strong association between basic female education and theonset of fertility transition that is observed for Mauritius is very common in the rest ofthe world as well. As the sample of twenty other developing nations shows, thereseems to be some kind of threshold at the point when about half of society's womencan read and write. Since educational efforts are usually rather recent, this means that
160
in practice most younger women are literate, while illiteracy is still high among theelderly. Only in some Arab countries is this threshold not clearly visible.
The literature on the relationship between fertility and education as well as betweenfertility and income is extremely large. No attempt was made to review it here. It shouldonly be pointed out that Mauritius is just one additional strong piece of evidencesupporting the already overwhelming evidence (especially on the micro-level) thatbasic education, especially of women, is an extremely important factor in explaining theonset of fertility decline, whereas increasing income had no visible direct role inMauritius.
5.2. The Role of Ethnic and Religious Factors
In the early 1960s the scientific reports by Titmuss (Titmuss and Abel-Smith, 1968)and Meade (1961) on the future of Mauritius had both identified rapid population growthas the major obstacle to development. These scientific studies had an importantinfluence on policy makers and also on the general public in Mauritius to understandthat—to use Malthusian language—the island would have to suffer from a positivecheck (i.e. increased mortality) or at least severe poverty, if no preventive check (i.e.declining fertility) was found.
The influential religious communities, although traditionally pronatalist (RomanCatholic, Hindu, Muslim) found it difficult to oppose this argument, especially on asmall island where spatial limitations were clearly visible. As to the Catholic church,which was most influential on Mauritius, it is largely the merit of one individual, theFrench Jesuit Lestapis, to convince Catholic authorities and politicians that the churchdoctrine was not against family planning in general but only against certain methods.As a consequence, Catholics did not block the introduction of government supportedfamily planning programs, but established their own family planning organization whichonly propagated natural methods and also received government support.
161
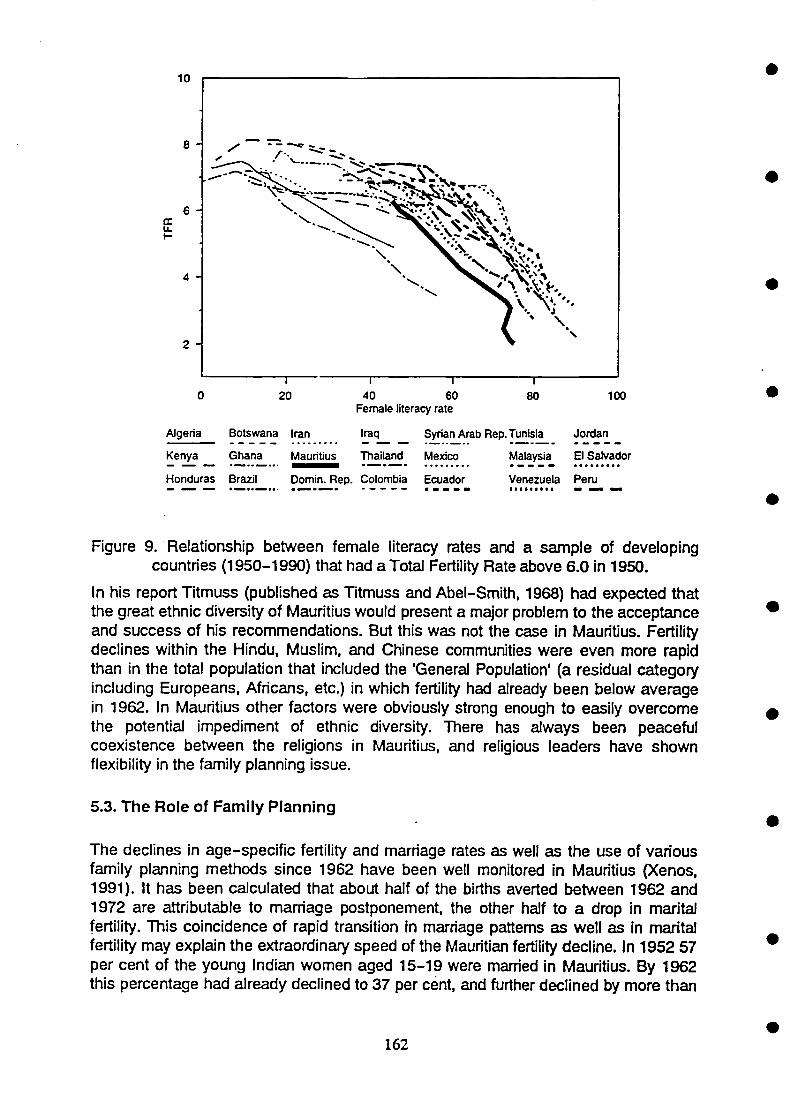
10
8 -
6 -
4 -
2 -
s / •> ~
20 40 60Female literacy rate
80 100
Algeria Botswana Iran Iraq Syrian Arab Rep. Tunisia Jordan
Ghana Mauritius Thailand Mexico Malaysia El Salvador
Domin. Rep. Colombia Ecuador Venezuela Peru
Kenya
Honduras Brazil
Figure 9. Relationship between female literacy rates and a sample of developingcountries (1950-1990) that had a Total Fertility Rate above 6.0 in 1950.
In his report Titmuss (published as Titmuss and Abel-Smith, 1968) had expected thatthe great ethnic diversity of Mauritius would present a major problem to the acceptanceand success of his recommendations. But this was not the case in Mauritius. Fertilitydeclines within the Hindu, Muslim, and Chinese communities were even more rapidthan in the total population that included the "General Population' (a residual categoryincluding Europeans, Africans, etc.) in which fertility had already been below averagein 1962. In Mauritius other factors were obviously strong enough to easily overcomethe potential impediment of ethnic diversity. There has always been peacefulcoexistence between the religions in Mauritius, and religious leaders have shownflexibility in the family planning issue.
5.3. The Role of Family Planning
The declines in age-specific fertility and marriage rates as well as the use of variousfamily planning methods since 1962 have been well monitored in Mauritius (Xenos,1991). It has been calculated that about half of the births averted between 1962 and1972 are attributable to marriage postponement, the other half to a drop in maritalfertility. This coincidence of rapid transition in marriage patterns as well as in maritalfertility may explain the extraordinary speed of the Mauritian fertility decline. In 1952 57per cent of the young Indian women aged 15-19 were married in Mauritius. By 1962this percentage had already declined to 37 per cent, and further declined by more than
162

half to 15 per cent in 1972. In the age group 20-24 the percentage fell from 85 per centin 1962 to 58 per cent in 1972. This trend towards increasing age at marriage wasuniversal among all ethnic groups.
The decline in marital fertility was strongest at the higher age groups, a typical patternfor fertility transition. In the age group 30-34 the birth rate declined from 0.256 in 1963to only 0.128 in 1972. For all age groups above 35 the rates more than halved overthese few years. The "Index of Family Limitation" increased threefold over this period.This is directly related to the strong family planning efforts in both propagating smallerfamilies and providing efficient contraceptive methods, together with village level healthcare and counseling.
Although the decision to launch strong family planning efforts was based on a broadnational consensus and saw active government support, the external financialcontributions of IPPF and UNFPA were also instrumental for the successfulimplementation on a larger scale. The number of new acceptors to the two Mauritianfamily planning organizations grew very rapidly during the late 1960s and peakedaround 1970-72. Surveys showed that contraceptive use had reached 46 per cent in1975 (30 per cent "supplied" and 16 per cent "natural" methods) and 74 per cent in1985 (44 per cent "supplied" and 30 per cent "natural"). In the early 1970s the densityof family planning clinics was one of the highest in the world.
5.4. Conclusion
Based on extensive surveys of historical and modem fertility transitions Ansley Coale(1974) specified three preconditions for the introduction of deliberate family limitation,i.e. fertility control dependent upon the number of children already bom. All three ofthese conditions find strong support from the study of the Mauritian fertility transition.
1. "Fertility must be within the calculus of conscious choice." This refers to a mentaland cultural transition that seems to be intimately tied to education, especiallyfemale education. Also the fact that Mauritius has a minority group of Frenchorigin with already lower fertility in 1962 may have facilitated a kind of culturaldiffusion process on this issue similar to that in Europe at the beginning of thiscentury.
2. "Reduced fertility must be advantageous." It was both on the macro and microlevels that Mauritians understood that lower fertility was advantageous to them.On the macro level the scientific reports by Titmuss and Meade seem to havebeen of crucial importance. On the level of families it seems to have been therather high cost of education together with the high desirability of education as aprerequisite for a career that made some difference. Also the early introduction ofsocial policies to support the disabled and elderly made parents less dependenton their children.
3. "Effective techniques of fertility reduction must be available." The widedistribution of modem contraceptive methods and especially the pill throughfamily planning organizations certainly facilitated the rapidity of the fertilitydecline. Both international aid and good local organization were also instrumentaland show that motivation to limit family size need not entirely rely on the supply
163

of modern methods. Without such methods, however, fertility would most likelybe higher in Mauritius today.
6. Policy Priorities for the Future: Investment in Human Capital
There seem to be two most important policy issues which become apparent whenstudying the history and the future of Mauritius under a truly holistic perspective, thatmay be partly generalized to other situations.
6.1. Farsightedness and Accountability
In Mauritian history, things went well when the persons in charge had a longer timehorizon; irreparable damage was caused when immediate advantages were the onlyobjective. For example, the scientific studies on Mauritius in the 1960s, showing that achange was necessary, had a long time horizon and were fortunately heard byresponsible politicians, and understood on individual and societal levels. Such flexibilityand farsightedness was the basis for the Mauritian success story. Similar foresight isbeing shown now in the first steps being taken by Mauritian authorities towardssustainable development which cares for the environmental heritage.
A comparison of Mauritius to other countries in the African region since the 1960sshows that one of the major non-material differences is that during the whole period,Mauritius had a truly democratic system. Despite the extreme ethnic heterogeneity thissystem managed to settle conflicts peacefully and develop a sophisticated balance ofpower. Although this dimension is beyond our quantitative model, it comes out asnumber one under a holistic perspective in the historical analysis.
Many things could have gone wrong in Mauritian politics that could have inhibiteddevelopment or even ruined the island. Desperate economic conditions and extremelyhigh unemployment—in 1983 still half of the male youth cohort born around 1960 wasunemployed—could have easily started ethnic tension and conflict over continuingsevere social inequalities.
There are several explanations why the peaceful coexistence of very diverse ethnicgroups that differ not only by language, religion and skin color but to a large extent alsoby social class, was possible in Mauritius while similar settings cause severedisruptions and civil war in other parts of the world. One reason may lie in the fact thatno group can claim to be the original population of the island because everyonedescends from immigrants. Another reason is that under the British rule, 1810-1967,the very influential and rich Franco-Mauritian estate owners were allowed to keep theirland and language but not political power, and they learned to find other mechanismsto serve their interests. Finally, after independence the first prime minister, SirRamgoolam, established an important Mauritian tradition of ruling by consensus byinviting the conservative party to share power although his Independence Party had asufficient majority in parliament.
Despite many political squabbles, in most issues of real importance for Mauritius,farsightedness was paired with personal accountability. Decision makers who areaccountable to the majority of the population, including families and the children who
164

represent the future generation, and who do not primarily serve their own interests orthose of a subgroup, seem to be a basic prerequisite for sustainable development.
The political accountability in Mauritius is extended to the individual level where it isunderstood that one is accountable for one's own choices, including the number ofchildren, education, private business and the environment. This may be seen as aprerequisite for the demographic transition as well as for modern economicdevelopment in balance with the natural environment. This empowerment of the peoplethemselves seems to be the major underlying reason for the Mauritian success story.The people can read, they are informed about most critical issues, and they haveshown that they can take an active role in determining their country's fate.
6.2. Investment in Human Skills and the Status of Women
The above brings us to the second important policy lesson, the crucial importance ofthe human resource in sustainable development. The story of Mauritius tells us that thefirst policy priority in international efforts for sustainable development should befocusing on the development of people or what economists call human capital. This isthe "ultimate resource" under a longer time horizon but in terms of skills (and attitudes)rather than sheer quantity. It is not the starving and unskilled desperate people whobring about progress, but those who have the skills and the possibility to thinkcreatively and care about others at all different levels. The Mauritian experiencesuggests that education is the key, especially basic education of broad segments ofthe population rather than of elites in an otherwise illiterate society.
More specifically, it is the basic education of women and their status in society thatseems to have a very important role in the transition to lower fertility. It may also beconducive to sustainable development through increased female activity and greaterweight of women in decision making together with their supposed tendency to caremore about the future of their children and harmony with nature than aboutunnecessary consumption and technology. On this last presumption, however, littleempirical analysis has been done so far. But the gender dimension at familial andsocietal levels certainly needs more attention in the context of sustainabledevelopment.
Provision of family planning services, one specific and heatedly-debated policy issue,is one of the factors that is conducive to the fertility transition and is desirable not onlyfor macro-level considerations but also for facilitating individual choice and personallife course planning. Family planning, however, should not be singled out of the contextof female status and health care, and pushed as an independent "engineering"solution. This does not work and can be counterproductive. Instead it should be viewedas one aspect of empowering women, men and families to more actively plan theirlives and those of their society. It is part of the investment in the human resource.
With respect to the priorities in international development policies, this suggests aradical change of emphasis. Less attention should be given to large-scaletechnological projects that often prove to be inappropriately designed for the specificlocal conditions and may even turn out to be harmful to the environment and the socialfabric. In contrast, investment into the human resource, into education, health andfamily planning can hardly be wrong, but is likely to result ¡n immeasurable and far-
165

reaching benefits to individuals, communities and nations. It is a very robust policy thatmay only show modest immediate results, but greatly pays off in the longer run.
References
Cleland, J. and C. Scott, eds. 1987. The World Fertility Survey: An Assessment. NewYork: Oxford University Press.
Coale, A.. 1974. The demographic transition. In UN, The Population Debate,Dimensions and Perspectives: Papers of the World Population Conference.Bucharest, 347-56
Coale, A J . and E.M. Hoover. 1958. Population Growth and Economic Development inLow-Income Countries. Princeton, New Jersey: Princeton University Press.
Debbage, K.G. 1991. Tourist destination cycles and sustainable development: Acomparative analysis of the Bahamas and Mauritius. In W. Lutz and F.L Toth, eds.Population, Economy, and Environment in Mauritius. CP-91-01. Laxenburg,Austria: International Institute for Applied Systems Analysis, 255-70
Keyfitz, N. 1985. Applied Mathematical Demography. 2nd Edition. New York:Springer-Verlag.
King, J. 1991. The ECCO approach to planning sustainable development. In AJ .Gilbert and L.C. Braat, eds. Modelling for Population and SustainableDevelopment. London: Routledge, 18-35.
Meade, J.E. 1961. The Economic and Social Structure of Mauritius. London: FrankCass and Company.
Rogers, A. and F. Willekens, eds. 1986. Migration and Settlement: A MultiregionalComparative Study. Dordrecht, the Netherlands: D. Reidel Publishing Company.
Titmuss, R. and B. Abel-Smith. 1968. Social Policies and Population Growth inMauritius. London: Frank Cass and Company.
U.S. National Academy of Sciences. 1986. Population Growth and EconomicDevelopment: Policy Questions. Washington, D.C.: National Academy Press.
Xenos, C. 1991. Family planning and fertility change in Mauritius. In W. Lutz and F.L.Toth, eds. Population, Economy, and Environment in Mauritius. CP-91-01.Laxenburg, Austria: International Institute for Applied Systems Analysis, 67-85.
166

CHAPTER 8
METHODES ET ANALYSES DE LA RELATIONPOPULATION-MILIEUX NATURELS DANS LES
CAMPAGNES: LE PROGRAMME DYPEN EN TUNISIE1
Michel R. Picouet(laboratoire Population-Environnement, Université de Provence ORSTOM, France)
Dans les pays du Sud: la croissance démographique est récente et rapide, le progréssanitaire ou technique, venu d'ailleurs, n'est pas le produit direct de l'évolution dessociétés et les effets de sa diffusion se sont exercés autant sur les modes deproduction agricole que sur l'évolution des sociétés. L'emprise agricole s'y est accruedans des conditions souvent désastreuses (surexploitation des terres anciennementcultivées, mise en cultures de terres à risques, surutilisation des sytèmes d'irrigation,diminution des espaces forestiers). Les paysages changent accompagnant lesmutations societales dans des évolutions où peu à peu les modèles de reproductionfamiliale, de comportements alimentaires et d'habitat, de transmission du savoirtechnique et culturel se transforment. Ces évolutions par leur rapidité, par l'intensité deleur diffusion, impliquent des conséquences sur les équilibres naturels qui sontaujourd'hui très mal connues. La formalisation intégrée de l'ensemble de cesévolutions n'est pas en effet des plus simples: comment intégrer un facteur immédiatet aggravant (la croissance de population) et ce qui relève de facteurs de fond (modèlede croissance économique, pauvreté et problèmes de survie, inégalités Nord Sud...)qui sont difficiles et longs à changer, comment les relier aux facteurs écologiques? Seposent un problème de niveau de l'observation, d'échelles et celui de la nature duquestionnement ou si l'on préfère celui de l'enchaînement des questions.
Les milieux naturels ne sont, en effet, uniformes ni dans l'espace, ni dans le temps: ilsont une certaine hétérogénéité et une variabilité propre et ils ne peuvent être étudiésque par rapport au type d'organisme étudié: c'est un problème d'échelle. En effet, il y aautant de descriptions d'écosystèmes que d'échelles de cette description. Par ailleurs,c'est du fonctionnement du système societal que dépendent les actions exercées surles systèmes écologiques ainsi que de la façon dont les êtres humains perçoiventl'environnement et de la valeur qu'ils lui accordent (Galopin, et al., 1989). De cesmicro-décisions au niveau local dépendent nombre de changements globaux. Cettevariabilité sociale peut être courte et imprévisible. Comment concilier dansl'observation cette hétérogénéité et cette variabilité? Une première difficulté surgit: lesétats observés sont surtout liés aux états antérieurs de l'environnement socio-culturelet économique, mais également aux état antérieurs du milieu. Le niveau connaissancede ces états sera rarement homogène. La seconde difficulté n'est pas moinsimportante: pour autant que son choix soit judicieux, quelles causes peut-on attribuerà la variation d'un indicateur donné. Chaque série de questions en entraine denouvelles. C'est ce type de problèmes qui nous a été donnés de percevoir dansl'expérience que nous menons dans le milieu rural de la Tunisie.
167

1. La formalisation théorique: "populations rurales et milieuxnaturels"
1.1. Les relations villes-campagnes
La campagne a fonctionné longtemps en régime autarcique: autosubsistance,production fonction de la population habitant sur le site ..., aujourd'hui elle estorganisée pour produire au maximun et exporter sa production vers les villes... ellenourrit la ville, elle ne peut plus subsister seule... la technologie vient de la ville. Celle-ci ne produit rien sinon de l'information, elle transforme les produits (énergie, mines,denrées alimentaires), apporte aux campagnes les moyens de produire plus. Il y aintégration de sous-systémes complémentaires, dissemblables, mais dépendants l'unde l'autre.
La boucle d'assistance technique qui en découle, repose sur des structures inventéespar la ville et introduites dans les campagnes suivant une stratégie qui se fonde sur undéveloppement national et, dont la répartition régionale apparaît comme un sousproduit des grands agrégats nationaux. Schématiquement cette stratégie repose surquatre grands champs de décision:
- la politique agricole: production et commercialisation des ressources alimentairestirées de la terre, gestion du patrimoine foncier,
- l'aménagement du territoire et les grands travaux d'infrastructure: voies decommunication, barrages, irrigation, création de nouveaux périmètres agricoles..,
- les politiques de défense de l'environnement: mise en défense, reforestération,lutte contre l'érosion, l'aridité, et bientôt la préservation des ressources phyto-écologiques, de la bio-diversité etc ...
- enfin la politique démographique et de santé: maîtrise de la descendance, luttecontre la morbidité, politiques migratoires et de distribution spatiale etc ...
L'ensemble de ces interventions peuvent conduire à une réduction de la diversificationdes productions au niveau local avec comme conséquences une fragilité économiqueplus grande des économies régionales (plus grande sensibilité des productionsagricoles au prix des marchés) et une fragilité écologique grandissante (monochargesur les milieux naturels... type d'intrants chimiques ou aménagementsmonofonctionnels). Suivant la logique des systèmes, les campagnes contrôlées dansleur évolution démo-économique par l'extérieur sont soumises à de fortes fluctuationsquantitatives, aggravées par les aléas de la production (conditions climatiques etpluviosité). Ainsi, les populations locales se trouvent subir trois types de pressions:
- démographiques (dynamique de population spécifique, mais également influencedes niveaux différentiels de population avec d'autres régions, ou pressionsdirectes par l'apport de population ..).
- économiques (produire plus ...)
- écologiques: dégradation, aléas climatiques...
168

1.2. La définition d'un "champ de référence écologique"
Outre les changements dans la gestion et l'organisation des exploitations agricoles, lesréponses des populations à ces pressions sont sociales et familiales, en particulier lerecours à l'émigration et ou l'adaptation des comportements matrimoniaux. Définir unchamp de référence implique donc la prise en compte de toutes ses composantes:population - organisation sociale, économique et culturelle - environnement interne etexterne - technologie. Le concept de "champ de référence écologique" définit lesrelations entre les notions de systèmes écologiques et les notions d'anthropisation auniveau d'un ensemble campagnes (nature exploitée) et villes (milieux artificiels conçusautour des besoins sociaux). Les diverses variables de ce champ peuvent être la baseexplicative de relations entre les différentes composantes et leurs propriétés. Parexemple, le nombre des enfants, la taille et la composition des familles, l'existence ounon de membres de la famille en émigration... peuvent être mis en relation avec laforme de la production agricole (augmentation du cheptel, des surfaces cultivées) ouavec les changements dans les techniques d'exploitation (introduction d'intrantschimiques ou mécaniques ou de nouvelles espèces végétales), saisir enfin l'impact dela commercialisation des produits de l'exploitation etc ...(Picouet, 1993).
2. Les contextes de l'expérience en Tunisie
2.1. Le contexte scientifique
L'approche scientifique est pluridisciplinaire. Il ne pouvait en être autrement en raisonmême de la diversité du champ à observen état de l'évolution des milieux naturels:sols, ressources en eau, couvert végétal, situation des modes d'utilisation des terres,dynamique démographique et sociale etc ... L'étude est menée par un collectif derecherches groupant trois Instituts Tunisiens: l'Institut Sylvo Pastorale de Tabarka(ISPT), l'Institut des Régions Arides de Médenine (IRA), le Commissariat Régional deDéveloppement Agricole de Siliana (CRDA), ainsi que le Laboratoire PopulationEnvironnement (LPE) de l'Université de Provence/Orstom et de l'ORSTOM-Tunisie.Le protocole de recherches s'est ainsi établi tout d'abord sur la base d'unquestionnement partagé entre toutes les disciplines sur les relations entre lacroissance de population, les activités humaines, ici essentiellement agro-pastoraleset l'évolution du milieu naturel, ensuite sur le choix dés le départ d'une approche enmodes synchrone et diachrone (analyse longitudinale et transversale) avec l'utilisationsimultanée de la photo-interprétation et de l'imagerie satellelitaire, des analyses dumilieu naturel (sols, végétation) et des enquêtes auprès des ménages (aspectsagronomiques, démographiques et socio-économiques).
2.2. Le contexte démographique
Le taux d'accroissement de la population du pays est actuellement de 2,5 pour centpar an, il demeure plus rapide dans les campagnes de l'ordre de 2,7 à 3 pour cent.Dans les trois zones choisies le taux d'accroissement est cependant plus faible de
169

l'ordre de 1,6 à 1,8 pour cent, en raison principalement de la ponction opérée par lesphénomènes migratoires internes et externes et de l'élévation de l'âge au mariage.L'indice synthétique de fécondité est de 4,72 enfants par femme en 1984 pour laTunisie et de 3,34 en 1991, soit une baisse conséquente qui reste cependant trèsdiverse suivant les régions. Dans la zone Nord il est passé au cours de la mêmepériode de 5,3 à 2,8 enfants par femme, dans le Centre de 4,8 à 3,3 et dans le Sud ilse maintient en 1989 à 4,1 enfants par femme. Dans l'ensemble la parité des femmesen fin de procréation reste plus élevée que la moyenne nationale, autour de 7,3 pour leSud contre 6,5 pour le pays et 6,9 pour les campagnes. La baisse de la fécondité estainsi générale, mais elle semble aujourd'hui marquer le pas. Néanmoins on peutconstater dans certaines régions rurales une tendance au retard à l'âge au mariagenotamment pour les femmes: une tendance qui s'est peu à peu affirmée depuis lesannées 1970: de 26,4 ans pour les hommes et 16,6 pour les femmes en 1966, cet âgeétait de 27,7 ans pour les hommes et 24,2 pour les femmes en 1984.
2.3. Caractéristiques des campagnes (d'après Floret, Khattali, Le Roch,Pontanier, 1989)
- Les aléas de la pluviosité sont loin d'être complètement maîtrisés. Pour luttercontre l'aridité et améliorer les potentialités agricoles l'arido-culture, l'élevage,l'irrigation ont été développées... ces pratiques liées directement avec ladynamique de population, ont induit dans la majorité de ces interventions unrisque de dégradation et de désertisation. L'augmentation de la population et desa sédentarisation dans les villages offrant écoles, dispensaires etc. ...qui sefixent sur les piémonts des montagnes pour bénéficier du ruissellement et àproximité des zones inondables pour la pratique des cultures vivrières dedécrue... a profondément transformé les paysages, en particulier dans les zonesles plus arides. Ces changements dans le mode d'habitat se sont accompagnésde modifications dans les systèmes fonciers et l'utilisation qualitative etquantitative des ressources naturelles avec une emprise agricole accrue.
- Les modifications des systèmes écologiques: défrichement des steppes etcroissance de l'érosion hydrique sur les piemonts, céréaliculture des steppes dezone sableuse réduisant les zones traditionnelles de pâturages... se sonttraduites par le lessivage des sols plus intensif et la diminution de la capacitéd'absortion les eaux de pluie, aggravant le risque d'inondations localisées. Lapression des animaux domestiques s'accentue sur les steppes à sols superficielsqui sont peu aptes à la mise en culture. Il y a une diminution des steppespastorales en bon état et de plus en plus atteintes de seuils au delà desquels lespossibilités de reconstitution du couvert végétal sont très faibles.
- Dans bien des cas, le prélèvement dépasse la capacité de renouvellement et lesprocessus de désertisation sont engagés, le retour d'années plus favorables enpluviosité, ne permet toujours pas la remontée biologique du milieu naturel,(irréversibilité des processus de dégradation). Ainsi, face au faible dynamismebiologique du milieu (vitesse de cicatrisation de la végétation, importance desphénomènes de régénération), la baisse de productivité biologique peut êtreirréversible pendant plusieurs générations, même avec des mesures deprotection et de mise en défense. Les interventions pour lutter contre ces
170

évolutions ont été nombreuses, pas forcément avec le même succès maissuffisamment efficaces dans certaines régions pour voir se ralentir les processusde dégradation, assister même à des remontées biologiques significatives. Cesinterventions ont porté sur une utilisation des conditions favorables du milieu pan
- l'adaptabilité des espèces à la variabilité temporelle des précipitations,
- le maintien de la diversité des races biologiques,
- l'utilisation de la plasticité des races locales d'animaux domestiques (les ovins derace barbarme peuvent supporter des pertes de poids considérables),
- la plantation des arbustes fourragers,
- l'intégration des zones irriguées et les parcours,
- la récupération les eaux de ruissellement par des petits barrages successifs(jessours, tabias) et des lacs collinaires, les techniques traditionnelles deconcentration des eaux sont en général efficaces,
- Le problème majeur est l'offre décroissante de main d'oeuvre agricole.Paradoxalement en période de croissance démographique celle-ci se raréfie etl'entretien des terres devient aléatoire: manque d'hommes, perte de l'expérienceacquise au fil du temps, en raison de l'éducation qui éloigne la population activedes métiers manuels et de la recherche d'un revenu monétaire... qui accentuentles tendances à l'émigration. En situation de pression démographique et desbesoins accrus des populations (en particulier urbaines), se fait jour unetendance à l'intensification agricole. Autrement dit, l'étendue des terrescultivables et l'état des techniques étant donnés, les agriculteurs se résignent àrecourir, de période ne période, à une quantité accrue d'intrants (engrais,mécanisation) par unité de production pour augmenter les rendements et pallierdans une certaine mesure la baisse de la main d'oeuvre agricole.
3. La problématique générale
3.1. Les objectifs
Dans ce contexte, les questions portaient au départ sur l'effet possible de la migration,elle même soutenue par une pression démographique forte, sur la dégradation rapideobservée des milieux naturels et l'avenir de ces populations rurales. Questions qui sesont résumées dans les objectifs suivants:
- décrire les états de dégradation des milieux naturels et en identifier les causesimmédiates. En parallèle, analyser le dynamisme démographique et social enfonction de l'occupation des terres et de leur utilisation, avec comme objectif despropositions d'action de mise en valeur et de développement régional,
- étudier les processus d'adaptation des populations à leur environnement, enparticulier saisir l'impact des déplacements sur le milieu naturel et apprécierl'influence des évolutions historiques sur les systèmes de production agro-pastoraux, en insistant sur le degré d'artificilisation des milieux,
171

- avancer des propositions pour de nouveaux équilibres environnement-populationdans le cadre d'un schéma prospectif à moyen terme allant dans le sens de lareconstruction des milieux dégradés.
Qui se structurent en trois types d'analyses:
- la première axée sur l'évaluation des problèmes environnementaux face à lacroissance actuelle de la population, il s'agit ici de faire un état de la situation,d'identifier les facteurs déterminants de déséquilibres et de ruptures et d'isoler lescontraintes propres aux écosystèmes de chaque zone,
- la seconde a trait à l'étude des relations entre les évolutions passées et lespotentiels de croissance actuels dans une approche diachronique desphénomènes écologiques,
- la troisième, prospective, devrait permettre de différencier les tendances nonmaîtrisables des évolutions futures de celles qui peuvent l'être, et de construiredes modèles d'évolution prévisibles sur la relation population-milieux naturels.
Comment concilier dans toutes ces approches les observations écologiques et lesanalyses socio-démographiques de l'évolution des populations?
3.2. Une démarche comparative pour le choix des zones
Un premier constat: la charge humaine est fonction du bio-climat, à 50 mm de pluie lacharge est en effet beaucoup plus nocive et beaucoup plus difficile à gérer qu'à 1000mm de pluie. La capacité de comparaison de l'étude dépend donc étroitement descritères de choix des zones d'étude. Cela imposait de retenir des zones:
- à gradiant bio-climatique et d'aridité différente,
- de conditions de peuplements spécifiques (mode d'occupation et d'utilisation desterres),
- correspondant à une ou plusieurs unités administratives, (Imadat)
Ces critères ont conduit à choisir trois régions rurales de la Tunisie continental. Al'intérieur de celles-ci, les zones d'études retenues tiennent compte d'échellesd'analyses différentes, qui permettent d'intégrer des ensembles de micro-zonesreprésentant un tapis végétal homogène pour les milieux naturels et une ouplusieurs unités administratives pour les enquêtes sur la population. En raisondes modes d'occupation et de l'utilisation du milieu naturel par l'homme, d'unedynamique démographique vivace, les trois régions sont particulièrementtouchées par les phénomènes de dégradation des sols et de la végétation:
- la région du Nord-Ouest comprend principalement la Kroumirie et les Mogodscouverte ici en grande partie par une forêt de chêne liège, de type mésophile, à lapluviométrie abondante et dont le dynamisme du tapis végétal est intimement liéà l'activité humaine (pâturages en forêt, défriches pour cultures, arrachage pourcharbon de bois, vieillissement de la forêt). C'est une région à forte densité depopulation connaissant une émigration forte, mais récente, liée autant à la fortecroissance démographique de ces dernières décennies qu'à la déstructurationdes activités agricoles traditionnelles. Le poids démographique y est encoreimportant en rupture avec les potentialités économiques de la région. Deux zonesretenues: Ain Snoussi et Ain Sobah,
172
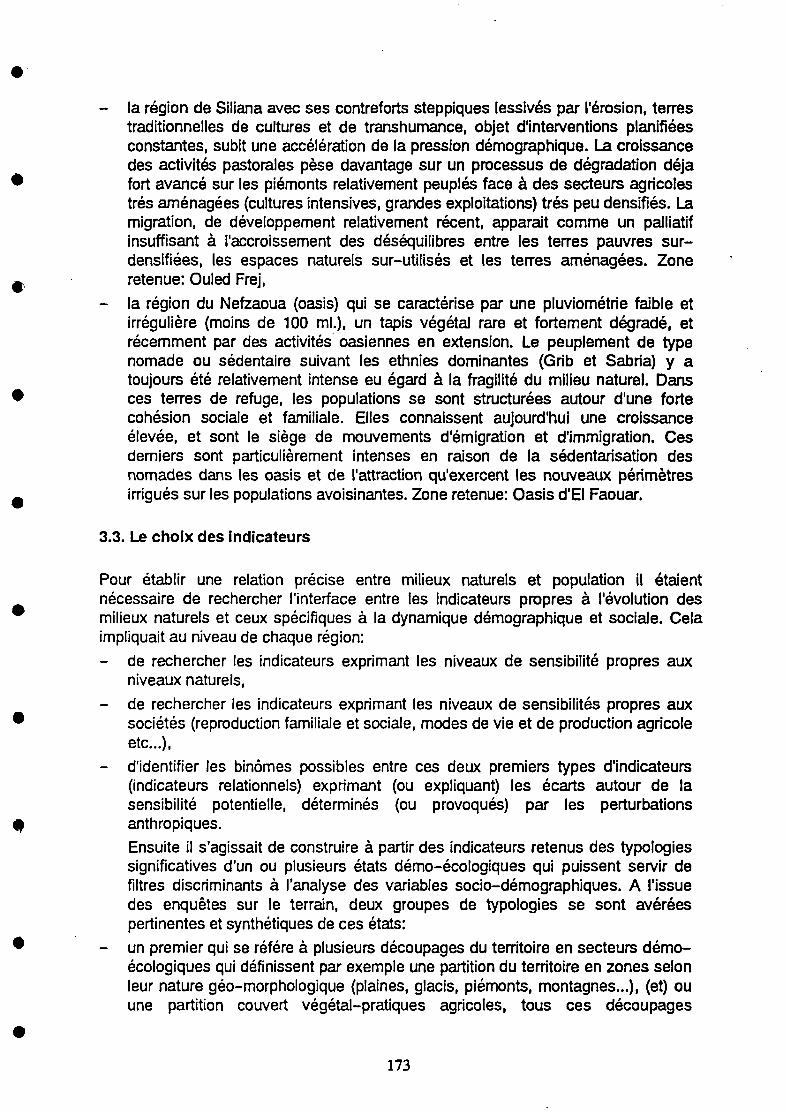
- la région de Siliana avec ses contreforts steppiques lessivés par l'érosion, terrestraditionnelles de cultures et de transhumance, objet d'interventions planifiéesconstantes, subit une accélération de la pression démographique. La croissancedes activités pastorales pèse davantage sur un processus de dégradation déjàfort avancé sur les piémonts relativement peuplés face à des secteurs agricolestrès aménagées (cultures intensives, grandes exploitations) très peu densifiés. Lamigration, de développement relativement récent, apparaît comme un palliatifinsuffisant à l'accroissement des déséquilibres entre les terres pauvres sur-densifiées, les espaces naturels sur-utilisés et les terres aménagées. Zoneretenue: Ouled Frej,
- la région du Nefzaoua (oasis) qui se caractérise par une pluviométrie faible etirrégulière (moins de 100 ml.), un tapis végétal rare et fortement dégradé, etrécemment par des activités oasiennes en extension. Le peuplement de typenomade ou sédentaire suivant les ethnies dominantes (Grib et Sabría) y atoujours été relativement intense eu égard à la fragilité du milieu naturel. Dansces terres de refuge, les populations se sont structurées autour d'une fortecohésion sociale et familiale. Elles connaissent aujourd'hui une croissanceélevée, et sont le siège de mouvements d'émigration et d'immigration. Cesderniers sont particulièrement intenses en raison de la sédentarisation desnomades dans les oasis et de l'attraction qu'exercent les nouveaux périmètresirrigués sur les populations avoisinantes. Zone retenue: Oasis d'EI Faouar.
3.3. Le choix des indicateurs
Pour établir une relation précise entre milieux naturels et population il étaientnécessaire de rechercher l'interface entre les indicateurs propres à l'évolution desmilieux naturels et ceux spécifiques à la dynamique démographique et sociale. Celaimpliquait au niveau de chaque région:
- de rechercher les indicateurs exprimant les niveaux de sensibilité propres auxniveaux naturels,
- de rechercher les indicateurs exprimant les niveaux de sensibilités propres auxsociétés (reproduction familiale et sociale, modes de vie et de production agricoleetc.) ,
- d'identifier les binômes possibles entre ces deux premiers types d'indicateurs(indicateurs relationnels) exprimant (ou expliquant) les écarts autour de lasensibilité potentielle, déterminés (ou provoqués) par les perturbationsanthropiques.
Ensuite il s'agissait de construire à partir des indicateurs retenus des typologiessignificatives d'un ou plusieurs états démo-écologiques qui puissent servir defiltres discriminants à l'analyse des variables socio-démographiques. A l'issuedes enquêtes sur le terrain, deux groupes de typologies se sont avéréespertinentes et synthétiques de ces états:
- un premier qui se référé à plusieurs découpages du territoire en secteurs démo-écologiques qui définissent par exemple une partition du territoire en zones selonleur nature géo-morphologique (plaines, glacis, piémonts, montagnes...), (et) ouune partition couvert végétal-pratiques agricoles, tous ces découpages
173

recouvrant d'une manière précise l'implantation du peuplement (localisationphysique des ménages et des exploitations agricoles) etc...
- un second ayant trait aux typologies milieu-exploitation agricole qui résument leparadigme: "ménages, activités agricoles, milieu", la construction de cestypologies pouvant être différente suivant les zones.
4. La collecte des données
Dans la chaîne interactive homme nature, l'approche méthodologique se heurte auchoix du maillon de départ par lequel les suivants sont appréhendés. Ici, I' "entrée" aété le ménage, envisagé à la fois comme unité familiale (reproduction sociale etfamiliale) et comme représentation des activités humaines (exploitation agricole). Lesenquêtes sur le terrain ont donc porté à la fois sur les ménages et sur les gradiantsbio-climatiques d'implantation. C'est à ce niveau que les indicateurs relationnels (ouindicateurs démo-écologiques) ont été utilisés.
4.1. Les techniques d'adéquation des différentes sources.
La relation entre les observations passées, actuelles et les évolutions à venir, ou si l'onfait référence aux concepts utilisés en démographie la relation entre le longitudinal, letransversal et la prospective s'effectue de la manière suivante: trois typesd'observation ont été utilisés:
A. Les modes d'observation diachrones et synchrones: phyto-écologie, pédologiesur la base des observations sur des stations centrées sur les zones choisies etl'analyse de chronoséquences de photos aériennes: partage de l'espace desgroupements végétaux, nature et usure des sols,
B. Photo-interprétation et télédédection: évolution de l'occupation des sols et desindices de dégradation, systèmes de communication et de desserte desexploitations agricoles, implantation des douars et de l'habitat dispersé,
C. L'enquête socio-démographique et agricole: échantillon de ménages-exploitations agricoles: dynamique démographique, migration, mode de vie duménage, modes d'exploitation du milieu.
La relation entre ces divers instruments s'établit sur la base des indicateurs construitsà partir des différentes sources. (A) a pour objet d'opérer une segmentation des milieuxapprochés suivant l'intensité et la nature des dégradations ou des remontéesbiologiques observées. Ce sont principalement les secteurs démo-écologiquesauxquels viendront s'ajouter d'autres maillages plus directement associés à un facteurécologique (par exemple un maillage couvert végétal établi à partir des transects). Leszonages opérés sont spatialisés par (B), complétés par l'information sur l'évolution desimplantations et des aménagements tirée de la chronologie des couvertures aériennes.Ces divers zonages sont caractérisés suivant une ou plusieurs typologies, qui sontautant de caractéristiques des exploitations agricoles. La démarche est de construired'abord une typologie "ménage-exploitation agricole et milieu" que nous avons désignéTME, de la tester avant d'introduire d'autres indicateurs complexes. Cette typologie
174

TME est ensuite mise en relation avec les observations réalisées en (C), c'est à direavec chaque unité "ménage, exploitation agricole".
4.2. L'enquête sur les ménages et les exploitations agricoles
Elle comportait quatre volets:
- le premier, essentiellement démographique permettant d'apprécier le niveau decroissance ou de décroissance, tant des facteurs naturels que celui de lamigration considérée comme facteur de modulation ou de régulation de ladynamique démographique. Le questionnaire est constitué d'une fiche collectivesimple recensant l'ensemble des personnes composant l'unité d'enquête,
- le second, sur les formes d'utilisation des milieux naturels vus sous l'angleconsommation des ménages: énergie, eau, habitat, équipement..,
- le troisième, sur les activités agricoles et pastorales: nature et type desexploitations agricoles, formes de production, systèmes et techniquesd'exploitation, cultures, élevage, intrants agricoles, activités de cueillette...commercialisation...,
- un quatrième volet enfin sur la perception des évolutions adressé aux exploitantsagricoles portant: sur les capacités productives appréciées des parcellescultivées ou des parcours, notion des changements notamment par rapport à cequi se faisait autrefois son père, ou ancien exploitant), appréciation de l'évolutiondes risques et incertitudes liées aux conditions du milieu, connaissance desseuils de ruptures des ressources naturelles à travers les indicateurs (ressourcesen eau: niveau des puits, ruissellement, disparition ou apparition d'espècesvégétales), perception individuelle de la dégradation ou de phénomènes deremontée biologique....
Dans chacune des quatre zones retenues, l'enquête a été menée auprès d'unéchantillon de 200 ménages qui représente environ le quart de la population totale dela zone. Tous les thèmes sont présentés de manière à intégrer l'ensemble desindicateurs de dégradation (antécédents historiques, état, évolution, prémices deruptures, de déséquilibres ou de remontée biologique...). Les résultats des enquêtesde type phyto-écologiques (s'appuyant sur des enquêtes antérieures) constituent lecadre essentiel de la préparation de ce type d'enquête. Finalement toute cetteinformation est synthétisée dans la saisie, qui est globale et centrée sur l'unité famille-exploitation agricole.
4.3. Le traitement des données
Les secteurs démo-écologiques (typologie NS) ont été établis à partir de l'observationde l'état de dégradation des sols et de leur nature et de l'évolution du couvert végétalobservée par photointerprétation. Les ménages et leur exploitation agricole sont ainsirepérés suivant le site écologique qu'ils occupent. Ce repérage ne couvre pas, loins'en faut, tous les facteurs d'évolution des milieux naturels et ¡I n' y a pas forcémentune adéquation parfaite entre les surfaces utilisées dans l'exploitation et un secteur, enparticulier lorsque l'exploitation comporte un nombre important de parcellesdisséminées sur l'ensemble de la zone, par ailleurs les parcours des troupeaux
175

dépassent quelquefois largement le périmètre étudié. La typologie TME (MénagesExploitation Agricole, Environnement) permet à partir de critères discriminants desurmonter cette difficulté, pas totalement, mais en grande partie.
En effet la typologie TME se construit à partir d'un certaine nombre de variablesobservées dans l'enquête, elle caractérise le ménage à partir de ses relations avec lemilieu naturel et de l'utilisation des ressources naturelles: systèmes de culture,espaces cultivés et espaces sylvo-pastoral, structure foncière et patrimoniale, typesde cultures et d'élevage, énergie domestique employée... La TME ainsi constituéepermet de mettre en évidence les différents systèmes d'exploitation de la nature selonles caractéristiques de celle-ci. Deux méthodes ont été employées pour identifier lesvaraibles entrant dans la composition de la TME: une méthode statistique basée surl'analyse des correspondances2 qui permet d'isoler les variables discrimantes et uneméthode plus empirique par choix raisonnée effectué directement par visualisation deslistes de ménages classées suivant les modalités de variables retenues. Uneconfrontation des deux méthodes est ensuite opérée pour fixer la TME choisie pourla zone. Le nombre de variables, leur nature entrant dans la composition de la TMEsont bien entendues différentes selon les zones. Ainsi pour la zone de Ouled Frej3, 22variables sont retenues:
Structure foncière de l'exploitation:
-Superficie totale de l'exploitation agricole
- Nombre totale de parcelles (Morcellement de l'exploitation agricole)
- Modes de faire valoir
Assolements et occupation du sol:
- Nombre d'hactares cultivés
- Diversification de la production agricole
- Superficie irriguée
- Nombre d'arbres fruitiers
- Superficie de cultures fourragères
Techniques culturales:
- Moyens de traction
- Amébagement de protection des parcelles
- Sens du labour
- Intrants chimiques ou organiques
Alimentation du Cheptel:
- Source d'approvisionnement des aliments pour le bétail
- Location de pâturages
- Durée d'utilisation des jachères et des chaumes
Types d'élevage:
- Effectif actuel d'ovins
176

- Effectif actuel de caprins
- Effectif actuel de bovins
Utilisation de la montagne:
- Utilisation des parcours en forêt et garrigue
- Récolte de plantes sauvages pour la consommation
- Pratique de la chasse
- Source d'approvisionnement en bois
Muni de cette typologie on peut procéder aux croisement avec les autres variables soitde type écologique: secteurs démo-écologiques, facteurs environnementaux, soit detype socio-démographique avec des variables simples ou composées issues del'enquête démographique et socio-économique. La confrontation de ces diverscroisements permet en définitive de relier les caractéristiques environnementales auxcomportements et aux stratégies des ménages et en particulier de relier lesmécanismes migratoires mis en place par les populations aux systèmes d'exploitationdu milieu naturel et à son évolution.
5. En conclusion ...
Les enquêtes de terrain sont terminées, elles sont dans leur phase de traitement. Unpremier tri à plat des variables croisées avec le secteur démo-écologique a étéeffectué. Ce tri à plat a guidé l'élaboration et le choix des variables entrant dans lacomposition de la TME. L'étude des évolutions par photo-interprétation a été réaliséesur les couvertures aériennes 1954, 1962 et 1989, de même l'évolution du contextedémographique, enfin les relevés phyto-écologiques et érosion des sols...sont pourl'essentiel disponibles. Cette phase du programme se révèle délicate, chaque zone ases spécificités, ses contraintes d'observation qui risquent de mettre en cause lacapacité de comparaison recherchée. Néanmoins la quantité d'information recueilliepermet déjà de relier un certain nombre de caractéristiques environnementales auxsystème d'exploitation des ressources naturelles et par la même de comprendre lesstratégies familiales et économiques des ménages. Si la taille de ces ménages reste,par rapport à l'ensemble du pays, relativement forte autour de 6 à 7 personnes et celaquelque soit la zone, on peut constater que le milieu, les conditions de peuplement ontfaçonné des systèmes d'exploitation des ressources naturelles très différents suivantles régions. La taille des exploitations varie de 15 hectares dans la zone semi-aride,1,6 en zone oasienne et à 4 en zone forestière. Le morcellement des exploitations estégalement très variable. Une faible assisse foncière de l'exploitation, un moindrerecours à l'émigration entraînent une surexploitation des ressources forestières et desactivités clandestines de carbonisation: système qui se concentre dans des secteursdéjà fortement érodées, mais qui s'est développé précisément là où il était pour lespopulations le seul moyen de subsister...Le programme DYPEN-TUNISIE, conçucomme une démarche expérimentale, n'apporte pas de résultats assimilables àl'ensemble du milieu naturel tunisien, il caractérise certaines relations homme-milieudans des conditions spécifiques arides, semi-arides ou forestières en même tempsqu'il propose un protocole de recherches susceptible de fournir les éléments de
177

compréhension des interrelations entre les dynamiques de population et les évolutionsdes milieux naturels. L'analyse des résultats, en cours, devrait infirmer ou confirmercet optimisme4
Footnotes
'Ce texte s'appuie sur la réflexion développée dans le cadre du programme DYPEN-TUNISIE, mené par un collectif de recherches groupant cinq institutions de recherchestunisiennes et françaises: Institut Sylvo-Pastoral de Tabarka, Institut des RégionsArides, Commissariat au Développement Agricole de Siliana, Ecole Supérieured'Agriculture de Mograne, ORSTOM-Tunis, Laboratoire Population EnvironnementUniversité de Provence/Orstom. Il reprend de larges extraits de documents antérieurs:voir notamment "Dynamique de population et milieux naturels: de la formalisation àl'expérience de terrain: le cas de la Tunisie rurale" Séminaire du CEPED, 1993 et "Pression démographique et l'environnement11 Article ECODECISION 10,1993.2Cette méthode est développée par l'unité de traitement de l'IRA (Institut des régionsArides par N. Bachar (ingénieur statisticien) et M. Sghaier (Agro-économiste).3La TME pour Ouled Frej a été établie par L AUCLAIR, ingénieur agronome,économiste de l'ORSTOM.4Un premier fascicule de résultats issu du tri à plat sera disponible début 1994, laprésentation des analyses au prinptemps 1994.
Références
Slesser M., and J. King. 1988. Resources accounting: an application to developmentplanning, World Development, 16, 2:293-303
Galopin, G.C., P. Gutman, and N. Maletta. 1989. Appauvrissement à l'échelle duglobe, développement durable et environnement: une perspective théorique Revueinternationale des Sciences Sociales 121:412-437
Floret, C , E. Khatalli, E. Le Floch, et R. Pontanier. 1989. Le risque de désertisation enTunisie présaharienne. Sa limitation par l'aménagement agro-pastoral. Le risqueen Agriculture, A travers Champs, Ed. ORSTOM, pp 291-308
Picouet M. 1993. Pression démographique et milieux naturels dans les campgnes duTiers Monde: un essai de formalisation. Congrès général de IVIESP, Montréal,Actes du Congrès, fasc:4, (paru dans ECODECISION 10)
Collectif de recherches DYPEN: 1993. Résultats provisoires tri à plat, document 1,100(non diffusé).
Collectif de recherches DYPEN: 1989-90. Rapport d'étape 1, 40 p.
Collectif de recherches DYPEN: 1990-92. Rapport d'étape 2, 45 p.
Picouet M. 1992-93. Dynamique de population et milieucx naturels: de la formalisationà l'expérience de terrain: le cas de la Tunisie Rurale, séminaire CEPED, à paraître.
178

PART II
POLLS, PERCEPTIONS AND POLICIES
179


CHAPTER 9
POPULATION AND THE ENVIRONMENT: POLLS, POLICIES,AND PUBLIC OPINION*
J. Mayone Stycos(Department of Rural Sociology, Cornell University, Ithaca, NY, USA)
1. Introduction
Social scientists frequently employ sample surveys to assess public attitudes towardcurrent or prospective government policies. Population and environmental problemsare two areas of public concern and debate that have traditionally had differentconstituencies and leadership. However, there have been numerous recent attempts tojoin forces, both at the organizational and conceptual levels. As the issues evolve,there is a growing need for new social scientific knowledge, especially the assessmentof public opinion toward current or potential policies on population and theenvironment. In this paper I will deal with several questions relevant to this need:
1. Has the demand for better policies on population and the environment producedan increase in the social science knowledge base on these subjects?
2. What data are available and what data are needed to assess the attitudes ofgovernments toward population and environmental problems?
3. What data are available and needed to assess public attitudes on population andenvironmental problems?
In answering the first question I will look at trends in the number of scholarlypublications over the past few decades. In answering the latter two questions, I willlook more closely into the substance of past data collection efforts that concentrate onthe population issue, but, where possible, provide comparative information on theenvironment as well.
2. The Scientific Knowledge Base
Sociofile1 is a data bank of abstracts of articles that deal broadly with sociologicaltopics. Covering roughly 1,600 sociological and related journals, it abstracted 177,728documents between 1974 and 1992. "Demography and Human Biology" and"Environmental Interactions" are two of the 21 major subjects covered by the database. I conducted a search than first asked for the number of citations in which thewords "population," "environment," or "population and environment" appearedanywhere in the title or abstract ("Basic Index"). A second search asked for the number
' The research assistance of Ms. Huong Hoai Tran is gratefully acknowledged.
181

of abstracts in which these topics constituted the main topic of the article("Descriptors").
As judged by the volume of abstracts, social science attention to the environment hasgrown markedly in the last decade. While Sociofilés total file grew by only 39 per centbetween 1983 and 1991, the number of "Basic Index" citations on the environmentincreased by 139 per cent; and "Descriptors" on the environment increased almostsevenfold (Fig. 1).
However, the growth in population citations, while faster than growth in overallcitations, has been much slower than for environment—only 43 per cent in Basic Indexcitations, and 120 percent in Descriptors. By 1991 the unequal growth rates resulted ina confluence of absolute numbers of Basic Index citations: 1061 for population and1036 for the environment. However, environment received almost three times as manyDescriptor citations (325 to 119). References to population and the environment(jointly) are few. Although Basic Index items total 1220 and have tripled since 1983,there were only 42 articles over the entire 18 year period in which population andenvironment was the major topic (not shown in Fig. 1).
A second source of information on scholarly productivity is PopHne, a computerizedbibliography of documents on population. Over the same period (1974-92) it hasabstracted about the same number of population documents (164,349) as Sociofile hasabstracted for sociology/social science in general. As seen in Figure 2, the totalnumber of population citations since 1980 has been declining, whether measured bythe size of the overall file (-48 per cent), by the number of documents identified aspopulation in a "Global" search (-38 per cent), or in a "Keyword Major" search (-41 percent).2
Over the same period, articles whose main topic is the environment (Keyword Major)have steadily increased, and Global Environmental Abstracts have shown only a slight(7 per cent) decline. Global references to population and environment have remainedsteady since 1981 at between five and six hundred per year but very few articles havethis as their main topic: 9 in 1980, 78 in 1991 (not shown in Fig. 2).
To sum up what we have found from the abstracts in Sociofile and Poplina (1) over thepast decade social science productivity on the environment has increased much fasterthan productivity on population, which may be in decline relatively and absolutely; and(2) productivity on the joint topic of population and environment has at best increasedmodestly from a very small base.
3. Population Policies and Government Attitudes
Population policies are not new, having been propounded by governments in classicalGreece and Rome, and articulated by early philosophers from China to the MiddleEast. What is new is the technology available to governments (primarily modemcontraception and the mass media), and the internationalization of technical assistanceon population policies and programs. Newest of all is the goal of slowing populationgrowth rates rather than sustaining or speeding them up, and, at least in a substantialnumber of cases, the high priority governments have assigned to population planning.
182

Number of Citations (Log scale)
CO
c
tatio
*o
Tot
alX
sas
ic
CÛ
PO
P
L_
OQ.
escr
o1 &-*
fg
XCD
•ocÜ
Bas
of
Q.
cri
Des
ce
EN
VI
X(D•a
o"wrem
ZLU00
|PO
P
8
/
'
"A
I i I I I 1 I I I§oo
I I I I I I I I
o
C3
s >-
Fig. 1. "Sociofile" citations: population, environment and totals (1974-91), compiledfrom Sociofile (Silverplatter), April 1993.
183

Judged by these more recent criteria, population policies have existed for only a fewdecades. Writing in the late 1960s, Hope Eldridge (1968: 387) concluded that "Onlythree countries can be said to have coherent, carefully constructed and frankly statedpopulation policies: France...Sweden...and India." The first two were more developedcountries desirous of increasing their birth rates. Moreover, in much of the modemperiod, migration has been viewed as "the only major demographic process over whichpolicy was consciously debated and fixed" (Robinson, 1975). With the development ofnew contraceptive methods in the 1960s and, at the urging of a few European andAsian nations, the international agencies became major instigators of populationplanning for the Less Developed Countries (LDCs), with family planning as the majortool.
At the end of the 1950s only six developing nations, including Tonga and Hong Kong,had policies supportive of family planning. By the end of the 1960s 45 countries hadformulated policies, and by 1975 81 had done so. However, of the latter number,Watson (1977: 2) argued that only 54 could be characterized as giving "realprogrammatic support." Moreover, in the more industrialized nations at that time,"population ...does not rank high on the agenda of national problems. It is more giventhan problematic, more to be adjusted to than changed" (Berelson, 1974: 786).
A more recent review remains pessimistic concerning governments' commitments topopulation planning3 and the ability or interest in integrating it with social and economicplanning in general:
" Population factors continue to be treated essentially as exogenous planningcomponents. The state of the art seems restricted mostly to an examination ofpopulation projections in relation to the demand for social services. In somecountries even that relatively simple approach seems to have run into seriousproblems of application because sectoral programming and target-setting havesuffered from inaccurate demographic estimates and analyses. Selection ofsocial and economic policies and programmes, including the countries welladvanced in the application of development planning, appears to be largelydevoid of the consideration of their implications for demographic variables andprocesses" (Farooq and Pernia, 1988:11).
Aside from such subjective appraisals, how can government attitudes on populationand environment issues be assessed? I will discuss three approaches: systematicexpert assessments, direct queries of government officials, and content analysis ofgovernment documents.
3.1. Systematic Expert Assessments
The emphasis here is on "systematic." The prototype is the scheme developed byLapham and Mauldin (1985: 132) wherein "some 400 population specialists around theworld provided information on 30 items related to family planning programs..." Thesubjects of the questionnaire were judged to be experts on a particular country orcountries. Their responses on policy and three other program effort categories (service,record keeping, and availability/accessibility) were given scores by the authors. Thescores for policies in 73 countries ranged from 0 (e.g., Saudi Arabia and Laos) to 31(China) and were based on the authors' evaluations of eight questionnaire items
184

including budget, public statements by leaders, import laws regarding contraception,and mass media attention to contraception.
This technique is a great improvement over judgments made by individual experts,since it employs many judges, breaks "policy" down into eight more objectivecomponents, and asks all judges the same questions about these components.However, it is still tainted by judgmental and subjective problems, perhapscompounded by the additional layer of authors' judgments.4
Number of Citations (Log scale)
100,000
10,000-
1,000-
J_
> -6k
. . - • '
100-H \ 1 1 1 1 r1974 1978 1982
t i l l 1 i l l1986 19S0
Year
Total citations
POP, Global
POP.Keyword Major
ENVIR, Global
POP &ENVIR, Global
Fig. 2. "Popline" citations: population, environment and totals (1974-91), compiledfrom Popline (Silverplatter) April 1993.
185

The various measures are heavily weighted in the direction of family planning policiesand programs, and ignore policy issues such as internal and external migration,population distribution, urbanization, etc. However, the general method could easily beadapted to a more general definition of population policy.
3.2. Direct Queries
The leading example of the direct query approach is the series of surveys on"Government Perceptions and Policies on Demographic Trends and Levels in Relationto Development" carried out by the United Nations (UN). Roughly every two years aquestionnaire has been sent to each member nation, which is asked for its officialposition on population issues. A major finding concerns the growing number of nationsthat have formally recognized a national population problem. When the UN made its1974 inquiry of government population policies, it found that only 28 per cent of the 156responding nations judged their population growth to be too high, compared with 40 percent in 1990. Further, the proportion who said they support direct access tocontraceptive methods increased from 55 per cent to 76 per cent (UN, 1992:38).
Can we trust the responses of nations that claim their population growth is too high?Are they not like individuals who, when polled, may do their best to give answers thatwill please the interviewer? After all, as sponsor of the questionnaire, the UN could besuspected of rewarding countries that have "appropriate" policies and programs.Further, unlike a poll of persons, we really do not know how many individuals ordepartments were involved in answering the questions. In a large country with manydepartments, responsibility for responses to specific questions may be spread out overa number of persons, whereas in a small country or one with more centralizedauthority, an individual or a single department may respond.
Another problem refers to missing information—countries that fail to respond to thequestionnaire. At the time of an initial inquiry in the early 1960s, only 44 per cent of 124countries polled responded to the questionnaire; and, as in surveys of individuals,those who responded were different from those who did not. An analysis of this surveyfound that "the nonrespondents were principally the small underdeveloped countries,not the ones which traditionally oppose birth control programs..." (Back andWinsborough, 1968-69:644). Subsequent inquiries elicited somewhat higher returnrates, but with considerable fluctuation, for example 47 per cent in 1978 and 72 percent in 1982 (UN, 1989:387). This translates to an average of 63 countries that failed toanswer each of the six more recent inquiries (UN, 1989:387). Certainly a non-response from a nation is more significant than a non-response from an individual.Further, why is it that Brazil has answered only one of the six inquiries, while Colombiahas answered all of them? Why have Bolivia and Haiti answered three, and theDominican Republic five?
The length of the questionnaire would certainly stun the average respondent—the1988 inquiry was 42 pages long and contained 282 questions, 48 of them open-ended(UN, 1990). There were 77 questions on fertility and the family; 25 "how-concerned-are-you" questions regarding causes of death ranging from suicide to measles; 25items on integrating demographic factors into development planning; and sections on
186

population and the status of women, and on population and peace. But there is not asingle question on the environment.
Despite such limitations there are things we can learn from these surveys. Forexample, rapidly growing countries that regard their rates as satisfactory or too lowmay be less subject to a "courtesy bias" since their views are contrary to the currentinternational norm favoring low rates of population growth for LDCs. Also, there shouldbe special interest in the attitudes of industrial countries. In 1990, not one of 38industrial countries considered its growth as too rapid, and as many as seven of themconsidered it to be too low (UN, 1992:48). In the light of the fact that any populationgrowth in these countries places a heavy tax on the environment, their demographicviewpoints are of special concern. How is it that strongly Catholic countries such asBelgium and Italy with slightly negative growth rates consider their rates assatisfactory, while France and Greece with positive annual rates of 0.2 and 0.35 percent consider these rates as too low? Why do the United States, Canada and Ireland,with rates between 0.8 and 0.9 per cent, regard these rates with satisfaction? If suchperplexing findings were uncovered in an investigation of individuals, they would soonbe followed up with depth interviews, focus group sessions and observationalapproaches better to explicate the typical cases and diagnose the deviant ones.
As we move to other regions, even greater anomalies surface. Although 30 Africannations judged their growth rates to be too high, the Congo, Equatorial Guinea andGabon, with annual rates of 3.2, 2.4 and 3.5 per cent, regard theirs as too low.Moreover, there are an additional 18 African nations that regard their rates assatisfactory despite the fact that all exceed 2 per cent (UN, 1992). The UN believesthat the first three consider their nations to be underpopulated, so that rapid growth isseen as desirable. This could also be of importance in Argentina and Bolivia, whoserates of 1.3 and 2.8 per cent respectively, are viewed as too low. Follow-up in depth toascertain who is doing what reasoning should be a high priority research item.
3.3. Content Analysis
Some of the problems of bias inherent in the direct query approach are circumventedby analyzing government documents intended for some other purpose. An examplecan be provided by examining what 169 governments said about population in theirreports to the Rio de Janeiro Earth Summit Conference. The United NationsCommission on Environment and Population (1992) has published three volumes ofsummaries of these reports, which were usually prepared by special committees set upto prepare for the conference. Each of the summaries, which run 5-6 pages, containsa section on "Problem Areas" and a section on "Recommendations and Priorities onEnvironment and Development." We would expect population problems andrecommendations to be found in these sections, if population is viewed as any kind ofmajor factor in the environment.
The number of problems ranged from less than five (Singapore, North Korea, Myanmarand Cuba) to over 40 (Russian Federation, Pacific Islands), with a median number of14 and with 75 per cent of the nations citing more than 10 problems. Despite this largenumber, a majority (54 per cent) failed to mention population growth or pressure as a
187

problem, and 28 per cent mentioned neither population growth nor distribution (i.e.,urban concentration, city growth, etc.) (Table 1).
The data confirm the industrial nations' lack of concern about their population growth.Only six of the 42 nations of Europe, Northern America and Oceania mentionedpopulation growth as a problem. Of these, four were from the former Soviet Union—Belarus, Estonia, Latvia and the USSR, the latter concerned over declining growthrates. The United States and Switzerland are the only other countries in this group.
Table 1. Mention of Population Growth or Distribution as a Problem, in Nationsof the Earth Report (UNCED, 1992)
Population Only
Urban/DistributionOnly
Both
Neither
Total
Latin America/Caribbean
5
15
6
8
(34)
Africa
20
6
14
4
(44)
Asia
15
13
12
9
(49)
Europe/Oceania/USA/Canada
3
9
3
27
(42)
Total
43
43
35
48
(169)
On the other three continents, Latin American nations were the least likely to citepopulation problems (35 per cent), the African nations most likely (70 per cent), and theAsian countries fell in between (50 per cent).5 Latin American countries were the mostlikely to cite urban growth or distributional problems (62 per cent), compared with Asianand African nations (49 per cent and 43 per cent, respectively).
Although the 169 nations made a total of 2,232 recommendations, only 31 countries or18 per cent made a recommendation on population. These ranged from "coping withpopulation growth" to "better family planning." Nearly all came from Asia (16) andAfrica (12). In Latin America only Haiti, Bolivia and Trinidad made populationrecommendations. None of the industrial nations did so.
This kind of test of concern about population has advantages similar to those ofopen-ended questions in an individual questionnaire, especially where the respondentis unaware of the subject of the inquiry. However, despite guidelines, each countrydecided on the specific mechanisms for writing the report, making some responsesmore official or representative of decision makers than others.
4. Measurement of Public Attitudes. The World Fertility Survey(WFS)
The success of public policies can be greatly enhanced by information on publicattitudes.6 With respect to population, the World Fertility Survey (WFS) (and its
188

successor, the Demographic and Health Surveys) has been the largest cross-nationalsurvey in the history of social science. The WFS interviewed 341,300 women ofchildbearing age from 61 countries at a cost of $47 million, at least $5 million of whichwas from the LDCs themselves. Organized and monitored by a substantial staff ofexperts operating under the aegis of the International Statistical Institute, the surveywas a model for its rigor in sampling, questionnaire design, data processing and reportwriting. Should it be the model for social science research on the environment?
Scholarly production was impressive in volume,7 and the surveys greatly increasedLDC capacity for conducting sample surveys. Moreover, there were several indicationsof policy payoffs. First, the survey enabled countries not yet sure of where they stoodon the controversial issue of population planning to engage in an activity ("research")less subject to controversy but policy relevant.8 It gave some breathing space tocountries not quite ready to introduce population planning. Among the other ways inwhich the surveys contributed to policy were (1) demonstrating a large unmet need forcontraception; (2) providing more accurate data on fertility, which tended to be higherthan official estimates; (3) verifying that prevalence and duration of breast feeding wereimportant factors in fertility; (4) showing that larger doses of education than had beensupposed would be necessary to induce fertility declines (Gille, 1985).
A questionnaire sent to participating agencies at the termination of the surveys in 1983specifically asked about dissemination and utilization of the findings. Nineteencountries reported that the findings were used in population projections (Ortega andVaessen, 1987: 964-65), and "18 of the 19 countries with official family planningprogrammes made use of WFS findings in these programs; findings were also appliedin 15 of the 23 countries with private family planning programs."9
4.1. Limitations of the World Fertility Survey
Although the WFS proved useful to many countries, its shortcomings as a model forattitude surveys on environment and population need to be noted. First, in mostcountries the sample was restricted by gender, age and marital status. Especiallyproblematic, even for a fertility survey, was the exclusion of males and of young,unmarried women. As regards environment, there are both theoretical and empiricalreasons for considering younger cohorts as qualitatively different from older ones,10
and any large scale survey should take care to include this population.
Second, the survey was essentially a-theoretical.11 While much useful descriptivematerial was provided, the explanatory or predictive power of the study was weak.
Third, attitude data in the WFS are almost non-existent, essentially confined to a fewitems on desire for more children. No attitudes toward environment were included, norwere attitudes toward demographic aspects of one's community or nation.
Fourth, assessment of respondents' knowledge was confined to knowledge ofcontraceptive methods and their supply sources. Since demographic knowledge wasnot assessed, the study sheds no light on respondent awareness of governmentpro-natalist or anti-natalist policies, nor does it measure awareness of the populationsize, growth, density or distribution of the respondent's nation or community. Fifth, only17 of the 42 countries included a community module, and most of these did not
189

analyze the data. Thus, situational determinants of household or individual behaviorcannot be determined.
Sixth, there are very few potential explanatory variables in the WFS questionnaire. Forexample, there are no questions on agriculture (tenure, production, land use, size ofplot, etc.) despite the fact that most of the respondents are living in rural areas; norwas information collected about sources of information on family planning (masscommunications exposure, friendship networks, health professionals, etc). Migrationdata were excluded, as were details on women's working.
In 1984, the Agency for International Development (AID) initiated a new series ofsurveys—The DHS or Demographic and Health Surveys. By 1991, final reports hadbeen received from 29 countries, with many more planned. In addition to newquestions on maternal and child health, there are a few more attitude items oncontraceptives and fertility intentions; sexual behavior (sexual frequency and age atfirst experience); migration; women's working experience; and exposure to masscommunications. As in the WFS, however, there are no questions on demographicknowledge, attitudes and behavior; or on agriculture, the community, or theenvironment (Institute for Resource Development, 1990).
In sum, the WFS and DHS set some good examples in terms of overall design,methodology, and policy benefits, but provide little guidance on the content of futuresurveys on population or the environment. But another source of guidance on publicopinion are the surveys carried out by professional pollsters, who are strongly policyoriented. What can we learn from them?
5. Two Decades of Public Opinion Polling
5.1. U.S. Based Surveys
Using computerized data (POLL) covering 150,000 questionnaire items from over 8000surveys in the Roper Center Archives, Milavsky (1991) found that 2979 questions onthe environment had been administered in US surveys 1935-90. From a mean of lessthan two questions per year until 1969, the average rose to 80 per year in the 1970s,148 in the 1980s and 311 for the period 1990-92.
Using the same data set12 I searched for questions on "population growth," "populationsize" and "overcrowding." Only 149 items were recorded in these categories, 96 percent of them since 1970. Since then there has been no trend in annual numbers ofreferences, i.e., population questions have been few and have not been increasing13-
5.2. Surveys from Other Countries
The twelve volumes (1978-79 to 1990-91) of the The Index to International PublicOpinion consist of an annual inventory and exposition of questions used in "over 165countries and geographical regions worldwide" (Hastings and Hastings, 1991: xi).Norris (nd) tallied 469 items on the environment from this source. Judging from thissmall number compared with the thousands tallied in the Roper Archives, the Index is
190

highly selective in what it chooses to include14. Nevertheless, it will give us some ideaof the nature of the items and the relative attention given to population and theenvironment.
A search of the indices contained in the 12 volumes resulted in a total of 332 itemsbroadly related to population.15 Nearly half of these (156) were devoted to "family size,"over one-quarter (91) to "birth control," and only about one-quarter (85 items) toattitudes toward population16 Almost one-third of the items occurred in the most recentthree-year period. This recent upsurge, however, is almost entirely due to increases inquestions on birth control and family size, while population items have remainedconstant at about five per year over the past decade.
According to the Index, France has asked the largest number of questions (57),followed by Japan (49), Great Britain (37), the USA (33), Germany (32), and Canada(24). After Canada, there is a sharp drop to the next set of 13 nations (3-9 items each),all of them industrialized with the exception of India. Most of the remaining 16 nationshad asked only one question each.17
A number of conclusions can be reached, based on a review of the questions onpopulation used in over 80 surveys:
1. Questions regarding population attitudes are fewer than those dealing withattitudes toward family planning and family size.
2. Few questions have been repeated over time in the same countries, and thesame questions are infrequently applied across countries.
3. Data on the public's level of demographic information are especially sparse.
4. Responses reflecting degree of concern about population depend on questionformat and sequence. A very small minority (<5 per cent) spontaneously citepopulation problems as the highest priority; a larger proportion, up to one-quarter, believe they are among the world's major problems; and majorities say, ifasked directly, that they regard them as serious.
5. Population questions usually refer to population growth or size. Very fewquestions refer to population distribution, composition, migration, or death rates.
6. Few questions on attitudes toward existing or potential population policies arefound, other than with respect to abortion and family planning.
7. Attitudes toward the dynamics of community (as opposed to national or world)population dynamics have not been queried.
8. Personal behavior aimed at affecting population or population policies is virtuallynever queried; i.e., voting, organizational support, political activity, adoption orfamily planning for demographic purposes, etc.
9. Exposure to mass communications regarding population is rarely assessed.
191
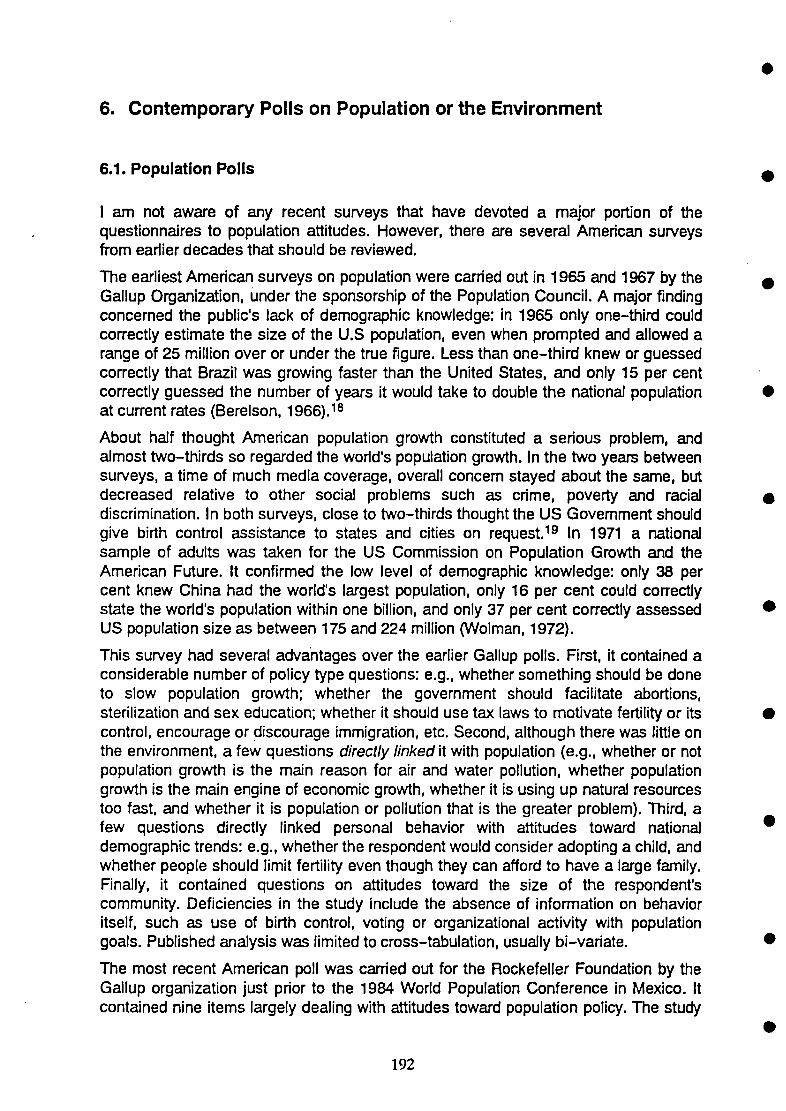
6. Contemporary Polls on Population or the Environment
6.1. Population Polls
I am not aware of any recent surveys that have devoted a major portion of thequestionnaires to population attitudes. However, there are several American surveysfrom earlier decades that should be reviewed.
The earliest American surveys on population were carried out in 1965 and 1967 by theGallup Organization, under the sponsorship of the Population Council. A major findingconcerned the public's lack of demographic knowledge: in 1965 only one-third couldcorrectly estimate the size of the U.S population, even when prompted and allowed arange of 25 million over or under the true figure. Less than one-third knew or guessedcorrectly that Brazil was growing faster than the United States, and only 15 per centcorrectly guessed the number of years it would take to double the national populationat current rates (Berelson, 1966).18
About half thought American population growth constituted a serious problem, andalmost two-thirds so regarded the world's population growth. In the two years betweensurveys, a time of much media coverage, overall concern stayed about the same, butdecreased relative to other social problems such as crime, poverty and racialdiscrimination. In both surveys, close to two-thirds thought the US Government shouldgive birth control assistance to states and cities on request.19 In 1971 a nationalsample of adults was taken for the US Commission on Population Growth and theAmerican Future. It confirmed the low level of demographic knowledge: only 38 percent knew China had the world's largest population, only 16 per cent could correctlystate the world's population within one billion, and only 37 per cent correctly assessedUS population size as between 175 and 224 million (Wolman, 1972).
This survey had several advantages over the earlier Gallup polls. First, it contained aconsiderable number of policy type questions: e.g., whether something should be doneto slow population growth; whether the government should facilitate abortions,sterilization and sex education; whether it should use tax laws to motivate fertility or itscontrol, encourage or discourage immigration, etc. Second, although there was little onthe environment, a few questions directly linked it with population (e.g., whether or notpopulation growth is the main reason for air and water pollution, whether populationgrowth is the main engine of economic growth, whether it is using up natural resourcestoo fast, and whether it is population or pollution that is the greater problem). Third, afew questions directly linked personal behavior with attitudes toward nationaldemographic trends: e.g., whether the respondent would consider adopting a child, andwhether people should limit fertility even though they can afford to have a large family.Finally, it contained questions on attitudes toward the size of the respondent'scommunity. Deficiencies in the study include the absence of information on behavioritself, such as use of birth control, voting or organizational activity with populationgoals. Published analysis was limited to cross-tabulation, usually bi-variate.
The most recent American poll was carried out for the Rockefeller Foundation by theGallup organization just prior to the 1984 World Population Conference in Mexico. Itcontained nine items largely dealing with attitudes toward population policy. The study
192

was not fully analyzed, but a press release accompanied by a series of cross-tabulations was issued at the conference (Segal, 1984).
6.2. Environmental Polls
Two multi-national surveys that are entirely focussed on the environment20 have beencarried out by Harris and Gallup in recent years.
The Harris Poll. This massive multi-national survey of public and leadership attitudestoward the environment was conducted for the United Nations Environmental Program(UNEP) by Louis Harris and Associates (1989). The questionnaire was administered in"31 separate surveys, conducted in 16 countries...whose populations account for morethan 64 per cent of the world's population." The samples were designed to berepresentative of persons aged 16 and over, mainly those living in the "majormetropolitan areas and urban centers, because of the impracticality of surveying ruralpopulations" (Louis Harris and Associates, 1989: 2). In each nation 300 to 1250persons were surveyed, plus a separate sample of 50 leaders. Quota sampling,random walk techniques, probability sampling, and electoral registers were variouslyemployed.
The survey concentrated on awareness of and attitudes toward environmental issues.The most important conclusion concerned the "deep and widespread concern aboutthe quality of the environment." This conclusion was based on such findings as "Mostpeople in 15 of the 16 countries surveyed, rated the environments of their countries asonly fair or poor." Such a conclusion is critical, for it could suggest that stringentgovernment policies would be welcomed, if not demanded, by the publics in bothindustrial and non-industrial nations.
Apart from the fact that the surveys were highly variable in sampling size and design,they were drawn exclusively from major urban areas, with all this implies about literacy,general sophistication, and attitudes toward national issues. But there are more seriousproblems of bias with the sequence and format of the questions. The way in which theHarris questionnaire was introduced immediately tipped off respondents that thesubject of the interview was environment, defined in a vaguely positive way:"Hello...We are conducting a survey of public opinion in this country and othercountries about the environment-the world we all live in." The introduction wasimmediately followed by three items21 eliciting an evaluation of the environment, which,again, was somewhat positively defined for the respondent as "the land, the sea, theair, the rivers and lakes and the climate."
In the questions that follow, "don't know" or "not sure" responses were accommodatedin the coded response categories, but never incorporated as a response alternative intothe questions themselves. This will inflate the proportions who appear to have anopinion.22 Rarely are "not certain" responses reported as higher than 3 per cent, evenin the LDCs. For the following question, which could confound the average collegegraduate, a mere 8 per cent of the total sample (and only 9 per cent in the four Africansamples) were reported to be not sure.
" If you had to make a choice between having building and industrial developmentwhich might endanger the health of some people but would make jobs for peopleand a better standard of living, or living conditions where the air was good, the
193

water was good, and the health of people was much better, which would youchoose—a situation where there would be a better standard of living but with realhealth risks, or a less good standard of living but with much less risk to humanhealth?"
When respondents have no opinion, are uncertain or ambivalent, they are especiallysusceptible to suggestion, that is, to loaded questions or to what they think theinterviewer wants to hear. In the Harris survey there is considerable evidence ofquestions loaded in the direction of eliciting concern for the environment. For example,each of ten items on pollution is preceded by the phrase "How much of a danger doyou think that kind of pollution will be in your country in the next five years—veryserious, somewhat serious, not very serious or not serious at all" (emphasis added).Thus, in order to indicate lack of concern, a respondent had to deny the impliedexistence of a danger.
Most of the ten pollution questions, moreover, are vividly and negatively colored. Forexample, "How much of a danger is:
...drinking water that will make people sick?
...air which is polluted and makes breathing more difficult?"
Batteries of items follow, most of them further informing the respondent about specificdangers. Thus, a set that asks whether each of a number of items constitutes "a majorproblem, a minor problem or not a problem" contains such loaded examples (emphasisadded) as:
"The danger of radioactivity from nuclear power plants."
" The dangerous use of chemicals used to control pests or weeds."
A set of eight agree-disagree items included such loaded statements as:
" Unless something is done urgently about controlling the environment in the world,the land will become desert, the oceans will flood over onto the land, and theearth will hardly be fit for human life."
" With industry dumping dangerous toxic wastes, people polluting the air withfumes from cars, and factories giving off polluted smoke, the health of futuregenerations of children is in real danger."
In order to assess the balance of positively and negatively worded statements, Iclassified each of the survey's 102 substantive questions according to its loading. Theexamples I have already given illustrate negative loadings. An example of a positivelyloaded item (one in which environmental circumstances are favorable ornon-problematic) would be: "People have always lived with some pollution in the airand water so why be upset by it now? Do you agree or disagree?" An example of aneutrally worded item is: "Do you feel the environment where you live has becomebetter or worse in the last 10 years, or has it stayed about the same?"
A tabulation of the 102 items found that 38 of them were neutral, 62 negative, and onlyone or two positive.
Population in the Ham's Poll. The Harris poll asks only one question on population outof the hundred odd items: "Do you think the growth of population has been a majorcause, a minor cause or not a cause of pollution to the environment?" The same formatwas used for 10 subsequent items such as pesticides, the dumping of toxic chemicals
194

and the cutting of forests. In the unweighted total sample (7072 cases for all nations),population is at the bottom of the list as a major cause of pollution, along with soilerosion. Only 45 per cent of the combined public samples considered either of these tobe a major cause of pollution, compared with more than 80 per cent for various kinds ofindustrial practices, 69 per cent for inadequate government policies, and 61 per cent forthe failure of countries to cooperate. The same ranking holds among the sample ofleaders, 50 per cent of whom judged population to be a major cause of pollution.
Some of the differences among nations do not appear unreasonable (Table 2). It isperhaps not surprising that India, with its lengthy record of population planningregistered the highest level of public and leader perception for the importance ofpopulation; and it seems plausible that the nations with the slowest rates of populationgrowth, such as the European, would have the lowest levels of public concern.Mexico's very high levels might be due to their extensive mass communicationprograms on population, as distinct from Argentina's pro-natalist policy.
Table 2. Percent who "think the growth of population has been a major cause ofpollution or damage to the environment," by Nation and Sample
ArgentinaJamaicaMexicoBrazil
ChinaIndiaJapanSaudi Arabia
KenyaNigeriaSenegalZimbabwe
HungaryNorwayW. GermanyAll Countries
General Public
36477850
37793937
70405856
22303945
Leaders
18466748
34805635
66363678
27625450
Source: Harris, 1989
Less credible, however, is the low significance attributed to population in China, whereboth leaders and the public have been heavily saturated with population controlpropaganda. That China is at the same level as highly pro-natalist Saudi Arabia strainscredulity, as does population's high ranking in Kenya. Of course a single question isnot to be trusted on any survey, and the diverse sampling designs in this survey could
195

also be responsible for such differences. More detailed analysis of the data (e.g.,controlling for social and economic characteristics) might also help to account for them.
777e Gallup Survey. In 1992, a second cross national opinion survey of mammothproportions was carried out, this time under the sponsorship of the Gallup InternationalInstitute. "Representative national samples of 1000 or more citizens" were interviewedin 24 nations around the world, the project funded by governments, foundations,business organizations and Gallup affiliates (Dunlap, Gallup and Gallup, 1992). Thequestionnaire is much superior to Roper's and avoids many of the problems of questionloading discussed above. A most important distinction is that its first question, prior toany information as to the subject of the interview, is an open-ended one that asks therespondent to name "the most important problem facing our nation today." This formatenhances the analyst's ability to assess the priority level of environmental concern,before potential contamination by batteries of questions on the environment. Inresponse to this question, no more than about 10 per cent of the samples in NorthernAmerica, Russia, Germany, Great Britain, Hungary, Poland and Norway mentionedenvironmental problems. This is by no means a trivial proportion, but yields a muchdifferent picture than is gained from direct questions asking the respondent for thedegree of his/her concern. Moreover, in the one country (Ireland) where respondentswere aware, prior to the questions, that the subject of the study was the environment,39 per cent mentioned environment as the number one problem.23
The Gallup survey did in fact ask respondents to rate how serious a problem theyconsidered environment to be, but also asked the same questions about crime, theeconomy, health, prejudice, and homelessness. Thus, the finding that majorities in 12of the 22 countries rated environmental problems as "very serious" becomes far moremeaningful when we discover that in 11 nations environment is among the three mosthighly rated problems and in none is it the lowest rated problem.
The Harris survey's second question ("How would you rate the environment in thiscountry—excellent, pretty good, only fair, or poor?") was very similar to Gallup'ssecond question ("Overall, how would you rate the quality of the environment of ournation—very good, fairly good, fairly bad or very bad?").The Gallup study reports onlythe percentages who responded "Fairly bad or very bad" so that I will compare thesewith Harris respondents who replied "only fair or poor" in the eight countries surveyedby both agencies (Table 3).
Table 3. Percentages Who Think Their Nation's Environment is Poor, Harris andGallup Compared
BrazilMexicoIndiaJapanHungaryGermanyNorwayUSA
HarrisPercent "only fair or
poor"
8085838385835564
GallupPercent "fairly bad or
very bad"
4955515272421146
HarrisPercent "poor"
2951482739301320
196

By this comparison, far more concern about the environment is expressed in the Harrissurvey, in which respondents were informed about the nature of the interview.24 Inmost instances this difference is about 60 per cent (30 percentage points). In the caseof Germany, twice as many express concern, and in Norway five times as many.
Of course, the Gallup study is based on national samples, while the Harris subjects areurban; but in the case of India the Gallup sample happens also to have been 90 percent urban and the differences are just as large as in countries where the sampleincluded rural populations. It could be argued that Gallup's "fairly bad and very bad"reflects more concern over the environment than the Harris1 "only fair or poor," and thatthe Harris equivalent should be "poor." By this measure, concern drops radically in theHarris sample, and, in five of the eight countries, falls below concern as expressed inthe Gallup survey (Table 3, Column 3).
We may conclude that the measurement of "concern" can be much affected by thestudy's introduction, and that slight changes in question wording or categorizing canhave major impacts on the conclusions. Concern for the environment is widespread,but not so intense as the Harris data and conclusions imply.
Population in the Gallup Survey. Something of an exception to the general neglect ofpopulation in environmental polls is found in the Gallup survey, since it included fourquestions on atttitudes toward population. Early in the questionnaire (question 5),respondents were asked the open-ended question "What is the most importantenvironmental problem facing our nation?" In none of the 22 nations was populationmentioned most often or second most often; and only in India was it the third mostfrequently mentioned problem. Either population is not viewed as a priority problem ofthe environment, or it simply is not associated with environmental problems.
Some light on this is provided by a subsequent question in which six "possible causesof our nation's environmental problems" were read to the respondent, who was askedhow much each "contributes to environmental problems here in our nation—a greatdeal a fair amount, not very much, or not at all." The first problem listed was"Overpopulation—there are too many people using up resources."
Using data from Dunlap, et al. (1992: Table 4), I classified seven countries as LDCs(India, Philippines, Turkey, Chile, Mexico, Brazil and Korea) and 15 others as moreindustrialized. In the average LDC, 50 per cent believe overpopulation contributes agreat deal to national environmental problems, as compared with only 15 per cent inthe other countries (unweighted means). Compared with the other five problems,overpopulation scores highly among the LDCs, but comparatively poorly among theindustrial nations. This suggests, first, that overpopulation is not readily associated withenvironmental problems for most respondents. However, when population is identifiedas an explicit alternative, LDC respondents rate it as a very important contributor toenvironmental problems in their nations, while respondents in the more developednations do not.25
While the Gallup questionnaire is clearly superior to the one used by Harris, thequestionnaire seems too difficult for illiterate or semi-literate respondents.Unfortunately, proportions of non-responses and "don't knows" have not been reportedthus far. My supposition is that the samples are biased toward upper educatedrespondents in the LDCs or that there are unacceptably high proportions of non-responses.
197

7. The Neglect of Population in Recent Surveys
Despite the volume of data gathering that we have seen devoted to the environment, arecent review concluded that:
" The work that has been accomplished to this point does not constitute adequatebase-line data It does not provide comprehensive coverage of countries ortopics. The questions that have been used are seldom comparable on a globalbasis. The sample frame has been based on political and administrativeboundaries with the result that the samples cannot be used to address manyenvironmental issues. Most of the work to date has been primarily descriptive,designed to measure public concern about different environmental problems. Fewof these surveys have been designed to explore changes in attitudes andbehavior" (Jacobson and Miller, 1993).
As inadequate as they may be, poll data on the environment are nonetheless strongerthan they are on population. Although questions and surveys on the environment haveblossomed in recent years, questions and surveys on population have not. Anexamination of recent polls on environment finds them short on population:
In 1992 the ISSS (International Social Science Survey) conducted a 21 nationpoll that contained 130 items on the environment. Items ranged from attitudestoward astrology to animal rights, but no attitudes toward population wereincluded.
A British survey by MORI in 1990 queried respondents about 18 environmentalproblems ranging from destruction of tropical forests to uneven pavements.Population as a problem was not included. Similarly, MORI surveys of BritishMP's and MEPs attitudes toward the environment have not included populationattitudes. Three 1990 MORI surveys contained 16 environmental behavior itemsthat ranged from avoiding chlorine-bleached nappies to buying free-range eggs.Population-relevant behavior has not been included (Worcester, 1993).
Eurobarometer polls in 12 European countries have asked about personalbehavior that might directly or indirectly affect the environment; e.g., littering,financial support for environmental associations, etc. Population-related behaviorwas not included.
In a review of longitudinal poll data, Dunlap and Scarce (1991) unearthed a totalof 46 environmental questions that have been administered by nine major USpollsters.26 Population was not among the questions.
Also in the USA, Cambridge polls in 1987 and 1989 asked respondents toregister their degree of concern for a list of ten "potential environmental threats"ranging from pesticides to greenhouse effects. Population growth or density wasnot listed as one of the threats (Dunlap, 1991:111).
8. Conclusions
According to one authority "Several forces are converging to create powerful pressuresfor conducting research on links between population growth and environmental quality"(Preston, 1993: 600). In this paper, various aspects of the knowledge base for such
198

research have been appraised and found to be weak. This is especially true of the linksbetween population and environment, which have received little scholarly attention, butit is also true for the study of population, where productivity has not kept pace with thatof the environment.
In terms of public awareness, poll data are highly vulnerable to sampling andquestionnaire defects, but available evidence suggests that environmental awarenessand concern are more widespread than population concern. Thepopulation-environmental linkages, probably poorly understood by the general publicsof most nations, are often ignored by governments, indicating the need for moreresearch on (if not education of) decision makers.
To facilitate policy, better data and analyses of public and elite opinion on populationand the environment are needed. Both topics should be contained in the sameinstruments, and the instruments and sampling designs should be replicated in asubstantial number of industrial and non-industrial nations.
As for population, greater concentration is needed on attitudes toward demographicvariables such as growth, size, distribution and migration. Such variables should referto world, national, and community levels. Information on behavior motivated bydemographic norms and attitudes is also needed.28
Analysis must move beyond descriptive statistics to include multivariate methods. Thedegree of consistency among various techniques such as content analyses, directqueries and expert assessments needs systematic evaluation.
The World Fertility Survey, with its carefully designed samples and questionnaires, canprovide a general guideline for a world public opinion poll on population and theenvironment. Its shortcomings need not be repeated, and the lessons learned from thedeficiencies of other poll data should be helpful in creating a superior multinationalsurvey of population-environment knowledge, aptitude, and practice (PEKAP).
Footnotes
'"Sociofile abstracts journal articles in the field of sociology and related disciplines,such as anthropology, economics, education, medicine, community development,philosophy, demography, political science, social psychology and planning. Coverageis international" (Dialog, 1986).
'Popline's coverage includes demography, human fertility, censuses, economic andsocial characteristics, biological characteristics, population policy and maternal andchild health. It includes unpublished reports and foreign language publications. "Global"is the more inclusive search, and corresponds roughly to "Basic Index" in Sociofile."Keyword Major" identifies the major theme of a publication and is roughly comparableto Sociofile's "Descriptor".3Some critics have even expressed doubts about the depth of commitment ofinternational donor agencies best known for promoting population policies. Thus,Lester Brown (1991:17) has stated that "the World Bank officially recognizes the needto slow population growth, but contributes little to doing so. The Secretary-General of
199

the United Nations rarely mentions population, much less provides leadership on theissue."
""the reported scores represent the authors' best judgment as to the score indicated bythe data received...instead of taking the average of all answers..." (Lapham andMauldin, 1985: 122). Whether this is an advantage or a disadvantage depends on theexpertness of the experts.
The only major Latin American countries that mentioned population growth wereMexico, Ecuador, El Salvador and Guatemala Among the African minority that failed tomention population problems were South Africa, Chad, Zambia, Zaire and the Congo.In Asia, Thailand, Turkey, Iraq, Jordan and North and South Korea are among thosethat failed to mention population.
These are occasionally assessed by content analysis. For example, Wilmoth and Ball(1992) traced U.S. opinion on population 1946-1990 by content analyzing a sample of548 magazine articles that were among the 1683 on population they found indexed inthe Readers Guide to Periodical Literature.7AII 41 internationally funded LDC surveys, and most of the others, produced detailednational reports. Moreover, the central office produced about 80 scientific reports, 50multi-national comparative studies, 11 technical bulletins, 12 methodological studies,and "at least 500 analytic projects based on WFS data" (Cleland and Hobcraft, 1985:3). At the very least, "these papers probably contain more information about thepractical methods of survey taking and interviewing in developing countries than hasbeen published in any previous enquiry" (Grebenik, 1981: 25. Cited by Blake, 1983:154).
*At first the issue was considered to be so sensitive that policy objectives were notexplicitly mentioned in the original design of the project, since "a strong emphasis onthe role of WFS in providing much needed data for policy-making in the populationfield could have limited the response from countries and the full collaboration of thenecessary local institutions and personnel" (Gille, 1985: 273).
"Among the specific policy consequences for particular countries, drawn from Scott andChidambaram (1985) are: (1) The National Family Planning Association in theDominican Republic based a new program on the strong demand for femalesterilization revealed in the WFS; (2) data proving extremely high fertility in Kenyaprecipitated the creation of the Integrated Rural Health Family Planning Program; (3)the Turkish Ministry of Health used WFS data to win Parliamentary support for a law onfamily planning; (4) WFS results in Cameroon and in Nepal helped move thesegovernments to form National Population Commissions; (5) The discovery ofsurprisingly low rates of contraceptive prevalence in Pakistan were influential in theformulation of its Sixth Five Year Plan.10Based on a wide variety of survey findings, age may be the most critical demographicvariable in accounting for variation in environmental attitudes and behavior (Black,1993). Further, attitudes on the environment may be shaped (or more easily shaped)during formative years, and young people provide a readily accessible target to policymakers (via schools and youth organizations).
200

"Miller and Jacobson (1992: 177) argue that "An important theory—the theory ofdemographic transition—provided a framework for the survey," but this theory is toogeneral to have provided much guidance.12POLL is produced by the Roper Center for Public Opinion Research. Despite thelarge number of polls covered in the Roper Center Archives, not all commercialagencies share all of their data with the Center.
"Public interest in population may have been waning during this period. A contentanalysis of articles on population in American magazines found a decline in the numberof articles on population from about 1970 on. However, among the articles devoted topopulation, the topic of population and the environment "goes from being a non-issuein 1946 to being the single most frequently invoked anti-growth argument in the 1980s"(Wilmoth and Ball, 1992: 651. See footnote 6.)
"According to the editors, The data are drawn from surveys...by polling organizationswhich, in the judgment of the editors, are engaged in research of the highest scientificquality..." (Hastings and Hastings, 1991: xi).
"Some surveys have been multi-national, such as those sponsored by the EEC andGallup International. In such cases, where the same question has been used in anumber of nations, the same item has been counted several times.16The birth control category includes attitudes toward abortion, sterilization, the pill,family planning commercials and government expenditures on family planning. Familyattitudes include ¡deal family size, desire for more children, adoption, spacing, etc.
'These countries include Spain, Austria, Norway, Finland, Sweden, USSR, HongKong, Korea, Taiwan, Philippines, South Africa, Gabon, Peru, Chile, and Colombia.With less than one-fifth of its items dedicated to population, the USA is near thebottom, while Canada, with 45 per cent, is at the top.
'The correct response was 50 years. Responses 45 to 60 years were consideredcorrect.
'"Concern was about the same for Catholics and non-Catholics, but was higher amongthe better educated in both surveys (Kantner, 1968). The latter relation could beexplained by superior demographic knowledge on the part of the better educated, butthe hypothesis was not tested. A similar blind spot occurs in an analysis of two othernational samples of married women in the U. S. National Fertility Surveys of 1965 and1970. Finding very low levels of demographic knowledge in both samples, the analystconcluded the "the fact that only one respondent in four knew or could guess thecorrect size indicates that attitudes about population growth are not being informed byknowledge of the size of the population" (Rindfuss, 1972: 465). However, since across-tabulation between knowledge and attitudes was not reported, the irrelevance ofthe former cannot be assumed.
^In addition to polls by Gallup and Hams, a multi-national survey has been conductedby the International Social Science Survey, but results are not yet available.2The third of these items ("How would you rate the environment in this country-excellent, pretty good, only fair, or poor") is of special significance, since the reportleans on responses to it for the conclusion that the survey revealed "deep andwidespread concern".
201

^Question wordings also failed to include critical middle positions as alternatives.Thus, nine items ask how things will change in the next 50 years, but allow only twoalternatives: "Will there be more or less deserts? Will there be cleaner or dirtier air?Should this country be doing more or less...to protect the environment...?" (emphasisadded). Responses to such questions tend to understate the degree of indifference oruncertainty.
^Although it is likely that Ireland's high degree of apparent concern was influenced byfore-knowledge of the subject, one other of the 22 countries (the Netherlands) alsorated environment this highly, presumably without such knowledge. In these countriesand one other with a relatively large proportion citing environment as the number oneproblem, smaller proportions rated environmental problems as "very serious." Thus, inthe Netherlands, although 39 per cent mentioned the environment as the mostimportant problem, only 32 per cent felt environment was a "very serious" problem. Invirtually all other countries, far higher proportions regarded environment as a veryserious problem than volunteered it as the most important problem. Examples are theU.S. (51 per cent and 11 per cent, respectively) and Poland (66 per cent and 1 percent, respectively).24The two polls agree on only two points: in both surveys Norway shows the lowestconcern about the state of its environment, and, within each poll, the levels of concernamong the three LDCs are about the same.
"Another question asked how much overpopulation, consumption of resources, andmultinational companies contributed to environmental problems in LDCs. In mostcountries, substantial proportions rated overpopulation as contributing "a great deal" toenvironmental problems—an average of 47 per cent in the seven LDCs, and 38 percent in the 15 others (Computed from Table 10, Dunlap et al., 1992).
^In an early review of those analyses that have reported correlation coefficients forenvironmental variables, Van Liere and Dunlap (1980) found only one population scaleamong 21 studies.
"Barnett (1970: 59) found that among a small sample of American women, there wasonly a moderate correlation between demographic concerns and the belief that couplesshould restrict fertility to avoid overpopulation. In 1970 he predicted that "a strongcorrelation will develop by the mid-1970s...stemming from the continued pollution ofthe environment with people and chemicals." It seems time to test the hypothesis.
References
Back, K. and H. Winsborough. 1968-69. Population policy: Opinions and actions ofgovernments, Public Opinion Quarterly, 32.
Barnett, LD. 1970. U.S. Population growth as an abstractly-perceived problem,Demography, 7(1).
Berelson, B. 1974. Population Policy in the Developing Countries. New York: McGrawHill.
Berelson, B. 1966. American attitudes on population policy, Studies in FamilyPlanning, 9.
202

Black, A. 1993. Privately circulated memorandum, May 8.
Cleland, J. and J. Hobcraft. 1985. Reproductive Change in Developing Countries.Oxford: Oxford University Press.
Dialog. 1986. Dialog information retrieval service. Sociological Abstracts.
Dunlap, R.E. 1991. Public opinion in the 1980s: Clear consensus ambiguouscommitment, Environment53(8):10-15; 32-37.
Dunlap, R.E. and R. Scarce. 1991. The polls. Poll trends: Environmental problems andprotection, Public Opinion Quarterly 53:651 -672.
Dunlap, R.E., G.H. Gallup, Jr. and A.M. Gallup. 1992. Trends in public opinion towardenvironmental issues: 1965-1990. In R.E. Dunlap and Mertig A.G., eds., AmericanEnvironmentalism. Philadelphia: Taylor and Francis.
Dunlap, R.E., G.H. Gallup, Jr. and A.M. Gallup. 1992. The Health of the Planet Survey,George H. Gallup International Institute.
Dunlap, R.E., G.H. Gallup, Jr., and A.M. Gallup. 1993. Global environmental concern:Results from an international public opinion survey. Environment 35 (in press).
Eldridge, H. 1968. Population policies, International Encyclopedia of the SocialScience.
Farooq, G. and E.M. Pemia. 1988. UN Population Bulletin.
Gille, H. 1985. Policy implications. In J. Cleland and J. Hobcraft. eds. ReproductiveChange in Developing Countries. Oxford: Oxford University Press.
Grebenik, E. 1981. The world fertility survey and its 1980 conference: InternationalStatistical Institute. In J. Blake, 1983. Book review, in Population and DevelopmentReview, 9.
Harris, L and Associates. 1989. Public and Leadership Attitudes to the Environment inFour Continents, Study #884002.
Hastings, E.H. and P.K. Hastings. 1991. Index to International Public Opinion1989-199O.,Nevj York: Greenwood Press.
Institute for Resource Development. 1990. Model 'A' Questionnaire, DHS-II BasicDocumentation Number 1.
Jacobson, H. 1992. Proposal for a workshop for the global omnibus environmentalsurvey, unpublished document.
Kantner, J. 1968. American attitudes on population policy: Recent trends, Studies inFamily Planning 30.
Lapham, R.J. and W.P. Mauldin, 1985. Contraceptive prevalence: The influence oforganized family planning programs, Studies in Family Planning 16(3).
Milavsky, J.R. 1991. The U.S. public's changing perceptions of environmental change,1950-1990, In K. Pawlik. Ed., Perception and Assessment of GlobalEnvironmental Conditions and Change (PAGEC): Report 1. Human Dimensions ofGlobal Environmental Change Programme of the International Social ScienceCouncil.
203

Norris, P. n.d. Are we all green now? Public opinion towards environmentalism inBritain, unpublished manuscript.
Ortega, M. and M. Vaessen. 1987. Dissemination and utilization of findings andmethodology within countries. In J. Cleland and C. Scott, The World FertilitySurvey. Oxford University Press.
Preston, S. 1993. The contours of demography: Estimates and projections,Demography 30(4).
Rindfuss, R.R. 1972. Recent trends in population attitudes. In R. Parke and CF.Westoff, eds., Aspects of Population Growth Policy. Commission on PopulationGrowth and the American Future. U.S. Government Printing Office.
Robinson, W. 1975. Population and Development Planning. The Population Council.
Scott, C. and V.C. Chidambaram. 1985. World fertility survey: Origins andachievements. In J. Cleland and J. Hobcraft, Reproductive Change in DevelopingCountries. Oxford: Oxford University Press.
Segal, S. 1984. U.S. Population Assistance to Developing Countries: Gallup SurveyFindings, Press Release, Mexico City, Aug. 3.
United Nations. 1989. Trends in population policy. Population Studies No.114/ST/ESA/SER.A/114.
United Nations. 1990. Results of the sixth population inquiry among governments.Population Policy Paper No. 31/ST/ESA/SER.R/104.
United Nations. 1992. World population monitoring, 1991. Population Studies No.126/ST/ESA/SER.A/126.
UNCED. 1992. Nations of the Earth Report. Geneva: United Nations Conference onEnvironment and Development, Vols. 1 -3 .
Van Liere, K. and R. Dunlap. 1980. The social bases of environmental concern: Areview of hypotheses, explanations and empirical evidence, Public OpinionQuarterly 44(2): 181-197.
Watson, W. 1977. Family Planning in the Developing World.
Wilmoth, J.R. and P. Ball. 1992. The population debate in American popularmagazines, Population and Development Review\8, 4.
Wolman, D.M. 1972. Findings of the national commission's public opinion survey. InThe Commission on Population Growth and the American Future, 6.
Worcester, R. 1993. Public and elite attitudes to environmental issues, InternationalJournal of Public Opinion Research, (in press).
204

CHAPTER 10
POPULATION DYNAMICS, ENVIRONMENT, AND CONFLICT.WHAT ARE THE CONNECTIONS?*
Ismail Sirageldin(Department of Population Dynamics, School of Public Health, The Johns Hopkins
University, Battimore, Maryland, USA)
1. Introduction
Population dynamics is a discipline that deals with the determinants and consequencesof changes in the structure, growth and distribution of populations over time. Bystructure we mean the distribution of a given population by age and gender. There aretwo concepts of population growth. The first relates to total change in populationrelative to a base population size. Total change includes the balance of births, deathsand net international migration in a given period of time and within a given nationalboundary (conventionally called the rate of population growth). The second is beingdefined as the natural rate of population growth. This natural rate of population growthfocuses on differences in the vital rates of births and deaths, and excludes migration asa source of increase or decrease in population size. Indeed, in the case of a "closedpopulation," the two rates are equal. Distribution refers to the spatial distribution ofpopulation within a national boundary, such as rural-urban or regional balance within acountry. It also relates to measures of density. As will be evident from the followingdiscussion, population growth, structure and distribution constitute a consistent andinterrelated demographic sub-system of society. They are also an integral part of thelarger social, economic and environmental system.
The purpose of the present paper is to investigate the role of these basic demographicphenomena as a source of social and political conflict or disorder. Harmony and order,we must emphasize are not the norm in a world of continuous and acceleratingchanges in technological and environmental conditions. Many of these changes are notbeing confined to their areas of origin. Furthermore, not all changes are predictable.Many could be sudden and radical. Recent development in the super-highwayinformation technology is an example of such rapid technological change with manyunexpected and as yet unforeseen socio-economic and political ramifications.Uncertainty about changes in environmental conditions is illustrated by the case of theGreenland ice cores. Systematic observations of these cores questioned theconventional view of the stability of climatic conditions over long periods of time. Basedon such observations, it has been concluded that climate can change suddenly andradically. Will we have time to adapt to such unforeseen environmental andtechnological changes, especially where many of the consequences seem to have norespect for national boundaries? What is the role of population change, as a cause andeffect, in this process of universal change? More specifically, do population change
205

and structure reduce the adaptive capacity of the system? These are the questionsthat lie at the core of the present discussion.
By the adaptive capacity of the system we mean the extent of society's technical andsocial sustainability. Technical sustainability implies the ability of society to maintainover time the productive capacity of its core resource endowment. Social sustainabilityimplies the harmonious evolution of its social contracts and of the institutionsnecessary for the enforcement of these contracts, within and across generations, in theface of such changes. The dichotomy of the adaptive capacity of the social system intotechnical and social spheres parallels that of the material and cultural antecedents ofinstitutions. As Geoffrey McNicoll (1994:6) put it:
"Institutions .. emerge or are designed as ways for people to deal with recurrentproblems about material realities (resources, technologies, environmental conditions,human biology) and as manifestation of ideational systems that give some degree ofcoherence in the cultural domain of symbol and belief."
The main argument of McNicoll (1994:7) is that institutions are path-dependent. Theyare:
"A precipitate of time. They adjust (admittedly with some delay, and at times only,so to speak, with considerable provocation) to changing circumstances — say,shifting power relations among social groups or altered transaction costs. But thedirection in which they adjust depends not merely on those new circumstancesbut also, and crucially, on their past history."
From the perspective of the present discussion, the adaptive capacity of society,especially as it relates to conflict is a function of the mechanism by which institutionsevolve. The question as to how institutions evolve is yet unsettled. The recent researchprogram in sociology (e.g. Hechter, 1983), seems to be, on the one hand, an attempt toindicate the universality of a standard explanation or theory to all institutional settings,and on the other hand an overly optimistic program. The parallel in economics is theattempt to impose the atomistic Newtonian paradigm of the equilibrium of forces, withpossible growth but no genuine qualitative change in society, as the universalexplanation of social and economic evolution. In this paradigm, social structures areincidental. They are merely the children of a system of micro-behavior that is alwaysconsistent, optimal and independent of time. Recent literature on the behavior ofgovernment as a social and political institution is illustrative of the incidental nature ofstructures in this paradigm. In that "positive" framework, the evolution of government isa result of "agents" maximizing behavior, that is to maximize their length of stay inpower or their budget, subject to existing resource and power constraints. Theseconstraints are set by the existing distribution of wealth and political power! Indeed,under special conditions of perfect competition in the economic and political domains,this type of atomistic and collective welfare maximum may coincide. The world isimperfect, however. The causes of the imperfection are outside the paradigm.Understanding the sources of the constraints, whether economic, social or political isthe study of the structure of institutions. In the absence of such analyses, developmentis reduced to atomistic behavior on the margin.
The limitation of the atomistic paradigm has been discussed extensively In theliterature. A recent critical overview is in Floyd B. McFariand (1991). Many economistshave been wary of the universal application of standard theory to development
206

economics. This is best illustrated by Nicholas Georgescu-Roegen's (1971) statementin his classic work The Entropy Law and the Economic Process where he warnedagainst the indiscriminate application of the Newton-Smith equilibrium paradigm,especially to the case of developing countries:
"For the tenacity with which we cling to the tenet that standard theory is valid in allinstitutional settings—either because its principles are universally valid orbecause all economic systems are mixtures of some invariable elements—hasfar-reaching consequences for the world's efforts to develop the economy ofnations which differ in their institutionsfrom the capitalist countries. These consequences may go down in history as thegreatest monument to the arrogant self-assurance of some of science'sservants."
The focus of the paper is to examine the role that population dynamics play ininfluencing such adaptive ability. Our main claim is that social and political conflict is afunction of the adaptive capacity of society. We argue further that the effect ofpopulation change on society's adaptive capacity is context-specific. No generaltheory exists that encompasses all situations. The real world is inconvenientlycomplicated. Analyses can only produce conditional conclusions that are short ofuniversal generalizations.
The effect of population change on society's adaptive capacity depends, among otherthings, on the structure of the social and political systems. That structure includes forexample, the degree of society's ethnic and cultural homogeneity and the degree ofequity in the distribution of its income, opportunities and political power. The effect ofpopulation change depends equally on the ability of existing institutions to introducenecessary changes and, meanwhile, have themselves the capacity to adjust to suchchanges. We agree that the evolution of institutions is path-dependent. The atomisticNewtonian paradigm needs elaboration as to how history, present circumstances andexpectations interact to influence institutions through the aggregate of individualdecisions and behavior. There are three sets of institutions that, for purposes of thepresent discussion, define the social structure of society: namely government andgovernance as well as economic and social institutions.
First, we present an overview of population trends. This is followed by a review ofpotential mechanisms through which conflict may arise. Next, we discuss threeillustrative case studies from Sub-Saharan Africa, South Asia and the Middle East.Finally, we present some general conclusions.
2. Population Trends and the Demographic System
In this section, we review some key population trends. The review serves as the basisfor interpreting the consequences of these trends. To facilitate the discussion wedefine demographic concepts as we go along and introduce some basic demographicsystem identities. The relation between population change and conflict is a policy-oriented subject. Policy analyses include four levels: descriptive, explanatory,predictive and evaluative. Formal Demography provides the tools and technicallanguage to measure and describe the levels, movements and interrelations among thethree basic components of population change: mortality, fertility and net migration.
207

Descriptive demography also provides population projections. These are essentiallyscenarios that specify, given the initial age structure, the boundaries and limits withinwhich population change could occur over time. The level of explanation, prediction orthe cost-benefit evaluation of demographic phenomena, however, is beyond the basictools of technical demography. Here demographic analyses must join hands with alarge number of other methodologies and disciplines that range from biology,economics, and sociology to political and environmental sciences. We start with asimple framework to formalize the discussion.
A simple but fundamental demographic accounting identity relates population growthr(p) to its basic components as follows:
r(p) = Crude Birth Rate - Crude Death Rate + Net Migration Rate, or[1] r(p) = CBR - CDR + NMR
Clearly, the size of r(p) depends on the difference between the two vital rates of birth(CBR) and death (CDR), assuming international migration (NMR) is not a significantfactor. Not immediately obvious, is the presence of a direct relation between the levelof fertility and the age structure (or the age pyramid).
High fertility that persists for a few generations produces a young age structure wherethe bottom of the age pyramid is fairly wide. In this situation, the young, say thoseunder age fifteen, compose a large proportion of the population, typically 40 per cent ormore compared to about 20-25 per cent in societies with older age distributions. Whilethe old, say 65 and older, make up less than 5 per cent of the total populationcompared to 15-20 per cent in older age structures. This pattern of high fertility andyoung age structure has been the typical case in almost all the developing countriesthrough the 1970s. With fertility continuing at relatively high levels, the remarkabledecline in mortality that started in the 1950s did not have a significant effect on theyoung pattern of the age distributions in the developing countries. Its main effect hasbeen to produce high rates of population growth (World Bank, 1993,1994).
A systematic decline in fertility in some developing countries started in the late 1970s.It was led mainly by East Asian countries: Korea, Taiwan, China, Hong Kong andSingapore experienced a remarkable decline. These were joined more recently byThailand, Malaysia and Indonesia. By the late 1980s, fertility in most of the developingcountries, regardless of the level of their development or cultural background, seems tohave started a sustained decline. On the whole, birth rates have declined by one-thirdsince the mid-1960s: women formerly had six children on average, but only four by thebeginning of the 1990s. This apparent trend led some observers to conclude that:
"The developing world is undergoing a reproductive revolution. In contrast to theclassical demographic transition, recent evidence suggests that birth rates in thedeveloping world have fallen even in the absence of improved living conditions.The decrease has also proceeded with remarkable speed. Developing countriesappear to have benefited from the growing influence and scope of family-planning programs, from new contraceptive technologies and from theeducational power of mass media." [Emphasis added] (Robey, Rutstein andMorris, 1993).
208

Some observations on this 'reproductive revolution1 are in order.
1. These trends are not universal. As indicated in Figure 1, the decline in fertility hasbeen lagging in some regions and countries, i.e. Sub-Saharan Africa and someArab and South Asian countries. Indeed, such variations are expected, asillustrated, for example by McNicoll's (1994:26-34) five fold typology of broadpatterns of fertility transitions. Variations depend on how institutions adapt.
2. Despite the observed decrease in birth rates, the world population will continue togrow at high rates. It is expected to double to 10 billion by 2050. For somecountries the increase will continue well through the middle of the next century.
3. The reason for the large increase in population size in the face of declining fertilityrates is the momentum built into the young age structure of the populations of thedeveloping world. For example, if India adopts a replacement level of fertilityimmediately, its population will continue to grow until the sizes of its variouscohorts equalize, thus reaching a stationary state. In this transition, India's agestructure will change from its original young triangular shape towards a stationaryrectangular shape, as illustrated in Figure 2.
4. Moving from a young age structure, typical for all developing countries, towards astationary state, a population will increase in size. That increase will be greaterthe younger the initial (stable) age structure. Furthermore, that increase inpopulation size will be concentrated in that part of the population above 30 yearsof age. This process is illustrated in Figure 2 for the case of India. In thishypothetical case, between 1995 and 2025, the size of the 30-35 age group canbe expected to increase from about 70 to 100 million people. In this scenario, forthose who are less than ten years of age, population size declines from about230 to 210 millions (Kim, Schoen and Sarma, 1991).
5. The socio-economic significance of the concentration of growth in the older agegroups (over thirty years old) needs no emphasis. It is probably a major potentialsource of conflict in the process of population change. It increases the supply ofpotential workers in society. It also increases the relative claims of the elderly. Ifoutput and productivity do not increase fast enough, unemployment and potentialinter-generational conflict may arise.
6. Concentrating on fertility and its effects on the age structure ignores otherimportant consequences of fertility decline. An established high level of fertilityreflects a structure of local values, traditions and social contracts. That structurerepresents the foundation and stability of the existing social and political order. Itimplies an established distribution of income, wealth, power and authority. Newpatterns, especially those perceived as foreign, pose serious challenges to theprivileged status of the existing authorities. Such challenges do not proceedwithout resistance. It is emphasized that even in social structures that have beenestablished for long periods, values are not universal. At any time, there exists acertain degree of value heterogeneity. This should not be confused with thecontinual changes in the overall value system being induced through innovationsand technical change. The policy challenge is to maintain the diffusion of socialinnovations within the ability of society to absorb its new value implication. Thatchallenge is not always met.
209

— oO0
OK»
Ü
OCOa.
CO
in
TJre
m
|
1y.,
CD
?
•j.
_ -o» o
CD •>• _
r-eo a N I D— o> o> f-o»o>
COO
uoo
» 0 ¿0 0 Co> o> re
reo- c>—oí reoí o> j r- - O
|̂_|_J u¿j *re .•= ~ o> c «>«0o ^ m ^ ñ(^o a> 0<D <D OJO n v a
- - S «SS »2S SSS •§£2 £§í"** Z 0 ~ CO""- « S S Kj *"So> roen a
m-CM .Ö
— oocoso¿2 « »i201 O)
roCD
roütu
•ocroroo
a3E <oo iS — CD
0
D.<DŒCreo o
TJro O) ai3 ** «
"ció
oO
!LU!«»0 £
C/5 K. 0 reo>a> 3
ID - - ü
oo>a
T>Ca
TJa
COM 2— o
p p~<o x so ¡¡'«•o» i r r ' » c«10a» • ««» « 2 2 COK.- —
Figure 1. Recent changes in fertility rates in some developing countries, after Robey,Rutstein and Morris, 1993.
210

Male
1995Total population 931 million
70 (0 SO 40 10 20 10Mi l t« !
10«7S-7»
70-74
ss-soS0-S4
4S-4»40-44JS-3ÍI0-Í42M»20-24is-ia10-14
SI0-4
•: ,.-,:.• ••• 1
...-•: . . . • : • • : , • . . . 1
. , . - - . . . - : |
• : • - . • : • . • :
Female
11............ 1
Male
2025Total population 1394 million
0 10 20 30 40 SO «0 70 «0 SO 44 JO 20 10 0
10«7S-7Í70-74(5-M*0-M
u-stS0-S4
4S-4Í
is-ia10442S-2t20-24IS-1110-14S-t»•4
TT| Female
lh
i
i
t1f
•
0 10 2« M 4« H «0
Figure 2. Projected age structures of India, 1995 and 2025, after UN, 1993.
"If such development-induced change proceeds too fast, relative to the ability ofthe social system to absorb it [to become endogenous to society], resistance tochange may turn into revolt against change and ignite revolution against theestablished regime. The result of these dynamics could be the emergence of anew development paradigm that builds upon threatened traditions, or an attemptby the established regime to accelerate the process of change...Establishedregimes may fear the loss of legitimacy and may divert scarce resources tosecurity issues through costly repressive means or through a non-sustainablesystem of subsidies and employment guarantees, away from their countries'long-term development priorities. Alternatively, established regimes may seekalliances with foreign powers that, on the surface seem to be an attempt toaccelerate the modernization effort, but mostly are an attempt to seek protectionagainst the opposing forces that represent established traditions" (Sirageldin,1992:50).
7. Migration is the third element in the demographic accounting of Equation 1.Migration is probably the most important population factor underlying the overallstability of the socio-economic system - at least in the short run. For example,resistance to change depends on:"...the structure of the social system, the degree of its openness, e.g., acceptanceandassimilation of immigrants. A tribal social system, a commune-canton Swiss-
type system, or a subsistent rural community are examples of relatively closedsystems with strict socialization processes that limit the domain of individualactions" (Sirageldin, 1992:50).
The acceptance of controlling immigration as a legitimate exercise of nationalsovereignty is not much disputed in international law and relations. Such movementswhether legal or not do occur, however, on a large scale. In many instances the resultscreated conflict and violence. For example, it is estimated that in 1992, there were 21.6million refugees around the world. These were distributed as follows: 9.89 million
211

refugees in Asia, 5.39 million in Africa, 4.38 millions in Europe, 1.04 million in NorthAmerica, 0.89 million in Latin America and 0.06 million refugees in Oceania (PopulationAction International, 1994). Movements of refugees are partly a result of conflict inareas of origin and a cause of conflict in areas of destination. The sovereignty of thenational state to regulate such movements is not disputed as mentioned above.
The exercise of the state role in the internal distribution of population has not been freefrom conflict. It must be noted, however, that although the economic and socialconsequences of migration seem current and visible, its determinants could be á resultof deep rooted historical foundation. It could be triggered by unexpected andsometimes irrational incidences creating costly conflicts. There are many suchexamples in recent history as well as in today's world. The role of migration as asource of conflict is examined below. First the relation between population change andconflict is examined on the conceptual level.
3. Modeling Population Change and Conflict
3.1. Population and Development
It was noted earlier that population dynamics is a subsystem of the larger socio-economic system. The demographic identity of Equation 1 could be incorporated in alarger identity that relates population growth to the growth rate of national output. Thatlatter rate includes the rate of net human and physical capital accumulation as follows:
[2] r(p) = r(Y) - r(y)
[3] r(y) = {S/K} - {CBR - CDR + NMR}
r(p), r(Y) and r(y) refer to rates of growth of population, GNP and per capitaGNP respectively. S and K refer to the saving ratio and the incremental capitaloutput ratio. (For details and references, see Ismail Sirageldin, 1991).
On a descriptive level, the Left Hand Side of Equation 2 indicates net human capitalformation and the Right Hand Side indicates non-human capital accumulation.Equation 3 illustrates that to maintain the same standard of living [r(y) = 0], investedsaving [S], and productivity [K] must accommodate net additions to the population[r(p)J.
However, development implies more than accommodating net additions at the samestandard of living. It implies an attempt to improve living standards for present andfuture generations. Representing the gap between current and desired status by d,Equation 4, represents required system adjustments as follows:
[4] d [r(y)] = d [{S/K} - {CBR - CDR + NMR}]
Although an identity, Equation 4 indicates that in order to accommodate the desiredchange, adjustments must be made in the socio-economic, demographic andtechnological components of the system. As we argued elsewhere (Sirageldin, 1991),these are not marginal adjustments. They include basic interrelated developmentaltransformations: demographic, mobility, human capital, agricultural, technological andinstitutional. An example of the interrelations between demographic and agricultural
212

transformations is given in Sirageldin (1993). Both transformations must act in concert.It seems rather impossible to increase significantly labor productivity in agriculture, forexample, through a massive mechanization program without an equally massivespatial and occupational mobility in the short and medium terms, and a parallel declinein fertility to insure stability in the longer term. The interactive nature of migration andfertility on the stability of the socio-economic system is often overlooked. For example,it was found that rural-urban migrants are selective on low fertility. The agriculturaltransformation accordingly will not be as smooth (Ahmed and Sirageldine, 1993).
The developmental policy challenge is to facilitate and achieve, with minimum socialand environmental costs, a sustainable completion of these transformations, byminimizing the imbalances between the two basic accumulations of human and non-human capital. Imbalances between human and non-human capital accumulation dooccur, however, in the normal course of socio-economic change. Population growthmay exceed or lag behind the rate of non-human capital accumulation and the growthof either accumulation may exceed environmental tolerance. The question is: underwhat conditions are societies able to cope with imbalances? In many instances, withininstitutional and technological limits, societies could cope with demographicimbalances. A celebrated mechanism is through the introduction of labor-intensivetechniques in agricultural production that increase the demand for labor (see Boserup,1965).
Beyond such limits, however, where imbalances are associated with unemployedresources or unfulfilled aspirations, demographic forces take hold through increasedmortality, reduced fertility, or forced migration. These may be associated with unrestand conflict within or between countries. What are the conditions for such latterdevelopments?
3.2. Population and Conflict
What is the mechanism through which population changes create conflict? Clearlythere is more than one mechanism: resource scarcity, migration, expulsion, decreasedeconomic opportunities, or famine conditions. There are also many types of conflict:ethnic conflict, deprivation conflict, or coups d'etat. There are also various conditionsthat may enforce the relation between population change and conflict: inequality inaccess to resources or opportunities, ecosystem vulnerability, inefficient or weakgovernance and inefficient market functioning, among others. Indeed population is butone variable in a series of political, economic, social and environmental factors thatcan bring about turmoil and conflict. It is our view that the causal process that linkspopulation to conflict is contingent on the presence of these other factors. Two factorsplay important roles: unequal access to resources and the value imports of themodernization process in practice.
213

Indirect Factors Proximate Factors Conflict
Decrease inquality and quantity
of renewableresources
Unequalresource access
I nc re sedscarcity ofrenewableresources
WeakenedI states
I Coups d'etat
Decreasedeconomic
productivity.
| DeprivationI conflicts
Figure 3. Some sources and consequences of renewable resource scarcity, afterHomer-Dixon, Boutwell and Rathjens, 1993.
Lack of access to two basic resources, water and crop land, when combined with highrates of population growth seems to be a sure way to serious conflict. Figure 3 basedon Homer-Dixon, Boutwell and Rathjens (1993) [referred to hereafter as HBR]presents a framework that links the various factors, including population, to varioustypes of conflict.
The left-hand side of Figure 3 lists the three basic sets of factors that influence conflictindirectly through a set of proximate factors. These indirect factors include renewableresources [water and crop land], population change and unequal access to resources.The combined effects of these three sets of factors lead to increased scarcity ofrenewable resources. Scarcity of renewable resources increases the migration rate aswell as migrants' expulsion. It also decreases economic productivity. The combinedeffects of these two proximate factors affect conflict directly and indirectly through theireffects on the strength of the state. Migrants' displacement and productivity declinereduce the State's revenue while the State increases its spending as it deals with thedeteriorating circumstances. The result is to weaken the financial and political ability ofthe State. The combination of forced migration, decreased productivity and aweakened State leads eventually to deprivation, ethnic conflict and finally coup d'etat.
The strength of the HBR framework lies in its simplicity, clarity and flexibility. Althoughlacking some important feedback linkages, it serves as a starting point for thepreliminary analyses of specific case studies. Important feedback linkages that are
214

missing from the framework include those between environmental and populationchanges. These are illustrated by the dashed lines in Figure 3 [not included in theoriginal HBR framework]. A more detailed specification of the role of populationdynamics was attempted by HBR in their analysis of the case of the Philippines. This isillustrated in Figure 4. Here, the population factors play a prominent role, but continueto be exogenous to environmental and economic conditions. A fuller understanding ofthe role of population in this dynamic system should incorporate these feedbacklinkages. The cost however, is an increase in model complexity.
The simplicity of the HBR model helped to focus on the main policy issues. It tells thefollowing story about the Philippines experience. There are lowlands and uplands. Thelowland is rich, has a high population density and high rate of natural increase. Thelowland is exceeding its carrying capacity and provides limited labor absorptioncapacity. People from the lowlands start emigrating to the uplands. However, thenatural rate of population growth in the uplands is already high. The result is morecultivation of steep slopes, increased soil erosion and reduced per capita availability ofproductive agricultural land in upland areas. Upland welfare deteriorates. Uplandpopulations become less receptive to immigrants. Migration streams are redirectedtowards urban centers. The combined effects of these dynamic forces led to conflict asfollows:
1. Migration from lowland to highland created resentment in the receiving area
2. Both types of land experienced a decline in productivity, leading to the erosion ofthe state's tax base.
3. As a result of reduced productivity and labor absorptive capacity in both lands,migration streams moved to urban areas. The result is increased crime rates anddeteriorating health and social conditions, leading to conflict.
4. The weakened economic and political status of the state limited its ability to dealwith reduced agricultural productivity and to improve deteriorating urbansocioeconomic conditions.
The story is revealing and fits the Philippines setting at the time. It also leaves somepuzzling questions unanswered. There is a sense of unidirectional causation thatsuggests an inevitable outcome insensitive to economic or demographic feedback.What is the role of public policy in this scenario, especially in the early stages of itsdevelopment? To answer this question, the model needs to incorporate 'a theory ofgovernment' in order to introduce policy parameters and investigate farmers' andmigrants' responses to such parameters. We know from the earlier discussion thatreduced fertility today will not reduce the rate of growth of the labor force today ortomorrow. Jobs need to be created at an increasing rate to deal with the historicaldeterminism of the age structure. However, postponement of the fertility decline willonly exacerbate future consequences.
215

Migration lourban arcas
Soll aroslon ol asmuch as 300 lo 400
Ions p«r hectarep«r year on cleared
steep sk>p«sPotential lor urban
unrast, financialwtakanlng ol slat«
Lower per capitaavailability ol
productiva agriculturalland In upland area
Migration
to uplands
Natural populationgrowth of about
2 percent per yearIn uplands Increased peasant
receptivity lorural Insurgency
Limited absorptionol labour In rich
lowlands, populationgrowth In lowlands
Further uplandImpoverishment
Figure 4. The role of population dynamics in the Philippines, after Homer-Dixon,Boutwell and Rathjens, 1993.
What is missing from the framework is the role of social values, ethnicity, religion andracial tensions. These are probably easier to use as control variables than to model.They also interact with economic and resource availability factors. Their net effects arehard to estimate or predict. However, they seem to be at the forefront of most oftoday's international conflicts. The framework is equally silent on the adaptive capacityof social institutions. How it evolves and adapts seems to be outside the framework.
3.3. The Role of the State
As mentioned earlier, an important characteristic of a society that succeeds in reducingovert conflict is its ability to adjust to changing circumstances and take advantage ofopportunities. The role of the state in promoting such an ability has become anincreasingly controversial subject in recent years. For example, what is the degree ofefficiency implied in the markets of Figures 3 and 4? And what is the role of thegovernment in that case? The figures clearly imply a strong role for the state. This roleis also implied in the Robey, Rutstein and Moms (1993) discussion regarding theefficacy of family planning programs with strong public support and commitment.
The weakening of the state is taken as a result of adverse economic and socialconditions and a cause of the state's inability to avert conflict. Evidently, there ¡s adilemma as to the appropriate size and scope of state activities, especially as an agent
216

of development. This dilemma was set forth with clarity by Homer-Dixon, Boutwell andRathjens (1993:43):
"Dwindling natural resources can weaken the administrative capacity and authorityof government, which may create opportunities for violent challenges to the stateby political and military opponents. By contributing to rural poverty and rural-urban migration, scarcity of renewable resources expands the number of peopleneeding assistance from the government. In response to growing citypopulations, states often introduce subsidies that distort prices and causemisapplication of capital, hindering economic productivity. Simultaneously, theloss of renewable resources can reduce the production of wealth, therebyconstraining tax revenue. For some countries, this widening gap betweendemands on the state and its capabilities may aggravate popular grievances,erode the state's legitimacy and escalate competition between elite factions asthey struggle to protect their prerogatives."
There seems to be a general consensus that the state should promote the conditionsfor an adaptive economy. But what do we mean by a flexible or an adaptive economy?This is apparently a narrower concept than our earlier definition that included both'technical' and 'social' sustainability. The term, 'adaptive economy1 has been discussedin great detail by Killick (1993:47) who states:
"Expressed in its own terms, a flexible economy is one in which ends and meansare readily adjusted to changing constraints and opportunities. These includeflexibility in institutional base of the socioeconomic system, as well as flexibilityon the part of the government in adapting policy to changing conditions. It impliesan economy in which movement of resources among alternative uses is relativelylow friction, low cost, and rapid and leads to changing factor proportions,technologies, and composition of output... Given the information and incentives,the second set of conditions relates to people's reactions to these stimuli, that isthe responsiveness to economic signals." [Emphasis added].
It is not our purpose to go into the relative merits of market and planned economies.Such digressions often lead to conclusions similar to that of Dr. Pangloss: All's for thebest in the best of all possible worlds! Evidently, there has been an increasingtendency in professional opinion, among politicians and those they represent, to placemore emphasis on market efficiency and mechanism. Most economies continue to bemixed, however. We should be able to identify the critical policy parameters. As Killick(1993:49) emphasizes: "However the balance is struck between the market and thestate, we should note the importance of adequate information flows." Adequateinformation in this scenario improve market efficiency. An important role of the stateaccordingly is to improve information flows. We must be wary however, of thepossibility that free information flow does not necessarily imply perfect or reliableinformation. Information is often used as a tool to serve political objectives even inestablished democracies (recall for example the use of the term "misinformation" tojustify the United States' government international objectives during the cold war eraand beyond). In most of the developing countries the role and size of the state arelarge. That does not imply good governance. Neither does it imply that the potential forgood government does not exist. What seems evident is that the scope forimprovements is promising.
217

4. Empirical Illustrations
In this section we examine the links between population change and two basicrenewable resources, namely, water and cropland. The purpose is to elucidate themechanisms that may trigger conflict and violence. The findings reported in the 1993HBR study, mentioned earlier, on Environmental Change and Violent Conflict is anexcellent base for the present discussion. Their report is based on findings from a teamof 30 researchers whom they assembled to examine a set of specific cases relatingenvironmental change to violent conflict. They focused on the two renewable resourcesof interest. Population was an important variable in their analyses. Their generalconclusions are illustrative:
"Evidence gathered points to a disturbing conclusion: scarcities of renewableresources are already contributing to violent conflicts in many parts of thedeveloping world. These conflicts may foreshadow a surge of similar violence incoming decades, particularly in poor countries where shortages of water, forestsand, especially, fertile land, coupled with rapidly expanding populations, alreadycause hardship." [Emphasis added] (Homer-Dixon, Boutwell and Rathjens,1993).
We start with the HBR definition of resource scarcity. Scarcity is produced in threedifferent ways. First, it may result from degrading or consuming the resource at a ratefaster than its renewal rate. Second, where the resource per capita declines as a resultof a high rate of population growth. Third, where a change in the distribution of aresource results in concentrating supply in the hands of a few, subjecting the rest toextreme scarcity. We may also add, as a fourth dimension, ecological change thatoccurs independent of human actions.
Their first example of cropland scarcity refers understandably to the case ofBangladesh. Given the built-in population momentum, mentioned earlier, Bangladeshpopulation of 120 millions is expected to double during the next 30 years. With anaverage density that is almost three times higher (2.75) than that of the neighboringIndian State of Assam, the seeds of conflict were already planted. Legal and illegalmigration from Bangladesh to India have been a source of increasing conflict betweenthe two countries and have created ethnic and religious tension and violence: "In thevillage of Nellie, Lalung tribespeople massacred nearly 1,700 Bengalis in one five-hourrampage" (Homer-Dixon, Boutwell and Rathjens, 1993:40). At destination, migrationcreates a shift in the balance of political and economic power that is violently resistedby the original power structure. It essentially creates an explosive situation that couldbe triggered by unexpected and often minor incidences.
This case of cropland scarcity and high rates of population growth that exceeds theeffective supply of the vital renewable resource illustrates some important pointsrelated to population dynamics and conflict. The momentum of population growth thathas been built through generations of high fertility does not disappear suddenly. Underconditions of increased resource scarcity, it triggers spatial movements that interactwith ethnic, religious and racial origin to keep tension and violence alive through futuregenerations. Increased density, coupled with a subsistent economy, leave little roomfor social or political adaptability. Environmental shocks, even minor ones, could easilytrigger a chain of events that leads to forced migration and violent conflict. Almost all
218

areas of the world are experiencing a decline in cropland per person. The trend willcontinue well into the twenty-first century. This is mainly a result of the populationmomentum built into the populations of the developing countries. It is also a result of avery low supply response of available cropland. Asia with the highest humanconcentration, has the lowest per person availability of cropland, about 0.15 hectareper person in 1989 which is expected to decline to 0.1 by 2025. In Africa cropland perperson was 0.3 in 1989 but is expected to decline to 0.1 by 2025. These trends incropland availability per person, if not compensated by innovations in land use, will bea serious source of conflict through the next century.
The second case of the effects of cropland, water availability and population dynamicson conflict mentioned in the HBR study relates to the violence that erupted betweenSenegal and Mauritania. The violence seems to have been triggered by a complicatedset of factors including a cooperative regional project: the building of the ManantaliDam on the Bafing River and the Diama salt intrusion barrage. Population growth inthis part of Africa exceeds 2 percent per year. With a very young age structure, theprospect for future increase is guaranteed for many decades to come. According to anFAO report, the three countries of Mali, Mauritania and Senegal were included in thecritical list of countries whose croplands cannot support current or projectedpopulations without a large increase in fertilizer and irrigation. More intensivecultivation of existing cropland is deemed impossible without increased waterresources. The situation was considered a matter of survival. Accordingly, the threecountries agreed to develop these joint irrigation projects with the blessing andfinancial support of the international community.
The project was considered by the international development agencies a model forregional cooperation in the Sub-Sahara Region of Africa. However, the combination ofthe structure of political power, unequal wealth distribution and ethnic composition inthese countries produced unexpected outcomes. The announcement that the Damswould be built created expectations of rising land values. In Mauritania, the elite,mainly Moors, used their power to take advantage of the situation. They succeeded inchanging legislation governing land ownership in their favor effectively depriving a largesegment of the population of cropland ownership. These were mainly non-Moors.Ethnic violence erupted when in 1989, some Senegalese farmers were killed inMauritania, triggering a chain of events that led to ethnic conflict and violence in thetwo neighboring countries. The events included confiscation of properties, expulsionsand forced migration of nationals and finally violence, which were further exacerbatedby attempts on the part of the privileged groups to exploit the situation further and seizeeven more. The two countries were close to the brink of war.
The forces of population dynamics, especially high growth rates and unevendistribution of wealth and political power have created an increased scarcity ofrenewable resource endowments. The attempt to deal with the short-run implicationsof the situation by improving the productivity of cropland through vertical technologyrequired action by the state that implied some difficult decisions regarding thedistribution of gains and losses. These difficulties arose mainly from the presence of anunequal distribution of political power that controlled the behavior of the state, and thatran mainly along ethnic lines. On the other hand, long-term solutions that require areduction of the excessive rates of population growth and a more efficient allocation ofscarce resources for sustainable development were not forthcoming. This was the
219

case primarily because of the structure of existing social and political institutions. In theabsence of long-run development vision and action, the potential for future conflict canonly increase. It is evident, however, that the role of population dynamics in creatingconflict depends on the presence of such social and political conditions. Populationpressure has clearly accelerated a process that has been donnant for some time. Italso reduced the system's ability to adapt effectively in the face of change.
Water is the second renewable resource that interacts with population dynamics toproduce the potential for conflict and violence. The example from the Middle Eastmentioned in HBR, illustrates how national and international forces combine withresource scarcity and population dynamics to produce conflict and violence. TheMiddle East is an area where the situation of water scarcity is critical, and could onlyget worse in the future. The potential for political discord is significant. In the MiddleEast, water scarcity is combined with some of the highest rates of population growth inthe world, through high rates of natural population increase or excessive netimmigration. The region is also characterized by increasing cropland scarcity, unequaldistribution of resource endowments, imbalances in the distribution of military power,and the presence of unstable political regimes. This is a situation where a minorincident could trigger a chain of events that would lead to unpredictable outcomes. Thecase of Israel and the occupied territories discussed by HBR illustrates thesedynamics. Indeed concerns over access to water resources preceded the 1967 Arab-Israeli war and contributed to earlier tensions. The 1967 war, however, gave Israelcontrol over most of the Jordan Basin's water resources. This control and the pattern ofits utilization created non-sustainable imbalances between the supply and demand forwater among the population groups living around the Jordan Basin that include those ofIsrael, Jordan, Lebanon, Palestine and Syria.
The situation is best illustrated by Miriam R. Lowi of Princeton University, quoted inHomer-Dixon, Boutwell and Rathjens (1993:44). She estimates that:
The average amount of renewable fresh water available annually to Israel is about1,950 million cubic meters (mem). Sixty percent comes from ground water, therest from the river flow, floodwater and wastewater recycling. Current Israeldemand — including that of settlements in the occupied territories and the GolanHights — is about 2,200 mem. The annual deficit of about 200 mem is met byover-pumping aquifers. As a result the water table in some parts of Israel and theWest Bank has been dropping significantly. Two of the three aquifers on whichIsrael depends lie for the most part under the West Bank, although their waterdrains into Israel. Thus, nearly 40 percent of the groundwater Israel usesoriginates in occupied territories."
The Israeli government introduced strict measures to limit the use of water resources inthe West Bank. These measures were not equitable. According to the HBR study(1993:44-45) the distribution of water resources was as follows:
"Of the 650 mem of all forms of water annually available there, Arabs are allowedto use only 125 mem. Israel restricts the number of wells Arabs can drill in theterritory. On a per capita basis, Jewish settlers consume about four times asmuch water as Arabs. Arabs are not permitted to drill new wells for agriculturalpurposes, although Mekorot (the Israeli water company) has drilled more than 30for settlers."
220

Such severe inequalities in access to such a vital renewable resource could be aserious source of conflict and violence. However, given the comparative advantage ofthe Israeli military power, water shortages may create more intra-country conflict thaninter-country "water wars." The situation is unstable and could destabilize furtherthrough the process of population growth and its built-in momentum. For example,because of the agricultural water policy, most of the Arab Palestinian population wasforced to quit agriculture. They became either unemployed or sought jobs in Israel. ThePalestinian population has a very young age structure. As a result, the labor force willcontinue to increase at a high rate at least for half a century regardless of the path offertility. Non-agriculture labor absorption must accommodate the natural increase inthe labor force as well as the forced exodus from the agriculture sector. If not, theexcess labor supply will be a source of conflict either as emigrants or unemployedcivilians.
The current peace process that is being initiated in the region includes an attempt toreach agreements on water use among all parties concerned. Such agreements shouldreduce short-term tensions. Conflict, however, seems to be built-in the long-term highrates of population growth, their momentum and the implied increase in water demand.It must be emphasized that future demand for water does not depend only onpopulation growth. It depends equally on improvements in living standards and on thetechnology used in agricultural and industrial production. These latter factors could alsoreduce the effective water supply by degrading water quality through increased wasteand pollution. Commoner (1991) for example has found that the effect of technology onenvironmental degradtion far exceeds that of population growth.
5. Concluding Remarks
In this paper, the relation between population dynamics and conflict has beenexamined. The conclusions reached are based on conceptual analyses and empiricalobservations. The main conclusion of the paper is that population change hassignificant effects on social and political conflict. These effects are not direct, however.They exert their impact through other proximate factors such as increased scarcity ofrenewable resources, reduced economic productivity, migration expulsion, or theweakening of the state authority. Furthermore, the net effect of population change onconflict is not easy to assess. The effect of population change depends on the levels ofother indirect factors such as inequality and the quantity and quality of existingresources.
An important corollary is that population change could create conditions that reduce theadaptive capacity of society. That last effect depends among other things, on thestructure of the social and political system. That structure includes for example, thedegree of society's ethnic and cultural homogeneity and the degree of equity in thedistribution of income, opportunities and political power. Furthermore, the effect ofpopulation change on the adaptive capacity of society depends on the types of politicaland socio-economic institutions. The probability that conflict would be reduced isgreater if such institutions were able to introduce necessary changes and, in themeantime, were able themselves to adjust to accommodate such changes.
221

The paper identified various mechanisms through which population change affectsconflict. These are long-term and short-term term effects. It was emphasized that thelong-term effects of population dynamics on conflict are the most serious. This is thecase because the impact of long-term trends is not sudden, it creeps in so to speak.However, once the trend takes hold through the presence of a population momentum,it becomes difficult to contain or reverse. This argument is not novel. A similar examplewas given by J. Goldstone (1986) where he argues that the factors that led to theEnglish Revolution were:
"...driven by the underlying force of population growth in the preceding century anda half [which] created a synergistic stress that caused the breakdown of the statepower."
The long-term effects exert themselves through the influence of the shape of the agestructure on the rate of population growth and on the labor force. This built-inmomentum creates conditions for system vulnerability, especially in poor countries withscarce renewable resources. It must be emphasized, however, that the built-inmomentum of labor force growth is not necessarily a negative influence. It could be asource of future conflict, or alternatively, a facilitator for development. Whether societymoves towards a costly conflict or towards sustainable development will depend on thesuccess of its development efforts and how equitable its outcome. A continuation ofhigh rates of population and labor force growth will generate conditions for violentconflict. Countries that postpone their fertility transitions will only increase the size ofthe momentum, increase its impact on system vulnerability and reduce the potential forsustainable development.
The short-term effects are mainly those of population movements. Populationmovements are initiated by the long-term interplay of population growth and resourcescarcity. Large movements occur as a result of sudden shocks when society reaches astate of system vulnerability. Population movements are equally sensitive to non-demographic forces. Relative deprivation as a result of economic inequalities withincountries or across neighboring countries could result in large and sometimesunwelcome population movements leading to expulsion. Conflict is more likely to occurin situations that include ethnic, religious or racial minorities, and where inequalities arehigh and identified with these social groups.
The remainder of this section provides a brief summary of the empirical findings.
1. In countries with extreme poverty and high cropland density, populationmovements may cross international boundaries. Serious conflict arises especiallyin the presence of ethnic rivalry. This was the case of Bangladesh and Assam.The case also represents the situation of many Sub-Saharan African countries.
2. In countries with severe economic and political inequalities, conflict could ariseeven as the state attempts to remedy the negative consequences of long-termpopulation growth. Such conflict could cross international boundaries. This wasthe case of Mauritania and the Senegal. Population growth created resourcescarcity. The elite who had political power were able to extract privileges. Aprocess of costly ethnic violence erupted. The resolution of that short-termconflict did not deal with the basic underlying causes. There has been no seriouseffort to deal with the excessive rates of population growth. Neither resolved isthe inequity of the political system that reduced the ability of the state to deal
222

efficiently and equitably with such situations. The potential for future violence isvery much alive.
3. Countries with joint claims on a critical renewable resource, such as water in theJordan Basin, impose solutions based on relative military power. In theaforementioned case, these solutions did not give adequate regard to the needsof large segments of the population. When solutions are imposed based on ethnicor religious lines, the outcome is an unstable system that serves as a breedingground for conflict. The potential for future conflict increases when thepopulations concerned have a high growth momentum. The need for internationalmediation becomes essential. This is the Middle East case.
In our discussion of the Middle Eastern region, we only emphasized the potential roleof population dynamics in creating conflict in the presence of renewable resourcescarcities. We did not dwell on the role of oil politics and the associated internationallabor migration in the region, especially in the Gulf countries (see Sirageldin, 1992).There seems to be potential misreading of the directions of future events in the regionthat requires comments. The Economic and Social Commission of Western Asia[ESCWA], for example predicted that the non-national labor force in the Gulf countrieswill continue to grow at the rate of three percent a year through the present century(ESCWA, 1992). Such scenarios have been used to predict future economic trends inthe region, including external financial flows (see Diwan, Squire and Underwood,1993). The analyses might be valid in the immediate term. As the discussion of thepresent paper illustrates, 'longer-term trends and prospects' must account for theinteraction of population momentum and resource scarcity on the one hand, and theability of the social and political structure to accommodate these fundamental changeson the other hand. In a recent comparative analysis of the political economy of Egyptand Turkey during the period 1950-1985, Hansen (1991) shows convincingly that
"...development in both countries have been too complex to permit simplisticinference and conclusions about causes and effect of poverty, equity andgrowth".
However, Hansen finds some significant differences between the two countries thatexplains observed differences in the path of their agricultural development. Agriculturegrew in Turkey but not in Egypt during the analysis period mainly because Turkey wasable to expand the extensive margin of land until about 1960, whereas Egypt hadreached this point by 1900. The importance of relating the growth momentum of thelabor force to resource scarcities needs no emphasis. However, that momentumseems underutilized in the analyses of trends and consequences of migration flows inthe region. To illustrate, the growth of the native labor force in Saudi Arabia and otherGulf countries is about 3.5 percent per year. Because of the built-in populationmomentum, this rate will continue to increase for the next forty years at least. Theresult is a four-fold increase in the size of the national labor force in these countries.Such a prospect should be the basis for the analysis of longer-term trends andcosequences of migration flows. The potential for future conflict is already built-in thepresent socio-demographic system. Present analyses and policies should anticipatethe consequences of such built-in demographic momentum, especially as it interactswith the resource base. Goldstone's (1986) analysis, mentioned above, is illustrative ofsuch historical consequences.
223

In summary, the discussion indicates that the effect of population change on violencedepends on the existing socio-economic and political structure. But the strength andability of the state to manage also depend on that same structure. Most of the literatureon conflict focuses on the short-term manifestation of population change, such aspopulation movement. Forecasting the future, however, requires a careful look into theshape of the age structure and long-term population dynamics. Almost all of thepopulations of the developing world have a young age structure with a high momentumfor growth especially its labor force. Disparities between the future supply and demandfor labor could generate processes leading to serious conflict. National andinternational agencies should focus on strategies that promote efficient and equitabledevelopment, and that seriously reduce fertility. As mentioned in the context of thepopulation dynamics basis for a sustainable agricultural transformation in Egypt:
"The problem is that in Egypt the short-term issues (crises) have takenprecedence. The success of the policies adopted is a matter of survival. Indeed,all governments are concerned about balancing political stability, equity, andefficient utilization of resources. However, sustainability is an issue ofintergenerational equity, and attempting to buy political stability today ai theexpense of instability tomorrow is not a sustainable strategy." [Emphasis added,Sirageldin, 1993:228].
Footnotes
* A draft of this paper was presented at the Workshop on "Environment, Resources,and Population as Sources of Conflict in 2014." Organized by the Institute forNational Strategic Studies, National Defence University, Washington D.C., on July19, 1994. Views Expressed in this paper are those of the author and are notnecessarily those of the affiliated institutions. The paper benefited from thediscussion in the Workshop and from comments by Carol Underwood of the JohnsHopkins University.
224

References
Ahmed, A.M. and I. Sirageldin. 1993. Socio-economic determinants of labor mobility inPakistan, The Pakistan Development Review, 32(2) :139-57.
Boserup, E. 1965. The Conditions of Agricultural Growth. The Economics of AgrarianChange under Population Pressure. New York: Aldine.
Commoner, B. 1991. Rapid population growth and environmental stress. InConsequences of Rapid Population Growth in Developing Countries, Proceedingof the United Nations/ Institut National d'Etudes Démographiques Expert GroupMeeting, New York: 23-26 August 1988. New York: Taylor & Francis, 161-190.
Diwan, I., L Squire and J. Underwood. 1993. External Finance In the Middle East.Trends and Prospects. Working Paper 9402. Cairo: Economic Research Forum forthe Arab Countries.
Georgescu-Roegen, N. 1971. The Entropy Law and Economic Progress. Cambridge,Mass.: Harvard University Press.
Goldstone, J. 1986. State breakdown in the English Revolution: a new synthesis,American Journal of Sociology, 92(2) 257-322.
Hansen, B. 1991. The Political Economy of Poverty, Equity and Growth: Egypt andTurkey. World Bank Comparative Studies. Oxford: OUP.
Hechter, M. ed. 1983. Microfoundation of Macrosociology. Philadelphia: TempleUniversity Press.
Homer-Dixon, T.F., J.H. Boutwell and G.W. Rathjens. 1993. Environmental changeand violent conflict: growing scarcities of renewable resources can contribute tosocial instability and civil strife, Scientific American, Feb. 38-45.
Killick, T. 1993. The Adaptive Economy. Adjustment Policies in Small, Low-IncomeEconomies. Washington, D.C. World Bank.
Kim, Y.S., R. Schoen and P.S. Sarma. 1991. Momentum and the growth-free segmentof a population, Demography, 28:159-73.
McFarland, F.B. 1991. Economic Philosophy and American Problems. ClassicalMechanism, Marxist Dialectic and Cultural Evolution. Savage, Maryland: Rowmanand Uttlefield.
McNicoll, G. 1994. Institutional Analysis of Fertility. Population Council, WorkingPapers, 62, New York.
Population Action International. 1994. Global Migration on the Move. Washington, D.C.
Robey, B., S.O. Rutstein, and L Morris. 1993. The fertility decline in developingcountries, Scientific American, Dec. 60-7.
Sirageldin, I. 1991. Demography and policy: an Asia experience. In R. Andorka, ed.The Utilization of Demographic Knowledge in Policy. Liège: IUSSP.
Sirageldin, I. 1992. Safeguarding the Future: Population, Environment, Women Statusand Development in the Arab World. New York: UNFPA.
225

Sirageldin, I. 1993. Population dynamics and sustainable agricultural development inEgypt. In M A Paris and M.H. Khan, eds. Sustainable Agriculture in Egypt.Boulder and London: Lynne Rienner.
World Bank. 1993 and 1994. World Development Report.
226

CHAPTER 11
SPATIAL POPULATION DISTRIBUTION IN MEXICOSTRATEGIC MICRO-REGIONS AND ENVIRONMENTAL
PROBLEMS
Ligia Gonzalez Garcia de Alba(Estudios de Socioeconómicos y Regionales, Consejo Nacional de Población, Mexico)
1. Introduction
One of the demographic challenges which faces Mexico is the distribution of populationwithin its territory. The urbanization process which Mexico has undergone in the lastdecades has resulted on the one hand in a great dispersion of population in smallcommunities and on the other hand an extraordinary concentration of population insome large cities, the most notable being the metropolitan zone of Mexico City, whichis the fourth largest in the world with more than 15 million inhabitants in 1990. Theeconomic, social and environmental costs in both cases acquire a growing magnitude.With this situation in mind, The National Council on Population (CONAPO) has carriedout in-depth studies regarding the structure and function of the nation's cities and thepossibilities of regional development. Based on these studies, a policy has beendefined to promote a population distribution in the national territory which correspondsto the development potential of distinct regions, taking into account both national aswell as international migratory movements (National Program of Population,1989-1994).
The design of the policy, including any practice derived from it, rests on basic criteria ofeconomic and social development within a framework which considers the availability,use and conservation of natural resources.
In this paper the way in which environmental elements have been taken intoconsideration during this process is presented. It is a description of the approach andthe types of concepts related to population and environment which are being used onlyrecently in the demographic planning of Mexico. Recent development andcharacteristics of population distribution in Mexico are analyzed; the criteria and theclassification of Mexican territory by areas, according to their capacity to attract andretain population. The method of selection of micro-regions considered strategic inorder to modify the existing pattern of population distribution is also presented,including a description of their principal geographic and environmental aspects.
2. Migratory Flows and Territorial Organization
Population distribution in Mexican territory has been closely linked with the model andpolitics of economic development that have been put into practice throughout its
227

history. Mexico became a predominately urban country with the advent of industrialdevelopment. This was reflected in a change in the rate of urbanization from 20 percent in 1940, to 38 per cent in 1970 and 57 per cent in 1990, when of the 81 millionMexicans, 46 million lived in the 416 urban localities1
Internal migration has played an important role in shaping the distribution pattern.Rural-urban migration, which was directed principally towards Mexico City and to alesser degree to Guadalajara and Monterrey, predominated until 1970 (Fig. 1). In thelate eighties, in contrast, places of origin and destination were multiplied in the entirecountry; movements from city to city increased and the growth of medium-sized citieswas strengthened (Fig. 2). As a consequence, even though the average density of theMexican Republic is 41 inhabitants per km2, among the 32 states there are extremecontrasts, such as Baja California Sur with 10 per km2 and the Federal District (MexicoCity) with over 5,000 inhabitants per km2. In like manner, six out of every ten Mexicansreside within the central perimeter of the country (20 per cent of the surface, Fig. 3). Anexample of the excessive urban concentration is the fact that a quarter of all Mexicanslive in one of the three largest metropolitan zones (Mexico City, Guadalajara andMonterrey) within a surface which represents barely 0.6 per cent of the nationalterritory.
This process of urbanization has formed a national system of cities (31 sub-systems)with internal malfunctions. Existing within this system are regions which are tightlyintegrated, others with low levels of integration, urban-regional networks poorly definedand also excessive urban concentrations.
These maladjustments are reflected in the different levels of well-being and in varyingconditions regarding environmental quality. There are areas with overuse of resourcesand others with underused resources.
3. Regional Possibilities and Demographic Distribution
CONAPO has developed studies under the premise that the distribution of populationresponds to characteristics of regional development and that in order to influence theformer the latter must be considered. Work has been done with this line of thought tostudy: a) the structure and function of urban-regional systems via their centrallocations and respective hinterlands and, b) the regional possibilities in order to absorbor retain population. Thus, a network of over 800 locations has been defined accordingto their urban hierarchy, and approximately 70 functional regions and more than 200micro-regions have been classified according to their possibilities of regionaldevelopment in areas with capacity to absorb population and to retain population (Figs.4, 5 and 6).
Also important for the classification of micro-regions according to demographiccapacity were natural resources and the possibility of their availability. In addition,other regional factors were taken into consideration such as; the system functioning,the development of the social and productive infrastructure, the economically activepopulation and the standard of living (this did not involve a quantitative analysis).
228

4. Strategic Micro-regions
Some micro-regions have been selected in order to encourage change in populationdistribution by taking advantage of development possibilities in distinct regions of thecountry. These are considered strategic because they fulfil the following requisites:
VOLUME OF MIGRANTS(thounsands)
, From 10 to 19
. From 20 10 29
• From 30 10 39
I From 40 »id More
Fig. 1. Principal interstate migratory flows in Mexico 1965-70, produced by CONAPObased on INEGI. IX Censo general de población y vivienda, 1970.
VOLUME OF MIGRANTS(mounxand!)
From 10 lo 19
From 20 lo 19
From 30 lo 39
From 40 and More
Fig. 2. Principal interstate migratory flows in Mexico 1985-1990, produced byCONAPO.
229
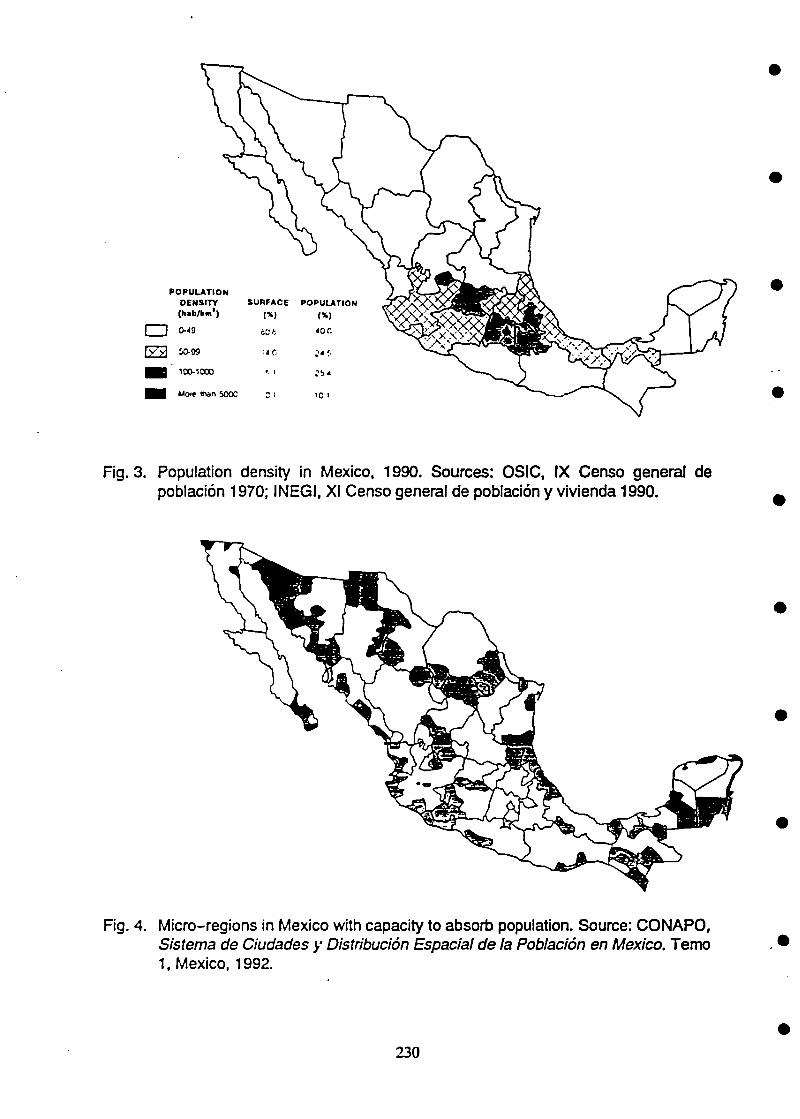
I I 0-«
¡yy\ M-09
1 ^ ] 100-1000
• • Wc»f nun 500C
POPULATIONDENSITY SURFACE POPULATION(h.b/km1) (%) (X)
¿Ct J Ü C
10 1
Fig. 3. Population density in Mexico, 1990. Sources: OSIC, IX Censo general depoblación 1970; INEGI, XI Censo general de población y vivienda 1990.
Fig. 4. Micro-regions in Mexico with capacity to absorb population. Source: CONAPO,Sistema de Ciudades y Distribución Espacial de la Población en Mexico. Temo1, Mexico, 1992.
230

Fig. 5. Micro-regions in Mexico with capacity to retain population. Source: CONAPO,Ibid, 1992.
Fig. 6. Micro-regions with critical capacity to retain population. Source: CONAPO,ibid, 1992.
231

- They are the source of high density migratory flows to the large urban centers:Mexico City, Guadalajara, Monterrey, Puebla, Tijuana and Cuidad Juarez.
- They have the capacity to absorb population and also they have favorableconditions to initiate, re-activate or increase economic activities, to generateemployment and to increase the standard of living of their own population.
- Their central cities are important in functional terms within the context of theirrespective macro-regions and a greater integration with these urban centers andareas of influence is possible and recommendable.
- In many cases these regions exhibit potential to arrest the excessiveconcentration of population in some macro-regions where a high percentage oftotal population is concentrated in the capital city.
- They are located at a considerable distance from the center of the country.
- They are outside the area of direct influence of the four principal metropolitanareas.
- They are predominately located between the northern border and the central beltof the country, or in one of the coastal regions of the Gulf of Mexico, the PacificOcean or the Caribbean.
With these criteria, 44 micro-regions will be selected to be developed, taking care toincrease production and employment, better the quality of life and exploit rationallyresources in order to preserve them for future generations. In 1990 these micro-regions contained 17.1 million inhabitants, that is 21 per cent of the total nationalpopulation on 24 per cent of the territory (Fig. 7). The average density was 19inhabitants per km2 (Table 1).
Each selected micro-region has an identified potential of development that can be acombination of the following types: agriculture, cattle-raising, forestry, fishing, industry,mining, energy, tourism and artisanship. Since these micro-regions and theirrespective central places constitute units to attract population, and considering thattheir development should increase both productivity and labor intensive employmentwhile preserving natural resources for future generations, it became necessary toconduct an analysis of their natural resources and environmental characteristics.
For this analysis, a study which presents a diagnosis concerning the environmentalconditions of the different regions of the country2, dividing the territory into 88 provincesand 1,813 eco-geographic systems was reviewed. Since this analysis was based onterritorial units, different from the selected micro-regions, it was necessary to situatethe latter within the eco-geographic system to obtain a description of the most extremeenvironmental problems. The variables used to obtain a panorama of these problemswere: risk of erosion, incompatibility of land use (agriculture, cattle-raising or forestry),the decrease or extinction of any variety of wildlife or plant life (terrestrial or aquatic),and pollution (air, water and/or soil) by type of pollutant (agro-chemical, industrialwaste, noise, urban waste, radiation or emission of gases).
232

5. Environmental Characteristics of Selected Micro-regions
Mexico has a wide variety of geographic landscapes and eco-systems within nearly 2million km2 and more than 10 thousand km of coastal areas. The climate of 75 per centof the nation's territory is either very arid, arid or semi-arid. Water is a scarce resourcein 87 per cent of the territory and in areas where it is abundant, it is not takenadvantage of due to lack of water recovery facilities (Bassol, 1987).
Within the national context there are four vast zones defined for their climaticcharacteristics (Fig. 8): the temperate zone, the tropical humid zone, the dry tropicalzone and the arid zone (Poder Ejecutivo Federal, 1984:30).
MACRO-REGION• CENTRAL PLACE
Fig. 7. Priority macro-regions for attracting and maintaining population. Source:CONAPO, ibid, 1992.
233

ARID
TEMPERATE
HUMID TROPIC
DRY TROPIC
Fig. 8. Climatic zones of Mexico. Sources: CONAPO, ibid, 1992; Poder Ejecutivo.Federal. Programa Nacional de Ecología 1984-1988, Mexico, 1994.
234

ce
u.O_ i
OCL
tu2CLO
i5<a.UÜX
ootuo
tuoLU*o<Ik
ceV)
IICL
UJm<
NT1
AL
PO
TE
20.Q
ri
EV
o
o ^
< trr 0o 2s <U Oo
NS
ITY
b/H
m')
O £.
rea
<
Ion
I "5uS
¿
Art
sa
ship
1 E
• «•o u
1 e.
£
cacSE
Isln
g
ô 2
5 ' £"• I •>
i!< 5
990
*'
"e
-
coo>
cou2
g
o
7183
2
645
t»CM
0D
*L N
ATI
Or
TOT
S
inCM
CO0000
«n
639
•TCOCM
co
M D
E M
ai1
TOT)
inCM
CM
3309
w
227
335
CM
tr
TH
WE
ST
t|
N0R
X
X
<
o
S
o
0927
562
624
1•5
§
| C
hid
X
X
X
X
X
X
X
c
«n00
10ClO
o>
7043
123
601
•5w
| C
uba
X
X
X
o
•
o
„
2914
109
175
fC
| G
ua>
X
X
X
<
1.30
„
5631
118
459
losillo
. S
oi
!
X
X
X
X
•*
CM
o
3724
970
160
u.ec
s
0.
_J
X
X
X
X
X
<
01
6
1/)
3068
345
314
a
2
u>O)
o
7607
O)
SCO
326
• •
RA
LT
H-C
EN
T
&
X
X
X
X
X
X
X
u
1.16
o
2849
CM
921
o>
40s
X
X,
X
X
X
<
o
i n
o
0228
C5
970
590
•ç0
S
X
X
X
X
X
X
<
-
ISO
10
0041
835
413
1i
| D
ura
X
X
X
X
X
<
-
CO(O
o
h*
3303
232
144
¿
ral.
Ch
go d
el P
ar|
Hld
a
X
X
X
X
X
X
o
10
8
oin00
077
S
g,n
\
ago
Pap
a
l
CM
31
2
_sect809
993
*•
2ce
THE
AS
TE
8
X
X
X
X
ce
m
1.14
to
2468
960
330
I
1
X
X
X
X
X
o
(0
09
7
CM
9001
787
112
ana.
NL
1 Ga
le
X
X
X
X
X
<
om
0.77
(O
5078
834
758
1o
X
X
X
X
X
X
ce
"é
0.24
908»
891
791
Ô
-Ler
do.
S1IXfsf
1o
4Torr
e|
Dg
o.
ooo
4 98
m
8045
c»
761
729
r»
i
WE
STE
O
i
I
| C
EN
X
X
X
X
X
ce
oCM
0.59
1647
CO
m
237
ca,J
al.
1
X
X
X
X
X
<
mCM
0.70
3768
299
345
fi
X
X
X
X
X
oc
CM
0.58
1430
504
238
n.J
al.
i
X
X
X
X
X
X
<
m
0.52
_
0238
t
582
ad V
ales
,
u
X
X
X
X
X
X
X
X
<
es
920
o
5455
OIS
428
M.
Cd.
iu
235

o
o
ioa.
IU
ELO
P
so
o _r S
MO
GR
AP
AP
AC
ITY
IU OO
t f
o ¿
I U
0
ca.i/i
AR
EA
AR
EA
Y
! E
i »nl
ng
S
b
Indu
c
C
• Ol
« c£ M<3 ï
•> >.s «
U. "
Ag
ri-
cultu
re
1990
|
0661
X
X
X
<
rw
-7O
flO
.T»
244.
773
tM
d/
5
X
X
X
X
o
•e
o
ooS
1235
95
CL
î
X
X
X
E
s
o
2625
137.
999
o
£oX)V*s
it/J
X
X
X
X
c
«r
oo
00
i
297.
834
i
«i
»-
X
X
X
X
X
X
X
<
o
• 7
2274
268.
185
Z
i
X
X
X
X
ce
i n
cuO
o
5
65 2
36
U
S1
51I1
X
X
X
X
X
X
<
698
o
•n«n
o
359.
404
€2
i5
~>
X
X
X
<
o
8381
400.
490
ü
«i
1ON
to
c>^4
CNt
00cw
2.03
5.41
9|
CE
NTR
AL
X
X
X
u
o
3149
85.3
18
dÖ
ítu
X
X
X
X
<
i n
o
o
m
3943
295.
763
d<3
56
X
X
X
X
X
X
o
108
o
CU
1341
41.
430.
015
£=*u
2
X
X
X
X
X
X
X
<
CM
O
8219
224.
323
d
<5
1ñte
1
s
n
tM
2034
41.
902.
640
| G
ULF
X
X
X
X
X
<
o
o
3381
166.
491
n
X
X
X
X
X
X
X
X
X
<
011
r*
O
o
1127
21,
243.
801
iUŒ
i
X
X
X
X
X
X
X
ce
O)
o
5691
.49
2.34
8|
VH
Iahe
rmos
a. T
ab.
00
sr>
cs
5964
32.
885.
453
| S
OU
TH
PA
CIF
IC
X
X
X
X
X
X
X
Œ
ino
o
8134
.28
4.83
1
„-
X
X
X
X
X
ce
CM
i n
o
_
8762
.71
8.94
2|
Oax
aca.
Oax
.
X
X
X
X
X
X
X
<
00Cg
So
6675
.18
9.48
5
O
3"u2
X
X
X
X
X
X
X
X
<
100
Sío
i n
5775
.57
9.36
7
•i
5
X
X
X
X
X
X
X
X
X
u
CSJ
n
o
—
1633
341
8,19
4|
TIa
xlac
o. O
ax.
X
X
X
X
X
X
X
<
s
o
o
1396
369
4,63
4
U01
1¿2
3
r j
CNJ
m
4195
61.
076.
496
5
| Y
UC
AT
AN
PE
NtN
SU
X
X
X
X
X
X
X
<
_
CO
«
2313
024
5.48
11
Cam
pech
e. C
amp.
X
X
X
X
<
o
ö
CO
1718
917
2.56
3
tOC
O
X
X
X
X
X
<
402
00
O
i
658.
452
Í
236

5.1. Temperate Zone
The temperate zone covers nearly 19 per cent of the national territory. It ischaracterized by high mountainous terrain plus it has supported most of the urban,industrial and demographic growth because it comprises the principal economic andproduction activities of the nation. Located in this ecological zone are some of themain cities such as Mexico City, Puebla, Toluca and Guadalajara. The activities thatare carrried out in these urban centers and others of lesser size, generate pollutionin their surroundings to varying degrees: among the most notable is thecontamination generated by the discharges of sewage and industries in the river-basins Lerma-Santiago, Panuco and Balsas, as well as the diverse problemsassociated with the socio-economic dynamics of the nation's capital city.
There are 19 priority micro-regions in this zone. They are located mainly near thecoasts of the Pacific Ocean and the Gulf of Mexico. Portions of their territories haveclimates which are arid, dry tropical and tropical humid. In parts of these micro-regions pertaining to the temperate zone, the risk of erosion predominates and inmany cases the decrease and extinction of wildlife is relevant. To take advantage oftheir resources (notably agriculture, cattle-raising and industry) without harming soilproductivity, it is necessary to apply techniques that help their conservation andpermit an increase in their yield (Table 2).
Micro-regions having major regional cities present problems of extreme pollution inair, water and soil due to industrial activities and services. Four of the ten micro-regions manifest extreme environmental problems in seven or eight of the variablesanalyzed, because they are located in very fragile ecosystems which are seriouslyaffected by industries in general and oil-related industries in particular.
Regarding demographic capacity, five micro-regions show critical conditions to retaintheir population. This provokes high migratory flows, principally towards the largeurban centers. In like manner, eight other micro-regions have the capacity to attractpopulation and the six remaining, have the capacity to retain population.
5.2. Tropical Humid Zone
The tropical humid zone covers flat regions with altitudes of less than 100 metersabove sea level. It encompasses more than 17 per cent of the national territory andextends over the coastal plain of the Gulf of Mexico and the Yucatan Peninsula. Theecosystems of this zone are very fragile and have been altered by different means.Located within this zone are 11 micro-regions, seven with complete territories andfour others with most but not all of their area within this climatic zone.
The basic problem in these micro-regions is the risk of erosion, the decrease andextinction of wildlife and plant life, both aquatic and terrestrial, as well as thepollution of the air, water and soil. Among the principal causes of this situation arecattle-raising activities which have been dynamic but have provoked thedestruction of forests and jungles in order to plant for pasture ground. Another
237

relevant factor is the oil industry which has caused drastic changes in the traditionalpatterns of the use and quality of the soil, thus harming other production activities.
The most outstanding potential of these micro-regions is related to fishing, industry,water resources and tourism. Nine micro-regions show capacity to attract population,one to retain population and another one has critical capacity to retain population(plus being one of the regions which presents the greatest number of severeenvironmental problems).In four micro-regions the problems are serious in regard to more than six of theenvironmental variables, and in three other micro-regions there is an extremeproblem in at least five variables. This means that more studies should beundertaken which permit the formulation of specific recommendations to achieve abetter yield from resources and the restoration and conservation of these within eachmicro-region.
5.3. Dry Tropic Zone
The dry tropic zone comprises about 13 per cent of the national territory. It extendsalong the Pacific Coast, south of the Tropic of Cancer and continues towards thecenter of the country. Above all, this area presents problems of water and soilpollution as well as erosion and underuse of resources. The agriculturaldevelopment is slow because of topographical problems and scarce rainfall. Cattle-raising is extensive but of low yield, thus contributing to a greater deterioration of thesoil and natural vegetation.
Twelve micro-regions are located in this zone, six of them with their total surfacearea and the other six with portions in other climatic zones. The environmentalproblem in these micro-regions is less serious than others located in different zones.This is due to the fact that the ecosystems are not as fragile as those of the humidtropics and in general have not been exploited as severely as in the temperate zone.
These micro-regions have all types of potential. Although agriculture, cattle-raisingand industry are the most prevalent, they also have hydraulic and energy resourceswhich are essential to their development.
The most notable problem is the risk of erosion and the pollution of water due to theuse of agrochemicals and urban and industrial wastes. The micro-region of Juchitan,in particular presents an extreme environmental problem in the most number ofvariables studied as a result of industrial and oil-related activities which are found inthe south-eastern part of the country. This problem is a determining factor in theformulation of programs to foster development in these micro-regions especially rfthese programs intend to fulfil the objective of attracting and retaining population aswell as to raise the standard of living.
The dry tropic zone has a vast extension of coastal areas along the Pacific Ocean,nevertheless, this resource has been is poorly exploited and, on the other hand,there are fishing methods which affect the existence of some species.
238
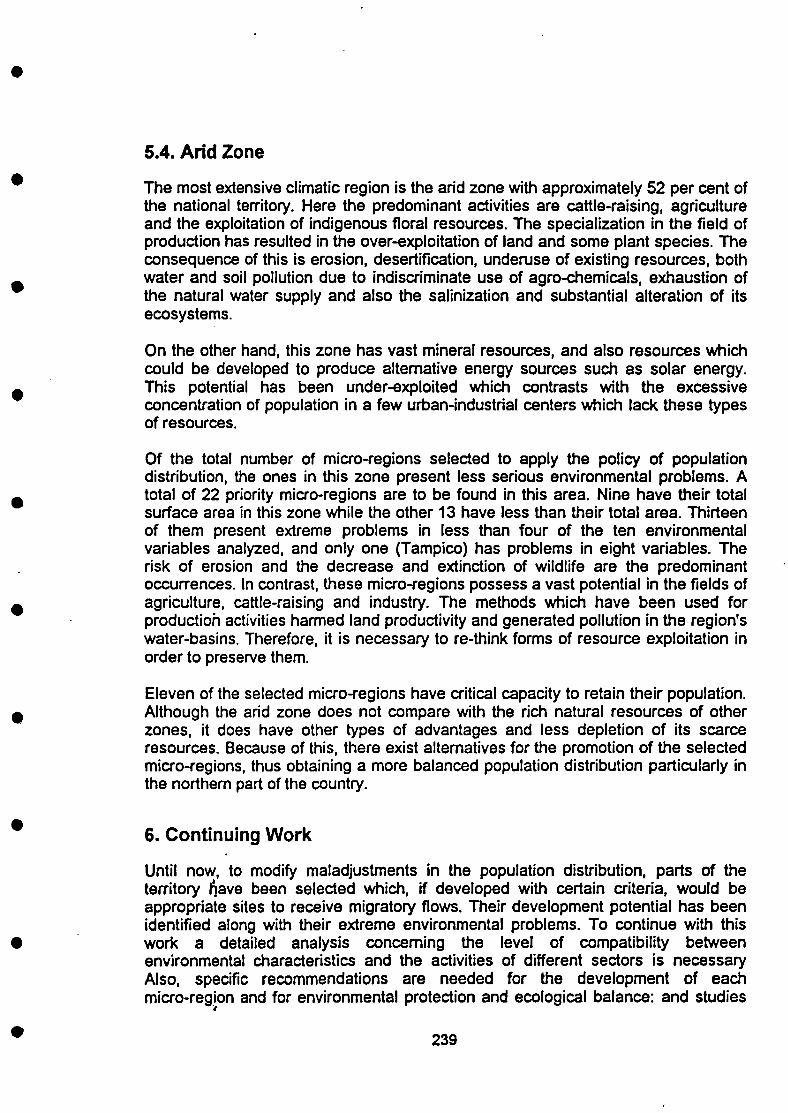
5.4. Arid Zone
The most extensive climatic region is the arid zone with approximately 52 per cent ofthe national territory. Here the predominant activities are cattle-raising, agricultureand the exploitation of indigenous floral resources. The specialization in the field ofproduction has resulted in the over-exploitation of land and some plant species. Theconsequence of this is erosion, desertification, underuse of existing resources, bothwater and soil pollution due to indiscriminate use of agro-chemicals, exhaustion ofthe natural water supply and also the salinization and substantial alteration of itsecosystems.
On the other hand, this zone has vast mineral resources, and also resources whichcould be developed to produce alternative energy sources such as solar energy.This potential has been under-exploited which contrasts with the excessiveconcentration of population in a few urban-industrial centers which lack these typesof resources.
Of the total number of micro-regions selected to apply the policy of populationdistribution, the ones in this zone present less serious environmental problems. Atotal of 22 priority micro-regions are to be found in this area. Nine have their totalsurface area in this zone while the other 13 have less than their total area. Thirteenof them present extreme problems in less than four of the ten environmentalvariables analyzed, and only one (Tampico) has problems in eight variables. Therisk of erosion and the decrease and extinction of wildlife are the predominantoccurrences. In contrast, these micro-regions possess a vast potential in the fields ofagriculture, cattle-raising and industry. The methods which have been used forproduction activities harmed land productivity and generated pollution in the region'swater-basins. Therefore, it is necessary to re-think forms of resource exploitation inorder to preserve them.
Eleven of the selected micro-regions have critical capacity to retain their population.Although the arid zone does not compare with the rich natural resources of otherzones, it does have other types of advantages and less depletion of its scarceresources. Because of this, there exist alternatives for the promotion of the selectedmicro-regions, thus obtaining a more balanced population distribution particularly inthe northern part of the country.
6. Continuing Work
Until now, to modify maladjustments in the population distribution, parts of theterritory rjave been selected which, if developed with certain criteria, would beappropriate sites to receive migratory flows. Their development potential has beenidentified along with their extreme environmental problems. To continue with thiswork a detailed analysis concerning the level of compatibility betweenenvironmental characteristics and the activities of different sectors is necessaryAlso, specific recommendations are needed for the development of eachmicro-region and for environmental protection and ecological balance: and studies
239

will have to be made in order to estimate both the desired increase in population ofeach strategic micro-region and the number of jobs required.
In this project, the complex study of the relationship between population andenvironment is achieved through the use of natural resources to modify thepopulation distribution. Although population growth alone does not generateenvironmental imbalance, it is important to recognize that forms of consumption,cultural patterns, technology and forms of production combined with the economicconditions of the country, provoke alterations in the environment. The excessiveconcentration of population in the central part of the country and in a few urbancenters has contributed to the over-exploitation of resources in some areas and theunder-exploitation in others. Under these circumstances, it is essential to establishpolicies of control to diminish environmental pollution; ecological restoration isurgent in areas of deterioration, and it is necessary to apply techniques that permitthe conservation, use and enrichment of natural resources.
The challenges concerning environment are enormous. For example, Mexico is oneof the most bio-diverse countries in the world. The estimated number of species ithas ranges from 250,000 to 10 million3. In spite of this, Mexico has onlyapproximately 400 specialists in this field which makes the task of enhancingknowledge even more difficult to achieve.
Nevertheless, with the aim to preserve the most fragile and most diverse ecosystems4 per cent the national territory has been safeguarded through establishingprotected natural areas. The policy of population distribution maintains the positionthat the preservation and the use of natural resources, in man's benefit, should gohand-in hand.
240

Ü>55a¡1oc
_ i
u.O
Oa.UJ
ceou
5wcóy
teocû.
S
So
c z
is;U goS O
i£
PLA
NT
%
LDLI
FE¿
Ï
b1 5o
S
! A
NO
EX
a
ECR
O
.US
Eso
n
*
lurt
e
S%O
5
Ris
e
oc
u
CR
O-
1
Í
E)U
FE
3
O
i
AN
IMA
L
INT
UF
E
< *
Êirt
FO
RI
a st a3 2
u
S3ce
5I0N
OE
Uzon
CIO
N
E
DT
-HT
CR
UZ
1
SAL
X
c7X
sX
X
X
X
X
o
z
JUC
M
X
(31
X
DT
-T|
AU
T
X
X
X
X
DT
-T
6
AM
E
(31
X
o
NG
AN
E
APA
oti
(Z)
X
X
X
X
(3)
X
o
éo
X
DT
-T
5
AP
E
DT
-A
ü
TEP
(Z)P(Z)
X
X
X
X
A-T
3
cuu
X
T-A
i
X
X
X
X
X
sX
o
o
X
(9)
X
A-T
2
CIU
C
X
a
1a
I
SX
o
AN
EJO
| ZI
HU
AT
i
X
X
X
X
DT
-T
9
1
(z)
X
SX
X
5X
T-D
T-H
1
á
TEH
T-A
PAZ
5UJO
23
SAN
X
T-A
|
X
X
S3.X
pX
T-A
OO
oo
X
X
X
(z)
X
T-A
O
§
i1
SAN
m
m
£X
X
T-A
OB
E
SX
SX
X
Ë
o
X
SI)
X
X
(s)
X
Ï
2
g
DT
-HT
CR
UZ
2
X
EX
X
X
X
X
1
JUC
X
5X
DT
-T
X
X
X
X
DT
-T
UJ
241
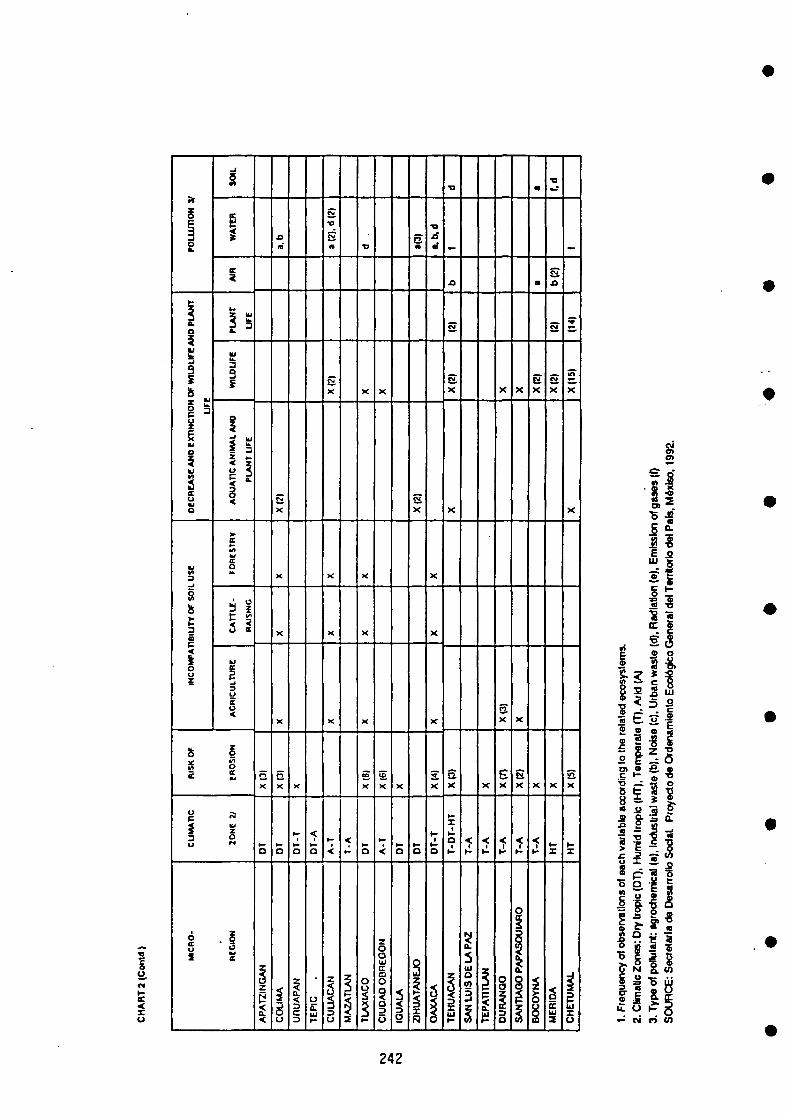
u
itm
ON
12
fc
11
luZ £
u
«A
cuo
LU
SE
nosft
1BIU
i
INC
OI
ft
Ë
O
U
CR
O-
I
i
i
1
i -Z u
u
3
o
IMA
LJ
UFE
5 eP ¿
E(A
< ;o s
u
§u
üOa
IUMO
Z
ClO
N
S
131
X
o
5
| A
PA
TZ
ING
a
aX
X
X
X
X
D
| C
OLI
MA
X
| O
T-T
|
| D
T-A
| TE
PIC
.
STJ
S
sX
X
X
X
1 A
-T
U
1 T
-A|
MA
ZATL
Ah
TJ
X
X
X
X
SX
5
| TI
AX
IAC
O
X
X
| A
-T
OOUJ
g
| C
IUO
AD
O
X
o
| IG
UA
LA
•
etX
o
EJO
[ ZI
HU
ATA
N
.o
«r
X
X
X
X
| D
T-T
| O
AX
AC
A
TJ
-
E(z)
X
X
SX
t -X
| T
-OT
-
PA
Z
5
| S
AN
LU
IS 1
X
i
3
| TE
PAT1
TL»
X
5X
EX
1 T~A|
DU
RA
NO
O
X
X
sX
1 T*A
o
ii1i
m
s
SX
X
1 T"A|
BO
CO
YN
A
TJ_ -
»(2)
(Z) 1
SX
X
| M
ER
IDA
-
x"
X
SX
\~
_1
| C
HE
TUM
A1
I
- « ri w
242

Footnotes
'The definition for urban and rural population varies according to the criteriaadopted in each country and for each author. In this work, urban population existsin an area with more than 15 thousand inhabitants; mixed population of between5,000 and 14,999 inhabitants; and rural in areas of less than 5,000 inhabitants.
decretaría de Desarrollo Social. Proyecto de Ordenamiento Ecológico General delTerritorio del País, México, 1992.3Data was included among those distributed by the regional office of Latin Americaand the Caribbean Program of the United Nations for the Environment. Obtained in:Femando Tudela, "Población y sustentabilidad del desarrollo: los desafios de lacomplejidad". Revista de Comercio Exterior, Vol. 43, Nr 8, August, 1993. Pg. 698
References
A. Bassol, 1987. México: Formación de regiones económicas, México. UNAM-HEc, 58.
Poder Ejecutivo Federal. 1984. Programa Nacional de Ecología, México, 30.
243


CHAPTER 12
POPULATION AND ENVIRONMENT IN BRAZIL: ACHANGING AGENDA
Daniel Joseph Hogan(Instituto de Filosofía e Ciencias Humanas, Universidade Estadual de Campinas,
Campinas, S. P., Brazil)
1. Introduction
The decade of the nineties has brought a new - and different - urgency to thepopulation-environment question in Brazil. Lining up solidly with Third Worldpositions in the seventies and eighties, both governmental and academic voicesexpressed their resistance to identifying demographic growth rates orenvironmental degradation as major obstacles to development. These wereconsequences - not causes or obstacles - of underdevelopment, whose rootswere to be found in unequal economic relations between Brazil and the developedworld. In Stockholm in 1972, Brazil's delegate to the United Nations Conference onthe Human Environment declared that smoking chimneys were a mark of progressand that environmentalism was a luxury only developed countries could afford. In1974, in Bucharest, at the World Population Conference, "development was thebest contraceptive." In contrast, the head of the Brazilian delegation to the ThirdSession of the Preparatory Committee for the International Conference onPopulation and Development (Cairo 94), declared that:
" Family planning is not a panacea to achieve social development,environmental balance and economic growth. It is only one of the means,albeit a most important one, to break the intergenerational transmission ofpoverty, particularly when combined with the appropriate social developmentpolicies....lt is impossible to believe that a 16 year-old girl's pregnancy isgenuinely wanted. A standing objective should be the avoidance of allpregnancies before the age of 19. ...Rapid steps should be taken to decreaseunwanted child bearing and to guarantee universal access to reproductivehealth services" (my emphasis).
Today, none of the major actors who resisted family planning programs - themilitary, the Catholic Church, the political left - has remained immune to changingsocial conditions and the evolution of values and behavior. The environment, on theother hand, has moved from a non-question to a guaranteed place on the agendaof public opinion. The same declaration cited above states that "Sustainabledevelopment is central to any viable strategy directed towards improving quality oflife and combating poverty. Population levels, consumption patterns and productionsystems are directly linked to environmental quality." These shifts in social thought
245

represent fundamental transformations in Brazilian life and demand attention as thenation seeks to define - and redefine - itself in preparation for the 21st century.
The present notes seek to outline the evolution which has taken place. Why didissues considered part of a modem, progressive agenda first meet suchwidespread resistance in Brazil? How and why did this position evolve? How didthese processes shape population programs and environment programs,separately, and how were perspectives on population-environment relationsaffected? These are not simple questions and their answers will require a more in-depth analysis than these pages will allow. But it is possible to identify the principalissues and to raise the question more clearly. We are indeed at a watershed inBrazilian views on these questions. As we move forward to deal more directly withthem, and as interested observers seek to accompany these changes, it will beuseful to set out the central themes involved.
2. Population, Environment and Development: from theSeventies to the Nineties
Brazil's post World War II drive for development, which reached its apogee in thelate sixties and early seventies - the years of the "Economic Miracle" - left littleroom for environmental concerns. In 1972, at the United Nations Conference onThe Human Environment, the Brazilian delegation swam against the stream of theawakening environmental consciousness. The Conference, together with thepublication of the Club of Rome's Limits to Growth in the same year, was awatershed in linking Third World economic development with concerns for thenatural resource base. But these concerns did not strike responsive chords inBrazil. Official positions, as noted above, discounted such calls for action, holdingfast to developmental perspectives and a defense of more equitable trade relations.
Academic and scientific opinion did not differ greatly from this official position -especially in the social sciences. Progressive voices of the universities in theseyears were directed at reestablishing democracy (a 1964 coup d'état inauguratedtwo decades of military rule), and this priority was seen as a necessary conditionfor economic development with social justice. To many, environmental concernswere an epiphenomenon of more fundamental problems and a passing middleclass fad of developed countries.
Similar attitudes marked academic views on population. These were the years ofBrazil's most rapid population growth and the country's size made it an obvioustarget for international concern. While rates were to start declining in the mid-sixties, this was not clear at the time, nor even in 1972 when the StockholmConference was the stage for a re-enactment of the Malthusian/anti-Malthusiandebate. The fact that rapid demographic growth produced international calls forbirth control; that rapid economic growth benefited only a small minority of thepopulation (leaving room for achieving greater social justice without curtailingpopulation growth); and that the military dictatorship greatly constrained debate onall such issues, meant that fertility reduction was seen as an unacceptablealternative to reducing social inequalities and not as a component of such aprocess.
246

Both population and environmental concerns were subordinate to this ideologicaldebate on the model of development. When developed country birth controllerslater adopted environmentalism as a more fashionable and acceptable argument,more dispassionate consideration of the question in Brazil was further delayed.Today's total fertility rate of approximately 2.5, achieved without any national familyplanning program behind the fertility decline, has taken much of the steam out ofthe debate, and both issues - taken together or separately - are discussed in aless-charged atmosphere.
At the level of Brazilian experience, then, accelerated economic growth of the fiftiesand sixties in parallel with accelerated population growth, and rapid fertility declinein the seventies and eighties with no explicit government policy, took the wind outof the sails of older debates. Neither the diagnosis nor the prescription ofneomalthusianists were sustained by recent Brazilian history.
This climate has been reflected in preparations for the 1994 InternationalConference on Population and Development in Cairo. Brazilian demographers havebeen active in this process, individually as consultants to the Foreign Ministry andinstitutionally through their professional association (Associaçâo Brasileira deEstudos Populacionais - ABEP). Preparatory seminars, a population video andformal participation in the national delegation have been marked by non-confrontational dialog. While fallout from older clashes between progressives andbirth controllers is still visible when representatives meet, action proposals are nolonger so far apart. At the Mexico City Regional Conference in 1993, for example,the summary document was baptized "A Latin American Consensus on Populationand Development." While not always all that consensual, the meeting reflected theconvergence of positions on the necessity and the forms for guaranteeing accessto contraceptive methods (through integrated health programs), on the urgency ofurban problems relative to health and population distribution, and on the context ofsustainable development in which these questions will have to be treated. Thisconsensus does not yet include such questions as the locus of fertility regulation(the woman - or man - as an individual versus the family), abortion and adolescentsexuality. It is important to note, however, that the "progressive" and "anti-progressive" line-up is no longer automatic nor predictable.
In international fora, for example, many developed countries defend positionscloser to Brazilian feminist causes, while more conservative views are expressedby other developing (especially Islamic) countries. In this new context, yesterday'simperialists are frequently today's allies in advocating proper attention to what hasbeen recast as "women's reproductive health." The idea that contraception shouldbe dealt with in the context of comprehensive health care - a cause long espousedby Brazilian and other developing country progressives - has been absorbed bysuch international agencies as the UNFPA. While not yet a reality in Brazil, publicdiscussion of such programs reveals a growing consensus. That this new situationis not yet taken as a political victory by advocates of integrated health care isrevealed in the lingering hostility between family planners and much of thedemographic establishment.
This state of affairs is the inheritance of a prolonged period in Latin America, whenfamily planning (and this was nearly synonymous with population) was seen as an
247

imperialist plot to diminish the number of consumers instead of increasing the sizeof the pie and redistributing this pie. Population control was seen as an alternativeand not a component of development broadly conceived. Indeed, this was to be thecase in many instances: family planning activities were often promoted as lessexpensive and more viable alternatives compared to providing education, sanitationand health to a growing population, and to tackling the thorny problems of land andincome distribution. Considerations on individual rights and personal welfare tooksecond place to economic strategies for development with social justice.
One issue never properly dealt with in Brazil was the stance of developedcountries' progressives on population. The benefits of fertility control were taken forgranted by such voices, without denying (indeed, frequently calling attention to) thebasic social inequalities between developed and underdeveloped countries andwithin developing countries. The need to redress these inequalities as the basis fordevelopment was not an idea exclusive to poor countries. But developed countryacademics were seen as naive interpreters of dominant ideologies. Their analysesdid not overcome the limits of the ideological context of their work, and calls forpopulation planning were proof of this.
3. Environmentalism and the Changing Academic Climate
In this context, the environmental question is one of the new issues whichproposes to redefine development and redefine, therefore, the role of population indevelopment. Most especially, it contributes to defusing the Marx/Malthus debate.It is not questioned any longer that population growth will slow and eventuallycease. The question of how population growth fuels or inhibits economic growth isnot, in this light, any longer the central question. The environmental debate placesthe absolute limits of resources (in spite of technology's role in redefining, replacingor extending supplies of resources), the quality of life and considerations on futuregenerations on a more complex agenda.
The emergence of the environmental question at the international level occurred inparallel with the evolution of this thinking. Identified today as dramaticconsequences of rapid demographic growth in developing countries, degradationand scarcity of natural resources would be first manifested, however, in countries ofslow demographic growth. Critical episodes of thermal inversion in Donora,Pennsylvania in 1948 and in London in 1952 (when 2,000 people died) inspiredclean air laws in the United States and England in the sixties. The poisoning ofMinamata Bay, in Japan, by mercury, came to world attention in 1956 andcontributed to more rigid control of industrial waste. The silent spring arrived first tothe Northeastern United States and the alarm raised by biologist Rachel Carson, in1962, concerning the effects of DDT on the fauna of the region were precursors ofother alarms which would feed the environmental movement in that country. And inthe seventies and eighties, more important than scenes of starvation in Biafra orthe drought in the Sahel in sustaining the new environmental consciousness, werethe toxic cloud of dioxin over Sevesso, Italy, in 1977; the consequences of toxicwastes in Love Canal, in the United States in the same year; and the explosion ofthe nuclear installation of Chernobyl in 1986. These consequences of the industrial
248

way of life of rich countries inspired the first manifestations of contemporaryenvironmental awareness.
The extension of the environmental question to poor countries in the form of aconcern with rapid population growth appeared first among the neomalthusianists,who soon placed environmentalism at the service of their cause. Once theenvironmental question managed to sensitize public opinion, it became a goodcandidate for the list of arguments in favor of population control. In Brazil, as in alarge part of the Third World, this initial way of linking population and environmentdid not resonate well in academic or governmental circles and after a flutter ofcriticism the issue was generally ignored.
As the seriousness of environmental limits came to be better understood, however,their relations with demographic dynamics again became the object of attention,this time from a different perspective. Considering the size of the Brazilian territoryand the present stage of the demographic transition, this new attention arises not interms of the volume or rate of population growth, but directed to questions ofpopulation distribution. The relations between environmental change and othercomponents of demographic dynamics (fertility and morbidity/mortality) areidentified as important, but not yet the object of intensive research. This change ofemphasis occurred in parallel with the above-mentioned change in thinking onpopulation and development, at the international level. Not all segments of the"population community" have absorbed this evolution, however, and today thesimpler version survives in statements of birth controllers and environmentalists.Each uses the relationship in its own way and to its own ends, without havingprobed the possible mechanisms involved.
What we have seen in the course of these decades, then, is that the idea of thepressure of numbers on resources at first grew and later diminished amongpopulation specialists at the international level; set down roots among theneomalthusianists; and was appropriated acritically by environmentalists. Manystudies and the concrete experience of developing countries serve to transform theissue of "population growth as the major obstacle to development" to "rapid growthas one factor among others which makes development more difficult.' Thisdifference of emphasis is accompanied by efforts to determine the mechanisms bywhich growth affects development.1 The attenuation of earlier dichotomizedpositions suggests to Sawyer that the International Conference on Population andDevelopment "may recognize explicitly that the natural environment places limits onpopulation growth, which affects the capacity of nature to offer sustainableconditions of production and of life" (Sawyer, 1993). That this position may be putforward in Brazil without raising earlier polemics points to the new phase in whichthese relations are discussed.
4. Environmentalism and the Brazilian Political Agenda
Brazilian social sciences, then, were slow to distinguish ephemeral and superficialexpressions of environmental awareness in the United States and Europe from realthreats facing man's future on the planet. An appreciation of the social content ofenvironmental problems was even slower to develop. That it was the poor who pay
249

the price of environmental degradation and resource scarcity is only todaybecoming clear within the social sciences.
Two specific events, and the international attention they received, have beenespecially important in changing this picture. The first was the disastrous pollutionof Cubatáo, a steel and petrochemical complex on the coast of Säo Paulo. Theearly eighties witnessed a constant stream of denunciations of anencephaly andother birth defects, benzene poisoning and respiratory illnesses among the localpopulation; of the slow death of the mangrove swamps which were reproductivereservoirs of innumerable ocean species of fish and crustaceans; of open dumpingof toxic waste from the petrochemical and fertilizer industries which were offshootsof the oil refinery; and of deforestation of coastal slopes which resulted from acidand basic rain, with the consequent threat of landslides. Cubatáo's industrial parkwas baptized the "Valley of Death" and the international media - from NBC and LeMonde to the Village Voice publicized the problem.
This situation galvanized public and scientific opinion in Brazil. The BrazilianAssociation for the Advancement of Science (SBPC), for example, wasinstrumental in calling attention to Cubatáo. At its annual meeting in 1982, whosetheme recalled the Stockholm conference ten years earlier, the SBPC created aninterdisciplinary working group whose subsequent research was to haveconsiderable impact on moving state and national authorities to action. The slowredemocratization occurring at this time both permitted this mobilization whichfinally led to government action and widened the political arena to include otherissues than the basic anti-dictatorship movement. The environmental movement,as a cultural and political phenomenon, with a decade's delay in relation to thedeveloped world, was underway.
The second issue which drew public attention to the environmental question wasforest burning in the Amazon. The rapid colonization of the State of Rondônia in theseventies and government incentives to Amazon cattle ranching led to alarmedreaction by researchers of the region, which were soon echoed by the internationalpress. This international attention, in turn, greatly intensified debate within Brazil,and the last few years have seen the politicization of this issue and of theenvironmental question in general. One of the most interesting consequences ofthis concern has been the effort to guarantee the continued presence of nativepopulations in the region. These "forest peoples" - Indians, rubber-tappers andpeasant farmers - have been the object of considerable research and debate. Theconcern has been fed by the movement to defend these native groups and bythose searching for sustainable development strategies for the Amazon. The goalsof development, the relation between its material and non-material benefits, andthe basic relation between man and nature are questions raised within thisframework.
As counterpoint to the Amazon question, the devastation of the Atlantic Forest hasalso gained increased attention. Its conservation has benefited from the politicalimportance of drawing concern to this region, which has already lost 95 per cent ofits forest cover and which contains the major part of Brazil's urban-industrialsector. The internationalist tone that the Amazon question has acquired generatesa defensive, nationalist posture which tends to diminish the centrality of the larger
250

environment/development issue. The Atlantic Forest, which once covered thestates from Rio Grande do Norte to Rio Grande do Sul, is nearly invisible on theinternational environmentalist map. Its preservation and conservation, extremelyimportant from an ecological point of view, can be promoted without suggestingsubservience to foreign pressure. This region, indeed, contains innumerablespecies of plant and animal life whose importance has yet to be evaluated. Thelargest intact portions, in Rio de Janeiro and Säo Paulo, are home to Indians and topeasant farmers and fishermen whose livelihoods are threatened by urbanization,by tourist development and by preservationist policies of state and nationalgovernments. In summary, the region encompasses the same dilemmas as theAmazon, but has a much lower international profile.
These issues have encouraged a local environmentalist movement and politicaland scientific attention. They also represent the two poles of theenvironment/development question. What are the limits within which modernurban-industrial life must operate? How are traditional cultures and environmentalsanctuaries to be preserved against the encroachment of this life? How are theseconcerns compatible with the economic growth necessary to alleviate poverty andpromote social justice? Air pollution, water and sewage treatment, toxic wastedumps, exposure to industrial and domestic contaminants, green space, etc., arequestions fundamental to the quality of life in the metropolitan areas of Sao Paulo(20 million) or Campinas (1 million) or the "California Brasileira" represented by thePaulista interior (4 million). But simultaneous with environmental problems resultingfrom industrial development are those related to the survival of indigenous groupsand their more primitive (and sustainable) relationships with the environment. Brazilthus faces environmental problems of both development and underdevelopment.The challenge that this double dilemma presents has only recently been recognizedby Brazilian social sciences.
5. Conclusion
The evolution of perspectives on population and environment in Brazil, then, havebeen marked by recent political history, by debate on models of economicdevelopment and by sometimes ambiguous and often tense relations betweenBrazilian and developed country intellectuals. Somewhat independently of all this,women have taken the matter into their own hands and have surprised bothpoliticians and demographers with one of the world's most rapid fertility declines.And the environmentalist movement has gained momentum at a rate unexpectedby it most dedicated activists.
The role of international thinking, international pressure and internationalexperience in these areas has been important but has not resulted in automaticabsorption of theory or practice. As the volume of the debate gets turned down,much fruitful exchange will occur. The question is posed for further research bysociologists and historians of social thought, but the prospects for a more relaxedand productive dialog within Brazil and between Brazilian and internationaltraditions have been increased, and this is an accomplishment to becommemorated.
251

Footnotes
'The National Academy of Sciences (NAS) of the United States published, in 1986, an evaluation ofthe relationships among population, development and environment which is representative of theshiñ away from simpler visions of other times. With the participation of well-known students of theAmerican scientific establishment, the Working Group on Population and Economic Developmentsubstituted unidirectional formulations with an effort to examine the mechanisms involved.Organizing its analysis on the basis of questions which identified the basis of the relationship, theNAS asks: "Will slower population growth increase the growth rate of per capita income throughincreasing per capita availability of exhaustible resources? Will slower population growth increasethe growth rate of per capita income through increasing per capita availability of renewableresources? Will slower population growth alleviate pollution and the degradation of the naturalenvironment? Will slower population growth lead to more capital per worker, thereby increasing perworker output and consumption? Do lower population densities lead to lower per capita incomes viaa reduced stimulus to technological innovation and reduced exploitation economies of scale inproduction and infrastructure? Will slower population growth increase per capita levels of schoolingand health? Will slower population growth decrease the degree of inequality in the distribution ofincome? Will slower population growth facilitate the absorption of workers into the modemeconomic sector and alleviate problems of urban growth? Can a couple's fertility behavior imposecosts on society at large?"
References
Brazil. 1994. Statement by Ambassador Mauro Sergio Couto, Head of theDelegation of Brazil to the Preparatory Committee for the InternationalConference on Population and Development. New York, 4 April.
Hogan, D.J. 1992. The impact of population growth on the physical environment.European Journal of Population, 8: 109-123.
Working Group on Population Growth and Economic Development. 1986.Population Growth, and Economic Development: Policy Questions.Washington: National Academy Press.
Sawyer, D. 1993. Populaçâo, Meio Ambiente e Desenvolvimento no Brasil.Seminario Políticas Públicas, Agentes Sociais e Desenvolvimento Sustentável.Ministerio das Relacóes Exteriores. Belo Horizonte, 14-115 de junho.
252

CHAPTER 13
FRONTIER MIGRATION AND ENVIRONMENTALDEGRADATION IN DEVELOPING COUNTRIES:EXPERIENCES FROM NEPAL AND ECUADOR
Keshari K. Thapa and Richard E. Bilsborrow(Carolina Population Centre, University of North Carolina, Chapel Hill, N.C., USA)
1. Introduction
This paper assesses the causes and environmental consequences of frontiermigration in low-income countries based on the experiences of Nepal andEcuador. Our assumption is that although frontier migration in these countries andelsewhere is mainly a demographic response associated with rapid populationgrowth since the 1950s, it is also an economic response to unequal landdistribution, lack of alternative employment opportunities and governmentresettlement policies in frontier regions. We note that while Nepal and Ecuador areat different levels of economic development (per capita GNP of $170 for Nepal and$1,010 for Ecuador in 1991) and have very different histories and cultures, theyalso appear to have important similarities in terms of the causes and consequencesof internal migration from highland to lowland areas1. Relevant similarities andcontrasts will both be noted below as appropriate. The next brief section reviewsthe population growth and distribution situation in Nepal and Ecuador. Section 3then discusses migration and environmental change in more detail in Nepal,followed by similar assessment for Ecuador in Section 4. The final section drawsthe discussion together and makes some policy recommendations.
2. Population Growth and Out-migration: Nepal and Ecuador
Nepal and Ecuador have experienced rapid population growth, especially since the1950s, and have had roughly similar rates of population growth over the past threedecades. During 1965-80. population growth rate in Ecuador reached its peak at3.1 per cent per year—one of the highest in the world. But as a result of asubstantial decline in fertility, it has since tapered off to 2.4 per cent per year duringthe last intercensal period 1982-90, and is currently about 2.1 per cent per annum.The population growth rate recorded for Nepal between 1940 and 1952-54 was 2.3per cent per year, increasing to its peak of 2.7 per cent per year during theintercensal period 1971-81. It has since fallen somewhat to 2.1 per cent per yearduring the 1981-91 period due to a modest decline in fertility (mortality continues tobe higher in Nepal than Ecuador, with the infant mortality rates in 1990 being 128and 63 per 1000 live births, respectively) (United Nations, 1992).
253

As a consequence of out-migration from highland to lowland areas, both Nepal andEcuador have experienced significant growth of their populations in the previouslysparsely populated lowland areas. A substantial in-migration into the Tarai regionmainly from the hill region since the 1950s increased its population from 2.9 millionin 1952/54 to 6.5 million in 1981 and increasing its share in the total populationfrom 35 to 44 per cent. In 1991, the Tarai's population exceeded 8 million, makingits share the largest of the three regions (47 per cent) in the country. Thepopulation growth rate in the Tarai in 1971-81 reached its highest level (4.2 percent per year), compared to the national average of 2.7 per cent (Nepal, HisMajesty's Government, 1993b).
Ecuador has experienced significant migration from the Sierra to the coastal regionsince the 1940s, and more recently from both the Sierra and coastal regions to theAmazon. According to the 1990 census results, in-migration into the Amazonregion has contributed to unprecedented population growth in the region at a rateexceeding 5 per cent per year, or twice the national average (Pichón andBilsborrow, 1992). The population in the Amazon region more than doubledbetween 1974 and 1990, from 173,471 in 1974 to 372,533 in 1990; the largestincrease was in the two northern provinces (Napo and Sucumbios), where itincreased from 62,186 to 180,339 (Southgate and Whitaker, 1992). At the time ofthe 1982 population census, almost half of the Amazon region's population wasborn outside the region, with two-thirds of the in-migrants being from the Sierra(Hicks et al., 1990).
3. Causes and Consequences of Migration in a Frontier Region:The Case of Nepal
3.1. Historical Legacy of Subsistence Farmers and Government Policy
The hill region of Nepal has long been settled, with the mountain region beinglargely uninhabitable and the southern Tarai malaria infested, only sparselypopulated by malana-immune aborigines and some Indian immigrants until themid-twentieth century. Throughout the 18th and 19th centuries, land in the Taraiwas considered abundant relative to the small population (Regmi, 1978). Its historyof skewed land distribution started when the Gorkha state was involved in territorialexpansion from 1769 to 1816 and lands (considered state property) weregenerously granted as rewards and emoluments to civil and military officials,members of the nobility, chieftains and other key state employees. On the otherhand, the numerous poor peasants, living at a subsistence level, were required tosupply free labor to the state and pay rent and taxes, or face eviction (Regmi,1971:54).
The practice of awarding lands to important persons in the royal families andnobility continued throughout the 19th and early 20th centuries even after the endof the expansionist policy. This has led to the creation of a small landed, rent-receiving class and a large poor farmer class not only living at a subsistence levelbut also in debt (Regmi, 1978). The peasants, thus faced with such a hard life in
254

the hill region, have consequently resorted to permanent or temporary internationalout-migration to places such as Assam, Sikkim, Bhutan, Darjeeling and evenBurma (Gurung, 1989; Shrestha, 1990). The recruitment of Nepalese soldiers in theBritish Indian Army after the Anglo-Nepal treaty of 1816 gave further impetus forthe hill people to emigrate. If it was the oppressive land and labor policies that ledto out-migration from the hill region to the Tarai in the pre-1950 Nepal, it appearsto have been mainly the demographic effects of subdivision and fragmentation ofland and inadequate production of small farmers after 1950.
Nepal has experienced rapid population growth, especially since the 1950s.Without concomitant growth of industries, this has led to increased populationdensity on agricultural lands especially in the hill region. With the custom of partibleinheritance among sons, the results have been increasing subdivision andfragmentation of landholdings. The average size of landholding per household hasthus been smaller in the hill region compared to the Tarai, though the differenceseems to be narrowing due to migration (Table 1). Thus in 1961 the average size oflandholding per family was only 0.50 ha in the hill region compared to 2.29 ha in theTarai region. A rural economic survey as early as 1965-66 revealed that over 50per cent of the households in the Tarai had 2 ha or more land (Gurung, 1984:167).In contrast, near landlessness is widespread in the hill area: according to theILO/Asian Employment Program Mission report in 1974, although the proportion oflandless households in the hill region is less than 1 per cent, 59 per cent of farmhouseholds possessed less than 0.2 ha (Rizwanul et al., 1982:42).
Table 1. Nepal: Average Land Holdings per Household by Ecological Region,1961-91
Regions
Mountains
Hills
Mountains +Hills
Tarai
Nepal
Average Size of Land Holding/Household (ha)
1961
—
_
0.50
2.29
1.15
1971
0.47
0.56
-
1.63
0.96
1981
0.62
0.90
-
1.47
1.12
1991
0.68
0.77
-
1.23
0.95
Note: 1971 average holdings per household was based on cultivable land,whereas for other years, it was based on total holdings of farmhouseholds.
Sources: Nepal/His Majesty's Government, 1974, 1988 and 1993a; Dhital inGurung, 1981.
A Land Reform Program, implemented in 1964, was proved largely ineffective inchanging the agrarian structure (Regmi, 1976). Since it was implemented in stages,big landholders were able to evict tenants and distribute lands among family
255

members and relatives beforehand. The reform also encouraged landowners toacquire land for individual cultivation and resulted in the displacement of smalltenant farmers (Kansakar, 1983:246). Thus many of these small landholders in thehill region opted for migration to the Tarai in the hope of acquiring land. If we canignore serious questions about the reliability of the agricultural census data onwhich Table 1 is based, then it would appear that holding size in the hill regionimproved somewhat after the 1970s. If so, inter-regional migration may havecontributed to this. Between 1971 and 1981 the number of households in the hillregion increased by only 14 per cent compared to 40 per cent in the Tarai (Nepal,His Majesty's Government, 1987). This coincides with the largest population growthrate (4.2 per cent) in the Tarai during the 1971-81 period due mainly to in-migration.
The 1981 census gives a rough idea of the importance of land and agriculture forthe hill migrants. According to this census, of the total life-time net migrants fromthe hill region to the Tarai region (424,711), more than 50 per cent gave"agriculture" as their reason for migration (Gurung, 1989). Later migrants were alsoattracted by the availability of better socio-economic facilities in the Tarai. A surveyof 5,621 households carried out in 10 Tarai districts in the early 1980s found that 16per cent of the migrant households were attracted by access to better transport,market, education and health facilities (ibid., 1989:87). Except for Kathmandu in thehill region, the focus of development plans started since 1956 has been onagriculture and road development in the fertile Tarai plain. For example, between1969 and 1983, the Tarai's percentage share of roads in the country increased from34 to nearly 51 (ibid).
Migration of the hill population to the Tarai region was also encouraged by plannedgovernment resettlement programs and malaria eradication programs earned outsince the 1950s. The high incidence of malaria in the Tarai led to failure of earlierattempts by the state to attract hill people. The provision was even made in thelegal code by rulers in the second half of the 19th century entitling alienation ofTarai land to foreigners through sale or purchase, mainly to attract Indianimmigrants. Nevertheless, deforestation was proceeding, albeit slowly in manydistricts of the Tarai even in the first quarter of the 20th century, stimulated in partby demand for wood from the sal tree (Shorea robusta) for use in Indian railwaysleepers (Kansakar, 1985).
The government-sponsored resettlement program, started initially to resettlevictims of the 1954 flood and landslide, was soon thereafter institutionalized. In theFirst Five-Year Development Plan (1956-1960) the Rapti Valley DevelopmentProgram (RVDP) was launched in Chitwan district of the Inner Tarai region with theobjectives of relieving population pressure in neighboring areas, rehabilitatinglandless peasants, and partially solving food problems in the Kathmandu valley.From 1954 to 1960 the RVDP had distributed 27,759 ha of land among 5,233families (Kansakar, 1983:236). To resettle the landless peasants in a more plannedway and to control reckless deforestation, in 1964 the government created anautonomous body, the Nepal Resettlement Company. In 1969, a full-fledgedDepartment of Resettlement was created.
256

As resettlement progressed and available forests decreased, the plot size allottedto settler families decreased (as also occurred over time in the Brazilian Amazon).For instance, in the beginning, the policy of the Nepal Resettlement Company wasto allot 2.7 ha to each approved family. But as land became scarce, plots allotted togovernment settlers decreased to 2 ha by 1972, then in the mid-1970s to only 1.02ha. Families settled after 1987 have reportedly been given only 0.1 ha (Shrestha,1990:193). Between 1974-75 and 1991-92, more than 80,000 families wereresettled (Table 2), but this does not reflect the large volume of spontaneoussettlers encroaching on forests illegally and thus the real extent of deforestation.Despite the large number of families settled, the volume of spontaneous settlers,has remained large (Gurung, 1989).
Although the government has now ended official resettlement programs in the Tarairegion since 1981 (Kansakar, 1985), it is still faced with a large problem ofcontinuing encroachment by squatters. The Official Report of the NepalResettlement Company in 1980 states that so far it had resettled 37,000encroachers (Shrestha, 1990). Indeed, according to a statement issued by theMinistry of Forests and Soil Conservation in December 1992, in the Far-WesternTarai district of Bardiya, more than 2,600 squatter households were actuallyremoved and more than 5,000 ha of forest land were thereby preserved from beingencroached upon in the fiscal year 1991/92. ••-
Table 2. Nepal: Land and Households Resettled in the Tarai
Fiscal Year
1974/75-1980/81
1981/82-1991/92
Total
Land (ha)
31,262
16.272
47.534
No. ofHouseholds
36,348
44,055
80,403
Average Landper Household
0.86
0.37
0.59
Sources: Gurung. 1989; Nepal, His Majesty's Government, 1993a.
3.2. Deforestation in the Tarai
The main environmental correlate of in-migration to the Tarai is large-scaledeforestation. Since the main motive of migrants moving to the frontier region wasland for agriculture, the impact of land extensification (Bilsborrow, 1987) ondeforestation in the Tarai appears to have been enormous, though estimates ofdeforestation vary widely. In 1963-64 the first ever inventory of forest resourcesbased on aerial photographs found 3 million ha of forests remaining, indicating that51 per cent of the Tarai was under forest. By 1978-79, about 44 per cent of thearea remained under forest. Between 1978-79 and 1991, the total forest loss in theTarai region was estimated to be 415,000 ha, or at an annual rate of 3.3 per centper year (calculated from data in Gurung, 1989 and Forest Survey and StatisticsDivision in Nepal, His Majesty's Government, 1993a). This represented aconsiderable increase in the pace of deforestation compared to earlier years.
257

Table 3 provides aggregate data on population dynamics and forest loss in theTarai region for several different time periods. The Eastern Tarai had the lowestpopulation increase due to net migration in 1961-71 but the largest forest loss,whereas the Western Tarai, despite a comparatively large population increase dueto net migration, had a forest loss less than 1 per cent per year. It is thus clear thatother factors besides in-migration must be involved in the deforestation process.Indeed, the Eastern Tarai, with over 2 million people even by 1971, had by far thehighest population density in the Tarai (205 persons/km2, compared to a nationaldensity of 79). This higher density puts forests in the region at greater risk of beingcleared. The Central Tarai had both a large population increase due to netmigration between 1961 and 1971 and a high forest loss over 1 per cent per year.In the Western Tarai, while population size and density are relatively low, both arerising very rapidly recently partly due to heavy in-migration. This is associated witha very high forest loss of 3 per cent per year during the most recent period from1974-75 to 1991. It is also important to note that although the proportionateincrease in population due to net migration has decreased in the Tarai regionbetween the successive censuses, second-generation impacts may now beincreasingly felt to the extent the children of migrants stay in the region.Unfortunately, there are no direct data on this topic in Nepal.
In addition to population growth, density and in-migration effects, economic factorshave undoubtedly played important roles in the Tarai deforestation. In particular,commercial exploitation of forests by timber interests is also partly responsible forforest clearing and use in the Tarai. The construction of the East-West Highway(969 km. in total) and other roads linking important centers of the hill region to theTarai, not only helped increase the flow of migration and the destruction of forestsin the Tarai (Jha, 1993) but also facilitated commercial exploitation of the forests.
The demand for land in the Tarai has persistently exceeded targets set byresettlement plans. As a result, there has been large-scale encroachment intoforests. According to the Fifth Development Plan (1975-80), between 1964 and1974 forest land cleared for official settlement amounted to 77,700 ha, but anadditional 237,600 ha was lost by encroachment due to spontaneous migration. Inaddition, there appeared to be rampant malfeasance and nepotism in thedistribution of land by the government (Kansakar, 1985:114), and many landlessand natural disaster victims were able to obtain land (Shrestha, 1990). Those whowere unable to get land through official channels formed a large cadre ofspontaneous settlers.
Large-scale destruction of Tarai forests in the Bhabar region in the north, with itsdeep alluvial soils mixed with sand, pebbles and gravels, has also had immenseimpacts in the southern Tarai. Much of the northern part was not suitable foragriculture, with its forests serving as a check for the fast-flowing hill riversentering the Tarai. Thus the destruction of its forests has resulted in increasingfloods in the Tarai plains (Kansakar, 1985:117). The massive flood in the summerof 1993 in the Tarai region, with the largest number of reported flood deaths inNepal this century, is a grim reminder of the consequences of environmentaldestruction.
258
3.3. The Condition of Migrant Settlers in Nepal
Although the deforestation of valuable forests is a source of environmental concern,another important issue is whether frontier migration has helped in improving theeconomic conditions of the migrants themselves. In the case of Nepal the answerseems mixed. According to Shrestha (1990), the previous socio-economicbackground of migrants and their present aspirations both play important roles inland acquisiton and achievement on the frontier. Moreover, land speculation isanother important fact in the frontier region: as the flow of migrants continued torise, land transactions became common, even though the sale of governmentallotted plots was supposed to be prohibited for 10 years after resettlement. Butnew migrants were always willing to buy land from previous settlers even thoughthe latter did not have legal land titles (ibid, 1990:229). Some of the latter in factwere simply professional squatters involved in land speculation. In oneresettlement project area (Nawalpur), 50 per cent of the original settlers sold theirland and moved elsewhere. The poor quality of land also contributed to this, assome settlers sold their allotted land and purchased better quality land elsewhere(Kansakar, 1985).
259

s.
co*o>LX
15
0)
"oC
Q.Q)O•D
tocoToG)
nQ.0)Zri
S"a
°m0>
o
c
su
cn
nii
oa.o£
oc
igr
Sci
£
To« c3 O
II3Q.oa.
Reg
l
199
97
8-7
nua
Cl
t
S
1
co
1
en
(
CDCl
enen
coen•"
Cl
1961
a?
i n^*
u>
m
m
01
anq
U
Cl
359.
092
co
cocoo
i
Cli nCOm
co
s
1
co
o
co
o
1
Clco
CM
ci( 0
cooCM
1
O
182.
32.1
CM
O
1
O)
CM
öCM
1
So
—o
11
i nco
CMmm
31.1
m
Cen
li
304.
04.9
coCM
1
oClco
n
mco
ii
3o
3o
1
Cl
(OCM
mm
CM
S
Eas
t
co
847.
263.
0
Sci
i
ö
1.37
coCMmwZ
8o
So
so
m
en
CMcoCOco
co
g
Cl
119
2n
Tot
al
260

A survey of 407 households carried out in 1988 in two resettlement districts of theTarai found that the decreasing availability of land on the frontier, as migrationincreased, has led to increasing squatter settlement and encroachment on forestmargins (Shrestha et al., 1993:790). According to this survey, of the 84 householdswho were landless prior to coming to the Tarai, 56 per cent received land from thegovernment while 14 per cent self-occupied it, 8 per cent purchased it, and 22 per centremained landless. In total, including the landless and those with some land in the hillregion prior to migration, 47 per cent had received land through purchase, 14 per centthrough self-occupation, and 26 per cent from the government, while 13 per centremained landless (¡bid.:799). The majority of the previous subsistence farmers andsmallholders from the hills thus had to purchase land, and did not receive anyassistance from the government.
If migrants' welfare is determined by the amount of land possessed, based on thesurvey carried out in 1988, 66 per cent of the total sample of migrant households hadmade at least some absolute gain over what they had in the hill region prior tomigration. On the other hand, 28 per cent had less land compared to before and 6 percent experienced no change (ibid:807). But in such a narrow measure of welfare,income level, health, education, housing quality and access to markets and amenitiesare not considered. From the migrants' own perspective, despite the usual small size ofholdings, 85 per cent of sample households stated that their economic situation in theTarai was better than it had been in the hills prior to migration, 8 per cent about thesame, and only 5 per cent worse (¡bid:809).
Nevertheless, in the case of Nepal, frontier migration has not helped solve socio-economic inequalities. In fact, data show that land distribution is even more skewed inthe Tarai than in the hills. In 1981 about 46 per cent of Tarai households with less than0.5 ha, accounted for only 3 per cent of the total cultivated area, whereas the 14 percent of the households with more than 3 ha accounted for nearly 58 per cent of thetotal cultivated land (Yadav, 1987). The landholdings migrants receive are generally toosmall, especially those of later migrants:"... almost 50 per cent of the sample migranthouseholds were still landless and near landless ... If one takes into account thesubsistence class, the percentage of the migrant population with 1 ha or less land goesup to almost 75 per cent" (Shrestha, 1990:217). With such small holdings, prospects forsignificant economic betterment of migrant families are dim, even though they seethemselves as better off.
4. Frontier Migration and Deforestation: The Case of Ecuador
4.1. Historical Legacy of Subsistence Farmers and Government Policy
As in Nepal, the population of Ecuador has long been concentrated in the highlands(Sierra) region, the coastal region, with its heavy but uneven distribution of rain, andthe Amazon region, with its very humid climate, being much less hospitable areas.Since the 1950s however, with the banana boom and decline in malaria in the coastalregion, people from the highlands have often migrated to the coast. Now a slightmajority of the total population resides in the coastal region. But more recently, since
261

the discovery of oil in the Amazon and the subsequent construction of roads linking thisregion with the Sierra beginning in the early 1970s, the Amazon region has also begunto experience a substantial flow of migrants, primarily for land colonization. Theenvironment of the Ecuadorian Amazon region, with its extremely rich biologicaldiversity (Myers, 1986) is, however, quite fragile. It is a home to innumerable rarespecies of plants, birds, fish, and mammals, but is mired in a conflict between theneeds of conservation vs. the need for exploitation of its resources for development, asmore and more oilfields are discovered and brought into production.
As a legacy of its Spanish colonial history and prior Inca civilization, land distributionhas long been highly skewed in the Sierra region, with large landowners invariably ofSpanish descent. In 1954 there were around 3,000 large haciendas in the Sierra, withan average size of 650 ha (Peek and Antolinez, 1980:2). They constituted only one percent of the farms but occupied two-thirds of the cultivated land. These landstraditionally operated under a system of servant labor, called huasipungo, in whichprimarily Indian farmers had access to small plots of land for producing for subsistenceneeds in return for providing work to the hacienda owner. This work included both workon the other lands of the hacienda as well as by the farmer's wife and children in andaround the hacienda building as servants, cooks, etc. The Indians were essentially tiedto the hacienda for life, and unable to migrate away. In addition, of the other Sierrafarmers 32 per cent in 1954 had less than one ha and together accounted for only 1per cent of the total farm area (ibid.). Meanwhile, only about 15 per cent of the largehacienda area was cultivated on average, so the small landholders' opportunities foremployment were limited. The majority of these smallholdings were too small tosupport a family, thus condemning them to poverty.
A major land reform program in Ecuador in 1964 abolished the huasipungo system andrelated forms of servant labor, and declared that farmers were to receive the land theycultivated, with the land reform agency (IERAC) to provide credit and technicalassistance and organize farmers into cooperatives. But while land reform changed themethod of cultivation and "freed" the servant laborers (e.g. to migrate), it did notsignificantly change the distribution of land (ibid:12). Based on the only subsequentdata available (and unfortunately the most recent agricultural census, carried out in1974), the 65 per cent of the farms which had less than 5 ha still accounted togetherfor only 7 per cent of the farmland, while at the other end the 2.4 per cent of the farmswith over 100 ha had nearly half (48 per cent) of all the farmland (Bilsborrow and Peek,1992:365). Landowners had often avoided expropriation by simply dividing land amongmany family members (creating also many absentee landlords). At the same time,many of the large farms shifted into cattle and milk production, converting cropped landinto pasture, facilitated by loans from government agencies. The fate of thesmallholders was actually in a sense worsened by land reform, as they were no longerprotected by landowners and provided with small dwellings, plots and tools. Also,because of the shift of haciendas increasingly into low labor-intensity pasture, farmlaborers have increasing problems finding farm work. Among those who did have smallfarms, the average size of those farms with less than 5 ha decreased from 1.61 to 1.45ha during the period 1954-74 (Peek and Antolinez, 1980:14). It is likely that thisdecrease is associated with rural population growth due to declining mortality, and tofragmentation of plots over time due to division among children (regarding Guatemala,
262

see BilsboiTow and DeLargy, 1991), but this link has not been made by any scholars ofagrarian change in the Ecuadorian Sierra.
By the 1970s, many peasant families in the Sierra were surviving by earning asignificant part of their income from temporary labor out-migration. In addition,according to a detailed migration survey conducted in the region in 1977-78, over 50per cent of the households with farm sizes less than 5 ha had permanent out-migrantsin contrast to only 27 per cent of those with more than 10 ha The small farms hadextremely high intensity of labor use but their size limited their labor absorption(Bilsborrow and Peek, 1992: 364-365); as a result, often some family member had toout-migrate to seek off-farm employment as a family survival strategy (¡bid:367).
During the time when Ecuador experienced its highest population growth in the 1960sand 1970s, the problem of rural poverty associated with the highly skewed distributionof land was probably aggravated. Thus, in the absence of any real redistribution ofland, land reform was a factor "in stimulating a part of the rural population to migrateelsewhere, either to [other] rural areas where there is land and employment morereadily available, or to the towns and cities" (Redclift and Preston, in Preston,1980:59). The state was also more active in encouraging colonization in the Amazonthan in carrying out land reform in the Sierra (ibid:55). Thus the Amazon region hasbeen viewed by the government as an "escape valve" for people without much land,especially in the Sierra. Public forest lands in the Amazon can be converted into asettler's private plot if (s)he presents evidence of agricultural use or cattle production,according to the 1978 Law for the Settlement of the Amazon, which also encouragedsettlement of the Amazon region as an urgent national priority (Hicks et al., 1990:7)because of concern about Ecuador's border security with such a low population density(Pichón, 1992). This concern was strongly motivated by the fact that Peru, withsuperior military force, forcibly seized over half of Ecuador's Amazonian lands in 1942while the major powers were engaged in World War II.
4.2. Deforestation in the Amazon
As in many other parts of the world, estimates of deforestation in the EcuadorianAmazon vary greatly. According to Cabarle et ai. (1988, quoted in Hicks era/. 1990:15),75,000 ha of lowland forests are being cleared annually in the Ecuadorian Amazon.Population increase is highest in the northern two Amazonian provinces of Napo andSucumbios, at a rate of 6.5 per cent per year, where the forest loss is estimated at 1.5per cent per year (Table 4). The province of Zamora Chinchipe has the second largestannual increase in population in 1974-90 and the highest percentage forest loss ofover 4 per cent per year, while Pastaza had the lowest percentage forest loss. Butgiven the large differences in initial endowments of forests across provinces, it is muchmore relevant to examine the relationship between the absolute loss of forests andpopulation growth (which is always due to both natural increase and net migration).Thus Napo and Sucumbios had the largest absolute increase in population, as well asthe largest forest loss in absolute terms (770,000 ha) among the four province areas;but because of its large initial forest area, they experienced only a small annualpercentage loss. Meanwhile, the provinces of Zamora Chinchipe and Morona Santiagohad the next largest population increases in absolute terms and also had the secondand third largest forest losses, while Pastaza had the lowest absolute increase ¡n
263

population and also the lowest forest loss (250,000 ha). The fact that the forest loss inMorona Santiago (550,000 ha) was higher than in Zamora Chinchipe may be attributedto its population density. Thus as in the case of Nepal, population density and the initialstock of forests should both be taken into account in looking at the relationshipbetween the rate of forest destruction and population change. On the whole, there doesappear to be a closer relationship in the Ecuadorian Amazon than in Nepal betweenpopulation growth and the rate of forest loss based on these "ecological" data. Butmore work is needed at a more disaggregated level to sort out the effects ofdemographic and non-demographic factors.
Table 4. Ecuador: Population and Forest Change in the Amazon
Provinces
Napo andSucumbios1
Pastaza
MoronaSantiago
ZamoraChinchipe
Ecuador
Population (in 000)
1974
62.2
23.5
53.3
34.5
6.826.0
1982
113.0
32.5
70.2
44.8
8.605.0
1990
180.3
41.8
84.2
66.2
10.587.0
Annual%
Change
1974-90
6.5
3.7
3.0
4.2
2.9
Forested Area(000 ha)
1965
3.270
3.500
1,300
700
16.2502
1984
2,500
3.250
750
300
12.4003
Annual%Loss
1965-84
-1.5
-0.4
-3.0
-4.4
-1.81 Data are presented for both provinces together to achieve comparability over time, since Sucumbios
is a new province created out of the old Napo province in 1990.21969-713 1985
Sources: Southgate and Whitaker. 1992, originally from INEC. 1977, 1985 and 1991 and SUFOREN;FAO. 1993; World Bank. 1987 and 1993.
In the country as a whole, the recent rate of forest destruction is 1.8 per cent per year,most in the Amazon region. Since the initial size plot of land (40-50 ha) the settlersreceive from the government's land titling agency (IERAC) is relatively large in theEcuadorian Amazon, the land use decisions of existing settlers will also continue tohave significant impacts on future deforestation. While a few large corporateplantations of cash crops in the area, such as palm oil and tea, use capital-intensivetechnology and modern inputs, the vast majority of settlers use a simple hand-tooltechnology and practise a mixed system of cultivation: subsistence food production forfamily consumption, a small vegetable garden, a pasture area which tends to increaseover time, and an area devoted to cash crops, mainly coffee. Much of the plot remainsforested, varying with the duration of settlement, size of family, and the farm and off-farm activities settler families are involved in. The land use practices of farmers oftenevolve over time from initially clearing a small patch for subsistence food production toclearing a larger area for cash crops, and then, once cash income starts coming in,
264

using it to clear a much larger area for pasture and cattle. A long-term goal of settlersis to acquire cattle, for at least four reasons: because it yields a higher income withless labor, because it provides a store of wealth which can be drawn upon or sold incase of sudden need or emergency, because it is easy to market ("the cattle do itthemselves," the settlers say, by walking to market), and because it gives status. Inaddition, the conversion of forest land into pastureland is also encouraged indirectly bystate policies that provide Banco de Fomento loans for cattle acquisition.
4.3. The Condition of Migrant Settlers in the Amazon
In 1990 Pichón and Bilsborrow carried out a detailed representative household surveycovering about 420 settler families in the Napo and Sucumbios provinces ofEcuadorian Amazon in order to understand land use decisions at the household leveland their implications for deforestation (Pichón and Bilsborrow, 1990). According to thatsurvey, 68 per cent of the sample of farm settlers came from the Sierra (28 per centfrom the Coast), and 90 per cent were from rural areas, so it can be generallycharacterized as highland to lowland rural-rural migration. While nearly two-thirds ofthe settlers owned some land before migrating, most had less than 5 ha. Thus mostmigrants were of the "survival" type, with nearly two-thirds mentioning access to theirown land (or to more land) as their major reason for migrating to the Amazon.
Since the initial plots each settler receives from the state (40-50 ha.) are large andusually laid out in a rectangular grid of 100m by 2 km plots, only two families live ineach square kilometer, so settlements are usually not clustered (Pichón andBilsborrow, 1992:13). Initially, the settlement policy produced a relatively equitabledistribution of land: the Gini coefficient for land in the mid 1970s was 0.36 compared to0.67 for the Sierra. However, with a longer duration of settlement, land acquisition bythe more successful or wealthier migrants from the less successful, and increasingdemands for commercially-oriented products such as cattle and palm oil, have led to asomewhat increased land concentration (Fundación Natura, 1988, quoted in Hicks etal, 1990:17). According to the 1990 survey, landholdings of settlers averaged 44 ha,ranging from 1.15 to 400 ha. The small plots constitute only 5 per cent of the total—mainly portions of legal settler plots provided illegally for share-cropping. The largestplots reflect some consolidation of plots evolving over time.
As of 1990, 90 per cent of the sample settlers had at least a provisional land title, withnearly 50 per cent having full legal titles. Only 32 per cent of sample households hadobtained their land directly from the government, with 61 per cent buying it fromprevious settlers, including land speculators, despite restrictions on such illegal landtransactions. Among those who purchased land, 61 per cent received certificate of landtitles and 39 per cent did not. Only a negligible number of households (3) reported thatthey had simply squatted on land. Survey responses suggest settlers are generallysatisfied with their lives (as in Nepal), despite the great difficulties of life in the Amazon:about two-thirds of sample household heads stated in the 1990 survey that life wasbetter for them in the Amazon than in their previous place of residence, 21 per centabout the same, and only 13 per cent worse.
265

Based upon the survey data, Pichón and Bilsborrow (1992) examined householdsocio-economic characteristics, institutional and ecological factors and their effects onsettler decisions to clear forests. They found that most settlers have put their plots tomore than one use: on average they were allocating 22 per cent for pasture, 17 percent for perennial crops and 5 per cent for food crops, with 56 per cent still remaining inforest. Land use varies by farm size, with larger farms having higher percentages oftheir farm areas remaining in forest, as is to be expected. The other variables thataffected land use decisions include family size (larger families clear more), possessionof a secure land title, soil quality, and duration of settlement (longer duration means alarger area cleared). But the most important factors that influenced land use werelogistical: the greater the distance to the nearest market or to a primary or secondaryroad, the less deforestation on the settler plot, interpreted as reflecting ease ofcommercialization of output.
Despite the perception of abundant land in the Amazon region, further settlement of thearea and further deforestation cannot be expected to solve the problems associatedwith population pressures and inequitable land distribution in other regions of Ecuador.The fragility of soils in the region means that the perception of abundant land isdeceiving. Most tropical rainforests are on soils too poor for uses other than remainingin forest. Surveys of the Amazon region in Ecuador and elsewhere indicate that limitedsoil fertility and poor drainage render sustainable crop production uneconomical inmost of the region. In addition, its forests are among the richest in the world inbiodiversity, so that continued deforestation is exacting a terrible biological price.
5. Concluding Remarks
Nepal and Ecuador are both countries of great physical, ecological and culturaldiversity, with large, environmentally important, ecologically fragile regions. AlthoughEcuador's current population (11 million) is only about half that of Nepal's (20 million)—and its population density about one-quarter that of Nepal—both countries have beenundergoing rapid rates of population growth and deforestation in recent decades. Thepopulations of both countries will also continue to increase substantially for severalmore decades (at least) because of their young age distributions associated with pasthigh fertility. Thus if population growth remains at its current moderate level, forexample, Ecuador's population will reach that of Nepal's current population in about 30years, while Nepal's will double to about 40 million. Agriculture will probably continue toprovide a major source of livelihood for people in both countries, with strong potentialimplications for further deforestation.
In both countries rural-rural migration of small farmers from densely populatedhighland areas to lowland forest frontier regions has been the proximate cause ofdeforestation. Thus timber operations and large agricultural plantation operations haveplayed only minor roles in the process. Similarly, in both cases, most migration hasbeen spontaneous, though some was government-sponsored in Nepal (in Ecuador,the land titling agency was involved mainly in distributing land titles). Also similar inboth countries is the powerful effect of roads on "opening up" the lowlands area tosettlement, the insecurity of land tenure, and the predatory and uncontrolled role
266

played by land speculators in acquiring plots initially only to resell them for profit laterto the "real" agricultural settlers.
In both Ecuador and Nepal, the desire for land has been the predominant motivation forout-migration from highland to lowland areas. In this sense, subsistence farmers with aneed for survival have constituted the majority of the migrants. The skewed distributionof land and the small size of holdings in highland areas, and the absence ofgovernment policies to improve agricultural technology, contribute to inadequateincomes from land, so many farm families must resort to out-migration as the onlyalternative. Even in Ecuador where the discovery of oil and the construction of roads inthe Amazon initially helped migrants move to the region, the main motivation was stillland ownership rather than service-sector employment.
There are, nevertheless, some important differences in the deforestation and migrationprocesses in the two countries. First, deforestation in Nepal's Tarai region has been amuch longer, slower process, going on even before the construction of the major roadslinking it with other parts of the country beginning in the 1950s. In the case of Ecuadorin contrast, deforestation has been quite rapid and recent, mainly due to the discoveryof petroleum and the subsequent unpaved road network in the northern Amazon, builtby the oil companies, that facilitated settlers' migrating to the region since the early1970s.
The abundance of land remaining to date in the Ecuadorian Amazon is anotherimportant difference between the two countries (though it may be only a matter of timebefore it too no longer exists). As a result, plots allocated to settlers werecomparatively large in Ecuador (50 ha cf. 1-2 ha or less in Nepal). The notion of theTarai as an "escape valve" in the case of Nepal has already proved to be false as itspopulation share is now the highest in the country (47 per cent cf. 46 per cent in the hillregion in 1991), and its density has almost equalled that of the hill region (6.6persons/ha in the hill region cf. 6.1 persons/ha in the Tarai, according to the 1991census). Although the Tarai's population growth has slowed down somewhat comparedto earlier years (to 2.8 per cent per year between 1981-91, compared to the nationalaverage of 2.1 per cent per year), the effect of past high natural growth is increasinglyfelt in the Tarai as per capita landholdings have decreased due to subdivision andfragmentation. This could well occur in the Ecuadorian Amazon in the future as well.However, in much of the Amazon, poor soil quality may prompt many migrant settlersto abandon current plots once their productivity declines. This could lead to a cycle ofdeforestation, as has already occurred in the Brazilian Amazon.
In Ecuador, the very high fertility of migrant settlers has been noted earlier (Pichón andBilsborrow, 1992). Thus there will also be substantial second-generation effects to theextent migrants' children remain in the region and resort to agriculture (crop cultivationand pasture) as a way of life. As the weak soils lose their fertility over time, there willbe greater efforts of existing settlers to clear more forests unless other economicopportunities in the area increase substantially.
Given the different amounts of land migrant settlers have access to in Nepal andEcuador, it will be important to continue to monitor changes in land use patterns overtime in the two countries—the extent to which agricultural production increasespredominantly at the intensive vs extensive margin—as population density increases.
267

At the macro level, when looking at the relationship between frontier migration andforest loss, it is necessary to take into account initial population density and the initialstock of forests. In any case, the complex interrelations among on-going economicprocesses, population growth, and environmental degradation cannot be understoodadequately using only existing macro level data, so more intensive investigationsbased on household/farm and community level data are needed in both areas of originof migrants and areas of destination or deforestation. Thus in Ecuador it is important toboth reduce and better direct the flow of new migration into the Amazon region. Thiswill require a careful study of the underlying causes of out-migration from places oforigin. Other important areas for further research in the Amazon itself include assessingthe determinants of fertility and the health problems of migrant settlers; the current andthe expected economic activities of migrants' sons and daughters, and the extent ofsecond-generation settlement and land clearing, now that many migrant families havebeen in the area over 15 years; and the effect of community-level conditions includingpolicy factors, such as the availability of health facilities, education, agriculturalextension services, road access, etc., on settlers' fertility, mortality, economic activitiesand pace of deforestation.
The other important consideration in Ecuador is the need to preserve as much aspossible of the remaining rich forest resources in the Amazon. Based on the 1990survey, over half of migrant settlers' land remains in forest, so there is a need toeducate both households and communities on the importance of preserving forests,and to encourage them to become involved in the preservation of their own forestareas.
The experience of Nepal with respect to community forestry may provide an interestinglesson for Ecuador in this respect. After the nationalization of forests in 1957 and thesubsequent failure of central government policies to stop deforestation, the governmentsince 1978 has tried to involve local people once again in preserving forests aroundtheir communities by reintroducing a community forestry approach. Under thisapproach, the authority of forest management is delegated to local user groups, usuallya village-level group with members from each of the wards constituting severalvillages. It makes its own rules and regulations regarding forest preservation, such aswhat trees to cut and when, how much to allow each household to cut, how to monitorthe rules, and what punishments should be if the rules are not followed. On a broaderlevel, such forestry management can also generate a supplementary source of incomefor the community "with both forest and agriculture practised as a balanced land usesystem" (Kayastha, 1991). Important to the community forestry approach, however, isan awareness in the local community of the importance of forests and theirpreservation. Promoting local community "ownership" over forest resources in theEcuadorian Amazon—where most people have arrived only recently, and fromdifferent parts of the country—is likely to be more difficult but is surely worth pursuing,together with other policies discussed earlier (see e.g., Pichón and Bilsborrow, 1992;Pichón. 1993).
In Nepal, a new community forestry approach has thus taken shape. There is a need tostudy its effectiveness—its strengths and weaknesses in the hill region as well as inthe Tarai, where there is greater cultural diversity in the population. At the same timehousehold surveys are necessary to collect information to permit investigating out-migration patterns from the hill region (now that Tarai land is no longer easily
268

available), along with other adaptations to high population growth and scarce land inrural areas. It is also desirable to investigate demographic in comparison with otherreasons for the declining size of landholdings in the Tarai, which could be done basedupon the new household survey data or even aggregate agricultural census data.Above all, there is a need for a more holistic approach in forestry and populationpolicies. For example, present programs of afforestation and family planning are likelyto be more sucessful in contributing to environmental conservation if they are moreclosely integrated. But unless the quality of life of the majority of the rural populationcan also be raised through other development programs, such efforts are likely to havelittle effect in the long run.
Footnotes
"•Geographically, Ecuador can be divided into three distinct regions: a coastal region(with the largest city and seaport, Guayaquil) in the west; a highland region called theSierra (lands in the central region, generally above 1200 meters) which contains theonly other major city, the capital, Quito, in the middle; and the Amazon region in theeast. Nepal can similarly be divided into three regions: a mountain region in the north(above 4850 meters), comprising less than 10 percent of the total population; a hillregion in the middle with many densely populated valleys (600-4850 meters), includingthe largest city and capital, Kathmandu; and the Tarai region, a lowland tropical belt inthe south bordering India.
References
Bilsborrow, R.E. 1987. Population pressures and agricultural development indeveloping countries: a conceptual framework and recent evidence. WorldDevelopment, 15:183-203.
Bilsborrow, R.E. and P.F. DeLargy, 1991. Land use, migration and natural resourcedeterioration in the third world: the cases of Guatemala and Sudan. Population andDevelopment Review. Supplement to 16:125-147.
Bilsborrow, R.E. and Peter P. 1992. Peasant farming and labor migration: evidencefrom the Ecuadorian highlands. Proceedings of IUSSP Conference on ThePeopling of the Americas. Veracruz, Mexico, May 18-23.
Food and Agriculture Organization, 1993. Country Tables. Rome.
Gurung, H. 1981. Food Systems and Society in Nepal: An Overview. New ERAOccasional Paper 2, Kathmandu, Nepal: New ERA.
Gurung, H. 1984. Nepal: Dimensions of Development. Nepal: Sahayogi Press.
Gurung, H. 1989. Regional patterns of migration in Nepal. Papers of the East-WestPopulation Institute, 113. Honolulu, Hawaii.
Hicks, J. et al., 1990. Ecuador's Amazon region: development issues and options.World Bank Discussion Papers 75, Washington, D.C.: The World Bank.
269

Jha, H.B., 1993. The Tarai Community and National Integration in Nepal. Center forEconomic and Technical Studies in cooperation with Friedrich Ebert-Stifttung,Kathmandu, Nepal.
Kansakar, V.B.S. 1983. Population distribution policies and planned resettlement inNepal. In A.S. Obérai, ed., State Policies and Internal Migration. New York: CroomHelm.
Kansakar, V.B.S. 1985. Land resettlement policy as a population redistribution strategyin Nepal. In LA. Kosinski and M. Elahi, eds., Population Redistribution andDevelopment in South Asia. Boston: D. Reidel Publishing Co.
Kayastha, B.P. 1991. Elements of Community Forestry in Nepal. Kathmandu, Nepal.
Myers, N. 1986. Tropical deforestation and a mega-extinction spasm. In Soule, ed.,Conservation Biology: The Science of Scarcity and Diversity. Sunderland, Mass:Sinauer Associates, Inc.
Nepal, His Majesty's Government. 1974. Statistical Pocket Book - Nepal. Kathmandu,Nepal: Central Bureau of Statistics.
Nepal, His Majesty's Government. 1987. Changes in 1971/72 and 1981/82 SampleCensuses of Agriculture of Nepal at Ecological Belt Level. Kathmandu, Nepal:Central Bureau of Statistics.
Nepal, His Majesty's Government. 1988a. A Comparative Study of Ecological Belts onthe National Sample Census of Agriculture for Nepal, 1981/82. Kathmandu, Nepal:Central Bureau of Statistics.
Nepal, His Majesty's Government. 1988b. Master Plan for the Forestry Sector Nepal,Main Report. Kathmandu, Nepal: Ministry of Forests and Soil Conservation.
Nepal, His Majesty's Government. 1992. Statistical Pocket Book - Nepal. Kathmandu,Nepal: Central Bureau of Statistics.
Nepal, His Majesty's Government. 1993a. Statistical Year Book of Nepal - 1993.Kathmandu, Nepal: Central Bureau of Statistics.
Nepal, His Majesty's Government. 1993b. National Sample Census of Agriculture:Nepal, 1991/92, District Summary. Kathmandu, Nepal: Central Bureau ofStatistics.
Nepal, His Majesty's Government. 1993c. The International Conference on Populationand Development. Nepal's Country Report. Kathmandu, Nepal: National PlanningCommission Secretariat.
Peek, P. and P. Antolinez, 1980. Labor Migration in the Sierra of Ecuador Causes andIncidence. World Employment Program Research Working Paper, WP36,International Labor Organization, Rome.
Pichón, F.J. 1992. Agricultural settlement and ecological crisis in the EcuadorianAmazon frontier: a discussion of the policy environment. Policy Studies Journal,20(4):662-78.
Pichón, F.J. 1993. Agricultural Settlement, Land Use and Deforestation in theEcuadorian Amazon Frontier: A Micro-level Analysis of Colonists' Land-Allocation
270

Behaviour. Ph. D. Dissertation, Department of City and Regional Planning, TheUniversity of North Carolina at Chapel Hill, USA.
Pichón, FJ . and R.E. Bilsborrow. 1990. Survey of Agricultural Colonists in theEcuadorian Amazon, Carolina Population Center, University of North Carolina,Chapel Hill.
Pichón, FJ . and R.E. Bilsborrow, 1992. Land use systems, deforestation andassociated demographic factors in the humid tropics: Farm-level evidence fromEcuador. Paper presented at the IUSSP Seminar on Population and Deforestationin the Humid Tropics, Campinas, Brazil, November 30-December 3. OxfordUniversity Press (in press).
Preston, D.A. 1980. Environment, Society, and Rural Change in Latin America. NewYork: John Wiley and Sons.
Regmi, M.C. 1971. A Study in Nepali Economic History, 1768-1846. New Delhi:Manjushri Publishing House.
Regmi, M.C. 1976. Landownership in Nepal. Berkeley: University of California Press.
Regmi, M.C. 1978. Thatched Huts and Stucco Palaces. New Delhi: Vikas PublishingHouse Pvt. Ltd.
Rizwanul, I. et al. 1982. Employment and Development in Nepal.ILO/AsianEmployment Program (ARTEP). Bangkok, Thailand.
Shrestha, N.R. 1989. Frontier settlement and landlessness among hill migrants inNepal Tarai. Annals of the Association of American Geographers, 79(3):370-89.
Shrestha, N.R. 1990. Landlessness and Migration in Nepal. Boulder, Colorado:Westview Press.
Shrestha, N.R. ef al. 1993. Frontier migration and upward mobility: The case of Nepal.Economic Development and Cultural Change, 41 (4):787-816.
Southgate, D. and M. Whitaker. 1992. Development and the Environment; Ecuador'sPolicy Crisis. Quito, Ecuador: Instituto de Estrategias Agropecarias (IDEA).
United Nations, 1992. Statistical Yearbook 1988/89. 37. New York: Department ofEconomic and Social Development/ Statistical office.
Whitaker, M. and D. Colyer. eds. 1990. Agriculture and Economic Survival: The Role ofAgriculture in Ecuador's Development. Boulder, Colorado: Westview Press.
World Bank. 1987. World Tables. Fourth Edition. Washington D.C.
World Bank. 1993. World Development Report 1993. Oxford: Oxford University Press.
Yadav, R.P. 1987. Agricultural research In Nepal: Resource allocation, structure andincentives. Research Report, 62. Washington, D.C: International Food PolicyResearch Institute.
271


CHAPTER 14
LOCAL COMMUNITY APPROACH TO THE STUDY OFPOPULATION-ENVIRONMENT INTERRELATIONSHIPS AND
DISHARMONY: THE RELEVANCE FOR AFRICA
Hyacinth I. Ajaegbu(Population, Environment and Development Agency, Jos, Nigeria)
1. Introduction: A Local Community Approach
A logical starting point for this paper is to discuss the question: what is local communityapproach? This implies a way of looking at issues from the local-level perspective,defining local-level problems for investigation, disaggregation, even global-levelissues to their area-specific local origins in an attempt to understand the actualdecision-making process and other behavioural processes involved.
In the context of the study of population-environment (P-E) interrelationships anddisharmony, for instance, a local community approach implies defining local-level,relatively small-scale areas of investigation in which P-E processes operate andwhere disharmony problems originate. It also requires adopting methods ofinvestigation, analysis and reporting to suit the local-level/local-area circumstancesand scale of the study. In particular, it requires adopting methods of study that willenhance the aggregation of similar, comparable local-level studies from wider areasand situations, even up to the global level.
Indeed, in various respects, local communities do exist and can be defined, both interms of human populations and of environmental processes or ecological units. Theyare definable functional space units within which various ecosystem processesoperate, including P-E interrelationships.
Another pertinent question at this stage is why local community approach? It helps inelucidating, actually, how P-E processes operate at the levels that are really primary inthe interplay of the various factors/elements, and the functioning of the processes. Itenables the collecting of information/data at the local level and, thence, aggregatingthem to the wider regional, national and global-levels, rather than the other way round.In this way the approach helps to avoid generalizations and guesses which often blurthe true situations regarding, say, the interrelationships between the different specificelements and factors of both the population and the environment
The literature regarding P-E interrelationships and consequences in many developingcountries, in particular, is full of often wild guesses and sweeping generalizationsespecially based on the single population factor of high/rapid growth rates. This hasraised the need to study P-E interrelationships at the various levels and circumstancesin which they operate in Africa (and the developing countries) starting from the grass-roots (the family, household, and local community habitat).
273
It also helps to ensure that many crucial factors are considered, such as individual,family, household or community decision-making processes; local community groupdynamics and pressures; poverty and high levels of illiteracy; information relationships;risk perception and assessment processes; levels of expectation andresponses/actions towards challenges (stimuli); gender differences in knowledge and •awareness, in access to and rights on resources and inputs, or in power relations andempowerment; among others. The effect of time and thus the trend in P-E relationshipprocesses over time are also clearly revealed.
An appropriate mix of methodology for a local community approach requires acombination of scientific/probabilistic methods, rapid assessment methods and #anthropological methods (especially of participant observation). And conducted withmulti-disciplinary teams and input the approach helps to fill the noticeable gaps in ourknowledge of the different behavioural factors and processes that operate in the P-Erelationships.
When a local community approach is adopted, the local inhabitants of the study area 0are involved by participating in the investigation of the P-E problems. Their perceptionand assessment of the risks to them arising from the P-E disharmony are heightenedwhile their local/indigenous knowledge base is drawn upon in the understanding of theorigin of the problem(s), or in the various decisions and responses that precipitate orprolong the problem(s), or in finding appropriate -and sustainable remedies orpreventive measure for the problem(s). Hence, for effectiveness, the approach needs •also to be research and development (R&D) oriented, including one or more localcommunity self-help or assisted projects component(s).
2. P-E Relationships in Local Communities in Africa/Nigeria(9
2.1. The Model
A historical perspective to the study of P-E processes in some local communities hasrevealed that there is a recognizable pattern in the trend of events. This is generally ashift from a state of primitive balance and harmony between population and the local *environments through time and progressively (and in some cases imperceptibly) tovarying stages of imbalance and disharmony. In some areas this can get up to evencatastrophic dimensions. The picture that emerges is represented in the schemadepicted in Table 1 and Figure 1.
274
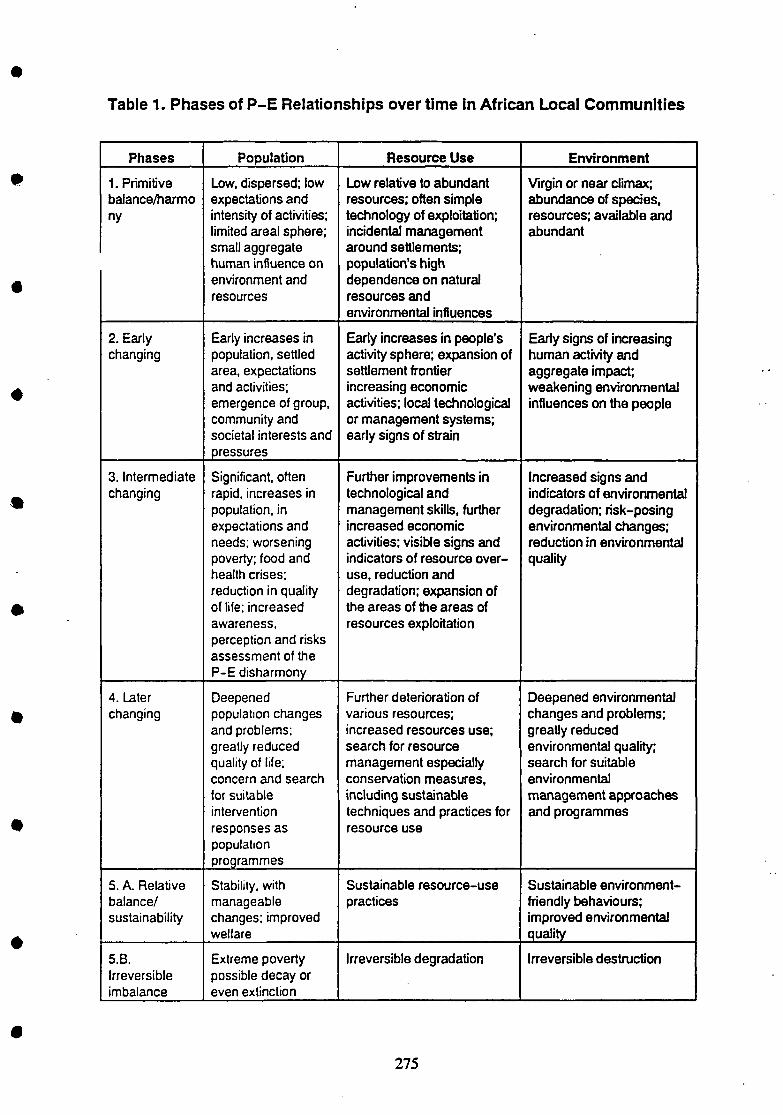
Table 1. Phases of P-E Relationships over time in African Local Communities
Phases
1. Primitivebalance/harmony
2. Earlychanging
3. Intermediatechanging
4. Laterchanging
5. A. Relativebalance/sustainability
5.B.Irreversibleimbalance
Population
Low, dispersed; lowexpectations andintensity of activities;limited areal sphere;small aggregatehuman influence onenvironment andresources
Early increases inpopulation, settledarea, expectationsand activities;emergence of group,community andsocietal interests andpressures
Significant, oftenrapid, increases inpopulation, inexpectations andneeds; worseningpoverty; food andhealth crises:reduction in qualityof life: increasedawareness,perception and risksassessment of theP-E disharmony
Deepenedpopulation changesand problems;greatly reducedquality of life;concern and searchfor suitableinterventionresponses aspopulationprogrammes
Stability, withmanageablechanges; improvedwelfare
Extreme povertypossible decay oreven extinction
Resource Use
Low relative to abundantresources; often simpletechnology of exploitation;incidental managementaround settlements;population's highdependence on naturalresources andenvironmental influences
Early increases in people'sactivity sphere; expansion ofsettlement frontierincreasing economicactivities; local technologicalor management systems;early signs of strain
Further improvements intechnological andmanagement skills, furtherincreased economicactivities; visible signs andindicators of resource over-use, reduction anddegradation; expansion ofthe areas of the areas ofresources exploitation
Further deterioration ofvarious resources;increased resources use;search for resourcemanagement especiallyconservation measures,including sustainabletechniques and practices forresource use
Sustainable resource-usepractices
Irreversible degradation
Environment
Virgin or near climax;abundance of species,resources; available andabundant
Early signs of increasinghuman activity andaggregate impact;weakening environmentalinfluences on the people
Increased signs andindicators of environmentaldegradation; risk-posingenvironmental changes;reduction in environmentalquality
Deepened environmentalchanges and problems;greatly reducedenvironmental quality;search for suitableenvironmentalmanagement approachesand programmes
Sustainable environment-friendly behaviours;improved environmentalquality
Irreversible destruction
275

First phase
Second phase
Third phase
Fourth phase
Fifth Stage A. B.
Initial balance
Precarious balance
Imbalance
Interventions againstdeepened imbalance
Balance,Stability andSustainability
Irreversibleimbalance,degradation anddestruction
Fig. 1. Schema of the phases of P-E relationships in African local communities
276

The major features of the various phases are as follows:
Phase 1 : Primitive balance/harmony phase
This is the initial situation that exists in a newly settled/colonized area, community orregion. In this phase the population size is relatively low, the distribution is dispersed,scanty and generally spotty, while the density is low and rate of increase is also low.People's expectations are relatively simple and low, leading to relatively low intensity ofactivities regarding resources exploitation. The technology is also low if in situ or asefficient or inefficient as those brought in by migrant groups/settlers. The sphere ofactivities (the operational space) is limited as often there is a low level of stimulus toincrease activity levels. Resources management is generally only incidental orunconscious as surpluses are abundant and the limited needs/expectations areeasily/readily met. Environmental influences are usually high, while the aggregate ofthe people's impact on the environment and resources is relatively small, insignificantor non-threatening. Over time, however, the population increases, the needs andexpectations increase or the aggregate intensity of activities on the environment andresources increase, arising either from within or from outside the area, locality orregion, leading to the second phase.
Phase 2: Early changing phase
This phase is marked by continuing, but precarious and falling P-E balance. Itwitnesses early increases in population often through a combination of natural growthand immigration into the area, community or region. This is accompanied by anexpansion in human settlement and activity. Thus, it is marked by expandingsettlement frontier; increasing economic activity sphere; increasing extensification ofactivities over the increasing operational space; and increasing intensity of impact onthe environment and resources following increasing needs and expectations as well asstimuli for increased activities. During this phase, there occurs also a weakening of theenvironmental influences of the population as a result of increasing demands, some insitu local technological improvements or introduction of superior/improved techniquesof resource exploitation from an external area. With time early signs of environmentalweakening and P-E imbalance begin to emerge; but this is often contained (especiallythrough common property regimes of communal ownership) with management andregulation of use of the environment and resources. Considerable group, community orsocietal interests, pressures and influences emerge and influence both collective andindividual behaviours including those affecting the P-E situation. As some of suchsocietal values and influences could be detrimental to the maintenance of P-Ebalance, they and other stimuli lead over time to further deterioration in P-E balanceand thence to disharmony, risks and more acute crises, heralding the next phase.
277

Phase 3: Intermediate changing phase
This phase witnesses considerable P-E imbalance and disharmony, largely as a resultof a combination of many factors. During this period there is usually a significant andoften rapid increase in the population's numbers or needs, expectations and actions(activities). Out of increased needs there occur also improvements in technological andmanagement skills and efficiency. Increasing signs and indicators of environmentaldegradation, resources deterioration and reduction in the quality of life of the peopleemerge or worsen. There occurs also the emergence and deepening or worsening ofpoverty, illiteracy, diseases, and crises of food, nutrition and health. There isdecreasing communal ownership and management of resources, with rising incidenceof single household or family or individual ownership of resources. Considerabledifferentiated gender roles and responsibilities arise, while there are still persisting butweakening group, community or societal pressures and influences. During this phase,very noticeable risk-posing environmental changes occur as well as populationchanges, deteriorating over time, and increasing awareness, perception andassessment of the risks from the heightened P-E imbalance and disharmony. Suchawareness and the concern over the risks and challenges mark the onset of the nextstage.
Phase 4: Later changing phase
This phase is marked by the search for balance and sustainability, arising fromdeepened, desperate P-E imbalance and disharmony. There develops increasingconcern for the quality and welfare of the population, for environmental quality and forsustainability of development processes, Thus, there are considerable responses tothe threats, challenges, crises and risks that constitute stimuli from the P-E imbalanceand disharmony. Thus too, there are concerted searches for, and efforts towardsappropriate interventions, as in the form of population action programmes, as well asenvironment and resources management, rehabilitation and conservation programmes.This phase therefore witnesses the formulation and implementation of various models,approaches and strategies for effective population and environment actionprogrammes and projects at different spatial levels. These are generally resorting,enhancing and sustaining P-E balance, while achieving sustainable growth anddevelopment now and for the future. Depending on whether the efforts during thisphase succeed and yield the desired effects, including bringing about suitable P-Ebalance friendly behaviours on the part of the people (the community members), a nextphase may be reached.
Phase 5: Relative P-E balance and sustainability phase, or irreversibleimbalance and destruction or decay
This is an expected future phase, during which there is population stability, withmanageable increases, and the people demonstrate sustainable environmental andresource-use behaviours and practices. On its part there will be relatively highenvironmental quality and resources sustainability. Improvements in development andpeople's general welfare will be relatively high and sustainable. This is expected when
278

the various intervention measures during the fourth phase prove successful andsustainable.
However, another path can be envisaged, although not expected, if the interventionmeasures do not achieve the desired objectives, or when there are no interventions. Ifthe communities do not manage their populations adequately, do not achieve suitableenvironment and resource-use related behaviours, or do not evolve responses to P-Erisks, challenges and stimuli, then a phase of irreversible imbalance may be reached.Such a path may lead ultimately to extinction or decay of environment, resources andhuman populations.
2.2. Reality
So far, the P-E studies in various communities and regions of Africa have not revealedany areas falling into the fifth phase. Rather, many African local communities are todayat the second or third phase, while initial efforts are being mobilized to get some on tothe fourth phase. Indeed, many Nigerian local communities, for instance, which aretoday faced with numerous indicators of P-E imbalance and disharmony (Ajaegbu,1992a), and are now at the third phase in this model, still recall their experiences in thefirst phase when, according to them, farm land was surplus, every household hadenough to cultivate, crop yields were high and food was plentiful. In such days, therewere no incidences of disputes and conflicts between members over farm land orsettlement site. As they now report, all those have changed.
In some of the communities, such days of relative P-E balance and harmony lasteduntil the mid-1950s, while in others they extended well into the 1960s, depending onwhen their resource-use circumstances impacted markedly on the local environment.Only a few patches of virgin or almost virgin land still exist presenting characteristics ofinitial P-E balance. Among them are the present-day settlement frontiers, includingthe rather remote coastal/mangrove forest zone in Nigeria. Such areas exist today atwell over 100km away from the nearest urban centre (e.g. from Benin City), or fromany significant concentration of rural settlements. They are generally inaccessible withvery sparse and spotty cultivated patches and, occasionally, also farm huts, at theirperipheries. The southern, coastal parts of the Oredo West LGA in Nigeria's Edo. Stateis an example of such areas.
3. Some Observations
Some communities in Africa are found in relatively very vulnerable ecological areas,with resource bases that soon prove inadequate, unreliable or non-renewable in theface of even moderate increases in resource use and general intensity of humanactivities. The various communities in the Sudan Sahel or other savannas and in thedeserts fall largely within this category. And, as discussed elsewhere (Ajaegbu,.1992b), other highly susceptible ecological units and P-E crisis areas in the continentinclude the following fragile environments:
a. The desert, Sahelian, Sudano-sahelian zone
b. The forest zone
279

c. The savanna (guinea, highland/plateau) zone
d. The large urban areas
e. The densely peopled rural areas and settlements.
These are generally areas, ecological zones or units, in which substantial or, even overtime, marginal increases in the intensity of resource use, over-use or misuse haveresulted in considerable P-E imbalance and disharmony. At the third phase, inparticular, they are often characterized by factors such as low rainfall, high evaporationor drought, erosion, sand drift, gullying, soil impoverishment, reduced crop productivity,crop failures, pests and diseases, and considerable poverty. Thus, the role of thevarying ecological zones and local community environmental and resourcecharacteristics, as well as varying intensity of resource-use activities, whether by thelocal community population and/or by users from outside the community, seem to bethe two major factors involved in the P-E balance or imbalance ¡n many Africancommunities.
Similarly, there are high-risk population groups in Africa regarding population change,environmental change, resource deterioration and various other indicators of P-Ecrisis. Also (as summarised in Ajaegbu, 1992b), they include the following:
a. The nomadic people (and their animals) in the arid and semi-arid areas.
b. The sedentary cultivators in the savannas.
c. The urban poor households, males and females, the low income and theinformal-sector marginal operators.
d. The land/forest-based small-scale peasant cultivators of the forest zones.
e. The growing number of illiterate, unskilled environmental refugees displaced anddispossessed, destitutes and beggars or, at best, menial workers; also includedin this group today are the large numbers of refugees arising from politicalinstability, crises and wars in several parts of Africa.
f. The women and children, especially in the rural areas, who depend on the localenvironments.
g. The non-landowning, land-renting or hiring cultivators, male or female, migrant,settler or indigenous cultivators in both the savanna and forest areas.
Indeed, many people in the large, expanding urban areas or in the various denselysettled environmentally disturbed or fragile rural areas in Africa are today at riskregarding the processes and adverse consequences of P-E disharmony and crises.
In several African communities, studies show clearly, on the one hand, the effects ofthe intensity of the people's activities and resource use on the environment, and, onthe other hand, the varying and continuing effects of the different environments andresource characteristics on the people's social, economic and political life. Alsorevealed are several local community or group influences, values and pressures whichinfluence or even determine the types and nature of information on population orenvironment or even on various levels and ranges of P-E problems which individuals,women, children, adolescents or even some male or female adults get or are allowedto receive. Such beliefs, biases or norms also in many localities, influence or colourmany people's perception of P-E issues, their assessment of the risks involved, their
280

cause-effect constructs on such problems and their responses (actions or inaction) tothe P-E changes and problems.
At the local community level in African the role of women in P-E relationships is strongand crucial. Yet, gender differentiation in resource ownership, control and use rightstends to be strong and the balance tilted against the female (Ajaegbu, 1992c; Jackson,1992; Kanogo, 1992). This appears to affect considerably the efforts made duringphases 3 and 4 towards attaining stability, harmony and sustainability. As is still thecase in many rural communities, lack of access for the women to several resourcesand/or sources of information, decision-making or opinion-forming sources, as well aslack of inheritance rights have denied the women the power and the zeal to make theirown decisions for themselves and take independent actions about population stability,environmental harmony or sustainability of the development processes (see also ADB,1990; Dube, 1992; Joekes, 1989; Morna, 1991).
The adoption of communal common-property management systems is reported tohave helped in maintaining resource use and P-E harmony in many communitiesthroughout phase one and well into phase 2. However, by the third phase the extentand effectiveness of communal ownership and regulation of use of several localresources, including land, have reduced so much that areas hitherto protected andmanaged change to private ownership and often uncontrolled or poorly managed usepractices. In such places, for instance, forests reserved for various communal uses areclaimed or bought by some powerful individuals. Instances have been cited of suchforests covering steep hillslopes or fragile watersheds being cleared and cultivatedleading within very short periods to devastating landslide, soil creep or gully erosion.Indeed, as against the relative harmony achieved generally through communities' useof common-property regimes in managing many local resources, individualizedownership and use rights have led to considerable increases in pressure on many suchresources.
Besides, communal management of local community resources helps to ensure thatmany otherwise disadvantaged members have at least use rights. In somecommunities all adult tax-paying males participate in the use of some types ofresources, while all married or widowed women participate in the use of some othertypes of local resources. Thus, overall, the communal system ensures that, say, thepoor households, the women and young adults, the women-headed households(especially also if such households have adult male offspring), and all peasant farmers,male or female, have access to the use of environmental resources. Everyone soinvolved, therefore, also feels substantial commitment to the sustainable use of suchresources.
With individualized ownership and use right, the poor groups lose access to many ofthe resources, get even poorer and more desperate and lose the sense of commitmentto improving, managing and sustaining such resources. Moreover, many of therelatively rich members of the communities who acquire and own several suchresources often no longer see their fate and survival tied to the fate of the localcommunity. And, in that case, they may even be absentee owners, or pay little or noattention to managing and improving such resources, which ultimately deteriorate.
Studies have also shown that the role of poverty and relatively high rate of illiteracy iseverywhere considerable in influencing the P-E relationships and the persistence or
281

deterioration of disharmony and crises. This is true of both rural and urbancommunities. Associated with these factors are also relatively low levels of awarenessand perception of P-E issues in wider spatial contexts than the immediate localcommunity or even than at the personal-individual or household habitational area.There is also little appreciation of causes and effects involved in both population'swelfare or environmental quality. Thus, for instance, explanations for the origin of someenvironmental degradation, resource crisis or declining population's welfare orenvironmental quality often tend to be false. Thus, too, the levels of such people'sassessment of the risks arising or likely to arise from their P-E decisions, actions orinactions, are in many cases low.
Poor households, women, informal-sector workers or small-holder farmers, amongothers, are still numerically dominant in many of the communities. The activities ofsuch large numbers regarding either population increases and behaviours orenvironment/resource exploitation, management and conservation practices proveprominent in the P-E imbalance and crises in many communities. In such localitiesand in respect of such people, the local techniques and management systemspractised are often unable to achieve sustainability. Moreover, such people are oftenforced or easily manipulated by a few influential and better-off members of theircommunities to lose their ownership of resources and thence become, say, landless.Or they are often fed with propaganda information or views that colour their awareness,decisions and actions. Such people easily resign to fate, feeling helpless, or resistsome P-E improvement measures or new ideas which are objected to by the powerful(religious, social, economic) few.
Migration has proved an important mechanism regarding P-E conditions andprocesses in many parts of Africa. This is true of the various rural-rural movements,rural-urban migrations, waves of migrant labourers/workers or cultivators and the nowfrequent movement of environmental or war refugees. Migration has impacted on theP-E situation in various study communities in three main ways. First, it has led to theeasing-off of the pressures in some resource-deficit and P-E crisis areas. Second, ithas helped in providing the needed manpower to exploit available resources inresource-surplus areas. Third, it has over time, and following increasing migrationwaves and numbers, led to or precipitated P-E disharmony and crisis in some areas(see Adepoju. 1976; 1982; Ajaegbu, 1976; Udo, 1976). Thus, communities todayrecord various levels of net-migration depending on and relating to their P-E situation.
It appears that the conditions (factors) and processes which lead to or enhance P-Edisharmony are widely transported or transferred from place to place through theincreasing, unending migration waves in the continent.
Too many African communities there still have religious and cultural constraints to thesearch for suitable approaches and strategies for tackling some of the existing P-Ecrises issues. For instance, some religious ideas/beliefs or cultural norms/expectationsof and pressures on the people (particularly on the women, their rights and roles, etc.)account for the resistance shown to adopting some population intervention orenvironmental management measures in some communities.
It is necessary to state that in any one community many of these and other factorsidentified work in conjunction with others, rather than in isolation, to lead to or during
282

any phase of the P-E imbalance and disharmony. Some factors may, of course, exertmore effect than others.
However, in some of the local communities, members have organized both social anddevelopment associations which have proved to be a useful framework for joint effortand enhancement to their members. Such organizations have been initiated by theadult males, the adult females, the adolescents and other age grades in thepopulations, in rural areas as well as in urban centres. They enable the members todiscuss their various P-E problems and development issues collectively and to poolresources towards tackling such problems. Many of them are known to have embarkedon or supported various P-E improvement projects in their communities. Indeed manyof the local community projects which often herald or mark phase 4 are invariablyinitiated or strongly supported by such associations.
Cases abound in many parts of Africa of local community development, religious orsocial associations initiating, supporting or executing projects on, say, agricultural foodproduction, soil improvement, rural water supply and management, or on afforestation.Others exist regarding the provision or refurbishing of various services or infrastructuresuch as for health, education, road access or information, education andcommunication, as through mass television-viewing centres. In some communities,such associations have also started financing literacy classes for adult females andmales, skills acquisition training for women, or short courses for in-school or out-of-school adolescents and teenagers (male and/or female) during holiday periods onpopulation, family-life and environmental awareness.
Rapid appraisal of the indigenous knowledge of the members of various studycommunities regarding their P-E processes, behaviours, crises and solutions hasrevealed the extent of what people know or do not know and how much they practise.It shows, for instance, different levels of awareness, appreciation of causes and effectsor assessment of risks to them and to others directly and/or indirectly, at various levelsfrom the local to the global. Furthermore, it reveals the various sources of informationand their decision-making processes, such as regarding their assessment of risks orchoice of solutions to different P-E problems. Thus is revealed the various channels ofinformation and basis for responses to the P-E crisis situations, which help to explainthe sustainability or non-sustainability effects of the diverse responses thecommunities have so far made. In this way it also indicates the basis for determining ormodelling appro-priate approaches to and programmes for tackling the numerous P-Edisharmony problems in Africa today.
4. Conclusion
The foregoing demonstrates that P-E relationships are very complex and multifactorialin African communities. Understanding them, therefore, requires detailed, painstakinginvestigation of the numerous factors, linkages and processes operating in suchcommunities. Hence a local-community approach provides the opportunity forunravelling the intricacies involved. It also holds out immense prospects for designingpractical solutions to the P-E related problems.
283

The phases model enables us to classify the local communities, ecological units orpopulation groups according to their dominant characteristics and indicators of P-Esituation, harmony or disharmony; development and welfare status; or according totheir P-E related crises and intervention efforts. This is because the communities, ruralor urban, are not homogeneous in their P-E experiences, factors or phase of theprocess, the imbalance or the intensity of the crises. Indeed, some communitiesexperience more P-E imbalance and disharmony than others.
References
Adepoju, A. ed. 1976. International Migration in Nigeria. University of Ife, Institute ofPopulation & Manpower Studies (now Dept. of Demography & Social Stuies)lie—Ife, Nigeria.
Adepoju, A. 1982. Rural Migration and Development in Nigeria. University of Ife, Dept.of Demography & Social Studies lie—Ife, Nigeria (revised 1986).
African Development Bank (ADB). 1990. Policy Paper on Women in Development,Abidjan, Ivory Coast.
Ajaegbu, H.I. 1976. Migrants and the rural economy in Nigeria In: A. Adepoju, ed.Internal Migration in Nigeria. Univ. of Ife, Inst. of Pop. and Manpower Studies (nowDept. of Demography & Social Studies) lie—Ife, Nigeria, 119-139.
Ajaegbu, H.I. 1992a. Population and environment interrelationships on the Jos Plateau,Nigeria. In: B. Zaba and J. Clarke, eds. Environment and Population Change,IUSSP Editions, 349-36.
Ajaegbu, H.I. 1992b. Population and environment interrelationships in Africa: A review.In: Population and the Environment in Africa, Union For African Population Studies(UAPS) Conference Proceedings, Dakar, Senegal, 1-25.
Ajaegbu, H.I 1992c. Women, natural resources and the environment. Paper presentedat the seminar on Women and Demographic Change in sub-Saharan Africa,organized by the IUSSP committee on Gender and Population, Dakar, Senegal, 3-6 March.
Dube. P.O. 1992. Women and environmental management in Botswana. In: Populationand Environment in Africa, UAPS Conference Proceedings, Dakar, Senegal, 462-475.
Jackson, C. 1992. Questioning synergism: win-win with women in population andenvironment policies. In B. Zaba and J. Clarke, eds. Environment and populationChange, IUSSP Editions, 439-458.
Joekes, S. 1989. Women's programmes and the environment. POPULI (Journal of theUN Pop. Fund). 16(3): 4-12.
Kanogo, T. 1992. Women and environment in history. In: S.A. Khasiani, ed.Groundwork: African Women as Environmental Managers. African Centre forTechnical Studies, Nairobi, Kenya, 7-17.
Morna, C. L. et al. 1991. Women seek control of the land they farm. African Farmer(Journal published by the Hunger project) 6:29-33.
284

Udo, R.K. 1976. Migration and the rural economy of South Western Nigeria. In: A.Adepoju, ed. Internal Migration in Nigeria, Univ. of Ife, Institute of Population &Manpower Studies (now Dept. of Demography & Social Studies), He—Ife, Nigeria,140-147.
285


PART
MORTALITY AND HEALTH IN URBAN AND INDUSTRALIZEDENVIRONMENTS


CHAPTER 15
MORTALITY AND THE ENVIRONMENT:OBSERVATIONS ON THE GEOGRAPHY OF MORTALITY
Daniel Noin(Université de Paris 1, Paris, France)
More than other researchers in the social sciences, geographers are accustomed toenvironmental approaches and are aware of environmental issues. Among populationgeographers, however, few have studied the relationship between population and theenvironment. Since the early seventies, population geographers have drawn nearer todemographers and have tended to study the spatial variations of demographicphenomena. This position is quite clear in recent books of population geography or inatlases devoted to the population. It is equally clear in studies undertaken by theCommission on Population Geography which operates within the InternationalGeographical Union; over the last ten years, this Commission has tended towardsdemographic themes.
The relationship between population and the environment has not however beenentirely put aside. The study of this relationship was approached during certainmeetings of the Commission, notably during the symposium held in Lille, France, in1990, which was dedicated to the geographical inequalities of mortality. Thissymposium attracted 130 researchers from many countries and gave rise to 80 paperswhich were published in three separate documents between 1990 and 1993 ("Lesinégalités géographiques...", 1990-1; "L'inégalité devant la mort...", 1991;"Geographical Inequalities...", 1993). In creating new topics moreover, the symposiumstimulated research in the geography of mortality during the following years. A certainnumber of studies which looked entirely or partially at the relationship betweenmortality and the environment during and after the meeting are referred to in this paperin order to assess and review the subject so far.
1. Methodological Problems
The study of the relationship between mortality and the environment is not easywhatever the type of mortality considered.
1) In the case of natural disasters, the link to the environment is perfectly clear, butthe total number of human losses is often uncertain. This is the case for variousbrutal phenomena such as earthquakes, volcanic eruptions, hurricanes, floods,avalanches and landslides.
A count of the total number of victims is not too difficult when a small-scale ormedium-scale disaster is considered and when the number of people dead or
289

missing can be counted in units, tens or even in hundreds. In the case of a large-scale disaster which causes the loss of thousands of people, tens of thousandsor sometimes hundreds of thousands, this operation is very uncertain as mostbodies are not found. Moreover, these terrible disasters normally strike thedeveloping countries of the world where population statistics are poor and wherethe administrative framework Is weak. For instance in Bangladesh, when anappalling cyclone and a huge tidal wave inundated part of the delta in 1970, theofficial figure was 242,000 victims whereas, in later weeks, experts estimated thetotal between 300.000 and 400,000 (Paucton, 1992).
2) The relationship between mortality and the physical environment Is less clear inthe case of certain exceptional climatic phenomena which are less brutal.
So the statistics for heat waves and cold spells, which can sometimes provokenot insignificant loss of life, are lacking in most countries. This is also the case forlong droughts which continue to provoke large-scale disasters in developingcountries. The cost in human lives may be considerable; in the great famine ofChina in 1877-8, which was due to an exceptional drought, 9 to 13 million peopleare thought to have died (Curson, in Clarke, 1989). In Ethiopia, drought-linkedfamines are believed to have caused the death of 2 to 5 million people during thesixties and seventies (Mesfin, 1984). It must be emphasized however that theseestimations are highly uncertain, and that it is impossible to distinguish in thesedisasters between the results of the drought itself and the results brought aboutby other factors. The causes of these disasters are very complex and not onlyphysical.
3) In the case of "ordinary" mortality, i.e. disasters being excluded, the link with theenvironment is always difficult to ascertain, even where statistical data onmortality is precise and where information exists on the environment.
Most causes of death are in fact linked not to one sole factor, but to a group offactors, and it is difficult to distinguish between one environmental factor andanother. To form correct hypotheses, mortality must be analyzed by sex, age andcause of death. But the more the subject is analyzed, the more it is difficult toundertake a detailed geographical analysis as the number of deaths becomes fewfor one particular cause of death in one particular small area. Even when thestatistics for three or five, or even seven years, are taken into account (the yearof census and those surrounding it), the risk of random results cannot beexcluded (Noin, in "Les inégalités géographiques...", 1990-1).
Moreover, mortality statistics by place of residence are complicated by the factthat the cause of death may be due to an aggressive environment which is faraway from home, or linked to a former place of residence. In the case of cancerparticularly, there may be a big difference in time between the exposure to a riskfactor, and the death.
2. Natural Disasters and Mortality
The human cost of natural disasters will be examined first, as in spite of the uncertaintyof statistical data, this is the best known point. Quite a lot of publications exist on thesubject, in which several geographers have attempted an assessment (Foucher, 1982;
290

Thomson, 1982; Clarke, 1989; Noin, 1994). In 1991, research studies wereencouraged by the International Geographical Union (I.G.U.) and by the Commissionon Population Geography (Paucton, 1992). These were based on data fromreinsurance companies, in particular the Compagnie Suisse de Réassurances, Zürich,and the Münchener Rückversicherungs Gesellschaft, Munich ; they are as exhaustiveas possible for the period 1970-90. In this research, it is considered that a climaticaccident or an earth tremor becomes a disaster when the number of victims is 20 orabove. Only violent phenomena relating to the physical environment are considered.Heat waves, cold spells and periods of exceptional drought are excluded for thereasons stated above. A brief review of this research follows.
During the period 1970-90, disasters of telluric origin resulted in a total of almost onemillion victims: 943,000 for seismic phenomena (earthquakes and tsunamis) and24,000 for volcanic eruptions; 91 earthquakes and 7 eruptions were recorded asdisasters given the definition adopted above. These two groups of phenomena areconnected since they are both linked to the movement of tectonic plates of the earth'scrust; they nearly always occur at the limits of these plates. However, the geographicaldistribution of victims is different. The most fatal earthquakes occur principally in Asiawhere plate movements are most evident and where the population is very dense(Fig. 1). Destructive volcanic eruptions primarily affect the Americas, especially theAmerican isthmus, the West Indies and the Andes (Fig. 2).
Still considering the same period 1970-90, disasters of atmospheric origin gave rise toover 650,000 victims: 604,000 due to hurricanes, cyclones, storms, tornadoes andother violent atmospheric phenomena, and 54,000 to floods. The distinction betweenthese two types of disasters is very uncertain as many more people die by drowningduring hurricanes than because of violent winds. There were 564 disasters ofatmospheric origin within the period 1970-90, 365 considered as hurricanes orcyclones and 199 as floods. South and South-East Asia were undeniably the worst hitareas, being a zone of high hurricane risk due to a strong contrast of air massesseveral times each year (Figs. 3 and 4). Besides hurricanes and floods, landslideswhich are often caused by torrential rain took 6,500 lives in 1970-90, and avalanchescaused by abundant snowfall took over 1,000 (Figs. 5 and 6).
In total over this period, 740 disasters of all kinds caused over 1.6 million victims. Thenumber of disasters and particularly the number of victims has increased from the firstdecade to the second. This increase may be partly due to better recording but, moreimportantly, it seems linked to population growth. Asia is by far the worst hit area of theplanet, counting 84 per cent of the deaths. Countries with the highest number ofvictims are all Asiatic: China, Bangladesh, India and Iran rank highest in the table; thencomes Japan far behind.
Mortality linked to disasters affects particularly the poor countries : during the years1970-90, 92 per cent of the victims were recorded in the developing countries whichrepresented 74 per cent of the world population. This high proportion can be explainedby a set of reasons: high densities in the worst affected Asiatic countries, highproportion of urban population in these same countries, and development of thehabitation of the poor in dangerous areas which are not suitable for building (floodplains in particular, steep slopes and ravines). Developed countries are also affectedby natural disasters (Japan, California, South-Eastem States of the U.S.A.), but thereare fewer and fewer victims due to various safety measures such as anti-seismic
291

norms for construction, dams against overflows, hurricane warnings, surveillance ofdangerous volcanoes and evacuation procedures in case of danger.
Though these results are of great interest, it must emphasized that a period of 21 yearsis a little short for an in-depth study of the phenomena, given its extreme annualvariability. It is possible to go further back in time, though the data become lessnumerous and reliable the further back you go. An evaluation for a longer period, from1900 to 1990 was attempted (Paucton, 1992) giving a total of 7 million victims due tonatural disasters. The geographical distribution was very similar for the various types ofphenomena (Fig. 7). The proportions concerning Asia and the poor countries as awhole were very similar for the years 1900-90 compared to the period 1970-90. Theonly difference was the proportion of victims due to the various types of disasters.There was a greater proportion of victims due to disasters of atmospheric origin, asChina was severely affected by terrible floods on several occasions with very high lossof life (4 million victims in total during those years).
3. The Environment and Ordinary Mortality
The role of the environment on ordinary mortality, i.e. not caused by disasters, is lessobvious and is often very difficult to determine.
The studies presented at or consequent to the Symposium of Lille were contradictoryon this point. In fact, the importance given to the environment was very different amongthe researchers having undertaken studies on the subject.
1) Certain authors consider that the environment in some cases holds someresponsibility in mortality. Among these authors, it is not surprising to find severalgeographers from Eastern Europe where the degradation of the environment incertain regions was truly catastrophic during the seventies and eighties. SeveralPolish authors emphasized this deterioration and its consequences for Poland asa whole (Pulaska-Turyna, 1991; Potrykowska, 1991) or for a particular region(Miszewska, 1990 on lower Silesia). According to Pulaska, the pollution of the air,the rivers and the soils is well over the limits considered as dangerous. The mostaffected areas are the South and the West : on the one hand, mining andindustrial towns and, on the other hand, rural areas of large state farms usingmassive quantities of chemical products. This author attributes the high cancermortality of the Western regions to pollution, as well as the increase in male adultmortality and male excess mortality since the sixties. Potrykowska arrives atroughly the same conclusion using elaborate statistical methods. She observesthat seven to nine-tenths of deaths due to tumours are statistically associated toenvironmental factors in Poland. She links cancer mortality with the pollutionobserved in industrial towns and in the countryside. More important than the roleof fertilizers and pesticides, she blames the water distribution network which isinsufficiently purified and which contains harmful chemical and metallic elements.She maintains that the link between ecologically degraded areas and zones ofhigh cancer mortality is undeniable.
None of the West European authors is as certain. In the west of the continent,some deaths are indeed linked to the environment but in a limited measure or forvery specific causes. This is so, for instance, in the Nord-Pas-de-Calais region
292

in France (Lacoste et al., 1990:91). At the beginning of the eighties, a clearexcess mortality was still observed in the mining area due to respiratory diseasesand especially silicosis (or pneumoconiosis) as the extracted coal was particularlyrich in silica dust which was harmful to mine workers' lungs (Fig. 8). It mustnevertheless be noted that this is mainly a phenomenon of the past, since miningactivity practically ceased in the eighties and the last pit closed in 1990. Otheractivities derived from coal also stopped and the pollution level was considerablyreduced. There is a time-lag effect however, as the disease continues to developin the affected men who now represent essentially the older generation.
2) Most of the authors who worked on the geography of mortality for the Lillesymposium or in its wake consider that the environment is a minor or insignificantfactor in mortality. For them, the important factors are economic, social orcultural. In the more developed countries, geographical variations of mortality arenot linked to ecological factors, but to the level of education, to the use of healthfacilities, to the diet adopted and to certain harmful habits such as cigarettesmoking and alcohol drinking. In fact, mortality maps of Europe show norelationship to industrial areas (Decroly and Vanlaer 1991). It is a similar picturefor detailed studies carried out in various European countries (Cohen, 1991 forSpain; Decroly and Grimmeau, 1991 for Belgium; Kemper and Thieme, 1991 forGermany; Kunst et al., 1991 for the Netherlands; Meneghel, 1991 for Italy;Tonnelier, 1991 for France). Moreover, some studies undertaken in EasternEurope do not show up this relationship either, for instance for formerCzechoslovakia (Rychtariková and Dzurova, 1991).
If instead of looking at total mortality, analysis is directed towards one specificcause of death or another, it is not environmental factors which emerge, butnational and regional behaviour patterns (Lange, 1991). For lung cancer, it isparticularly the relationship with the smoking habits of the population over manypreceding years, perhaps twenty years or so, which is the main causal factor(Fig. 9). For cancer of the aesophagus, it is especially the consumption of alcoholover many preceding years (Fig. 10). The differences between the sexes clearlyemphasize the essential role of behaviour patterns. For the consumption ofcigarettes, the worst affected areas are appreciably different for men and forwomen. For the consumption of alcoholic drinks, they are very different.
4. Conclusions
These few observations on the geography of mortality are not exhaustive of a subjectwhich is vast and complex. Many questions are left without answers. More research isnecessary on various countries, using detailed geographical analysis andinvestigations in the aetiology of diseases causing death. Nevertheless, someprovisional conclusions can be put forward.
1) For the exceptional mortality caused by disasters, the physical environment isclearly at fault, although it is far from being the only factor involved. The appallingnumber of victims which is occasionally experienced in poor countries is largelydue to the installation of numerous populations in risk zones and to the absenceor quasi-absence of protective measures. Some ripostes are possible. In the
293

United States for example, mortality due to hurricanes is constantly diminishing(about 700 people killed in the twenties, 50 in the eighties). However an efficientresponse in the developing countries will require a great deal of time and money.
The impressive estimations established also require relative comparison. For theperiod 1970-90, victims due to natural disasters amounted to roughly 0.16 percent of the total number of estimated deaths, that is to say a minute fraction ofthe whole. Even in the worst affected countries, this exceptional mortalityrepresented a very small share of the total mortality: 1.6 per cent in Bangladesh(ten times the world average), 0.5 per cent in China (three times the worldaverage).
2) When ordinary mortality is considered, here again the role of the environmentappears to be very small on the whole. In West European countries, theenvironment is probably at the origin of deaths caused by exposure to aggressiveelements, but globally its part in mortality is negligible. In East Europeancountries, the alarming degradation of the environment which is sometimesobserved could no doubt explain a stronger influence, especially for deaths due tocancer and respiratory diseases. This link nevertheless requires confirmationthrough detailed studies in demography, geography and epidemiology. In thesecountries, the considerable influence of the living conditions, health facilities,dietary habits, cigarette addiction and alcoholism do not seem to have been takensufficiently into account.
Until complementary research brings more clarification, it would seem wise in generalnot to overestimate the role of the environment on mortality.
References
Clarke, J. etal. 1989. Population and Disaster, Oxford: Blackwell.
Cohen, A. 1991. La dynamique géographique de la mortalité en Espagne, Espace,Populations, Sociétés, 1:135-141.
Decroly, J.M. & J.P. Grimmeau 1991. Variations intercommunales de la mortalité parâge en Belgique, Espace, Populations, Sociétés, 1:75-83.
Decroly, J.M. & J. Vanlaer 1991. Atlas de la population européenne, Bruxelles: éd. del'Univ., 172p.
Foucher, M. 1982. Esquisse d'une géographie humaine des risques naturels, ParisHérodote, 40-67.
Geographical inequalities of Mortality in Developing Countries. 1993. Soc. Science andMedicine, 36(10) 1237-1382.
Kemper, F.J. & G. Thieme. 1991. Regional disparities of mortality in the FederalRepublic of Germany, Esp. Popul. Soc., 1:93-100.
Kunst A.E. et ai. 1991. Are regional mortality patterns in the Netherlands culturallydetermined?, Esp. Popul. Soc., 1:85-91.
Lange, 1.1992. Y-a-t-il une géographie des cancers? Multigr., Univ. de Paris 1,1 vol.
294

Les Inégalités Géographiques de la Mortalité. The Geographical Inequalities ofMortality. (1990-1), Esp. Popul. Soc, 1990, 3:353-576 - 1991, 1:1-243.
L'Inégalité devant la mort dans le Nord - Pas-de-Calais. 1991. Trav. et Doc. duL.G.H., USTL, Villeneuve d'Ascq, 7, 92p.
Lacoste, O. et al. 1990. Mortalités et géographie de la santé dans le Nord et le Pas-de-Calais, Hommes et Terres du Nord (Lille), 2:117-26.
Meneghel, G. 1991. La mortalité en Italie selon des facteurs socio-économiques, Esp.Popul. Soc, 1:173-80.
Mesfin, V.M. 1984. Rural Vulnerability to Famine in Ethiopia. 1958-1977, New Delhi:Vikas.
Miszewska, B. 1990. La surmortalité masculine en Basse-Silésie, Esp. Popul. Soc, 3,501-07.
Noin, D. 1990. L'étude géographique de la mortalité: bilan et problèmes, Esp. Popul.Soc, 3:367-76.
Noin, D. 1994. Mortality and natural disasters in the world. In Zaba B. & Clarke J.1994, Environment and Population change, Derouaux Ordina Ed. (Liège), 363-76.
Paucton I. 1992. Mortalité et catastrophes naturelles dans le monde depuis 1900,multigr., Univ. de Paris 1, 2 vol.
Potrykowska A. 1991. Les tendances actuelles et la répartition spatiale de la mortalitéen Pologne, Esp. Popul. Soc, 1:201-13.
Pulaska-Turyna B. 1991. Les inégalités géographiques de la mortalité selon la causede décès en Pologne, Esp. Popul. Soc, 1:191-200.
Rychtarfkovâ J. and D. Dzurovâ. 1991. Les disparités géographiques de la mortalité enTchécoslovaquie, Esp. Popul. Soc, 1:183-90.
Thomson S.A. 1982. Trends and Developments in Global Natural Disasters 1947 to1981. Natural Hazard Research Working Paper 45, University of Colorado,Boulder.
Tonnelier, F. 1991. Evolution des inégalités géographiques de la mortalité en Francedepuis 1911, Esp. Popul. Soc, 1:29-36.
World map of natural hazards. 1978. Munich: Münchener Rückversicherungs-Gesellschaft, 49 p. + map.
295

296


298

299

300


302

Fig. 8.
Nord-Pas-de-Calais region, Francemortality due to respiratory diseases (except cancers)s.m.r., male population, 1979-1986
s.m.r. significant
J *^/ \
t=±I fe. L_ ^ ^ ^ j T 7 'M, \
Nord-Pas-de-Calais region, Francemortality due to silicosiss.m.r., male population, 1979-1986
s.m.r. significant
H B s.m.r. > 1
s.m.r. < 1
s.m.r. non significant
^ ^ ^ T±5—v^..
from Lacoste O., 1990v-5
303

0)
0)o
C—
E
CD
lity
C0•eo£
TJ
izei
• o
es,
"coocB(DQ.
gLU"cô
>CD
C
enCD
Î2co
Oi
V
00
ON
c"o
Oua(3EuM
ooroCNX
ir-t_ j
C
i
ONON
cl,
cI-J
e
304

o
so
305


CHAPTER 16
THE EFFECTS OF THE ENVIRONMENTAL POLLUTION FORPOPULATION IN POLAND
Alina Potrykowska(Institute of Geography and Spatial Organisation, Polish Academy of Sciences,
Warsaw, Poland)
1. Introduction
Poland, a country confronted with ecological disaster, faces the very difficult task ofreshaping its environmental policy during a time of radical change in the nationaleconomic system. This new policy moves from what was once a narrow understandingof environmental protection to a broader goal of sustainable development, i.e. theattainment of a balance between social, economic, technical and environmentalconditions in the process of development. This kind of understanding for the idea ofsustainable development should be beneficial to addressing society's social andeconomic needs.
"The policy of sustainable development will be implemented through theenforcement of environmental requirements in every public and economic activitythroughout the country, as well as through an appropriate policy towardsneighbouring states. The consciousness of each citizen's sense of individualresponsibility regarding environmental protection in all aspects of life, at home,work or play, must be raised. Under the changing conditions of the economic andpolitical system it is necessary to incorporate the principles of sustainabledevelopment into the newly developed legal and economic framework as well asinto the new management system. The process of economic reconstruction, nowunderway, shall, in addition to social and economic goals, take into accountenvironmental goals. An effective policy of sustainable development shouldembrace all sectors of the economy." (National Environmental Policy of Poland,1991).
These are the directions by which environmental pollution is to be counteracted and apolicy of sustainable development put into practice. Emissions of particulates, gases,sewage, saline waters and wastes are to be limited, as is the degradation of soil. Thisrequires a fundamental reconstruction of the country's economy; particularly in thosesectors which pose a particular threat to the environment, i.e. power supply and theextraction of energy resources. It will also require a rationalization of industry andtransport. These priorities will first embrace the areas now considered to be ecologicaldisaster areas, i.e. those in which standards for air, soil, and water quality areexceeded to a considerable degree hazardous for human health. This means thatcomprehensive environmental policies must be developed, and effective methods forimplementing them must be established as soon as possible. Many Western and
307

Polish organizations as well as scientific institutions and academic bodies are activelyinvolved in this process.
The Institute of Geography and Spatial Organization, Polish Academy of Sciences andother scientific centres have a strong interest in carrying out research on Populationand Environment (P-E) in Poland. The main areas of research activity in the field of P-E studies may be summarized in six groups of issues as follows:
1) Methodological research;
2) Population and Environmental data issues1;
3) Population concentration and déconcentration2;
4) Identification and analysis of P-E crisis areas;
5) Population-environment relationships in settlement systems;
6) Comparative P-E studies on the international and national policy3.
2. Methodological Research
Studies on environment transformation in Poland under the influence of humaneconomic activity with special attention paid to areas under urbanization pressure arebeing conducted by A. Breymeyer. The main research topics are: the theory andmethodology of the study on mutual influence of human economy and nature researchon mechanisms controlling ecological units at different levels of organization;establishing, evaluation and verification of methods for studying the man-environmentinteractions, with special attention paid to bioindication, economic and systemsanalysis methods; comparative studies of land ecosystems in different climaticconditions with the application of transect method; research on air pollution influenceon ecosystems; development of methods for evaluation of ecological (production anddestruction of organic matter) and geomorphological (organic matter washout)processes influencing organic matter budget in ecosystems.
Collaboration within the framework of international research programmes includesthose sponsored by the International Council of Scientific Unions (ICSU) such asSCOPE (Breymeyer, 1993).
The programme of studies on Global Environmental Change is going to develop underthe direction of L. Starkel, head of the Department of Geomorphology and Hydrology ofMountains and Uplands (Cracow). This is a grant programme sponsored by theNational Committee for Scientific Research and its main research topics are studies onevolution of land forms and water circulation in mountains and uplands as connectedwith changes of climate and human activity.
308

3. Identification and Analysis of Population-Environment CrisisAreas (the analysis and synthesized map of natural environmentand environmental pollution of Poland)
The idea for the publication of the atlas of Polish natural environment emerged at thebeginning of the 1970s. A leading role in its conception and formation was played by S.Leszczycki, former director of the Institute. The Atlas of Resources, Values andDegradation of Poland's Geographic Environment (1993) is the first of our publicationspresenting an integrated, synthetic approach to the basic problems. It contains awealth of information, both in terms of quality and quantity, about the natural featuresof the environment, its qualities and resources, its state, and the scope and directionsof its change. Particular attention is paid to the issues of nature conservation, tophenomena associated with human activity which puts the natural environment at risk,and to the evolution of the various qualities and uses of the environment. It is a mostcomprehensive spatially-oriented documentation of those phenomena and processeswhich make up the qualities of the Polish natural environment.
The analysis of the state of individual elements of the environment, supplemented withinformation on hazardous environmental pollution made it possible to carry out spatialdifferentiation of the phenomenon, and consequently 27 areas were distinguished inwhich the state of natural environment was recognized as particularly hazardous forecological balance or human health (Fig. 1). These 27 areas of ecological hazard inPoland, feature a total break in the state of natural balance manifested by a loss ofresistance, elimination of the self-regeneration processes, and degeneration of thebiosystems, as well as intensified health hazards and incidence of diseasesconditioned by the state of the environment. These areas are situated in the mainregions of concentration of mining and metallurgy in the South: Upper Silesian District,Cracow Region, and Legnica-Glogow Copper Basin in Lower Silesia (the biggest andmost onerous sources of environment pollution with chiefly wastes, dust, gases andsewage), and in the remaining urban agglomerations (Warsaw, Lodz, Poznan,Wroclaw), especially the two northern seaports of Gdansk and Szczecin (where thehazardous state of the natural environment has international implications because oftheir localization on the Baltic coast).
Within the 27 ecologically endangered areas encompassing altogether 11.2 per cent ofthe country's surface, where more than 10 million people live (i.e. 35.4 per cent ofPoland's population), and where there are especially high levels of toxic elements, soil,air and water pollution, the limits of ecological resistance of the natural environmenthave been violated to such an extent that the health of the inhabitants is threatened.
Sometimes the safety limits for some of these elements are exceeded so drasticallythat it causes mass poisoning as, for example, the lead poisoning of children inSzopienice (The Upper Silesian Industrial District) in the late seventies. It is insufficientto discuss the risk of exposure to toxic elements solely on the basis of reports on theiramounts in air, soil or water because many of them circulate via the alimentary chain.This way the elements travel from soil water to plants and animals, and finally reachhuman organisms exposing them to toxic elements in human tissues. I. Baranowska etal. (1992) have confirmed such concentration of heavy metals in human tissues. Lead,cadmium, zinc, manganese, chromium, cobalt, copper, and molybdenum concentration
309

were measured in 50 samples of placenta tissues from Tychy in the Upper SilesianIndustrial District, where the population is exposed to enormously increased levels ofheavy metals. Mean concentrations of metals in the placenta were determined.Coexistence of increased levels of various metals was checked. The concentration ofheavy metals in the samples coming from the polluted industrial territory is much higherthan in those collected in cleaner regions. In the Upper Silesian Industrial District,where the concentration of heavy metals in the environment is extremely high, this kindof research had not been conducted before.
Figure 1. Hazardous environment pollution in Polanda. Urban agglomerationsb. Areas of ecological hazard:
1-Szczecin, 2-Gdansk, 3 - Poznan, 4--Bydgoszcz-Torun. 5- Inowroclaw, 6- Konin, 7-Wloclawek,8-Plock, 9-Legnica-Glogow, 10-Wroclaw, 11 - Belchaiow, 12-Lodz, 13-Tomaszow Mazowiecki,14-Pulawy, 15-Chelm, 16- Turoszow, 17-Jelenia Gora, 18-Walbrzych, 19-Czestochowa, 20- Kielce,21-Tarnobrzeg, 22-Opole, 23-Rybnik, 24-Katowice, 25- Myszkow -Zawiercie. 26- Cracow, 27- Tamow.Source: Cz.Rolewicz, 1993.
310

4. Population-Environment Relationships in Settlement Systems
The research topics conducted by geographers and demographers are: studies ofimpact of the environmental degradation and the changes in the local rural settlementsystem; migration change; environment and the settlement system in Poland; theurban settlement system: the population in heavily industrialized regions; socialstructure and housing conditions in large cities.
The degradation of the natural environment in heavily industrialized areas and largecities gives rise to justifiable anxiety and encourages concern for significance of thisfactor in the state of health, the rate and causes of mortality, the pathology ofreproduction, and also the migratory behavior of the population. The main researchtask was to discover the particularities of the course of demographic processes intowns with varying degrees of degradation of natural environment.
The study of the demographic consequences of degradation of natural environment inPoland, based on the example of large towns, has included three basic processes:births, deaths and migration (Witkowski, 1993). The study has concerned 29 largePolish towns located within the regions of ecological danger. Research resultsconfirmed that the quality of the natural environment is one of the mortality factors inPoland. This is observed in the highest mortality rates in towns located in the regionsof ecological peril. The impact of the quality of the environment on population mortalityis most powerful among children and young people (Table 1). However, it occurred thathigher mortality covaries with ecological conditions which are not always the worst.Therefore, the ongoing degeneration of the natural environment in Poland is not yetcommonly reflected in mortality rates. Different and disadvantageous mortality patternsonly occurred in strongly degenerated towns. The research has also shown that thequality of the natural environment is not unrelated to reproduction. The endangeredtowns are distinguished by the lowest levels of fertility as well as worse weight-specificstructure of newborns. In spite of the many signs of the negative impact of the naturalenvironment in Poland on the different dimensions of fertility, it is not a factor ofdecisive significance. However, its role increases systematically and it is most powerfulin the most degenerated towns. The impact of the quality of the natural environment onmigrations has so far been relatively weak. Factors which postpone the occurrence ofthis dependence have probably been operating, namely a difficult housing situation andsocio-economic crisis. Only in the towns lying in the regions of ecological disaster wasthere observed a different migratory behavior among the population. However, if thedegeneration of environment proceeds, we can expect the disadvantageous migratorytendencies to spread into other towns.
The concentration of negative demographic consequences in the most desolateregions suggests that only exceeding a certain limit of environmental pollution distinctlymodifies demographic processes.
311

Table 1. Infant mortality rates in ecologically endangered and remaining towns,Poland, 1985-1987.
Towns
endangered remaining
Excess of mortalityin endangered
towns in %
Age at death
0-27 days
28 days and more
Cause of death
endogenous
exogenous
Birthweight in gms.
3001 and more
3000-2501
2500-2001
2000-1501
1500 and less
14.6
4.4
15.1
3.9
12.9
4.1
14.3
2.8
6.0
12.8
45.0
159.3
477.5
5.7
10.5
52.8
167.0
548.3
113.2
107.3
105.6
139.3
105.3
125.9
85.2
95.4
87.1
Source: J.Witkowski, 1993.
Pollution of the natural environment also influences in a degrading manner the overallhealth status of the society. This influence is expressed in the form of the increasingrisk of the appearance of many diseases both in children and in the adult population.There is too slow a decrease in the infant mortality rates, there are more and morechildren with congenital effects and low birth weight, and cases of premature birthswith lower chances of survival are more frequent.
Research conducted by J. Witkowski had also confirmed that the quality of the naturalenvironment is one of the mortality factors in Poland. The general mortality level hasbecome quite bad, for inasmuch as in the middle of the sixties mortality in Poland wasclose to European averages, it has rapidly increased in the middle of the eighties. Theincrease in mortality, observed since the middle of the sixties in Poland, has become apersistent phenomenon (Fig. 2). Activities undertaken aiming at overcoming the maincauses of deaths, i.e. the so-called civilizational diseases (cardiovascular diseases,neoplasms, accidents, poisonings and violence, as well as diseases of the respiratorysystem) has not succeeded in stopping the spread of these diseases.
The territorial differentiation of mortality in Poland is very clear (Fig. 3). Highly pollutedareas with the highest death rates, located in south-western parts (particularly theKatowice voivodship), represent the highest threat of human life. Low mortality levelscharacterize the eastern territories, along the belt stretching from North to South.These voivodships (especially the Bialystok voivodship) which represent the lowest lifeand health hazard are the least economically developed and least polluted rural areas.
312

My study on consequences of the environmental pollution for population in Poland(Potrykowska, 1992a), reports on testing of hypotheses as to the influence ofenvironmental and socio-economic variables on the death rate levels at the regionalscale. The results of a multiple regression analysis have confirmed the hypothesesforwarded. The fact of significance of the explanatory variables in the regressionmodels confirms the negative influence of such factors as strenuous life conditions(overpopulation of apartments, bad sanitary state), hard work conditions, especially inmining and heavy industry, and catastrophic state of environmental pollution on thehealth status of Polish population and on the death rate4.
14 -
12 -
10 -
8 -
6 -
4 -
2 -
Males
— - — Females
Males
Females
Males
— — Females
1950 1960 1970 1980I
1990
Figure 2. Crude death rates, Poland, 1950-1990.1. Poland, 1a- Males, 1b- Females2. Rural areas, 2a- Males, 2b- Females3. Urban places, 3a- Males, 3b-Females
Source: Various Demographic Yearbooks, Warsaw, GUS.
The disadvantageous epidemiological situation related to the spread of mortality doesnot only depend on the functioning of the health care system, but also upon thenegative changes taking place: 1 ) in the natural environment, 2) in the conditions of lifeand work, life style (the diet and hygiene), as well as upon 3) the level of the healthcare and culture of the society, education, and popularization of adequate patterns ofhealth-oriented behaviour, and the development of prophylactic measures; and 4) lifestyle and bad habits especially high rates of consumption of tobacco (first place in theworld) and alcohol. The spread of the smoking habit among young people, includingfemales, is associated with the increase in death rates from cancer and some diseases
313

of the respiratory and digestive tracts. The unprecedented, high consumption ofalcohol, the habits related to it, and the way the alcohol is drunk, are linked withmortality caused by cirrhosis, cardiovascular diseases, some disorders of the nervoussystem, as well as violent causes.
According to the recommendations of the Governmental Demographic Commission theinfluence exerted by the pollution of natural and work environments on the excessivemortality should become the subject of the intensive studies meant for forming thebasis of the prophylactic examinations and health care in Poland (DemographicSituation of Poland, 1991).
Figure 3. (a) Standardized death rates, Poland, 1988(b) Deaths per 100 000 inhabitants.
5. Strategies of International and National Policy. Comparative P-EStudies
The geographic position of Poland leads to transboundary water and air pollution. Thetransboundary pollution needs the international action and environmental policybetween the neighbouring countries. Actually, the emission of the main pollutants,sulphur dioxide and nitric oxides, totals 5.5 million tons a year. On about a half of thecountry's area, the mean annual concentration of SO2 exceeds 20 mg per m3. Apartfrom this, large quantities of SO2 (1.4 million tons annually) are imported fromneighbouring countries through transboundary pollution (from the south: Czecho-slovakia and other southern countries; and from the west: particularly Germany andother West European countries) (see Fig. 4). Polish forests are exposed to a verystrong influence of polluted air. Sulphur dioxide induces acid rain which has caused
314

serious damage to forests in some regions. The dying of forests in the Sudeten andCarpathian Mountains is connected primarily with transboundary air-borne pollutionfrom Czecho-Slovakia. Poland also exports 1.7 million tons of SO2 emissions todownwind neighbours in Scandinavia and the Baltic Republics, and in turn theChernobyl nuclear accident in the Ukraine aggravated human health in north andsouth-eastern Poland.
Poland's water balance is particularly unfavourable. The deficit of water is a veryserious problem, which is aggravated by the high degree of contamination of surfacewaters. Over 60 per cent of the length of Polish rivers carry water that is too polluted tobe used for municipal purposes and 40 per cent is too polluted to be used in industry.The most polluted rivers are the ones that carry the most water, especially the biggestrivers: the Vistula, the Oder, the Warta and the Bug, which are partly polluted by ourneighbours. Polluted waters from Germany, Czecho-Slovakia, Byelorussia andUkraine are reaching our territory by the Neisse, Oder and Bug rivers respectively,while Poland is a source of Baltic contamination, namely by the waters of the Vistulaand Oder Rivers. The protection of water quality is directly connected with theprotection of the Baltic Basin, to which Poland contributes about 20 per cent of thewater. The state of sea water is an especially important problem. Enormous quantitiesof biogenic nitrogen and phosphorous salts reach the Baltic Sea, which initially causeda vigorous development of biological life, and the secondary contamination of thereservoir with residues of decaying organisms. Water contamination caused increasedcosts in the water supply and treatment for the people and industry; decline of fishstock; degradation and contamination of water ecosystems for irrigation in agricultureand horticulture; abandonment of many bathing places and beaches; anddissemination of diseases among animals and people.
Poland is extremely interested in activities to develop a regional strategy forenvironmental protection (Fig. 5). In the last few years has been appeared a new ideafor the creation of a huge area whose main function will be to maintain the richness ofnature and valuable environmental features. This area is called the "Green Lung ofPoland", and is being created in five adjacent voivodships which cover about 15 percent of the area of the country (Fig. 6). Lying behind this idea is a basic assumptionabout the appropriate steering of economic growth in these areas, so that eco-development (sustainable development) can occur. The major resources of theseareas will be the valuable features of the environment, and the source of income for thepeople - agriculture producing organic produce, and eco-tourism. This concept issupported internationally and by non-governmental and scientific organizations. Thenew concept is extended beyond the Polish borders, on the territories of Lithuania,Latvia, Estonia and Byelorussia. Such new co-operation, through the newrelationships struck up with both formerly-communist countries and northern countries.On the Polish side such areas are often in National Parks or reserves, whilst on theother side their protection is less strict. It may also happen the other way round - withareas recognized as particularly valuable in neighbouring countries having no protectedstatus in Poland. Current cross-border co-operation, through the creation of acommon protective strategy and the integration of protected areas, is occurring on theborders with Byelorussia, Ukraine, Czecho-Slovakia and Germany, and concernsabove all the Bialowieza National Park, the Tatra Mountains, the Bieszczady
315

Mountains, the Karkonosze Mountains, the waters of the Baltic and areas along theOder River.
A more active role of local communities on both sides of the borders should be asignificant element to the improvement of the environment in those areas. The stateadministration at the central and regional level, as well as the local self-government,should provide assistance, which should facilitate an accès to all forms of informationon the state of the environment and sources of pollution hazardous for human health.
-S
f
il'Wm
iliH§11
? ,*ff ri
— "~'~I^k7Kotobrzeg ^ ^
^Szczecin
'<• ' v \ : r ' r j / - ^ : • - . - . '•• ? \
'':"S?X:- H£i^ ' ::': '""••' '— - ^ / v — o 5 ^ N < . . - • : • : . : '• ' • • ' • 7 • . " . ; • +yo. ••
" : . : • • . ' . ; . ' . > ^ ' . . " • . - ' . - • - y * » /1
. ';
* '. ' '"«-vV ' •' ̂ —~^Ç<•'• ^ 1 \ v\ \ \
(enough to destroy forests)above BO iig/m1
(alfects human health)', above 300 ug/m3
'•;. (ecological catastrophe)
— — .̂
\1
1
, ! \
Fi
IH•1
" - • " " " ' . . .
- V ^ . - • ^ * " * ^ • •
•fir • -,
>v" S
01
.•£\M A 01
•J-V
OstrotekaX
:':.,;:;.•;:-:.':>i**iT:-: > > —
• v ^ K . - ^ s i j ^ ̂ .'"'.•- "•-• ' , . ' ' . • ; ' *
i l' * ^ * T ^ : ^ •' '
: • -
': " ' • - • ' - - - : \ .- . l :- -, :"' :
"' ' ' ft''^V ' » • '" ' " ';' • , „ • l |C X ' V * '"
" ' ' " , " " ' ' ' ' ' • " • • • "
Sandornlerz^«
quantity ol sulphur dioxidedeposition tonnes/km /year)
;V1/
1j
N .
km1
^^D '1.0
r N*
|); \
'• '. à
/
l /: /
•\•
* *r
%1a
•
1
2C)0
\
NJ
\ %
S\
Figure 4. Transboundary pollution of Sulphoc dioxide in Poland. Average annualconcentration S02, 1978.1 - above 20g/m3 (enough to destroy forests)2- above 60g/m3 (affects human health)3- above 300g/m3 (ecological catastrophy)4- quantity of SO2 deposition in tonnes/km2/year
Source: F.W.Carter, 1989, p. 177
316

BalticSea
^
Areas of top priorityin environment protection
Nature high value areas
Areas allocated to first priority inestablishing system of protected areas
• Major cities
Major rivers
Areas selected for Water Protection
v\s Baltic coastal area to beprotected against crude sewage
Protected drainage areas
km 200
Fig. 5. Environmental protection in Poland.Source: Regional Policies in Poland, 1991.
317

Fig. 6. "Green lungs" of Europe. Source: Degorska, 1993.Source: Degorska, 1993
Footnotes
1. A bank of population and natural environment data is being created for thecommon purposes of researchers involved in the P-E studies, and others, at theLaboratory of Geographical Information Systems of the Institute. The Departmentof Population Geography and Urban Studies headed by Prof. P. Korcelli isundertaking population change and migration studies; fertility and mortalityanalyses; multiregional population projections; studies of internal andinternational migration. The new approach to the population-environment study isdeveloping (Potrykowska, 1992).
318

2. The expert report on depopulation of rural areas in Poland, conducted under thedirection of Prof. A. Stasiak, head of the Department of the Spatial Organization,was presented last year to the governmental Commission of the SpatialOrganization and Economy (Stasiak et al., 1991; Eberhardt, 1992). This studyhas been diffused and discussed by demographers, planners, and politicians,because of its importance for the present and future demographic and socio-economic structure of rural areas.
3. The main research topics conducted in the Institute of Geography and SpatialOrganization of Polish Academy of Sciences are: field research and strategies ofP-E development in frontier regions; international comparative studies of Easternand Western frontier regions in Poland (Potrykowska, 1992b; Degórska, 1993).
4. Therefore, the hypothesis adopted in the analysis states that environmental andsocio-economic factors have influenced the mortality in Poland. A multipleregression was run with a matrix of observations of dimensions 35x49, in which35 variables for 49 voivodships were contained. Because of comparability ofvariables in the adopted territorial setting, 19 explained variables were describedin the form of standarized death rates according to sex, cause of death and thecharacter of residential location, while 16 explanatory variables were presentedas structure and intensity coefficients, expressing the environmental and socio-economic characteristics of voivodships (Table 2). In order to limit the set ofexplanatory variables to the most significant, the step-wise regression algorithmwas applied, and finally 19 regression equations were obtained (Table 3). In thefirst stage 5 regression equations were analysed.
Table 2. Variables used in the multiple regression analysis of mortality in Poland
Dependent variables
D - Standardized death rate, PolandDF - Female standardized death rateDM - Male standardized death rateDU - Standardized death rates. Urban areasDR - Standardized death rates. Rural areasC - Standardized death rates. Cardiovascular diseases, PolandCF - Female standardized death rate. Cardiovascular diseasesCM - Standardized death rate. Cardiovascular diseasesCU - Standardized death rate. Cardiovascular diseases. Urban areasCR - Standardized death rate. Cardiovascular diseases. Rural areasN - Standardized death rate. Neoplasms, PolandNF - Female standardized death rate. NeoplasmsNM - Male standardized death rate. NeoplasmsNU - Standardized death rate. Neoplasms. Urban areasNR - Standardized death rate. Neoplasms. Rural areasA - Standardized death rate. Accidents, poisonings, violence. PolandAM - Male standardized death rate. Accidents, poisonings, violence.AU - Standardized death rate. Accidents, poisonings, violence. Urban areasAR - Standardized death rate. Accidents, poisonings, violence. Rural areas
319

Independent variables
DEMOGRAPHIC
PD - Density of population per km2
U - % of urban population in total number of populationI - % population employed in industryIF - % females employed in industry
HOUSING, SANITARY AND LIVING CONDITIONS
PPR- Persons per roomWC - Consumption of water from water supply in hm3 (106 m3)GC - Consumption of gas in hm3
TR - Number of passengers in urban transport (mln persons)LW - Industrial and municipal liquid of wastes requiring purification but
discharged to surface waters in 106 eu. m3 per km2
G&D- Emissions of dusts and gases in tons per km2
IW - Environmentally harmful industrial wastes accumulated within industrialplants in tons per km2
F - Surface of forests in hectaresFD - Forest surface in the areas endangered by industrial emissions in
hectares
MEDICAL SERVICES
MD - Number of medical doctors per 10 thousand inhabitantsHB - Number of hospital beds per 10 thousand inhabitantsFZR- Mineral fertilizers use in kgs per hectare of agricultural land
In the first model six independent variables account for 57 per cent of thevariance of the standardized death rate. The most significant variables are:urbanization index (U), degree of ecological danger (IW, FD), sanitary conditions(WC), as well as the state of the health care system (ND, HB). In twoconsecutive models describing the influence of environmental and socio-economic factors on death rates of females (DF) and males (DM) the sameindependent variables describing housing conditions are significant. In the fourthmodel 8 significant variables (the same as in the first model plus PPR and LW)account for 50 per cent of variance of standardized death rates in urban places.In the fifth model, representing the influence of 4 socio-economic variables ondeath rates in rural areas, the most significant variable is the mineral fertilizer usein kgs per hectare of agricultural land. This confirms the hypothesis thatexcessive use of chemicals in agriculture is the cause of mortality. The otherthree variables describe living conditions (GC) as well as the state ofenvironmental pollution in rural areas (G&D). The share of variance Is 46 percent.
The following group of models describes the Influence of explanatory variables onthe spatial differentiation of death rates according to causes, sexes and rural-urban residential locations. Among the models describing mortality due tocardiovascular diseases (C.CR) the highest fit was noted In the eight model R2 =
320

28 per cent), in which the mortality of males from these diseases depended upon7 independent variables expressing life conditions in urban places, includingpopulation density (PD) and urbanization index (U), as well as industrialemployment (I), housing and sanitary conditions (PPR, WC), and accessibility ofthe health care system services and facilities (MD, HB). This, again confirms thesupposition that urban ecosystems are less favourable for males, who are moresensitive to stresses and hard life conditions in urban environment. In thesubsequent model (CR) the most significant independent variables influencingthe death rates in rural areas due to cardiovascular diseases are: forest surface,which positively influences the health condition of population, and accessibility ofthe health care services (MD, HB), the latter having, very often, especially in ruralareas, a direct importance for the possibility of saving human life.
The greatest share of variance of dependent variables formulated as death ratesdue to neoplasms, according to sex and rural-urban location, is explained bythese independent variables which turned out most significant in the third groupof models (N.NR). Some 70 per cent to 90 per cent of the variance of themortality due to cancer can be ascribed to the impact of ecological factors.Deathsdue to neoplasms dominate in strongly industrialized, polluted towns (model NU)and in the male population (model NM), which is corroborated by significantindependent variables representing dust emmissions and industrial employment,as well as consumption of water from water supply systems (drinking watercontains various detergents, bleaching substances, chemical and metallurgicalwastes, pesticides etc., which cannot be entirely excluded, and even when thebiological oxidation of organic substances is properly performed, the end productsof this process may be toxic in conditions of high concentration.
Table
No.1.2.3.
4.
5.6.7.8.9.
10.11.
12.13.14.15.16.17.18.19.
3. Stepwise regression results for mortality in Poland, 1988
Regression equationD = 897.94 + 2.66U + 0.15WC - 0.0003IW + 0.055FD + 0.66HB - 6.09MDDF = 829.58 + 0.27WC - 1.53LW + 0.003FD + 2.26U - 5.74MD + 0.33PDDM = 728.92 + 72.72PPR + 0.19WC - 0.003IW + 0.13FD - 4.41 MD + 0.32HB +2.41 UDU = 611.73 + 3.48U + 137.9PPR + 0.22WC + 0.34LW - 0.77IW - 0.22FD -9.4MD + 2.3HBDR = 668.15 - 0.11GC + 0.71 FZR + 260.8PPR + 0.36GDC = 424.8 + 2.491 + 0.08LW - 0.09GD + 0.001 IW + 0.07FDCF = 409.4 + 0.06PD + 2.7I - 0.28LW + 0.005ICM = 411.25 + 0.11 PD + 0.46U + 1.971 - 0.084WC - 0.65LW + 0.03IW + 0.29FDCU = 399.36 + 2.021 -+0.02WC + 0.02LW - 0.001 IW + 0.21 FDCR = 345.04 + 2.221 + 120.3PPR - 0.23WC + 0.15MD + 0.47HBN = 142.04 + 1.61 U - 11.38PPR + 0.06WC - 0.18TR + 0.01 IW - 09FD - 0.05HB-1.51MDNF = 126.29 + 1.3U - 25.13PPR + 0.07WC - 0.25LW- 0.09MD - 0.29HBNM = 150.52 + 1.94U + 3.42PPR - 0.03IW - 0.06I + 0.26HB - 2.85MDNU = 173.92 + 1.14U + 0.003WC + 0.002IW + 0.23HB - 1.78MD - 0.911NR = 181.94 -+41.21 WC + 0.25FZRA = 54.13 + 0.12U - 0.09I + 0.001 IW + 0.51 HB - 0.98MDAM = 87.05 - 0.01 PD - 1.38MD + 0.814HBAU = 41.31 +0.18U + 0.53HBAR = 58.62 + 0.54 U - 7.93PPR - 0.99WC
R2
575246
50
46252427184175
7866555631232040
321

This problem has a connection with the significance of two variables (WC andFZR), which explain altogether 56 per cent of variance of the death rates due toneoplasms in rural areas (NR). In the twelfth model (NF) 78 per cent of varianceof standardized death rates of females from cancer is explained by 6 independentvariables related to degree of urbanization, housing, and sanitary conditions, andstate of environment (TR), as well as health care system (MD.HB). Attentionshould be paid to the significance of the variable representing consumption ofwater from water supply systems, which are also related to the catastrophicsituation as to waste-water purification in Poland. The majority of towns inPoland are not served by any water purification plant, including several largecities, Warsaw not excepted. Even purified water is not adequate in towns in viewof its demineralization - it is deprived of various trace elements, which may resultin definite deficiencies in the human organism. Even the inadequate system ofwater supply in rural areas has a very unfavourable influence upon the health ofthe rural population. In the majority of rural areas particularly in the easternregions of Poland, the system of piped water is less developed. For example, in1988, 56 per cent of households in the countryside were served by piped water,38.9 per cent had a we, 43 per cent a bathroom, 3.5 per cent gas and 33.4 percent central heating.
In the last group of models, describing the influence of environment socio-economic variables on the death rates due to accidents and poisonings, themajor part of variance of mortality levels related to these causes (R2=30 per cent)is explained by the variables expressing the degree of urbanization, industrialemployment, as well as accessibility of medical service (MD). The remaining partof the variance is explained by other causes having important significance, whichshould be considered in future investigations. In order to better recognize theinfluence of different factors on the mortality level one should study the followingelements: work conditions, housing conditions, life style, cultural and educationallevel, eating habits and diet, biological and health characteristics, living conditionsin industrial and urban agglomerations, availability of sanitary facilities andequipment, as well as ecological conditions connected with the state of pollutionof the natural environment.
References
Atlas of Resources, Values and Degradation of Poland's Geographic Environment,(1993). Institute of Geography and Spatial Organization, Warsaw: Polish Academyof Sciences.
Baranowska, I., R.. Aleksandrowicz, A. Cekanski, and J. Baranowski. 1992.Determination of Metals in Human Placenta Using Graphite Furnace AtomicAbsorption Spectroscopy, Polish Journal of Environmental Studies, 1, 3-8.
Breymeyer, A., ed. 1993. Geography of organic matter production and decay, SCOPESeminar, Conference Papers, 18, Institute of Geography and Spatial Organization,Warsaw: Polish Academy of Sciences.
Carter, F.W., 1989. Air pollution problems in Poland, Geographia Polonica, 56,155-77.
322

Degórska, B., 1992. Kilka uwag o stanie srodowiska przyrodniczego w zachodniejstrefie przygranicznej Polski (Some remarks on natural environment in Westernfrontier region of Poland). In: Problematyka Zachodniego Obszaru Pogranicza(Problematics of Western frontier areas), Warsaw: Biuletyn, 1, IGiPZ PAN.
Degórska, B., 1993. Problematyka ekologiczna wschodniego pogranicza Polski(Ecological Problems of Eastern frontier region in Poland) In: ProblematykaWschodniego Pogranicza Polski (Problematics of Eastern frontier region), Warsaw:Biuletyn 2, IGiPZ PAN.
Demographic Situation of Poland. National Reports 1986-1992. Warsaw:Governmental Demographic Commission.
National Environmental Policy of Poland, 1991. Ministry of Environmental Protection,Natural Resources and Forestry, Poland.
Potrykowska, A., 1991. Les tendances actuelles et la répartition spatiale de la mortalitéen Pologne, Espace, Populations, Sociétés, 1, 201-13.
Potrykowska, A., 1992a. The consequences of the environmental pollution forpopulation in Poland, Paper presented at the 27th Geographical Congress,Washington D.C: IGU.
Potrykowska, A., 1992b. Problematyka zachodniego obszaru pogranicza (Problematicsof Western frontier areas), Warsaw: Biuletyn 1, IGiPZ PAN.
Potrykowska, A., 1993. Mortality and Environmental Pollution in Poland, Research andExploration, 9(2).
Regional Policies in Poland, 1991. Central Planning Office, Warsaw, 83 pp.
Rolewicz, Cz., Zmiany w stanie srodowiska przyrodniczego na obszarach ekologiczniezagrozonych w latach 1982-1988-1990 (Changes of the state of naturalenvironment in the areas of ecological hazard), Warsaw: Biuletyn KPZK PAN, 165,135 pp.
Stasiak, A., P Eberhardt, A. Gawryszewski, 1991. Expert Report on Depopulation ofRural Areas in Poland, Warsaw: IGiPZ PAN.
Witkowski, J., 1993. The quality of the natural environment and demographicprocesses in large towns in Poland, Geographia Polonica, 61.
323


CHAPTER 17
HEALTH AND PERCEPTION OF PEOPLE ABOUTPOLLUTION AROUND INDUSTRIAL ZONE OF BOMBAY
Parveen Nangia, Kamla Gupta, T.K. Roy & Rajiva Prasad(Institute of Population Sciences, Bombay, India)
1. Introduction
Two most glaring examples of fatal industrial accidents of the immediate past are theleakage of methyl isocynate (MIC) from the Union Carbide Plant in Bhopal in 1984 andthe emission of radio-nuclides from the nuclear power plant in Chernobyl in 1986. It isestimated that the former claimed over 4,000 lives and severely affected nearly 50,000people, while nearly four million people were directly or indirectly affected by large-scale contamination in the Chernobyl accident (Narvane, 1992). Though managementof any hazardous plant takes all the precautions to prevent any untoward incident, stillthe possibility of an accident cannot be eliminated completely. The extent of damage, ifsuch an unfortunate incident takes place, depends not only upon the amount andtoxicity of the material released by such factories, but also upon the proximity of peopleto these plants, prevailing wind direction and other weather conditions, city skyline etc.
Greater Bombay, the largest urban agglomeration in India, having around ten millionpeople, is located in the crater of an industrial volcano. Any eruption of poisonousgases and lava of injurious chemicals will take away tens of thousands of lives andcripple many more. The numerous chemical industries located in Bombay keepreleasing quantities of toxic, irritant gases and pollute the entire environment of thecity. The major concentration of these industries in Bombay is in the Chembur-Trombay industrial belt, which is probably the smallest area with the largest industrialinvestment in India. It has two major petroleum refineries, a petroleum off-loadingterminal, large industrial plants and many other smaller industries which use hazardouschemicals. Of the 32 hazardous factories at Chembur-Agra road, seven are inChembur (Shridhar, 1992).
This area, which holds about 50 industries today, was once a piece of marshy land. Itwas covered with forests in 1810, when it was the part of the island of Trombay.Chembur still comprised jungles in the 1940s when the first refinery was set up andpollution was never felt in the area (D'souza, 1992). The proximity of this relativelyuninhabited area to the sea and its considerable distance from the mainland Bombayprompted the government to target it as a high growth centre. The area was mergedwith Bombay Municipal Corporation (BMC) in 1957 and soon became the largestconcentration of industries producing a range of petro and agrochemicals, cosmetics,Pharmaceuticals, engineering and processing goods. With industries came the workersand with them more people to cater to their needs. With development and increasingpopulation, Chembur and its surrounding area lost its flora and fauna and was
325

submerged in a variety of obnoxious gases released by the factories. This rightlyearned the acronym "gas-chamber" for Chembur.
According to the Air and Water Quality Monitoring Unit BMC, 2971 tonnes of pollutantsare let out in the air in Bombay every day. Nearly 46 per cent of this is contributed bythe industries, 52 per cent by automobiles, and 2 per cent by the domestic sector(Kamat, 1992; Goenka, 1992). Fortunately, because of Bombay's coastal location,strong sea winds help in dispersing the air pollutants. However, during the winter, theexcessive presence of suspended particulate matter (SPM) leads to temperatureinversion and the city is visibly enveloped in a low lying pollution cloud. Studies showthat a higher concentration of SPM in the air is particularly stressful for old peoplewhose health is already poor. It increases the cases of pulmonary heart diseases andpneumonia.
M Rough estimates indicate that if unhealthy levels of SPM were brought down tothe annual average level that WHO considers safe, between 300,000 to 700,000deaths a year could be averted in developing countries Chronic coughing inurban children under the age of fourteen could be reduced by half (or about 50million cases annually), reducing the chance that these children will facepermanent respiratory damage" (World Bank, 1992).
The pollutants can cause health problems through direct exposure or indirectly throughchanges in the physical environment. In two major cases of direct exposure in theNetherlands and the United States homes were built on reclaimed land containing paintsolvents, pesticides, chemicals used in making plastic and sludge from the bottom ofstills. The children living on or near the site developed many serious health problems.Finally, the families had to be evacuated from both the sites (UN, 1990).
The evidence in the United States show that 2-3 per cent of all the cases of cancer areassociated with environmental pollution (World Bank, 1992). But, the effect of pollutionon the health of people in the developing countries is much more pronounced as theyare comparatively less healthy and undernourished.
Environmental pollution also affects the reproductive health. It may cause sub-fertility,intra-uterine growth retardation, spontaneous abortion and various birth defects. Indeveloping countries various infectious diseases, malnutrition and poor livingconditions are important causes of reproductive health problems, whereas indeveloped countries chemical pollution, radiation and stress have become the majorthreats (WHO, 1991).
Environmental pollution has led to several health related problems among theBombayites leading to respiratory disorders, lung infections, asthma, allergy etc..Kamat et al. (1992) attributed the prevalence of several respiratory and other problemsto the existing level of air pollution. They found higher incidence of respiratory infectionin areas with high air pollution, particularly with high level of SPM and sulphur dioxide.The incidence of TB was found to be between 0.5 to 0.8 per cent and history of old TBbetween 0.8 to 1.5 per cent. The incidence of cancer was 69.1 per 100,000 femalesand 67.7 per 100,000 males in 1979-84. In the highly polluted areas cough andmultiple chest infections were common at ages below 10 years (Srinivasan, 1990-91).
With this background in mind, the present study which was conducted in 1990 in azone of 5km radius (covering 78.5km2 area) around Rashtriya Chemicals and
326

Fertilizers (RCF) throws some light on the prevalence rate of respiratory and skinproblems which could be caused by pollution among the inhabitants residing close tothe industrial area; the spatial variation in the prevalence rate of actual suffering as onemoves away from the industrial zone; the knowledge of residents about the pollutersand the pollutants; their preparedness in case of any eventuality; and measures to betaken by them (right or wrong) if an unfortunate leakage of the hazardous chemicalstakes place from any of these factories. It also gives some recommendations forreducing the sufferings from factory pollution and prevention of occurrence of anydisaster in the area.
2. Methodology
The study was conducted in the M, N, L, G-south, F-south, F-north and H-eastwards of Greater Bombay. Keeping RCF as the centre on the map, the area to besurveyed was marked at a distance of 5kms from the centre. The major objective of thestudy, which was conducted for RCF, was to estimate the population in this area. Themap obtained from BMC showed the industrial and residential areas, no developmentzone and open spaces. The circle with 5km radius was enclosed in a square forsampling purposes. This big square was divided into 100 squares each of one km2
size. Again each of these 100 squares was sub-divided into 100 small squaresmeasuring 100 metres by 100 metres in size. All these squares were systematicallynumbered. In the residential areas, the small squares (100m by 100m) were stratifiedaccording to their density of residential structures as shown in the BMC map and 343such squares (15 per cent of the total residential space in the study area) wereselected using stratified random sampling procedure. After a rapid field reconnaissanceanother 66 small squares were selected from the open areas which were strewn allover by the slums. Only six small squares from the no development zone were foundhaving some residential areas which were also included in the sample. For the purposeof estimating the population density, full population count was done in all these 415selected small squares. In addition, detailed information was elicited from the first fivehouseholds in each selected small square through a pre-designed questionnaire. Aftereliminating the cases of no response, locked or vacant houses, information wasobtained in all from 1877 households.
3. Findings
In all, 9291 persons were staying in these 1877 households, indicating that the averagehousehold size was 4.95 persons. The estimated population of this 5km zone aroundRCF (78.5km2 area) was 2.2327 millions (Roy et al., 1991). Since most of theindustries are located in the southern and eastern portion of the study area, thedistances of the study blocks were calculated from the industrial area and grouped intothree distance zones, viz. up to 1km (zone-1), 1 to 3km (zone-2), and 3 to 5km(zone-3). The estimated densities of population of these three zones were 15092,42292 and 31864 per km2 respectively. Fig. 1 shows the location of bigger squares ineach zone and the pattern of their population densities.
327

Persons per sq km
100,001 -125,000
70,001 - 100,000
55,001 -70,000
40,001 - 55,000
25,001 - 40,000
10,001 -25,000
< 10,000
— — Industrial area
Zone 1
Zone 2
Zone 3
0 m 1000
N
Fig. 1. Residential population density in big grids (weighted average density) in 5kmzone around Rashtriya Chemicals and Fertilizers (RCF), Greater Bombay,October 1990.
328

Table 1. General Characteristics of the Households (HH)/Population Interviewed
Percentage ofHH interviewed
Average H Hsize
Percentage ofkutcha houses
Percentage ofHH not havingtoilet facility
Percentage ofHH not havingwater facility
Dependencyratio
Zone
1
21.9
5.3
16.2
50.9
43.7
48.9
2
32.0
4.8
14.3
41.8
32.3
46.2
3
46.1
4.9
12.6
39.0
29.9
32.3
Total
100.0
4.9
13.9
42.5
33.7
47.5
Note: Kutcha house refers to a dwelling unit made up of materials like unburnt bricks, bamboos, mud,thatch, etc.
Table 1 presents the general characteristics of the households interviewed as well asthe population covered during the survey. It shows that nearly one-fifth of thehouseholds were residing in zone-1, about one-third in zone-2 and 46 per cent inzone-3. More than two-fifths of the households did not have any toilet and one-thirdany water facility within the house. About 14 per cent households in the entire studyarea were staying in kutcha houses. In zone-1, which was closest to the industrialarea the living conditions, both in terms of quality of house and availability of basicamenities within the house, were much worse than in zones 2 and 3. To make thematter worse, these poor quality houses were accommodating more people in zone-1as is reflected by their larger average household size. Apart from that, this zone alsohad the highest dependency ratio, particularly the young dependency ratio. In anutshell one can say that the living conditions of people in zone-1 were mostunfavourable. At several other places also it has been observed that the concentrationof the poorer sections of society is greater near industrial units, which makes themmost the vulnerable group to any industrial hazard.
4. Complaint Rate about Pollution Related Health Problems
Evidence from other countries show that chronic exposure to pollution may lead toexacerbation of bronchial asthma, recurring lung infection, frequent nasal, throat andeye irritation and emphysema. The common clinical complaints caused by exposure topollutants may be headache' (NO2, aldehyde, benzene), eye irritation (ammonia,aldehyde, NO2), watery nasal discharge and sneezing (SO2), irritating cough (SO2,
329

SPM), choking and chest pain (NO2), irritability, anginal pain, ECG changes onexercise (CO) and productive cough (SO2, SPM) (Kamat, 1992).
Table 2. Age Distribution of Population and Pollution-related Health ComplaintRate
Age group
0-14
15-59
60 +
All ages
Percentage of Population
Zones
1
28.3
67.2
4.5
100.0
2
25.
68.
5.
100.
3
25.6
67.7
6.7
100.0
Total
26.2
67.8
6.0
100.0
Health Complaint Rate
Zones
1
12.3
23.3
34.3
20.7
2
8.7
15.2
27.7
14.3
3
4.7
14.0
21.6
12.1
Total
7.8
16.5
25.6
14.8
The percentage of households with at least one complainant declined from 50 per centin zone-1 to 43 per cent in zone-2 and 40 per cent in zone-3. The overall rate ofhealth complaints amongst the residents was 14.8 per cent for this part of GreaterBombay, which declined as one moved away from the industrial area (20 per cent inzone-1 to 12 per cent in zone-3, Table 2). This pattern was found to be true for all agegroups. However, the complaint rate was lowest among children and highest amongold people, which could be because children, especially small ones, either do not knowabout their problems or do not report them even if they are suffering. On the otherhand, old people generally complain more about their health problems which alsoincrease because of the age factor.
Table 3 depicts the pollution-related health complaint rates by broad age groups andhousehold characteristics in different zones. It is observed that generally the complaintrates declined as one moved away from zone-1 to zone-3 in all the age-groupsexcept for old people (aged 60 +) staying in kutcha houses and without availability ofwater within the house. This could be because of the overall small sample size in thatparticular category. Another noteworthy feature of this table is that the households withcomparatively deprived living conditions had a lower complaint rate in all the threezones. The lower complaint rates among the deprived households with poor livingconditions indicate their lower sensibility to minor complaints, such as headache,irritation in eyes, etc. However, the differentials in complaint rates by living conditionswere generally low in zone-1 and quite high in zone-2. The perpetual suffering ofpeople from these complaints in zone-1 reduces the differentials in the complaint ratesby living conditions of the family.
330

Table 3. Rate of Health Complaints by Household Characteristics and BroadAge-Groups
Age-groupZone
Age 0-14Zone-1Zone-2Zone-3TotalAge 15-59Zone-1Zone-2Zone-3TotalAge 60+Zone-1Zone-2Zone-3TotalAll agesZone-1Zone-2Zone-3Total
Household characteristicsType of construction
Kutcha
12.71.52.14.8
25.013.711.715.6
14.30.0
22.212.5
20.19.28.5
11.7
Non Kutcha
11.910.35.28.4
23.115.414.416.7
35.929.121.626.4
20.715.012.714.1
Water availableNo
11.83.22.99.2
24.810.212.715.5
30.823.332.128.6
20.68.5
10.012.7
Yes
12.312.15.85.8
22.317.514.717.1
35.628.720.425.3
20.717.013.215.9
Toilet availableNo
9.43.73.65.3
22.211.012.514.8
28.230.030.329.7
18.99.7
10.512.5
Yes
15.813.55.6
10.2
24.618.215.017.9
38.326.718.924.2
23.217.713.216.6
Table 4 shows that there is a direct correspondence between the educational level ofthe respondents and the health complaint rates. The uneducated reported leastcomplaints in all zones, whereas those with secondary and above qualification reportedmost complaints. However, the complaint rate declined in almost all the categories asone moved away from the industrial zone. The pattern is almost identical for all the agegroups. It seems that an uneducated person is less sensitive to perceive thecomplaints like headache and irritation in eyes as real ailments. On the other hand, theeducated persons, particularly in the areas located closer to the industries, not onlyreported more health complaints but also related them to the industrial pollution.
In addition, a greater proportion of households in zone-1 had complained of pollution-related ailments, but also a relatively greater proportion of household members herewere reported to be suffering from such ailments. This was true notwithstanding thefact that people in this area were relatively young and unfavourably placed in terms oflevel of living among whom the complaint rate was in general low.
331

Table 4. Rate of Health Complaints among Residents by Educational Level of theRespondents
Age group
ZoneAge 0-14Zone-1Zone-2Zone-3TotalAge 15-59Zone-1Zone-2Zone-3TotalAge 60+Zone-1Zone-2Zone-3TotalAll agesZone-1Zone-2Zone-3Total
Level of Education
No Schooling
12.17.23.97.6
17.67.9
13.512.9
26.715.820.820.7
16.28.0
11.111.6
Below Secondary
9.99.44.27.2
23.511.810.214.0
34.523.323.025.6
21.211.68.9
12.4
Secondary & above
14.08.85.28.3
25.119.316.018.9
36.431.721.226.7
23.018.214.017.1
Overall
12.38.74.77.8
23.315.214.016.5
34.427.721.625.6
20.714.312.114.8
5. Major Health Complaints
The most common clinical complaints in the area were irritation in the eyes, chronicheadache, sore throat or cough and skin itching. Table 5 shows the prevalence rate ofthese problems according to distance of the complainants from the industrial area byage groups.
It is clear from this table that eye irritation declined substantially as one moved awayfrom the industrial area (from 12.1 per cent in zone-1 to 5.1 per cent in zone-3).Chronic headache and sore throat/cough had lower complaint rates and showed aslight decline across the zones. They remained almost at the same level in the secondand third zones. The skin itching and breathing problem hardly had any spatialvariation. The pollution caused by automobiles, which is omnipresent in Bombay, mightbe responsible for the same prevalence rate of these complaints in different areas. Thetype of complaints also differed according to the age of the complainants: while skinitching and sore throat were more prevalent among children, older people complainedmore about eye irritation and chronic headache. This table suggests that the industrialpollution is largely responsible for eye irritation and to some extent for chronicheadache and sore throat/cough.
332

Table 5. Health Complaint Rate by Age and Type of Complaint
Zone-11. Eye irritation2. Skin itching3. Chronic headache4. Sore throat/cough5. Breathing problem6. OthersTotalNo.of personsZone-21. Eye irritation2. Skin itching3. Chronic headache4. Sore throat/cough5. Breathing problem6. OthersTotalNo.of personsZone-31. Eye irritation2. Skin itching3. Chronic headache4. Sore throat/cough5. Breathing problem6. OthersTotalNo of Persons
0-14
6.02.00.71.30.22.1
12.3(620)
1.82.60.51.50.41.98.7
(740)
0.81.50.31.30.20.64.7
(1084)
15-59
14.01.53.22.70.61.3
23.3(1474)
8.11.32.71.10.71.3
15.2(1962)
6.41.62.71.50.51.3
14.0(2864)
60+
23.21.07.11.02.00.0
34.3(100)
18.11.22.43.61.80.6
27.7(167)
7.62.93.62.54.01.0
21.6(280)
Total
12.11.62.72.30.61.4
20.7(2194)
7.11.72.11.30.71.4
14.3(2869)
5.11.62.11.50.71.1
12.1(4228)
6. Knowledge and Perception about Pollution
Of late the public sensitivity and awareness towards environmental pollution andrelated issues has become a potent force in many political and development decisions.In 1988 and 1989 the Harris Polling Organization surveyed public opinion andleadership attitudes around the globe on behalf of the United Nations EnvironmentProgramme. The survey findings revealed a widespread concern about the quality ofenvironment. Most of those surveyed believed that their environments had becomeworse in the past decade (Louis Harris and Associates, 1988; 1989). In our survey alsosome questions were asked to ascertain the extent of knowledge of the respondentsabout pollution-causing factories around the surveyed area as well as pollutantsreleased by these factories. On the basis of these questions the respondents wereclassified into the following three groups: (1) those who did not have any idea aboutany factory-causing pollution or any pollutant, were classified as having no knowledge,(2) those who had knowledge either about one factory or one pollutant or both werecategorized as having a low level of knowledge, and (3) those who had knowledgeabout more than one factory or pollutant or both were classified as having goodknowledge.
333

Table 6 presents the relevant data to gauge the respondents' knowledge aboutindustrial pollution according to their literacy status. In general, compared to illiteraterespondents a higher proportion of literate respondents had knowledge about industrialpollution. Similarly, the extent of knowledge was also found to be higher for literaterespondents. The knowledge about industrial pollution declined with increasingdistance from the industrial zone irrespective of the literacy status of respondents. Theincrease in the proportion of those who did not have any knowledge about industrialpollution among both literate and illiterate respondents from zone-1 to zone-2 wasvery striking. Equally striking was the widespread knowledge about industrial pollutionin zone-1 where around 83 per cent of both literate and illiterate respondents wereaware of industrial pollution and where 40 per cent of illiterate respondents and morethan half of the literate respondents had good knowledge about industrial pollution.This may be an outcome of the day-to-day exposure and the physical discomfortsexperienced by the residents in this zone because of persistent air pollution.
Table 6. Distribution of Respondents by Literacy Status and Knowledge aboutIndustrial Pollution
Level of
Knowledge
Noknowledge
Lowknowledge
Goodknowledge
Total
Zone
1
Illiterate
16.7
43.3
40.0
100.00
Literate
17.5
30.0
52.5
100.00
2
Illiterate
52.3
34.9
12.8
100.00
Literate
34.4
36.5
29.1
100.00
3
Illiterate
66.3
25.6
8.1
100.00
Literate
55.0
26.8
18.2
100.00
All area
Illiterate
48.3
33.6
18.1
100.00
Literate
40.6
30.5
28.9
100.00
An attempt was also made to ascertain the knowledge of the respondents aboutBhopal gas disaster according to literacy status (Table 7). In this case also a higherproportion of literate than illiterate respondents were having knowledge about it, butunlike industrial pollution, the proportion of both literate and illiterate respondentshaving knowledge about it was the least in zone-1. Besides, the difference inproportion of respondents having knowledge about the Bhopal gas disaster betweenliterate and illiterate respondents was very striking in zone-1 compared to other twozones. This again substantiates our earlier observation that a higher level of knowledgeabout industrial pollution in zone-1 even among illiterate respondents is because of thepersistent air pollution and consequential discomforts experienced by the residents ofthis zone.
334

7. Preferred Measures to Tackle any Disaster
The respondents were also asked to give their views on how they perceived thepossibility of an industrial disaster in this area, what measures could they suggest toavoid such a disaster and what type of system they thought could warn people toprepare themselves to face the situation in case of such an eventuality. The results ofthese interrogations are presented in Tables 8 and 9.
Table 7. Percentage of Respondents by Literacy Status Having Knowledge of theBhopal Gas Disaster
Literacy Status
Illiterate
Literate
Zone
1
39.6
64.6
2
58.8
67.0
3
47.5
59.5
Table 8. Distribution of Types of Measures Suggested to Avoid Disaster by Levelof Education of the Respondents
Measures
Better maintenance
Shifting of factories
Reduction of pollution by increasing the heightof chimney
Regular check-up of plants
Provision of gas masks by the industries
Planting more trees
Total
Literacy Status
Illiterate
43.0
30.2
12.0
12.7
0.7
1.4
100.0
Literate
46.2
29.7
8.7
11.1
1.8
2.5
100.0
It is observed that a large proportion of respondents have suggested bettermaintenance of the factories and shifting of factories away from the densely populatedarea as remedies to avoid any industrial disaster (Table 8). Of the two suggestedmeasures, the percentage of respondents indicating better maintenance was found tobe higher (46 per cent) than those suggesting shifting of factories (30 per cent).However, the situation did not appear to be very different when the literacy status wasaccounted for. It is apparent from this table that more literate respondents had opinedabout better maintenance of factories. A sizable number had suggested that raising theheight of chimneys might reduce pollution and in turn the risk of any disaster. The
335

percentage of illiterate respondents suggesting this measure was higher than theliterate respondents. Almost 12 per cent respondents had suggested regular check-upof plants as one of the remedies to avoid disaster, with some variation when literacystatus was considered. However, a very small proportion of people suggested treeplantation in the area to reduce the effect of pollutants.
In case of any gas leakage, it was considered necessary to have a warning system tomake people aware of an industrial accident and take some precautionary measures inorder to safeguard themselves from the hazardous situation. Accordingly, suggestionswere taken from the respondents regarding such a warning system, and the samehave been tabulated in Table 9 according to their literacy status.
Table 9. Suggested Warning Systems to be used at the time of Disaster byLiteracy Status of Respondents
Warning System
Siren
Police horn
Hospital bell
Radio/T.V.
Loudspeaker
Electronic warning device
Total
Illiterate
51.2
26.2
8.1
7.6
5.2
1.7
100.0
Literate
59.2
19.7
5.0
7.3
7.4
1.4
100.0
It was observed that more than half of the respondents had preferred a siren as ameans of warning system followed by a police horn. Whereas a siren was preferredmore by the literate group, a police horn was preferred by a larger proportion of illiteraterespondents. Some of the respondents had also suggested radio/T.V, hospital bell andloudspeaker as the other means of warning system.
8. Recommendations
The existence of a large number of gas-emitting factories in the densely settledsurroundings of Chembur and the high rate of health complaints related to pollution callfor immediate steps to mitigate the sufferings. While the need for controlling the level ofpollution in the area is imperative, there is an urgent need for undertaking programmesto inform and educate the masses about pollution and for measures to be taken toalleviate the level of sufferings. Since a large number of people live in the vicinity ofhazardous factories, special emphasis should be given to the preparedness of peopleto meet any disaster in the area and the appropriate steps to be taken by them to facesuch eventualities. The following specific recommendations are worth considering.
336

8.1. Measures to mitigate sufferings:
i) Educating the residents regarding types of pollution and their likely effects onhealth.
ii) Generating awareness about seasonal and diurnal variations in the level ofpollution and measures to be taken to minimize the effect of pollution.
8.2. Measures to reduce the level of pollution:
i) Regular maintenance and upgrading of machines and, if required, increasing theheight of chimneys.
ii) Restricting any expansion of the existing chemical factories and addition of suchnew factories in the area.
iii) Further increase in the density of population in this area to be thwarted.
iv) Tree plantation programmes in and around the factories to beundertaken/strengthened.
8.3. Measures to be taken to meet any catastrophe:
i) Educating and training people about precautionary and safety measures to betaken in the event of any industrial accident. It becomes very pertinent as duringthe survey many people said that they would rush towards the railway stations toprotect their lives in case of an accident. Such actions may lead to total chaosand confusion and create hurdles in the evacuation and relief measures.
ii) Proper warning system to be evolved to inform public about an industrial accident.
iii) Water resources and other relief measures to be installed and mobilized at thetime of an eventuality.
References
D'souza, L 1992. Memoirs of Chembur, The Times of India, March 16.
Goenka, D. 1992. Darkening Scenario, The Hindu - Survey of the Environment 1992.
Harris, L and Associates. 1988. Public and Leadership Attitudes to the Environment infour countries : A report of a Survey in 14 Countries and (1989) American Resultsof the UNEP Survey, New York, quoted in The World Resources Institute, UNEPand UNDP 1990, World Resources 1990-91, New York. p.10.
Kamat, S.R. 1992. Lethality of pollution killing us softly, The Hindu - Survey of theEnvironment, 1992.
Narvane, V. 1992. Chernobyl radio-activity spreads to Europe, The Times of India,October 6.
337

Roy, T.K., S. Mukherji, K. Gupta, P. Nangia and R. Prasad. 1991. Populationconcentration and perception of pollution and hazard around RCF, GreaterBombay. International Institute for Population Sciences, Bombay (mimeographed).
Shridhar, R. 1992. Dual Route - a must, The Times of India, March 16.
Srinivasan, R. 1990-91. Environmental Pollution of Bombay (unpublished SeminarPaper), International Institute for Population Sciences, Bombay.
United Nations. 1990. Global Outlook 2000, New York, USA.
World Bank. 1992. World Development Report, New York: Oxford University Press.
World Health Organization. 1991. Progress in Human Reproduction Research, 20,Geneva.
338

CHAPTER 18
SLUM AND THE URBAN ENVIRONMENT;STUDY OF A SQUATTER SETTLEMENT IN DELHI
Sudesh Nangia(Centre for the Study of Regional Development, School of Social Sciences, Jowaharlal
Nehru University, New Delhi, India)
1. Introduction
Who are the slum and squatter settlement dwellers? Where do they come from? Whatare the environmental consequences of slum and squatter settlements? These are theperpetual questions facing the metropolitan cities of today's India (Govt. of India, 1983,1985; Nangia, 1987,1988; Seshan, 1983; Singh and de Souza, 1980).
A survey conducted in December 1991 by the students pursuing their Master's degreein Geography at the Jawaharlal Nehru University, New Delhi, India sought answers tothese questions in the context of our concern for urban poverty and degradation ofurban environment, while undertaking a complete survey of an urban squattersettlement named 'Bhoomiheen Jhuggie - Jhonpuri camp' (cluster of temporaryshelters for the landless) in the southern part of metropolitan city of Delhi. This squattersettlement of approximately 1510 households stretches over an acre of public landnear middle and upper middle income-group colonies where land values go sky-rocketing. The squatter settlement occupied the land lying between the railway-lineand a link-road nearly 12 years ago, and has extended to the other side of the road aswell blocking parts of the road and rendering it unusable for through traffic.
It is astonishing to note that while in the year 1977 all the squatter-dwellers wereremoved to "resettlement colonies" (Mishra and Gupta, 1981) and the city was clearedof squatters, today's Delhi is dotted with nearly 900 such squatter settlements,accommodating nearly 200,000 people.
Our inquiry as to who are the squatter-settlers revealed that only some are genuinesettlers from rural areas in search of work and employment in the city. Many are fromthe resettlement colonies in the city itself, having given up their houses for rent or soldthem, and now squatting at the site concerned.
Back on their old site, they squat with the intention of receiving free land again from thestates as and when such distribution takes place. Our observations revealed thatsquatting is no longer an innocent act under compulsions of poverty, it is an organizedand manipulated activity managed by a group of people with strong political patronageand administrative support in a bid to benefit from the government subsidies for thepoor while they receive a continuous income in the form of fees for allowing the poor tobuild their shelters within the squatter settlement. A large number of Bangladeshimigrants settled in this squatter settlement further suggests the fact of political
339

patronage and interference in the system. The squatter settlement also shows a highrate of employment both for males and females. Engaged largely in the informal sector,either in the settlement itself or outside in the neighbouring colonies or factories, theirpopular activities are factory work, cottage household industry work, domestic work,shopkeeping and a few white collar jobs. Underworld activities ranging from pick-pocketing to commercial sex also flourish, though no one talks about them.
Under the programme for Environmental Improvement of Urban Slums (EIUS), thesquatter is provided with hand-pumps and water-taps. However, the squatters havealso taken additional connections direct from water-pipes meant for distribution ofwater for planned localities in the vicinity, which in turn face water shortage. Pavedstreets have not been built in a few pockets, largely because the residents refuse toremove their jhuggis from the site. The problem of electricity is solved by takingunauthorized connections directly from the electrical poles. A monthly sum is paid to'someone1 in the cluster itself for this illegal connection and not to the electricity board.Urban living is thus further subsidized for them.
The household possessions of squatter-dwellers may include T.V., room cooler andother items of comfort, but the walls of the house invariably are of mud, with thatchedroofs and mud floor. Their investment pattern reveals that they prefer to spend either abare minimum or nothing on items where they are sure of heavy government subsidy(like interest-free loans for building a house or provision of a land site for building ahouse).
Looking at the environmental degradation in the neighbouring settlements and with theaim of improving the living conditions of the squatter-dwellers, we initiated a dialoguewith the dwellers for an alternative accommodation site. We were informed that thesquatters were allotted an alternative site in the peripheral area of the city, but refusedto shift. They wanted a site in the vicinity itself; however, there is no land available orthe land values are too high for Delhi Development Authority (1991a, 1991b) to affordfor squatter- dwellers. Many people live in these squatter settlements not because of"no other choice" but because of convenience. They invite political patronage and aresolid vote-banks. They attract social activists who go out of their way to provide themvarious services like free medical aid, free education for children, work and educationprogrammes for adolescents and women, and in cases provide creche facilities forchildren. Squatter-dwellers have access to several such services either throughvoluntary organizations or through the government-funded programmes of socialwelfare, for which an ordinary middle-class resident of the city has to pay through thenose.
Such sites have also become favourites for the administrators who, under the EIUSprogramme claim to achieve their targets of providing basic services to urban poor andin a bid to ameliorate poverty and improve quality of life, further claim a higher share offunds from the donors.
In the whole process, the beneficiary sits and smiles and muses over the fact that hehas made a fool of everyone through his 'misery' because that pays him rich dividends.Otherwise, how does one explain a squatter-shelter with a wall of brick and two oftarpaulin with a shattered door of wood and with a television set, a room cooler and atwo-in-one inside the hutment.
340

2. Demography and Literacy
This squatter cluster of 1510 households had a population of 6682 where 53.8 per centare male (3595) and 46.2 per cent are female (3087), with 49 per cent (3282) in theage group 15-59, 45 per cent (2988) below 15 years and 6 per cent (412) above 59years.
The cluster has a high rate of literacy, as 65.2 per cent of males (2108) and 34.8 percent females (1123) are literate. The literacy level goes up with the income level of thehousehold for males, though it fluctuates for female heads of the household (Table 1).
Table 1. Literacy and Income-Level of the Households, Bhoomiheen J.J. Camp,New Delhi.
Household Income level(rupees per month)
500
500-999
1000-1999
2000-2999
3000 +
Percentage of literates to the total population (heads ofthe households)
Male
24.3
30.5
31.6
33.4
44.4
Female
19.5
16.2
17.2
16.7
19.7
By education level, 48.7 per cent of the population had completed primary schooleducation, 39.8 per cent middle school, 10.5 per cent high school and 1.0 per centcollege education. Given that Hindus and Muslims account for the overwhelmingmajority of squatter-dwellers, religious/educational differences are small, except thatonly the Hindus, Sikhs and Muslims have achieved high school and college education,attained by 8 to 12 per cent of the population (Table 2).
Table 2. Percentage of Literates, According to Religion and Education,Bhoomiheen J.J. Camp, New Delhi.
Religion
Hindu
Muslim
Sikh
Christian
Others
Total
PrimarySchool
49.1
* 46.1
31.0
50.0
33.3
48.7
MiddleSchool
39.0
45.4
58.6
50.0
66.7
39.8
High School
10.8
8.2
10.3
0.0
0.0
10.5
CollegeLevel
1.1
0.4
0.0
0.0
0.0
1.5
TotalLiterates
2464
269
29
6
36
2771
341

Females are less educated than males and the gap between the sexes increases withthe increase in the level of education (Table 3).
Table 3. Levels of Education by Religion and Sex, Bhoomiheen J.J. Camp, NewDelhi.
Religion
Hindu
Muslim
Sikh
Christian
Others
MaleFemaleMaleFemaleMaleFemaleMaleFemaleMaleFemale
Primary
63.037.066.133.966.733.366.733.30.0
100.0
Secondary
72.827.277.922.182.417.60.0
100.0100.0
0.0
HighSchool
83.816.277.322.766.733.3
———-
College
81.418.5
100.00.00.00.0
————
Total
17067581957419102421
3. Income Level
The majority of the households earn Rs. 500- 2000. The maximum share is of thosewith an income range of Rs. 500-999, who form 48.4 per cent of the households. Thisis followed by Rs. 1000-1999 with 35.4 per cent of the total households. Only 8 percent of the total households have income above Rs. 2000 per month.
Table 4. Income Level of Households, Bhoomiheen J.J. Camp, New Delhi.
Income Groups (Rupees permonth)
Less than 500
500-999
1000-1999
2000-2999
3000 +
Total
TotalHouseholds
140
724
527
93
26
1510
Percentage of totalhouseholds
9.3
48.4
35.4
6.2
1.7
100.0
342

4. Migration
A great majority of the households (1479 of 1510) claimed that they were migrants tothe city and came straight to the said settlement, the others shifting from other coloniesof Delhi. But, the fact is that the majority shifted from other areas of Delhi during theearly eighties. In Delhi all the squatter settlements were cleared by 1977 and weresettled in resettlement colonies. But during the eighties a number of squattersettlements mushroomed all over Delhi again.
This camp has migrants from a large number of states (Table 5). Migrant householdshave arrived from Uttar Pradesh (542), West Bengal (186), Rajasthan (119), Bihar (84),Madhya Pradesh (33) etc. A large number of migrant households have arrived fromBangladesh (417) which are second only to Uttar Pradesh. The other statescontributing to a much lesser extent to the migrant families are Orissa, Punjab, TamilNadu. Very few have come from southern states. Relatives (almost half), friends andsometimes contractors and middlemen form the channel of communication and partialsupport to the potential migrants.
Table 5. State of Origin and Religion of Migrants to Bhoomiheen J.J. Camp,New Delhi.
Religion
Hindu
Muslim
Sikh
Christian
Others
Total
ScheduledCaste
States
Bihar
74
8
2
84
30
MadhyaPrades
h
30
2
1
33
10
Rajasthan
117
2
119
33
UttarPradesh
414
120
6
2
542
273
WestBengal
157
27
2
186
63
angladesh
396
20
1
417
217
Others
31
64
1
1
97
8
Total
1219
239
7
8
5
1478
638
Many Hindus from Bangladesh have taken shelter in India. Having crossed over theborder illegally, they made their ways to Delhi either directly or indirectly. Initially, theyrefuse to divulge the information that they are from Bangladesh but later they confide.They claim to have possessed very small pieces of land in Bangladesh which they soldto migrate out but political instability, lack of security and poverty have made themleave their native land and take shelter in India.
Within India, most families have arrived from the nearby 15 districts of Uttar PradeshState. They are followed by Rajasthan, Madhya Pradesh and Bihar. The majority (553)
343

of families speak Bengali, coming from West Bengal and Bangladesh. Most of themwork in the nearby locality named Chitta Ranjan Park (they call it Bengali colony as it islargely inhabited by people from West Bengal).
There are special clusters for families migrating from different states/districts within thelocality. There is a large component of scheduled caste families, as 43 per cent of thehouseholds have claimed to be scheduled caste, coming from a deprived socio-economic background.
For the migrants, it is not a step-like migration from rural to semi-urban, to smallurban, large urban and the metropolitan centre. It is a straight jump for them from therural to the metropolitan or rural/urban/metropolitan. The survey revealed that only 25per cent were indirect migrants; others all came straight to Delhi.
The purpose of migration is well known. Employment is the basic motive behind 77 percent of the households, though migrants gave other reasons for migration as well, likemarriage (0.97 per cent) and family migration (6.7 per cent). Sixteen per cent migratedon several other counts, which seems to be quite a significant figure. Family quarrels athome force many youngsters to leave their homes. Fragmentation of land-holdings,whereby the land turns out to be highly uneconomic and incapable of supporting thefamily, is cited as another reason for migration.
Nearly half (48 per cent) of the migrants reported to be landless labourers at home.Many tailors migrated to Delhi because their profession provided little opportunity intheir native places. The same reason has been given by the masons as well. In thecity, they work in factories or shops. Migrants from Bangladesh gave the reason ofmigration as riots in their native places, and confiscation of their land and propertywhich forced them out to India The land provided to them at the resettlement sites inPumia in Bihar or Dendkarniya in Madhya Pradesh was found to be rocky and infertile,so they left their resettlement sites and moved to Delhi.
Within the slum, a constant movement tends to take place. Those who have improvedtheir income status tend to shift their families out, while those staying in their villagesstill join them from time to time. They continue to maintain their houses in the slum tohelp their relatives and village-folks, and also in anticipation of allotment ofland/site/loan by the State to improve their housing and living conditions.
5. Economic Activities
The workers engaged part-time or full-time have been classified into factory workers,domestic servants, shopkeepers, cottage and household industry workers, constructionworkers and others. The survey revealed that nearly 30 per cent of the population isengaged in full-time work and women form 22 per cent of the total workforce (Table 6).
There is a large concentration of men in factory jobs. The presence of Okhla industrialestates nearby provides job opportunities to the workers. Construction work is anotherimportant economic pursuit, though not common for women. Generally in constructionsites, the entire family is engaged in construction work but not in this particular slum.Women have taken to lighter jobs working largely as domestic servants in the nearbyresidential colonies. Cottage and household industrial workers are mostly male.Women are engaged in embroidery, bead work, and other stitching and craft work,
344

which is brought to their houses by the male members on contract. Besides, there area large number of women working part-time in this work, a fact which has not beenbrought out in this table.
Table 6. Distribution of Workers by Job and Gender, Bhoomiheen J.J. Camp,New Delhi.
Types of Job
Factory workers
Domestic servants
Shopkeepers
Cottage & household industryworkers
Construction workers
Others
Total
Employed
Male
334
55
129
165
201
634
1518
Female
56
324
9
20
10
21
440
No. of Persons
Total
390
379
138
185
211
655
1958
Cross-classified by income-level (Table 7), we find that most of the workers fall in theincome- range of Rs. 500-1000 followed by Rs. 1000-2000. Nearly 18 per cent of thetotal workers have incomes below Rs. 500. Only 4.5 per cent of workers indicated theirincome above Rs. 2000.
Table 7. Income Level by Nature of Work, Bhoomiheen J.J. Camp, New Delhi.
Incomegroups (Rsper month)
Less than400
500-1000
1000-2000
2000-3000
3000 +
FactoryWorkers
11
201
74
2_
DomesticServants
207
180
20
-
Shop-keepers
18
115
83
12
2
Cottage &house holdindustriesworkers
15
92
100
11
5
ConstructionWorkers
31
171
86
9
—
Others
62
287
225
24
6
Total
344
1146
588
58
13
Surprisingly, the incidence of child-labour reported in this cluster was very low. In fact,every family claimed that their children were going to schools located at walkingdistance. The slum itself has a community centre equipped with primary education
345

facilities which is used extensively by the local population. It also offers an adulteducation programme in the afternoon and evening shifts for women and menrespectively.
6. Conclusion
In brief, the analysis of the survey data dilutes many notions built around the life styleof slum-dwellers. Some of the highlights may be re-emphasized.
The people here are not living out of economic compulsions, but out of choice. Analternative site proposal has not appealed to them. In fact, many of them have housesin other resettlement colonies, which they have rented out or part of their family staysthere.
Their stated income may be low but it is not revealed in their consumption pattern andtheir life style except in the building material of the houses (which is apparently onaccount of other factors).
There ¡s a class of middlemen who try to provide infrastructure like water, electricity,space for shelter in the settlement return for token charges paid periodically by thehouseholds. The middlemen themselves make arrangements for such public servicesby diverting them from the share of regular localities, creating sometimes an acuteshortage of supply in those localities. This class of middlemen negotiates for favours tothe slum/squatter residents with the politicians, non-governmental organizations, DelhiDevelopment Authority etc., though it was stated that a large percentage share ofbenefits is taken away by the middlemen themselves.
The homogeneity in terms of family occupations is diffused. Men and womenseparately look out for the best opportunity of work whether domestic or otherwise.
A large number of NGOs and public welfare units are active in providing social servicesand basic infrastructural facilities to the residents. The residents are well aware of it,and take maximum possible advantage of the services rendered by the NGOs andother private/public organizations. Though education and general awareness amongthe people is high, the bane of slum life is still visible as a majority continue to wait forgovernment subsidies and free services from welfare organizations.
Further, the location of squatter settlements in the vicinity of planned urban colonies,the virtual encroachment on prime private/public lands, the obstruction caused totransport and commuting through the roads being cluttered with squatters' huts, shops,and other paraphernalia cause discontent among the residents of nearby localities. Thegeneral environmental deterioration in the form of open sewerage, poor drainage,waste water flowing through the streets, poor cleaning of the roads, and garbagestrewn in heaps add further to the agony of the neighbours. The use of such squattersas 'vote banks' and safe pockets' to procure funds from donor agencies under theEIUS scheme further aggravates frustration among the residents of neighbouringplanned localities. In this process, not only the physical environment but also the socialenvironment faces tension and degradation.
No doubt, the poor areas and the poor people need subsidies for survival inmetropolitan cities. However, where both 'donor' and the target-group* take undue
346

advantage of the subsidies being made available in the name of the urban poor, therearises a need to recast the strategies of development.
References
Delhi Development Authority. 1991a. Demographic Soci-economic Profile of Jhuggiedwellers Based on the Findings of a Survey Conducted in 1989 of 457 Jhuggieclusters in West of River Yamuna Area. A Report.
Delhi Development Authority. 1991b. List of identified Jhuggies Clusters in Delhi. SlumWing, Delhi Development Authority.
Govt. of India. 1983. Shelter for the Urban Poor and Slum Improvement IV. PlanningCommission, Govt. of India.
Govt. of India. 1985. A Compendium on Indian Slums. Town and Country PlanningOrganisation, Ministry of Works and Housing, Govt. of India.
Mishra, G.K. and R. Gupta. 1981. Resettlement Policies in Delhi. Institute of PublicAdministration, New Delhi.
Nangia, S. 1987. Socio-Cultural Features and Traditional Values in the Low IncomeUrban Communities in Asia and the Pacific. Proceedings of the 2nd Congress ofLocal Authorities for Development of Human Settlements in Asia and Pacific, 21 -27 July 1987, Nagoya, Japan.
Nangia, S. 1988. Slums of urban India. In A.K. Dutt, LJ.C. Ma and A. G. Noble, eds.Asian Urbanisation : Problems and Processes, Berlin: Gebruder Bomtraeger, 131-42.
Seshan, K. 1983. A Geographical Appraisal of the Impact of Resettlement on theSquatters in Delhi. Ph.D. Thesis, Jawaharlal Nehru University, New Delhi, India.
Singh, A.M. and A. de Souza. 1980. The Urban Poor: Slum and Pavement Dwellers inthe Major Cities of India. New Delhi: Manohar Publications.
347


CHAPTER 19
HOW MIGRANTS PERCEIVE ENVIRONMENTALCONDITIONS: A CASE STUDY IN JAKARTA, BOGOR,
TANGERANG AND BEKASI, INDONESIA1
byM. Djuhari Wirakartakusumah
(Demographic Institute, Faculty of Economics, University of Indonesia, Jakarta,Indonesia)
1.Industrialization and Rural-Urban Migration
As a developing country, Indonesia is engaged vigorously in nation-building activities.Since 1969/1970, the nation implemented five-year development programs. It is in thebeginning of the sixth Five-year Plan (1994-1999). Programs and projects undertakenduring the preceding 25 years (the first long-term plan) produced records of progress.The nation's per capita income rose. Its economic structure shifted from one heavilybased on agriculture to one characterized by industries.
Indonesia achieved not only advancements but also encountered a number ofchallenges. The latter include inequalities and discrepancies in regional development.A striking discrepancy occurs between rural and urban growths. Industrialization,concentrated in the urban areas, attracted migration of people from the villages to thecities.
Developing countries frequently apply the macro approach (known sometimes as theChenery-Syrquin approach) when dealing with issues on national developmentprograms and projects. Generally, developing countries follow a pattern ofdevelopment which shows that at a certain point a developing country enters a processof industrialization.
Indonesia is not excluded from the phenomenon. Since 1991, statistics on nationalincome, based on prevailing or constant prices, showed that contributions by themanufacturing sector to the country's gross national product exceeded contributions bythe agricultural sector. Since 1990, prevailing prices showed that the manufacturingcontributed in excess of 20 per cent to the gross national product. This means thatIndonesia can be classified as semi-industrialized country.
Concurrent with the process of industrialization, there occur changes in the nation'spopulation structure and shifts in population growth, fertility, infant mortality andmigration. There is a close relationship between industrialization in urban areas and themigration of people from rural regions to urban neighborhoods. Limited employmentopportunities and low incomes in rural regions prompted young people from thevillages to migrate to centers of industry in urban areas. Large-scale industrialization inurban areas drew people from the villages and created the flow of people from the
349

villages to the cities generating high demands for social and health facilities. However,migration occurs faster than the delivery of such facilities. It takes time to providesocial and health facilities and the costs incurred are substantial. Consequently, slumsareas sprout up in neighborhoods where the migrants live. The slums are the bestalternative for migrants who, due to their incomes, cannot afford to live elsewhere2-Such environments are assumed to affect their health.
Conditions such as the aforementioned are readily seen in areas where industrieslocate, especially in the Jakarta, Bogor, Tangerang and Bekasi areas, hereinafterreferred to as JABOTABEK. This region, where large industries concentrate, is highlyattractive to migrants. This paper proposes to review conditions in this area andpresent the migrants' perceptions of environmental conditions in JABOTABEK.
2. Greater Jakarta, an Industrial Region and a Destination Point forMigrants
Jakarta, the capital of Indonesia, is the center of economic and trade activities, thecenter of government and the concentration point for industries. A large number ofmigrants from rural regions descend on this metropolitan area. They come from all overIndonesia. The in-flow of migrants and high fertility among city dwellers generated ahigh population growth in JABOTABEK.
Between 1980 and 1990, Jakarta experienced a slight decline, about 2.41 per cent, inpopulation growth. During the same period, its population increased from 6.5 million in1980 to 8.2 million ten years later (Central Bureau of Statistics, 1991). It is projectedthat in the year 2005, the capital city will be inhabited by 11.3 million people(Demographic Institute, Faculty of Economics, University of Indonesia, 1992).
In anticipation of projected population growths, the government of Jakarta has longstrived to discourage people from moving to and resettling in the metropolitan area.Measures for controlling population growths are pursued through, among others, familyplanning. Measures for controlling population distribution called for, among others,opening of residential neighborhoods and creation of jobs in Bogor, Tangerang andBekasi. Presidential Decree No. 13/1976 on Growths in Greater Jakarta paved the wayfor the opening of residential areas and creation of jobs in the fringe areas of the capitalcity, seeking to reduce population pressure on Jakarta. The residential areas in Bogor,Tangerang and Bekasi encouraged people to relocate from the capital city to thosesuburbs. Available data show that migration from Jakarta to the adjoining municipalitiesexceeds the in-flow of people to the capital city. West Java absorbs most of themigration; it accommodated 538,381 new settlers in Bogor, Tangerang and Bekasi atthe time of the 1990 population census.
The foregoing showed that although migration to Greater Jakarta remains substantial,its impacts on the capital city have declined. On the other hand, migration from Jakartato the suburban areas appears to increase (See Table 1). The 1990 population censusunveiled that 38.5 per cent of Jakarta's inhabitants are life-time migrants, a declinefrom the 40.1 per cent recorded in 1980. Table 1 also shows significant increases inthe percentage of migration from Jakarta to the neighbouring areas. In 1980, migrationfrom the capital city was 6.2 per cent; it rose sharply to 12.8 per cent ten years later.
350

The increased migration from Jakarta occurred concurrent with the rising inflows ofpeople to West Java, from 3.7 per cent in 1980 to 6.8 per cent a decade later. Theforegoing can be interpreted to mean that people who moved out of the capital citygenerally headed for West Java, specifically to settlements in Bogor, Tangerang andBekasi.
Presumably, the sizeable relocation of Jakarta residents to Bogor, Tangerang andBekasi resulted from the availability of housing obtained through the National HousingAuthority, mortgages secured from Bank Tabungan Negara (State Savings Bank),commercial loans and the ministries which employ the migrants. Available data showthat until the end of 1990, the National Housing Authority built 56,352 housing units inBogor, Tangerang and Bekasi accounting for 69.8 per cent of the houses the Authoritybuilt in West Java.
Houses in the three municipalities are built not only by the National Housing Authorityby also by private residential developers. Available data show that housingconstruction in Bogor, Tangerang and Bekasi increases every year. In 1986, privatedevelopers accounted for 65.69 per cent of the housing construction in the three areas;the percentage rose to 73.5 and 76.1 in 1989 and 1990 respectively.
Population redistribution to Bogor, Tangerang and Bekasi occurs concurrently withconstruction of industries in the three areas. The new industries are built to increaseemployment opportunities for people residing in Jakarta's fringe areas. Thereby,population concentration in the capital city can be reduced.
The sizeable number of people who move out to Bogor, Tangerang and Bekasi isexpected to ease population pressure on the capital city. Densely populatedneighborhoods at centers of activity in the capital city are gradually experiencing reliefafter the departure of their residents to Bogor, Tangerang and Bekasi. Housingconstruction in the three municipalities during the past decade has effectively easedpopulation density in Jakarta Unfortunately, low-income people find it impossible toobtain houses because they cannot afford the increasing amounts of down paymentsand monthly instalments. If this condition persists, then the new houses built in thethree districts will be unable to reduce population density in Jakarta's slumneighborhoods.
A sizeable number of Jakarta residents have resettled in Bogor, Tangerang and Bekasibut continue to commute daily to their jobs in the capital city, and also to pursueeducation and attend to other personal business. A survey undertaken by the JakartaStatistics Bureau revealed that most of the commuters descend on Jakarta dailybecause of their jobs. Of the 2,500 households surveyed, 54 per cent worked inJakarta. Of the respondents in Bekasi, 60 per cent worked in Jakarta and only 38 percent maintained jobs in the district domicile. Therefore, only a small portion of Bekasiresidents worked close to their homes. The same occurred in Tangerang where only 43per cent of the respondents worked in the district while 55 per cent worked in thecapital city.
A sizeable number of people from Bogor, Tangerang and Bekasi attend schools inJakarta. Approximately 46 per cent of the residents under 10 years of age commute totheir schools in Jakarta Of the Bogor respondents, only 47.5 per cent attend localschools while 52 per cent commute to Jakarta The larger percentage is presumed tohave been caused by the large number of people who live in the districts of Bogor
351

Regency, such as Depok, Cisalak and Cimanggis which are closer to schools in thecapital city.
The above data endorse the prevailing opinion that population migration from Jakartato the suburban regions is not accompanied by sufficient relocation of jobs, schools,health services, recreation and other facilities. Those who moved out to the suburbscontinue to patronize facilities provided by the metropolitan city. Consequently, thosewho work and attend schools in Jakarta commute daily from Bogor, Tangerang andBekasi.
Table 1. Lifetime Migration (in and out) as Percentage of the Total Population ofeach Province in Indonesia, in 1971,1980, and 1990
PROVINCE
D. I. AcehNorth SumatraWest SumatraRiauJambiSouth SumatraBengkuluLampungDKI JakartaWest JavaCentral JavaD.I. YogyakartaEast JavaBaliWest NusaTenggaraEast Nusa TenggaraEast - TimorWest KalimantanCentral KalimantanSouth KalimantanEast KalimantanNorth SulawesiCentral SulawesiSouth SulawesiSouth-EastSulawesiMalukuIrian JayaAbroadNot-KnownTOTAL
IN-MIGRAT1ON
19713.088.273.18
13.2315.919.717.01
36.1540.07
1.771.194.071.171.071.55
0.57-
1.217.163.965.582.935.621.383.64
4.0022.50
--
4.94
19805.606.843.95
16.4620.6613.3515.9938.7840.11
3.661.386.561.602.642.06
1.56-
4.5214.917.05
24.454.32
14.561.96
11.26
9.248.68
--
6.97
19905.704.485.45
21.0223.4614.8421.3428.7738.53
6.811.819.151.774.142.06
1.476.256.19
17.2810.5832.24
3.6016.883.23
17.61
10.0816.13
--
8.25
OUT-MIGRATION
19713.282.84
11.642.542.735.794.771.072.915.528.22
10.732.942.690.58
1.14-
1.741.644.963.243.543.754.674.31
3.364.28
--
4.94
19804.445.00
16.414.003.267.205.081.256.185.42
12.729.225.484.771.63
1.74-
2.912.638.222.805.732.648.449.55
4.601.40
_-
6.97
19903.687.51
16.073.893.837.033.962.79
12.794.95
15.8717.457.637.982.87
3.041.713.623.427.783.396.202.849.207.98
5.151.89
-
8.25
TOTAL POPULATION
19712.008,3416,620,8112,792.2211,641,0741,005,6583,438,061
519,3162,775,6954,546,492
21,620,95021,865,2632,488,544
25.508.3872,120.0912,203,435
2.295,279-
2.019,924701,936
1,699,105731.606
1,717,671913.662
5,179,911714,120
1,089.511150,786
--
118,367.850
19802,610,5288,350,9503,406,1322,163,8961,444,4764,627,719
767,9884,624,2386,480,654
27,449,84025.367,344
2,750,12829,169.004
2.469.7242,723.678
2736,988-
2,484,891954,176
2,063.2271.214.6022.114,8221.284,5286,059,564
941,634
1.408,4511.107.291
--
146,776.473
19903.415,674
10,252,3113,998,7643,278,8072,018,4636,311,9581 178,9516,015,8038,227,746
35,381,68228,515,737
2,912.61132,487,744
2.777,3563,368,699
3,267,919747,557
3,228.0731,396,0132,596,6471.875.0322,477,1891,703.3306,980,5891,349,298
1,852,7231.630.107
--
179,247.783
Sources: Indonesia. CBS.. 1975. Population of Indonesia, Result of The Census 1971. Serie D, Table 23Indonesia, CBS., 1983. Population of Indonesia, Result of The Census 1980, Serie S No. 2,
Table 06.3Indonesia, CBS., 1992. Population of Indonesia, Result of The Census 1990, Serie S No. 2,
Table 08.9
352

The high population mobility in Greater Jakarta has environmental impacts unique tothe region. While population pressure shifts from Jakarta to the suburbs, patronage ofpublic facilities in the capital city remains as high as ever creating congestions onroads which connect Jakarta to Bogor, Tangerang and Bekasi. A study undertaken bythe Demographic Institute showed that traffic congestion was the main problemencountered by 86.8 per cent of its 682 respondents. Of the commuters from Depokand Bekasi, 91.9 per cent and 91.5 per cent respectively complained about trafficcongestions.
The high population mobility and the sizeable number of migrants to Jakarta createdserious impacts on the area's environment. It is therefore necessary to know theattitudes and behaviors of the migrants towards the environment in Jakarta and whypeople migrate from Jakarta.
3. Why People Migrate
The reasons why people relocated to Bogor, Tangerang and Bekasi from Jakarta differfrom the reasons why people migrated to the three areas from other regions of thecountry. Generally, former residents of Jakarta resettled in Bogor, Tangerang andBekasi because they found suitable houses. People from other regions of the countrymigrated to the three districts because of employment.
Two studies conducted by the Demographic Institute showed that 56 per cent of the400 respondent heads of households decided to move to either Bogor, Tangerang orBekasi after obtaining mortgages from the State Savings Bank. This means that rapidgrowths in housing at affordable prices provided the pull factors for relocation fromJakarta to Bogor, Tangerang and Bekasi. The push factors varied and ranged fromrespondents' efforts at escaping from environmental interferences (7.5 per cent), highcosts of living in Jakarta (7.8 per cent), high costs of real estate in Jakarta (9.7 percent) and so forth. It is interesting to note that only 3 per cent of the respondentsrelocated because they wanted to be close to their jobs.
The above findings lead us to suspect that the newly-developed industrial centers inBogor, Tangerang and Bekasi do not provide the pull factors for people to move out ofJakarta and live in the three districts. They merely delay migration from other regions ofthe country to the capital city.
The industrial centers in Bogor, Tangerang and Bekasi attract the flows of migrationwhich originally headed for the capital city. Another study by the Demographic Instituteshowed that 66 per cent of the 277 respondent migrants from areas other than GreaterJakarta (based on lifetime migration) said they migrated to this area for reasons ofemployment. Available data showed that employment was the main reason whymigrants left their home towns in other parts of the country and settled in Bogor,Tangerang and Bekasi. The above findings endorsed the prevailing assumption thatindustrialization in Bogor, Tangerang and Bekasi provides the incentives for people torelocate to and work in the three districts. Wages in these industrial zones are higherthan wages in rural farms and therefore encouraged the rural-to-urban migration. Therespondents earned an average monthly salary of Rp. 163,000 from the mainoccupations. Those with side jobs earned up to an average of Rp. 249,000 a month.
353

The preceding descriptions revealed that housing and industries in Bogor, Tangerangand Bekasi attracted people to migrate to these areas from other regions of thecountry. Housing construction in Bogor, Tangerang and Bekasi also attracted peoplefrom the capital city. Meanwhile, industries in Bogor, Tangerang and Bekasi drew asizeable number of migrants not only from the other regions of the country but alsofrom metropolitan Jakarta. In the long run, these migrants apply pressure on theenvironments of the three districts.
4. Environmental and Residential Conditions
Employment is a major reason for people to migrate from the various regions of thecountry to Bogor, Tangerang and Bekasi. People migrated either because they wereunable to find jobs in the villages or because jobs in urban areas were better than jobsin rural regions. Their successes in finding employment, however, did not necessarilyensure that they could live in decent houses and in good neighborhoods. For reasonsof efficiency and economy, they were willing to live in relatively run-downneighborhoods as long as they could be close to their places of work. This isunderstandable; housing in urban neighborhoods is expensive and is inaccessible tothose in the low-income group.
Descriptions of the environment in which respondents resided are based onobservations of neighborhoods near and around industrial centers. The recent migrantsgenerally rent or share leases on houses or rooms in neighborhoods near their placesof employment. Only a few of them owned homes. The study revealed that 67 per centof the respondents rented houses or rooms and only 32 per cent owned homes. Therentals or leases were adjusted to their incomes; the average monthly rental was Rp.39,300.
Of the respondents, 88 per cent drew their drinking water from wells. Similarly, waterfor bathing and laundry was drawn from the same well. Generally, respondenthouseholds drew water from the same well to meet their needs for drinking, bathing,household cleansing and other purposes. Most of the respondents shared commonfacilities for bathing and washing their clothes. Only 39.4 per cent of the respondenthouseholds had private bathrooms and laundry facilities.
Few of the drains or sewers which carried domestic waste water were in goodcondition. The study uncovered that 39.4 per cent of the drains or sewers were cloggedand 12 per cent of the respondent households had no sewers to which they could draintheir domestic wastewater. Most of the respondent households buried or burned theirdomestic solid waste or trash. Only 10 per cent had trash pickups and 8 per centdisposed their trash in nearby canals or sewers. Respondents complained that thesemethods of disposing domestic wastewater and solid wastes created pollution of theirneighborhoods. The situation was aggravated by the close proximités of their housesto factories. Of the 99 respondent households, 76 per cent complained theirneighborhoods were polluted while 24 per cent said their neighborhoods were free ofpollution. A sizeable number of the respondents complained of environmental pollutiongenerated by smoke, noises from factory machinery and motor vehicles as well asunpleasant odours.
354

The migrants therefore generally lived in neighborhoods with adverse physical andenvironmental conditions, attributable to the spaces in which they lived, the sources ofwater, disposal of domestic wastewater and other interferences from the surroundingenvirons.
5. How Migrants Perceived their Environment
It is important to know how people perceive their environment and environmentalissues. This is especially true in a metropolitan area such as Jakarta. The city isinhabited by people from all parts of the country who live in all social strata. Some ofthe behavioral attitudes they brought from their home regions may not necessarily begood for and acceptable in Jakarta.
Descriptions on migrants' perceptions are based on findings of a study by theDemographic Institute on 682 commuters who lived in Bogor, Tangerang and Bekasi.They were asked about the various environmental occurrences in their neighborhoods.There is a sizeable number of migrants who live in Bogor, Tangerang and Bekasi andtheir mobility is sufficiently high. Were there any relationships between the migrants'attitudes and behaviors toward the environment and the environmental conditions oftheir neighborhoods? What were their attitudes toward environmental matters andbehaviors in their environment?
Respondents' knowledge of environmental issues undoubtedly have a bearing on theformation of their attitudes toward the environment. Respondents who areknowledgeable about and adopt positive attitudes toward the environment arepresumed to adopt a more favorable attitude toward environmental matters. Knowledgeof environmental affairs is obtained from varied sources such as schools, the massmedia, books and so forth.
This study presents some of the sources where respondents obtained information onthe environment. Most of the respondents, 94.7 per cent, knew about environmentalissues from the mass media; 64.1 per cent learned from household members while57.6 per cent were informed by friends or relatives. The preceding findings can beinterpreted to mean that the mass media assume a significant role in formingrespondents' awareness of and attitudes towards the environment. It was encouragingto note that respondents' household members were placed second on the roster ofsources of information on environmental issues and therefore, significantly instrumentalin forming respondents' attitudes towards the environment.
Respondents' attitudes were also moulded by environmental facts or incidents whichthey saw or experienced. Respondents who knew or witnessed many negativeenvironmental occurrences were moulded accordingly on their attitudes toward theenvironment. However, this study showed that respondents had positive attitudestowards the environment. Of the respondents, 95 per cent said the many negativeenvironmental incidents they heard or saw in Jakarta had adverse effects on themetropolitan area None of the respondents favored indiscriminate disposal of solidwastes. However, some of them, 0.4 per cent, stated that indiscriminate disposal oftrash was "reasonable". Those who maintained this attitude resided in neighborhoodswithout trash bins or in areas without trash collections. In these neighborhoods, each
355

household disposed its trash in its own convenient way, either by burying or burningthem.
Of the respondents, only 2.5 per cent said that smoking in public places or publictransportation was "reasonable" and 2.1 per cent said it was good. These respondentssaid that smoking in such places helped reduce smokers' restlessness during theirjourneys. In contrast 95.4 per cent of the respondents were against smoking in publicplaces or buses. Those who said so maintained that the smoke from the cigarettes wasdetrimental to people around the smokers. Furthermore, they claimed, an undueamount of smoke from cigarettes might interfere with the operator's capacity to drivehis vehicle.
A sizeable number of residents remain unaware of the dangers created by motoristswho drive with excessive speeds, create undue noises and exhausts from theirvehicles. The foregoing surfaced from respondents who said that speeding was "good".Their percentage, however, was only 2.9. The other respondents, 97.2 percent, saidthat speeding was "bad".
Respondents were asked to comment on the various infringements on theenvironment. They agreed that sanctions should be imposed on those who violatedenvironmental laws and regulations. The number who maintained this position wassizeable. Although 95.4 per cent of respondents disapproved of smoking in publicplaces, only 63.3 per cent of this group agreed to impositions of sanctions againstthose who smoked in public places. These findings showed that efforts at establishinga sound environment, including campaigns against smoking, should be pursuedthrough punitive measures rather than mere appeals against smoking. Thus, thoughtshould be given to the types of sanctions to be imposed on the various types ofinfringements against the environment.
This study also uncovered the various forms of sanctions respondents recommendedagainst violations of environmental laws. Respondents were against prison terms. Onlya small percentage of the respondents favored such punitive actions. Manyrespondents suggested prison terms only for those found guilty of speeding and thosefound guilty of relieving themselves at inappropriate places. Respondentsrecommended a number of punishments for those found guilty of smoking in publicplaces and for indiscriminate disposal of solid wastes. They ranged from a merewarning to physical punishments such as sit-ups, push-ups and so forth. Most of therespondents recommended fines for those found guilty of violating environmental laws.This can be interpreted to mean that respondents favored levies of environmentaltaxes, particularly against those who committed major crimes against the environment.
This study also revealed respondents' willingness and refusal to take part inenvironmental management programs. Most of them preferred to take part inenvironmental programs on their neighborhoods rather than in public places orfacilities. There were respondents who flatly refused to become involved inenvironmental programs on public facilities. Respondents recommended various formsof involvement in environmental management programs. There were those who wantedto contribute financially and those who agreed to contribute their time and labor. Therewere also those who wanted to contribute their money and energy.
Generally therefore the people are truly willing to help out if they are recruited to takepart in environmental management programs. Thus, the question is not one of an
356

agreement or a disagreement but rather on how they are approached and asked totake part and create a positive behavior toward the environment.
The preceding descriptions on respondents' perceptions of the environment indicatedthe people's intense desire to create a clean and compatible environment. Migrantslived in slum areas because of their economic and other structural conditions ratherthan because they had no cultural appreciation and awareness of a good environment.Their socio-economic conditions forced them to live in slum neighborhoods.
6. Policy Implications
Traffic congestions in Greater Jakarta are serious problems faced daily by the people.The available means of public transportation are inadequate to move people inside andoutside Jakarta. Motor vehicles which are stuck in traffic congestions created airpollution through excessive exhausts of carbon dioxide (CO2). Traffic congestions arestrenuous on people in transit; fatigue and weariness strike those who travel frequentlyin the city.
Therefore, it is necessary to create options on urban transportation in Jakarta. To date,most of the people travel by bus, taxi and the like; few of them ride the train. A studyconducted by the Demographic Institute showed that only 8.4 per cent travelled bytrain to their jobs in the city. The low percentage of commuters by train indicated thatthe railways remain unable to facilitate travel in Greater Jakarta. Transportation inGreater Jakarta demands immediate overhauls to reduce commuter traffic on theenvironment.
Workers in industrial centers remain without adequate housing amenities. This alsorequires serious attention. The workers earn low wages; consequently, they are onlyable to live in cheap houses in slum areas. Their neighborhoods are densely populatedand their homes stand too close to one another. These conditions frequently affecttheir health. Overcrowding in these neighborhoods makes the environs moreunfavorable.
Consequently, it is necessary to build houses close to industrial centers. In otherwords, plans for industrial centers must incorporate plans for employee housing.Unless the two are integrated, the sizeable numbers of workers will interfere withenvironmental conditions in neighborhoods adjoining the industrial centers.
Attention is also focused on efforts at enhancing public awareness of the environment.Generally, people are sufficiently aware of conditions in their neighborhoods. However,such an awareness is confined to individual homeowners. Public awareness of thegeneral environment needs to be upgraded. Efforts at increasing environmentalawareness should be carried out intensively through relevant campaigns. Thereby, thepeople are truly involved in voluntary campaigns on environmental preservation inGreater Jakarta.
357

Footnotes
1This paper consolidates the findings of two studies undertaken by the DemographicInstitute, Faculty of Economics, University of Indonesia. The first study focused onindustrialization, urbanization and their impacts on the health of people in urbanneighborhoods. The second study deals with the attitudes and behaviors of people inthe Bogor, Tangerang and Bekasi suburbs towards the living environment inmetropolitan Jakarta, the capital of Indonesia. Data from the two studies are excerptedto strengthen this paper. Since this paper discusses cases, therefore, its descriptionsand conclusions cannot be generally applied to reflect conditions throughout Indonesia
^ a g e s in developing countries are generally low and provide a comparativeadvantage to efforts at attracting industries from developed countries. Studies on thewage profiles of factory workers in Indonesia show that the minimum wages prescribedfor workers remain low and are unable to meet the minimum requirements of theirphysical needs.
358

PART IV
SOME POPULATION-ENVIRONMENT-DEVELOPMENTPROBLEMS


CHAPTER 20
RURAL POPULATION SETTLEMENTSAND THE ENVIRONMENT IN CENTRAL SUDAN
Hassan Musa Yousif(IIASA, Laxenburg, Austria)
Central Sudan exhibits an unusual heterogeneity of rural population settlements. Theyreflect a complex of economic, tribal, religious and political factors. This chapterexamines population settlement patterns and their relationship to the environment ofcentral Sudan. It highlights land, water and biomass fuels (wood, charcoal, agriculturalresidues and animal waste) as major factors in population settlement patterns andenvironment interaction. Section 1 of the chapter gives a brief description of theenvironment of central Sudan. Section 2 focuses on population dynamics andsettlements. It starts with a brief account of population dynamics of central Sudan andconsiders the adaptation of nomadic tribes to the environment. Subsequently thesection discusses new patterns of rural population settlements that have emerged as aresult of agricultural development; particularly population settlements in villages andsmall urban centers in the irrigated and mechanized rainfed agricultural schemes.Section 3 presents the role of the government, and section 4 highlights the role ofagricultural development policies in social change. In section 5 the chapter focusses onbiomass fuel resources and consumption by various population settlements. Thechapter concludes in section 6 where final remarks are discussed.
1. Environment of Central Sudan
Central Sudan lies immediately to the south of Khartoum and is dominated by what iscurrently known as the central state (Fig. 1). This area constitutes about 9 per cent ofthe total land area of the Sudan (Table 1). It is naturally divided to three major sections:
(a) Al-Gezira which lies to the south of Khartoum between the Blue Nile and theWhite Nile rivers. The eastern side of the Blue Nile river often is added to themain Gezira land to constitute one administrative unit.
(b) The White Nile which lies to the west of Al-Gezira and is physically dominated bythe White Nile river. The northern part of this section is dry with very little rainfall.Agricultural pump schemes are located on both banks of the river.
(c) The Blue Nile which lies to the south of Al-Gezira and extends to theinternational borders with Eritrea and Ethiopia. Rainfall (500mm to 1000mm) isconsiderably higher in this section, allowing for more pasture for animals andrainfed cultivation.
361

500 U . A . R .-" ' ( E g y p t )
CENTRALAFRICAN /
REPUBLICS
Deseri
Semi - desert
Low woodlandsavanna
Swamp grassland '
High woodlandsavanna
Tropical rain forest
C O N G
R E P U B L I C K E N Y AN
Fig. 1. Main ecological zones and average rainfall in Sudan.
362

Table 1. Environment of Central Sudan
Variable
Area
Rainfall
Soil
Sources of Water
Population
Economy
Energy
Description
139017km2 extending between latitudes 9.30 and 15.30 andlongitudes 31.50 and 35.30. This area is divided into threemajor sections (1) Al-Gezira, (2) White Nile and (3) Blue Nile
Ranges from 300 mm in the north to 1000mm ¡n the south (July-October). High seasonally and low degree of reliability insustaining natural and cultivated plants
Very heavy dark cracking clay. Flat plain sloping very gently tothe west and north.
Rivers: Blue Nile and White Nile rivers. Seasonal tributaries:Rahad and Dindir Hafirs and boreholes.
5.5 million persons in 1993.73 per cent rural settled,21 per cent urban and6 per cent NomadicPopulation density 38.9 per m2
Three farming systems:1. Irrigated farming,2. Mechanized rainfed farming3. Traditional farming including livestock raising.Several industrial plants (sugar, textile, oil seeds and food
industries).
Central Sudan is the major producer of energy in the country inthe form of hydroelectric power and biomass fuels.
1.1 Land
The most striking features of land in central Sudan are its high fertility, flatness andgentle slope to the west and north. The soil consists of heavy dark clay. There isuniformity in the type and quality of land and hence of crops produced: cotton, wheat,sorghum (dura), seasame, groundnut and vegetables. With unreliable rainfall innorthern Gezira and the White Nile, pasture and rainfed cultivation are very limited. Bycontrast, the amount of rainfall in the Blue Nile permits land use for rainfed cultivationand grazing. The natural vegetation consists of stands of Sunt (Acacia arabica) in thesavannah woodland belt. To the north of this belt shrubs and thorn trees are scattered.Vegetation becomes very scarce as you move north close to Khartoum.
363

1.2 Water
Use of land for cultivation and pasture is conditioned by availability of water. Beforeinception of the irrigated agriculture schemes, wells and surface water tanks werepopular. Wells reach water some 100 feet below the surface and were, therefore, oflimited use for irrigation. Surface tanks, on the other hand, were too few and were usedfor drinking water and not for irrigation (Barbour, 1961).
The gentle slope of land to the north permitted gravity irrigation. This started withconstruction of Sennar dam and establishment of Al-Gezira scheme in 1925.Subsequently, Jabal al Awlia dam was constructed in 1937 to store water andguarantee its permanent flow for agriculture in Egypt and AI Roseries dam in 1966,allowing for excavation of hundreds of miles of irrigation canals extending on bothsides of rivers. These canals are now an important source of water for cultivation(Table 2) and for domestic use by rural inhabitants but it has also been argued thatthey created habitats for snail breeding that helped in the spread of water associateddiseases such as malaria, bilharzia and schistosomiasis (Shaaeldin, 1980). Moreover,the Rural Water Development Corporation excavated hafirs (surface water reservoirs)and boreholes for use by nomadic tribes and rural sedentary population.
Table 2. Irrigated Schemes in Central Sudan
Scheme
Al-Gezira
Al-Rahad
Blue Nile Pump Schemes
White Nile Pump Schemes
Al-Suki
Kenana
Assalaya
Al-Gunied
Sennar West
Abu Na'ama
Total
Area (thousand feddams)
2000
300
616
620
85
80
37
80
32
30
3880
(1 feddan= 1.038 acres)
Source: Ministry of Agriculture, 1990.
364

2. Population Dynamics and Settlements
2.1 Population Dynamics
Data on population dynamics indicate that the size of the population of central Sudanhas increased from 2.1 million persons in 1956 to 5.5 in 1993, more than doubling inabout 37 years. This implies a rapid growth rate of about 2.6 per cent per year. The1956 urban population has grown five times by 1993, as compared to only two timesfor both of the rural and nomadic populations.
In view of these high rates of growth the population is undoubtedly young. A significantproportion (45 per cent) of the population is under 15 years of age, and less than 5 percent are 65 years and above. Also, 44 per cent of all women are in the reproductiveage span 15 to 49. This imply a high potential for reproduction. Those who are in theworking age group 15 to 64 constitute 53 per cent of the population; not all of themeconomically productive. The dependency burden is exceptionally high at a rate of 97per cent.
Nuptiality and fertility are the most important pillars of the reproductive system andfamily formation. Marriage in the Sudan has traditionally served to further childbearingand strengthening of women's reproductive status. Infertility and out-of-wedlock birthsare considered socially unacceptable. Fertility in central Sudan is high: the crude birthrate is 45, the total fertility rate is 6.7 and the general fertility rate is 198.
A study by Henin (1968) unravelled enormous fertility differences between ruralpopulation groups:
1. A well known group of people settled in Al-Gezira scheme had a total fertility rateof about 8.2.
2. Two partly settled populations in Al-Managil and Al-Mujlad had total fertility ratesof about 6.7 and 4.6 respectively.
3. Two population groups practising nomadism (Blue Nile nomads and the Baggara)had identical rates of 3.6.
Henin (1968) attributes these differences to four factors: (1) childlessness is higheramong the nomads compared to the settled population; (2) the mean age at firstmarriage is different between the three population groups; it is higher for the nomadsas compared to the sedentary population; (3) high marital instability among thenomads; and (4) high incidence of miscarriage among the nomads. More recentfindings from the Sudan Fertility Survey and the Sudan Demographic and HealthSurvey give higher fertility rates for the irrigated schemes where people are settled invillages, as compared to other parts of the Sudan.
2.2 Nomadic Population
Central Sudan is inhabited by groups of well-known nomadic tribes such as theKawahla, Rufaa Al-Hoi, Kenana, Fulani and Hassania. Each tribe and its subgroups isattached to a particular area of land and has the exclusive right to exploit it. Families
365

and kin-groups can claim any piece of land lying within the jurisdiction of its tribe.Therefore, nomadic tribes use land in accordance with their tribal customs or as thetribal authority directs (Ahmed, 1976).
The social structure of nomadic tribes is patrilineal with distinct dominance of males.Males marry within their kinship groups so as to maintain the solidarity of their families.Members of each kinship group work according to traditionally accepted principles ofdivision of labor. The whole sub-tribe shows complete solidarity when a feud breaksout over water and land for grazing and cultivation.
Nomads live in tents easy to dismantle whenever they decide to move. Tent clustersconsist of closely related households. A tent cluster may consist of 10 to 15households, depending on the water and grazing conditions of the area. Tent clustersclose to each other constitute a ferig(f\ve to six clusters of tents). Each nomadic ierigoften is under the leadership of one sheikh.
The central area of Sudan provides a wide variety of pastures that nomads1 animalsneed. Camels exist entirely on shrubs and trees. Cattle and sheep live on grasses,seed pods and shrubs. Nomads practise various grazing techniques. For example,Rufaa Al-Hoi and Kenana tribes practise light grazing (while on the move), and theFulani pastoralist practise razor grazing (leaving no grass behind) (Ahmed, 1976).
Nomads in Sudan usually move in the north-south directions. The northwardmovement, which often commences with the rain, is a long distance migration. Thesouthward movement is a short distance migration. Usually they move in family units.In the wet season animals and families move within a close distance to each other. Inthe dry season the two are usually separated by a long distance.
2.3 Rural Settled Population
Irrigated and mechanized rainfed agriculture projects are a prominent feature ofdevelopment plans laid out for the Sudan by various governments. The main aims ofthese projects are:
a. To utilize the vast expanse of land in central Sudan by introducing modemmethods of irrigation and improving farming principles and by using tractorswhere cultivation is based on rainfall.
b. To induce rural people to settle in permanent villages where they can receivesocial services and can easily be integrated in the development process.
The great majority of the irrigated schemes are located in the central state. An area ofapproximately 3.9 million feddans is under irrigation by canals stretching from damsand large pump machines located on the Blue Nile and the White Nile rivers (Table 2).This expansive agriculture has brought about a new pattern of population settlementsand distribution in central Sudan. Five major categories of population settlements canbe identified depending on tribal affiliation and a different combination of associatedland and water uses.
366
(a) Nile Villages
The oldest and most well-known population settlements in central Sudan are the largevillages located close to the banks of the Blue Nile and the White Nile rivers. Most ofthem are connected by asphalt and paved roads and railways to towns and cities suchas Khartoum, Wadmedani, Sennar, Kosti and Senga Some of these villages are wellknown religious sites where famous religious leaders and their followers live. Peopleliving in these villages consist of groups of families descending from the same greatgrandfather. Such kinship groups usually consist of about 20 families. Therefore, avillage settlement of 2000 persons will consist of about 100 kinship groups.
(b) Tenant Farmer Village Settlements
These are medium-size villages located 50 to 100km away from the banks of riversand are scattered on the clay plains of the irrigated agriculture schemes. There are, forexample, about 1550 villages in Al-Gezira scheme, 68 villages in Al-Rahad schemeand 80 villages in Al-Suki scheme. Most of the inhabitants of these villages are tenantfarmers and their families. Most of them are Arabs and few are Sudanese westernersand fellata (Sudanese of West African origin, particularly Nigerians). They have accessto water either from a borehole or from im'gation canals. Inhabitants of these villageshave access to education and primary health care services. These villages areconnected to each other and to small urban centers by a network of private ruraltransportation.
(c) Labor Villages and Camps
These are agricultural labor villages and camps established in the irrigated agricultureschemes. They are, therefore, an outcome of the agricultural development activity inthe fertile clay plains of central Sudan. The great majority of these villages areinhabited by a complex of tribes from Western Sudan and fellata. They provide most ofthe labor force needed for work on farms. Also, they sharecrop and rent agriculturalland while few of them operate small farms.
Inhabitants of these villages have no direct access to basic services such as purewater, schools, health facilities and electricity. In recent years these villages played amajor role in absorbing some of the environmentally and war displaced persons fromKordofan and Darfur.
(d) Hafir and Borehole Villages
These are villages established around hafirs and borehole s in the mechanized rainfedagriculture schemes. Excavation of hafirs and boreholes in central Sudan permittedcrop production and establishment of new villages. Inhabitants of these villagespractise rainfed cultivation of sesame and sorghum and they raise cattle and sheep.People and animals in these settlements are both vulnerable to variations in theamount of rainfall. These settlements are, therefore, not very stable in years of lowrainfall.
367

(e) Small Urban Towns
Associated with the transformation of rural economies from nomadism to commercialagricultural production is the emergence of small urban towns in central Sudan. Theseare usually located in the middle of groups of village settlements. Some of these townswere village centers of trade where roads from different directions converge. Some ofthem were places for religious gathering where people meet to express loyalty,admiration and obedience to a religious leader. Others came into existence for the firsttime as a result of agricultural development and establishment of administrativeheadquarters and offices. However, all of them played a major role in social change,distribution of basic goods and forest products (wood and charcoal) and penetration ofurban values. Also, they have played a major role in accommodating refugees andvictims of drought, famine and war.
3. The Role of the Government
Early in this century the British government was concerned with the future of cottontextile industry. Production of raw cotton in the empire was declining; particularly inEgypt and India. Also, the industry was facing competition from Japan, the UnitedStates and China. Concurrently, there was a desire to enable the colonial governmentof Sudan to finance its administration and not to become a burden on the Britishgovernment. On the other hand, research indicated that the fertile clay plains of centralSudan are suitable for growing cotton. These circumstances and several other onesnot mentioned here brought about the establishment of irrigated agricultural schemesin the Sudan.
The first irrigated agriculture project was Al-Gezira scheme which was established in1925. It is the largest project in the Sudan covering an area of about 2 million feddans(1 feddan = 1.038 acres). Following Al-Gezira model several irrigated agricultureprojects were established in Khasm Al-Girba (1964), Al-Suki (1972) and Al-Rahad(1977).
Before the establishment of irrigated agriculture schemes, land in central Sudan wascommunal (MacMichael, 1954; Gaitskell, 1959). The government put all land under itseffective control, then, having divided it into manageable units of uniform size toconform with the needs of systematic irrigation, reallocated it to tenant farmers whopay land and water charges to the government. Later, this arrangement proved to be amajor factor behind the success of the irrigated agriculture schemes (Barnett, 1977).
Tenant farmers have no right over land other than using it. A tenant farmer cannot sellor mortgage land. Also, under no condition should a farm be divided to units smallerthan the standard size set for irrigation management. Moreover, the government havethe right to take the farm whenever a tenant farmer proves unable to cultivate itaccording to a fixed cropping schedule.
These arrangements and regulations neglected population pressure on land whichcame about as a result of labor demand dynamics. Firstly, labor migration to theschemes has been continuing for several decades; labor migration to the Al-Gezirascheme alone is estimated at about half a million persons annually. Secondly, fertility
368

in these schemes has been found higher than in any other part of the country. Thesetwo demographic dynamics played a major role in land fragmentation andlandlessness.
Population pressure and inheritance have led to the halving of standard farms. This isparticularly evident in Al-Gezira scheme where about 80 per cent of the farmers areoperating half-size farms. In some instances two families or more operate one farm.Occasionally it is possible to find a household where more than one memberpossesses half a tenancy.
Moreover, in the process of household formation new generations are increasinglybecoming landless. Another factor contributing to the process of landlessness is themovement of families and displaced households for permanent residence in theirrigated schemes. Population pressure is reflected in the expansion of residentialareas in villages and small urban centers at the expense of agricultural land. In recentyears this problem became an issue of major concern to the scheme authorities asmore people are building permanent houses on agricultural land adjacent to villages.
Another aspect of agricultural development is the introduction of mechanized rainfedagriculture in Central Sudan The first mechanized rainfed farms started in 1945 in theGedarif area primarily for the purpose of producing food for army units stationed inEast Africa (ILO, 1976). Mechanized farming developed rapidly after 1953 when thegovernment decided to allot land to private entrepreneurs. Since then the techniquehas been expanded to eastern Sudan, southern Blue Nile and southern Kordofan.Mechanized rainfed land is now estimated to extend to about 8 million feddans.
Mechanized rainfed farming is characterized by large size of farms and use of tractorsfor land cleaning, ploughing and planting. Farmers in their own private farms growsorghum, short stable cotton, sesame and sunflower, mechanized farming is totallydependent on the amount of rainfall, and therefore it is vulnerable to shortage andclimatic risks. For example, its share in total food production had fallen from 41 percent in season 1981/82, which was a good rain season, to 15 per cent in season1984/85, which was a season of low rainfall and drought. By contrast, large-scaleirrigated agriculture contributed 61.7 per cent of local food production in 1984.
4. Marginalization of Nomads
Before establishment of the irrigated and rainfed agriculture schemes the central clayplains of the Sudan were inhabited by nomadic tribes. These tribes adapt to theenvironment by adopting a system of life based on social structure, communal use ofresources and seasonal patterns of migration. With expansion of im'gated andmechanized rainfed agriculture in the fertile clay plains of central Sudan, nomadism asa system of life became very limited. Expansion of agriculture has set physicallimitations to the migration patterns of nomadic tribes. In particular, the long distancemigration has been considerably shortened. As nomads are not allowed to graze theiranimals in cash crop production areas, pasture became very limited too.
Nomadic tribes face immense difficulties in watering their animals. They have lost theirtraditional watering points on river banks to expanding private pump schemes. Also,the hafirs which were established to provide water to nomads, have gradually become
369

surrounded by permanent village settlements in the cultivated ralnfed land, with settlersdenying the nomads the right of using them. Availability of water and land for pasturehave been further limited by climatic variations and changes in the amount of rainfall.Nomads were environmentally squeezed by the severe drought of 1984. They lostmost of their animal wealth, which is their major form of investment.
Historically, the supply of surface water and rainfall permitted crop production in theSudan to win the competition for land use against livestock and forestry. Consequently,nomads were pushed into marginal land that have a limited capacity to support growinglivestock and human beings. For example, a large number of the White Nile Arabnomads and their animals were displaced to dry dune areas west of the river as aresult of the construction of Jabal AI Awlia dam and reservoir on the White Nile andexpansion of commercial irrigated agriculture (Kates and Haarmann 1992).
Also, the Blue Nile nomads who lived on the eastern side of the Blue Nile river andwho were used to crossing the river during the dry season for pasture and water in Al -Gezira are no longer practising their annual migration cycle between the clay plains inAl-Gezira in the winter dry season and the sandy upper land in the summer, whichwas balancing the use of resources. They cannot move to Al-Gezira to compensatefor the dry season decrease in surface water and pasture. Moreover, they have beenpushed further to the east as a result of the establishment of AJ-Rahad scheme in1979 in the eastern side of the river. Therefore, nomads and livestock becameconcentrated on marginal land resulting in overgrazing and immense pressures on theenvironment. Competition over land use is more severe in Western Sudan. Camelherders, mainly of Arab origin, usually migrate rate north towards the Sahara desert inthe rainy season, and south in search of both water and pasture during the dry season.Cattle owners (Baggara) and the traditional farmers are located immediately to thesouth of this zone. Because of low rainfall and expanding traditional farming, pastureland is getting substantially reduced. The movement of camel owners southwardbrought them into more frequent contact with the traditional cultivators and cattleowners. Competition over land use between these population groups in Western Sudanresulted in tribal warfare and social and political unrest.
5 Population Settlements and Biomass Fuels
Urban, rural and nomadic settlements depend substantially on fuelwood, charcoal,agricultural residues and animal waste for cooking, housing, and manure foragricultural production. Therefore, various population settlements and sectors of theeconomy compete for available biomass resources. Analyses in this section are basedentirely on published data obtained from the Ministry of Agriculture, Animal Wealth andNatural Resources and the National Energy Administration in the Central State.
370

5.1 Biomass Fuel Resources
(a) Wood Resources
Wood resources and wood supplies are not identical terms as they may seem to be.Wood resources refer to the standing stock of wood. Wood supplies, on the otherhand, refer to the annual cut of wood. Sustainable wood supplies are those which canbe cut without depleting the initial stock of wood. If the annual cut of wood exceedsannual growth of standing stock then the resource base is being depleted. Thestanding stock of forests, their renewal process, amount and rate of growth ofconsumption all interact to determine the rate of wood resources depletion.
Wood resources in central Sudan, sustainable cut and the amount of licensedproduction are shown in Table 3. The Ministry of Agriculture estimated wood resourcesof central Sudan at about 123 million cubic meters in an area of 3.6 million hectares ofland. These figures give an average wood density of 34 mVhectare. Most of the woodresources are located in the Blue Nile with an average density of 36 mVhectare. Wooddensity in Al-Gezira is 38 mVhectare, suggesting more intensive planting. The WhiteNile has a significantly lower resource base than the other two parts.
Table 3. Wood Resources
Gezira
Blue Nile
White Nile
Total
area (000)
59
3376
238
3673
in Central Sudan
Volume000m3
2226
120773
234
123233
DensitymVhectare
37.7
35.8
0.9
33.5
Sustainablecut 000m3
122
4227
8
4357
Licensedcut 000m3
597
1670
1121
3388
Source: Energy Assessment Report. National Energy Administration, 1987.
(b) Agricultural Residues and Animal Wastes
Unlike wood, agricultural residues are reproduced in a very short period (every 3 to 4months period). The supply of agricultural residues depends on the area cultivated andcrops produced. Cotton, wheat, dura and groundnuts are the four major sources ofagricultural residues in central Sudan. Most of the cotton stalks, wheat stalks andgroundnut shells are produced in the irrigated agriculture schemes in Al-Gezira(Table 4). Dura stalks are primarily produced in the mechanized rainfed farming in theBlue Nile. Traditional agricultural areas located in the White Nile produce fewagricultural residues.
The supply of animal waste, on the other hand, depends on the size and types ofanimal herds and presumably how much they eat. Most of the animal waste isproduced by animals in the White Nile where nomadism is widespread. Some cattleand sheep are raised by the sedentary village cultivators in Al-Gezira and the BlueNile.
371

5.2 Biomass Fuel Consumption
(a) Wood Consumption
Households in central Sudan consume annually an average of 593 thousand metrictons of wood (Table 5). Families of Al-Gezira account for only 5.6 per cent of woodconsumption as compared to the Blue Nile (49.9 per cent) and the White Nile (44.4 percent). The overall average per capita wood consumption is 260 kilos per year.Variations in per capita wood consumption by mode of living are striking (Table 6).
Table 4. Supplies of Agricultural Residues and Animal Waste in Metric Tons (mt)
1. GeziraCottonWheatDuraGroundnut
2. Blue NileCottonDura
3. White NileCottonWheatDuraGroundnut
Total
Agricultural Residues
28025731463858305762897008135945
515679762797
5094000
21936587538830270
20790009000
10153028
Animal Waste
1135422
1333056
2336751
4805229
Source: Energy Assessment Report, National Energy Administration, 1989.
Table 5. Biomass Fuels Consumption by Households in Metric Tons (mt).
Wood%Charcoal%AgriculturalResidues%Animal waste%
Gezira
333355.6
23484248.8
721194
82.9142027
90.4
Blue Nile
29605349.9
12883826.8
104977
12.010065
6.4
White Nile
26355144.4
11773624.4
43565
5.04924
3.1
Total
592939100
481415100
869736
100157016
100
Source: Energy Assessment Report, National Energy Administration, 1989.
372

On a per capita basis, nomadic tribes are the major consumers of wood resources forfuel, fencing, construction of tents etc. Average yearly per capita wood consumption ishighest among the nomadic tribes of the White Nile (413 kilos). By contrast, woodconsumption among the urban inhabitants is low, ranging between 50 kilos for urban
• households in Al-Gezira and 127 kilos for urban households in the Blue Nile.
(b) Charcoal Consumption
Of the 481 thousand tons of annual charcoal consumption in central Sudan, 49 per• cent is consumed in Al-Gezira, 27 per cent in the Blue Nile and 24 per cent in the
White Nile. Settled rural households consume 73 per cent of the charcoal, urbanhouseholds 23 per cent and nomads 4 per cent. The highest per capita charcoalconsumption is 141 kilos for the White Nile urban households and the lowest is 37 kilosfor nomads in the same province. Charcoal consumption is higher among urban thanrural residents; particularly urban residents of the Blue Nile and the White Nile. Thisresult is expected particularly for the wood-rich charcoal production area of the BlueNile. On the other hand, similarity of charcoal consumption between the urban andrural Al-Gezira is not unexpected. Rural settlements in Al-Gezira are highly monetizedbecause of cash crop production in the irrigated schemes. By contrast, ruralhouseholds in the Blue Nile and the White Nile practise subsistence agriculture, and
% therefore tend to rely less on commercial fuels, preferring to gather wood instead.
(c) Wood and Charcoal Consumption By Other Sectors
Households are not the only consumers of wood and charcoal, there are two other0. sectors competing, namely industries and commercial enterprises (Table 7). Industries
consume an average of 202 thousand tons of wood most of it by bakeries (51 per cent)and brick kilns (48 per cent). Commercial establishments consume an average of 22.4thousand tons of charcoal and 2.3 thousand tons of wood a year; almost entirely (99per cent) by the urban-based commercial enterprises. Pastry shops and restaurantsare major consumers of wood accounting for 41 per cent and 35 per cent of total wood
• consumption respectively.
373

Table 6. Per Capita Consumption of Biomass Fuels by Type and Mode of Living(Kilos per year).
UrbanGeziraBlue NileWhite Nile
RuralGeziraBlue NileWhite Nile
NomadicGeziraBlue NileWhite Nile
.Wood
50127122
3292287
279311413
Charcoal
110125141
108114111
997737
Agriculturalresidues
162449
17211262
1423130
Animal waste
234
10
76114
000
Source:Energy Assessment Report, National Energy Administration, 1989.
Table 7. Wood and Charcoal Consumption by Sectors of the Economy.
Households
Industries
Commercial Enterprises
Total
Wood
592939
202036
2395
797370
Charcoal
481415
22476
503891
Industries: bakeries, brick making, workshops and small industriesCommercial Enterprises:lnns, hotels, clubs, restaurants,tea houses, pastry shops etc.Source: Energy Assessment Report, National Energy Administration, 1989.
(d) Consumption of Agricultural Residues and Animal Waste
Agricultural residues and animal waste are a major source of cooking fuel in centralSudan. These two sources together make 48.8 per cent of total biomass fuelconsumption. Agricultural residues are an important source of energy for rural, urbanand nomadic households of Al-Gezira (Table 6). While less in other areas, the use ofagricultural residues, particularly dura stalks, is quite noticeable among the ruralhouseholds of the Blue Nile.
The consumption of agricultural residues and animal waste is far below the averageannual supplies. Only 8.5 per cent of the former and 3.3 per cent of the latter areconsumed by households. These results indicate great potential for expanded use ofthese biomass fuels as substitutes for wood and charcoal. In fact, substitution awayfrom wood and charcoal fuels towards agricultural residues and animal waste hasoccurred in Al-Gezira, where they are free and within easy access to the rural andurban inhabitants. The nomads of Al-Gezira, by contrast, don't have such easy access
374

to residues as they are required by law to keep their animals away from the cropproduction area. Nomads, therefore, operate in the periphery of the irrigated schemeswhere some wood resources are available free.
6. Concluding Remarks
Water and land are the most important natural resources in determining populationdistribution and settlement patterns. In areas where permanent water supplies cannotbe determined, people may occupy the land for a short period of 2 to 3 months to grazetheir animals and cultivate few crops. When the dry season comes they migrate toother sites where water is available. Permanent population settlements such asvillages and small urban centers are located on river banks, near irrigation canals andaround hafirs and deep boreholes.
Rural development policies in Sudan are always in favor of sedentarization because itis believed to provide a better utilization of human resources for development andmodernization. Sedentary life allows for easy integration of people into one nationhood,sedentarized tribes being easy to control through security and administrative services.On the other hand nomadism is considered incompatible with development andmodernization because of difficulties in spreading education, services, political controland justice, as well as nomads having strong tribal loyalties and being consideredwasteful of resources
Various population settlement groups and sectors of the economy compete for theavailable biomass resources. Nomadic tribes are the major consumers of woodresources. On the other hand, agricultural residues are produced in quantities sufficientto satisfy all biomass energy needs. In fact, there is great potential for expanded use ofagricultural waste as a substitute for wood and charcoal.
Analyses of biomass fuel consumption indicate considerable use of wood and charcoalin central Sudan. The average annual licensing of wood cut is approximately 3.4 millionm3 which is equivalent to 578,332 tons of wood fuel plus 183,718 tons of charcoalproduction. Comparing these figures with the overall average annual consumption ofwood and charcoal by all sectors of the economy (households, industries andcommercial enterprises 797370 metric tons of wood fuel and 503891 metric tons ofcharcoal) imply substantial unofficial cut of wood. In fact, consumption of wood andcharcoal exceeds licensed supplies.
Also, the overall wood consumption exceeds the amount of sustainable cut. Assuminga cut rate of 0.035 for the Blue Nile and the White Nile and a rate of 0.055 for A l -Gezira, we can derive the annual amount of sustainable cut (Table 3). This refers tothe supplies of wood which would leave the standing stock unchanged. The overallsustainable cut is estimated to be 4.3 million m3 most of it in the Blue Nile. By contrast,the annual official cut licensed by the authorities is 3.4 million m3. The licensing ofwood cut in Al-Gezira and the White Nile exceeds sustainable cut by 475 thousandand 1113 thousand metric tons respectively (Table 3). Official licensing, therefore,encourages deforestation. Considering unofficial licensing of wood cut and theconsiderable consumption of wood by households, industries and commercialenterprises, the extent of deforestation would appear far greater than implied by officiallicensing alone.
375

References
Ahmed, A.G.M. 1976. Some Aspects of Pastoral Nomadism in the Sudan. Khartoum:Khartoum University Press.
Barnett, T. 1977. The Gezira Scheme, An Illusion of Development. London: FrankCass.
Barbour, K.M. 1961, Population, Land and Water in Central Sudan. In K. M. Barbour,and R.M. eds. Prothero, 1961, Essays on African Population. London. Routledgeand Kegan Paul: 137-156
Bilsborrow, R.E. and F.D. Pamel. 1991. Land use, migration and natural resourcesdeterioration: the experience of Guatemala and the Sudan. Population andDevelopment Review. Supplement to Vol. 16.
Fruzzetti, L 1978. The meaning of development and its implications: the Sudan case.Sudan Journal of Development and Research, 2(2).
Gaitskell, A. 1959. The Gezira Scheme, A Story of Development in the Sudan. London;Faber and Faber.
Henin, R.A., 1968. Fertility differentials in the Sudan. Population Studies, 22(1):147-164.
Hisham, M.A., S. Jan, and N. Anthony. 1991. Whose Trees. People's View of ForestryAid. London: Panos Publications.
ILO. 1976. Growth Employment and Equity. A Comprehensive Strategy for the Sudan.Geneva.
Kates, R.W. and V. Haarmann. 1992. Where the poor live: are the assumptionscorrect? Environment, 34(4) 4-11, 25-28.
MacMichael, H. 1954. The Sudan. London: Earnest Benn Limited.
Maglad, N.A and H.M. Yousif. 1988. Tenant Survey of the Suki AgriculturalCorporation. Final Report.
Shaaeldin, E.F. 1980. Environmental issues in the Periphery with special reference toSudan. Sudan Journal of Development and Research, 4(5) 86-104.
Umbadda, S. 1980. Socio-economic aspects of environment deterioration in northernKordofan (Sudan). Sudan Journal of Development Research, 4 and 5.
376

CHAPTER 21
DOMESTIC WATER SUPPLY TRENDS IN TANZANIA:RURAL AND URBAN CONTRASTS
Basia Zaba and Hilda Kiwasila(Centre for Population Studies, London School of Hygiene & Tropical Medicine, and
Institute for Resource Assessment, University of Dar-es-Salaam)
1. Introduction
This exploratory analysis looks at the relationship between regional population growthand trends in domestic water supply in Tanzania, in the most recent intercensal interval(1978 -88) for which data are available. The census data indicate a substantial declinein the proportion of households obtaining drinking water from piped supplies, as well asa decline in proportions obtaining drinking water from any source internal to thedwelling or compound. By the simple means of comparing the growth in the number ofhouseholds in each region with the changes in the regional number of householdsobtaining drinking water from different sources, we try to establish whether thegovernment's provision of piped water, and individual or community attempts at self-provisioning from the most convenient, internal sources, are keeping pace withpopulation growth at a regional level. Analysis of the correlation between growth ratesshows that in urban areas, rapid population growth itself may be a contributory causeto the decline in the proportion of households obtaining drinking water from the moredesirable sources, but that in rural areas this is not the case.
2. Background
Without water to drink, humans cannot survive longer than a few days, so allpermanent households must have a water supply. In the 1980s campaigns to improvepeople's knowledge about the importance of the quality of this water supply for generalhealth have attempted to reach even the remotest rural dwellers, as part of the UnitedNations Water and Sanitation Decade. Tanzania has participated in this action, witheducational programmes promoting the protection of traditional water supplies, and theuse of "the three pot method" for domestic storage. If such programmes havesucceeded, we would expect to see an improvement in the distribution of drinkingwater sources between the 1978 and 1988 censuses, with a shift away from relianceon the most easily contaminated sources such as ponds and surface flows, to safersources such as wells and piped water filtered and treated with modem chemicals bythe water utility.
Since the formation of the Water Development Department in 1946, the Tanzaniangovernment has embarked on a very ambitious programme of providing piped water, inboth rural and urban areas (Mambali, 1992). Under the first schemes, local authorities
377

were required to contribute to the costs of water development projects, but theirproportionate contributions were decreased in successive policy changes aimed atredressing the balance between the richer urban areas and the rural hinterland, until by1965 the central government was financing all new water investments, and in the1970s even began to pay for operating and maintenance costs, and providing ruralwater services free of charge (Kauzeni, Mujwahuzi & Kiwasila, 1990). The Twenty YearRural Water Supply Programme (1971-90), was formulated on the premise that accessto clean water was a basic human right, and its aim was to extend piped water suppliesto within 400 m of every household by 1991 (Mambali, 1992).
Under this programme, Water Master Plans were commissioned in 15 of the 20 regionsof the Tanzanian mainland, using a series of donor agencies to finance reviews of thedemand levels and supply constraints. These reviews collected data on population,land use, geological and hydrological data at the level of individual villages (Agrar-undHydrotechnik, 1976; DHV, 1971; CBA, 1979; Finnwater, 1977; Cari Bro, 1982; SMEC,1978; Norconsult, 1982; Brokonsult, 1977). The studies produced masses of highquality data, at an extremely fine geographical breakdown - much of it so detailed thatit has never been summarized at the district or regional level. The Regional WaterMaster Plans have formed the basis of donor financed schemes for developingimproved water supplies in many regions.
In 1991, the first comprehensive water sector policy was officially launched by thegovernment, and this embodies the principle of payment for improved water suppliesby all end-users (Mambali, 1992). In fact, those urban residents who benefited from apiped supply into their own home had always paid for the connections to the municipalwater supply on a flat rate basis, but people who used standpipes and hand pumpsconnected to boreholes received their supplies free. Since the introduction of the newpolicy, water meters have begun to be introduced for households connected tomunicipal piped water supplies, substantial increases in the flat charges have beenmade, and kiosks have been constructed round stand pipes in urban areas, to levycharges for the water obtained (Kiwasila, 1994). In rural areas, villages are to be madefinancially responsible for the maintenance of pumps installed in their areas. Villagewater committees have been traditionally responsible for the maintenance of hygienicconditions around communal wells and this will continue to be encouraged. Thereforms enacted by the new policy would not have affected the changes in water useobserved between the 1978 and 1988 censuses.
As a result of government policy and investment, supplemented by foreign aid, theproportion of urban households with a piped drinking water supply, grew from 70 percent at the time of the 1967 census, to 88 per cent in 1978, in spite of a growth in thetotal number of urban households of 188 per cent in the same decade (we cannot usecensus data to estimate changes in rural areas, since water supply data were onlygathered in urban areas in 1967.) The 1978 to 88 decade however, saw a sharpreversal to this favourable trend, as is shown in Table 1.
In both urban and rural areas there has been a decline in the proportion of householdsobtaining drinking water from a piped supply. This is true for all households using pipedwater, and for those with inside and outside piped supplies considered separately. Thisfall was compensated by a rise in the proportion using wells, especially wells outsidethe dwelling or compound. However, in urban areas this percentage decline in pipedwater merely reflects the fact that the total number of households has grown faster
378

than the number with a piped supply, while in rural areas there has been an absolutedecline in the number of households using piped drinking water - from 829,000 in 1978to 644,000 in 1988. The proportion of households benefiting from any kind of drinkingwater supply inside the dwelling or compound has also declined - from 41 to 35percent in rural areas, and from 38 to 34 per cent in urban areas. Again, in the case ofrural areas this represents an absolute decline, though not a very large one - just over3,000 fewer households had an internal water supply in 1988 than in 1978.
Table 1. Percentage of Rural and Urban Households by Water Supply, 1968-1988
Rural Areas
UrbanAreas
Year
1978
1988
1968
1978
1988
Totalhouseholds
2994456
3480233
194591
560337
939405
Internal
piped
11
20
34
27
well
18.9
22.3
n.a.
2.
5.
other
10.1
6.
n.a.
1.
0.
piped
16.1
12.7
48.9
54.1
52.1
External
well
27.5
38.2
n.a.
5.7
11.5
other
15.
14.
n.a.
2
2
householdsize
4.9
5.4
3.5
4.2
4.5
The basic data on changes in drinking water source in each mainland region and forthe whole of Zanzibar are given in the appendix (Table A1). Most regions experiencedsimilar patterns of change to those seen at the national level, with only five regions(Rukwa, Kigoma, Mbeya, Mtwara and Lindi) showing increases in the proportion ofhouseholds using piped water in rural areas, and three (Dodoma, Iringa and Singida)with increased proportions of piped water use in urban areas. In most of these cases,the increased use of piped water is due to a large increase in the use of external standpipes rather than internally supplied piped water.
Various theoretical traditions could be invoked to explain relationships betweendemographic growth and use of resources such as drinking water. The neo-Malthusianschool of thought, most notably represented in the field of water resources byFalkenmark (1994), would predict a worsening of the supply situation in semi-aridareas in the face of rapid population growth. Indeed, Falkenmark (1989) has identifiedTanzania as one of several African countries which will move from a situation ofintermittent water crises to one of chronic water shortage in the 1990s. Falkenmark ischiefly concerned with agricultural rather than domestic use of water, and indeed,domestic use in Africa is estimated to account for only 7 per cent of the total amountavailable in the environment. But one could speculate that increasing abstraction ofwater for agricultural and industrial uses to satisfy the needs of a growing population,would lower water tables and reservoir levels, and thereby have an impact on domesticavailability also. Added to this, we might expect that the provision of adequateinfrastructure for catchment, purification and delivery would be more difficult in the faceof rapid population growth.
379

On the other hand, history offers many examples of technological advances in theprovision of water supplies being spurred by population growth, particularly by theconcentration of population in urban areas, as it is cheaper to provide piped supplies indensely settled areas. Indeed, the very contrast between the relatively favourablewater supply situation in the densely populated urban areas of Tanzania with theposition in the sparsely populated rural areas would tend to back this interpretation.Furthermore, the proportionate changes in piped supplies, and in internal supplies of allkinds, have been worse in the rural areas, which grew by 16 per cent in the intercensaldecade, compared with changes in urban areas which grew by 68 per cent in the sameperiod. So although the better types of water supply may not be keeping pace withpopulation growth - for whatever reason - it might be argued that population growth ¡snot a cause of their relative decline.
The more advanced development of water supplies in urban areas may have beenoriginally spurred by factors other than population growth - e.g. the location of colonialadministrative authorities and the demands of a wealthy urban elite. In rural areas thepresence of foreigners - e.g. plantation owners, missionaries or aid workers - mayalso have influenced the relative pace of development of modern water supplytechnology. The natural location of a reliable, potable and palatable water supply haslong been thought to be an important factor in determining settlement patterns inTanzania (Allan, 1965; Gillman, 1945). Once any kind of improvement to local watersupplies has been made, population may be attracted to the area. It is also possiblethat the secular relationship between population density and convenience of watersupply in any given area is non-linear - that is, population growth could act first toencourage the development of convenient water supplies, but after some criticaldensity is reached further growth may force people to use less desirable options.
The large declines observed in use of piped water in the last intercensal decade, areattributed by local experts to mechanical failures, shortages of expertise in servicingimported machinery and the lack of foreign exchange to purchase spare parts(Mujwahuzi, 1993). If this is the major explanation for all the deterioration in the watersupply situation, we would not necessarily expect to see any correlation betweensupply changes and population growth. The worst affected regions would presumablybe the ones most reliant on foreign technology for domestic water supplies - in allprobability, the very regions which achieved the largest coverage of piped water supplyin the decade of rapid expansion in the 70s. However, if the quality of a regional watersupply was primarily determined by political connections between regional and nationalauthorities, we might expect to see the most favourable changes in areas with goodsupplies over periods of time in which the power relationships remained stable.
This study examines the changes in water supply at the regional level between 1978and 1988, looking at urban-rural differentials, and tries to establish whether theapparent deterioration in household water supplies is associated with rapid populationgrowth and/or previous development of water sources. Regional indicators of rainfall,agricultural potential and socio-economic status are also examined in relation to watersupply distribution and changes.
380

3. Data Sources and Quality
The data used in this study come mainly from the 1978 and 1988 censuses ofTanzania, though some use has been made of other secondary sources, such as thespatial analysis of rainfall and rural economic activity data by Berry (1973). Even withsuch a modest data collection there are problems of compatibility and continuity.Rainfall does not respect administrative boundaries, and may vary widely across aregion - the mean annual rainfall figures obtained by interpolation between isohyetsshould therefore be regarded as crude approximations. There are also somedifferences in detail between census tables published in the two years: in 1988,individuals and households were both classified by source of water, but for 1978 only ahousehold classification is available, and there are minor differences in the provision ofurban/rural breakdowns for some socio-economic variables. The census questions onwater use were identical in both censuses, as were the formal instructions toenumerators embodied in the training materials.
The regional breakdown presented in this analysis generally follows the administrativecategories used by the government statistical bureau, except that Zanzibar is treatedas one analytical unit, whereas for administrative purposes it is divided into 5 regions.The administrative regions of Zanzibar are actually about one-fifth of the size of thesmallest of the 20 mainland regions. The aggregation used here ensures that theanalytical units are of a broadly similar size - between 100 and 300 thousandhouseholds when rural and urban areas are taken together.
The overall quality of the demographic data collected in the 1988 census has beenascertained as quite good (Zaba et al., T991), by means of the usual consistencychecks, and similar quality checks on the 1978 census data were performed by Rafiqet al., (1983). In Tanzanian censuses, the detailed demographic and householdinformation is obtained from a sample of households (about 14 per cent in 1988), otherhouseholds just providing a return of members by sex and age. All the estimatespresented here are therefore subject to sampling error. In 1978, it was believed thatlarge estate households were oversampled in the rural areas of Arusha, Kilimanjaro,Tanga, Morogoro, Coast and Iringa. In so far as such households may have had betterwater supplies than others in rural areas, there is a possibility that the recorded 1978supply situation in these areas may have been favourably biased compared to 1988.
The data on water supply are obtained from the census question which asks about themain source of drinkable water for the household. This is categorized as piped, welland other, each being further divided into inside or outside the dwelling or compound.In urban areas, it is common to find more than one household in a single dwelling,whereas in rural areas, a single household may occupy several huts grouped togetherin a compound.
It is not possible to obtain measures of water quality or of quantity of water used, nor isit possible to take account of changes in supply between wet and dry seasons.However, the two censuses were both conducted in August, so the effect ofseasonality of source use should not bias the results of one census relative to theother. The simple division into inside and outside the dwelling or compound does notpermit any comparison of how far the external sources lie from the usual householdresidence, and this may vary widely, particularly between rural and urban areas.
381

The data on sources used for drinking water may not reflect the true availability of aparticular source in a given region, since choice of source may be dictated by otherfactors - for example, piped water may be available from a neighbouring house in anurban area, but a hand pump at a communal well may be preferred, for reasons oftaste, cost, reliability of flow or opportunity for socialization. Where water for washing isobtained from a different source to water for drinking, the data presented here wouldnot represent the volumes actually used for domestic purposes from each source.Finally, since piped water is used more abundantly and is generally associated with ahigh degree of wastage due to leakages, the proportion of households using pipedsources is far lower than the proportion of environmentally available water captured bythe utilities for feeding into the piped system as a fraction of the total amount of watercaptured for domestic consumption.
Some explanation of the terms used to describe water supply in Tanzania may beuseful, particularly to highlight urban and rural contrasts. A household described ashaving a "piped water supply into the house or compound" may range from a singlefamily house with modern plumbing throughout, including flush toilets, to a communaldwelling, housing several unrelated households, sharing a single outside tap in theyard. Water companies generally charge for a piped supply on a flat rate basis, thoughwater meters have recently been introduced into some urban areas. Individuals living indwellings with piped water often supply water to others - this is particularly common inurban areas. This may be done free of charge, or for an agreed monthly fee, or evenon a "per bucket" basis. Households reported as obtaining water from a piped sourceoutside the house or compound could therefore be benefiting from water piped into aneighbouring dwelling, or they could be using free communal standpipes or municipalwater kiosks at which piped water is sold by the bucket (Kiwasila, 1994).
The term "well" is used to cover simple, shallow wells, improved wells with stone orconcrete ring linings and lids, deep drilled wells, and even boreholes with hand pumpsfor raising water. In rural areas, trading in drinking water from wells is uncommon, asmost households would have access to some communal source, and in any case, itwould be considered unethical to deny a neighbour access to drinking water, althoughcharges can be made for watering cattle (Drangert, 1993). But in urban areas, waterfrom wells in private enclosures may be sold, just as with piped water. "Other" sourcesvary widely between rural and urban areas, and different regions of the country. "Otherinternal" would generally describe rainwater collection from a metal roof to a largestorage tank, and this would occur in both rural and urban areas. In rural areas, "otherexternal" could refer to water from springs, water-holes, rivers and river-beds, lakes,ponds, and dams (White et al., 1972). Households in urban areas would be less likelyto use such sources, as they are less accessible and because open water in urbanareas tends to be too polluted for human consumption. However, water supplied bymobile vendors in urban areas would also be described as "other external", whateverits original source.
There are large differences between regions in the total amount of rainfall, and smallerdifferences in its seasonal pattern. The heaviest rainfall occurs in a narrow coastalstrip, on the western shores of Lake Victoria, and over mountainous parts of thecountry: Kilimanjaro and Meru in the north-west, the Central ranges running north-eastto south-west from Morogoro through Iringa to Mbeya, and the highland in the westbetween lakes Nyasa and Tangyanika, which forms the eastern wall of the rift valley.
382

The northern parts of the country tend to have two distinct rainy seasons, with a higherpeak in March-April and a lower one in September-October, whereas in the souththere is only one maximum, in October-November. June and July are dry monthsthroughout the country. There is quite marked variability in rainfall even within regions,some of which stretch across important physical features such as mountain ranges,lakes and watersheds - in Arusha region, for example, the area around the town ofArusha, at the foot of mount Meru, has over 1000mm of rain per annum, but much ofthe rest of the region has under 600mm. The rainfall data shown in the appendix, TableA2, have been derived from maps and tables presented by Berry (1971) byinterpolating across grid squares.
Population density in rural areas is not available directly from published sources, sincethe land areas of urban and rural census tracts are not given. Rural densities havebeen obtained indirectly, by estimating the urban area on the assumption that thegeneral density of urban settlement is 500 persons per km2, rising to 1,000 in the moreheavily urbanized regions in Arusha, Kilimanjaro, Tanga, Kigoma and Mwanza, andreaching 2,500 in Dar-es-Salaam and Zanzibar. In most regions, the proportion ofurban population is so small, that it would make less than 1 per cent difference to theresulting rural density if it were calculated on the basis of the entire area of the region.Zanzibar and Dar-es-Salaam have the highest rural densities, both over 150 personsper km2, Rukwa and LJndi are the most sparsely settled, with under 10 persons perkm2.
Dar-es-Salaam and Zanzibar also have the highest proportions of their populationsliving in urban areas: 91 per cent and 33 per cent respectively, in sharp contrast to allother regions which have below 15 per cent in urban areas. The least urbanizedregions are Shinyanga and Kagera, with under 5 per cent. Rural densities andproportions living in urban areas in 1978 at the start of the period for which change isanalyzed, are shown in the appendix, Table A2.
There is a considerable difference in the rural economies both between and withinregions. Berry (1971) produced a profile of rural economic performance at district level,calculating per-capita income for rural inhabitants. A ranking of regions (shown inappendix Table A2) has been constructed on the basis of the district profiles, whichshows that the wealthiest regions are Dar-es-Salaam and Morogoro in the centre ofthe country, and the North-Eastern regions of Kilimanjaro, Tanga and Arusha. Thepoorest regions in 1971 were Rukwa, Singida, Mara and Dodoma.
The final socio-economic variable used to differentiate the development level of eachregion at the start of the intercensal period is female literacy. For the country as awhole, this was 35 per cent in 1978, but it ranged from over 65 per cent in Kilimanjaro,to below 20 per cent in Shinyanga.
4. Methodology
One simple way of investigating the influence of population growth on water supply, isto invent a supply score for each region, based on the proportion of householdsobtaining drinking water from different sources according to. the perceived desirabilityof the source, and then to analyze changes in the score with respect to population
383

growth. The water sources described above have been ranked by perceiveddesirability, from the point of convenience and hygiene, as shown in Table 2.
Table 2. Raking of Drinking Water Supplies Used in Analysis
Rank
1
2
3
4
5
6
Source
piped internal
well internal
other internal
pipedexternal
well external
other external
Assumptions
most convenient, minimal domestic storage required, filtered and possiblychemically treated
convenient, household can exercise control over sanitary maintenance ofwell
mainly roof collection: convenient, but long domestic storage required,subject to interruption in dry season
filtered and possibly chemically treated* water, own vessel used forcollection
little control over well surroundings, may have to use communal vesselfor drawing water
mixed unprotected sources in rural areas, mobile vendors in urban areas
* not all piped water supplies in Tanzania are chemically treated on a regular basis
It is assumed that in regions where highly ranked sources are available, and affordableor attainable by households hitherto using sources with a low ranking, there would be agradual improvement in the frequency distribution of households by water source.Since the population is growing in both rural and urban areas of all regions (except forthe rural area of the Coast region, where the number of households has remainedalmost constant), such an improvement would be seen even if no households actuallychanged to a different supply, but simply if newly formed households had a morefavourable distribution of supply than existing households, or if households whichdissolved in the intercensal period had a less favourable distribution of supply than theaverage.
If there is a worsening of the proportional distribution of households by water sourceover time, this could indicate that newly formed households are obtaining drinkingwater from inferior sources to those used by existing households, or that existinghouseholds are abandoning the higher ranked sources, or that households with highlyranked sources are more prone to dissolution than households with lower rankedsources. Since a dwelling with an internal water supply of any kind represents aconsiderable investment of labour and/or household income, it is unlikely that suchdwellings would remain vacant for any length of time. An absolute fall in the number ofhouseholds with highly ranked sources, in the face of rapid population growth, almostcertainly represents a decline in the availability of water from these sources. This maybe due to technical problems in the case of piped water, but a decline in the absolutenumber of households using sources ranked at least as high as wells, could indicate adeterioration in the quality or quantity of ground water available in settled areas.
Using the above ranking, we could score 5 for households with an internal pipeddrinking water supply, down to 0 for households using "other external" sources. Table 3
384

shows such scores for the urban and rural areas of each region in 1978, and thechanges to the score observed between 1978 and 1988. It indicates that there hasbeen a net movement towards inferior drinking water sources in most regions: in therural areas 15 out of 21 regions show a negative change, and 14 regions shownegative changes in urban areas. The average decline in the score is larger in ruralthan in urban areas, and since rural areas had lower scores in 1978, the gap betweenrural and urban areas widened by 1988.
Table 3. Water Source Scores and Changes, 1978-1988
Region
DodomaArushaKilimanjaroTangaMorogoroCoastDar-es-SalaamLJndiMtwaraRuvumaIringaM bey aSingidaTaboraRukwaKigomaShinyangaKageraMvvanzaMaraZanzibarTanzania
Rural
1978 score1.912.503.392.412.553.412.222.061.892.132.821.902.282.231.721.682.121.691.981.552.652.24
areas
change 78-881.08
-0.39-1.33-0.78-0.84-1.65-0.01-0.05
0.36-0.55-0.04
0.34-0.67-0.29-0.48
0.46-0.11
0.08-0.20
0.06-0.37-0.22
Urban
1978 score3.033.203.673.432.843.362.942.702.292.562.812.722.323.032.572.863.382.302.822.953.772.98
areas
change 78-880.33
-0.50-1.00-0.31
0.21-0.95-0.09-0.26
0.100.030.130.070.25
-0.36-0.36-0.05-0.67-0.28-0.65-0.69-0.05-0.17
A scoring procedure produces summary statistics, but these are somewhat arbitrary, inthat a numerical equivalence is created between different kinds of changes, andchanges in opposite directions cancel out and remain undetected in the overallmeasure of change. A more satisfactory analysis would attempt to consider each typeof supply separately, though it would be difficult to interpret an analysis of the growthrates of households obtaining water from a particular source in the middle of theranking, where the majority of households are to be found -e.g. an increase in theproportion of households using outside pipes could be the result of a net movementinto this category from any combination of other categories, and could not be used asan indicator of improvement or deterioration.
One way to overcome this interpretational difficulty, is to divide households into twogroups according to the source ranking in Table 2 - e.g. the "superior" group could bethose who obtained their water from all inside sources or from outside pipes, and the"inferior" group those who obtain their water from outside wells and other outside
385

sources. A comparison of the growth rates of households in the two groups with theoverall growth rate would then show whether water provision was keeping pace withhousehold growth at the level of the chosen boundary - in this case, between outsidepipes and outside wells. If the superior group is growing slower than the total numberof households, and the inferior group faster, we could describe this as a net worseningof the supply situation across this boundary. Net changes between supply categorieswithin the superior group or within the inferior group would not affect our growth ratemeasures. This approach could also indicate whether the chosen ranking is sensible,in so far as one would expect to see systematic changes in the relationship betweengrowth in the two supply groupings and overall household growth as the groupboundary changed.
Mechanical failure of modern pumping schemes which were supposed to deliver pipedwater may be considered an irrelevancy in any attempt to measure population pressureon resources. Grouping the supplies in this way allows us to see how far down thedesirability scale households which have had to abandon the use of piped watersupplies have been forced to move. We can see whether the supply of the more highlydesirable traditional water sources, such as wells, is able to keep up with the growingtotal number of households augmented by the number of households which are nolonger able to obtain piped water.
Table 4 shows the intercensal growth rates of the superior group of households in eachregion, when the boundary is drawn successively lower down the source ranking. Anegative growth rate indicates an absolute fall in the number of households in thiscategory. To facilitate comparison, the figures for groups which grow faster than theoverall household growth rate are preceded with a plus sign, whereas unsigned figuresrepresent positive growth at a rate slower than household growth for the region.
Tables 4a and 4b highlight the contrasts between urban and rural areas noted in theintroduction. In urban areas, growth in superior supply sources is positive in all but fourcases: three regions experienced an absolute decline in internal piped water supplies,and only one in internal water supplies in general. In rural areas however, over two-thirds of regions have seen an absolute decline in internal piped water, half haveexperienced an absolute decline in all types of internal water supply, and in four out ofthe 21 regions there has even been an absolute decline in the cumulated number usingsources at least as good as outside wells. In fact less than half of the regions have agrowth rate faster than the total rural household growth rate for this last supplygrouping. This means that there has been a fairly widespread increase in theproportion of rural households using the least desirable sources of drinking watenstreams, river beds, ponds and lakes.
386

Table 4. Growth in Households with Superior Water Supply and OverallHousehold Growth
a. Rural Areas
Region
Dodoma
Arusha
Kilimanjaro
Tanga
Morogoro
Coast
Dar-es-Salaam
LJndi
Mtwara
Ruvuma
Iringa
M bey a
Singida
Tabora
Rukwa
Kigoma
Shinyanga
Kagera
Mwanza
Mara
Zanzibar
faster
slower
negative
Supply at least as good as:InsidePiped
+0.837
-0.536
-0.546
-0.748
-0.872
-0.893
+5.545
+0.191
+1.353
-0.046-0.192
+1.167
-0.765
-0.783
-0.943
+0.732
-0.653
-0.335
-0.891
-0.298
-0.619
6
0
15
InsideWell
+1.585
0.077
-0.433
-0.315
-0.352
-0.679
0.674
0.050
+0.430
0.012
0.170
+1.097
-0.387
-0.236
-0.328
+0.934
0.167
+1.618-0.147
+0.454
-0.123
6
6
9
InsideOther+1.785
0.199
-0.536
-0.184
-0.300
-0.664
+0.717
0.058+0.308
-0.468
0.178
+0.379
-0.393
-0.220
-0.447
+0.464
-0.034
+0.238
-0.113
+0.344
-0.057
7
3
11
OutsidePiped+0.528
0.181
-0.223
-0.466-0.326
-0.575
0.513
+0.145
+0.210-0.304
0.192
+0.365
-0.367
-0.180
0.168+0.543
-0.025
0.129
-0.092
-0.060
0.091
5
6
10
OutsideWell
+0.415
+0.393
-0.131
-0.080
-0.098
-0.020
0.684
0.011+0.250
0.183
+0.284
+0.345
0.127
+0.2530.398
+0.581
+0.346
0.092
+0.174
+0.199
0.197
10
7
4
OverallHousehold
Growth0.154
0.383
0.105
0.042
0.061
-0.000
0.691
0.079
0.086
0.222
0.199
0.234
0.135
0.098
0.481
0.248
0.1870.171
0.098
0.137
0.198
387

b. Urban Areas
Dodoma
Arusha
Kilimanjaro
Tanga
Morogoro
Coast
Dar-es-SalaamLindi
Mtwara
Ruvuma
Iringa
Mbeya
Singida
Tabora
Rukwa
Kigoma
Shinyanga
Kagera
Mwanza
Mara
Zanzibar
faster
slower
negative
+0.811
0.174
0.017
0.150
+1.001
-0.132
0.344
0.097
+0.492
+1.264
+0.498
1.755
+0.242
-0.017
0.628
+0.572
0.208
0.157
0.019
-0.182
0.163
7
11
3
+0.908
0.356
0.043
0.211
+1.386
0.523
0.462
0.794
+0.864
+1.231
+0.483
+2.155
+0.465
0.021
0.508
+0.783
0.416
0.716
0.433
0.012
0.2228
13
0
+0.882
0.411
0.057
0.217
+1.394
0.526
0.427
0.814
+0.805
1.115
0.340
+2.047
+0.358
-0.007
0.440
+0.735
0.455
0.501
0.400
0.030
0.2246
14
1
+0.687
1.080
1.017
0.417
+0.928
0.989
0.427
0.698
0.284
1.028
+0.628
1.753
+0.287
0.133
0.482
0.324
0.551
0.761
0.534
0.630
+0.2435
16
0
+0.622
1.078
1.048
0.430
+0.951
1.278
+0.492
+0.941
0.341
+1.460
+0.499
+1.873
+0.216
+0.294
0.856
+0.559
0.910
+1.097
1.037
0.898
+0.24412
9
0
0.565
1.100
1.156
0.457
0.915
1.498
0.491
0.937
0.352
1.215
0.451
1.799
0.161
0.290
0.902
0.557
0.968
0.995
1.120
0.920
0.241
The superior supply groups in most of the urban areas have faster growth when theboundary point is chosen lower down the ranking (i.e. growth rates tend to increasefrom left to right in Table 4b), the remainder have a peak growth rate for the superiorgrouping which combines internal pipes and wells. The pattern of change of growthrates across different boundary points is less regular in rural areas: only eight regionsdisplay the regular urban pattern of faster growth across lower ranking boundaries;one, Mbeya, has a regular pattern but in the opposite direction; the rest show evidenceof an overall shift towards both internal and external wells.
This data configuration allows us not only to study the relative growth or decrease inthe more desirable forms of water supply, but also to examine the relationship betweengrowth in superior water supplies and the pace of population growth. This can be doneby means of simple regression analysis, treating the growth in the superior watersupply group as the dependent variable, and total household growth as the predictor.
388

The slope of the regression line tells us whether rapid population growth is associatedwith a less favourable supply situation (regression coefficients less than one) as wouldbe predicted by a neo-Malthusian outlook, or a more favourable situation (regressioncoefficients greater than one) which is what Boserup's innovation hypothesis mightlead us to expect, or what would occur if the availability of a convenient water supplyserved as an attractor to internal migrants.
Two growth models were tested using this data - the simple, univariate modeldescribed above, and a bivariate model, in which the second independent variable wasthe baseline (1978) value of the proportion of households with the superior supply. Thebaseline proportions were also treated as the dependent variable in a multivariatemodel, in which the explanatory variables used were rainfall, an index of agriculturalpotential, population density, proportions of the regional population living in urbanareas, and literacy level. The object of this exercise was to try and discover whetherthere were any easily measured predictors of the evolution of supply patterns in thedifferent regions up to 1978. To allow for the different sizes of the populations in eachregion, the values used in the regressions were weighted by the 1978 number ofhouseholds.
In both the growth models, the constant term in the regression shows whether therehas been a general tendency for the number of households using the superior sourcegrouping to increase or decrease over the intercensal interval. With regard to therelationship of source change to population growth, our "null hypothesis" in bothmodels is that water provision from each source exactly keeps up with populationgrowth. The significance tests on the coefficient of the household growth variabletherefore determine whether it is significantly different from one rather than from zero.
In the case of the model which includes the baseline proportion with a superior supply,the null hypothesis is that the 1978 levels of use of different sources represented anenvironmental or demand equilibrium for each region, so that in the absence ofpopulation growth, the sources would continue to be exploited at the current levels.Positive values of the coefficient for the baseline proportion of the superior supplywould indicate that regions which had already achieved relatively high levels of use ofthe better sources were the ones in which growth in their use was proceeding fastest.This could be explained in several ways: that these sources were relatively easy todevelop, and environmental constraints to their further development were not importantat present, or simply that demand for these sources was high in areas in which theywere relatively widely used. It would not be possible to discriminate between supplyand demand side explanations without collecting additional data and constructing amore complex model. Negative values of the same coefficients would indicate thatgrowth in the better sources of supply was proceeding fastest in regions in which thesewere relatively underdeveloped. Again, both supply and demand factors could be usedto explain this. Since the growth in use of a source grouping which is already used byalmost the entire population would be constrained by the growth of the wholepopulation, we would expect these coefficients to decline as cut-off values for thesuperior source were made lower down the ranking, thereby including a larger fractionof the population in each region.
389

5. Regression Analysis Results
Examining first the simple score data presented in Table 3, we can regress thechanges in the scores against their baseline values and the overall growth in thenumber of households in the ¡ntercensal interval. The results are shown in Table 5. Inboth urban and rural areas, the coefficient of the base line score is negative andsignificantly different from zero, indicating that the largest declines in the water sourcescore have occurred in those regions where the scores were highest in 1978. In urbanareas, there is a significant negative relationship with the growth rate - changes areworse in the more rapidly growing urban areas, but this is not the case for rural areas,where the positive coefficient has no statistical significance. However, these results tellus nothing about which types of source are becoming more or less prominent, andwhether, in the case of urban areas, population growth is actually associated with anabsolute decline in provision from the best ranked sources. For answers to thesequestions we must examine the statistical relationship between population growth andgrowth in the grouped water supply categories.
Table 5. Regression Results for Water Supply Scores
DependentVariable
rural supplyscorechange
urban supplyscorechange
Prob > Fof model
0.001
0.027
independent variable householdgrowth
const, signif.
1.71*«
1.19**
coeff. signif.
0.51
-0.35**
independent variablebaseline level
coeff. signif.
-0.90***
-0.38**
** difference significant at 5 per cent level of probability*** difference significant at 1 per cent level of probability
The results of regressing the growth rates of households with superior supplies atdifferent boundary points against the overall growth rate for households are shown inTable 6. The comparative regularity in the behaviour of urban areas is reflected in theprobability values of the F-statistic which indicate the overall explanatory power of themodel: the lower values for urban areas indicate a stronger relationship betweendependent and independent variables.
In the regressions for urban areas, the constant terms are all positive, but notsignificantly different from zero, and the coefficients of the overall growth variable areall less than one, though only two of the relationships are significantly less than unity.In the rural area regressions, the constant terms are all negative, though only one issignificantly different from zero,, and the growth coefficients almost all greater than one,but not significantly so.
390

Table 6. Grouped Growth Regression: Model I. Growth in superior water supplycompared with overall household growth
Rural areas
Dependent Variable
superior group growth
in piped
in well
in other
out piped
out well
Prob > Ffor model
0.368
0.266
0.391
0.010
0.000
independent variable: household growth
constant signif. diff.from 0.0
-0.44
-0.00
-0.08
-0.24**
0.00
coefficient signif. diff. from1.0
1.44
1.62
0.99
1.55
1.22
Urban areas
in piped
in well
in other
out piped
out well
0.057
0.007
0.006
0.000
0.000
0.09
0.11
0.08
0.03
0.01
0.44**
0.67
0.67
0.79**
0.99
difference significant at 5 per cent level of probability
Figures 1 and 2 illustrate the regressions of growth in the number of households withan internal water supply or a piped supply of any kind against total household growth(the results shown in the fourth rows of the urban and rural panels of Table 6). Thecontinuous lines represent the regression line, and the 95 per cent confidence limits ofthe prediction. The dashed line is a reference curve - it has a slope of one and passesthrough the origin, indicating the relationship we would expect if the growth in this levelof water supply was exactly keeping pace with population growth. In the ruralillustration (Fig. 1), the regression line has a steeper slope than the reference curve,indicating that this level of water supply grows faster in the regions which areexperiencing more rapid growth, but because the general pattern is one of decline inthis kind of water supply, as exemplified by the negative intercept, the reference curvegenerally lies between the confidence limits of the regression line, and the difference inslopes is not significant. By contrast, the urban regression slope (Fig. 2) is less steepthan the reference line, indicating that the higher the population growth, the less likely itis that growth in this level of water supply will keep pace. The differences betweenpopulation growth rate and water supply growth are significant, as indicated by the factthat the reference curve lies outside the confidence limits.
391

RURAL AREA WATER SOURCE CHANGES, 1978-8B
a.Q.3in
Q .
2O
1.5
1 -
.5 -
0 -
-.5 -
housenold growth rate.8
Fig. 1. Regression of growth in the number of rural area households with an internalwater supply or a piped supply of any kind against total household growth.
a.us
Cc01
o
URBAN AREA WATER SOURCE CHANGES, 1978-88
2 -
1.5 -
1 -
.5 -
0 -
jtfe
.5 i 1.5household growth rate
Fig. 2. Regression of growth in the number of urban area households with an internalwater supply or a piped supply of any kind against total household growth.
392

Table 7 shows the results of the bivariate regressions, and the F-statistic probabilitiesindicate broadly similar levels of correlation for both urban and rural areas, all therelationships being significant at the 10 per cent level, and most of them significanteven at 1 per cent. The rural-urban contrasts between the constant terms and thegrowth coefficients are the same as in the univariate regressions. In the regressions forrural areas, the coefficients for the variables which measure the baseline level of thesupply groupings are positive, all highly significant, and decrease in value as the groupcut-off point is shifted to include less desirable supplies (and a larger fraction of thetotal population). For urban areas these coefficients are negative, of varyingsignificance, and show no regular trend over the supply groupings.
Table 7. Grouped Growth Regression: Model II. Growth in superior water supplycompared with overall household growth and baseline supply level
Rural areas
DependentVariable
superior groupgrowth
in piped
in well
in other
out piped
out well
Prob > F
for model
0.058
0.029
0.000
0.001
0.000
independent variable householdgrowth
const, signif.diff. from 0.0
-0.78**
-0.92**
-1.13***
-0.75***
-0.79***
coeff. signif. diff. from1.0
1.17
1.45
0.37
1.23**
1.35***
independent variablebaseline level
coeff. signif. diff. from
o.o •6.80**
3.36**
3.32***
1.19***
0.89***
Urban areas
in piped
in well
in other
out piped
out well
0.083
0.004
0.005
0.000
0.000
0.42
0.73**
0.64*
0.13
0.96***
0.42**
0.65
0.66*
0.79**
0.96
-0.96
-1.65**
-1.45*
-0.11
-0.95***
• difference significant at** difference significant at*** difference significant at
10 per cent level of probability5 per cent level of probability1 per cent level of probability
The rural part of Dar-es-Salaam region is clearly very different from rural areas in therest of the country. Table 3 shows that internal piped water supplies in this area grew6-fold, far faster than in any other area, rural or urban, but from a very low base - in1978 this area had the second lowest proportion of households with this supply in thewhole country, as can be seen in appendix Table A1. Numerically, the rural areas ofDar-es-Salaam are not particularly important - less than 1 per cent of the ruralpopulation of the whole country live there, (but just over 10 per cent of the population ofthe Dar-es-Salaam region). In most of the regressions for rural areas Dar-es-Salaam
393

was either a prominent outlier, or exerted very high leverage. The rural arearegressions were therefore repeated without Dar-es-Salaam, and the results shown inTable 8.
Table 8. Grouped Growth Regressions for Rural Areas Without Dar-Es-Salaam.Growth in superior water supply compared with overall householdgrowth and baseline supply level.
Model IDependentVariable
superior groupgrowth
in pipedin wellin otherout pipedout well
Prob > F formodel
0.5940.2750.4600.0130.001
independent variable householdgrowth
constant signif.diff. from 0.0
-0.37-0.26-0.07-0.26**-0.01
coefficient signif.diff. from 1.0
0.931.770.961.661.27
independent variable:baseline level
coeff. signif. diff. from0.0
Model IIin pipedin wellin otherout pipedout well
0.0800.0350.0000.0010.000
-0.71**-0.94**-1.11***-0.76***-0.87***
0.671.580.141.321.49*
6.79**3.36**3.37***1.18***0.97***
difference significant at 10 per cent level of probabilitydifference significant at 5 per cent level of probabilitydifference significant at 1 per cent level of probability
In fact, excluding Dar-es-Salaam makes surprisingly little difference to the observedrelationships. Most of the correlations are slightly weaker, as shown by the modestincreases in the probability of the F-statistic. It is clear that in rural areas, the rate ofchange in water use from the most desirable sources is much more strongly correlatedwith historical patterns of use than with population change.
Table 1 and appendix Table A1 show that household size increased in both rural andurban areas between 1978 and 1988, as population growth was faster than growth innumber of households at both national and regional levels. Population growth andhousehold growth are very highly correlated, but population growth did not perform aswell as growth in number of households as an explanatory variable in the regressions,nor did it provide any further explanatory power if it was included as an additionalvariable in any of the models. The same was true of mean household size, andincrease in mean household size.
The background socio-economic and climate variables were also included inregression models for growth in water supply at various levels of desirability. The onlybaseline variable to show consistent and significant correlation with water supplychange was the rural wealth index, which was negatively correlated with all the growthrates of superior supply in rural areas, no matter where the boundary was drawn, and
394

most of these correlations were significant at the 5 per cent level. No significantcorrelations were found for urban areas. Adding the wealth index to the independentvariables in regression model II for rural areas did not significantly improve theexplanatory power of the models, nor did it change the significance of regressioncoefficients reported in Table 7.
The baseline values for proportion of households with superior water supply were thenregressed against the background variables, to see if the 1978 supply patterns couldbe explained by these climatic or socio-economic factors. In the rural areas, the onlyrelationship to emerge was a weak negative correlation (significant at the 10 per centlevel) between baseline level of water supply and rainfall. This relationship wasobserved for all the boundaries between superior and inferior sources except for theoutside well boundary. This finding indicates that by 1978 internal sources and outsidepiped supplies were better developed in the rural areas of regions of relatively lowrainfall. As for urban areas, the baseline supply levels appeared to be positivelycorrelated with rural density and negatively correlated with proportion of the populationin urban areas, but this was entirely due to the two outliers, Dar-es-Salaam andZanzibar - when the observations for these regions were dropped, no significantrelationships were observed.
One other set of regression analyses was tried - regressions of rural baseline suppliesand growth in these against their urban equivalents, to see whether the development ofrural supplies was an extension of urban development. No significant relationshipswere discovered here - there is not even any correlation between overall rural andurban growth rates on a regional basis, suggesting that urban growth differentials aredetermined by inter-regional migration rather than by the scale of migration from ruralareas within the region.
6. Discussion
The analysis presented above confirms that domestic drinking water supply isdeteriorating in both rural and urban areas of Tanzania. When different sources ofhousehold supply are split into two groups, "superior" and "inferior", it is only theinferior grouping which consistently grows faster than the total number of households,no matter where the boundary between superior and inferior is drawn. This indicatesthat the most rapid growth is taking place in the least desirable sources of drinkingwater - "other external" - that is rivers and river beds, ponds, springs and dams inrural areas, and mobile vendors in urban areas.
However, it is only in urban areas that population growth is seen as a significant factorin the shift towards inferior sources, in so far as the situation appears to be worse ¡nthose regions where urban population growth is most rapid. In rural areas, where thechanges have in general been more unfavourable than in urban areas, the opposite istrue - the shift to inferior sources is strongest in the areas which are growing moreslowly, though the relationship is not strong enough to be statistically significant.Furthermore, in rural areas the most favourable changes have occurred in regionswhich were already relatively well supplied at the beginning of the interval, so there Isno direct evidence for the emergence of new environmental constraints to water supplyin rural areas. In urban areas the trends are in the opposite direction - the worst
395

changes have occurred in those areas which had relatively good supply patterns in1978, though the relationship is not as strong as that observed in rural areas. Since thereforms which increased payment for piped water use in urban areas have only been ineffect since 1991, it is very unlikely that cost factors would have lowered demand inareas where supplies were relatively well developed, so we can tentatively concludethat supply side problems are worst in these areas.
These results show that neither the simple Malthusian explanation, nor any of theopposing hypotheses could entirely account for the relationship between changes inwater supply and population growth in both rural and urban areas of Tanzania Itseems more likely that cyclical changes are taking place, with different areasexperiencing Malthusian pressures and technological innovation in different phases oftheir development. Thus an area naturally endowed with easily exploitable waterresources, or one which is wealthy enough or politically powerful enough to ensureinvestment in technological solutions, may experience relatively rapid populationgrowth as people are attracted to it from neighbouring regions. In this first phase,relatively good water sources can still be developed or expanded faster than insurrounding regions, even if the their growth does not match that of the overallpopulation. As a group, the rural areas of the country would appear to be in thisdevelopment phase. The momentum of the migratory movement and natural increasein the fastest growing areas may subsequently cause the ratio of people to desirablewater sources to become relatively unfavourable compared to that in slower growingareas, and unless there is further investment, these initially better endowed areas maythen experience worse changes in water supply. Urban areas as a whole are currentlyin this phase.
The big question, which is not answered by this analysis, is whether the regionspossess enough water resources and whether the country as a whole has enoughinvestment capital to enable urban areas to re-enter the first phase of such a cycle.The migratory component of regional population growth could help to improve theoverall water supply situation, if migration was towards areas with better natural waterendowments, or if the concentration of population in urban areas made the provision ofpiped water more economical. However continuing high rates of natural increase canonly make it more difficult to maintain water provision at current levels, or to effect anykind of improvement.
It is particularly worrying that supplies internal to the compound are declining in ruralareas, as there is no evidence that these are being replaced by external piped watersources. The bulk of internal provision in rural areas continues to be provided by wells,but the proportionate use of this source has declined in 8 regions, with an absolutedecline in 4 regions: Coast, Singida, Tabora and Rukwa. There is an urgent need forfield studies which could investigate whether the loss of internal wells is due to fallinggroundwater levels, or to contamination due to unsatisfactory sanitation.
It would be interesting to repeat this analysis with a finer geographical breakdown -e.g. using data aggregated at the district level for the mainland (103 districts) and theregional level for Zanzibar (5 regions) would give us up to 108 observations of eachvariable rather than the 21 used above, though there would be some missing dataproblems, as a few boundary changes have occurred at the district level betweencensuses, and not all districts contain both rural and urban areas. Such an analysiswould also help to identify areas in which mechanical failures of piped supplies were
396

the major cause of an overall decline in the distribution of households by water source.However, the district level tables of water source data were not published for 1978, andwe have not yet been able to locate them in the archives of the census office.
Looking ahead to the next census, it would seem appropriate to include a question onpayment for water, since this is becoming more widespread, even in rural areas, andeven for water which is not piped into the dwelling. It would also be useful todistinguish between traditional wells and modern boreholes as sources of drinkingwater supply, as this would give a better indication of the extent of use of technologicalsolutions in different parts of the country. A further question asking whether the mainsource of drinking water was adequate for both wet and dry seasons would give someindication of the reliability of modern and traditional sources. An analysis of theinformation provided by expanding the questions on water supply would allow thegovernment to begin to monitor the progress of its new policy of providing access toclean water at an affordable price.
Footnote
The authors would like to thank Pauline Airey and James Ngana for helpful commentson an earlier version of this paper, and Basia Zaba gratefully acknowledges researchfunding from the ESRC Global Environmental Change Programme.
References
Agrar-und Hydrotechnik GMBH. 1976. Water Master Plan for Tanga Region, Essen,Fed. Rep. Germany.
Allan, W. 1965. The African Husbandman, Connecticut: Greenwood Press.
Berry, L ed. 1973. Tanzania in Maps, London: University of London Press.
Brokonsult. 1977. Water Master Plan for Kagera, Mwanza and Mara Regions, Taby,Sweden.
Carl Bro. 1982. Water Master Plan for Ruvuma, Iringa and Mbeya Regions, Kruger,CCKK, Denmark.
CBA Engineering. 1979. Water Master Plan for Coast and Dar-es-Salaam Regions,CIDA, Vancouver, Canada.
DHV Consulting Engineers. 1971. Domestic Water Supply Plan for Morogoro Region,Netherlands.
Drangert, J. 1993. Who Cares About Water? Household Water Development inSukumaland, Tanzania, Linkoping Studies in Arts and Science.
Falkenmark, M. 1989. The massive water scarcity now threatening Africa - Why isn't itbeing addressed?, AMBIO, 15(4).
Falkenmark, M. 1994. Water availability as carrying capacity determinant - a newfactor in Third World demography. In B. Zaba and J. Clarke, eds. Environment andPopulation Change, Liege: IUSSP, Ordina Editions, 179-95.
397

Finnwater. 1977. Water Master Plan for Lindi and Mtwara Regions, Finland.
Gillman, C. 1945. Population problems of Tanganyika Territory, East Africa AgriculturalJournal, 11.
Kauzeni, A.S., M. Mujwahuzi and H. Kiwasila. 1990. Study on Community ParticipationApproaches in Rural Water Supply and Sanitation Sector in Tanzania, Institute ofResource Assessment, University of Dar-es-Salaam.
Kiwasila, H. 1994. Water Supply Aspiration and Willingness to Pay: A Socio-economicStudy of Mwanza Urban Area. Unpublished report, Institute of ResourceAssessment, University of Dar-es-Salaam.
Mambali, S.S. 1992. The National Water Policy. Paper presented at seminar onre-organization of the Makonde Plateau water supply, vol. 2 of proceedings,Ministry of Water, Energy and Minerals, Government of Tanzania.
Mujwahuzi, M. 1993. Personal communication - Institute of Resource Assessment,University of Dar es Salaam.
Norconsult. 1982. Water Master Plan for Rukwa and Kigoma Regions, Sandvika,Norway.
Rafiq, M. et al. 1983. Chapter 2: An evaluation of coverage and age-sex data,Tanzania 1978 Census - volume 8, Analysis, Bureau of Statistics,Dar-es-Salaam.
SMEC. 1978. Water Master Plan for Singida Region, Snowy Mountain EngineeringCorporation, Australia.
Tanzania 1988 Census. Regional Profiles (20 published volumes for mainland regions,Zanzibar data not yet published) Takwimu, Bureau of Statistics, Dar-es-Salaam.
White, G., D. Bradley, and A. White. 1972. Drawers of Water: Domestic Water Use inEast Africa, Chicago: University of Chicago Press.
Zaba B., I. Diamond, G. Jones, C. Kamuzora and C. McMurray. 1991. An InitialAnalysis of the 1988 Census of Tanzania, Proceedings of a Workshop,unpublished report to ODA.
398

Appendix Tables
Table Al. Percentage Distribution of Households by Water Supply, 1978 and 1988
RURAL
AREAS
Tanzania
Dodoma
Arusha
Kilimanjaro
Tanga
Morogoro
Coast
Dar-es-Salaam
Lindi
Mtwaia
Ruvuma
Iringa
Mbeya
Singida
Tabora
Rukwa
Kigoma
Shinyanga
Kagera
Mwanza
Mara
Zanzibar
Year
788878887888788878887888788878
8878887888788878887888788878887888788878887888788878887888
Tota
households
29944563480233
18883721816815694921739815318916937118748819547616974318112611126711122719129
3238810703711549915600316948198569
12046718825222564019564924147812056713681913843215203176845
1137891053221314282145362546612159652528942083822289381061091206987618691256
piped
11.65.88.8
14.024.983
40.116.520.04.8
20.42.5
25.82.82.1
8.14.85 34.9
10.61.41.1
22.615.23.86.76.21.34.70.96.70.36.59.05.01.52.41.45.70.62.113
13.24.2
Internal
well
18.922315.841.0
6.416.04.16.22.9
10.212.917.843.719.626.7
20.426.725316.517.519.816.523.629.917.329.232.019339.229.613.18.7
11.118.227.330.3
8.021.926.224.213.919.234.230.5
other
10.16.81.47.6
10.812.126.67.03.95.95.04.90.21.10.0
0.81.41.62.50.6
20.90.812.112.217.16.86.63.30.20.89.01.8
20.817.813.95.8
28.618.04.64.74.74.01.03.4
piped
16.112.728.89.8
29.924.920.834.750.518.633.019.911.010.933.2
26.26.29.2
28329.413.213.210.010.68.79.27.55.21.02.38.6
18.78.7
13.24.64.16.22.43.33.4
13.43.7
11.516.4
External
well
27.538.221.921.57.6
18.7037.8
16.943.520.232314.959.438.0
44.158.550.033.940.937.758.518.424.933.135.333.856.439.963.342.245.711.616.227.446.926.723.544.557.248.458.736.641.9
other
15.814.22335.9
20.419.88.1
27.85.816.98.5
22.04.4630.0
0.42.48.5
13.90.97.010.01337.1
20.012.813.914.515.03.0
20.424.841.325.621.811.328.132.915.79.917.513.13.53.5
Household
size
4.95.44.75.15355535.54.45.445534.24.83.7
4.44.44.7434.45.2534.44.75.05.04.6534.85.85.25.35.55.75.9654.44.96.26.7637.04.24.5
399

Table Al (Contd.).
URBAN
AREAS
Tanzania
Dodoraa
Amsha
Kilimanjaro
Tanga
Morogoro
Coast
Dar-es-Salaaro
Lindi
Mtwara
Ruvurna
Iringa
Mbeya
Singida
Tabora
Rukwa
Kigoma
Shinyanga
Kagcra
Mwanza
Mara
Zanzibar
Year
788878887888788878887888788878
8878887888788878887888788878887888788878887888788878887888
Total
households
560337939405
18566291251887739678169693660132950480543164560646
798519970
188405
28108311734227312171529366
89401981218810272972210161885128721494624721319011113021165122191903112741250778328
16614323366855810538202383675545627
piped
34.027.438.844.841.723356.326.647.037.132.634.044.215.331.4
28327.015314.415.925325.828329.227.927.517.618.829.322322.118.931.631.945.928.226.615.426.612.831.813.559.255.5
Internal
well
2.65.71.13.71.34.40.50.92.43.92.49.53.8
13.90.0
2.51.9
11.53.68.96.66 34.64.42.66.98.9
14.611.19.76.33.61.56.02.97.01.38.66.19.37.27.03.46.1
other
120.60.80.30.71.60.50.60.60.70.81.20.10.10.9
0.10.10.40.70.22.70.93.80.32.3132.20.11.70.41.40.01.00.12.83.05.31.01.40.40.20.50.10.2
piped
54.152.147.846350.664.040.763.546.852.450.442.048.147.266.7
63.856.848.160.650340.836.050.563.954.149.738.941.449.648.150.540.058.440.741.335.135335.555.742.548.353.330.731.7
External
well
5.711.56.7333.13.01.02.42.63.48.59.73.7
14.50.8
5.113.023.819.122.313.930.2
9.01.67.4
11324.221.2
8.019.415.631.0
1.715.75.4
22.25.3
17.19.2
30.19.7
21.86.26.2
other
2.42.74.8132.63.61.06.00.62.55.33.50.18.90.2
0.21.21.01.62.4
10.70.83.80.65.73.28.23.90 30.14.16.45.85.71.74.6
26.222.41.04.92.83.90.40.2
Household
size
4.24.54 34.53.93.93.94 34 34.6354.44.44.74.0
4 34.34.24 34 34.94.54.24.24.44 34.44.54.34.74.54.65.15 34.24.53.64.14.44.94.94.94.24.9
400

Table A2. Baseline Values of Socio-Economic and Climate Variables
Region
TanzaniaDodomaAnishaKilimanjaroTangaMorogoroCoast
Dar-es-Sa]aamLindiMtwaraRuvumaIringaMbcyaSingidaTaboraRukwaKigoraa
ShinyangaKageraMwanzaMaraZanzibar
Rural wealthrank 1971
1161817198
20
1276
12111
121
5108
121
10
Rainfall 1971
840500600650800
1000900
1200900950
1100650850650850950
1000800950850
10001600
Populationdensity 1978
17.221.610.4
63.533311.4
14.981.1
7.241.3
8.214.816.411.39.4
5.815.825.134.5
67.334.6
135.5
Percent urban1978
13.88.88.0
7.514.114.4
7.291310.112.07.79.18.99.4
13.111.79.94.23.4
10.27.3
32.6
Percent literate1978
35.435.429.166.744.743.427.926.631.938.254.538.9
32.9
33.8
22.728.928.218.341.426.740.925.8
401


CHAPTER 22
THE DYNAMICS OF LAND USE AND LAND-COVERCHANGE AS A MANIFESTATION OF POPULATION-
DEVELOPMENT-ENVIRONMENT LINKAGE: WORK-IN-PROCESS
Riga Adiwoso Suprapto
1. Introduction
The ongoing interest in studying the linkage between population and environment havebrought to the fore a variety of approaches from an array of disciplines such ashydrology, soil sciences, forestry, sociology, demography, anthropology, economicsand political science (Ambio, 1992). This has resulted not only in understanding moreprecisely the differences in which social and natural sciences perceive the linkage, butalso, rather frustratingly, a quest for a more interdisciplinary approach. Admittedly, thisis not an easy task, since at the same time as scientists try to iron out their differences,there is a "mega-struggle" for claim of superiority of one approach over the other.Nonetheless, one needs to observe this as a necessary process to reach a commoninterdisciplinary framework.
Studies and classifications of land-cover changes persistently indicate the need foradditional information on land use. Most of the land-cover changes are driven byhuman activities. Initial assumptions contend that such factors as population growth,increasing consumer demands combined with land tenure arrangements, access tocredits, shift in trade patterns as well as local inheritance law and customs resulted indifferent land uses (IGBP Report #24; HDP Report #5, 1993; Turner et al. 1990). It isrealized that linking human driving forces of land use to land-cover changes is difficultdue to the interactive complexity between human and environmental factors.Variabilities in how the linkage manifests itself in different areas has created even moreproblems in drawing global generalizations on the dynamics of land-cover changes. Inaddition, simple aggregation of individual responses does not permit the prediction ofhigher level behavior. Therefore, societal institutions, role in land use and land-coverchange need to be seen as human organization over individual actions. This on-goingstudy intends to reveal societal institutions' role in the process of land use change.
2. Rationale of the Study
Decision-making processes in the use of lands are often assumed to be based oneconomic rationale (Kunner, 1992; Mahar, 1989; Ramli, 1993) or demographicrationale (Ehrlich and Ehrlich, 1990; Boserup, 1985; Allen and Barnes, 1985) as well as
403

technological advancement rationale (Brouwer and Chadwick, 1991) in other words,reflecting the formula of environmental impact: I=P.A.T. (Impact = Population xAffluence x Technology). Others (Sanderson, 1993; Okoth-Okendo, 1991) have alsocontended that political economy, particularly the systems of exchange, ownership andcontrol, as well as institutions and government bureaucracies and policies affect orfunction as driving forces of land-cover conversion. However anthropological studies(e.g. Blaikie and Brookfield, 1987; Tjitrajaya, 1993) indicate that societal values asreflected in the social institutions pertaining to environment are also pertinent inunderstanding land use changes. In other words, the question is raised about theextent to which decisions in land-cover conversion can be based solely on a singlyfactor such as economic cost-benefits and are not modified by contextual condition.
This on-going study examines the dynamic process of community decision-makingregarding land use. It is intended to examine how the community negotiates internaland external pressures for land use change through institutional mechanisms. Itintends to reveal the underlying societal value system governing the environment.Although the study is more data driven than model driven, it is expected to indicate apossible empirical model of the role of societal institution in managing land.
3. Methodology
The framework in conducting the study is a modification of a framework proposedpreviously in which various factors/driving forces have been incorporated (Falkonmarkand Suprpto, 1992) as demonstrated in Figure 1.
SocioculturalValues
PopulationCondition
ConsumptionPattern
ProductionActivities
ResourceDemands
Land Use
Land-Cover
SocioEconomicModes
Quality of Life
Technology
Individual
Socio-PoliticalFactors
Adjustment
The framework shows that the population condition (e.g. population growth, migration,as well as structure) does not link directly with land-cover condition, but rather througha series of interiinkages involving human activities. However, such activities are
404

affected by the value systems prevailing in the society with various intervening factors,such as the perceived quality of life, the technology employed, and the economy ofscales within a given society. Although the framework is very general in nature, itdefines the focus of a study. In the present case, the main focus is at the interactionsbetween socio-political modes with land use, particularly the cultural values systems ofland. However, this does not preclude the possibility to interlink the focus with othersets of factors in the framework.
In addition, the framework itself questions to a certain extent the assumptionsunderlying the concept of "carrying capacity" employed often by natural scientists, andputs to the fore the concept of "social adaptability". It sees that human societies havecertain adaptive capacity towards change. However, the magnitude and speed ofchange may affect the adaptive ability both at individual level and societal levelreaching a certain dysfunctional condition.
The study focuses on the following questions:
- what are the underlying societal value systems towards the environment whichencourage or discourage land-use conversion?
- how do societal institutions operate as a mechanism to ensure compliance of thecommunity members? What are the social sanctions operative in a givencommunity?
- how do communities handle competing institutional rules that affect land use?
The study examines six communities in three locations of Indonesia: two communitiesin West Java, two in ñores, and two in Irian Jaya. It employs comparative caseanalysis, to identify commonalties and differences in the cases and allow the possibilityof drawing a low level generalization regarding the role of societal institutions in land-use changes. While from a purely demographic perspective this may raise the basicquestion regarding their representativeness, the in-depth study conducted is notintended for qualitative rather than quantitative purposes, so the sampling criterionshould not be applied. The on-going study is into its second year and is expected tocontinue for another. Hence, the results reported are still tentative.
Data were collected through observation and focus group discussion. In addition,unstructured interviews with key informants as well as rapid appraisals wereconducted. To be able to gain insights into the value systems, participant observationin various conflict situations were employed.
4. General Historical Background
The two communities Sawah Lama and Sawah Baru in West Java are located in theoutskirts of the JABOTABEK area, and have undergone the rapid land-use changeduring the last two decades (Fig. 2a). Two other communities, the Iwanggete and Uo,are located at Sikka and Ende respectively, in the island of Flores (Fig. 2b). Tow othercommunities, the Tabbeyan in Kaurek and Sentosa in Unurumguay, are located in IrianJaya (Fig. 2c).
405

4.1. West Java Communities
In contrast to the two other locations, the West Java communities studied are semi-urban areas. In the 1960s the area still functioned as a hinterland for Jakara and itsvicinity, particularly supplying vegetables and fruits. A single dirt road connected thearea to the local market, which operated mostly at early dawn. Until the early 1970s thepopulation was still fairly homogenous. Ethnically, most of them were Betawi andSundanese. Economically, most were small-scale vegetable and fruit gardeners. Ricewas planted mostly for their own consumption. A limited number of local people (25persons) worked for an orchid plantation owned by a Jakarta family. Some of the menoccasionally became seasonal workers working as laborers for real estate activities inJakarta.
By mid-1970 drastic changes occurred as the government set up two INPRESelementary schools in the area and compulsory education was enforced. While in thepast schooling was confined to a very few members of the community, namely to thesons of the informal leaders (jawara) at the apex of the social stratification, thedemocratization of mass education brought a change in the social configuration. Nolonger was education confined to them. Nonetheless, because of their socio-economicstanding, the sons of the informal leaders still govern the local day-to-day activitieseither in the capacity of administrative village heads, thus formally assigned authority,or as local leaders. While prior to 1970 the communities knew only of two layers ofstratification, the informal/formal leaders and farmers, afterwards another social layercould be found, namely educated unemployed youth aspiring for social verticalmobility. On the one hand, unwilling to work in the field, on the other hand unable tocompete for clerical works in Jakarta, these young educated groups take temporaryworks in the vicinity. Most of them either turned to work, became dependent on thebetter-off informal leaders, or remained at home unemployed.
In the 1970s the road was enlarged and repaired. Land speculation started to occur, asmany expected the area to grow assuming that the Jakarta land use plan was toexpand from north to south. Most of the lands were actually purchased by the informalleaders who paid an instalment to the farmers promising them full payments at a laterdate. Landless fanners continued to tend the land until the owner converted it forhousing. Many could not leave or purchase lands in other areas as payments were notfully made by the leaders who expected to resell the lands to real estate developers.As expansion of Jakarta took place from west to east, the economy of the communityfaltered. In addition, many of the children did not want to work on the land. Hence,most of the lands turned into shrublands rather than remaining as vegetable or fruitgardens. This condition has brought in real estate developers attracted by the lowprices of land, and they established low-cost housing for low-middle class workerswho commute to Jakarta. At present, real estate housings have taken most of theprime locations. The older local people have been pushed farther into the lessproductive areas with difficult access to infrastructure. The younger ones remained aslaborers in the area or migrated into Jakarta.
406

4.2. Flores Communities
The two communities in Flores, the Iwanggets and Lio, are basically farmers. Incontrast to the Sawah Lama and Sawah Baru people, the speed of change takingplace is less drastic. The Iwanggete community is located in the mountainous region ofSikka between Ladat mountain in the west and the mountains Tarât Meat in the east.The Lio community is located also in the mountainous area of Detusoko and Wolowaruin Ende. Both are about 500-700m above sea level. Riverflow can be found onlyduring the rain season, and the dry season ranges from 7 to 8 months. The peoplesettled in the mountain areas to avoid malaria rampant in the northern part of theregion even though this part is more fertile.
The social structure of the Lio consists of four social strata. At the apex is the mosalakiholding most of the power, followed by aji-ana family members of the mosalaki whoprotect the interests of the mosalaki. The third stratum is fai walu, the farmers, and thelast stratum is ata hoo, the landless peasants.
In contrast, the Iwanggete has only three layers of social strata. The first, ata duamoan consists of seven leaders, the landowner, the information leader, the securityhead, and 4 border leaders. The ata dua moan functions as community leaders,reigning over the local people. Most of the power is in their hands. The second layer,ata riwun gawan consists of the commoners, and the third one, the pariah of thesociety.
The two communities practice multiple-cropping systems. The main crops are rice andmaize. Maize are planted four to five days after the paddy. Dry rice planting method isemployed. In addition, they also plant sorghum. Other crops planted in between riceand maize are cassava and sweet potatoes. At present, the people of Iwanggete haveshifted their land use into cash crops such as coffee, cocao, and cloves. This shiftoccurred around the 1970s initiated by the Catholic Mission who organized thePancasila Farmers Association with the intention to promote crop diversificationmethods. However, as cash crops provided higher economic returns, the shift intoexclusive cash crop cultivation occurred.
In contrast, the Lio community still practices rice and maize planting, although on morea permanent basis than before. The introduction of cash crops was also done but asland tenure was in the hands of the mosalaki, the shift to cash crops did not take place.
4.3. Irian Jaya Communittee
While the two communities in Flores are rice and maize farmers, the two communitiesin Irian Jaya are basically forest-dwelling ones. Since 1989 the communities arelocated within concession area in Jaya Pura district. A joint Indonesian-Korean timbercompany holds the timber concession in this are for 339,100 hectares of forest. Thetwo communities, the Tabbeyan and Saniosa are located in Kaureh and Unumunguayrespectively where three rivers run through the area. The soil in the dwellers settlementis considered less fertile than in the marshes and riverbeds where the villagers obtaintheir sago plants.
407

Until 1991 the community was quite isolated and was only accessible by two and halfdays hiking. After the timber concession company built roads, the two communities areaccessible by motorbikes.
Historically, the first outsider entering the community was the missionary who arrived inthe 1950s and brought about changes to the community. The small dwellers wereencouraged to become a more settled community forming larger settlements. Thisprocess in turn resulted In a more permanent claim over the land and the naturalresources surrounding their settlement areas. As interclan wars were prohibited by themissionaries, the roles of war lords were reduced whereas the roles of the ondoafi orclan heads were increased to maintain social networks resulting in more clearly definedclan boundaries.
A drastic change occurred again in the 1980s with the Department of Social AffairsDecree 1983/84 and 1984/85 in which families from the two communities wereresettled into two main village settlements. The Tabbeyan were resettled in Taja areawhereas the Sentosa were resettled in Jadam area. Many families, having closebounds with their lands, refused to such resettlement as it would reduce substantiallytheir access to their gardens, sago and forest lands since the terrains where theresettlement areas were located were more difficult. Only after they were guaranteedaccess to extracting sago palms and opening gardens in the surrounding forest, andapparently with some coercive force from the military, did the resettlement processtake place (Tjitrajaya, 1993).
As indicated earlier, the main basis needs are fulfilled as dwellers, outing sago,gardening, hunting and fishing. The clan members, whether male or female, participatefully in the processing of sago as well as hunting and gardening. Most of the productsare for their own clan consumption.
LINE MISSING
ondoafi or the clan head families, and clan members. Ondoafi regulate their clanmembers access to forest-lands. As the ondoafi holds most of the decision-makingpower, clan members expect that he will take the lead in negotiating compensationswith the timber company. Conflicts in land use are reported to occur regularly.
These general backgrounds of the six communities observed portray the differences inlocal biophysical as well as social conditions. A closer look at how the communityinstitutions operate indicates several commonalties underlying the land cover change.
5. Community Institutions Related To Land Use
5.1. West Java Institutions
The social institution regulating land use in the two communities of Sawah Lama andSawah Baru in West Java has basically been replaced by a modern formaladministrative system of individual land ownership; and hence, individual land use.Traces of the old (traditional?) land-use system can still be found among the oldergeneration practising vegetable fruit gardening. While most of the lands are not ownedby them any more most of them still tend and benefit from the gardens while awaiting
408

the owners decision to vacate the land. The gardens are communally tended; that is,the members reciprocally assist each other in tending the gardens on a rotation basis.As fruits, such as jackfruits and durians, do not ripen simultaneously, reciprocalassistance takes place to deliver to the market. Whoever has the turn to go to themarket, will bring along marketable goods of others that day. It is the person'sresponsibility then to seek the best price offer in the market for their commodities. Theactual income from the fruit or vegetables is handed over to the owner without any cutsin transportation or opportunity cost.
Should the owner of the land claim the products of the fruit or vegetable gardens, thefarmer tending the land will hand over a small/insignificant amount of products as atoken of 'ownership' over the land. In other words, the farmers.perceive that they stillhave full rights over their labor tending the gardens.
The influx of newcomers, the residents of the housing compounds/real estates in thearea, had opened up new markets for their products. However, the farmers prefer tosell their products directly to the market rather than vending them among the housingcompounds, as products are bought in bulk in the market place.
The influx however, has a spillover effect on the younger groups. As most of thehouses have servants not employed from the local population, social interactionsamong the servants and the local youth take place within the compounds rather than attheir traditional meeting place where all members regardless of age come to gather.This results in generation gaps with no social institution regulating the interaction yet.
The local people have little to say in the conversion of land into housing real estates,as the community issuers themselves are heavily involved in the land transactions anddefining the local informal taxes levied upon the real estate developers. In other words,the land-use system is replaced by a more individual oriented one.
5.2. Flores Institutions
In the two communities in Flores, traditional land management still prevails for the totalplanting cycles of rice and maize. Social sanctions take place for non-compliance toregulations regarding prohibition to:
a. cut trees in other people's cropland,
b. grazing on land left to fallow,
c. vegetation burnings to forests for future croplands,
d. omit the responsibility to replant used croplands,
e. omit the responsibility to build terraces/dams to prevent land erosion.
The degree of sanctions depends on the level of offence committed. It ranges fromsimple warnings to monetary compensations. In order to reestablish equilibrium withinthe community between the offender and the offended, rituals are conducted. Theoffended party consists of two sides, the person/family and the land or soil itself.Towards the person/family the offender needs to offer compensation be it in monetaryor labor terms. Towards the land, the higher the offence the more complex theceremony that needs to be conducted. Among the Lio, the mosalaki or the communityleader defines the sanction, while among the Iwanggete the seven leaders of ata dua
409

moan serving as community executives have to agree on the level of offence as wellas the sanction.
While in the past the ata dua moan of the Iwanggete had the power to assign lands forfarming which were rotated among them, with the new administrative system of privateand individual property rights they lost their power as the concept of communalownership was eliminated. However, among the Lio where decisions about land use isin the hand of the mosalaki, single person assignments of lands for farming by themosalaki still takes place. In other words, communal ownership can prevail as long asit is congruent with the new administrative system.
Land-cover change, in this case the shift to cash crops among the Lio as a cropdiversification strategy introduced by the Catholic missionaries failed, as the role of themosalaki in defining as well as assigning land use still prevails. On the other hand,among the Iwanggete such as introduction was accepted, as the communityexecutives power over land ownership and land use has diminished. In other words,local contextual factors seem to play significant roles in defining land-use changes.
5.3. Irian Jaya Institutions
Forest ownership in Tabbeyan and Sentosa in Irian Jaya is vested in several patrilinealand exogamous clans. According to their institutional arrangements, a person hasaccess to obtain or use forest resources belonging to his/her clan, mother's clan,grandmother's clan, and wife's or husband's clan. Such local arrangements mightrelate to the fact that there have been extensive social relationships among the variousclans through marriage and the attendant exchange of presents. Members of a clanhave tended to seek intermarriage with members of as many other clans as possiblewithin a large area Marriage among most clans in Irian Jaya, according to van Baal(1953), has tended to be patrilocal. However, there have been no clan houses, thenewly-weds usually move into their own house (Adim, 1963).
Access to forest resources can be gained by non-members who are granted usepermits by heads of the clans. This has also been distributed and controlled by theheads of the clans, and tightly guarded by clan members. In the past, the clanmembers could severely punish those who were caught as trespassers on the scene,but nowadays severe sanctions of trespassers by resource owners have beensuppressed by the military. The owners are only allowed to chase away thetrespassers by harsh words.
The presence of the timber company in 1969, in the forest claimed by the Sentosa andTabbeyan has created social tensions as two different resource ownership systemsexist within a given area. Conflict incidences indicate that local ownership systems notonly regulate the use of forest resources, but also define the environmentalmanagement system of the land and the forest, such as which sago trees to leave andcut, and cyclic planting of the gardens. It seems that the prevalent societal valuesregard the forest as specific clan livelihood resources. Under the traditional view theplants are their resources. Therefore, timber cutting by the timber company is seen asviolating their property rights, hence the frequent compensation disputes. The value ofthe forest as livelihood resources persists as changes occur. When the companyemploys security guards, conflicts occurred when the "wrong" persons were assigned
410

to forest areas in which they do not have the clan-use-right. Those with the clan use-right claimed that they were the ones who should benefit from the income as securityguards for these areas.
As the people become more exposed to market forces as well as a more monetizedsociety, increased demands occur for monetary compensations for the trees cut. Evenif the timber company has paid the local government in Jayapura as local taxes, thepeople do not see this as benefiting their community, but the community of Jayapura,the people of Sentani and Tobati, not the people of Tabbeyan and Sentosa. The localpeople perceived that if the timber company had paid the Tobati and Sentani, then theyshould cut the Tobati's and Sentani's trees, not theirs.
Evidently, changes are taking place in these communities. In the process of adaptingto the change, traditional values of land and land tenure systems still continue. Whilepresent conflicts are mainly between the local people and the timber company, as thedwellings become more accessible by road, increased conflicts with outside hunterswill occur.
6. Discussion
Several tentative conclusions can be drawn from these cases:
a. Urbanization occurring in West Java, which changes the land cover into housingestates, tends to displace older local people further away from the locus ofactivities. The younger educated ones tend to migrate into the inner city/Jakartalooking for jobs rather than remaining in the area, or seasonally returning to thearea where their families live. Population characteristics change into ethnicallymore heterogeneous but socially more homogeneous.
b. In the case of West Java and Irian Jaya, the presence of better roads createscircular migration. However, in the case of Irian Jaya, clan-social-networkdictates the area to which they migrate circularly.
c. Land cover crop changes occur only when there is a certain congruency betweenthe existing system and the new system.
d. In all cases, the environment serves as livelihood resources to which localmanagement systems are applied.
e. More settled agricultural practices take place when more labor and time aredemanded by the crops planted or when the crops are considered to providehigher monetary rewards.
411

References
Adim, 1963
Allen, J.C. and D.F. Barnes. 1985. The causes of deforestation in developingcountries. Annuals of the Association of American Geographers, 75:163-84.
Blaikie, P. and H.C. Brookfield. 1967. Land Degradation and Society. London:Metheun.
Boserup, E. 1965. The Condition of Agricultural Growth, Chicago: Aldine.
Brookfield, 1993. Population, land management and environment. PLEC News andViews, 1, July 1993. Camberra: UNU.
Brouwer, F.M. and M.J. Chadwick. 1991. Land Use Changes in Europe. Dordrecht:Kluwer Academic Publ.
Ehrlich, P.R. and A.H. Ehrlich. 1990. The Population Explosion. New York: Simon andShcuster.
Falkenmark, M. and R.A. Suprapto. 1992. Population and environment linkages; awater perspective. Ambio: Population, Natural Resources, and Development. 21.January 1992. Stockholm: Swedish Royal Academy of Sciences.
Falkenmerk, M. and R.A. Suprapto. 1992. Population-landscape interactions indevelopment: a water perspective to environmental sustainability. In Ambio, 21(1)31-6.
Grainger, A. 1990. Population as concept and parameter in the modelling of tropicaluse change. Population and Environment Symposium. Ann Arbour, Michigan, Oct1-3.
IGBP Report #24;HDP Report #5, 1993. Relating Land Use and Global Land-CoverChange, Stockholm, IGBP.
Kummer, D. 1992. Deforestation in the Postwar Philippines, Chicago: University ofChicago Press.
Mahar, D.J. 1969. Government Policies and Deforestation in Brazil's Amazon Region.Washington, D.C.: The World Bank.
Ness, G. 1990. Population-environment dynamics in Southeast Asia. Population andEnvironment Symposium. Ann Arbour, Michigan. Oct. 1-3.
Okoth-Okendo. 1991. The Sacred Crown: Land Tenure Law in Kenya. University ofKenya.
Ramli, 1993.
Sanderson, S. 1993. The dynamics of land use and land cover change in comparativeperspective. Unpublished paper.
Suprapto, S.A. and I. Tjitrajaya. 1993. Differential access to resources and conflictresolution in a forest concession in Irian Jaya. Paper presented at Seminar onForest Management, Jakarta 3-5 September.
Tjitrajaya, 1993.
Turner, et al. 1990. The Earth as Transformed by Human Action. Cambridge:Cambridge University Press.
Van Baal, 1953.
412

CHAPTER 23
IMPACTS OF GLOBAL SEA LEVEL RISE ON CALIFORNIACOASTAL POPULATION RESOURCES1
Maurice D. Van Arsdol, Jr., Douglas J. Sherman, Angela Constable,Jinkang Wang, and Louise Rollin
(Departments of Sociology and Geography, University of Southern California, LosAngeles, California, USA)
1. Objectives
Global effects of human populations, organizations, and technologies upon theenvironment and subsequent feedbacks to populations now receive attention fromdemographers (Clarke, 1991). To our knowledge, coastal erosion rates, sea level riseand population changes have yet to be integrated into local resource, risk assessmentand social impact models. Our objectives are as follows:
(1) We will describe recent population changes in California counties and projectionsfor California coastal, bay and delta counties from 1990 to 2040.2
(2) We will delineate a preliminary enhanced-risk coastal zone on the Oxnard Plainof Ventura County, California, for potential sea level rise related hazards for theyears 1990 to 2040.
(3) We will make an initial assessment of potential impacts of sea level rise andidentify some possible mitigation measures. We will describe thesecircumstances for the Oxnard Plain.
(4) We will revise population projections for coastal areas of California to take intoaccount the shrinking land base, including that attributable to a future sea levelrise.
(5) We plan to develop a protocol for risk assessment in other coastal, bay, and deltaareas in California and elsewhere, and identify potential mitigation measures toreduce impacts of sea level rise on population.
We report our activities to date concerning the first three of these objectives. This is areport of research in progress; our analysis is illustrative rather than definitive. Likeother attempts to describe population-environment relations, our preliminary resultsvary according to the level of aggregation of our questions and data, the perspectivesof the disciplines from which they are asked and the time periods under consideration(Heilig, 1993; Keyfitz, 1993).
413

2. Background
It has been argued that a one meter rise in sea level world-wide could result in morethan 50 million environmental "refugees" or displaced persons globally (Jacobson,1990). The United States, with more than 19,000km of coastline, could be severelyaffected (Jacobson, 1990), including inundation of both east and west coast wetlands,and beach loss. Early projections of catastrophic sea level rise and widespread coastalinundation are no longer taken seriously. Nevertheless, current projections, at the levelof 100cm by 2100, suggest there are many locations where low-lying coastalenvironments are at risk from even small rises in sea level (e.g. Ellison and Stoddart,1991).
Population size, as well as production and consumption activities (expressed as grossdomestic product per capita), largely determines levels of CO2 emissions and isdescribed as contributing to global warming (Bongaarts, 1992; Bartiaux and Ypersele,1993). Global warming may, in turn, lead to sea level rise for two reasons: (1) waterexpands as it is heated, and (2) glacier and polar ice cap melting could increase thevolume of seas (Abrahamson, 1989), Sea level rise decreases the availability of landuseful for shelter and subsistence. Natural phenomena may be responsible for someportion of global warming; coastal population increases, however, can exacerbateimpacts.
Demographers have recently described population impacts of rising sea level (Nangiaand Banerji, 1993). Population-environment connections, including rising sea level,can be expressed as impact = population x affluence x technology, where affluence =consumption/population, and technology = impact/consumption (CICRED, 1992). TheMalthusian paradigm suggests that population growth eventually outstrips the ability ofthe (coastal) environment to provide resources (Malthus, 1798); population increasesare assumed to reduce affluence, or reduced affluence is assumed to decreasepopulation (CICRED, 1992). Mitigation includes decreasing levels of consumptionand/or technology. Optimists (Simon, 1981) suggest that scarcity limits degradation bydriving up (coastal) land prices. Following Boserup (1965), increasing technology suchas ocean barriers, may enhance the ability of the coastal environment to supportpopulation.
Effects of changes in population and land use "may go in both directions" (Lutz andHolm, 1993). Evaluations of rising sea level-population carrying capacity relationshipsare hindered by fuzzy concepts, a lack of data, and the fact that definitions of researchproblems, evaluations of acceptable risks, and specifications and implementation ofmitigation measures are all based on social constructions of the reality of risks. Theoptimist and Boserup paradigms may fit limited (coastal) ecosystems; nevertheless,Malthus correctly anticipated that there are global limits to resources available tosupport human populations. Following Shaw (1989), we view population growth andaffluence-technology determinants of environmental degradation as proximate andultimate causes, respectively. There appears to be greater resistance to changing thesocial mechanisms supporting current affluence-technology connections that generaterising sea level than resistance to changing population flows that represent populationadaptations (Shaw, 1989). This focuses our attention on the latter.
414

Two assumptions govern our considerations of impacts of rising sea level on Californiacoastal populations.
First, population growth is a proximate cause of decreasing land availability on theCalifornia coast (Koss, Van Arsdol, Jr., and Mongeau, 1987). By 1990, more than 26million persons, 87 per cent of the state's then 30 million persons, lived in coastalcounties (Fig. 1, Table 1). These counties were on the north coast, bay and deltaareas, central coast, and south coast. California's coastal county population in 1990was 20 per cent of the coastal county population of the United States. The sea levelrise of perhaps 10-15cm in the past century has had important impacts includingbeach erosion, recession of wetlands, and salt water intrusion into the bay and deltaregion, as well as other heavily populated regions (Revkin, 1992).
Second, perceived threats of global warming has raised concerns regarding potentialinundation of California coastal areas. Impacts would increase as population increases,and would affect urban and metropolitan areas, which are particularly vulnerable todisaster (Quarantelli, 1987). Redirecting populations away from all affected areas maybe unfeasible. Rising sea level is often not perceived as a problem, organizationalstrategies to mitigate risk are lacking, and land to support relocated populations maynot be available. If land is available, an extended time is needed to provideinfrastructures, and populations in existing coastal centers must often beaccommodated at higher densities and with dwindling resources (Jacobson, 1990).
3. Methods
We consider global sea level rise to be a background (macro) characteristic anddescribe superimposed local (meso) effects. Our methods are as follows:
We first describe population trends and projections for the State of California and the29 California coastal or bay counties as defined by the Strategic EnvironmentalAssessments Division of the National Oceanic and Atmospheric Administration(NOAA, n.d.i.a). Seven of these counties are non-metropolitan, the remaining 22 aremetropolitan; 5 are on the north coast, 13 on the bay and delta region, 5 on the centralcoast, 6 on the south coast, and 9 are inland counties classified as coastal by NOAAwhose populations affect and are affected by coastal ecology (Fig. 1, Footnote 2).Projections from 1990 to 2040 are based on those of the state's Department of FinancePopulation Research Unit (1993).3 Long-term projections are necessary due to theneed to plan for long-term disruption of coastal populations and infrastructures thatmay be occasioned by sea level rise.
Second, we delineate an enhanced risk zone. Outcomes of global sea level rise aretypically localized and have been described in anecdotal rather than exhaustive terms(Jacobson, 1990). We evaluate future coastal hazard risks, including horizontal(erosional) and vertical (sea level) changes, for the State of California. We willdelineate an enhanced risk zone in three steps. The first step is to describe coastalcounties and their populations, including inland counties classified as coastal areas orbays (Fig. 1). The second step is to describe coastal census tracts of coastal counties.The third step is to provide an illustrative description of a potential enhanced risk zonewithin Ventura County. We describe this zone by using US Bureau of the Census
415

TIGER/line 1992 files to delineate census tracts and then overlay physical featuresfrom digital line graphs, based on an analysis of US Geological Service topographicmaps.
Third, we will attempt to meld coastal erosion rates, sea level rise projections,population projections, and organizational factors affecting possible mitigationalternatives into risk assessment and social impact descriptions.
4. Population Trends in Coastal Counties
The first step in delineating an enhanced risk zone is to describe California's coastalcounties and their populations. California's population historically grew more swiftlythan that of the United States as a whole. It increased from less than half a millionpersons in 1860, when California had one per cent of the nation's population, to nearly30 million in 1990, 12 per cent of the nation's population. During the 1980s, the stateadded approximately 6.1 million persons; about 37 per cent from net in-migration and63 per cent from natural increase.
Population growth in California's coastal counties closely follows that of the state (Fig.2). High numerical growth occurred in the 1950s, growth was less in the 1960s and1970s and the highest growth occurred during the 1980s. These trends were apparentin each of the 4 coastal regions.
The total population of the 29 coastal counties (including the 9 inland countiesclassified as coastal by NOAA) increased by 25 per cent, from 21.0 million in 1980, to26.3 million in 1990 (Table 1, Fig. 2, Appendix Table 1). Growth for the coastalcounties was greatest in the south coast, followed by the bay and delta area. In 1980,the coastal counties contained 89 per cent of the state's population. The land area ofthese counties accounts for 201,580km2 or 50 per cent of the state's total land area.The 1990 total populations for the 4 coastal areas were as follows: 280,000 for thenorth coast, almost 7.8 million for the bay and delta area, 1.2 million for the centralcoast, and 17.0 million for the south coast.
The share of California population in coastal counties peaked at 90 per cent in 1970, isnow decreasing and is projected to continue to decrease. The south coast share was57 per cent in 1990 and is relatively constant. The bay and delta share was 26 per centin 1990 and is slowly decreasing. The central coast and north coast shares in 1990were 4 and less than one per cent, respectively.
California's two largest metropolitan clusters are located on the coast; the SanFrancisco-Oakland-San Jose Consolidated Metropolitan Statistical Areas (CMSAs) inthe bay and delta area and Los Angeles-Riverside-Anaheim (CMSA) on the southcoast. Each cluster is integrated into a separate regional economy ranked among theworld's largest and each is an economic and social focus for the Pacific Rim, makingfor metropolitan dominance of the physical ecology of the bay and delta areas andsouth coast (Fig. 1).
416

North coast
Bay
San
0l__
and delta
Francisco,Oakland,San Jose
Central
o
Oo
©
1
^4Qr
XT
1 nrv
illcoast ^ 4 l \ ^
^ s
South coast •
Los Angeles,Anaheim, ^Riverside
km 400I i i
/ J
/
A
\
\
\
\
\
\
\
\
\
Mexico
N o r t h c o a s tDel NorteSiskiyou 'Trinity*MendocmoHumboldt
B a y a n d d e l t aSonoma (PMSA)Napa (PMSA)*Yolo (MSA)*Sutter (MSA)'Sacramento (MSA}San Joaquin (MSA)'SoJano (PMSA)Contra Coasta (PMSA)Alameda (PMSA)
12345
I123456789
10 Santa Clara (PMSA)11 San Mateo (PMSA)12 San Francisco (PMSA)13 Marin (PMSA)
Central coast1 Santa Cruz (PMSA)2 San Benito'3 Monterey (MSA)'4 San Luis Oblapo5 Santa Barbara (MSA)
S o u t h coast1 Ventura (PMSA)2 Los Angeles (PMSA)3 San Bernardino (PMSA)'4 Riverside (PMSA)'5 San Diego (MSA)6 Orange (PMSA)
PMSA Primary Metropolitan Statistical AreaMSA Meiropoloitan Statistical Area
— • • Consolidated Metropolitan Statistical Area• Inland counties classified as coastal
Fig. 1. California coastal counties, by definitions of the U.S. National Oceanic andAtmospheric Administration (NOAA).
417

Population growth
(Millions)
COOO
rai
cCOO
S"35•o
•ocCO
CO
m
1toCOoo
oz
1
tot
0)Œ
*-•CO
DCOoÜ
x:3O
CO
1
IlllllllltlJ I ©
3O
CO
Fig. 2. Decennial population growth of State of California and coastal counties:enumerated 1940-90 and projected 2000-40.
418

5. Population Changes in the Coastal Strip of Coastal Counties
The second step in designating an enhanced risk zone is to describe coastal censustracts in coastal counties. A preliminary analysis of population and housing changesfrom 1970 to 1990 was carried out for the coastal strip of census tracts along theshoreline of the 20 NOAA defined coastal counties with a shoreline containing coastalcensus tracts.4
The population on the immediate California coast may now be pressing on theresidential resource base. By 1990, 7 per cent of the population of the 20 coastalcounties lived in the strip of coastal census tracts compared with 8 in 1980 and in1970. Nevertheless, between 1970 and 1990, the population of the coastal stripincreased by approximately 400,000 persons, 1.3 million to 1.7 million, adding 226persons/km of shoreline. More than four-tenths (42 per cent) of this growth wasconcentrated in coastal tracts of the metropolitan south coast. In 1990 the percentageof population in the coastal strip was 32 on the north coast, 7 on the bay and delta, 29on the central coast, and 5 on the south coast.
There is a lack of public lands in California coastal areas, and local governments arealso losing some of their abilities to preserve land. Larger populations are now exposedto the risk of rising sea levels and land loss due to coastal erosion and subsidence.Population activities contribute to coastal environmental instability by increasingseacliff or bluff erosion, lowering water tables in coastal areas through irrigation,blocking sand input into shoreline areas, and by contributing to air, land, and waterpollution. Approximately 86 per cent of the 1774km coastline of the state for example,is reported to be eroding (Edgerton, 1991). Future loss in the coastal land base,including inundation, when combined with other growth constraints, can reduce theability of the coastal zone to support human populations. A scarcity of coastal land andcurrent land use restrictions may drive up housing prices and inhibit growth on thecoast. The population of the coastal census tracts of the 20 coastal counties increasedless rapidly between 1970 and 1990 (32 per cent) than did the population of the inlandcensus tracts (41 per cent) of these coastal counties. The number of housing unitsincreased more rapidly in coastal tracts (54 per cent) than in non-coastal tracts (49 percent). The differences between population and housing units were greater in coastalthan non-coastal tracts.
Median rent and housing unit values (indexed to 1990) were higher for coastal censustracts than for the remainder of the 20 coastal counties and the coastal counties overallfor 1970, 1980, and 1990. The median household income (indexed to 1989) was lowerfor coastal census tracts than for non-coastal tracts and the coastal counties overallduring this period (Fig. 3). The difference in housing unit values and median householdincome between coastal tracts and the remainder of the coastal counties increasedmore rapidly during the 1980s than in the 1970s. These trends suggest but do notverify a connection between scarcity of coastal land and inhibited population growth.
419
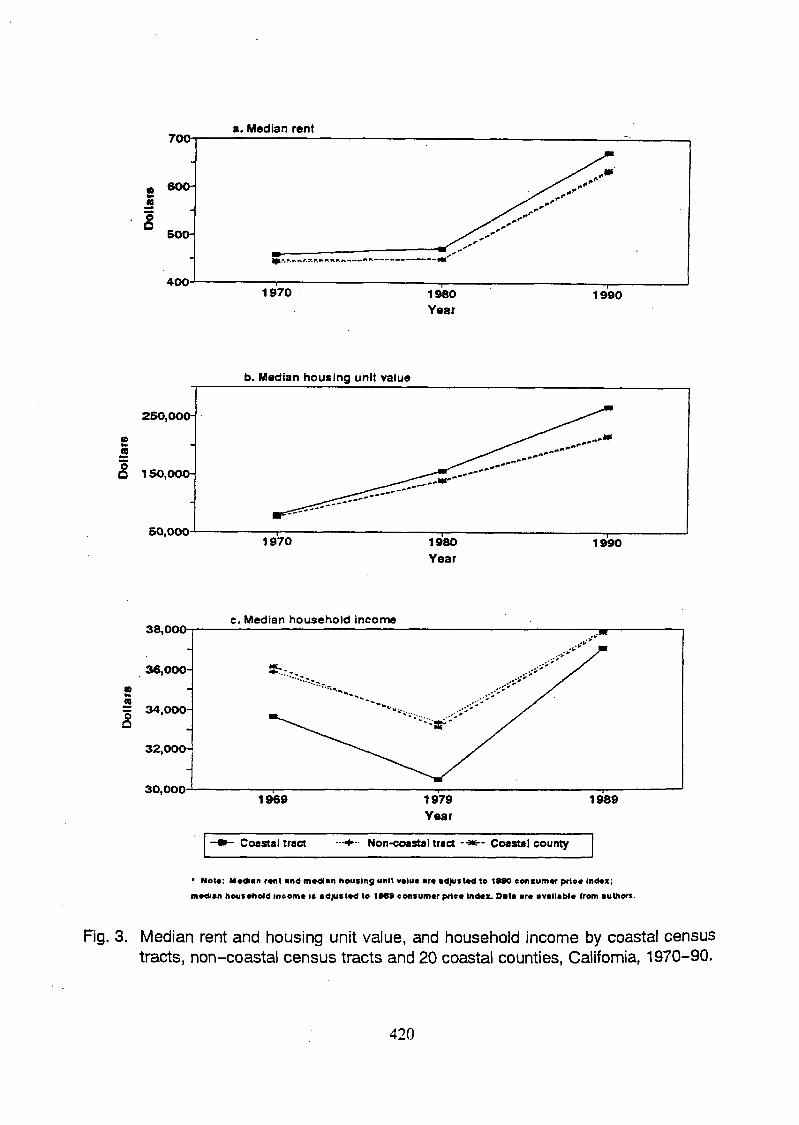
(S
i
70a
600-
500-
4 0 0
a. Median rent
1990
250,000-
£n
O 150,000-
50,000
b. Median housing unit value
38,000c. Median household income
1989
Coastal tract -+•- Non-coastal tract -•**•- Coastal county
' Net«: Median rent and median housing unit valu« ar« adjusted to 1S90 consumer prioe index;
median household income is adjusted te IMS consumer price index. Data are available from authors.
Fig. 3. Median rent and housing unit value, and household income by coastal censustracts, non-coastal census tracts and 20 coastal counties, California, 1970-90.
420

6. Population Projections for Coastal Counties
Significant future population growth in California is projected after the state recoversfrom the current economic recession. "The state's demographic underpinnings remainstrong" according to Morrison (1993). Recent growth provides demographicmomentum, migration to California has global origins, and the economic pull of thestate is likely to resume, although it is too soon to determine the future mix of non-skilled versus skilled employment (Koss, Van Arsdol, and Mongeau, 1987; Morrison,1993). Nevertheless, economic downturns, resource shortages, inadequateinfrastructures, environmental and social deterioration, earthquakes and other naturaldisasters, and community growth limitation policies will eventually constrain growth.
The illustrative projections are to help delineate potential impacts of rising sea leveland not to emphasize future human numbers. From 1990 to 2040, California populationis projected to increase from 29.8 to 63.3 million persons, an increase of 113 per cent(State of California, Department of Finance, 1993) (Table 1, Appendix Table 1).Coastal counties are projected to increase from 26.2 million in 1990 to 52.2 million in2040, an increase of 99 per cent. Population could more than double on the southcoast, increasing from 17 to 36.2 million. In the bay and delta area, the increase couldbe from 7.8 to 13.1 million (Fig. 4).
421

Population
(Millions)
COCOoÜ
"cck—
4—>
c0)O
*1
CO
"55"ö
-ocCO5 KCOCD
•f
"coCOooszo•z.
\
o<Drr<fu
CO
tCOcooo10ot
11•
COco0o(—3oCO
0
XI0
o(0
Fig. 4. California coastal population: enumerated 1940-90 and projected 2000-40.
422

As coastal land becomes more populated, commercial developers and communitiesattempting to preserve open spaces engage in a conflict over coastal land userestriction. If future population growth saturates the south coast, the bay and deltaareas, and the central coast, then further growth is to be expected in inland areas andalong the north coast. Urbanization could eventually dominate the entire Californiacoast with the possible exception of the north coast whose timber and canningindustries are now too weak to attract newcomers.
7. Ventura County Coastal Impacts
The third step in specifying an enhanced risk zone for sea level rise is to describe sucha zone in Ventura County. Our measurements here are preliminary, pending ourdetermination of 1994 mean sea level, which will be used as a benchmark forprojecting future sea level rise. Rising sea level affects the Ventura County coastalzone ecosystem in several ways, including reducing fresh water supplies, acceleratingbeach and cliff erosion, reducing wetlands, dunes, and protective shoreline, andreleasing soil bound chemicals on agricultural land. The sandy barrier beach; whichadvanced by more than 150 m over the last century (Hamblin, 1951), is currentlyretreating as a consequence of dam and break water construction and sand miningactivities. The enhanced risk coastal zone here comprises a broad alluvial lowland areaof approximately 405km2 the Oxnard Plain, with 28km of shoreline between theVentura River and Point Mugu (Griggs, 1985), including an area overlying a decliningaquifer (California Department of Water Resources, 1967) (Table 2).
Due to its low elevation, much of the Oxnard plain would be affected by sea level rise;the census tracts immediately bordering the ocean are considered to be an enhancedrisk zone particularly subject to rising tides (Fig. 5). Natural ecosystems are not theonly potential casualties of rising sea levels; also threatened are residential structures,sewage treatment plants and other commercial facilities (Griggs and Lauret, 1985).Significant population displacement and property loss could occur in the enhanced riskzone. The coastal census tracts contain high density housing, major resort and hotelcomplexes, three harbors (Port Hueneme, Channel Island Harbor and Ventura Harbor),and a Marine Corps base at elevations estimated as <3m above sea level, excludinghigh tide measurements.
423

Table 2. Summary data for Ventura County, coastal and non-coastal tracts,Oxnard Plain, and preliminary enhanced risk zone, 1990
1990
Total population
Persons per room
Occupied housingunits
Persons per occupiedhousing unit
Vacant housing units
Persons in owner-occupied housingunits
Persons in renter-occupied housingunits
Owner-occupiedhousing units
Renter-occupiedhousing units
Total
668,666
0.54
217,298
3.08
11,180
435,666
219,937
142,262
75,036
Coastal tracts
122,248
0.64
36,662
3.33
3,418
63,332
54,968
19,138
17,524
Non-coastaltracts
546,418
0.52
180,636
3.02
7,762
372,334
164,969
123,124
57,512
Oxnardplain
326,871
0.58
104,324
3.13
5,786
189,905
128,504
61,624
42,700
Preliminaryenhancedrisk zone
40,097
0.47
14,745
2.72
2,419
18,816
19,024
6,796
7,949
Source: US Bureau of Census enumeration, 1990
424

Pierpont
Ventura Harbour
ChannelIsland
HarbourPort Huenemé
Enhanced risk zone,demarcated by 3 m contour line
Fig. 5. Enhanced risk zone and Oxnard plain, Ventura County, California, 1994.
425

The 1990 census enumerated population of Ventura County was 669,000; 18 per centor 122,248 persons resided in coastal census tracts, and 48 per cent or 326,900 livedwithin the approximated boundaries of the Oxnard Plain. Of the plain residents, morethan 40,100 (13 per cent) dwelled on land estimated as 3m or less above sea level, thearea most likely to experience the earliest impacts from sea level rise.
The State of California Department of Finance projections suggest that Ventura Countypopulation could reach 1,319,000 persons by 2040 doubling the 1990 population.Population increased 41 per cent during the 1970s or by 152,877 persons. The coastaltracts increased by 27,500, and the Oxnard Plain by almost 71,600. During the 1980s,county population increased 27 per cent or 141,600, and the coastal census tracts by24,000, while 61,000 persons were added to the Oxnard Plain.
While the coastal tract residents are presently experiencing problems due to chronicbeach erosion and periodic storm surges, real estate development continues at a rapidrate. Mounting insurance company concerns could lead to discontinuance of coveragein high risk zones, thus further limiting land resources and development and reducingavailable government tax sources (Berz, 1991).
8. Organizational Responses
Population impacts of rising sea level in California will be influenced and mitigated bythe "social construction" of the hazards, legislation, responses to legislation, actions byrelevant government agencies, and the monitoring of regulatory enforcement by"stakeholders" with sometimes opposing interests.7 These stakeholder groups and theirpositions are assumed to be as follows:
(1) Groups favoring population and development in coastal and delta zones —business organizations, real estate associations, developers, contractors, fishinginterests, and elected officials of some coastal communities.
(2) Groups advocating concentration of commercial and housing development inmore central, urban areas — elected and appointed officials in central citycoastal and delta area and their constituencies.
(3) Groups opposed to rapid coastal and delta population growth and to developmentof the open space of those areas and encouraging low-density housing in theenhanced risk zone — private sector insurance companies, environmental andneighborhood organizations, farmers affiliations and governmental agenciesinvolved in environmental protection and management.
(4) Groups desiring greenbelts and open spaces for parks particularly in enhancedrisk zones — local, national and international environmental and neighborhoodorganizations, parks and recreation departments (Koss and Van Arsdol, 1981).
Policy alternatives for distributing growth among regions of the state are limited. First,much of the area of inland counties consists of federal land — legal mandates andpublic sentiment tend to reserve these lands for uses that are incompatible with urbandevelopment. Second, most private non-urban land in inland counties is devoted toagriculture. Third, many residents of sparsely settled inland areas support local growthlimitation ordinances (Koss, Van Arsdol and, Mongeau, 1987). Tax incentives anddisincentives may also play a role in population distribution. Local governments—
426

counties and cities—have at their disposal population growth and distribution controlmeasures but local growth limitation has several negative economic and socialconsequences, including rising housing prices, increases in homelessness, acontracting economy and increased ethnic segregation (Koss, Van Arsdol andMongeau, 1987). Enactment and implementation of the policies necessary to distributeand manage population change depends on convincing various "stakeholders" thattheir interests and the welfare of the community in general will be served by land usepolicies.
9. Conclusions
Global warming may affect sea level resulting in coastal population impacts. Wedescribe population and social impacts of sea level rise in California. Local sea levelrise is expected to decrease the base of California's coastal zone land available forsettlement. Coastal population is increasing, and an increasing area is at risk forerosion and flooding.
Rapid population growth is projected for California's coastal counties which nowcontain nine-tenths of the state's population. For coastal areas in general (excludingthe north coast), large population growth is expected. Population increases inCalifornia's coastal neighborhoods will exacerbate the instability of the coastlineecology. Population growth in coastal neighborhoods of coastal counties from 1970 to1990 were not as rapid as in inland neighborhoods of these counties, perhapsreflecting increasing land scarcity and costs. Nevertheless, population increases arelikely to stimulate more intense development of coastal lands, and result in theurbanization of much of the California coast. Property loss and populationdisplacement resulting from any sea level rise could be high. In contrast to most pastvictims of environmental degradation and disasters, future "environmental refugees"from the California coast may be less economically disadvantaged.
Population growth impacts global land use (Jolly and Torrey, 1994). Rising coastalland values may eventually limit degradation, but there also appear to be limits in theability of the coastal environment to support populations. Population phenomena canbe regarded as proximate causes of coastal environmental degradation, but not alwaysthe most important cause. The nature of population-degradation relationships appearsto depend on the level of aggregation of questions and data, disciplinary perspectives,and time frames (Heilig, 1993; Keyfitz, 1993). As our research continues we willattempt to resolve some of these issues.
427

Footnotes
1Support is from the U.S. National Oceanic and Atmospheric Administration (NOAA)grant #NGA36GPO486. The views expressed are the authors and do not representthose of NOAA.
California coastal counties, listed in Figure 1 are as specified in NOAA (n.d.i.a). The672 coastal counties in the United States (285 on the Atlantic, 142 on the Gulf ofMexico, 87 on the Pacific, and 158 on the Great Lakes) accounted for almost 54 percent of the Nation's population and 25 per cent of the land area including Alaska in1990. Excluding Alaska, the proportion of the US land area classified as coastaldecreases to 17 per cent. Coastal counties had at least 15 per cent of their land areain the nation's coastal watershed, or, for counties that bisected the coastal watershed,had less than 15 per cent of their total land area in the coastal watershed andaccounted for at least 15 per cent of a coastal cataloguing unit. Also see US Bureau ofthe Census (1991) and NOAA (n.d.i.b).3The projections use a baseline cohort component method, assume a convergence ofcounty race/ethnic-specific fertility rates, and projected increases in life expectanciesfor race/gender groups, consistent with U.S. Census Bureau expectations. Migration isexpected to decline from 1990 to 1995 due to the current economic recession inCalifornia, but to increase thereafter and decline again after 2010.
*We excluded the 8 inland counties classified as coastal by NOAA, plus Napa countywhich has no coastal census tracts.
Population in the coastal census tracts in the 20 coastal counties was 1,259,243 and1,657,025 in 1970 and 1990 respectively. Housing units were 463,307 and 714,807.Population in the non-coastal tracts was 14,981,243 and 21,094,559 in 1970 and1990, respectively, housing units were 5,218,890 and 7,772,179.
'The Ventura Marina (Griggs, 1985:295) was nearly destroyed in a 1969 flood andremains vulnerable to seasonal storms, shoaling and potential sea level rise. TheOxnard Plain contains costly waterfront property with a 1990 average value for the110,000 housing units of the coastal census tracts of $259,880. This compares withan average housing unit value of $247,983 for the 188,300 housing units in the non-coastal tracts of Ventura County.7We are indebted to Margo Koss for the use of the "stakeholders" concept.
References
Abrahamson, D.E., ed. 1989. Global warming: the issue, impacts, responses. In TheChallenge of Global Warming. Washington, DC: Island Press and NaturalResources Defense Council. 3-34.
Bartiaux, F. and J.P. van Ypersele. 1993. The role of population growth in globalwarming. In Proceedings of the International Population Conference Montreal1993, Volume 4. Liège, Belgium: International Union for the Scientific Study ofPopulation. 33-48.
428

Bongaarts, J. 1992. Population growth and global warming. Population andDevelopment Review, 18:299-320.
Boserup, E. 1965. The Conditions of Agricultural Growth: The Economics of AgrarianChange Under Population Pressure. Chicago: Aldine Press.
Berz, G A 1991. The Worldwide Increasing Impact of Natural Catastrophes on theInsurance Industry. Paper presented at the International Decade for NaturalDisaster Reduction (IDNDR) Meeting, UCLA, Los Angeles, CA.
CICRED. 1992. Meeting on Population and Environment, organized by CICRED, theIUSSP Committee on Population and Environment, and the Département desSciences de la Population et du Développement of the Catholique University ofLouvain-la-Neuve, November, Catholique University of Louvain-la-Neuve,Louvain-la-Neuve, Belgium.
California Department of Water Resources. 1967.
Clarke, J.I. 1992. Population and environment an introductory note. Paper presentedat the Meeting on Population and Environment, organized by CICRED, the IUSSPCommittee on Population and Environment, and the Département des Sciences dela Population et due Développement of the Catholique University of Louvain-la-Neuve, November, Catholique University of Louvain-la-Neuve, Louvain-la-Neuve, Belgium.
Edgerton, C.T. 1991. The Rising Tide: Global Warming and World Sea Level.Washington, DC/Covelo, CA: Island Press.
Ellison, J.C. and D.R. Stoddart. 1991. Mangrove ecosystem collapse during predictedsea level rise: Holocene analogues and implications. Journal of Coastal Research,7:151-166.
Griggs, G. and S. Lauret, eds. 1985. Living with the California Coast, sponsored by theNational Audobon Society. Durham, NC: Duke University.
Hamblin, J.W. 1951. The source, transportation, and deposition of beach sediments,Beach Erosion Board Technical Memo 22:5-56.
Heilig, G.K. 1993. Neglected Dimensions of Global Land-Use Change: Reflections andData. WP 93-73, International Institute for Applied Systems Analysis, Laxenburg,Austria.
Jacobson, J. 1990. Holding back the sea. In L.R. Brown, et. al., eds. State of theWorld, New York: W.W. Norton and Co. 79-97.
Jolly, C.L and B.B. Torrey, eds. 1994. Introduction. In Population and Land Use inDeveloping Countries. Washington, DC: National Academy Press. 1-14.
Keyfitz, N. 1993. Resolution of inter-disciplinary contradictions and the use of science. in policy. Paper presented at a Seminar of the Netherlands Graduate School of
Research in Demography, Sept., Groninger, Netherlands.
Koss, M. and M.D. Van Arsdol, Jr. 1981. Population and environment in greater LosAngeles. Paper presented at the conference of the Center for Futures Research,USC, Los Angeles, CA.
429

Koss, M., M.D. Van Arsdol, Jr., and J. Mongeau. 1987. Population growth and policiesin California's coastal zone. Fifth Symposium on Coastal and Ocean Management.
Lutz, W. and E. Holm. 1993. Mauritus population and land use. In C.L Jolly and B.B.Torrey, eds. Population and Land Use in Developing Countries, Washington, DC:National Academy Press. 28-104.
Malthus, T.R. 1798. An essay on the principle of population.. In P. Appleman, ed. AnEssay on the Principle of Population, New York: W.W. Norton, 1976.15-39.
Morrison, P. 1993. A California that can work: people, productivity, and energy. RANDpaper. Santa Monica, CA.
Nangia, S. and A. Banerji. 1993. Some aspects of population pressure and builtenvironment along the coast of India. Paper presented at the General Conferenceof the International Union for the Scientific Study of Population, Aug., Montreal,Canada.
NOAA. n.d.i. (a) NOAA's List of Coastal Counties for The Bureau of the CensusStatistical Abstract Services.
NOAA. n.d.i. (b) NOAA's Coastal Assessment Framework. Strategic EnvironmentalAssessments Division, Data Management and Geographic Information SystemsGroup.
Quarantelli, E.L 1987. What should we study? Questions and suggestions forresearchers about the concept of disasters. International Journal of MassEmergencies and Disasters, 5:7-32.
Revkin, A.R. 1992. Global Warming, Understanding the Forecast. New York: AbbevillePress.
Shaw, R.P. 1989. Rapid population growth and environmental degradation: Ultimateversus proximate factors. Environmental Conservation 10, 3:199-208.
Simon, J. 1981. Population: The Ultimate Resource. Princeton, NJ: PrincetonUniversity Press.
State of California, Department of Finance, Demographic Research Unit. 1993.Population Projections by Race/Ethnicity for California State and its Counties,1990-2040, Report 93, P1 Series.
U.S. Bureau of the Census. 1991. Postcensal Estimates of Coastal Counties based on1992 NOAA Definitions: July 1, 1991, Table 91-3B. Coastal County Display,Population Estimates Branch, Statistical Information Branch.
430

CICRED, 66 bis, Avenue Jean Moulin, 75014 PARIS (France)Téléphone : [33 1] 42.18.20.19Télécopie : [33 1] 42.18.21.65E-Mail : [email protected]
http://www.cicred.ined.fr