Development and Validation of an Explicit Aggressive Beliefs and Attitudes Scale
12
Michel, J. S., Pace, V. L., Edun, A., Sawhney, E., & Thomas, J. (2014). Development and validation of an explicit aggressive beliefs and attitudes scale. Journal of Personality Assessment, 96(3), 327-338. DOI: 10.1080/00223891.2013.832260 PUBLISHED IN Journal of Personality Assessment, 96(3), 327–338, 2014 ISSN: 0022-3891 print / 1532-7752 online DOI: 10.1080/00223891.2013.832260 Development and Validation of an Explicit Aggressive Beliefs and Attitudes Scale JESSE S. MICHEL, 1* VICTORIA L. PACE, 1 ANYA EDUN, 1 ENA SAWHNEY, 1 AND JEFFREY THOMAS 2 1 Department of Psychology, Florida International University 2 Stern School of Business, New York University This work outlines the development and validation of a new self-report measure that assesses explicit aggressive beliefs and attitudes within the normal adult population (using 7 samples, total N = 3,533). These explicit aggressive beliefs and attitudes are expected to reflect aggressive biases including hostile attribution, potency, retribution, victimization by powerful others, derogation of target, and social discounting. The resulting scale is reliable with a hierarchical 6-factor structure, and displays convergent and discriminant validity. Criterion-related validity studies indicate incremental effects over socially desirable response bias, related implicit and explicit aggression measures, and is predictive of self-reported and other-reported aggression-related behaviors. Social-cognitive theory revolves around how people think and interpret their social world, and has become a dominant the- oretical perspective for understanding how personality and in- dividual differences are related to coherent patterns of human behavior (Dweck & Leggett, 1988; Fazio, Jackson, Dunton, & Williams, 1995; Greenwald & Banaji, 1995; Mischel & Shoda, 1995). The social-cognitive framework and related research has shown that both implicit social cognitions and explicit social cognitions are important for understanding how personality af- fects behavior (Bing, LeBreton, Davison, Migetz, & James, 2007; Frost, Ko, & James, 2007; Gawronski & Bodenhausen, 2006). Implicit and explicit social cognitions are theoretically, operationally, and empirically distinct, and serve as meaningful yet separate components of rudimentary personality structure: where implicit social cognitions refer to the effortless and auto- matic (i.e., unconscious) thoughts pertaining to an individual’s beliefs, attitudes, and behaviors; and explicit social cognitions refer to corresponding introspective and controlled (i.e., con- scious) thoughts pertaining to an individual’s beliefs, attitudes, and behaviors (Greenwald & Banaji, 1995). Recent research has shown each to have unique and often interactive explana- tory power through various mechanisms in a variety of basic and applied research settings (e.g., mediation, moderation, indepen- dent and additive coaction; see Bing, LeBreton, et al., 2007; Frost et al., 2007; Gawronski & Bodenhausen, 2006). Because implicit social cognitions occur outside conscious awareness, scholars generally agree that this component of per- sonality must be assessed through indirect methods (Fazio & Olson, 2003; Greenwald & Banaji, 1995; Karpinski & Hilton, 2001; Nosek, Greenwald, & Banaji, 2005). Traditionally, re- searchers and practitioners have assessed various implicit social *Address correspondence to Jesse S. Michel, who is now at: Auburn University, Department of Psychology, 226 Thach Hall, Auburn, AL, 36849-5214 Email: [email protected] cognitions via projective techniques such as the Thematic Ap- perception Test (Lilienfeld, Wood, & Garb, 2000) or Implicit Association Tests (Greenwald, McGhee, & Schwartz, 1998). More recently, James and colleagues (e.g., James, 1998; James & LeBreton, 2012; James & McIntyre, 2000; James et al., 2005) have developed a framework for the measurement of motive- based biases in reasoning and inference founded on conditional reasoning methods (the Conditional Reasoning Test [CRT]) and underlying cognitive biases; CRTs have been developed for the constructs of achievement motivation (CRT–AM) and aggres- sion (CRT–A). The basic premise for conditional reasoning is that aggressive people, for example, often think of their actions as reasonable, whereas nonaggressive people do not see the same rationale (Baron & Richardson, 1994; Baumeister, Smart, & Boden, 1996). Therefore aggressive people will rely on im- plicit cognitive biases, which James and colleagues refer to as justification mechanisms, to rationalize or justify their behavior (i.e., because people are motivated to believe their actions are reasonable); thus reflecting the personality and underlying im- plicit social cognitions of the individual. The biases associated with aggression as summarized by James and colleagues (James, 1998; James & Mazerolle, 2002; James et al., 2005) are: 1. Hostile attribution: Tendency to see harmful intent in the actions of others (E. Anderson, 1994; Crick & Dodge, 1994; Tedeschi & Nesler, 1993; Toch, 1993). 2. Potency: Tendency to frame and reason using the contrast of strength versus weakness (E. Anderson, 1994; Gay, 1993; Millon, 1990). 3. Retribution: Tendency to confer logical priority to retalia- tion over reconciliation (Bradbury & Fincham, 1990; Dodge, 1986; Laursen & Collins, 1994). 4. Victimization by powerful others: Tendency to frame oneself as a victim and as being exploited by the powerful (Averill, 1993; Finnegan, 1997; Toch, 1993).
Transcript of Development and Validation of an Explicit Aggressive Beliefs and Attitudes Scale

Michel, J. S., Pace, V. L., Edun, A., Sawhney, E., & Thomas, J. (2014). Development and validation of an explicit aggressive beliefs and attitudes scale. Journal of Personality Assessment, 96(3), 327-338. DOI: 10.1080/00223891.2013.832260
PUBLISHED INJournal of Personality Assessment, 96(3), 327–338, 2014
ISSN: 0022-3891 print / 1532-7752 onlineDOI: 10.1080/00223891.2013.832260
Development and Validation of an Explicit Aggressive Beliefsand Attitudes Scale
JESSE S. MICHEL,1* VICTORIA L. PACE,1 ANYA EDUN,1 ENA SAWHNEY,1 AND JEFFREY THOMAS2
1Department of Psychology, Florida International University2Stern School of Business, New York University
This work outlines the development and validation of a new self-report measure that assesses explicit aggressive beliefs and attitudes within the normal adult population (using 7 samples, total N = 3,533). These explicit aggressive beliefs and attitudes are expected to reflect aggressive biases including hostile attribution, potency, retribution, victimization by powerful others, derogation of target, and social discounting. The resulting scale is reliable with a hierarchical 6-factor structure, and displays convergent and discriminant validity. Criterion-related validity studies indicate incremental effects over socially desirable response bias, related implicit and explicit aggression measures, and is predictive of self-reported and other-reported aggression-related behaviors.
Social-cognitive theory revolves around how people think andinterpret their social world, and has become a dominant the-oretical perspective for understanding how personality and in-dividual differences are related to coherent patterns of humanbehavior (Dweck & Leggett, 1988; Fazio, Jackson, Dunton, &Williams, 1995; Greenwald & Banaji, 1995; Mischel & Shoda,1995). The social-cognitive framework and related research hasshown that both implicit social cognitions and explicit socialcognitions are important for understanding how personality af-fects behavior (Bing, LeBreton, Davison, Migetz, & James,2007; Frost, Ko, & James, 2007; Gawronski & Bodenhausen,2006). Implicit and explicit social cognitions are theoretically,operationally, and empirically distinct, and serve as meaningfulyet separate components of rudimentary personality structure:where implicit social cognitions refer to the effortless and auto-matic (i.e., unconscious) thoughts pertaining to an individual’sbeliefs, attitudes, and behaviors; and explicit social cognitionsrefer to corresponding introspective and controlled (i.e., con-scious) thoughts pertaining to an individual’s beliefs, attitudes,and behaviors (Greenwald & Banaji, 1995). Recent researchhas shown each to have unique and often interactive explana-tory power through various mechanisms in a variety of basic andapplied research settings (e.g., mediation, moderation, indepen-dent and additive coaction; see Bing, LeBreton, et al., 2007;Frost et al., 2007; Gawronski & Bodenhausen, 2006).
Because implicit social cognitions occur outside consciousawareness, scholars generally agree that this component of per-sonality must be assessed through indirect methods (Fazio &Olson, 2003; Greenwald & Banaji, 1995; Karpinski & Hilton,2001; Nosek, Greenwald, & Banaji, 2005). Traditionally, re-searchers and practitioners have assessed various implicit social
*Address correspondence to Jesse S. Michel, who is now at: Auburn University, Department of Psychology, 226 Thach Hall, Auburn, AL, 36849-5214Email: [email protected]
cognitions via projective techniques such as the Thematic Ap-perception Test (Lilienfeld, Wood, & Garb, 2000) or ImplicitAssociation Tests (Greenwald, McGhee, & Schwartz, 1998).More recently, James and colleagues (e.g., James, 1998; James& LeBreton, 2012; James & McIntyre, 2000; James et al., 2005)have developed a framework for the measurement of motive-based biases in reasoning and inference founded on conditionalreasoning methods (the Conditional Reasoning Test [CRT]) andunderlying cognitive biases; CRTs have been developed for theconstructs of achievement motivation (CRT–AM) and aggres-sion (CRT–A). The basic premise for conditional reasoning isthat aggressive people, for example, often think of their actionsas reasonable, whereas nonaggressive people do not see thesame rationale (Baron & Richardson, 1994; Baumeister, Smart,& Boden, 1996). Therefore aggressive people will rely on im-plicit cognitive biases, which James and colleagues refer to asjustification mechanisms, to rationalize or justify their behavior(i.e., because people are motivated to believe their actions arereasonable); thus reflecting the personality and underlying im-plicit social cognitions of the individual. The biases associatedwith aggression as summarized by James and colleagues (James,1998; James & Mazerolle, 2002; James et al., 2005) are:
1. Hostile attribution: Tendency to see harmful intent in theactions of others (E. Anderson, 1994; Crick & Dodge, 1994;Tedeschi & Nesler, 1993; Toch, 1993).
2. Potency: Tendency to frame and reason using the contrastof strength versus weakness (E. Anderson, 1994; Gay, 1993;Millon, 1990).
3. Retribution: Tendency to confer logical priority to retalia-tion over reconciliation (Bradbury & Fincham, 1990; Dodge,1986; Laursen & Collins, 1994).
4. Victimization by powerful others: Tendency to frame oneselfas a victim and as being exploited by the powerful (Averill,1993; Finnegan, 1997; Toch, 1993).

328
5. Derogation of target: An attempt to make the target moredeserving of aggression (James & Mazerolle, 2002; Wright& Mischel, 1987).
6. Social discounting: Tendency to call on socially unorthodoxand antisocial beliefs to interpret and analyze social eventsand relationships (Finnegan, 1997; Millon, 1990).
Unlike implicit social cognitions, explicit social cognitionsoccur within conscious awareness and are easily accessedthrough introspection and direct methods (Greenwald & Banaji,1995; McClelland, Koestner, & Weinberger, 1989), resulting inthe near ubiquitous use of self-report questionnaires. Researchhas shown both implicit and explicit social cognitions are im-portant for understanding how personality affects behavior andhave unique and often interactive predictive power (e.g., Bing,LeBreton, et al., 2007, Bornstein, 2002; Winter, John, Stewart,Klohnen, & Duncan, 1998). Within the personality assessmentfor aggression literature, Frost et al. (2007) tested and foundsupport for an integrative model (i.e., channeling hypothesis)of aggression using the CRT–A and the Angry Hostility Scalefrom the NEO Personality Inventory (Costa & McCrae, 1992).Similarly, Bing, Stewart, et al. (2007) provided and testedan integrative typology and found meaningful interactiveeffects between the CRT–A and several explicit aggressivenessmeasures (Angry Hostility scale from the NEO PersonalityInventory, Form A of the Personality Research Form [PRF];Jackson, 1968) in the prediction of multiple criteria includingdishonesty, traffic violations, and organizational deviance.
Despite these significant theoretical advances and promisingempirical findings, there is no existing measure of the explicitsocial cognitions associated with the six aggressive biasesoutlined by James and colleagues (James, 1998; James &Mazerolle, 2002; James et al., 2005). This is an important gap inthe literature as researchers and practitioners must use existingpersonality questionnaires, such as the Angry Hostility scalefrom the NEO Personality Inventory or Form A of the PRF, asproxy measures for the explicit social cognitions associated withthese six biases. Therefore the goal of this research is to developand validate a multifactor self-report measure that can be usedindependently (for explicit assessment only) or in conjunctionwith the CRT–A (for joint implicit and explicit assessment) tomore fully assess the aggressive biases of hostile attribution,potency, retribution, victimization by powerful others, dero-gation of target, and social discounting. Literature suggeststhat these aggressive biases are associated with correspondingand easily assessable explicit social cognitions through beliefsand attitudes expressed freely by aggressive people (Fazioet al., 1995; Gawronski & Bodenhausen, 2006; Greenwald &Banaji, 1995; Karpinski & Hilton, 2001), for which there are noexisting self-report measures beyond that of hostility bias (cf.C. A. Anderson, Deuser, & DeNeve, 1995; Buss & Perry, 1992;Costa & McCrae, 1992). We believe such a measure will helpreveal incremental explicit aggressive beliefs and attitudes (i.e.,explicit social cognitions) that influence individual patterns ofappraisals, attributions, and behavior across situations.
SCALE DEVELOPMENT AND VALIDATION
In generating and validating this scale, we followed proce-dures outlined in the scale development literature (e.g., Hinkin,1998) commonly used in the psychological literature (e.g.,Ferris, Brown, Berry, & Lian, 2008). We present the findings of
this scale development in four phases: Phase 1 explains the itemgeneration, item reduction, and scale development procedures;Phase 2 details the psychometric properties of the resultant scale;Phase 3 details convergent and discriminant validity; and Phase4 details criterion-related validity evidence.
PHASE 1: ITEM GENERATION AND REDUCTION
Item Generation
Members of the scale development group, consisting of thetwo faculty and three doctoral student authors, independentlyand deductively developed items for the six aggressiveness fac-tors outlined by James (1998; James, McIntyre, Glisson, Bowler,& Mitchell, 2004). Items were carefully crafted following guide-lines for item generation that incorporated easy reading level,short direct statements, avoidance of words and phrases withmultiple connotations, and minimal overlap across factors. Thegroup then reviewed all generated items with a goal of retaining15 items per factor for initial testing (see Hinkin, 1998). Thisgoal was chosen because we aimed to develop a final scale of30 items (five items for each of the six factors) that providesproper psychometric properties and relatively broad constructassessment, yet is short enough to use in basic and applied re-search settings. This process resulted in 97 items (15–17 itemsper factor).
Item Reduction: Item-Sort Task
To examine the substantive validity of the developed itemswe employed an item-sort task, as these procedures are recom-mended in the early stages of scale development to determinewhich items best capture the construct of interest (J. C. Ander-son & Gerbing, 1991; Hinkin, 1998). Specifically, we calculatedthe proportion of substantive agreement (PSA) for each item.The PSA is calculated by nc/N, where nc represents the numberof participants who assigned an item to its posited construct andN is the total number of participants.
Ten independent graduate students were recruited to partici-pate in the item-sorting task, which is considered an appropri-ate sample size for this initial item reduction (J. C. Anderson& Gerbing, 1991; Ferris et al., 2008). We chose to utilize agraduate student sample given the complexity of the constructdefinitions. Each participant was given definitions of the aggres-siveness factors and trained in the use of a rating form to sort theinitial item pool into relevant categories. Based on the aggregateof the independent item-sort task, the majority of items achievedperfect PSA (1.00). However, given the preliminary nature ofthe item-sort task, and to ensure an adequate number of itemswere retained within each factor for further analysis, we utilizeda PSA cutoff of .80. This is consistent with previous research(e.g., Ferris et al., 2008) as PSA coefficients are used in a com-parative manner to retain a subset of items with the largest values(J. C. Anderson & Gerbing, 1991), and retaining items with PSAof .80 or greater helped balance substantive validity and scaleeconomy in this particular situation. Items that did not meet thiscutoff were eliminated from the item pool. This process resultedin a reduced set of 77 items (10–15 items per factor).
Item Reduction: Exploratory Factor Analysis
To further reduce the item pool and develop a parsimoniousyet multidimensional measure we conducted exploratory factoranalysis (EFA; see Hinkin, 1998). We conducted EFA on twodata sets: The first data set contained participant responses to
329
the previously reduced 77 items; the second data set containedresponses from an independent group of participants to 52 items,including the best functioning items from the first EFA as wellas several newly written or revised items.
Participants and procedure. Undergraduate students froma large university in the southeastern United States partici-pated in the scale development study in exchange for courseextra credit. We collected useful data from 473 undergraduatestudents for initial scale development. An independent sam-ple of 348 participants from the same university contributedto a second data set that was used for scale refinement. De-mographic information indicated that participants were diverse(approximately 71% Hispanic, 11% White, 8% African Amer-ican, and 3% Asian/Pacific Islander, 7% “other”), the majoritywere female (72%), and participants ranged in age from 16 to 54(M = 21.56, SD = 4.51). These samples are appropriate for EFAgiven that individual differences are generally considered uni-versal and have been shown to be largely stable during and aftercollege (McCrae & Costa, 1997; Roberts & DelVecchio, 2000).
The initial item pool of 77 aggression items and standarddemographic items was administered in an online format to thefirst group of participants. The second sample of participantswas administered the best functioning items from the initialitem pool as well as additional items that were newly generatedor revised. The response scale for all aggression items followeda Likert-style format from 1 (strongly disagree) to 7 (stronglyagree). Responses were carefully screened to eliminate thosewith obvious random response patterns and large amounts ofmissing data.
Analytic strategy and results. With the first data set weconducted exploratory principal axis factoring with oblique ro-tation and Kaiser normalization to determine if the six intendedfactors were represented in the item pool and, if so, which itemswere the best indicators of each. Initial eigenvalues indicated oneprimary component with many smaller components exceedingthe 1.0 Kaiser criterion. However, because our aim was to de-velop a multidimensional scale of explicit aggressive beliefs andattitudes that would be made up of six theorized factors, we ex-amined a rotated six-factor solution and possible reduced factorsolutions (five, four, etc.) to aid in our selection of items. Thesix-factor solution was made up of four components easily in-terpretable as retribution, victimization, hostile attribution, andsocial discounting, plus one that consisted primarily of potencyitems, and one that was less interpretable; the five-factor solutionshowed the same four interpretable components and one con-sisting of primarily potency items; and with fewer factors eachcomponent become less interpretable. Thus, given the goals ofthe study, we chose the six-factor solution for item reduction.
Based on the .32 factor loading cutoff criteria recommen-dation of Tabachnick and Fidell (2001), we retained items thatdisplayed high loadings on the intended factor with low cross-loadings. To further reduce items, we examined item character-istics including item distributions, interitem correlations, itemredundancy, and coefficient alpha for each factor if items weredeleted. This process resulted in the retaining of the best five ret-ribution items, five victimization items, five hostile attributionitems, and five social discounting items from the interpretablefactors. These items yielded factor loadings on the intendedfactor of .45 or higher with relatively low cross-loadings(below .25). Additionally, we retained five potency items and
two derogation of target items for revision. Following theitem writing procedures outline earlier, we wrote 10 additionalitems for potency, 9 additional items for derogation of target, 4additional items for social discounting, and 2 additional itemsfor retribution, resulting in a total of 52 items for additionalitem reduction.
With the second data set the dimensionality of the 52 itemswas analyzed using principal axis factoring with oblique rota-tion and Kaiser normalization. Results suggested the presenceof six factors that were easily interpretable as the proposedfactors. To reduce these items into the desired multidimensionalmeasure we selected the five best items per factor using thetechniques already described. Thus the pool of 52 items wasreduced to 30 items with five representing each of the sixaggression factors. To ensure the stability of the factor structureand item loadings prior to confirmatory techniques, we followedthe recommendation of Worthington and Whittaker (2006) andreexamined the reduced 30 items within the same data set. Thesix factors that formed the final scale accounted for 42.5% of theitem variance. These factors, in order of variance accounted forin the items, were victimization by powerful others, derogationof target, retribution, hostile attribution, potency, and socialdiscounting. Each item exhibited a loading of .40 or greateron its expected factor with cross-loadings of .20 or below. Theresultant six-factor scale and loadings are presented in Table 1.
PHASE 2: PSYCHOMETRIC PROPERTIES
The psychometric properties of the newly developed explicitaggressive beliefs and attitudes scale were examined in regard tofactor structure and coefficient alpha reliability. Given the the-oretical foundation and empirical development of the explicitaggressive beliefs and attitudes scale, we proposed and tested ahierarchical model in which a superordinate aggressive beliefsand attitudes construct affects the six factor-level constructs ofhostile attribution, potency, retribution, victimization by power-ful others, derogation of target, and social discounting.
Participants and Procedure
A third independent sample of undergraduate students froma large university in the southeastern United States participatedin the study for extra credit. Participants took the survey on-line, which consisted of the 30-item explicit aggressive beliefsand attitudes scale developed in Phase 1 (see Table 1). We col-lected useful data on 930 participants. Demographic informationindicated that the sample was diverse (approximately 65% His-panic, 13% White, 8% African American, and 3% Asian/PacificIslander, 12% “other”) and ranged in age from 18 to 56 (M =21.02, SD = 3.96). This sample is appropriate for confirmatoryfactor analysis (CFA) given that individual differences are gen-erally considered universal and have been shown to be largelystable during and after college (McCrae & Costa, 1997; Roberts& DelVecchio, 2000).
Analytic Strategy and Results
CFA was performed to compare the fit of our hypothesizedmeasurement model to several alternative plausible models toprovide strong discriminant validity evidence among the sixfactors within the explicit aggressive beliefs and attitudes scale(Lance & Vandenberg, 2002). Specifically, we tested three mod-els: a single-factor model in which all items loaded on a com-mon latent construct; a six-factor model in which the six latent

330
TABLE 1.—Final scale items and principal axis factoring loadings.
Final Scale Factor Loadings
Item1 2 3 4 5 6
Victimization by powerful other bias items1. The wealthy capitalize on those who are
less fortunate..90
2. The rich get richer by taking advantageof the poor.
.72
3. I believe that large corporations exploittheir employees.
.53
4. Big companies intentionally rip offcustomers.
.47
5. Those in power stay in power bykeeping others down.
.45
Derogation of target bias items6. Some people are simply horrible human
beings..82
7. Some people are just bad people. .508. Some people are completely immoral. .499. There is not good in everyone. .4510. In general, people are either good or evil. .40
Retribution bias items11. Getting back at others makes me feel
better..76
12. If someone disrespects me, I feel theneed to get even.
.75
13. People have the right to get revenge. .7514. Revenge is sweet. .7415. If I am betrayed then I have the right to
retaliate..68
Hostile attribution bias items16. People gain others’ trust to betray them. .7217. Friendliness is often a disguise for
hostile intentions..60
18. People are motivated by a desire to harmothers.
.48
19. People make friends in order to usethem to get ahead in life.
.42
20. People give bad advice for personalgain.
.41
Potency bias items21. History is made through triumphs of the
strong over the weak..61
22. Life presents challenges that separatethe weak from the strong.
.57
23. I want to be stronger than others. .5724. Only the strong survive. .4825. It’s important to establish who’s boss. .40
Social discounting bias items26. Common sense overrides the need for
rules..54
27. I only follow rules that I find important. .5428. People follow too many unnecessary
rules..49
29. Laws are meant to be broken. .4730. Any social rule that gets in the way of
personal expression is a bad rule..43
Note. Items were assed in a random order across all samples, but are presented herebased on factor loadings. Factor loadings above .30 are presented. Recommended scale isa 7-point Likert scale ranging from 1 (strongly disagree) to 7 (strongly agree).
constructs were allowed to covary freely; and a hypothesized hi-erarchical model in which the superordinate aggressive beliefsand attitudes construct affects the six factor-level constructs.Following the recommendations of Hu and Bentler (1999), weused the maximum-likelihood-based standardized root meansquared residual (SRMR) and supplemented it with the rootmean square error of approximation (RMSEA). We chose the
FIGURE 1.—Hypothesized hierarchical model and associated standardized re-gression weights.
supplemental RMSEA as it accounts for parsimony, as well asthe ability for a confidence interval to be calculated around itsvalue. The Hu and Bentler two-index presentation strategy statesthat an RMSEA of .06 or lower and an SRMR of .09 or lowersuggests good model fit. Because models that differ in regardto the number of latent factors are not necessarily nested, weutilized the Akaike Information Criterion (AIC) index versus aχ2 difference test to compare our CFA models.
Results of the CFAs indicated that the single-factor model inwhich all items loaded on a common latent construct did not fitthe data well, χ2(405, N = 930) = 8393.78, p < .001, SRMR =.124, RMSEA = .146 (90% CI of RMSEA = [.143, .148]). Wethen tested the six-factor model in which the six latent con-structs were allowed to covary freely. This model fit the datavery well, χ2(390, N = 930) = 1381.74, p < .001, SRMR =.052, RMSEA = .052 (90% CI of RMSEA = [.049, .055]). Fi-nally, we tested the hypothesized hierarchical model in whichthe superordinate aggressive beliefs and attitudes construct af-fects the six factor-level constructs. As expected, this model alsofit the data very well, χ2(399, N = 930) = 1399.14, p < .001,SRMR = .050, RMSEA = .052 (90% CI of RMSEA = [.049,.055]). We then examined the AIC across the models tested, aswell as a baseline independence model. The AIC displayed thefollowing results: independence model = 14,926.46; one-factormodel = 8,573.78; six-factor model = 1,591.74; hierarchicalmodel = 1,591.14. Collectively these results suggest both thesix-factor and hierarchical models fit the data well. However,considering that the hierarchical model possesses the strongesttheoretical rationale and is more parsimonious with greater de-grees of freedom, we found these results supportive of the apriori hierarchical model. Standardized regression weights forthis model are presented in Figure 1. (Note: Factor-level itemorder follows the EFA loading order from Table 1.)
Coefficient alpha reliabilities were also examined at the factorand scale level. Reliabilities were moderately high at both thefactor (hostility attribution = .86, potency = .84, retribution =.92, victimization = .90, derogation of target = .79, and socialdiscounting = .79) and scale (α = .91) levels.
PHASE 3: CONVERGENT AND DISCRIMINANT VALIDITY
To develop the nomological network around the newly devel-oped explicit aggressive beliefs and attitudes scale, we examinedconvergent and discriminant validity with existing implicit and

331
explicit measures. Convergent validity represents the extent towhich a scale is related to other measures of the same or similarconstructs, whereas discriminant validity represents the extent towhich a scale exhibits low or nonsignificant relationships withmeasures of dissimilar constructs (Campbell & Fiske, 1959;Hinkin, 1998). We propose that the explicit aggressive beliefsand attitudes scale will display convergent and discriminant va-lidity with other measures of implicit and explicit aggressionand the Five-factor model of personality (FFM; cf. Barlett &Anderson, 2012).
Although the theoretical overlap between existing explicitaggression measures and the explicit aggressive beliefs and atti-tudes scale is minimal, they should nonetheless tap into an over-arching global “explicit aggression” construct. Accordingly, theexplicit aggressive beliefs and attitudes scale should displaymedium to large positive relationships with other self-reportexplicit measures of aggression, such as the Aggression Ques-tionnaire (Buss & Perry, 1992). Further, factor-level relation-ships should also display similar levels of convergence. As theBuss and Perry Aggression Questionnaire assesses more affec-tive, hostile, and reactive forms of aggression (anger, hostil-ity, and physical and verbal aggression), more reactive formsof explicit aggressive beliefs and attitudes, such as retribution,should display strong positive relationships with the Aggres-sion Questionnaire. Similarly, hostile attribution should displaya strong positive relationship with Buss and Perry’s hostilityfactor. Meanwhile, the explicit aggressive beliefs and attitudesscale should display small positive relationships with implicitmeasures of aggression, such as the CRT–A (James & McIntyre,2000). It is expected that this relationship will be positive, asboth measures assess an individual’s predisposition and readi-ness to aggress. However, this relationship is expected to besmall in magnitude as they capture different aspects of per-sonality, where the self-report measure assesses explicit socialcognitions via beliefs and attitudes revolving around aggression,and the conditional reasoning test assesses implicit social cogni-tions via motive-based reasoning underlying aggression (Bing,LeBreton, et al., 2007; James & LeBreton, 2012). Indeed, it isgenerally well accepted that the implicit and explicit compo-nents of personality are often uncorrelated or low in magnitude(McClelland, 1985; McClelland et al., 1989).
In regard to the FFM, research has shown that trait aggressionis related to but not redundant with the FFM, generally findingthat agreeableness is most related to instrumental goal-orientedaggression, whereas emotional stability is most related to af-fective, hostile, and reactive aggression (Sharpe & Desai, 2001;Tremblay & Ewart, 2005). Accordingly, it is expected that theexplicit aggressive beliefs and attitudes scale will be negativelyrelated to agreeableness and emotional stability. However, webelieve that the explicit aggressive beliefs and attitudes scalewill display a smaller relationship with emotional stability thanother self-report measures, such as Buss and Perry’s (1992) Ag-gression Questionnaire, as the aggressive biases in which theexplicit aggressive beliefs and attitudes scale was developedare less affectively driven. In addition, given the negative re-lationship between anger and conscientiousness, and hostilityand conscientiousness (Ang et al., 2004; Gallo & Smith, 1998),it is expected that aggression and conscientiousness will dis-play a small negative relationship. Finally, given the lack oftheoretical justification and empirical evidence for relationshipsbetween aggression and extraversion or openness, it would be
expected that these overall relationships will be null or near null(Ang et al., 2004).
Method
Participants and procedure. A fourth independent sam-ple of undergraduate students from a large university in thesoutheastern United States participated in the study for extracredit. As the CRT–A must be administered in person, all sur-veys were administered in pencil-and-paper format. Each par-ticipant received a packet consisting of the surveys beginningwith the CRT–A. The rationale for this order was to ensure thatthe CRT–A was first and participants were not primed by theitems of the self-report aggression measures. On completion,responses were carefully screened to eliminate those with ob-vious random response patterns, large amounts of missing data,and numerous illogical responses to the conditional reasoningitems, resulting in a usable sample of 406.The average partici-pant was approximately 21 years old (ranging from 18–54 yearsof age), female (approximately 69%), and Hispanic (approxi-mately 71% Hispanic, 15% White, 8% African American, 4%Asian/Pacific Islander, 2% “other”). This sample is appropri-ate to determine the nomological network around the newlydeveloped aggressive beliefs and attitudes scale, in relation toother individual difference measures, as individual differencesare generally considered universal and have been shown to belargely stable during and after college (McCrae & Costa, 1997;Roberts & DelVecchio, 2000).
Measures.
Explicit Aggressive Beliefs and Attitudes: We used the 30-item explicit aggressive beliefs and attitudes scale developed inPhase 1 (see Table 1). The coefficient alpha reliability for theoverall scale was .89.
Aggression Questionnaire: We used Buss and Perry’s(1992) 29-item Aggression Questionnaire as a comparison scaleof self-reported explicit trait aggression. This measure consistsof four factors: anger, hostility, physical aggression, and ver-bal aggression. Each item was scored on a Likert-style scaleranging from 1 (extremely uncharacteristic of me) to 5 (ex-tremely characteristic of me). Sample items from this measureinclude “I have trouble controlling my temper” (anger), “I won-der why sometimes I feel so bitter about things” (hostility),“Given enough provocation, I may hit another person” (physi-cal aggression), and “I often find myself disagreeing with peo-ple” (verbal aggression). The coefficient alpha reliability for theoverall scale was .89.
Conditional Reasoning Test–Aggression: The CRT–A(James & McIntyre, 2000) measures implicit aggression andis made up of 22 conditional reasoning problems, as well asthree nonconditional reasoning problems to improve face valid-ity. Each of the conditional reasoning items is based on one ormore of the following six aggressive biases: hostile attribution,potency, retribution, victimization by powerful others, deroga-tion of target, and social discounting.
Five-factor model: The FFM was assessed with the pub-lic domain International Personality Item Pool developed byGoldberg (2000). Each personality factor consisted of 10 itemswith a 5-point scale ranging from 1 (very inaccurate) to 5 (very

332TA
BL
E2.
—D
escr
iptiv
est
atis
tics,
corr
elat
ions
,and
relia
bilit
ies
for
conv
erge
ntan
ddi
scri
min
antv
alid
ityst
udy.
Var
iabl
esM
SD1
23
45
67
89
1011
1213
1415
1617
18
Five
-fac
tor
mod
el1.
Ext
rave
rsio
n3.
37.8
0.8
92.
Agr
eeab
lene
ss4.
01.5
5.2
5∗∗∗
.77
3.C
onsc
ient
ious
ness
3.59
.59
.07
.15∗
∗.7
64.
Em
otio
nalS
tabi
lity
3.24
.76
.13∗
∗.0
7.1
8∗∗∗
.86
5.O
penn
ess
3.84
.53
.21∗
∗∗.1
8∗∗∗
.21∗
∗∗.1
4∗∗
.78
Exi
stin
gag
gres
sion
mea
sure
s6.
Agg
ress
ion
Que
stio
nnai
re2.
53.6
4.0
6−.
32∗∗
∗−.
19∗∗
∗−.
48∗∗
∗−.
03.8
97.
Ang
er2.
31.8
1.0
5−.
23∗∗
∗−.
18∗∗
∗−.
58∗∗
∗−.
09.8
1∗∗∗
.77
8.H
ostil
ity2.
62.7
9−.
16∗∗
−.24
∗∗∗
−.18
∗∗∗
−.49
∗∗∗
−.17
∗∗.7
4∗∗∗
.49∗
∗∗.7
79.
Phys
ical
2.32
.83
.12∗
−.30
∗∗∗
−.14
∗∗−.
16∗∗
.08
.80∗
∗∗.5
2∗∗∗
.36∗
∗∗.8
210
.Ver
bal
3.06
.88
.20∗
∗∗−.
19∗∗
∗−.
06−.
27∗∗
∗.1
0∗.7
3∗∗∗
.53∗
∗∗.4
0∗∗∗
.47∗
∗∗.5
611
.CR
T4.
60a
2.22
.02
−.12
∗−.
01−.
02−.
03.1
4∗∗∗
.14∗
∗∗.1
0∗.0
9.0
9—
New
aggr
essi
vene
ssm
easu
re12
.AB
A3.
82.7
9.0
4−.
32∗∗
∗−.
16∗∗
−.16
∗∗−.
02.5
5∗∗∗
.40∗
∗∗.4
5∗∗∗
.48∗
∗∗.3
5∗∗∗
.18∗
∗∗.8
913
.Hos
tile
attr
ibut
ion
2.89
1.06
−.04
−.28
∗∗∗
−.10
−.12
∗−.
06.3
8∗∗∗
.28∗
∗∗.4
2∗∗∗
.25∗
∗∗.2
2∗∗∗
.19∗
∗∗.6
6∗∗∗
.73
14.P
oten
cy4.
591.
11.2
2∗∗∗
−.13
∗∗−.
00−.
06.0
4.3
8∗∗∗
.27∗
∗∗.2
8∗∗∗
.34∗
∗∗.2
7∗∗∗
.14∗
∗.6
9∗∗∗
.38∗
∗∗.7
315
.Ret
ribu
tion
3.35
1.31
.04
−.35
∗∗∗
−.14
∗∗−.
18∗∗
∗−.
03.5
3∗∗∗
.39∗
∗∗.3
9∗∗∗
.51∗
∗∗.3
0∗∗∗
.06
.74∗
∗∗.3
7∗∗∗
.44∗
∗∗.8
616
.Vic
timiz
atio
n4.
221.
20−.
14∗∗
−.18
∗∗∗
−.13
∗∗−.
10∗
.01
.36∗
∗∗.2
5∗∗∗
.32∗
∗∗.2
9∗∗∗
.24∗
∗∗.1
8∗∗
.69∗
∗∗.3
9∗∗∗
.32∗
∗∗.3
9∗∗∗
.81
17.D
erog
atio
nof
targ
et4.
211.
30.0
4−.
19∗∗
∗.0
1−.
10∗
−.08
.28∗
∗∗.2
2∗∗∗
.24∗
∗∗.2
4∗∗∗
.14∗
∗.1
2∗.6
7∗∗∗
.33∗
∗∗.3
8∗∗∗
.39∗
∗∗.3
2∗∗∗
.75
18.S
ocia
ldis
coun
ting
3.68
1.08
.04
−.14
∗∗−.
28∗∗
∗−.
05.0
3.3
0∗∗∗
.22∗
∗∗.1
9∗∗∗
.27∗
∗∗.2
5∗∗∗
.06
.59∗
∗∗.2
7∗∗∗
.31∗
∗∗.3
2∗∗∗
.36∗
∗∗.2
0∗∗∗
.66
Not
e.N
=40
6–
404.
Cro
nbac
h’s
alph
aco
effic
ient
sar
ein
show
nita
lics
and
appe
aron
the
diag
onal
.CR
T=
Con
ditio
nal
Rea
soni
ngTe
st;
AB
A=
Agg
ress
ive
belie
fsan
dat
titud
es.a Sc
ores
rang
edfr
om0–
12,w
here
0–2
repr
esen
tlo
wag
gres
sion
,3–7
repr
esen
tmod
erat
eag
gres
sion
,and
8or
mor
ere
pres
enth
igh
aggr
essi
on.∗ p
<.0
5.∗∗
p<
.01.
∗∗∗ p
<.0
01.
accurate). Sample items are “I am the life of the party” (extraver-sion), “I feel others’ emotions” (agreeableness), “I am alwaysprepared” (conscientiousness), “I am relaxed most of the time”(emotional stability), and “I spend time reflecting on things”(openness). The coefficient alpha reliabilities ranged from .76to .89.
Results
To examine convergent and discriminant validities of thenewly developed explicit aggressive beliefs and attitudes mea-sure, as compared to other implicit and explicit measures ofaggression and the FFM, we calculated bivariate correlations(see Table 2). We examined each variable at the overall scalelevel, as well as the factor level, for the explicit aggressive be-liefs and attitudes scale and the Aggression Questionnaire. Ingeneral, we base our discussion of results on Cohen’s (1988)classification of correlation magnitudes (i.e., ≥ .50 = large, ≥.30 = moderate, and ≥ .10 = small).
As expected, the explicit aggressive beliefs and attitudes scaledisplayed strong convergent validity with the Aggression Ques-tionnaire (r = .55, p < .001). Although this relationship waslarge in magnitude, it clearly does not indicate problematicscale redundancy with only 30% shared variance. Across theAggression Questionnaire factors of anger, hostility, physicalaggression, and verbal aggression, the explicit aggressive beliefsand attitudes scale displayed consistent positive relationships ofmoderate magnitude (ranging from r = .35–.48, p < .001).However, there was greater variability across the factors of theaggressive beliefs and attitudes scale (i.e., factors related to theAggression Questionnaire differently). As expected, the morereactive retribution factor possessed the highest convergent va-lidity with the overall Aggression Questionnaire scale (r = .53,p < .001), and across all factors of the Aggression Questionnaireexcept for hostility (ranging from r = .30–.51, p < .001), whichconverged more strongly with the hostility factor of the explicitaggressive beliefs and attitudes scale (r = .42, p < .001). Mean-while, as expected, the explicit aggressive beliefs and attitudesscale displayed a small positive relationship with the CRT–A(r = .18, p < .001). At the factor level, hostile attribution (r =.19, p < .001) and victimization (r = .18, p < .01) possessedthe strongest relationships with the CRT–A, whereas retributionand social discounting displayed nonsignificant relationships.
In regard to the FFM, and as expected, the explicit aggressivebeliefs and attitudes scale displayed significant relationshipswith agreeableness (r = –.32, p < .001), emotional stability (r= –.16, p < .01), and conscientiousness (r = –.16, p < .01),and nonsignificant relationships with extraversion (r = .04, p >.05) and openness (r = –.02, p > .05) at the overall scale level.Additionally, these results mimic the overall results between theBuss and Perry (1992) Aggression Questionnaire and the FFM,with the exception of emotional stability. This is particularlyinteresting, as emotional stability is most related to affective,hostile, and reactive aggression (Sharpe & Desai, 2001; Trem-blay & Ewart, 2005). Because the Aggression Questionnairecaptures angry affect and hostility, as well as reactive physi-cal and verbal aggression, it therefore shows significant overlapwith emotional stability at both the overall scale (r = –.48, p< .001) and factor (e.g., r = –.58, p < .001 for anger) levels.However, it appears that the aggressive biases on which the ex-plicit aggressive beliefs and attitudes scale is based are indeed

333
more cognitively than affectively driven and therefore the ex-plicit aggressive beliefs and attitudes measure displays muchsmaller relationships with emotional stability.
At the factor level the explicit aggressive beliefs and atti-tudes scale and the FFM displayed some interesting relation-ships. First, retribution displayed the strongest relationshipswith agreeableness (r = –.35, p < .001) and emotional stability(r = –.18, p < .001). Given previous research linking agree-ableness and emotional stability with aggression, and our find-ings between retribution and the Aggression Questionnaire, thisconvergent evidence seems appropriate. Second, we expected asmall negative relationship between conscientiousness and theexplicit aggressive beliefs and attitudes scale, which was sup-ported. However, factor-level analyses indicate that this relation-ship is much stronger for social discounting (r = –.28, p < .001).Considering that conscientiousness could be conceptualized associally constructed in that individuals who are conscientiousdisplay greater self-discipline, control, and impulse regulation,it seems appropriate that social discounting (e.g., dismissingsocial norms of the roles) displayed the strongest negative re-lationship. Third, although the relationship between the overallexplicit aggressive beliefs and attitudes scale and extraversionwas nonsignificant, the potency (r = .22, p < .001) and victim-ization (r = –.14, p < .01) factors displayed small significantrelationships. Post-hoc, these relationships make sense. For ex-ample, individuals high in potency frame and reason througha prism of strength versus weakness. Thus they see the worldand people (themselves and others) as being strong, assertive,and powerful or submissive, timid, and weak. In a quasi-parallelfashion, extroverts are known to be socially active and talkative,and they tend to assert themselves, whereas introverts tend towithdraw from social exchanges and spend time alone. Accord-ingly, it makes sense that there would be a positive relationshipbetween potency and extraversion. Further, this relationship issimilar to that of extraversion and the Aggression Question-naire verbal factor (r = .20, p < .001), although potency fromthe explicit aggressive beliefs and attitudes scale and the verbalfactor from the Aggression Questionnaire do not display unusu-ally strong convergence (r = .27, p < .001). Finally, opennessdisplayed nonsignificant relationships with every factor of theexplicit aggressive beliefs and attitudes scale as expected.
PHASE 4: CRITERION-RELATED VALIDITY
Criterion-related validity is an important aspect of constructvalidity (Hinkin, 1998), and refers to the extent to which ameasure is related to theoretically derived outcomes. Accord-ingly, this section provides a sequence of studies that examinesthe criterion-related validity of the newly developed measure.Considering the newly developed measure should tap into theexplicit aggressive biases previously reviewed, it should predictaggression-related behaviors both independently and in con-junction with existing explicit measures that do not capturethese explicit aggressive biases, as well as implicit motive-basedmeasures that do. Thus this section examines (a) the positive in-cremental effects of the explicit aggressive beliefs and attitudesscale above and beyond several existing implicit and explicitmeasures of aggression and social desirability in relation toaggressive driving behavior, and (b) the positive relationshipsbetween the explicit aggressive beliefs and attitudes scale andinterpersonal and organizational deviance.
Method
Participants and procedure.
Study 1: Participants from the convergent and discriminantvalidity study (N = 406) were invited to complete a follow-upsurvey online approximately 1 week after their initial partic-ipation. Additional data were collected on socially desirableresponse bias and aggressive driving behaviors (as describedlater). We received usable surveys from 205 individuals foran approximate response rate of 50%. Each participant in thefollow-up study received nominal extra credit for an undergrad-uate psychology course. The subsample did not differ signif-icantly from the full sample on the explicit aggressive beliefsand attitudes scale.
Study 2: Participants were recruited through Study Re-sponse, an online service that connects researchers to individualswilling to complete research surveys (cf. Judge, Ilies, & Scott,2006; Piccolo & Colquitt, 2006). A link to an online survey wase-mailed to 550 employed individuals in the Study Responsedatabase. Data were collected on demographics, explicit aggres-sive beliefs and attitudes, and workplace deviance (as describedlater). We received 392 usable surveys for an overall responserate of 71%.The average participant was approximately 36 yearsof age and worked on average 41 hr per week. Approximately54% of participants were female and 82% were White. Partici-pants held job titles such as bartender, grocery clerk, librarian,nurse, office manager, paralegal, social worker, and teacher. In-dividuals received a $5 gift card to an online store for theirparticipation.
Study 3: Participants were recruited using a peer-nomination web-based sampling methodology, similar to ap-proaches used by Martins, Eddleston, and Veiga (2002) andMatthews, Kath, and Barnes-Farrell (2010). Information aboutthe study was initially presented to students at a large southeast-ern U.S. university enrolled in advanced undergraduate psychol-ogy courses. Individuals were instructed to forward the studyinformation to others who might qualify (an e-mail invitationwas provided). To be eligible to participate, individuals wererequired to be 18 years of age or older, fluent in English, workat least 20 hr per week, and not identify themselves as a “col-lege student.” Participants meeting these requirements followeda hyperlink to an online survey. Data were collected on demo-graphics, explicit aggressive beliefs and attitudes, and work-place deviance (as described later). Students received nominalcourse credit while the participants received no compensation.The final sample for the study consisted of 700 participants,with an average age of 29, and working an average of 36 hr perweek. The sample was highly diverse, with 58% being female,and of the following ethnicities: 68% Hispanic, 17% White, 8%African American, 2% Asian/Pacific Islander, and 5% “other.”
Study 4: Participants were recruited using a peer-nomination pencil-and-paper based sampling methodology,similar to that used in Matthews et al. (2010). Students en-rolled in advanced undergraduate psychology courses at a largesoutheastern U.S. university assisted with the data collectionprocess. Trained undergraduate student recruiters identified in-dividuals they personally knew and invited them to participate.Participants were required to be 18 years of age or older, fluent

334
in English, work at least 20 hr per week, not identify themselvesas a “college student,” and be able to recruit a close personalfriend or family member. Participants completed two surveysseparated by approximately 3 weeks. During the second sur-vey, participants were asked to provide a similar survey to aclose personal friend or family member. Data were collected ondemographics, explicit aggressive beliefs and attitudes, work-place deviance (self-report), and general interpersonal deviance(other report; as described later). All surveys were returned tothe researchers in signed and sealed envelopes with participantcontact information for follow-up data collection confirmation.Participants received no compensation. The final sample for thestudy consisted of 284 dyads, with the target participant (i.e.,self-reported explicit aggressive beliefs and attitudes) having anaverage age of 35 and working full-time. The sample was highlydiverse, with 57% being female, and including the following eth-nicities: 74% Hispanic, 15% White, 6% African American, 1%Asian/Pacific Islander, and 4% “other.”
Measures.
Explicit Aggressive Beliefs and Attitudes Scale: We usedthe 30-item explicit aggressive beliefs and attitudes scale devel-oped in Phase 1 (see Table 1) in Studies 2, 3, and 4 (Time 1). Theresponse scale for the aggression items followed a Likert-styleformat ranging from 1 (strongly disagree) to 7 (strongly agree).Coefficient alpha reliabilities for Studies 2, 3, and 4 (Time 1)were .95, .95, and .92.
Socially Desirable Response Bias: The Balanced Inven-tory of Desirable Responding (Paulhus, 1984, 1991) was usedto detect socially desirable response bias in Study 1. This mea-sure consists of 40 items that assess self-deception and impres-sion management. Sample items include “I don’t always knowthe reasons why I do the things I do” (self-deception) and “Idon’t gossip about other people’s business” (impression man-agement). Respondents were asked to rate their level of agree-ment on a 7-point scale ranging from 1 (not true) to 7 (verytrue). The coefficient alpha reliability for the overall scale inStudy 1 was .86.
Aggressive Driving Behaviors: The Aggressive DrivingBehavior Scale (Houston, Harris, & Norman, 2003) was used inStudy 1. This measure consists of 11 items tapping into conflictand speeding behaviors such as horn honking, rude gestures,accelerating to prevent passing, and tailgating. A sample itemis “Honk when another driver does something inappropriate.”
Participants rate the frequency with which they have engaged inbehaviors over the past 6 months using a 6-point response scaleranging from 1 (never) to 6 (always). The coefficient alphareliability in Study 1 was .84.
Interpersonal Deviance: Self-reported interpersonal de-viance at work was assessed with seven items from Bennett andRobinson (2000). Other-reported interpersonal deviance was as-sessed by adapting these items to be more general by removingthe concluding statement “at work” from each item. All itemswere assessed on a 5-point frequency scale from 1 (never) to5 (daily). A sample self-report item is “Said something hurtfulto someone at work,” and a sample other-report item is “Saidsomething hurtful to someone.” Coefficient alpha reliabilitiesfor the self-report scale in Studies 2, 3, and 4 (Time 2) were.97, .83, and .84, whereas the coefficient alpha reliability for theother-report scale in Study 4 (Time 2) was .84.
Organizational Deviance: Organizational deviance wasassessed with 12 items from Bennett and Robinson (2000).All items were assessed on a 5-point frequency scale from 1(never) to 5 (daily). A sample self-report item is “Intentionallyworked slower than you could have worked.” Coefficient alphareliabilities in Studies 2, 3, and 4 (Time 2) were .96, .86, and.85.
Results
In Study 1 we examined the incremental effects of the explicitaggressive beliefs and attitudes scale. As this was our initialstep in displaying criterion-related validity, we chose aggressivedriving behaviors because (a) the majority of the participantsfrom that study were likely to commute to campus daily, and(b) the metropolitan area in which they live is known for itshigh rate of aggressive driving. Accordingly, driving behaviorsshould provide an aggression-related criterion likely to have adesirable base rate and distribution of occurrences. Further, thisis particularly relevant for most U.S. adults as transportationincidents make up approximately 41% of all fatal occupationinjuries (U.S. Department of Labor, 2012).
Multiple regression analysis examined the incremental effectof the explicit aggressive beliefs and attitudes scale on aggres-sive driving behaviors (see Table 3). The explicit aggressivebeliefs and attitudes scale displayed significant incremental ef-fects on the criterion (β = .19, p < .05). This relationship isabove and beyond demographic characteristics of age and gen-der, the social desirable response biases of self-deception and
TABLE 3.—Multiple regression analysis examining incremental effects on aggressive driving behavior in criterion-related validity Study 1.
Ordered Predictors Step 1 Step 2 Step 3 �R2 Ordered Predictors Step 1 Step 2 Step 3 �R2
1. Age −.10 −.10 −.08 .10∗∗∗ 1. Age −.10 −.08 −.08 .10∗∗∗Gender −.02 −.02 .02 Gender −.02 .01 .02Self-deception .05 .05 .06 Self-deception .05 .06 .06Impression management −.34∗∗∗ −.28∗∗ −.26∗∗ Impression management −.34∗∗∗ −.25∗∗ −.26∗∗
2. Aggression Questionnaire .23∗∗ .14 .04∗∗ 2. Aggression Questionnaire .14 .14 .06∗∗∗Conditional Reasoning
Test.04 .03 Aggressive beliefs and
attitudes.19∗ .19∗
3. Aggressive beliefs andattitudes
.19∗ .02∗ 3. Conditional Reasoning Test .03 .00
Note. N = 205.∗ p < .05. ∗∗p < .01. ∗∗∗p < .001.

335
impression management, and existing implicit (CRT–A) andexplicit measures (Aggression Questionnaire) of aggression. Itmight be important to note that impression management wasalso significantly related to the criterion (β = –.26, p < .01);however, the explicit aggressive beliefs and attitudes scale wasincrementally predictive above social desirability bias. Also ofinterest is that the explicit aggressive beliefs and attitudes mea-sure at Step 3 made the previously significant beta for the ex-plicit Aggression Questionnaire nonsignificant, suggesting theexplicit aggressive beliefs and attitudes scale is the better pre-dictor with this particular criterion. For comparison, we alsoexamined the incremental effect of the corresponding implicitCRT–A above and beyond demographic characteristics of ageand gender, the social desirable response biases of self-deceptionand impression management, the explicit Aggression Question-naire, and our new explicit measure of aggressiveness. TheCRT–A did not display significant incremental effects on thecriterion (β = .03, p > .05). Further, with all seven variables inthe regression equation, only impression management and theexplicit aggressive beliefs and attitudes scale were significantpredictors.
Next we examined relationships between the explicit aggres-sive beliefs and attitudes scale and workplace deviance in twoindependent working samples (see Table 4). The aggressive be-liefs and attitudes scale was significantly related to interpersonaldeviance (Study 2, r = .50, p < .001; Study 3, r = .39, p <.001) and organizational deviance (Study 2, r = .48, p < .001;Study 3, r = .41, p < .001) in both samples. Additionally, allfactors were significantly related to workplace deviance in theexpected direction, with correlations ranging from r = .21 to.55 (p < .001) for interpersonal deviance and r = .20 to .53 (p< .001) for organizational deviance.
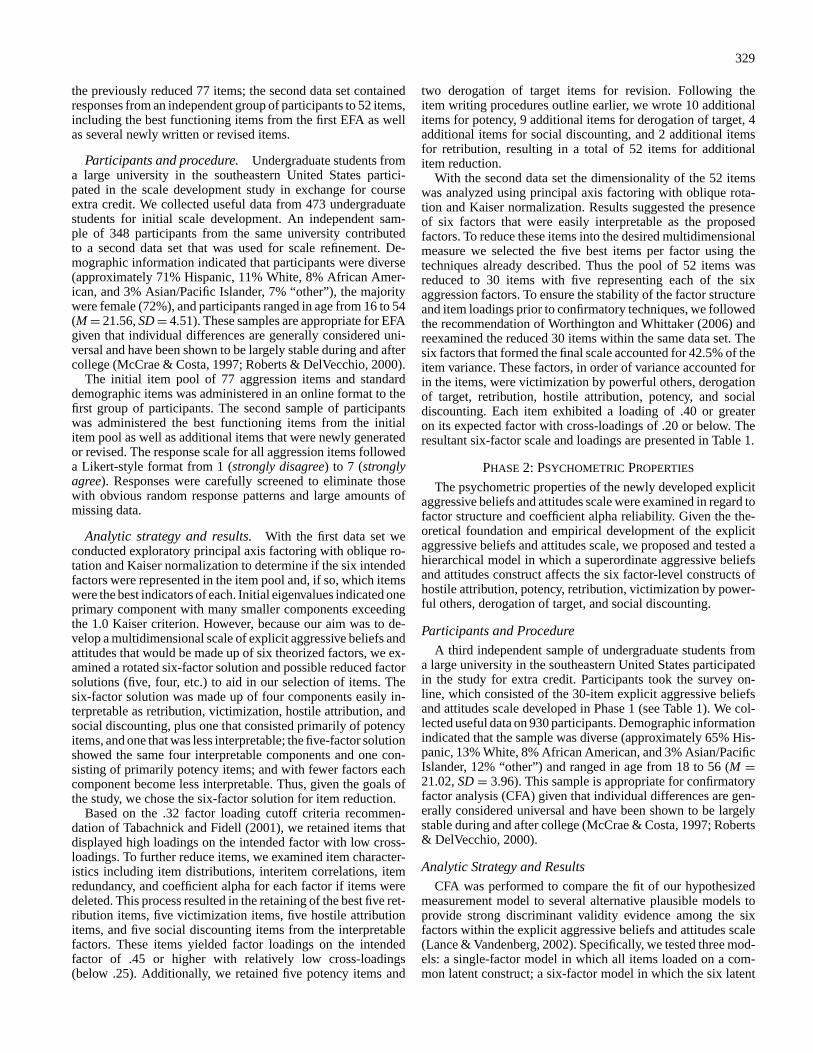
In a final step to provide criterion-related validity evidence,we examined the explicit aggressive beliefs and attitudes scalein relation to self-reported and other-reported deviance with thepredictor and criterion separated by approximately 3 weeks (seePodsakoff, MacKenzie, Lee, & Podsakoff, 2003). As reported inTable 5, the explicit aggressive beliefs and attitudes scale fromTime 1 was significantly related to self-reported workplace in-terpersonal deviance (r = .23, p < .001) and organizationaldeviance (r = .26, p < .001) at Time 2. All factors displayedsignificant relationships except for hostile attribution with inter-personal deviance and derogation of target with organizational
deviance. Similarly, the explicit aggressive beliefs and attitudesscale from Time 1 was significantly related to other-reportedgeneral interpersonal deviance (r = .23, p < .001) at Time 2.All facets displayed significant relationships except for hostileattribution, which is similar to the self-report relationships. Ad-ditionally, it is important to note that the relationships betweenthe explicit aggressive beliefs and attitudes scale from Time 1and self-reported and other-reported interpersonal deviance atTime 2 were similar in magnitude at both the overall scale andfactor levels, although self-reported and other-reported interper-sonal deviance at Time 2 were only moderately related (r = .40,p < .001).
GENERAL DISCUSSION
The purpose of this study was to create a reliable and validmultifactor self-report measure that taps into the explicit socialcognitions and biases expressed freely by aggressive people(Fazio et al., 1995; Gawronski & Bodenhausen, 2006; Green-wald & Banaji, 1995; Karpinski & Hilton, 2001). These aggres-sive biases, which are associated with easily assessable explicitaggressive beliefs and attitudes, include hostile attribution, po-tency, retribution, victimization by powerful others, derogationof target, and social discounting. Through the use of seven sam-ples (total N = 3,533) we deductively developed and validatedthe first self-report measure to capture these explicit aggressivebeliefs and attitudes, which can be used independently (for ex-plicit assessment only) or in conjunction with the CRT–A (forjoint implicit and explicit assessment) to more fully assess ag-gressiveness. A hierarchical six-factor structure was supported.Convergent and discriminant validity were provided showingexpected relationships with the FFM of personality, the explicitAggression Questionnaire, and the implicit CRT–A. In the fourcriterion-related validity studies we found incremental effectson aggressive behaviors above and beyond socially desirableresponse bias and related implicit and explicit aggression mea-sures, and significant and meaningful relationships with work-place deviance. Additionally, we found predictive validity ev-idence for both self-reported and other-reported interpersonaldeviance. Collectively, these results provide strong initial sup-port for the newly developed explicit aggressive beliefs andattitudes scale.
TABLE 4.—Descriptive statistics, correlations, and reliabilities for criterion-related validity Studies 2 and 3.
Variables M SD 1 2 3 4 5 6 7 8 9
Workplace deviance1. Interpersonal deviance 1.48 (1.82) .81 (.97) .97 (.83) .65∗∗∗ .39∗∗∗ .26∗∗∗ .33∗∗∗ .38∗∗∗ .35∗∗∗ .31∗∗∗ .28∗∗∗2. Organizational deviance 1.57 (1.71) .78 (.79) .91∗∗∗ .96 (.86) .41∗∗∗ .28∗∗∗ .32∗∗∗ .39∗∗∗ .37∗∗∗ .28∗∗∗ .35∗∗∗
New aggressiveness measure3. Aggressive beliefs and attitudes 3.82 (3.52) 1.06 (1.09) .50∗∗∗ .48∗∗∗ .95 (.95) .81∗∗∗ .80∗∗∗ .80∗∗∗ .83∗∗∗ .81∗∗∗ .81∗∗∗4. Hostile attribution 3.28 (2.80) 1.42 (1.16) .53∗∗∗ .48∗∗∗ .85∗∗∗ .90 (.82) .57∗∗∗ .58∗∗∗ .63∗∗∗ .60∗∗∗ .59∗∗∗5. Potency 4.43 (4.37) 1.09 (1.33) .26∗∗∗ .26∗∗∗ .78∗∗∗ .56∗∗∗ .78 (.80) .58∗∗∗ .58∗∗∗ .59∗∗∗ .59∗∗∗6. Retribution 3.34 (2.95) 1.49 (1.40) .50∗∗∗ .50∗∗∗ .85∗∗∗ .69∗∗∗ .59∗∗∗ .92 (.90) .55∗∗∗ .55∗∗∗ .59∗∗∗7. Victimization 4.07 (3.74) 1.39 (1.48) .31∗∗∗ .32∗∗∗ .81∗∗∗ .63∗∗∗ .55∗∗∗ .61∗∗∗ .90 (.88) .60∗∗∗ .63∗∗∗8. Derogation of target 4.47 (4.01) 1.22 (1.40) .21∗∗∗ .20∗∗∗ .67∗∗∗ .43∗∗∗ .59∗∗∗ .46∗∗∗ .47∗∗∗ .80 (.81) .56∗∗∗9. Social discounting 3.37 (3.27) 1.26 (1.30) .55∗∗∗ .53∗∗∗ .83∗∗∗ .76∗∗∗ .55∗∗∗ .70∗∗∗ .60∗∗∗ .37∗∗∗ .84 (.82)
Note. Study 2 N = 392; Study 3 N = 700. Study 2 data are outside of the parentheses and below the diagonal; Study 3 data are inside of the parentheses and above the diagonal.Cronbach’s alpha coefficients are shown in italics and appear on the diagonal.
∗∗∗p < .001.
336
TABLE 5.—Descriptive statistics, correlations, and reliabilities for criterion-related validity Study 4.
Variables M SD 1 2 3 4 5 6 7 8 9 10
Interpersonal deviance (O-R)1. Interpersonal deviance 2.16 1.11 .84Workplace deviance (S-R)2. Interpersonal deviance 1.90 1.05 .40∗∗∗ .843. Organizational deviance 1.71 .79 .32∗∗∗ .51∗∗∗ .85
New aggressiveness measure4. Aggressive beliefs and attitudes 3.70 .97 .23∗∗∗ .23∗∗∗ .26∗∗∗ .925. Hostile attribution 2.88 1.12 .11 .12 .21∗∗∗ .76∗∗∗ .756. Potency 4.56 1.26 .16∗∗ .16∗∗ .15∗ .76∗∗∗ .43∗∗∗ .777. Retribution 2.98 1.30 .18∗∗ .14∗ .24∗∗∗ .77∗∗∗ .53∗∗∗ .51∗∗∗ .838. Victimization 4.00 1.41 .24∗∗∗ .20∗∗ .24∗∗∗ .79∗∗∗ .51∗∗∗ .53∗∗∗ .51∗∗∗ .839. Derogation of target 4.25 1.27 .13∗ .15∗ .06 .72∗∗∗ .52∗∗∗ .49∗∗∗ .39∗∗∗ .46∗∗∗ .7310. Social discounting 3.51 1.26 .24∗∗∗ .27∗∗∗ .29∗∗∗ .79∗∗∗ .53∗∗∗ .52∗∗∗ .55∗∗∗ .57∗∗∗ .44∗∗∗ .76
Note. N = 284–278. O-R = other report; S-R = self-report. Cronbach’s alpha coefficients are shown in italics and appear on the diagonal.∗p < .05. ∗∗p < .01. ∗∗∗p < .001.
Limitations
As with any study, there are a few limitations that shouldbe acknowledged in this work. One potential limitation is thatdata were collected using a series of self-report questionnaires.However, our intention was to develop and validate a self-reportmeasure of the explicit beliefs and attitudes held by aggressivepeople, thus we relied exclusively on self-report data for ag-gressiveness. It is important to note that relying on self-reportdata makes this study potentially vulnerable to the effects ofcommon-method variance (CMV), such as the inflation of cor-relations and regression coefficients. In an effort to combatCMV, we showed incremental effects above and beyond so-cially desirable response bias in Study 1, collected predictorand criterion data in two separate waves in Study 1 and 4,and collected other-report criterion data in Study 4 (see Pod-sakoff et al., 2003). Further, potential inflation of relationshipsdue to CMV might not have been a pervasive problem in thecross-sectional data as many of the nonproposed relationshipsexhibited nonsignificant correlations. For example, Study 1 con-tained several nonsignificant relationships between personalityvariables (e.g., agreeableness and emotional stability at Time1). These results suggest that CMV did not necessarily inflateour observed correlations.
An additional limitation involves our testing of seeminglycausal relationships though the use of correlational data. Thismeans that the displayed relationships suggest plausible expla-nations for the observed patterns of covariance (James, Mulaik,& Brett, 1982), and the absence of a proper experimental designprevents us from testing true causal relationships. However, thepurpose of this study was to develop a valid measure of ex-plicit aggressive beliefs and attitudes. Accordingly, the lack oftruly causal relationships is less of a concern as criterion-relatedvalidity is indicated through relationships with theoretically de-rived criteria. Accordingly, whether aggression is an antecedent,mediator, or consequence, criterion-related validity is estab-lished through patterns of covariance. Nonetheless, future re-search could seek to establish if the general structure implied inthis work is consistent with a truly causal model by structuringstudies and collecting data to satisfy the requisite conditions forcausal inference (see James et al., 1982).
Practical Implications and Future Directions
The practical implications for self-report explicit aggressive-ness measures, such as the one developed here, are vast. Oneexample in the applied psychology field is the use and appli-cation of such measures within the workplace. As suggestedin Bing, LeBreton, et al. (2007), the integrative use of implicitand explicit measures and subsequent application of knowledgeabout employee aggressiveness can be directed toward selectiondecisions, with additional uses in work team composition, teammember training, and executive coaching. More comprehensiveunderstanding of the implicit and explicit processes underly-ing aggressive behaviors could be especially useful for trainingdesign, particularly suggesting effective components and ap-proaches to incorporate in team-building, conflict resolution,and coaching efforts. Another potential use of the identifica-tion of aggressive individuals is for the effective routing ofaggression to beneficial purposes. Training personnel to betterunderstand and comprehend aggressive behavior (self and oth-ers) could be particularly useful for service sectors (e.g., policeofficers). More generally, this positive approach might providea good complement to the difficult-to-achieve deselection andretraining of individuals with inherent aggressive tendencies.The usefulness of aggression-relevant information in organiza-tions will depend greatly on identifying the network of relatedconstructs and outcomes as well as developing process-basedinterventions. To build such a knowledge base around aggres-sion in the workplace, it will be necessary to identify effectiveprocedures for measuring the subtleties of aggression.
As it was beyond the scope of this work, future research couldmore thoroughly clarify the theoretical and empirical relation-ships between aggressive predispositions (e.g., explicit beliefsand attitudes, implicit motive-based reasoning) and “aggres-sive” organizational behaviors (e.g., abusive supervision, work-place bullying, workplace incivility). Although recent researchhas made significant advancements in our understanding of ag-gressive workplace behaviors (e.g., Bowling & Beehr, 2006;Tepper, 2007), much more clarity is needed to fully understandthe complexities of these constructs and measures (cf. Hershco-vis, 2011). For example, future research could explore the pro-cess in which explicit aggressive beliefs and attitudes influence

337
organizational behaviors (cf. Frost et al., 2007). Similarly, thenewly developed explicit aggressive beliefs and attitudes scaleshould not be seen as a replacement to existing measures of ag-gression, but as a complement to current measurement and the-ory (e.g., used in conjunction with the CRT–A; cf. Frost et al.,2007). Accordingly, future research should further clarify theintegrative processes through which aggressiveness influencesoutcomes.
Conclusions
We believe our newly developed scale is a reliable and validself-report measure that taps into the explicit social cogni-tions and biases expressed freely by aggressive people. Prelim-inary evidence indicates that conceptual and empirical redun-dancy with existing implicit and explicit measures is minimal.Criterion-related validity evidence suggests that the explicit ag-gressive beliefs and attitudes scale is incrementally and mean-ingfully predictive of a number of organizational and nonorga-nizational outcomes. These findings support the utility of the30-item measure, as well as the individual five-item factor-levelmeasures. We feel these measures can be used in conjunctionwith current and future measures to better explain complex de-viant behaviors in a number of contexts.
ACKNOWLEDGMENTS
We would like to thank Lawrence R. James for the use of theConditional Reasoning Test of Aggression. We are also gratefulfor the feedback provided by James M. LeBreton throughoutthis scale development project.
REFERENCES
Anderson, C. A., Deuser, W. E., & DeNeve, K. M. (1995). Hot temperatures,hostile affect, hostile cognition and arousal: Tests of a general model ofaffective aggression. Personality and Social Psychology Bulletin, 21, 434–448.
Anderson, E. (1994, May). The code of the streets. The Atlantic Monthly, 81–94.Anderson, J. C., & Gerbing, D. W. (1991). Predicting the performance of mea-
sures in a confirmatory factor analysis with a pretest assessment of theirsubstantive validities. Journal of Applied Psychology, 76, 732–740.
Ang, R. P., Ng, A. K., Wong, S. S., Lee, B. O., Oei, T. P., & Leng, V. (2004).Relationship between big five traits and aggression: A comparison betweenundergraduates from Australia and Singapore. Journal of Psychology in Chi-nese Societies, 5, 291–305.
Averill, J. R. (1993). Illusions of anger. In R. B. Felson & J. T. Tedeschi (Eds.),Aggression and violence: Social interactionist perspectives (pp. 171–192).Washington, DC: American Psychological Association.
Barlett, C. P., & Anderson, C. A. (2012). Direct and indirect relations betweenthe Big 5 personality traits and aggressive and violent behavior. Personalityand Individual Differences, 52, 870–875. doi: 10.1016/j.paid.2012.01.029
Baron, R. A., & Richardson, D. (1994). Human aggression. New York, NY:Plenum.
Baumeister, R., Smart, L., & Boden, J. (1996). Relation of threatened egotismto violence and aggression: The dark side of high self-esteem. PsychologicalReview, 103, 5–33.
Bennett, R. J., & Robinson, S. L. (2000). Development of a measure of work-place deviance. Journal of Applied Psychology, 85, 349–360.
Bing, M. N., LeBreton, J. M., Davison, H. K., Migetz, D. Z., & James, L.R. (2007). Integrating implicit and explicit social cognitions for enhancedpersonality assessment: A general framework for choosing measurement andstatistical methods. Organizational Research Methods, 10, 346–389.
Bing, M. N., Stewart, S. M., Davison, H. K., Green, P. D., McIntyre, M. D., &James, L. R. (2007). An integrative typology of personality assessment for ag-
gression: Implications for predicting counterproductive workplace behavior.Journal of Applied Psychology, 92, 722–744.
Bornstein, R. F. (2002). A process dissociation approach to objective–projectivetest score interrelationships. Journal of Personality Assessment, 78, 47–68.
Bowling, N. A., & Beehr, T. A. (2006). Workplace harassment from the vic-tim’s perspective: A theoretical model and meta-analysis. Journal of AppliedPsychology, 91, 998–1012.
Bradbury, T. N., & Fincham, F. D. (1990). Attributions in marriage: Review andcritique. Psychological Bulletin, 107, 3–33.
Buss, A. H., & Perry, M. (1992). The Aggression Questionnaire. Journal ofPersonality and Social Psychology, 63, 452–459.
Campbell, D. T., & Fiske, D. W. (1959). Convergent and discriminant valida-tion by the multitrait–multimethod matrix. Psychological Bulletin, 56, 81–105.
Cohen, J. (1988). Statistical power analysis for the behavioral sciences (2nded.). Mahwah, NJ: Erlbaum.
Costa, P. T., & McCrae, R. R. (1992). Revised NEO Personality Inventory andNEO Five-Factor Inventory professional manual. Odessa, FL: PsychologicalAssessment Resources.
Crick, N., & Dodge, K. (1994). A review and reformulation of socialinformation-processing mechanisms in children’s social adjustment. Psycho-logical Bulletin, 115, 74–101.
Dodge, K. A. (1986).A social information processing model of social compe-tence in children. In M. Perlmutter (Ed.), The Minnesota symposium on childpsychology (Vol. 18, pp. 77–125). Hillsdale, NJ: Erlbaum.
Dweck, C. S., & Leggett, E. L. (1988). A social-cognitive approach to motivationand personality. Psychological Review, 95, 256–273.
Fazio, R. H., Jackson, J. R., Dunton, B. C., & Williams, C. J. (1995). Atti-tudes and social cognition. Journal of Personality and Social Psychology, 69,1013–1027.
Fazio, R. H., & Olson, M. A. (2003). Implicit measures in social cognitionresearch: Their meaning and use. Annual Review of Psychology, 54, 297–327.
Ferris, D. L., Brown, D. J., Berry, J. W., & Lian, H. (2008). The development andvalidation of the workplace ostracism scale. Journal of Applied Psychology,93, 1348–1366.
Finnegan, W. (1997, December). The unwanted. The New Yorker, 61–78.Frost, B. C., Ko, C. H. E., & James, L. R. (2007). Implicit and explicit person-
ality: A test of a channeling hypothesis for aggressive behavior. Journal ofApplied Psychology, 92, 1299–1319.
Gallo, L. C., & Smith, T. W. (1998). Construct validation of health-relevantpersonality traits: Interpersonal circumplex and five-factor model analyses ofthe Aggression Questionnaire. International Journal of Behavioral Medicine,5, 129–147.
Gawronski, B., & Bodenhausen, G. V. (2006). Associative and propositionalprocesses in evaluation: An integrative review of implicit and explicit attitudechange. Psychological Bulletin, 132, 692–731.
Gay, P. (1993). The cultivation of hatred. New York, NY: Norton.Goldberg, L. R. (2000). International Personality Item Pool. Retrieved from
http://www.ipip.orgGreenwald, A. G., & Banaji, M. R. (1995). Implicit social cognition: Attitudes,
self-esteem, and stereotypes. Psychological Review, 102, 4–27.Greenwald, A. G., McGhee, D. E., & Schwartz, J. L. (1998). Measuring indi-
vidual differences in implicit cognition: The implicit association test. Journalof Personality and Social Psychology, 74, 1464–1480.
Hershcovis, M. S. (2011). Incivility, social undermining, bullying . . . oh my! Acall to reconcile constructs within workplace aggression research. Journal ofOrganizational Behavior, 32, 499–519.
Hinkin, T. R. (1998). A brief tutorial on the development of measures for use insurvey questionnaires. Organizational Research Methods, 1, 104–121.
Houston, J. M., Harris, P. B., & Norman, M. (2003). The Aggressive DrivingBehavior Scale: Developing a self-report measure of unsafe driving practices.North American Journal of Psychology, 5, 269–278.
Hu, L., & Bentler, P. M. (1999). Cutoff criteria for fit indexes in covariancestructural analysis: Conventional criteria versus new alternatives. StructuralEquation Modeling, 6, 1–55.
Jackson, D. N. (1968). Personality Research Form: Form A. Port Huron, MI:Research Psychologists Press.
338
James, L. R. (1998). Measurement of personality via conditional reasoning.Organizational Research Methods, 1, 131–163.
James, L. R., & LeBreton, J. M. (2012). Assessing the implicit personalitythrough conditional reasoning. Washington, DC: American PsychologicalAssociation.
James, L. R., & Mazerolle, M. D. (2002). Personality at work. Thousand Oaks,CA: Sage.
James, L. R., & McIntyre, M. D. (2000). Conditional reasoning test of aggres-sion: Test manual. Knoxville, TN: Innovative Assessment Technology.
James, L. R., McIntyre, M. D., Glisson, C. A., Bowler, J. L., & Mitchell, T. R.(2004). The conditional reasoning measurement system for aggression: Anoverview. Human Performance, 17, 271–295.
James, L. R., McIntyre, M. D., Glisson, C. A., Green, P. D., Patton, T. W.,LeBreton, J. M., . . . Williams, L. J. (2005). A conditional reasoning measurefor aggression. Organizational Research Methods, 8, 69–99.
James, L. R., Mulaik, S. S., & Brett, J. M. (1982). Mediators, moderators, andtests for mediation. Journal of Applied Psychology, 69, 307–321.
Judge, T. A., Ilies, R., & Scott, B. A. (2006). Work–family conflict andemotions: Effects at work and at home. Personnel Psychology, 59, 779–814.
Karpinski, A., & Hilton, J. L. (2001). Attitudes and implicit association test.Journal of Personality and Social Psychology, 81, 774–788.
Lance, C. E., & Vandenberg, R. J. (2002). Confirmatory factor analysis. In F.Drasgow & N. Schmitt (Eds.), Measuring and analyzing behavior in orga-nizations: Advances in measurement and data analysis (pp. 221–254). SanFrancisco, CA: Jossey-Bass.
Laursen, B., & Collins, W. A. (1994). Interpersonal conflict during adolescence.Psychological Bulletin, 115, 197–209.
Lilienfeld, S. O., Wood, J. M., & Garb, H. N. (2000). The scientific status ofprojective techniques. Psychological Science in the Public Interest, 1, 27–66.
Martins, L. L., Eddleston, K. A., &Veiga, J. F. (2002). Moderators of the rela-tionship between work–family conflict and career satisfaction. Academy ofManagement Journal, 45, 399–409.
Matthews, R. A., Kath, L. M., & Barnes-Farrell, J. L. (2010). Short, valid,predictive measures of work–family interference. Journal of OccupationalHealth Psychology, 15, 75–90.
McClelland, D. C. (1985). How motives, skills, and values determine whatpeople do. American Psychologist, 40, 812–825.
McClelland, D. C., Koestner, R., & Weinberger, J. (1989). How do self-attributedand implicit motives differ? Psychological Review, 96, 690–702.
McCrae, R. R., & Costa, P. T., Jr. (1997). Personality trait structure as a humanuniversal. American Psychologist, 52, 509–516.
Millon, T. (1990). The disorders of personality. In L. A. Pervin (Ed.), Handbookof personality theory and research (pp. 339–370). New York, NY: Guilford.
Mischel, W., & Shoda, Y. (1995). A cognitive-affective system theory of person-ality: Reconceptualizing situations, dispositions, dynamics, and invariance inpersonality structure. Psychological Review, 102, 246–268.
Nosek, B. A., Greenwald, A. G., & Banaji, M. R. (2005). Understanding and us-ing the implicit association test: II. Method and construct validity. Personalityand Social Psychology Bulletin, 31, 166–180.
Paulhus, D. L. (1984). Two-component model of socially desirable responding.Journal of Personality and Social Psychology, 46, 598–609.
Paulhus, D. L. (1991). Measurement and control of response bias. In J. P.Robinson, P. R. Shaver, & L. S. Wrightsman (Eds.), Measures of personalityand social psychological attitudes (pp. 17–59). San Diego, CA: Academic.
Piccolo, R. F., & Colquitt, J. A. (2006). Transformational leadership and jobbehaviors: The mediating role of job characteristics. Academy of ManagementJournal, 49, 327–340.
Podsakoff, P. M., MacKenzie, S. B., Lee, J. Y., & Podsakoff, N. P. (2003). Com-mon method biases in behavioral research: A critical review of the literatureand recommended remedies. Journal of Applied Psychology, 88, 879–903.
Roberts, B. W., & DelVecchio, W. F. (2000). The rank-order consistency of per-sonality traits from childhood to old age: A quantitative review of longitudinalstudies. Psychological Bulletin, 126, 3–25.
Sharpe, J. P., & Desai, S. (2001). The revised NEO Personality Inventory and theMMPI–2 psychopathology five in the prediction of aggression. Personalityand Individual Differences, 31, 505–518.
Tabachnick, B. G., & Fidell, L. S. (2001). Using multivariate statistics. Boston,MA: Allyn & Bacon.
Tedeschi, J. T., & Nesler, M. S. (1993). Grievances: Development and reactions.In R. B. Felson & J. T. Tedeschi (Eds.), Aggression and violence: Social inter-actionist perspectives (pp. 13–46). Washington, DC: American PsychologicalAssociation.
Tepper, B. J. (2007). Abusive supervision in work organizations: Review, syn-thesis, and research agenda. Journal of Management, 33, 261–289.
Toch, H. (1993). Good violence and bad violence: Self-presentations of aggres-sors through accounts and war stories. In R. B. Felson & J. T. Tedeschi (Eds.),Aggression and violence: Social interactionist perspectives (pp. 193–206).Washington, DC: American Psychological Association.
Tremblay, P. F., & Ewart, L. A. 2005. The Buss and Perry Aggression Ques-tionnaire and its relations to values, the Big Five, provoking hypotheticalsituations, alcohol consumption patterns, and alcohol expectancies. Person-ality and Individual Differences, 38, 337–346.
U.S. Department of Labor (2012). National census of fatal occupationalinjuries in 2011 (USDL-12-1888). Retrieved from http://www.bls.gov/news.release/pdf/cfoi.pdf
Winter, D. G., John, O. P., Stewart, A. J., Klohnen, E. C., & Duncan, L. E. (1998).Traits and motives: Toward an integration of two traditions in personalityresearch. Psychological Review, 105, 230–250.
Worthington, R. L., & Whittaker, T. A. (2006). Scale development research:A content analysis and recommendations for best practices. The CounselingPsychologist, 34, 806–838.
Wright, J. C., & Mischel, W. (1987). A conditional approach to dispositionalconstructs: The local predictability of social behavior. Journal of Personalityand Social Psychology, 53, 1159–1177.