DEVELOPMENT AND QUALITY EVALUATION OF ...
151
DEVELOPMENT AND QUALITY EVALUATION OF ANTIOXIDANT RICH AND HIGH PROTEIN BISCUITS A THESIS SUBMITTED IN FULLFILMENT OF THE REQUIREMENT OF MASTER OF RESEARCH By Pardeep Kaur Grewal SCHOOL OF SCIENCE AND HEALTH WESTERN SYDNEY UNIVERSITY, AUSTRALIA December 2018
-
Upload
khangminh22 -
Category
Documents
-
view
0 -
download
0
Transcript of DEVELOPMENT AND QUALITY EVALUATION OF ...

DEVELOPMENT AND QUALITY EVALUATION OF
ANTIOXIDANT RICH AND HIGH PROTEIN BISCUITS
A THESIS SUBMITTED IN FULLFILMENT OF THE REQUIREMENT OF
MASTER OF RESEARCH
By
Pardeep Kaur Grewal
SCHOOL OF SCIENCE AND HEALTH
WESTERN SYDNEY UNIVERSITY, AUSTRALIA
December 2018
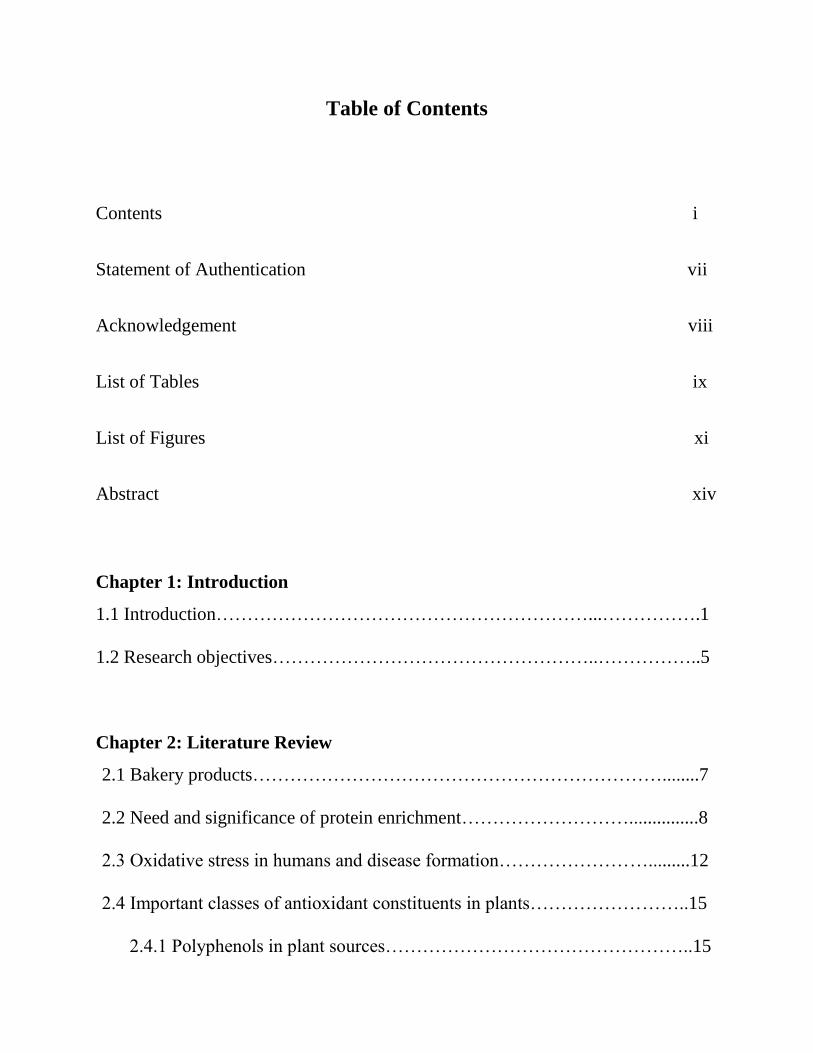
Table of Contents
Contents i
Statement of Authentication vii
Acknowledgement viii
List of Tables ix
List of Figures xi
Abstract xiv
Chapter 1: Introduction
1.1 Introduction……………………………………………………...…………….1
1.2 Research objectives……………………………………………..……………..5
Chapter 2: Literature Review
2.1 Bakery products…………………………………………………………........7
2.2 Need and significance of protein enrichment………………………...............8
2.3 Oxidative stress in humans and disease formation…………………….........12
2.4 Important classes of antioxidant constituents in plants……………………..15
2.4.1 Polyphenols in plant sources…………………………………………..15

2.4.2 Trace metals in plants………………………………………………….16
2.5 Methods of measurement of antioxidant activities…………………………..17
2.5.1 Principles of ABTS•+ free radical scavenging activity test……..............17
2.6 Improving the antioxidant quality of bakery products with under-
-utilized plants……………………………………………………………….18
2.6.1 Moringa (Moringa oleifera)……………………………………………21
2.6.2 Goji Berry (Lycium barbarum)………………………………...............24
2.6.3 Schisandra (Schisandra chinensis)…………………………………….25
2.6.4 Gotu Kola (Centella asiatica)………………………………………….26
Chapter 3: Materials and Methods
3.1 Procurement of raw material…………………………………………………29
3.2 Chemicals and reagents…………………………………………….…….......30
3.3 Preparation of plants powder (raw materials)…………………..………........30
3.4 Development of biscuits……………………………………………………...30
3.4.1 Biscuit manufacturing process…………………………….…………...32
3.5 Proximate and physical analysis of antioxidant rich and high protein
Biscuits………………………………………………………………............34
3.5.1 Proximate composition…………………………………….…..............34
3.5.1.1 Moisture content…………………………...…………………34

3.5.1.2 Total ash……………………………………………………..35
3.5.1.3 Crude protein………………………………………………...35
3.5.1.4 Crude fat……………………………………………………..36
3.5.1.5 Crude fibre…………………………………………...............37
3.5.1.6 Carbohydrates content……………………………………….37
3.5.1.7 Energy…………………………………………………..........37
3.5.2 Physical analysis of biscuits……………………………………..…....38
3.5.2.1 Diameter and thickness determination…………...….............38
3.5.2.2 Spread ratio (SF) determination……………………..…..…...38
3.5.2.3 Bake loss…………………………………………...…...........39
3.5.2.4 Color analysis………………………………………..…….....39
3.6 Antioxidant activities and their correlation with antioxidant contents of
high protein biscuits…………………………………………………….........40
3.6.1 Preparation of hot water extracts for chemical analysis…………........40
3.6.2 Isolation of ethanol soluble small molecules from hot
water extracts…………………………………………………......……42
3.6.3 Antioxidant activity determination……………………………….........44
3.6.3.1 Measurement of radical scavenging activities against
ABTS•+……………......................................................................44
3.6.4 Measurement of total phenolic content (TPC)………………................45

3.6.5 Measurement of total flavonoid content (TFC)………..……………...47
3.7 Statistical analysis……………………………………………………………48
Chapter 4: Results and Discussion
4.1 Proximate and physical analysis of antioxidant rich and high protein
Biscuits………………………………………………………………………..49
4.1.1 Proximate analysis ………….…………………………………………49
4.1.1.1 Moisture content………………………………………………49
4.1.1.2 Ash content……………………………………………………52
4.1.1.3 Protein content………………………………………………..53
4.1.1.4 Crude fat content……………………………………………...54
4.1.1.5 Crude fibre content………………………………………...….54
4.1.1.6 Carbohydrates content………………………………………...57
4.1.1.7 Energy…………………………………………………………58
4.1.2 Physical analysis of Biscuits……………………………………….......59
4.1.2.1 Biscuits weight………………………………………………..61
4.1.2.2 Diameter ……………………………………………………...63
4.1.2.3 Thickness……………………………………………………...64
4.1.2.4 Spread ratio (SF)………………………………………………65
4.1.2.5 Bake loss………………………………………………………67

4.1.2.6 Color analysis of biscuits……………………………………..68
4.1.2.6.1 L* value………………………………………….…69
4.1.2.6.2 a* value………………………………………….....70
4.1.2.6.3 b* value…………………………………………….71
4.2 Antioxidant activities of plant extracts and their correlation with
antioxidant contents…………………………………………………………..72
4.2.1 Hot water extraction yield………………………………………..…..….74
4.2.2 Total phenolic contents (TPC) and total flavonoid contents (TFC)….…74
4.2.3 Antioxidant activities of plant extracts and their correlation with TPC and
TFC……………………………………………………………………...77
4.3 Antioxidant activities of functionally enriched biscuits…………………...….79
4.3.1 Hot water extraction yield…………………………………………..……80
4.3.2 Total phenolic contents (TPC) and total flavonoid contents (TFC)
of enriched biscuits……………………………………………………….81
4.3.3 Antioxidant activities and their correlation with TPC and TFC……..…..83
4.3.4 Isolation of ethanol solubles from hot water extract of
enriched biscuits……………………………………………………….....85
4.3.5 Total phenolic contents (TPC) and total flavonoid contents (TFC) of
Ethanol solubles in the extracts of enriched biscuits…………………….86

4.3.6 Antioxidant activities and their correlation with TPC and TFC of enriched
biscuits…………………………………………………………………………….89
Chapter 5: Conclusion and Recommendations
5.1 Conclusion and Recommendations for Future Research Studies……………..94
References………………………………………………………………………...97
Appendix………………………………………………………………………...116

STATEMENT OF AUTHENTICATION
This is to certify that the thesis entitled, “Development and Quality Evaluation of
Antioxidant Rich and High Protein Biscuits” to the best of my knowledge and belief this
thesis contains no material that has been previously published by any other person, except as
acknowledged in the text. I hereby declare that this work has not submitted either in full or in
part, for the award of degree/diploma at this or any other University.
Signature:
Date: 10/12/2018

ACKNOWLEDGEMENT
It is my proud privilege that I take this opportunity of expressing my deep sense of regards and
indebtedness to my supervisor, Prof. Vijay Jayasena from School of Science and Health, Western
Sydney University, for his valuable supervision and encouragement through my entire Masters
of Research study.
I personally feel obliged and grateful to my co-supervisor, Dr Narsimha Reddy. I owe to his
profound debt of gratitude not only for his guidance in the present work but also for his ever-
willing help, support and inspiration to confidently complete the research project.
I convey my sincere obligation to Dr Rosalie Durham, Academic course advisor- Nutrition and
Food Science at School of Science & Health for their support and constant encouragement. I am
also thankful to laboratory staff members; Kelly Strachan, Mehnaz Shahnaseri, Adam Hale, Greg
Fathers from School of Science and Health, Western Sydney University, for their timely help and
co-operation during my study. I would also like to thank my peer Anupreet Kaur for her support
throughout this project.
I am indebted to my respected to my mother for her replenishing source of strength,
encouragement, love and silent prayers and my father whose words of inspiration,
encouragement and optimism and inscribed in my heart and whose soul is always there to guide
me. I also would like to special thanks to my husband for his love, support and constant
encouragement for my study.
Above all, I express my deep sense of gratitude to the merciful and compassionate Almighty
with whose grace and blessings, I have been able to accomplish this research successful
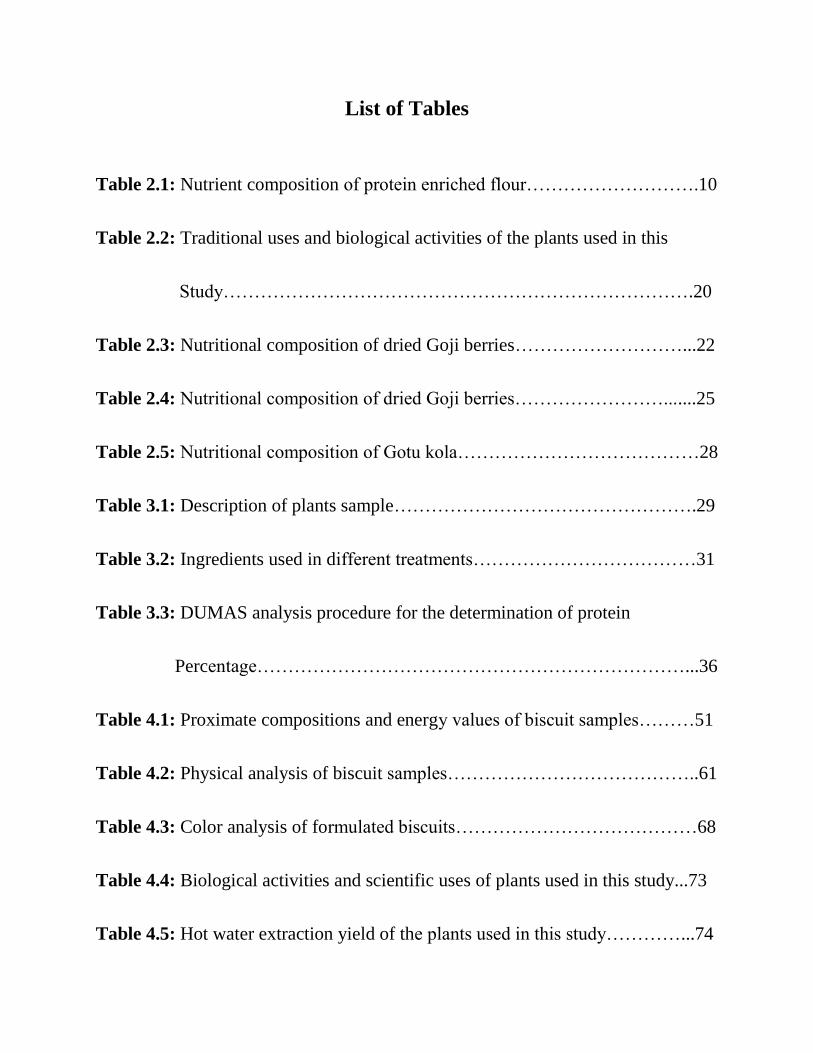
List of Tables
Table 2.1: Nutrient composition of protein enriched flour……………………….10
Table 2.2: Traditional uses and biological activities of the plants used in this
Study………………………………………………………………….20
Table 2.3: Nutritional composition of dried Goji berries………………………...22
Table 2.4: Nutritional composition of dried Goji berries…………………….......25
Table 2.5: Nutritional composition of Gotu kola…………………………………28
Table 3.1: Description of plants sample………………………………………….29
Table 3.2: Ingredients used in different treatments………………………………31
Table 3.3: DUMAS analysis procedure for the determination of protein
Percentage……………………………………………………………...36
Table 4.1: Proximate compositions and energy values of biscuit samples………51
Table 4.2: Physical analysis of biscuit samples…………………………………..61
Table 4.3: Color analysis of formulated biscuits…………………………………68
Table 4.4: Biological activities and scientific uses of plants used in this study...73
Table 4.5: Hot water extraction yield of the plants used in this study…………...74
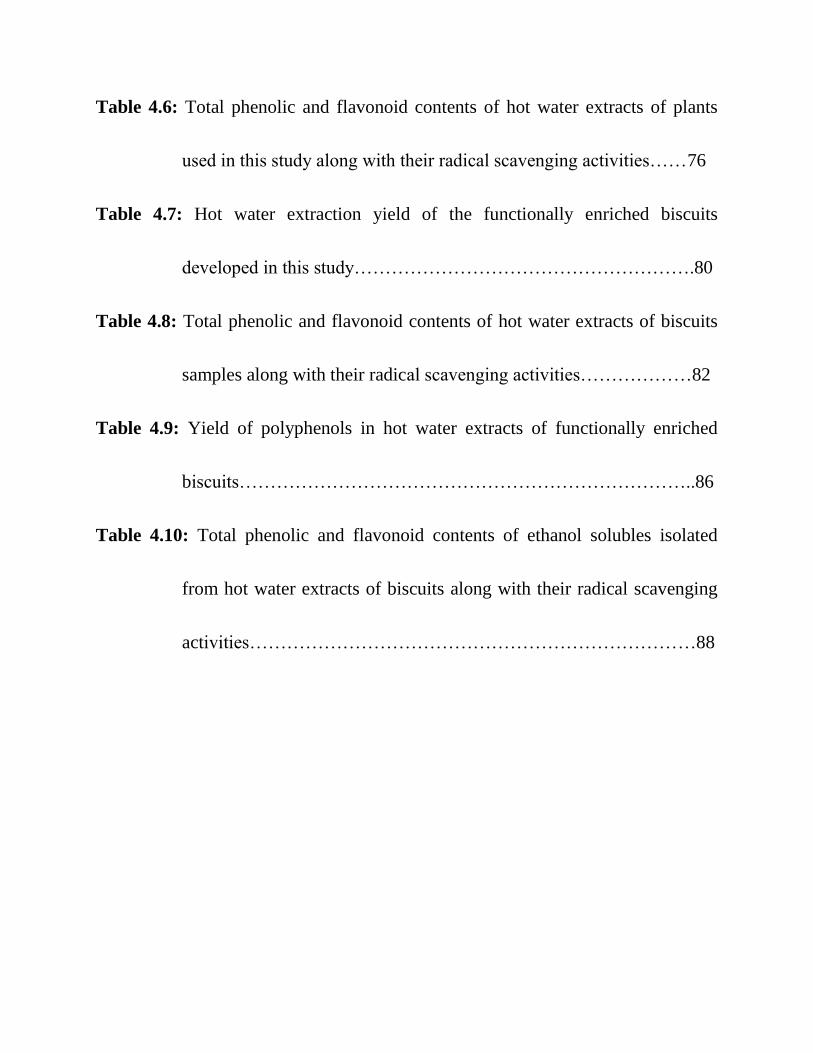
Table 4.6: Total phenolic and flavonoid contents of hot water extracts of plants
used in this study along with their radical scavenging activities……76
Table 4.7: Hot water extraction yield of the functionally enriched biscuits
developed in this study……………………………………………….80
Table 4.8: Total phenolic and flavonoid contents of hot water extracts of biscuits
samples along with their radical scavenging activities………………82
Table 4.9: Yield of polyphenols in hot water extracts of functionally enriched
biscuits………………………………………………………………..86
Table 4.10: Total phenolic and flavonoid contents of ethanol solubles isolated
from hot water extracts of biscuits along with their radical scavenging
activities………………………………………………………………88
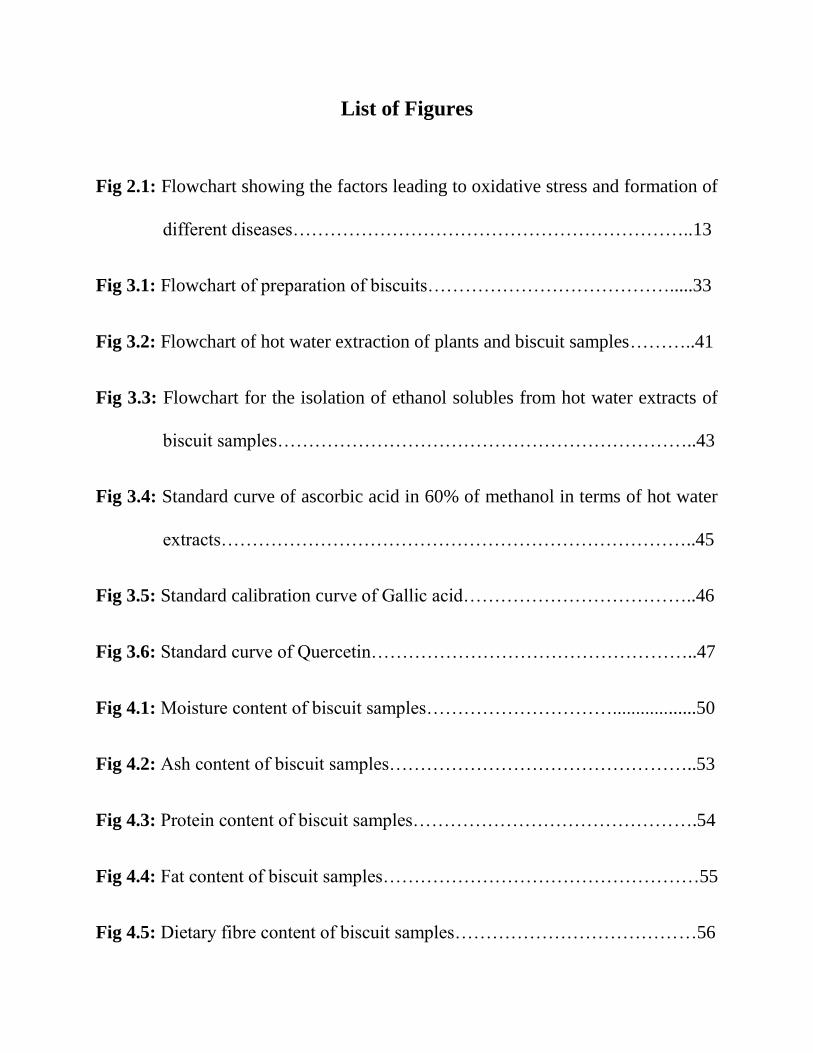
List of Figures
Fig 2.1: Flowchart showing the factors leading to oxidative stress and formation of
different diseases………………………………………………………..13
Fig 3.1: Flowchart of preparation of biscuits………………………………….....33
Fig 3.2: Flowchart of hot water extraction of plants and biscuit samples………..41
Fig 3.3: Flowchart for the isolation of ethanol solubles from hot water extracts of
biscuit samples…………………………………………………………..43
Fig 3.4: Standard curve of ascorbic acid in 60% of methanol in terms of hot water
extracts…………………………………………………………………..45
Fig 3.5: Standard calibration curve of Gallic acid………………………………..46
Fig 3.6: Standard curve of Quercetin……………………………………………..47
Fig 4.1: Moisture content of biscuit samples…………………………..................50
Fig 4.2: Ash content of biscuit samples…………………………………………..53
Fig 4.3: Protein content of biscuit samples……………………………………….54
Fig 4.4: Fat content of biscuit samples……………………………………………55
Fig 4.5: Dietary fibre content of biscuit samples…………………………………56

Fig 4.6: Carbohydrates content of biscuit samples……………………………….57
Fig 4.7: Energy values of biscuit samples………………………………………..58
Fig 4.8: Control and underutilized plants’ materials incorporated biscuits………60
Fig 4.9: Weight of biscuit samples…………………………………………….....62
Fig 4.10: Diameter of biscuit samples……………………………………………64
Fig 4.11: Thickness of biscuit samples…………………………………………...65
Fig 4.12: Spread ratio of biscuit samples……………………………………....…66
Fig 4.13: Bake loss of biscuit samples………………………………………...….67
Fig 4.14: L* value of biscuit samples………………………………………….....70
Fig 4.15: a* value of biscuit samples………………………………………..……71
Fig 4.16: b* value of biscuit samples……………………………………………..72
Fig 4.17: Total phenolic and flavonoid contents of hot water extracts of plants…77
Fig 4.18: ABTS•+ scavenging activity of hot water extracts of plants……….…...79
Fig 4.19: Total phenolic and flavonoid contents of hot water extracts of biscuit.
samples………………………………………………………………..…83

Fig 4.20: Total phenolic and flavonoid contents of ethanol solubles from hot water
extracts of biscuit samples………………………………………………89
Fig 4.21: ABTS•+ scavenging activity of ethanol solubles isolated from hot water
extracts of biscuit samples from Control to Sample-4………………….90
Fig 4.22: ABTS•+ scavenging activity of ethanol solubles isolated from hot water
extracts of biscuit samples from Control, Sample-5 & 6……………….90
Fig 4.23: Correlation between ABTS•+ radical scavenging activity with total
phenolic contents of antioxidant rich biscuit samples with varying
proportion of plants’ materials…………………………………………..91
Fig 4.24: Correlation between ABTS•+ radical scavenging activity with total
flavonoid contents of antioxidant rich biscuit samples with varying
proportion of plants’ materials………………………………………..…91

Abstract
This research was undertaken with a view to develop antioxidant rich high protein biscuits with
health promoting benefits. The flour used for this purpose was procured from Manildra Group of
Pty Ltd Company. In order to enhance the antioxidant properties of the biscuits, four traditionally
well-known underutilized plants with several health benefits have been chosen. These are
Moringa leaves, Gotu kola leaves, Schisandra berries, and Goji berries that are known to exhibit
antioxidant, antidiabetic, anticancer, anti-inflammatory, immunostimulatory, and
cardioprotective properties. The dried form of leaves and berries were used in this research. The
research was designed to prepare biscuit samples with different substitutions of the selected
plant’s material. Sample 1 was substituted with 1% of all the four plants in equal proportion
Sample 2 was substituted with 2% of all the four plants in equal proportion; Sample 3 was
substituted with 3% of all the four plants in equal proportion; Sample 4 was substituted with 4%
of all the four plants in equal proportion; Sample 5 was substituted with 1% of Moringa and
Gotu kola leaves in equal proportion; and Sample 6 was substituted with 1% of Schisandra and
Goji berries in equal proportion. A control sample without any plant material was also prepared
as a reference. Amongst the different biscuit samples developed in this research, sample 4 had
the highest proportion of plant’s material.
Nutritional and chemical analysis of the four plants used in this study revealed that all of them
exhibited highly significant radical scavenging activities that are superior to many well-known
anticancer traditional herbs. Particularly, Schisandra berries displayed extremely high
antioxidant activities. These activities were well correlated to the total phenolic and flavonoid
contents of the plants. The total phenolic and flavonoid contents of the six biscuit samples were

in accordance with the amounts of plant’s material incorporated. This is consistent with the
highest phenolic and flavonoid contents observed in sample 4. The antioxidant activities of the
six biscuit samples were also proportional to the amounts of plant material incorporated showing
a highly significant correlation of the activities with their polyphenol contents.
The biscuits (Sample-4) with 4% plant material are found to be the best substitution with the
highest polyphenol contents that offer an overall health benefit. Therefore, the antioxidant rich
high protein biscuits developed in this research are expected to provide health benefits including
alleviation of oxidative stress and associated diseases.

CHAPTER 1
INTRODUCTION

1
Chapter 1
Introduction
1.1 Introduction
Increasing awareness and scientific evidence clearly indicates a strong relationship between
health and diet. These factors have generated new concepts for researchers in the field of
nutrition science targeting the development and promotion of functional foods (Carnes et al.,
2013). The rapid increase in diseases is now increasing interest in more intensified research
regarding the antioxidant activity of bioactive components present in the food products and their
contribution to the prevention and treatment of several ailments. Functional foods are prominent
junctions in the field of health and nutrition. Most of the research studies have clarified their
scope and importance. The demands of functional food products are high in global health and
wellness market and also functional ingredient rich food products are now representing one of
the fastest growing sectors of food manufacturing an observed during the past few years (Kraus,
2015). Kulczynski & Gramza-Michalowska (2016) have reported in his study that, the American
Dietetic Association (ADA) has defined bioactive ingredients of food as “Bioactive food
components are physiologically active constituents in food or dietary supplements derived from
both animal and plant sources, including those needed to meet basic human nutrition needs that
have been demonstrated to have a role in health and to be safe for human consumption”.
Antioxidants have free radical scavenging activity and believed to offer a defense to the living
organism in protecting against reactive oxygen species (Dong-Ping et al., 2017; Ou et al., 2002).
Even though, living organisms have their own antioxidant defense and repair system in the body,

2
these systems are not enough to overcome the damage caused by reactive oxygen species.
Therefore, dietary antioxidant supplementation can help to maintain sufficient amount of
antioxidant status that is promising in strengthening the normal physiological function in all
living organisms (Almeida et al., 2011; Speroni et al., 2011; Thaipong et al., 2006). The
bioactive ingredient rich foods, vegetables, and herbal plants are the good source of exogenous
antioxidants.
The various research studies have demonstrated that the scope and benefits of antioxidants
constituents vary in every discipline. In food and nutrition science, antioxidants take a wider
scope that the field includes dietary antioxidants, such as functional foods that significantly
improve the physiological function of the body by decreasing the adverse effects of reactive
intermediate species in oxidation mechanisms in human beings. Moreover, natural antioxidants
also help to prevent the oxidation process which helps to improve the food products quality and
also nutritional values by interrupting the chain reactions of chelating and oxidative agents and
decomposed hydroperoxides (Antіnio, 2018; Aruoma, 1994).
In biological systems, the reactive oxygen spices (ROS) and reactive nitrogen spices (RNS) play
a dual contributory role in the biology of various chronic diseases (Chen et al., 2012; Fang et al.,
2002). Consequently, antioxidants provide counteracting protection against the free radicals and
the oxidative stress by scavenging these radicals (Liu, 2013; Wang et al., 2010; Zhong et al.,
2013). Due to the intense impact of environmental and endogenous radical-initiating factors,
including UV-radiations, dust, and pollutants, and autoxidation reactions can contribute to

3
oxidative stress leading to the structural damage of biomolecules and loss of function (Yousuf et
al., 2016).
Oxidative stress plays a key role in the generation of different pathologies, such as pathogenesis
of aging, inflammatory processes, cancer, cardio and neurodegenerative diseases (Tsang &
Chung, 2009). The exogenous antioxidants with the human body system may help to keep the
antioxidant status balance between oxidation and anti-oxidation by ameliorating the damage
caused by free radicals or oxidative stress generated during the physiological processes,
functioning as the scavengers of reactive radical species and diminishing harmful effects of
oxidative stress (Niki & Noguchi, 2008; Rohman et al., 2010; Valko et al., 2007). In the body
system, bioactive food compounds are important part of the antioxidant system for defense after
oxidative depletion via enzymatic antioxidant shortcomings or the reduction of other
antioxidants taken as diet and supplements that includes vitamin C, fatty acids polyphenols,
flavonoids, Gallic acid, phenolic acid (Bhagwat et al., 2010; Milner, 2004).
Scientific research studies have reported that synthesized antioxidant compounds, especially
butylated hydroxyl toluene (BHT), butylated hydroxyl anisole (BHA), and tert-butyl
hydroquinone (TBHQ) have been used to prevent the lipid peroxidation of food products. In
recent years, the increasing interest to search alternatives for synthetic antioxidants from food
components has promoted research on fruits, vegetables, and other plant sources to identify the
natural antioxidants in them (Jayathilakan et al., 2007).
4
The exogenous antioxidants are present in various types of plants, such as fruits, cereals, spices,
and herbs. These natural antioxidants from plant materials are mainly polyphenols, flavonoids, β-
carotene, vitamin C, anthocyanins, and polysaccharides which display significantly higher
antioxidant properties. Antіnio (2018) reported that natural antioxidants from plant materials,
especially polyphenols, carotenoids, and flavonoids exhibit an extensive range of health-
promoting bioactivities, such as cardioprotective, neuroprotective, antidiabetic, anti-
inflammatory, antimicrobial, anti-aging, cytotoxic, anticancer, antitumor, regulating of hormone
balance, immune system enhancement, and memory-enhancing activities, and also weight
reduction in humans.
Many observational studies have investigated that supplying to human beings with sufficient
quantity and ratios of nutrient is necessary to maintain the proper functioning of the body and
health. In addition to that, nutritional quality, the nutraceutical rich foods are expected to have
disease preventative properties. In this context, underutilized edible plants play an important role
as they can be added to improve functional /nutraceutical value of food products. Four
underutilized plants studied in this research, namely Moringa, Gotu kola, Goji berry, and
Schisandra berry are edible and also have been used as traditional medicine for centuries
(Benchennouf et al., 2017; Donno et al., 2015). Recently, these plants have also been well
studied for their antioxidant and functional properties (Damor et al., 2017; Oyeyinka &
Oyeyinka, 2018). These pharmacological studies have found that all the four plants display
excellent antioxidant and nutraceutical potentials and hence, are expected to have health-
promoting properties (Guo et al., 2008a; Gupta et al., 2007; Li & Zhou, 2007; Mocan et al.,
2014b; Pakade et al., 2013b; Panossian & Wikman, 2008; Wang et al., 2010). Based on their

5
antioxidant properties as well as their important health-promoting benefits, utilization and
supplementation of these under-utilized plants have received great attention in food science and
nutrition. It has indeed been demonstrated that these four plants can be used as ingredients for
the preparation of properly engineered foods (Alam et al., 2014).
Biscuits are popular snack foods and are consumed extensively among all age groups all over the
world especially in developing countries where protein and malnutrition are prevalent (Chinma
& Gernah, 2007; Chinma et al., 2012). Food industries are faced with the challenge of the
production of foods that are rich in bioactive ingredients in order to meet the current demands for
functional foods. Considering the nutritional and functional requirements, protein, and fibre
enriched flour together with plants’ parts (all from natural sources) have been rated as highly
nutritious, as these are rich sources of protein and antioxidants, easy to substitute and available at
reasonable cost (Kulthe et al., 2014).
1.2 Research Objectives
This project aims to develop and evaluate the physical, chemical, biological and nutritional
characteristics of antioxidant rich, high protein biscuits. Therefore, the present investigation was
planned to develop antioxidant rich, high protein biscuits by using under-utilized plants’ parts
along with protein enriched biscuit flour, sugar, pure maple syrup, Omega-3 rich canola oil,
baking powder, and other general ingredients. All these food ingredients will impart good
physical and nutritional characteristics, such as color, texture, and nutraceutical content that have

6
significance modern bakery products and other foods. The present research was conducted to
address the following objectives:
1. To develop value-added biscuits by using underutilized plants.
2. To study the physical and nutritional aspects of under-utilized plant based biscuits
3. To evaluate the antioxidant activities and antioxidant contents of the underutilized plant’s
based biscuits.

CHAPTER 2
LITERATURE
REVIEW

7
Chapter 2
Literature Review
2.1 Bakery products
Bakery industry is one of the largest and highly fragmented global industries in the world. In the
past five years, demand has risen for high quality bakery goods due to consumers’ health
consciousness. The introduction of biscuits that have been enriched with value-added bioactive
nutrients has also contributed to the growing demand of premium bakery products with
functional benefits. Biscuits are popular snack food due to a wide range of high quality products
that are readily available have a longer shelf life, and different taste and texture profiles at a
reasonable cost. At present, there is an ever-growing demand for high quality protein enriched
biscuits (Sonone et al., 2015).
Today, the consumers are aware of the relationship between diets and disease development so
they are more health conscious and prefer low calorie, low fat, and high protein foods that are
ready-to-eat. In this context, development of recipes that satisfy nutritional requirements and also
display diseases preventative function will play a key role in securing consumer health. Among
baked products, biscuits are especially popular being perceived as delicious products with special
organoleptic properties (Khan et al., 2014).
Recent studies suggest that people are aware of the benefits of consuming nutritious foods. The
development of an antioxidant rich and high protein containing biscuit is a worthwhile challenge
when considering the overall nutritional status of the population (Klunklin & Savage, 2018). In

8
considering the demand for the development of healthy food products, researchers have recently
become interested in functional foods that are high in protein and antioxidants as well as other
bioactive compounds due to their health-promoting benefits (Pasqualone et al., 2015).
Biscuits are one of the most popular bakery foods in the world and popular among all age
groups, due to convenience, taste, and low cost (Li, 2009). Fortification of biscuits with various
types of vitamins, minerals, herbs is a common practice (Karklina et al., 2012). Biscuits are
known for good palatability and have generally longer shelf-life and good eating quality. Also,
due to less moisture content in biscuit products, these are less susceptible to microbiological
spoilage. Nowadays, people emphasis is on healthy natural food products with low calories and
carbohydrates, protein enriched, more dietary fibre and antioxidant rich (Emire & Arega, 2012).
Herbal Biscuits are made by incorporation of underutilized plants’ parts in a mixture of biscuit
flour, powder sugar, canola oil, baking powder, sweetener, and other general ingredients which
have beneficial effects on overall health. Biscuits have become extremely popular due to their
sensory properties and texture, easy to eat and cost-effectiveness. Hence, antioxidant rich, high
protein biscuits will also be beneficial to achieve the nutritional security of any target population.
Considering these factors, the present study was designed aimed at formulating biscuits using
under-utilized plants’ materials in different proportions, and to evaluate the physicochemical,
nutritional and nutraceutical quality characteristics.
2.2 Need and significance of protein enrichment
Modern population is extremely health conscious due to some of the major world health
problems. In addition, increased awareness of the link between diet and health has motivated

9
new trends in nutrition science. As a result, more attention is given to the health benefits of
individual foods. In particular, attention is given to the development of foods that contain
nutraceuticals for the prevention of degenerative diseases and improving body function (Steijns,
2001).
Protein is an endogenous component of healthy diets. Protein source includes parts of plant
material, cereals and legumes, roots and vegetables, and animal foods. Animal foods are
considered as the best source of protein as they contain essential amino acids. However, over the
past few years, there is a growing demand for other alternative protein sources due to high the
cost of animal food products. New Scientific technologies have helped to isolate the readily
digestible fragments of food components from the non-digestible fractions such as protein,
bioactive ingredients, and fibre. It is known that many communities have changed eating habits
towards high quality healthy foods (Bunde et al., 2010).
Protein enriched flour has diversified uses in the food industry, especially in the preparation of
baked goods such as bread, cookies, and biscuits. Moreover, such preparations are characterized
by healthy nutritional properties with less fat content and high protein (about 13.3%) and other
essential micronutrients. Protein enriched flows can also be combined with other food
ingredients, such as natural antioxidants in the preparation of biscuit products because it helps to
enhance the physical, nutritional, functional, and sensorial quality characteristics of the baked
goods and also helpful the food industry to find it economical to use in high protein bread
preparations and biscuit manufacture (Oyeyinka & Oyeyinka, 2018). Such protein enriched flour

10
can be produced by mixing wheat, barley, and other ingredients. An example is provided in
Table 2.1. Protein enriched flour with similar composition (Table 2.1) has been purchased from
Manildra Group of Companies, Australia and used for this research.
Table 2.1: Nutrient composition of Protein Enriched Flour
Constituents Quantity g/100g
Moisture 14.0
Protein 13.5
Total Fat 1.6
Saturated Fat 0.2
Trans Fat <0.1
Carbohydrates 66.8
Sugar 2.3
Dietary Fibre 3.5
In the bakery industry, the concept of incorporation value-adding composite flour is not new and
has been the subject of several studies. However, composite flour blends materials should
preferably be readily available and also provide high quality nutritional potential (Olaoye &
Idowu, 2018). Biscuits have been suggested as a better utility for high quality protein enriched
flour than bread because of their wide consumption, good eating quality and relatively ready-to-
eat form along with longer shelf-life. Recently, there has been an increased trend of producing
cookies using natural antioxidants to improve their nutritional qualities. A variety of protein rich
flours such as, soybean, sweet potato, oats, and cowpea were utilized in biscuit preparations that
11
showed improvement in their antioxidative qualities (Sneha et al., 2012). Plant and fruits
components in the powdered form were also utilized to prepare nutritive cookies. New strategies
(NPD process, FFPD model) are also used where cookies and biscuit were prepared with plants
and fruits powder extracts, with the objectives to improve their quality with fortification of
protein, dietary fibre, antioxidant activity, and polyphenolic content in a cost-effective manner
(Raymond, 2013; Reid & Brady, 2012; Youssef, 2012).
Food products rich in protein and antioxidants can satisfy the demands of people for health
benefits. The intake of plant based antioxidants has been related to the maintenance of health and
reduction of the incidence of chronic diseases. A different variety of plant sources (Soya
proteins, quinoa, seitan, edamame beans, chia and hemp seeds) has been used in bakery products
to improve the texture, color, and aroma with a reduced calorie content of the final products
(Marijana, 2009). Antioxidants are bioactive constituents that have the ability to inactivate free
radicals, which are instable species that could cause several chronic diseases (Bolanho et al.,
2014). Underutilized plants parts that can be consumed by humans, and have high antioxidant
potential and several other therapeutic properties with major health benefits, such as the ability to
improve circulatory functions and mental acuity, antitumor activity against cancer, helps to
improve cardio-protective actions, ability to boost anti-diabetic, and anti-inflammatory actions
(Baldermann et al., 2016; Jansen et al., 2014). Moreover, the functional properties of new
products have therapeutic effects for selected diseases, such as anticancer, anti-ulcerogenic,
antiviral, wound healing, blood pressure-reducing, anxiolytic, arteriosclerosis reducing, and
improve venous insufficiency effects were ascribed as skin healing effects (Starowicz et al.,
2015). Towards this goal under-utilized plants’ based products can be included in various food

12
formulations. As discussed above oxidative mechanisms have the ability to produce undesirable
health effects in living systems, and lead to serious diseases. A brief description of oxidative
stress and formation is thereby provided below.
2.3 Oxidative stress in humans and disease formation
Reactive radical species are formed in the human body due to metabolic processes and external
factors such as exposure to radiation, pollutants and other factors (Akinmoladun et al., 2010)
Prolonged presence of excessive amounts of free radicals in the body can cause oxidative stress
that has the potential to impact on various metabolic pathways in cells (Apel & Hirt, 2004;
Aruoma, 1994). These effects can lead to oxidative damage to the structures of functional
biomolecules, such as DNA, proteins, and lipids. Such damage to functional biomolecules has
the potential to cause serious illnesses (as shown in Fig 2.1), such as cancer, cardiovascular and
neurodegenerative disorders (Athina & Antonios, 2006; Li et al., 2014; MacNee & Rahman,
1999; Malta et al., 2013). It is therefore essential to alleviate oxidative stress by scavenging the
reactive free radicals formed in the body. Biological systems possess their own antioxidant
defense; however, this is not sufficient to cope with excessive oxidative damage. In this context,
natural antioxidants consumed in the form of functional foods and dietary supplements are
extremely important for improving oxidative defense and restoration mechanism in living cells
(Aruoma, 1994; Lobo et al., 2010).
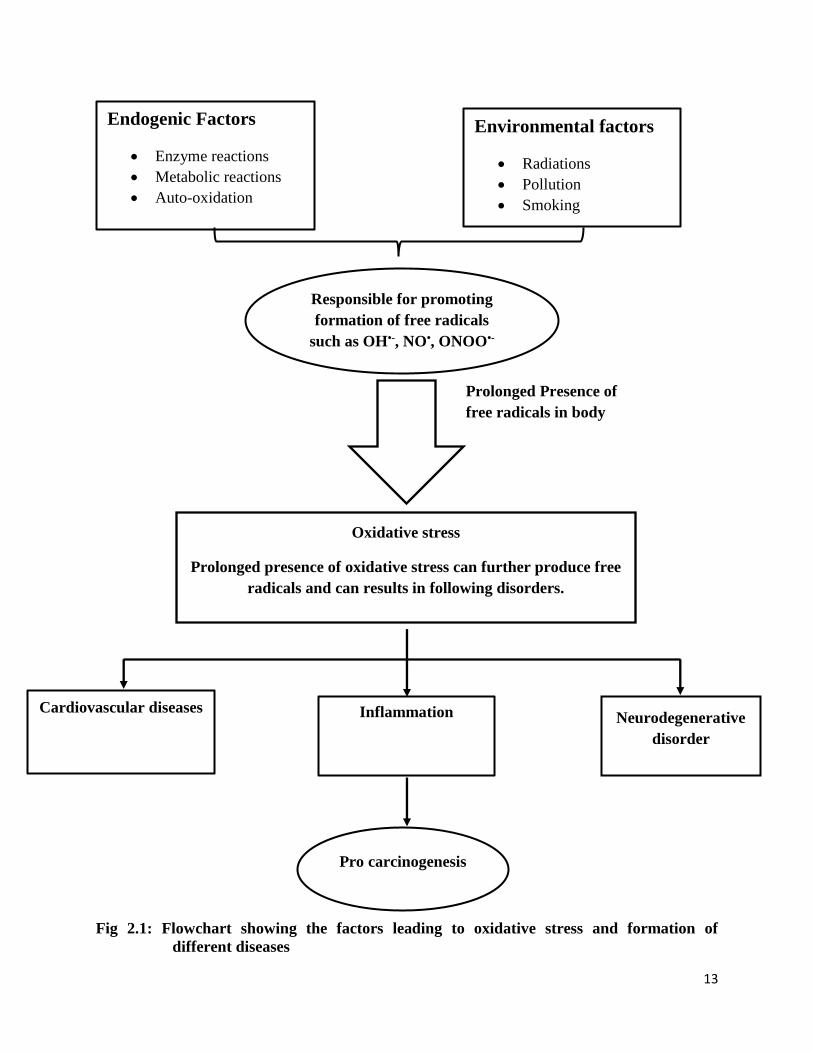
13
Fig 2.1: Flowchart showing the factors leading to oxidative stress and formation of
different diseases
Endogenic Factors
• Enzyme reactions
• Metabolic reactions
• Auto-oxidation
Environmental factors
• Radiations
• Pollution
• Smoking
Oxidative stress
Prolonged presence of oxidative stress can further produce free
radicals and can results in following disorders.
Cardiovascular diseases
Inflammation
Neurodegenerative
disorder
Pro carcinogenesis
Responsible for promoting
formation of free radicals
such as OH•-, NO•, ONOO•-
Prolonged Presence of
free radicals in body

14
As can be seen from the Figure, prolonged oxidative stress leads to a severe imbalance between
the production of free radicals and antioxidant protection in living systems. This situation can
ultimately affect the cells, tissue and the whole animal (Lushchak, 2015; Milner, 2004;
Mohamad et al., 2011; Rahman & Hussain, 2015). Continuous stress leads to a further increase
of free radicals and the formation of inflammation in the body (Diaz et al., 2012; Zhang et al.,
2011a). In such a situation, if the person’s innate immunity is frail and also not sufficient
antioxidants are consumed, inflammation can last for a longer period and a chronic condition is
established. Such chronic oxidative stress and inflammation lead to the formation of several
serious diseases like cancer (Karker et al., 2016; Shaikh et al., 2014).
Regular consumption of antioxidants such as polyphenols will effectively scavenge the reactive
free radicals in the body and prevents oxidative damage and associated diseases (Dance, 2017;
Fuente et al., 2005; Malta et al., 2013). Antioxidants are present in many plant based foods, such
as fruits and vegetables or they can also be manufactured by synthetic methods. Many scientific
studies demonstrated that synthetic antioxidant (such as BHT, BHA, TBHQ, and gallates) have
been used in the food industries to prevent the oxidation process and also have been included in
the human diet. However, their uses have raised concerns about high cost; cumbersome synthetic
procedures that make them least accessibility and more importantly they exhibit adverse side-
effects. Hence, natural antioxidants are the attractive alternative due to their cost-effectiveness,
least side-effects and high natural abundance in plants (Arulselvan et al., 2016; Ramana et al.,
2018).

15
Therefore, consumption of natural antioxidant rich food with sufficient amounts of polyphenols
(phenolic compounds and flavonoids) is expected to show a beneficial effect and provide
protective health advantage (Cai et al., 2004; Hashemzaei et al., 2017). Consequently, the use of
plant based bioactive compounds as antioxidants to induce a protective effect against the disease
causing free radicals has received more interest in food and nutrition science discipline.
In the body system, bioactive food constituents support internal antioxidant system in defense
against the reactive free radicals and the natural antioxidants that are consume through our diet
include glutathione, thiols, sterols, vitamin C, vitamin E, phytoestrogens, fatty acids, bioactive
peptides, carotenoids, stanols, polyphenols, such as flavonoids, isoflavones, Gallic acid, phenolic
acid, kaempferol, anthocyanins, and many more (Bhagwat et al., 2010; Guo et al., 2008c; Milner,
2004). Many of these antioxidants are present in plant based foods and herbs. A brief outline of
important antioxidant constituents present in various plants is given in the following sections.
2.4 Important classes of antioxidant constituents in plants
2.4.1 Polyphenols in plant sources
Polyphenols are secondary metabolites produced by plants (Molan et al., 2012). The literature
demonstrates that many polyphenols possess antioxidant, immunomodulatory, anti-
inflammatory, antitumor, antidiabetic, antiviral and many other activities (Cai et al., 2004). It is
known that the antioxidant activities are related to the structures of these molecules. Generally,
the number of hydroxyl groups and their position and the presence of other functional groups are
linked to the antioxidant activity of these compounds. Glycosylation of flavonoids is also linked

16
to the improved antioxidant action (Cai et al., 2004; Choudhary & Swarnkar, 2011; Guo et al.,
2008c).
Flavonoids are an important class of polyphenols and occur extensively in plant tissue and
exhibit different colors (blue, purple, yellow, orange and red). Flavonoids are structurally rigid
with three-rings and contain many hydroxyl groups, and other functional groups (Hashemzaei et
al., 2017; Wolfe & Liu, 2008). They display the antioxidant function by scavenging the free
radicals as well as by chelating with metal ions. Owing to the tremendous importance and health
benefits of these compounds, the total phenolic content and total flavonoid contents of plant
based foods are measured on their water/ethanol extracts. These contents are generally used as a
measure of their activities and health benefits of the associated foods.
2.4.2 Trace metals in plants
In addition to polyphenols, plants also contain several trace minerals (Sium et al., 2016).
Literature demonstrates that trace metals such as Iron (Fe), Copper (Cu), zinc (Zn), Potassium
(K), Magnesium (Mg), Calcium (Ca), Rubidium (Rb), and many other metals display health
benefits against several diseases including oxidative stress and cancer (Schwartz, 1975). For
instance, it has been demonstrated that sufficient intake of foods rich in zinc is important to
alleviate oxidative damage and DNA repair (Nielsen, 2014; Prasad, 2014a), whereas, intake of a
diet deficient with zinc can potentially lead to cancer formation (Prasad, 2014b). Selenium rich
diet or selenium supplementation lowers the risk of several types of cancers (Dennert et al.,
2011; Etani et al., 2014; Hatfield & Gladyshev, 2009).
17
A brief outline of the principle involved in the measurement of antioxidant activities is provided
below. These measurement methods help to grade various plant extracts according to their
antioxidant potentials.
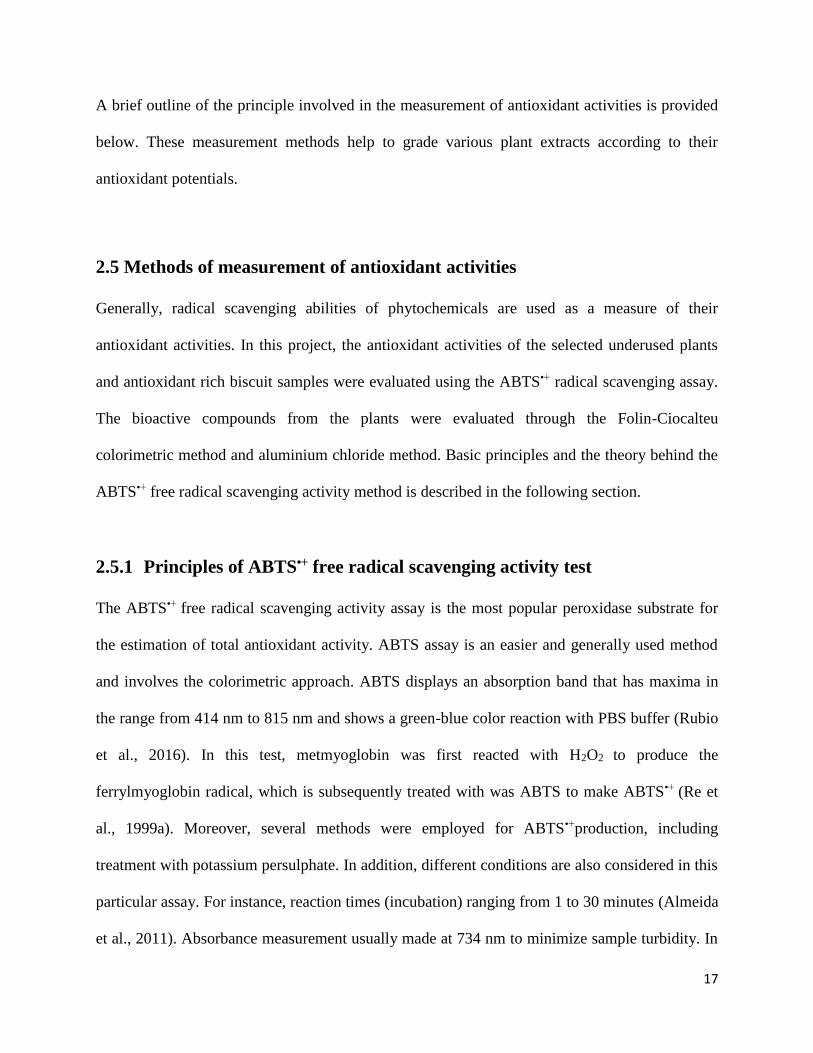
2.5 Methods of measurement of antioxidant activities
Generally, radical scavenging abilities of phytochemicals are used as a measure of their
antioxidant activities. In this project, the antioxidant activities of the selected underused plants
and antioxidant rich biscuit samples were evaluated using the ABTS•+ radical scavenging assay.
The bioactive compounds from the plants were evaluated through the Folin-Ciocalteu
colorimetric method and aluminium chloride method. Basic principles and the theory behind the
ABTS•+ free radical scavenging activity method is described in the following section.
2.5.1 Principles of ABTS•+ free radical scavenging activity test
The ABTS•+ free radical scavenging activity assay is the most popular peroxidase substrate for
the estimation of total antioxidant activity. ABTS assay is an easier and generally used method
and involves the colorimetric approach. ABTS displays an absorption band that has maxima in
the range from 414 nm to 815 nm and shows a green-blue color reaction with PBS buffer (Rubio
et al., 2016). In this test, metmyoglobin was first reacted with H2O2 to produce the
ferrylmyoglobin radical, which is subsequently treated with was ABTS to make ABTS•+ (Re et
al., 1999a). Moreover, several methods were employed for ABTS•+production, including
treatment with potassium persulphate. In addition, different conditions are also considered in this
particular assay. For instance, reaction times (incubation) ranging from 1 to 30 minutes (Almeida
et al., 2011). Absorbance measurement usually made at 734 nm to minimize sample turbidity. In

18
general, the test sample has to be added after the ABTS•+ has been generated and amount of
ABTS•+remaining after reaction with antioxidants in the sample is measured after a certain
reaction time; expressed as a standard for comparison scavenging activity of the specific sample.
Due to the ease and quick analysis, ABTS assay is the most preferred method for assessing
radical scavenging potentials of plant extracts (Re et al., 1999b). In this project, free radical
scavenging activities of aqueous extracts and their ethanol solubles of the selected plant species
were carried out using this method.
With the knowledge on how natural antioxidants alleviate oxidative stress and help to prevent
diseases formation, it is pertinent at this stage to discuss some of the underutilized plants and
their antioxidant potentials. Their use in bakery products to improve functional properties is also
outlined below.
2.6 Improving the antioxidant quality of bakery products with underutilized
plants
Recent research demonstrated that, in addition to incorporating protein into bakery products, the
inclusion of suitable quantities of plant material into these foods improves their therapeutic
benefit (Chavan & Kadam, 1993; Ranawana et al., 2016). In this context, plants with antioxidant
potential are of high value as they offer medicinal value to prevent a number of lifestyle
disorders related to oxidative stress (Eddouks et al., 2014).
Increasing human population, changes in the environment and the world food shortage in the
past few years has raised the concerns about terrestrial food security (Birch et al., 2011;

19
Chakraborty et al., 2016; Gross, 2014). In order to address these concerns and also to improve
nutritional/medicinal quality, Food Science and Technology researchers have explored the use of
natural plant resources to manufacture novel and value-added foods (Carocho et al., 2015; Hintz
et al., 2015). Such foods will not only offer great nutritional value but also possess disease
preventative and therapeutic importance (Bisla et al., 2014).
Bioactive compounds are abundantly present in plants and these form significant constituents of
functional foods in the diet (Hasler, 2002; Rivera et al., 2010). Many researchers strongly
suggested that plant food based natural antioxidants and phytonutrients are more effective than
synthetic food additives (Kumar et al., 2015; Li et al., 2014). Thus, these sources based
antioxidants are more effective to prevent oxidative stress and associated disorders (Scalbert et
al., 2011). It should be noted that organic plant based bioactive compounds play a special role in
this context (Ganesan & Xu, 2018; Mgbeahuruike et al., 2017; Sasidharan et al., 2010).
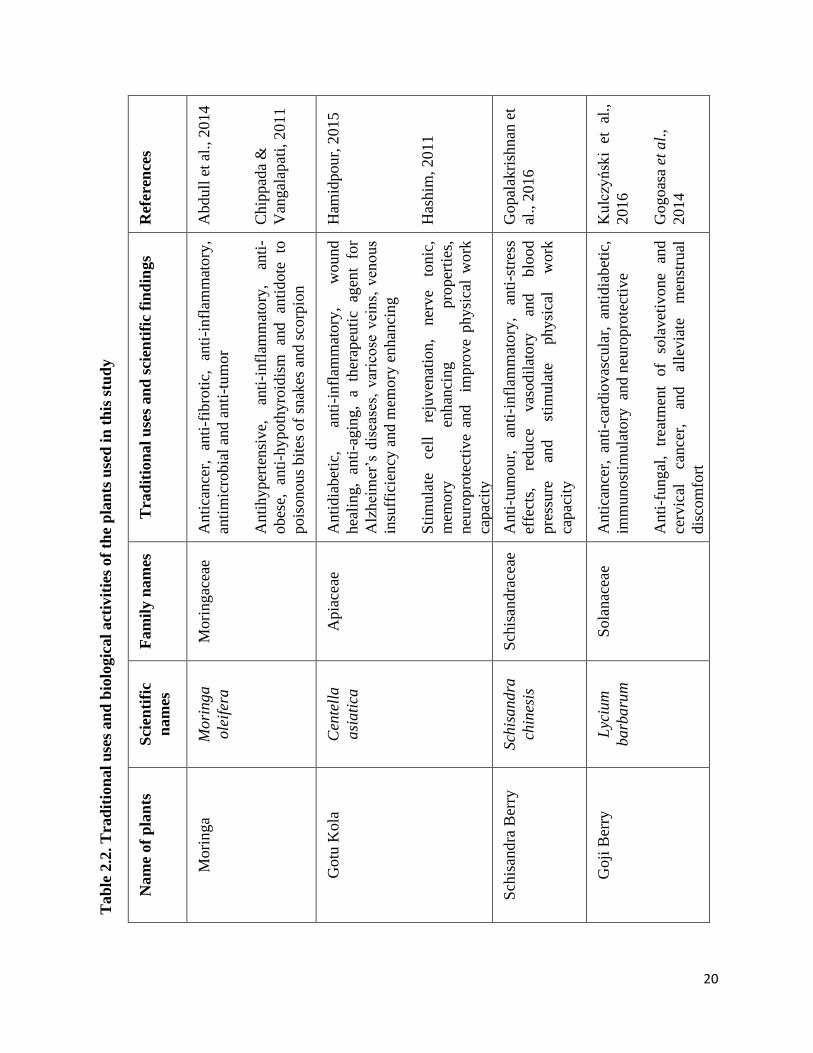
There are a number of underutilized plants throughout the world (Mavlyanova, 2013) and their
use in bakery products is of enormous value. This project has considered four such underutilized
plants to develop and manufacture “high protein and antioxidant rich biscuits”. These plants
include Moringa, Goji berry, Schisandra berry, and Gotu kola. Traditional uses and biological
activities of these plants along with their scientific names are provided in Table 2.2. Importance
of these additions and the antioxidant potentials of the four plants studied in this research are
outlined below. A brief description of the traditional knowledge and antioxidant potentials of
these plants is also given.
20
Tab
le 2
.2. T
rad
itio
nal
use
s an
d b
iolo
gic
al
act
ivit
ies
of
the
pla
nts
use
d i
n t
his
stu
dy
Ref
eren
ces
Abdull
et
al., 2
014
Chip
pad
a &
Van
gal
apat
i, 2
011
Ham
idpour,
2015
Has
him
, 2011
Gopal
akri
shnan
et
al., 2
016
Kulc
zyńsk
i et
al
.,
2016
Gogoas
a et
al.
,
2014
Tra
dit
ion
al
use
s an
d s
cien
tifi
c fi
nd
ings
Anti
cance
r,
anti
-fib
roti
c,
anti
-infl
amm
atory
,
anti
mic
robia
l an
d a
nti
-tu
mor
Anti
hyper
tensi
ve,
an
ti-i
nfl
amm
atory
, an
ti-
obes
e,
anti
-hypoth
yro
idis
m
and
anti
dote
to
pois
onous
bit
es o
f sn
akes
and s
corp
ion
Anti
dia
bet
ic,
anti
-infl
amm
atory
, w
ound
hea
ling,
anti
-agin
g,
a th
erap
euti
c ag
ent
for
Alz
hei
mer
’s d
isea
ses,
var
icose
vei
ns,
ven
ous
insu
ffic
iency
and m
emory
enhan
cing
Sti
mula
te
cell
re
juven
atio
n,
ner
ve
tonic
,
mem
ory
en
han
cing
pro
per
ties
,
neu
ropro
tect
ive
and
imp
rove
physi
cal
wo
rk
capac
ity
Anti
-tum
our,
an
ti-i
nfl
amm
atory
, an
ti-s
tres
s
effe
cts,
re
duce
vas
od
ilat
ory
an
d
blo
od
pre
ssure
an
d
stim
ula
te
physi
cal
work
capac
ity
Anti
cance
r, an
ti-c
ardio
vas
cula
r, an
tidia
bet
ic,
imm
unost
imula
tory
an
d n
euro
pro
tect
ive
Anti
-fungal
, tr
eatm
ent
of
sola
vet
ivone
and
cerv
ical
ca
nce
r,
and
alle
via
te
men
stru
al
dis
com
fort
Fam
ily n
am
es
Mori
ngac
eae
Apia
ceae
Sch
isan
dra
ceae
Sola
nac
eae
Sci
enti
fic
nam
es
Mori
ng
a
ole
ifer
a
Cen
tell
a
asi
ati
ca
Sch
isan
dra
chin
esis
Lyc
ium
barb
aru
m
Nam
e of
pla
nts
Mori
nga
Gotu
Kola
Sch
isan
dra
Ber
ry
Goji
Ber
ry

21
2.6.1 Moringa (Moringa oleifera)
It is well established in the scientific literature that synthetic antioxidants are non-compatible for
human consumption as they cause several side-effects (Chen et al., 2012). In this context, plant
based natural antioxidants are considered to be the best alternatives for human use. Particularly,
the plants that have been used traditionally for treating various ailments are considered to be
important for direct consumption as antioxidants as well as to prepare foods enriched with
dietary antioxidants and these foods are expected to possess therapeutic value (Schwarzinger &
Kranawetter, 2004; Wang et al., 2011).
Moringa oleifera plant is also known as “Miracle Tree” that belongs to a monogenetic family
(Bennett et al., 2003). Moringa is a small ornamental tree which has originated in India. The high
nutritional value of its leaves is most useful and the plant grows well in all seasons as it is a
tropical drought tolerant tree (Gopalakrishnan et al., 2016). Phytochemicals present in this plant
display several biological activities such as analgesic, blood pressure control, and anti-
inflammatory potentials (Mbikay, 2012). Alam et al., (2014) have demonstrated that the tea
prepared with Moringa plant possess the antidiabetic property and is useful to treat
hyperglycemia.
Moringa leaves possess high antioxidant capacity due to the presence of large quantities of
minerals, vitamins and phenolic constituents such as Quercetin and kaempferol (Coppin et al.,
2013). Animal food enriched with Moringa leaves is known to defend them from diseases
associated with oxidative stress and contributes to the improvement of meat quality for
consumption by humans (Damor et al., 2017; Karthivashan et al., 2015; Oyeyinka & Oyeyinka,

22
2018). In fact, it was demonstrated that the water extracts of Moringa leaves exhibit significant
antioxidant potential (Richter et al., 2003; Siddhuraju & Becker, 2003). Literature revealed that
the extracts of Moringa leave exhibit cholesterol-lowering activity and inhibited the formation of
atherosclerotic plaque in coronary arteries in rabbits on high cholesterol food, indicating that
these leaves contain preventative agents for cardiovascular diseases (Chumark et al., 2008; Stohs
& Hartman, 2015). Proximate analysis and nutritional study of plant based foods play a critical
role in evaluating their nutritive importance. Standard analytical techniques have been used to
estimate various nutrients in the powdered form of dry Moringa leaves and these results are
presented in Table 2.3.
Table 2.3: Nutritional analysis of Moringa leaves
Constituents As per edible portion % / 100g
Moisture 6.12
Ash 11.50
Protein 24.31
Carbohydrates 55.97
Total fat 9.22
Saturated fatty acids 3.77
Unsaturated fatty acids 5.45
Monounsaturated fatty acids 0.87
Dietary fibre 10.28
Source: (Saini et al., 2016)

23
Moringa is extremely rich in antioxidant constituents and proven to be better than many well-
known antioxidant rich fruits and vegetables. For instance, Moringa stands out in comparison to
strawberries with high phenolic content, hot pepper with high ascorbate content, carrot with high
β-carotene content and soybean with high α-tochopherol content (Yang et al., 2006b). The
literature clearly demonstrates that Moringa provides a wide range of dietary antioxidant
constituents (Abdull et al., 2014; Alam et al., 2014; Muthukumar et al., 2014; Thurber & Fahey,
2009; Vergara-Jimenez et al., 2017). Moringa possesses remarkable therapeutic/preventative
potential including antiulcer, antibiotic, antioxidative and anticancer activities (Siddhuraju &
Becker, 2003; Yang et al., 2006a).
Several studies on the antioxidative activity of the leaves and flowers of the Moringa oleifera
have shown that results are comparable to many well-known nutrient rich and health beneficial
vegetables. Pakade et al., (2013a) have determined the polyphenol contents of Moringa leaves
that are found to be superior to many vegetables. Moringa has also been reported to contain
different types of tochopherols that are α, γ and ᵟ at fairly high amounts. Both tender and mature
leaf extracts are found to display DPPH radical scavenging activity. The activity was more in the
mature leaves than the tender ones (Mohamad et al., 2011; Siddhuraju & Becker, 2003; Sreelatha
& Padma, 2009; Stohs & Hartman, 2015).
As can be seen from these findings, high nutritional value and remarkable health beneficial
activities of Moringa leaves make them extremely important ingredient for mixing with novel
bakery products.
24
2.6.2 Goji Berry (Lycium barbarum)
Goji berries (Lycium barbarum) also known as wolfberries, belonging to the Solanaceae family
have been used as a traditional medicine for centuries (Kulczyński & Michalowska, 2016). Dry
Goji berry fruits have several beneficial health effects because of their rich nutrients, such as
phenolic compounds and other antioxidant constituents with high biological activity
(Benchennouf et al., 2017; Donno et al., 2015; Guo et al., 2008b; Islam et al., 2017; Jiang, 2014;
Kulczyński & Michalowska, 2016; Wang et al., 2010; Xin et al., 2017; Zhang et al., 2011b).
Dietary fibre and other phytonutrients present in this fruit help to reduce the risk of several
diseases including cardiovascular, diabetics, high blood pressure, obesity, and certain
gastrointestinal ailments (Wang et al., 2010). Recent scientific literature demonstrates that
polysaccharides and other phytochemical constituents from goji berries display several biological
activities such as antioxidant, anti-tumor, immunomodulatory effects (Amagase et al., 2009;
Anon, 2015; Cheng et al., 2014; Yan et al., 2014). These studies indicate tremendous health
benefits of goji berries which are consistent with their traditional use (Amagase & Nance, 2011;
Paul-Hsu et al., 2012). It is therefore expected that Goji berries are an extremely important
source of dietary antioxidants that may be beneficial to prevent diseases related to oxidative
stress (Islam et al., 2017). It is important to note that a few cases of side effects have been
reported, however, such negative effects are very rare (Xin et al., 2017). Some side effects have
been noticed in the patients on anticoagulants and these people need to exercise caution due to
possible drug interaction (Rivera et al., 2012).
The Goji fruit market is significantly expanding because of an increased awareness of the health
benefits. Carotenoids present in Goji berries possess significant bioactivities (Donno et al., 2014;

25
Endes et al., 2015) that are widely used as coloring agents for a wide range of foods (Fratianni et
al., 2015). Table 2.4 provides the nutritional composition of dried Goji berries (Niro et al., 2017).
Table 2.4: Nutritional composition of dried Goji berries
Source: (Niro et al., 2017)
2.6.3 Schisandra berry (Schisandra chinensis)
The fruits of Schisandra (Schisandra chinensis) are well-known for their use in traditional
Chinese medicine for treating chronic cough, palpitation, memory loss, protecting the skin, repair
skin damage and many other ailments (Chen et al., 2012). Recent scientific studies clearly
demonstrate the high antioxidant potential of these fruits and the bioactive constituents derived
from them (Chen et al., 2012; Mocan et al., 2014a; Wang et al., 2011). It has also been
demonstrated that the antioxidant activities of extracts of Schisandra berries correlate well with
phenolic and flavonoids contents (Wang et al., 2011). Very recently, Lee et al., (2018) have
isolated a novel anticancer agent (deoxyschizandrin) that exhibits significant activity against
Constituents As per edible portion/100g
Moisture 9.3
Protein 10.2
Fat 4.4
Carbohydrates 61.3
Dietary Fibre 8.8

26
ovarian cancer. Owing to their tremendous health beneficial effects as traditional medicine and
also due to their antioxidant/therapeutic potential, it may be concluded that Schisandra berries
are extremely suitable candidates to prepare antioxidant rich bakery foods (Lobo et al., 2010). In
addition, no negative health effects on humans were identified for this fruit and this is
understandable for a traditional medicine that was used for thousands of years.
In addition to having significant quantities of polyphenols, Schisandra berries also contain other
antioxidants such as essential oils, polysaccharides, vitamin C, vitamin E, and other
phytonutrients (Chen et al., 2012; Mocan et al., 2014a; Wang et al., 2011). Highly active
flavonoids present in these fruits include isoquercitrin, quercetin, and rutin. These fruits are
currently used in foods such as jam, yogurt, cakes, wine, and a few other products as functional
additives (Chen et al., 2011; Lu & Chen, 2008).
2.6.4 Gotu Kola (Centella asiatica)
Gotu Kola (Centella asiatica) is a tropical medicinal plant that has been extensively used in
Indian Ayurvedic medicine for centuries (Hamidpour, 2015). According to Ayurveda literature,
this plant is used to treat several ailments including skin disorders, enhancing memory and
cognition, ulcers, leprosy, diarrhoea and many other conditions (Hamidpour, 2015; Hashim,
2011). Several clinical studies have revealed its therapeutic potential to treat Alzheimer’s, high
blood sugar, wound healing and also as an anti-inflammatory agent (Chippada & Vangalapati,
2011; Hamidpour, 2015; Hashim, 2011). It is an extremely useful plant to improve learning and
memory. Presence of large quantities of antioxidant constituents such as phenolic compounds

27
and flavonoids make this plant an extremely useful herb to treat diseases associated with
oxidative stress (Hamidpour, 2015; Hashim, 2011). In many countries, Gotu kola leaves are used
as vegetables and also as a tonic to improve health. These drinks are processed as ready to drink
juices and cordials (Hashim, 2011).
Extracts of Gotu kola and also its fermented herbal tea exhibit high antioxidant activities and
these activities correlate well with their phenolic content (Ariffin et al., 2011; Hashim, 2011;
Zainol et al., 2003). Tremendous health benefits together with extremely low toxicity make this
plant an ideal candidate for functional and therapeutic applications (Ariffin et al., 2011; Hashim,
2011; Shakir Jamil et al., 2007; Zainol et al., 2003). Shukla et al., (1999) and Somboonwong et
al., (2012) have reported that triterpenoid compounds present in this plant are effective for
treating skin problems and wound healing (Somboonwong et al., 2012).
Literature reports that the leaves of this plant contain several important and highly active
flavonoids, such as quercetin, kaempferol, patuletin, rutin (Ariffin et al., 2011; Das, 2011). These
phytochemicals are responsible for radical scavenging and metal chelating activities (Schmitt-
Schillig et al., 2005).
Nutritional composition found in Gotu kola leaves are mainly proteins, carbohydrates, and fibre
and these details are presented in the Table 2.5 below.

28
Table 2.5: Nutritional composition of Gotu kola
Constituents As per edible portion/100g
Moisture 8.7
Protein 2.4
Fat 0.2
Insoluble Fibre 5.4
Carbohydrates 6.7
Phosphorus 17.0 mg
Iron 14.9 mg
Sodium 107.8 mg
Source: (Chandrika & Prasad-Kumara, 2015)
Tremendous health benefits as evidenced by traditional, as well as scientific knowledge on the
four plants, leads to the conclusion that they are improved candidates to be used to manufacture
antioxidant rich biscuits. This research, therefore, aimed to manufacture biscuits using these four
plants’ parts and their nutritional and antioxidant potential has been evaluated.

CHAPTER 3
MATERIALS
&
METHODS

29
Chapter 3
Materials and Methods
3.1 Procurement of raw materials
Moringa leaves, Gotu kola leaves, Schizandra berry fruit, and Goji berry fruit samples were
procured from Sunrise botanicals Austral Herbs and Spices Australian Company PTY LTD. The
bulk sample of flour was procured from Manildra flour mills PTY LTD, Australia and other food
ingredients, such as Queen pure maple syrup, CSR powdered sugar, Gold’n Canola oil
(Omega3), and McKenzie’s baking powder was procured from Australian local supermarket. All
the plants’ sample and food materials samples were stored in the food research laboratory. The
plants’ samples were powered and subjected to hot water extraction procedure.
Table 3.1: Description of Pants’ Sample
Sample Name Scientific Name Sample Description
Moringa Moringa oleifera Dry leaves
Gotu Kola Centella asiatica Dry leaves
Goji Berry Lycium barbarum Dry berries
Schisandra Berry Schisandra chinensis Dry berries
3.2 Chemicals and reagents
Quercetin, potassium chloride, gallic acid, disodium orthophosphate, sodium chloride,
potassium phosphate monobasic, potassium persulphate, sodium nitrite, sodium phosphate

30
dibasic, aluminium chloride, 2,2'-azino-bis(3-ethylbenzothiazoline-6-sulphonic acid (ABTS),
Folin–Ciocalteu reagent (FCR), Sodium carbonate, ethanol, methanol, ascorbic acid (Vitamin
C). Sodium hydroxide, petroleum ether, Ethylenediaminetetraacetic Acid (EDTA) was
purchased from Sigma, Australia and Lomb Scientific Pty Ltd, Australia.
3.3 Preparation of plant powder (raw materials)
The Schisandra berries and goji berries were dried in an air oven (Rational CPC, Germany) at
110 °C for 24 h. After that, dried forms of all four plants material were ground in the mechanical
grinder (Breville – The BossTM – BBL915BAL) to form a powder. The powdered plant samples
were stored in airtight bags at 4 °C in a refrigerator until further analysis.
3.4 Development of biscuits
The biscuit was also made from the flour without plant samples to serve as the control. Biscuits
with different proportion of the selected four plant powders were mixed with the same flour. In
addition to antioxidant rich plant material and high protein flour, the other standard ingredients
(sugar, pure maple syrup, canola oil, baking powder, and water) were used for the preparation of
these biscuits. These ingredients are expected to improve nutritional as well as the functional
value of the biscuits that are desirable in the modern food industry. The antioxidant rich and high
protein biscuit samples were prepared in the M10 building of Western Sydney University at
Hawkesbury campus; kitchen laboratory using standardized recipes (Chauhan et al., 2016a,
Chauhan, 2014) with fortification of under-utilized plants powder is given as follows:

31
Table 3.2: Ingredients used in different treatments
3.4.1 Biscuit Manufacturing Process
Sieve the flour, plants powder, and baking powder and were mixed together to homogenize the
blend. Canola oil, maple syrup, and sugar were mixed together in a Hobart commercial dough
mixer (Hobart A200-20 QT Mixer) for 30 s at low speed (no. 1) to obtain a shortening cream, the
bowl was scraped down and the mixing was continued at higher speed (no. 2) for 3 minutes.
Ingredients
(g)
Control
(g)
Sample 1
(g)
Sample 2
(g)
Sample 3
(g)
Sample 4
(g)
Sample 5
(g)
Sample 6
(g)
Protein enriched
Flour 1000 990 980 970 960 995 995
Moringa leaves - 2.5 5 7.5 10 2.5 -
Gotu Kola leaves - 2.5 5 7.5 10 2.5 -
Goji Berry - 2.5 5 7.5 10 - 2.5
Schisandra Berry - 2.5 5 7.5 10 - 2.5
Powder Sugar 125 125 125 125 125 125 125
Maple Syrup 125 125 125 125 125 125 125
Canola oil 250 250 250 250 250 250 250
Baking Powder 8 8 8 8 8 8 8
Water 400 400 400 400 400 400 400
32
Then the mixture of dry ingredients such as flour, plants’ powder, and baking powder was added
to shortening cream with the addition of water and mixing for 3 minutes at no. 1 speed for proper
mixing of all the ingredients (Hobart A200-20 QT Mixer). After that, scraped down the bowl
once more and continued mixing at the same speed for 2 minutes. The kneading procedure
developed by (Chauhan, 2014) was employed to prepare the dough with desirable consistency.
The dough was then kept at room temperature for 15-20 minutes. Then the sheets were made by
making balls with the dough and rolling them and were then cut by specific biscuit cutter (D-
Line- Plain Biscuit Cutter S/S). The biscuits were placed on a baking tray coated with baking
paper. Each lot was baked at 175 °C for 15-17 minutes in an electric oven (Rational ClimaPlus
Combi@ CPC). The biscuits were cooled to room temperature and packed in heat-sealed high-
density polyethylene (HDPE) bags and stored in the cold room for subsequent analysis.

33
Fig 3.1: Flowchart of preparation of Biscuits
Preparation of raw ingredients
Flour, plants materials and baking powder are sieved
and mixed together (dry ingredients mix)
Mixed fat, sugar and maple syrup and make
shortening cream
creaming
Dry flour mix is added into the shortening cream
Mixed and kneaded to make dough
The dough was rolled into sheets and cut to the shape
Baked at 175 °C for 15-17 minutes
Cooling and packaging
Storage of biscuits until further analysis

34
3.5 Proximate and physical analysis of antioxidant rich and high protein
biscuits
Analyses were performed in the food science research laboratory at the School of Science and
Health, Hawkesbury campus, Western Sydney University. The analyses were carried out to
evaluate the biscuit samples in terms of nutritional and physical qualities.
3.5.1 Proximate composition
The biscuits samples were analyzed for moisture, ash, protein, fat, fibre, carbohydrates, and
energy. The proximate analyses were determined by using the Official Methods of Analysis of
AOAC (AOAC, 1995). Samples were ground to make a powder form before analysis. All
samples were analyzed in triplicates.
3.5.1.1 Moisture content
The moisture content was determined by using AOAC Official method, 1995. Five grams (5 g)
of biscuit samples were taken into the tared aluminium moisture pans. The moisture content of
the biscuit samples was measured as the loss after drying in an air oven (Clayson OM400T oven)
at 100 °C for overnight as per standard AOAC method and the lids were placed under the dishes
to evaporate moisture until a constant weight was attained. Dried samples of biscuits were
removed from the oven and were placed in a desiccator to cool to room temperature and
weighed. All the experiments were carried out in triplicates and results were expressed in
percentages. The moisture content of the biscuit samples was calculated using the equation
below:
%Moisture =(Pan & dry sample − Pan Wt. )
(Pan & wet sample − Pan wt. )× 100
35
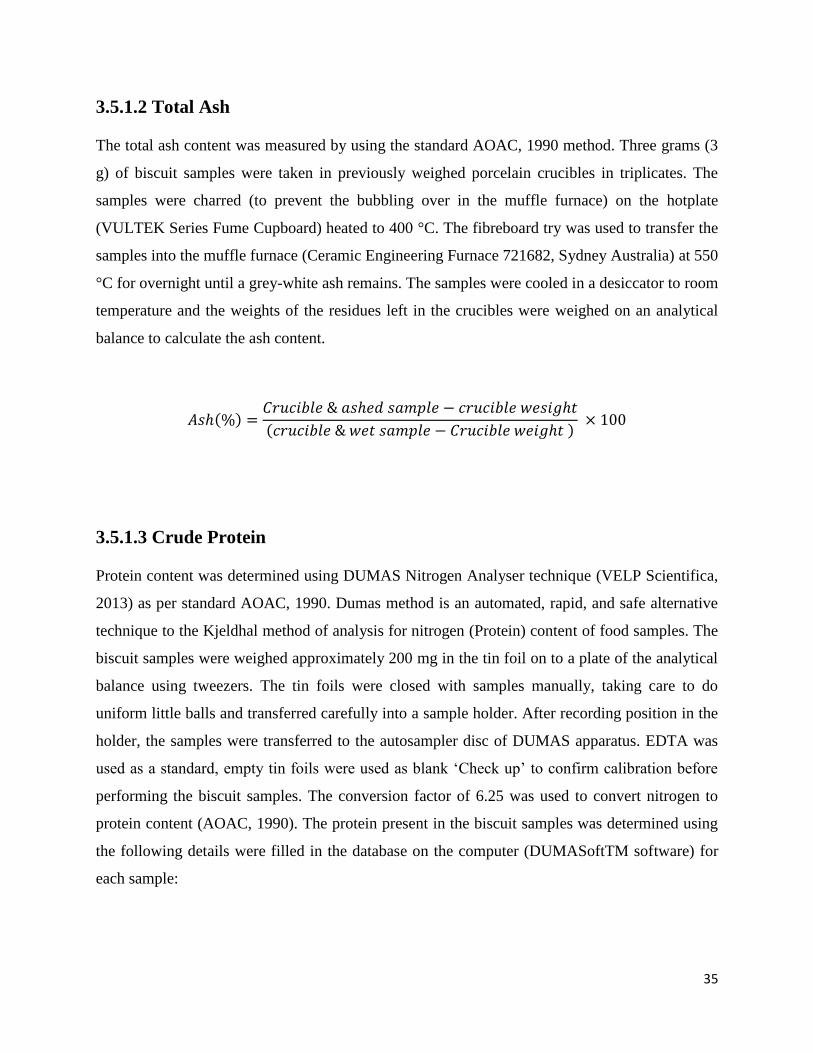
3.5.1.2 Total Ash
The total ash content was measured by using the standard AOAC, 1990 method. Three grams (3
g) of biscuit samples were taken in previously weighed porcelain crucibles in triplicates. The
samples were charred (to prevent the bubbling over in the muffle furnace) on the hotplate
(VULTEK Series Fume Cupboard) heated to 400 °C. The fibreboard try was used to transfer the
samples into the muffle furnace (Ceramic Engineering Furnace 721682, Sydney Australia) at 550
°C for overnight until a grey-white ash remains. The samples were cooled in a desiccator to room
temperature and the weights of the residues left in the crucibles were weighed on an analytical
balance to calculate the ash content.
𝐴𝑠ℎ(%) =𝐶𝑟𝑢𝑐𝑖𝑏𝑙𝑒 & 𝑎𝑠ℎ𝑒𝑑 𝑠𝑎𝑚𝑝𝑙𝑒 − 𝑐𝑟𝑢𝑐𝑖𝑏𝑙𝑒 𝑤𝑒𝑠𝑖𝑔ℎ𝑡
(𝑐𝑟𝑢𝑐𝑖𝑏𝑙𝑒 & 𝑤𝑒𝑡 𝑠𝑎𝑚𝑝𝑙𝑒 − 𝐶𝑟𝑢𝑐𝑖𝑏𝑙𝑒 𝑤𝑒𝑖𝑔ℎ𝑡 ) × 100
3.5.1.3 Crude Protein
Protein content was determined using DUMAS Nitrogen Analyser technique (VELP Scientifica,
2013) as per standard AOAC, 1990. Dumas method is an automated, rapid, and safe alternative
technique to the Kjeldhal method of analysis for nitrogen (Protein) content of food samples. The
biscuit samples were weighed approximately 200 mg in the tin foil on to a plate of the analytical
balance using tweezers. The tin foils were closed with samples manually, taking care to do
uniform little balls and transferred carefully into a sample holder. After recording position in the
holder, the samples were transferred to the autosampler disc of DUMAS apparatus. EDTA was
used as a standard, empty tin foils were used as blank ‘Check up’ to confirm calibration before
performing the biscuit samples. The conversion factor of 6.25 was used to convert nitrogen to
protein content (AOAC, 1990). The protein present in the biscuit samples was determined using
the following details were filled in the database on the computer (DUMASoftTM software) for
each sample:
36
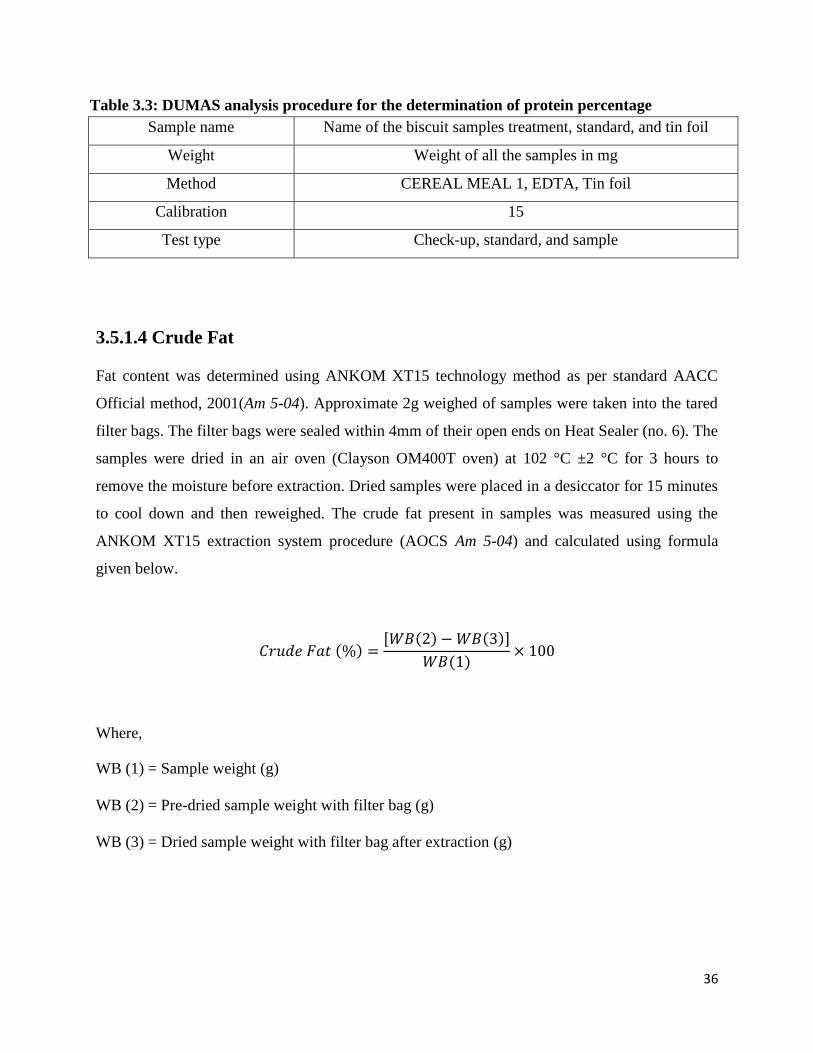
Table 3.3: DUMAS analysis procedure for the determination of protein percentage
Sample name Name of the biscuit samples treatment, standard, and tin foil
Weight Weight of all the samples in mg
Method CEREAL MEAL 1, EDTA, Tin foil
Calibration 15
Test type Check-up, standard, and sample
3.5.1.4 Crude Fat
Fat content was determined using ANKOM XT15 technology method as per standard AACC
Official method, 2001(Am 5-04). Approximate 2g weighed of samples were taken into the tared
filter bags. The filter bags were sealed within 4mm of their open ends on Heat Sealer (no. 6). The
samples were dried in an air oven (Clayson OM400T oven) at 102 °C ±2 °C for 3 hours to
remove the moisture before extraction. Dried samples were placed in a desiccator for 15 minutes
to cool down and then reweighed. The crude fat present in samples was measured using the
ANKOM XT15 extraction system procedure (AOCS Am 5-04) and calculated using formula
given below.
𝐶𝑟𝑢𝑑𝑒 𝐹𝑎𝑡 (%) =[𝑊𝐵(2) − 𝑊𝐵(3)]
𝑊𝐵(1)× 100
Where,
WB (1) = Sample weight (g)
WB (2) = Pre-dried sample weight with filter bag (g)
WB (3) = Dried sample weight with filter bag after extraction (g)

37
3.5.1.5 Crude Fibre
Due to time and resources limitations, the fibre content of the biscuit samples was calculated using
the specification provided by suppliers. The crude fibre content of the biscuit samples was
calculated according to the amount of flour and plants powder used in the preparation of biscuit
samples since the storage conditions have no significant effect on crude fibre content.
3.5.1.6 Carbohydrates content
For calculating the total carbohydrate content, the following equation was used which is
described in AOAC, 2000.
% Carbohydrates = 100 – (CP + EF + CF + Total Ash) %
Where,
CP = Protein (g)
EF = Fat (g)
CF = Fibre (g)
3.5.1.7 Energy
Following equation (fractional method) was used to calculate the energy content of the biscuits:
Energy (Kcal) = [(4 Protein) + (9 Fat) + (4 Carbohydrates)]

38
3.5.2 Physical analysis of biscuits
3.5.2.1 Diameter and thickness determination
The weight of the baked biscuits was measured by weighing on an analytical weighing balance
(Mettler Toledo Xs 10002s Xs-s Precision Balance). The diameter and thickness of the biscuit
samples were determined by using Vernier Calliper (Mitutoya Vernier Caliper, Metric). The
diameter of the biscuits was measured by placing six biscuits edge-to-edge horizontally and
rotating at a ninety-degree angle for triplicate readings and the average was calculated (Chauhan
et al., 2016b). The biscuit samples thickness was determined by placing six well-formed biscuits
on the top of each other, followed by triplicate readings recorded by shuffling biscuit samples
(Gomez et al., 1997). The diameter and thickness measurement was done in triplicates.
3.5.2.2 Spread ratio (SF) determination
The spread ratio of the biscuits was determined by using the following formula: (Zoulias et al.,
2000)
SF = (D/TCF)10
D= Diameter of biscuits
T= Thickness of biscuits
CF = 1.0 (standard correction factor at atmospheric pressure) (AACC, 2000).

39
3.5.2.3 Bake loss
The bake loss of the biscuit samples was determined by weighing six biscuits before baking and
after baking. The weight difference was regarded as percent bake loss (Gupta and Singh, 2005)
3.5.2.4 Color analysis
Colour analyses of biscuit samples were measured with Minolta Chroma Meter (Konica Minolta
CR-410 Chroma Meter) on the basis of the value of L*, a*, b* color parameters. L* values
measure black to white (range between 0-100), a* values measure redness of the product and b*
values measure yellowness of the sample. The colorimeter was calibrated with the white
standard. The color was analyzed using the following equation (∆E).
∆E = (L0 - L)2 + (a0 - a)2 + (b0 - b)2
Where,
L0 = Standard reading of L* value
a0 = Standard reading of a* value
b0 = Standard reading of b* value
L = Instantaneous reading of L* value after applying the experiment
a = Instantaneous reading of a* value after applying the experiment
b = Instantaneous reading of b* value after applying the experiment

40
3.6 Antioxidant activities and their correlation with antioxidant contents of
high protein biscuits
3.6.1 Preparation of hot water extracts for chemical analysis
Hot water extraction of samples was done followed by the method of (Benchikh & Louailèche,
2014). Five grams (5 g) of the powered plants’ materials and biscuit samples (50 g) were added
to 40 mL and 400 mL of ultra-pure water respectively. The samples were subjected to hot water
extraction using autoclave method for 1 hour at 121 °C and then cooled to room temperature. The
extracts were then subjected to centrifugation at 10,000rpm for 30 min. The supernatant was
separated by filtration and then made up to 50 mL by adding ultrapure water in a standard
volumetric flask. The solutions were transferred into pre-weighed 100mL beakers and then
freeze-dried (CHIRST ALPHA 1-4 LDplus). After freeze-drying the samples, the solid extracts
were weighed on an analytical balance (to get the dry mass of extracts. Then the dry extracts
were stored at -20 °C until further analysis. The entire process of hot water extraction is
illustrated in Figure 3.2.

41
Fig 3.2: Flowchart of Hot water extraction of plants and biscuit samples
Powdered plant material / biscuit samples
Hot water extraction
• Autoclaving 121 °C for 1h
• Centrifugation at 10000 rpm (30 minutes)
• Filtration
Marc Supernatant
Freeze drying
Dry Extracts are stored at -20 °C until
further analysis

42
3.6.2 Isolation of ethanol soluble small molecules from hot water extracts
Isolation of Ethanol soluble small molecules from hot water extracts was done by using the
method (Benchikh et al., 2018). 1.5 grams of hot water extracts of each biscuit samples were
subjected to ethanol precipitation in 1:4 v/v ratio (Deionized Water: Ethanol = 20 mL water and
80 mL ethanol) and left them overnight at 4.0 °C to isolate ethanol solubles of extracts. The
extracts were centrifuged for 30 minutes at 10000 rpm in a centrifuge at room temperature. The
supernatant containing ethanol solubles were separated by filtration. Ethanol was evaporated by
using Rotavapor (BUCHI Rotavapor R-II Rotary Evaporator, Switzerland). The samples were
then freeze-dried to remove water (CHIRST ALPHA 1-4 LDplus) and keep in a refrigerator at -
20 °C for further analysis. The entire procedure to isolate ethanol soluble small molecules is
presented in Fig. 3.3.

43
Fig 3.3: Flowchart for the isolation of ethanol solubles from hot water extracts of biscuit
samples
Hot water extracts of biscuit samples
Treatment with Ethanol
(Extracts in ultra-pure water: EtOH) = 1:4 v/v at 4 °C for 24h
Supernatant
Precipitate
(Polysaccharides &
proteins)
Freeze drying
Small organic molecules (contains phenolic and
flavonoids)
Sored at -20 °C until further analysis
• Centrifuge (10000 rpm, 30 minutes)
• Filtration
Rotary evaporation to remove EtOH

44
3.6.3 Antioxidant activity determination
The antioxidant activity potential of plants powder and biscuit samples was assessed by
measuring the abilities of the samples to scavenge ABTS•+ radical.
3.6.1 Measurement of radical scavenging activities against ABTS•+
Antioxidant capacities of the samples were measured using ABTS•+ assay (Ozgen et al., 2006;
Ma et al., 2018). In this method, ABTS●+ radicals were produced by the addition of 33.11 mg of
K2S2O8 to 192.04mg of ABTS in 50 ml distilled water and the solution was left in dark for 15
hours (Alam et al., 2013) at room temperature. The absorbance of the generated ABTS●+ radicals
was adjusted to 0.70± 0.02 to 0.75± 0.02 by addition with PBS buffer. Suitable concentrations of
plant extracts, biscuit extracts, and ethanol solubles were prepared in PBS buffer and serially
diluted for concentration-dependent study. Vitamin C was used to build the standard curve by
taking various concentrations (1000 µM, 400 µM, 200 µM, 100 µM, 80 µM, 60 µM, 40 µM, 20
µM). Briefly, the assay procedure involves, 100µl of the sample was taken in a test tube. 1 mL of
ABTS●+ radical solution was added. The samples were then incubated for 0.5 h by covering with
an aluminium foil. Absorbance values were then measured at 734 nm (Multiskan 141 EX,
Thermo Electron, USA). Triplicate measurements were made.
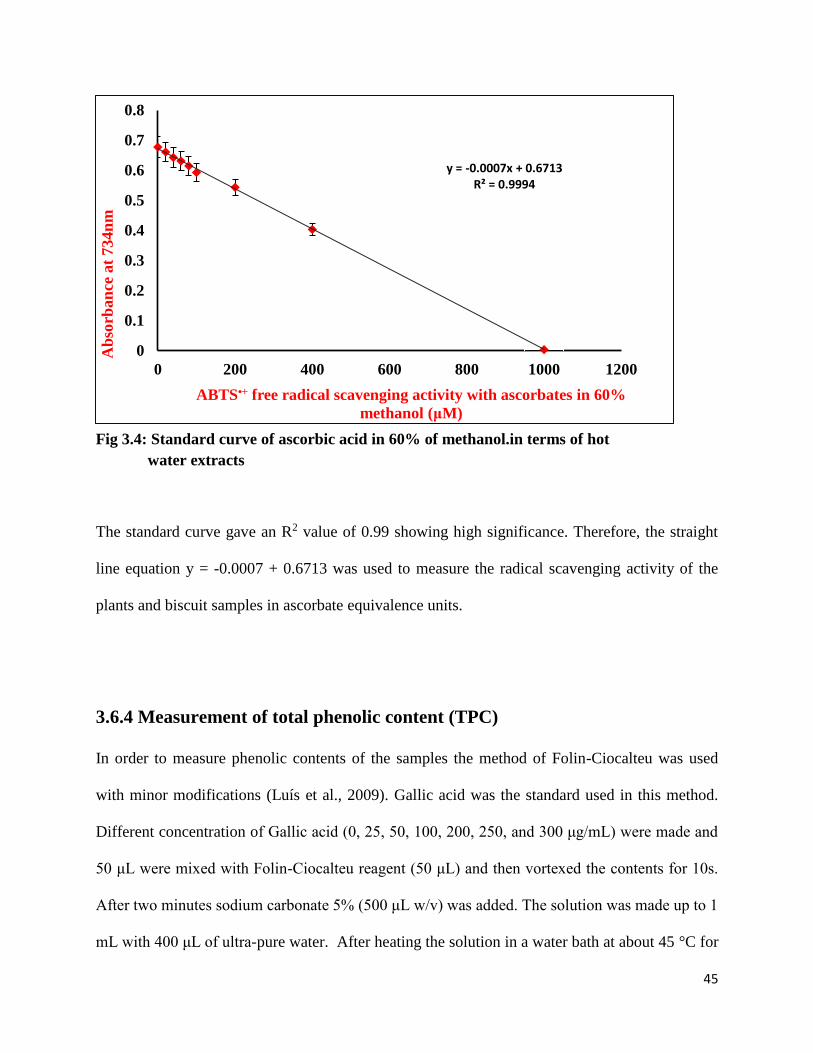
45
Fig 3.4: Standard curve of ascorbic acid in 60% of methanol.in terms of hot
water extracts
The standard curve gave an R2 value of 0.99 showing high significance. Therefore, the straight
line equation y = -0.0007 + 0.6713 was used to measure the radical scavenging activity of the
plants and biscuit samples in ascorbate equivalence units.
3.6.4 Measurement of total phenolic content (TPC)
In order to measure phenolic contents of the samples the method of Folin-Ciocalteu was used
with minor modifications (Luís et al., 2009). Gallic acid was the standard used in this method.
Different concentration of Gallic acid (0, 25, 50, 100, 200, 250, and 300 μg/mL) were made and
50 μL were mixed with Folin-Ciocalteu reagent (50 μL) and then vortexed the contents for 10s.
After two minutes sodium carbonate 5% (500 μL w/v) was added. The solution was made up to 1
mL with 400 μL of ultra-pure water. After heating the solution in a water bath at about 45 °C for
y = -0.0007x + 0.6713R² = 0.9994
0
0.1
0.2
0.3
0.4
0.5
0.6
0.7
0.8
0 200 400 600 800 1000 1200
Ab
sorb
an
ce a
t 734n
m
ABTS•+ free radical scavenging activity with ascorbates in 60%
methanol (μM)

46
half an hour. Then quenched in an ice bath. Absorbance values were determined at 760 nm (Cai
et al., 2004) in a UV spectrophotometer (GENESYS 10S UV-VIS Spectrophotometer). A Gallic
acid standard curve was built (shown in Fig 3.5) using different concentrations (0-300 μg/mL).
The regression of standard curve gave a linear equation (y = 0.002x-0.0108 with R2 = 0.9987).
Each sample was analyzed in triplicates.
Fig 3.5: Standard calibration curve of Gallic acid.
The straight line equation for the standard curve gave an R2 value of 0.99 showing high
significance. The straight line equation (y = 0.0022x – 0.0153) was used to calculate the phenolic
contents of plants and biscuit extracts. The total phenolic contents were estimated as gallic acid
equivalent (GAE). The results were expressed as milligrams (mg) of GAE per 1g of the dry
weight of extracts (mg GAE/gdw). Each sample was analyzed in triplicates.
y = 0.0022x - 0.0153
R² = 0.9941
-0.1
0
0.1
0.2
0.3
0.4
0.5
0.6
0.7
0 50 100 150 200 250 300 350
Ab
sorb
an
ce
Gallic acid concentrations μg/mL

47
3.6.5 Measurement of flavonoid content (TFC)
Total flavonoid content was measured using the aluminium colorimetric method (Khodaie et al.,
2012; Zhishen et al., 1999). Quercetin was used as a standard. Different concentrations of
Quercetin (0, 200, 400, 600, 800, 1000, 1200 μg/mL) were made. The samples extract 0.5 ml
was diluted with methanol (80%) were added to 300 μL of NaNO2 and vortexed contents for 10s
and then left at 25 °C for 2 minutes. Then add 300 μL AlCl3 (1:10 w/v) left the contents at 25 °C
for 6 minutes. Add 2 mL of 1M NaOH to the reaction mixture and immediately added to 1.9 mL
of distilled water. Absorbance values were determined at 510 nm (GENESYS 10S UV-VIS
Spectrophotometer). A standard calibration curve was built for various concentrations of
quercetin (0-1200 μg/mL) (Honmore et al., 2016). The regression of the standard curve gave a
linear equation (y = 0.0008x-0.0115, R2 = 0.9988) shown in Figure 3.6. Each sample was
examined in triplicates.
Fig 3.6: Standard curve of Quercetin.
y = 0.0005x - 0.0023
R² = 0.9942
-0.1
0
0.1
0.2
0.3
0.4
0.5
0.6
0.7
0.8
0 200 400 600 800 1000 1200 1400
Ab
sorb
an
ce
Quercetin concentractions (μg/mL)
48
As the correlation coefficient value (R2 = 0.9942) was highly significant, the straight line
equation (y = 0.0005x – 0.0023) was used to determine flavonoid contents of plants and biscuit
extracts. The total flavonoid contents of the plant and biscuit extracts were determined as the
quercetin equivalent (QE). The results were expressed as milligrams (mg) QE per 1g of dry plant
and biscuit extracts weight (mg QE/gdw). Each sample was examined in triplicates.
3.7 Statistical Analysis
All statistical analysis was performed using the SPSS version 22.0. The data collected from
physicochemical and nutritional composition tested statistically by using a One-way Analysis of
Variance ANOVA to determine the significant difference (p< 0.05). The mean difference among
groups was compared using Turkey’s HSD test at 95% confidence level. The results were
expressed as mean± standard deviation (SD).

CHAPTER 4
RESULTS
&
DISCUSSION

50
Chapter 4
Results and Discussion
4.1 Proximate and physical analysis of antioxidant rich and high protein
biscuits
4.1.1 Proximate analysis
The results of the proximate analysis of biscuit samples are displayed in Table 4.1. Results
showed that there was a significant variance (p 0.05) in the moisture, ash, protein, fibre,
carbohydrates, and energy samples.
4.1.1.1 Moisture content
The moisture content of the biscuit samples was ranged from 4.56 to 4.89% wwb. Moisture plays
a crucial role in terms of quality parameters, acceptability, and shelf-life of fat and sugar based
baked products (Adebayo-Oyetoro et al., 2015; Ergun et al., 2010). The incorporation of under-
utilized plants powder into biscuits preparation had also shown the effect of increasing the
moisture content. The difference in moisture content between samples might be due to the
difference in moisture holding capacity of different ingredients (Abu-Salem & Abou-Arab, 2011;
Rathnayake & Navaratne, 2017). The Table 4.1 depicts that there was a significant difference in
moisture content (p< 0.02) between control and treatments made with 1%, 2%, 3%, 4% of plants
parts based powder. Figure 4.1 shows that control sample contains 4.79% of moisture on wet wet
basis (wwb) while all the samples incorporated with under-utilized plants’ material, except
sample-4, contains lower moisture contents (ranges between 4.5 to 4.6%) on wet wet basis
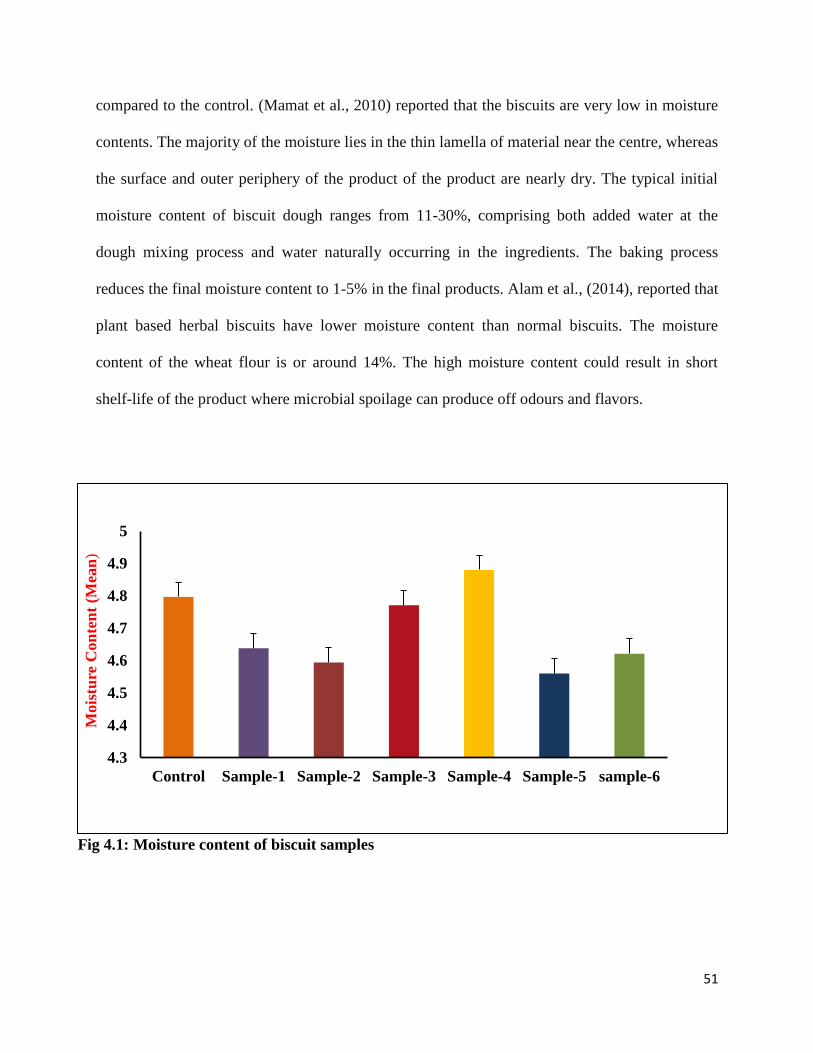
51
compared to the control. (Mamat et al., 2010) reported that the biscuits are very low in moisture
contents. The majority of the moisture lies in the thin lamella of material near the centre, whereas
the surface and outer periphery of the product of the product are nearly dry. The typical initial
moisture content of biscuit dough ranges from 11-30%, comprising both added water at the
dough mixing process and water naturally occurring in the ingredients. The baking process
reduces the final moisture content to 1-5% in the final products. Alam et al., (2014), reported that
plant based herbal biscuits have lower moisture content than normal biscuits. The moisture
content of the wheat flour is or around 14%. The high moisture content could result in short
shelf-life of the product where microbial spoilage can produce off odours and flavors.
Fig 4.1: Moisture content of biscuit samples
4.3
4.4
4.5
4.6
4.7
4.8
4.9
5
Control Sample-1 Sample-2 Sample-3 Sample-4 Sample-5 sample-6
Mo
istu
re C
on
ten
t (M
ean
)

52
En
ergy
(Kca
l/
100g
)
457.3
± 0
.60
456.0
± 2
.1
452.1
± 0
.40
449.3
± 1
.33
445.0
± 0
.30
456.1
± 2
.65
456.7
± 1
.89
Tab
le 4
.1:
Pro
xim
ate
co
mp
osi
tion
s an
d e
ner
gy v
alu
es o
f b
iscu
it s
am
ple
s
Carb
oh
yd
rate
s
(%)
66.7
± 0
.12
64.1
± 0
.43
63.5
± 0
.08
62.9
± 0
.40
62.1
± 0
.22
64.9
± 0
.54
64.8
± 0
.38
Fib
re
(%)
2.5
± 0
.01
3.1
± 0
.03
3.7
± 0
.00
4
4.2
± 0
.02
4.9
± 0
.01
2.7
± 0
.00
4
2.6
± 0
.00
3
Fa
t
(%)
15.1
8±
0.1
0
15.5
8±
0.4
5
15.3
7±
0.0
6
15.3
9±
0.2
3
15.1
3±
0.0
9
15.2
5±
0.5
0
15.3
2±
0.3
9
Pro
tein
(%)
13.4
1±
0.0
2
14.8
3±
0.0
5
14.8
6±
0.1
2
14.9
7±
0.1
4
15.0
± 0
.08
14.7
± 0
.07
14.8
± 0
.08
Ash
(%)
2.1
2±
0.0
3
2.3
0±
0.0
5
2.4
5±
0.0
3
2.5
7±
0.0
1
2.7
1±
0.0
3
2.2
5±
0.0
3
2.2
7±
0.0
2
Mo
istu
re
(%)
4.7
9±
0.0
5
4.6
3±
0.0
5
4.5
9±
0.1
1
4.7
7±
0.0
6
4.8
9±
0.1
1
4.5
6±
0.0
7
4.6
2±
0.0
8
Tre
atm
ents
per
10
0g
Contr
ol
Sam
ple
-1
S
ample
-2
S
ample
-3
S
ample
-4
S
ample
-5
Sam
ple
-6
Note
: D
ata
rep
rese
nte
d a
re m
ean
± S
D (
n =
3).
Each
para
met
er v
alu
es f
or
dif
fere
nt
trea
tmen
ts p
rese
nte
d o
n t
he
sam
e co
lum
n i
n t
he
table
dis
pla
y are
sta
tist
icall
y si
gn
ific
an
tly
dif
fere
nt
(p
0.0
5).
Th
e in
corp
ora
tion
of
pla
nts
mate
rials
is
at
dif
fere
nt
pro
port
ion
s are
;
con
trol,
sam
ple
-1 (
1%
), s
am
ple
-2 (
2%
), s
am
ple
-3 (
3%
), s
am
ple
-4 (
4%
), s
am
ple
-5 (
1%
), s
am
ple
-6 (
1%
).

53
4.1.1.2 Ash content
The ash content of biscuit samples increased with the increasing under-utilized plants material
substitution levels (Fig 4.2). There were significant differences (p< 0.05) in ash contents between
the control and under-utilized plants parts’ based biscuit samples at each substitution levels up to
4%. Table 4.1 depicts that ash content of biscuits ranged from 2.1 to 2.7%. The ash content
represents the mineral content of the food samples (Agrahar-Murugkar et al., 2015; Mishra et al.,
2015). Minerals are essential nutrients in diet which helps in important metabolic functions of
the body and are parts of a molecule which serve as a normal metabolism of the other compound,
include haemoglobin, adenosine triphosphate (ATP), DNA (deoxyribonucleic acid) (Essuman et
al., 2016; Ibidapo et al., 2017). The ash content is the proportion of inorganic residue after
removed water and organic materials, such as moisture, protein, fat, and carbohydrates by
incineration in the presence of oxidizing agents (Adeyeye, 2016). Ikuomola et al., (2017)
reported that milling and soaking could result in lower minerals contents. The results suggest that
biscuits prepared with under-utilized plants will provide more minerals to the consumers than the
standard biscuits. Alam et al., (2014) observed similar findings that herbal biscuits produced
from plant materials had higher ash contents (2.1 to 2.4%).

54
Fig 4.2: Ash content of biscuit samples
4.1.1.3 Protein content
The protein contents of the biscuit samples were ranged from 13.41 to 15%. The sample-4 with
4% plants based materials had the highest protein content (15.0%) while the control sample had
the lowest protein content (13.41%). Addition of plants materials shows a significant (p 0.05)
increase in the protein content among all the biscuit samples. The protein content of biscuits
slightly increased in every level of plant materials substitution (14.83, 14.86, 14.97, 15.0, 14.7,
14.8 with p< 0.001) shown in Table 4.1. This increase was expected because the under-utilized
plants’ parts contain a significant quantity of protein. Karki et al., (2016) found a similar trend in
the protein content of biscuits and cake made with supplementation of sorghum wheat flour.
Alam et al., (2014) reported an increase in the protein content with a corresponding increase in
the proportion of plant material supplementation in biscuits produced from refined wheat flour.
0
0.5
1
1.5
2
2.5
3
Control Sample-1 Sample-2 Sample-3 Sample-4 Sample-5 sample-6
Ash
Con
ten
t (M
ean
)

55
Fig 4.3: Protein content of biscuit samples
4.1.1.4 Crude Fat Content
The fat content of the biscuit samples ranged from 15.18 to 15.37 %. Biscuit sample-4 had the
highest fat content (15.58%) while the reference control sample had the least value (15.13%).
The results of the fat content showed that there was no significant difference (p 0.05) between
biscuit samples. Fat is an important factor the more fat content indicates the high calorific value
and also serves as a lubricating agent that helps in improving the texture, rheology, and overall
quality of the product. Omeire & Ohambele (2010) reported that fat is a rich source of energy
and is essential as carriers of fat-soluble vitamins, such as vitamin A, D, E, and K. Despite fat
content in food products should not be 25% because this could lead to oxidative rancidity as
well as development of unpleasant and odorous compounds in product (Ikuomola et al., 2017;
12.5
13
13.5
14
14.5
15
15.5
Control Sample-1 Sample-2 Sample-3 Sample-4 Sample-5 sample-6
Pro
tein
Con
ten
t (M
ean
)

56
Okpala et al., 2013). However, the presence of low-fat content (unsaturated fatty acid) is
beneficial to ensure the longer shelf-life for food products (Okpala & Okoli, 2014).
Fig 4.4: Fat content of biscuit samples
4.1.1.5 Crude Fibre
The total dietary fibre content of biscuit samples ranged from 2.50 to 4.95%. The results showed
the significant difference (p 0.05) between the control and plant based biscuit samples made
with the incorporation of 1%, 2%, 3%, and 4% under-utilized plants. The highest proportion of
plants materials substitution samples contain the highest dietary fibre (4.95, 4.23, 3.7, 3.1, 2.7,
and 2.6 respectively) shown in Table 4.1. The increasing dietary fibre content trend indicates that
the use of plants materials had significant effects by increasing the dietary fibre of different
proportion of all the biscuit samples. The findings agree with the observations of (Alam et al.,
14.8
14.9
15
15.1
15.2
15.3
15.4
15.5
15.6
Control Sample-1 Sample-2 Sample-3 Sample-4 Sample-5 sample-6
Fat
Con
ten
t (M
ean
)
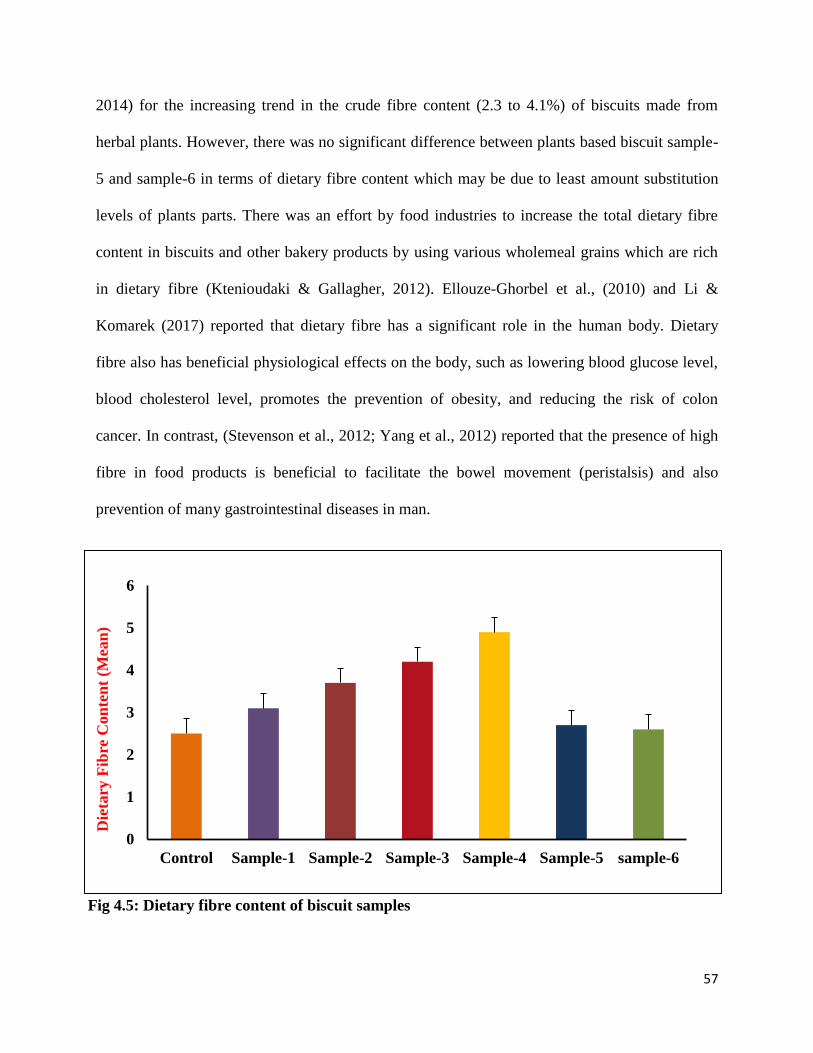
57
2014) for the increasing trend in the crude fibre content (2.3 to 4.1%) of biscuits made from
herbal plants. However, there was no significant difference between plants based biscuit sample-
5 and sample-6 in terms of dietary fibre content which may be due to least amount substitution
levels of plants parts. There was an effort by food industries to increase the total dietary fibre
content in biscuits and other bakery products by using various wholemeal grains which are rich
in dietary fibre (Ktenioudaki & Gallagher, 2012). Ellouze-Ghorbel et al., (2010) and Li &
Komarek (2017) reported that dietary fibre has a significant role in the human body. Dietary
fibre also has beneficial physiological effects on the body, such as lowering blood glucose level,
blood cholesterol level, promotes the prevention of obesity, and reducing the risk of colon
cancer. In contrast, (Stevenson et al., 2012; Yang et al., 2012) reported that the presence of high
fibre in food products is beneficial to facilitate the bowel movement (peristalsis) and also
prevention of many gastrointestinal diseases in man.
Fig 4.5: Dietary fibre content of biscuit samples
0
1
2
3
4
5
6
Control Sample-1 Sample-2 Sample-3 Sample-4 Sample-5 sample-6
Die
tary
Fib
re C
on
ten
t (M
ean
)

58
4.1.1.6 Carbohydrates Content
Carbohydrate content of biscuits ranged between 62.1 to 66.7%. Biscuit sample-4 had the lowest
carbohydrate content (62.1%) while the reference control sample had the highest content
(66.7%). The increase in the proportion of plants materials brought a decrease in the
carbohydrate content of the biscuits. There was a significant difference in the carbohydrate
content in all the biscuit samples. Similarly, Alam et al., (2014) have found a decreasing trend in
the carbohydrate contents (56.6 to 54.6%) of biscuit samples made from plants parts.
Carbohydrates are macromolecules (Sugar, starch, and cellulose) that provide a good source of
energy value (Thongram et al., 2016). In contrast, Ganorkar (2014) and Stevenson et al., (2012)
states that low carbohydrate and high fibre content of food products have protective health
effects, such as relief from constipation and also aids digestion in the colon.
Fig 4.6: Carbohydrate content of biscuit samples
59
60
61
62
63
64
65
66
67
68
Control Sample-1 Sample-2 Sample-3 Sample-4 Sample-5 sample-6
Carb
oh
yd
rate
s C
on
ten
t (M
ean
)

59
4.1.1.7 Energy
The energy values of the biscuits are shown in Figure 4.7. The energy value of all the samples
ranged from 445 to 457.3 Kcal/100g. Biscuit sample-4 had the lowest energy value (445
kcal/100g), whereas the control sample had a higher energy value (457.39 Kcal/100g). The
energy values of biscuits were shows a significant difference (p 0.05) from the control to
sample-6 respectively. Similarly, a decreasing trend in the energy value (458 to 449 Kcal/100g)
for biscuits made from different flour blends was reported by (Norhayati et al., 2015). In
addition, the protein, fat, carbohydrates constituents all contributed to providing energy. Biscuits
are energy giving food products that are consumed as a snack by all age groups in-between
meals. The incorporation of plant materials could help to boost the level of protein, antioxidant
and fibre content of biscuits (Alam et al., 2014; Ikuomola et al., 2017).
Fig 4.7: Energy Values of biscuit samples.
435
440
445
450
455
460
465
Control Sample-1 Sample-2 Sample-3 Sample-4 Sample-5 sample-6
En
ergy C
on
ten
t (M
ean
)
60
4.1.2 Physical Analysis of Biscuits
Six formulations of biscuits were prepared with the incorporation of under-utilized plant
materials respectively and the results of the physical properties of all biscuit samples are
presented in Table 4.2. The mean score of weight, diameter, thickness, and spread ratio and bake
loss of the biscuits were significantly different (p< 0.05) in terms of all the samples from each
other. The parameters have been used to determine the quality of flour as well as product (Gul et
al., 2014; Mir et al., 2014a; Mir et al., 2014b; Singh et al., 2011).

61
Fig 4.8 Control and Underutilized plants materials incorporated biscuits

62
Table 4.2: Physical analysis of biscuit samples
Treatments Weight
(g)
Diameter
(mm)
Thickness
(mm)
Spread
ratio
Bake loss
(g/100g)
Control 16.28± 0.25 51.33± 0.50 6.54± 0.26 7.83± 0.32 21.00± 0.87
Sample-1 17.19± 0.19 51.39± 0.35 6.50± 0.25 7.99± 0.16 19.82± 0.69
Sample-2 19.70± 0.54 51.48± 0.30 6.37± 0.23 8.12± 0.28 18.45± 0.68
Sample-3 20.45± 0.30 51.78± 0.43 6.26± 0.27 8.24± 0.32 16.47± 0.62
Sample-4 20.81± 0.51 52.23± 0.47 6.15±0.23 8.53± 0.22 15.19± 0.45
Sample-5 17.53± 0.30 51.35± 0.57 6.10± 0.24 8.04± 0.34 18.88± 0.42
Sample-6 18.22± 0.40 51.46± 0.26 6.05± 0.19 8.08± 0.27 19.41± 0.69
Note: Sample-1 (1%), sample-2 (2%), sample-3 (3%), sample-4 (4%), sample-5 (1%), sample-6
(1%) of underutilized plants materials
All the values for different samples; different parameters in the same column presented in the
table display are significantly different (p< 0.05) from one another; values are represented in
means± SD (Standard deviations) of three determinations (n = 6)
4.1.2.1 Biscuits Weight
According to Table 4.2, the weight of the biscuits ranged from 16.2, 17.1, 19.7, 20.4, 20.8, 17.5,
and 18.2 g respectively. It is evident from results, the addition of plants materials caused a
significant difference (p< 0.05) in the weight between control and under-utilized plants
incorporated biscuit samples. Control Sample had a minimum weight which may be due to high
water holding capacity (WHC) rather than other biscuit samples as they have more protein
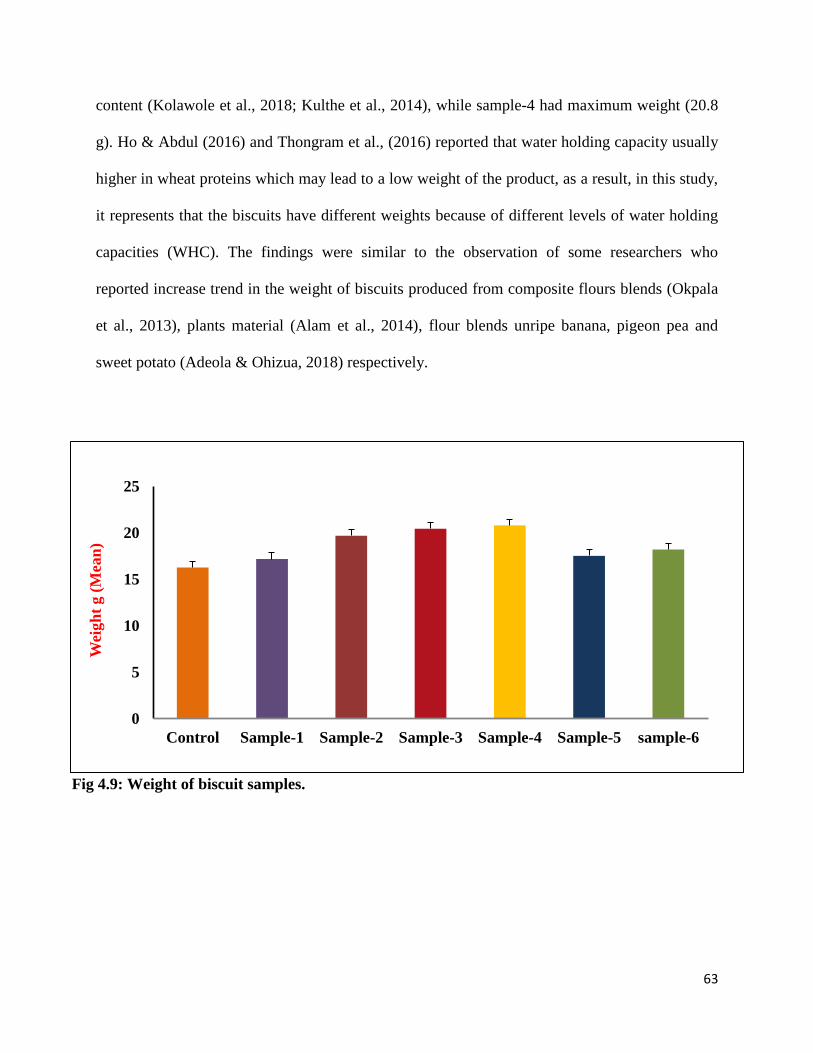
63
content (Kolawole et al., 2018; Kulthe et al., 2014), while sample-4 had maximum weight (20.8
g). Ho & Abdul (2016) and Thongram et al., (2016) reported that water holding capacity usually
higher in wheat proteins which may lead to a low weight of the product, as a result, in this study,
it represents that the biscuits have different weights because of different levels of water holding
capacities (WHC). The findings were similar to the observation of some researchers who
reported increase trend in the weight of biscuits produced from composite flours blends (Okpala
et al., 2013), plants material (Alam et al., 2014), flour blends unripe banana, pigeon pea and
sweet potato (Adeola & Ohizua, 2018) respectively.
Fig 4.9: Weight of biscuit samples.
0
5
10
15
20
25
Control Sample-1 Sample-2 Sample-3 Sample-4 Sample-5 sample-6
Wei
gh
t g (
Mea
n)

64
4.1.2.2 Diameter
The results from Table 4.2 showed that the diameter of biscuits ranged from 51.1 to 52.2 mm
(Table 4.2). As noticed from reference data the diameter of the biscuits showed an increasing
trend with the increase of plants materials substitution level in biscuits. According to Chauhan et
al., (2016), protein content and diameter have an inverse correlation. During the heating process,
protein gluten present in flour undergoes glass transition, therefore gaining mobility that allows it
to interrelate and form a web, thus increasing viscosity and stop the flow of dough. In contrast,
(Ballabio et al., 2011; Ibidapo et al., 2017) reported that dough with lower viscosity causes the
baked product to spread at a faster rate thereby increases the spread ratio. The results of the
diameter of biscuit samples showed that all the samples were different significantly (p< 0.05)
from each other. The sample-4 (52.2 mm) had the maximum diameter and minimum in the
control sample (51.3 mm). The findings agreed with the observation of Giwa & Ikujenlola
(2010) and Ikuomola et al., (2017), who reported an increase in diameter of biscuits with
increasing substation level of quality protein maize (QPM) flour and malted barley bran (MBB)
blends. However, these results were in contrary to the findings on biscuits produced from
soybean supplemented wheat flour (Ayo et al., 2007), cowpea-wheat (Okaka & Isieh, 1990), and
millet-sesame flour (Alobo, 2001) respectively.

65
Fig 4.10: Diameter values of biscuits
4.1.2.3 Thickness
The thickness of the biscuits ranged between 6.05 to 6.60 mm (Table 4.2). The results of the
thickness showed that there was significant (p< 0.05) difference between control and under-
utilized plants parts biscuit samples. The biscuit sample-2 had the highest height value (6.60
mm), whereas the sample-6 had the least thickness value (6.05 mm). Similar results have been
observed by Chauhan et al., (2016) produced from wheat and amaranth flour, wheat flour semi-
sweet biscuits (Mamat and Hill, 2014). However, the findings disagree with Abdul et al. (2015),
who reported increasing trend as the thickness of the samples produced from composite wheat
flour and oat bran blends, wheat flour and malted barley brans blends (Ikuomola et al., 2017).
Thongram et al., (2016) reported that the thickness of the biscuits may be affected due to
different baking properties, such as lower temperature, the rise of temperature, and high
absorption of moisture of the dough (presence of water binding components).
50.8
51
51.2
51.4
51.6
51.8
52
52.2
52.4
52.6
Control Sample-1 Sample-2 Sample-3 Sample-4 Sample-5 sample-6
Dia
met
er m
m (
Mea
n)

66
Fig 4.11: Thickness values of biscuits
4.1.2.4 Spread Ratio
Biscuits spread rate stands for a ratio of diameter to thickness. Spread rate of biscuits ranged
from 7.83 to 8.53. It is affected by dough viscosity; lower viscosity of dough increases the spread
ratio at a faster rate (Miller & Hoseney, 1997). The addition of plants parts caused a significant
difference in the spread rate of the biscuits with increasing levels of incorporation from 1 to 4%.
From the results (Table 4.2) spread ratio of the biscuit samples revealed an increasing trend
along with increasing substitution levels of plants materials. Results showed that biscuit sample-
4 had the maximum spread rate value (8.53), while the control sample had the minimum (7.83).
A similar trend was observed by Chauhan et al., (2016), who stated that the spread ratio of
cookies samples increased with increasing incorporation levels of quality maize flour; wheat and
5.7
5.8
5.9
6
6.1
6.2
6.3
6.4
6.5
6.6
6.7
Control Sample-1 Sample-2 Sample-3 Sample-4 Sample-5 sample-6
Th
ick
nes
s m
m (
Mea
n)

67
amaranth flour blends (Chauhan et al., 2016); cassava and water chestnut flours (Bala et al.,
2015). According to Chugh et al., (2013) products with higher spread ratios are considered as
most desirable. However, findings of this study are inconsistent with the study of Abdul et al.
(2015), who observed decreasing tend in the spread ratios for cookies produced from oat bran;
legumes flour (Thongram et al., 2016). Moreover, the spread rate values for products produced
from unripe plantain and defatted sesame flour blends did not follow a particular trend (Chinma
& Gernah, 2007). In contrast, low spread factor of the products due to hydrophilic nature and of
the flour used in the production of the products which led to increase in thickness and decrease in
spread rate (Yahya, 2004).
Fig 4.12: Spread ratio values of biscuits
7.4
7.6
7.8
8
8.2
8.4
8.6
8.8
Control Sample-1 Sample-2 Sample-3 Sample-4 Sample-5 sample-6
Sp
read
Rati
o (
Mea
n)

68
4.1.2.5 Bake Loss
The bake loss of the biscuits ranged from 21.0, 19.82, 18.45, 16.47, 15.19, 18.88, and 19.41
g/100g respectively. The control sample had the highest value (21.0 g), whereas biscuit sample-4
had the lowest value (15.1 g). The bake loss values of biscuit samples significantly (p< 0.05)
decreased as the incorporation level of plants parts increased from 1 to 4%. The results from
Table 4.2 clearly represent decreasing similar tend as observed by Chauhan et al., (2016), for
cookies produced from wheat and amaranth flour blends. The decrease in bake loss can be due to
higher water holding capacity as well as high-protein content of the flour used in the production
of the products (Jerome et al., 2007; Singh et al., 2011)
Fig 4.13: Bake loss values of biscuits.
0
5
10
15
20
25
Control Sample-1 Sample-2 Sample-3 Sample-4 Sample-5 sample-6
Bak
e L
oss
(M
ean
)

69
4.1.2.6 Colour analysis of biscuits
Color is an essential element which makes a significant contribution to the initial as well as
overall acceptability of baked products by consumers. Despite Cauvain (2017) reported that
color development of the baked products usually occurs during the later stages of baking and it
can be helpful or used to judge completion of the baking process. L*, a*, and b* are the hunter
parameters which measured from the top and bottom surface of baked products. The results of
the physical color assessment of biscuits produced from under-utilized plants parts are presented
in Table 4.3. The mean score of color L* value, a* value, and b* value for the biscuit samples
were significantly (p< 0.05) different from each other. The control sample had the lowest score
for a* and b* attributes observed, except for L* value.
Table 4.3: Color analysis of formulated biscuits
Treatments L*-value a*-value
b*-value
Control 63.35± 0.99 6.49± 0.31 25.90± 1.66
Sample-1 63.14± 0.56 6.56± 0.34 26.34± 0.58
Sample-2 62.390± 1.35 7.10± 0.82 27.46± 0.99
Sampl-3 61.75± 2.34 7.58± 0.44 28.79± 0.56
Sampl-4 60.82± 0.72 7.77± 0.43 29.96± 0.64
Sample-5 59.56± 0.68 8.31± 0.16 30.12± 0.82
Sample-6 59.54± 0.44 8.55± 0.23 33.32± 1.34

70
Note: Sample-1 (1%), sample-2 (2%), sample-3 (3%), sample-4 (4%), sample-5 (1%), sample-6
(1%) of underutilized plants materials.
Color parameters values for different samples with different significant letters presented on the
same column in the table display are statistically significantly different (p 0.05); values are
represented in means± SD (Standard deviations) of three determinations (n = 3)
a* & b* value: +ve indicates red and –ve indicates green color
4.1.2.6.1 L* Value
L* value is a hunter parameter which is used to measure the lightness-darkness (L* = 0 indicates
black and L* = 100 yields a white fraction of the product. The results from Table 4.3 indicates
that the L* value of the biscuit samples showed a decreasing trend along with the increasing
substitution level of under-utilized plants materials. The control sample had the highest lightness
(L*) value for the top along with the bottom surface of the biscuit samples. The data showed that
there was a significant difference (p< 0.05) between one another samples. The findings agree
with the study observed by Mamat et al., (2010) produced semi-sweet biscuits from wheat flour;
wheat and amaranth flour blends (Chauhan et al., 2016). Gallagher et al., (2003) reported that
high protein content of the product has a reverse correlation with the lightness of biscuits (L-
value), represents that an increased protein content in biscuits formulation decreased the L*
value). Moreover, the decrease in L* value reveals that the under-utilized plants’ incorporated
biscuits are darker in color at higher levels of substitution are shown in Fig 4.14.

71
Fig 4.14: L* value of biscuits
4.1.2.6.2 a* Value
a* value in color measurements depicts an indication of the redness of the product if positive and
negative indicates green. From Table 4.3 results displayed an increasing trend in a* value of
biscuit samples along with the increased substitution level of under-utilized plants materials in
biscuits preparation. The top surface results revealed that sample-6 had the highest a* value,
whereas control sample had least. All the biscuit samples were significantly different (p< 0.05)
from one another. The results showed the similar an increasing trend with the findings observed
by Mamat et al., (2010) produced fat-reduced tea biscuits from wheat flour; wheat and amaranth
flour blends (Chauhan et al., 2016). Moreover, an increasing pattern of a* value was found for
both the top and the bottom surface of biscuit samples that were dark in color (L* value) shown
57
58
59
60
61
62
63
64
65
Control Sample-1 Sample-2 Sample-3 Sample-4 Sample-5 sample-6
L* V
alu
e (M
ean
)

72
in Figure 4.8. In addition, Agrahar-Murugkar et al., (2015) stated that color formation of the
baked products is due to Millard reactions between sugar and proteins. The Millard reaction is a
non-enzymatic reaction which causes the browning and caramelization of sugar which produce
brown pigments during baking. Cronin & Preis (2000) reported that there are several factors
(such as; composition of ingredients, baking time, humidity in the oven atmosphere in the initial
stages of baking) may be contributing to the color development of final products. Inconsistent
with these studies, Mahdi et al., (2008) observed that Malt extract is one of the main sugars and
protein contributing flavor and color to the final baked products.
Fig 4.15: a* value of biscuits
4.1.2.6.3 b* Value
The b* value is a measure of the yellowness of the biscuits surface color. The control sample top
surfaces had the lowest b* value (25.9), while sample-6 had the highest (33.32) respectively. The
0
1
2
3
4
5
6
7
8
9
10
Control Sample-1 Sample-2 Sample-3 Sample-4 Sample-5 sample-6
a* V
alu
e (M
ean
)

73
results were significantly different (p< 0.05) for the biscuit samples from each other. From the
results, it was noticed that yellowness (b* value) in the biscuits top surface had a similar trend as
redness (a* value) along with the increased under-utilized plants’ parts incorporation level in
biscuit preparation. Moreover, the results showed a similar trend with the findings reported by
Mamat et al., (2010) produced fat-reduced commercial tea biscuits from different brands of
wheat flour blends; wheat and amaranth flour blends (Chauhan et al., 2016).
Fig 4.16: b* value of biscuits
4.2 Antioxidant activities of plant extracts and their correlation with
antioxidant contents
Four traditionally well-known and scientifically evaluated plants’ parts were used in this study to
develop antioxidant rich biscuits. These are Moringa leaves, Goji berries, Schisandra berries, and
0
5
10
15
20
25
30
35
40
Control Sample-1 Sample-2 Sample-3 Sample-4 Sample-5 sample-6
b* V
alu
e (M
ean
)

74
Gotu kola leaves (Chapter 2/ Section 2.6). A brief summary of the traditional use of these plants
together with the scientific evaluation of their health beneficial properties are presented in Table
4.4.
With a view to evaluating the antioxidant activities and polyphenol contents of these plants, dry
powders of each of the plant were subjected to hot water extraction procedure (Chapter 3/
Section 3.6).
Table 4.4: Biological activities and scientific uses of the plants used in this study
Name of
plants Traditional uses and scientific findings References
Moringa Anticancer, anti-inflammatory, antimicrobial,
antihypertensive, anti-obese, and antidote to
poisonous bites of snakes and scorpion
Abdull et al.,
2014
Gotu Kola
Antidiabetic, wound healing, anti-aging,
therapeutic agent for Alzheimer’s diseases, and
memory enhancing
Stimulate cell rejuvenation, nerve tonic,
neuroprotective, and improve physical work
capacity
Hamidpour, 2015
Schisandra
Berry Anti-inflammatory, anti-stress effects, blood
pressure, and stimulate physical work capacity Hashim, 2011
Goji Berry Anti-cardiovascular, antidiabetic,
immunostimulatory, neuroprotective, anti-fungal,
treatment of cervical cancer, and alleviate
menstrual discomfort
Kulczyński et al.,
2016

75
4.2.1 Hot water extraction yield
About 5 g of dry plant powder was used to perform hot water extraction and the extraction yields
are presented in Table 4.5 below. These extracts contain all water-soluble compounds that
include polyphenols (phenolics and flavonoids), essential oils, vitamins, polysaccharides,
proteins, and other phytonutrients such as trace metals. In this study, special focus was given to
phenolic and flavonoid contents due to their high antioxidant and many other health beneficial
activities.
Table 4.5: Hot water extraction yield of the plants used in this study
Plants samples Quantity of plants Powder
used (g)
Extraction yield (g)
Moringa Leaves 5.2271 1.1084
Gotu Kola Leaves 5.2072 1.0412
Schisandra Berries 5.2428 2.1613
Goji Berries 5.2576 2.9829
4.2.2 Total phenolic contents (TPC) and total flavonoid contents (TFC)
Folin-Coicalteu assay and aluminium chloride tests were used to determine the total flavonoid
and phenolic contents respectively, of hot water extracts of the selected four plants and the
results are presented in Table 4.6 and Fig 4.17. The phenolic contents were expressed in Gallic
acid equivalent (GAE mg/g) units and the flavonoid contents were expressed in Quercetin
equivalent (QE mg/g) units of the extracts per gram of the dried plant material. The total

76
phenolic contents of the selected four plant extracts were in the range of 30.11 to 70.07 mg/g.
The highest phenolic contents were observed in the extracts of Schisandra berries (70.07± 0.10
mg/g) and this observation is consistent with the literature that these fruits are being used to
improve the functional benefits of certain food products (Chen et al., 2012, Lin et al., 2009).
The findings also revealed that the phenolic contents were relatively larger in all the extracts
compared to their flavonoid contents (Table 4.6 and Fig 4.17). Extremely high quantities of
phenolic and flavonoid contents were observed in Schisandra berry which is followed by Goji
berry (Table 4.6 and Fig 4.17). As can be seen from the results, Moringa and Gotu kola leaves
also had high levels of phenolic and flavonoid contents.
These are important findings and the results are consistent with the literature on all the four
plants revealing their tremendous health beneficial effects (Chen et al., 2012, Coppin et al., 2013,
Lin et al., 2009, Wang et al., 2010, Yan et al., 2014). These findings indicate that high
antioxidant contents of the four plants and their edible nature with least side effects make them
extremely suitable candidates to be used for functionally enriched food products.

77
Table 4.6: Total phenolic and flavonoid contents of hot water extracts of plants used in this study
along with their radical scavenging activities
Plant Samples Phenolic content
(GAE mg/g)*
Flavonoid content
(QE mg/g)*
ABTS. + scavenging activity
(Ascorbate equivalent µM/)#
Moringa Leave 30.77± 0.18 10.9± 0.26 822.62± 1.65
Gotu Kola Leave 30.11± 0.22 11.28± 0.67 844.05± 2.97
Schisandra Berry 70.07± 0.10 35.43± 0.95 860.24± 1.65
Goji Berry 46.75± 0.44 15.47± 0.65 846.90± 1.65
*Total phenolic and flavonoid contents are expressed as Gallic acid and Quercetin equivalent mg per
gram respectively
#ABTS•+ free radical scavenging activities are expressed as ascorbic acid equivalent (µM) at 1mg/mL
of plant extracts
&All values are expressed as mean ± SD, n=3 (p< 0.005)

78
Fig 4.17: Total phenolic and flavonoid contents of hot water extracts of plants:
The RED bar represents total phenolic content and the BLUE bar represents total
flavonoid content per 40 grams of biscuits
4.2.3 Antioxidant activities of plant extracts and their correlation with TPC
and TFC
As mentioned before, four traditionally known and underutilized plant parts, namely Moringa
leaves, Gotu kola leaves, Goji berries, and Schisandra berries were used in this study to develop
antioxidant rich biscuits (Chapter 2/ Section 2.6). Radical scavenging activities of their water
extracts were evaluated against ABTS●+ radicals. These results are presented in Table 4.6 and
Fig 4.18. All the four plant extracts exhibited highly significant ABTS●+ scavenging activities
and these activities are superior when compared with the scavenging activities of several
medicinal herbs studied previously in our Laboratory (Zhang et al., 2017). As can be seen from
Table 4.6, the activities of the extracts ranged from 822.62 µmol to 860.24 µmol ascorbic acid
equivalent. Extremely high scavenging activities were displayed by the extracts of Schisandra
0
10
20
30
40
50
60
70
80
Moringa Leaf Gotu Kola Leaf Schisandra
Berry
Goji Berry
Po
lyp
hen
ol
Co
nte
nt
Phenolic content (GAE mg/g)
Flavonoid content (QE mg/g)

79
berry which is followed by Goji berry (Table 4.6 and Fig 4.18). Extremely high activity of
Schisandra berries is in agreement with the literature findings that they contain large quantities of
polyphenols as well as essential oils, vitamins and other antioxidant constituents (Chen et al.,
2012, Wang et al., 2010).
All the four plants showed concentration dependent scavenging activities in the range of 0 to
1000 µg/mL and these results are presented in Appendix A1 (Table A1.1 and Figures A1.1 to
A1.4). The results presented in this section strongly indicate that the four plants studied in this
research display highly significant antioxidant activities. It is therefore concluded that these
plants are extremely suitable to enrich the antioxidant potential and functional value of bakery
products and these observations are consistent with the literature (Cheng et al., 2014, Hashim,
2011, Kulczynski and Gramza-Michalowska, 2016).
An overall conclusion from the antioxidant contents and activities presented in this section
reveal that a systematic investigation, of edible plants with traditionally known health benefits,
employing contemporary scientific tools are expected to lead to the discoveries of functional
foods with major health benefits.

80
Fig 4.18: ABTS •+ scavenging activity of hot water extracts of plants:
Scavenging activities are expressed as ascorbate equivalent (µM) at 1mg/mL
4.3. Antioxidant activities of functionally enriched biscuits
Results presented in sections 4.1 to 4.3, clearly demonstrate that biscuits developed and
evaluated in this project with high protein flour in combination with nutritionally rich plants’
materials have produced high quality products. They indeed had appealing colour and physical
characteristics, improved protein contents and lowered carbohydrate (lower energy) contents.
Their fibre contents have also improved as the percentage of plant material is increased (Sections
4.1).
With a view to evaluating the antioxidant activities and polyphenol contents of these enriched
biscuits, dry powders of each of the six enriched biscuit samples along with the control sample
were subjected to hot water extraction procedure (Chapter 3/ Section 3.6). The polyphenol
790
800
810
820
830
840
850
860
870
880
Moringa Leaf Gotu Kola Leaf Schisandra Berry Goji Berry
AB
TS
. +
sca
ven
gin
g a
ctiv
ity
(Asc
orb
ate
eq
uiv
ale
nce
(µ
M)

81
contents and the antioxidant activities of these extracts are presented and discussed in this
section.
4.3.1 Hot water extraction yield
About 50 g of dry biscuit powder was used to perform hot water extraction and the extraction
yields are presented in Table 4.7 below. These extracts contain all the waterr-soluble compounds
that are part of the plants used as well as the flour. They also include the water-soluble
compounds from the other ingredients used in the preparation of biscuits.
Table 4.7: Hot water extraction yield of the functionally enriched biscuits developed in this
study
Biscuit samples Quantity of hot water
extracts of biscuits used
(g)
Extraction yield (g)
Control 50.0028 3.3657
Sample-1 50.0022 3.3634
Sample-2 50.0018 3.3113
Sample-3 50.0020 3.3880
Sample-4 50.0024 3.3387
Sample-5 50.0029 3.3811
Sample-6 50.0019 3.4123
4.3.2 Total phenolic contents (TPC) and total flavonoid contents (TFC) of enriched biscuits

82
In this study, phenolic and flavonoid contents of the biscuit extracts were determined as their
antioxidant enrichment is expected to be due to the increasing levels of plant materials for
different biscuit samples (Chapter 3/ Table 3.2). These results are presented in Table 4.8 and Fig
4.19. In should be noted that the quantities of phenolics and flavonoids presented in Table 4.8 are
calculated for 40g of biscuit samples. This is because of the fact that the average weights of
biscuit samples prepared in this study are about 20g per biscuit (Table 4.2) and it is assumed that
two biscuits are considered as one serving (40g per serving).
The total phenolic contents of the seven biscuit samples prepared in this study were in the range
of 12.80 to 28.80 mg per 40g of biscuits. As expected, the highest phenolic content was observed
in sample 4 (28.80± 0.52 mg per 40g). Similarly, the total flavonoid contents of the seven biscuit
samples were in the range of 23.20 to 61.60 mg per 40g of biscuits. Again, the highest flavonoid
content was observed in sample 4 (61.60± 1.20 mg per 40g).
It should be noted here that the major constituents of the biscuit extracts are polysaccharides
(carbohydrates) and protein. The plant polyphenols are only minor constituents as the plant
material added varied from 1 to 4% of the total flour.

83
Table 4.8: Total phenolic and flavonoid contents of hot water extracts of biscuit samples along
with their radical scavenging activities.
*Total phenolic and flavonoid contents are expressed as Gallic acid and Quercetin equivalent units
respectively. The quantities are calculated for 40 grams of biscuit samples
#ABTS•+ free radical scavenging activities are expressed as ascorbate equivalent (µM) at 5mg/mL of
biscuit extracts
&All values are expressed as mean ± SD, n=3 (p< 0.005)
Biscuit treatments Phenolic content (GAE
mg/40g)*
Flavonoid content
(QE mg/40g)* ABTS.+ scavenging
activity (Ascorbate
equivalent µM) #
Control 12.8± 0.44 23.2± 1.04 291.66± 0.10
Sample-1 20.8± 0.76 36.8± 1.08 370.71± 0.009
Sample -2 23.2± 0.60 43.2± 1.2 264.04± 0.004
Sample -3 25.6± 0.48 55.2± 1.08 163.57± 0.001
Sample -4 28.8± 0.52 61.6± 1.20 314.52± 0.012
Sample -5 17.2± 0.36 28.1± 1.24 193.10± 0.002
Sample -6 18.8± 0.48 29.2± 1.68 310.24± 0.004

84
Fig 4.19: Total phenolic and flavonoid contents of hot water extracts of biscuit samples:
RED bars represent total phenolic content and BLUE bars represent total
flavonoid content per 40 grams of biscuits
4.3.3 Antioxidant activities of biscuit extracts and their correlation with TPC
and TFC
As can be seen from the scavenging activities of the biscuit extracts presented in Table 4.8, an
increased percentage of plants’ material did not significantly improve their activities. In fact, the
activities have remained very similar for all the samples (Table 4.8). This may be due to the fact
that the major constituents of all the hot water biscuit extracts are polysaccharides
(carbohydrates) and protein. The polyphenols are only minor constituents (only 1 to 4% of the
plant material was added). It should be noted from the literature that plant polysaccharides and
protein display significant antioxidant activities (Zhang et al., 2018). Hence, the contribution of
plant polyphenols for water extracts of biscuit samples is small when compared to the
contribution from polysaccharides.
0
10
20
30
40
50
60
70
Control Sample-1 Sample-2 Sample-3 Sample-4 Sample-5 Sample-6
Po
lyp
hen
ols
Co
nte
nt
Phenolic content (GAE mg/40g)
Flavonoid content (QE mg/40g)
85
It is therefore planned to isolate the plant polyphenols from the hot water extracts of biscuits.
This can be achieved by ethanol treatment of hot water extracts (Zhang et al., 2017). Results on
the isolation of ethanol soluble small molecular phytonutrients (polyphenols) and their
antioxidant activities are presented in the following sub-sections (sections 4.3.4 to 4.3.6).
4.3.4 Isolation of ethanol solubles from hot water extracts of enriched biscuits
As discussed before, the hot water extracts of biscuit samples contain biopolymers
(polysaccharides and proteins as major constituents). In order to remove these biopolymers and
to isolate the ethanol soluble small organics (including polyphenols, vitamins, small sugars,
minerals etc.) from water extracts, the samples were treated with ethanol as described in section
3.7 (Chapter 3; Fig 3.3). The results are presented in Table 4.9. In should be noted that the
quantities of polyphenols presented in Table 4.9 are calculated for 40g of biscuit samples (one
serve of biscuits).

86
Table 4.9: Yield of polyphenols in hot water extracts of functionally enriched biscuits
Biscuit samples Quantity of hot
water extracts used
for isolation (g)
Yield of polyphenols
(g)
Yield of
polyphenols in 40g
of biscuits*
Control 1.5052 0.5708 1.021
Sample-1 1.5055 0.5789 1.034
Sample-2 1.5053 0.5750 1.011
Sample-3 1.5056 0.5734 1.032
Sample-4 1.5058 0.5778 1.040
Sample-5 1.5058 0.5781 1.038
Sample-6 1.5059 0.5787 1.049
#This is total yield after ethanol isolation and contains small sugars and other ethanol solubles
organic molecules in addition to polyphenols.
*Yield of isolated polyphenols in 40 g of biscuit samples is calculated from the total quantity of
water extracts (shown in Table 4.7)
4.3.5 Total phenolic contents (TPC) and total flavonoid contents (TFC) of
ethanol solubles in the extracts of enriched biscuits
The total phenolic and flavonoid contents of ethanol soluble water extracts of the biscuit samples
are presented in Table 4.10 and Fig 4.20 and these values are expressed per 40g of biscuit
samples (per one serving). Results indicate that the total phenolic contents of the seven biscuit
samples prepared in this study were in the range of 25.60 to 57.6 mg per 40g of biscuits. As
expected, the highest phenolic content was observed in sample 4 (57.60± 1.6 mg per 40g).
Similarly, the total flavonoid contents of the seven biscuit samples were in the range of 21.36 to

87
171.50 mg per 40g of biscuits. Again, the highest flavonoid content was observed in sample 4
(61.60± 1.20 mg per 40g).
Clearly, the sample 4 with the largest percentage of plant material (Chapter 3; Table 3.2)
displayed the highest quantities of total phenolics and flavonoid compounds. Results presented in
Figure 4.20, clearly demonstrates that the antioxidant contents of seven biscuit samples increased
as a function of the quantity of plant material added. It is therefore concluded that the polyphenol
contents of the plant material have been retained in the developed biscuits (no loss of these
antioxidant compounds occurred during the baking process of the biscuits).

88
Table 4.10: Total phenolic and flavonoid contents of ethanol solubles isolated from hot water
extracts of biscuits along with their radical scavenging activities
*Total phenolic and flavonoid contents are expressed as Gallic acid and Quercetin equivalent units
respectively. The quantities are calculated for 40 grams of biscuit samples
#ABTS•+ free radical scavenging activities are expressed as ascorbate equivalent (µM) at 1mg/mL of
biscuit extracts
&All values are expressed as mean ± SD, n=3 (p< 0.005)
Biscuit Treatments Phenolic content
(GAE mg/40g)*
Flavonoid content
(QE mg/ 40g)* ABTS
. + scavenging activity
(Ascorbate equivalent µM)#
Control 25.6± 0.4 21.36± 6.21
116.40± 6.9
Sample-1 31.6± 1.2 80.53± 8.22
143.10± 7.6
Sample-2 36± 2.4 98.72± 11.0
188.90± 2.57
Sample-3 50± 2.8 133.53± 6.25
308.10± 2.83
Sample-4 57.6± 1.6 171.50± 8.28
348.60± 5.49
Sample-5 28.8± 2.0 62.93± 11.26
134.20± 2.88
Sample-6 30± 1.2 68.97± 8.33
141.40± 3.46

89
Fig 4.20: Total phenolic and flavonoid contents of ethanol solubles isolated from hot water
extracts of biscuit samples: GREEN bars represent total phenolic content and
RED bars represent total flavonoid content per 40 grams of biscuits
4.3.6 Antioxidant activities and their correlation with TPC and TFC of
enriched biscuits
The ABTS•+ radical scavenging activities of functionally enriched biscuits (as measured from the
isolated ethanol solubles from each biscuit sample) are presented in Table 4.10 and Fig 4.21 and
4.22. These Figures present the activities at three different concentrations for each biscuit
sample. It should be noted that the biscuit samples 1 to 4 (Table 3.2) contain an increasing
proportion of plant material and the trend of scavenging activities reflect such an increase. For
instance, biscuit sample 4 with the largest proportion of plant material displayed the highest
scavenging activity. Also, the correlation plots (Fig4.23 and 4.24) clearly demonstrate the
relationship between antioxidant activities of various biscuit samples with their polyphenol
contents. The polyphenol contents of the biscuits are in turn depended on the amount of plant
material substituted into different biscuit samples.
0
20
40
60
80
100
120
140
160
180
200
Control Sample-1 Sample-2 Sample-3 Sample-4 Sample-5 Sample-6
Po
lyp
hen
ol co
nte
nt
Phenolic content (GAE mg/40g)
Flavonoid content (QE mg/ 40g)

90
Fig 4.21: ABTS•+ scavenging activity of ethanol soluble isolated from hot water extracts of
biscuit samples from Control to Sample-4 (with different proportions of plants
material). Activities are expressed as ascorbic acid equivalent (µM) at three
different concentrations: PURPLE bars represent at 250µg/mL, GREEN bars
represent at 500 µg/mL and RED bars represent at 1000 µg/mL
Fig 4.22: ABTS•+ scavenging activity of ethanol soluble isolated from hot water extracts of
biscuit samples: Control, Sample-5 (with two plants leaves), Sample-6 (with two
berries). Activities are expressed as ascorbic acid equivalent (µM) at three
different concentrations: PURPLE bars represent at 250µg/mL, GREEN bars
represent at 500 µg/mL and RED bars represent at 1000 µg/mL
0
50
100
150
200
250
300
350
400
Control Sample - 1 Sample - 2 Sample - 3 Sample - 4AB
TS
. +
sca
ven
gin
g a
ctiv
ity
of
(Asc
orb
ate
eq
uiv
ale
nce
μM
)
Concentrations (μg/mL)
250 (μg/mL)
500 (μg/mL)
1000 (μg/mL)
0
20
40
60
80
100
120
140
160
Control Sample -5 Sample -6
AB
TS
. +
sca
ven
gin
g a
ctiv
ity
of
(Asc
orb
ate
eq
uiv
ale
nce
μM
)
Concentration (μg/mL)
250 (μg/mL)
500 (μg/mL)
1000 (μg/mL)

91
Figure 4.23: Correlation between ABTS
•+ radical scavenging activity with total phenolic content of
antioxidant rich biscuit samples with varying proportions of plant material: C represents control;
S1 to S6 represent samples with different proportions of plants material
Figure 4.24: Correlation between ABTS•+ radical scavenging activity with total flavonoids content of
antioxidant rich biscuit samples with varying proportions of plant material: C represents control;
S1 to S6 represent samples with different proportions of plants material
C
S1
S2
S3
S4
S5
S6
R² = 0.9928
0
50
100
150
200
250
300
350
400
20 25 30 35 40 45 50 55 60
AB
TS
. +
sca
ven
gin
g a
ctiv
ity
of
eth
an
ol
solu
ble
s (
μM
)
Phenolics content (mg/40g)
CS1
S2
S3
S4
S5
S6
R² = 0.8967
0
50
100
150
200
250
300
350
400
0 20 40 60 80 100 120 140 160 180 200
AB
TS
. +
scaven
gin
g a
ctiv
ity o
f
eth
an
ol
solu
ble
s (μ
M)
Flavonoids Content (mg/40g)
92
As discussed in section 4.1, all the biscuit samples prepared in this project have high nutritional
value. It is therefore concluded that the biscuits with 4% plant material (sample 4) is the best
substitution with the highest functional benefit and expected to provide an overall health benefit
to the consumers of all age groups.
Overall, it may be concluded based on the health benefits of the plants used in this project (Table
4.4) that the antioxidant rich biscuits are expected to provide tremendous health benefits
including alleviation of oxidative stress and associated diseases; prevention of high blood sugar,
cardiovascular diseases, cancer; have the capacity to heal wounds, enhance memory, and exhibit
neuroprotective benefits.

93
CHAPTER 5
CONCLUSION
&FUTURE
RECOMMENDATIONS

94
Chapter 5
Conclusion & Future Recommendations
5.1 Conclusion and recommendations for future research
Interest in naturally occurring under-utilized plants rich in bioactive compounds has considerably
increased and natural food products have regained prominence in recent years. It has become
necessary to search new sources of natural antioxidants and proteins to develop novel foods
which are low cost, safe, and affordable by all population. Thus, under-utilized plants
incorporated products have great future potential for the discovery of new and highly nutritious
food products with overall health benefits.
The main objective of this study was to develop antioxidant and protein rich food products using
under-utilized plants parts. In order to fulfill the main objectives, different under-utilized plants
such as Moringa leaves, Gotu kola leaves, Schisandra berry, and Goji berry have been selected.
Parts of these plants with high nutritional and antioxidant activities were incorporated into flour
to make different biscuit samples at different substitution levels of plants and were evaluated for
their physicochemical, nutritional, and antioxidant properties. Quantification of proximate
nutrients (Moisture, ash, protein, fat, fibre, carbohydrates, and energy), antioxidant and bioactive
compounds (phenolics and flavonoids) have been carried out to determine the nutritional and
bioactive properties of plants parts incorporated biscuit samples. Different under-utilized plants
substituted biscuit samples displayed a range of nutritional and biological activities especially,
antioxidant activities.

95
The results of this study revealed that under-utilized plants are good sources of protein, fibre,
carbohydrate, and energy. The physical properties (weight, thickness, diameter, color, spread
ratio, and bake loss) of biscuit samples were affected by the incorporation of plant parts in a
positive way. The color characteristics of the biscuit samples were significantly influenced by the
addition of plants materials.
In order to evaluate the antioxidant activities of the biscuit samples, their radical scavenging
activities, as well as their polyphenol contents, were determined. These results clearly suggest
that the biscuit samples prepared with increased levels of plant material display increased
antioxidant activities. It is also concluded from the present research that four traditionally known
edible plant parts have been successfully used to improve the antioxidant potentials of the
biscuits. Owing to the fact that the plant parts used in this study have displayed extremely high
antioxidant activities and these effects have been incorporated into the biscuits. It is therefore
expected that the antioxidant rich biscuits developed in this project are good sources to provide
overall health benefits to the consumers. The enhanced nutritional and antioxidant properties of
biscuits observed in this research are desirable characteristics in the modern food industry. The
developed biscuit products are expected to be a good source of the required nutrition and
functional bioactive compounds which benefits overall human health including addressing
obesity, diabetes, cancer, and other age-related diseases.

96
Baked products have become very popular among all age groups. Among baked products,
biscuits are one of the most popular snacks and can be substituted with functional and bioactive
nutrients. These can be used as a very easy vehicle for providing a sufficient amount of nutrients
needed by the population. Some of the under-utilized plants are a good source of bioactive
nutrients and can be used to fortify or develop new food products. Further studies on the
development of under-utilized plant based products are recommended for overall sensory
acceptability by consumers.
Future research possibilities include the use of the four plants studied in this project to other
bakery products such as cookies and also the use of other well-known herbal plants into bakery
products. Further research employing modern food technology methods combined with
contemporary scientific tools is expected to lead to the discoveries of novel functional foods with
major health benefits.

97

97
REFERENCE
LIST

98
References
AACC, 2001. Approved methods of the American Association of Cereal Chemists. American
Association of cereal Chemists Press, St. Paul, MN, 10th Ed.
Abu-Salem, F. & Abou-Arab, A. 2011. Effect of supplementation of Bambara groundnut (Vigna
subterranean L.) flour on the quality of biscuits. African Journal of Food Science, 5(7):
376-383.
Abdull, A. F. R., Ibrahim, M. D, & Kmtayya, S. B. 2014. Health benefits of Moringa oleifera.
Asian Pacific journal of Cancer Prevention: APJCP, 15(20): 8571-8576.
Adebayo-Oyetoro, A. O., Ogundipe, O. O. & Adeeko, K. N. 2015. Quality assessment and
consumer acceptability of bread from wheat and fermented banana flour. Food science
and nutrition, 4(3): 364-369.
Adeola, A. A. & Ohizua, E. R. 2018. Physical, chemical, and sensory properties of biscuits
prepared from flour blends of unripe cooking banana, pigeon pea, and sweet potato. Food
Science and Nutrition, 6, 532-540.
Adeyeye, S. A. O. 2016. Assessment of quality and sensory properties of sorghum–wheat flour
cookies. Cogent Food and Agriculture, 2: 12450-12459.
Agrahar-Murugkar, D., Gulati, P., Kotwaliwale, N. & Gupta, C. 2015. Evaluation of nutritional,
textural and particle size characteristics of dough and biscuits made from composite
flours containing sprouted and malted ingredients. Journal of Food Science and
Technology, 52(8): 5129-5137.
Akinmoladun, A., Obuotor, E. M. & Farombi, O. 2010. Evaluation of Antioxidant and Free
Radical Scavenging Capacities of Some Nigerian Indigenous Medicinal Plants. Journal
of Medicinal Food, 13(2):
Alam, A. M., Alam, J. M., Hakim, A. M., Huq, A. K. O. & Moktadir, S. M. G. 2014.
Development of fiber enriched herbal biscuits: A preliminary study on sensory evaluation
and chemical composition. International Journal of Nutrition and Food Sciences, 3(4):
246-250.
Alam, M. N., Bristi, N. J. & Rafiquzzaman, M. 2013. Review on in vivo and in vitro methods
evaluation of antioxidant activity. Saudi Pharmaceutical Journal, 21: 143-152.
Almeida, M. M. B., Sousa, P. H. M., Arriaga, A. M. C., Prado, G. M., Magalhaes, C. E. D. C.,
Maia, G. A. & Lemos, T. L. G. 2011. Bioactive compounds and antioxidant activity of
fresh exotic fruits from northeastern Brazil. Food Research International, 44: 2155-2159.
Alobo, A. P. 2001. Effect of sesame seed flour on millet biscuit characteristics. Plant Foods for
Human Nutrition, 56: 195-202.

99
Amagase, H. & Nance, D. M. 2011. Lycium barbarum increases caloric expenditure and
decreases waist circumference in healthy overweight men and women: Pilot study. Jornal
of American College of Nutrition, 30(5): 304-309.
Amagase, H., Sun, B. & Nance, D. M. 2009. Immunomodulatory effects of a standardized
Lycium barbarum fruit juice in Chinese older healthy human subjects.(Full
communication report). Journal of Medicinal Food, 12: 1159.
Anon, 2015. New type 2 diabetes findings from Southeast University discussed (Practical
application of antidiabetic efficacy of lycium barbarum polysaccharide in patients with
type 2 diabetes).(Clinical report). Drug Week, 177.
Antіnio, J. 2018. Phenolic compounds in fruit beverages. Beverages, 4: 35.
AOAC, 1990. Official methods of analysis of AOAC, International, Washington, DC:
Association of Official Analytical Chemist, 16: 1546.
AOAC, 1995. Official methods of analysis of AOAC, International, Washington, DC:
Association of Official Analytical Chemist, 16: 1546.
AOAC, 2000. Official methods of analysis. Association of Official Analytical Chemists,
Washington, DC., USA, 16th Ed.
Apel, K. & Hirt, H. 2004. Reactive oxygen species: Metabolism, oxidative stress, and signal
transduction. Annual Review of Plant Biology, 55: 373-399.
Ariffin, F., Chew, S. H., Bhupinder, K., Karim, A. A. & Huda, N. 2011. Antioxidant capacity
and phenolic composition of fermented centella asiatica herbal teas. Journal of Science
and Food Agriculture, 91: 2731-2739.
Arulselvan, P., Fard, M. T., Tan, W. S., Gothai, S., Fakurazi, S., Norhaizan, M. E. & Kumar, S.
S. 2016. Role of antioxidants and natural products in inflammation. Oxidative Medicine
and Cellular Longevity, 15.
Aruoma, O. I. 1994. Nutrition and health aspects of free radicals and antioxidants. Food &
Chemical Toxicology, 32: 671-683.
Athina, A. G. & Antonios, M. G. 2006. Antioxidants and inflammatory disease: Synthetic and
natural antioxidants with anti-inflammatory activity. Combinatorial Chemistry & High
Throughput Screening, 9: 425-442.
Ayo, J. A., Ayo, V. A., Nkama, I. & Adeworie, R. 2007. Physiochemical, invitro digestibility
and organoleptic evaluation of acha-wheat biscuit supplemented with soyabean flour.
Nigerian Food Journal, 25: 15-17.

100
Bala, A., Gul, K. & Riar, C. S. 2015. Functional and sensory properties of cookies prepared from
wheat flour supplemented with cassava and water chestnut flours. Cogent Food and
Agriculture, 1(1).
Baldermann, S., Blagojević, L., Frede, K., Klopsch, R., Neugart, S., Neumann, A., NGWENE,
B., Norkeweit, J., Schröter, D., Schröter, A., Schweigert, F. J., Wiesner, M. & Schreiner,
M. 2016. Are neglected plants the food for the future?. Critical Reviews in Plant
Sciences, 35: 106-119
Ballabio, C., Uberti, F., Lorenzo, C. D., Brandolini, A., Peñas, E. & Restani, P. 2011.
Biochemical and immunochemical characterization of different varieties of amaranth
(Amaranthus L. ssp.) as a safe ingredient for gluten-free products. Journal of Agriculture
and Food Chemistry, 59(24): 12969-12974.
Benchennouf, A., Grigorakis, S., Loupassaki, S. & Kokkalou, E. 2017. Phytochemical analysis
and antioxidant activity of lycium barbarum (Goji) cultivated in Greece. Pharmaceutical
Biology, 55: 596-602.
Benchikh, Y. & Louailèche, H. 2014. Effects of extraction conditions on the recovery of
phenolic compounds and in vitro antioxidant activity of carob (Ceratonia siliqua L.) pulp.
Acta Botanica Gallica, 161: 175-181.
Benchikh, Y., Zaoui, A., Derbal, R., BEY, M. R. & Louaileche, H. 2018. Optimisation of
extraction conditions of phenolic compounds and antioxidant activity of Ruta chalepensis
L. using response surface methodology. Journal of Food Measurement and
Characterization.
Bennett, R. N., Mellon, F. A., Foidl, N., Pratt, J. H., Dupont, M. S., Perkins, L. & Kroon, P. A.
2003. Profiling glucosinolates and phenolics in vegetative and reproductive tissues of the
multi-purpose trees moringa oleifera L. (Horseradish Tree) and moringa stenopetala L.
Journal of Agricultural and Food Chemistry, 51: 3546-3553.
Bhagwat, S., B Haytowitz, D. & HOLDEN, J. M. 2010. Oxygen radical absorbance capacity
(ORAC) of selected foods.
Birch, A. N., Begg, G. S. & Squire, G. R. 2011. How agro-ecological research helps to address
food security issues under new IPM and pesticide reduction policies for global crop
production systems. Journal of Experimental Botany, 62: 3251-3261.
Bisla, G., Choudhary, S. & Chaudhary, V. 2014. Evaluation of the nutritive and organoleptic
values of food products developed by incorporated catharanthus roseus (Sadabahar) fresh
leaves explore their hypoglycemic potential. The Scientific World Journal, 304120-
304127.

101
Bolanho, B., Egea, M. & Campos, I. 2014. Antioxidant and nutritional potential of cookies
enriched with spirulina platensis and sources of fibre. Journal of Food and Nutrition
Research, 53: 171-179.
Bunde, M. C., Osundahunsi, O. & Akinoso, R. 2010. Supplementation of biscuit using rice bran
and soybean flour. African Journal of Food, Agriculture, Nutrition and Development,
10(9).
Cai, Y., Luo, Q., Sun, M. & Corke, H. 2004. Antioxidant activity and phenolic compounds of
112 traditional Chinese medicinal plants associated with anticancer. Life Sciences,
74(17): 2157-84.
Carnes, J., Larramendi, C. H. D., Ferrer, A., Huertas, A. J., Lгіpez-Matas, M. A., Pagгўn, J. A.,
Navarro, L. A., Garcгa-Abujeta, J. L., Vicario, S. & Peia, M. 2013. Recently introduced
foods as new allergenic sources: Sensitisation to goji berries (lycium barbarum). Food
Chemistry, 137: 130-135.
Carocho, M., Barreira, J. C. M., Antonio, A. L., Bento, A., Morales, P. & Ferreira, I. C. F. R.
2015. The incorporation of plant materials in “Serra da Estrela” cheese improves
antioxidant activity without changing the fatty acid profile and visual appearance.
European Journal of Lipid Science and Technology, 117: 1607-1614.
Cauvain, S. 2017. Biscuits, cookies, crackers and wafers.
Chakraborty, P., Bhattacharya, A., Bhattacharyya, D. K., Bandyopadhyay, N. R. & Ghosh, M.
2016. Studies of nutrient rich edible leaf blend and its incorporation in extruded food and
pasta products. Materials Today: Proceedings, 3: 3473-3483.
Chandrika, U. G. & Prasad-Kumara, P. A. A. S. 2015. Chapter four - Gotu kola (Centella
asiatica): Nutritional properties and plausible health benefits. In: HENRY, J. (ed.)
Advances in Food and Nutrition Research, Academic Press.
Chauhan, A., Saxena, D. C. & Singh, S. 2016a. Physical, textural, and sensory characteristics of
wheat and amaranth flour blend cookies. Cogent Food & Agriculture, 2: 1125773.
Chauhan, A., Saxena, D. C. & Singh, S. 2016b. Physical, textural, and sensory characteristics of
wheat and amaranth flour blend cookies. Cogent Food & Agriculture, 2: 1125773.
Chauhan, A. I. 2014. Product development and sensory evaluation of value added food products
made by incorporating dried cauliflower green leaves.
Chavan, J. & Kadam, S. 1993. Nutritional enrichment of bakery products by supplementation
with nonwheat flours.
Chen, X. Q., Zhang, Y., Zu, Y. & Yang, L. 2011. Chemical composition and antioxidant activity
of the essential oil of Schisandra chinensis fruits.

102
Chen, X., Zhang, Y., Zu, Y. & Yang, L. 2012. Chemical composition and antioxidant activity of
the essential oil of Schisandra chinensis fruits. Natural Product Research, 26: 842-849.
Cheng, J., Zhou, Z. W., Sheng, H. P., He, L. J., Fan, X. W., He, Z. X., Sun, T., Zhang, X., Zhao,
R. J., Gu, L., Cao, C. & Zhou, S. F. 2014. An evidence-based update on the
pharmacological activities and possible molecular targets of Lycium barbarum
polysaccharides. Drug design, development and therapy, 9: 33-78.
Chinma, C. E. & Gernah, D. I. 2007. Physicochemical and sensory properties of cookies
produced from cassava/soybean/mango composite flours. Journal of Raw
Material Research, 4: 32-43.
Chinma, C. E., Iqbabul, B. D. & Omotayo, O. O. 2012. Quality characteristics of cookies
prepared from unripe plantain and defatted sesame flour blends. American
Journal of Food Technology, 7: 398-408.
Chippada, S. C. & Vangalapati, M. 2011. Antioxidant, an anti-inflammatory and anti-arthritic
activity of Centella asiatica extracts.
Choudhary, R. K. & Swarnkar, P. L. 2011. Antioxidant activity of phenolic and flavonoid
compounds in some medicinal plants of India. Natural Product Research, 25: 1101-1109.
Chugh, B., Singh, G. & Kumbhar, B. K. 2013. Development of low-fat soft dough biscuits using
carbohydrate-based fat replacers. International journal of food science, 13: 576153-
576153.
Chumark, P., Khunawat, P., Sanvarinda, Y., Phornchirasilp, S., Morales, N., Phivthong-Ngam,
L., Ratanachamnong, P., Srisawat, S. & Pongrapeeporn, K. U. 2008. The in vitro and ex
vivo antioxidant properties, hypolipidaemic and antiatherosclerotic activities of water
extract of Moringa oleifera Lam. leaves.
Coppin, J., Xu, Y., Chen, H., Pan, M. H., Ho, C. T., Juliani, H., Simon, J. & Wu, Q. 2013.
Determination of flavonoids by LC/MS and anti-inflammatory activity in Moringa
oleifera.
Cronin, K. & Preis, C. 2000. Statistical analysis of biscuit physical properties as affected by
baking.
Damor, V., Pawar, M., Gami, Y., Ankuya, K., Srivastava, A. K., Chauhan, H. & Patel, V. 2017.
Effect of replacing concentrate mixture with moringa (moringa oleifera) leaves on blood
biochemical and mineral profile of mehsana goat kids.
Dance, A. 2017. Cancer immunotherapy comes of age. Science, 355: 1220.
Das, A. 2011. Review on nutritional, medicinal and pharmacological properties of centella
asiatica (Indian pennywort).

103
Dennert, G., Zwahlen, M., Brinkman, M., Vinceti, M., Zeegers, M. P. A. & Horneber, M. 2011.
Selenium for preventing cancer. The Cochrane database of systematic reviews,
CD005195-CD005195.
Diaz, P., Jeong, S. C., Lee, S., Khoo, C. & Koyyalamudi, S. 2012. Antioxidant and anti-
inflammatory activities of selected medicinal plants and fungi containing phenolic and
flavonoid compounds.
Dong-Ping, X. 2007. Natural antioxidants in foods and medicinal plants: extraction,
assessment and resources. International Journal of Molecular Science,18: 96.
Donno, D., Beccaro, G. L., Mellano, M. G., Cerutti, A. K. & Bounous, G. 2014. Goji berry fruit
(lycium spp.): Antioxidant compound fingerprint and bioactivity evaluation. Journal of
Functional Foods, 18.
Donno, D., Beccaro, G. L., Mellano, M. G., Cerutti, A. K. & Bounous, G. 2015. Goji berry fruit
(Lycium spp.): Antioxidant compound fingerprint and bioactivity evaluation. Journal of
Functional Foods, 18, 1070-1085.
Eddouks, M., Chattopadhyay, D., Feo, V. D. & Cho, W. C. S. 2014. Medicinal plants in the
prevention and treatment of chronic diseases 2013. Evidence-Based Complementary and
Alternative Medicine, 3.
Ellouze-Ghorbel, R., Kamoun, A., Neifar, M., Belguith, S., Ayadi, M. A., Kamoun, A. &
Ellouze-Chaabouni, S. 2010. Development of fiber-enriched biscuits formula by a
mixture design. Journal of Texture Studies, 41: 472-491.
Emire, S. & Arega, M. 2012. Value added product development and quality characterization of
amaranth (Amaranthus caudatus L.) grown in East Africa.
Endes, Z., Uslu, N., Ozcan, M. M. & Er, F. 2015. Physico-chemical properties, fatty acid
composition and mineral contents of goji berry (Lycium barbarum L.) fruit.
Ergun, R., Lietha, R. & Hartel, R. W. 2010. Moisture and shelf life in sugar confections. Critical
Reviews in Food Science and Nutrition, 50: 162-192.
Essuman, E. K., Osei, J. A. & Gyimah, V. 2016. Proximate composition and sensory qualities of
chips produced from ackee aril flour. American Journal of Food Science and Technology,
4: 38-42.
Etani, Y., Nishimoto, Y., Kawamoto, K., Yamada, H., Shouji, Y., Kawahara, H. & Ida, S. 2014.
Selenium deficiency in children and adolescents nourished by parenteral nutrition and/or
selenium-deficient enteral formula. Journal of Trace Elements in Medicine and Biology,
28: 409-413.
Fang, Y. Z., Yang, S. & Wu, G. 2002. Free radicals, antioxidants and nutrition. Nutrition.
Review, 18: 872-879.
104
Fratianni, A., Mignogna, R., Niro, S. & Panfili, G. 2015. Determination of lutein from fruit and
vegetables through an alkaline hydrolysis extraction method and hplc analysis. Journal of
Food Science, 80: C2686-C2691.
Fuente, M. D. L., Hernanz, A. & Vallejo, M. C. 2005. The immune system in the oxidative stress
conditions of aging and hypertension: favorable effects of antioxidants and physical
exercise. Antioxidants & Redox Signaling, 7: 1356-1366.
Gallagher, E., M. O., Brien, C., Scannell, A. & Arendt, E. 2003. Evaluation of sugar replacers in
short dough cookie production.
Ganesan, K. & Xu, B. 2018. A critical review on phytochemical profile and health promoting
effects of mung bean (vigna radiata). Food Science and Human Wellness, 7: 11-33.
Ganorkar, P. & R. K, J. 2014. Effect of flaxseed incorporation on physical, textural, sensorial
and chemical attributes of cookies.
GANORKAR, P. & R.K, J. 2014. Development of flaxseed fortified rice–corn flour blend based
extruded product by response surface methodology.
Gomez, M. I., Obilance, A. B., Martin, D. F., Madzvanuse, M., & Many, E. S. 1997. manual of
laboratory procedures for quality evaluation of sorghum and millet. International crop
Research Institute of the Semi-Arid and Tropics (ICRSAT), India. 64.
Gopalakrishnan, L., Doriya, K. & Kumar, D. S. 2016. Moringa oleifera: A review on nutritive
importance and its medicinal application. Food Science and Human Wellness, 5: 49-56.
Gross, M. 2014. Plant science called up to provide food security. Current Biology, 24: R1105-
R1108.
Gul, K., Riar, C. S., Bala, A. & Sibian, M. S. 2014. Effect of ionic gums and dry heating on
physicochemical, morphological, thermal and pasting properties of water chestnut starch.
LWT - Food Science and Technology, 59: 348-355.
Guo, D. J., Cheng, H. L., Chan, S. W. & Yu, P. H. F. 2008a. Antioxidative activities and the total
phenolic contents of tonic Chinese medicinal herbs. Inflammopharmacology, 16: 201-
207.
Gupta, H. O. & Singh, N. N. 2005. Preparation of wheat and quality protein maize based biscuits
and their storage, protein quality and sensory evaluation.
Gupta, R., Bajpai, K. G., Johri, S. & Saxena, A. M. 2007. An overview of Indian novel
traditional medicinal plants with anti-diabetic potentials. African journal of traditional,
complementary, and alternative medicines : AJTCAM, 5: 1-17.
Hamidpour, R. 2015. Medicinal property of gotu kola (centella asiatica) from the selection of
traditional applications to the novel phytotherapy.

105
Hashemzaei, M., Far, A. D., Yari, A., Heravi, R. E., Tabrizian, K., Taghdisi, S. M., Sadegh, S.
E., Tsarouhas, K., Kouretas, D., Tzanakakis, G., Nikitovic, D., Anisimov, N. Y.,
Spandidos, D. A., Tsatsakis, A. M. & Rezaee, R. 2017. Anticancer and apoptosis‑inducing effects of quercetin in vitro and in vivo. Oncology Reports, 38: 819-828.
Hashim, P. 2011. Centella asiatica in food and beverage applications and its potential antioxidant
and neuroprotective effect.
Hasler, C. M. 2002. Functional foods: Benefits, concerns and challenges—A position paper from
the American Council on Science and Health. The Journal of Nutrition, 132: 3772-3781.
Hatfield, D. L. & Gladyshev, V. N. 2009. The outcome of selenium and vitamin e cancer
prevention trial (select) reveals the need for better understanding of selenium biology.
Molecular Interventions, 9: 18-21.
Hintz, T., Matthews, K. K. & Di, R. 2015. The use of plant antimicrobial compounds for food
preservation. Bio Med Research International, 246264-246264.
Ho, L. H. & Latif, N. W. B. A. 2016. Nutritional composition, physical properties, and sensory
evaluation of cookies prepared from wheat flour and pitaya (hylocereus undatus) peel
flour blends. Cogent Food & Agriculture, 2.
Ibidapo, O., Akinyele, O., Akinwale, T., Folasade, O., Olabisi, A. & Nnenna, E. 2017.
Development and Quality Evaluation of Carrot Powder and Cowpea Flour Enriched
Biscuits.
Ikuomola, D. S., Otutu, O. L. & Oluniran, D. D. 2017. Quality assessment of cookies produced
from wheat flour and malted barley (Hordeum vulgare) bran blends. Cogent Food &
Agriculture, 3: 1293471.
Islam, T., Yu, X., Badwal, T. & Xu, B. 2017. Comparative studies on phenolic profiles,
antioxidant capacities and carotenoid contents of red goji berry (lycium barbarum) and
black goji berry (lycium ruthenicum). Chemistry Central Journal, 11: 1-8.
Jansen, R. L. M., Brogan, B., Whitworth, A. J. & Okello, E. J. 2014. Effects of five ayurvedic
herbs on locomotor behaviour in a drosophila melanogaster parkinson's disease model.
Phytotherapy Research : PTR, 28: 1789-1795.
Jayathilakan, K., Sharma, G. K., Radhakrishna, K. & Bawa, A. S. 2007. Antioxidant potential of
synthetic and natural antioxidants and its effect on warmed-over-flavour in different
species of meat. Food Chemistry, 105: 908-916.
Jerome, A. A., Ayo, V. A., Nkama, I. & Adewori, R. 2007. Physiochemical, in-vitro digestibility
and organoleptic evaluation of "acha" wheat biscuit supplemented with soybean flour.

106
Jiang, L. F. 2014. Preparation and antioxidant activity of Lycium barbarum oligosaccharides.
Carbohydrate Polymers, 99: 646-648.
Karker, M., Falleh, H., Msaada, K., Smaoui, A., Abdelly, C., Legault, J. & Ksouri, R. 2016.
Antioxidant, anti-inflammatory and anticancer activities of the medicinal halophyte
Reaumuria vermiculata. EXCLI Journal, 15, 297-307.
Karki, R., Mishra, A., Ojha, P. & Subedi, U. 2016. Comparative study on the sensory quality of
prepared biscuit and cake from amaranthus and sorghum.
Karklina, D., Gedrovica, I., Reca, M. & Kronberga, M. 2012. Production of biscuits with higher
nutritional value. Proceedings of the Latvian Academy of Sciences, 66: 113-116.
Karthivashan, G., Arulselvan, P., Alimon, A. R., Ismail, I. S. & Fakurazi, S. 2015. Competing
role of bioactive constituents in moringa oleifera extract and conventional nutrition feed
on the performance of cobb 500 broilers. BioMed Research International, 970398-
970398.
Khan, R., Grigor, J. V., Win, A. & Boland, M. 2014. Differentiating aspects of product
innovation processes in the food industry An exploratory study on New Zealand.
Khodaie, L., Bamdad, S., Delazar, A. & Nazemiyeh, H. 2012. Antioxidant, total phenol and
flavonoid contents of two pedicularis L. Species from eastern Azerbaijan, Iran.
BioImpacts : BI, 2: 43-57.
Klunklin, W. & Savage, G. 2018. Physicochemical properties and sensory evaluation of wheat-
purple rice biscuits enriched with green-lipped mussel powder ( perna canaliculus ) and
spices.
Kolawole, F. L., Akinwande, B. A. & Ade-Omowaye, B. I. O. 2018. Physicochemical properties
of novel cookies produced from orange-fleshed sweet potato cookies enriched with
sclerotium of edible mushroom (pleurotus tuberregium). Journal of the Saudi Society of
Agricultural Sciences.
Kraus, A. 2015. Development of functional food with the participation of the consumer:
Motivators for consumption of functional products. International Journal of Consumer
Studies, 39: 2-11.
Ktenioudaki, A. & Gallagher, E. 2012. Recent advances in the development of high-fibre baked
products.
Kulczynski, B. & Gramza-Michalowska, A. 2016. Goji berry (lycium barbarum): composition
and health effects - a review. Olsztyn: De Gruyter Open Sp. z o.o.
107
Kulthe, A. A., Pawar, V. D., Kotecha, P. M., Chavan, U. D. & Bansode, V. V. 2014.
Development of high protein and low calorie cookies. Journal of food science and
technology, 51: 153-157.
Kumar, Y., Yadav, D. N., Ahmad, T. & Narsaiah, K. 2015. Recent trends in the use of natural
antioxidants for meat and meat products. Comprehensive Reviews in Food Science and
Food Safety, 14: 796-812.
Lee, K., Ahn, J. H., Lee, K. T., Jang, D. & Choi, J. H. 2018. Deoxyschizandrin, isolated from
schisandra berries, induces cell cycle arrest in ovarian cancer cells and inhibits the
protumoural activation of tumour-associated macrophages. Nutrients, 10: 91.
Li, J. 2009. Total anthocyanin content in blue corn cookies as affected by ingredients and oven
types. In: Faubion, J., Walker, C., Herald, T. & Sun, S. (eds.). ProQuest Dissertations
Publishing.
Li, S., Chen, G., Zhang, C., Wu, M., Wu, S. & Liu, Q. 2014. Research progress of natural
antioxidants in foods for the treatment of diseases. Food Science and Human Wellness, 3:
110-116.
Li, X. L. & Zhou, A. G. 2007. Evaluation of the antioxidant effects of polysaccharides extracted
from lycium barbarum. Medicinal Chemistry Research, 15: 471-482.
Li, Y. O. & Komarek, A. R. 2017. Dietary fibre basics: health, nutrition, analysis, and
applications. Food Quality and Safety, 1: 47-59.
Liu, R. H. 2013. Dietary bioactive compounds and their health implications. Journal of Food
Science, 78: A18-A25.
Lobo, V., Patil, A., Phatak, A. & Chandra, N. 2010. Free radicals, antioxidants and functional
foods: Impact on human health. Pharmacognosy reviews, 4: 118-126.
Lu, Y. & Chen, D. 2008. Analysis of Schisandra chinensis and Schisandra sphenanthera.
Luís, Â., Domingues, F., Gil, C. & Duarte, A. 2009. Antioxidant activity of extracts of
Portuguese shrubs: Pterospartum tridentatum, Cytisus scoparius and Erica spp.
Lushchak, V. 2015. Free radicals, reactive oxygen species, oxidative stresses and their
classifications.
Ma, H., Li, J., An, M., Gao, X. M. & Chang, Y. X. 2018. A powerful on line ABTS+–CE-DAD
method to screen and quantify major antioxidants for quality control of Shuxuening
Injection. Scientific Reports, 8: 5441.
108
Macnee, W. & Rahman, I. 1999. Oxidants and antioxidants as therapeutic targets in chronic
obstructive pulmonary disease. American Journal of Respiratory and Critical Care
Medicine, 160: S58-S65.
Mahdi, G. S., Behera, B. C., Verma, N., Sonone, A. & Makhija, U. 2008. Barley is a healthful
food: A review.
Malta, L. G., Tessaro, E. P., Eberlin, M., Pastore, G. M. & Liu, R. H. 2013. Assessment of
antioxidant and antiproliferative activities and the identification of phenolic compounds
of exotic Brazilian fruits. Food Research International, 53: 417-425.
Mamat, H., Abu-Hardan, M. & Hill, S. 2010. Physicochemical properties of commercial semi-
sweet biscuit.
Mamat, H. & Hill, S. 2014. Effect of fat types on the structural and textural properties of dough
and semi-sweet biscuit.
Manildra Group of Companies (GEM of the west). Product data sheet. March. 10, 2018.
Marijana S., A. M., Zita S, Biljana P. 2009. Antioxidant activity of cookies supplemented with
sugarbeet dietary fibre. Proceedings of the 5th International Congress Flour-Bread '09.
7th Croatian Congress of Cereal Technologists, Opatija, Croatia, 76-83.
Mavlyanova, R. 2013. Strategic approaches for research and promotion of underutilized
vegetable crops for food security in central asia and the caucasus. International Society
for Horticultural Science (ISHS), Leuven, Belgium, 541-547.
Mbikay, M. 2012. Therapeutic potential of moringa oleifera leaves in chronic hyperglycemia and
dyslipidemia: A review. Frontiers in Pharmacology, 3: 24-24.
Mgbeahuruike, E. E., Yrjönen, T., Vuorela, H. & Holm, Y. 2017. Bioactive compounds from
medicinal plants: Focus on piper species. South African Journal of Botany, 112: 54-69.
Miller, R. A. & Hoseney, R. 1997. factors in hard wheat flour responsible for reduced cookie
spread 1.
Milner, J. A. 2004. Molecular targets for bioactive food components. The Journal of Nutrition,
134: 2492S-2498S.
Mir, N. A., Gul, K. & Riar, C. S. 2014a. Physicochemical, pasting and thermal properties of
water chestnut flours: A comparative analysis of two geographic sources. Journal of
Food Processing and Preservation, 39: 1407-1413.
Mir, N. A., Gul, K. & Riar, C. S. 2014b. Technofunctional and nutritional characterization of
gluten-free cakes prepared from water chestnut flours and hydrocolloids. Journal of Food
Processing and Preservation, 39: 978-984.

109
Mishra, A., Devi, M. & Jha, P. 2015. Development of gluten free biscuits utilizing fruits and
starchy vegetable powders. Journal of food science and technology, 52: 4423-4431.
Mocan, A., Crișan, G., Vlase, L., Crișan, O., Vodnar, C. D., Raita, O., Gheldiu, A. M., Toiu, A.,
Oprean, R. & Tilea, I. 2014a. Comparative studies on polyphenolic composition,
antioxidant and antimicrobial activities of schisandra chinensis leaves and fruits.
Molecules, 19.
Mocan, A., Crisan, G., Vlase, L., Crisan, O., Vodnar, D., Raita, O., Gheldiu, A. M., Toiu, A.,
Oprean, R. & Tilea, I. 2014b. Comparative studies on polyphenolic composition,
antioxidant and antimicrobial activities of schisandra chinensis leaves and fruits.
Molecules, 19: 15162-15179.
Mohamad, R. H., El-Bastawesy, A. M., Abdel-Monem, M. G., Noor, A. M., Al-Mehdar, H. A.
R., Sharawy, S. M. & El-Merzabani, M. M. 2011. Antioxidant and anticarcinogenic
effects of methanolic extract and volatile oil of fennel seeds (foeniculum vulgare).
Journal of Medicinal Food, 14: 986-1001.
Molan, A. L., Faraj, A. & Mahdy, A. 2012. Antioxidant activity and phenolic content of some
medicinal plants traditionally used in northern Iraq.
Muthukumar, M., Naveena, B. M., Vaithiyanathan, S., Sen, A. R. & Sureshkumar, K. 2014.
Effect of incorporation of moringa oleifera leaves extract on quality of ground pork
patties. Journal of food science and technology, 51: 3172-3180.
Nielsen, F. h. 2014. Should bioactive trace elements not recognized as essential, but with
beneficial health effects, have intake recommendations. Journal of Trace Elements in
Medicine and Biology, 28: 406-408.
Niki, E. & Noguchi, N. 2008. Evaluation of antioxidant capacity: What capacity is being
measured by which method? IUBMB Life, 50, 323-329.
Niro, S., Fratianni, A., Panfili, G., Falasca, L., Cinquanta, L. & Alam, M. 2017. Nutritional
evaluation of fresh and dried goji berries cultivated in Italy.
Norhayati, M., Noh, M. M., Zaiton, A., Syuriahti, W., Selamat, R., Rashed, A., Ang, J., Nawi,
N., Suraiami, M., Jamilan, M. A. & Balasubramaniam, V. 2015. Nutritional Composition
of Selected Commercial Biscuits in Malaysia.
Okaka, J. C. & Isieh, M. I. 1990. Development and quality evaluation of cowpea-wheat biscuits.
Okpala, L., Okoli, E. & Udensi, E. 2013. Physico-chemical and sensory properties of cookies
made from blends of germinated pigeon pea, fermented sorghum, and cocoyam flours.
Food Science and Nutrition, 1: 8-14.

110
Okpala, L. C. & Okoli, E. C. 2014. Development of cookies made with cocoyam, fermented
sorghum and germinated pigeon pea flour blends using response surface methodology.
Journal of Food Science and Technology, 51: 2671-2677.
Olaoye, O. & Idowu, A. O. O. 2018. Quality characteristics of bread produced from composite
flours of wheat, plantain and soybeans.
Omeire, G. C. & Ohambele, F. I. 2010. Production and evaluation of biscuits from composite
wheat/defatted cashew nut flours.
Ou, B. 2002. Analysis of antioxidant activities of common vegetables employing oxygen
radical absorbance capacity (ORAC) and ferric reducing antioxidant power
(FRAP) assays: a comparative study. Journal of Agricultural and Food
Chemistry, 50: 3122–8.
Oyeyinka, A. T. & Oyeyinka, S. A. 2018. Moringa oleifera as a food fortificant: Recent trends
and prospects. Journal of the Saudi Society of Agricultural Sciences, 17: 127-136.
Ozgen, M., Reese, R. N., Tulio, A. Z., Scheerens, J. C. & Miller, A. R. 2006. Modified 2,2-
azino-bis-3-ethylbenzothiazoline-6-sulfonic acid (ABTS) method to measure antioxidant
capacity of selected small fruits and comparison to ferric reducing antioxidant
power (FRAP) and 2,2‘-diphenyl-1-picrylhydrazyl (DPPH) methods. Journal of
Agricultural and Food Chemistry, 54: 1151-1157.
Pakade, V., Cukrowska, E. & Chimuka, L. 2013a. Comparison of antioxidant activity of moringa
oleifera and selected vegetables in South Africa.
Pakade, V., Cukrowska, E. & Chimuka, L. 2013b. Comparison of antioxidant activity of moringa
oleifera and selected vegetables in South Africa. South African Journal of Science, 109:
1-5.
Panossian, A. & Wikman, G. 2008. Pharmacology of schisandra chinensis Bail.: An overview of
Russian research and uses in medicine. Journal of Ethnopharmacology, 118: 183-212.
Pasqualone, A., Bianco, A. M., Paradiso, V. M., Summo, C., Gambacorta, G., Caponio, F. &
Blanco, A. 2015. Production and characterization of functional biscuits obtained from
purple wheat. Food Chemistry, 180: 64-70.
Paul-Hsu, C. H., Nance, D. & Amagase, H. 2012. A meta-analysis of clinical improvements of
general well-being by a standardized lycium barbarum.
Prasad, A. S. 2014a. Impact of the discovery of human zinc deficiency on health. Journal of
Trace Elements in Medicine and Biology, 28: 357-363.

111
Prasad, A. S. 2014b. Zinc: An antioxidant and anti-inflammatory agent: Role of zinc in
degenerative disorders of aging. Journal of Trace Elements in Medicine and Biology, 28:
364-371.
Rahman, M. A. & Hussain, A. 2015. Anti-cancer activity and apoptosis inducing effect of
methanolic extract of cordia dichotoma against human cancer cell line. Bangladesh
Journal of Pharmacology, 10(1).
Razis, A., Fazial, A., Ibrahim, M. D. & Kntayya, S. B. 2014. Health benefits of moringa oleifera.
Asian Pacific Journal of Cancer Prevention : APJCP, 15 (20): 8571-8573.
Ramana, K. V., Reddy, A. B. M., Majeti, N. V. R. K. & Singhal, S. S. 2018. Therapeutic
potential of natural antioxidants. Oxidative Medicine and Cellular Longevity, 2018, 3.
Ranawana, V., Campbell, F., Bestwick, C., Nicol, P., Milne, L., Duthie, G. & Raikos, V. 2016.
Breads fortified with freeze-dried vegetables: Quality and nutritional attributes. Part II:
Breads not containing oil as an ingredient. Foods (Basel, Switzerland), 5: 62.
Rathnayake, H. & Navaratne, S. 2017. Utilization of moringa olifera leaves as a functional food
ingredient in bakery industry.
Raymond, W., Mairesse, J., Mohnen, P. & PALM, F. 2013. Dynamic Models of R&D,
Innovation and Productivity Panel Data Evidence for Dutch and French Manufacturing,
Cambridge, Mass, Cambridge, Mass. National Bureau of Economic Research.
Re, R., Pellegrini, N., Proteggente, A., Pannala, A., Yang, M. & Rice-Evans, C. 1999a.
Antioxidant activity applying an improved ABTS radical cation decolorization assay.
Free Radical Biology and Medicine, 26: 1231-1237.
Re, R., Pellegrini, N., Proteggente, A., Pannala, A., Yang, M. & Rive-Evans, C. 1999b.
Antioxidant activity applying a improved abts radical cation assay.
Reid, M. & Brady, E. 2012. Improving firm performance through NPD: The role of market
orientation, NPD orientation and the NPD process. Australasian Marketing Journal
(AMJ), 20: 235-241.
Richter, N., Siddhuraju, P. & Becker, K. 2003. Evaluation of nutritional quality of moringa
(moringa oleifera lam.) leaves as an alternative protein source for Nile tilapia
(Oreochromis niloticus L.).
Rivera, C. A., Ferro, C. L., Bursua, A. & GERBER, B. S. 2012. Probable interaction between
lycium barbarum (goji) and warfarin.
Rivera, G., Bocanegra-García, V. & Monge, A. 2010. Traditional plants as source of functional
foods: A review plantas tradicionales como fuente de alimentos funcionales: una revisión.
CyTA - Journal of Food, 8, 159-167.

112
Rohman, A., Riyanto, S., Yuniarti, N., Saputra, W. R., Utami, R. & Mulatsih, W. 2010.
Antioxidant activity, total phenolic, and total flavonoid of extracts and fractions of red
fruit (Pandanus conoideus lam).
Rubio, C. P., Hernández-Ruiz, J., Martinez-Subiela, S., Tvarijonaviciute, A. & Ceron, J. J. 2016.
Spectrophotometric assays for total antioxidant capacity (TAC) in dog serum: an update.
BMC veterinary research, 12: 166-166.
Saini, R. K., Sivanesan, I. & Keum, Y. S. 2016. Phytochemicals of moringa oleifera: a review of
their nutritional, therapeutic and industrial significance. 3 Biotech, 6: 203-203.
Sasidharan, S., Chen, Y., Saravanan, D., Sundram, K. M. & Latha, L. Y. 2010. Extraction,
isolation and characterization of bioactive compounds from plants' extracts. African
Journal of Traditional, Complementary, and Alternative Medicines : AJTCAM, 8: 1-10.
Scalbert, A., Andres-Lacueva, C., Arita, M., Kroon, P., Manach, C., Urpi-Sarda, M. & Wishart,
D. 2011. Databases on food phytochemicals and their health-promoting effects. Journal
of Agricultural and Food Chemistry, 59: 4331-4348.
Schmitt-Schillig, S., Schaffer, S., Weber, C. C., Eckert, G. & E müller, W. 2005. Flavonoids and
the aging brain.
Schwartz, M. K. 1975. Role of trace elements in cancer. Cancer Research, 35: 3481.
Schwarzinger, C. & Kranawetter, H. 2004. Analysis of the Active Compounds in Different Parts
of the Schisandra chinensis Plant by Means of Pyrolysis-GC/MS.
Shaikh, R., Pund, M., Dawane, A. & Iliyas, S. 2014. Evaluation of anticancer, antioxidant, and
possible anti-inflammatory properties of selected medicinal plants used in Indian
traditional medication. Journal of Traditional and Complementary Medicine, 4: 253-257.
Shakir, S. J., Nizami, Q. & Salam, M. 2007. Centella asiatica (linn.) urban: A review.
Shukla, A., Rasik, A. M., Jain, G. K., Shankar, R., Kulshrestha, D. K. & Dhawan, B. N. 1999. In
vitro and in vivo wound healing activity of asiaticoside isolated from centella asiatica.
Journal of Ethnopharmacology, 65: 1-11.
Siddhuraju, P. & Becker, K. 2003. Antioxidant properties of various solvent extracts of total
phenolic constituents from three different agroclimatic origins of drumstick tree (moringa
oleifera lam.) leaves.
Singh, G. D., Riar, C. S., Saini, C., Bawa, A. S., Sogi, D. S. & Saxena, D. C. 2011. Indian water
chestnut flour- method optimization for preparation, its physicochemical, morphological,
pasting properties and its potential in cookies preparation. LWT - Food Science and
Technology, 44: 665-672.

113
Sium, M., Kareru, P., Keriko, J., Girmay, B., Medhanie, G. & Debretsion, S. 2016. Profile of
trace elements in selected medicinal plants used for the treatment of diabetes in eritrea.
The Scientific World Journal, 2752836-2752836.
Sneha, S., Genitha, T. R. & Vrijesh, Y. 2012. Preparation and quality evaluation of flour and
biscuit from sweet potato. Journal of Food Processing and Technology, 3: 192.
Somboonwong, J., Kankaisre, M., Tantisira, B. & Tantisira, M. 2012. Wound healing activities
of different extracts of centella asiatica in incision and burn wound models: an
experimental animal study.
Sonone, V., A. Powar, D. & SURPAM, T. B. 2015. Preparation and evaluation of biscuit
supplemented with potato flour.
Speroni, E., Cervellati, R., Dall'acqua, S., Guerra, M. C., Greco, E., Govoni, P. & Innocenti, G.
2011. Gastroprotective effect and antioxidant properties of different laurus nobilis l. leaf
extracts (report). Journal of Medicinal Food, 14: 499.
Sreelatha, S. & Padma, P. R. 2009. Antioxidant activity and total phenolic content of moringa
oleifera leaves in two stages of maturity.
Starowicz, M., Zieliński, H., Ciesarova, Z., Kukurová, K. & Lamparski, G. 2015. study on
sensory quality, antioxidant properties, and maillard reaction products formation in rye-
buckwheat cakes enhanced with selected spices.
Steijns, J. M. 2001. Milk ingredients as nutraceuticals. International Journal of Dairy
Technology, 54: 81-88.
Stevenson, L., Phillips, F., O'sullivan, K. & Walton, J. 2012. Wheat bran: Its composition and
benefits to health, a European perspective. International journal of Food Sciences and
Nutrition, 63: 1001-1013.
Stohs, S. J. & Hartman, M. J. 2015. Review of the safety and efficacy of moringa oleifera.
Phytotherapy Research, 29: 796-804.
Thaipong, K., Boonprakob, U., Crosby, K., Cisneros-Zevallos, L. & Hawkins, D. B. 2006.
Comparison of ABTS, DPPH, FRAP, and ORAC assays for estimating antioxidant
activity from guava fruit extracts. Journal of Food Composition and Analysis, 19: 669-
675.
Thongram, S., Tanwar, B., Chauhan, A. & Kumar, V. 2016. Physicochemical and organoleptic
properties of cookies incorporated with legume flours. Cogent Food & Agriculture, 2:
1172389.

114
Thurber, M. D. & Fahey, J. W. 2009. Adoption of moringa oleifera to combat under-nutrition
viewed through the lens of the "Diffusion of innovations" theory. Ecology of Food and
Nutrition, 48: 212-225.
Tsang, A. H. K. & Chung, K. K. K. 2009. Oxidative and nitrosative stress in Parkinson's disease.
BBA - Molecular Basis of Disease, 1792, 643-650.
Valko, M., Leibfritz, D., Moncol, J., Cronin, M. T. D., Mazur, M. & Telser, J. 2007. Free
radicals and antioxidants in normal physiological functions and human disease. The
International Journal of Biochemistry & Cell Biology, 39: 44-84.
Vergara-Jimenez, M., Almatrafi, M. M. & Fernandez, L. M. 2017. Bioactive components in
moringa oleifera leaves protect against chronic disease. Antioxidants, 6.
Wang, C. C., Chang, S. C., Inbaraj, B. S. & Chen, B. H. 2010. Isolation of carotenoids,
flavonoids and polysaccharides from lycium barbarum L. and evaluation of antioxidant
activity. Food Chemistry, 120: 184-192.
Wang, Z., Chen, H., Zhang, W., Lan, G. & Zhang, L. 2011. Comparative studies on the chemical
composition and antioxidant activities of schisandra chinensis and schisandra
sphenanthera fruits.
Wolfe, K. L. & Liu, R. H. 2008. Structure−activity relationships of flavonoids in the cellular
antioxidant activity assay. Journal of Agricultural and Food Chemistry, 56: 8404-
8411.
Xin, G., Zhu, F., Du, B. & Xu, B. 2017. Antioxidants distribution in pulp and seeds of black and
red goji berries as affected by boiling processing.
Yahya, M. N. 2004. Physicochemical and shelf life studies on reduced fat legume-based cookies
using sago flour as a fat replacer (Msc. Thesis).
Yan, Y., Ran, L., Cao, Y., Qin, K., Zhang, X., Luo, Q., Jabbar, D. S., Abid, M. & Zeng, X. 2014.
Nutritional, phytochemical characterization and antioxidant capacity of ningxia wolfberry
(lycium barbarum l.).
Yang, J., Wang, H. P., Zhou, L. & Xu, C. F. 2012. Effect of dietary fiber on constipation: a meta
analysis. World Journal of Gastroenterology, 18: 7378-7383.
Yang, R. Y., Chang, L. C., Hsu, J. C., Weng, B. C., Palada, M., Chadha, M. & Levasseur, V.
2006a. Nutritional and functional properties of moringa leaves − from germplasm, to
plant, to food, to health.
Yang, R. Y., Tsou, S. C. S., Lee, T. C., Chang, L. C., Kuo, G. & Lai, P. Y. 2006b. Moringa, a
novel plant rich in antioxidants, bioavailable iron, and nutrients. Herbs: Challenges in
Chemistry and Biology. American Chemical Society.
115
Youssef, H., Mousa, Rasha 2012. Nutritional assessment of wheat biscuits and fortified wheat
biscuits with citrus peels powders.
Yousuf, S. T. A., Shaukat, S. F., Qasim, R. & Khawar, H. 2016. Elimination of free radicals and
immunity enhancement with 644 nm (red colour) radiation: A randomised controlled
clinical trial. CM, 07: 10-15.
Zainol, M. K., Abd-Hamid, A., Yusof, S. & Muse, R. 2003. Antioxidative activity and total
phenolic compounds of leaf, root and petiole of four accessions of centella asiatica (l.)
urban. Food Chemistry, 81: 575-581.
Zhang, L., Ravipati, A. S., Koyyalamudi, S. R., Jeong, S. C., Reddy, N., Smith, P. T., Bartlett, J.,
Shanmugam, K., Münch, G. & Wu, M. J. 2011a. Antioxidant and anti-inflammatory
activities of selected medicinal plants containing phenolic and flavonoid compounds.
Journal of Agricultural and Food Chemistry, 59: 12361-12367.
Zhang, L., Ravipati, A. S., Koyyalamudi, S. R., Jeong, S. C., Reddy, N., Smith, P. T., Bartlett, J.,
Shanmugam, K., Münch, G. & Wu, M. J. 2017. Biological activities and structural
characterisation of anticancer Herbal Polysaccharides. Journal of Agricultural and Food
Chemistry, 8(2).
Zhang, L., Ravipati, A. S., Koyyalamudi, S. R., Jeong, S. C., Reddy, N., Smith, P. T., Bartlett, J.,
Shanmugam, K., Münch, G. & Wu, M. J. 2018. Antioxidant and anti-inflammatory
activities of selected medicinal plants containing phenolic and flavonoid compounds.
Journal of Agricultural and Food Chemistry, 59.
Zhang, Z., Liu, X., Wu, T., Liu, J., Zhang, X., Yang, X., Goodheart, M. J., Engelhardt, J. F. &
Wang, Y. 2011b. Selective suppression of cervical cancer hela cells by 2-o-β-d-
glucopyranosyl-l-ascorbic acid isolated from the fruit of lycium barbarum L. Cell Biology
and Toxicology, 27: 107-121.
Zhishen, J., Mengcheng, T. & Jianming, W. 1999. The determination of flavonoid contents in
Mulberry and their scavenging effects on superoxide radicals.
Zhong, Y., Shahidi, F. & Naczk, M. 2013. Dried fruits: Phytochemicals and health effects.
Zoulias, E., Piknis, S. & Oreopoulou, V. 2000. Effect of sugar replacement by polyols and
acesulfame‐k on properties of low‐fat cookies.
116
APPENDIX

117
Appendix A1:
Tables with statistical analysis (One-Way ANOVA) of biscuits samples prepared in this research
are provided in this Appendix (Table A1.1, Table A1.2, and Table A1.3).
Appendix A2:
Concentration dependant ABTS•+ radical scavenging activity of hot water extracts of plants used
in this study are provided in this Appendix (Table A2.1, Fig A2.1, Fig A2.2, and Fig A2.3).
Appendix A3:
Concentration dependant ABTS•+ radical scavenging activity of ethanol solubles from hot water
extracts of biscuits developed in this study are provided in this Appendix (Table A3.1,Table
A3.2, Fig A3.1, Fig A3.2, Fig A3.3, Fig A3.4, Fig A3.5, Fig A3.6, and Fig A3.7).

118
A1.1: Proximate analysis of biscuit samples (One-Way ANOVA)

119
Descriptive ANOVA
M
ean
Std
. D
evia
tion
N
Std
. E
rro
r
95% Confidence
Interval for Mean
Min
imu
m
Max
imu
m
F
P V
alu
e
Res
ult
Lo
wer
Bo
und
Up
per
Bo
und
Moisture
Content
Control 4.797 0.057 3 0.033 4.656 4.937 4.73 4.84
6.370 0.002 Signific
ant
Sample
1 4.638 0.057 3 0.033 4.497 4.778 4.60 4.70
Sample
2 4.594 0.116 3 0.067 4.305 4.882 4.50 4.72
Sample
3 4.771 0.062 3 0.036 4.616 4.925 4.70 4.81
Sample
4 4.890 0.111 3 0.064 4.614 5.166 4.76 4.97
Sample
5 4.563 0.079 3 0.045 4.368 4.759 4.51 4.65
Sample
6 4.621 0.085 3 0.049 4.409 4.833 4.53 4.70
Ash content
Control 2.129 0.036 3 0.021 2.038 2.219 2.10 2.17
95.259 <0.001 Signific
ant
Sample
1 2.301 0.056 3 0.032 2.162 2.441 2.24 2.35
Sample
2 2.453 0.032 3 0.019 2.373 2.533 2.43 2.49
Sample
3 2.570 0.013 3 0.008 2.537 2.603 2.56 2.58
Sample
4 2.713 0.037 3 0.021 2.620 2.805 2.67 2.75
Sample
5 2.254 0.037 3 0.021 2.162 2.345 2.21 2.29
Sample
6 2.276 0.026 3 0.015 2.211 2.341 2.26 2.31
Protein
Content
Control 13.411 0.025 3 0.014 13.349 13.473 13.39 13.44
113.76
9 <0.001
Signific
ant
Sample
1 14.838 0.057 3 0.033 14.697 14.978 14.80 14.90
Sample
2 14.860 0.121 3 0.070 14.559 15.161 14.72 14.96
Sample
3 14.971 0.140 3 0.081 14.623 15.320 14.85 15.12
Sample
4 15.015 0.084 3 0.048 14.808 15.223 14.94 15.10
Sample
5 14.763 0.079 3 0.045 14.568 14.959 14.71 14.85
Sample
6 14.821 0.082 3 0.048 14.617 15.026 14.74 14.90
Fat Content
Control 15.186 0.106 3 0.061 14.923 15.449 15.08 15.30
0.618 > 0.006
Not
Signific
ant
Sample
1 15.582 0.455 3 0.263 14.450 16.713 15.07 15.94
Sample 15.377 0.061 3 0.035 15.226 15.528 15.31 15.43

120
A1.2: Physical analysis of biscuit samples (One-Way ANOVA)
2
Sample
3 15.312 0.280 3 0.162 14.617 16.007 14.99 15.51
Sample
4 15.139 0.096 3 0.056 14.900 15.378 15.05 15.24
Sample
5 15.254 0.501 3 0.289 14.009 16.500 14.89 15.83
Sample
6 15.326 0.392 3 0.226 14.353 16.299 14.89 15.66
Fibre content
Control 2.507 0.012 3 0.007 2.478 2.535 2.50 2.52
8505.0
63 <0.001
Signific
ant
Sample
1 3.150 0.030 3 0.017 3.075 3.225 3.12 3.17
Sample
2 3.736 0.004 3 0.003 3.725 3.747 3.73 3.74
Sample
3 4.232 0.028 3 0.016 4.162 4.302 4.20 4.25
Sample
4 4.956 0.013 3 0.007 4.925 4.987 4.94 4.97
Sample
5 2.788 0.004 3 0.002 2.778 2.798 2.78 2.79
Sample
6 2.695 0.003 3 0.002 2.687 2.704 2.69 2.70
Carbohydrate
s
Control 66.767 0.120 3 0.069 66.470 67.064 66.63 66.86
55.644 <0.001 Signific
ant
Sample
1 64.129 0.433 3 0.250 63.053 65.205 63.80 64.62
Sample
2 63.573 0.085 3 0.049 63.362 63.784 63.51 63.67
Sample
3 62.915 0.404 3 0.233 61.910 63.919 62.63 63.38
Sample
4 62.176 0.226 3 0.130 61.616 62.737 61.95 62.40
Sample
5 64.941 0.544 3 0.314 63.590 66.291 64.32 65.32
Sample
6 64.882 0.382 3 0.220 63.934 65.830 64.61 65.32
Energy
Control 457.39
0 0.603 3 0.348 455.893 458.888 456.74 457.93
25.829 <0.001 Signific
ant
Sample
1
456.10
4 2.143 3 1.237 450.780 461.429 453.70 457.81
Sample
2
452.12
9 0.407 3 0.235 451.117 453.140 451.66 452.41
Sample
3
449.35
1 1.331 3 0.768 446.045 452.657 447.82 450.25
Sample
4
445.02
1 0.304 3 0.175 444.266 445.777 444.77 445.36
Sample
5
456.10
4 2.650 3 1.530 449.520 462.689 454.19 459.13
Sample
6
456.74
5 1.892 3 1.092 452.045 461.446 454.64 458.30
Descriptive ANOVA

121
A1.3: Color analysis of biscuit samples (One-Way ANOVA)
Mean Std.
Deviation N
Std.
Error
95% Confidence
Interval for Mean Minimum Maximum F
P V
alu
e
Res
ult
Lower
Bound
Upper
Bound
Weight
(g)
Control 16.28 .25 6 .10 16.02 16.54 16.0 16.5
127.836 <0.001 Significant
Sample
1 17.19 .19 6 .08 16.99 17.39 17.0 17.5
Sample
2 19.70 .54 6 .22 19.13 20.27 19.2 20.6
Sample
3 20.45 .30 6 .12 20.13 20.77 20.0 20.9
Sample
4 20.81 .51 6 .21 20.28 21.35 20.0 21.5
Sample
5 17.53 .30 6 .12 17.22 17.84 17.2 17.9
Sample
6 18.22 .40 6 .16 17.80 18.65 17.9 18.9
Diameter Control 51.33 .50 6 .21 50.60 51.66 50.5 51.8
4.326 0.002 Significant
Sample
1 51.39 .35 6 .14 50.96 51.69 50.9 51.9
Sample
2 51.48 .30 6 .12 51.16 51.80 51.0 51.8
Sample
3 51.78 .43 6 .18 51.33 52.24 51.2 52.4
Sample
4 52.23 .47 6 .19 51.74 52.72 51.4 52.7
Sample
5 51.35 .30 6 .12 51.44 52.07 51.4 52.2
Sample
6 51.46 .57 6 .23 51.20 52.39 51.3 52.8
Thickness Control 6.54 .26 6 .11 6.26 6.81 6.3 6.9
3.904 0.004 Significant
Sample
1 6.50 .25 6 .10 6.33 6.86 6.4 7.1
Sample
2 6.37 .23 6 .09 6.12 6.61 6.1 6.7
Sample
3 6.26 .27 6 .11 5.97 6.54 5.9 6.7
Sample
4 6.25 .31 6 .13 6.02 6.68 5.9 6.7
Sample
5 6.10 .24 6 .10 5.85 6.35 5.7 6.4
Sample
6 6.05 .19 6 .08 5.85 6.25 5.9 6.4
Bake loss Control 21.00 .87 6 .35 20.09 21.91 20.1 22.0
54.948 <0.001 Significant
Sample
1 19.82 .69 6 .28 19.10 20.55 19.1 20.9
Sample
2 18.45 .68 6 .28 17.74 19.16 17.6 19.4
Sample
3 16.74 .62 6 .25 16.09 17.40 16.1 17.5
Sample
4 15.19 .45 6 .18 14.72 15.67 14.4 15.6
Sample
5 18.88 .42 6 .17 18.43 19.32 18.3 19.3

122
Descriptive ANOVA
Mean Std.
Deviation N
Std.
Error
95% Confidence
Interval for Mean Minimum Maximum F
P V
alu
e
Res
ult
Lower
Bound
Upper
Bound
Color
Value
L*
Control 63.145 0.563 6 .230 62.554 63.736 62.50 63.99
10.726 <0.001 Significant
Sample
1 61.755 2.344 6 .957 59.296 64.214 59.00 65.60
Sample
2 62.390 1.352 6 .552 60.971 63.809 59.84 63.91
Sample
3 60.823 0.728 6 .297 60.059 61.588 60.04 61.90
Sample
4 63.358 0.994 6 .406 62.315 64.401 62.07 65.01
Sample
5 59.543 0.441 6 .180 59.081 60.006 59.02 60.14
Sample
6 59.563 0.688 6 .281 58.841 60.286 58.65 60.53
Color
Value
a*
Control 6.565 0.348 6 .142 6.199 6.931 6.03 6.91
19.878 <0.001 Significant
Sample
1 6.495 0.310 6 .126 6.170 6.820 6.17 6.93
Sample
2 7.105 0.829 6 .339 6.235 7.975 5.49 7.77
Sample
3 7.583 0.443 6 .181 7.118 8.048 7.09 8.35
Sample
4 7.772 0.437 6 .178 7.313 8.230 7.29 8.42
Sample
5 8.318 0.168 6 .069 8.142 8.495 8.11 8.53
Sample
6 8.558 0.236 6 .097 8.310 8.806 8.18 8.79
Color
Value
b*
Control 25.903 1.666 6 .680 24.155 27.651 22.64 27.27
37.868 <0.0010 Significant
Sample
1 26.347 0.589 6 .241 25.728 26.965 25.43 27.04
Sample
2 27.467 0.994 6 .406 26.423 28.510 25.71 28.70
Sample
3 28.792 0.568 6 .232 28.196 29.388 28.15 29.62
Sample
4 33.322 1.346 6 .549 31.909 34.734 30.76 34.33
Sample
5 30.125 0.824 6 .336 29.260 30.990 29.32 31.63
Sample
6 29.960 0.648 6 .264 29.280 30.640 29.17 30.93

123
A2.1: ABTS•+ free radical scavenging activity of hot water extracts of plants used in this
study in terms of ascorbate equivalence.
No. Concentrations
(mg/mL)
Scavenging
activities of
Moringa
(Ascorbate
equivalence
μM)*
Scavenging
activities of
Gotu Kola
(Ascorbate
equivalence
μM)*
Scavenging
activities of
Schisandra
Berry
(Ascorbate
equivalence
μM)*
Scavenging
activities of
Goji Berry
(Ascorbate
equivalence
μM)
1 1000 822.62± 1.65 844.05± 2.97 860.24± 1.65 846.90± 1.65
2 500 705.00± 2.47 724.05± 2.18 749.76± 1.65 747.38± 1.65
3 250 544.04± 2.97 598.80± 2.97 639.28± 2.86 608.80± 2.97
4 125 453.57± 2.86 480.24± 2.97 531.19± 2.97 491.19± 1.65
5 62.5 322.14± 2.47 354.05± 2.18 375.47± 2.97 364.51± 2.47
6 31.25 167.86± 2.37 183.57± 2.86 206.90± 2.18 197.38± 2.97
7 15.63 47.85± 2.47 55.95± 1.65 93.09± 3.3 68.33± 2.97
8 7.81 31.19± 2.18 28.81± 2.18 70.38± 3.6 32.14± 2.86
*ABTS•+ free radical scavenging activities are expressed as ascorbic acid equivalent (µM) at
1mg/mL of plant extracts
&All values are expressed as mean ± SD, n=3 (p< 0.005)

124
Fig A2.1: ABTS•+ free radical scavenging activity of hot water extracts of Moringa leaf
used in this study in terms of ascorbate equivalence
Fig2.2: ABTS•+ free radical scavenging activity of hot water extracts of Gotu kola leaf used
in this study in terms of ascorbate equivalence
0
100
200
300
400
500
600
700
800
900
0 100 200 300 400 500 600 700 800 900 1000
Sca
ven
gin
g a
ctiv
ity (
Asc
orb
ate
equ
iale
nt
μM
)
Concentartion µg/mL
Moringa Leaf
0
100
200
300
400
500
600
700
800
900
0 100 200 300 400 500 600 700 800 900 1000
Sca
ven
gin
g a
ctiv
ity (
Asc
orb
ate
equ
iale
nt
μM
)
Concentartion µg/mL
Gotu Kola Leaf

125
FigA2.3: ABTS•+ free radical scavenging activity of hot water extracts of Schisandra berry
used in this study in terms of ascorbate equivalence
FigA2.4: ABTS•+ free radical scavenging activity of hot water extracts of Goji berry used in
this study in terms of ascorbate equivalence.
0
100
200
300
400
500
600
700
800
900
1000
0 100 200 300 400 500 600 700 800 900 1000
Sca
ven
gin
g a
ctiv
ity
(Asc
orb
ate
eq
uia
len
t μ
M)
Concentartion µg/mL
Schisandra Berry
0
100
200
300
400
500
600
700
800
900
0 100 200 300 400 500 600 700 800 900 1000
Sca
ven
gin
g a
ctiv
ity (
Asc
orb
ate
equ
iale
nt
μM
)
Concentartion µg/mL
Goji Berry
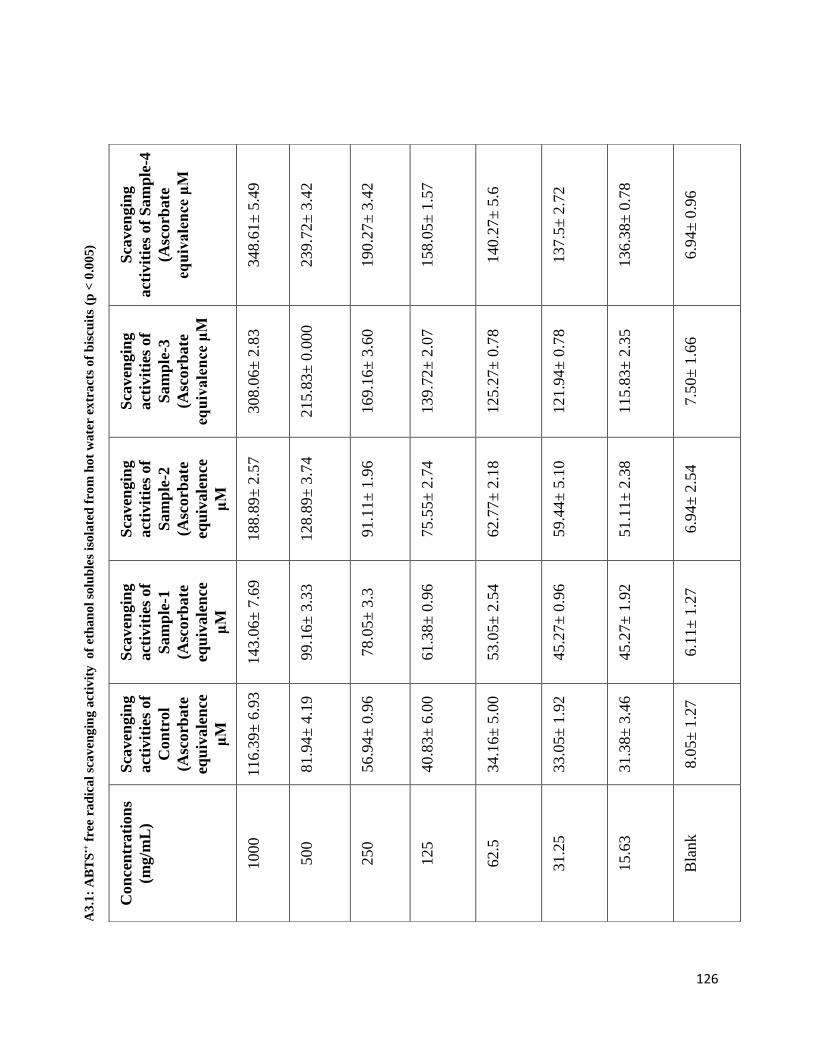
126
A3
.1:
AB
TS
•+ f
ree
rad
ica
l sc
av
eng
ing
act
ivit
y
of
eth
an
ol
solu
ble
s is
ola
ted
fro
m h
ot
wa
ter e
xtr
act
s o
f b
iscu
its
(p <
0.0
05)
Sca
ven
gin
g
act
ivit
ies
of
Sam
ple
-4
(Asc
orb
ate
equ
ivale
nce
μM
348.6
1±
5.4
9
239.7
2±
3.4
2
190.2
7±
3.4
2
158.0
5±
1.5
7
140.2
7±
5.6
137.5
± 2
.72
136.3
8±
0.7
8
6.9
4±
0.9
6
Sca
ven
gin
g
act
ivit
ies
of
Sam
ple
-3
(Asc
orb
ate
equ
ivale
nce
μM
308.0
6±
2.8
3
215.8
3±
0.0
00
169.1
6±
3.6
0
139.7
2±
2.0
7
125.2
7±
0.7
8
121.9
4±
0.7
8
115.8
3±
2.3
5
7.5
0±
1.6
6
Sca
ven
gin
g
act
ivit
ies
of
Sam
ple
-2
(Asc
orb
ate
equ
ivale
nce
μM
188.8
9±
2.5
7
128.8
9±
3.7
4
91.1
1±
1.9
6
75.5
5±
2.7
4
62.7
7±
2.1
8
59.4
4±
5.1
0
51.1
1±
2.3
8
6.9
4±
2.5
4
Sca
ven
gin
g
act
ivit
ies
of
Sam
ple
-1
(Asc
orb
ate
equ
ivale
nce
μM
143.0
6±
7.6
9
99.1
6±
3.3
3
78.0
5±
3.3
61.3
8±
0.9
6
53.0
5±
2.5
4
45.2
7±
0.9
6
45.2
7±
1.9
2
6.1
1±
1.2
7
Sca
ven
gin
g
act
ivit
ies
of
Con
trol
(Asc
orb
ate
equ
ivale
nce
μM
116.3
9±
6.9
3
81.9
4±
4.1
9
56.9
4±
0.9
6
40.8
3±
6.0
0
34.1
6±
5.0
0
33.0
5±
1.9
2
31.3
8±
3.4
6
8.0
5±
1.2
7
Con
cen
trati
on
s
(mg/m
L)
1000
500
250
125
62.5
31.2
5
15.6
3
Bla
nk

127
A3.2: ABTS•+ free radical scavenging activity of ethanol solubles isolated from
hot water extracts of biscuits
Concentrations
(mg/mL)
Scavenging
activities of
Control
(Ascorbate
equivalence μM)
Scavenging
activities of
Sample-5
(Ascorbate
equivalence
μM)
Scavenging
activities of
Sample-6
(Ascorbate
equivalence
μM)
1000 116.39± 6.93 134.17± 2.88 141.39± 3.33
500 81.94± 4.19 90.27± 7.87 96.94± 3.34
250 56.94± 0.96 70.27± 2.54 75.27± 4.19
125 40.83± 6.00 47.5± 3.33 54.72± 3.84
62.5 34.16± 5.00 30.83± 4.40 37.5± 3.30
31.25 33.05± 1.92 24.16± 1.66 25.27± 0.96
15.63 31.38± 3.46 18.0± 2.54 22.5± 1.66
Blank 8.05± 1.27 7.50± 1.66 6.94± 0.96
*ABTS•+ free radical scavenging activities are expressed as ascorbic acid equivalent
(µM) at 1mg/mL of ethanol solubles isolated from hot water biscuit extracts
&All values are expressed as mean ± SD, n=3 (p< 0.005)
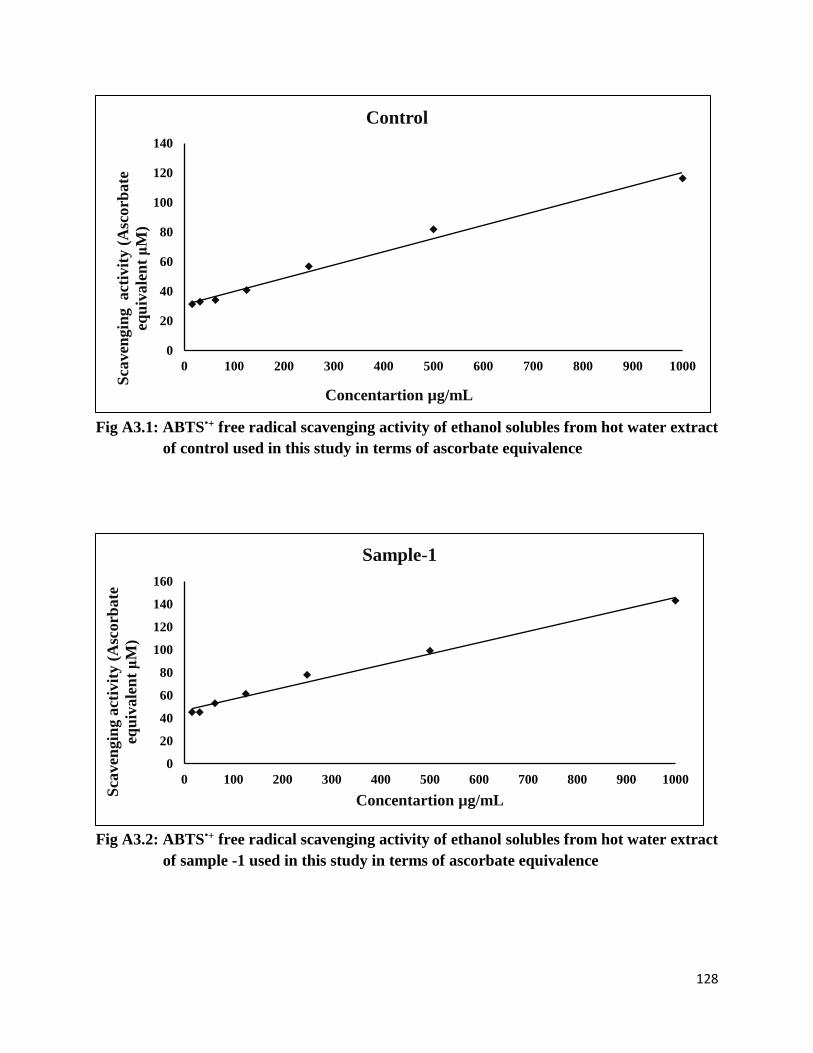
128
Fig A3.1: ABTS•+ free radical scavenging activity of ethanol solubles from hot water extract
of control used in this study in terms of ascorbate equivalence
Fig A3.2: ABTS•+ free radical scavenging activity of ethanol solubles from hot water extract
of sample -1 used in this study in terms of ascorbate equivalence
0
20
40
60
80
100
120
140
0 100 200 300 400 500 600 700 800 900 1000
Sca
ven
gin
g a
ctiv
ity
(A
sco
rba
te
equ
ivale
nt
μM
)
Concentartion µg/mL
Control
0
20
40
60
80
100
120
140
160
0 100 200 300 400 500 600 700 800 900 1000
Sca
ven
gin
g a
ctiv
ity (
Asc
orb
ate
equ
ivale
nt
μM
)
Concentartion µg/mL
Sample-1

129
Fig A3.3: ABTS•+ free radical scavenging activity of ethanol solubles from hot water extract
of sample - 2 used in this study in terms of ascorbate equivalence
Fig A3.4: ABTS•+ free radical scavenging activity of ethanol solubles from hot water extract
of sample - 3 used in this study in terms of ascorbate equivalence
0
50
100
150
200
250
0 100 200 300 400 500 600 700 800 900 1000Sca
ven
gin
g a
ctiv
itiy
(A
scorb
ate
equ
ivale
nt
μM
)
Concentartion µg/mL
Sample-2
0
50
100
150
200
250
300
350
0 100 200 300 400 500 600 700 800 900 1000
Sca
ven
gin
g a
ctiv
ity (
Asc
orb
ate
equ
ivale
nt
μM
)
Concentartion µg/mL
Sample - 3

130
Fig A3.5: ABTS•+ free radical scavenging activity of ethanol solubles from hot water extract
of sample – 4 used in this study in terms of ascorbate equivalence.
Fig A3.6: ABTS•+ free radical scavenging activity of ethanol solubles from hot water extract
of sample – 5 used in this study in terms of ascorbate equivalence.
0
50
100
150
200
250
300
350
400
0 100 200 300 400 500 600 700 800 900 1000
Sca
ven
gin
g a
ctiv
ity (
Asc
orb
ate
equ
ivale
nt
μM
)
Concentartion µg/mL
Sample-4
0
20
40
60
80
100
120
140
160
0 200 400 600 800 1000 1200
Sca
ven
gin
g a
ctiv
ity (
Asc
orb
ate
equ
ivale
nt
μM
)
Concentartion µg/mL
Sample-5

131
Fig A3.7: ABTS•+ free radical scavenging activity of ethanol solubles from hot water extract
of sample – 6 used in this study in terms of ascorbate equivalence.
0
20
40
60
80
100
120
140
160
0 200 400 600 800 1000 1200Sca
ven
gin
g a
ctiv
ity (
Asc
orb
ate
equ
iva
len
t μ
M)
Concentartion µg/mL
Sample-6