
Development and Evaluation of Let's Eat Smart: a Pilot School
156
University of Mississippi University of Mississippi eGrove eGrove Electronic Theses and Dissertations Graduate School 2011 Development and Evaluation of Let's Eat Smart: a Pilot School- Development and Evaluation of Let's Eat Smart: a Pilot School- Based Nutrition Intervention for Elementry School Children in Based Nutrition Intervention for Elementry School Children in Kuwait Kuwait Sondos Ahmad Kalendar Follow this and additional works at: https://egrove.olemiss.edu/etd Part of the Nutrition Commons Recommended Citation Recommended Citation Kalendar, Sondos Ahmad, "Development and Evaluation of Let's Eat Smart: a Pilot School-Based Nutrition Intervention for Elementry School Children in Kuwait" (2011). Electronic Theses and Dissertations. 160. https://egrove.olemiss.edu/etd/160 This Dissertation is brought to you for free and open access by the Graduate School at eGrove. It has been accepted for inclusion in Electronic Theses and Dissertations by an authorized administrator of eGrove. For more information, please contact [email protected].
-
Upload
khangminh22 -
Category
Documents
-
view
2 -
download
0
Transcript of Development and Evaluation of Let's Eat Smart: a Pilot School

University of Mississippi University of Mississippi
eGrove eGrove
Electronic Theses and Dissertations Graduate School
2011
Development and Evaluation of Let's Eat Smart: a Pilot School-Development and Evaluation of Let's Eat Smart: a Pilot School-
Based Nutrition Intervention for Elementry School Children in Based Nutrition Intervention for Elementry School Children in
Kuwait Kuwait
Sondos Ahmad Kalendar
Follow this and additional works at: https://egrove.olemiss.edu/etd
Part of the Nutrition Commons
Recommended Citation Recommended Citation Kalendar, Sondos Ahmad, "Development and Evaluation of Let's Eat Smart: a Pilot School-Based Nutrition Intervention for Elementry School Children in Kuwait" (2011). Electronic Theses and Dissertations. 160. https://egrove.olemiss.edu/etd/160
This Dissertation is brought to you for free and open access by the Graduate School at eGrove. It has been accepted for inclusion in Electronic Theses and Dissertations by an authorized administrator of eGrove. For more information, please contact [email protected].

DEVELOPMENT AND EVALUATION OF LET‘S EAT SMART: A PILOT SCHOOL-
BASED NUTRITION INTERVENTION FOR ELEMENTRY SCHOOL CHILDREN IN
KUWAIT
A Thesis
presented in partial fulfillment of requirements
for the degree of Master of Science
in the Department of Nutrition and Hospitality Management
The University of Mississippi
by
SONDOS A. KALENDAR
July 2011

Copyright © Sondos A. Kalendar 2011
ALL RIGHTS RESERVED

ii
ABSTRACT
Due to nutrition transition, the prevalence of childhood obesity is increasing significantly
worldwide especially in affluent developing countries such as Kuwait. Obesity is associated with
adverse chronic health conditions and financial burdens which provides an incentive for
prevention. The objective of the study was to examine the effectiveness of a multi-component
school-based nutrition intervention designed to improve healthy eating knowledge, attitudes, self
efficacy and dietary behaviors among fourth and fifth graders in Kuwait. The Let‘s Eat Smart
program was based on the social cognitive theory and used short interactive lessons, DVD
sessions, posters, food models and parental letters to promote a healthy lifestyle message among
fourth and fifth graders. Let‘s Eat Smart was delivered to 110 students in the English Playgroup
and Primary School. Surveys and 3-day food-records were collected on pre- and post-
intervention. Surveys assessed nutrition knowledge, attitudes, dietary behaviors and self efficacy
while diet records were analyzed to examined intake of food groups. Additionally, program
evolutions were collected on post-intervention. A paired t-test was used to analyze the change
from pre- to post-intervention. Eighty four students completed all requirements of the program
and were included in the quantitative analysis, while 95 students were included in the qualitative
analysis of the program evaluation. After the intervention, students reported high levels of
knowledge (p < .0001), positive attitude toward a healthy lifestyle (p < .04) and higher levels of
self efficacy toward healthy eating (p < .01). There was no significant change in dietary practices
assessed in the survey except for fast food consumption where there was a significant decrease in
consumption after the intervention (p < .001). Diet-records analysis showed a significant increase

iii
in fruits intake (p < .02) and vegetables intake (p < .001) after the intervention. The overall
students‘ evaluation of the program was positive as 90.5% were satisfied and would like to have
more nutrition lessons. Due to its apparent impact on children, Let‘s Eat Smart is an effective
school-based intervention approach to address prevention of childhood obesity in Kuwaiti
schools.

iv
DEDICATION
This thesis is dedicated to my beloved husband Youssif al-Hassan and my precious
daughters Nada and Fatima. Without their motivation and tolerance, this project would never
have been completed. Your love carried me through.

v
ACKNOWLEDGMENTS
I would like to express my appreciation and gratitude to my advisor, Dr. Kathy B.
Knight, for her support and guidance throughout this process. This thesis would not have been
written without her wonderful support and assistance. I would also like to sincerely thank my
committee members, Dr. Anne Bomba and Dr. Melinda Valliant, for their thoughtful input and
valuable assistance along the way. Thank you so very much for honoring me with your time and
skills. I dedicate a special thanks to Dr. Yunhee Chang for her valuable guidance in the statistical
analysis. In addition, I would like to thank the English Playgroup and Primary School principal
and teachers who facilitated and aided in the data collection process. Thank you to the children
and their parents as this research would not have been possible without you allowing your
children to participate in this project.
I would like to express heartfelt thanks to my beloved parents, Dr. Ahmad Kalendar and
Hind Al-Mulla, who have provided unconditional support and constant encouragement
throughout the years. I am eternally grateful for you unwavering love and care. Thank you from
the bottom of my heart for always believing in me. I hope I can be as much of an inspiration to
my children as they have been to me. May Allah bless you always; you have been the biggest
blessing in my life.
Lastly, I am grateful for my dear husband Youssif al-Hassan for the unlimited support he
provided for me while obtaining my degree. I am deeply obliged for your genuine love, wisdom
and patience. I will never forget how you have helped me survive this process. You are the only
person that I can rely on and I thank you for always being there for me when I needed you.

vi
TABLE OF CONTENTS
ABSTRACT ……………………………………………………………………………………...ii
DEDICATION……………………………………………………….…………………………...iv
ACKNOWLEDGMENTS…………………………………………………………………….......v
LIST OF TABLES………………………………………………………………………………..ix
LIST OF FIGURES…………………………………………………………………………….....x
CHAPTER I: Introduction……......………………………………………………..……...…...….1
Research Question………………………………………………………….………………...3
Hypothesis…………………………………………………………….…….………….…….3
Specific Aims……………………………………………………………….…….…….….....4
CHAPTER II: Review of Literature…………………………………………….……….…..……5
Definition of Childhood Obesity……………………………………….…….……………....5
Prevalence of Childhood Obesity Worldwide………………………….….……….….…......7
Childhood obesity in Kuwait………………………………………………………...…9
Contributors of Childhood Obesity………………………………….……………………...10
Contributors of childhood obesity in Kuwait……………………….…………….…...11
Consequences of Childhood Obesity………………………………………………………..13
Gap in the Literature…………………………………………………………………………15
Prevention…………………………………………………………………………………...16
Promoting healthy lifestyle and healthy eating…………………………….……….....16
Intervention at an early age…………………………………………………………….19

vii
Consideration of parental influence…………………………………………………...20
School-Based Intervention………………………………………………………………….22
Social Cognitive Theory……………………………………………………………….23
Schools in the Arabian Gulf Region…………………………………………………...27
Practicality of school-based interventions……………………………………….……29
Related studies from the developed world……………………….…….…………...….31
Validity of food records…………………………………………….…………………..37
CHAPTER III: Methods…………………………………………………………………………39
Study Design………………………………………………………………………………...39
Recruitment and Participants………………………………………………………………..39
Theoretical Framework Applied to Let‘s Eat Smart………………………………………..42
Curriculum Lessons……………………………………………………………………...…44
Supportive Educational Materials & Incentives……………………………….…………...48
Instrumentation……………………………………………………………………………..49
Survey…………………………………………………………………………………..49
Food records………………………………………………………………………...….50
Program evaluation……………………………………………………………………..51
Data Analysis………………………………………………………………………………...52
Quantitative analysis……………………………………………………………………53
Qualitative analysis……………………………………………………………………..55
CHAPTER IV: Results…………………………………………………………………………..56
viii
Subjects Characteristics……………………………………………………………………..56
Quantitative Data (Survey)………………………………………………………………….57
Reliability analysis……………………………………………………………………..57
Nutrition knowledge……………………………………………………………………58
Attitude…………………………………………………………………………………62
Dietary practices………………………………………………………………………..64
Self efficacy………………………………………………………………………....….65
Quantitative Data (Food Record)…………………………………………………...…….…65
MyPyramid food group servings……………………………………………....……….65
Breakfast intake………………………………………………………………………...67
Qualitative Data (Program Evaluation)……………………………………………………..68
Comprehension and awareness……………………………………………….……..…68
Practicality and usability……………………………………………………….……....69
Relevance and interest…………………………………………………………....…….70
Overall Impact………………………………………………………………………….70
CHAPTER V: Discussion……………………………………………………………………….71
Recommendations and Significance…………………………………………….……….....79
Conclusion………………………………………………………………………….……….81
LIST OF REFERENCE………………………………………………………………………….82
LIST OF APPENDICES……………………………….……………………………………...…96
VITA…………………………………………………….………………………………….…..144

ix
LIST OF TABLES
1. Lesson Plan of the Let‘s Eat Smart Intervention…………………………………..…..…….45
2. Themes Tested During Group Evaluation Session……………………………….………….52
3. Survey Sections‘ Response Scales and Sample Questions…………………………………..54
4. Participants‘ Demographic Characteristics…………………………………………………..56
5. Internal Reliability (Cronbach‘s α) for: Nutrition Knowledge scale, Attitude toward Healthy
Lifestyle scale and Self Efficacy Scale………………………………………………………58
6. Percent Change in Correct Responses for Nutrition Knowledge Items……………..……….60
7. Analysis of Nutrition Knowledge Items as: Pre & Post Correct responses, Pre & Post
Incorrect Responses, Improved Responses and Diminished Responses……..……………...61
8. Participant‘s Responses on Attitude Questions……………………………………………..63
9. Means of Dietary practice Questions at Pretest and Posttest………………………………..65
10. Comparison of Food Groups Intake from Pretest to Posttest…………………………...…..66
11. Breakfast Intake as Reported in the 3-Day Food Records…………………………………..67
12. Application of Theory Constructs in the Let‘s Eat Smart Program…………………..……109
13. Lessons for Let‘s Eat Smart Program……………………………………………….……..112
14. Participant‘s Responses on Dietary Practices Questions………………………….……….139
15. Students‘ Comments in Regard to Comprehension and Awareness……………….………141
16. Students‘ Comments in Regard to Practicality and Usability……………………..….……142
17. Students‘ Comments in Regard to Relevance and Interest………….…………………..…143
18. Students‘ Comments in Regard to the Overall Impact……………….……………….…...143

x
LIST OF FIGURES
1. Reciprocal Determinism Concept in Social Cognitive Theory…………………………...…25
2. The Difference between Self Efficacy and Outcome Expectations…………………....…....26
3. Study Design and Recruitment Process……………………………………………………..41
4. Flow of changes in sample size through each stage of the study………………………..…..42
5. Reciprocal Determinism concept of SCT applied to Let‘s Eat Smart Program Design….….43
6. Comparison of percentages of correct responses for each nutrition knowledge question
between pretest & posttest…………………………………………………………………...59
7. Evaluation of: improved test scores, correct test scores at pre & post and incorrect test scores
at pre & post for each nutrition knowledge questions……………………………………….62
8. Comparison of attitude questions responses from pretest to posttest………………………..64
9. Comparison of food groups servings in pretest and posttest to MyPyramid
Recommendations……………………………………………………………………………67
10. Breakfast intake according to the 3-day food records……………………………………….68
11. Location of Kuwait on the world map……………………………………………………….99
12. Location of Kuwait and the Arab Gulf countries in the Middle East region…………….…..99

1
CHAPTER I
Introduction
The literature indicates that lifelong eating habits are shaped by early childhood and the
social environment in which the child is fed (Nicklas & Johnson, 2004). Since dietary
preferences start during childhood years, establishing healthy habits early will decrease the
chance of becoming overweight or obese in adulthood (Davis et al., 2007; Veugelers &
Fitzgerald, 2005a). Childhood obesity is a worldwide problem and a major public health concern.
There is a great need for prevention strategies to tackle the problem of childhood obesity as it has
reached epidemic proportions in many countries. A report by the World Health Organization on
population-based prevention strategies for childhood obesity estimated that 43 million children
under the age of five will become overweight by the end of 2010, with 35 million of them in
developing countries (World Health Organization [WHO], 2010).
In the Middle East, the prevalence of childhood obesity has become exceptionally high
especially among the affluent populations in the Arab Gulf Region (Al-Sendi, Shetty, &
Musaiger, 2003; El-Hazmi & Warsy, 2002). Childhood obesity is a serious contributor to chronic
disease and will grow to be a serious healthcare burden particularly in countries with a larger
percentage of children in the population. Kuwait, one of the Arabian Gulf countries, has 25.8%
of its population under the age of 15 (Central Intelligence Agency [CIA], 2011).

2
With the prevalence of childhood obesity increasing worldwide, a considerable amount of
research has investigated the effectiveness of school-based nutrition intervention programs.
Schools are consistently recognized as a logical place for health promotion and education
(Center of Disease Control & Prevention [CDC], 1996; Stallings, Yaktine, & Institute of
Medicine, 2007). The American Dietetic Association acknowledges the responsibility of dietetic
professionals to develop empirical methods to begin prevention of chronic disease early in life
(Nicklas & Johnson, 2004).
Helping children in Kuwait to understand why their small bodies need nutritious food can
be challenging. It cannot be assumed they would understand why making healthy food choices
matters. In order for the young population to conceptualize the message of making healthy food
choices to eventually develop healthy eating habits, it is important to use an effective multi-
component intervention that specifically addresses the needs of Kuwaiti children. According to
Bergman (2010) an effective nutrition education program must: focus on specific behaviors,
grasp the interest of the audience and motivate them, permit enough time to attain positive
outcomes, develop and deliver a structured sequential curriculum and address the child‘s
environment, not only at school but also at home. Ideally, a multi-component school-based
intervention program, for elementary school students, that is theory-based can be very
resourceful. Developing a theory-based school intervention that incorporates nutrition education,
physical and social environments development, and a parental involvement would be the most
appropriate path in teaching children how to maintain healthy habits throughout their lives
(McArthur, 1998; Hyner, 2005; Ritchie, Crawford, Hoelscher & Sothern, 2006).
In 2005, The Center for Nutrition Policy and Promotion, an organization of the U.S.
Department of Agriculture, released the MyPyramid Food Guidance System for children

3
focusing on promoting a healthy lifestyle and advancing and promoting healthy dietary
guidelines (United State Department of Agriculture [USDA], 2011). MyPyramid is a food guide
pyramid that is widely recognized as a tool for nutrition education in United States. Other
countries have adopted similar guidelines to educate the public. Under the supervision of the
Ministry of Health in Kuwait, the Nutrition Education Department has developed and utilized
nutrition education materials for children that are mainly based on the MyPyramid (Kuwait
National Programme for the Prevention of Obesity, 2010). Even with the use of these education
materials during sporadic lectures and talks in Kuwaiti schools, there has been no scientific study
completed on the effectiveness of teaching concepts from MyPyramid in elementary schools.
Thus, the purpose of this study was to develop and evaluate a multi-component school-based
nutrition intervention program (i.e., Let‘s Eat Smart) based on the Social Cognitive Theory
(SCT). The intervention principally consists of interactive lessons that primarily utilize
MyPyramid resources. The program intend to: increase nutrition knowledge, improve attitude
and self efficacy toward healthy eating and enhance dietary behaviors among Kuwaiti
elementary school children.
Research Question
Would a school-based nutrition education program for fourth and fifth graders in Kuwait, be
effective in increasing healthy eating knowledge and promoting healthy dietary behaviors?
Hypothesis
A multi-component school-based nutrition intervention would improve healthy eating
knowledge, attitudes, self efficacy and dietary behaviors of fourth and fifth graders in Kuwait.

4
Specific Aims
A. The different intervention components (curriculum, class activities, home sent letters, posters
and DVD session) will be evaluated for practicality and effectiveness.
B. Students in this intervention will:
1. Increase their nutritional knowledge in four topic areas: Energy Balance, My
Pyramid, portion size and healthy snacking.
2. Report more positive attitude toward healthy eating lifestyle.
3. Increase their self efficacy toward healthy eating.
4. Enhance their dietary practices.
5. Enhance their dietary intake of food groups represented in MyPyramid.

5
CHAPTER II
Review of Literature
Definition of Childhood Obesity
Because childhood is a critical period when the human body is in a dynamic growth state,
it is difficult to determine clear cut-offs for defining obesity and overweight in children. Even
though there is no specific international definition for childhood obesity, throughout this paper
the term ―childhood obesity‖ is used to explain a condition of having excess body weight
associated with immediate or later in life chronic diseases. In the United States, the terms ―at risk
of overweight‖ and ―overweight‖ are preferred when referring to children with excess body
weight and medical risks (Centers for Disease Control and Prevention [CDC], 2009).
In children overweight and obesity can be assessed using measurements that reflect body
weight or body composition. Body Mass Index percentiles (BMI percentiles) are a commonly
used measure for determining overweight and obesity in children. BMI is a measure of a child‘s
weight and height (i.e., weight in kilograms divided by the square of height in meters). The BMI
percentiles are age and gender specific due to the fact that body compositions changes with
growth and growth rates differ between boys and girls (CDC, 2009). BMI is a measure of excess
body weight rather than excess body adiposity, but it is considered a moderately sensitive and
specific indicator of excess adiposity in children (Freedman & Sherry, 2009). This is because
usually children above certain weight-for-height cutoffs are characterized as having both: excess
body adiposity and excess body weight (Kuczmarski & Flegal, 2000).

6
The Centers for Disease Control (CDC) has defined overweight as at or above the 95th
percentile of BMI for age and defines being at risk for overweight as between 85th to 95th
percentile of BMI for age (Kuczmarski et al., 2002). Researchers in European countries have
classified childhood overweight as being at or above 85th percentile and childhood obesity as
being at or above 95th percentile of BMI for age (Flodmark, Lissau, Moreno, Pietrobelli, &
Widhalm, 2004). International Obesity Taskforce (IOTF) gave overweight and obesity in
childhood an international definition by relating growth charts and cut-off points to the WHO‘s
adult BMI criteria (Cole, Bellizzi, Flegal, & Dietz, 2000). The new definition was based on
pooled international data from several countries. According to Cole et al. (2000) BMI cut-off
points for overweight and obesity in children aged 2-18 years are gender specific and defined to
pass through body mass index of 25 and 30 kg/m2 at age 18. The rationale behind the IOTF cut-
off points‘ development is to perform a valid international comparison of data in regard to
obesity prevalence worldwide rather than to be used in a clinical setting.
Measurement of body weight is not reflective of body composition. Excess weight in
some children who have bigger stature or have an athletic body might be explained by having
excess lean body mass rather than excess body fat (McArdle, Katch & Katch, 2010).
Measurement of body fatness and composition is more reflective and predictive of chronic
diseases associated with obesity. In a study by Williams et al. (1992) that examined the skin fold
thickness for 3320 children aged 5-18 years, children were classified as fat if their body fat
percents were at least 25% for girls and 30% for boys. Unlike the well defined BMI percentile
cut-off points, which measures excess body weight, there is no agreement in the literature on cut-
off points for excess body fatness when examining overweight or obesity in children.

7
Prevalence of Childhood Obesity Worldwide
Many industrialized countries such as the United States recognize childhood obesity as a
national problem. According to the National Center for Health Statistics (2009) the prevalence of
obesity among children 6-11 years old in United States increased from 6.5% in 1980 to 17% in
2007. In the literature, there has been considerable evidence, mostly from industrialized
countries, that childhood obesity has become a major public health problem that needs to be
addressed through preventative interventions (Ebbeling, Pawlak & Ludwig, 2002).
Although, the increase in childhood obesity has become a worldwide phenomenon
including both industrialized nations and developing nations, the greater increase has been in
economically developed and urbanized populations (de Onis & Blossner, 2000; Wang &
Lobstein, 2006). Lobstein, Baur, & Uauy (2004) evaluated obesity in children for the
International Obesity Taskforce and estimated the prevalence of overweight and obesity among
school-age children worldwide to be approximately 10%. Specifically, for different regions of
the world, the highest prevalence of childhood obesity was in the Americas (32%), Europe (20%)
and the Middle East (17%) respectively. This calls for the need of effectual international,
regional and local interventions to deal with the childhood obesity problem.
Kuwait is considered one of the Arab Gulf developing countries in the Middle East
region. According to the CIA (2011b), the Middle East region is defined by 19 countries and the
State of Kuwait is one of them. The location of Kuwait on the world map in regard to the Middle
East region is presented in Figure 10 in Appendix A. In a systemic review of the literature from
1950-2007 on childhood obesity in developing countries, Kelishadi (2007), established that the
highest prevalence of childhood obesity was found in Eastern Europe and the Middle East
(Kelishadi, 2007). The obesity levels in preschool children in some countries of the Middle East

8
(i.e., especially the affluent countries in the Arab Gulf area of the Middle East) are as high as the
numbers found in United States (Martorell, Khan, Hughes, & Grummer-Strawn, 2000).
The Arabian Gulf countries; Kuwait, Kingdom of Saudi Arabia (KSA), Bahrain, Qatar,
United Arab Emirates (UAE) and Oman, all characteristically face the problem of childhood
obesity due to the lifestyle change upon oil discovery in the area in the last decades (Figure 11 in
Appendix A). The problem of obesity in the Arab Gulf Region of the Middle East became a
major public health concern starting two decades ago (Al-Awadi, Rahman, & Thomas, 1990;
Musaiger, 1978).
Studies in UAE showed high proportions of obesity among children (Malik & Bakir,
2007; Zaal, Musaiger & Souza, 2009). A sample of 4381 Emirati adolescents aged 5-17 showed
that, 21.5% of them were overweight and 13.7% of these were obese (Malik & Bakir, 2007).
Another recent cross sectional study carried out among 661 adolescents in UAE found that, the
proportion of overweight in boys was 18.5% and obesity was 22.2%, and the proportion of
overweight in girls 13.1% and obesity was 20.5% (Zaal et al., 2009). Among the adolescent
population in Qatar, a recent study found that the prevalence of overweight and obesity based on
the IOTF cut-off points was respectively, 28.6% and 7.9% in boys and 18.9% and 4.7% in girls
(Benar, 2006). Also, a study based on IOTF criteria in Bahrain found that the overall prevalence
of obesity was 15% in boys and 18% in girls (Al-Sendi, Shetty, & Musaiger, 2003). In a
comparative study among children, in KSA, the investigators found that the overall prevalence of
childhood overweight was 10.7% in boys and 12.7% in girls, and the prevalence of obesity was
6% in boys and 6.7% in girls (El-Hazmi & Warsy, 2002).

9
Childhood obesity in Kuwait. The prevalence of obesity in Kuwait is among the highest
in the Arab Gulf region (Moussa et al., 1999). In reference to ITOF cut-off points, childhood
obesity prevalence in Kuwait is higher than in the United States (International Association for
the Study of Obesity [IASO], 2011). In the United States, 35% of boys and 35.9% of girls are
considered overweight or obese (Lobstein & Jackson-Leach, 2007). In comparison, in Kuwait
45.6% of boys and 44.9% of girls are obese or overweight (Al-Isa, 2004). The study by Al-Isa
(2004) was performed among adolescents aged 10–14 years (n= 14659) in Kuwait and revealed a
very high prevalence of overweight (31.8% of girls and 30.0% of boys) and obesity (13.1% of
girls and 14.7% of boys). When compared with the US National Center for Health Statistics
reference population, the body mass index of Kuwaiti adolescents exceeded that of American
adolescents in each percentile category at or above the 50th percentile (Al-Isa, 2004).
In another cross-sectional study by Al-Isa & Moussa (2000) assessing the nutritional
status of 6-10 years old Kuwaiti school-age children compared with a NCHS//CDC American
reference population, the authors found Kuwaiti children to be heavier and shorter than the
referenced American children. Moreover, 15.7% males and 13.8% females in the study were
obese, and there was a greater significant change in fatness than in tallness among the Kuwaiti
children over a decade (i.e., from 1985 to 1995).
Al-Shammari et al. (2006) in a cohort study examined changes in physical characteristics
and obesity risk in 6-13 years old school-age Kuwaiti children (n=1536) over the last several
decades to investigate the impact of environmental risk factors associated with the nutritional
transition. In this matched cohort, they found that a present-day sample of children in 2004 were
taller and heavier than their counterparts were in 1984 (20 years ago), with a significant upward
shift in BMI in both boys and girls. Similarly, there was a significant excess of energy intake

10
above estimated total daily energy expenditure for both boys and girls. Thus, indicating that for
such a genetically homogeneous population, hereditary predisposition alone cannot explain these
observations. The findings of Al-Shammari et al. (2006) supported earlier evidence that
environmental risk factors including lifestyle changes, lack of physical activity and unhealthy
food choices related to rising household income are contributory to the childhood obesity
problem.
Contributors of Childhood Obesity
Chronic diseases associated with obesity are an emerging public health concern in the
Middle East due to the rapid rise in its risk factors. Dietary and lifestyle patterns among the
young population living in the Middle East has changed and led to the emergence of diet-related
chronic diseases. This is due to urbanization, economic development and transition from a
traditional diet to a more fast food-based westernized diet (Galal, 2003; Musaiger, 2004). At the
present time, younger generations in the Middle East are less likely to consume healthy food
compared to older generations. Also, the younger population in the Middle East has the highest
energy intake and obesity rates when compared to other developing countries (Galal, 2003).
More children are at a particularly high risk of obesity in developing countries especially
those prosperous due to transition in nutrition and physical activity lifestyle. According to
Popkin (2003) this can be explained by the nutrition transition phenomenon which happens in
three stages: the receding famine stage, then the degenerative disease stage and last the
behavioral change stage. The famine stage (i.e., characterized by low-variety diet, labor intensive
lifestyle, high mortality and high prevalence of communicable diseases) begins to recede with
economic growth. Some of the other causes of this transition are urbanization, increase leisure
time and food processing. After that the society go through the degenerative disease stage were a

11
shift toward a sedentary lifestyle and an increase in food intake occur and lead to obesity and,
therefore, an increase in chronic degenerative diseases. As a result of this degenerative disease
stage, the society will be compelled to take measures to overcome the problem, and this leads to
the behavioral change stage. In this stage, a shift toward a healthy diet and an active lifestyle
occur and in return it would reverse the negative trend of obesity and extend healthy aging
(Popkin, 2003).
Even though economic prosperity in some developing countries improved food security
and decreased communicable diseases, the nutrition transition was associated with adverse health
effects including childhood obesity. More food items that are high in fat and sweets content are
readily available in developing countries at the present time. Overconsumption of these energy-
dense food items among children is due to the increased perceived tastiness of these items and
their abundance in the food supply (Drewnowski & Popkin, 1997). The population of the Arab
countries in the Gulf region adopted a more sedentary lifestyle and their diet changed noticeably
over the last two decades with a more noticeable increase consumption of fat, meat, sugar, rice
and wheat flour than before (Musaiger, 1993). Kuwait is considered one of the developing
prosperous countries. This calls for health educators in the country to consider preventative
efforts in order to combat the childhood obesity trend and shift the society toward the behavioral
change stage.
Contributors of childhood obesity in Kuwait. The rise of childhood obesity is
fundamentally dependent on the shift toward an energy-dense diet that is high in fat and sugars
but low in nutrients, and a drift toward a sedentary lifestyle (World Health Organization [WHO],
2010). During the last two decades, several important transformations have occurred in the
epidemiological profile of the Kuwaiti population. Life expectancy has increased from 70.3 years

12
in 1980 to 77.9 years in 2010 (United Nations Department of Economic and Social Affairs, 2009,
p.73). This epidemiological transition accompanied a shift from infectious to chronic diseases.
An increased intake of processed foods rich in fats, sugars, and salt and low in dietary fiber and a
decrease in physical activity, all known risk factors for obesity, have also increased considerably
(Alawadi & Amine, 1989; Musaiger, 1993).
Most Kuwaitis lead sedentary lifestyle due to the considerable changes occurred in
lifestyle, such as nutritional practice and physical activity, since the first shipment of oil in 1946
and the surge in oil prices of the 1970's, especially in the intervening years between the 1980's
and the 1990's (Al-Isa, 1995). Kuwait has been transformed into a super-affluent society with
rapid modernization (Kamel & Martinez, 1984). Obesity is known to be more prevalent in
affluent societies undergoing modernization which can be recognized as a possible cause for
adopting the developed world problems associated with obesity in such societies (Garrow, 1975;
Bindon & Baker 1985). Al-Isa (1997) explained the increase in obesity prevalence among
Kuwaitis was possibly due to modernization, affluence, increased food consumption and the
associated changes to sedentary lifestyles.
There are several factors that specifically reflect lifestyle patterns among Kuwaitis that
can be linked to childhood obesity. For instance, frequent gatherings with extended families and
friends are a regular affair. During these times, individuals are consuming more fat, meat, sugar,
rice, and wheat flour than usual (Musaiger, 1993). In addition, Kuwait‘s climate is like that of a
dry desert (i.e., intensely hot summers and short cool winters) which may discourage children
from indulging in regular exercise. Kuwait‘s rapid growth and socioeconomic developments
have a negative impact on healthy behavioral practices among the Kuwaiti population (Al-Isa,
2003). Prior to the discovery of oil, there were natural checks and balances such as hard manual

13
labor like sailing, fishing and pearl-diving that protected against disease associated with
metabolic syndrome. At present, the rising income levels in Kuwait have led to a more sedentary
lifestyle, over-reliance on motor vehicles and fast foods and poor food choices among school-age
children. If these present trends are allowed to continue, the impact on the health service would
be enormous. These significant shifts in an otherwise homogenous population within the last two
decades seem to confirm an impact of the demographic and epidemiological transition on
nutritional risk (Al-Isa, 2003).
Beside the surplus of calorie-dense food being contributory to childhood obesity in
Kuwait, there is an improper public perception of what is an appropriate diet. People would
usually associate food rich in fat, sugar and salt as being good and tasty food (Al-Moussa, 1996).
There might be a link between fast food consumption and childhood obesity trend in both
developed and developing countries especially when considering the composition of fast food as
being a risk factor chronic disease such as cardiovascular diseases and diabetes. Fast foods
characteristically are energy dense, high in sugar content, high in saturated and trans-fat and
larger in portion sizes. Moreover, they are low in fiber, antioxidants, minerals and vitamins
(Slavin, Martini, Jacobs, & Marquart, 1999; Hu, van Dam, & Liu, 2001).
Consequences of Childhood Obesity
According to Lee (2009) Morbidities linked to childhood obesity do not only pose a
direct impact on the health of obese children during childhood, but also elevate their chance of
suffering from these chronic diseases during their adulthood life (i.e., being obese during
childhood is linked with a higher likelihood of obesity, premature death and disability in
adulthood). In Kuwait, coronary heart disease is recognized as the most common cause of death
among adults, with an approximate 50% increase in mortality rate because of heart disease from

14
1972 to 1981 (Kurtz, 1984; Radovanovic, 1994). In another study among 3003 adult Kuwaitis 20
years of age and older, the prevalence of non-insulin dependent diabetes was 14.8% (Abdella,
Al-Arouj, Al Nakhi, Al Assoussi, & Moussa, 1998).
In addition to increased future risks of chronic diseases such as coronary heart disease
and diabetes, overweight children may experience breathing difficulties, high risk of fractures,
elevated blood pressure, insulin resistance, early markers of cardiovascular disease and
psychological effects (WHO, 2005). Chronic diseases, mainly cardiovascular diseases, diabetes,
cancers and chronic respiratory diseases, are a growing global burden. A report in 2005 by the
World Health Organization estimated 35 million deaths worldwide (60% of all deaths globally)
to be due to chronic diseases and projected an increase by a further 17% over the next 10 years.
Moreover, the report indicates that increasingly younger people are developing these chronic
diseases in urban environments mainly due to unhealthy diet and physical inactivity (WHO,
2005).
Overall, considering the health-related quality of life, overweight children and
adolescents scored lower on the emotional, physical and social aspects when compared to
children at normal weight (Williams, Wake, Hesketh, Maher, & Waters, 2005). Obese children
were more prone to bullying and were categorized as the least-desired friend (Griffiths, Wolke,
Page, & Horwood, 2006). Children and adolescents classified as overweight or obese
experienced lower psychological quality of life, emotional agony, body image disappointment
and lower self-esteem (Huang, Norman, Zabinski, Calfas & Patrick, 2007; Wallander et al.,
2009).

15
Gap in the Literature
Most of research about childhood obesity conducted in Kuwait reported the prevalence of
the problem and was descriptive in nature. The problem of childhood obesity, its prevalence, its
possible causes and the risk factors associated with it were all fairly documented in the literature
for the Arab Gulf Region. Equally, there is almost no literature testing the feasibility and the
effectiveness of health interventions addressing the childhood obesity problem. What is more,
considering the scope of the childhood obesity problem in Kuwait, most health educators
stressed the urgent and desperate need for effective nutrition health promotion interventions and
disease prevention programs especially for youth and children. According to Zaal et al. (2009)
intervention programs focused on promoting lifestyle modifications, increasing physical activity
and adapting better food habits need to be implemented as soon as possible. Al-Isa (2004)
referred to the necessity of intervention programs that focus on educating and motivating
adolescents in this region to modify their eating behaviors and increase their level of physical
activity. In addition, Al-Shammari et al. (2006) referred to the population in the Arab Gulf area
as being in a nutritional transition stage and at an increased risk of noncommunicable diseases
unless appropriate interventions are implemented to reverse the trend of obesity.
Cost is another issue to consider. The higher prevalence and expenses associated with the
obesity epidemic have made preventive efforts a public health precedence. Countries in the Gulf
area need to invest in prevention programs targeting childhood obesity in a step toward reducing
the cost of chronic morbidities associated with adulthood obesity. Finkelstein, French, Variyam,
& Haines (2004) argued that it is relatively easy to justify on economic grounds the interventions
targeting children due to the additional protections that this age group requires. The WHO (2008)
recommended promoting healthy diet among children through: establishing food-based dietary

16
guidelines, enabling children to make educated decisions about their food choices by providing
accurate and balanced information, implementing school-based programs in correspondence with
WHO‘s health-promoting schools initiative and investing in preventative behavioral research to
prevent noncommunicable diseases. Therefore, school-based interventions in Kuwait that focus
on educating students on how to develop healthy dietary habits and be more physically active
seems to be a viable promising step toward preventing chronic diseases associated with
childhood obesity.
Prevention
The influence of environmental, psychological and social factor on childhood obesity is
critical. Ebbeling et al. (2002) pointed out that funding research that only focuses on the
treatment of childhood obesity will not solve the problem as childhood obesity is not caused by
an inherent biological defect. Rather, there should be a focus on primary prevention research that
would address the lifestyle and environmental factors because they play a major role in
combating childhood obesity (Kelishadi, 2007).
Unlike prevention program targeting alcohol and tobacco use, obesity prevention
programs are more challenging and exceptional, because eating is essential to life and a message
in obesity prevention programs would be about balancing food consumption rather than
prohibition or cessation or limitation as in the case of tobacco or alcohol prevention programs
(Dorfman, Wilbur, Lingas, Woodruff, & Wallack, 2005).
Promoting healthy lifestyle and healthy eating. The endorsement of healthy eating is
considered essential approach of health promotion especially for strategic legislative programs
that are considered with public health (Niva, 2007). Promoting healthy eating, as a favorable
behavioral outcome among children, better serves and strongly relates to the purposes of obesity

17
prevention. Rather than endorsing restriction of bad dietary habits, it is more useful to learn
about positive influences that could be introduced into a young person‘s life, because habitually
it is difficult to remove a detrimental influence (Backman, Haddad, Lee, Johnston, & Hodgkin,
2002). There is no consistent definition of healthy eating in the literature, but generally it refers
to a well balanced diet that is rich in fiber, fruit and vegetables, low in fat and sugar, constitute of
appropriate average total energy intake and reflect consistent healthy eating habits
(Tsorbatzoudis, 2005; Hewitt & Stephens, 2007). In a review by Davis et al. (2007) examining
evidence provided by behavioral interventions linked to childhood obesity, the authors
demonstrated that the literature show sturdy evidence in favor of: family meals, smaller portion
sizes, limiting dining out especially at fast food restaurants, eating breakfast regularly,
consumption of a calcium rich diet, eating a diet high in fiber, eating fruit and vegetable
according to MyPyramid recommendations, limited consumption of sweetened beverages and
being physically active for at least 60 minutes each day.
According to Melanson (2008) a healthy diet for children must consist of vegetables,
fruits, whole grains, low-fat dairy, beans and lean sources of meat. Foods and beverages that are
calorie-dense and low in nutrient should be consumed in moderation and only as a part of the
child's discretionary calorie allowance. MyPyramid is a color coded food guide for Americans
designed to provide general recommendations of food group consumption. The MyPyramid
recommended-intake of food groups can be further personalized to be age and gender specific
(Marcoe, Juan, Yamini, Carlson, & Britten, 2006). For school-age children the pyramid: is called
MyPyramid for Kids, illustrates color coded food groups with an emphasis on regular physical
activity and provides resourceful educational classroom materials that can be used by schools
and health educators (French, Howell, Haven, & Britten, 20006). Further, French et al. (2006)

18
pointed out that the main focus of MyPyramid for Kids was to emphasize the points of: meeting
daily calorie and food group requirements, having at least three meals and two snacks, restricting
diet that is high in fat and sugars and exercising for 60 minutes daily. The challenge now is to
develop innovative ways for disseminating the new MyPyramid to the general public,
specifically among children.
Proper consumption of foods from each food group in the MyPyramid is essential for
optimal health. Promoting healthy dietary habits, such as increasing fruit and vegetables intake
and reducing fast foods consumption have vital effects on public health especially children
(Rasmussen et al., 2006; Kelishadi, 2007). Fruits and vegetables help to prevent chronic disease
(Ness & Powles, 1997; Reddy & Katan, 2004). Also, The American Academy of Pediatrics
supports the promotion of healthy dietary practices that encourage moderation instead of
overconsumption and accentuate healthful choices rather than restrictive eating patterns (Krebs
et al., 2003).
In a study by Melnik, Rhoades, Wales, Cowell, & Wolfe (1998) dietary habits were
evaluated among second (n = 693) and fifth (n = 704) grade students in New York, using house
hold questionnaires and 24-hour recalls. Diets records were evaluated in relation to the Food
Guide Pyramid and 5 A Day and illustrated an under-consumption of vegetables, fruits and
grains, while milk and meat consumption met the recommendations (Melnik et al., 1998). The
authors found that: school lunch participation, meal skipping, meal preparation by the child, and
socio-demographic characteristics all influenced food habits. These findings indicate the need to
tailor nutrition education intervention to specifically address the dietary practices of the targeted
population.

19
Intervention at an early age. As lifestyles and behaviors are established early in life, it
is important to focus early on adoption of health-conscious behaviors by young people. Special
attention and early intervention may be considered for children and adolescents in school as
overweight problems developed at this stage may be present during adulthood with adverse
health outcomes. A 40-year weight history and adult morbidity and mortality cohort study of
overweight children by Di Pietro, Mossberg & Stunkard (1994) found a marked increase in the
BMI between post-puberty and age of 25 in subjects who consequently died, developed
cardiovascular disease, and particularly who were diagnosed as diabetic concluding that that
obesity during adolescence may persist in adulthood with adverse major health risks. Studying
obesity during childhood is significant since the detection of children who may become obese
during adulthood can aid in early intervention and avoidance of the adverse health effects related
adult obesity (Moussa et al., 1999). A study carried out to measure adherence and barriers to
lifestyle recommendations among adult patients with high cardiovascular risk factors found that
the majority of individuals in the sample were overweight, did not engage in recommended
levels of physical activity, and did not follow dietary recommendations (Serour et al., 2007).
This further emphasizes the need to intervene early in life since healthy lifestyle adherence in
adult populations is not present.
Early dietary habits. Dietary practices are shaped during early childhood. For that
reason, tailored nutritional messages that are culturally appropriate and age specific are essential
to achieve positive outcomes when considering behavioral development (Doak, Visscher
Renders & Seidel, 2006). Establishing healthy eating habits early in life is a major key to
childhood obesity prevention. Lytle et al. (1997) explains that knowledge about a healthy eating
lifestyle is not sufficient for a child to adopt healthy dietary practices. This is because the

20
interaction between the child and his social, cultural and physical environment also play a major
role in shaping the child eating habits early in life. For health educators to assist children in
making informed food choices, they must focus on conveying behavioral nutritional messages
and empower children with dietary skills in addition to providing nutrition knowledge (Lytle,
1997). Giving children the opportunity to experience healthy eating in childhood is important.
Many habits learned early are carried on to adulthood. According to Cooke (2007) children who
are exposed to a large array of healthy foods can easily adopt and follow healthy diets during
childhood which prove that children‘s intake and preference of food are highly influenced by
their dietary experience.
School-age children. Targeting school-age children in a classroom environment to
convey nutrition knowledge and skills, provide students with tools to make healthy decisions.
Students in fourth and fifth grade are at an appropriate age; to comprehend nutrition information
and to make informed decisions about their food and beverage choices (Willeford, Splett, &
Reicks 2000; Caballero et al. 2003; Robertson & Zalles, 2005). At this age (i.e., usually 8 to 11
years old) students become more autonomous in their food choices but are still young where
their lifestyle attitudes and behaviors can be shaped and influenced. A study comparing fourth,
fifth and sixth graders found that younger students had greater nutrition knowledge gain and
more of them were making healthier food choices. This advocate that the younger the students
are, the greater is their readiness to learn and the more likely they are to change behavior as a
result of what they learned (Willeford, Splett, & Reicks, 2000).
Consideration of parental influence. It is crucial for parents to comprehend the
importance of a healthy lifestyle for their children because parents largely influence their
children food choices (Hesketh, Waters, Green, Salmon, & Williams, 2005). Parents are

21
considered the gatekeepers when it comes to providing food for the household and play an
important role in developing their children eating habits. Therefore, educating families and
increasing their awareness about the influence they have in the development of their children‘s
lifelong food and physical activity habits are effective strategies for promoting a healthy lifestyle
(Bergman, 2010; Epstein, Myers, Raynor, & Saelens, 1998; Epstein, Paluch, Gordy, & Dorn,
2000; Krebs, Jacobson, & American Academy of Pediatrics [AAP], 2003). In an effort to control
childhood obesity, the American Academy of Pediatrics provides noteworthy recommendations
and practical steps for health educators in regard to promoting healthy eating habits and physical
activity and discouraging sedentary activities among children. Specifically, they recommend
health educators help those who influence children such as parents, teacher and coaches to
discuss health habits, proper diet and provide opportunities for regular physical activity. Also
encourages parents and schools to: provide healthy food patterns and choices for children,
become role models for healthy eating and empower children with autonomy to set appropriate
limits on their food intake (Krebs et al., 2003).
Children do not have a total choice over what they eat, but their parents make decisions
and cook the food for them. During childhood the family house is an environment where children
learn and develop food preferences and eating habits (Perez-Rodrigo & Aranceta, 2001). It is
useful to study associated factors with childhood obesity in different populations, since
environmental factors play an important role in the development of obesity, and these factors
vary from one population to another. Moussa et al. (1999) recommend early preventive measures
in children with emphasis on families in which one or both parents are overweight because they
found that parental obesity is a risk factor for obesity among children.

22
Since parental influence appears to determine children's food intake, it is beneficial to
include parents when designing a school-based intervention. Sharma (2006) found that all
interventions that documented parental involvement successfully influenced obesity indices.
Sallis et al. (2003) also focused on parental education by communicating information through
school newsletters, posters, and a brochure at open houses and PTA meetings. To communicate
healthy eating effectively, nutrition education programs must include: nutritionists, physical
activity instructors, parents and teachers in the school setting, who all can be influential to pass
healthy behavioral practices to children (Al-Isa, 2000; Zaal et al., 2009).
School-Based Intervention
As discussed earlier, the high income developing countries of the Gulf region and
countries in the developed world share the same problem and concerns of obesity and nutritional
risks associated with it. Risk factors profile and related lifestyle patterns reveal levels generally
similar to those in industrialized communities. High fat and cholesterol, lack of physical activity,
obesity and hypertension are main factors responsible for the high incidence of diabetes and
coronary heart diseases in these countries (Musaiger, 2002).Althouh the literature documents
numerous school-based nutritional interventions for developed countries, there are non
developed for the Gulf Region. Replicating interventions that have been proven to be successful
in a new setting (e.g., Gulf Region Countries) with a similar demographic (i.e., such as age,
gender, BMI & physical setting), would be beneficial, provided special cultural and
environmental needs of the group were considered.
Evaluation measures used in intervention studies with school-aged children summarized
by Contento, Randell & Basch (2002) are general nutrition education, attitudes, behavioral and
dietary intakes, behaviorally focused nutrition education, skills, psychosocial variables, food

23
preferences, physiologic measures and environmental changes. These measures from the
literature can be used to implement an effective nutrition school-based intervention in the Gulf
region.
Schools provide convenience and practicality to conduct an effective health promotion
intervention within a controlled environment and reach a large number of youth. During most of
the year children spend six to eight hours in school which positions schools as a logical site for
prevention. Schools provide an established setting for health education and prevention programs
(Hayman et al., 2004). Schools provide children with: at least one regular meal, physical activity
in a productive setting and a chance to learn from health educators about health and nutrition
(Davis, Davis, Northington, Moll, & Kolar, 2002).
Social Cognitive Theory. Theory provides a systemic way for understanding and
studying problems, developing appropriate interventions and evaluating their successes. Theory-
based nutrition interventions are more likely to be successful than those developed without the
advantages of a theoretical standpoint. This is because theory plays a key role in explaining the
dynamics of health behaviors, including the process of changing them and the influence of the
many factors that affect health behaviors including psychological determinant of behavior and
environmental determinant of behavior (National Cancer Institute, 2005).
Behavior theories, like the Social Cognitive Theory (SCT) offers a comprehensive and
structural, theoretical framework for nutrition interventions. It offers a better understanding of
the factors that affect changes in human behavior and the mechanism through which learning
occurs (McAlister, Perry & Parcel, 2008). For school-age children, programs based on the SCT
appeared to be the most effective (Lytle & Achterberg, 1995). When working with a young
audience the framework of SCT is particularly beneficial because it acknowledges the impact of

24
the environment on the child‘s ability to learn new behaviors. The prevention of poor health
habits is less problematic than trying to change these habits once they have become a well-
established part of a lifestyle (Baranowski et al., 2000).
According to Bandura‘s (1986) Social Cognitive Theory, any human behavior such as
practicing healthy dietary habits is shaped by a dynamic interaction of personal, behavioral, and
environmental influences. Bandura explained this triadic dynamic interaction as being reciprocal
in nature. The concept of reciprocal determinism in the SCT emphasize that environmental
factors influence individuals and mutually individuals influence their environment and control
their own behaviors (McAlister et al., 2008).
Other concepts used by the SCT that can interact and lead to behavior change are
outcome expectation, self-efficacy, collective efficacy, observational learning, incentive
motivation, facilitation, self regulation and moral disengagement (McAlister et al., 2008).
Further, McAlister et al. (2008) explained that the outcome expectations and self-efficacy
concepts in the SCT can be categorized as psychological determinant of behavior. While
incentive motivation and facilitation concepts are categorized as environmental determinant of
behavior. Researchers can use all or some of these theory concepts to design an intervention.
Therefore, the main thing when designing nutrition intervention based on SCT is to address
personal, environmental and behavioral factors reciprocally (Figure 1).

25
Figure 1: Reciprocal determinism concept in Social Cognitive Theory.
Social cognitive models tend to promote behavior change by applying more motivational
than volitional processes. Motivational processes occur when a person moves from hoping to
change his behavior to willing to do so. While, volitional processes happens when there is
planning and the actual behavior is practiced and maintained (Garcia & Mann, 2003). According
to SCT, participants in a study must have a behavioral goal. Then, outcome expectations provide
the motivation for changing behavior, knowledge ensures the participants know what behavior to
perform, self-efficacy provides the confidence for overcoming obstacles, facilitation and
motivation provide a premium environment and observational learning offers a chance to model
and apply the behavior (Bandura, 1986).
Outcome expectations and self-efficacy. Outcome expectation is defined as person‘s
beliefs about the likely consequences of a given behavior (McAlister et al., 2008). The more
positive the outcome is perceived to be, the more likely it is that a child will engage in the
behavior of making healthy food choices. Self-efficacy is the belief about personal ability and
confidence in performing a given behavior that would lead to favorable outcomes (McAlister et
al., 2008). Those with higher self-efficacy are more likely to practice healthy dietary habits and
Behavior
Environmental Factors
Personal Factors
(Cognition)

26
are better at tackling obstacles (McAlister et al., 2008). Therefore, providing students with the
proper nutrition education and tools that would help them practice healthy eating is important
because this will give them the confidence to perform the healthy behaviors that they are taught
and adopt a healthy lifestyle.
For a child (person) to adopt healthy dietary habits (behavior) in order to become healthy
and improve school performance (outcomes), he must believe that a healthy lifestyle will benefit
his health and help him perform better at school (outcome expectations) and believe that he is
confidently capable of developing healthy dietary habits (self-efficacy). As explained by
Bandura (1977) even though outcome expectation and self-efficacy are both being accounted as
psychological determinants of behavior, it is important to distinguish between them (Figure 2).
Figure 2. The difference between self efficacy and outcome expectations.
Observational learning and attitude. Observational learning construct in the SCT can be a very
effective tool when designing a nutrition intervention for children. Observational learning occurs
by learning to perform new behaviors through emulating peer models in one‘s direct
environment or through models observed in the media (McAlister et al., 2008). An example of
peer modeling is, if a child sees another child being praised by his teacher for eating fruit, he is
more likely to eat fruit because doing so may earn praise. Equally influential in observational
learning are media models and the use of in-class modeling of healthy dietary behaviors by
Self-efficacy
(Confidance in ability to take action)
Person
(Child)
Outcome expectations
(beliefs about positive outcomes)
Behavior
(Healthy dietary habits)
Outcome
(become healthy, better at school)

27
health educators. By observing media models children can extract general rules from the
observed situation and apply these rules to similar contexts (Bandura, 1986). These rules
influence children‘s behaviors as well their attitude being expressed in a given context (Eyal &
Rubin, 2003).
Incentive motivation & facilitation. Modifying the environment can directly affect
children‘s behaviors and vice versa. In order for observational learning to be effective and
change a behavior, a supportive environment for the new behavior must be adopted. Both
incentive motivation and facilitation are accounted as environmental determinants of behavior.
Incentive motivation refers to the use of reward to modify the targeted behavior, whereas
facilitation is the use of tools and resources and environmental modifications that would
facilitate the targeted behavior (McAlister et al., 2008). Motivation seeks to influence behavior
through external control. It is important to find incentives that are attractive and suitable for
children. Appropriate positive rewarding system applied by the health educator for school-age
children can also play an essential role in promoting a positive learning environment.
Schools in the Arabian Gulf. It is critical to evaluate current schools in the Gulf region
to facilitate planning of an appropriate intervention that would be effective and produce
meaningful results. The following sections will assess schools in the Gulf region and explore
reasons for the need for health promotion programs, possible challenges and obstacles that need
to be addressed and possible venues that researchers can employ when designing a nutrition
school-based intervention.
Education systems in the Gulf region need standardization and regulation of the type of
food served in school to promote healthy eating habits and provide nutritious healthy option for
school-age children. Higher weight status resulting from eating breakfast at school was observed

28
by Zaal et al. (2009). This could be explained due to the consumption of caloric-dense foods at
schools. Recently, a study by Musaiger & Gregory (2000) found that school cafeterias in Bahrain
commonly served foods that are high in caloric content such as thymes bread and sausage
sandwiches. Bahraini boys preferred beef burgers, liver and egg sandwiches, while Bahraini girls
favored soft drinks, cheese, canned drinks and beans as a morning snack (Musaiger & Gregory,
2000). Snacking all day long on energy-dense foods can be detrimental to health because
snacking between meals provides almost 25% of the daily energy intake in some adolescent
populations. An effective approach would be to snack on nutrient-dense food as a healthier
option (Zaal et al., 2009). Recognizing the situations in which adolescents snack and skip meals
may help health educators to develop strategies that would promote healthy dietary habits among
adolescents.
In a recent cross sectional study in UAE about the relationship between the dietary habits
and behavioral factors to the increased risk of obesity among adolescents, the investigators found
that caloric-dense food was significantly associated with obesity in girls. Also, the risk of obesity
was high in boys who ate caloric-dense food (Zaal et al., 2009). Missing breakfast was
significantly related to female adolescents‘ weight in the Gulf region as those who skip breakfast
tend to consume greater quantities of food at lunch and thereby gain weight (Zaal et al., 2009;
Musaiger, 1991). There is a need for nutrition interventions that assess the development of eating
habits of local diets that contain adequate, but not excessive calories.
People have become more sedentary in the past decade. Health professionals need to
promote a healthy lifestyle and regular physical activity among children. Changes in lifestyle are
warranted through changes in the school environment rather than changes in individuals alone.
Emphasizing the importance of physical activity sessions in the school to be in weather-

29
controlled centers, since the weather is hot most of the year in the Gulf region, is an essential
step to encourage children's and teacher's participation (Al-Isa, 2000).
Practicality of school-based interventions. Early intervention with children that include
increasing physical activity, reducing screen time and adhering to healthy eating habits, both at
home and in school is an effective approach (Campell, Waters, O‘Meara & Summerball, 2001).
A comprehensive review meta-analysis of RCTs and clinical controlled trials (published between
1995 and 2007) evaluated the effectiveness of school-based programs in the prevention and
management of childhood obesity presented persuasive evidence that at least on the short-term,
school-based interventions were effective in reducing the prevalence of childhood obesity. The
Longer-running programs had more successful rates than shorter programs. (Gonzalez-Suarez,
Worley, Grimmer-Somers & Dones, 2009). Additionally, an article by Sharma (2006) reviewing
international school-based interventions for preventing obesity in children published between
1999 and 2005 (i.e., excluding the United States) found most interventions were focused on
individual-level behavior change approaches. Also, most of the interventions had experimental
designs with at least 1-year follow-up. The recommendations provided by Sharma (2006) are a
voluble resource that researchers can use and apply when designing an intervention in an
international setting.
Schools provide important opportunities for public health initiatives to tackle the problem
of childhood overweight and obesity. Interactive school-based nutrition education program
generally produce positive effects concerning students‘ knowledge and attitudes toward nutrition
(Robertson & Zalles, 2005). Schools that promote healthy standards of living by incorporating:
health and nutrition education in their curriculum, healthy foods in lunchrooms, physical
education classes, trained team, parental involvement and the banning of soft drink sales; had a

30
better influence on children‘s diet and reduced overweight by 59% and obesity by 72%.
(Veugelers & Fitzgerald, 2005a). Another study by Veugelers & Fitzgerald (2005b) found an
association between obesity levels and regularity of physical education classes as having a
physical education class two or more times a week at school decreased the risk of overweight
and obesity among fifth grade students.
Barlow & Dietz (1998) recommended using family-based and school-based approaches
when it comes to childhood obesity prevention because children are somewhat intellectually and
psychologically undeveloped and vulnerable to peer-pressure. Exploring the role of schools in
obesity prevention Story, Kaphingst, & French (2006) suggested that school-based intervention
take three main assortments, namely interventions that, promote healthy dietary practices and
discourage unhealthy ones in lunchrooms and from vending machines, emphasize the importance
of healthy eating and physical activity by providing health education curricula that support a
healthy lifestyle and offer students opportunities to be active in physical education classes and
recess time.
To achieve considerable effect when planning nutrition interventions, educators should
modify both the physical and social environments directly. (French & Stable, 2003; Powers,
Struempler, Guarino, & Parmer, 2005; Doak et al., 2006). According to Bergman (2010) in order
for school-based intervention to be successful it must integrates changes to the school
environment and curriculum and uses social marketing to promote healthy dietary practices.
Further, the author emphasized that the intention of nutrition educators to impact behavior
change must be through promoting skill-building that would aid students in adopting a healthy
dietary practice (Bergman, 2010). Officials in Kuwait can make use of successful intervention
strategies provided by neighboring Arab Gulf countries with similar demographics and culture.

31
As a part of its ―Health Promoting Schools‖ initiative, Oman promoted nutrition and physical
activity education by developing life-skills and physical education curricula, both with strong
health messages, which were designed to be integrated into the existing school curriculum. An
evaluation of this intuitive indicated that both students and school staff in health promoting
schools have better dietary practices and better knowledge of healthy lifestyle and firmer beliefs
regarding healthy lifestyle than those in control schools (WHO, 2010).
Related studies from the developed world. Children are a remarkable population to
study and more promising when it comes to learning healthy dietary practices particularly in a
controlled, structured and easily accessible environment such as a school. School-based
interventions that involve multi-component measures in their design are usually more effective in
dealing with a multifaceted problem such as childhood obesity. Articles reviewed in this paper
shows clear evidence of the effectiveness of such multi-component school-based programs.
Designing interventions that emphasize nutritional issues for schools in the Gulf region
would be productive if evaluated against other interventions with successful outcomes. The
Gimme 5 intervention following 9th graders found a significantly more fruit and vegetable
consumption among intervention students than among controls at 1 and 2 year follow-up
(Nicklas et al., 1998). Intervention by Nicklas et al. (1998) included several components, such as
a media marketing campaign, workshops, and school meal modifications increasing availability,
variety, and taste of fruits and vegetables. All such factors possibly would produce similar
positive results in the Gulf area.
A diabetes risk-factor prevention program by Trevino et al. (1997) addressed students'
social systems (parents, school classroom, school cafeteria, and after-school care). Activities
included a nutrition seminar for parents, education for cafeteria staff, and curriculum changes.

32
The after-school component reinforced classroom learning and promoted physical activity. The
intervention resulted in a decrease in dietary fat servings and the number of servings of fruits and
vegetables consumed increased. The Heart Smart Program by Hunter et al. (1990) attempted to
increase students' self-efficacy for adopting healthy lifestyles for CVH. The program addressed 6
areas: curriculum, school lunch (menu modification), staff development, physical activity, school
environment, and parental support. The intervention families showed greater improvements in
physical activity and dietary practices compared with the controls (Hunter et al., 1990). Also,
Harris et al. (1997) founders of Kansas LEAN school program included modifying school
lunches to reduce the percentage of calories from fat, providing nutrition education, and
increasing students' physical activity through increased opportunities, intensity, and incentives.
A study by Powers et al. (2005) examined a six week nutrition program that was based on
SCT. The researchers studied the effect of the program on nutrition knowledge and dietary
practices among elementary school children in second and third grade. The study was a pre-
/post- evaluation control group design with a sample of convenience selected from Alabama
public schools (N= 1100). The curriculum for classes was based on materials from the Dairy
Council, Wellness Inc., and the American Heart Association. The questionnaire included 24
dietary behavior questions and 16 nutrition knowledge questions. The concepts covered in
classes that were assessed in the nutrition questionnaire were: dairy intake, fruit and vegetable
intake, Food Guide Pyramid knowledge, nutrient-food association knowledge, and nutrient-job
association knowledge. The researchers utilized the concept of reciprocal determinism were they
taught skills to select healthy food, employed educator to serve as role models in lunchrooms,
reinforced the concepts learned by hands-on activities and nutrition messages on bulletin boards.

33
In contrast to the control group, the treatment group showed a significant increase (p < .001) in
nutrition knowledge (i.e., including comprehension of Food Guide Pyramid, nutrient-food
association and nutrient job association). The study also showed a significant improvement (p <
.001) in dairy, fruits and vegetables intake in treatment group. Powers et al. (2005) concluded
that teaching positive nutrition messages have the potential of improving dietary knowledge and
behaviors among children.
In another study among forth to sixth grade students (N= 1172) from rural areas in United
States, Willeford et al. (2000) examined a six week nutrition curriculum that incorporated
videotapes, experimental procedures and other nutrition learning activities. Nutrition and
scientific methods were taught to students through an animal care and feeding project. Teachers
volunteered to conduct the lessons and administrated the pre- and post-assessments to evaluate
scientific method knowledge, nutrition knowledge and nutrition attitudes. Curriculum materials
that were given to teachers included: class room activates manual, videotape, a Food Guide
Pyramid poster and food nutrient comparison cards. Teachers were given the choice to
implement the lesson based on their interest and feasibility of use in classrooms. All grade levels
showed an increase in nutrition knowledge (p < .0001) and an improvement in attitude (p <
.0001). In a comparison between groups, the researchers found that fourth graders had higher
gain in nutrition knowledge than fifth and sixth graders which indicate a better readiness to learn
among younger groups. Seventy five percent of all participant repotted they were making
different food choices on a self-reported behavioral change evaluation. Fourth graders were more
willing to make different healthy food choices than fifth and sixth graders with 86% of them
reporting that they were making different food choices (Willeford et al., 2000).

34
In an after-school setting intended for third to fifth graders (N= 157, 61% retention rate),
Kelder et al. (2005) designed the CATCH Kids Club after-school program based on the original
CATCH program (Coordinated Approach to Child Health elementary school program). The
study was based on SCT with a pre-/post-assessment controlled design and was conducted in 16
after-school programs in Texas. According to Kelder et al. (2005) it is difficult to incorporate a
program during the busy school-day and an after-school program seemed a viable accessible
option. The study focused on helping students to make healthy food choices, increase moderate
to vigorous exercise at school and prevent chronic diseases. All program materials were designed
to be flexible to implement with clear concise instruction manual. The program included 15
lessons (i.e., 15-30 minutes each) over five 3-week units, nutrition activities and education, snack
and physical activity components. The study highlighted the use of modeling, monitoring, goal
setting, contracting, building skills, practice and reinforcement in the nutrition education
component. The snack component was intended to introduce students to healthy foods through
cooking lessons and sensory taste evaluations and the emphasis of fruits and vegetables, whole
grains and low-fat dairy intake. The physical activity component consisted of a variety of
enjoyable physical activities, plenty of opportunities to practice skills in physical activity and
participation of student in exercise for at least 30 minutes daily. Surveys and focus groups were
used to assess the intervention effectiveness. As a result of the after-school program, the
intervention group showed a significant increase in nutrition knowledge and a marginal increase
in fruit and vegetable intake (p < .10). Children in the intervention group increased their
moderate to vigorous physical activity (p < .001) from at post-intervention. Also, students in
intervention group and decreased the amount of sitting (p < .125) or standing (p < .072) when
compared to control groups (Kelder et al., 2005). Students‘ responses were better in the snack

35
and physical activity component compared to the education component. The researchers
concluded that the program was effective, but the training of teachers was challenging and
needed to be done routinely.
An interactive school-based nutrition education program identified as Nutrition
Pathfinders for third to fifth graders was developed by the Dairy Council of California
(Robertson & Zalles, 2005). The aim of the study was reinforcing the Food Guide Pyramid to
help students recognize healthy food and physical activity behaviors and eventually practice
them to minimize the risk of overweight and obesity. The program was based on SCT and
included a CD-ROM, a teacher guide, student workbook and a website to provide students,
teachers and parents with tools and support. Student in the intervention group had a 3-day camp
experience, where their food choices, physical activity and interactions with other camp students
were addressed by the investigators. The study evaluated teacher and students satisfaction with
the program, implementation and changes in students‘ knowledge, attitudes, food intake
behavior. The study had a pre-/post-assessment design with a matched comparison group.
Student in the intervention group (n= 445) were trained to increase play activity, be familiar with
Food Guide Pyramid recommendations and choose healthy food deliberately. Seventy six
students were in the comparison group. Those who completed the program (n= 521) in both
groups showed a significant increase in nutrition knowledge (p < .05). Eighty seven percent of
students in intervention group reported their intention to consume appropriate amounts of food
compared to only 75% of those students who were in the control group (Robertson & Zalles,
2005). The researchers concluded that students at third and fifth grade are receptive and still at
an early age were their behaviors and attitudes can be influenced. Robertson & Zalles (2005)

36
highlighted the usefulness of using hands-on learning tools during class period and the
interaction and support provide by the program website.
Jan, Bellman, Barone, Jessen, & Arnold (2009) developed and evaluated an obesity
prevention program based on the SCT, among 89,736 second to fifth grade elementary school
students at 175New Jersey schools. The results obtained from this study were intended to be used
for improving the Shape It Up program in the future. The study used a pre-/post- evaluation
design for a single sample. Missing and uncompleted surveys were excluded from data analysis.
A sample of convenience (n = 6,421) completed surveys at pre- and post-intervention to assess
knowledge, attitude toward healthy eating and exercise and the overall impact of the program.
Jan et al. (2009) specified that the main aim of the Shape It Up program was to promote healthy
eating and exercise through 60 minutes interactive workshops delivered in schools auditoriums
and cafeterias. The workshops depended on vivid demonstrations to get children‘s attention.
Some of the main topics covered in the workshops included: healthy portion sizes, Food
Pyramid, benefits of eating fruits and vegetables, detrimental effects of soda consumption and
benefits of milk and water consumption. Posters in the school environment, a website especially
developed for the program and sent home booklets explaining program objectives, were all
intended to reinforce the nutrition message learned at school. Jan et al. (2009) found a
significant increase in knowledge (p < .001) and a more positive attitude (p < .001) at post-
intervention. Moreover, 91.7% rated the program as being satisfactory with 54.9% of students
choosing the highest point on the satisfaction scale. Although the impact of the program is
promising, the researchers stressed the need of a comparison group to determine if the results
obtained can really be explained by the intervention (Jan et al., 2009).

37
Another study based on SCT and an ecological model investigated a school-based
diabetes intervention program among 122 Native North American students in third, fourth and
fifth grades (Saksvig, et al., 2005). The study design was a pre-/post-test design for a single
sample. During the program teacher delivered 16 weekly lessons (i.e., each was 45 minutes in
length) using a curriculum that focused on healthy eating and physical activity; knowledge, skills
development and diabetes education. The family component of the intervention included sent
home letters, information booth during parent-teacher meetings and weekly community radio
shows. Modifications to the environment included a school-policy of banning high-fat and high-
sweet snack in school, while pear modeling was used to reinforce positive learned habits such as
children‘s video cooking club. The study found that because of the exposure to the intervention
there was a significant increase in dietary knowledge, intention, preferences and self efficacy.
Saksving et al. (2005) pointed out the effectiveness of using culturally adopted and relevant
materials in interventions that would address health concern related to certain cultures.
The reviewed above school-based interventions focused on; physical education,
enhancing nutrition knowledge, improving students‘ nutritional intake, assessing social and
behavioral factor, emphasizing parental support and promoting environmental supports. All these
procedures can be effectively implemented and replicated for schools in the Gulf region with
more specific tailoring.
Validity of food records. Food records are written documentation of actual intake of the
food and beverages consumed during a specific time period, usually three, five, or seven days
(Thompson & Byers, 1994). The use of food records in school aged children is considered a
valid standard instrument since collecting information at the time of consumption reduces error
due to memory loss. A review that examined the reliability and validity of dietary assessment

38
methods among school children aged 5-18 concluded that the use of food recalls and diet record
to measure dietary intake has higher validity than the use of food frequency questionnaires in this
age group (McPherson, Hoelscher, Alexander, Scanlon, & Serdula, 2000). Further, McPherson et
al. (2000) pointed out the advantages of using diet records as they do not rely on memory, they
have a defined record time, intake can be quantified, they can be group administrated and
procedure can be automated.
Thompson & Byers (1994) specified that the validity of food records for measuring usual
food intake improves with more days of recording, which signifies the need for multiple records
to generate a representative sample of usual intake. Moreover, a study designed to investigate
three methods of collecting dietary information (i.e., 24-hour recall, 3-day food record, and 5-day
food frequency) found that nine to ten years old children who used a 3-day record reported their
observed intakes more accurately than did children who used a 24-hour recall or a 5-day food
frequency (Crawford, Obarzanek, Morrison, & Sabry, 1994).
According to McPherson et al. (2000) a single food record measures actual intake and is
not a suitable tool to predict individual-level health outcomes, rather it is more appropriate for
estimating group means. A study that evaluated dietary assessment instruments in adolescents
highlighted the need for a short, easily administered, inexpensive, precise instrument that can be
used in a broad range of adolescent subpopulations (Rockett, Berkey, & Colditz, 2003). Gillman,
Hood, Moore, & Singer (1994) specified that adequate preparation and teaching and the use of
appropriate incentives immediately after the recording period motivated fifth grade students to
complete multiple days of food records.

39
CHAPTER III
Methods
Study Design
This study was a pilot testing of the Let‘s Eat Smart program, a school-based nutrition
education program with a pre-/post- evaluation design. Twelve interactive lessons were designed
to promote healthy dietary habits among fourth and fifth grade elementary school children in
Kuwait. The program lessons focused on: increasing nutrition knowledge, improving attitude
toward a healthy lifestyle, enhancing self-efficacy for dietary change, and improving dietary
behaviors. The pre-intervention data collection phase included nutrition surveys and 3-day food
records. In addition, data collected during the post-intervention phase included program
evaluation checklists collected during a post-program group evaluation session. The study was
approved by the Institutional Review Board of the University of Mississippi and by the Kuwait
Ministry of Education (Appendix B).
Recruitment and Participants
A sample of convenience was selected from several private English teaching schools in
Kuwait Capital and recruited for this study. The first school that replied was selected for the
intervention. A private school system was chosen because it teaches in English and the materials
used for this intervention are for English speaking audiences. Also, private schools include both
genders compared to the separate gender public education system in Kuwait. Including both
genders better serves the purpose of the study as it is not gender specific.

40
The English Playgroup and Primary School was the first school to respond. School
authorities granted permission for the Let‘s Eat Smart program to be conducted at their school
site (Appendix C). All fourth and fifth graders with English literacy and no known food allergies
were qualified for the study. The total number of fourth and fifth grade students in the school
was 113 students. The school had three fourth grade classes with 23 students in each and two
fifth grade classes with 22 students in each. G Power analysis indicated that a total of 71 subjects
was needed in order to obtain a power of 0.80 with an effect size of 0.30 at an α-level of 0.05
utilizing a t-test for two dependant samples (Faul, Erdfelder, Lang & Buchner, 2007).
Prior to the intervention, all fourth and fifth grade students in the school were given a
parental consent form to take home (Appendix D). Forms signed by their legal guardian were
collected later the same week. Oral assents to participate in the program were also collected from
students (Appendix E). During the preliminary data collection week, students filled out the pre-
survey during the regular class period (45 minutes). Those surveys were coded with student
numbers and administered by the class teacher. Students were allowed enough time to complete
the survey and upon completion they were asked to flip through the survey again and record any
missing answers. In the same week, students filled out 3-day food records. The intervention
lasted for 12 weeks. During the post data collection week students filled out post surveys, 3-day
food records and attended a group evaluation session to complete program evaluations. Figure 3
shows the study design and the course of recruitment process.

41
Figure 3. Study design and recruitment process.
One hundred ten students from the English Playgroup and Primary School participated in
the study. All the 110 students attended at least 9 out of the 12 Let‘s Eat Smart Classes. Of those
included in the study only 84 students completed all components of the quantitative data
collection by completing both pre/post surveys and both pre/post 3-day food records. Twenty six
students were excluded from the quantitative data analysis because of missing data. Therefore
the sample size for the quantitative data analysis was N= 84 students.
Fifteen extra students who completed the post program evaluation checklists but had
other missing data (i.e., the number of students‘ program evaluation checklists that were
School approval (principal)
Parental consents & child assents to participate
Three 4th grade classes & Two 5th grade classes in the study (n = 113)
Pre- data collection week (survey & 3-day diet record)
Nutrition Intervention
(12 lessons covering 4 topics with 3 lessons for each)
Post- data collection week (survey & 3-day diet record & program
evaluation)

42
s
completed is N = 95). These extra 15 students were included in the qualitative analysis to get the
feedback of those who failed to complete all requirements. Finger 4 explains the process for
selecting the final sample size for analysis.
Figure 4. Flow of changes in sample size through each stage of the study.
Theoretical Framework Applied to Let’s Eat Smart
Social Cognitive Theory provided the conceptual framework for the educational and
behavioral components in this school-based nutrition intervention. The essential reason for
choosing SCT is because the program aims to promote and motivate school children in Kuwait to
change their dietary behaviors toward healthier eating habits. The concept of reciprocal
determinism was applied to the Let‘s Eat Smart program focusing on the three factors of SCT
(Figure 5).
Initial Sample (n= 113)
Subjects included (n= 110)
Subjects completed both pre- & post- surveys
(n= 104)
Subjects completed both pre- & post- diet records
(n= 90)
Subjects completed the post program evaluation
students' checklists (n=95)
Quantitative Data analysis (n= 84) because:
Completed all: both pre-& post- surveys and both pre- & post-diet records.
Qualitative data analysis (n= 95) because:
Completed post prorgram evaluation: (Students' checklists)
Didn't complet pre- &/or post- surveys (n=6)
Didn't complet pre- &/or post-diet records (n= 20)
Subjects excluded (total n= 3)
*Refused to participate (n=2)
*Did not meet inclusion criteria (n= 1)
Assessment for eligibility
Pre- & Post-data collection phase
Enrolment Analysis

43
Figure 5. Reciprocal determinism concept of SCT applied to Let‘s Eat Smart Program Design.
The Social Cognitive Theory‘s constructs that were used in this study are outcome
expectation and self-efficacy (psychological determinants of behavior); incentive motivation and
facilitation (environmental determinant of behavior) and observational learning. The constructs
were defined accordingly to fit within the purpose of this nutrition education program.
This intervention was tailored to increase outcome expectation of feeling more
empowered to make healthier choices and become healthier by adopting healthy dietary habits.
To increase children‘s self-efficacy toward healthy dietary behaviors and eventually developing
healthy dietary habits, the interactive nature of the lessons in this program were designed to
make use of both observational learning and participatory learning (i.e., practicing the behavior
Behavior
*Improve breakfast intake
* Improve MyPyramid food group consumption
*Improve dietry habits
Environment
*Provide posters & in class incentives within classroom
environment
* Weekly progress report to encourage changes in home
environment
*Provide tools to enhance dietary habits
Individual cognition expectancies
*Increase knowledge about healthy lifestyle
*Promote critical thinking through class activities
*Positive attitudes toward healthy eating
*increase self-efficacy about healthy eating

44
during classes and at home). Children learn positive behaviors and were anticipated to develop
positive attitudes from observing televised pictures of characters engaging in positive dietary
behaviors.
Motivation in this program was encouraged by: supporting self-reward through
amplifying the concept of making healthy choices as being the right thing to do and a reasonable
goal to achieve (i.e., emphasize what is right and what is wrong when it come to nutrition
choices). Another motivation strategy used in this program was to associate the message of
healthy eating with pleasure by practicing in class activities and sharing good times with
classmates (i.e., attending nutrition class is an opportunity to take a break from the routine of
other demanding classes and learn simple fun concepts). Incentives during classes such as
stickers, fruit stamps, crayons and bookmarks were provided for active participation to children.
Facilitation was used in this program to empower children with skills such as healthy snacking
practices and tools. It also focused on providing a supportive environment by using educational
posters, parent letters and hands-on activities that support the nutrition messages conveyed
during the program. A detailed illustration of how the SCT constructs were addressed in this
study is displayed in Table 12 in Appendix F.
Curriculum Lessons
Let‘s Eat Smart intervention consisted of 12 interactive lessons. All lessons were
conducted by the primary investigator during the time of the National Awareness Class. The
classroom teacher‘s role was to assist in class management and data collection. The investigator
taught three fourth grader classes on Wednesdays and two fifth grade classes on Thursdays every
week during the intervention. These lessons were designed to be delivered within a class period

45
and would take 15 to 20 minutes. The lessons covered four major topics: energy balance,
MyPyramid, portion size and healthy eating as illustrated in Table 1.
Table 1
Lesson Plan of the Let’s Eat Smart Intervention
Topic Weekly lessons Lesson plan
Energy balance Lesson 1 Energy in equals Energy out.
Lesson 2 What is a Calorie? DVD session.
Lesson 3 Discussion and recap
MyPyramid Lesson 4 Understand My Pyramid
Lesson 5 Food Smart: My Pyramid DVD session.
Lesson 6 Discussion and recap
Portion size Lesson 7 Food Models & Portion estimation
Lesson 8 Portion Distortion DVD session
Lesson 9 Discussion and recap
Healthy eating Lesson 10 Nutrient Math & Science
Lesson 11 Healthy Snack Day
Lesson 12 Discussion and recap
The main theme of this intervention was to convey a positive healthy eating message to
promote healthy dietary behaviors among children. For each topic there were three lessons. The
first lesson focused on introducing the concept to be learned in an interactive class, the second
lesson was a DVD session and the third lesson was a discussion class that would emphasize the
points learned earlier and address students concerns about the topic learned. In the interactive
lesson children practiced educational activities that emphasized skill development, critical
observation, learning by modeling and practicing. The DVD session was to support the concepts
learned earlier, promote role modeling and promote positive attitudes toward a healthy lifestyle.
The discussion session triggered dialogue about the concepts learned earlier and got children‘s
feedback about what they learned. A summary of lessons used in this intervention is represented
in Table 13 in Appendix G.

46
Energy balance lessons introduced the students to the concepts involved in energy
metabolism and weight management. Students were able to articulate why food intake needs to
be balanced with physical activity. Lesson 1 was based on the Energy Balance lesson plan from
Program Energy school intervention lessons sponsored by Colorado State University (Program
Energy, 2010). Lesson 2 was a DVD session. Students watched ―What is a Calorie?‖ DVD, that
explains calories in food and how energy that comes in food is balance by being physically
active (School Media Associates, 2005). Lesson 3 used an open dialogue system that stimulated
questions and addressed students concerns about the topic learned.
The MyPyramid lessons introduced students to MyPyramid as a reliable tool that could
guide them toward healthy eating. Lesson 4 introduced the different food groups in MyPyramid
and the appropriate serving size of each group for children in fourth and fifth grade. The students
identified and matched different foods to their appropriate food group using a Food Pyramid
model. In lesson 5 a DVD called ―Food Smart: My Pyramid for Kids‖ was used to recap the
purpose of MyPyramid and to represent peer modeling of students of similar age (Discovery
School, 2006). Lesson 6 reviewed the main purpose of MyPyramid as a guide for children who
want to be healthy and presented a discussion about the counterproductive and competitive
media messages about junk food.
Lessons covering the portion size topic were represented to develop a better
understanding of appropriate portion sizes. In lesson 7 food models were used to provide visual
reinforcement about appropriate portion sizes of different food groups and were compared to
some current larger serving sizes. Also in this lesson students were introduced to the plate
method, food scales, and the use of comparable materials to estimate food portion sizes. This
allowed students to perform critical analysis by creating a full day‘s menu of three meals using a

47
math activity sheet obtained from MyPyramid. Lesson 8 was a video session that focuses on
reinforcing the concept of appropriate portion size and how the consumption of bigger portions
nowadays is associated with bigger health problems. The ―Portion Distortion DVD‖ was
intended to explain the consequences of the change in food portions over decades and teach
students how to measure portions using easy to understand analogies (Human Relations Media,
2004). Lesson 9 encouraged the dialogue about whether students can relate the concepts learned
about portion distortion to examples of their own experiences and observations at school, home,
grocery stores and restaurants.
The last topic covered in this curriculum was healthy eating. Lesson 10 dealt with
protein, carbohydrate, fat and fiber content in food. Students had the opportunity to see and
compare sugar, fat and fiber content of different foods using label reading and examining tubes
of fat, sugar and fiber. For example students identified and compared sugar content of three
brands of cereals by reading the label for sugar content and by comparing three test tubes filled
with sugar that each represents a different cereal brand. An emphasis on nutrient dense versus
caloric dense food allowed students to compare different foods based on label reading and
develop a better sense of what is a healthy food choice. Lesson 11 focused on healthy snacking
and the importance of breakfast. Students practiced preparing their own healthy snacks by
preparing vegetarian sandwiches and decorative cantaloupe balls using fruit scoops. This activity
was intended to let students practice healthy eating in a sharing and encouraging environment
with their peers. Lesson 12 reviewed the concept of healthy snacking and the importance of
breakfast. Finally, students were allowed to share their lunch boxes‘ contents as a demonstration
of everyday food choices made by students and their parents. Materials used for each lesson are
provided in Appendix H.

48
Supportive Educational Materials & Incentives
Parents are the gatekeeper when it comes to food choices offered to their children and
they certainly play a key role in shaping the dietary habits of their children. A total of four
parental letters covering the four major topics in the curriculum were sent home explaining
briefly what their child learned in school. The purpose of these letters was to inform parents
about the activities their child performed at school and to encourage discussion about the topics
learned.
Posters about MyPyramid servings, Portion Distortion and healthy snacking were
distributed and posted in the hallways and classrooms to create an environment conducive to
healthy eating. In-class incentives such as bookmarks with a nutritionally sound message about
healthy snacking or illustrations of the food pyramid were given to students for active
participation. Other class incentives used were stickers, stamps with fruit and vegetable symbols
and crayons.
The children were encouraged to consume five servings of fruit and vegetable every day.
Fruit and vegetable wrist bands were distributed at the end of lesson 10. Each student was given
a total of five colorful bands (i.e., three vegetable bands and two fruit bands). This method
served as both a reminder and a way to count fruit and vegetable serving per day. For each
serving consumed, a child could remove one fruit band from his left hand to his right hand and
so on until he consumed all of his servings. This was a great tool to encourage students to
implement what they learned at school in home.
To encourage students to complete all program requirements they received a ticket to the
Scientific Center in Kuwait upon their completion of all program activities, pre-/post-surveys,
pre-/post-diet records and program evaluation.

49
Instrumentation
Measures for both quantity and quality were used in this study to build a comprehensive
picture about the effectiveness of using a school-based nutrition intervention in Kuwait. Using
both quantitative and qualitative measures ensured a greater understanding of the group studied
and provided a more purposeful evaluation of the program. Program evaluation checklists
collected during a post program evaluation session represent the qualitative data collected in this
study. The quantitative measures used in this study were a nutrition survey and a 3-day food
record analysis.
Survey. Reflecting the pre-/post-design of the study, students completed a self-
administered survey prior to the intervention and at the end of the intervention. Demographic
data on gender, age, grade level and nationality were collected through self-report on the pre-
survey.
The survey used in this study consisted of two major sections: nutrition knowledge and
psychological determinants of nutrition behaviors. The nutrition knowledge part of the survey
was specifically developed to test the concepts covered in lessons. There were four questions for
each topic: questions 1-4 for energy balance, 5-8 for MyPyramid, 9-12 for portion size and 13-16
for healthy snacking. These knowledge questions were intended to directly measure what the
students learned from the curriculum. The questions were reviewed by a panel of experts in the
fields of nutrition and elementary education.
The psychological determinants of nutrition behaviors part of the survey covered
questions about attitudes toward a healthy lifestyle, dietary practices and self-efficacy. This part
of the survey was adopted from the CATCH Kids Club pilot study designed for third, fourth and
fifth grade students (Kelder et al., 2005). The survey used in CATCH Kids Club pilot study was

50
designed to measure behavioral and psychosocial variables. Survey items in the CATCH Kids
Club study were modified from two questionnaires: the Health Behavior Questionnaire and the
School-Based Nutrition Monitoring Student Questionnaire, both with an acceptable internal
consistency of greater than 0.6 (Edmundson et al., 1996; Hoelscher, Day, Kelder, & Ward,
2003). The three attitude questions used in this study are intended to measure students‘ attitudes
toward a healthy lifestyle both before and after participating in the Let‘s Eat Smart program. The
dietary practices section contained five questions that measured fast food consumption, breakfast
skipping, caloric-dense food snacking, fruit intake and vegetable intake. There were five self-
efficacy questions that measured the students‘ confidence in making a healthy dietary choice (see
Appendix I for the complete survey questions).
Food records. Each student was requested to complete a 3-day food record representing
two school days and one weekend day at the beginning and at the end of the intervention, to
investigate the students‘ dietary intake as a collective group.
The food record instrument in this study was divided into possible meals and snacking
periods during the day. Illustrations for each time period were used to raise interest in recording
by making it simple and appealing. Precision is also important therefore, students were asked a
yes/no question about whether they ate at each meal or snacking period and if they did, they were
asked to write what did they ate. The reason for using this diet record was to not only examine
food intake but also to determine food intake patterns especially for breakfast (Appendix J).
The primary investigator instructed students on the how to keep a 3-day food record. The
instructions were age-appropriate and emphasized recording all food and drink consumed during
3 consecutive days, 2 weekdays and 1 weekend day. Students were asked to record detailed
information about their dietary intakes, such as brand names, ingredients of mixed dishes, food

51
preparation methods, estimates of amount consumed and food origin (e.g. home, school or
restaurant). Written examples and simple guidelines about keeping a 3-day food record were
given to students, and they were allowed to ask their guardians to assist them in recording their
food intake. Students were asked to complete their food records together with their parents to
increase the accuracy of their dietary report. The food and beverages could be recorded in either
English or Arabic to account for cultural and local dishes that cannot be described in English. To
get students to complete food records in a timely manner, each student received a packet of
crayons upon completion of each diet record.
Program evaluation. The purpose of the evaluation was to determine whether the Let‘s
Eat Smart curriculum was comprehensible, appealing, memorable, culturally sensitive and
personally relevant to the students.
Following the intervention, a total of five, group qualitative evaluation sessions were
conducted (i.e., one 45 minutes session per each). Topics presented during the evaluation
sessions included students‘ opinions on the strengths and weaknesses of the program.
Throughout the group session, open-ended questions were asked to examine students‘
acceptability of the lessons, including an evaluation of the lectures and in-class activities. Each
student was able to report his/her opinion on a checklist in order to get structured and well
thought-out feedback (Appendix K). The students‘ checklist was adopted from another study and
modified to fit the nature and purpose of this program (DuBroc, 2007).
The theme questions that were used in the session are shown in Table 2. During the
group evaluation session a discussion about each question on the checklist was encouraged. The
primary investigator asked the question, then promoted a short controlled discussion and then
allowed some time for students to report their ideas about that specific question. This process

52
continued until all questions on the checklist were answered. The checklist prompted students to
comment on concepts learned during the program and aided in organizing the data collection
throughout the group evaluation session. Also the checklists provided a way to communicate
opinions freely and anonymously especially for those students who would not share their opinion
publicly. In addition to the checklist the primary investigator notated students‘ verbal feedback
for further analysis.
Table 2
Themes Tested During Group Evaluation Sessions
Theme tested Sample Questions
Comprehension
& awareness
―What is the main idea that we are covering in this program or the
purpose of the program?‖
―What would you say is the main thing you learned from this program?‖
Practicality &
usability
―Name some things you liked/disliked about the lessons.‖
―Did you like the activities and did the DVD session aid in learning?
Overall Impact ―Are you interested in seeing more of this program?‖
Relevance &
Interest
―Did you share what you learned with your parents?‖
―What else you would like to know about not covered in lessons?‖
Data Analysis
For quantitative analysis, only complete data sets collected from students were analyzed
(i.e., students who had some or all missing diet records or surveys were not included) because
the primary aim was to examine the changes from pre- to post-intervention. Qualitative data
analysis included even those who did not complete some diet records or surveys because the aim
was to investigate all feedbacks. The qualitative analysis included feedback from students‘
checklists and the primary investigator notes from the group evaluation sessions.

53
Quantitative data analysis. The pre- and post-surveys were graded manually. Data
collected from the surveys and food records were coded for analysis. The data was analyzed
using Statistical Program for Social Sciences (SPSS) version 19.0 for Windows. Significance for
all analyses was set at p < .05.
Survey. The questions in the survey were divided into four major sections; nutrition
knowledge questions (16 items), attitude questions (3 items), dietary practices questions (5
items) and self efficacy questions (5 items). Each nutrition knowledge item had four answer
options. Each correct response was allocated 1 point and each incorrect or no response was
allocated 0 points. Each attitude item was on a 3 point-scale. The dietary practices items were
assessed individually on a 4 point-scale. The self-efficacy five items had three answer options.
The maximum scores for nutrition knowledge, attitude, dietary practices and self-efficacy items
were 16, 6, 3 and 10 respectively, with higher scores indicating higher knowledge, positive
attitude, better dietary practices and higher self-efficacy. The minimum score for all was zero.
Examples of questions and response scales that covered each section of the survey are illustrated
in Table 3.
Frequency analysis was used to provide descriptive characteristics of the sample,
including age, grade, gender, and nationality. Individual survey items, as well as scale scores,
were compared at pre- and post-survey. For each scale, a Cronbach‘s alpha was performed to
determine the reliability. Scales in this survey include nutrition knowledge scale, attitude scale
and self-efficacy scale. Dietary practices items were analyzed independently. Tabulation of
frequency counts, percentages and paired t-tests were completed to determine if there were any

54
changes in students‘ nutrition knowledge, attitude, dietary behaviors and self-efficacy before and
after the intervention.
Table 3
Survey Sections’ Response Scales and Sample Questions
Note. The possible response scales include the following: A: 0 = Incorrect, 1 = Correct; B: 0 =
Not important, 1 = Somewhat important, 2= Very important; C: 3 = Never, 2 = Sometimes, 1 =
Frequently, 0 = Daily; D: 3 = None, 2 = One-time, 1 = Two-times, 0 = Three-times or more; E: 0
= None, 1 = One-time, 2 = Two-times, 3 = Three-times or more; F: 0= Not sure, 1= Little sure,
2= Very sure.
Food records. The purpose of collecting 3-day food records was to analyze students‘
intake of breakfast and food groups from MyPyramid. Food records were coded and analyzed to
examine MyPyramid food groups‘ intake using the most up-to-date version of ―Nutritionist Pro‖
diet software, version 6.4 (Nutritionist Pro, 2010). This software is culturally relevant as its data
base include over 20,000 foods and ingredients including brand-name foods, fast foods, and
Survey section No. of
Items
Sample Item Response
Scale
Nutrition Knowledge
Questions
16 What do we call the unit of energy that comes
from the food we eat and what we drink?
A
Attitude Questions 3 How important is eating healthy to you? B
Dietary Practices
Questions
Fast Food
Consumption
1 Think about last week. How frequently did
you eat food from a fast food restaurant?
C
Breakfast Skipping
1 Think about last week. How frequently did
you skip eating breakfast? C
Caloric-dense Food
Snacking
1
Yesterday did you eat snacks like candy,
chocolate, chips, cookies, cake or ice-cream?
D
Fruit Intake
1 Yesterday, did you eat fruit? E
Vegetable Intake
1 Yesterday, did you eat any vegetables? E
Self Efficacy
Questions
5 How sure are you that you can eat fresh fruit
instead of a candy bar? F

55
ethnic foods of Arabian, Indian and Mediterranean origin. The Kuwaiti diet is mostly influenced
by these cuisines in addition to the popular westernized diet. The Nutritionist Pro software is
validated in the literature. Several studies have used this software to analyze food intake in youth
populations of different ethnicity and nationalities (Davis et al., 2005; Kontogianni et al., 2008;
Borradaile et al., 2009). The 3-day food record was analyzed to include two weekdays and one
weekend day. For each student, intake of MyPyramid food groups for the three days was
averaged to allow for a more accurate quantification and representation of usual intake. Food
groups that were evaluated include grains (in ounces), meat and beans (in ounces), milk (in
cups), fruit (in cups) and vegetable (in cups). Paired t-tests were used to compare intake of My
Pyramid food groups from pre to post intervention. In addition, frequencies were used to
compare breakfast intake before and after the intervention.
Qualitative data analysis. Qualitative data collected from students‘ checklists and the
primary investigator notes during group evaluation sessions assessed: student acceptability of the
lessons, main ideas students grasped form the lessons, lesson materials and activities, lesson
difficulty and comprehension of the lessons. Student‘s comments provided on the checklists and
form the investigator notes were collected, combined, analyzed and summarized in a tabular
format. Mainly, the checklists were reviewed for common themes and messages. These
comments provided by students were coded into categories to derive a list of positive and
negative comments about the curriculum. The purpose of analyzing student‘s feedback was to
generate a concrete list of recommendations for curriculum revision.
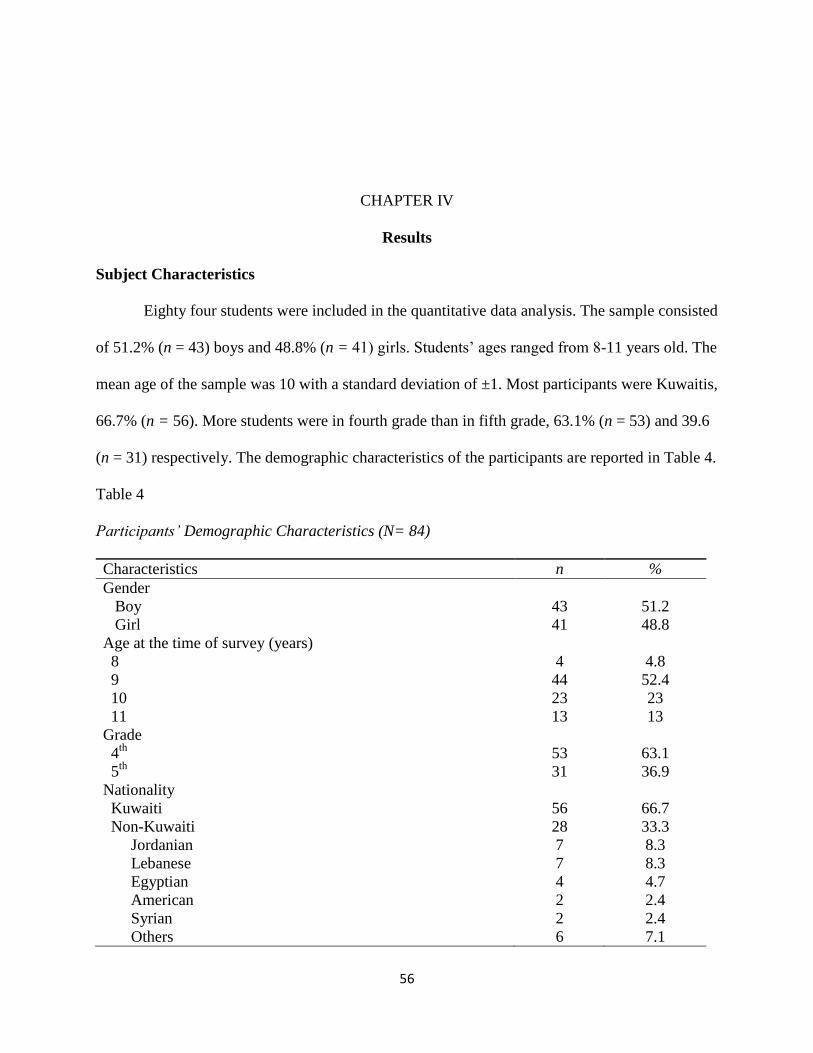
56
CHAPTER IV
Results
Subject Characteristics
Eighty four students were included in the quantitative data analysis. The sample consisted
of 51.2% (n = 43) boys and 48.8% (n = 41) girls. Students‘ ages ranged from 8-11 years old. The
mean age of the sample was 10 with a standard deviation of ±1. Most participants were Kuwaitis,
66.7% (n = 56). More students were in fourth grade than in fifth grade, 63.1% (n = 53) and 39.6
(n = 31) respectively. The demographic characteristics of the participants are reported in Table 4.
Table 4
Participants’ Demographic Characteristics (N= 84)
Characteristics n %
Gender
Boy
Girl
43
41
51.2
48.8
Age at the time of survey (years)
8
9
10
11
4
44
23
13
4.8
52.4
23
13
Grade
4th
5th
53
31
63.1
36.9
Nationality
Kuwaiti
Non-Kuwaiti
56
28
66.7
33.3
Jordanian
Lebanese
Egyptian
American
Syrian
Others
7
7
4
2
2
6
8.3
8.3
4.7
2.4
2.4
7.1

57
Quantitative Data (Survey)
Students were asked 16 questions about nutrition knowledge, three questions about
attitude, five questions about dietary practices and five questions about self efficacy. All
nutrition knowledge questions collectively were analyzed as a scale by comparing pre-/post-
survey means. Means were also compared from pre- to post-tests for attitude scale and self
efficacy scale. Each question in the dietary practices section was analyzed individually by
comparing means from pre- to post-surveys. In addition, changes in percentages were reported
for each question from pre- & post-tests for an in depth analysis.
Reliability analysis. For this survey internal reliability analyses (Cronbach‘s α) were
performed for nutrition knowledge scale, attitude toward healthy lifestyle scale and self-efficacy
scale. Internal reliability analysis for each scale is presented in Table 5 and was considered to be
acceptable if Cronbach's α was greater than 0.6 (Sim & Wright, 2000, p. 257).
Both pre-test and post-test nutrition knowledge scale had a reliability coefficient of 0.45
and 0.42 respectively which is below the 0.6 threshold. Therefore, percentages for each nutrition
knowledge item were calculated to provide an in depth analysis of the change in nutrition
knowledge parameter form pre-test to post-test period. The attitude toward healthy lifestyle scale
and self efficacy scale had reliability coefficients almost slightly below and can be rounded to
0.6. This could be attributed to the small number of items (3-5 items) included in each scale.

58
Table 5
Internal Reliability (Cronbach’s α) for: Nutrition Knowledge scale, Attitude toward Healthy
Lifestyle scale and Self Efficacy Scale
Scale No. of
items
Sample item Response
Scalea
Cronbach‘s α
Pre Post
Nutrition
Knowledge
16 What do we call the unit of energy
that comes from the food we eat and
what we drink?
A .45 .42
Attitude toward
healthy lifestyle
3 How important is physical activity to
you?
B .63 .59
Self-efficacy 5 How sure are you that you can eat
fresh fruit instead of a candy bar?
C .57 .56
Note. Cronbach‘s α = index of internal reliability, Pre= Pretest, Post= Posttest. aThe possible response scales include the following: A: 0= Incorrect, 1=Correct; B: 0= Not
important, 1= Somewhat important, 2= Very important; C: 0= Not sure, 1= Little sure, 2= Very
sure.
Nutrition knowledge. There were 16 nutrition knowledge items with 0 being the
minimum possible score and 16 being the maximum possible score. A paired-samples t-test was
conducted to evaluate the impact of the intervention on student‘s nutrition knowledge scores.
There was a statistically significant increase in nutrition knowledge scores from pretest (M =
4.95, SD = 2.33) to posttest (M = 9.43, SD = 2.39), t(83) = -12.81, p < .0001, ES = 0.8.
The nutrition knowledge section of the survey covered the major four topics conveyed in
the intervention lessons with a total of four questions relating to each topic. Percentages of
correct answers for nutrition knowledge were calculated and students improved from pretest to
posttest for every question except question three, the calorie definition, which had 32.1% correct
answers at pretest compared to 31% correct at posttest. Figure 6 shows a comparison between
percent correct responses at pretest and at posttest for each nutrition knowledge question.

59
Figure 6. Comparison of percentages of correct responses for each nutrition knowledge question
between pretest & posttest.
Table 6 includes the percent change for each nutrition knowledge question. The most
positive magnitude of change was observed in questions 5-9 that asked about the MyPyramid
topic. Also question nine about serving size, had a large 45.6 percent change. The lowest percent
changes were found in question 11 about cup estimate (11.9% change), question 16 about
energy-dense food definition (10.7% change) and question 14 about healthy snacking (17.8%
change). The only question with negative percent change is the question about calorie definition
(-1.1% change).
0% 20% 40% 60% 80% 100%
1. Exercise
2. Goal steps
3. Calorie
4. Food calories
5. Guide
6. Purple
7. Active minutes
8. Grain
9. Serving size
10. Fruit & vegetables
11. Cup estimate
12. Cups of dairy
13. Healthy drink
14. Healthy snack
15. Fiber
16. Energy-dense
%Correct
Nu
trit
ion
Kn
ow
led
ge Q
ues
tio
ns
Post-test
Pre-test

60
Table 6
Percent Change in Correct Responses for Nutrition Knowledge Items
Variable % Correct at
pretesta
% Correct at
posttestb
% change
Energy Balance
1. Exercise 29.8 54.8 25.0
2. Goal steps 17.9 41.7 23.8
3. Calorie 32.1 31.0 -1.1
4. Food calories 31.0 59.5 28.5
MyPyramid
5. Guide 26.2 83.3 57.1
6. Purple 34.5 71.4 36.9
7. Active minutes 28.6 65.5 36.9
8. Grain 8.3 75.0 66.7
Portion Size
9. Serving size 20.2 66.7 46.5
10. Fruit & vegetables 42.9 67.9 25.0
11. Cup estimate 40.5 52.4 11.9
12. Cups of dairy 20.2 41.7 21.5
Healthy Snacking
13. Healthy drink 66.7 88.1 21.4
14. Healthy snack 17.9 35.7 17.8
15. Fiber 47.6 67.9 20.3
16. Energy-dense 31.0 41.7 10.7
Note. The four topics covered in the intervention are: energy balance (questions 1-4),
MyPyramid (questions 5-8), portion size (questions 9-12) & healthy snacking (questions 13-16). a percent of students who answered correctly at pretest.
b Percents of students who answered
correctly at posttest.
In order to further understand the change in students‘ responses on the knowledge
questions from pretest to posttest, Table 7 point out that for each individual knowledge question
frequencies were used to identify: the percentage of students who answered pre/post questions
both correctly, the percentage of students who answered pre/post questions both incorrectly, the
percentage of students who answered incorrectly at pre and correctly and post, and the
percentage of students who answered correctly at pre and incorrectly at post.

61
Table 7
Analysis of Nutrition Knowledge Items as: Pre & Post Correct responses, Pre & Post Incorrect
Responses, Improved Responses and Diminished Responses
Item Pre & Post
Correct
n(%)
Pre & Post
Incorrect
n(%)
Improved
n(%)
Decreased
n(%)
Energy Balance
1. Exercise 13(15.5) 26(31.0) 33(39.3) 12(14.3)
2. Goal steps 7(8.3) 41(48.8) 27(32.1) 9(10.7)
3. Calorie 10(11.9) 42(50.0) 17(20.2) 15(17.9)
4. Food calories 16(19.0) 24(28.6) 34(40.5) 10(11.9)
MyPyramid
5. Guide 17(20.2) 9(10.7) 53(63.1) 5(6.0)
6. Purple 22(26.2) 17(20.2) 38(45.2) 7(8.3)
7. Active minutes 17(20.2) 22(26.2) 38(45.2) 7(8.3)
8. Grain 6(7.1) 20(23.8) 57(67.9) 1(1.2)
Portion Size
9. Serving size 11(13.1) 22(26.2) 45(53.6) 6(7.1)
10. Fruit & Veg. 24(28.6) 15(17.9) 33(39.3) 12(14.3)
11. Cup estimate 22(26.2) 28(33.3) 22(26.2) 12(14.3)
12. Cups of dairy 5(6.0) 37(44.0) 30(35.7) 12(14.3)
Healthy snacking
13. Healthy drink 51(60.7) 5(6.0) 22(26.2) 6(7.1)
14. Healthy snack 14(16.7) 53(63.1) 16(19.0) 1(1.2)
15. Fiber 29(34.5) 16(19.0) 28(33.3) 11(13.1)
16. Energy-dense 14(16.7) 38(45.2) 20(23.8) 12(14.3)
Note. The four topics covered in the intervention are: energy balance (questions 1-4),
MyPyramid (questions 5-8), portion size (questions 9-12) & healthy snacking (questions 13-16).
Pre & Post Correct = those who answered pre/post questions both correctly; Pre & Post Incorrect
= those who answered pre/post questions both incorrectly; Improved = those who answered
incorrectly at pre and correctly and post; Decreased = those who answered correctly at pre and
incorrectly at post.
By examining question 13 in Figure 7, it is clear that students had a good knowledge of
what is a healthy drink as 60.7% answered correctly on both pre and post surveys compared to
26.2% of those who improved from pre to post survey. In contrary, for question 14 student were
unable to recognize what a healthy snack option would be as 63.1% answered incorrectly at both
pre and post surveys compared to 19% of those who improved. The impact of the intervention
on nutrition knowledge is most noticeable in question five to nine. Answers to question five

62
shows that, because of the intervention students are more familiar with that MyPyramid as a
guide for what they should eat as 63.1% improved their answers from pre to post. Also, in
question eight 67.9% improved from pre to post and became more aware after the intervention
that the food group that they should eat most from is the grain group.
Figure 7. Evaluation of: improved test scores, correct test scores at pre & post and incorrect test
scores at pre & post for each nutrition knowledge questions.
Attitude. Students were asked three questions regarding attitude toward a healthy
lifestyle. For the attitude scale zero represent the minimum and six represent the maximum
possible points on the scale. Students‘ improvement in attitude toward a healthy lifestyle
improved significantly from pretest (M =5.00, SD =1.15) to posttest (M=5.33, SD =1.07), t(83) =
-2.037, p < .043, ES = 0.2.
0% 20% 40% 60% 80%
1. Exercise
2. Goal steps
3. Calorie
4. Food calories
5. Guide
6. Purple
7. Active minutes
8. Grain
9. Serving size
10. Fruit & vegetables
11. Cup estimate
12. Cups of dairy
13. Healthy drink
14. Healthy snack
15. Fiber
16. Energy-dense
Percentages of Students
Nu
trit
ion
Kn
ow
led
ge Q
ue
stio
ns
Improved from Pre to Post
Correct at Pre & Post
Incorrect at Pre & Post

63
To further examine responses for each question on the attitude scales counts and
percentages are reported for each question‘s responses. Students were asked three attitude
questions about healthy eating, physical activity and health education at school. The majority of
students ranked eating healthy, being physically active and health education at school as either
very important or somewhat important to them in both pretest and posttest. For all three
questions, the percentages of those who answered not important were consistently low from
pretest to posttest and were not considerably different. Tabular and graphical presentations of
attitude questions are depicted in Table 8 and Figure 8.
Table 8
Participant’s Responses on Attitude Questions
Pre Post
Attitude n % n %
Healthy Eating
Not important
Somewhat important
Very important
3
23
58
3.6
27.4
69.0
3
14
67
3.6
16.7
79.8
Physical Activity
Not important
Somewhat important
Very important
2
30
52
2.4
35.7
61.9
1
19
64
1.2
22.6
76.2
School Health Education
Not important
Somewhat important
Very important
3
15
66
3.6
17.9
78.6
3
9
72
3.6
10.7
85.7

64
Figure 8. Comparison of attitude questions responses from pretest to posttest.
Dietary practices. There were no significant differences from pretest to posttest in the
four dietary practices that were assessed in the survey: breakfast skipping, caloric-dense food
snacking, fruit intake and vegetable intake (p = .655, p = .928, p = .320, p = .360) respectively.
Only fast food consumption behavior was significantly improved from pretest (M = 2.04, SD =
0.65) to posttest (M = 2.29, SD = 0.51), t(83) = -3.49, p < .001, ES = 0.4 (Table 9).
Points allocated for each response on the answer‘s scale are noted in Table 9 with a
possible minimum of zero and a maximum of three for each question. Analyzing means
provides a general picture of change from pretest and posttest but cannot explain how students
responded on each question. To further examine students‘ responses on each dietary practice
question; percentages for each response were calculated and are presented in Table 14 in
Appendix L.
3.6% 3.6% 2.4% 1.2%3.6% 3.6%
27.4%
16.7%
35.7%
22.6%17.9%
10.7%
69.0%
79.8%
61.9%
76.2%78.6%
85.7%
0.0%
10.0%
20.0%
30.0%
40.0%
50.0%
60.0%
70.0%
80.0%
90.0%
Pre Post Pre Post Pre Post
Healthy Eating Physical Activity Health Education
Not important Somewhat important Very important

65
Table 9
Means of Dietary practice Questions at Pretest and Posttest
Pre(N=84) Post(N=84)
Dietary Practice Question M SD M SD df t p
Fast Food Consumption 2.04 0.65 2.29 0.51 83 -3.49 .001*
Skipping Breakfast 1.98 1.01 2.04 0.96 83 -0.45 .655
Caloric-dense Food Snacking 1.98 1.01 1.99 0.90 83 -0.09 .928
Fruit Intake 1.52 1.23 1.65 1.22 83 -1.00 .320
Vegetable Intake 1.19 1.09 1.31 1.16 83 -0.92 .360
Note. Fast Food Consumption & Skipping Breakfast answer scale: 3 = Never, 2 = Sometimes, 1
= Frequently, 0 = Daily; Caloric-dense Food Snacking answer scale: 3 = None, 2 = One-time, 1
= Two-times, 0 = Three-times or more; Fruit Intake & Vegetable Intake answer scale: 0 = None,
1 = One-time, 2 = Two-times, 3 = Three-times or more.
* p < 0.05.
Self efficacy. The scale of self efficacy is represented by five questions with zero being
the possible minimum score and 10 being the maximum. Students were asked how sure they that
they can consume: skim instead of regular milk, fruit instead of candy, baked potato instead of
French fries, fruit juice instead of soft drink and brown instead of white bread. Possible answer
responses for each question were: not sure, little sure and very sure. The improvement in self
efficacy from pre-test (M = 6.49, SD = 2.46) to post-test (M = 7.14, SD = 2.17) was statistically
significant, t(83) = -2.52, p < .014, ES = 0.3.
Quantitative Data (Food Record)
MyPyramid food group servings. Table 10 gives the mean number of servings of each
food group at pretest and posttest. Significant differences in means were found only in the
number of vegetable and fruit servings. Vegetables servings increase significantly from pretest
(M = .967, SD = .645) to posttest (M = 1.27, SD = .841), t(83) = -3.34, p < .001, ES = 0.34. Fruit
servings also increased from pretest (M = 1.41, SD = 1.04) to posttest (M = 1.68, SD = .981),
t(83) = -2.34, p < .022, ES = 0.25.

66
Table 10
Comparison of Food Groups Intake from Pretest to Posttest
Pre Post
Food Groups
Intake
M
SD
Min
Max
M
SD
Min
Max
df
t
p
Grainsa
6.93 1.89 1 17 6.81 1.82 .5 14.5 83 .473 .637
Vegetablesb .967 .645 0 6.3 1.27 .841 0 8 83 -3.34 .001*
Fruitsb 1.41 1.04 0 7 1.68 .981 0 5.5 83 -2.34 .022*
Milkb 2.23 .992 0 7.8 2.21 1.01 0 6.8 83 .18 .858
Meat&Beana 6.36 2.68 0 16 6.29 2.50 0 18 83 .235 .815
Note. Numbers of servings recommended by MyPyramid for each food group are: Grain = 6
ounces, vegetable = 2.5 cups/day, fruits = 1.5 cups/day, Meat & Bean= 5 ounces/day, Milk = 3
cups/day. The mean servings of each food group was compared from pre to post-intervention
period and also compared to the recommended serving in MyPyramid. aServing in ounces.
bServing in cups.
*p < 0.05
A comparison of the pretest/posttest food group intakes to MyPyramid recommendations
is presented in Figure 9. When compared to the MyPyramid recommendation for grain intake (6
ounces/day), students consumed more servings of grains on average at both pre- and post-test
(6.93 and 6.81 ounces/day respectively). Numbers of meat & bean servings were also higher at
pretest (6.36 ounces/day) and at posttest (6.29 ounces/day) than MyPyramid recommendations (5
ounces). The amount of milk at both pretest and post test were equal (2.2 cups), but still lower
than what is recommended by MyPyramid (3 cups). Although, there was a significant
improvement in vegetable intake (.967 to .841 cups/day), it is still below the MyPyramid
recommendation. The significant increase in fruit intake from pretest (1.41cups/day) to posttest
(1.68 cups/day) is slightly above what is recommended by MyPyramid (1.5 cups/day).

67
Figure 9. Comparison of food groups servings in pretest and posttest to MyPyramid
Recommendations.
Breakfast intake. The food record instrument developed for this intervention examined
food intake and food intake patterns. There was a specific focus on breakfast intake because of
its known health benefits. Overall, the numbers of those who had breakfast were more than those
who didn‘t across the three days of food record period (Table 11).
Table 11
Breakfast Intake as Reported in the 3-Day Food Records
Pre Post
Breakfast intake n % n %
Day 1
Skipped breakfast 25 29.8 18 21.4
Had breakfast 59 70.2 66 78.6
Day 2
Skipped breakfast 26 31.0 26 31.0
Had breakfast 58 69.0 58 69.0
Day 3 (weekend)
Skipped breakfast 19 22.6 18 21.4
Had breakfast 65 77.4 66 78.6
6.9
0.97 1
2.2
6.46.8
1.31.7
2.2
6.36
2.5
1.5
3
5
0
1
2
3
4
5
6
7
8
Grain(ounces) Vegetables(cups) Fruits(cups) Milk(cups) Meat & Beans(ounces)
Nu
mb
er
of
se
rvin
gs
Food Groups
Pre Post MyPyramid Recomindations

68
There was a decrease in the percent of those who skipped breakfast from pre-intervention
(29.8%) to post-intervention (21.4%) during day 1. During day 2 and day 3 the percentages of
those who skipped breakfast were not significantly different from pretest to posttest and
remained lower than those who had breakfast (Figure 10).
Figure 10. Breakfast intake according to the 3-day food records.
Qualitative Data (Program Evaluation)
Ninety five students participated in the group evaluation session. Overall, the students
mostly provided comments that are in favor of the Let‘s Eat Smart program. Examples of
comments that were thoughtful and significant are presented in a tabular format in Appendix M.
Comprehension and awareness. When asked about awareness, students clearly
recognized the purpose of the program as having a balanced diet and choosing their food in a
way that would mostly benefit their health. In regard to students‘ comprehension of the lessons,
those who reported they comprehended the lessons (96.8%, n = 92,), were more than those who
29.8%
21.4%
31.0% 31.0%
22.6% 21.4%
70.2%
78.6%
69.0% 69.0%
77.4% 78.6%
0.0%
10.0%
20.0%
30.0%
40.0%
50.0%
60.0%
70.0%
80.0%
90.0%
Pre Post Pre Post Pre Post
Day 1 Day 2 Day 3
Skipped breakfast Had breakfast

69
stated they did not understand (3.2%, n = 3). Several topics notated in checklists as the main
things the students learned were: choosing foods that benefit their bodies is important, the energy
concept of balancing diet with exercise, following MyPyramid as a trust worthy resource, the
type of food and portion size they eat matters and could benefit or harm their bodies, and fruit
and vegetables are good for health. Some of the topics that students did not understand were
calories, food labels, food nutrients, and reasons why bad eating habits lead to obesity and
chronic diseases. Some of the students‘ comments are listed in Table 15 in Appendix M.
Practicality and usability. When asked about if they liked the lessons and activities or
not, 95.8% liked the lessons (n = 91) and 4.2% did not (n = 4). Some of the things students liked
are: MyPyramid activity, preparing healthy snacks, incentives, outside activities, fruit and
vegetables bands and food models. Students mentioned that they didn‘t like: the idea of eating
more fruits and vegetables, the need to limit fast food consumption, the exercise activity and the
lack of resources such as few tables and not having enough space in class. Students‘ opinions
were divided on the usefulness of the DVD session in helping them learn about previous lessons.
Eighty five students (89.5%) thought that the DVD session helped them to learn compared to 10
who thought that it did not help (10.5%). Those who thought the DVD was interesting liked the
use of illustration on the DVD, learning about other role models, and the MyPyramid camp
activity. Those who did not like the DVD thought that it would help to: do more in-class
activities, watch something culturally relevant to Kuwait, do more experiments with food, and do
more cooking classes. Some also noted that the characters in the DVD talked too fast, and some
said that they didn‘t understand some words (Table 16 in Appendix M).

70
Relevance and interest. During the program evaluation session more students reported
that they shared what they learned in the Let‘s Eat Smart program with their parents than those
who did not share with their parents, 82.1% (n= 78) and 17.9% (n=17) respectively. The ones
who shared what they learned with their parents talked with them about things like: importance
of healthy eating, benefits of fruits and vegetables, MyPyramid as a guide, and food labels. On
the other hand, students who didn‘t share what they learned mentioned several reason of why
they didn‘t such as: didn‘t have time because of homework, forgetting to do so, didn‘t feel like
talking, their parents would not care about such matters, and they don‘t have to share because
they already have healthy food at their home. Only 15.8% of students showed desire to learn
things that were not covered in these lessons (n = 15). Some of the things they would like to
know about were: exercise and its benefits, pedometers, food measures, fast food, oil intake
effects on health, chocolate, and how to avoid food pesticides (Table 17 in Appendix M).
Overall Impact. On the checklists 90.5% of the students declared that they would
participate in more Let‘s Eat Smart lessons (n = 86) compared to 9.5% who would not like to do
so (n = 9). Additional comments are listed in tabular format at the end of Appendix M in Table
18.

71
CHAPTER V
Discussion
The purpose of this study was to investigate the effectiveness of the Let‘s Eat Smart
Program and its curriculum for elementary school students in Kuwait with a pre-/post- evaluation
design. The specific objectives for students receiving the program included: increasing nutrition
knowledge, improving attitude toward a healthy lifestyle, enhancing self-efficacy for dietary
change and improving dietary practices.
At the preliminary phase, the high return rate of parental consent forms for this study may
have been due to the short length of the lessons, and the recommendations of the school principal
to conduct the lessons within the National Awareness class period. Parents were not anxious
about their children having to spend extra time attending extra class hours and were enthusiastic
to let their children be a part of an international study.
Out of the 110 students in this study, only 84 students completed all the program
requirements. Even though incentives offered to the students did help participation rates by
encouraging them to have their surveys and diet records completed and returned on time, some
students had difficulty comprehending what they needed to do. Incentives included stickers, fruit
stamps, bookmarks, and crayons. Upon program completion students received a ticket to The
Scientific Center at Kuwait. Students who did not complete the requirements (n = 26) explained
that they didn‘t have time, they didn‘t know how, or their parents didn‘t help because this was
optional. The short time window for each lesson, 15-20 minutes, may not have been enough for

72
some students to learn how to fill a diet record. Additionally, parents may not have received the
written instructions on how to help their children report a diet record or discarded the diet record.
Failure of young subjects to complete requirements is not unusual especially if there is low
parental support. Low parental participation has been shown to result in low final sample sizes
(Perry et al., 1998; Levine et al., 2002).
Most lost data in this study was due to uncompleted diet records rather than uncompleted
surveys (i.e., Only 90 students completed both pre- and post- diet records compared to 104
students who completed both pre- and post- surveys). This is because of a perceived higher
burden of completing a diet record (i.e., students had to take it home and record their diet for
three consecutive days) than completing a survey. Lack of survey completions were due to
absences. The numbers of students who completed both surveys were relatively high (n = 104)
because 40 minutes were given during the class period for students to complete the survey, and
questions were read out loud. Also, the nutrition lessons were delivered within the first segment
of the National Awareness classes; and that class was perceived as being important and required
mandatory attendance, which made students attend the whole class period including the time
specified for the nutrition lessons.
As mentioned previously, quantitative data was only analyzed those who completed all
program requirements because the main purpose was to report progress (i.e., compare pre- and
post-data). The sample size estimated for this study was 71 subjects and those who completed all
data were 84 out of 110 students (retention rate = 76.4%). Eighty four is a sufficient number
when compared to the estimated sample size, but still there is a limitation that not including the
missing results in analysis could lower the validity of the results being significant. Program
evaluation however collected quantitative data and was analyzed for all participants (n = 95 with
73
86.3% retention rate) even if they were missing other requirements. This was done to gather
collective feedback including that of those who were less motivated to complete all program
requirements.
One of the main objectives of this study was to assess improvements in nutrition
knowledge after the intervention. Nutrition knowledge was assessed by 16 questions and
Cronbach‘s α, an internal reliability measure, for the nutrition knowledge scale was lower than
the 0.6 cutoff point at both pretest and at posttest. Despite that, the nutrition knowledge was
analyzed as a scale for all 16 questions because according to Lowenthal (2001) it is feasible to
include items having internal reliability lower than the 0.6 cutoff point if they were theoretically
justified, valid, and practically reasonable. Adding more questions to assess nutrition knowledge
scale would improve reliability, but also it would be a burden to students. Also, too many
questions require longer time and may cause loss of interest in response.
The nutrition knowledge questions were validated as being related to the topics covered
in lessons and were intended to test the degree to which the students comprehended each topic in
the program. Validity may be more vital than reliability because if an evaluation is not measuring
what it supposes to, its use is unreasonable even if it measures consistently and is described as
reliable. Percentages for each question in the nutrition knowledge section were analyzed
separately to obtain a better understanding of the data rather than only looking at the change in
nutrition knowledge overall.
Due to limited resources, a sample of convenience was investigated for the pilot testing
of the Let‘s Eat Smart program and a better design would incorporate a control group.
Conducting extensive validity and reliability testing for the instruments before administration in
the study is a must, especially, because the instruments were being used for the first time in a

74
school in Kuwait. Validity and reliability testing is important to develop an effective assessment
or evaluation tool when being used with children of different cultural and income backgrounds.
(Siti Sabariah et al., 2006).
Overall improvement in nutrition knowledge was achieved (p < .0001) as students were
able to comprehend the nutritional messages conveyed to them. Despite that, nutrition
knowledge alone is not sufficient to modify health behaviors and should be not assessed solely to
reflect intervention success. When comparing the percent of correct answers at pretest to the
percent of correct answers at post test, students mostly improved in questions relating to the
MyPyramid topic. Similarly, the treatment group in a study by Robertson et al. (2005) improved
Food Guide Pyramid knowledge by 54% compared to a 41% improvement of control
participants.
What is more important is the investigation of true improvement in knowledge scores.
Therefore, another analysis was conducted to differentiate those who answered correctly at both
pre- and post- tests from those who improved (i.e., answered incorrectly at pretest but correctly
at posttest). The analysis provided a better insight about students‘ knowledge. For example,
students had a good knowledge of what is a healthy drink as 60.7% answered correctly on both
surveys compared to only 26.2% who improved. The largest number of students answered the
goal steps, calorie definition and healthy snacking questions incorrectly at both surveys, 48.8%,
50% and 63.1%, respectively. The question about what is a healthy snack option may be difficult
and complex to comprehend as students were unable to identify what is a healthy snack option,
(63.1% answered incorrectly at both surveys compared to 19% who improved). Better wording
of the questions and greater emphasis on these concepts during lessons would improve
responses. Also, distraction, misapprehension, lack of interest, lack of knowledge or guessing the

75
answers could all have contributed to decreased response rates or answering incorrectly on both
tests by some students. Increase in nutrition knowledge in other studies correlates with the
findings of this study. In an evaluation of a 6-week curriculum in fourth through sixth graders
Willeford et al. (2000) found that all students had significant increases from pre- to post-
intervention. Other studies that randomized students into treatment and control groups and found
a significant increase in nutrition knowledge in treatment groups compared to control groups
(Powers et al. 2005; Robertson et al. 2005).
Another objective of this study was to improve attitudes toward a healthy lifestyle. Three
items were assessed on the attitude scale with a significant improvement in attitude toward a
healthy lifestyle from pretest to posttest (p < .043). When comparing percentages of each
response for each item, most of the students rated being physically active, eating healthy and
health education at school as either somewhat important or very important. Reported attitudes
were highly positive at pretest and remained so at posttest. Having a positive attitude toward a
healthy behavior correlates with adopting that behavior (Baranowski, Cullen, Nicklas,
Thompson, & Baranowski, 2003). This is reflective of students‘ perception about health being a
priority which is promising for nutrition educators as they can assume student positive
receptiveness to nutrition instruction. Those who answered not important for all attitude
questions were consistently low in both the pretest and the posttest. Similarly, Willeford et al.
(2000), Robertson & Zalles (2005) and Jan et al. (2009) reported a significant increase from pre
to post regarding nutrition attitudes.
There was no significant change in dietary practices, except for fast food consumption
which decreased significantly (p < .001) after the intervention. Typically, for short term
interventions, changes in dietary practices are not warranted because dietary habits take time to

76
occur and longer intervention periods and follow-ups are needed to track change considering
different demographics (Gortmaker et al., 1999). Another possible explanation of the no change
in dietary practices is that, previously established dietary practices among parents largely
influence their children intake and are more challenging to change (Taylor, Gallagher, &
McCullough, 2004). This signifies the need and the importance of parental involvement in future
interventions.
In the United States, previous research has shown that households with children were
significantly associated with higher rates of eating at fast food restaurants, where children
consumed more total energy and had inferior diet quality (Bowman, Gortmaker, Ebbeling,
Pereira, & Ludwig, 2004; Jeffery, Baxter, McGuire, & Linde, 2006). High intake of fast food has
been associated with obesity among children in the Arab Gulf region; globalization and free
trade have brought these fast food chains to developing nations, and their influence as a popular
trend among children is no longer limited to the developed world (Musaiger, 2004). Regardless
of the short period of this intervention, fast food consumption decreased. This is promising for
health educators as the results demonstrate that communicating the right message about eating
can be influential and has the potential to develop a new trend of healthy eating in the Kuwaiti
schools.
Reported self-efficacy increased after the intervention (p < .01). In addition to nutrition
knowledge, having the opportunity to practice and model healthy eating such as preparing food,
doing food experiments, solving problems in class activates, may all have resulted in improved
self-efficacy. Similarly, Saksvig et al. (2005) found an improvement in dietary self efficacy
among girls (p < .05), boys (p < .05) and students who were obese at baseline (p < .01).

77
Change in the consumption numbers of each food group servings were examined, and the
significant changes detected were an increase in fruit (p < .02) and vegetable (p < .001)
consumption. These findings are noteworthy, as this change is probably because of the skills that
student practiced using fruit and vegetable wrist bands to count daily servings. These wrist bands
served as a reminder of fruit and vegetable servings and created a trendy culture among the
students that eating healthy can be fun. Powers et al. (2005) found an increase not only in fruit
and vegetable consumption but also in that of dairy. As well, Kelder et al. (2005) found a
marginally significant increase in fruit and vegetable intake at post-intervention.
As described previously in Figure 9, there was a higher intake of the grain group and
meat and bean group at both the baseline and after the intervention compared to the
recommended servings of MyPyramid. Milk consumption (2.2 cups) at both pretest and posttest,
was lower than the recommendations. Even with the significant increase, the number of
vegetable servings was still below what is recommended by MyPyramid, while the increase in
the number of fruit serving gave an intake that was slightly higher than recommended amounts.
Melnik et al. (1998) reported that students in the second and fifth grades consumed lower than
the recommended servings for fruits, vegetable and grains; while they met the milk and meat
recommendations. This implies that each population has its own characteristics and could
manifest different patterns of consumptions.
Taking in to consideration the unique characteristics of the Kuwaiti diet, health habits and
environmental factors; health educators should investigate and determine what the appropriate
numbers of servings for the food groups for Kuwaiti children are and establish dietary guidelines
accordingly. There was no significant change in breakfast intake. Overall, breakfast intake was
fairly high across the three days of the food record period at both baseline and post-intervention.

78
Likewise, Jan et al. (2009) reported that 81.6% of second to fifth grade students in their study ate
breakfast daily. Apparently, breakfast is an important meal for this sample as most would eat
breakfast at school if it was not eaten at home.
The atmosphere of the classrooms was influential on students and their ability to focus on
the topics learned during the lessons. Noise level, the teacher‘s classroom management skills,
movement of students, and students‘ comprehension levels all contributed to the outcomes in this
pilot study. However, analysis of the students‘ evaluation checklists revealed key points.
Students were clearly able to recognize the purpose of the program, and a high number of
students reported that they understood the lessons (96.8%). The students also showed an interest
to learn even more about the topics covered. The comments indicated that although some of the
concepts learned were entirely new at the beginning of the intervention, for that, they recognized
the importance of topics such as calorie and food labels and wanted more information about
them. Most students (95.8%) liked the interactive nature of the lessons such as the MyPyramid,
healthy snacks, and pedometer activities. They also liked the fruit and vegetables bands and food
models. Others didn‘t like the message of eating less of unhealthy food and more of healthy
food. Taking this in to consideration, a message that would focus on promoting healthy eating
behaviors rather than limiting unhealthy ones is recommended. Also, better classroom
facilitation and management is would help to create a better experience for children.
Most students thought the DVD sessions were interesting and helped them to learn
(89.5%). Students liked the DVD sessions because they made information taught in class more
applicable to them. The other 10.5% of students preferred to do more interactive activities or
thought the DVDs should be more culturally relevant to Kuwait. The results show that the DVD
session is a great tool to reinforce information presented during lessons, but it should be

79
culturally relevant. Seventy eight students shared what they learned with their families compared
to 17 students who did not share. Some of the reasons for those who didn‘t share what they
learned were; ―I didn‘t have time because of homework‖, ―I forgot‖ and ―My parents would not
care‖. Unquestionably, future interventions need to be designed to have greater parental
involvement to help build a supportive environment of healthy eating at home.
Fifteen students showed a desire to learn new things about nutrition. Some of the things
they were interested to learn were: exercise and its benefits, pedometers, fat intake effects on
health and food pesticides. The topics suggested by students could be taken into consideration
when designing future interventions.
Overall, 90.5% of the students would participate in more Let‘s Eat Smart lessons and
reported positive additional comments. Concerns expressed with class conditions, anticipations
for more lessons and general gratitude. Generally, the students were satisfied with class activities
and showed interest in nutrition. These nutrition classes were popular because of their interactive
nature were children got to do experiments, watch movies, examine food models, play and move
around during class.
Recommendations and significance
Compared to other nations, the prevalence of childhood obesity in Kuwait is very high.
Therefore, serious action and prevention strategies are needed. Even though, the findings of this
pilot study cannot be generalized to the rest of schools in Kuwait, these findings are important
because they represented a novel approach to intervention for Kuwait. According to Doak et al.
(2006) reporting interventions with small sample size, lacking study design and no significant
change in outcomes is important because the evaluation and publication of these interventions
can be useful in improving and informing future interventions.

80
Incorporating nutrition education into the schools‘ health education curriculum could
positively influence children‘s perception about a healthy lifestyle. There is a need for school-
based interventions that utilize interactive lessons to achieve favorable outcomes and promote a
healthy lifestyle among school-aged children in Kuwait. Based on the results of this study,
nutrition educators in Kuwait may find it helpful to develop programs based on the reciprocal
determinism concept of Social Cognitive Theory that address environmental, personal and
behavioral factors.
Another point to consider is that school-based interventions cannot solely solve the
problem of childhood obesity. Let‘s Eat Smart was well received and filled a gap within the
school curriculum. An extended intervention and evaluation is needed to improve and assess
long-term program efficiency. Story et al. (2006) indicated that even though school-based
interventions, in general, exhibit high participation rates and usually affect targeted health
behaviors positively, their effect on body weight and fatness were less prominent. To achieve
long-term success, considerable collective cooperation between public policy makers, health
promotion educators and health practitioners is necessary for addressing a multifaceted problem
such as childhood obesity.
Also, longer, more intensive interventions may be needed to attain considerable change in
targeted outcome behaviors. Including measures such as BMI or percent body fat and measures
of caloric intake change would be helpful to detect change in longer- period-interventions. Future
interventions should consider larger sample sizes, randomization, adding a control group, greater
parental involvement, the use of both qualitative and quantitative measures and follow-up
assessments to detect change over time.

81
Conclusion
Schools are an ideal place to reach children and provide nutrition and health education.
The Let‘s Eat Smart program was developed to offer comprehensive and interactive nutrition
education tailored to elementary school children in Kuwait. Positive, significant changes in
nutrition knowledge, attitude toward a healthy lifestyle, self efficacy toward healthy eating and
some dietary behaviors (i.e., increased consumption of fruit and vegetables and decreased
consumption of fast food) emerged among the majority of fourth and fifth grade students after
receiving the Let‘s Eat Smart lessons. Students had high satisfaction levels with the program.
Although more elaboration and an addition of a control group is crucial to examine the
program‘s full impact, The results show potential and indicate the feasibility and effectiveness of
applying school-based interventions in Kuwait.

82
LIST OF REFERENCES

83
Abdella, N., Al-Arouj, M., Al Nakhi, A., Al Assoussi, A., & Moussa, M. (1998). Non-insulin-
dependent diabetes in Kuwait: Prevalence rates and associated risk factors. Diabetes
Research & Clinical Practice, 42(3), 187-196.
Alawadi, F., & Amine, E. K. (1989). Overweight and obesity in Kuwait. Journal of the Royal
Society of Health, 109, 175-177.
Al-Awadi, F., Rahman, K.M., & Thomas, M. (1990). Study of obesity with hyperlipidaemia in
Kuwaiti adults. Kuwait Medical Journal, 24(2), 161-166.
Al-Isa, A. N. (1995). Prevalence of obesity among Kuwaitis: A cross-sectional study.
International Journal of Obesity and Related Metabolic Disorders, 19(6), 431-433.
Al-Isa, A. N. (1997). Changes in body mass index (BMI) and prevalence of obesity among
Kuwaitis 1980-1994. International Journal of Obesity and Related Metabolic Disorders,
21, 1093-1099.
Al-Isa, A. N. (2003). Are Kuwaitis getting fatter? Nutrition and Health, 17(3), 185-197.
Al-Isa, A. N. (2004). Body mass index, overweight and obesity among Kuwaiti intermediate
school adolescents aged 10–14 years. European Journal of Clinical Nutrition, 58, 1273-
1277.
Al-Isa A. N., & Moussa M. A. (2000). Nutritional status of Kuwaiti elementary school children
aged 6-10 years: Comparison with the NCHS/CDC reference population. International
Journal of Food Sciences and Nutrition, 2000, 51(4), 221-228.
Al-Moussa, Z. (1996). Nutrition-related chronic diseases in Kuwait. In Musaiger, A. O., &
Miladi, S. S. (Eds.), Diet-related non-communicable diseases in the Arab countries of the
Gulf. (pp. 46-57). Retrieved from
http://www.acnut.com/images/stories/pdf/publications/diet_related_non_communicable_
diseases_in_the_acg.pdf
Al-Sendi, A. M., Shetty, P., & Musaiger, A. O. (2003). Prevalence of overweight and obesity
among Bahraini adolescents: A comparison between three different sets of criteria.
European Journal of Clinical Nutrition, 57, 471-474.
Al-Shammari, H., Amuna, P., Tewfik, I., Bumejjdad, A. & Zotor, F. (2006). Changing trends in
physical characteristics and obesity risk in 6–13 year old Kuwaiti school children:
Evidence of a nutritional and epidemiological transition? [Abstract]. Proceedings of the
Nutrition Society, 65, 95.
Backman, D., Haddad, E., Lee, J., Johnston, P., & Hodgkin, G. (2002). Psychosocial Predictors
of Healthful Dietary Behavior in Adolescents. Journal of Nutrition Education &
Behavior, 34(4), 184.

84
Bandura, A. (1986). Social foundations of thought and action: A social cognitive theory.
Englewood Cliffs, NJ: Prentice-Hall.
Bandura, A., (1977). Social learning theory. Englewood Cliffs, NJ: Prentice Hall.
Baranowski, T., Cullen K. W., Nicklas T., Thompson, D., & Baranowski J. (2002). School based
obesity prevention: A blueprint for taming the epidemic. American Journal of Health
Behavior, 26(6), 486-493.
Baranowski, T., Cullen, K. W., Nicklas, T., Thompson, D., & Baranowski, J. (2003). Are current
health behavioral change models helpful in guiding prevention of weight gain efforts?
[Supplemental materials]. Obesity Research, 11, 23-43.
Barlow, S. E., & Dietz, W. H. (1998). Obesity evaluation and treatment: Expert committee
recommendations. Pediatrics, 102(3), 1-11.
Bener, A. Prevalence of obesity, overweight, and underweight in Qatari adolescents. (2006).
Food Nutrition Bulletin, 27(1), 39-45.
Bergman, E. (2010). Position of the American Dietetic Association: Local support for nutrition
integrity in schools. Journal of the American Dietetic Association, 110(8), 1244-1254.
Bindon, J. R. & Baker, P. T. (1985). Modernization, migration and obesity among Samoan
adults. Annals of Human Biology, 12(1), 67-76.
Borradaile, K. E., Sherman, S., Veur, S. S., McCoy, T., Sandoval, B., Nachmani, J., . . . &
Foster, G. D. (2009). Snacking in Children: The Role of Urban Corner Stores. Pediatrics,
124(5), 1293-8.
Bowman, S. A., Gortmaker, S. L., Ebbeling, C. B., Pereira, M. A., & Ludwig, D. S. (2004).
Effects of fast-food consumption on energy intake and diet quality among children in a
national household survey. Pediatrics, 113(1), 112-118.
Caballero, B., Clay, T., Davis, S. M., Ethelbah, B., Rock, B. H., Lohman, T., . . . & Stevens, J.
(2003). Pathways: A school-based, randomized controlled trial for the prevention of
obesity in American Indian schoolchildren. American Journal of Clinical Nutrition,
78(5), 1030-1038.
Campell, K., Waters, E., O‘Meara, S. & Summerball, C. (2001). Interventions for preventing
obesity in childhood. A systematic review. Obesity Reviews, 2, 149–157.
Central Intelligence Agency. (2011a). The world factbook: Kuwait. Retrieved from
https://www.cia.gov/library/publications/the-world-factbook/geos/ku.html
Central Intelligence Agency. (2011b). The world factbook: Middle East. Retrieved from
https://www.cia.gov/library/publications/the-world-factbook/wfbExt/region_mde.html

85
Center of Disease Control and Prevention. (1996). Guidelines for school health programs to
promote lifelong healthy eating. Morbidity & Mortality Weekly Report, 45(RR-9), 1-33.
Retrieved from http://www.cdc.gov/mmwr/preview/mmwrhtml/00042446.htm
Centers for Disease Control and Prevention. (2011). Overweight and obesity. Basics about
childhood obesity. Retrieved from http://www.cdc.gov/obesity/childhood/basics.html
Cole, T. J., Bellizzi, M. C., Flegal, K. M., & Dietz, W. H. (2000). Establishing a standard
definition for child overweight and obesity worldwide: International survey. British
Medical Journal, 320(7244), 1240–1246.
Contento, I. R., Randell, J. S. & Basch, C.E. (2002). Review and analysis of evaluation measures
used in nutrition education intervention research. Journal of Nutrition Education and
Behavior, 34(1), 2-25.
Cooke, L. (2007). The importance of exposure for healthy eating in childhood: A review.
Journal of Human Nutrition and Dietetics, 20(4), 294-301.
Crawford, P. B., Obarzanek, E., Morrison, J., & Sabry, Z. I. (1994). Comparative advantage of 3-
day food records over 24-hour recall and 5-day food frequency validated by observation
of 9- and 10-year-old girls. Journal of the American Dietetic Association, 94(6), 626-630.
Davis, J. N., Ventura, E. E., Weigensberg, M. J., Ball, G. D., Cruz, M. L., Shaibi, G. Q., &
Goran, M. (2005). The relation of sugar intake to beta cell function in overweight Latino
children. American Journal of Clinical Nutrition, 82(5), 1004-1010.
Davis, M. M., Gance-Cleveland, B., Hassink, S., Johnson, R., Paradis, G., & Resnicow G.
(2007). Recommendations for prevention of childhood obesity [Suplemantal materials].
Pediatrics, 120(4), 228-252.
Davis, S. P., Davis, M., Northington, L., Moll, G., & Kolar, K. (2002).Childhood obesity
reduction by school based programs. The Association of Black Nursing Faculty in Higher
Education Journal, 13(6), 145–149.
de Onis, M., & Blossner, M. (2000). Prevalence and trends of overweight among preschool
children in developing countries. American Journal of Clinical Nutrition, 72(4), 1032-
1039.
Di Pietro, L., Mossberg, H. O. & Stunkard, A. (1994). A 40-year history of overweight children
in Stockholm: Life-time overweight morbidity and mortality. International Journal of
Obesity and Related Metabolic Disorders, 18(9), 585-590.
Discovery School. (Producer). (2006). Food smart: My pyramid for kids [DVD]. Available from
http://store.discoveryeducation.com/product/show/50369

86
Doak, C. M., Visscher, T. S., Renders, C. M., & Seidell, J. C. (2006). The prevention of
overweight and obesity in children and adolescents: A review of interventions and
programmes. Obesity Reviews, 7(1), 111-136.
Dorfman, L., Wilbur, P., Lingas, E. O., Woodruff, K., & Wallack, L. (2005). Accelerating policy
on nutrition: Lessons from tobacco, alcohol, firearms, and traffic safety. Berkely, CA:
Berkely Media Studies Group. Retrieved from
http://www.bmsg.org/pdfs/BMSG_AccelerationReport.pdf
Drewnowski, A., & Popkin, B. M. (1997). Dietary fats and the nutrition transition: New trends in
the global diet. Nutrition Reviews, 55(2), 31-43.
DuBroc, E. M. (2007).Team: Bee Me. A formulative evaluation of a negative eating attitudes and
behaviors primary prevention curriculum targeted at fifth-grade elementary school girls
(Master‘s Thesis). Available from ProQuest Dissertations & Theses database. (UMI No.
1441747).
Ebbeling, C. B., Pawlak, D. B., & Ludwig, D. S. (2002). Childhood obesity: Public-health crisis,
common sense cure. The Lancet, 360(9331), 473-482.
Edmundson, E., Parcel, G. S., Feldman, H. A., Elder, J., Perry, C. L., Johnson, C. C., . . . &
Webber, L. (1996). The effects of the child and adolescent trial for cardiovascular health
upon psychological determinants of diet and physical activity behavior. Preventive
Medicine, 25(4), 442-54.
El-Hazmi, M. A., & Warsy, A. S. (2002). A comparative study of prevalence of overweight and
obesity in children in different provinces of Saudi Arabia. Journal of Tropical Pediatrics,
48(3), 172-177.
Epstein, L. H., Myers, M. D., Raynor, H. A., & Saelens, B. E. (1998). Treatment of pediatric
obesity. Pediatrics, 101(3), 554-570.
Epstein, L. H., Paluch, R. A., Gordy, C. C., & Dorn, J. (2000). Decreasing sedentary behaviors in
treating pediatric obesity. Archives of Pediatrics and Adolescent Medicine, 154, 220-226.
Eyal, K., & Rubin, A. M. (2003). Viewer aggression and homophily, identification, and
parasocial relationships with television characters. Journal of Broadcasting & Electronic
Media, 47, 77-98.
Flodmark, C. E., Lissau, I., Moreno, L. A., Pietrobelli, A., & Widhalm, K. (2004). New insights
into the field of children and adolescents' obesity: The European perspective.
International Journal of Obesity, 28, 1189-1196.
Finkelstein, E., French, S., Variyam, J. N., & Haines, P. S. (2004). Pros and cons of proposed
interventions to promote healthy eating. American Journal of Preventive Medicine, 27(3),
163-171.

87
Freedman, D. S., & Sherry, B. (2009). The validity of BMI as an indicator of body fatness and
risk among children [Supplemental material]. Pediatrics, 124(1), 23-34.
French, L., Howell, G., Haven, J., Britten, P. (2006). Designing MyPyramid for Kids materials to
help children eat right, exercise, have fun [Supplemental material]. Journal of Nutrition
Education & Behavior, 38(6), 158-159.
French, S. A., & Stable G. (2003). Environmental interventions to promote vegetable and fruit
consumption among youth in school settings. Preventative Medicine, 37(6), 593-610.
Galal, O. (2003). Nutrition-related health patterns in the Middle East. Asia Pacific Journal of
Clinical Nutrition, 12(3), 337-343.
Garrow, J. C. (1975). Weight reduction. Proceedings of the Royal Society of Medicine, 68(7),
663-664.
Garcia, K., & Mann, T. (2003). From ‗I wish‘ to ‗I will‘: Social cognitive predictors of
behavioral intentions. Journal of Health Psychology, 8(3), 347-360.
Gillman, M. W., Hood, M. Y., Moore, L. L., & Singer, M. R. (1994). Feasibility and acceptance
of food records among inner-city fifth-grade students. Journal of the American Dietetic
Association, 94(11), 1311-1313.
Griffiths, L. J., Wolke, D., Page, A. S., & Horwood, J. P. (2006). Obesity and bullying: Different
effects for boys and girls. Archives of Disease in Childhood, 91, 121-125.
Gonzalez-Suarez, C., Worley, A., Grimmer-Somers, K., & Dones, V. (2009). School-Based
Interventions on Childhood Obesity: A Meta-Analysis. American Journal of Preventive
Medicine, 37(5), 418-427.
Gortmaker, S. L., Peterson, K., Wiecha, J., Sobol, A. M., Dixit, S., Fox, M. K., & Laird, N. (1999).
Reducing obesity via a school-based interdisciplinary intervention among youth: Planet
Health. Archives of Pediatrics & Adolescent Medicine, 153, 409-418.
Harris, K. J., Paine-Andrews, A., Richter, K., Lewis, R. K., Johnston, J. A., James, V., . . . &
Fawcett, S. B. (1997). Reducing elementary school children's risks for chronic diseases
through school lunch modifications, nutrition education, and physical activity
interventions. Journal of Nutrition Education, 29(4), 196-202.
Hesketh, K., Waters, E., Green, J., Salmon, L., & Williams, J. (2005). Healthy eating, activity
and obesity prevention: A qualitative study of parent and child perceptions in Australia.
Health Promotion International, 20(1), 19-26.
Hewitt, A., & Stephens, C. (2007). Healthy eating among 10-13-year-old New Zealand children:
Understanding choice using the theory of planned behavior and the role of parental
influence. Psychology, Health & Medicine, 12(5), 526-535.
88
Hoelscher, D. M., Day, R. S., Kelder, S. H., & Ward, J. L. (2003). Reproducibility and validity
of the secondary level school-based nutrition monitoring student questionnaire. Journal
of the American Dietetic Association, 103(2), 186-94.
Hu, F. B., van Dam, R. M., & Liu, S. (2001). Diet and risk of type II diabetes: The role of types
of fat and carbohydrate. Diabetologia, 44(7), 805-817.
Human Relations Media. (Producer). (2004). Portion distortion: Seeing the healthy way to eat.
Available from
http://www.hrmvideo.com/items.cfm?action=view&item_id=2680&type=&search_keyw
ords=portion
Huang, J. S., Norman, G. J., Zabinski, M. F., Calfas, K., & Patrick K. (2007). Body image and
self-esteem among adolescents undergoing an intervention targeting dietary and physical
activity behaviors. Journal of Adolescent Health, 40(3), 245-251.
Hunter, S. M., Johnson, C. C., Little-Christian, S., & Nicklas T. Heart Smart: A multifaceted
cardiovascular risk reduction program for grade school students. American Journal
Health Promotion, 4(5), 351-360.
Hayman, L. L., Williams, C. L., Daniels, S. R., Steinberger, J., Paridon, S., Dennison, B. A., &
McCrindle, B. W. (2004). Cardiovascular health promotion in the schools: A statement
for health and education professionals and child health advocates from the committee on
atherosclerosis, hypertension, and obesity in youth of the council on cardiovascular
disease in the young, American Heart Association. Circulation, 110, 2266-2275.
Hyner, G. C., (2005). A procedural model for planning and evaluating behavioral interventions.
Methods of Information in Medicine, 44(2), 299-302.
International Association for the Study of Obesity. (2011). Overweight children around the
world. Retrieved from http://www.iaso.org/?map=children
Jan, S., Bellman, C., Barone, J., Jessen, L., & Arnold, M. (2009). Shape it up: A school-based
education program to promote healthy eating and exercise developed by a health plan in
collaboration with a college of pharmacy. Journal of Managed Care Pharmacy, 15(5),
403-413.
Jeffery, R., Baxter, J., McGuire, M., & Linde, J. (2006). Are fast food restaurants an environmental
risk factor for obesity? International Journal of Behavioral Nutrition and Physical
Activity, 3(2), 1-6.
Kamel, B. S., & Martinez, O. B. (1984). Food habits and nutrient intake of Kuwaiti males and
females. Ecology of Food and Nutrition, 15(4), 261-272.
89
Kelder, S., Hoelscher, D. M., Barroso, C. S., Walker, J. L., Cribb, P., & Hu, S. (2005). The
CATCH kids club: A pilot after-school study for improving elementary students‘
nutrition and physical activity. Public Health Nutrition, 8(2), 133-140.
Kelishadi, R. (2007). Childhood overweight, obesity, and the metabolic syndrome in developing
countries. Epidemiological Reviews, 29 (1), 62-76.
Kontogianni, M. D., Vidra, N., Farmaki, A. E., Koinaki, S., Belogianni, K., Sofrona, S.,
Magkanari, F., & Yannakoulia, M. (2008). Adherence rates to the Mediterranean diet are
low in a representative sample of Greek children and adolescents. The Journal of
Nutrition, 138, 1952-1956.
Krebs, N. F., Jacobson, M. S, & American Academy of Pediatrics. (2003). Prevention of
pediatric overweight and obesity. Pediatrics. 112(2), 424-430.
Kuczmarski, R. J., & Flegal, K. M. (2000). Criteria for definition of overweight in transition:
Background and recommendations for the United States. The American Journal of
Clinical Nutrition, 72(5), 1074-1081.
Kuczmarski, R. J., Ogden, C. L., Guo, S. S., Grummer-Strawn, L. M., Flegal, K. M., Mei, Z., . . .
& Johnson, C. L. (2002). 2000 CDC growth charts for the United States: Methods and
development (DHHS Publication No. PHS 2002-1696). Hyattsville, MD: Department of
Health and Human Services, Centers for Disease Control and Prevention, National Center
for Health Statistics. Retrieved from
http://www.cdc.gov/nchs/data/series/sr_11/sr11_246.pdf
Kurtz, R. A. The leading causes of death in Kuwait. The Journal of Kuwait Medical Association,
18, 217-233.
Kuwait National Programme for the Prevention of Obesity. (2010). التغذية السليمه للشباب [Healthy
eating for youth]. Kuwait, Kuwait City: Kuwait Ministry of Health.
Lee, Y. S. (2009). Consequences of childhood obesity. Annals Academy of Medicine Singapore,
38(1), 75-77.
Levine, E., Olander, C., Lefebvre, C., Cusick, P., Biesiadecki, L., & McGoldrick, D. (2002). The
Team Nutrition pilot study: Lessons learned from implementing a comprehensive
school-based intervention. Journal of Nutrition Education & Behavior, 34(3), 109-116.
Lobstein, T., Baur, L., & Uauy, R. (2004). Obesity in children and young people: A crisis in
public health [Supplemental material]. Obesity Reviews, 5(1), 4-85.
Lobstein, T., & Jackson-Leach, R. (2007). Child overweight and obesity in the USA: Prevalence
rates according to IOTF definitions. International Journal of Pediatric Obesity, 2(1), 62-
64.

90
Lowenthal, K. M. (2001). An introduction to psychological tests and scales (2nd ed.)
Philadelphia PA: Psychology Press.
Lytle, L., & Achterberg, C. (1995). Changing the diet of America's children: What works and
why? Journal of Nutrition Education, 27, 250-260.
Lytle, L. A., Eldridge, A. L., Kotz, K., Piper, J., Williams, S., & Kalina, B. (1997). Children‘s
interpretation of nutrition messages. Journal of Nutrition Education, 29(3), 128-136.
Malik, M., & Bakir, A. (2007). Prevalence of overweight and obesity among children in the
United Arab Emirates. Obesity Reviews, 8(1), 15-20.
Marcoe, K., Juan, W. Y., Yamini, S., Carlson, A., & Britten, P. (2006). Development of food
group composites and nutrient profiles for the MyPyramid Food Guidance System
[Supplemental material]. Journal of Nutrition Education & Behavior, 38(6), 93-107.
Martorell, R., Khan, L. K., Hughes, M. L., & Grummer-Strawn, L. M. (2000). Overweight and
obesity in preschool children from developing countries. International Journal of
Obesity. 24(8), 959-967.
McAlister, A. L., Perry, C. L., & Parcel, G. S. (2008). How individuals, environments, and
health behaviors interact. In K. Glanz, B. Rimer, & K. Viswanath (Eds.), Health
Behavior & Health Education: Theory, research, practice (4th ed.) (pp. 169-188). San
Francisco, CA: Jossey-Bass.
McArdle, W. D., Katch, F. I., & Katch, V. L. (2010). Exercise physiology: Nutrition, energy, and
human performance. Baltimore, MD: Lippincott Williams & Wilkins.
McArthur, D.B., (1998). Heart healthy eating behaviors of children following a school-based
intervention: A meta-analysis. Issues in Comprehensive Pediatric Nursing, 21(1) 35-48.
McPherson, R. S., Hoelscher, D. M., Alexander, M., Scanlon, K. S., & Serdula, M. K. (2000).
Dietary assessment methods among school-aged children: Validity and reliability
[Supplemental materials]. Preventative Medicine, 31(2), 11-33.
Melanson, K. J. (2008). Lifestyle approaches to promoting healthy eating for children. American
Journal of Lifestyle Medicine, 2(1), 26-29.
Melnik, T. A., Rhoades, S. J., Wales, K. R., Cowell, C., & Wolfe, W. S. (1998). Food
consumption patterns of elementary schoolchildren in New York City. Journal of the
American Dietetic Association, 98(2), 159-164.
Moussa, M. A., Shaltout, A. A., Nkansa-Dwamena, D., Mourad, M., AlSheikh, N., Agha, N., &
Galall D. O. (1999). Factors associated with obesity in Kuwaiti children. European
Journal of Epidemiology, 15, 41-49.

91
Musaiger, A. O. (1987). The state of food and nutrition in the Arabian Gulf countries. World
Review of Nutrition and Dietetics. 54, 105-173.
Musaiger, A. O. (1991). Height, weight and menarcheal age of adolescent girls in Oman. Annals
of Human Biology, 18 (1), 71-74.
Musaiger, A. O. (1993). Socio-cultural and economic factors affecting food consumption
patterns in the Arab countries. The Journal of the Royal Society for Health, 113(2), 68–
74.
Musaiger, A. O. (2002). Diet and prevention of coronary heart disease in the Arab Middle East
countries. Medical Principles and Practice, 11(2), 9-16.
Musaiger, A. O. (2004). Overweight and obesity in the Eastern Mediterranean Region: Can we
control it? Eastern Mediterranean Health Journal, 10(6), 789-793.
Musaiger, A. O., & Gregory, W. B. (2000). Profile of body composition of school children (6-
18Y) in Bahrain. International Journal of Obesity and Related Metabolic Disorders,
24(9), 1093-1096.
National Center for Health Statistics. (2009). Health, United States, 2008: With special feature
on the health of young adults (Report No. 2009-1232). Hyattsville, MD. Retrieved from
http://www.ncbi.nlm.nih.gov/books/NBK19617/pdf/TOC.pdf
National Cancer Institute. (2005). Theory at a glance: A guide for health promotion practice
(NIH Publication No. 05-3896). Retrieved from
http://www.cancer.gov/cancertopics/cancerlibrary/theory.pdf
Ness, A. R., & Powles, J. W. (1997). Fruit and vegetables, and cardiovascular disease: A review.
International Journal of Epidemiology, 26(1), 1-13.
Nicklas, N., Johnson, C. C., Myers, L., Farris, R. P., & Cunningham, A. (1998). Outcomes of a
high school program to increase fruit and vegetable consumption: Gimme 5— a fresh
nutrition concept for students, The Journal of School Health, 68(6), 248-253.
Nicklas, T., & Johnson, R. (2004). Position of the American Dietetic Association: Dietary
guidance for healthy children ages 2 to 11 years. Journal of the American Dietetic
Association, 104(4), 660-677.
Niva, M. (2007). All foods affect health: Understandings of functional foods and healthy eating
among health-oriented Finns. Appetite, 48(3), 384-393.
Nutritionist Pro (Version 4.6) [Computer software]. (2010). Stafford, TX: Axxya Systems LLC.

92
Perry, C. L., Bishop, D. B., Taylor, G., Murray, D. M., Mays, R. W., Dudovitz, B. S., . . . &
Story, M. (1998). Changing fruit and vegetable consumption among children: The 5-a-
day power plus program in St. Paul, Minnesota. American Journal of Public Health,
88(4), 603-609.
Popkin, B. M. (2003). The nutrition transition in the developing world. Development Policy
Review. 21(5-6), 581-597.
Powers, A. R., Struempler, B. J., Guarino, A., & Parmer, S. M. (2005). Effects of a nutrition
education program on the dietary behavior and nutrition knowledge of second-grade and
third-grade students. Journal of School Health, 75(4), 129-133.
Program ENERGY. Energy Balance lesson Plan. Retrieved May 25, 2010 from
http://programenergy.org/
Radovanovic, Z. (1994). Mortality patterns in Kuwait: Inferences from death certificate data,
European Journal of Epidemiology, 10(6), 733-736.
Rasmussen, M., Krolner, R., Klepp, K. I., Lytle, L., Brug, J., Bere, E., & Due P. (2006).
Determinants of fruit and vegetable consumption among children and adolescents: A
review of the literature. Part I: Quantitative studies. The International Journal of
Behavioral Nutrition & Physical Activity, 3(22), 1-19.
Reddy, K. S., & Katan, M. B. (2004). Diet, nutrition and the prevention of hypertension and
cardiovascular diseases. Public Health Nutrition, 7(1A), 167-186.
Ritchie, L.D., Crawford, P.B., Hoelscher, D.M., & Sothern, M.S. (2006). Position of the
American Dietetic Association: Individual-, family-, school-, and community-based
interventions for pediatric overweight. Journal of the American Dietetic Association,
106(6), 925-945.
Robertson, T. P., & Zalles, D. R. (2005). Nutrition education program nutrition pathfinders
teaches children how to make healthful food choices. Journal of Nutrition Education &
Behavior, 37(1), 41-42.
Rockett, H. R., Berkey, C. S., & Colditz, G. A. (2003). Evaluation of dietary assessment
instruments in adolescents. Clinical Nutrition & Metabolic Care, 6(5), 557-562.
Saksvig, B. I., Gittelsohn, J., Harris, S. B., Hanley, A. J., Valente, T. W., & Zinman, B. (2005).
A pilot school-based healthy eating and physical activity intervention improves diet, food
knowledge, and self-efficacy for native Canadian children. The Journal of Nutrition,
135(10), 2392-2398.

93
Sallis, J. F., McKenzie, T. L., Conway, T. L., Elder, J. P., Prochaska, J. J., Brown, M., . . . &
Alcarez, J. E. (2003). Environmental interventions for eating and physical activity: A
randomized controlled trial in middle schools. American Journal of Preventive Medicine,
24(3), 209-217.
Serour, M., Alqhenaei, H., Al-Saqabi, S., Mustafa, A. R., & Ben-Nakhl A. (2007). Cultural
factors and patients‘ adherence to lifestyle measures. British Journal of General Practice,
57(537), 291-295.
School Media Associates. (Producer). (2005). What is a calorie? [DVD]. Available from
https://www4091.ssldomain.com/smavideo/Store/titledetail.cfm?MerchID=38707
Sharma, M. (2006). International school-based interventions for preventing obesity in children.
Obesity Reviews, 8(2), 155-167.
Sim, J., & Wright C. (2002). Research in Health Care: Concepts, Designs and Methods.
Cheltenham, UK: Nelson Thornes.
Siti Sabariah, B., Zalilah, M. S., Norlijah, O., Normah, H., Maznah, I., Laily, P., . . . & Zabidi
Azhar, M. H. (2006). Reliability and validity of the primary school children‘s nutrition
knowledge, attitude and practice instrument used in the HELIC Study. Malaysian Journal
of Nutrition, 12(1), 33-44.
Slavin, J. L., Martini, M., C, Jacobs, D. R., & Marquart, L. (1999). Plausible mechanisms for the
protectiveness of whole grains [Supplemental material]. American Journal of Clinical
Nutrition, 70(3), 459-463.
Stallings, V. A., & Yaktine, A. L., (Eds.) & Institute of Medicine. (2007). Nutrition standards for
foods in schools: Leading the way toward healthier youth. Washington, D.C: National
Academies Press.
Story, M., Kaphingst, K. M., & French, S. (2006). The role of schools in obesity prevention. The
Future of Children, 16(1), 109-142.
Taylor, L. J., Gallagher, M., & McCullough, F. W. (2004). The role of parental influence and
additional factors in the determination of food choices for pre-school children.
International Journal of Consumer Studies, 28(4), 337-346.
Thompson, F. E., & Byers, T. (1994). Dietary assessment resource manual [Supplemental
materials]. Journal of Nutrition, 124(11), 2245-2317.
Trevino, R. P., Pugh, J. A., Hernandez, A. E., Menchaca, V. D., Ramirez, R. R. & Mendoza, M.
(1997). Bienestar: A diabetes risk-factor prevention program. Journal of School Health,
68(2), 62-67.
94
Tsorbatzoudis, H. (2005). Evaluation of a planned behavior theory-based intervention
programme to promote healthy eating. Perceptual and Motor Skills, 101(2), 587-604.
United Nations Department of Economic and Social Affairs. (2009). World Population
Prospects: The 2008 Revision (Report No. ESA/P/WP.210). retrieved from
http://www.un.org/esa/population/publications/wpp2008/wpp2008_highlights.pdf
United State Department of Agriculture. (2011). MyPyramid.gov steps to a healthier you.
Retrieved from http://www.mypyramid.gov/index.html
Veugelers, P. J., & Fitzgerald, A. L. (2005a). Effectiveness of school programs in preventing
childhood obesity: A multilevel comparison. American Journal of Public Health, 95(3),
432-435.
Veugelers, P. J. & Fitzgerald, A.L. (2005b). Prevalence of and risk factors for childhood
overweight and obesity. Canadian Medical Association Journal, 173(6), 607-613.
Wallander, J. L., Taylor, W. C., Grunbaum, J. A., Franklin, F. A., Harrison, G. G. , Kelder, S. H.,
& Schuster, M. A. (2009). Weight status, quality of life, and self-concept in African
American, Hispanic, and White fifth-grade children. Obesity, 17(7), 1363-1368.
Wang, Y., & Lobstein, T. (2006). Worldwide trends in childhood overweight and obesity.
International Journal of Pediatric Obesity, 1(1), 11-25.
Willeford, C., Splett, P. L., & Reicks, M. (2000). The great grow along curriculum and student
learning. Journal of Nutrition Education, 32(5), 278-284.
Williams, D. P., Going, S. B., Lohman, T. G., Harsha, D. W., Srinivasan, S. R., Webber, L. S., &
Berenson, G. S. (1992). Body fatness and risk for elevated blood-pressure, total
cholesterol, and serum-lipoprotein ratios in children and adolescents. American Journal
of Public Health, 82(3), 358-363.
Williams, J., Wake, M., Hesketh, K., Maher, E., & Waters, E. (2005). Health-related quality of
life of overweight and obese children. Journal of the American Medical Association,
293(1), 70-76.
World Health Organization. (2005). Preventing chronic diseases: A vital investment. Geneva:
WHO Press. Retrieved from
http://www.who.int/chp/chronic_disease_report/contents/foreword.pdf
World Health Organization. (2008). 2008-2013 action plan for the global strategy for the
prevention and control of noncommunicable diseases. Geneva: WHO Press. Retrieved
from http://www.who.int/nmh/Actionplan-PC-NCD-2008.pdf

95
World Health Organization. (2010). Report of WHO forum and technical meeting on population-
based prevention strategies for childhood obesity. Geneva: WHO Press. Retrieved from
http://www.who.int/dietphysicalactivity/childhood/child-obesity-eng.pdf
Zaal, A. A., Musaiger, A. O. & D‘Souza R. (2009). Dietary habits associated with obesity among
adolescents in Dubai, United Arab Emirates. Nutrición Hospitalaria, 24(4), 437-444.

96
LIST OF APPENDICES

97
Appendix A: Maps of Kuwait
Appendix B: IRB Approval
Appendix C: English Playgroup and Primary School permission
Appendix D: Parental consent
Appendix E: Child/Minor Assent-Oral Script
Appendix F: Table 12. Application of Theory Constructs in Let‘s Eat Smart Program
Appendix G: Table 13. Lessons for Let‘s Eat Smart Program
Appendix H: Lessons‘ Materials
Appendix I: Survey
Appendix J: 3-day food record
Appendix K: Student‘s checklist
Appendix L: Table 14. Participant‘s Responses on Dietary Practices Questions
Appendix M: Comments on students‘ checklists (Tables: 15, 16, 17 and 18)

98
Appendix A

99
Figure 11. Location of Kuwait on the world map.
Figure 12. Location of Kuwait and the Arab Gulf countries in the Middle East region.

100
Appendix B

101

102
Appendix C

103

104
Appendix D

105
PARENT/GUARDIAN PERMISSION to participate in: Let’s Eat Smart Nutrition Education Program Dear Parents please take a moment to read this letter. Your child is invited to participate in a research study called Let’s Eat Smart Nutrition Education Programme being conducted by Ms. Sondos Kalendar, Master Candidate at The University of Mississippi, USA. This will be delivered as an educational programme within school, and your child has been selected because he/she is a fourth or a fifth year student at English Play Group Primary School. This topic also ties into the English National PSCHE curriculum (Personal, Social, Citizenship & Health Education). The purpose of this programme is to determine whether a nutritional education curriculum in the school environment can increase the nutritional knowledge and influence the healthy behaviour choices of fourth and fifth year students. Data will be confidentially collected as to contribute to research on this topic; student’s data will be anonymous. Programme Delivery The Let’s Eat Smart Programme, which will be tested as a part of the school curriculum, consists of twelve interactive lessons designed to teach the students about nutrition and lifestyle behaviours that could have a positive impact on their overall health. One day each week during the twelve-week programme, 15-20 minutes will be devoted to nutrition education including four major topics of; energy balance, My Pyramid, portion size and healthy snacking. The interactive lessons are delivered during the school day and are designed to motivate students to make healthy lifestyle choices and increase their awareness of healthy eating. A knowledge and behavioural survey will be administered to your child at the beginning and at the end of the study. In addition he/she will be asked to record his/her food intake for three days at the beginning and at the end of the programme. Approval for delivery of the programme was obtained from The Kuwait Ministry of Education and English Play Group School management. There is no extra school work associated with this nutrition programme as the nature of lessons is intended to increase nutrition awareness. There are no known risks associated with this research project. However, if your child is known to have sensitivity to any food or food ingredient he/she should not participate in this study. Potential benefits for students will be learning about healthy eating habits and making healthy food choices. The students involved have the potential to develop lifestyle behaviors that may positively impact their health. There will be in-class incentives like; Bookmarks, stickers, fruit bands to further convey the message of healthy lifestyle. Also upon your child completion of the intervention he/she will receive a ticket to the Scientific Center. Your decision whether or not to allow your child to participate will not affect you or your child grade, treatment, or any other benefits to which they are otherwise entitled. If you decide to allow your child to participate, you are free to withdraw your permission and to discontinue the use of your child’s data for the purpose of this research study at any time. If you have any questions now or at any time during the study you can contact Ms. Sondos Kalendar by e-mail: [email protected] To indicate you grant permission for your child to participate in this programme, please sign below the white copy and return it back to school. ______________________________________ _________________________ ______________ Parent/Guardian Name Signature Date ______________________ ___________________________________________ Relation to Child Name of Child

106
Appendix E

107
Child/Minor Assent-Oral Script
Let’s Eat Smart Dear (participant):
Hi, my name is Sondos Kalendar. I am a student at the University of Mississippi and I am doing a project to help me learn more about how to help children learn about activities and foods that are good for their health. I would like to ask you for your help so I can do the Let’s Eat Smart project.
Let me tell you about what you would be doing. You will fill out
some surveys on how much you know about eating healthy and record what you eat for three days at the beginning and at the end of the project. You will also attend 15 minutes nutrition classes each week. No one will see your answers except members of our staff, and we won’t use your name in any reports we write.
If you say “yes” you can still stop at any time by telling me “I want to
stop.” You won’t get in any trouble for stopping. If you have questions please ask me now. Sincerely, Sondos Kalendar I agree to help with this research project. YES NO Name: _________________________________________ Date: _____________

108
Appendix F

109
Table 12
Application of Theory Constructs in Let’s Eat Smart Program
Construct Definition within study Activities
Outcome
expectations
If students were to adopt healthy
dietary habits:
They are anticipated to feel
healthier.
They are expected to feel the ease
of making a healthy food choice.
They are expected to feel more
positive toward adopting healthy
lifestyle that would bring health
benefits
Lessons provide students with
knowledge about likely outcomes of
adopting healthy dietary habits such as
having more energy, excelling in
school, become smarter by choosing
foods that benefits their bodies &
preventing diseases.
Lessons on healthy eating emphasized
the concepts of nutrient dense food vs.
energy dense food & gave students the
chance to explore why dietary
practices are important for optimal
health.
Self-Efficacy Confidence in ability to make
healthy food choices such as eating
more fruit and vegetables, whole
grains and low fat dairy.
Confidence in adopting a healthy
lifestyle
Students were expected to belief they
are empowered with tools that aid
them to make healthy choices. Tools
used to build self confidence were:
fruit and vegetable bands used to
remind them of their 5 a day intake,
meal planning activities, simple label
reading & preparing their own healthy
snack.
Observational
Learning
Learning to develop and being able to
practice:
Making healthy food choices.
Eating breakfast consistently.
Choosing proper food portions.
Positive attitude toward a healthy
lifestyle.
Students practiced and modeled
through class activities such as
preparing healthy snack. The health
educator served as a role model by
dining with students in lunchroom.
Students had the chance to emulate
Media role models & learned to
develop positive attitudes toward
healthy eating by watching nutrition
education DVD sessions.
Incentive
motivation
The use of reword to modify healthy
dietary habits.
Incentive to motivate students to adopt
a healthy lifestyle used were:
bookmarks to remind them of
Mypyramid groups intake, stickers and
fruit stamps passed for participation
and paying attention during class &
those who bring healthy snack in lunch
break were verbally encouraged.

110
Facilitation Providing tools, resources &
environmental changes to make it easy
for children to learn the nutrition
concepts and to practice develop
healthy dietary habits.
Tools that promote adopting healthy
dietary habits used in this study
included: practical nutrition guidelines
sent home letters, school posters
promoting healthy dietary lifestyle,
simple label reading practice, using
everyday materials to estimate portion
size, the use of plate method & the use
of fruit & vegetable bands system to
track fruit and vegetable intake during
the day.

111
Appendix G

112
Table 13
Lessons for Let’s Eat Smart Program
Topic Lesson Lesson description
Energy Balance
1. Energy in= Energy out.
Lecturing: Students introduced to energy balance concept, pedometers, calories, nutrient-dense, energy-dense and exercise. Interactive lesson: student demonstrate a double amount of exercise after consuming 2 Hershey kisses chocolate vs. 2 slice of apples Group activity: bar graph work sheets and comparison between groups and discussion.
2. What is a Calorie? DVD.
Review and introduction. DVD: A 20 minutes video for 4 and 5th graders about energy balance to reinforce the concept learned previous week
3. Discussion & Recap
Q&A: a guided discussion about the energy balance concept and the video from last week.
MyPyramid 4. MyPyramid Lecturing: introduce MyPyramid five colored groups and recommended exercise with examples of food models to show what a serving size for each food look like. Interactive lesson: student demonstrates healthy choices by participating in a Food Pyramid pocket chart & card Game. Group activity: children will fill an activity sheet about MyPyramid groups and each group will compose a healthy breakfast, lunch and dinner using food models.
5. Food Smart: MyPyramid DVD.
Introduction & review of MyPyramid portion size for each group. DVD: A 20 minutes video suitable for 4th & 5th graders about what is MyPyramid and how it can help in food choices to reinforce previous week lesson.
6. Discussion & Recap
Q&A: a guided discussion about MyPyramid and the video from last week.
Portion Size 7. Food Models & Portion estimation
Review of serving size of food groups and introduction of portion distortion. Interactive lesson: using visual posters and food models to make children make their own comparison about portion change. Introducing the children to some handy object around home that they can use to estimate their food servings. Group activity: students groups will create a full day menu of three meals using a Math activity sheet obtained from MyPyramid.
8.Portion
Distortion DVD.
Review of portion distortion. DVD: a 20 minutes video about food portion sizes change over the years.

113
9. Discussion
& Recap
Q&A: a guided discussion about the appropriate serving sizes and the video from last week.
Healthy Eating
10. Nutrient Math & Science
Introduction about what is nutrient dense vs. energy dense food, vitamins, minerals, fiber, sugar, fat, protein and their role in health. Interactive lesson: showing simple food labeling information, visualizing sugar, fat and fiber content of some common food and using measuring tools such as food scales and beakers to measure fluid volumes and compare finding with food labels on food boxes. Group activity: compare and draw a bar chart about sugar, fat and fiber content of different common foods.
11. Healthy snack Day
Introduction: emphasizing the importance of healthy breakfast and healthy snack choices with focus on fruits and vegetables. Interactive lessons: snack day is about A fun cooking activity. Group 1 will make smiley low fat cheese sandwich with olives, tomato, yellow pepper and group 2 will make cantaloupe balls for desert. Group activity: student will try new fruits and vegetables and record their opinions on a food palate.
12. Discussion & Recap
Q&A: a guided discussion about the appropriate snacking habits.

114
Appendix H

115
Balancing energy in is (food) and energy out is (exercise)
Calorie: is a unit that represents the energy stored in food.
Pedometer: a device that measures footsteps.
(The goal for physical activity is to take 10,000 steps every day)
Nutrient-dense food: food that is rich in vitamins and minerals
(Like whole grains, beans, fruits and vegetables)
Calorie-dense food: food that has lots of calories.
(Like candy and fast food. These foods have lots of fat and fats have lots of calories)
1cup of butter = 1600 calories
1 cup of rice = 200 calories
1 cup of strawberries = 45 calories
Energy
Energy Balance
Food
Topic 1

116
Activity
Write number of steps:
Food choice
Number of laps Number of steps
2 Apple slices 1 lap
2 Hershey’s Kiss Chocolate
2 laps
Complete the bar graph below:
Topic 1
Apple Chocolate

117
MyPyramid: is a guide that helps you balance energy in (food) with energy out
(exercise).
Eat the MyPyramid way:
MyPyramid shows you the correct food servings you should eat form each food
group.
MyPyramid
Guide you
Topic 2

118
Activity
Match each food group with the box that tells us what the group gives our bodies.
Every day I need to have ________________ cups of dairy.
Every day I need to have at least _____________ servings of fruit and vegetables.
Every day I need to do _________________ minutes of physical activity.
I need to eat most from ___________ group and limit ________________.
Topic 2

119
A portion is the amount of food that you choose to eat. It can be big or small—you
decide.
A serving is a measured amount of food or drink, such as one slice of bread or one
cup (250ml) of milk .
20 years ago Now
Portion Distortion
333 Calories 590 Calories
2 cups
1025 Calories
1 cup
500 Calories
210 Calories 610 Calories
250 Calories 85 Calories
210 Calories
850 Calories
500 Calories
500 Calories
630 Calories 270 Calories
Example: You eat a sandwich with 2 slices of bread. The Food Guide Pyramid serving
size for bread is 1 slice. Your portion is 2 slices, which equals 2 servings from the
Pyramid Grains group.
Topic 3

120
Visual guide for portion size
Try this portion measuring tips:
Measure your typical portion of foods you eat often using measuring cups or you can use the plate method.
Limit portions of foods high in calories, such as cookies, cakes, other sweets, and fats.
Try using a smaller plate for your meal.
Put sensible portions on your plate and don't take "seconds".
Activity
List two reasons why "bigger" is not always "better"?
____________________________________________________________
____________________________________________________________
Topic 3

121
Food Math Activity
Jason is 9 years old. He is physically active sometimes. Each day, he needs to eat:
Topic 3

122
Snacking tips for healthy kids
Keep beverage choices healthful. Choose low-fat milk (1 cup serving), water, and moderate amounts of 100% fruit juice.
Avoid soda, sweetened juice drinks, and sports drinks!
Look for snacks that have at least 2 grams of fiber per serving listed on the nutrition label.
Choose whole-grain snacks as much as possible. Look for the word “whole” as one of the first ingredients on the product label.
Keep fresh fruits and veggies readily available.
Choose low-fat dairy products, like low-fat cheeses, cottage cheese, yogurt, and milk.
Aim for snacks low in fat and sugar.
Snacks that include at least two of the major food groups are best (carbohydrates, meats/beans/nuts, dairy, fruits and vegetables). For example, cottage cheese with cucumber slices.
Healthy Snacking Topic 4

123
In the grocery store LOOK at the Food Label
Complete the bar graphs below:
Light Ice-cream
Ice-cream Frozen Yogurt
100% Juice
Fruit Punch
Soda Energy Drink
Sugary Cereal
Whole Milk
Non-fat Milk
Low-fat Milk
All Bran Cereal
Rice Cereal
Activity

124
Appendix I

125
My student ID_____________________________________________
Class ___________________________________________________
Let’s Eat Smart (Survey)

126
Nutritional knowledge and healthy lifestyle behavior survey Please tell me some things about you____________________________________________
I am a Boy, Girl My Nationality Kuwaiti , Others ________________________ I am in year 4 5 My age is _____________ My birth date Month ___ ___ Day___ ___ Year_______ My Initials _____ _____ ______
For each question, please fill the circle next to the answer you think is correct _
1. Balancing energy in and energy out is important to maintain a healthy body weight.
Energy out is also known as:
exercise
calories
Nutrients
water
2. The goal for physical activity is to take ______________ steps every day.
1000
100
5000
10,000
3. A unit of energy that comes from the food we eat and what we drink is called:
Nutrient
Vitamin
Serving size
Calorie
4. Calories in 1 cup of butter _________calories in 1 cup of rice.
Equal
Less than
More than
None of the above

127
5. A guide that helps us to balance what we eat with regular physical activity called:
Food pyramid
Food label
Diet
Menu
6. A guide that helps us to evaluate what are the nutritional contents of food products
called:
Food pyramid
Food label Diet Menu
7. My Pyramid recommends __________minutes of activity per day.
5-10
15-20 30-60 90-120
8. According to My Pyramid you should eat most from the ___________ group. Grain Milk Vegetables Fruits
9. A correct food serving refers to _____________
How much a person normally eats
How much a person should eat following the guide of My Pyramid
How much it takes to feel full
How much a person should eat following the guide of food menu
10. Total number of servings of fruits and vegetables you should eat every day are: At least 2
At least 5
At least 10
At least 8

128
11. One cup of cooked rice is equal to:
Tennis bal
Basketball
Football
Ping-Pong ball
12. Every day you need ________ cups of dairy.
13. The healthiest choice from the following is to drink: 100% fruit juice
Fruit punch
Soft drink
Energy drink
14. Which food is considered a healthy snack?
Low fat yogurt
Lettuce and tomato salad
Baked potato
All of the above
15. Which food had most fiber?
A slice of watermelon
A spoon of low-fat mayonnaise
A small cupcake
A slice of meat
16. Foods that contain high amounts of vitamins and minerals and relatively few calories are called:
Energy-dense food
Calorie-dense food
Nutrient-dense food
Weight-dense food
4
3
2
5

129
For each Question, please fill the circle next to the answer that describes you best______ Attitude
17. How important is eating healthy to you?
Very important Somewhat important Not important
18. How important is physical activity to you?
Very important Somewhat important Not important
19. How important is it for schools to help students learn about healthy diet and physical activity?
Very important Somewhat important Not important
Dietary practices
20. Think about last week. How frequent did you eat food from a fast food restaurant?
Never Sometimes Frequently Daily
21. Think about last week. How frequent did you skip eating breakfast?
Never Sometimes Frequently Daily
22. Yesterday did you eat snacks like candy, chocolate, chips, cookies, cake or ice-
cream?
No, I didn’t eat any of the foods listed above yesterday.
Yes, I ate 1 of these foods 1 time yesterday.
Yes, I ate 1 of these foods 2 times yesterday.
Yes, I ate 1 of these foods 3 or more times yesterday.
23. Yesterday, did you eat fruit? Do not count fruit juice.
No, I didn’t eat any fruit yesterday.
Yes, I ate fruit 1 time yesterday.
Yes, I ate fruit 2 times yesterday.
Yes, I ate fruit 3 or more times yesterday.
24. Yesterday, did you eat any vegetables?
Vegetables are salads; boiled, baked and mashed potatoes; and all cooked and
uncooked vegetables. Do not count French fries or chips.
No, I didn’t eat any vegetables yesterday.
Yes, I ate vegetables 1 time yesterday.
Yes, I ate vegetables 2 times yesterday.
Yes, I ate vegetables 3 or more times yesterday.

130
Self efficacy
25. How sure are you that you can drink low fat or skim milk instead of regular white
milk?
Not sure A little sure Very sure
26. How sure are you that you can eat fresh fruit instead of a candy bar?
Not sure A little sure Very sure
27. How sure are you that you can eat a baked potato instead of French fries?
Not sure A little sure Very sure
28. How sure are you that you can drink fruit juice instead of a soft drink?
Not sure A little sure Very sure
29. How sure are you that you can eat brown bread instead of white bread?
Not sure A little sure Very sure
Thank you
The end of the Questionnaire

131
Appendix J

132
My student ID_____________________________________________
Class ___________________________________________________
Dear parents,
Please help your child to write down all what he actually eats and drinks for three days. (Day 1 in the first table, Day 2 in the second table and Day 3 in the third table.)
Please note that you child should describe his intake with your help thoroughly.
Your child should write the type, size, brand name and amount of food he eats and drinks. (Example: 2 medium oranges, ½ cup vegetable salad, 1 ½ cup whole milk, 1 cup white rice, 3 small pieces of fried fish, ½ cup lentil soup, 250ml fresh apple juice, 2 tablespoon honey, 3 pieces of white toast, 1 piece medium brown bread, 1 medium MacDonald’s cheese burger, 1 large MacDonald’s fries, 1 cup coca cola medium size, 1 beef kabob with tomato 2 slices on a white bread pita bread sandwich, 6 black olives large size, 4 slices of tomato.)
Your child should complete this form and return it back by next week at most.
Reminder: Only those who complete the questionnaire & the food record at the beginning and at the end of the study will be eligible for the scientific center ticket.
Thank you for your cooperation
Let’s Eat Smart (Food Record)

133
Please fill out the chart below with the food you will eat today _Day 1_
Meals Did you have any?
If yes, What is the kind and size of food you ate and how much?
Breakfast Yes No
At school meal
Yes No
Lunch
Yes No
Afternoon snack
Yes No
Dinner
Yes No
Late snack
Yes No

134
Please fill out the chart below with the food you will eat today _Day 2_
Meals Did you have any?
If yes, What is the kind and size of food you ate and how much?
Breakfast Yes No
At school meal
Yes No
Lunch
Yes No
Afternoon snack
Yes No
Dinner
Yes No
Late snack
Yes No

135
Please fill out the chart below with the food you will eat today _Day 3 Weekend
Meals Did you have any?
If yes, What is the kind and size of food you ate and how much?
Breakfast Yes No
Early snack
Yes No
Lunch
Yes No
Afternoon snack
Yes No
Dinner
Yes No
Late snack
Yes No

136
Appendix K

137
Group evaluation session-- Student’s checklist 1. What do you think is the purpose of the program?
__________________________________________________________________________________
__________________________________________________________________________________
2. Did you understand all the lessons? Yes, No If no, what did you not understand?
__________________________________________________________________________________
If yes, what would you say is the main thing you learned?
__________________________________________________________________________________
3. Did you like the lessons and the activities? Yes, No If no, what did you not like about it?
_________________________________________________________________________________
If yes, what did you like about it?
_________________________________________________________________________________
4. Did the DVD help you learn about the previous lessons? Yes, No If no, what do you think would help you learn?
________________________________________________________________________________
If yes, what did you like about the DVD?
________________________________________________________________________________
5. Is there anything you wanted to learn about that was not covered in the lessons? Yes, No If yes, what do you like to know?
________________________________________________________________________________
________________________________________________________________________________
6. Did you talk about what you learned this week with you parents? Yes, No If no, why did you not share?
________________________________________________________________________________
If yes, what did you talk about?
________________________________________________________________________________
7. Would you like to participate in more Let’s Eat Smart lessons and activities? Yes, No
8. Please write any other comments about the lesson and the activities you did if you wish.
________________________________________________________________________________
________________________________________________________________________________

138
Appendix L

139
Table 14
Participant’s Responses on Dietary Practices Questions
Pre Post
Behavioral Variable n % n %
Fast Food Consumption
Never/last week
Sometimes/last week
Frequently/last week
Daily/last week
18
52
13
1
21.4
61.9
15.5
1.2
26
56
2
0
31.0
66.7
2.4
0.0
Skipping Breakfast
Never/last week
Sometimes/last week
Frequently/last week
Daily/last week
30
33
10
11
35.7
39.3
11.9
13.1
30
37
7
10
35.7
44.1
8.3
11.9
Caloric-dense Food Snacking
0 times/yesterday
1time/yesterday
2 times/yesterday
3 or more times/yesterday
30
33
10
11
35.7
39.3
11.9
13.1
27
35
16
6
32.1
41.7
19.0
7.1
Fruit Intake
0 times/yesterday
1time/yesterday
2 times/yesterday
3 or more times/yesterday
25
17
15
27
29.8
20.2
17.9
32.1
22
15
17
30
26.2
17.9
20.2
35.7
Vegetable Intake
0 times/yesterday
1time/yesterday
2 times/yesterday
3 or more times/yesterday
29
24
17
14
34.5
28.6
20.2
16.7
27
24
13
20
32.1
28.6
15.5
23.8

140
Appendix M

141
Table 15
Students’ Comments in Regard to Comprehension and Awareness
Theme tested Example of Students comments
Comprehension & awareness
1. What do you think is the
purpose of the program?
Eating healthy to give the body energy and protect it from
diseases
How often you should eat healthy food
What to not eat and what to eat
To choose food wisely and choose food that benefits our
bodies
Balance diet and healthy food
To know the importance of eating healthy food
That we need to exercise and eat healthy
2. Did you understand the
lessons? If Yes, what is the main thing you leaned? (n = 92)
That we should eat more healthy food
How to choose food at home smartly
We must follow MyPyramid
That what matters is what kind of food we eat and the
quantity
Fruit and vegetables are good for health
We must balance diet with activity
If No, what did you not understand? (n = 3)
Calories and how to read food label
nutrients in food
Why so much fast food and candy makes us sick, then why
we like it.

142
Table 16
Students’ Comments in Regard to Practicality and Usability
Theme tested Example of Students comments
Practicality & usability
3. Did you like the lessons
and the activities?
If Yes, what did you like? (n = 91)
I like everything, it is fun and easy
The idea of eating smart
I like the presents
The pyramid activity
I like when we counted steps with pedometers and went outside
to run
That I know now what to eat and how much
I like how the teacher bring food and show us how many calories
in them.
The fruit and vegetable bands helped a lot.
I liked the lesson that tells us about fiber, fat and sugar in food
I liked the cooking class it was awesome
If No, what did you dislike? (n = 4)
I don‘t like that we have to eat more fruits and vegetables.
I like fast food and mom says it is ok so these lessons are not
important
When we have to run and do exercise
That sometimes we didn‘t have space or tables
4. Did the DVD help you
learn about the previous
lessons?
If Yes, what did you like about it? (n = 85)
I like how the DVD help me learn what I must eat
I liked the cartoon it is funny and interesting
Everything
That it had real people talking about them selves
It helped a lot in learning about calories
The food pyramid camp
That I learn about what other people do to live healthy
That it made me remember what you talk about
If No, what would help you learn? (n = 10)
Do more class activities
I prefer the teacher tell us more about Kuwait
It helps littlie. I like to do more experiments and cook food
The kids in DVD talk too fast and I do not understand some of
what they say. So better the teacher talk
I do not remember it, I remember better when I do things
I did not like the healthy food it shows
I did not understand it

143
Table 17
Students’ Comments in Regard to Relevance and Interest
Theme tested Example of Students comments
Relevance & Interest
5. Did you share with your
parents what you learned?
If Yes, what did you share? (n = 78)
How it is important to eat healthy
How we should eat fruits and vegetables and using bands to
remind us
I told mom to give me vegetables everyday
How fruits are better than chocolate
The pyramid help us to eat healthy
How to look at food label in grocery
If No, why you did not share? (n = 17)
I forgot
I didn‘t have time, because of lots of homework
I don‘t feel like to say a lot
I did not share because I already have healthy food in my
house
Because they don‘t care
6. Is there anything you wanted
to learn that was not covered
in the lessons?
If Yes, what would you like to know? (n = 15)
About exercise
What is in fast food
Why too much oil is not good for us
About chocolate
More about pedometers
How it feels when we eat junk food or healthy food
I would like to know about food pesticides and how we can
avoid it
Table 18
Students’ Comments in Regard to the Overall Impact
Theme tested Example of Students comments
Overall Impact
7. Would you participate in
more Let‘s Eat Smart lessons?
Number of yes responses (n = 86)
Number of no responses (n = 9) 8. Other comments you may
have?
Sometimes the class gets noisy
The lesson is too short and I wish we have more time
I did not like the DVD telling us about healthy food
It was assume when we watched the DVD
I like the lessons so much thank you
I like that it is ok to eat chocolate sometimes
I like that we have to use fruit and vegetables bands at home
I love your classes they are fun
I wish we did more activities outside
You made me think that I have power to eat smart
Thank you I enjoyed your classes

144
VITA
Sondos Kalendar was born in Raleigh, North Carolina on November 14, 1978 to her
parents, Ahmad Kalendar and Hind Al-Mulla. She was raised in Kuwait and graduated from
Qurtuba High School in 1996. She attended the Faculty of Medicine at Kuwait University from
2000 to 2002. After that, she traveled to the United States and attended the University of
Colorado at Boulder in 2005. The following spring she attended Colorado State University where
she graduated with a Bachelor of Science in Dietetics in 2007. In fall 2008, she began attending
the Food and Nutrition Services program at the University of Mississippi and received a Master
of Science in 2011.
She will be returning to Kuwait to fill a teaching position in the Collage of Nursing at the
Public Authority of Applied Education and Training. She is married and has two daughters.