Development and application of LC–APCI–MS method for biomonitoring of animal and human exposure...
9
Development and application of LC–APCI–MS method for biomonitoring of animal and human exposure to imidacloprid Matthaios P. Kavvalakis a,1 , Manolis N. Tzatzarakis a,1 , Eleftheria P. Theodoropoulou a , Emmanouil G. Barbounis a , Andreas K. Tsakalof b , Aristidis M. Tsatsakis a,⇑ a Center of Toxicology Science & Research, Medical School, University of Crete, Heraklion, Crete 71409, Greece b Faculty of Medicine, University of Thessaly, Larissa 41222, Greece highlights LC–MS method for quantification of imidacloprid in urine and hair is described. The developed method is precise, accurate and sensitive. The method was tested in biomonitoring of intentionally exposed rabbits. The method was applied for pilot biomonitoring of Cretan population exposure. Method can also quantify 6- chloronicotinic acid – main metabolite of imidacloprid. graphical abstract article info Article history: Received 23 May 2013 Received in revised form 27 August 2013 Accepted 20 September 2013 Available online 23 October 2013 Keywords: Biomonitoring Pesticide exposure Imidacloprid Hair Urine abstract Imidacloprid (IMI) is a relatively new neuro-active neonicotinoid insecticide and nowadays one of the largest selling insecticides worldwide. In the present study a LC–APCI–MS based method was developed and validated for the quantification of imidacloprid and its main metabolite 6-chloronicotinic acid (6- CINA) in urine and hair specimens. The method was tested in biomonitoring of intentionally exposed ani- mals and subsequently applied for biomonitoring of Cretan urban and rural population. The developed analytical method comprises two main steps of analytes isolation from specimen (solid– liquid extraction with methanol for hair, liquid–liquid extraction with methanol for urine) and subse- quent instrumental analysis by LC–APCI–MS. The developed method was applied for the monitoring of IMI and 6-ClNA in hair and urine of laboratory animals (rabbits) intentionally fed with insecticide at low or high doses (40 and 80 mg kg 1 weight d 1 respectively) for 24 weeks. The analytes were detected in the regularly acquired hair and urine specimens and their found levels were proportional to the feeding dose and time of exposure with the exception of slight decline of IMI levels in high dose fed rabbits after 24 weeks of feeding. This decline can be 0045-6535/$ - see front matter Ó 2013 Elsevier Ltd. All rights reserved. http://dx.doi.org/10.1016/j.chemosphere.2013.09.087 Abbreviations: IMI, imidacloprid; 6-ClNA, 6-chloronicotinic acid; ILD, imidaclo- prid low dose group; IHD, imidacloprid high dose group; LOD, limit of detection; LOQ, limit of quantification; LC–MS, liquid chromatography–mass spectrometry; HPLC, high performance liquid chromatography; APCI, atmospheric pressure chemical ionization; SIM, selected ions monitoring; CDL, curved desolvation system; WHO, World Health Organization; USEPA, United States Environmental Protection Agency; SD, standard deviation; LD 50 , lethal dose (50% of population). ⇑ Corresponding author. Address: Head of Forensic Sciences and Toxicology Department, Medical School, University of Crete, P.O. Box 1393, Heraklion, Crete 71003, Greece. Tel.: +30 (2810) 394679; fax: +30 (2810) 542098. E-mail address: [email protected] (A.M. Tsatsakis). 1 Both authors have equal contribution to paper. Chemosphere 93 (2013) 2612–2620 Contents lists available at ScienceDirect Chemosphere journal homepage: www.elsevier.com/locate/chemosphere
Transcript of Development and application of LC–APCI–MS method for biomonitoring of animal and human exposure...

Chemosphere 93 (2013) 2612–2620
Contents lists available at ScienceDirect
Chemosphere
journal homepage: www.elsevier .com/locate /chemosphere
Development and application of LC–APCI–MS method for biomonitoringof animal and human exposure to imidacloprid
0045-6535/$ - see front matter � 2013 Elsevier Ltd. All rights reserved.http://dx.doi.org/10.1016/j.chemosphere.2013.09.087
Abbreviations: IMI, imidacloprid; 6-ClNA, 6-chloronicotinic acid; ILD, imidaclo-prid low dose group; IHD, imidacloprid high dose group; LOD, limit of detection;LOQ, limit of quantification; LC–MS, liquid chromatography–mass spectrometry;HPLC, high performance liquid chromatography; APCI, atmospheric pressurechemical ionization; SIM, selected ions monitoring; CDL, curved desolvationsystem; WHO, World Health Organization; USEPA, United States EnvironmentalProtection Agency; SD, standard deviation; LD50, lethal dose (50% of population).⇑ Corresponding author. Address: Head of Forensic Sciences and Toxicology
Department, Medical School, University of Crete, P.O. Box 1393, Heraklion, Crete71003, Greece. Tel.: +30 (2810) 394679; fax: +30 (2810) 542098.
E-mail address: [email protected] (A.M. Tsatsakis).1 Both authors have equal contribution to paper.
Matthaios P. Kavvalakis a,1, Manolis N. Tzatzarakis a,1, Eleftheria P. Theodoropoulou a,Emmanouil G. Barbounis a, Andreas K. Tsakalof b, Aristidis M. Tsatsakis a,⇑a Center of Toxicology Science & Research, Medical School, University of Crete, Heraklion, Crete 71409, Greeceb Faculty of Medicine, University of Thessaly, Larissa 41222, Greece
h i g h l i g h t s
� LC–MS method for quantification ofimidacloprid in urine and hair isdescribed.� The developed method is precise,
accurate and sensitive.� The method was tested in
biomonitoring of intentionallyexposed rabbits.� The method was applied for pilot
biomonitoring of Cretan populationexposure.� Method can also quantify 6-
chloronicotinic acid – mainmetabolite of imidacloprid.
g r a p h i c a l a b s t r a c t
a r t i c l e i n f o
Article history:Received 23 May 2013Received in revised form 27 August 2013Accepted 20 September 2013Available online 23 October 2013
Keywords:BiomonitoringPesticide exposureImidaclopridHairUrine
a b s t r a c t
Imidacloprid (IMI) is a relatively new neuro-active neonicotinoid insecticide and nowadays one of thelargest selling insecticides worldwide. In the present study a LC–APCI–MS based method was developedand validated for the quantification of imidacloprid and its main metabolite 6-chloronicotinic acid (6-CINA) in urine and hair specimens. The method was tested in biomonitoring of intentionally exposed ani-mals and subsequently applied for biomonitoring of Cretan urban and rural population.
The developed analytical method comprises two main steps of analytes isolation from specimen (solid–liquid extraction with methanol for hair, liquid–liquid extraction with methanol for urine) and subse-quent instrumental analysis by LC–APCI–MS.
The developed method was applied for the monitoring of IMI and 6-ClNA in hair and urine of laboratoryanimals (rabbits) intentionally fed with insecticide at low or high doses (40 and 80 mg kg�1 weight d�1
respectively) for 24 weeks. The analytes were detected in the regularly acquired hair and urine specimensand their found levels were proportional to the feeding dose and time of exposure with the exception ofslight decline of IMI levels in high dose fed rabbits after 24 weeks of feeding. This decline can be

M.P. Kavvalakis et al. / Chemosphere 93 (2013) 2612–2620 2613
explained by the induction of IMI metabolizing enzymes by the substrate. After testing on animal modelsthe method was applied for pilot biomonitoring of Crete urban (n = 26) and rural (n = 32) population.Rural but not urban population is exposed to IMI with 21 positive samples (65.6%) and found median con-centration 0.03 ng mg�1. Maximum concentration detected was 27 ng mg�1.
� 2013 Elsevier Ltd. All rights reserved.
1. Introduction
Imidacloprid (IMI – 1-(6-chloro-3-pyridylmethyl)-N-nitroimidaz-olidin-2-ylideneamine) is a member of a relatively new class of neu-ro-active neonicotinoid insecticides which are syntheticderivatives of nicotine. Most neonicotinoids demonstrate muchlower toxicity in mammals than insects and therefore they have al-most replaced other more toxic organophosphate and carbamateinsecticides. Within a decade, they gained a market share of about77% (Elbert et al., 2008) and in particular IMI is nowadays one ofthe largest selling insecticides worldwide and get distributed inmore than 120 countries (Shripanavar and Deshmukh, 2013).
To the best of our knowledge for today no method of IMI and itsmain metabolite 6-chloronicotinic acid (6-ClNA) detection in bio-logical specimens has been presented in the literature. The simul-taneous detection and quantification of IMI and 6-CINA is aprerequisite for a proper biomonitoring study, since after pesticideabsorption the parent compound is quickly metabolized to 6-CINAby human cytochrome P450 isozymes (Schulz-Jander and Casida,2002). In Fig. 1, the whole metabolic pathways of IMI are shownas firstly presented by Solecki (2001). Since IMI is a widely usedinsecticide for many applications, the necessity to establish an ana-lytical method for its detection and quantification in biologicalspecimens is very important for biomonitoring of human exposureto this insecticide.
Concerning biological specimen used for exposure evaluationand biomonitoring hair have a special value, as their analysis couldprovide information for long-term exposure. Moreover, hair can beeasily acquired by non-invasive sampling and a second specimengiving similar information to the first can be easily obtained ifneeded (Tsatsakis et al., 1998, 2008a; Tutudaki et al., 2003). Hairanalysis has been successfully used to assess chronic exposure tovarious chemicals (drugs of abuse, medicines, metals, variousxenobiotics, environmental pollutants) and for the assessment ofexposure to organophosphate pesticides (Dolapsakis et al., 2001;Tsatsakis et al., 2008b, 2010).
The aim of this study was to develop an analytical LC–APCI–MSmethod for the detection and quantification of IMI and 6-ClNA inhair and urine specimens and apply this method at an in-houselaboratory study of orally exposed rabbits and finally use the meth-od for the chronic exposure assessment to IMI of two different hu-man population groups (rural and urban residents) of Crete(Greece).
2. Experimental
2.1. In-vivo study protocol
Six male rabbits aged 3 months, weighing approximately 3 kgeach were selected for this study. Rabbits were divided into threetreatment groups of two animals each and housed in individualmetal cages in the Medical School’s test animal facilities (Univer-sity Hospital of Heraklion, Crete). They kept in a 12 h dark/light cy-cle with average temperature 25 �C and fed with commercialrabbit pellets ab libitum. Potable (tap) water was also provided. Fol-lowing a one-week acclimation, two of the groups were treatedwith two different sub-acute doses of IMI via potable water. Since
oral LD50 values for rabbits were not reported before the sub-acutedoses were estimated on the basis of known values for rats and twodifferent doses were used to cover the evaluated sub-acute rangein rabbits (Meister, 1994). The IMI low dose (ILD) group was ex-posed to 40 mg kg�1 d�1 and the IMI high dose (IHD) group to80 mg kg�1 d�1, diluted in clean tap water, during a period oftwenty-four successive weeks (approx. 6 months) with the admin-istration performed three times per week. The total amount of in-gested IMI for each test animal of the ILD group was 21900 mg andthe corresponding amount for the IHD group was 43800 mg. Acontrol group of rabbits was also used. Dietary habits concerningwater and food consumption were noted during the study. All rab-bits were observed regularly and their health condition was re-corded as well. There was no clinical evidence of acute poisoningby the ingested amounts of IMI.
2.2. Rabbit hair and urine samplings
Urine and hair specimen collection was performed before thefirst dose administration and at the end of each month of the treat-ment. In order to assess the bioaccumulation of target metabolites,hair specimens were collected from the back of each animal. Thesame anatomical site was used for hair sampling each time. Hairspecimens were labeled and stored in paper envelopes in a dryplace, at room temperature until analysis. Moreover, 24 h urinesamples (approx. 20 mL) of each test animal were collected andstored at �20 �C until analysis.
The present study was approved by the Veterinary Administra-tion Office of Heraklion, Ministry of Agriculture and the AnimalInvestigation Committee of the University of Crete and the Univer-sity Hospital and conformed to the National and European Uniondirections for the care and treatment of laboratory animals.
2.3. Human hair sampling
Head hair specimens (n = 58) were collected from residents ofrural and urban areas of Crete Island, Greece. Twenty-six hair spec-imens were from residents of the city of Heraklion (Crete, Greece)and marked as general population (urban). 38.5% (10/26) of the ur-ban residents were male, while the average age of the urban pop-ulation group was 35.0 ± 16.0 years old. Also, 32 head hairspecimens were collected from residents of villages Kantanos andKountoura (both villages are located in the prefecture of Chania,Crete, Greece). These were marked as rural regions due to the par-ticipation in agricultural activities by the residents of these vil-lages. An amount of approximately 50–100 mg was collectedfrom the back of the scull, while information about the residence,the occupation, the dietary habits and health issues were recordedfor each individual. All hair samples were stored in envelopes atroom temperature until analysis.
2.4. Materials
Imidacloprid (>95%) was a kind gift of Vapco (Jordan). Ethirimol(internal standard), 6-chloronicotinic acid, methanol and water(LC–MS grade) were all purchased from Sigma–Aldrich ChemieGmbh (Germany). Hydrochloric acid (37%) was purchased from

N NH
NNClNO2
N NH
NNClNO2
HO
NCl
COOH
Imidacloprid
5-Hydroxyimidacloprid
6-chloronicotinic acid
N NH
NNClNH2
N NH
NHNCl
N N
NNClN CH3
O
Triazinone
Guanidine-type metabolite
N NH
NNClNO2
OH
4-Hydroxyimidacloprid
N NH
NNClNO2
Olefinic metabolite
HN NH
NNO2
N NH
NNClNO
Nitroso metabolite
HN NH
NNO2
NCl
NH
O
COOH
Glycine conjugate of6-chloronicotinic acid
NHO
COOH
6-hydroxynicotinic acid
NS
COOH
HN
HOOC
CH3
OMercapturic acid derivative of
6-chloronicotinic acid
NS
COOH
H3CNS
NH
COOH
O
H3C
6-methylmercaptonicotinic acidGlycine conjugate of6-methylmercaptonicotinic acid
Fig. 1. Metabolic pathways for imidacloprid (Solecki, 2001).
2614 M.P. Kavvalakis et al. / Chemosphere 93 (2013) 2612–2620
Merck (Germany). Dichloromethane (pure analytical grade) waspurchased from Fluka (Germany).
2.5. Liquid chromatography and mass spectrometry conditions
Liquid chromatography was carried out using Shimadzu Prom-inence LC system consisting of a binary LC pump, a vacuum degas-ser, an autosampler and a column oven. A gradient of 0.1% formicacid in water (solvent A) and methanol (solvent B) were selectedfor routine use: starting at 20% of solvent B, 100% B (15.0 min linearramp) and, finally 20% B (5 min). Total mobile phase pumped at0.6 mL min�1 through a Discovery C18 HPLC column(25 cm � 4.6 mm, 5 lm) thermostated at 30 �C. A 10 lL volumeof each sample was injected in the mobile phase flow.
A mass spectrometer (LCMS-2010 EV Shimadzu), comprised ofan atmospheric pressure chemical ionization (APCI) interface anda single quadrupole mass filter, was used to detect and quantifyIMI and 6-ClNA in column effluent. Interface, curved desolvationsystem (CDL) and heat block temperatures were 400 �C, 250 �Cand 200 �C, respectively. The detector voltage was 1.5 kV and thenebulizing gas flow 2.5 L min�1. Drying gas was set at 0.02 MPa.Ion signals were acquired in time selected ion monitoring (SIM)mode with ions m/z = 256.00, 211.95, 288.00 for IMI, 157.95,190.00, 96.00 for 6-ClNA and 210.10 for ethirimol used as internal
standard (underlined fragments were used for quantification)(Proenca et al., 2005).
The mass spectrometry operating conditions were tunedaccording to the manufacturer procedure. Data acquisition andprocessing were performed using LC–MS Solution software (Shi-madzu, version 3.40.307).
2.6. Stock and working solutions
Stock solutions of IMI and 6-ClNA at the concentration of1 mg mL�1 were prepared in methanol. Working solutions ofmixed analytes were prepared weekly by dilutions in methanolin the concentrations of 0, 0.05, 0.1, 0.25, 0.5, 1 and 10 lg mL�1.All working solutions were stored at �20 �C.
2.7. Quality controls and spiked samples
Spiked samples were prepared as previously reported (Tsatsakiset al., 2010). Control group rabbits’ hair and a pool of human do-nors’ hair with no detectable levels of IMI and 6-ClNA were usedas blank hair samples and were further used for the preparationof the spiked samples and the quality controls. The blank humanor rabbit hair samples were spiked with known concentrations ofIMI and 6-ClNA in a concentration range from 0 to 16 ng mg�1
(0, 0.1, 0.25, 0.5, 1, 2, 4, 8, 12 and 16 ng mg�1) and used for the

M.P. Kavvalakis et al. / Chemosphere 93 (2013) 2612–2620 2615
preparation of the calibration curves and further quantification ofin vivo rabbits’ hair specimens as well as of human head hair spec-imens. Quality control samples were similarly prepared. In eachanalysis batch, two quality control samples were run in levels of0.25 and 4 ng mg�1 (for both IMI and 6-ClNA).
Similar procedure was followed for urine analysis. Blank urinesamples were spiked with known concentrations of IMI and 6-ClNA in a concentration range from 0 to 50 lg mL�1 (0, 0.5, 1,2.5, 5, 10, 25 and 50 lg mL�1) and used as spiked samples for thepreparation of calibration curves. Respectively, two quality controlsamples were included in each analysis batch, in levels of 1 and10 lg mL�1 (for both IMI and 6-ClNA).
2.8. Hair specimen treatment
2.8.1. Decontamination of hairFor the removal of the external contaminants a procedure used
in previous studies (Maravgakis et al., 2012; Tsatsakis et al., 2010)slightly modified was used. Briefly, hair specimens were washedonce in 5 mL of water (for 10 min) and twice in 5 mL of methanol(for 1 min) at room temperature. Washed hair specimens weredried in the oven. The methanol wash was tested for IMI and 6-ClNA to confirm that external contamination was eliminated. Sub-sequently, an amount of 50 mg of hair was cut in 2–3 mm pieces,weighed and finally transferred in a glass test-tube with screw-top. Ten microlitre of ethirimol were added (10 lg mL�1) as inter-nal standard.
2.8.2. Isolation of analytes from hair specimensHair was incubated with 2 mL of methanol at room temperature
in an ultrasonic bath for 3 h. The temperature of the bath duringthe ultrasonic extraction did not exceed 40 �C. The methanol ex-tract was filtered through 0.2 lm membrane filter (econofilter,Agilent Technology) to a glass test-tube. The same procedure wasrepeated once more and finally the total 4 mL of methanol wereevaporated to dryness under a gentle nitrogen stream at roomtemperature. The residue was dissolved in 100 lL of methanoland 10 lL were injected to LC–MS (Fig. 2A).
(A)
Fig. 2. Flow charts of the experimental procedures followed for IM
2.9. Urine specimen treatment
To 0.5 mL of urine, 10 lL of ethirimol solution (10 lg mL�1 inmethanol) were added. The specimen was further diluted with1.5 mL of water (HPLC grade) and 2 mL of dichloromethane wereadded. The mixture was shaken mechanically for 10 min and aftercentrifuging it in 4000 rpm for 5 min, the organic layer was col-lected. The aquatic phase was acidified with 10 lL of HCl 6 Mand then 2 mL of dichloromethane were added again. The extrac-tion procedure was repeated once more. Both organic layers (total4 mL) were mixed and evaporated to dryness under a gentle nitro-gen stream, at 25 �C. The residue was reconstituted in 100 lL ofmethanol and 10 lL were injected to LC–MS (Fig. 2B).
3. Statistical analysis
Concentrations of IMI and 6-ClNA were expressed in the form ofmean (±standard deviation-SD) for animal experiments and in theform of median (minimum–maximum values) for the human spec-imens. Mann–Whitney tests were applied for two groups’ compar-isons. Two-way analysis of variance (2-way ANOVA) was applied toexamine the effect of dosage (high-low) and time of exposure (2nd,4th and 6th months). Scatter plots figure the estimated (model)mean IMI and 6-ClNA concentrations per time (months) and dos-age. IBM SPSS Statistics 20.0 was used for analysis.
4. Results
4.1. Method development and optimization
The developed methods for IMI and 6-CINA quantification inbiological specimens (hair, urine) are comprised of two main steps,in particular analytes extraction from the biological sample andsubsequent instrumental analysis of the extract. During methodsdevelopment the conditions and parameters of these two stepswere optimized for the most efficient analytes extraction, detec-tion and quantification.
(B)
I and 6-ClNA extraction from hair (A) and urine (B) samples.
2616 M.P. Kavvalakis et al. / Chemosphere 93 (2013) 2612–2620
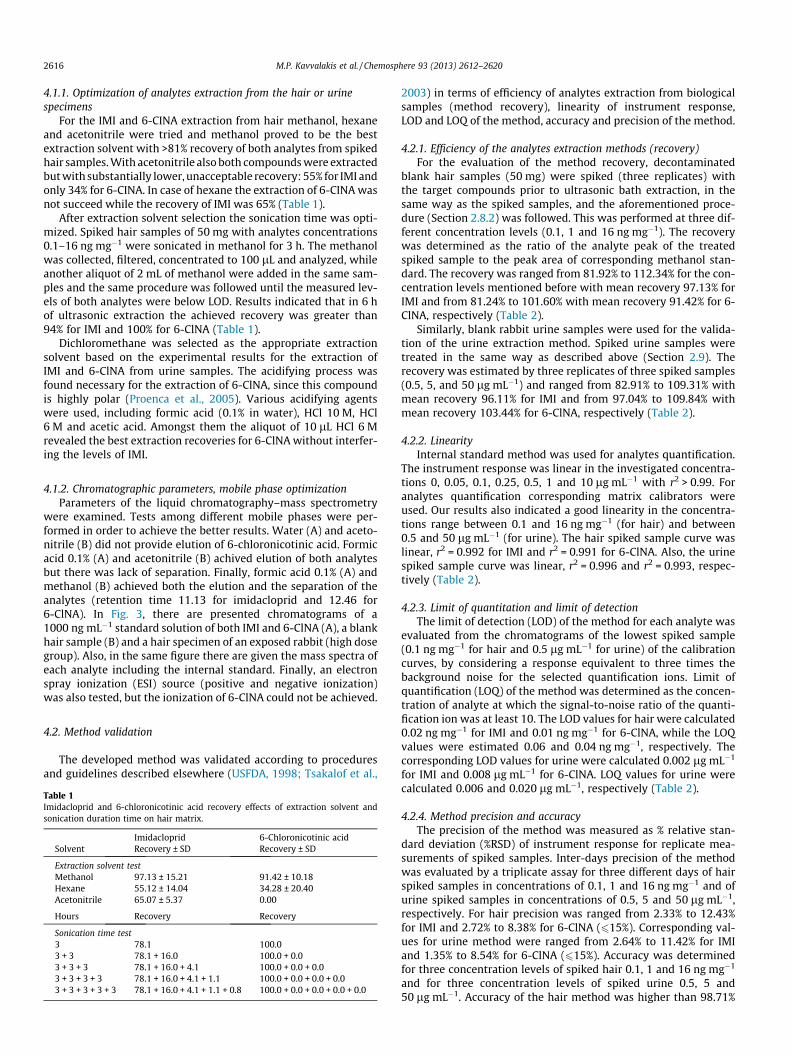
4.1.1. Optimization of analytes extraction from the hair or urinespecimens
For the IMI and 6-CINA extraction from hair methanol, hexaneand acetonitrile were tried and methanol proved to be the bestextraction solvent with >81% recovery of both analytes from spikedhair samples. With acetonitrile also both compounds were extractedbut with substantially lower, unacceptable recovery: 55% for IMI andonly 34% for 6-CINA. In case of hexane the extraction of 6-CINA wasnot succeed while the recovery of IMI was 65% (Table 1).
After extraction solvent selection the sonication time was opti-mized. Spiked hair samples of 50 mg with analytes concentrations0.1–16 ng mg�1 were sonicated in methanol for 3 h. The methanolwas collected, filtered, concentrated to 100 lL and analyzed, whileanother aliquot of 2 mL of methanol were added in the same sam-ples and the same procedure was followed until the measured lev-els of both analytes were below LOD. Results indicated that in 6 hof ultrasonic extraction the achieved recovery was greater than94% for IMI and 100% for 6-ClNA (Table 1).
Dichloromethane was selected as the appropriate extractionsolvent based on the experimental results for the extraction ofIMI and 6-ClNA from urine samples. The acidifying process wasfound necessary for the extraction of 6-ClNA, since this compoundis highly polar (Proenca et al., 2005). Various acidifying agentswere used, including formic acid (0.1% in water), HCl 10 M, HCl6 M and acetic acid. Amongst them the aliquot of 10 lL HCl 6 Mrevealed the best extraction recoveries for 6-ClNA without interfer-ing the levels of IMI.
4.1.2. Chromatographic parameters, mobile phase optimizationParameters of the liquid chromatography–mass spectrometry
were examined. Tests among different mobile phases were per-formed in order to achieve the better results. Water (A) and aceto-nitrile (B) did not provide elution of 6-chloronicotinic acid. Formicacid 0.1% (A) and acetonitrile (B) achived elution of both analytesbut there was lack of separation. Finally, formic acid 0.1% (A) andmethanol (B) achieved both the elution and the separation of theanalytes (retention time 11.13 for imidacloprid and 12.46 for6-ClNA). In Fig. 3, there are presented chromatograms of a1000 ng mL�1 standard solution of both IMI and 6-ClNA (A), a blankhair sample (B) and a hair specimen of an exposed rabbit (high dosegroup). Also, in the same figure there are given the mass spectra ofeach analyte including the internal standard. Finally, an electronspray ionization (ESI) source (positive and negative ionization)was also tested, but the ionization of 6-ClNA could not be achieved.
4.2. Method validation
The developed method was validated according to proceduresand guidelines described elsewhere (USFDA, 1998; Tsakalof et al.,
Table 1Imidacloprid and 6-chloronicotinic acid recovery effects of extraction solvent andsonication duration time on hair matrix.
Imidacloprid 6-Chloronicotinic acidSolvent Recovery ± SD Recovery ± SD
Extraction solvent testMethanol 97.13 ± 15.21 91.42 ± 10.18Hexane 55.12 ± 14.04 34.28 ± 20.40Acetonitrile 65.07 ± 5.37 0.00
Hours Recovery Recovery
Sonication time test3 78.1 100.03 + 3 78.1 + 16.0 100.0 + 0.03 + 3 + 3 78.1 + 16.0 + 4.1 100.0 + 0.0 + 0.03 + 3 + 3 + 3 78.1 + 16.0 + 4.1 + 1.1 100.0 + 0.0 + 0.0 + 0.03 + 3 + 3 + 3 + 3 78.1 + 16.0 + 4.1 + 1.1 + 0.8 100.0 + 0.0 + 0.0 + 0.0 + 0.0
2003) in terms of efficiency of analytes extraction from biologicalsamples (method recovery), linearity of instrument response,LOD and LOQ of the method, accuracy and precision of the method.
4.2.1. Efficiency of the analytes extraction methods (recovery)For the evaluation of the method recovery, decontaminated
blank hair samples (50 mg) were spiked (three replicates) withthe target compounds prior to ultrasonic bath extraction, in thesame way as the spiked samples, and the aforementioned proce-dure (Section 2.8.2) was followed. This was performed at three dif-ferent concentration levels (0.1, 1 and 16 ng mg�1). The recoverywas determined as the ratio of the analyte peak of the treatedspiked sample to the peak area of corresponding methanol stan-dard. The recovery was ranged from 81.92% to 112.34% for the con-centration levels mentioned before with mean recovery 97.13% forIMI and from 81.24% to 101.60% with mean recovery 91.42% for 6-ClNA, respectively (Table 2).
Similarly, blank rabbit urine samples were used for the valida-tion of the urine extraction method. Spiked urine samples weretreated in the same way as described above (Section 2.9). Therecovery was estimated by three replicates of three spiked samples(0.5, 5, and 50 lg mL�1) and ranged from 82.91% to 109.31% withmean recovery 96.11% for IMI and from 97.04% to 109.84% withmean recovery 103.44% for 6-ClNA, respectively (Table 2).
4.2.2. LinearityInternal standard method was used for analytes quantification.
The instrument response was linear in the investigated concentra-tions 0, 0.05, 0.1, 0.25, 0.5, 1 and 10 lg mL�1 with r2 > 0.99. Foranalytes quantification corresponding matrix calibrators wereused. Our results also indicated a good linearity in the concentra-tions range between 0.1 and 16 ng mg�1 (for hair) and between0.5 and 50 lg mL�1 (for urine). The hair spiked sample curve waslinear, r2 = 0.992 for IMI and r2 = 0.991 for 6-ClNA. Also, the urinespiked sample curve was linear, r2 = 0.996 and r2 = 0.993, respec-tively (Table 2).
4.2.3. Limit of quantitation and limit of detectionThe limit of detection (LOD) of the method for each analyte was
evaluated from the chromatograms of the lowest spiked sample(0.1 ng mg�1 for hair and 0.5 lg mL�1 for urine) of the calibrationcurves, by considering a response equivalent to three times thebackground noise for the selected quantification ions. Limit ofquantification (LOQ) of the method was determined as the concen-tration of analyte at which the signal-to-noise ratio of the quanti-fication ion was at least 10. The LOD values for hair were calculated0.02 ng mg�1 for IMI and 0.01 ng mg�1 for 6-ClNA, while the LOQvalues were estimated 0.06 and 0.04 ng mg�1, respectively. Thecorresponding LOD values for urine were calculated 0.002 lg mL�1
for IMI and 0.008 lg mL�1 for 6-ClNA. LOQ values for urine werecalculated 0.006 and 0.020 lg mL�1, respectively (Table 2).
4.2.4. Method precision and accuracyThe precision of the method was measured as % relative stan-
dard deviation (%RSD) of instrument response for replicate mea-surements of spiked samples. Inter-days precision of the methodwas evaluated by a triplicate assay for three different days of hairspiked samples in concentrations of 0.1, 1 and 16 ng mg�1 and ofurine spiked samples in concentrations of 0.5, 5 and 50 lg mL�1,respectively. For hair precision was ranged from 2.33% to 12.43%for IMI and 2.72% to 8.38% for 6-ClNA (615%). Corresponding val-ues for urine method were ranged from 2.64% to 11.42% for IMIand 1.35% to 8.54% for 6-ClNA (615%). Accuracy was determinedfor three concentration levels of spiked hair 0.1, 1 and 16 ng mg�1
and for three concentration levels of spiked urine 0.5, 5 and50 lg mL�1. Accuracy of the hair method was higher than 98.71%

Fig. 3. Chromatograms of (A) standard solution at the concentration of 1000 ng mL�1, (B) blank rabbit hair sample and (C) IHD group rabbit’s hair sample. Also, massspectrums of (D) IMI, (E) 6-ClNA and (F) ethirimol.
Table 2Developed LC–APCI–MS method’s analytical and performance parameters for analytes quantification in hair and urine samples: analytical parameters–retention time (Rt), m/zfragments (underlined the m/z used for quantification); performance parameters–linearity (r2), a and b factors, % mean error of linear regression for spiked calibration curves, LODand LOQ values and recovery.
Analyte Imidacloprid 6-chloronicotinic acid
Sample Hair Urine Hair UrineRt (min) 11.13 12.46m/z 256.00, 211.98, 288.00 157.95, 190.00, 96.00Calibration curve
r2 0.992 0.996 0.991 0.993a 0.0002 0.1644 0.0002 0.0609b 0.0936 0.0632 �0.0427 �0.0311% Error �2.50 �4.21 0.18 �6.53
LOD 0.02a 0.002b 0.01a 0.008b
LOQ 0.06a 0.006b 0.04a 0.020b
% Recovery (±SD) 97.13 ± 15.21 (n = 9) 96.11 ± 13.20 (n = 9) 91.42 ± 10.18 (n = 9) 103.44 ± 6.40 (n = 9)
Rt: retention time, r2: linearity, % error: linear regression mean error %, LOD: limit of detection, LOQ: limit of quantitation, SD: standard deviation.a ng mg�1.b lg mL�1.
M.P. Kavvalakis et al. / Chemosphere 93 (2013) 2612–2620 2617

2618 M.P. Kavvalakis et al. / Chemosphere 93 (2013) 2612–2620
for IMI and 100.25% for 6-ClNA. Respectively, accuracy of the urinemethod was evaluated higher than 98.93% for IMI and 97.82% for6-ClNA (Table 3).
4.3. Levels of imidacloprid and 6-chloronicotinic acid in rabbit hairspecimen
Methanolic standard solutions of IMI and 6-ClNA (at concentra-tions levels as described in Section 2.6) and spiked solutions (atconcentrations as described in Section 2.7) were included in everybatch of samples analyzed. Quality control samples were used tomonitor any possible change to analytical parameters.
The detected levels of IMI and 6-ClNA in rabbit hair are shownin Table 4. The mean concentration of IMI in rabbit hair specimensfor control group was 1.61, 1.09, 0.62 and 0.63 ng mg�1, for 0, 2, 4and 6 months of exposure, respectively. The corresponding valuesfor ILD group were 0.99, 14.40, 22.33 and 41.91 ng mg�1, whilefor IHD group were 0.25, 33.41, 58.87 and 56.62 ng mg�1. 6-ClNAwas not detected in control’s group rabbit hair. The mean concen-tration of 6-ClNA for ILD group was 0, 0.13, 0.13 and 0.21 ng mg�1
for 0, 2, 4 and 6 months of exposure respectively. The correspond-ing values for IHD group were 0, 0.41, 2.23 and 2.88 ng mg�1.
4.4. Levels of imidacloprid and 6-chloronicotinic acid in rabbit urinespecimen
The detected levels of IMI and 6-ClNA in rabbit urine are alsoshown in Table 4. IMI and 6-ClNA, were not detected in urine spec-imens of control group. The mean concentration of IMI for ILDgroup was 0, 80.13, 125.02 and 26.90 lg mL�1 for 0, 2, 4 and6 months of exposure respectively. For IHD group, the correspond-ing values were 0, 217.01, 343.17 and 193.30 lg mL�1. The meanconcentrations of 6-ClNA for ILD group were 0, 0.99, 1.29 and0.55 lg mL�1. For IHD group, the corresponding mean concentra-tions were 0, 1.94, 4.25 and 1.12 lg mL�1.
4.5. Levels of imidacloprid and 6-chloronicotinic acid in human hairspecimen
For rural residents group (n = 32) found IMI concentrations inhair ranged from below LOD to 0.27 ng mg�1 with median concen-tration 0.03 ng mg�1. For the calculation of the median concentra-tion of IMI all negative samples (<LOD) were set as LOD/2. Thepercentage of positive hair samples in the group of rural residentswas calculated to be 65.6% (21 positive samples out of 32). On thecontrary for all urban residents IMI hair concentrations were <LOD.
5. Discussion
As mentioned earlier, the purpose of this study was to developanalytical methods for the simultaneous detection and quantifica-tion of IMI and 6-ClNA in hair and urine specimens. The methods
Table 3Developed LC–APCI–MS method’s inter-day precision and accuracy.
Sample Concentrationa Imidacloprid
Precisionb
Hair 0.1 2.331 4.3416 12.43
Urine 0.5 2.645 4.2150 11.42
a ng mg�1 for hair and lg mL�1 for urine.b Inter-days precision (% RSD).
developed for hair and urine analysis share the common instru-mental approach but differ in analytes isolation procedures. Theimplemented validation of the methods demonstrates their lowLOD, LOQ and high accuracy and precision (Table 3) and thus thesemethods can be applied for the evaluation of acute (urine analysis)or chronic (hair analysis) exposure of human or animals to IMI andcorrelate the exposure with possible adverse health effects. To thebest of our knowledge these are the first LC–MS based method forsimultaneous quantification of IMI and 6-CINA in urine and hairspecimens (see Fig. 4).
The developed methods were applied for biomonitoring of ani-mal (rabbit) exposure to IMI under controlled sub-acute dosing.IMI was not detected in urine of control animals while low back-ground concentrations were found in their hair (Table 4). On thecontrary, substantially higher concentrations were found in thespecimens of exposed animals and concentrations found for thefirst four months of exposure are proportional to the total amountof insecticide ingested (Table 4). This testifies for the bioaccumula-tion of IMI in the animal body. Interestingly, the concentrationsfound on the 6th month of exposure in urine and hair (IHD group)were reduced and not proportional to the total amount of IMI in-gested. Probably IMI or its metabolites induce detoxification mech-anisms which accelerate IMI metabolism and/or excretion.Actually, the induction of cytochrome P450 activity in liver byIMI was mentioned in previous publications (Schulz-Jander et al.,2002; Dick et al., 2005). Cytochrome P450 iso-enzymes are mainIMI metabolizing enzymes (Schulz-Jander and Casida, 2002; Pro-enca et al., 2005).
Statistically significant differences were found in IMI levelsmeasured in ILD and IHD groups’ hair (p < 0.001) over time. Thefact that control group and animals in 0 weeks of exposure hairshowed measurable levels of IMI before the begging of the animaltreatment is may be attributed to dietary or environmental expo-sure of the rabbits before their acclimation in the Medical School’stest animal facilities (see Section 2.1). Also, significant differencesin IMI (p = 0.008) and 6-ClNA (p = 0.032) levels were found in urinespecimens of ILD and IHD groups over time.
6-CINA was found in lower concentrations in comparison withthat of IMI found in exposed animals (Table 4). It is not surprisingbecause 6-ClNA is only one of a number of IMI metabolites de-scribed (Fig. 1). 6-CINA was not detected in the urine or hair ofthe control animals.
It should be underlined that in our study we monitored the ani-mals’ exposure to IMI, while in the previous available studies thehealth effect of exposure was investigated. Thus the effect ofchronic exposure to IMI has already been studied in rats (Eibenand Rinke, 1989), rabbits (Pauluhn, 1988; Flucke, 1990) and dogs(Allen et al., 1989). Eiben and Rinke (1989) fed male and femalerats with IMI and noted reductions in body weight gain, liver dam-age and reduced blood clotting function. Liver damage disappearedafter exposure ended, but abnormalities in the blood were not en-tirely reversible. Pauluhn (1988) applied a paste containing IMI to
6-Chloronicotinic acid
Accuracy (%) Precisionb Accuracy (%)
98.71 2.72 107.4899.89 5.77 100.25
104.23 8.38 128.94
99.64 1.35 99.3098.93 8.54 97.82
105.22 3.85 102.56

Table 4Mean concentrations of IMI and 6-ClNA in rabbit hair (ng mg�1) and urine (lg mg�1) per treatment group (control, low dose, high dose).
Mean concentration (±SD) in rabbit hair (ng mg�1) and urine (lg mL�1) samples
Analyte Imidacloprid (IMI) 6-Chloronicotinic acid (6-ClNA)
Administration period (months) 0 2 4 6 0 2 4 6
Rabbit hairControl group (±SD) 1.61 1.09 0.62 0.63 <LOD <LOD <LOD <LOD
(�0.66) (�0.24) (�0.21) (�0.13)Low dose group (ILD) (±SD) 0.99 14.4 22.33 41.91 <LOD 0.13 0.14 0.21
(�0.41) (�1.1) (�0.36) (�11.11) (�0.17) (�0.18) (�0.12)High dose group (IHD) (±SD) 0.26 33.41 58.87 56.62 <LOD 0.41 2.23 2.88
(�0.34) (�0.4) (�13.82) (�10.09) (�0.41) (�2.73) (�3.66)F(6,12) = 12.52, p < 0.001 F(6,12) = 0.68, p = 0.571
Rabbit urineControl group (±SD) <LOD <LOD <LOD <LOD <LOD <LOD <LOD <LODLow dose group (ILD) (±SD) <LOD 80.13 125.02 26.9 <LOD 0.99 1.29 0.55
(�39) (�100.26) (�21.29) (�0.01) (�0.04) (�0.04)High dose group (IHD) (±SD) <LOD 217.01 343.17 193.3 <LOD 1.94 4.25 1.12
(�56.75) (�98.53) (�19.47) (�1.81) (�1.2) (�0.68)F(6,12) = 15.03, p = 0.008 F(6,12) = 3.60, p = 0.032
LOD: limit of detection, SD: standard deviation, F, p: statistical parameters.F is the value of F distribution used in ANOVA.p is the probability of the statistical test.
Fig. 4. Estimated mean IMI (A) and 6-ClNA (B) levels (ng mg�1) in rabbit hair per treatment group.
Table 5Estimated median concentrations (ng mg�1) of IMI in hair samples of rural residentsby group of age (p = 0.984) and sex (p = 0.981) did not show significant differences.
N Imidacloprid (ng mg�1) p Value
Median Min Max
Group of age<50 16 0.03 <LOD 0.27 0.984>50 16 0.03 <LOD 0.17
SexMale 7 0.04 <LOD 0.27 0.981Female 25 0.02 <LOD 0.07
Total32 0.03 <LOD 0.27
M.P. Kavvalakis et al. / Chemosphere 93 (2013) 2612–2620 2619
the shaved flanks and backs of rabbits, exposing them for 6 h a dayfor 15 d. Rabbits showed no effects from the treatment. Allen andco-researchers fed IMI to beagles for 1 year. Researchers noted re-duced food intake in the highest dose group. Females in this groupexhibited increased plasma cholesterol concentrations at 13 and26 weeks. Both males and females in this group exhibited in-creased cytochrome P450 activity in the liver and increases in liverweights at the end of the study. No adverse effects were observedat the two lowest doses (Allen et al., 1989).
Concerning the results of the study, measurable levels of IMIwere found only in rural residents’ hair specimens. No significantdifferences were noticed examining the rural residents’ detectedlevels by group of age or by sex (Table 5). The detection frequencyof IMI in rural resident’s hair specimen was high (65.6%). This couldbe attributed to the different lifestyle of each population group, dif-ferences between the residential parameters and of course thehigher involvement of the rural residents in agricultural activities(Tsatsakis et al., 2008c). Rural residents are participating in spray-ings and other agricultural processes, while urban residents notonly do not involved in similar processes, but also their residenceis far from fields and greenhouses. To our knowledge, no data
derived from the existing literature on human exposure to IMI.There is only a limited number of information comes from examin-ing poisoning and suicide attempts (Wu et al., 2001; Tamura et al.,2002; Huang et al., 2006; David et al., 2007; Shadnia andMoghaddam, 2008). No studies are published involving humansubjects chronically exposed to IMI.

2620 M.P. Kavvalakis et al. / Chemosphere 93 (2013) 2612–2620
6. Conclusion
The sensitive, precise and accurate LC–MS based method hasbeen developed for the simultaneously quantification of IMI and6-ClNA in hair and urine specimens. The method was appliedand tested in the study of animal chronic sub-acute long termexposure. This study demonstrates the dose dependent accumula-tion of IMI in animal hair and indicates the possible induction ofdetoxification mechanisms after 4 months of exposure.
After testing on animal models the method was applied for pilotbiomonitoring of Cretan urban and rural population. It was foundthat rural but not urban population is slightly exposed to IMI with21 positive samples (65.6% of total rural samples) and found med-ian concentration 0.03 ng mg�1. Maximum found concentrationwas 0.27 ng mg�1. To the best of our knowledge this is the first de-scribed method for IMI quantification in hair and first applicationof this method for bio-monitoring of population exposure to IMI.IMI is nowadays one of the most used pesticides worldwide andbiomonitoring of population exposure is important for the protec-tion of public health.
Acknowledgments
Authors deeply thank Dr. Alegakis Athanasios for his contribu-tion in the statistical analysis, Mr. Papadogiorgakis Manolis forthe care and treatment of animals and also Michail Panagiotakisfor his contribution in the current study. This article is dedicatedto the memory of Maria Toutoudaki, PhD, ERT who was an excel-lent scientist, member of our laboratory.
References
Allen, T.R., Frei, T., Leutkemeier, H., Vogel, O., Biedermann, K., Wilson, J., 1989. A 52-week oral toxicity (feeding) study with NTN 33893 technical in the dog.Unpublished Report No. R 4856, 1989, Amendment No. R 4856A, 1992,Submitted to WHO by Bayer AG, Mannheim, Germany. INCHEM ToxicologicalEvaluations: Imidacloprid; International Programme on Chemical Safety, WorldHealth Organization: Geneva, Switzerland.
David, D., George, I.A., Peter, J.V., 2007. Toxicology of the newer neonicotinoidinsecticides: imidacloprid poisoning in a human. Clin. Toxicol. 45, 485–486.
Dick, R.A., Kanne, D.B., Casida, J.E., 2005. Identification of aldehyde oxidase as theneonicotinoid nitroreductase. Chem. Res. Toxicol. 18 (2), 317–323.
Dolapsakis, G., Vlachonikolis, I.G., Varveris, C., Tsatsakis, A.M., 2001. Mammographicfindings and occupational exposure to pesticides currently in use on Crete. Eur.J. Cancer 37 (12), 1531–1536.
Eiben, R., Rinke, M., 1989. NTN 33893: Subchronic toxicity study on Wistar-rats(administration in the feed for 96 days). Unpublished Report No. 18187, 1989,Submitted to WHO by Bayer AG, Mannheim, Germany. INCHEM ToxicologicalEvaluations: IMI; International Programme on Chemical Safety, World HealthOrganization: Geneva, Switzerland.
Elbert, A., Haas, M., Springer, B., Thielert, W., Nauen, R., 2008. Applied aspects ofneonicotinoid uses in crop protection. Pest Manage. Sci. 64, 1099–1105.
Flucke, W., 1990. NTN 33893: Tech.-study for subacute dermal toxicity in the rabbit.Unpublished Report No. 19152, 1990, Submitted to WHO by Bayer AG,Mannheim, Germany. INCHEM Toxicological Evaluations: Imidacloprid;International Progamme on Chemical Safety, World Health Organization:Geneva, Switzerland.
Huang, N.C., Lin, S.L., Chou, C.H., Hung, Y.M., Chung, H.M., et al., 2006. Fatalventricular fibrillation in a patient with acute imidacloprid poisoning. Am. J.Emerg. Med. 24, 883–885.
Maravgakis, G., Tzazarakis, M.N., Alegakis, A.K., Stivaktakis, P.D., Tsatsakis, A.M.,2012. Diethyl phosphates accumulation in rabbits’ hair as an indicator of longterm exposure to diazinon and chlorpyrifos. Forensic Sci. Int. 218 (1–3), 106–110.
Meister, R.T. (Ed.), 1994. Farm Chemicals Handbook 1994. Meister PublishingCompany, Willoughby, OH.
Pauluhn, J., 1988. NTN 33893: Subacute inhalation toxicity study on the rataccording to OECD Guideline No. 412. Unpublished Report No. 18199, 1988,Submitted to WHO by Bayer AG, Mannheim, Germany. INCHEM ToxicologicalEvaluations; Imidacloprid; International Programme on Chemical Safety, WorldHealth Organization: Geneva, Switzerland.
Proenca, P., Teixeira, H., Castanheira, F., Pinheiro, J., Monsanto, P., Marques, E.,Vieira, D., 2005. Two fatal intoxication cases with imidacloprid: LC/MS analysis.Forensic Sci. Int. 153, 75–80.
Schulz-Jander, D.A., Casida, J.E., 2002. Imidacloprid insecticide metabolism: humancytochrome P450 isozymes differ in selectivity for imidazolidine oxidationversus nitroimine reduction. Toxicol. Lett. 132 (1), 65–70.
Schulz-Jander, D.A., Leimkuehler, W.M., Casida, J.E., 2002. Neonicotinoidinsecticides: reduction and cleavage of imidacloprid nitroimine substituent byliver microsomal and cytosolic enzymes. Chem. Res. Toxicol. 15 (9), 1158–1165.
Shadnia, S., Moghaddam, H.H., 2008. Fatal intoxication with imidaclopridinsecticide. Am. J. Emerg. Med. 26, 631–634.
Shripanavar, C., Deshmukh, M., 2013. Synthesis and Insecticidal Activity of SomeNeonicotinoid Compounds. Lap Lambert Academic Publishing.
Solecki, R., 2001. <http://www.inchem.org/documents/jmpr/jmpmono/2001pr07.htm>, (accessed 06.12).
Tamura, M., Endo, Y., Kuroki, Y., Ohashi, N., Yoshioka, T., et al., 2002. Investigationand case study of Imidacloprid insecticide caused poisoning. Chudoku Kenkyu15, 309–312.
Tsakalof, A.K., Bairachtari, K., Georgarakis, E., 2003. Development of a liquidchromatography–mass spectrometry method for monitoring the angiotensin-converting enzyme inhibitor lisinopril in serum. J. Chromatogr. B 783 (2), 235–241.
Tsatsakis, A., Toutoudaki, M., Tzatzarakis, M., 2008a. Counteraction to Chemical andBiological Terrorism in East European Countries. In: Proceedings of the NATOAdvanced Research Workshop on Counteraction to Chemical and BiologicalTerrorism at a National and Local Level in the East European Countries (Chapter24).
Tsatsakis, A.M., Tutudaki, M.I., Tzatzarakis, M.N., Psaroudakis, K., Dolapsakis, G.P.,Michalodimitrakis, M.N., 1998. Pesticide deposition in hair: preliminary resultsof a model study of methomyl incorporation into rabbit hair. Vet. HumanToxicol. 40 (4), 200–203.
Tsatsakis, A.M., Tzatzarakis, M.N., Tutudaki, M., 2008b. Pesticide levels in head hairsamples of Cretan population as an indicator of present and past exposure.Forensic Sci. Int. 176 (1), 67–71.
Tsatsakis, A.M., Tzatzarakis, M.N., Tutudaki, M., Babatsikou, F., Alegakis, A.K., Koutis,C., 2008c. Assessment of levels of organochlorine pesticides and theirmetabolites in the hair of a Greek rural human population. Human Exp.Toxicol. 27 (12), 933–940.
Tsatsakis, A.M., Barbounis, M.G., Kavalakis, M., Kokkinakis, M., Terzi, I., Tzatzarakis,M.N., 2010. Determination of dialkyl phosphates in human hair for thebiomonitoring of exposure to organophosphate pesticides. J. Chromatogr. B878 (17–18), 1246–1252.
Tutudaki, M., Tsakalof, A.K., Tsatsakis, A.M., 2003. Hair analysis used to assesschronic exposure to the organophosphate diazinon: a model study with rabbits.Human Exp. Toxicol. 22 (3), 159–164.
USFDA, 1998. Analytical Methods Validation for Human Studies. US Department ofHealth and Human Services Food and Drug Administration. p. 24.
Wu, I.W., Lin, J.L., Cheng, E.T., 2001. Acute poisoning with the neonicotinoidinsecticide imidacloprid in N-methyl pyrrolidone. J. Toxicol. – Clin. Toxicol. 39,617–621.