Developing benchmarks for consumer-oriented life cycle assessment-based environmental information on...
12
Developing benchmarks for consumer-oriented life cycle assessment-based environmental information on products, services and consumption patterns Ari Nissinen a, * , Juha Gro ¨nroos a , Eva Heiskanen b , Asmo Honkanen c , Juha-Matti Katajajuuri d , Sirpa Kurppa d , Timo Ma ¨kinen c , Ilmo Ma ¨enpa ¨a ¨ e , Jyri Seppa ¨la ¨ a , Pa ¨ivi Timonen b , Kirsi Usva d , Yrjo ¨ Virtanen d , Pasi Voutilainen d a Finnish Environment Institute, P.O. Box 140, 00251 Helsinki, Finland b National Consumer Research Centre, P.O. Box 5, 00531 Helsinki, Finland c Finnish Game and Fisheries Research Institute, P.O. Box 6, 00721 Helsinki, Finland d MTT Agrifood Research Finland, 31600 Jokioinen, Finland e Thule Institute, P.O. Box 7300, 90014 University of Oulu, Finland Accepted 25 May 2006 Available online 12 July 2006 Abstract Life cycle assessment (LCA) has been recognized in the EU in the context of ‘Integrated Product Policy’ (IPP) as providing ‘‘the best frame- work for assessing the potential environmental impacts of products currently available.’’ A study to promote the use of LCA-based product information was designed, with the following objectives: (a) to develop different benchmarks to which the LCA results of various products can be compared, (b) to study how consumers understand the different benchmarks and what proposals for improvement they have, and (c) to propose a few presentation formats and benchmarks for presenting LCA-based information in communications to consumers. Here we present the final results, i.e., the suggested benchmarks and presentation formats, ‘eco-benchmark’. We also present some lessons derived from the feedback gained from consumers and other stakeholders, and point out future directions for improving the benchmarks and their utilization. Ó 2006 Elsevier Ltd. All rights reserved. Keywords: Benchmarks; Environment; Sustainable; Consumption; Consumers; Communication; Environmental impacts; Life cycle assessment; Products; Services; Product policy; IPP; Eco-Benchmark 1. Introduction Life cycle assessment (LCA) is a standardized method to determine the environmental impacts of products (ISO 14040 series, see e.g. [1]), which is endorsed by a variety of international organizations. While it has until today been used mainly by business and policy makers, there are increas- ing calls to use LCA to develop consumer information tools to promote sustainable consumption [2,3]. Compared with other environmental management tools and assessment methods, LCA does in fact place a special empha- sis on consumption. In the LCA model, all environmental im- pacts are measured per functional unit (e.g., a wash of laundry, a cup of coffee), and are thus ‘caused’ by the act of consuming that unit. In principle, LCA could thus be an extremely em- powering tool for consumers. The LCA model can connect small, everyday consumer decisions to their impacts on differ- ent environmental problems, and to environmental burdens oc- curring in distant times and places (e.g. [4]). LCA thus, has the potential to reveal the ‘world behind the product’ [5] and empower consumers to make more re- sponsible decisions. There are of course many barriers to * Corresponding author. Tel.: þ358 9 403 00 346; fax: þ358 9 403 00 391. E-mail address: ari.nissinen@ymparisto.fi (A. Nissinen). 0959-6526/$ - see front matter Ó 2006 Elsevier Ltd. All rights reserved. doi:10.1016/j.jclepro.2006.05.016 Journal of Cleaner Production 15 (2007) 538e549 www.elsevier.com/locate/jclepro
-
Upload
independent -
Category
Documents
-
view
3 -
download
0
Transcript of Developing benchmarks for consumer-oriented life cycle assessment-based environmental information on...

Journal of Cleaner Production 15 (2007) 538e549www.elsevier.com/locate/jclepro
Developing benchmarks for consumer-oriented life cycleassessment-based environmental information on products,
services and consumption patterns
Ari Nissinen a,*, Juha Gronroos a, Eva Heiskanen b, Asmo Honkanen c,Juha-Matti Katajajuuri d, Sirpa Kurppa d, Timo Makinen c, Ilmo Maenpaa e,
Jyri Seppala a, Paivi Timonen b, Kirsi Usva d, Yrjo Virtanen d, Pasi Voutilainen d
a Finnish Environment Institute, P.O. Box 140, 00251 Helsinki, Finlandb National Consumer Research Centre, P.O. Box 5, 00531 Helsinki, Finland
c Finnish Game and Fisheries Research Institute, P.O. Box 6, 00721 Helsinki, Finlandd MTT Agrifood Research Finland, 31600 Jokioinen, Finland
e Thule Institute, P.O. Box 7300, 90014 University of Oulu, Finland
Accepted 25 May 2006
Available online 12 July 2006
Abstract
Life cycle assessment (LCA) has been recognized in the EU in the context of ‘Integrated Product Policy’ (IPP) as providing ‘‘the best frame-work for assessing the potential environmental impacts of products currently available.’’ A study to promote the use of LCA-based productinformation was designed, with the following objectives: (a) to develop different benchmarks to which the LCA results of various productscan be compared, (b) to study how consumers understand the different benchmarks and what proposals for improvement they have, and (c)to propose a few presentation formats and benchmarks for presenting LCA-based information in communications to consumers. Here we presentthe final results, i.e., the suggested benchmarks and presentation formats, ‘eco-benchmark’. We also present some lessons derived from thefeedback gained from consumers and other stakeholders, and point out future directions for improving the benchmarks and their utilization.� 2006 Elsevier Ltd. All rights reserved.
Keywords: Benchmarks; Environment; Sustainable; Consumption; Consumers; Communication; Environmental impacts; Life cycle assessment; Products;
Services; Product policy; IPP; Eco-Benchmark
1. Introduction
Life cycle assessment (LCA) is a standardized method todetermine the environmental impacts of products (ISO14040 series, see e.g. [1]), which is endorsed by a variety ofinternational organizations. While it has until today beenused mainly by business and policy makers, there are increas-ing calls to use LCA to develop consumer information tools topromote sustainable consumption [2,3].
* Corresponding author. Tel.: þ358 9 403 00 346; fax: þ358 9 403 00 391.
E-mail address: [email protected] (A. Nissinen).
0959-6526/$ - see front matter � 2006 Elsevier Ltd. All rights reserved.
doi:10.1016/j.jclepro.2006.05.016
Compared with other environmental management tools andassessment methods, LCA does in fact place a special empha-sis on consumption. In the LCA model, all environmental im-pacts are measured per functional unit (e.g., a wash of laundry,a cup of coffee), and are thus ‘caused’ by the act of consumingthat unit. In principle, LCA could thus be an extremely em-powering tool for consumers. The LCA model can connectsmall, everyday consumer decisions to their impacts on differ-ent environmental problems, and to environmental burdens oc-curring in distant times and places (e.g. [4]).
LCA thus, has the potential to reveal the ‘world behindthe product’ [5] and empower consumers to make more re-sponsible decisions. There are of course many barriers to

539A. Nissinen et al. / Journal of Cleaner Production 15 (2007) 538e549
environmentally sound consumption [6e9], but the informa-tion gap is perhaps the easiest problem to start withdandone which consumers themselves emphasize [10]. LCA pro-vides the data on environmental impacts that environmentallyconscious consumers need, yet the form in which it is providedis highly inaccessible. Published LCA reports are extremelytechnical, featuring long lists of environmental pollutantsand abounding with technical terms. They are not directed atlay people who need to get a quick overview of the most im-portant issues and make decisions on a day-to-day basis. Devel-oping accessible information is thus a key priority. Anotherimportant focus should be the usability of the information:how well it works in the context of different decision-makingsituations [11].
There have been some efforts to develop illustrative presen-tation formats in the LCA community. It is common to bench-mark the various effects against the total effects in an area orcountry; e.g. in the Eco-indicator method the environmentaleffects are normalized by the effects caused by the averageEuropean during a year [12]. Further, the normalized resultscan also be weighted according to the assumed seriousness ofeach effect: in Eco-indicator, these weights are determined bya panel method. After normalization and weighting, the result-ing ‘ecopoints’ can be shown in illustrative forms, e.g. usingthe common column format. In addition, quite sophisticated pre-sentation methods, using e.g. spheroids and addressing both thevalues and uncertainty of the various impacts, have also beenused to increase the effectiveness of visualization [13].
However, despite previous efforts there still exists an obvi-ous need to develop methods to interpret and present LCA re-sults for consumers. Surveys indicate that ordinary consumers’environmental literacy is relatively low: for example, the maincauses and effects of environmental problems such as climatechange are not well known [14,15]. In this situation, one start-ing point for developing usable information could be the con-cept of ‘anchoring’ suggested by social representation theory[16,17]. ‘Anchoring’ means that new concepts are adoptedby constructing continuities to familiar things from the past.Thus, we assume that LCA results would be easier to under-stand if they were linked to a familiar frame of reference,and compared to an everyday object. Everyday consumerproducts and activities may offer benchmarks that bring theframe of reference close to one’s own life. We expect thiswould help consumers and other information users to graspthe practical implications of the information for their everydayactivities and decisions.
To address the need for consumer oriented LCA results andbenchmarking, several Finnish research institutes starteda study with the following objectives: (a) to develop differentbenchmarks to which the LCA results of various products canbe compared, (b) to study how consumers understand the dif-ferent benchmarks and what proposals for improvements theyhave, and (c) to propose a few presentation formats and bench-marks for the purpose of communicating LCA-based informa-tion to consumers. In this article, we describe how we endedup with the ‘final’ benchmarks and presentation formats usinglessons learned from the feedback gained from consumers and
other stakeholders. We present the suggested benchmarks andpresentation formats, and we also assess their relevance re-garding overall consumption by comparing them to estimatesof the environmental effects of different consumption com-modity groups in Finland, determined by the inputeoutputmethod. Finally, we point out future directions for improvingthe benchmarks and their utilization.
2. Material and methods
2.1. The process of developing the benchmarks andthe presentation types
The project was conducted as an iterative process involvinga group of researchers with different backgrounds, two feed-back sessions with consumer groups, as well as seminars forstakeholder consultation (Fig. 1; [18]).
Two different kinds of benchmark alternatives were firstdeveloped. In addition, six different presentation types (bothfigures and verbal) were designed, in which comparisonswere demonstrated between the environmental impacts ofa product and the benchmarks.
The benchmarks and presentation types were described ina ‘draft brochure’, which aimed both to serve as the first stageof a brochure about this methodology and to provide materialfor the evaluation by the consumer panel. This 20-page infor-mation package also included an illustration of how the bench-marks could be applied to a consumer decision, as well asprovided a brief account of the LCA studies and other datasources referenced as well as on the calculation rules andthe various environmental impacts (both those involved andthose not accounted for at this stage).
Feedback on the first versions of benchmarks and presenta-tion formats was obtained from potential users of the informa-tion, including both ordinary consumers (from a voluntaryconsumer panel maintained by the National Consumer
Alternative
benchmarks and
presentation
formats
Product
LCA's
Seminars
THE BENCHMARKS
AND THE
PRESENTATION
FORMATS
Consumer
panel
Brochures
Fig. 1. The process of developing the benchmarks and the presentation types.
Arrows describe inputs of ideas and material from one stage of the work and
project to another.

540 A. Nissinen et al. / Journal of Cleaner Production 15 (2007) 538e549
Research Centre) and other stakeholders such as professionalsproviding environmental advice and counselling (two seminarsorganized at the Finnish Environment Institute). After this, thepresentation formats were refined to the state presented here,and the panellists gave feedback on the revised presentationformats via postal questionnaire.
2.2. Alternative benchmarks
In order to develop a benchmark that could serve as a proxymeasure of a citizen’s ‘total daily impact’, we calculated theaverage daily per capita environmental impacts of the wholeFinnish economy. This benchmark was based on three factors,namely (1) the environmental effects of the whole economy ofFinland in a year, including industry, agriculture, silvicultureand communities ([19,20,36], Table 1), (2) the population ofFinland which was 5.206 million at the end of 2002 [20],and (3) the number of days per year (365).
The second type of benchmark was based on a number ofcommon products. We thought they would serve as a usefulcomparison point and allow consumers to ‘anchor’ the novelinformation to a familiar context. Two conditions were setfor these products: (1) there must exist an LCA of the productwhich is of good quality, and can be updated and modified (ifneeded) to be relevant to the conditions of Finnish consumers,and (2) the product must be a familiar ‘everyday’ product toFinnish consumers.
In order to screen suitable LCA-studies, a survey was con-ducted of existing LCA studies, using literature databases (e.g.Cambridge Scientific Abstracts). Tens of LCA-studies werepre-evaluated, and more than ten studies were thoroughly as-sessed, so that the results of the selected LCA studies couldserve as reliable benchmarks: A group of 4e8 researchersevaluated together a predefined list of aspects concerninge.g. the age of data and relevance and reliability of the
Table 1
Environmental loads of the Finnish Economy in 2002 [19,20,36]
Environmental load Value Unit
Primary energy use 1443 109 MJ
Emission to air
CH4 243 109 g
CO 600 109 g
CO2 69270 109 g
N2O 21.9 109 g
NH3 33.3 109 g
NOxa 208 109 g
SOxb 82.4 109 g
VOC/HCc 150 109 g
Emission to water
N(w)d 78.2 109 g
P(w)e 4.21 109 g
a Calculated ad NO2.b Calculated as SO2.c Calculated as non-methane C.d Calculated as total N.e Calculated as total P.
information sources, in order to select only LCA-studieswith a low risk of the results being far from correct. Regardinganchoring to the everyday life of Finnish people, it was alsoimportant that the results should correspond to the environ-mental impacts of similar products in present-day Finnish con-ditions, or that the study could be modified to provide relevantresults for Finnish consumers.
Finally, five LCA-studies were selected for further develop-ment (Table 2). Rye bread and cheese were the food productsselected as benchmarks, largely due to the importance of foodin everyday consumption and data availability considerations.Both make up only a small portion of the daily food intake,and thus, also of a consumer’s total daily environmental loadcaused by food, but they provide an illustration of the environ-mental loads of commonly used food products. Other bench-mark products are also common and typical products forFinnish households: a wash of laundry, a two-bedroom apart-ment and a car trip (see below about their role in Finnishconsumption).
Some modifications and updating were needed to all of theselected LCA-studies (Table 2). A general modification was touse new data for the environmental effects of electricity anddistrict heating, representing the year 2003 and average valuesfor whole Finland, also taking into account imported electric-ity on the basis of country-specific values. The products are
Table 2
Product-benchmarks and their main LCA-information sources
Product/
service
LCA Modifications and updating
to Finnish conditions
Rye bread Gronroos and Seppala, 2000.
Agricultural production
systems and the environment.
The Finnish Environment
431 [22]
Updated nutrient leaching
and eutrophication of waters,
electricity in Finland
Emmental
cheese
Voutilainen et al., 2003.
Environmental impacts and
improvement possibilities of
Emmental blue-label cheese.
Maa ja elintarviketalous
35 [25]
Updated nutrient leaching
and eutrophication of waters,
electricity in Finland
Laundry Saouter et al., 2002. The effect
of compact formulations on
the environmental profile of
northern European granular
laundry detergents. Part II:
LCA Int J LCA 7(1):
27-38 [27]
Consumption of electricity
and water of typical washing
machine, 40 �C. Electricity
and wastewater treatment
in Finland
Apartment Koskela et al., 2002.
Environmental impacts in
assessing the ecoefficiency
of buildings. The Finnish
Environment 585 [30]
Updated electricity and
district heating in Finland,
electricity of appliances in
the apartment not included
Car drive Schweimer and Levin, Life
cycle inventory for the Golf
A4.downloaded from www.
volkswagen.-environment.de
[32]
Energy consumption and
emissions of vehicles from
a national model
(www.lipasto.fi, made by
VTT Technical Research
Centre of Finland), EURO 3
norm. Fuel production
(gasoline in Finland)

541A. Nissinen et al. / Journal of Cleaner Production 15 (2007) 538e549
described briefly below and in more detail in [21], and the newinventory results are shown in Table 3.
Rye bread is a staple food in Finland. The benchmark wascalculated for the average daily consumption of rye bread(83 g) among regular users of this food (80% of the popula-tion). This amount corresponds to approximately two slicesof bread. The benchmark for rye bread is based on a FinnishLCA-study [22e24] of bread made of rye grown in Finland.
Cheese represents an animal-based product with a highnutritional energy content. The benchmark was calculatedfor the average daily consumption of cheese (30 g) amongregular cheese users (80% of the population). This amount cor-responds to approximately four thin slices of cheese. The LCAwas made of Emmental cheese [25], which is very popular inFinland. The results pertain to conditions in 2000e2001, andrepresent one third of the total production of Emmental cheesein Finland.
Laundry was selected to represent an everyday, familiar ac-tivity at home. A two-person family was assumed to do onewash of laundry per day. Finnish families currently wash theirlaundry almost on a daily basis: 25 washing machine cyclesare run every month, on average. Of these washes, 55% arecold (40 �C) and 35% warm (60 �C), while the remaining10% are either hotter or colder [26]. The LCA data are basedon a Northern European case study [27], in Sweden 1998. Weupdated the data pertaining to energy consumption at the usestage and to waste water treatment to correspond to Finnishconditions [28], and based our calculations on the washingtemperature of 40 �C. The washing machine performancedata represent a relatively new and energy-efficient appliancewith an energy-label class A.
A two-bedroom apartment was selected to represent hous-ing, and the benchmark for housing is ‘one day of living ina warm apartment’ per person. Many Finnish households(44%) live in apartment houses (blocks of flats), and the aver-age living space per person is 36 m2. Thus the benchmarkapartment of 83 m2 was selected as a fairly common housingtype for two persons, with a living space per person of 41 m2.The apartment benchmark is based on an LCA of a three-floor
prefabricated apartment building [29,30], with supplementarydata gained through personal communication from Koskela[30]. The useful life of the building was calculated as100 years. The energy consumption of the building includesspace heating using district heating (combined heat and powerproduction) and the electricity use of the facility (i.e. electric-ity used in common spaces of the house, not within individualapartments). Thus, the housing benchmark does not includeelectricity used at home, e.g. for lighting, laundering or thekitchen, or recreational appliances.
A car trip represents mobility, and the benchmark corre-sponds to driving 20 km alone. The average daily travel dis-tance in the metropolitan area is 21 km (which is also closeto the national average daily travel distance by car 19 km),the average number of persons in the car being close to 1(i.e. 1.2). The data for fuel use and emissions in Finland ofa typical car fulfilling the EURO3 standards are based onthe Liisa database maintained by the ‘VTT Technical ResearchCentre of Finland’ (www.lipasto.vtt.fi). In addition, the envi-ronmental loads of fuel production [31] were included in thecalculation. The data on car manufacturing and maintenancewere calculated on the basis of a relatively new LCA of theVolkswagen Golf A4 [32], with the most recent data datingfrom summer 2000.
In addition, in order to demonstrate the benchmarkingmethod, a comparison between a bus trip and a car trip wasproduced. Likewise as for the car trip, the environmental loadsof the fuel production and the use of the bus are based on [31]and the Liisa database (a typical bus fulfilling EURO3 stan-dards), the average number of passengers being 18 in a busof 60 seats. Data for bus manufacturing and the waste phaseare from the environmental product declaration of a Volvobus [33].
2.3. Life cycle impact assessment
In the study, the impact assessment methodology is basedon the general phases of life cycle impact assessment(LCIA): selection of impact categories, classification,
Table 3
Inventory results of the benchmark products
Unit Rye bread Laundry Emmental cheese Car drive Apartment
Functional unit 83 g 0.5 wash 30 g 20 km 41 m2
Primary energy MJ 1.25 1.97 a 69.6 87.3
CH4 g 0.080 0.419 60.9 0.400 15.1
CO g 0.055 0.135 0.090 33.2 9.24
CO2 g 62.1 130 112 4684 5686
N2O g 0.140 0.016 0.48 0.6 0.75
NH3 g 0.092 b 1.86 b b
NOx g 0.163 0.398 0.480 4.67 10.2
SOx g 0.078 0.356 0.210 3.07 10.5
VOC/HC g 0.006 0.206 0.030 10.8 0.375
N(w) g 0.181 0.005 1.11 0.004 c
P(w) g 0.016 0.008 0.063 0.001 c
a Value so far confidential.b No data for NH3 emission in the original inventories of laundry, car drive and apartment.c No data for water emissions for apartment (including electricity and heat production and construction), and values generally assumed to be low.
542 A. Nissinen et al. / Journal of Cleaner Production 15 (2007) 538e549
characterization, normalization and weighting [1]. The selectedimpact categories and contributing emissions were (see alsoexplanations in Table 1):
1. Climate change (CO2, N2O, CH4)2. Acidification (SOx, NOx, NH3)3. Tropospheric ozone formation (NOx, VOC/HC, CH4)4. Terrestrial eutrophication (NOx, NH3)5. Aquatic eutrophication (NOx, NH3, N(w), P(w))
Other impact categories such as human toxicity, eco-toxic-ity, particulate matter and effects of land use were not mod-elled and shown in the presentation formats at this stage ofthe project.
Characterization factors for Finland were used for acidifica-tion [34], tropospheric ozone formation [35], and aquatic eu-trophication [36] (thus the impacts were calculated as if allthe emissions had occurred in Finland) (Table 4). For normal-ization (and at the same time for the first benchmark), the ref-erence values for each impact category were calculated on thebasis of the total Finnish emissions and energy use (Table 1).Finland-specific weighting factors were available from an ear-lier study ([37], determined according to the principles pre-sented by [38]).
2.4. Environmental effects of consumption determined bythe inputeoutput method
Due to problems encountered in communicating the rele-vance of ‘the average per capita environmental impacts of
Table 4
Characterization factors (see text for references)
Emission Coefficient value Unit
Climate change
CO2 1 g CO2 eq g�1
N2O 296 g CO2 eq g�1
CH4 23 g CO2 eq g�1
Tropospheric ozone formationa
NO2 0.35 pers ppb h g�1
VOC/HC 0.27 pers ppb h g�1
CH4 0.33 pers ppb h g�1
Acidification
SO2 0.463 AE meq g�1
NO2 0.186 AE meq g�1
NH3 0.535 AE meq g�1
Aquatic eutrophicationb
NO2 0.015 g PO4 eq g�1
NH3 0.038 g PO4 eq g�1
Total P(w) 1.192 g PO4 eq g�1
PO4 as P(w) 3.060 g PO4 eq g�1
Total N(w) 0.215 g PO4 eq g�1
NH4, NH3 as N(w) 0.420 g PO4 eq g�1
NO2, NO3 as N(w) 0.420 g PO4 eq g�1
a Effects on vegetation (AOT 40).b These are average values for Finnish emissions. However, in the calcula-
tions sector-specific values have been used, derived from Seppala et al. [36].
the whole Finnish economy’, we also considered using theinputeoutput (i/o) method to determine the environmentalimpacts pertaining specifically to consumption. In recentyears, this method has been adapted to product-level environ-mental assessments [39]. It can also be used in a combinationwith the LCA method, in ‘hybrid LCAs’ [40]. In the tradi-tional LCA method the environmental effects are assessedby detailed studies of the processing, refining and distributionchains of the product, bottom-up. The starting point of the i/omethod is the statistical inputeoutput table of the whole econ-omy, where the flows of products between branches of produc-tion and to the final use are depicted comprehensively. Usingthe i/o model based on the i/o tables, we can calculate howmuch each final product requires directly or indirectly in theproduction of different production branches. When the envi-ronmental impacts of each production branch are known, theenvironmental impacts of the entire production chain of eachfinal product can be estimated. The method is consistent inthe sense that the environmental impacts of all final productsproduced sum up to the environmental impacts of the totaleconomy. Thus, the i/o method could be interpreted as atop-down method.
An advantage of the i/o method is that the environmentalimpacts of all final products can be estimated simultaneouslyand that the estimates embody exhaustively all impacts ofthe economy. Because of its laboriousness, the traditionalLCA method has so far been limited to a modest number ofproducts, and often to the most important parts of the produc-tion chains. The basic limitation of the i/o method is that everyproduct of each production branch is assumed to be producedby the same, average technology of the branch. The i/o methodis thus applicable to the assessment of only relatively wideproduct groups and is dependent on the density of the branchdivision of the i/o tables used. For example, the i/o methodcannot estimate the differences between the environmental ef-fects of vegetable and animal based foodstuffs if plant cultiva-tion and animal husbandry are in the same agricultural branchof the i/o table. The method thus offers an interesting comple-ment to traditional LCA, but its appropriateness in differentapplications needs to be considered carefully.
In Finland Maenpaa [39] has estimated the environmentalimpacts of household consumption using the inputeoutput(i/o) method. The study was based on the i/o table of theyear 1999 with 152 branches of production. For this article,re-calculations were made by using the same characterizationcoefficients for the environmental impacts as in the LCAstudy.
2.5. First set of alternative presentation types
Six different presentation formats were developed for thefirst brochure and consultation with the consumer panel. Thepresentation formats focused on different levels of aggregationof the environmental data (e.g., whether environmental im-pacts should be presented separately for different environmen-tal problems such as climate change and eutrophication, orweighted by experts and summed up into a single column),

543A. Nissinen et al. / Journal of Cleaner Production 15 (2007) 538e549
as well as on visual vs. verbal presentation. In the presenta-tions, comparisons were made between the environmental im-pacts of an illustrated product (a car trip of 20 km) and thebenchmarks. See [21] for more information, including thefigures.
2.6. Obtaining feedback from consumers andother stakeholders
We identified active and environmentally conscious con-sumers and environmental communicators as the primary tar-get groups for the benchmark information. We thus consideredvolunteer members of the Consumer Panel of the NationalConsumer Research Centre [41] an appropriate group to in-volve as consumer representatives. We solicited help from300 members of this panel, clearly stating the environmentaltopic of the study, and obtained 57 volunteers for the co-designprocess consisting of (1) inspecting the information package,(2) participating in a focus group interview, and (3) participat-ing in a second round of feedback to the improved brochurevia postal questionnaires. We organized 10 focus groups.
Those who volunteered to participate in our study were, onaverage, somewhat more environmentally concerned than thegeneral population: about half could be classified as ‘highlyconcerned about the environment’, whereas only one-third ofthe total population is within this category [42]. The averageage of the participants was 48 (Finnish average: 40). Most(84%) had at least a college-level education and an active en-gagement in consumer issues. The participants also frequentlyreported advising other people on environmental and con-sumer issues. They can be thus identified as central in theirown social networksdthe first consumers to use and diffusethis kind of information. Obviously, ‘the average consumer’constitutes a more difficult target group, which might not bewilling to invest the time and effort needed to make use ofthe LCA benchmarks. For the present, such consumers areprobably better served by simplified forms of environmentalinformation such as eco-labels.
As our interest was both in gaining information about howconsumers understand the benchmarks and suggestions forfurther improvement, we selected focus group discussions(see e.g. [43]) as the method for collecting the first round offeedback. We were aware that the first draft of the benchmarkswould not be easy to grasp. Focus group discussions are a pop-ular consumer research approach to studying the reception ofnovel concepts, as they support sense-making processes andstimulate the development of new ideas and suggestions forimprovements [44,45]. This type of qualitative research, how-ever, does not readily provide clear-cut percentages or major-ity views. Taking into account the open-ended nature of thetool we were developing, we concluded that it would be im-portant to learn how people interpret the information, whythey consider something easy or difficult to understand, andexactly how and why they consider it useful or unhelpful.
We also sought feedback from professional environmentalcommunicators from the public administration (e.g., wasteprevention counsellors), from business (e.g., environmental
managers) and from NGOs (e.g., counsellors, campaigners)by organizing two seminars: the first to introduce the project,and the second to obtain systematic feedback. This was doneby organizing group work sessions, asking the participantsto comment on the proposed benchmarks, identify ways inwhich they could use the benchmarks in their own work,and suggest future application that they might find useful. Atthe end of the group work, the conclusions of the groupwere drafted and reviewed by the group, as well as discussedwith other groups at the seminar. (See Heiskanen et al. [18] formore details of the format and outcomes of the processes usedto gain consultation with consumers and various stakeholders.)
2.7. Final presentation types
After the consultations, the presentation formats (and thebrochure) were refined to the state presented here. Feedbackwas also obtained on these new versions via postalquestionnaire.
3. Results
3.1. Feedback gained from consumers andother stakeholders
The consumers in all groups were of the opinion that thebenchmarksdas presented in the draft brochuredaddress animportant need and provide plenty of food for thought. Theidea that consumers should be able to scale and compare theenvironmental impacts of different activities was appreciated,although there were also consumers who considered the ap-proach much too complex. Some of the focus group partici-pants had not grasped the purpose of the benchmarks whenreading the draft brochure at home, but they did get the mes-sage during the group discussions. In each group, however, atleast a few participants (sometimes all) had understood thepurpose of the benchmarks as intended, which helped to getthe discussion on track. Problems in understanding the pur-pose of the benchmarks originated in the notion of ‘makingcomparisons between two very different products’ such asa car trip and rye bread. Partly, this was due to a failure tocommunicate the purpose of the benchmarks in the introduc-tory text of the draft brochure, but this difficulty can also beinterpreted as a more fundamental, conceptual problem. Noteveryone is comfortable with the idea of using ‘portions ofrye bread’ as a measure of the environmental load of a cartrip. Thus, we were challenged to reconsider the use of indi-vidual products as benchmarks.
On the other hand, the benchmark based on the ‘averagedaily per capita environmental impact of the whole Finnisheconomy’ was received with a mixture of enthusiasm and con-fusion. It was considered an extremely informative bench-mark, yet we were surprised how strongly people questionedits validity in representing the average daily impacts of con-sumption. Many Finns are familiar with the fact that export in-dustries are heavy energy users and polluters, so some of theconsumers were of the opinion that this benchmark was in

544 A. Nissinen et al. / Journal of Cleaner Production 15 (2007) 538e549
need of refinement: the impacts of the export industry shouldbe subtracted from the total (the fact that the environmentalimpacts of imported products are not included in the measuregained much less attention!).
The draft brochure presented seven alternative proposalsfor benchmark formats. With so many alternatives, it was dif-ficult to find a clear winner. All in all, the aggregated presen-tation format D was just slightly the most popular one (seeformats in [21]). It was closely followed by the benchmarkbased on the ‘per capita total daily environmental impact’(A), but there were also people in favour of verbal representa-tion, as well as individuals who preferred the other, less aggre-gated presentation formats. Obviously, people have differentcognitive styles, and it is difficult to find a presentation formatfor a new topic that is readily understandable for everyone. Wealso discovered that some people had only understood thebenchmarks after reading through the whole brochure once,and then returning to the graphs. Thus, the different presenta-tion formatsdincluding textdclearly supported each other,and needed more mutual integration in order to become under-standable. A general opinion shared by all was that the presen-tation formats needed simplification.
The general purpose of the benchmarks was more readilygrasped by the environmental communicators, who were morefamiliar with LCA and its focus on quantifying environmentalimpacts over the whole product life cycle. Here, our discussionsfocused more on where and how the environmental communica-tors could make use of the benchmarks in their work. Here, too,we obtained a variety of suggestions and ideas ranging fromdesignated websites to benchmark-based information on pack-ages that can be scanned using a mobile phone. In the shortterm, the most realistic suggestions focused on providing con-sumers with background information on the relative importanceof different consumption items, and comparing different activ-ity patterns such as different modes of transportation.
We gained a wealth of suggestions for applications andalternative presentation formats from both consumers and en-vironmental communicators. Some of them were clearly ‘spur-of-the-moment’ ideas, whereas others were obviously wellthought out. The feedback gained was thus quite variegated,and could not all be accommodated in subsequent work ondeveloping the benchmarks. After intensive discussions withinthe expert group, we managed to condense the followingguidelines for our improvement efforts:
The benchmarks were clearly rather difficult to understandin the form in which they were presented in the ‘draft bro-chure’. A clear guideline was thus that the information re-quired simplification and integration. The informationmaterial required more ‘spelling out’ and quite intensive pro-cessing by the expert group.
Most potential users of the benchmarks preferred the sim-pler presentation formats, including ones based on aggregatedand weighted results. Yet in each group, there were one or twopeople who were not prepared to leave the weighting of envi-ronmental impacts to anonymous experts, so there is reason toretain the unweighted data alongside the weighted results inpublic communications.
Even when aggregated, the majority of consumers consid-ered the information too complexdand perhaps, too undis-criminatingdto be used as a ‘proxy eco-label’ on productpackaging. Space and printing technology concerns were alsoraised.
In contrast, many users considered the information mightbe extremely useful in comparing broader alternative behav-ioural patterns such as alternative forms of transportationdor‘make-or-buy’ decision such as home cooking vs. ready meals.One of the most important strengths of the benchmarks wastheir quantitative nature, enabling consumers to prioritizeand identify large and important decisions, such as housingand space heating.
A number of alternative suggestions for presentation for-mats were receiveddranging from colour-coding to awardingpoints similar to those used by Weight Watchers. The mostuseful suggestion for general consumer education, however,was using a ‘ruler’ as a scale on which different products couldbe placed according to their environmental impacts.
All the different benchmarks were considered useful, andusers were not prepared to select a single product as a suitable‘anchor’ for understanding the environmental impacts of otherproducts. Thus, the research group was encouraged to developa benchmark format combining the weighted environmentalimpacts of a citizen and of the several products into a singlemeta-benchmark, and integrating this with the ‘ruler’ idea.
These suggestions provided guidelines and inspiration fordeveloping the presentation format of the benchmark, whichis presented in detail in the following sections. Even thoughcondensing the key lessons learned from the first-round feed-back was difficult and required a lot of interpretation by theexpert group, our choices were confirmed in the second-roundfeedback collected by postal questionnaire (N ¼ 42). Of therespondents, 38 were happy with the choice of the aggregatedpresentation format presented below, and all but one respon-dent considered that the benchmarks and presentation hadimproved in the second version of the brochure.
3.2. Elements of the benchmarks and presentation types
Inspired by the feedback gained, the basic benchmark wasgiven the form of a ruler, which aims to serve as a yardstickfor scaling the environmental impacts of different products,services or activities (see this ‘eco-benchmark’ in Fig. 2).The backbone of the benchmark-ruler is based on the averagedaily per capita environmental impacts of the whole Finnisheconomy. This ruler also integrates the different benchmarkproducts, which serve as additionaldand perhaps moredown-to-earthdbenchmarks.
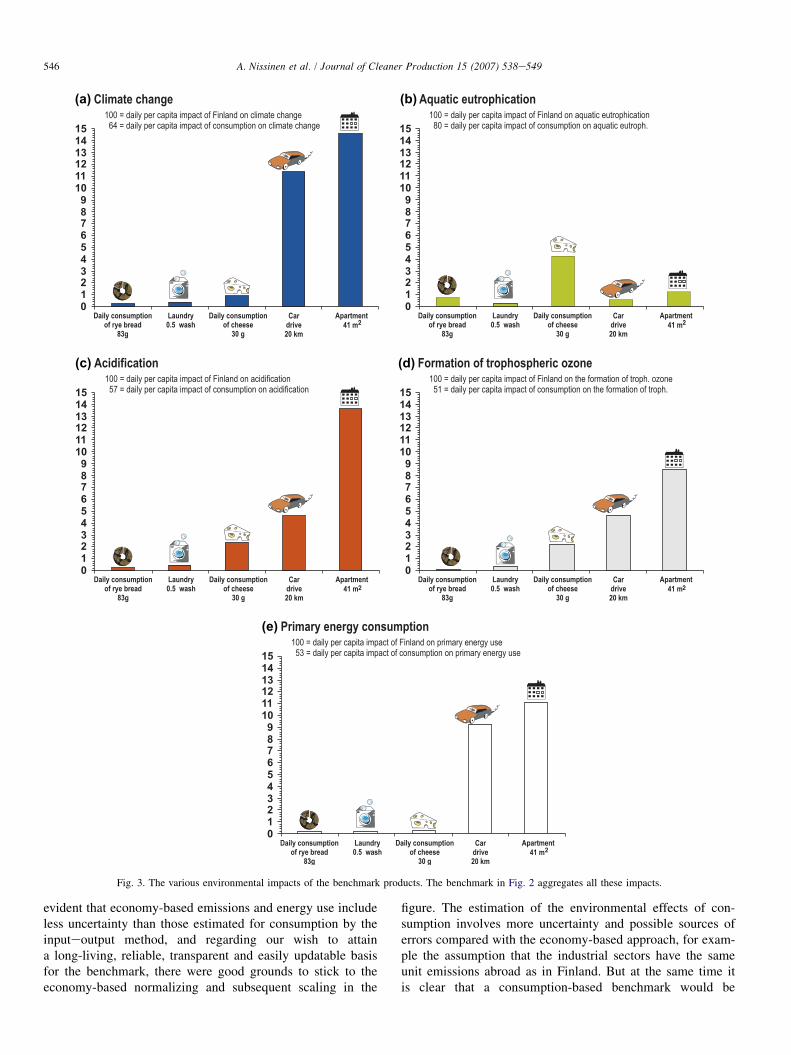
In addition to the aggregated presentation, it can often bevaluable and informative to show the values for each environ-mental impact class, as in Fig. 3. The ruler is not shown inthese figures, only the scale, in order to differentiate fromthe basic presentation format that aggregates the various envi-ronmental impacts.
We suggest that the presentation types in Figs. 2 and 3should be used in a combination. When using ordinary A4

545A. Nissinen et al. / Journal of Cleaner Production 15 (2007) 538e549
Fig. 2. The elements of the benchmarking: the ruler, the scale, and the benchmark products. Together they form the ‘eco-benchmark’. In addition, the various
environmental impacts of the benchmark products are shown here.
paper, the first page could present the aggregated results, andthe second page show the results for each impact class. Thiskind of combination of the presentation types would cater tothe needs of both those who prefer aggregated data, and thosewho prefer to draw their own conclusions on the relative im-portance of different environmental impact categories.
3.3. Assessing the relevance of the benchmarksfor consumption
In order to see how the scale and the benchmark productsrelate to estimated environmental effects of the private con-sumption, they were compared with estimates of average dailyper capita consumption of Finnish people, determined byinputeoutput analyses of production and consumption in theFinnish economy in the year 1999 (Fig. 4).
The value for the total environmental impacts was 64 forconsumption, when compared to an index of 100 for the wholeeconomy. The environmental impacts of food consumption arethe greatest, mainly because of the eutrophication effect.Housing rises to second-highest place, and after that the oper-ation of personal transport equipment. The environmental im-pacts of recreation and culture as well as the use of hotels andrestaurants are relatively high, too.
The average effects of the housing sector are larger than our‘apartment-benchmark’. One reason for this is that in the i/omethod, housing also includes the electricity for the variousappliances at homes, which are not included in our study.The impacts of the operation of personal transport equipmentdetermined by the i/o method are also higher than our ‘car-benchmark’. Regarding food, the i/o method clearly showsthat the overall impacts of all consumed foodstuff are high,while our ‘food-benchmarks’ show the impacts of only twofood items.
In conclusion, the overall pictures that the two methods(LCA, i/o) give are not in conflict. However, it is evident
that it is mostly fruitful and recommendable to look at suchresults side by side, if available, as they provide a complemen-tary picture of the environmental effects of the various productsand consumption commodity groups.
3.4. Example of using the benchmarks andpresentation types
In order to demonstrate the use of the benchmark, a compar-ison between a car trip and a bus trip is shown in Fig. 5. It iseasy to see from this kind of presentation that a typical car tripand bus trip are ‘services’ that have relatively high impactscompared with other products and services. In addition, onecan easily note that differences in the environmental effectsbetween the ways to make the trip are large. The conclusionfrom these two ‘benchmarkings’dpertaining to serviceswith large impacts, and large difference between themdisclear: this choice is something worth considering if one wantsto decrease one’s environmental impacts. Thus this exampleclearly demonstrates the benefits of the benchmarking andthe presentation type.
4. Discussion and conclusions
We concluded to use the environmental effects of the wholeeconomy of Finland as the basis of the scale in the benchmark.This ‘economy-based approach’ has often been used to nor-malize the various environmental effects [46]. Late in the pro-ject it also became possible to use the environmental effects ofconsumption in Finland, determined by the inputeoutputmethod [39]. This was a tempting alternative to the chosenscale, considering that many people in the consumer paneland seminars thought that a consumption-based scaling andbenchmark would be more relevant than the economy-basedscale (because export products have a large role in theeconomy-based environmental effects). However, as it was
546 A. Nissinen et al. / Journal of Cleaner Production 15 (2007) 538e549
(a)
(c)
(b)
(d)
(e)
Fig. 3. The various environmental impacts of the benchmark products. The benchmark in Fig. 2 aggregates all these impacts.
evident that economy-based emissions and energy use includeless uncertainty than those estimated for consumption by theinputeoutput method, and regarding our wish to attaina long-living, reliable, transparent and easily updatable basisfor the benchmark, there were good grounds to stick to theeconomy-based normalizing and subsequent scaling in the
figure. The estimation of the environmental effects of con-sumption involves more uncertainty and possible sources oferrors compared with the economy-based approach, for exam-ple the assumption that the industrial sectors have the sameunit emissions abroad as in Finland. But at the same time itis clear that a consumption-based benchmark would be

547A. Nissinen et al. / Journal of Cleaner Production 15 (2007) 538e549
Fig. 4. Environmental impacts of the consumption commodity groups [39], presented using the benchmark format.
perceived to be more relevant by many consumers, and it maybe worth studying later how consumers value the different as-pects of the economy-based and consumption-based scaling.
Analogously we do not show the environmental effects ofthe consumption commodity groups [39] in the benchmark,i.e. in the ruler, because we consider that each group includesso many different products [47] that a benchmark product can-not be identified by the person looking at the figure. Thus theymight not as easily get familiar and ‘anchor’ with the productbenchmark as they do with the well-defined products. How-ever, we regard this information valuable, and present it inan explanatory figure type (as in Fig. 4), which can be givenas extra information to the users of the benchmark presenta-tion. We assume that it broadens the view from a few productsto the entire consumption of different products and services,and helps to put the product benchmarks into the larger contextof consumed products and services. In fact the consumption-based approach is already used in the basic present presentationtype, so that in the figure the value for consumption is shown,being 64 compared with the value 100 for the whole economy(this difference reflects the importance of Finnish export indus-try sectors that have high unit emissions). Another solution is touse another ruler on the right side of the figure, showing theconsumption-based scale.
The benchmark presentation format lends itself to a varietyof applications. More and more manufacturers are publishingLCA-based data on their products (e.g., environmental productdeclarations). The benchmark format offers consumers a possi-bility to make sense of this information, and may eventuallyharmonize the way in which manufacturers publish LCA re-sults on products. Even more importantly, the benchmark pre-sentation format also shows the importance of the product, and
Fig. 5. An example of using the benchmark presentation, for comparing the
environmental impacts of a car trip and a bus trip.

548 A. Nissinen et al. / Journal of Cleaner Production 15 (2007) 538e549
potential improvements, in the context of consumption asa whole (at present Finnish consumption). Thus it offersa link between sustainable production and consumption. Inthe future, it will hopefully evolve to complement existing en-vironmental information systems, such as environmental la-bels, corporate environmental reporting and environmentalguidebooks for consumers.
The benchmark developed here has obvious benefits thatwere welcomed by the consumers and other stakeholders con-sulted. The ability to address multiple environmental impactsin a quantitative form provides users with much-sought infor-mation on priorities and the relative importance of various de-cisions. Thus, it has the ability to move discussions onsustainable consumption away from marginal issues such asrecycling discarded packaging or choosing eco-product vari-ants (e.g. [6,8]), while retaining the precision brought byLCA. One of the challenges, however, is that most of the in-dividual decisions are fairly small on this kind of a scale.Thus, one of the future directions for improving the bench-mark is to develop it into an interactive website allowing con-sumers to model, e.g. the combined effects of multipleenvironmental improvements of their choice. We will alsowork toward obtaining more product benchmarks from differ-ent product groups, and look forward to applications of themethod in other countries and possibly using the same bench-mark-product for many countries (like a car trip or cheese, see[21]).
Acknowledgements
The project was funded by the research organizations andthe Environmental Cluster Research Programme, coordinatedby Finland’s Ministry of the Environment. We also thankMrs Virpi Liesimaa for the idea of putting together a rulerand the five products.
References
[1] ISO (International Organization for Standardization). ISO 14042: Envi-
ronmental managementdLife cycle assessmentdLife cycle impact as-
sessment. Geneva: International Organization for Standardization; 2000.
[2] World Summit on sustainable development. Plan of implementations,
http://www.un.org/esa/sustdev/index.html; 2002.
[3] EU Commission. Communication from the Commission to the Council
and the European ParliamentdIntegrated Product Policy. Brussels: EU
Commission; 2003. COM (2003)302.
[4] Heiskanen E. The institutional logic of life cycle thinking. Journal of
Cleaner Production 2002;10(5):427e37.
[5] de Leeuw B. The world behind the product. Journal of Industrial Ecology
2005;9(1/2):7e10.
[6] Heiskanen E, Pantzar M. Toward sustainable consumption: new perspec-
tives. Journal of Consumer Policy 1997;20:409e42.
[7] Hobson K. Thinking habits into action: the role of knowledge and pro-
cess in questioning household consumption practices. Local Environment
2003;8(1):95e112.
[8] Shove E. Converging conventions of comfort, cleanliness and conve-
nience. Journal of Consumer Policy 2003;26(4):395e418.
[9] Jackson T. Live better by consuming less? Is There a ‘double dividend’ in
sustainable consumption? Journal of Industrial Ecology 2005;9(1/2):
19e36.
[10] Imkamp H. The interest of consumers in ecological product information
is growingdevidence from two German surveys. Journal of Consumer
Policy 2000;23:193e202.
[11] Leire C, Thidell A. Product-related environmental information to guide
consumer purchasesda review and analysis of research on perceptions,
understanding and use among Nordic consumers. Journal of Cleaner Pro-
duction 2004;13(10e11):1061e70.
[12] Goedkoop M, Spriensma R. The Eco-Indicator 99da damage oriented
method for life cycle impact assessment. Methodology report. Third edi-
tion. Amersfoort (The Netherlands): PRe Consultants B.V. http://
www.pre.nl/download/EI99_methodology_v3.pdf; [accessed 22.06.01].
[13] Otto HE, Mueller KG, Kimura F. Efficient information visualization in
LCA. International Journal of Life Cycle Assessment 2003;8(4):183e9.
[14] Niva M, Heiskanen E, Timonen P. Consumers’ environmental
sophisticationdKnowledge, motivation and behaviour. European Ad-
vances in Consumer Research 1997;3:1e6.
[15] Dunlap RE. Lay perceptions of global risk. Public views of global warm-
ing in cross-national context. International Sociology 1998;13(4):473e98.
[16] Wagner W, Kronenberg N, Seifert F. Collective symbolic coping with
new technology: knowledge, images and public discourse. British Journal
of Social Psychology 2002;41(3):323e43.
[17] Joffe H. Risk: from perception to social representation. British Journal of
Social Psychology 2003;42(1):55e73.
[18] Heiskanen E, Timonen P, Nissinen A, Gronroos J, Honkanen A,
Katajajuuri JM, et al. Developing a benchmark tool for sustainable
consumption: an iterative process, http://www.ymparisto.fi/default.asp?
contentid¼144840&lan¼EN; 2005.
[19] Finnish Environment Institute. www.ymparisto.fi/default.asp?contentid¼82002&lan¼fi (1 November 2005).
[20] Statistics Finland. www.stat.fi/tup/suoluk/suoluk_energia_en.html
(1 November 2005).
[21] Nissinen A, Gronroos J, Heiskanen E, Honkanen A, Katajajuuri JM,
Kettunen J, et al. Development of benchmarking for the environmental
impacts of different products, services and consumption patterns. In: Sus-
tainable consumption: the contribution of research, Workshop 10e12
February 2005, Gabels Hus, Oslo. Trondheim (Norway): Norwegian
University for Science and Technology (NTNU), Industrial Ecology
program. p. 98e114. Report 1/2005, http://www.indecol.ntnu.no/scwork
shop.php. Proceedings.
[22] Gronroos J, Seppala J, editors. Agricultural production systems and the
environment (in Finnish, executive summary in English). Finnish Envi-
ronment 431. Helsinki: Finnish Environment Institute; 2000.
[23] Gronroos J, Voutilainen P. Agricultural production systems and the envi-
ronment. Results of inventory analysis (in Finnish, executive summary in
English). Helsinki: Mimeograph series of the Finnish Environment Insti-
tute 231, http://www.environment.fi/publications.
[24] Gronroos J, Seppala J, Seuri P, Voutilainen P. Agricultural production
systems and the environment. In: Proceedings of the International Con-
ference on LCA in Foods, Gothenburg, Sweden 26e27 April 2001.
SIK-Dokument 143. 2001:131e135.
[25] Voutilainen P, Tuhkanen HR, Katajajuuri JM, Nousiainen J, Honkasalo
N. Environmental impacts and improvement possibilities of Emmental
blue-label cheese (in Finnish, abstract in English). Maa- ja elintarviket-
alous 35. http://www.mtt.fi/met/pdf/met35.pdf; 2003.
[26] Aalto K. Who washes laundry in Finland? Textile care in households and
use of textile care services (in Finnish, abstract in English). Publications
11. Helsinki: Kuluttajatutkimuskeskus; 2003.
[27] Saouter E, van Hoof G, Feijtel TCJ, Owens JW. The effect of compact
formulations on the environmental profile of northern European granular
laundry detergents. Part II: Life cycle assessment. International Journal
of Life Cycle Assessment 2002;7(1):27e38.
[28] Tenhunen J, Oinonen J, Seppala J. Life cycle assessment of a water sup-
ply and wastewater treatment systemdA case study of Tampere Water
Works (in Finnish, abstract in English). The Finnish Environment 434.
Helsinki: Finnish Environment Institute; 2000.
[29] Vares S. Environmental impacts of materials in an apartment building
(translation by authors of the article). VTT Research Notes 2108. Espoo:
VTT Technical Research Centre of Finland; 2001.

549A. Nissinen et al. / Journal of Cleaner Production 15 (2007) 538e549
[30] Koskela S, Seppala J, Leivonen J. Environmental impacts in assessing the
ecoefficiency of buildings (in Finnish, abstract in English). The Finnish
Environment 585. Helsinki: Finnish Environment Institute; 2002. p. 1e54.
[31] Fortum Eco-Inventory, Oil Products, 1.3.2002. Data-sheet from Fortum
Oil and Gas, P.O. Box 310, 06101 Porvoo, Finland; 2002.
[32] Schweimer GW, Levin M. Life cycle inventory for the Golf A4. Avail-
able from: www.volkswagen.-environment.de; August 2004.
[33] Volvo 8500 Low Entry, Environmental product Declaration. Available
from: www.epd.volvocars.se/main/default.asp; 6 August 2004.
[34] Seppala J, Posch M, Johansson M, Hettelingh JP. Country-dependent
characterisation factors for acidification and terrestrial eutrophication
based on accumulated exceedance as impact category indicator. Int Jour-
nal of Life Cycle Assessment;1e14 (OnLine First). Available from:
www.scientificjournals.com/sj/lca/Abstract/ArtikelId/7442; 1 November
2005.
[35] Hauschild M, Bastrup-Birk A, Hertel O, Schopp W, Potting J. Photo-
chemical ozone formation. In: Potting J, Hauschild M, editors. Back-
ground for spatial differentiation in life cycle assessmentdthe EDIP
2003 methodology. Copenhagen: Institute of Product Development;
2004.
[36] Seppala J, Knuuttila S, Silvo K. Eutrophication of aquatic ecosystems. A
new method for calculating the potential contributions of nitrogen and
phosphorus. International Journal of Life Cycle Assessment 2004;9(2):
90e100.
[37] Seppala J, Silvenius F, Gronroos J, Makinen T, Silvo K, Storhammar E.
Rainbow trout production and the environment (an LCA study) (in Finn-
ish, executive summary in English). The Finnish Environment 529. Hel-
sinki: Finnish Environment Institute; 2001.
[38] Seppala J. Decision analysis as a tool for life cycle assessment. In: LCA
Documents, vol. 4. Bayreuth (Germany): Eci-Informa Press; 1999.
[39] Maenpaa I. Analysis of environmental impacts of consumption in
Finland. In: Sustainable consumption: the contribution of research,
Workshop 10e12 February 2005, Gabels Hus, Oslo. Report 1/2005.
Trondheim (Norway): Norwegian University for Science and Technology
(NTNU). p. 1e21. Industrial Ecology program, http://www.indecol.ntnu.
no/scworkshop.php. Proceedings.
[40] Hertwich EG. Consumption and industrial ecology. Journal of Industrial
Ecology 2005;9:1e6.
[41] NCRC. Presentation of the National Consumer Research Centre’s Con-
sumer Panel, http://www.ncrc.fi/english/panel/index.html; 30 June 2005.
[42] Nurmela J, Kiianmaa N, Tanskanen E. The Finns and sustainable devel-
opment? How do we measure opinions about sustainable development?
Futura 2002;2:11e8.
[43] Barbour RS, Kitzinger J. Developing focus group research. Politics, the-
ory and practice. London: Sage Publications; 2001.
[44] Threfall KD. Using focus groups as a consumer research tool. Journal of
Marketing Practice 1999;5(4):102e5.
[45] Kuhn K. Problems and benefits of requirements gathering with focus
groups. International Journal of Human-Computer Interaction 2000;
12(3&4):309e25.
[46] Finnveden G, Hofstetter P, Bare JC, Basson L, Ciroth A, Mettier T, et al.
Normalisation, grouping, and weighting in life-cycle impact assessment.
In: Udo de Haes HA, Finnveden G, Goedkoop M, Hauschild M,
Hertwich EG, Hofstetter P, et al., editors. Life-cycle impact assessment:
striving towards best practice. Brussels: SETAC; 2002. p. 177.
[47] IPTS. Environmental impacts of products (EIPRO), Analysis of the life
cycle environmental impacts related to the total final consumption of
the EU25. Institute for Prospective Technological Studies (IPTS). Full
draft report. Available from: http://cleantech.jrc.es/docs/EIPRO_Total_
20050429_final.pdf; 1 November 2005.