Objectives Achieved: New Benchmarks for Growth - Euroland
62
Annual Report 2002 For the year ended March 31, 2002 Objectives Achieved: New Benchmarks for Growth
-
Upload
khangminh22 -
Category
Documents
-
view
4 -
download
0
Transcript of Objectives Achieved: New Benchmarks for Growth - Euroland

Annual Report 2002For the year ended March 31, 2002
Objectives Achieved:New Benchmarks for Growth

Corporate PhilosophyOur philosophy is to contribute to significant advances in food and health on a global basis and ultimately tocreate a better life for all. We emphasize leadership, innovation and foresight in providing safe and reliableproducts of the highest quality. Staunchly committed to environmental preservation, Ajinomoto is also globallyactive in promoting better health and nutrition and in education and disaster assistance programs.
Clearly Defined Strategies for GrowthAjinomoto has begun a new three-year management plan designed to promote further development as a trulyglobal corporation. The plan encompasses five key areas: expanding business in growth sectors, shifting toward ahigh-earnings structure, strengthening corporate governance, nurturing personnel capable of working in theglobal arena, and operating in harmony with society as a good corporate citizen. Our objectives under the newthree-year management plan, which will be completed in March 2005, include sales of ¥1.1 trillion, operatingincome of ¥75 billion, net income of ¥45 billion and return on equity of at least 10 percent.
The Ajinomoto WayAjinomoto has numerous number one and strong number two brands in its chosen markets, both in Japan andaround the world. Programs to concentrate resources in selected core markets implemented under our recentlyaccomplished management plan will support our brands, while our technological expertise is a core strength withwhich we can differentiate existing products and develop new ones. Ajinomoto’s 106 factories in 15 countries andregions including Japan support operations that span 22 countries and regions. We will continue to grow byemphasizing the Ajinomoto Way: developing the people, products and strategies required to differentiateAjinomoto from competitors and provide the means to succeed in global markets.
Financial Highlights ......................................................................... 1
To Our Shareholders ........................................................................ 2
New Benchmarks for Growth........................................................... 5
Ajinomoto at a Glance ..................................................................... 16
Review of Operations....................................................................... 18
Food Products ........................................................................... 19
Fine Chemicals .......................................................................... 23
Financial Section .............................................................................. 27
Board of Directors and Auditors....................................................... 51
Global Network................................................................................ 52
Major Subsidiaries and Affiliates ..................................................... 54
Directory .......................................................................................... 56
Investor Information ........................................................................ 58
Profile
Contents
Forward-Looking StatementsThis annual report contains forward-looking statements regarding the Company’s plans, outlook, strategies and results for the future. All forward-
looking statements are based on judgments derived from the information available to the Company at the time of publication.Certain risks and uncertainties could cause the Company’s actual results to differ materially from any projections presented in this report. These risks
and uncertainties include, but are not limited to, the economic circumstances surrounding the Company’s businesses; competitive pressures; related lawsand regulations; product development programs; and changes in exchange rates.

Financial Highlights
Ajinomoto Co., Inc. and Consolidated SubsidiariesYears ended March 31, 2002 and 2001
Thousands of PercentMillions of yen U.S. dollars change
2002 2001 2002 2002/2001
For the year:
Net sales ¥943,540 ¥908,528 $7,094,286 3.9%
Gross profit 263,536 242,672 1,981,474 8.6
Operating income 49,015 37,805 368,534 29.7
Income (loss) before income taxes and minority interests 58,464 (12,995) 439,579 —
Net income (loss) 31,442 (11,547) 236,406 —
At year-end:
Shareholders’ equity ¥381,017 ¥361,771 $2,864,789 5.3%
Total assets 840,152 828,945 6,316,932 1.4
Per share (yen and U.S. dollars)
Net income (loss) ¥ 48.4 ¥ (17.8) $ 0.36 —
Shareholders’ equity 586.3 556.6 4.41 5.3%
Cash dividends 10.0 10.0 0.08 0.0
Notes: 1. U.S. dollar amounts represent translations of yen, for convenience only, at ¥133=US$1, the approximate rate prevailing on March 31, 2002.
2. In connection with the implementation of new accounting standards for retirement benefits in Japan, Ajinomoto opted to accrue ¥52.3 billion in net retirement benefit obligations as a one-time charge during the fiscal year ended March 31, 2001. As a result, the Company posted a loss before income taxes and minority interests, net loss and net loss per share, and return on equity was a negative number.
20022001200019991998
908.5
829.4814.5836.0
20022001200019991998
37.8
33.1
28.8
50.4
-11.5
17.7
13.2
18.0
-3.3
5.2
3.7
5.0
20022001200019991998
361.8
330.6349.9359.2943.5 49.0
31.4
381.0 8.5
2002200019991998 2001
Net Sales(Billions of yen)
Operating Income/Net Income (Loss)(Billions of yen)
■ Operating Income■ Net Income (Loss)
Shareholders’ Equity(Billions of yen)
Return on Equity(%)
– 1 –

Over the past three fiscal years, Ajinomoto executed a management plandesigned to solidify the Company’s position as a global corporation in foodand amino acid products. I am proud to report to shareholders that yourcompany achieved almost all of the plan’s objectives.
Kunio Egashira, President
To Our Shareholders
– 2 –
PROGRESS IN FISCAL 2001
During fiscal 2001, ended March 31, 2002, a global economic slowdown was exacerbated by the terrorist
attacks on the United States, while the economic recession in Japan worsened due to deflation and continued
weakness in consumer spending. The operating environment in the domestic food market, Ajinomoto’s main
business area, remained challenging as this market’s maturity and the diversification of consumer tastes have
led to increasingly stringent competition. Our drive under the recently accomplished management plan to
reduce costs and improve global business development capabilities, however, resulted in gains in both sales
and income for the fiscal year. Consolidated net sales increased 3.9 percent to ¥943.5 billion, and operating
income expanded 29.7 percent to ¥49.0 billion. Net income totaled ¥31.4 billion, a gain of ¥42.9 billion
compared to the net loss of the previous fiscal year that resulted from a one-time charge to income due to the
implementation of new accounting standards for retirement benefits. Return on equity (ROE) was 8.5 percent
for the fiscal year. The cash dividend for the year was ¥10.0 per share.
Over the three years since Ajinomoto set goals under its management plan that ended in March 2002, our
operating environment deteriorated rapidly due to factors such as the economic recession and deflation in
Japan, slow growth worldwide and intensifying global competition. Consequently, Ajinomoto just missed
achieving its target of sales of ¥1 trillion, but the Company achieved its targets of net income of ¥30.0 billion
and ROE of at least 6.0 percent despite these factors.

Ajinomoto was also successful in implementing the five main initiatives of the recently accomplished
management plan: improving consolidated management; strengthening our brands; establishing world-leading
cost competitiveness; enhancing our R&D system; and contributing to society. As discussed in last year’s
annual report, Ajinomoto has made outstanding progress in consolidating Group operations and logistics for
greater efficiency, restructuring and strengthening the domestic food business, and aggressively executing
acquisitions and alliances.
The World Number 1 Network (WIN) plan continued to reduce costs, particularly in our global amino acids
and nucleotides businesses. At the same time, Ajinomoto prepared to meet growing demand and expand
market share through carefully targeted investments in production capacity for monosodium glutamate in
Brazil, nucleotides in Thailand, feed-grade Lysine in the United States, Italy and Thailand, and feed-grade
Threonine in the United States and France.
We also worked to expand our participation in global food products markets and build a foundation for further
growth, exemplified by the creation of SHANGHAI HOUSE AJINOMOTO FOODS CO., LTD. in China in cooperation
with House Foods Corporation of Japan. The new company will meet the needs of the high-potential Chinese
market, with a focus on production and marketing of retort pouch meals such as curry-based products.
In our pharmaceuticals business, we concluded an agreement to license development, production and
marketing rights for an anti-cancer agent in Ajinomoto’s R&D pipeline to global pharmaceutical industry leader
Aventis Pharma S.A. In addition, we obtained approval to manufacture a treatment for osteoporosis that we
have developed jointly with Aventis Pharma Ltd. and Takeda Chemical Industries, Ltd. Our progress in working
with strong partners has strengthened Ajinomoto’s foundation for achieving its objectives in building its
pharmaceuticals business.
Throughout the Ajinomoto Group, our people are enthusiastically embracing change and working toward our
shared objectives. We intend to increase our momentum under our new three-year management plan. By the
end of fiscal 2004 in March 2005, Ajinomoto has targeted net sales of ¥1.1 trillion, operating income of ¥75
billion, net income of ¥45 billion and ROE of at least 10 percent. These are ambitious targets, and we intend to
achieve them through the following five management strategies.
• Expanding business in growth sectorsThe global nutritional health business is growing. It will be a primary area of focus, and programs are under way
throughout the Ajinomoto Group to create products for this market segment. The retail food markets of Southeast
Asia, Central and South America and China offer Ajinomoto excellent potential, and in our global bulk ingredients
business, we will further reinforce our strong number one position through capacity expansion, optimum plant
location and continued cost reductions. In the pharmaceuticals business, we will strengthen our programs
covering clinical nutrition, gastrointestinal diseases and lifestyle-related diseases such as diabetes, while
building on alliances with global pharmaceutical leaders. Ajinomoto has also created a team to aggressively
investigate acquisitions and alliances that will help the Company expand operations in growth sectors.
• Shifting toward a high-earnings structureWe will continue to focus on the themes of selection, concentration and expansion in strengthening our
domestic food business. Key initiatives include concentrating resources on brands with number one or strong
number two market shares and further reducing costs. We also intend to restructure the Corporate Division
into a small, select group to contribute to improved profitability.
• Strengthening corporate governanceThe implementation of our internal company system as of April 1, 2002 builds on the progress we have made
in consolidating Group operations and building critical mass. Ajinomoto is now structured as three internal
companies, one company that has been spun off, four business tie-ups, subsidiaries and affiliates and the
– 3 –
A NEW THREE-YEARMANAGEMENT PLANBEGINS

Corporate Division. The new internal companies are vertically integrated to facilitate decision making, allocate
capital and responsibilities more effectively, and support Ajinomoto’s total returns.
• Nurturing personnel capable of working in the global arenaAjinomoto needs employees who are able to succeed globally, and we intend to make employees even better
able to maximize their potential — and their contribution. We plan to harness our corporate culture more
closely to merit, and create the flexibility necessary to support the achievement of our goals. Moreover, we
plan to construct a training center where we will train and develop personnel on a Groupwide basis both
domestically and overseas, while disseminating the “Ajinomoto Way” policy throughout the Group.
• Operating in harmony with society as a good corporate citizenIn response to incidents involving food quality at Japanese manufacturers and the worldwide problem of
bovine spongiform encephalopathy (BSE), Ajinomoto has strengthened its intragroup auditing functions, and is
further improving upon its thorough, high-level quality standards. The Company is also responding to
environmental issues under its exhaustive, global environmental protection standards. Ajinomoto supports a
wide range of activities ranging from research into food culture to promoting better health and education. A
commitment to broadly based contribution to the communities we serve in regions worldwide permeates the
attitudes and philosophy of the Ajinomoto Group.
Ajinomoto’s brands are one of the Company’s greatest strengths. Over the past three years, we measurably
strengthened both our corporate and individual brands, and intend to continue doing so. Our corporate brand
strategy has added the theme of amino acids to our “From the field, AJI-NO-MOTO” campaign. New product
Amino Vital has become a major hit because of effective communication that created strong awareness of the
goodness of amino acids among consumers. Our efforts to further build the Amino Vital brand should therefore
benefit from the consistent implementation of our corporate brand strategy.
The management plan we have just accomplished brought Ajinomoto to the threshold of being a truly global
company. We believe that being a global company means more than simply having operating bases around the
world or a certain level of sales and earnings. We must also be a unique and distinctive company trusted by
people around the world, and consider the following to be essential for us to become such a company:
• Products loved by people worldwide
• An Ajinomoto brand that assures reliability and safety
• Creative and individual personnel who take an active role in the global arena
• Innovative technologies with a primary focus on amino acids derived from the field of life science
I firmly believe that the Ajinomoto Group can become a truly global company by achieving the goals contained
in our new three-year management plan.
Until now, the Japanese food industry has been relatively uninvolved in global competition, and so has been
slow to develop a global perspective. Yet this industry has recently begun to be affected by globalization, and
has therefore gradually become more internationally aware. I believe that only companies that can create high-
value-added products based on technology will survive, and that all of us at Ajinomoto must use our unique
strengths to deliver value to the peoples of the world. The goals of our new three-year management plan are
designed to increase corporate value, and we are devoting maximum effort to meeting the expectations of our
shareholders.
July 2002
Kunio Egashira
President
– 4 –
THREE-YEAROUTLOOK: INCREASEOUR MOMENTUM

1New Benchmarks for Growth
Expanding Business in Growth Sectors
2Shifting toward a High-Earnings Structure
3Strengthening Corporate Governance
4Nurturing Personnel Capable of Working in the Global Arena
5Operating in Harmony with Society as a Good Corporate Citizen
– 5 –

Nutritional Health-Related Food Products Are Growth Drivers
The overall retail market for nutritional health-related food
products in Japan is estimated at ¥4 trillion. Within it, the retail
market for products that carry the Ministry of Health, Labour and
Welfare designation “Food for Specified Health Use” is estimated
at ¥400 billion. During the course of the new three-year
management plan, Ajinomoto expects to capture a significant
share of this market with functional foods. Amino Vital sports
supplement and Kenko Sarara cooking oil are representative of
successful new products we have introduced in the nutritional
health-related food market and we are aggressively developing
additional products to complement them.
Amino Vital: A Brand Built on ScienceAmino Vital, a scientifically engineered amino acid-based
sports supplement, exemplifies Ajinomoto’s approach in the
nutritional health-related food product segment. Our brands in
this market are built around science, rather than image. Using the
scientific approach to promote consumers’ understanding of the
benefits of amino acids has resulted in swift consumer
acceptance, with sales of Amino Vital expanding approximately
70 percent during fiscal 2001.
During fiscal 2002, Ajinomoto has targeted additional growth
of 40 to 50 percent in sales of Amino Vital. In support of this
objective, we will introduce new varieties and expand distribution
channels. The existing drugstore channel has proven very effective,
and will remain a primary conduit. Ajinomoto will also devote
additional effort to sales at sports and health clubs. Supermarkets
and convenience stores present excellent potential as a means of
broadening Amino Vital’s customer base. Ajinomoto is carefully
preparing to market Amino Vital in these channels using methods
that deepen understanding among general consumers, thus
emphasizing the scientific background of this exciting product.
Kenko Sarara Cooking Oil Poised for GrowthKenko Sarara, an edible oil that substantially reduces
cholesterol deposits, received designation as a “Food for Specified
Health Use” from the Ministry of Health, Labour and Welfare in
December 2001. The Japanese market for healthy oils is estimated
at ¥19 billion in fiscal 2001, and Ajinomoto expects to generate
sales of ¥2.5 billion of this product in fiscal 2002.
Kenko Sarara has moved quickly from laboratory concept to
commercialization, exemplifying Ajinomoto’s drive to accelerate
time to market. Applications development took place even while
basic research was still in progress to ensure strong market
linkage.
A Framework to Support ExpansionThe creation of the Health Services Development Department in
March 2002 will support achievement of our objectives by
promoting the development and effective management of
– 6 –
• Aggressively expand in the nutritional health-related food market.
• Increase presence in high-potential retail markets overseas.
• Build on global leadership in bulk ingredients.
• Expand pharmaceutical business through R&D and alliances.
Strategic Overview:
New varieties of hit product Amino
Vital and the development of new
distribution channels are projected to
drive solid sales growth for this
scientifically engineered sports
supplement drink.
In developing Kenko Sarara,
Ajinomoto conducted
applications research
concurrently with basic
research to make sure the
product would meet
consumer requirements.
Expanding Business in Growth Sectors
New Benchmarks for Growth:
1

nutritional health-related brands. Established within the Corporate
Division, the department will work with Group companies to
create new materials and products based on a clear scientific
foundation, thus strengthening Ajinomoto’s overall presence in
nutritional health-related segments.
Created in 2000, The Nutritional Health Science Research
Project Department was reorganized into the Research Institute for
Health Fundamentals and became part of Ajinomoto’s Corporate
Laboratories in March 2002. It will serve as the Group’s primary
research organization in the field of nutritional health-related
products. Its staff plays a key role in generating product ideas by
undertaking applications research in cooperation with Ajinomoto’s
internal and Group companies and outside organizations.
Ajinomoto aims to generate new health-related products every
year. Dietary approaches to good health and appropriate
responses to changes in the body over the life cycle are key
development themes in working to develop popular products.
Growing Presence in Retail Markets outside JapanThe market for food products in Japan is mature, making growth
challenging. Ajinomoto is therefore expanding the presence of its
powerful food product brands in high-potential markets outside
Japan, with emphasis on Southeast Asia, Central and South
America, and China. Moreover, during the new three-year
management plan Ajinomoto will strengthen its regional product
development capabilities to support increased sales in target
regions. This effort will be particularly important in determining the
best processed food product candidates for each region.
Ajinomoto has a potent brand lineup in Southeast Asia,
anchored by AJI-NO-MOTO. With a solid presence in Southeast
Asian food and seasoning mix markets as well, Ajinomoto is well
positioned to succeed in broadening its product offerings and
increasing market penetration. Channel development and
building on our strong brand awareness among consumers will
be core themes.
Central and South America offer solid potential. Having built
AJI-NO-MOTO into a respected brand in this region, Ajinomoto
has targeted products such as seasoning mixes and aspartame as
core growth drivers, and is also further strengthening its number
one position in the instant noodle market of Brazil.
In China, Ajinomoto’s overall objective is to build strong food
product brands that are well suited to the sensibilities of the
Chinese market. A larger share for AJI-NO-MOTO flavor
enhancer in the umami seasoning market is a priority. Seasoning
mixes represent another segment in which Ajinomoto intends to
expand sales, and we will also promote diversification into the
retort pouch curry market through an alliance with House Foods
Corporation of Japan.
Science and new ideas drive health-relatedproduct development.
The Health Services Development Department and the
Research Institute for Health Fundamentals will work
with Ajinomoto’s internal and Group companies as well
as outside organizations to support rapid development of
new health-related products. These organizations will
help ensure that Ajinomoto creates new, interdisciplinary
product concepts based on thorough science that will
excite consumer interest.
STRATEGIES IN ACTION
SHANGHAI HOUSE
AJINOMOTO FOODS
CO., LTD. will begin
production of retort
food products for the
Chinese market around
the end of 2002, with
an emphasis on high-
quality, convenient
retort curry products.
Establishment of SHANGHAI HOUSE AJINOMOTO FOODS CO., LTD. strengthens theCompany’s position in China.
– 7 –

Aggressively Generating Growth in Global Bulk Ingredients
Ajinomoto is a global leader in bulk ingredients, including
feed-use amino acids, monosodium glutamate (MSG),
nucleotides and pharmaceutical-use amino acids. Under the new
three-year management plan, we are focusing on re-orienting
and expanding existing plants and equipment to manufacture
the most profitable products with optimum efficiency. We are
also emphasizing efficiency gains in sales organizations.
• Expansion in the Growing Feed-Use Amino Acid MarketThe feed-use amino acid market is expected to grow strongly in
coming years, but the intense competition among manufacturers
makes cost competitiveness an essential factor in maintaining
market share. Ajinomoto bases its continuous efforts to reduce
costs on its superior fermentation and production technologies. As
a result, in 2001 we were successful in reducing production costs
of feed-grade Lysine to 43 percent of 1985 levels.
Feed-use Lysine is a 600,000-ton annual market of which
Ajinomoto currently holds a 35 percent share. We expect this
market to expand 7 to 8 percent annually to reach 800,000 tons
by 2005, and are investing to increase production capacity from
the current level of 200,000 tons to 300,000 tons annually by
fiscal 2005. Capacity expansion in the United States to increase
production from 40,000 tons to 50,000 tons annually was
completed in July 2002, while capacity expansion in Italy from
20,000 tons to 30,000 tons will be completed in January 2003.
Another program to increase production in Thailand from 30,000
tons to 50,000 tons will be completed in early 2003, rounding
out Ajinomoto’s ability to stably meet growing demand.
In the feed-use Threonine market, AJINOMOTO EUROLYSINE
S.A.S. currently has production capacity of 19,000 tons annually
and a market share of 60 percent. Completed in June 2002, our
new feed-grade Threonine plant at Ajinomoto Heartland, Inc. in
the United States is an integral part of our program of increasing
the Group’s total production capacity to 45,000 tons annually
and raising market share to 70 percent.
Feed-use Tryptophan, the newest addition to our feed-use
amino acid portfolio, is a rapidly growing market. With the goal
of building a 70 percent market share, we intend to raise
production to 1,500 tons annually by 2005.
• Growth in Core Products MSG and NucleotidesThe creator of the 1.5-million-ton MSG market, Ajinomoto
now holds a global market share of 30 percent with annual sales
of approximately 450,000 tons. Moreover, excluding the Chinese
market, Ajinomoto controls a 48 percent global market share.
Projecting annual market growth in the 3 percent range,
Ajinomoto is strengthening its operating base in this market by
China
ltaly
France
Japan
Brazil
U.S.A.
Thailand
Chuanhua Ajinomoto Co., Ltd.
AJINOMOTO BIOITALIA S.p.A.
AJINOMOTO EUROLYSINE S.A.S.
Ajinomoto Co., (Thailand) Ltd.
Ajinomoto Biolatina Indústria e Comércio Ltda.
Ajinomoto Heartland, Inc.
Ajinomoto Co., Inc.
Capacity Expansion to Meet Global Demand Growth in Core Markets
Moving to cost-competitively meet growth in
worldwide demand for nucleotides used in
seasonings, Ajinomoto is expanding capacity
by constructing a nucleotide plant in
Thailand. Existing capacity for feed-grade
Lysine is also being increased.
– 8 –

further integration for efficiency and even greater emphasis on
quality. In the closely related nucleotides market, Ajinomoto
holds a leading share and is working to complete a new plant in
Thailand by 2003 with annual production capacity of 3,000 tons.
• Realizing Additional Opportunities for ExpansionThe market for pharmaceutical-use amino acids is expanding
at about 3 percent annually. Ajinomoto manufactures 20
varieties at eight locations globally, and holds a leading market
share of 60 percent.
Ajinomoto has built a strong number two position in the
global aspartame sweetener market, with a share of 40 percent.
Supported by the creation of a strong European operating base
through acquisitions and consolidation, Ajinomoto is working to
take the number one position in this strategic business area.
Ajinomoto supplies aspartame to manufacturers in the beverage,
candy and other markets, and products containing aspartame
are available in more than 120 countries. Under the new three-
year management plan, Ajinomoto will continue to support this
business through cost-reduction and streamlining programs.
Pharmaceuticals Fit Ajinomoto’s Skills PortfolioThe pharmaceutical business is well suited to Ajinomoto’s
strengths in amino acid technology. We are emphasizing
amino-acid-related approaches to maintaining health, and
strengthening overall efforts in the areas of clinical nutrition,
gastrointestinal diseases and lifestyle-related diseases such as
diabetes.
Ajinomoto complements its own research and development
with alliances with leading companies in the pharmaceutical
business, including a marketing agreement with Novartis Pharma
AG covering the antidiabetic agent nateglinide. Ajinomoto also
cooperates with Novartis Consumer Health S.A., and in January
2002, concluded an exclusive license to manufacture and market
a leading critical care and immune system-enhancing nutrition
product, Impact, in Japan. Sales began in July 2002 following
studies to collect evidence of Impact’s ability to reduce risk of
infection and shorten hospital stays.
Joint development with Takeda Chemical Industries, Ltd. and
Aventis Pharma Ltd. has also yielded results. In January 2002,
both Takeda and Ajinomoto received approval from the Ministry
of Health, Labour and Welfare of Japan to manufacture
risedronate sodium hydrate, an osteoporosis treatment.
Ajinomoto supplies the product to Aventis Pharma for sale under
the brand name Actonel.
– 9 –
Tightly focused pharmaceutical research generates new opportunities for growth.
Ajinomoto is leveraging its strengths in amino acid
technology to develop a distinctive pharmaceutical
business, with a focus on post-genomic research to analyze
the functions of proteins linked to development of new
drugs. These activities both support the creation of new
products and make the Company an attractive alliance
partner for leading global pharmaceutical companies.

Continuous Improvement in Operating Profitability
The domestic food products market is mature and consumer
tastes and needs have become highly diverse, resulting in
heightened competition. Ajinomoto has therefore implemented a
comprehensive program to improve operating profitability in its
existing food products businesses with the goal of maintaining
leadership in its chosen market segments.
Maximizing the Benefits of Cost ReductionsAjinomoto’s ongoing program of reducing the cost of
nucleotides and amino acids has generated significant gains in
competitiveness in each of its global bulk ingredients businesses.
Moreover, the program has raised the competitiveness of retail
consumer brands, such as Hon-Dashi and Cook Do, that use
them as ingredients. Logistics has been another core focus in
reducing costs. Distribution companies work in conjunction to
consolidate shipments to obtain the maximum volume discounts,
and are using the same systems when advantageous to do so.
The highest levels of quality, however, are essential to
maintaining strong brands. Ajinomoto has therefore been careful
not to implement cost reductions that reduce quality. Moreover,
Ajinomoto will continue to invest to expand businesses in areas
where its technological strengths give it a strong competitive
advantage, and will use acquisitions and alliances when
favorable.
A Focused, Effective Presence in Seasonings and Foods
The consolidation of related domestic operations into the
Seasonings and Food Products Company will allow Ajinomoto to
build on the popularity and market share of its many number
one brands, which include AJI-NO-MOTO, Hon-Dashi, Cook Do
and Knorr soups. Enhanced synergy among seasoning and
processed food production and marketing operations in areas
such as gifts and institutional segments will be another
beneficial result of concentration. We also expect consolidation
to yield manufacturing efficiencies that will support the
competitiveness of our brands in the marketplace.
Externally, consistent and effective communication with
customers is critical to maintaining a solid position in the
seasonings and food markets we serve. Continuing corporate
advertising campaigns since the 1999 introduction of
Ajinomoto’s new logo and slogan are helping to reinforce a
consistent brand image among Group companies.
A Force in Frozen FoodsIn October 2000, Ajinomoto Fresh Foods Co., Ltd. and the
Company’s frozen food-related divisions were consolidated to
form Ajinomoto Frozen Foods Co., Inc., thus vertically integrating
all stages of frozen foods operations from development to
production and marketing. Frozen foods is a challenging market,
but Ajinomoto plans to reduce costs through several
management initiatives such as increasing overseas
procurement. As in the edible oils business discussed below, the
• Further reduce the cost structure of domestic food operations.
• Capture the full benefit of newly created economies of scale.
• Centralize and streamline corporate administration.
• Raise the strength of powerful Ajinomoto brands.
Strategic Overview: Hon-Dashi, a leading brand
in Japan for more than 30
years, remains the top
brand in its category and
has benefited strongly from
Ajinomoto’s success at
reinforcing communication
with consumers.
Shifting toward a High-Earnings Structure
New Benchmarks for Growth:
2
– 10 –

domestic frozen food market as a whole is consolidating, and
Ajinomoto is now prepared to emerge as one of its leaders.
Critical Mass in the Edible Oils BusinessThe Japanese market for edible oils is consolidating because
there are too many producers given the market size. This
understanding formed the rationale for the April 2002 formation
of a joint holding company by Ajinomoto Oil Mills Co., Inc. and
HONEN Corporation covering each company’s edible oils
business. In addition, Yoshihara Oil Mill, Ltd. will join the holding
company in April 2003, thus creating Japan’s largest producer of
cooking oil, with a 30 percent share of the domestic market. The
joint holding company will raise operating efficiency by
eliminating resource duplication in production, logistics and
sales, and will reduce personnel by approximately 20 percent.
Production lines will be reoriented to specific products to raise
operating rates and economies of scale.
Organizational Changes Strengthen ProfitabilitySelection and concentration of administrative functions are
also supporting improved earnings throughout the Ajinomoto
Group. Accounting systems have been unified through the Group
information system and centralized at the Accounting Service
Center in Kawasaki, Japan. A corporate function, Ajinomoto’s
accounting activities undergo a continuous improvement process
to ensure proper financial controls throughout the Group as
operations evolve. In addition, the implementation of an
enterprise resource planning (ERP) system is under
consideration. Ajinomoto is also serving shareholder interests by
further strengthening its ability to ensure regulatory compliance.
Treasury management is another area in which corporate
management will maintain control over Group functions for
greater efficiency and clarity. Ajinomoto Treasury Management,
Inc. was established in July 2000 to make best use of the parent
company’s financial strength in support of subsidiaries and
affiliates. Internal loans and cash pooling are key areas of focus,
and foreign exchange control is being added in support of
Ajinomoto’s drive to expand internationally. A new treasury
management system that improves financial risk management
worldwide is now being developed.
STRATEGIES IN ACTION
The agreement to integrate the edible oils operations of Ajinomoto
and HONEN Corporation will help the two companies counter the
maturity of the Japanese market while strengthening product
development, streamlining production and distribution, and enhancing
sales capabilities.
HONEN AJINOMOTO OIL MILLS, INC. supportsexpansion in the edible oils market.
Greater administrative efficiency supportscost competitiveness.
The Personnel Affairs Service Center, created in July
2001, unifies salary administration, employee training,
and personnel system administration for the Ajinomoto
Group. Representative of the success of Ajinomoto’s
strategic focus on concentrating and streamlining
operations, the Center is contributing to reduced costs
and heightened efficiency.
– 11 –

Internal Company System Will Support PerformanceAlong with the introduction of an internal company system in
April 2002, the Company organization underwent a transition to a
structure comprising three internal companies, one company that
has been spun off, four business tie-ups, subsidiaries and affiliates
and the Corporate Division. This new structure will vertically
integrate R&D, production, marketing and sales resources by
business to enhance efficiency and focus, giving each business the
tools it will need to succeed. At the same time, vertical integration
is expected to improve accountability and support Ajinomoto’s
drive to increase return on equity.
Ajinomoto’s new organization will have a strongly beneficial
effect on returns on capital. Each company will have responsibility
for its financial performance, with the result that each company
will have a clearly defined interest in managing its capital
effectively. The Corporate Division will be available to support the
operations of each company, but will bill for services rendered.
Thus each company will carefully consider its requirements for
support services, while the Corporate Division will be required to
provide services of the highest levels of quality and effectiveness.
The result will be elimination of duplicated effort and decreased
costs. In April 2003, the Corporate Division is scheduled to
undergo an additional reorganization to reduce personnel and
further clarify its support roles.
Strong Corporate GovernanceAjinomoto’s internal company system has been designed to
achieve a good balance between operating independence and
central control of issues that are fundamental to sound corporate
governance. Strategic brand building will remain a primary
corporate responsibility, while each internal company will take
responsibility for brand strategies for its own products. Managing
return on equity (ROE) will be a corporate responsibility, while
internal companies will be responsible for increasing the efficiency
with which they deploy assets as measured by return on assets,
which will in turn improve Group ROE.
Accelerated decisions and greater managerial accountability
are essential to the success of the internal company system. In
response to changes in the Commercial Code of Japan, Ajinomoto
is evaluating the most appropriate structure for its board of
directors. The Company is also evaluating measures to reinforce its
corporate auditor system.
• Manage R&D, production, marketing and sales vertically under an internal company system.
• Speed decision-making and responsiveness by clarifying responsibility and authority.
• Balance operating independence and central control.
Strategic Overview:
Introduction of an Internal Company System
Strengthening Corporate Governance
New Benchmarks for Growth:
3
– 12 –

STRATEGIES IN ACTION
– 13 –
Management seminar series providesopportunities for professional development.
In September 2001, the fifth annual Ajinomoto
International Management Seminar (AIMS) was held in
Tokyo. AIMS gives in-market management personnel the
opportunity to accelerate understanding of Ajinomoto and
its business strategies, and the chance to network with
Ajinomoto managers from around the world.
Ajinomoto requires employees who are able to succeed
internationally if the Group is to meet its performance
objectives. We have therefore implemented a new personnel
system designed to move away from the conventional Japanese
seniority-based system toward a greater emphasis on
performance. We believe that this approach will permit
Ajinomoto to attract new, mid-career employees with desirable
experience and skill sets, while also allowing us to better match
skills to responsibilities in allocating assignments and in
implementing performance-based compensation systems.
Training is critical to the success of the new system, and to
our global competitiveness. We need to support our
performance-based system by giving people the tools they need,
and are therefore planning to create a dedicated training center
that will cover Group employees in Japan and overseas.
We also intend to increase representation of non-Japanese
personnel in management positions. We believe that diversifying
our management ranks further will enhance our ability to
compete globally.
• Emphasize performance over seniority in assignments and compensation.
• Use training to give employees skills necessary for global success.
• Diversify management to enhance global competitiveness.
Strategic Overview:
Nurturing Personnel Capable of Working in the Global Arena
New Benchmarks for Growth:
4

We are aware that what customers and stakeholders expect
most from a food company is a reliable brand that they can trust.
In order to strengthen its corporate governance and continue to
fulfill its social responsibilities, Ajinomoto works to further improve
quality assurance and deals proactively with environmental
problems. Measures include Groupwide product quality and
environmental audits. By publicizing its corporate stance and
philosophy and contributing to society, Ajinomoto strives to
promote better communication while enhancing its transparency
and credibility with the public.
Comprehensive Implementation of GroupwideQuality Assurance
As consumer concerns about food companies rise to greater
levels than ever before, quality assurance (QA) must be conducted
on a global level for Ajinomoto to be a truly global company. The
Ajinomoto System of Quality Assurance (ASQUA), based on the
concepts outlined in the ISO standards, specifies the quality
standards that all Group companies must follow, and their proper
implementation will be constantly monitored by corporate
management. These initiatives have been codified in the
Ajinomoto Group Quality Policies established in October 2000.
Under the new three-year management plan, these standards
and policies will be thoroughly implemented throughout the
Ajinomoto Group to further strengthen product quality assurance.
Specific targets and plans for achieving them will be decided at
regular meetings of top management and managers directly
responsible for QA. In addition, the Corporate Division will carry
out annual product quality audits at all parts of the organization
involved with QA. QA targets will be set for pharmaceuticals and
amino acids, with the aim of compliance with good manufacturing
practice (GMP) standards at all Group production bases by the end
of March 2004.
Ajinomoto strives at all times to ensure a world-class level of
QA in keeping with its aim of being a global corporation in food
and amino acid products, with its beginnings in Japan.
Reconciling Environmental Preservation andCorporate Growth
Under the current three-year management plan, the Ajinomoto
Group’s environmental management system will be restructured to
adapt to the new internal company system, so that every business
area is involved in environmental preservation efforts. Measures
will include strengthening environmental audits and
environmental impact evaluations/assessments. Specifically, we
have set the goal of obtaining ISO 14001 accreditation for the
environmental management systems of approximately 70 major
operating sites of the Ajinomoto Group worldwide by March
2005, including the Company’s head office in fiscal 2002. As of
April 1, 2002, twelve of the Group’s facilities in Japan and
overseas had obtained ISO 14001 accreditation.
Operating in Harmony with Society as aGood Corporate Citizen
New Benchmarks for Growth:
5• Broaden the scope of global corporate citizenship.
• Ensure the highest levels of quality and safety.
• Continually improve sound environmental performance.
• Promote our social responsibility activities principally in the areas of food and health.
Strategic Overview:
Ajinomoto sponsors a program in
Cambodia, implemented by the
nonprofit Japan International Volunteer
Center (JVC), that helps people with
their household gardens in order to add
vegetables and calories to their diet,
therefore supporting both better
nutrition and self-reliance.
– 14 –

– 15 –
In addition to strict, full compliance with all regulatory
requirements, Ajinomoto has established its own voluntary
standards for environmental activities. For example, the Company’s
self-imposed limit for dioxin emissions is one-tenth of the amount
allowed by law in Japan.
The Ajinomoto Group is also dealing with issues such as
conserving energy, using resources more effectively, preventing
global warming, further reducing waste generation and disposal,
and promoting effective utilization of by-products and wastes.
Efforts in these areas at four of Ajinomoto’s plants in Japan have
resulted in reduction of unit energy consumption by 22 percent
and reduction of CO2 emissions by 14 percent, both compared to
fiscal 1990 levels. In addition, the entire Ajinomoto Group in
Japan has achieved a zero emissions* achievement ratio of 88
percent and a resource recovery ratio of 82 percent.
Through these initiatives, the Ajinomoto Group aims to realize
its corporate philosophy, “to contribute to significant advances in
food and health on a global basis and ultimately to create a better
life for all,” and to achieve sustainable development that
reconciles environmental preservation and corporate growth.
Promotion of Improved Communications withSociety as a Whole
As a company that is integrally involved with food and health,
Ajinomoto has always placed strong emphasis on open
communication with society and sound corporate citizenship. We
intend to further deepen this commitment under the new
management plan by heightening public awareness of our position
and corporate philosophy.
Ajinomoto believes that its policies centered on sound
regulatory compliance, transparency, health, safety and
environmental preservation are sincere and beneficial forms of
corporate citizenship that serve as concrete evidence of our
commitment to society.
As one specific example of the Company’s corporate citizenship
activities, Ajinomoto published its second annual report on the
Ajinomoto Group’s environmental activities in autumn 2001. The
report can also be accessed from the Company’s homepage for
easy reference. The scope of the report was widened and
deepened to offer more detailed coverage.
In Japan, Ajinomoto has been cooperating with the Future
Homemakers of Japan (FHJ) since 1975 in sponsoring the FHJ-
Ajinomoto Home Project Contest for essays covering culture- and
diet-related themes. The Ajinomoto Foundation for Dietary Culture
supports research and disseminates a broad array of dietary
information. Ajinomoto also participates in a service that delivers
meals to senior citizens.
Overseas, the activities of the Thai Ajinomoto Foundation have
included donations to elementary schools to cover rebuilding
expenses, and support for gifts of artificial limbs for the needy. In
Indonesia, Ajinomoto’s activities have included scholarships for
graduate students at each of Indonesia’s 23 universities. In Brazil,
the Instituto Assistencial Ajinomoto (IAA) donates medical
equipment and carrier vehicles to local medical organizations.
Social contributions in Peru have included gifts to cover new
school construction. In the Philippines, Ajinomoto provides joint
support with the Japanese Organization for International
Cooperation in Family Planning (JOICFP) for a project administered
by Batangas Province to improve reproductive health and
nutritional status at the household level.
Ajinomoto supports FHJ group visit to New Zealand.
A long-time sponsor of the Future Homemakers of Japan,
Ajinomoto also supported the opportunity for members
to travel to New Zealand in 2001. A group took part in an
international exchange program with high school
students there, to expand their horizons.
*Zero emissions: To eliminate the outsourcing of waste disposal to an external waste-processing dealer.

SEASONINGSSTRENGTHS:• Leading brand in the household and commercial markets in thecategories of umami seasonings and seasoning mixes for Japanese andChinese dishes. • Solidifying leadership in the area of liquid Japanese seasonings for thecommercial market.
EDIBLE OILS
PROCESSED FOODS
FROZEN FOODSSTRENGTHS:• Household market: Top brand for Chinese dishes such as dumplings,chicken products, pilaf and gratin products. Many long-selling productsthat have earned market support and customer trust. • Commercial market: Top brand for homestyle vegetable dishes, inaddition to core Chinese dumplings and rice dishes. Rapidly expandingsales in the growing market for chicken products. Support fromcommercial users for high-quality ingredients and superior productiontechniques established by analyzing chefs’ skills.
BEVERAGES AND DAIRY PRODUCTSOVERVIEW:
Ajinomoto’s beverages and dairy product operations comprise Ajinomoto General Foods, Inc., whichoperates the coffee segment; Calpis Co., Ltd., which is responsible for the beverage business; and CalpisAjinomoto Danone Co., Ltd., which handles dairy products. In each field, Ajinomoto pursues strongbrand power and product development capabilities through a global network of alliances.
INTERNATIONAL OPERATIONSOVERVIEW:
Ajinomoto’s international operations began more than 90 years ago, shortly after the Company’sfoundation, with the start of sales of AJI-NO-MOTO. AJI-NO-MOTO is now sold in more than 100countries worldwide and is the leading brand in its category in most of those markets. Ajinomoto tailorsproduct development to specific market tastes, and has developed solid positions in the seasoning mixmarkets in Thailand, Indonesia and Brazil. Ajinomoto has also been developing operations in the areasof instant noodles in Brazil, Thailand and Poland; frozen foods in North America; beverages in Thailandand Indonesia; and processed foods through joint ventures in six Southeast Asian countries and regions.
STRENGTHS:• Number one brand identity in the global monosodium glutamatemarket.• Experience in localizing management, sales and product development.• Reputation for product quality and reliability.
Food Products
Ajinomoto at a Glance
OVERVIEW:In the 93 years since its establishment, Ajinomoto’s seasonings business has grown from AJI-NO-
MOTO (monosodium glutamate), the world’s first umami seasoning, to encompass core products such asbasic seasonings Hi-Me, Aji-Shio and Seto no Honjio, the Hon-Dashi series of Japanese seasoning mixes,and retort pouch products such as Cook Do and Gohan Ga Susumu Kun. These brands are well known fortheir safety and reliability. Ajinomoto responds to diverse consumer needs through proactive productdevelopment, and continues its emphasis on the restaurant market.
OVERVIEW:In April 2001, Ajinomoto’s edible oil operations were spun off and consolidated into Ajinomoto Oil
Mills Co., Inc. To establish a solid presence in the cooking oil industry and strengthen the competitivenessof its operations, the company’s management was integrated with HONEN Corporation in April 2002through a joint stock holding company, HONEN AJINOMOTO OIL MILLS, INC. Moreover, a strategic alliancewas formed between HONEN AJINOMOTO OIL MILLS, INC. and Yoshihara Oil Mill, Ltd.
STRENGTHS:• Household market: Kenko Sarara extremely well received for ability toblock absorption of cholesterol, became first product from an edible oilmanufacturer to be certified as Food for Specified Health Use.• Commercial market: Support for developing products with quality andfunctions required by commercial market. Acclaimed for innovative newideas.
OVERVIEW:Ajinomoto’s processed food business encompasses soups, consommé and mayonnaise. The Knorr
brand has led the Japanese soup market since its introduction 39 years ago. Popular products includebreakfast favorite Knorr Cup Soup. Ajinomoto kk Consommé has occupied an important position inJapanese households for 40 years, not only as an essential ingredient in homemade soups, but also as aseasoning for a variety of dishes. In the mayonnaise segment, core product Pure Select Mayonnaise iscomplemented by healthy, low-calorie Pure Select Half. In the commercial market, Ajinomoto is expandingits product lineup of soups, mayonnaise, high-quality sauces and dressings, while entering new categories.
STRENGTHS:• Household market: Working to enhance core product values of goodtaste and nutrition and communicate these qualities to customers.Market-leading Knorr soups have strong brand power. Mayonnaiseproducts clearly differentiated by their high quality. Key ingredientsmanufactured by Ajinomoto Group members. • Commercial market: Products differentiated on the basis of theiringredients. Product development system makes use of Knorr brand assetsand an expanded global network. Organized to provide products quicklyand reliably to commercial users.
OVERVIEW:Ajinomoto Frozen Foods Co., Inc., created in October 2000 through the consolidation of Ajinomoto
Fresh Foods Co., Ltd. with Ajinomoto’s frozen food-related divisions, is a full-function company thatencompasses product development, production and marketing. In the year and a half since itsestablishment, Ajinomoto Frozen Foods has made substantial progress toward its objectives of improvingthe speed of management decision-making and product development while strengthening costcompetitiveness. In addition, the company is developing its global operations at its five overseasproduction bases – two in Thailand, two in China and one in the U.S. – from which it supplies high-qualityand economical products using carefully selected ingredients.
2002 marks the 30th anniversary of the start of Ajinomoto’s frozen food operations. The Companyremains committed to earning the trust of consumers by continuing to emphasize product quality andreliability along with great taste.
STRENGTHS:• Ajinomoto General Foods, Inc.: Brand power and technology of KraftFoods, Inc.• Calpis Co., Ltd.: More than eighty years of experience in the market;proprietary milk fermentation technology; products that are delicious,healthy, reliable and economical.• Calpis Ajinomoto Danone Co., Ltd.: Brand power and technology of theDanone Group.
– 16 –

AMINOSCIENCEOVERVIEW:
Focusing on amino acid-based products, the AminoScience business helps realize Ajinomoto’sfundamental philosophy of contributing to better food, health and lifestyles. The businesscomprises the fields of amino acids, specialty chemicals, sweeteners, pharmaceutical intermediatesand functional nutritional foods.
STRENGTHS:• Original technology and cost competitiveness.
Amino Acids: Ability to provide a stable supply of high-qualityamino acids and diversified technology for their use.
Specialty Chemicals: Cosmetic and toiletry ingredients: Materials that are highlyfriendly to both human skin and the environment; excellentproduct reputation.Electrochemicals: World’s first film-type insulation material.
Sweeteners: Two aspartame production bases, in Japan andEurope; global cost competitiveness and superior quality.
Pharmaceutical Intermediates: Extensive product lineup andindustry-leading capabilities in process research and development.
Functional Nutritional Foods: Product development with afirm scientific base.
PHARMACEUTICALSSTRENGTHS:• Unique technology as the world’s leading manufacturer of amino acidproducts.• Superior strategy-building capabilities in areas of core competence.
FEED-USE AMINO ACIDSOVERVIEW:
Since 1960, amino acids have been added to swine and poultry feed as a means of improvinggrowth. These amino acids also reduce the cost and increase the efficiency of feed, while helpingto save valuable natural protein resources and prevent livestock waste pollution. Ajinomotocommenced production of feed-grade Lysine in 1965.
Today, feed-use amino acids are a core business for Ajinomoto, which has become an industryleader with its global production and supply network. Ajinomoto’s share of the 600,000-ton globalmarket for feed-use Lysine is 35 percent. In addition, the Company supplies more than 60 percentof the rapidly growing market for feed-use Threonine, currently estimated at 33,000 tons per year.Ajinomoto is developing the market for feed-use Tryptophan as the third pillar of its feed-useamino acid product lineup, and has already gained a market share of more than 60 percent. Insummer 2000, production of feed-grade Tryptophan was transferred to a manufacturing facility inEurope and production capacity has been increased.
STRENGTHS:• Ajinomoto’s emphasis on the development of amino acid fermentationtechnology is the fundamental strength to support its leadership in theindustry.• Six production facilities worldwide (France, Italy, U.S., Thailand, Chinaand Brazil), operating globally as the AJINOMOTO ANIMAL NUTRITIONgroup.
Fine Chemicals
Amino Acids: Amino acids are used as ingredients for pharmaceuticals in the area ofclinical nutrition, including infusions and enteral formulas. They are also used in foodproducts such as supplements and flavorings, as well as cosmetics and pharmaceuticalintermediates. Two key features of the amino acid business are its applications in diverseindustries and its global scale. As the world’s largest manufacturer of amino acids,Ajinomoto produces primarily the 20 basic amino acids in bulk at eight locations in Japanand overseas, and sells them all over the world. Ajinomoto also works to expand themarket through activities such as research on the usefulness of amino acids anddevelopment of new materials and applications.
Specialty Chemicals: Ajinomoto develops amino acid-based cosmetic ingredients thatare comfortable for human skin as well as environmentally friendly functional chemicalsand electrochemicals.
Sweeteners: Changing diets and greater health-consciousness among consumers havehelped to expand the market for amino acid-based sweetener aspartame worldwide.
Pharmaceutical Intermediates: Ajinomoto manufactures and supplies amino acid andnucleotide derivatives for use as intermediates in pharmaceuticals such as antiviral agents.Together with Belgian subsidiary S.A. OmniChem N.V., which has developed a specializedmanufacturing process based on synthesis technology and possesses facilities equipped tohandle difficult or sensitive chemical reactions, Ajinomoto engages in joint projects tomanufacture optically active compounds for pharmaceutical intermediates.
Functional Nutritional Foods: Ajinomoto has expanded sales of the Amino Vital series,a line of nutritional supplements incorporating the physiological properties of amino acids,by actively introducing new products and promoting the benefits of amino acids to a widegroup of people, from professional athletes to everyday consumers.
OVERVIEW:The Pharmaceuticals Business has repositioned its strategy to focus primarily on clinical
nutrition and gastrointestinal and lifestyle-related diseases. Ajinomoto’s tripolar R&D network inJapan, the United States and Europe works to create innovative drugs for the global market aswell as clinical nutrition and gastrointestinal drugs for the Japanese market. The antidiabeticagent nateglinide, launched in Japan in 1999, became available in the U.S. and many Europeancountries during 2001, and has been favorably received. In the clinical nutrition segment, byemploying the concept of “Total Nutrition Care,” Ajinomoto has gained a high market share forproducts that employ amino acid technology, such as infusions, enteral nutrition products, anddrugs for hepatic and renal diseases.
– 17 –

– 18 –
Ajinomoto Co., Inc. and Consolidated SubsidiariesYears ended March 31, 2002 and 2001
Thousands of PercentMillions of yen U.S. dollars change
2002 2001 2002 2002/2001
Business Segments Net Sales
Food Products............................................................................. ¥636,201 ¥622,001 $4,783,466 2.3%Fine Chemicals ........................................................................... 215,708 188,421 1,621,865 14.5Other Businesses ........................................................................ 91,629 98,106 688,940 (6.6)
Operating IncomeFood Products............................................................................. ¥ 21,485 ¥ 23,629 $ 161,541 (9.1)%Fine Chemicals ........................................................................... 22,491 10,998 169,105 104.5Other Businesses ........................................................................ 4,827 3,405 36,293 41.8Eliminations ................................................................................ 210 (227) 1,579 N.A.
Geographical SegmentsNet Sales
Japan ......................................................................................... ¥716,774 ¥716,294 $5,389,278 0.1%Asia ............................................................................................ 87,836 70,527 660,421 24.5Americas .................................................................................... 56,598 50,224 425,549 12.7Europe ........................................................................................ 82,329 71,482 619,015 15.2
Operating IncomeJapan ......................................................................................... ¥ 26,606 ¥ 25,096 $ 200,045 6.0%Asia ............................................................................................ 11,209 8,822 84,278 27.1Americas .................................................................................... 3,077 1,252 23,135 145.8Europe ........................................................................................ 8,120 2,634 61,053 208.3
Note: U.S. dollar amounts represent translations of yen, for convenience only, at ¥133=US$1, the approximate rate prevailing on March 31, 2002.
Composition of Net Sales by Business(Year ended March 31, 2002)
Composition of Net Sales by Region(Year ended March 31, 2002)
Net Sales (left)/Operating Income (right)(Years ended March 31) (Millions of yen)
Food Products 67.4%Fine Chemicals 22.9%
Other Businesses 9.7%
Japan 76.0%Asia 9.3%
Americas 6.0%Europe 8.7%
Food ProductsFine ChemicalsOther Businesses
0
200,000
400,000
600,000
800,000
1,000,000
0
20,000
40,000
60,000
80,000
100,000
1998 1999 2000 2001 2002
Review of Operations

Fiscal 2001 Highlights
Food ProductsFood Products sales increased 2.3 percent year-on-year to ¥636.2 billion, while operating income fell to
¥21.5 billion. Programs to improve group management, consolidate subsidiaries for greater efficiency
and heighten responsiveness to market needs supported sales and enabled Ajinomoto to maintain its
market position during a difficult year.
MAIN PRODUCTS● AJI-NO-MOTO
● Umami Dashi Hi-Me
● Hon-Dashi Katsuodashi
● Hon-Dashi Katsuo Kiwami
● Hon-Dashi Udon Oden Dashi
● Cook Do series
● Chuka Aji
● Seto no Honjio
● Ajinomoto kk Marutori shiyo Garasoup
● Cook Do Oyster Sauce
● Cook Do Tobanjan
● Cook Do Korea!
● Gohan Ga Susumu Kun
– 19 –
➔ Strategic Initiatives and Results Sales in the household market remained strong during fiscal 2001. In particular, the popularity of
Cook Do Korea!, a seasoning mix for Korean dishes, resulted in higher revenues from the Cook Doline. Cook Do also benefited from the success of a new ad campaign based on the concept of enjoying
Chinese dishes at home, as well as an expanded lineup. These gains helped to offset lower sales of
Hon-Dashi due to declining retail prices, although prices began to stabilize during the fiscal year. In
addition, Ajinomoto expanded its presence in the field of powdered Japanese seasonings for specific
dishes with the introduction of Umai Chanko no Tsukurikata Oshiemasu, a seasoning mix for hot pot.
Sales also rose in the commercial market. Although sales of AJI-NO-MOTO and Umami Dashi Hi-Me to restaurants were lower compared to the previous fiscal year, overall sales grew, driven by
substantial growth in sales of liquid Japanese seasonings for restaurant use, an increase in domestic
sales volume of nucleotide seasonings, and growth in sales of savory seasoning products to major
customers.
➔ ➔ OutlookDuring fiscal 2002, Ajinomoto will implement its Strong No. 1 Strategy in the seasoning mixes
category, expand into the field of powdered Japanese seasonings for specific dishes, and enhance
promotional and advertising activities designed to promote the delicious taste of home cooking.
Ajinomoto will work to achieve new growth by strengthening existing operations and expanding into
new fields, particularly Chinese and Korean seasonings.
Building Product Loyalty in Families with Young ChildrenSince its launch in 1999, Gohan Ga Susumu Kun has been popular for the cute and playful
cartoon character Susumu-kun, who appears on the product package and in advertisements. The
character particularly appeals to families with young children, who are the target audience of
this product. Ajinomoto will continue to offer delicious, easy-to-cook rice dishes using the
familiar ingredients that children love.
SEASONINGS

Fiscal 2001 Highlights
Expanding into the Snack Foods MarketIn fall 2001, Ajinomoto expanded further into the area of snack foods with the launch of
Knorr Soup Pasta in Tokyo and the surrounding Kanto area. The area of availability was
thereafter expanded to include Osaka and Nagoya, with a full nationwide launch in February
2002. Available in tomato and cream of mushroom flavors, the brand is being built around such
new occasions for enjoying soup as an afternoon or late-night snack, in addition to light lunch as
the main occasion, and is already the sales leader in the convenience store soup category.
– 20 –
➔ Strategic Initiatives and Results Sales rose somewhat during the first few months of the fiscal year but declined during the second
half due to factors such as the weaker yen and escalating prices in the rapeseed market. In addition,
stronger demand for soybean meal was offset by increased imports from China, keeping prices low.
Market conditions prevented prices from rising, so that the high cost of production was not reflected
in oil prices, making fiscal 2001 an extremely difficult year throughout the industry.
Kenko Sarara has been certified by the Ministry of Health, Labour and Welfare as a Food for
Specified Health Use. Products with this certification clearly marked on the label were introduced in
February 2002, adding to Kenko Sarara’s competitive edge in the healthy cooking oil market.
➔ ➔ OutlookIn April 2002, Ajinomoto Oil Mills Co., Inc. and HONEN Corporation established and integrated
their management through HONEN AJINOMOTO OIL MILLS, INC., a joint stock holding company. In
addition, a strategic alliance with Yoshihara Oil Mill, Ltd. is aimed toward a management integration
in April 2003. The three companies and their affiliates will work together to increase production
efficiency, quickly establish a distribution network and implement substantial cost reductions under
the current sales structure, with the aim of spurring market growth.
➔ Strategic Initiatives and Results Building on the core product values of good taste and nutrition, Ajinomoto worked to strengthen
brand equity and enhance marketing activities in order to increase demand, while actively launching
new products in the snack category. As a result, sales of soup products grew steadily. Sales of
mayonnaise products were largely flat, but sales of consommé fell due to the outbreak of bovine
spongiform encephalopathy (BSE). Consequently, overall sales in the processed foods business
remained the same as the previous year.
➔ ➔ OutlookDuring fiscal 2002, Ajinomoto will work to enhance brand value throughout its operations and
establish strong number-one or number-two products. In addition, Ajinomoto aims to achieve growth
by expanding the new Knorr Soup Pasta line, and strengthen profitability by improving cost
competitiveness.
MAIN PRODUCTS● Corn Germ Oil
● Safflower Oil
● Pure Light Oil
● Kenko Sarara
● Kenko Canola E
● Canola Oil(standing pouch)
● Salad Oil(standing pouch)
● Olive Oil
● Olive Oil Extra Virgin
● Gomaaburazukino Goma Abura (sesame oil)
MAIN PRODUCTS● Knorr Cup Soup
● Knorr Cup Soup Shin Yasai no Potage series
● Knorr Hokkaido TororiPotage series
● Knorr Funwari Tamago Soup
● Knorr Soup Do
● Knorr Soup Pasta
● Ajinomoto kk Consommé
● Knorr Chicken Consommé
● Pure Select Mayonnaise
● Pure Select Half
● Korezero mayonnaise type
● Pure Select Super LowCalorie 70% Cut
● Pasta Do
● Okayusan
● Kellogg’s Bran Flakes
● Kellogg’s Corn Flakes
PROCESSED FOODS
EDIBLE OILS
Fiscal 2001 Highlights
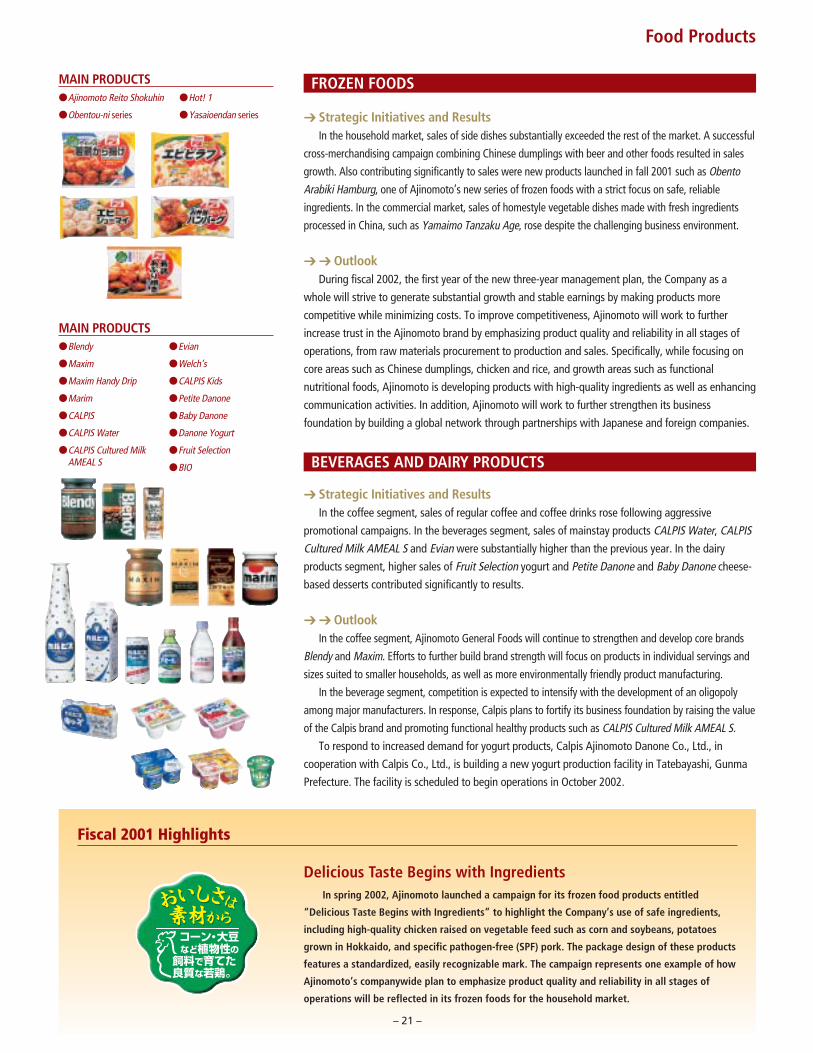
Delicious Taste Begins with IngredientsIn spring 2002, Ajinomoto launched a campaign for its frozen food products entitled
“Delicious Taste Begins with Ingredients” to highlight the Company’s use of safe ingredients,
including high-quality chicken raised on vegetable feed such as corn and soybeans, potatoes
grown in Hokkaido, and specific pathogen-free (SPF) pork. The package design of these products
features a standardized, easily recognizable mark. The campaign represents one example of how
Ajinomoto’s companywide plan to emphasize product quality and reliability in all stages of
operations will be reflected in its frozen foods for the household market.
➔ Strategic Initiatives and Results In the household market, sales of side dishes substantially exceeded the rest of the market. A successful
cross-merchandising campaign combining Chinese dumplings with beer and other foods resulted in sales
growth. Also contributing significantly to sales were new products launched in fall 2001 such as ObentoArabiki Hamburg, one of Ajinomoto’s new series of frozen foods with a strict focus on safe, reliable
ingredients. In the commercial market, sales of homestyle vegetable dishes made with fresh ingredients
processed in China, such as Yamaimo Tanzaku Age, rose despite the challenging business environment.
➔ ➔ OutlookDuring fiscal 2002, the first year of the new three-year management plan, the Company as a
whole will strive to generate substantial growth and stable earnings by making products more
competitive while minimizing costs. To improve competitiveness, Ajinomoto will work to further
increase trust in the Ajinomoto brand by emphasizing product quality and reliability in all stages of
operations, from raw materials procurement to production and sales. Specifically, while focusing on
core areas such as Chinese dumplings, chicken and rice, and growth areas such as functional
nutritional foods, Ajinomoto is developing products with high-quality ingredients as well as enhancing
communication activities. In addition, Ajinomoto will work to further strengthen its business
foundation by building a global network through partnerships with Japanese and foreign companies.
➔ Strategic Initiatives and Results In the coffee segment, sales of regular coffee and coffee drinks rose following aggressive
promotional campaigns. In the beverages segment, sales of mainstay products CALPIS Water, CALPISCultured Milk AMEAL S and Evian were substantially higher than the previous year. In the dairy
products segment, higher sales of Fruit Selection yogurt and Petite Danone and Baby Danone cheese-
based desserts contributed significantly to results.
➔ ➔ OutlookIn the coffee segment, Ajinomoto General Foods will continue to strengthen and develop core brands
Blendy and Maxim. Efforts to further build brand strength will focus on products in individual servings and
sizes suited to smaller households, as well as more environmentally friendly product manufacturing.
In the beverage segment, competition is expected to intensify with the development of an oligopoly
among major manufacturers. In response, Calpis plans to fortify its business foundation by raising the value
of the Calpis brand and promoting functional healthy products such as CALPIS Cultured Milk AMEAL S.To respond to increased demand for yogurt products, Calpis Ajinomoto Danone Co., Ltd., in
cooperation with Calpis Co., Ltd., is building a new yogurt production facility in Tatebayashi, Gunma
Prefecture. The facility is scheduled to begin operations in October 2002.
MAIN PRODUCTS● Ajinomoto Reito Shokuhin ● Hot! 1
● Obentou-ni series ● Yasaioendan series
MAIN PRODUCTS● Blendy
● Maxim
● Maxim Handy Drip
● Marim
● CALPIS
● CALPIS Water
● CALPIS Cultured MilkAMEAL S
● Evian
● Welch’s
● CALPIS Kids
● Petite Danone
● Baby Danone
● Danone Yogurt
● Fruit Selection
● BIO
Food Products
– 21 –
FROZEN FOODS
BEVERAGES AND DAIRY PRODUCTS

Food Products
ASIAIn Asia, Ajinomoto’s primary market for food products outside Japan, Ajinomoto markets
seasonings (including AJI-NO-MOTO), instant noodles and beverages, as well as processed foods
through joint ventures with Unilever Bestfoods. In fiscal 2001, mainstay brands AJI-NO-MOTO, RosDee, Masako and Birdy all recorded growth in sales. Ajinomoto is aiming to expand sales of other
product lines with stronger marketing strategies in addition to product renewals and variations.
In October 2001, Ajinomoto and House Foods Corporation established the joint venture
SHANGHAI HOUSE AJINOMOTO FOODS CO., LTD. to manufacture curry-based foods in retort
pouches. Ajinomoto aims to be one of the first companies to introduce the most up-to-date processed
foods from Japan to China’s rapidly expanding processed food market by building a local
manufacturing plant.
Throughout the high-potential Asian region, core themes for fiscal 2002 will be promoting
development and sales of new products in the areas of seasonings, instant noodles, beverages and
processed foods, as well as expansion into new markets.
THE AMERICASIn North America, sales of frozen foods at Ajinomoto Frozen Foods U.S.A., Inc. continued to grow,
although the terrorist attacks in September and the subsequent economic downturn had a negative
impact on total food sales in the region. In South America, new seasonings were launched in Brazil
and Peru. In addition, sales were strong in Brazil’s steadily expanding market for instant noodles.
During fiscal 2002, Ajinomoto plans to continue building the frozen foods business in North America
and the seasonings and instant noodle businesses in South America.
EUROPE AND AFRICA In Europe, new instant noodle products were launched in Poland during the second half of fiscal
2001. In Africa, sales of umami seasonings rose significantly, primarily in West Africa. During fiscal
2002, Ajinomoto plans to continue building the instant noodles and seasonings businesses in Europe
and the seasonings business in Africa, particularly West Africa.
MAIN PRODUCTS● AJI-NO-MOTO
● Ros Dee (Thailand)
● Sazon (Brazil)
● Masako (Indonesia)
● Birdy (Thailand)
Fiscal 2001 Highlights
Ajinomoto’s First Overseas Plant for NucleotidesNucleotides, when combined with monosodium glutamate (MSG), produce a synergistic effect
that results in a rich umami flavor. Demand for nucleotides has increased rapidly in recent years
in tandem with the expanding processed food market, and continued stable growth is expected.
Although Ajinomoto already maintains the leading share of the global markets for both
nucleotides and MSG, in order to strengthen cost competitiveness and meet increasing global
demand, a manufacturing plant for nucleotides is under construction in Thailand. Ajinomoto will
invest ¥6 billion and install its state-of-the-art technology in the plant, which will be its first
production facility for nucleotides outside Japan. Completion is scheduled for mid-2003.
– 22 –
INTERNATIONAL OPERATIONS

Fiscal 2001 Highlights
New Flavors Add Value to Slim-Up SugarIn February 2002, Ajinomoto launched flavored versions of Slim-Up Sugar in Japan. The
three new flavors – caramel, café mocha and Irish cream – are an ideal match for the popular
flavored coffee drinks sold at gourmet coffee shops. The explosive popularity of gourmet coffee
shops in Japan has created a new market for flavored coffees, and the new versions of Slim-Up
Sugar allow consumers to enjoy their delicious flavors at home.
Amino Acids➔ Strategic Initiatives and Results
Although measures to reduce medical care costs continued around the world, sales of
pharmaceutical-use amino acids during fiscal 2001 remained strong due to the continued
implementation of sales strategies based on market trends such as the impact of the bovine
spongiform encephalopathy (BSE) outbreak. While working to increase public perception about the
benefits of amino acids, Ajinomoto is actively expanding sales in the areas of food and beverages.
➔ ➔ OutlookResearch breakthroughs such as genomic drug creation are likely to bring about major changes in
the pharmaceutical and biotechnology industries. Growth can therefore be expected in applications
for amino acids as a culture medium or as a nutrient. Food applications are another area with
excellent growth potential, supported by increasing recognition of the health and nutritional benefits
of amino acids. As the leading company in this field, Ajinomoto aims to contribute to society and
expand its business by vigorously developing new materials and new applications, with a focus on
fields such as pharmaceuticals and foods that are deeply rooted in human life.
Specialty Chemicals➔ Strategic Initiatives and Results
Cosmetic and toiletry ingredients and electrochemicals, Ajinomoto’s mainstay products in this
field, performed well despite the depressed state of the chemical industry. Sales of the JINO line of
cosmetics, including new product Amino Wrinkle Essence, steadily increased. ABF (Ajinomoto Build-
Up Film) has been well received as the world’s first film-type insulation layer formulation material,
and Ajinomoto has obtained a basic patent in Taiwan.
➔ ➔ OutlookAlthough prices of cosmetic ingredients declined due to intense competition caused by the market
entry of several major domestic and foreign surfactant manufacturers, Ajinomoto’s efforts to
strengthen its production system are expected to support higher overall sales both in Japan and
abroad. In the field of electrochemicals, Ajinomoto is focusing on customer-tailored product
development as a means of keeping up with the accelerating pace of technological development.
– 23 –
Fine ChemicalsFine Chemicals sales increased 14.5 percent year-on-year to ¥215.7 billion, and operating income
increased 104.5 percent to ¥22.5 billion. Ajinomoto continued to promote public awareness of the
benefits of amino acids, leading to increased sales, while a strategic focus on strong niche products and
global new drugs supported growth in pharmaceuticals.
MAIN PRODUCTS● Amino Acids and Related Compounds
• As active pharmaceutical ingredients
• As food/food additives
AMINOSCIENCE
MAIN PRODUCTS● Cosmetic Ingredients
• Amisoft and Amilite surfactants
• PCANa moisturizing agent
• CAE and Amisafe conditioning agents
• Eldew emollient
● JINO Series of Cosmetics
● Functional Chemicals
• Empara and Reofos flame retardants
• Ajicure resin curing agent
● Electrochemicals
• ABF(Ajinomoto Build-Up Film) insulation film for build-up

Fiscal 2001 Highlights
Amino Vital Gaining Recognition as a Sports SupplementThe Amino Vital series received a prize for 2001 at the 20th Great Hit Food Product Awards,
sponsored by the Japan Foods Journal. In addition, since 1999 the product has been the official
sports supplement drink of the JAL Honolulu Marathon. Since 2000, Amino Vital has also won
recognition from sports organizations including the Japan Association of Athletics Federations,
the Professional Golfers’ Association of Japan and the Japan Paralympic Committee, and was
named the official nutrition drink of the Japan Tennis Association National Team.
Sweeteners➔ Strategic Initiatives and Results
In the bulk sweetener business, sales volume remained largely flat but net sales declined due to a
decrease in sales prices. Initiatives are under way to broaden the use of aspartame in beverages. In the
retail sweetener business, sales were strong, due primarily to a substantial increase in overseas sales.
➔ ➔ OutlookIn the bulk sweetener business, areas of focus will include expanding existing markets while
generating new demand, pursuing cost reductions and strengthening business support. In the retail
sweetener business, Ajinomoto will work to stimulate growth by expanding business domains in
Japan, and overseas it will develop new markets and products while bolstering earnings in existing
markets. A key R&D theme will be the development of new materials.
Pharmaceutical Intermediates➔ Strategic Initiatives and Results
Sales of pharmaceutical intermediates declined due to lower demand, which reflected a decline in
sales of end products and the termination of development projects at customers. However, sales of
intermediates for antiviral agents, a mainstay product, were supported by stabilized production.
Research and development was focused on core technologies to make process development more
competitive. Ajinomoto has also strengthened marketing strategies and launched several promising
new projects.
➔ ➔ OutlookIn fiscal 2002, Ajinomoto will concentrate on strengthening core technologies and launching new
projects in order to increase growth and earnings.
Functional Nutritional Foods➔ Strategic Initiatives and Results
During fiscal 2001, sales of the Amino Vital series exceeded ¥10 billion on a consumption basis
due to heightened awareness of the benefits of amino acids among consumers, as well as
Ajinomoto’s efforts to make the product available in retail stores. Also contributing to sales were
efforts to expand the consumer base by promoting Amino Vital as a healthy everyday drink as well as
a sports drink.
➔ ➔ OutlookObjectives for fiscal 2002 include further expanding distribution of the amino acid supplement
Amino Vital and actively developing new products in the growing daily care segment. To further
increase sales, Ajinomoto will continue to improve product quality while spreading knowledge of
amino acids using the phrase “The twentieth century was the age of vitamins and the twenty-first
century is the age of amino acids.”
MAIN PRODUCTS● Pharmaceutical Intermediates
• Amino acid derivatives
• Nucleic acid derivatives
• Optically active compounds
● Pharmaceutical Active Ingredients
MAIN PRODUCTS● Sweeteners
• Pal Sweet
• Pal Sweet Calorie Zero
• Slim-Up Sugar
• Slim-Up Sugar Flavor Sugar
MAIN PRODUCTS● Amino Vital series
– 24 –
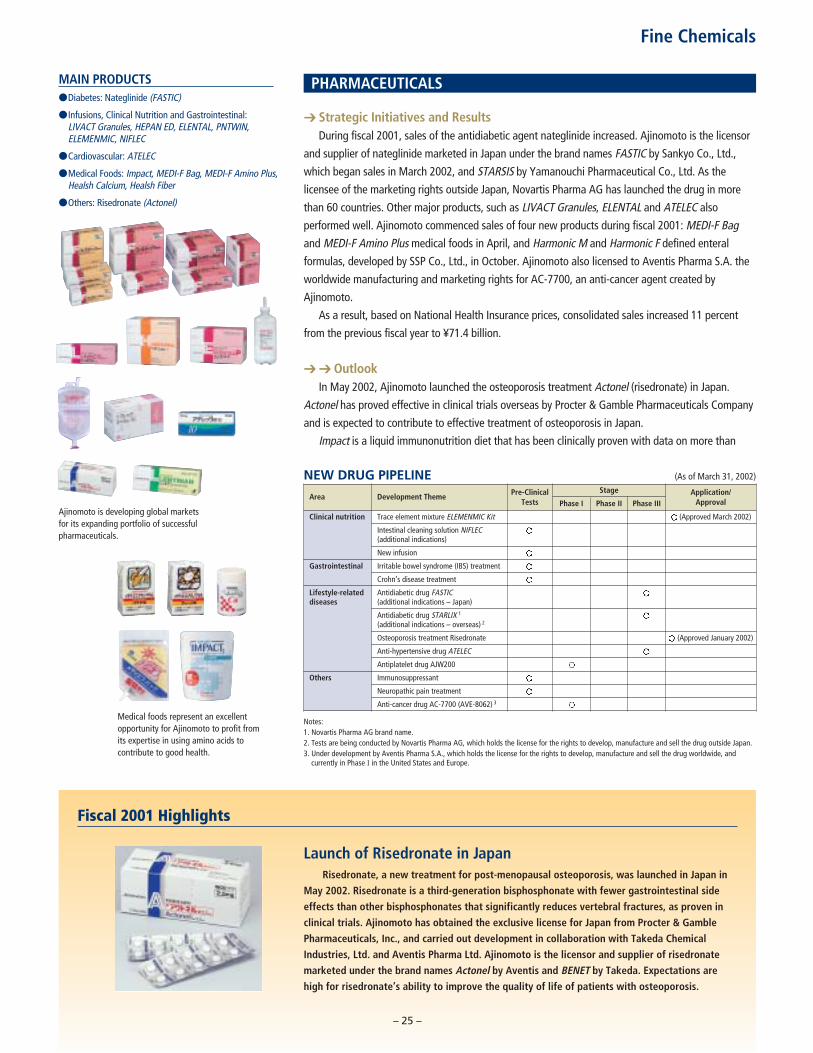
Fiscal 2001 Highlights
Launch of Risedronate in JapanRisedronate, a new treatment for post-menopausal osteoporosis, was launched in Japan in
May 2002. Risedronate is a third-generation bisphosphonate with fewer gastrointestinal side
effects than other bisphosphonates that significantly reduces vertebral fractures, as proven in
clinical trials. Ajinomoto has obtained the exclusive license for Japan from Procter & Gamble
Pharmaceuticals, Inc., and carried out development in collaboration with Takeda Chemical
Industries, Ltd. and Aventis Pharma Ltd. Ajinomoto is the licensor and supplier of risedronate
marketed under the brand names Actonel by Aventis and BENET by Takeda. Expectations are
high for risedronate’s ability to improve the quality of life of patients with osteoporosis.
Ajinomoto is developing global marketsfor its expanding portfolio of successfulpharmaceuticals.
Medical foods represent an excellentopportunity for Ajinomoto to profit fromits expertise in using amino acids to contribute to good health.
– 25 –
MAIN PRODUCTS● Diabetes: Nateglinide (FASTIC)
● Infusions, Clinical Nutrition and Gastrointestinal:LIVACT Granules, HEPAN ED, ELENTAL, PNTWIN, ELEMENMIC, NIFLEC
● Cardiovascular: ATELEC
● Medical Foods: Impact, MEDI-F Bag, MEDI-F Amino Plus, Healsh Calcium, Healsh Fiber
● Others: Risedronate (Actonel)
➔ Strategic Initiatives and ResultsDuring fiscal 2001, sales of the antidiabetic agent nateglinide increased. Ajinomoto is the licensor
and supplier of nateglinide marketed in Japan under the brand names FASTIC by Sankyo Co., Ltd.,
which began sales in March 2002, and STARSIS by Yamanouchi Pharmaceutical Co., Ltd. As the
licensee of the marketing rights outside Japan, Novartis Pharma AG has launched the drug in more
than 60 countries. Other major products, such as LIVACT Granules, ELENTAL and ATELEC also
performed well. Ajinomoto commenced sales of four new products during fiscal 2001: MEDI-F Bagand MEDI-F Amino Plus medical foods in April, and Harmonic M and Harmonic F defined enteral
formulas, developed by SSP Co., Ltd., in October. Ajinomoto also licensed to Aventis Pharma S.A. the
worldwide manufacturing and marketing rights for AC-7700, an anti-cancer agent created by
Ajinomoto.
As a result, based on National Health Insurance prices, consolidated sales increased 11 percent
from the previous fiscal year to ¥71.4 billion.
➔ ➔ OutlookIn May 2002, Ajinomoto launched the osteoporosis treatment Actonel (risedronate) in Japan.
Actonel has proved effective in clinical trials overseas by Procter & Gamble Pharmaceuticals Company
and is expected to contribute to effective treatment of osteoporosis in Japan.
Impact is a liquid immunonutrition diet that has been clinically proven with data on more than
Fine Chemicals
PHARMACEUTICALS
NEW DRUG PIPELINE (As of March 31, 2002)
Area Development Theme Pre-Clinical Stage Application/Tests Phase I Phase II Phase III Approval
Clinical nutrition Trace element mixture ELEMENMIC Kit (Approved March 2002)
Intestinal cleaning solution NIFLEC(additional indications)
New infusion
Gastrointestinal Irritable bowel syndrome (IBS) treatment
Crohn’s disease treatment
Lifestyle-related Antidiabetic drug FASTICdiseases (additional indications – Japan)
Antidiabetic drug STARLIX 1
(additional indications – overseas) 2
Osteoporosis treatment Risedronate (Approved January 2002)
Anti-hypertensive drug ATELEC
Antiplatelet drug AJW200
Others Immunosuppressant
Neuropathic pain treatment
Anti-cancer drug AC-7700 (AVE-8062) 3
Notes:1. Novartis Pharma AG brand name.2. Tests are being conducted by Novartis Pharma AG, which holds the license for the rights to develop, manufacture and sell the drug outside Japan.3. Under development by Aventis Pharma S.A., which holds the license for the rights to develop, manufacture and sell the drug worldwide, and
currently in Phase I in the United States and Europe.

Fiscal 2001 Highlights
Threonine: A New and Growing MarketThreonine is now Ajinomoto’s second major feed-use amino acid, and AJINOMOTO
EUROLYSINE S.A.S. in France produces 19,000 tons annually for a 60 percent share of the global
market. During fiscal 2001, Ajinomoto plans to establish a new Threonine plant with an annual
production capacity of 10,000 tons at Ajinomoto Heartland, Inc. in the United States and raise
production capacity at AJINOMOTO EUROLYSINE S.A.S. to 35,000 tons. By the end of 2002,
Ajinomoto’s total Threonine supply capability will be 45,000 tons, putting the Company in an
excellent position to meet rapidly growing demand in various regions.
– 26 –
Fine Chemicals
MAIN PRODUCTS● Feed-Grade Lysine
● Feed-Grade Threonine
● Feed-Grade Tryptophan
Global brand building programsinclude the feed-use amino acidsbusiness.
2,500 patients to lower the risk of infection and shorten hospitalization time. Ajinomoto has obtained
exclusive production and marketing rights in Japan from Novartis Consumer Health S.A. and launched
a Japanese version of Impact in July 2002. The product is expected to increase the cost-effectiveness
of medical treatment and improve quality of life for patients with critical illnesses with accelerated
metabolisms in the ICU or surgery, or for those with high risk of infection.
In R&D, Ajinomoto strives to create innovative drugs in the three main fields of clinical nutrition,
gastrointestinal diseases and lifestyle-related diseases. In particular, Ajinomoto’s strategic focus is to
enhance its presence and expertise in hepatic diseases, inflammatory bowel disease (IBD) and
diabetes, based on its core competence in amino acid technology.
➔ Strategic Initiatives and Results In the feed-use Lysine segment, after the large spread (price difference between soybean meal and
corn) due to strong demand for soybean meal in summer 2001, an estimated bumper crop in South
America led to a contraction in the spread in early 2002. As a result, the market price of feed-use
Lysine fluctuated between US$1.30 and US$1.80/kg, averaging US$1.60/kg for the fiscal year. In the
feed-use Threonine segment, the second pillar of Ajinomoto’s feed-use amino acids business, the
Company maintained its market position, although sales prices dropped precipitously during the
second half of the fiscal year due to increased competition triggered by newcomers. Supply of feed-
use Tryptophan became tight, as a number of companies appear to have ceased production due to
the intense competition. Ajinomoto remained committed to maintaining a stable supply for its main
customers, and continued to steadily develop the feed-use Tryptophan market.
Ajinomoto reached earnings targets despite a stagnant market during fiscal 2001. Factors included
efforts to manage a more flexible pricing system for feed-use Lysine according to the commodity price
and the competitive situation, steadily expand sales of feed-use Threonine and feed-use Tryptophan,
and reduce costs.
➔ ➔ OutlookWorking toward its annual production target for feed-grade Lysine of 300,000 tons by fiscal 2005,
Ajinomoto will expand the production capacity of facilities in the U.S., Italy and Thailand by a total of
40,000 tons per year during fiscal 2002, bringing overall annual production capacity to 240,000 tons.
Construction of a new plant in the U.S. and expansion of an existing facility in France during fiscal
2002 are expected to raise total annual production capacity for feed-grade Threonine from 19,000
tons to 45,000 tons, thus accelerating the development of new markets.
By 2005, Ajinomoto expects to hold a more than 35 percent share of the feed-use Lysine market
and a more than 70 percent share of the feed-use Threonine and feed-use Tryptophan markets, for a
strong number-one position in all three markets.
FEED-USE AMINO ACIDS
– 27 –
Financial Section
Six-Year Summary of Selected Financial Data ..............................28
Management’s Discussion and Analysis ......................................29
Consolidated Balance Sheets .......................................................34
Consolidated Statements of Operations.......................................36
Consolidated Statements of Shareholders’ Equity........................37
Consolidated Statements of Cash Flows ......................................38
Notes to Consolidated Financial Statements................................39
Report of Certified Public Accountants ........................................50

Ajinomoto Co., Inc. and Consolidated SubsidiariesYears ended March 31
Millions of yen
2002 2001 2000 1999 1998 1997
For the year:
Net sales ............................................................ ¥943,540 ¥908,528 ¥829,422 ¥814,538 ¥835,965 ¥788,400
Cost of sales ...................................................... 680,003 665,856 613,751 612,401 616,777 588,174
Gross profit..................................................... 263,536 242,672 215,670 202,136 219,187 200,225
Selling, general and administrative expenses .................................. 214,521 204,867 182,620 173,374 168,765 161,099
Operating income........................................... 49,015 37,805 33,050 28,762 50,422 39,125
Other income (expenses) ................................... 9,449 (50,800) 1,286 113 (8,141) (2,420)
Income (loss) before income taxes and minority interests.............................................. 58,464 (12,995) 34,336 28,875 42,281 36,705
Net income (loss) ............................................... 31,442 (11,547) 17,658 13,242 17,975 15,332
Capital expenditures .......................................... 45,277 46,914 55,765 53,395 50,077 45,692
Depreciation and amortization........................... 37,222 38,640 37,334 33,365 32,029 31,725
At year-end:
Shareholders’ equity 1 ........................................ ¥381,017 ¥361,771 ¥330,557 ¥349,939 ¥359,245 ¥354,748
Total assets 1...................................................... 840,152 828,945 732,980 762,173 796,149 774,150
Long-term debt .................................................. 94,435 98,511 139,821 137,999 118,572 74,372
Per share (yen):
Net income (loss) ............................................... ¥ 48.4 ¥ (17.8) ¥ 27.2 ¥ 20.4 ¥ 27.7 ¥ 23.6
Shareholders’ equity 1 ........................................ 586.3 556.6 509.0 538.8 553.2 546.6
Cash dividends .................................................. 10.0 10.0 10.0 12.0 10.0 10.0
Value indicators:
Liquidity ratios:
Debt/equity ratio (%) 1,2 ..................................... 41.0 52.0 59.0 54.7 57.0 62.6
Interest coverage ratio (times) 3 ......................... 10.9 7.4 6.8 6.5 9.6 7.9
Investment indicators:
Price/earnings ratio (times) 4 .............................. 24.4 — 46.0 69.1 41.9 41.9
Price/book value (times) 1,5 ................................ 2.0 2.2 2.5 2.6 2.1 1.8
Return indicators:
Return on assets (%) 1,6 ..................................... 3.8 (1.5) 2.4 1.7 2.3 2.0
Return on equity (%) 1,7...................................... 8.5 (3.3) 5.2 3.7 5.0 4.4
Number of employees ........................................... 24,326 23,739 22,373 17,365 16,991 13,663
Notes: 1. Shareholders’ equity, total assets, shareholders’ equity per share and the related indicators for each of the five years in the period ended March 31, 2000 have been
restated due to a change in the regulations relating to the presentation of translation adjustments. See accompanying note 1-c on page 39.
2. Debt = Short-term borrowings and current portion of long-term debt + Long-term debt
3. Interest coverage ratio = (Operating income + Interest and dividend income)/Interest expense
4. PER = Year-end share price/Net income per share
5. PBR = Year-end share price/Shareholders’ equity per share
6. ROA = Net income (or loss)/Average total assets
7. ROE = Net income (or loss)/Average total shareholders’ equity
Six-Year Summary of Selected Financial Data
– 28 –

Management's Discussion and Analysis
Overview of Financial Strategy
The Ajinomoto Group’s financial strategy is based onincreasing cash flow as a means to provide both appropriatereturns to shareholders and flexibility in funding research anddevelopment, capital expenditures and growth throughacquisitions. Consolidated management of businesses in eachsegment has been strengthened to increase profitability and cashprovided by operations, and Ajinomoto has been liquidatingsecurities and underutilized land to generate cash for investmentin income-producing assets. Capital investments will focus onhealth-related food products, global expansion, strengtheningbusinesses in which Ajinomoto is number one or a strong numbertwo, and high-potential new businesses.
Ajinomoto’s program to improve cash flow included theobjective of reducing interest-bearing liabilities from ¥172.3billion at March 31, 2001. Investment activities, particularly betterdiscipline in making capital expenditures, and working capitalwere two key areas targeted for improvement. By March 2002,Ajinomoto had reduced interest-bearing liabilities to ¥154.8billion. Increased profits were a key factor in the achievement ofthis objective. Moreover, all employees were made more aware ofthe importance of cash flow, and each division worked toimprove cash flow by reducing receivables and inventories.
Similar efforts will continue under the new three-yearmanagement plan, although interest-bearing liabilities mayincrease above ¥155 billion as a result of the Company’sstrategies for growth.
Exchange Rate Fluctuations
Ajinomoto is subject to the influence of changes in exchangerates because it operates in global markets. The Company’sfinancial statements are prepared in Japanese yen, and aresubject to the effect of fluctuations in foreign exchange rates. Ingeneral, operating income and net income increase when the yenweakens relative to principal global currencies, and decreasewhen the yen strengthens relative to principal global currencies.In the past fiscal year, the yen weakened compared to theprevious fiscal year. As of March 31, 2002, exchange rates forprincipal global currencies were ¥133.25 to US$1.00 and ¥116.14to 1.00 euro, compared to ¥123.90 to US$1.00 and ¥109.33 to1.00 euro at March 31, 2001.
Operating Environment
During the past fiscal year, the domestic food industry wasimpacted by the outbreak of bovine spongiform encephalopathy(BSE) and widespread concern about false labeling practices.Continued corporate bankruptcies in the retail industry and thetrend toward lower prices made the operating environment evenmore challenging. The global economy was affected bycontraction in the U.S. economy and the terrorist attacks of
September 11, 2001, creating generally unfavorable conditions.In this operating environment, the Ajinomoto Group
accomplished a management plan covering the three yearsended March 31, 2002. We successfully executed the fivemanagement strategies of improving consolidated management,strengthening our brands, establishing world-leading costcompetitiveness, enhancing our research and developmentsystem, and contributing to society. Moreover, Ajinomotodesigned a new three-year management plan to generate growth,and has begun aggressively implementing it.
Analysis of Statements of Operations
OverviewFor the fiscal year ended March 31, 2002, consolidated net
sales were impacted by a slight year-on-year decrease indomestic food product sales. Fine chemical sales in Japan werefirm, supported by sales of pharmaceutical products and aminoacid sports supplement Amino Vital. Overseas, food productsales increased, particularly in Asia, and sales of feed-use aminoacids were favorable in each region, especially Europe. As aresult, consolidated net sales increased 3.9 percent year-on-year,or ¥35.0 billion, to ¥943.5 billion. Successful efforts to reducecost of sales supported an increase of 29.7 percent, or ¥11.2billion, in operating income to ¥49.0 billion. Net income totaled¥31.4 billion, compared to a net loss of ¥11.5 billion for theprevious fiscal year. Return on average total shareholders’ equitystood at 8.5 percent for the fiscal year. Ajinomoto thereforeachieved every objective of the recently accomplishedmanagement plan with the exception of the objective for netsales, which the Company missed by a narrow margin.
Sales by SegmentAjinomoto has introduced an internal company system as part
of the new three-year management plan initiated in April 2002.Prior to this change, Ajinomoto classified results in the threesegments of food products, fine chemicals and others. Under thenew system, Ajinomoto will classify results into the five segmentsof domestic food products, overseas food products, amino acids,pharmaceuticals and others. Ajinomoto has also changed itsaccounting methods with the implementation of a system underwhich each internal company will pay corporate headquartersroyalty commissions that they will record as corporate expenses.Products including soybean hydrolyzate and enzymes with salestotaling approximately ¥10 billion, formerly classified under others,will now be classified under domestic food products.
The following discussion is based on the three-segmentclassification Ajinomoto used prior to April 2002.
Food ProductsThe food products business includes seasonings, edible oils,
processed foods, frozen foods, beverages and dairy products.
Ajinomoto Co., Inc. and Consolidated SubsidiariesFor fiscal 2001, ended March 31, 2002
– 29 –

– 30 –
Ajinomoto operates in this business in the domestic market, andis expanding business centered on seasonings in Asia, North andSouth America and Europe. Sales of food products for the fiscalyear ended March 31, 2002 increased 2.3 percent, or ¥14.2billion, to ¥636.2 billion. Successful efforts to increase overseassales offset the effect of increasingly intense competition in thedomestic market.
Seasonings: Sales of the retail seasoning line Hon-Dashidecreased even though the trend toward lower prices in thisproduct sector slowed. The Cook Do line of liquid seasoningmixes performed well due to an enhanced lineup and asuccessful advertising campaign based on the concept ofenjoying Chinese dishes at home. Sales increased in thecommercial market, although sales of AJI-NO-MOTO andUmami-Dashi Hi-Me for restaurants were down year-on-year.Sales of savory seasonings to food processing companiesdecreased compared with the previous fiscal year.
Sales in Asia increased year-on-year. Sales of AJI-NO-MOTOand flavored and mixed seasonings for consumer and generalrestaurant use rose over the previous fiscal year, and sales ofAJI-NO-MOTO to food processing companies increased as well.
Sales in the Americas and Europe increased year-on-year.Sales of AJI-NO-MOTO and flavored and mixed seasonings forconsumer and general restaurant use increased in both Northand South America. Sales of AJI-NO-MOTO to food processingcompanies also increased year-on-year, due in part to thedepreciation of the yen. Overall sales in Europe increased,supported by higher sales of AJI-NO-MOTO for consumer andgeneral restaurant use and for use by food processingcompanies.
Edible Oils: Retail sales of the Kenko Sarara oil series, whichis approved as a Food for Specified Health Use, increased year-on-year, although overall sales of household and commercial oilsdecreased due to reduced prices. Sales of meal products grewas the depreciation of the yen led to rising market prices.
Processed Foods: Sales of soups increased, supported byproduct line renewals emphasizing basic value, the introductionof new products, and the launch of Knorr Soup Pasta. A “keep-fresh bottle” that helps to maintain product quality wasintroduced for major retail mayonnaise products, which boostedconsumer confidence. Sales of Kellogg’s brand products wereessentially unchanged year-on-year due to effective marketing totargeted demographic segments. Sales of frozen bread doughcontinued to increase.
Frozen Foods: Sales increased year-on-year due to steadygrowth in sales of gyoza Chinese meat dumplings and EbiShumai in the household market. New product launchesincluding the Kappu Ni Haitta Gohan Ga Susumu-kun series alsosupported the gain in sales. Sales decreased in the commercialsector because of weakness in the restaurant market.
Beverages and Dairy Products: Sales rose year-on-yearbecause of the solid performance of regular coffee productscoupled with steady growth in sales of Blendy bottled coffee andother liquid coffee products. Sales of CALPIS Cultured MilkAMEAL-S increased due to health-oriented consumer demand,and CALPIS Water and Evian also performed well.
Sales of chilled dairy products increased year-on-year,supported by the strong performance of the Fruit Selection lineand Danone Yogurt.
Fine ChemicalsFine chemicals include the aminoscience business,
pharmaceuticals and feed-use amino acids. Sales of finechemicals increased 14.5 percent year-on-year, or ¥27.3 billion,to ¥215.7 billion.
In the domestic market, sales of pharmaceutical productsincreased substantially, supported by the solid performance ofnateglinide (brand name: FASTIC), a hypoglycemic agent for thetreatment of diabetes. In addition, sales of LIVACT Granules, abranched chain amino acid product for treating liver cirrhosis,continued to increase.
Overall domestic sales in the aminoscience business werefavorable. Sales of pharmaceutical-use amino acids increasedbecause of greater sales volume in the domestic market. Sales ofpharmaceutical intermediates increased substantially due togrowth in sales of antiviral applications. The amino acid-basedsports supplement Amino Vital continued to generate strongsales growth, supported by aggressive promotion and frequentexposure in a variety of media. Overall sales of amino acid-basedsweeteners decreased. Sales of Pal Sweet were strong in thedomestic market, but overall aspartame sales declined. Sales ofspecialty chemicals grew as multilayer insulation film for use inthe manufacture of computer equipment and liquid crystaldisplays continued to perform well.
Overseas sales expanded in Asia, the Americas and Europe.In Asia, a key factor in the growth was higher prices andexpanded sales volume for feed-use amino acids.
In the Americas, prices and sales volume for feed-use aminoacids increased. The depreciation of the yen supported increasedsales of both feed-use amino acids and pharmaceutical-useamino acids. Sales of amino acid-based sweeteners alsoincreased, supported by expansion in sales to major customers.
In Europe, sales prices for feed-use amino acids increased,and the depreciation of the yen contributed to higher sales aswell. Sales of pharmaceutical-use amino acids rose due toincreased sales volume and the depreciation of the yen. Sales ofpharmaceutical intermediates expanded because of the strongperformance of core product lines. Sales of amino acid-basedsweeteners declined as increasingly intense competition putdownward pressure on market prices.
OthersSales of other operations decreased by 6.6 percent year-on-
year, or ¥6.5 billion, to ¥91.6 billion.

Sales by Geographic SegmentDomestic sales increased marginally year-on-year to ¥716.8
billion. Sales increased 24.5 percent to ¥87.8 billion in Asia, 12.7percent to ¥56.6 billion in the Americas, and 15.2 percent to¥82.3 billion in Europe.
Cost of Sales and Selling, General and AdministrativeExpenses
Cost of sales increased 2.1 percent year-on-year,approximately half the rate of increase in net sales, to ¥680.0billion, and improved to 72.1 percent of net sales from 73.3percent of net sales for the previous fiscal year.
Selling, general and administrative (SG&A) expensesincreased 4.7 percent year-on-year, or ¥9.7 billion, to ¥214.5billion. Research and development expenses increased 2.8percent to ¥27.0 billion.
Operating IncomeOperating income for the year ended March 31, 2002
increased 29.7 percent year-on-year, or ¥11.2 billion, to ¥49.0billion. Operating income represented 5.2 percent of net sales,compared to 4.2 percent for the previous fiscal year.
Operating income in the food products business decreased 9.1percent, or ¥2.1 billion, to ¥21.5 billion. Domestic sales decreased,primarily because of lower sales of frozen foods, edible oils,seasonings and processed foods due to falling retail prices and theimpact of BSE. The depreciation of the yen also affected theoperating income of the domestic food products business. Sales offood products overseas increased, but operating income was
unable to compensate for the decrease in the profitability of thedomestic food business due to factors including higher expensesin connection with brand building in Indonesia and start-up costsat Ajinomoto Frozen Foods U.S.A., Inc., which became aconsolidated subsidiary during the fiscal year.
Operating income for the fine chemicals business increased104.5 percent year-on-year, or ¥11.5 billion, to ¥22.5 billion.Operating income in Japan increased due to increased sales ofpharmaceuticals, amino acids including Amino Vital, sweetenersand other high-value-added products such as specialtychemicals. Operating income from overseas operations alsoincreased due to higher sales of feed-use amino acids and theabsence of amortization expenses in connection with theconsolidation of two sweetener companies in Europe in theprevious fiscal year.
Operating income of other businesses increased 41.8percent, or ¥1.4 billion, to ¥4.8 billion due to efficiency gains fromconsolidation of three distribution subsidiaries.
Other Income (Expenses)Other income, net totaled ¥9.4 billion, compared to other
expenses, net of ¥50.8 billion for the previous fiscal year. Primaryfactors in the change were the absence of one-time chargeincurred in the previous year in connection with the amortizationof net retirement benefit obligations arising from theimplementation in Japan of a new accounting standard. Interestand dividend income decreased 9.6 percent to ¥2.1 billion due tocontinued low interest rates in Japan, while interest expensedecreased ¥0.7 billion to ¥4.7 billion. The interest coverage ratio,defined as the sum of operating income and interest anddividend income divided by interest expense, improved to 10.9times from 7.4 times in the previous fiscal year.
During the fiscal year ended March 2002, Ajinomoto withdrewfrom the soy protein business and closed subsidiary Asahi YushiCo., Ltd. Overall equity in earnings of affiliates decreased byapproximately ¥0.9 billion.
– 31 –
DOMESTIC AND OVERSEAS SALES
1998 1999 2000 2001 2002
681.7 681.8 688.3716.3
154.2 132.8 141.1192.2
836.0 814.5 829.4
908.5
716.8
226.8
943.5
Overseas
Japan
(Billions of yen)
Costs, Expenses and Income as Percentages of Net Sales
Years ended March 31 2002 2001 2000
Cost of sales. . . . . . . . . . . . . 72.1% (-1.2) 73.3% (-0.7) 74.0%
Gross profit. . . . . . . . . . . . . . 27.9 (+1.2) 26.7 (+0.7) 26.0
SG&A expenses. . . . . . . . . . 22.7 (+0.2) 22.5 (+0.5) 22.0
Operating income. . . . . . . . . 5.2 (+1.0) 4.2 (+0.2) 4.0
Income before income taxes &minority interests . . 6.2 — 4.1
Net income . . . . . . . . . . . . . . 3.3 — 2.1
Note: Figures in parentheses represent change in percentage points from the previous year.
OPERATING INCOME &OPERATING MARGIN
1998 1999 2000 2001 2002
50.4 49.0
28.833.1
37.8
6.0
3.5
4.04.2
5.2
Operating income
Operating margin
(Billions of yen) (%)
Years ended March 31
Years ended March 31

– 32 –
Net IncomeAs a result of the performance discussed above, income
before income taxes and minority interests totaled ¥58.5 billion,compared to a loss of ¥13.0 billion for the previous fiscal year.Income taxes totaled ¥23.4 billion, compared to net deferredincome taxes of ¥4.1 billion for the previous fiscal year. Theeffective tax rate was 40.0 percent. Minority interests increased¥1.0 billion year-on-year to ¥3.7 billion. Net income totaled ¥31.4billion, compared to a net loss of ¥11.5 billion for the previousfiscal year. Return on average total shareholders’ equity was 8.5percent, and net income per share of common stock was ¥48.4.
DividendsAjinomoto considers appropriate returns to shareholders a
primary management task. The Company structures its operatingbase to support continued growth, and considers overallprofitability in determining an appropriate level of dividends thatmeet the demands of shareholders and investors. Based onthese principles, cash dividends per share of common stockapplicable to the fiscal year were set at ¥10.0, unchanged fromthe previous fiscal year.
Liquidity and Financial Condition
Cash FlowsNet cash provided by operating activities increased ¥20.4
billion over the previous fiscal year to ¥58.3 billion. Operating cashflow, defined as the sum of income before income taxes andminority interests and depreciation and amortization, increased to¥95.7 billion from ¥25.6 billion for the previous fiscal year. Primaryfactors included the increase in income before income taxes andminority interests and efforts to limit increases in working capital.
Net cash used in investing activities increased to ¥36.8 billionfrom ¥23.4 billion for the previous fiscal year. Ajinomotodecreased the use of cash for purposes such as the acquisitionof shares of affiliates, but generated substantially less cashthrough proceeds from sales of investments in securities andsales of property, plant and equipment.
Acquisition of property, plant and equipment decreased to¥45.8 billion from ¥46.3 billion for the previous fiscal year. Capitalexpenditures by the parent company and domestic subsidiariesdecreased ¥7.3 billion year-on-year, while capital expenditures by
overseas subsidiaries increased ¥5.5 billion to ¥21.7 billion.Principal investments included expansion in production capacity forfeed-grade amino acids and nucleotides. Free cash flow increasedto ¥21.5 billion from ¥14.6 billion for the previous fiscal year.
Net cash used in financing activities increased ¥6.2 billion to¥26.4 billion, reflecting increased short-term borrowings andrepayment of bonds and long-term debt. Ajinomoto redeemed¥10.0 billion in straight bonds in September 2001 using internalcapital resources, and redeemed ¥18.3 billion in convertiblebonds in March 2002 using capital procured through an issue ofcommercial paper.
As a result of the above, cash and cash equivalents at theend of the fiscal year decreased ¥2.8 billion from a year earlier to¥56.6 billion.
Assets, Liabilities and Shareholders' EquityAs of March 31, 2002, total assets stood at ¥840.2 billion, an
increase of ¥11.2 billion from a year earlier. Return on averagetotal assets was 3.8 percent.
Current assets increased ¥13.6 billion from a year earlier to¥357.4 billion. Notes and accounts receivable - trade increased¥8.7 billion and inventories increased ¥7.6 billion as a result ofthe increase in net sales.
Investment securities included in investments and long-termadvances decreased ¥22.4 billion from a year earlier. Property,plant and equipment, net increased ¥9.3 billion. Land, buildingsand structures, and machinery and equipment all increased as aresult of expansion in production capacity for feed-grade aminoacids and nucleotides. Deferred tax assets increased ¥11.1 billionfrom March 31, 2001.
INTEREST COVERAGE RATIO
1998 1999 2000 2001 2002
9.6
6.5 6.87.4
10.9
(Times)
Cash Flow Highlights
Years ended March 31 2002 2001 2000
Net cash provided by operating activities................... ¥ 58,306 ¥ 37,955 ¥ 72,130
Net cash used in investing activities................... (36,812) (23,360) (29,219)
Net cash used in financing activities................... (26,376) (20,205) (37,156)
Cash and cash equivalents at end of year ........................... 56,550 59,389 60,309
CAPITAL EXPENDITURES
1998 1999 2000 2001 2002
50.153.4
55.8
45.346.9
(Billions of yen)
(Millions of yen)
Years ended March 31
Years ended March 31

Current liabilities decreased ¥6.3 billion from a year earlier to¥266.3 billion. Although short-term borrowings increased ¥6.6billion and accrued expenses and other current liabilitiesincreased ¥20.6 billion from a year earlier due mainly to an issueof commercial paper, the current portion of long-term debtdecreased ¥34.0 billion from a year earlier to ¥8.9 billion. Workingcapital increased to ¥91.2 billion from ¥71.2 billion a year earlier,and the current ratio increased to 1.34 times from 1.26 timesfrom a year earlier.
Long-term liabilities decreased ¥6.5 billion from a year earlierto ¥169.7 billion, primarily because of a ¥2.1 billion decrease indeferred tax liabilities and a reduction in long-term debt totaling¥4.1 billion. Ajinomoto’s long-term debt is rated AA- by Standard& Poor’s Ratings Group and AA by Rating and InvestmentInformation, Inc. (R&I).
Shareholders’ equity increased ¥19.2 billion from a yearearlier to ¥381.0 billion. Retained earnings increased ¥24.3 billionand translation adjustments were ¥42.4 billion, compared with¥49.3 billion for the previous fiscal year. Unrealized holding gainson securities, however, decreased ¥11.7 billion. Total capital, thesum of short-term borrowings, long-term debt including thecurrent portion and shareholders’ equity, was ¥537.7 billion, ofwhich shareholders’ equity accounted for 70.9 percent. Return onaverage total shareholders’ equity was 8.5 percent compared tonegative 3.3 percent for the previous fiscal year because
Ajinomoto generated net income for the fiscal year under review.The ratio of shareholders’ equity to total assets was 45.4 percent,compared to 43.6 percent a year earlier.
Outlook for the Year Ending March 31, 2003
Economic conditions in Japan do not indicate thatunemployment or personal income will improve, and the currentharsh business environment is expected to continue.
Ajinomoto projects an increase in domestic sales of foodproducts as we intend to introduce new products that meetconsumer demand. In the domestic fine chemicals business,continued strong performance is projected for the amino acid-based sports supplement Amino Vital, driven by healthconsciousness among consumers. In pharmaceuticals, sales areprojected to rise for Ajinomoto products for treating diabetes andosteoporosis. We expect greater maneuverability in implementingmarketing strategies, with a particular focus on responding to thegrowth in the market for feed-use amino acids.
As a result, net sales are projected to increase 4.9 percent to¥990.0 billion. Net income is projected to increase 1.8 percent to¥32.0 billion.
Note: These forecasts are based on an exchange rate of ¥130 to US$1.
SHAREHOLDERS’EQUITY RATIO
1998 1999 2000 2001 2002
45.1
45.945.1
43.6
45.4
(%)
TOTAL CAPITAL
1998 1999 2000 2001 2002
66.6 42.0 47.8 46.8 53.3
359.2330.6
361.8381.0
19.711.5 7.4 42.9 8.9
118.6139.8
98.594.4
564.1
525.7550.0 537.7
349.9
138.0
541.5
Shareholders’ Equity
Long-term Debt
Current Portion ofLong-term Debt
Short-term Borrowings
(Billions of yen)
– 33 –
As of March 31
As of March 31
Millions of yen Thousands of(Percentage of total assets) U.S. dollars
As of March 31 2002 2001 2002Total assets ........................................................................................ ¥840,152 (100.0%) ¥828,945 (100.0%) $6,316,932Notes and accounts receivable.......................................................... 168,017 (20.0) 157,416 (19.0) 1,263,286Cash and cash equivalents ................................................................ 56,550 (6.7) 59,389 (7.2) 425,188Inventories .......................................................................................... 104,008 (12.4) 96,449 (11.6) 782,015Investments and long-term advances................................................ 125,681 (15.0) 144,953 (17.5) 944,970Property, plant and equipment........................................................... 293,414 (34.9) 284,156 (34.3) 2,206,120Total liabilities..................................................................................... 435,973 (51.9) 448,798 (54.1) 3,277,992
Notes and accounts payable ............................................................. 106,529 (12.7) 106,067 (12.8) 800,970Short-term borrowings ....................................................................... 53,348 (6.3) 46,755 (5.6) 401,113Current portion of long-term debt ...................................................... 8,925 (1.1) 42,922 (5.2) 67,105Accrued income taxes........................................................................ 14,105 (1.7) 14,066 (1.7) 106,053Long-term debt .................................................................................. 94,435 (11.2) 98,511 (11.9) 710,038Shareholders’ equity .......................................................................... 381,017 (45.4) 361,771 (43.6) 2,864,789
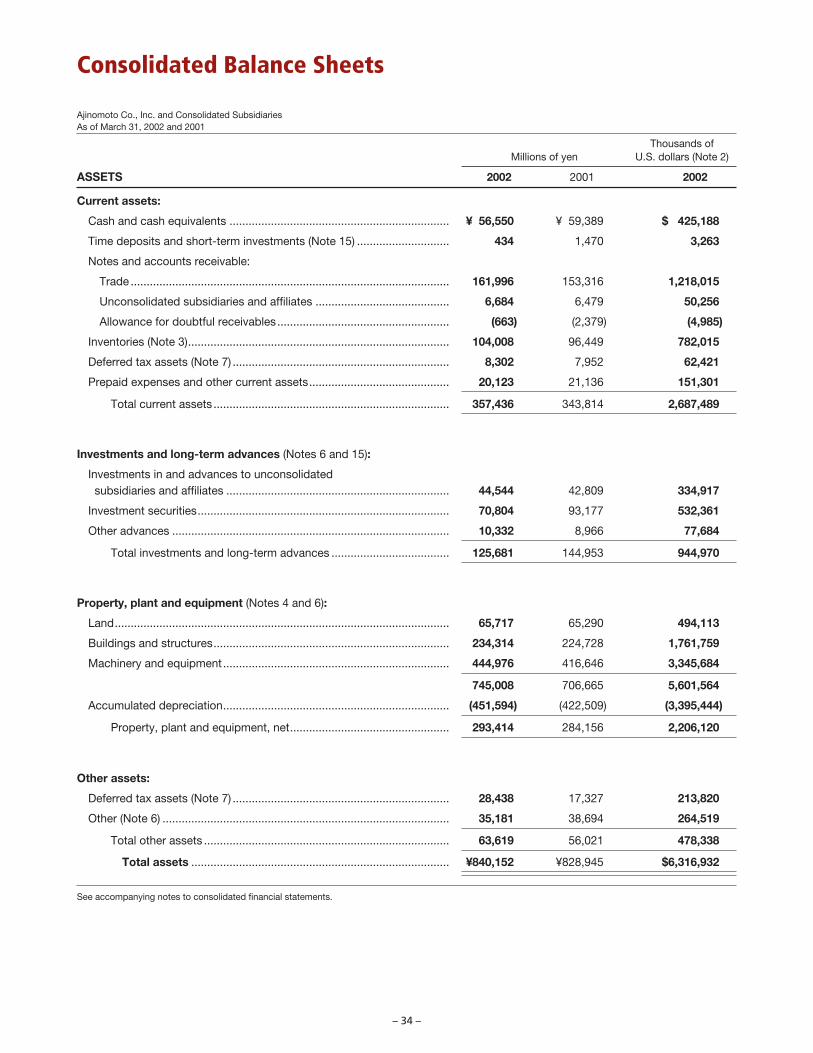
Consolidated Balance Sheets
– 34 –
Ajinomoto Co., Inc. and Consolidated SubsidiariesAs of March 31, 2002 and 2001
Thousands ofMillions of yen U.S. dollars (Note 2)
ASSETS 2002 2001 2002
Current assets:
Cash and cash equivalents ..................................................................... ¥ 56,550 ¥ 59,389 $ 425,188
Time deposits and short-term investments (Note 15) ............................. 434 1,470 3,263
Notes and accounts receivable:
Trade .................................................................................................... 161,996 153,316 1,218,015
Unconsolidated subsidiaries and affiliates .......................................... 6,684 6,479 50,256
Allowance for doubtful receivables...................................................... (663) (2,379) (4,985)
Inventories (Note 3).................................................................................. 104,008 96,449 782,015
Deferred tax assets (Note 7) .................................................................... 8,302 7,952 62,421
Prepaid expenses and other current assets............................................ 20,123 21,136 151,301
Total current assets .......................................................................... 357,436 343,814 2,687,489
Investments and long-term advances (Notes 6 and 15):
Investments in and advances to unconsolidated subsidiaries and affiliates ...................................................................... 44,544 42,809 334,917
Investment securities............................................................................... 70,804 93,177 532,361
Other advances ....................................................................................... 10,332 8,966 77,684
Total investments and long-term advances ..................................... 125,681 144,953 944,970
Property, plant and equipment (Notes 4 and 6):
Land......................................................................................................... 65,717 65,290 494,113
Buildings and structures.......................................................................... 234,314 224,728 1,761,759
Machinery and equipment....................................................................... 444,976 416,646 3,345,684
745,008 706,665 5,601,564
Accumulated depreciation....................................................................... (451,594) (422,509) (3,395,444)
Property, plant and equipment, net.................................................. 293,414 284,156 2,206,120
Other assets:
Deferred tax assets (Note 7) .................................................................... 28,438 17,327 213,820
Other (Note 6) .......................................................................................... 35,181 38,694 264,519
Total other assets ............................................................................. 63,619 56,021 478,338
Total assets ................................................................................. ¥840,152 ¥828,945 $6,316,932
See accompanying notes to consolidated financial statements.

Thousands of Millions of yen U.S. dollars (Note 2)
LIABILITIES AND SHAREHOLDERS’ EQUITY 2002 2001 2002
Current liabilities:
Short-term borrowings (Notes 5 and 6)................................................... ¥ 53,348 ¥ 46,755 $ 401,113
Current portion of long-term debt (Notes 5 and 6).................................. 8,925 42,922 67,105
Notes and accounts payable (Note 6):
Trade .................................................................................................... 68,132 69,065 512,271
Unconsolidated subsidiaries and affiliates .......................................... 37,278 36,409 280,286
Construction......................................................................................... 1,119 593 8,414
Accrued income taxes (Note 7) ............................................................... 14,105 14,066 106,053
Deferred tax liabilities (Note 7)................................................................. 33 13 248
Accrued expenses and other current liabilities ....................................... 83,315 62,747 626,429
Total current liabilities ...................................................................... 266,258 272,574 2,001,940
Long-term liabilities:
Long-term debt (Notes 5 and 6) .............................................................. 94,435 98,511 710,038
Accrued employees’ retirement benefits (Note 8) ................................... 70,672 70,687 531,368
Accrued officers’ severance benefits ...................................................... 1,449 1,754 10,895
Deferred tax liabilities (Note 7)................................................................. 3,158 5,271 23,744
Total long-term liabilities .................................................................. 169,715 176,224 1,276,053
Minority interests......................................................................................... 23,160 18,374 174,135
Shareholders’ equity (Notes 9 and 18):
Common stock:
Authorized: 2002 and 2001 — 1,000,000,000 shares
Issued: 2002 — 649,981,740 shares .................................................. 79,863 — 600,474
2001 — 649,981,182 shares .................................................. — 79,863 —
Capital surplus......................................................................................... 111,579 111,578 838,940
Retained earnings.................................................................................... 222,565 198,282 1,673,421
Unrealized holding gains on securities .................................................... 9,583 21,313 72,053
Translation adjustments .......................................................................... (42,441) (49,262) (319,105)
Treasury common stock, at cost:
108,610 shares in 2002 and 3,733 shares in 2001 .............................. (132) (4) (992)
Total shareholders’ equity ................................................................ 381,017 361,771 2,864,789
Commitments and contingent liabilities (Note 12)
Total liabilities and shareholders’ equity .................................. ¥840,152 ¥828,945 $6,316,932
– 35 –

Ajinomoto Co., Inc. and Consolidated SubsidiariesYears ended March 31, 2002, 2001 and 2000
Thousands ofMillions of yen U.S. dollars (Note 2)
2002 2001 2000 2002
Net sales ................................................................................. ¥943,540 ¥908,528 ¥829,422 $7,094,286
Cost of sales (Note 10) ........................................................... 680,003 665,856 613,751 5,112,805
Gross profit .................................................................. 263,536 242,672 215,670 1,981,474
Selling, general and administrative expenses (Note 10)......... 214,521 204,867 182,620 1,612,940
Operating income......................................................... 49,015 37,805 33,050 368,534
Other income (expenses):
Interest expense.................................................................. (4,675) (5,398) (5,298) (35,150)
Interest and dividend income.............................................. 2,105 2,329 2,827 15,827
Amortization of prior service cost relating to additional pension benefits ........................................... — — (5,008) —
Amortization of net retirement benefitobligation at transition ..................................................... — (52,293) — —
Reversal to income of accrued retirement benefits ............ 323 12 451 2,429
Unrealized loss on securities .............................................. (239) (1,329) (1,291) (1,797)
Gain (loss) on sales of securities......................................... 403 7,125 (473) 3,030
Loss on liquidation of affiliates............................................ (11) (12,161) (109) (83)
Equity in earnings of affiliates ............................................. 3,713 4,617 5,976 27,917
Provision for loss on guarantees......................................... — — (1,167) —
Other, net ............................................................................ 7,830 6,295 5,380 58,872
9,449 (50,800) 1,286 71,045
Income (loss) before income taxes and minority interests......... 58,464 (12,995) 34,336 439,579
Income taxes (Note 7):
Current ................................................................................ 26,448 22,689 15,183 198,857
Deferred .............................................................................. (3,089) (26,798) (1,148) (23,226)
23,359 (4,109) 14,035 175,632
Minority interests .................................................................... (3,662) (2,661) (2,642) (27,534)
Net income (loss) (Note 13) .................................... ¥ 31,442 ¥ (11,547) ¥ 17,658 $ 236,406
See accompanying notes to consolidated financial statements.
Consolidated Statements of Operations
– 36 –

Ajinomoto Co., Inc. and Consolidated SubsidiariesYears ended March 31, 2002, 2001 and 2000
Thousands ofMillions of yen U.S. dollars (Note 2)
2002 2001 2000 2002
Common stock
Beginning of year ................................................................ ¥ 79,863 ¥ 79,836 ¥ 79,836 $ 600,474
Add:
New shares issued in exchange for subsidiary’s stock(2001 — 535, 590 shares) ........................................... — 26 — —
Conversion of convertible bonds(2002 — 558 shares, 2001 — 558 shares) ................... 0 0 — 0
End of year .......................................................................... ¥ 79,863 ¥ 79,863 ¥ 79,836 $ 600,474
Capital surplus
Beginning of year ................................................................ ¥111,578 ¥111,123 ¥111,123 $ 838,932
Add:
New shares issued in exchange for subsidiary’s stock ...................................................... — 455 — —
Portion of principal of bonds converted but not transferred to common stock .......................... 0 0 — 0
End of year .......................................................................... ¥111,579 ¥111,578 ¥111,123 $ 838,940
Retained earnings
Opening balance ................................................................. ¥198,282 ¥214,673 ¥204,488 $1,490,842
Adjustments to retained earnings for inclusion in or exclusion from consolidation or equity method of accounting and other .................................................... (430) 1,836 505 (3,233)
Beginning of year ................................................................ 197,852 216,510 204,994 1,487,609
Add:
Net income (loss) ............................................................. 31,442 (11,547) 17,658 236,406
Deduct:
Cash dividends paid ........................................................ (6,499) (6,494) (7,793) (48,865)
Bonuses to directors and statutory auditors ................... (228) (185) (185) (1,714)
End of year .......................................................................... ¥222,565 ¥198,282 ¥214,673 $1,673,421
Unrealized holding gains on securities
Balance at beginning of the year ........................................ ¥21,313 ¥ — ¥ — $160,248
Net change during the year................................................. (11,730) 21,313 — (88,195)
Balance at end of the year .................................................. ¥ 9,583 ¥ 21,313 ¥ — $ 72,053
Translation adjustments
Balance at beginning of the year ........................................ ¥ (49,262) ¥ (75,065) ¥ (45,498) $ (370,391)
Net change during the year................................................. 6,821 25,803 (29,567) 51,286
Balance at end of the year .................................................. ¥ (42,441) ¥ (49,262) ¥ (75,065) $ (319,105)
See accompanying notes to consolidated financial statements.
Consolidated Statements of Shareholders’ Equity
– 37 –

Ajinomoto Co., Inc. and Consolidated SubsidiariesYears ended March 31, 2002, 2001 and 2000
Thousands ofMillions of yen U.S. dollars (Note 2)
2002 2001 2000 2002
Cash flows from operating activitiesIncome (loss) before income taxes and minority interests ....................... ¥ 58,464 ¥(12,995) ¥34,336 $ 439,579Depreciation and amortization.................................................................. 37,222 38,640 37,334 279,865Amortization of excess of cost over net assets acquired......................... 2,790 4,415 2,639 20,977Accrued employees’ retirement benefits.................................................. (68) 50,156 1,333 (511)Accrued officers’ severance benefits ....................................................... (305) 406 (42) (2,293)Provision for loss on guarantees .............................................................. — (1,167) 1,167 —Interest and dividend income ................................................................... (2,105) (2,329) (2,827) (15,827)Interest expense ....................................................................................... 4,675 5,398 5,298 35,150Equity in earnings of affiliates ................................................................... (3,713) (4,617) (5,976) (27,917)Loss on liquidation of affiliates ................................................................. — 12,161 109 —(Gain) loss on sales of securities .............................................................. (242) (6,953) 528 (1,820)Loss on revaluation of securities .............................................................. 232 1,177 1,291 1,744Notes and accounts receivable ................................................................ (6,655) (33,764) 9,836 (50,038)Notes and accounts payable.................................................................... (1,951) 18,805 (8,376) (14,669)Gain on compensation received for damages.......................................... (3,176) — — (23,880)Penalty paid .............................................................................................. 728 2,636 — 5,474Other ......................................................................................................... (4,462) (10,689) 10,826 (33,549)
Subtotal ................................................................................................ 81,433 61,279 87,476 612,278Interest and dividends received............................................................ 5,986 2,165 2,867 45,008Interest paid.......................................................................................... (4,981) (5,494) (5,471) (37,451)Compensation received for damages................................................... 3,176 — — 23,880Penalty paid .......................................................................................... (728) (2,636) — (5,474)Income taxes paid ................................................................................ (26,579) (17,358) (12,742) (199,842)
Net cash provided by operating activities ........................................ 58,306 37,955 72,130 438,391
Cash flows from investing activitiesIncrease (decrease) in marketable securities............................................ 1,017 4,897 (2,257) 7,647Acquisition of property, plant and equipment .......................................... (45,821) (46,277) (46,381) (344,519)Proceeds from sales of property, plant and equipment ........................... 8,135 20,561 5,389 61,165Acquisition of intangible assets, net of proceeds..................................... (3,564) (1,867) (8,511) (26,797)Acquisition of investments in securities ................................................... (607) (2,945) (5,869) (4,564)Proceeds from sales of investments in securities .................................... 2,157 12,432 25,630 16,218Losses on guarantees for liabilities .......................................................... — (1,256) — —Acquisition of subsidiaries’ stock resulting from changesin the scope of consolidation.................................................................. — (9,555) — —
Acquisition of shares of affiliates .............................................................. (418) (3,089) (838) (3,143)Other ......................................................................................................... 2,290 3,741 3,618 17,218
Net cash used in investing activities................................................. (36,812) (23,360) (29,219) (276,782)
Cash flows from financing activitiesIncrease (decrease) in short-term borrowings.......................................... 21,667 (6,357) (27,830) 162,910Proceeds from long-term debt ................................................................. 3,336 3,373 10,357 25,083Repayments of long-term debt................................................................. (16,572) (10,053) (11,485) (124,602)Repayment of bonds and convertible bonds ........................................... (28,303) — — (212,805)Cash dividends paid ................................................................................. (6,499) (6,495) (7,793) (48,865)Other ......................................................................................................... (4) (673) (404) (30)
Net cash used in financing activities ................................................ (26,376) (20,205) (37,156) (198,316)Effect of exchange rate changes on cash and cash equivalents ................... 1,888 2,208 (2,672) 14,195
(Decrease) increase in cash and cash equivalents................................... (2,992) (3,401) 3,080 (22,496)Cash and cash equivalents at beginning of year...................................... 59,389 60,309 47,854 446,534Increase due to inclusion of subsidiaries in consolidation ....................... 154 1,260 5,493 1,158Increase arising from change in fiscal year end of consolidated subsidiaries ....................................................................... — 1,220 3,880 —
Cash and cash equivalents at end of year ....................................... ¥ 56,550 ¥ 59,389 ¥60,309 $ 425,188
See accompanying notes to consolidated financial statements.
Consolidated Statements of Cash Flows
– 38 –

Ajinomoto Co., Inc. and Consolidated Subsidiaries March 31, 2002
1. SUMMARY OF SIGNIFICANT ACCOUNTING POLICIES
a. Basis of PresentationThe accompanying consolidated financial statements of Ajinomoto Co., Inc. (the “Company”) and its consolidated subsidiaries are
compiled from the consolidated financial statements prepared by the Company as required by the Securities and Exchange Law of Japanand are prepared on the basis of accounting principles and practices generally accepted and applied in Japan, which may differ in certainmaterial respects from accounting principles and practices generally accepted in countries and jurisdictions other than Japan.
As permitted by the Securities and Exchange Law, amounts of less than one million yen have been omitted. Consequently, the totalsshown in the accompanying consolidated financial statements (both in yen and U.S. dollars) do not necessarily agree with the sum of theindividual amounts.
Certain amounts in the prior years’ financial statements have been reclassified to conform to the current year’s presentation.
b. Basis of ConsolidationUntil the year ended March 31, 1999, the consolidated financial statements included the accounts of the Company and its significant
subsidiaries (owned more than 50%), and investments in significant affiliates (owned 20% to 50%) were accounted for by the equity method.In accordance with the revised accounting standard for consolidation, the accompanying consolidated financial statements for the years
ended March 31, 2002, 2001 and 2000 include the accounts of the Company and any significant companies controlled directly or indirectlyby the Company. Companies over which the Company exercises significant influence in terms of their operating and financial policies havebeen included in the consolidated financial statements on an equity basis. All significant intercompany balances and transactions have been eliminated in consolidation.
The minor differences arising from the cost of the companies’ investments in subsidiaries and affiliates over the equity in their net assets atfair value are charged or credited to income in the year of acquisition. Significant differences are, as a rule, amortized over periods of 5, 20 or25 years.
Investments in other affiliates and unconsolidated subsidiaries, not significant in amount, are carried at cost or less. Where there has beenpermanent impairment in the value of its investments, the Company has written down such investments.
c. Foreign Currency TranslationCurrent and non-current monetary accounts denominated in foreign currencies are translated into yen at the current rates.The revenue and expense accounts of the foreign consolidated subsidiaries are translated at the rates of exchange in effect at the balance
sheet date. Except for shareholders’ equity, the balance sheet accounts are also translated into yen at the rates of exchange in effect at thebalance sheet date. The components of shareholders’ equity are translated at their historical exchange rates.
A revised accounting standard for foreign currency translation became effective April 1, 2000. The effect of the adoption of the revisedstandard on the consolidated financial statements was immaterial for the year ended March 31, 2001.
d. Cash EquivalentsThe Company considers all highly liquid investments with a maturity of three months or less when purchased to be cash equivalents.
e. InventoriesInventories are stated at the lower of cost or market, cost being determined by the average method.
f. SecuritiesUntil the year ended March 31, 2000, marketable securities had been valued principally at the lower of cost or market, cost being
determined by the moving average method, and investment securities other than marketable securities had been stated at cost determinedby the moving average method.
A new accounting standard for financial instruments, which became effective April 1, 2000, requires that securities be classified into threecategories: trading, held-to-maturity or other securities. Under the new standard, trading securities are carried at fair value and held-to-matu-rity securities are carried at amortized cost. Marketable securities classified as other securities are carried at fair value with changes in unre-alized holding gain or loss, net of the applicable income taxes, included directly in shareholders’ equity. Non-marketable securities classifiedas other securities are carried at cost. Cost of securities sold is determined by the moving average method.
As of April 1, 2000, the Company and its consolidated subsidiaries assessed their intent to hold their investments in securities and classified their investments as “other securities” and have accounted for the securities at March 31, 2002 and 2001 in accordance with thenew standard referred to above. However, the adoption of this new standard had no material effect on the consolidated statement of opera-tions for the year ended March 31, 2001.
g. Property, Plant and Equipment and DepreciationProperty, plant and equipment is stated at cost. Depreciation is computed primarily by the declining-balance method at rates based
on the estimated useful lives of the respective assets, ranging from 3 to 50 years for buildings and structures and from 2 to 20 years formachinery and equipment.
Maintenance and minor repairs are charged to income as incurred; major renewals and improvements are capitalized.
h. LeasesNoncancelable leases of the Company and its domestic consolidated subsidiaries are accounted for as operating leases (whether such
leases are classified as operating or finance leases) except that lease agreements which stipulate the transfer of ownership of the leasedassets to the lessee are accounted for as finance leases. However, leases of the foreign consolidated subsidiaries are generally classified aseither finance or operating leases and accounted for accordingly.
Notes to Consolidated Financial Statements
– 39 –

i. Bond Issuance ExpensesBond issuance expenses are charged to income as incurred.
j. Retirement BenefitsUntil the year ended March 31, 2000, accrued employees’ retirement benefits were stated at the amount which would be required to be
paid if all employees covered by the retirement benefit plans voluntarily terminated their employment at the balance sheet date.Costs with respect to the pension plans are funded as accrued at an amount determined actuarially. Prior service cost is being funded
over a period of seven years.In accordance with a new accounting standard for retirement benefits which became effective April 1, 2000, accrued employees’ retire-
ment benefits at March 31, 2002 and 2001 have been provided mainly at an amount calculated based on the retirement benefit obligation andthe fair value of the pension plan assets as of the balance sheet date as adjusted for unrecognized actuarial gain or loss and unrecognizedprior service cost. The retirement benefit obligation is attributed to each period by the straight-line method over the years of service. The netretirement benefit obligation at transition was charged to operations as incurred.
Actuarial gain and loss are amortized in the year following the year in which the gain or loss is recognized primarily by the straight-linemethod over the period of mainly 10 years which are shorter than the average remaining years of service of the employees.
Prior service cost is being amortized as incurred by the straight-line method over the period of principally 10 years which are shorter thanthe average remaining years of service of the employees.
The effect of the adoption of the new standard for retirement benefits was to increase loss before income taxes and minority interests by¥48,358 million for the year ended March 31, 2001.
In addition, subject to the shareholders’ approval, directors and corporate auditors of the Company and certain consolidated subsidiariesare customarily entitled to lump-sum payments under their respective unfunded severance benefit plans. Provision for the indemnity for sev-erance benefits for those officers has been made at an estimated amount.
k. Income TaxesDeferred tax assets and liabilities are determined based on the differences between financial reporting and the tax bases of the assets and
liabilities and are measured using the enacted tax rates and laws which will be in effect when the differences are expected to reverse.
l. Research and Development ExpensesResearch and development expenses are charged to income when incurred.A new accounting standard for research and development expenses became effective the year ended March 31, 2000. However, the
adoption of this new standard had no material effect on the consolidated statement of operations for the year ended March 31, 2000.
m. Derivative Financial InstrumentsThe Company and certain consolidated subsidiaries have entered into derivative transactions in order to manage certain risks arising from
adverse fluctuations in foreign currency exchange rates, interest rates and commodity prices. In accordance with a new accounting standardfor financial instruments which became effective April 1, 2000, derivative financial instruments are carried at fair value with changes in unreal-ized gain or loss charged or credited to operations, except for those which meet the criteria for deferral hedge accounting under which unre-alized gain or loss is deferred as an asset or a liability. Receivables and payables hedged by qualified forward foreign exchange contracts aretranslated at the corresponding foreign exchange contract rates.
2. U.S. DOLLAR AMOUNTSThe translation of yen amounts into U.S. dollar amounts is included solely for the convenience of readers outside Japan and has been made,as a matter of arithmetic computation only, at ¥133 = U.S.$1.00, the approximate rate of exchange on March 31, 2002.
The translation should not be construed as a representation that yen have been, could have been, or could in the future be, converted intoU.S. dollars at the above or any other rate.
3. INVENTORIESInventories at March 31, 2002 and 2001 consisted of the following:
Thousands of Millions of yen U.S. dollars
2002 2001 2002
Finished goods ...................................................................................................................... ¥ 54,426 ¥48,569 $409,218Work in process..................................................................................................................... 24,511 24,278 184,293Raw materials and supplies .................................................................................................. 25,071 23,600 188,504
¥104,008 ¥96,449 $782,015
4. DEPRECIATIONDepreciation expense for the years ended March 31, 2002, 2001 and 2000 was ¥33,496 million ($251,850 thousand), ¥35,630 million and¥34,472 million, respectively.
– 40 –

5. SHORT-TERM BORROWINGS AND LONG-TERM DEBTShort-term borrowings are, with minor exceptions, unsecured and generally represented overdrafts. The annual interest rates applicable tothe borrowings at March 31, 2002 and 2001 ranged from 0.38% to 28.00% and from 0.33% to 20.00%, respectively.
Long-term debt at March 31, 2002 and 2001 consisted of the following:
Thousands of Millions of yen U.S. dollars
2002 2001 2002
Bonds without collateral:1.9% convertible bonds due 2002 ............................................................................. ¥ — ¥ 18,303 $ —2.675% bonds due 2007............................................................................................ 15,000 15,000 112,7822.425% bonds due 2005............................................................................................ 10,000 10,000 75,1882.075% bonds due 2003............................................................................................ 15,000 15,000 112,7821.600% bonds due 2001............................................................................................ — 10,000 —2.050% bonds due 2008............................................................................................ 20,000 20,000 150,376
Loans from banks, insurance companies and government-sponsored agencies:With collateral............................................................................................................. 8,705 10,835 65,451Without collateral........................................................................................................ 15,459 26,391 116,233
Customers’ deposits ...................................................................................................... 14,370 14,770 108,045Other .............................................................................................................................. 4,826 1,134 36,286
103,360 141,433 777,143Current portion ............................................................................................................... (8,925) (42,922) (67,105)
¥ 94,435 ¥ 98,511 $710,038
The annual maturities of long-term debt subsequent to March 31, 2002 are summarized as follows:
Thousands ofYear ending March 31 Millions of yen U.S. dollars
2003............................................................................................................................................................. ¥ 8,925 $ 67,1052004............................................................................................................................................................. 23,008 172,9922005............................................................................................................................................................. 2,131 16,0232006............................................................................................................................................................. 11,552 86,8572007 and thereafter ..................................................................................................................................... 57,744 434,165
¥103,360 $777,143
6. PLEDGED ASSETSThe assets pledged as collateral for short-term borrowings, notes and accounts payable and long-term debt at March 31, 2002 were as follows:
Thousands ofMillions of yen U.S. dollars
Property, plant and equipment, at net book value........................................................................................... ¥18,583 $139,722Investment securities........................................................................................................................................ 38 286Other assets ..................................................................................................................................................... 271 2,038
¥18,893 $142,053
7. INCOME TAXESThe Company and its domestic consolidated subsidiaries are subject to a number of taxes based on income which, in the aggregate, resultedin a statutory tax rate of approximately 42% in 2002, 2001 and 2000. Income taxes of the foreign consolidated subsidiaries are based gener-ally on the tax rates applicable in their countries of incorporation.
The effective tax rates reflected in the consolidated statements of operations for the years ended March 31, 2002, 2001 and 2000 differfrom the statutory tax rate for the following reasons:
2002 2001 2000
Statutory tax rate.................................................................................................................................... 42.0% (42.0)% 42.0%Effect of:
Expenses not deductible for income tax purposes............................................................................ 6.2 17.2 4.3Dividend income deductible for income tax purposes....................................................................... (6.2) (4.4) (2.5)Other, net............................................................................................................................................ (2.0) (2.4) (2.9)
Effective tax rate..................................................................................................................................... 40.0% (31.6)% 40.9%
– 41 –

The significant components of deferred tax assets and liabilities as of March 31, 2002 and 2001 were as follows:
Thousands of Millions of yen U.S. dollars
2002 2001 2002
Deferred tax assets:Inventories ......................................................................................................................... ¥ 984 ¥ 990 $ 7,398Securities........................................................................................................................... 4,443 4,540 33,406Property, plant and equipment.......................................................................................... 1,100 907 8,271Accrued retirement benefits .............................................................................................. 28,899 28,896 217,286Accrued expenses............................................................................................................. 1,916 2,516 14,406Accrued bonuses............................................................................................................... 2,804 2,181 21,083Unrealized profit ................................................................................................................ 3,847 4,323 28,925Accrued enterprise tax ...................................................................................................... 969 968 7,286Other ............................................................................................................................... 4,835 1,428 36,353
Total deferred tax assets....................................................................................................... 49,801 46,753 374,444
Deferred tax liabilities:Depreciation ...................................................................................................................... 6,163 8,135 46,338Unrealized gain on land ..................................................................................................... 2,470 2,470 18,571Other ............................................................................................................................... 7,619 16,152 57,286
Total deferred tax liabilities ................................................................................................... 16,253 26,758 122,203
Net deferred tax assets ......................................................................................................... ¥33,548 ¥19,994 $252,241
8. RETIREMENT BENEFIT PLANSThe Company and its domestic consolidated subsidiaries have defined benefit plans, i.e., welfare pension fund plans, tax-qualified pensionplans and lump-sum payment plans, covering substantially all employees who are entitled to lump-sum or annuity payments, the amounts ofwhich are determined by reference to their basic rates of pay, length of service, and the conditions under which termination occurs. Certainforeign consolidated subsidiaries have defined contribution plans in addition to defined benefit plans.
The following table sets forth the funded and accrued status of the plans, and the amounts recognized in the consolidated balance sheetsas of March 31, 2002 and 2001 for the Company’s and the consolidated subsidiaries’ defined benefit plans:
Thousands of Millions of yen U.S. dollars
2002 2001 2002
Retirement benefit obligation ................................................................................................ ¥(269,581) ¥(236,964) $(2,026,925)Plan assets at fair value......................................................................................................... 155,670 155,258 1,170,451Unfunded retirement benefit obligation ................................................................................ (113,910) (81,705) (856,466)Unrecognized actuarial gain or loss ...................................................................................... 46,288 11,018 348,030Unrecognized prior service cost............................................................................................ (3,049) — (22,925)Accrued retirement benefits .................................................................................................. ¥ (70,672) ¥ (70,687) $ (531,368)
The government-sponsored portion of the benefits under the welfare pension fund plans has been included in the amounts shown in theabove table.
The components of retirement benefit expenses for the years ended March 31, 2002 and 2001 are outlined as follows:
Thousands of Millions of yen U.S. dollars
2002 2001 2002
Service cost........................................................................................................................... ¥ 6,713 ¥ 6,900 $ 50,474Interest cost........................................................................................................................... 8,095 7,869 60,865Expected return on plan assets............................................................................................. (5,432) (5,505) (40,842)Amortization of prior service cost.......................................................................................... (48) — (361)Amortization of net retirement benefit obligation at transition .............................................. — 52,293 —Amortization of actuarial gain or loss .................................................................................... 1,089 — 8,188Other...................................................................................................................................... 362 — 2,722Total....................................................................................................................................... ¥10,779 ¥61,557 $ 81,045
The assumptions used in accounting for the above plans were as follows:
As of March 31,
2002 2001
Discount rates ................................................................................................................................................ Mainly 2.5% Mainly 3.5%Expected return on assets ............................................................................................................................. Mainly 3.5% Mainly 3.5%
– 42 –
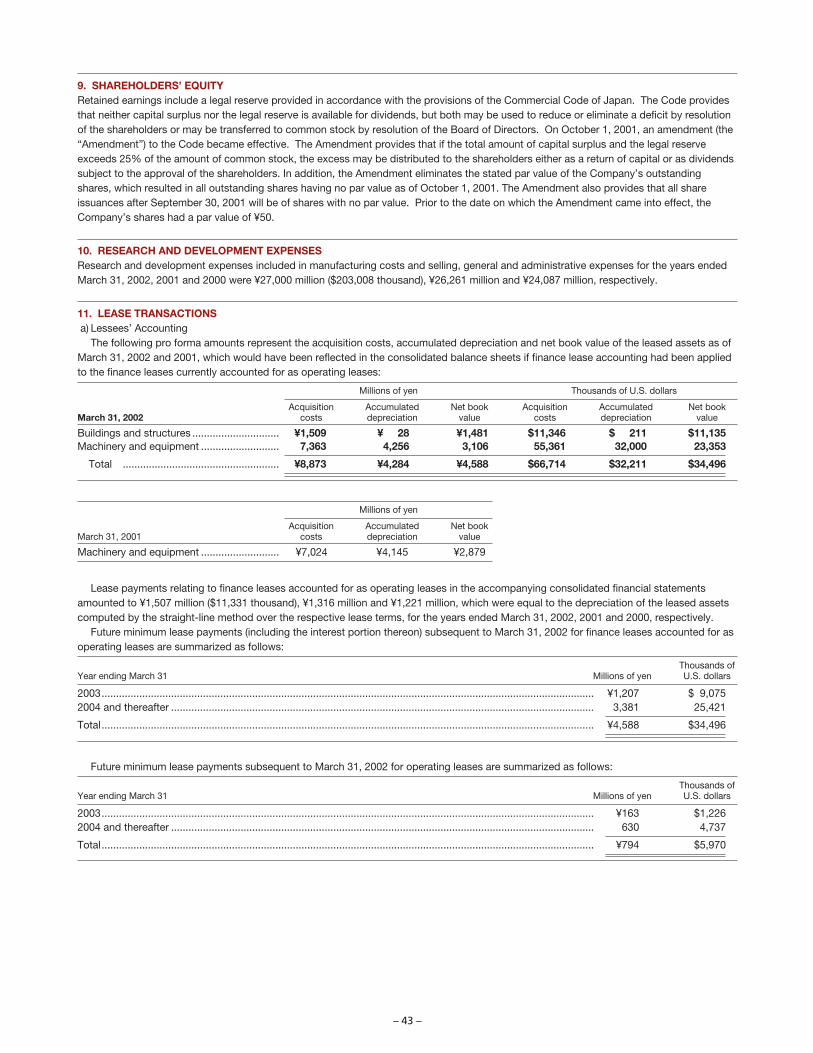
9. SHAREHOLDERS’ EQUITYRetained earnings include a legal reserve provided in accordance with the provisions of the Commercial Code of Japan. The Code providesthat neither capital surplus nor the legal reserve is available for dividends, but both may be used to reduce or eliminate a deficit by resolutionof the shareholders or may be transferred to common stock by resolution of the Board of Directors. On October 1, 2001, an amendment (the“Amendment”) to the Code became effective. The Amendment provides that if the total amount of capital surplus and the legal reserveexceeds 25% of the amount of common stock, the excess may be distributed to the shareholders either as a return of capital or as dividendssubject to the approval of the shareholders. In addition, the Amendment eliminates the stated par value of the Company’s outstandingshares, which resulted in all outstanding shares having no par value as of October 1, 2001. The Amendment also provides that all shareissuances after September 30, 2001 will be of shares with no par value. Prior to the date on which the Amendment came into effect, theCompany’s shares had a par value of ¥50.
10. RESEARCH AND DEVELOPMENT EXPENSESResearch and development expenses included in manufacturing costs and selling, general and administrative expenses for the years endedMarch 31, 2002, 2001 and 2000 were ¥27,000 million ($203,008 thousand), ¥26,261 million and ¥24,087 million, respectively.
11. LEASE TRANSACTIONSa) Lessees’ Accounting
The following pro forma amounts represent the acquisition costs, accumulated depreciation and net book value of the leased assets as ofMarch 31, 2002 and 2001, which would have been reflected in the consolidated balance sheets if finance lease accounting had been appliedto the finance leases currently accounted for as operating leases:
Millions of yen Thousands of U.S. dollars
Acquisition Accumulated Net book Acquisition Accumulated Net bookMarch 31, 2002 costs depreciation value costs depreciation value
Buildings and structures .............................. ¥1,509 ¥ 28 ¥1,481 $11,346 $ 211 $11,135Machinery and equipment ........................... 7,363 4,256 3,106 55,361 32,000 23,353
Total ...................................................... ¥8,873 ¥4,284 ¥4,588 $66,714 $32,211 $34,496
Millions of yen
Acquisition Accumulated Net bookMarch 31, 2001 costs depreciation value
Machinery and equipment ........................... ¥7,024 ¥4,145 ¥2,879
Lease payments relating to finance leases accounted for as operating leases in the accompanying consolidated financial statementsamounted to ¥1,507 million ($11,331 thousand), ¥1,316 million and ¥1,221 million, which were equal to the depreciation of the leased assetscomputed by the straight-line method over the respective lease terms, for the years ended March 31, 2002, 2001 and 2000, respectively.
Future minimum lease payments (including the interest portion thereon) subsequent to March 31, 2002 for finance leases accounted for asoperating leases are summarized as follows:
Thousands ofYear ending March 31 Millions of yen U.S. dollars
2003.......................................................................................................................................................................... ¥1,207 $ 9,0752004 and thereafter .................................................................................................................................................. 3,381 25,421
Total.......................................................................................................................................................................... ¥4,588 $34,496
Future minimum lease payments subsequent to March 31, 2002 for operating leases are summarized as follows:
Thousands ofYear ending March 31 Millions of yen U.S. dollars
2003.......................................................................................................................................................................... ¥163 $1,2262004 and thereafter .................................................................................................................................................. 630 4,737
Total.......................................................................................................................................................................... ¥794 $5,970
– 43 –

b) Lessors’ AccountingThe following amounts represent the acquisition costs, accumulated depreciation and net book value of the leased assets relating to
finance leases accounted for as operating leases at March 31, 2002 and 2001:
Millions of yen Thousands of U.S. dollars
Acquisition Accumulated Net book Acquisition Accumulated Net bookMarch 31, 2002 costs depreciation value costs depreciation value
Machinery and equipment ........................... ¥1,436 ¥865 ¥570 $10,797 $6,504 $4,286
Millions of yen
Acquisition Accumulated Net bookMarch 31, 2001 costs depreciation value
Machinery and equipment ........................... ¥1,057 ¥320 ¥737
Lease income relating to finance leases accounted for as operating leases in the accompanying consolidated financial statements amounted to¥623 million ($4,684 thousand), ¥193 million and ¥82 million for the years ended March 31, 2002, 2001 and 2000, respectively. Depreciation of theassets leased under finance leases accounted for as operating leases amounted to ¥256 million ($1,925 thousand), ¥174 million and ¥74 million forthe years ended March 31, 2002, 2001 and 2000, respectively.
Future minimum lease income (including the interest portion thereon) subsequent to March 31, 2002 for the finance leases accounted for asoperating leases are summarized as follows:
Thousands ofYear ending March 31 Millions of yen U.S. dollars
2003.......................................................................................................................................................................... ¥304 $2,2862004 and thereafter .................................................................................................................................................. 652 4,902
Total.......................................................................................................................................................................... ¥957 $7,195
12. COMMITMENTS AND CONTINGENT LIABILITIESCommitments for capital expenditures outstanding at March 31, 2002 aggregated approximately ¥10,587 million ($79,602 thousand).
At March 31, 2002, the Company and its consolidated subsidiaries had the following contingent liabilities:
Thousands of Millions of yen U.S. dollars
As endorser of documentary export bills and trade notes receivable discounted with banks ................................. ¥ 388 $ 2,917As guarantor of indebtedness of unconsolidated subsidiaries, affiliates and employees ........................................ 3,754 28,226
¥4,142 $31,143
13. AMOUNTS PER SHARE
Yen U.S. dollars
2002 2001 2000 2002
Net income (loss):Basic........................................................................................................................... ¥ 48.4 ¥ (17.8) ¥ 27.2 $0.364Diluted ........................................................................................................................ — — 27.1 —
Cash dividends............................................................................................................... 10.0 10.0 10.0 0.075Net assets ...................................................................................................................... 586.3 556.6 624.6 4.408
The computation of basic net income per share is based on the weighted average number of shares of common stock outstanding duringeach year. Diluted net income per share is computed based on the weighted average number of shares of common stock outstanding eachyear after giving effect to the dilutive potential of common stock to be issued upon the conversion of convertible bonds. No dilutive netincome per share for the year ended March 31, 2002 was presented because there were no convertible bonds outstanding.
Cash dividends per share represent the cash dividends declared as applicable to the respective years together with the interim cash divi-dends paid.
Net assets per share are based on the number of shares outstanding at the respective balance sheet dates.
14. RELATED PARTY TRANSACTIONSThe Company purchased goods for resale in the amount of ¥183,938 million ($1,382,992 thousand), ¥176,468 million and ¥168,433 millionfrom its affiliates, which were accounted for by the equity method, for the years ended March 31, 2002, 2001 and 2000, respectively.Purchase prices were negotiated on an arm’s-length basis based on the final retail prices of the Company.
– 44 –

15. SECURITIESa) Information regarding marketable securities classified as other securities as of March 31, 2002 and 2001 is as follows:
Millions of yen Thousands of U.S. dollars
Acquisition Carrying Unrealized Acquisition Carrying UnrealizedMarch 31, 2002 cost value gain (loss) cost value gain (loss)
Securities whose carrying value exceeds their acquisition cost:Stock ............................................................... ¥33,048 ¥52,615 ¥19,567 $248,481 $395,602 $147,120Debt securities................................................. 1 1 — 8 8 —Other................................................................ — — — — — —
Subtotal ............................................................... 33,049 52,616 19,567 248,489 395,609 147,120
Securities whose acquisition cost exceeds their carrying value:Stock ............................................................... 15,157 11,818 (3,338) 113,962 88,857 (25,098)Debt securities................................................. 3 2 (0) 23 15 (0)Other................................................................ 355 335 (19) 2,669 2,519 (143)
Subtotal ............................................................... 15,515 12,156 (3,358) 116,654 91,398 (25,248)
Total ......................................................................... ¥48,564 ¥64,773 ¥16,208 $365,143 $487,015 $121,865
Millions of yen
Acquisition Carrying UnrealizedMarch 31, 2001 cost value gain (loss)
Securities whose carrying value exceeds their acquisition cost:Stock ............................................................... ¥44,294 ¥81,886 ¥37,592Debt securities................................................. 24 25 1Other................................................................ 200 201 1
Subtotal ............................................................... 44,518 82,112 37,594
Securities whose acquisition cost exceeds their carrying value:Stock ............................................................... 5,019 4,030 (988)Debt securities................................................. — — —Other................................................................ 355 343 (11)
Subtotal ............................................................... 5,374 4,374 (999)
Total ......................................................................... ¥49,892 ¥86,486 ¥36,594
b) Sales of securities classified as other securities amounted to ¥2,976 million ($22,376 thousand) with an aggregate gain of ¥694 million($5,218 thousand) and an aggregate loss of ¥452 million ($3,398 thousand) for the year ended March 31, 2002. For the year ended March 31,2001, sales of securities classified as other securities amounted to ¥29,262 million with an aggregate gain of ¥7,212 million and an aggregateloss of ¥309 million.
c) The redemption schedule for securities with maturity dates classified as other securities as of March 31, 2002 is summarized as follows:
Millions of yen Thousands of U.S. dollars
Due in Due after Due after Due in Due after Due afterone year one year five years through one year one year five years throughor less through five years ten years or less through five years ten years
Government bonds.......................................... ¥ 0 ¥103 ¥ — $ 0 $ 774 $ —Corporate bonds ............................................. 2 — — 15 — —Other................................................................ — 298 — — 2,241 —
Total ..................................................................... ¥ 3 ¥401 ¥ — $23 $3,015 $ —
– 45 –

16. DERIVATIVE TRANSACTIONSThe Company and certain consolidated subsidiaries have entered into derivative transactions in order to manage certain risks arising fromadverse fluctuations in foreign currency exchange rates, interest rates and commodity prices.
The Company is exposed to credit risk in the event of nonperformance by the counterparties to the derivative financial instruments, butany such loss would not be material because the Company enters into transactions only with financial institutions with high credit ratings.The notional amounts of the derivative financial instruments do not necessarily represent the amounts exchanged by the parties and, there-fore, are not a direct measure of the Company’s risk exposure in connection with derivative financial instruments.
a) Summarized below are the notional amounts and the estimated fair value of the derivative transactions outstanding at March 31, 2002 and 2001:1) Currency-related transactions
Millions of yen Thousands of U.S. dollars
Notional Unrealized Notional UnrealizedMarch 31, 2002 amount Fair value gain (loss) amount Fair value gain (loss)
Forward foreign exchange contracts:Sell:
US$ ................................................................................. ¥879 ¥885 ¥ (5) $6,609 $6,654 $ (38)Others.............................................................................. 235 236 (0) 1,767 1,774 (0)
Buy:US$ ................................................................................. 913 950 36 6,865 7,143 271Others.............................................................................. 44 44 0 331 331 0
Options:Put options, purchased:US$ ................................................................................. 926 24 8 6,962 180 60Premium.......................................................................... 15 113
Total ..................................................................................... ¥38 $286
Millions of yen
Notional UnrealizedMarch 31, 2001 amount Fair value gain (loss)
Forward foreign exchange contracts:Sell:
US$ ................................................................................. ¥6,968 ¥7,030 ¥(61)Others.............................................................................. 839 815 24
Buy:US$ ................................................................................. 111 120 8Others.............................................................................. 64 58 (6)
Options:Put options, purchased:US$ ................................................................................. 926 50 37Premium.......................................................................... 12
Total ..................................................................................... ¥ 3
Note: The notional amounts of the forward foreign exchange contracts and currency swaps presented above exclude those entered into tohedge receivables and payables denominated in foreign currencies which have been translated and are reflected at their corresponding con-tracted rates in the accompanying consolidated balance sheets.
2) Interest-related transactions
Millions of yen Thousands of U.S. dollars
Notional Unrealized Notional UnrealizedMarch 31, 2002 amount Fair value gain (loss) amount Fair value gain (loss)
Interest rate swaps:Receive/floating and pay/fixed........................................ ¥900 ¥(16) ¥(16) $6,767 $(120) $(120)
Total ..................................................................................... ¥0,000 ¥0,000 ¥(16) $00,000 $00,000 $(120)
Millions of yen
Notional UnrealizedMarch 31, 2001 amount Fair value gain (loss)
Interest rate swaps:Receive/floating and pay/fixed........................................ ¥1,350 ¥1,342 ¥ (7)Receive/fixed and pay/floating........................................ 124 269 35
Total ..................................................................................... ¥28
– 46 –

3) Commodity-related transactions
Millions of yen Thousands of U.S. dollars
Notional Unrealized Notional UnrealizedMarch 31, 2002 amount Fair value gain (loss) amount Fair value gain (loss)
Options:Call options, purchased .................................................. ¥17 ¥17 ¥(0) $128 $128 $(0)
Total ..................................................................................... ¥00 ¥00 ¥(0) $000 $000 $(0)
Millions of yen
Notional UnrealizedMarch 31, 2001 amount Fair value gain (loss)
Options:Call options, purchased .................................................. ¥88 ¥87 ¥(0)
Total ..................................................................................... ¥(0)
17. SEGMENT INFORMATIONThe Company and its consolidated subsidiaries are primarily engaged in the manufacture and sale of products in Japan and overseas in threemajor segments: foods which include AJI-NO-MOTO and other seasonings, edible oils, processed foods, beverages and dairy products; finechemicals which include pharmaceuticals, amino acids and specialty chemicals; and other which includes distribution and other products.
The business and geographical segments of the Company and its consolidated subsidiaries for the years ended March 31, 2002, 2001 and2000 are outlined as follows:
Business Segments
Millions of yen
FineYear ended March 31, 2002 Foods Chemicals Other Total Eliminations Consolidated
I. Sales and operating income:Sales to third parties ....................... ¥636,201 ¥215,708 ¥ 91,629 ¥ 943,540 ¥ — ¥943,540Intragroup sales and transfers ........ 10,677 2,786 69,325 82,789 (82,789) —
Total sales....................................... 646,879 218,495 160,955 1,026,330 (82,789) 943,540Operating expenses........................ 625,393 196,004 156,128 977,525 (83,000) 894,525
Operating income ........................... ¥ 21,485 ¥ 22,491 ¥ 4,827 ¥ 48,804 ¥ 210 ¥ 49,015
II. Assets, depreciationand capital expenditures:
Total assets..................................... ¥378,674 ¥229,472 ¥114,709 ¥ 722,855 ¥ 117,296 ¥840,152Depreciation and amortization........ 19,748 15,759 2,705 38,213 (990) 37,222Capital expenditures ....................... 22,856 20,208 2,724 45,788 (511) 45,277
Thousands of U.S. dollars
FineYear ended March 31, 2002 Foods Chemicals Other Total Eliminations Consolidated
I. Sales and operating income:Sales to third parties ....................... $4,783,466 $1,621,865 $ 688,940 $7,094,286 $ — $7,094,286Intragroup sales and transfers ........ 80,278 20,947 521,241 622,474 (622,474) —
Total sales....................................... 4,863,752 1,642,820 1,210,188 7,716,767 (622,474) 7,094,286Operating expenses........................ 4,702,203 1,473,714 1,173,895 7,349,812 (624,060) 6,725,752
Operating income ........................... $ 161,541 $ 169,105 $ 36,293 $ 366,947 $ 1,579 $ 368,534
II. Assets, depreciationand capital expenditures:
Total assets..................................... $2,847,173 $1,725,353 $ 862,474 $5,435,000 $ 881,925 $6,316,932Depreciation and amortization........ 148,481 118,489 20,338 287,316 (7,444) 279,865Capital expenditures ....................... 171,850 151,940 20,481 344,271 (3,842) 340,429
– 47 –

Millions of yen
FineYear ended March 31, 2001 Foods Chemicals Other Total Eliminations Consolidated
I. Sales and operating income:Sales to third parties ....................... ¥622,001 ¥188,421 ¥ 98,106 ¥908,528 ¥ — ¥908,528Intragroup sales and transfers ........ 11,618 2,050 62,618 76,287 (76,287) —
Total sales....................................... 633,620 190,472 160,724 984,816 (76,287) 908,528Operating expenses........................ 609,991 179,474 157,318 946,784 (76,060) 870,723
Operating income ........................... ¥ 23,629 ¥ 10,998 ¥ 3,405 ¥ 38,032 ¥ (227) ¥ 37,805
II. Assets, depreciationand capital expenditures:
Total assets..................................... ¥371,626 ¥219,752 ¥100,604 ¥691,984 ¥136,960 ¥828,945Depreciation and amortization........ 19,433 17,732 2,456 39,621 (981) 38,640Capital expenditures ....................... 25,306 16,708 5,455 47,469 (555) 46,914
As a result of an adoption of a new accounting standard for retirement benefits as explained in Note 1.j., operating income for “Foods,”“Fine Chemicals” and “Other” decreased by ¥1,933 million, ¥1,199 million and ¥89 million for the year ended March 31, 2001 over the corre-sponding amounts for the previous year.
Millions of yen
FineYear ended March 31, 2000 Foods Chemicals Other Total Eliminations Consolidated
I. Sales and operating income:Sales to third parties........................... ¥598,841 ¥134,573 ¥ 96,006 ¥829,422 ¥ — ¥829,422Intragroup sales and transfers............ 16,047 2,856 47,563 66,467 (66,467) —
Total sales .......................................... 614,889 137,430 143,570 895,889 (66,467) 829,422Operating expenses ........................... 590,976 132,419 139,441 862,838 (66,465) 796,372
Operating income ............................... ¥ 23,913 ¥ 5,010 ¥ 4,128 ¥ 33,051 ¥ (1) ¥ 33,050
II. Assets, depreciation and capital expenditures:
Total assets ........................................ ¥349,774 ¥180,864 ¥ 95,550 ¥626,189 ¥106,791 ¥732,980Depreciation and amortization ........... 20,389 14,642 3,081 38,112 (778) 37,334Capital expenditures........................... 21,256 30,693 4,605 56,555 (790) 55,765
Geographical Segments
Millions of yen
Year ended March 31, 2002 Japan Asia America Europe Total Eliminations Consolidated
Sales to third parties ........................... ¥716,774 ¥87,836 ¥56,598 ¥82,329 ¥ 943,540 ¥ — ¥943,540Interarea sales and transfers ............... 33,567 11,498 9,785 4,217 59,068 (59,068) —
Total sales ........................................... 750,342 99,335 66,384 86,546 1,002,608 (59,068) 943,540Operating expenses ............................ 723,735 88,125 63,306 78,426 953,593 (59,068) 894,525
Operating income................................ ¥ 26,606 ¥11,209 ¥ 3,077 ¥ 8,120 ¥ 49,015 ¥ — ¥ 49,015
Total assets ......................................... ¥508,701 ¥72,034 ¥58,645 ¥61,753 ¥ 701,135 ¥139,017 ¥840,152
Thousands of U.S. dollars
Year ended March 31, 2002 Japan Asia America Europe Total Eliminations Consolidated
Sales to third parties ........................... $5,389,278 $660,421 $425,549 $619,015 $7,094,286 $ — $7,094,286Interarea sales and transfers ............... 252,383 86,451 73,571 31,707 444,120 (444,120) —
Total sales ........................................... 5,641,669 746,880 499,128 650,722 7,538,406 (444,120) 7,094,286Operating expenses ............................ 5,441,617 662,594 475,985 589,669 7,169,872 (444,120) 6,725,752
Operating income................................ $ 200,045 $ 84,278 $ 23,135 $ 61,053 $ 368,534 $ — $ 368,534
Total assets ......................................... $3,824,820 $541,609 $440,940 $464,308 $5,271,692 $1,045,241 $6,316,932
Millions of yen
Year ended March 31, 2001 Japan Asia America Europe Total Eliminations Consolidated
Sales to third parties ........................... ¥716,294 ¥70,527 ¥50,224 ¥71,482 ¥908,528 ¥ — ¥908,528Interarea sales and transfers ............... 30,489 6,233 6,912 2,029 45,665 (45,665) —
Total sales ........................................... 746,784 76,760 57,136 73,512 954,194 (45,665) 908,528Operating expenses ............................ 721,688 67,938 55,883 70,878 916,388 (45,665) 870,723
Operating income................................ ¥ 25,096 ¥ 8,822 ¥ 1,252 ¥ 2,634 ¥ 37,805 ¥ — ¥ 37,805
Total assets ......................................... ¥515,798 ¥59,540 ¥48,740 ¥54,285 ¥678,364 ¥150,580 ¥828,945
– 48 –

As a result of an adoption of a new accounting standard for retirement benefits as explained in Note 1.j., operating income for “Japan”decreased by ¥3,222 million for the year ended March 31, 2001 over the corresponding amount for the previous year.
Millions of yen
Year ended March 31, 2000 Japan Asia America Europe Total Eliminations Consolidated
Sales to third parties ...................... ¥688,276 ¥60,136 ¥35,490 ¥45,518 ¥829,422 ¥ — ¥829,422Interarea sales and transfers.......... 31,070 5,617 6,236 2,288 45,213 (45,213) —
Total sales ...................................... 719,347 65,754 41,726 47,807 874,635 (45,213) 829,422Operating expenses ....................... 694,826 58,302 41,000 47,456 841,585 (45,213) 796,372
Operating income........................... ¥ 24,521 ¥ 7,451 ¥ 726 ¥ 350 ¥ 33,050 ¥ — ¥ 33,050
Total assets .................................... ¥493,245 ¥63,662 ¥38,702 ¥34,252 ¥629,864 ¥103,116 ¥732,980
Overseas sales, which include export sales of the Company and its domestic consolidated subsidiaries and sales (other than exports toJapan) of the foreign consolidated subsidiaries for the years ended March 31, 2002, 2001 and 2000, are summarized as follows:
Millions of yen
Year ended March 31, 2002 Asia America Europe Total
Overseas sales .......................................................................................... ¥97,863 ¥63,161 ¥82,744 ¥243,769Consolidated net sales .............................................................................. 943,540
Thousands of U.S. dollars
Year ended March 31, 2002 Asia America Europe Total
Overseas sales .......................................................................................... $735,812 $474,895 $622,135 $1,832,850Consolidated net sales .............................................................................. 7,094,286Overseas sales as a percentage of consolidated net sales ...................... 10.4% 6.7% 8.8% 25.8%
Millions of yen
Year ended March 31, 2001 Asia America Europe Total
Overseas sales .......................................................................................... ¥79,182 ¥56,798 ¥70,701 ¥206,682Consolidated net sales .............................................................................. 908,528Overseas sales as a percentage of consolidated net sales ....................... 8.7% 6.3% 7.8% 22.8%
Millions of yen
Year ended March 31, 2000 Asia America Europe Total
Overseas sales .......................................................................................... ¥65,312 ¥40,692 ¥44,820 ¥150,825Consolidated net sales .............................................................................. 829,422Overseas sales as a percentage of consolidated net sales ...................... 7.9% 4.9% 5.4% 18.2%
18. SUBSEQUENT EVENTS1) On April 1, 2002, all shares of Ajinomoto Oil Mills Co., Inc. a wholly-owned consolidated subsidiary of the Company, were transferred inexchange for a 33.4% interest in HONEN AJINOMOTO OIL MILLS, INC. (“HONEN AJINOMOTO”), a joint holding company newly establishedby the Company and the shareholders of HONEN Corporation. As a result, Ajinomoto Oil Mills Co., Inc. and HONEN Corporation becamewholly-owned subsidiaries of HONEN AJINOMOTO.
Summarized balance sheets of Ajinomoto Oil Mills Co., Inc. and HONEN Corporation as of March 31, 2002 are as follows:
Ajinomoto Oil Mills Co., Inc. HONEN Corporation
Thousands of Thousands ofMillions of yen U.S. dollars Millions of yen U.S. dollars
Assets:Current assets ......................................................................................... ¥20,257 $152,308 ¥34,593 $260,098Fixed assets............................................................................................. 14,660 110,226 35,158 264,346
Total assets ................................................................................................. ¥34,917 $262,534 ¥69,752 $524,451
Liabilities:Current liabilities ...................................................................................... ¥18,113 $136,188 ¥28,161 $211,737Non-current liabilities............................................................................... 642 4,827 10,054 75,594
Total liabilities .............................................................................................. 18,756 141,023 38,215 287,331
Shareholders’ equity.................................................................................... 16,161 121,511 31,536 237,113
Total liabilities and shareholders’ equity ..................................................... ¥34,917 $262,534 ¥69,752 $524,451
2) The following appropriations of retained earnings of the Company, which have not been reflected in the accompanying consolidated finan-cial statements for the year ended March 31, 2002, were approved by the shareholders at a meeting held on June 27, 2002:
Thousands ofMillions of yen U.S. dollars
Year-end cash dividends (¥5=US$0.038 per share) ................................................................................................. ¥3,249 $24,429Bonuses to directors and statutory auditors............................................................................................................. 186 1,398
– 49 –

The Board of Directors and Shareholders
Ajinomoto Co., Inc.
We have examined the consolidated balance sheets of Ajinomoto Co., Inc. and consolidated subsidiaries as
of March 31, 2002 and 2001, and the related consolidated statements of operations, shareholders’ equity,
and cash flows for each of the three years in the period ended March 31, 2002, all expressed in yen. Our
examinations were made in accordance with auditing standards, procedures and practices generally accept-
ed and applied in Japan and, accordingly, included such tests of the accounting records and such other
auditing procedures as we considered necessary in the circumstances.
In our opinion, the accompanying consolidated financial statements, expressed in yen, present fairly the con-
solidated financial position of Ajinomoto Co., Inc. and consolidated subsidiaries at March 31, 2002 and 2001,
and the consolidated results of their operations and their cash flows for each of the three years in the period
ended March 31, 2002 in conformity with accounting principles and practices generally accepted in Japan
applied on a consistent basis.
As described in Note 1 to the consolidated financial statements, Ajinomoto Co., Inc. and consolidated sub-
sidiaries have adopted new accounting standards for consolidation and research and development expenses
effective the year ended March 31, 2000 and for employees’ retirement benefits, financial instruments and
foreign currency translations effective the year ended March 31, 2001 in the preparation of their consolidated
financial statements.
The U.S. dollar amounts in the accompanying consolidated financial statements with respect to the year
ended March 31, 2002 are presented solely for convenience. Our examination also included the translation of
yen amounts into U.S. dollar amounts and, in our opinion, such translation has been made on the basis
described in Note 2 to the consolidated financial statements.
June 27, 2002
See Note 1 to the consolidated financial statements which explains the basis of preparing the consolidated financial statements of Ajinomoto Co., Inc. and consolidated subsidiaries under Japanese accounting principles and practices.
Report of Certified Public Accountants
– 50 –

Board of Directors and Auditors(As of July 1, 2002)
– 51 –
PRESIDENT
Kunio Egashira
EXECUTIVE VICE PRESIDENT
Takeshi SuzukiEnvironment Dept.; Public Relations Dept.
EXECUTIVE MANAGING DIRECTORS
Takuzo KitamuraPresident, Global Foods & Amino Acids Company
Hisaya UshiodaSecretarial Office; General Affairs Dept.; FinanceDept.; Legal Dept.; Administration Office for CalpisCo., Ltd.; Administration Office for Ajinomoto GeneralFoods, Inc.; Administration Office for HONEN AJINOMOTO OIL MILLS, INC.
Tohru NishiyamaQuality Assurance & External Scientific Affairs Dept.;R&D Management Dept.; Intellectual Property Center;Institute of Life Sciences
Keiichiro AiharaPresident, Pharmaceutical Company; Purchasing Dept.
MANAGING DIRECTORS
Tadao TokiHealth Services Development Dept.; ResearchInstitute for Health Fundamentals
Norio YamaguchiCorporate Planning & Information Systems Dept.;Human Resources Dept.; Logistics & ServiceBusiness Strategy Dept.
Sohei IshiwataPresident, Seasonings & Food Products Company;Advertising Dept.
Takao IkedaVice President, Seasonings & Food ProductsCompany
Kinzo IitaniProduction Management Dept.; Technology &Engineering Center; Kawasaki Administration &Coordination Office; Tokai Administration &Coordination Office; Kyushu Administration &Coordination Office
DIRECTORS
Yoichi Kobayashi General Manager, North America Div., Global Foods& Amino Acids Company; President, AjinomotoU.S.A., Inc.
Hiroshi SakaguchiGeneral Manager, Kawasaki Administration &Coordination Office
Toshihide YukawaGeneral Manager, Tokai Administration &Coordination Office and Tokai Plant I
Shigetoshi SuzukiPresident, Ajinomoto Takara Corporation, Inc.
Chikahiko EguchiVice President, Pharmaceutical Company; GeneralManager, Pharmaceutical Research Laboratories,Pharmaceutical Company
Tsuyoshi MiuraVice President, Global Foods & Amino AcidsCompany
Shinji SasakiExecutive Vice President, HONEN AJINOMOTO OILMILLS, INC.; President, Ajinomoto Oil Mills Co., Inc.
Masatoshi ItoExecutive Vice President, Ajinomoto Frozen FoodsCo., Inc.
Daiji ShindoGeneral Manager, Tokyo Branch, Marketing Div.,Seasonings & Food Products Company
Yukimichi TamuraGeneral Manager, Europe & Africa Div., Global Foods& Amino Acids Company
Yasunori YoshiokaGeneral Manager, Finance Dept.
Takashi KurematsuGeneral Manager, Corporate Planning & InformationSystems Dept.
Osamu TosakaGeneral Manager, Kyushu Administration &Coordination Office and Kyushu Plant
Toshio TakahashiGeneral Manager, Sweetener Dept., Global Foods &Amino Acids Company
Takashi UtagawaGeneral Manager, Fermentation & BiotechnologyLaboratories, Global Foods & Amino Acids Company
Namio TerashiGeneral Manager, Human Resources Dept.
Keiichi YokoyamaGeneral Manager, Osaka Branch, Marketing Div.,Seasonings & Food Products Company
Yutaka KunimotoVice President, Global Foods & Amino AcidsCompany
Hirozumi EtoGeneral Manager, R&D Management Dept.
STANDING CORPORATE AUDITORS
Ichiro Ohashi
Yutaka Naito
Toshikatsu Saito
CORPORATE AUDITOR
Tadao SuzukiPresident, Mercian Corporation
Takuzo Kitamura Hisaya Ushioda Tohru Nishiyama
Keiichiro Aihara Tadao Toki Norio Yamaguchi
Sohei Ishiwata Takao Ikeda Kinzo Iitani
Kunio Egashira Takeshi Suzuki

– 52 –
Global Network(As of April 1, 2002)

– 53 –

Ajinomoto Group (International)
Processed Foods
Seasonings
Beverages
FoodProducts
Amino Acids
Pharmaceuticals
Other Businesses
Frozen Foods
COMPANY NAME
Ajinomoto Co., (Thailand) Ltd.Ajinomoto Sales (Thailand) Co., Ltd.AJINOMOTO PHILIPPINES CORPORATIONAjinomoto (Malaysia) BerhadAjinomoto (Singapore) Pte. Ltd.Ajitrade Pte. Ltd.P.T. Ajinomoto IndonesiaP.T. Ajinex InternationalAjinomoto Vietnam Co., Ltd.Ajinomoto Co., (Hong Kong) Ltd.Lianhua Ajinomoto Co., Ltd. Ajinomoto U.S.A., Inc.Ajinomoto Interamericana Indústria e Comércio Ltda.Ajinomoto Biolatina Indústria e Comércio Ltda.Ajinomoto del Perú S.A.West African Seasoning Co., Ltd.
Ajinomoto Frozen Foods (Thailand) Co., Ltd.Ajinomoto Betagro Frozen Foods (Thailand) Co., Ltd.Lianyungang Ajinomoto Ruyi Foods Co., Ltd.Lianyungang Ajinomoto Frozen Foods Co., Ltd.Ajinomoto Frozen Foods U.S.A., Inc.
CPC/AJI (Asia) Ltd.CPC/AJI (Hong Kong) Ltd.CPC/AJI (Malaysia) Sdn. BerhadCPC/AJI (Singapore) Pte. Ltd.California Manufacturing Co., Inc.CPC/AJI (Taiwan) Ltd.CPC/AJI (Thailand) Ltd.Nissin-Ajinomoto Alimentos Ltda.Wan Thai Foods Industry Co., Ltd.Ajinomoto Poland Sp. z o. o.SHANGHAI HOUSE AJINOMOTO FOODS CO., LTD.
Ajinomoto Calpis Beverage (Thailand) Co., Ltd.P.T. Ajinomoto Calpis Beverage Indonesia
Ajinomoto U.S.A., Inc.Ajinomoto Europe Sales G.m.b.H.Ajinomoto Lianhua Amino Acid Co., Ltd. Shanghai Ajinomoto Amino Acid Co., Ltd. S.A. OmniChem N.V.AJINOMOTO EUROLYSINE S.A.S.Ajinomoto Heartland, Inc.Ajinomoto Co., (Thailand) Ltd.AJINOMOTO BIOITALIA S.p.A.Chuanhua Ajinomoto Co., Ltd.Ajinomoto Biolatina Indústria e Comércio Ltda.Ajinomoto Euro-Aspartame S.A.S.Ajinomoto Switzerland AGTaiso Commerce Inc.
Ajinomoto Pharmaceuticals U.S.A., Inc.Ajinomoto Pharmaceuticals Europe Ltd.Forum Bioscience Holdings Ltd.
Fuji Ace Co., Ltd.Malaysia Packaging Industry BerhadAjinomoto (China) Co., Ltd.S.A. Ajinomoto Coordination CenterAjinomoto-Genetika Research Institute (AGRI)
– 54 –
Major Subsidiaries and Affiliates(As of April 1, 2002)

Ajinomoto Group (Japan)
Frozen Foods
Seasonings andProcessed Foods
Edible Oils
Beverages and Dairy Products
FoodProducts
Amino Acids
Pharmaceuticals
Other Businesses
COMPANY NAME
Knorr Foods Co., Ltd.Ajinomoto Packaging Inc.Delica Ace Co., Ltd.Shimadaya CorporationAjinomoto Frozen Bakery Product Co., Ltd.
Ajinomoto Frozen Foods Co., Inc.
HONEN AJINOMOTO OIL MILLS, INC.
Ajinomoto General Foods, Inc.Calpis Co., Ltd.Calpis Ajinomoto Danone Co., Ltd.
Ajinomoto Takara Corporation, Inc. Nippon Protein Co., Ltd.Ajinomoto Fine-Techno Co., Inc.Kawaken Fine Chemicals Co., Ltd.
Ajinomoto Pharma Co., Ltd. Showa Yakuhin Kako Co., Ltd.
Ajinomoto Communications Inc.AJINOMOTO LOGISTICS CORPORATIONAjinomoto Engineering Co., Ltd.Acepackage Co., Ltd.Ajinomoto System Techno CorporationAjinomoto Treasury Management Inc.Aji-Estates Co., Inc.Shin-Nippon Commerce, Inc.Chiyoda Bussan Co., Ltd.Takara-Daimi Co., Ltd.Okinawa Ajinomoto Co., Inc.Ajitsu CorporationCharles River Japan, Inc.
– 55 –

– 56 –
OVERSEAS SUBSIDIARIESAND AFFILIATESBELGIUM
S.A. Ajinomoto Coordination Center N.V.Industrial Research Park Fleming, B-1348 Louvain-la-Neuve, BelgiumTel: +32 (10) 48-3111Fax: +32 (10) 45-6227
S.A. OmniChem N.V.Industrial Research Park Fleming, B-1348 Louvain-la-Neuve, BelgiumTel: +32 (10) 48-3111Fax: +32 (10) 45-0693
S.A. OmniChem N.V., Louvain-la-Neuve PlantIndustrial Research Park Fleming, B-1348 Louvain-la-Neuve, BelgiumTel: +32 (10) 48-3111Fax: +32 (10) 45-0693
S.A. OmniChem N.V., Balen PlantJapanse-Kerselarenlaan 1, B-2490 Balen, BelgiumTel: +32 (14) 81-9811Fax: +32 (14) 81-2974
S.A. OmniChem N.V., Wetteren PlantCooppallaan 91, B-9230 Wetteren, BelgiumTel: +32 (9) 365-3333Fax: +32 (9) 369-8264
BRAZIL
Ajinomoto Biolatina Indústria e Comércio Ltda.Rua Joaquim Távora 541, Vila Mariana, 04015-901 São Paulo,SP, BrazilTel: +55 (11) 5579-6971Fax: +55 (11) 5575-7146
Ajinomoto Biolatina Indústria e Comércio Ltda.,Laranjal Paulista PlantAv. Oriento s/n°., Bairro Entre Rios, Cx.P.: 58, 18500-000 Laranjal Paulista, SP, BrazilTel: +55 (15) 283-9002Fax: +55 (15) 283-9010
Ajinomoto Biolatina Indústria e Comércio Ltda.,Valparaíso PlantRod. Dr. Plácido Rocha Km 39, 16880-000 Valparaíso, SP, BrazilTel: +55 (18) 671-9500Fax: +55 (18) 671-9505
Ajinomoto Interamericana Indústria e Comércio Ltda.Rua Joaquim Távora 541, Vila Mariana, 04015-901 São Paulo, SP, BrazilTel: +55 (11) 5080-6700Fax: +55 (11) 5080-6769/6789
Ajinomoto Interamericana Indústria e Comércio Ltda.,Limeira PlantRodovia Anhanguera Km 131, Bairro Jaguari, 13480-970 Limeira, SP, BrazilTel: +55 (19) 3404-9000Fax: +55 (19) 3404-9100
Nissin-Ajinomoto Alimentos Ltda.Av. Paulista 1842-19°., Edif. Cetenco Plaza-Torre Norte, 01310-200 São Paulo, SP, BrazilTel: +55 (11) 3145-5900Fax: +55 (11) 3145-5901
Nissin-Ajinomoto Alimentos Ltda., Ibiúna PlantRodovia Bunjiro Nakao Km 57, 18150-000 Ibiúna, SP, BrazilTel: +55 (15) 249-1100Fax: +55 (15) 249-1255
CHINA
Ajinomoto Co., Inc., Beijing Office/Ajinomoto (China) Co., Ltd.Room 2201 A, Tower A, Full Link Plaza, No.18, Chaoyangmenwai Ave., Beijing 10020, People’s Republic of ChinaTel: +86 (10) 6588-0110, 0220Fax: +86 (10) 6588-0330, 0440
Ajinomoto (China) Co., Ltd., Guangzhou BranchUnit 1408-1409, Yian Plaza, No. 38 Jian She 6th Road,Guangzhou 510060, People’s Republic of ChinaTel: +86 (20) 8363-3904Fax: +86 (20) 8363-4486
Ajinomoto (China) Co., Ltd., Shanghai BranchRoom 1608, Shanghai Int’l. Trade Center, 2200 Yan An Road (W), Shanghai 200335, People’s Republic of ChinaTel: +86 (21) 6219-2705Fax: +86 (21) 6219-1435
Ajinomoto Co., (Hong Kong) Ltd.21st Floor, Bangkok Bank Bldg., 14-20 Bonham Strand West, Hong KongTel: +852-2534-2888Fax: +852-2534-2899
Ajinomoto Lianhua Amino Acid Co., Ltd.Erhuan Road, Xiangcheng City, Henan Province, People’s Republic of ChinaTel: +86 (394) 4312432Fax: +86 (394) 4315574
Chuanhua Ajinomoto Co., Ltd.Qingbaijiang, Chengdu, Sichuan Province 610301, People’s Republic of ChinaTel: +86 (28) 8360-4305Fax: +86 (28) 8360-4053
CPC/AJI (Asia) Ltd.Suite 1408, Cityplaza 4, 12 Taikoo Wan Road, Taikoo Shing, Hong KongTel: +852-2513-3600Fax: +852-2868-1792
CPC/AJI (Hong Kong) Ltd.6 Dai Fu Street, Tai Po Industrial Estate, Tai Po, New Territories, Hong KongTel: +852-2664-2011Fax: +852-2664-2845
Lianhua Ajinomoto Co., Ltd.Lianwei Road, Xiangcheng City, Henan Province, People’s Republic of ChinaTel: +86 (394) 4323592, 4327353Fax: +86 (394) 4323591
Lianyungang Ajinomoto Frozen Foods Co., Ltd.Dingzi Road East, Xinpu, Lianyungang, Jiangsu Province,People’s Republic of ChinaTel: +86 (518) 5150741Fax: +86 (518) 5150740
Lianyungang Ajinomoto Ruyi Foods Co., Ltd.Dingzi Road East, Xinpu, Lianyungang, Jiangsu Province,People’s Republic of ChinaTel: +86 (518) 5150741Fax: +86 (518) 5150740
Shanghai Ajinomoto Amino Acid Co., Ltd.Rongle Dong Lu 518 Songjiang, Shanghai 201613, People’s Republic of ChinaTel: +86 (21) 57743402Fax: +86 (21) 57740433
SHANGHAI HOUSE AJINOMOTO FOODS CO., LTD.Rongle Dong Lu 520 Songjiang, Shanghai 201613, People’s Republic of ChinaTel: +86 (21) 57743402Fax: +86 (21) 57740433
FRANCE
Ajinomoto Co., Inc., Europe & Africa Division153, rue de Courcelles, 75817 Paris Cedex 17, FranceTel: +33 (1) 47-66-98-63Fax: +33 (1) 47-66-98-56
Ajinomoto Euro-Aspartame S.A.S.Z.I.P. des Huttes, route de la Grande Hernesse, 59820 Gravelines, FranceTel: +33 (3) 28-22-74-00Fax: +33 (3) 28-22-75-00
AJINOMOTO EUROLYSINE S.A.S.153, rue de Courcelles, 75817 Paris Cedex 17, FranceTel: +33 (1) 44-40-12-12Fax: +33 (1) 44-40-12-13
AJINOMOTO EUROLYSINE S.A.S., Amiens PlantRue de Vaux, 80084 Amiens Cedex 2, FranceTel: +33 (3) 22-54-70-00Fax: +33 (3) 22-54-70-38
GERMANY
Ajinomoto Europe Sales G.m.b.H.Stubbenhuk 3, 20459 Hamburg, GermanyTel: +49 (40) 37-49-36-0Fax: +49 (40) 37-20-87
INDONESIA
P.T. Ajinex InternationalJI. Laksda Yos Sudarso 77-78, Sunter, Jakarta 14350, IndonesiaTel: +62 (21) 65304455Fax: +62 (21) 65304443
P.T. Ajinex International, Mojokerto FactoryJI. Mlirip Jetis, P.O. Box 110, Mojokerto, Jawa Timur, IndonesiaTel: +62 (321) 361710Fax: +62 (321) 361708
P.T. Ajinomoto Calpis Beverage IndonesiaEJIP Industrial Park, Plot 7-C, Lemah Abang Bekasi 17550, IndonesiaTel: +62 (21) 8970240Fax: +62 (21) 8970241
P.T. Ajinomoto IndonesiaJI. Laksda Yos Sudarso 77-78, Sunter, Jakarta 14350, IndonesiaTel: +62 (21) 65304455Fax: +62 (21) 65304443
P.T. Ajinomoto Indonesia, Mojokerto FactoryJI. Mlirip Jetis, P.O. Box 110, Mojokerto, Jawa Timur, IndonesiaTel: +62 (321) 361710Fax: +62 (321) 361708
ITALY
AJINOMOTO BIOITALIA S.p.A.Via Gramsci 1, 45013 Bottrighe (Ro), ItalyTel: +39 (0426) 995311Fax: +39 (0426) 995303
KOREA
Ajinomoto Co., Inc., Seoul OfficeSeoul Center Building, 91-1, Sokong-Dong, Chung-ku, Seoul, Republic of KoreaTel: +82 (2) 755-6166Fax: +82 (2) 753-6875
MALAYSIA
Ajinomoto (Malaysia) BerhadLot 5710, Jalan Kuchai Lama, Petaling, 58200 Kuala Lumpur, MalaysiaP.O. Box 12507, 50780 Kuala Lumpur, MalaysiaTel: +60 (3) 7980-6958Fax: +60 (3) 7980-1731
CPC/AJI (Malaysia) Sdn. Berhad55 Jalan Bangsar, P.O. Box 11015 50990 Kuala Lumpur, MalaysiaTel: +60 (3) 2282-1143Fax: +60 (3) 2282-2617
CPC/AJI (Malaysia) Sdn. Berhad, PlantLot 1989 Block C, Jalan Segambut, 51200 Kuala Lumpur, MalaysiaTel: +60 (3) 6258-4233Fax: +60 (3) 6251-1855
Malaysia Packaging Industry Berhad6 1/2 Miles, Simpang Salak, South Baru,(Lot 3, Jalan Kuchai Lama), 58200 Kuala Lumpur, MalaysiaP.O. Box 11145, 50736 Kuala Lumpur, MalaysiaTel: +60 (3) 7983-1877Fax: +60 (3) 7981-3198
NIGERIA
West African Seasoning Co., Ltd.37 Creek Road, Apapa, Lagos, Federal Republic of NigeriaTel: +234 (1) 580-4920Fax: +234 (1) 580-4927
Directory(As of April 1, 2002)

– 57 –
PERU
Ajinomoto del Perú S.A.Av. República de Panamá 2455, La Victoria, Lima-13, PeruP.O. Box 14-0431, Lima, PeruTel: +51 (1) 470-6050Fax: +51 (1) 472-0274
Ajinomoto del Perú S.A., PlantAv. Coronel Nestor Gambetta No. 7003-7005, Callao, Lima, PeruTel: +51 (1) 464-7600Fax: +51 (1) 577-0022
PHILIPPINES
AJINOMOTO PHILIPPINES CORPORATIONAJINOMOTO Bldg., 331, Sen. Gil J. Puyat Avenue, Makati City,Metro Manila, The PhilippinesTel: +63 (2) 895-6081~9Fax: +63 (2) 890-6328
AJINOMOTO PHILIPPINES CORPORATION, PlantEulogio Rodriguez, Jr. Avenue, Bo. Ugong, Pasig City, Metro Manila, The PhilippinesTel: +63 (2) 671-2801/2803/2805Fax: +63 (2) 671-6086
California Manufacturing Co., Inc.Km. 18, East Service Road, South Superhighway, Parañaque City 1702, Metro Manila, The PhilippinesTel: +63 (2) 823-8021~6Fax: +63 (2) 838-8676
California Manufacturing Co., Inc., Cavite PlantGateway Business Park, General Trias, Cavite, The PhilippinesTel: +63 (46) 433-0058~61Fax: +63 (46) 433-0059
California Manufacturing Co., Inc., Las Piñas PlantAlabang Zapote Road, Barrio Talon, Las Piñas City 1747, The PhilippinesTel: +63 (2) 800-9756Fax: +63 (2) 805-0993
POLAND
Ajinomoto Poland Sp. z o.o.Ul. Sobieskiego 104 m.39, 00-764 Warsaw, PolandTel: +48 (0) 22-840-42-58Fax: +48 (0) 22-851-25-72
RUSSIA
Ajinomoto-Genetika Research Institute (AGRI)1st Dorozhny pr., 1, 113545, Moscow, RussiaTel: +7 (095) 315-3765Fax: +7 (095) 315-0001
SINGAPORE
Ajinomoto (Singapore) Pte. Ltd.No. 6, Senoko Avenue, Singapore 758299, Republic ofSingaporeTel: +65-6257-2022Fax: +65-6257-6866
Ajitrade Pte. Ltd.No. 6, Senoko Avenue, Singapore 758299, Republic ofSingaporeTel: +65-6257-1922Fax: +65-6257-1622
CPC/AJI (Singapore) Pte. Ltd.320 Jalan Boon Lay, Singapore 619525, Republic of SingaporeTel: +65-6265-0866Fax: +65-6268-0043
SWITZERLAND
Ajinomoto Switzerland AGInnere Güterstrasse 2-4, P.O. Box 4559, 6304, Zug, SwitzerlandTel: +41 (41) 728-6666Fax: +41 (41) 728-6565
TAIWAN
Ajinomoto Co., Inc., Taipei Office4th Floor, 148 Sung-Chiang Road, Taipei, Taiwan, R.O.C.Tel: +886 (2) 2562-9221Fax: +886 (2) 2521-5904
CPC/AJI (Taiwan) Ltd.18th Floor, 287, Sec. 2, Wenhua Road, Banchiau, Taipei Hsien 220, Taiwan, R.O.C.Tel: +886 (2) 8253-1188Fax: +886 (2) 8253-1199
CPC/AJI (Taiwan) Ltd., Hsin Chu Plant 150 Hsin Ho Road, Hsin Feng Hsiang, Hsin Chu Hsien, Taiwan, R.O.C.Tel: +886 (3) 568-8311~6Fax: +886 (3) 568-8317
Taiso Commerce Inc.4th Floor, 148 Sung-Chiang Road, Taipei, Taiwan, R.O.C.Tel: +886 (2) 2521-0150/0180/0194Fax: +886 (2) 2521-5904
THAILAND
Ajinomoto Betagro Frozen Foods (Thailand) Co., Ltd.Betagro Tower 323, Vibhavadi Rangsit Road, Laksi,Bangkok 10210, ThailandTel: +66 (2) 955-0555Fax: +66 (2) 955-0350
Ajinomoto Calpis Beverage (Thailand) Co., Ltd.Saha Rattana Nakorn Industrial Estate, 117/6 Mu 4, Tambon Bang Phrakhrue, Amphoe Nakhon, Luang Ayutthaya 13260, ThailandTel: +66 (35) 716-460~4Fax: +66 (35) 716-466
Ajinomoto Co., (Thailand) Ltd.487/1 Si Ayutthaya Road, Khwaeng Thanon Phaya Thai, Khet Ratchathewi, Bangkok 10400, ThailandTel: +66 (2) 245-1614Fax: +66 (2) 246-3887
Ajinomoto Co., (Thailand) Ltd., Kamphaeng Phet FactoryNo. 369, Mu 3 Kamphaeng Phet-Tha Makhua Road, TambonKhonthee Amphoe Muang, Kamphaeng Phet 62000, ThailandTel: +66 (55) 740-910~2Fax: +66 (55) 740-913
Ajinomoto Co., (Thailand) Ltd., Pathum Thani Factory99 Mu 1, Bangkadi Sai Nai Road, Tambon Bangkadi, Amphoe Muang, Pathum Thani 12000, ThailandTel: +66 (2) 501-2475~9Fax: +66 (2) 501-2440
Ajinomoto Co., (Thailand) Ltd., Phra Pradaeng Factory6 Mu 2, Suk Sawat Road, Tambon Bang Khru, Amphoe Phra Pradaeng, Samut Prakan 10130, ThailandTel: +66 (2) 462-6331~3/7471~3Fax: +66 (2) 463-0721
Ajinomoto Frozen Foods (Thailand) Co., Ltd., Ayutthaya FactoryHi-Tech Industrial Estate, 59 Moo 2, Tambol Banpo, Amphoe Bang Pa-in, Ayutthaya 13160, ThailandTel: +66 (035) 350-001~004Fax: +66 (035) 350-005
CPC/AJI (Thailand) Ltd.18 SCB Park Plaza, Tower 1, 10th Floor, Ratchadapisek Road,Ladyao, Jatujak, Bangkok 10900, ThailandTel: +66 (2) 554-2900Fax: +66 (2) 512-2622
CPC/AJI (Thailand) Ltd., Bangpoo Plant470 Bangpoo Mai, Samputprakan 10280, ThailandTel: +66 (2) 323-9085~6Fax: +66 (2) 323-9940
CPC/AJI (Thailand) Ltd., Gateway PlantGateway City, 181 Moo 7, Km. 10, Highway No. 331 Tambol Huasamrong, Plangyao District, Chachoengsao 24190, ThailandTel: +66 (38) 575-022~5Fax: +66 (38) 575-026
Fuji Ace Co., Ltd.487/1 Si Ayutthaya Road Khwaeng Thanon Phayathai Khet Rachathewi, Bangkok 10400, ThailandTel: +66 (2) 246-0828Fax: +66 (2) 246-0829
Wan Thai Foods Industry Co., Ltd.Bangchan Industrial Estate Plot Khor-1, Moo 14, Amphoe Minburi, Bangkok 10510, ThailandTel: +66 (2) 517-0944Fax: +66 (2) 518-1885
UNITED KINGDOM
Forum Bioscience Holdings Ltd.41-51 Brighton Road, Redhill, Surrey RH1 6YS, United KingdomTel: +44 (1) 737-773711Fax: +44 (1) 737-773116
Ajinomoto Pharmaceuticals Europe Ltd.Bridge Gate House, 55 High Street, Redhill, Surrey RH1 1RX, United KingdomTel: +44 (1737) 378-400Fax: +44 (1737) 378-430
UNITED STATES
Ajinomoto Frozen Foods U.S.A., Inc.7124 N. Marine Drive, Portland, OR 97203, U.S.A.Tel: +1 (503) 286-6548Fax: +1 (503) 978-1803
Ajinomoto Heartland, Inc.8430 West Bryn Mawr Avenue, Suite 650, Chicago, IL 60631-3421, U.S.A.Tel: +1 (773) 380-7000Fax: +1 (773) 380-7006
Ajinomoto Heartland, Inc., Eddyville PlantHeartland Drive, Eddyville, IA 52553-5001, U.S.A.Tel: +1 (641) 969-4551Fax: +1 (641) 969-4717
Ajinomoto Pharmaceuticals U.S.A., Inc.West 115 Century Road, Paramus, NJ 07652, U.S.A.Tel: +1 (201) 225-7187Fax: +1 (201) 261-7654
Ajinomoto U.S.A., Inc.West 115 Century Road, Paramus, NJ 07652, U.S.A. Tel: +1 (201) 261-1789Fax: +1 (201) 543-0106
Ajinomoto U.S.A., Inc., Iowa Plant1 Ajinomoto Drive, Eddyville, IA 52553, U.S.A.Tel: +1 (515) 969-4561Fax: +1 (641) 969-4409
Ajinomoto U.S.A., Inc., Los Angeles Office19675 Mariner Avenue, Torrance, CA 90503, U.S.A.Tel: +1 (310) 370-2500Fax: +1 (310) 370-3350
Ajinomoto U.S.A., Inc., North Carolina Plant4020 Ajinomoto Drive, Raleigh, NC 27610, U.S.A.Tel: +1 (919) 231-0100Fax: +1 (919) 231-6275
Ajinomoto U.S.A., Inc., Washington, D.C. Office1120 Connecticut Avenue, N.W., Suite 416, Washington, DC 20036, U.S.A.Tel: +1 (202) 457-0284Fax: +1 (202) 457-0107
VIETNAM
Ajinomoto Vietnam Co., Ltd.Bien Hoa Industrial Zone, An Binh Village, Dong Nai Province,Socialist Republic of VietnamTel: +84 (61) 831289/831384Fax: +84 (61) 831288

Ajinomoto Co., Inc.
Established: May 20, 1909
Number of Employees: 24,326 (consolidated basis)3,789 (non-consolidated basis)
Fiscal Year: April 1 — March 31 Annual meeting held in June
Common StockAuthorized: 1,000,000,000 shares
Issued: 649,981,740 shares
Paid-in Capital: ¥79,863 million
Listings: The Tokyo Stock Exchange and the four other domestic stock exchanges (Ticker Code: 2802)
Transfer Agent: The Mitsubishi Trust and Banking Corporation
Independent Auditor: Shin Nihon & Co.
Investor Information(as of March 31, 2002)
Monthly Stock Data (TSE)
– 58 –
Note: Fiscal years beginning April and ending March the following calendar year.
Distribution of Shareholders
Major ShareholdersNumber of Percentage ofShares Held Total Shares
Name of Shareholders (Thousands) Outstanding
The Dai-Ichi Mutual Life Insurance Company 39,501 6.08%
Nippon Life Insurance Company 35,523 5.47
Japan Trustee Services Bank, Ltd. (trust account) 33,182 5.11
The Bank of Tokyo-Mitsubishi, Ltd. 31,285 4.81
The Mitsubishi Trust & Banking Corp. (trust account) 30,747 4.73
The Dai-Ichi Kangyo Bank, Limited 27,454 4.22
The Mitsubishi Trust & Banking Corp. 20,655 3.18
NIPPONKOA Insurance Company, Limited 16,097 2.48
Meiji Life Insurance Company 15,156 2.33
Fukoku Mutual Life Insurance Company 13,194 2.03

Head Office 15-1, Kyobashi 1-chome, Chuo-ku, Tokyo 104-8315, JapanTel: +81 (3) 5250-8111http://www.ajinomoto.com/
Investor Relations Securities analysts and investmentprofessionals should direct inquiries to:Investor Relations15-1, Kyobashi 1-chome, Chuo-ku, Tokyo 104-8315, JapanTel: +81 (3) 5250-8291Fax: +81 (3) 5250-8378
– 59 –

Part of this report has been prepared using bagasse, a nonpulp paper made from sugarcane fiber.
Printed in JapanJuly 2002
15-1, Kyobashi 1-chome, Chuo-ku, Tokyo 104-8315, JapanTel: +81 (3) 5250-8111 http://www.ajinomoto.com/