Developing a Statistical Literacy Scale for Undergraduate Students
156
A STUDY FOR DEVELOPMENT OF STATISTICAL LITERACY SCALE FOR UNDERGRADUATE STUDENTS by Füsun Şahin B.S., Secondary School Science and Mathematics Education, Boğaziçi University, 2009 Submitted to the Institute for Graduate Studies in Science and Engineering in partial fulfillment of the requirements for the degree of Master of Science Graduate Program in Secondary School Science and Mathematics Education Boğaziçi University 2012
Transcript of Developing a Statistical Literacy Scale for Undergraduate Students
A STUDY FOR DEVELOPMENT OF STATISTICAL LITERACY SCALE FOR
UNDERGRADUATE STUDENTS
by
Füsun Şahin
B.S., Secondary School Science and Mathematics Education, Boğaziçi University, 2009
Submitted to the Institute for Graduate Studies in
Science and Engineering in partial fulfillment of
the requirements for the degree of
Master of Science
Graduate Program in Secondary School Science and Mathematics Education
Boğaziçi University
2012
ii
A STUDY FOR DEVELOPMENT OF STATISTICAL LITERACY SCALE
FOR UNDERGRADUATE STUDENTS
APPROVED BY:
Prof. Füsun Akarsu ………………………….....
(Thesis Supervisor)
Prof. Fetih Yıldırım …………………………....
(Thesis Co-Supervisor)
Assist. Prof. Diler Öner …………………………….
Fatma Aslan-Tutak, Ph.D. …………………………….
Filyet Aslı İşçimen, Ph. D. …………………………….
DATE OF APPROVAL: 04.06.2012
iii
ACKNOWLEDGEMENTS
First of all, I would like to thank my family, friends and teachers for encouraging and
supporting me to make graduate study and choose academic life as a career path.
To begin with, I have to thank my thesis supervisor Prof. Füsun Akarsu for sharing
her experiences. It was really a burden for her during her busy schedule filled with non-
academic jobs.
I would like to thank to my thesis committee members Assist. Prof. Diler Öner for
her careful analysis and feedback for my draft since the beginning of this thesis, Fatma
Aslan Tutak, Ph.D. for her valuable feedbacks and guidance, Filyet Aslı İşçimen, Ph.D. for
her time to read my study and being always available for my questions and her counter
questions. Last but not the least, I would also like to thank to Prof. Fetih Yıldırım for his
guidance in statistics, I learnt a different aspect of statistics every time we met.
I am also thankful to Prof. Ali Baykal, for his inspiring courses and guidance as a
measurement specialist who inspired me to develop a measurement instrument for this
thesis and to continue academic life in the area of measurement. I could not decide such a
path without your welcoming attitude, the wisdom you shared with us and generous
support every time I needed.
I would also thank to Prof. Dilek Ardaç for joyful and insightful courses. I had the
opportunity to work with you in the warmly environment you provided and took courses
from you, thank you Assoc. Prof. Ayşenur Yontar Toğrol and Asisst. Prof. Buket Yakmacı
Güzel, Assist. Prof. Sevil Akaygün, Fatih Çağlayan Mercan,Ph.D. and Gülseren Karagöz
Akar, Ph.D. Special thanks go to department secretary Gülşen.
iv
I cannot forget to thank my assistant friends Aysun, Ruhan, Derya, Oğuz, Zerrin,
Gürsu, Zeynep, Mustafa and remember my classmates Sevil, Ayşe, Berra, Sibel, and
Tuğba. My sincere thanks to Pınar Şener for her accompaniment throughout this thesis
study, for sharing her experiences, joy, and her keeping me together when I felt frustrated.
Finally, I would like to thank to scholars who gave permission to use their questions.
I cannot ignore the support of the scholars and who helped me in continuous and huge data
collection phases and their students who volunteered to participate to this study: Prof. Dr.
Ferhan Çeçen, Assoc. Prof. Asım Karaömerlioğlu and his doctoral students, Assit. Prof.
Nalan Babür, Assit. Prof. Ulaş Akküçük, Assist. Prof. Senem Yıldız, Assit. Prof. Müge
Kanuni, Dr. Gözde Ünal, and Dr. Serkan Özel.
v
ABSTRACT
A STUDY FOR DEVELOPMENT OF STATISTICAL LITERACY SCALE FOR UNDERGRADUATE STUDENTS IN A UNIVERSITY
Statistical literacy was defined as the ability to understand basic concepts, vocabulary and
symbol of statistics, and some probability; and critically evaluate statistical information in
everyday life situations. The aim of this study was to develop a valid and reliable
instrument measuring statistical literacy for university students. Statistics content covered
in previous instruments on statistics learning (CAOS- Web ARTIST Project, 2005;
Statistical Literacy Skills Survey, Schield, 2008; ARTIST Topic Scales, 2006) and 6-12
grades curricula implemented in Turkey were examined. A Statistical Content Rating Form
(SLCRF) was formed in the light of knowledge and skills involved in the related domain.
Scholars who were offering statistics and research methods courses were asked which
statistics topics undergraduate students are required to know for being statistically literate.
Content coverage was determined according to scholars’ answers, and then questions were
selected among existing instruments in the literature. For topics that questions in the
literature are insufficient then new questions were written by the researcher. Suggested
questions were examined by experts and the 42 questions were chosen and tried out with a
pilot study with 33 participants. Based on the results, the number of questions was reduced
to 20 and it was tried again with a sample consisting of 90 participants. Then, the number
of questions was reduced to 17 and Statistical Literacy Scale (SLS) was developed. SLS
was administered to 476 undergraduate students. The construct validity of SLS was
examined with experts’ item based opinions and results of factor analysis. Content validity
was assured with SLCRF results. From the data gathered from 476 participants the
Cronbach alpha coefficient was calculated as .532. It is possible to say that SLS has the
attributes of construct, content, and curricular validity.
vi
ÖZET
LİSANS ÖĞRENCİLERİ İÇİN İSTATİSTİKSEL OKURYAZARLIK
ÖLÇEĞİ GELİŞTİRİLMESİ ÇALIŞMASI
İstatistiksel okuryazarlık günlük hayat durumlarında verilen istatistiki bir bilgiyi
anlayabilmek, yorumlayabilmek ve istatistiki bilgi ve bu bilgi üzerinden yapılan yorumu
eleştirebilmek olarak tanımlanmıştır. Bu çalışmanın amacı istatistiksel okuryazarlığı ölçen,
bir devlet üniversitesinde okuyan lisans öğrencileri üzerinde geçerli ve güvenilir bir ölçek
geliştirmektir. İstatistik öğrenmeleri üzerine geliştirilmiş enstrümanların (CAOS- Web
ARTIST Project, 2005; Statistical Literacy Skills Survey, Schield, 2008; ARTIST Topic
Scales, 2006) ve Türkiye’deki 6-12 sınıflar müfredatının (MEB, 2005 ve 2009) içerdikleri
istatistik konuları incelenmiştir. Bu konular ve becerilerden yola çıkarak İstatistiksel
Okuryazarlık İçerik Derecelendirme Formu (İOİDF) oluşurulmuştur. İstatistik ve araştırma
yöntemleri dersi veren öğretim elemanlarına üniversite öğrencilerin istatistiksel okuryazar
olmaları için hangi konuları bilmeleri gerektiği sorulmuştur. Alınan cevaplara göre konu
içeriği belirlenmiş, ilgili konulardaki sorular literatürdeki ölçme araçlarından seçilmiş ve
eldeki soruların yetersiz kaldığı konularda yeni sorular araştırmacı tarafından yazılmıştır.
Önerilen sorular uzmanlarca incelenmiş ve seçilen 42 soru 33 katılımcının katıldığı bir
pilot çalışma ile denenmiştir. Sonuçlar ışığında soru sayısı 20’e düşürülmüş ve 90 kişilik
bir örneklemde yeniden denenmiştir. Bu çalışma sonunda soru sayısı 17’e düşürülmüş ve
İstatistiksel Okuryazarlık Ölçeği (İOÖ) geliştirilmiştir. İOÖ 476 lisans öğrencisine
uygulanmıştır. İOÖ’nin kavram geçerliliği uzmanların soru bazında kanıları ve faktör
analizi sonuçlarıyla değerlendirilmiştir. Kapsam geçerliliği İOİDF sonuçları ile
belirlenmiştir. Dörtyüz yetmiş altı kişiden alınan veriler üzerinde ölçeğin Cronbach alpha
katsayısı .532 çıkmıştır. İOÖ’nin kavram, kapsam ve müfredat geçerliliği özelliklerine
sahip olduğu söylenebilir.
vii
TABLE OF CONTENTS
ACKNOWLEDGEMENTS .................................................................................................. iii
ABSTRACT. .......................................................................................................................... v
ÖZET.................................................................................................................................... vi
LIST OF FIGURES .............................................................................................................. xi
LIST OF TABLES ............................................................................................................... xii
LIST OF SYMBOLS ........................................................................................................... xv
LIST OF ACRONYMS/ABBREVIATIONS ..................................................................... xvi
1. INTRODUCTION ............................................................................................................. 1
2. LITERATURE REVIEW .................................................................................................. 3
2.1. Definitions of Statistical Literacy .............................................................................. 3
2.2. Related Constructs ..................................................................................................... 6
2.2.1. Statistical Reasoning ........................................................................................ 6
2.2.2. Statistical Thinking .......................................................................................... 7
2.3. Models of Statistical Literacy .................................................................................... 8
2.4. Content of Statistical Literacy .................................................................................. 11
2.4.1. Statistical Literacy Content in Instruments .................................................... 12
2.4.2. Statistical Literacy Content in Instruction ..................................................... 13
2.4.3. Suggested Statistical Literacy Content by Authors ........................................ 14
2.4.4. Statistical Literacy Content in Curricula ........................................................ 15
2.5. Context of Statistical Literacy .................................................................................. 18
2.5.1. Statistical Literacy in the Turkish Context .................................................... 18
2.6. Statistical Literacy and Research Competency ........................................................ 21
2.7. Definition of Statistical Literacy Used in This Study .............................................. 23
3. SIGNIFICANCE .............................................................................................................. 25
4. STATEMENT OF THE PROBLEM ............................................................................... 26
4.1. Research Questions .................................................................................................. 26
viii
4.2. Instruments ............................................................................................................... 27
4.2.1. Statistical Literacy Content Rating Form....................................................... 27
4.2.2. Item Rating Form ........................................................................................... 27
4.2.3. Demographic Survey ...................................................................................... 28
5. METHODOLOGY .......................................................................................................... 29
5.1. Phase 1 - Initial Preparation of the Instrument......................................................... 31
5.1.1. Clarifying the Content .................................................................................... 31
5.1.2. Overall Plan and Test Specifications ............................................................. 34
5.1.3. Item Selection and Construction .................................................................... 35
5.1.4. Scoring ........................................................................................................... 37
5.2. Phase 2 of the Study- First Pilot Study .................................................................... 38
5.2.1. Participants ..................................................................................................... 38
5.2.2. Administration ............................................................................................... 40
5.2.3. Data Analysis ................................................................................................. 40
5.2.4. Item Revision ................................................................................................. 44
5.3. Phase 3 of the Study- Second Pilot Study ................................................................ 47
5.3.1. Participants ..................................................................................................... 47
5.3.2. Administration ............................................................................................... 48
5.3.3. Data Analysis ................................................................................................. 48
5.3.4. Item Reduction ............................................................................................... 52
5.3.5. Item Revision ................................................................................................. 54
5.4. Phase 4 of the Study- Third Pilot Study ................................................................... 55
5.4.1. Participants ..................................................................................................... 55
5.4.2. Administration ............................................................................................... 61
5.4.3. Data Analysis ................................................................................................. 62
5.5. Phase 5 of the Study- Translation of the Instrument ................................................ 75
5.5.1. Translation Method ........................................................................................ 75
5.5.2. Translation of the Instrument ......................................................................... 76
5.5.4. Sample and Participants ................................................................................. 78
5.5.5. Administration ............................................................................................... 79
ix
5.5.6. Data Analysis ................................................................................................. 79
5.6. Further Analysis ....................................................................................................... 82
5.6.1. Differences Related to Year of Study ............................................................ 83
5.6.2. Differences Related to Departments .............................................................. 86
5.6.3. Correlation between GPA and SLS Scores .................................................... 90
6. RESULTS ........................................................................................................................ 92
6.1. Evidence on Validity ................................................................................................ 92
6.1.1. Confirming Evidence of Content Validity ..................................................... 92
6.1.2. Confirming Evidence of Construct Validity .................................................. 94
6.1.3. Confirming Evidence of Curricular Validity ................................................. 96
6.1.4. Disconfirming Evidence of Validity .............................................................. 98
6.2. Evidence about Reliability ....................................................................................... 99
6.2.1. Confirming Evidence of Reliability ............................................................... 99
6.2.2. Disconfirming Evidence of Reliability ........................................................ 100
7. LIMITATIONS .............................................................................................................. 101
7.1. Limitations about Participants................................................................................ 101
7.2. Limitations about the Content ................................................................................ 101
8. DISCUSSIONS .............................................................................................................. 103
8.1. Participants ............................................................................................................. 103
8.2. Content of SLS ....................................................................................................... 104
8.3. Questions ................................................................................................................ 106
8.4. Validity of SLS ...................................................................................................... 107
8.5. Reliability of SLS ................................................................................................... 108
9. FURTHER RESEARCH ............................................................................................... 109
APPENDIX A: STATISTICS TOPICS IN RELATED STUDIES ................................... 110
APPENDIX B: STATISTICAL LITERACY CONTENT RATING FORM .................... 116
APPENDIX C: EXPERTS’ ANSWERS TO CONTENT RATING FORM ..................... 119
APPENDIX D: FINAL TEST PLAN ................................................................................ 120
APPENDIX E: DETAILED TEST PLAN FOR SLS ........................................................ 121
APPENDIX F: STATISTICAL LITERACY SCALE- ENGLISH VERSION ................. 122

x
APPENDIX G: İSTATİSTİK OKURYAZARLIĞI ÖLÇEĞİ- TÜRKÇE ÇEVİRİSİ ...... 126
REFERENCES .................................................................................................................. 130
xi
LIST OF FIGURES
Figure 2.1. Gal’s definition of statistical literacy. ............................................................... 5
Figure 2.2. delMas’ (2002) models of statistical literacy. ................................................... 9
Figure 2.3. Sanchez’s (2007) models of statistical literacy. .............................................. 10
Figure 4.1. Part of Statistical Literacy Content Rating Form. ........................................... 27
Figure 4.2. Part of Item Rating Form. ................................................................................ 28
xii
LIST OF TABLES
Table 2.1. Watson and Callingham’s (2004) hierarchical levels of statistical literacy. .... 4
Table 2.2. Comparison of Watson’s (1997) framework and statistical literacy themes. ... 6
Table 2.3. delMas’ (2002) three instructional domains. .................................................... 8
Table 2.4. Basic statistics and probability topics covered in grades 6-12. ...................... 16
Table 2.5. Common topics covered in statistics courses in a public university. ............. 17
Table 2.6. Statistical literacy definition used in this study. ............................................. 24
Table 5.1. Frequency of Most rated statistics topics. ...................................................... 33
Table 5.2. Least rated statistics topics. ............................................................................ 34
Table 5.3. Distribution of participants’ for the first pilot study. ..................................... 38
Table 5.4. The population for the first pilot study. ......................................................... 39
Table 5.5. Descriptive statistics of the first pilot study. .................................................. 41
Table 5.6. Item - total correlations for the first pilot study. ............................................ 41
Table 5.7. Questions eliminated and reasons for elimination. ......................................... 43
Table 5.8. Comparison of questions remained and reason for stay. ............................... 44
Table 5.9. Overall properties and decisions of questions in the first pilot study. ........... 46
Table 5.10. Profile of the participants in the second pilot study. ...................................... 47
Table 5.11. Descriptive statistics for the second pilot study. ............................................ 49
Table 5.12. Item- total score correlations for second pilot study. ..................................... 50
Table 5.13. Item difficulty scores for second pilot study. ................................................ 50
Table 5.14. Item discrimination index for questions in the second pilot study. ................ 52
Table 5.15. Overall properties and decisions for the questions in the second pilot study. 55
Table 5.16. Profile of participants in the third administration. ......................................... 57
Table 5.17. Number of students registered to the departments. ........................................ 58
Table 5.18. Number of people by the type of their majors. ............................................... 59
Table 5.19. Stratified sample size calculation for third administration. ............................ 60
Table 5.20. Comparison of stratified sample size for third administration. ...................... 60
xiii
Table 5.21. Descriptive statistics for third administration. .............................................. 63
Table 5.22. Item Difficulty index for third administration. ............................................... 64
Table 5.23. Overall properties and decisions of questions in the third administration. .... 64
Table 5.24. Percentage of options...................................................................................... 65
Table 5.25. Most common answers in the third administration. ....................................... 66
Table 5.26. KMO and Bartlett’s test results for third administration. ............................... 67
Table 5.27. Factor analysis for third administration. ......................................................... 68
Table 5.28. Component matrix for third administration. .................................................. 69
Table 5.29. Rotated component analysis. .......................................................................... 70
Table 5.30. Total variance explained with three factors. ................................................. 71
Table 5.31. Component matrix with three components. ................................................... 71
Table 5.32. Factor analysis for third administration with two factors. ............................. 72
Table 5.33. Component matrix for third administration with two factors. ....................... 72
Table 5.34. Content of questions and dimensions for third pilot study. ........................... 73
Table 5.35. Corrected item- total correlations and Cronbach’s alpha if item deleted. ..... 75
Table 5.36. Participants in the fourth administration. ....................................................... 78
Table 5.37. Descriptive statistics regarding Turkish and English versions of SLS. ......... 80
Table 5.38. Test of normality for Turkish version scores and English version scores. .... 80
Table 5.39. Result of paired samples t- test. ..................................................................... 80
Table 5.40. Result of McNemar test. ................................................................................. 81
Table 5.41. Descriptive statistics for participants specified and not specified their years
of study. ......................................................................................................... 83
Table 5.42. Result of independent samples t- test. ........................................................... 84
Table 5.43. Descriptive statistics for year groupings total score. ..................................... 85
Table 5.44. Result of test of homogeneity of variances total score. .................................. 85
Table 5.45. One way ANOVA results for grade groupings total score. ............................ 85
Table 5.46. Post Hoc Test results for grade groupings total score. ................................... 86
Table 5.47. Descriptive statistics for type of majors. ........................................................ 87
Table 5.48. Result of test of homogeneity of variances. ................................................... 87
Table 5.49. One way ANOVA results for type of majors total score. .............................. 87
xiv
Table 5.50. Result of post hoc test for type of majors total scores. ................................... 87
Table 5.51. Group statistics for MEDU and FLED. ......................................................... 88
Table 5.52. Result of t- test for total score comparison for MEDU and FLED................. 88
Table 5.53. Descriptive information for faculties and schools total scores. ...................... 89
Table 5.54. Result of test of homogeneity of variances. ................................................... 89
Table 5.55. One way ANOVA results for faculties and schools total score. .................... 89
Table 5.56. Post Hoc test result for type of majors total scores. ....................................... 90
Table A.1. Compilation of statistics topics in related assessment studies. .................... 110
Table A2. Comparison of statistics topics in related assessment studies. ..................... 111
Table A.3. Statistics topics in related instruction studies. .............................................. 112
Table A.4. Important topics in statistics as proposed by authors. .................................. 113
Table A.5. Content of statistics courses in a university.................................................. 114
Table A.6. Statistics topics in related curricula in Turkey. ............................................ 115
Table C.1. Experts’ answers to content rating form. ..................................................... 119
Table D.1. Final test plan. .............................................................................................. 120
Table E.1. Detailed test plan for SLS. ........................................................................... 121
xv
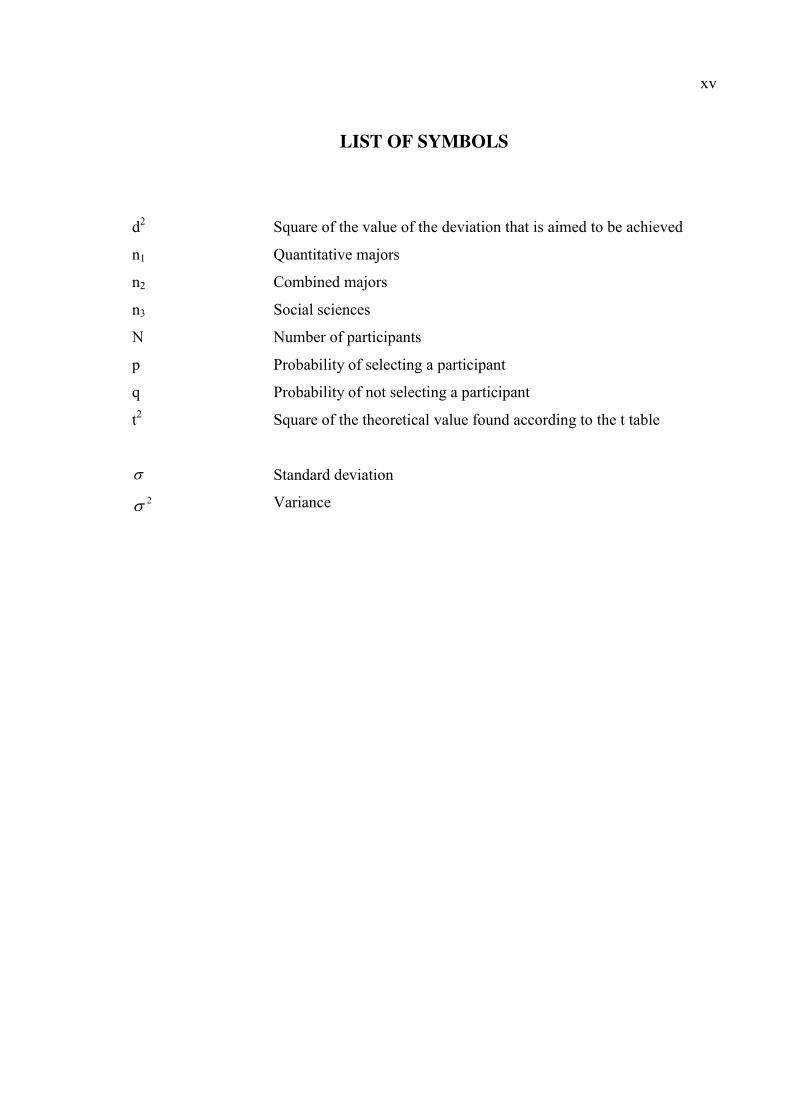
LIST OF SYMBOLS
d2 Square of the value of the deviation that is aimed to be achieved n1 Quantitative majors
n2 Combined majors
n3 Social sciences
N Number of participants p Probability of selecting a participant q Probability of not selecting a participant
t2 Square of the theoretical value found according to the t table
Standard deviation 2 Variance
xvi
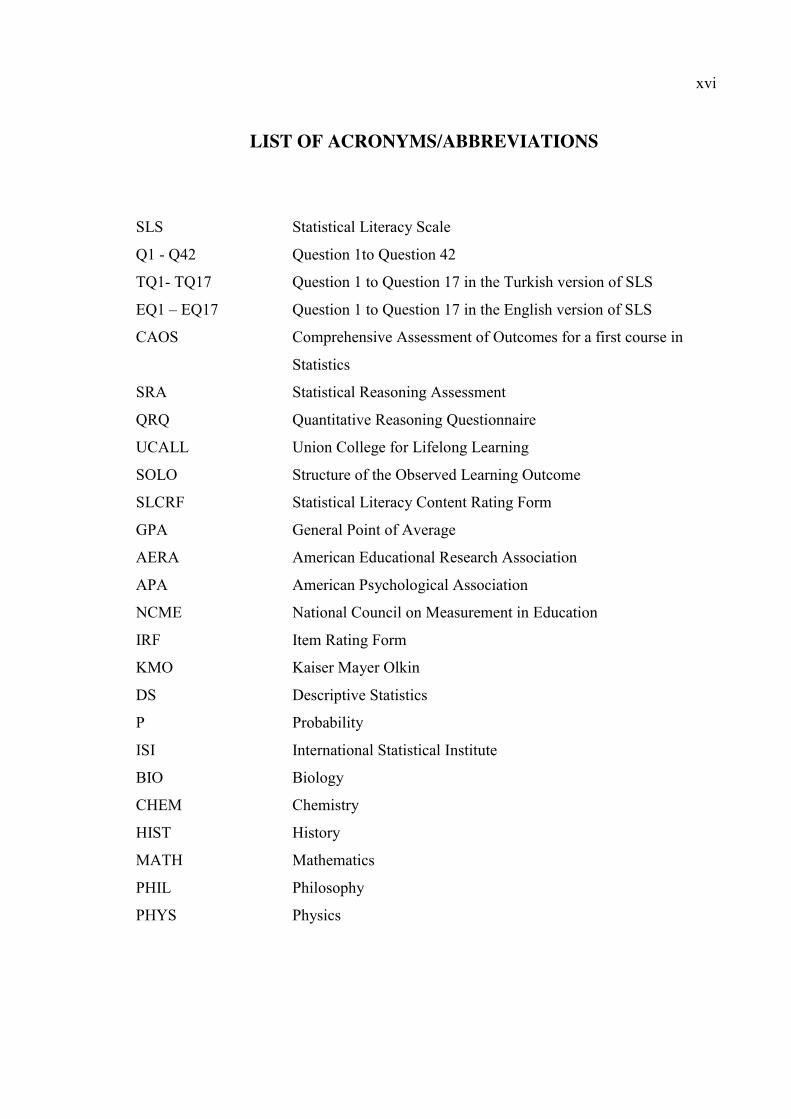
LIST OF ACRONYMS/ABBREVIATIONS
SLS Statistical Literacy Scale
Q1 - Q42 Question 1to Question 42
TQ1- TQ17 Question 1 to Question 17 in the Turkish version of SLS
EQ1 – EQ17 Question 1 to Question 17 in the English version of SLS
CAOS Comprehensive Assessment of Outcomes for a first course in
Statistics
SRA Statistical Reasoning Assessment
QRQ Quantitative Reasoning Questionnaire
UCALL Union College for Lifelong Learning
SOLO Structure of the Observed Learning Outcome
SLCRF Statistical Literacy Content Rating Form
GPA General Point of Average
AERA American Educational Research Association
APA American Psychological Association
NCME National Council on Measurement in Education
IRF Item Rating Form
KMO Kaiser Mayer Olkin
DS Descriptive Statistics
P Probability
ISI International Statistical Institute
BIO Biology
CHEM Chemistry
HIST History
MATH Mathematics
PHIL Philosophy
PHYS Physics
xvii
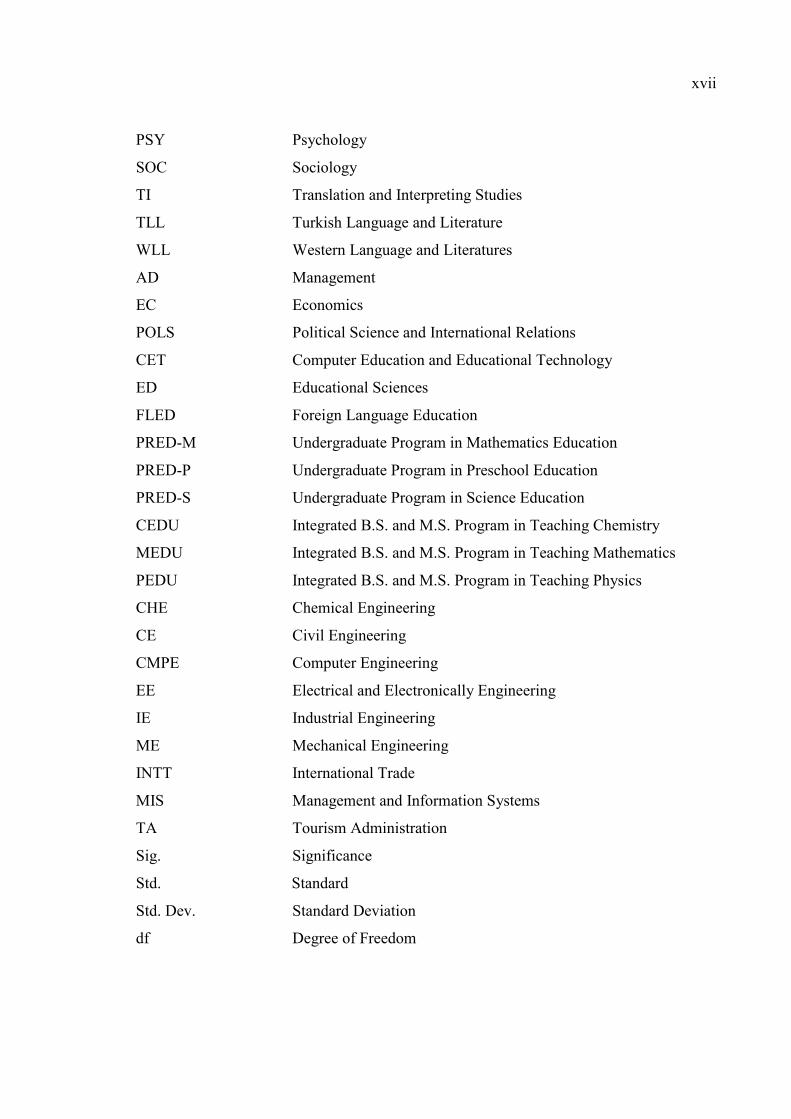
PSY Psychology
SOC Sociology
TI Translation and Interpreting Studies
TLL Turkish Language and Literature
WLL Western Language and Literatures
AD Management
EC Economics
POLS Political Science and International Relations
CET Computer Education and Educational Technology
ED Educational Sciences
FLED Foreign Language Education
PRED-M Undergraduate Program in Mathematics Education
PRED-P Undergraduate Program in Preschool Education
PRED-S Undergraduate Program in Science Education
CEDU Integrated B.S. and M.S. Program in Teaching Chemistry
MEDU Integrated B.S. and M.S. Program in Teaching Mathematics
PEDU Integrated B.S. and M.S. Program in Teaching Physics
CHE Chemical Engineering
CE Civil Engineering
CMPE Computer Engineering
EE Electrical and Electronically Engineering
IE Industrial Engineering
ME Mechanical Engineering
INTT International Trade
MIS Management and Information Systems
TA Tourism Administration
Sig. Significance
Std. Standard
Std. Dev. Standard Deviation
df Degree of Freedom

xviii
Min. Minimum
Max. Maximum
1
1. INTRODUCTION
In today’s world, the power of information is huge, especially when the information
is yielded through scientific research. As findings of research activities are shared with
public, statistical results and methods used are also narrated as well as the context and the
research problem. Hence, it can be said that statistics is not only part of the researchers’ or
experts’ experiences but in the daily experiences of all individuals. For example, an
ordinary person encounters with statistical information while reading a newspaper article.
Hence, the ability of dealing with statistical information is a necessity for everyone which
constitutes the core ability of statistical literacy. For this reason, statistical literacy was
chosen as the topic of this study.
There are different definitions (Hayden, 2004; Wallman, 1993, Schield, 2001,
Burnham, 2003, Watson and Callingham, 2003 and 2004; Gal, 2004) and models of
statistical literacy (delMas, 2002; Sanchez, 2007). Moreover, related concepts like
statistical reasoning and statistical thinking were examined in this study. Based on the
analysis of different definitions, common themes that emerge in different definitions of
statistical literacy were revealed. These common themes can be listed as understanding of
statistical results, understanding (the basic) concepts, vocabulary, symbols of statistics, and
some probability, critical evaluation of information, and the context of everyday life. Since
everyday experiences cannot be thought apart from the culture, the Turkish context was
examined. Taking into account common themes in different definitions, different models
of statistical literacy, and the Turkish context, an adapted definition of statistical literacy
was formed. According to this definition statistical literacy was defined as understanding
basic concepts, vocabulary and symbols of statistics, including some probability, and
critically evaluating statistical information as encountered in everyday life situations.
Universities have an essential function as institutions for research and education.
Besides producing scientific knowledge through research, students who will be active
members of the society are cultivated in universities. In many departments statistics
courses are given as a required course. Undergraduate students are expected to be able to
2
disseminate statistical information arise from research as they encounter everyday life. It is
important to examine university students’ statistical literacy. Undergraduate students from
all departments and years except English Language Preparation School and freshmen year
students were considered as the population for this study.
In order to study statistical literacy empirically, there was the need for measuring this
construct. Previous instruments measuring statistical literacy (Wilson, 1994; Schield, 2008)
and related concepts (Garfield, delMas, and Chance, 2006; Garfield, DelMas, Chance,
Poly, Ooms, 2006; Schield , 2008; Allen, 2006; Garfield, 2003) were examined. No similar
study about statistical literacy was found in the Turkish context. Since the definition of
statistical literacy used in this study was clarified by taking the Turkish context into
account, a single instrument among existing instruments developed outside of Turkey was
not suitable for this study. Therefore, it was decided to develop a new instrument,
Statistical Literacy Scale (SLS), which is tailored to the definition of statistical literacy
used in this study. The sample of the study was undergraduate students studying in a public
university in Turkey.
Statistical Literacy Scale (SLS) was planned to be a multiple choice test where every
question has only one keyed response. Items used in previous instruments were examined
according to the cognitive level and content they were measuring. Among them questions
that fit the scope of the SLS were selected and new questions were written when necessary.
Two pilot studies and a final administration of SLS were carried out.
Moreover, the language was a consideration for the understandability of the scale.
The scale was translated into Turkish and administered to a group of participants who had
taken the English version of the scale. Qualitative comparisons depending on experts’
ideas of equivalency of the two versions of the scale and quantitative comparisons
regarding statistical analyses between participants’ scores gained from the versions of the
scale were done. It was seen that although scores gained from the Turkish version of SLS
were higher, qualitative comparisons show that the two versions of SLS were equivalent.
3
2. LITERATURE REVIEW
2.1. Definitions of Statistical Literacy
The definition of statistical literacy has changed in terms of its scope and content.
Nevertheless, the main aim of defining this construct remained the same. Some definitions
of statistical literacy can be listed in the following pages.
In general terms, Hayden (2004) defined statistical literacy as the skills that a person
needs in order to deal with issues of probability and statistics arise in everyday life.
Wallman (1993) defined statistical literacy as the ability to understand and critically
evaluate statistical results that guide our daily life. She also stressed the ability to
appreciate the contributions that can be done to public, private, professional, and personal
decisions by employing statistical thinking in her definition.
Furthermore, according to Schield (2001) statistical literacy is “the ability to review,
interpret, analyze, and evaluate written materials (and detect errors and flaws therin).” Also
again by Schield (2004) statistical literacy was summarized as being literate about
everyday arguments that use statistics as evidence. On the other hand, Burnham (2003)
defines statistical literacy as the habit of mind that makes us notice the strengths and
weaknesses of claims and reports including statistical information, and also thinking the
arguments based on statistical information as the claims, reports or arguments commonly
appear in the non-technical media without specific prompting.
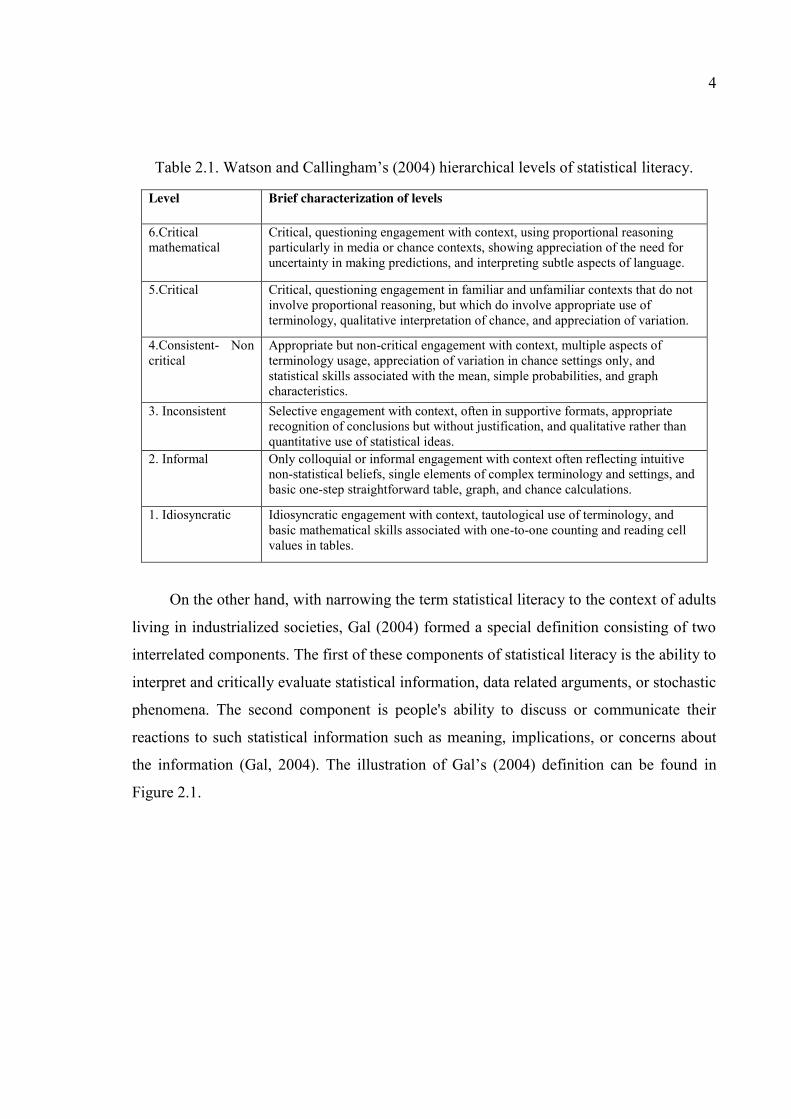
Watson and Callingham (2003, 2004) studied the ability of dealing with information
provided with an empirical study. They proposed a six level hierarchical construct of
statistical literacy where the levels are from idiosyncratic to critical mathematical levels
which can be seen in detail in Table 2.1.
4
Table 2.1. Watson and Callingham’s (2004) hierarchical levels of statistical literacy.
Level Brief characterization of levels
6.Critical mathematical
Critical, questioning engagement with context, using proportional reasoning particularly in media or chance contexts, showing appreciation of the need for uncertainty in making predictions, and interpreting subtle aspects of language.
5.Critical Critical, questioning engagement in familiar and unfamiliar contexts that do not involve proportional reasoning, but which do involve appropriate use of terminology, qualitative interpretation of chance, and appreciation of variation.
4.Consistent- Non critical
Appropriate but non-critical engagement with context, multiple aspects of terminology usage, appreciation of variation in chance settings only, and statistical skills associated with the mean, simple probabilities, and graph characteristics.
3. Inconsistent Selective engagement with context, often in supportive formats, appropriate recognition of conclusions but without justification, and qualitative rather than quantitative use of statistical ideas.
2. Informal Only colloquial or informal engagement with context often reflecting intuitive non-statistical beliefs, single elements of complex terminology and settings, and basic one-step straightforward table, graph, and chance calculations.
1. Idiosyncratic Idiosyncratic engagement with context, tautological use of terminology, and basic mathematical skills associated with one-to-one counting and reading cell values in tables.
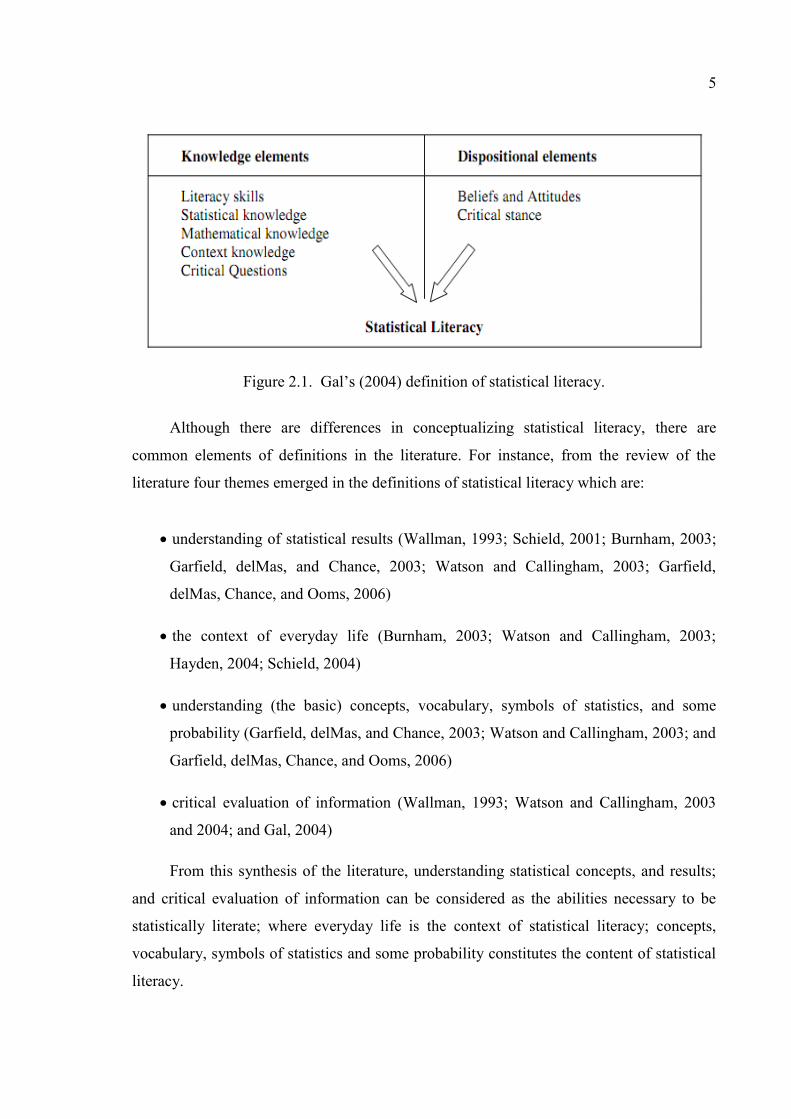
On the other hand, with narrowing the term statistical literacy to the context of adults
living in industrialized societies, Gal (2004) formed a special definition consisting of two
interrelated components. The first of these components of statistical literacy is the ability to
interpret and critically evaluate statistical information, data related arguments, or stochastic
phenomena. The second component is people's ability to discuss or communicate their
reactions to such statistical information such as meaning, implications, or concerns about
the information (Gal, 2004). The illustration of Gal’s (2004) definition can be found in
Figure 2.1.
5
Figure 2.1. Gal’s (2004) definition of statistical literacy.
Although there are differences in conceptualizing statistical literacy, there are
common elements of definitions in the literature. For instance, from the review of the
literature four themes emerged in the definitions of statistical literacy which are:
understanding of statistical results (Wallman, 1993; Schield, 2001; Burnham, 2003;
Garfield, delMas, and Chance, 2003; Watson and Callingham, 2003; Garfield,
delMas, Chance, and Ooms, 2006)
the context of everyday life (Burnham, 2003; Watson and Callingham, 2003;
Hayden, 2004; Schield, 2004)
understanding (the basic) concepts, vocabulary, symbols of statistics, and some
probability (Garfield, delMas, and Chance, 2003; Watson and Callingham, 2003; and
Garfield, delMas, Chance, and Ooms, 2006)
critical evaluation of information (Wallman, 1993; Watson and Callingham, 2003
and 2004; and Gal, 2004)
From this synthesis of the literature, understanding statistical concepts, and results;
and critical evaluation of information can be considered as the abilities necessary to be
statistically literate; where everyday life is the context of statistical literacy; concepts,
vocabulary, symbols of statistics and some probability constitutes the content of statistical
literacy.
6
Callingham (2006) stresses the necessity of identifying a framework for assessing
statistical literacy. Watson (1997) presented a framework with three hierarchical
components with increasing sophistication which can be listed as:
(i) a basic understanding of terminology of probability and statistics
(ii) an understanding of statistical language and concepts given in the context of wider social discussion
(iii) a questioning attitude for questioning the application of concepts to contradict claims
made without proper statistical foundation
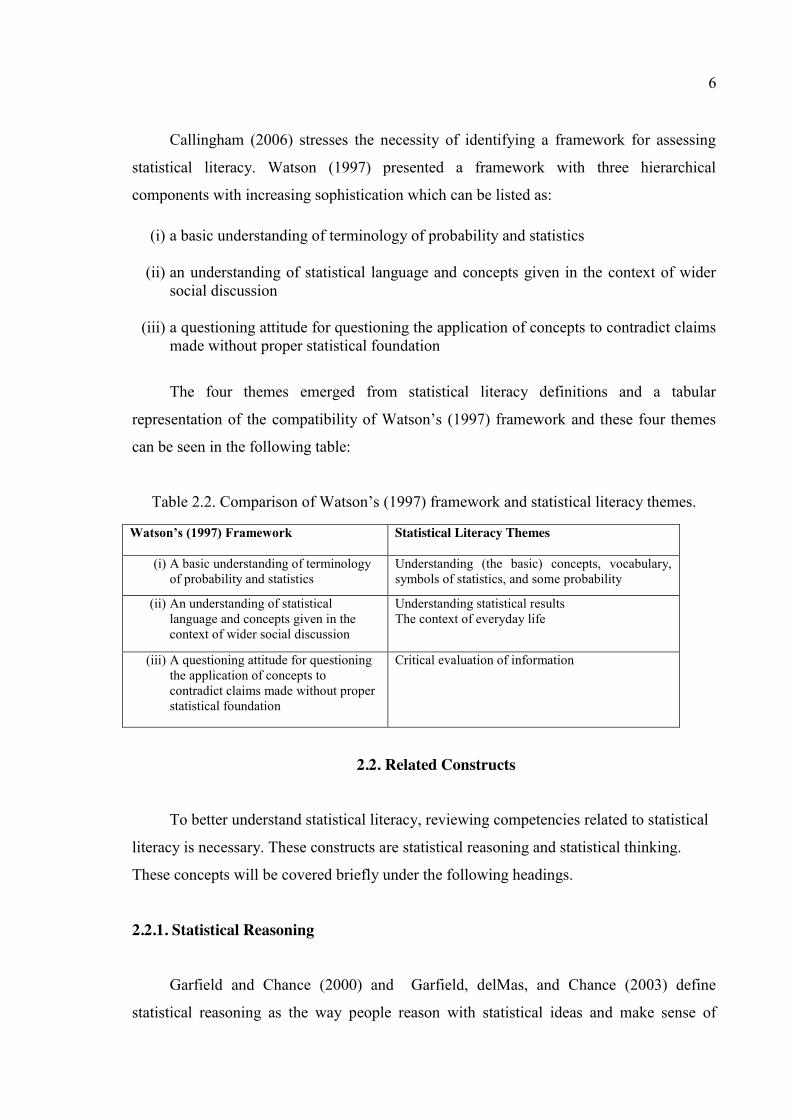
The four themes emerged from statistical literacy definitions and a tabular
representation of the compatibility of Watson’s (1997) framework and these four themes
can be seen in the following table:
Table 2.2. Comparison of Watson’s (1997) framework and statistical literacy themes.
Watson’s (1997) Framework Statistical Literacy Themes
(i) A basic understanding of terminology of probability and statistics
Understanding (the basic) concepts, vocabulary, symbols of statistics, and some probability
(ii) An understanding of statistical language and concepts given in the context of wider social discussion
Understanding statistical results The context of everyday life
(iii) A questioning attitude for questioning the application of concepts to contradict claims made without proper statistical foundation
Critical evaluation of information
2.2. Related Constructs
To better understand statistical literacy, reviewing competencies related to statistical
literacy is necessary. These constructs are statistical reasoning and statistical thinking.
These concepts will be covered briefly under the following headings.
2.2.1. Statistical Reasoning
Garfield and Chance (2000) and Garfield, delMas, and Chance (2003) define
statistical reasoning as the way people reason with statistical ideas and make sense of
7
statistical information. Some selected types of reasoning necessary for statistical reasoning
can be listed as reasoning about data, reasoning about representations of data, reasoning
about statistical measures, reasoning about uncertainty, reasoning about samples, and
reasoning about association (Garfield, 2003). Garfield, delMas, and Chance (2003)’s
clarification on statistical reason was summarized in Ben-Zvi and Garfield (2004) as
statistical reasoning may involve connecting one concept to another (e.g., center and
spread), or it may combine ideas about data and chance having in mind that reasoning
means understanding and being able to explain statistical processes and being able to fully
interpret statistical results.
2.2.2. Statistical Thinking
Snee (1990, p.118) defines statistical thinking as
“thought processes, which recognize that variation is all around us and present in everything we do, all
work is a series of interconnected processes, and identifying, characterizing, quantifying, controlling,
and reducing variation provide opportunities for improvement”.
Pfannkuch and Wild (2004) proposed five types of thinking that are fundamental for
statistical thinking: Recognition of the need for data, transnumeration, consideration of
variation, reasoning with statistical models, and integrating the statistical and contextual.
According to them, recognition of the need for data stands for considering the real
situations data as a prime requirement for reliable judgments, transnumeration means
“changing representations to engender understanding”, consideration of variation occurs in
the process of how variation arises and is transmitted through data and the uncertainty
caused by unexplained variation. Moreover, statistical models are taken in a broad range
including all types of tools that are used in representing and thinking about reality like
graphs and by reasoning with statistical models people are expected to read, interpret and
reason graphs, centers, spreads, clusters, outliers, residuals, confidence intervals, and p-
values to find evidence on which to base a judgment. Lastly, Pfannkuch and Wild (2004)
state that synthesizing statistical and contextual knowledge on concluding what can be
learned from the data about the context is necessary for statistical thinking and they name
this competency as integrating the statistical and contextual.
8
Garfield, delMas, and Chance (2003) summarizes that statistical thinking involves
understanding of why and how statistical investigations are conducted and understanding
“big ideas” like nature of variation and sampling, usage of data analysis methods and
visual displays of data, research methods to claim causality. Moreover, statistical thinking
includes understanding how models are used and utilizing the context of a problem in
drawing conclusions.
From the analysis of definitions given above, it can be inferred that there is an
understanding of statistical thinking that embraces statistical processes, variation, and the
context. Chance (2002) suggests that from existing definitions it can be said that there
exists a more global view of the statistical process which include understanding of
variability and the statistical process as whole.
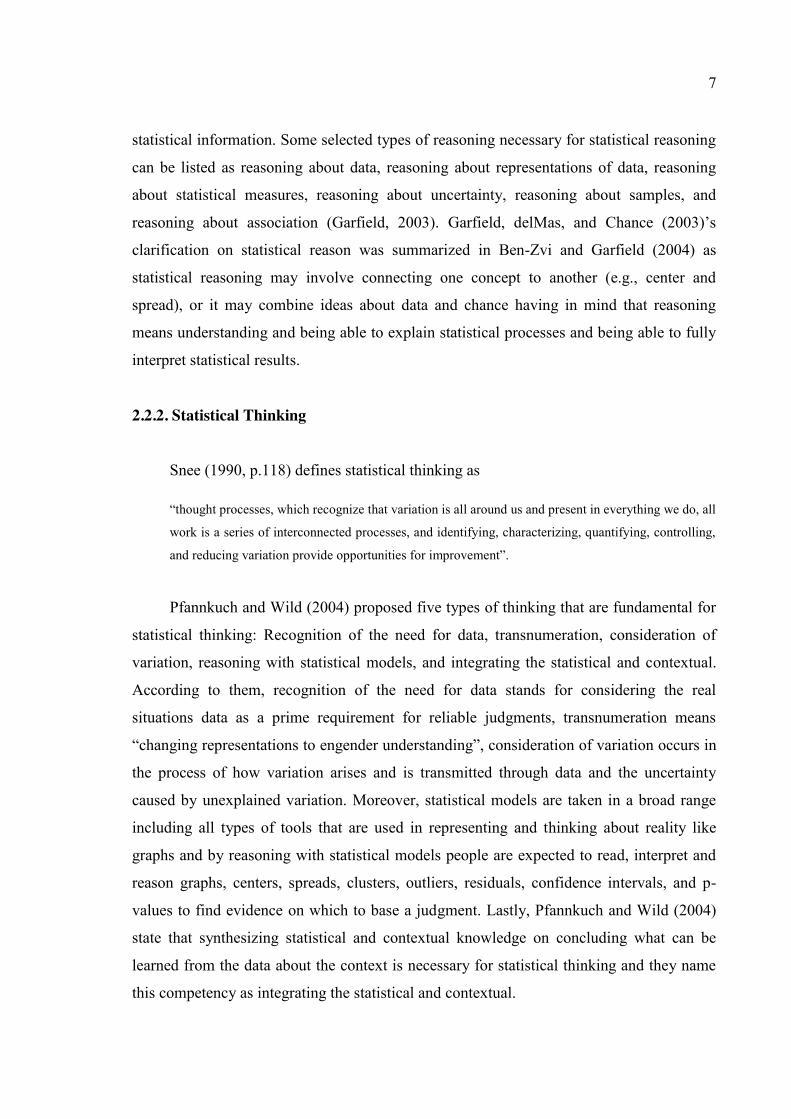
As a final word, delMas (2002) assumes that the content is not a determinant factor
in distinguishing these three domains, but the cognitive engagement with the content is.
Moreover, he lists the tasks he collected from literature related to each domain in the
following table:
Table 2.3. delMas’ (2002) three instructional domains.
Basic Literacy Reasoning Thinking Identify Describe Rephrase Translate Interpret Read
Why? How? Explain (The Process)
Apply Critique Evaluate Generalize
2.3. Models of Statistical Literacy
The models he proposes represent two different perspectives about the relationship
between literacy, reasoning and thinking. One perspective he uses is focusing on literacy
for the development of basic skills and knowledge necessary for statistical reasoning and
statistical thinking. Another perspective is thinking of statistical literacy as a domain that
encompasses other domains. In this second perspective, statistically reasoning and
statistical thinking are sub goals in the pursuing of developing statistical literacy. In this
9
point of view, a statistically literate person is the one who also knows how to think
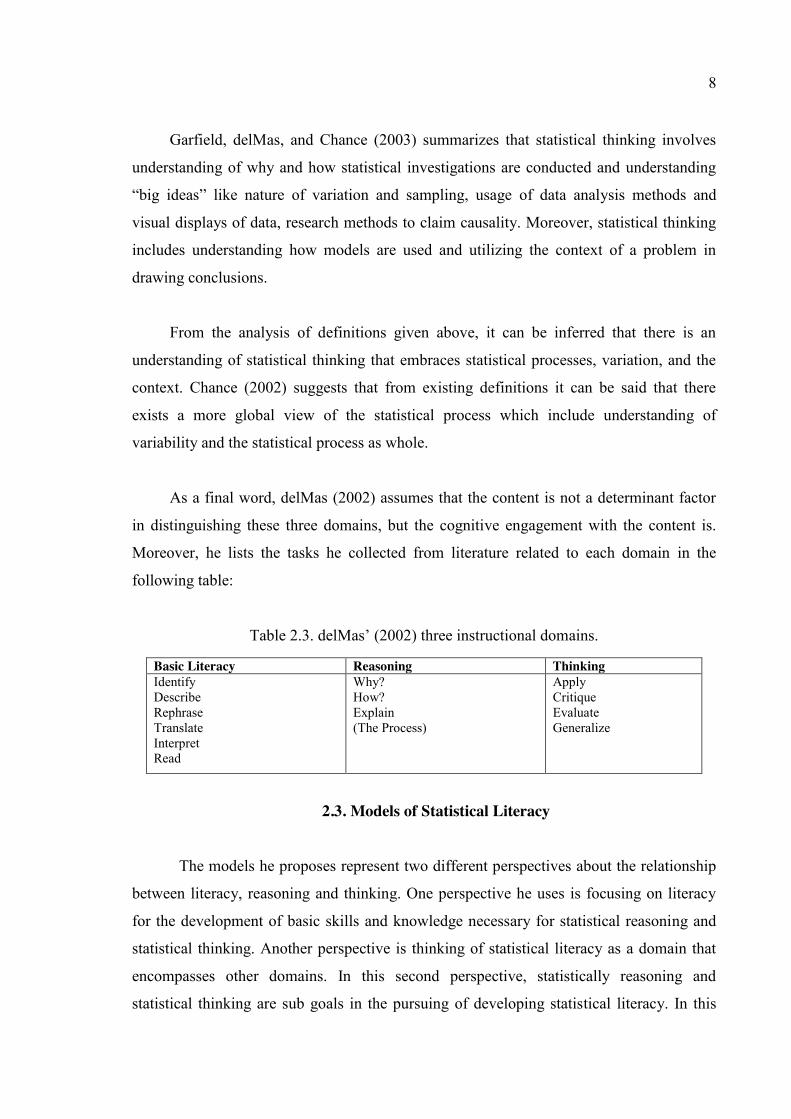
statistically. These two models can be seen in Figure 2.2.
Figure 2.2. delMas’ (2002) models of statistical literacy.
In the first model, it is seen that statistical thinking, statistical reasoning, and
statistical literacy are independent, yet overlapping domains. In this regard, literacy is
considered as the basic literacy for which with identifying, describing, rephrasing,
translating, interpreting, and reading is required. These activities can be thought as lower
mental processes, which also correspond to “comprehension” level in terms of Bloom’s
(1956) taxonomy of educational objectives or “understanding” level in terms of Anderson
and Krathwohl's (2000) Taxonomy which is a revised version of Bloom’s taxonomy and
equivalent of comprehension level.
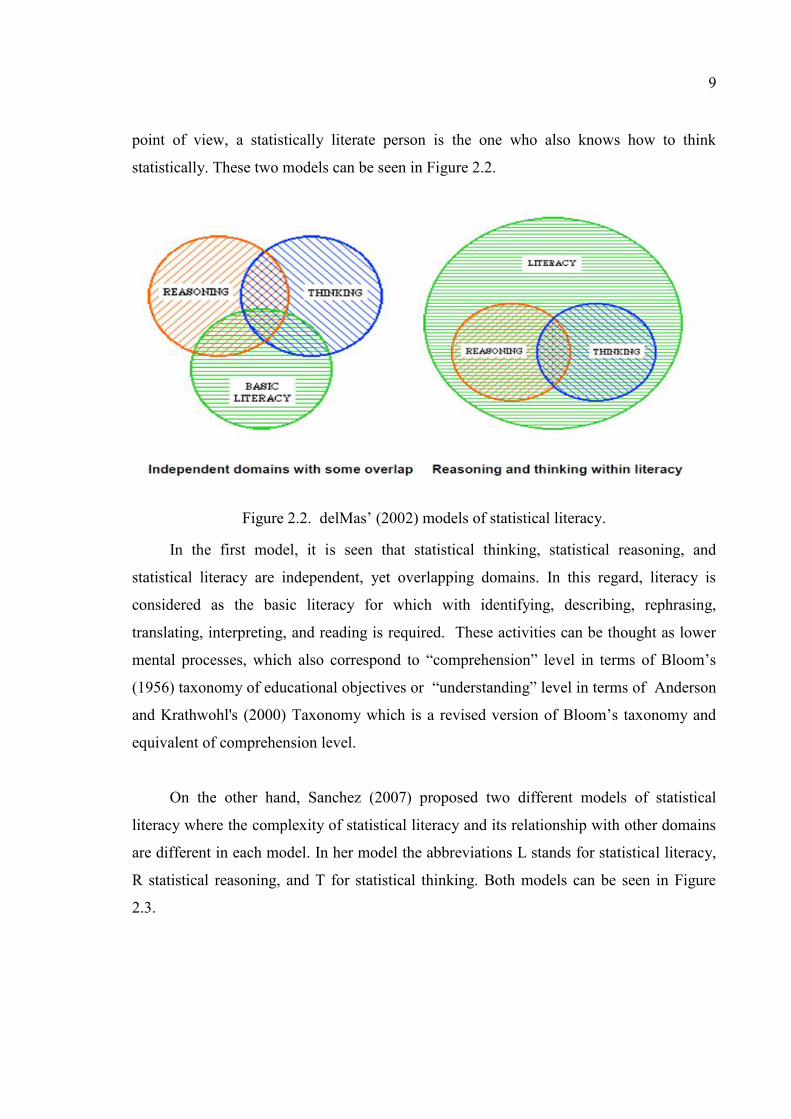
On the other hand, Sanchez (2007) proposed two different models of statistical
literacy where the complexity of statistical literacy and its relationship with other domains
are different in each model. In her model the abbreviations L stands for statistical literacy,
R statistical reasoning, and T for statistical thinking. Both models can be seen in Figure
2.3.
10
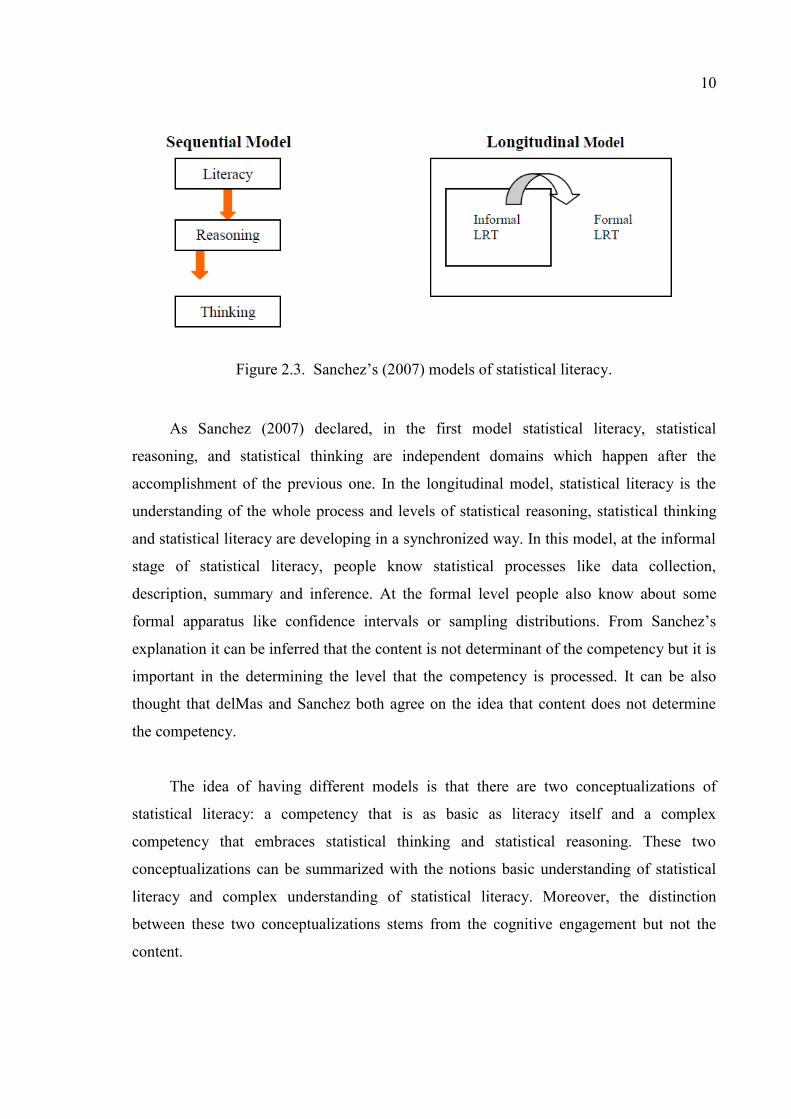
Figure 2.3. Sanchez’s (2007) models of statistical literacy.
As Sanchez (2007) declared, in the first model statistical literacy, statistical
reasoning, and statistical thinking are independent domains which happen after the
accomplishment of the previous one. In the longitudinal model, statistical literacy is the
understanding of the whole process and levels of statistical reasoning, statistical thinking
and statistical literacy are developing in a synchronized way. In this model, at the informal
stage of statistical literacy, people know statistical processes like data collection,
description, summary and inference. At the formal level people also know about some
formal apparatus like confidence intervals or sampling distributions. From Sanchez’s
explanation it can be inferred that the content is not determinant of the competency but it is
important in the determining the level that the competency is processed. It can be also
thought that delMas and Sanchez both agree on the idea that content does not determine
the competency.
The idea of having different models is that there are two conceptualizations of
statistical literacy: a competency that is as basic as literacy itself and a complex
competency that embraces statistical thinking and statistical reasoning. These two
conceptualizations can be summarized with the notions basic understanding of statistical
literacy and complex understanding of statistical literacy. Moreover, the distinction
between these two conceptualizations stems from the cognitive engagement but not the
content.
11
From this perspective, it can be said that Watson and Callingham (2004), Burnham
(2003), Schield (2001), and Wallman (1993) perceive statistical literacy as a complex
construct. On the other hand definitions of Gal (2004) and Schield (2004) signal that these
authors mainly focus on statistical literacy as a construct with basic competency.
The reasons on having different ideas about the complexity of the statistical literacy
can be analyzed. As stated previously, there are four themes that emerge in definitions of
statistical literacy: understanding of statistical results, the context of everyday life,
understanding concepts, vocabulary, symbols of statistics, and some probability, and
critical evaluation of information. Among these four themes the context of everyday life
and understanding are relatively clear that the probability of affecting the complexity of
statistical literacy is low but the competency of critical evaluation can be effective in
determining the complexity of statistical literacy. Critical evaluation can mean a wide
range of actions like criticizing the relationship between the data and its interpretation,
criticizing the relationship between given statistical results and the research methods that
the results were yielded through, or criticizing about the variables that are not included in
the study but may affect the statistical results yielded. Hence, it can be said that the
complexity of statistical literacy concept can differ through how deep individuals are
expected to dig in criticizing a statistical expression they encounter.
2.4. Content of Statistical Literacy
As statistical literacy was described with understanding the concepts, vocabulary,
symbols of statistics, and some probability (Garfield, delMas, and Chance, 2003; Watson
and Callingham, 2003; and Garfield, delMas, Chance, and Ooms, 2006), it can be said that
there is not a consensus about what content should be covered in statistical literacy.
Identifying the basic concepts of statistics is an important question to be addressed in order
to describe the scope of the definition of statistical literacy used in this study. Previous
studies on assessment, teaching, proposals for necessary topics for statistics related
concepts, and related curriculum were gathered and analyzed in terms of its content.
12
2.4.1. Statistical Literacy Content in Instruments
Previous studies assessing or teaching statistical literacy were examined in terms of
their content coverage. To start with, studies assessing statistical literacy were searched. As
it was seen from the models of statistical literacy, statistical can be seen in relation with
statistical reasoning and statistical thinking. Therefore, instruments assessing statistical
reasoning and statistical thinking were also searched. It was considered that some topics
could be covered commonly although the depth of topics could be different in such
instruments. In addition, instruments assessing statistics achievement were also searched.
To start with, Schield (2002, 2008) constructed an inventory about “Reading and
Interpreting Tables and Graphs Involving Rates and Percentages” and developed it into
“Statistical Literacy Skills Survey. The item- total score correlations, percentage of
questions which were answered right were calculated, and by modeling different number
of questions, he asserts that the improvement of the instrument can be possible by
eliminating some of the questions (Schield, 2008). However no evidence for construct and
content validity was reported.
Other than statistical literacy instruments, Garfield, delMas, and Chance (2006)
published their project named Assessment Resource Tools for Improving Statistical
Thinking (ARTIST) aimed at improving research on statistical literacy, reasoning and
thinking for undergraduate students. They developed topic based scales which cover 11
topics each consisting of 7-15 multiple-choice items to assess student reasoning in those
particular topics. The psychometric properties of these scales are not published that’s why;;
they cannot be reported here.
Another study is Comprehensive Assessment of Outcomes for a first course in
Statistics (CAOS) test produced by Garfield, DelMas, Chance, Poly, Ooms (2006). The
aim of such a study is developing an instrument for measuring conceptual understanding of
important statistical ideas by a broader range of students who enroll in the first, non-
mathematical statistics courses at the undergraduate level. The content validity for CAOS
was assured with three rounds of evaluation by content experts for college-level non-
mathematical first course in statistics (delMas, Garfield, Ooms, and Chance, 2006). The
13
psychometric properties of this scale was reported as valid and reliable (Cronbach alpha=
.82) when it was tried in undergraduate student groups (delMas, Garfield, Ooms, and
Chance, 2006; 2007).
Allen (2006) developed an instrument called The Statistics Concept Inventory for
assessing conceptual understanding of students taking statistics courses from different
departments including engineering, mathematics, and social sciences. Content validity of
the instrument was achieved through surveying faculty about the necessity of statistics
topics in their curricular needs. Moreover, the reliability of the instrument was calculated
in different administrations and for the last administration the alpha of the instrument was
found as .76.
Garfield (2003) developed and instrument for assessing statistical reasoning named
Statistical Reasoning Assessment (SRA) consisting of 20 multiple choice items about
probability and statistics concepts as it was defined as reasoning with statistical ideas and
making sense of statistical information (Garfield and Chance, 2000). The reliability
analysis showed that inter correlations between items were low and items were not
measuring one trait or ability.
Moreover, in 2003 Sundre Developed Quantitative Reasoning Questionnaire (QRQ)
based upon revisions of Garfield’s (2003) instrument for the purpose of how students use
quantitative information in everyday life. The new instrument consisted of 40 multiple
choice items and was tried with 804 sophomore students. The internal consistency was
calculated as .62. The compilation and comparison of statistics topics covered in
assessment studies can be seen Appendix A in Table A.1 and Table A.2 respectively.
2.4.2. Statistical Literacy Content in Instruction
There were also studies which performed an instruction for the attainment of
statistical literacy. Wilson (1994) developed and evaluated a statistical literacy program
for the use of undergraduate students at Illinois which was named as “A Brief Course in
Statistical Literacy”. Dimensions of this program were defined as understanding statistics,
applying statistics, and interpreting statistic and topics in this program included picturing
14
data displays and describing distributions. He also developed an instrument, namely Test
of Statistical Literacy I and II, for evaluating the attainment in the course content. He
developed two parallel forms of the instrument to evaluate the effectiveness of his
instruction, one to be administered as pretest and the other as posttest each consisting of 38
questions; the reliability of the pretest was calculated as .69 and as .82 for the posttest.
Schield (2003) also taught a one semester course in statistical literacy with business
majors. This course covered the objectives like reasoning with statistics and describing
rates and percents. In 2009, another course, a mini, five two-hour session course was
designed for adults in Union College for Lifelong Learning (UCALL) which was named as
Numbers in Everyday Life (Hahn, Doganaksoy, Lewis, Oppenlander, Schmee, 2010).
Topics covered for this course included some examples and basic concepts, polls and
forecasts. In addition, Merriman (2006) designed a unit of work on statistical literacy to
ninety 14 years old students in New Zealand using media reports. The duration of the
teaching was 12 hours and pre and post assessment were done with questions featured
short answer questions involving media reports on statistical literacy concepts.
Compilation of statistics topics covered in these instruction studies can be seen at
Appendix A in Table A.3.
2.4.3. Suggested Statistical Literacy Content by Authors
There are some studies focused on proposing some important topics in statistics
education. For example, Scheaffer, Watkins, and Landwehr (1998, as cited in Gal, 2004)
proposed a list of topics that are essential to include in a study like number sense and
understanding variables. Garfield and Ben-Zvi (2005) also offered a list of big ideas of
statistics that students encounter throughout their education including data and distribution.
Moreover, some other researchers identified some ideas that every student should
know. For example, in her article “What educated citizens should know about statistics and
probability” Utts (2003) tried to compile ideas which she claims that necessary for every
student who takes elementary statistics to be an educated citizen. These essential ideas
include knowing when it can be concluded that a relationship is a cause and effect type of
relationship and when it is not and the difference between statistical significance and
15
practical importance. Also Schield (1999) stated three important distinctions that are
important in distinguishing a statistical literate person and an illiterate one. These
distinctions are association versus causation, sample versus population, and the quality of
the test versus the power of the test. The association versus causation distinction indicates
the ability to distinguish between causal relationships from others. The sample versus
population distinction stands for distinguishing target population from the sampled
population and the distinction between the quality and power of a test includes the part and
whole relationship. He also gives a full list of the knowledge areas that a statistically
literate person accomplishes which also include interpreting what a statistic means and
asking various questions about the statistics. The detailed list of statistics topics proposed
as necessary by the authors mentioned can be seen at the Appendix A in Table A.4.
2.4.4. Statistical Literacy Content in Curricula
The statistics topics in mathematics curriculum can also be considered as a way to
identify basic concepts of statistics. In United States, Sorto (2006) analyzed documents
regarding mathematics education in middle grades from ten states, mostly being state
standards and constructed contour maps accordingly. The map regarding ten states
indicated that the least covered topics were shapes of distribution and the process of
statistical investigation where the emphasis is on representations of data and measure of
center (Sorto, 2006).
In Turkey, grades 1-8 are compulsory for all citizens and statistics topics in these
eight year long curricula can be considered as the basic statistical knowledge that every
citizen is expected to know. For university students, statistics subjects covered in grades 1-
12 can be considered as the basic content knowledge that a person is expected to attain.
Since Turkish curriculum before 2006 was spiral, it repeats the content with different depth
and breadth analyzing statistics topics in grades 6-12 sufficient for understanding basic
content knowledge that a university student is expected to attain.
The national curriculum at 6-8 grade levels includes subjects on both statistics and
probability. The objectives are not separately defined for probability and statistics. The
concepts for statistics and probability areas covered in these grades include basic
16
probability concepts, tables and graphs, and measures of center. When 9-12 mathematics
curriculum on statistics and probability areas are analyzed, it was seen that there was only
one related chapter. This chapter is in the 10th grade and about probability. However in 10th
grade, students are assigned to different areas regarding their orientation and future ideals.
Those students who wish to pursue degrees that require preparation on science and
mathematics are required to take more and extensive science and mathematics courses.
That’s why, probability unit is compulsory for only students those who wish to take
extensive mathematics courses.
Compared with 1-5 grades curriculum, it can be seen that in 9-12 grades curriculum
many of the content covered in primary school is not revisited and three new subjects were
added. These new subjects are impossible events, certain events, and conditional
probability. All the subjects regarding statistics and probability in grades 6-12 can be
organized as follows:
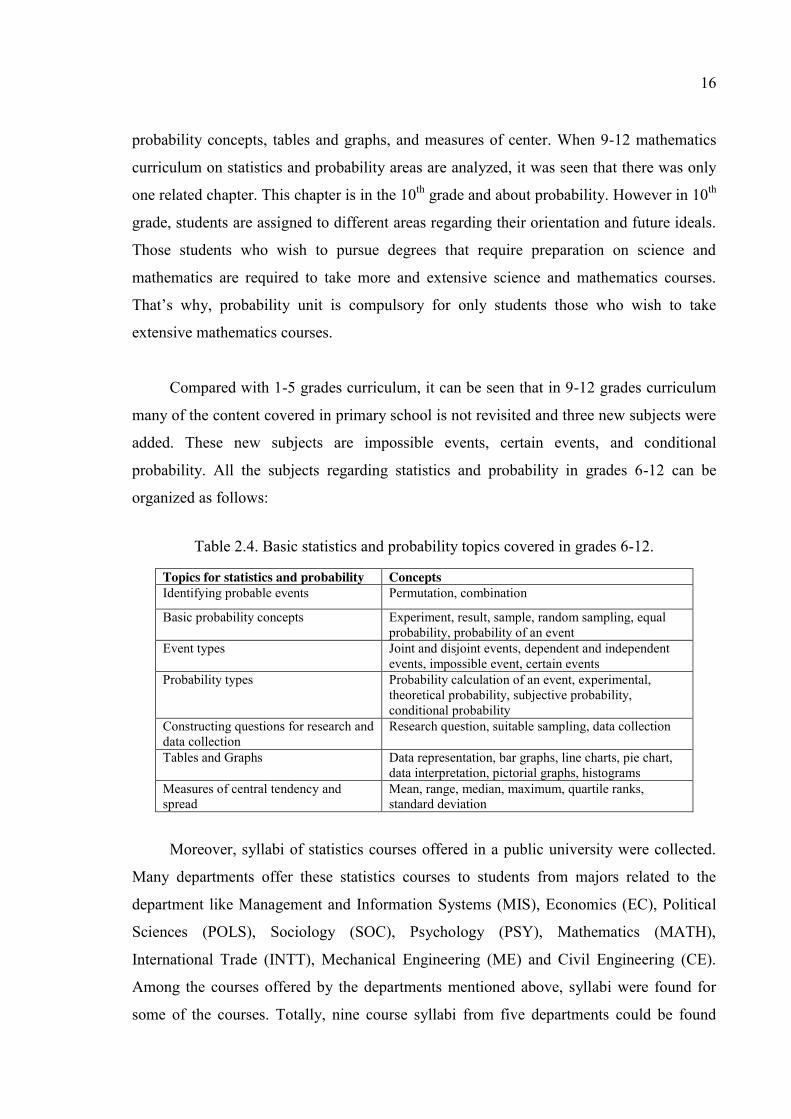
Table 2.4. Basic statistics and probability topics covered in grades 6-12.
Topics for statistics and probability Concepts Identifying probable events Permutation, combination
Basic probability concepts Experiment, result, sample, random sampling, equal probability, probability of an event
Event types Joint and disjoint events, dependent and independent events, impossible event, certain events
Probability types Probability calculation of an event, experimental, theoretical probability, subjective probability, conditional probability
Constructing questions for research and data collection
Research question, suitable sampling, data collection
Tables and Graphs Data representation, bar graphs, line charts, pie chart, data interpretation, pictorial graphs, histograms
Measures of central tendency and spread
Mean, range, median, maximum, quartile ranks, standard deviation
Moreover, syllabi of statistics courses offered in a public university were collected.
Many departments offer these statistics courses to students from majors related to the
department like Management and Information Systems (MIS), Economics (EC), Political
Sciences (POLS), Sociology (SOC), Psychology (PSY), Mathematics (MATH),
International Trade (INTT), Mechanical Engineering (ME) and Civil Engineering (CE).
Among the courses offered by the departments mentioned above, syllabi were found for
some of the courses. Totally, nine course syllabi from five departments could be found
17
some of which sequential courses, such as Statistics I and Statistics II. There was a big
variation on the topics included in a course depending on the necessities of each
department. Although covered in different depth, some common topics were found across
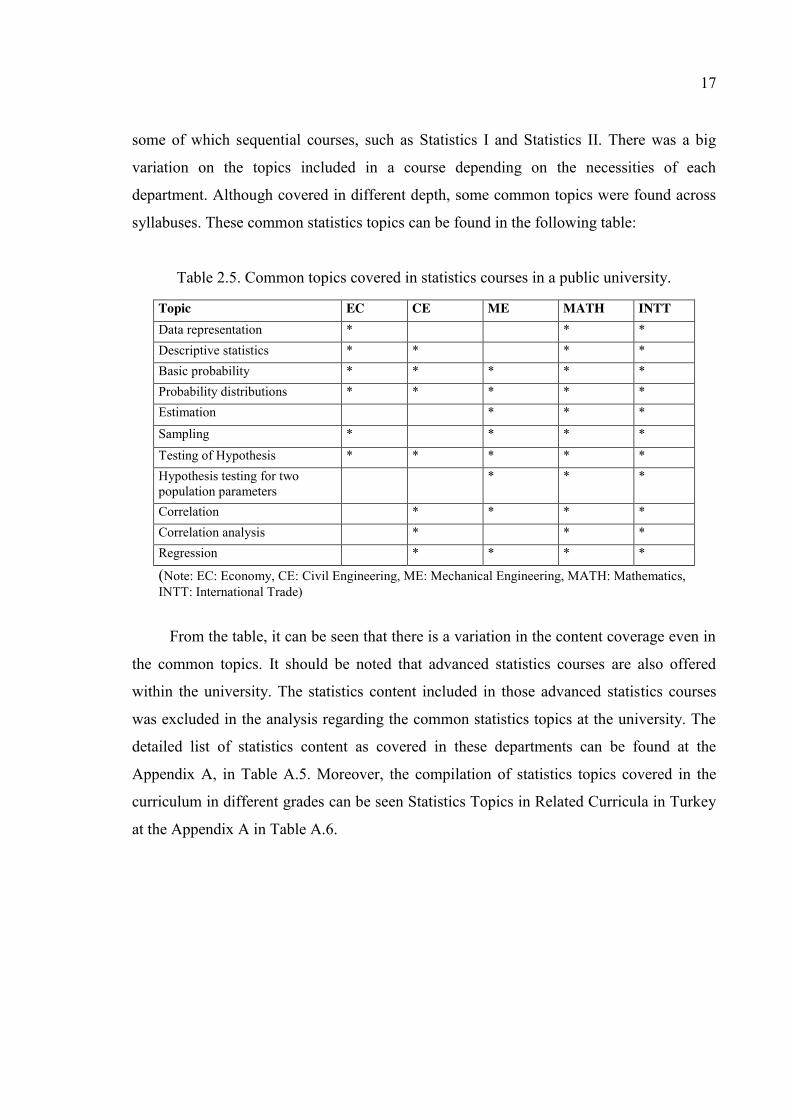
syllabuses. These common statistics topics can be found in the following table:
Table 2.5. Common topics covered in statistics courses in a public university.
Topic EC CE ME MATH INTT Data representation * * * Descriptive statistics * * * * Basic probability * * * * * Probability distributions * * * * * Estimation * * * Sampling * * * * Testing of Hypothesis * * * * * Hypothesis testing for two population parameters
* * *
Correlation * * * * Correlation analysis * * * Regression * * * *
(Note: EC: Economy, CE: Civil Engineering, ME: Mechanical Engineering, MATH: Mathematics, INTT: International Trade)
From the table, it can be seen that there is a variation in the content coverage even in
the common topics. It should be noted that advanced statistics courses are also offered
within the university. The statistics content included in those advanced statistics courses
was excluded in the analysis regarding the common statistics topics at the university. The
detailed list of statistics content as covered in these departments can be found at the
Appendix A, in Table A.5. Moreover, the compilation of statistics topics covered in the
curriculum in different grades can be seen Statistics Topics in Related Curricula in Turkey
at the Appendix A in Table A.6.
18
2.5. Context of Statistical Literacy
Literature reveals statistical literacy requires understanding statistical claims and
arguments and critically evaluating them in everyday life situations. The context in which
it is meaningful to observe statistical literacy was defined as the context of everyday life by
Burnham (2003), Watson and Callingham, (2003), Hayden (2004), and Schield (2004).
There were studies which employed daily life examples in the instruction of statistics
(Wilson, 1994; Merriman, 2006; Hahn, Doganaksoy, Lewis, Oppenlander, Schmee, 2010).
As Gal and Garfield (1997) stated, traditional questions used for assessment in
statistics education usually lack an appropriate context and therefore are limited in giving
information about students’ ability to interpret statistical arguments. Hence, statistics
questions need to have some context to be effective for assessment.
Using everyday life examples can be seen in assessment of statistical literacy where
several studies in statistical literacy were assessed in different contexts. Media articles and
research reports (Reston, 2005; Budgett and Pfannkuch, 2007), journal articles (Budgett
and Pfannkuch, 2007), and advertisements (Reston, 2005) were seen to be employed as the
media for observing statistical literacy.
2.5.1. Statistical Literacy in the Turkish Context
A statistically literate person is expected to be literate about everyday statistics.
That’s why;; the context is important for understanding statistical literacy. Studies about
statistical literacy in the Turkish context were searched however, the researcher was unable
to find a study that is directly related to statistical literacy that was done in Turkish context.
Therefore, studies about statistical thinking and attitudes towards statistics will be
reviewed as the related literature about statistical literacy in the Turkish context.
Beginning with the most related study, Şahin (2011a) analyzed undergraduate
students’ questioning of causality in media excerpts and compared them with Watson and
Callingham’s (2004) levels of statistical literacy. She found that there is almost one to one
correspondence with complexity of participants’ answers and hierarchical levels of
statistical literacy proposed by Watson and Callingham. From the data, it can be said that
19
although many students are aware of the need for experimentation and control to infer
causality, many hold idiosyncratic beliefs at the same time.
Moreover, Yılmaz (2003) examined university students questioning of media
inferences and observed that university freshmen and sophomore students had the tendency
of questioning information in terms of theory or agent where junior and senior students had
the tendency of questioning information in terms of data and statistics.
Akkaş (2009) examined 6th – 8th graders’ statistical thinking in describing,
organizing, representing, analyzing, and interpreting data procedures using SOLO
(Structure of the Observed Learning Outcome) taxonomy. This taxonomy describes
developmental cognitive levels of thinking which are pre-structural, unistructural,
multistructural, relational, and extended abstract levels (Biggs and Collis, 1991). In this
taxonomy, students at pre-structural level have little understanding of the question posed
and his answer is not related to the question. Students in unistructural level shows some
understanding, he focuses on the question but only one aspect of it, he gives limited
answers to questions. Students in multistructural level can approach the question from
multiple aspects but his answers are not aligned with each other, the relationship between
aspects emerges at the relational level. The student at relational level can give consistent
answers and can understand the role of different aspects in his answer. In the extended
abstract level, in addition to the previous level, student can make generalizations and can
use reasoning beyond the task. Mooney (2002) developed a Statistical Thinking
Framework based on SOLO taxonomy. In his study done with 6th, 7th, and 8th grade
students, he tried to identify statistical thinking levels of participants which resulted in four
levels: idiosyncratic, transitional, quantitative, and analytical levels with increasing
complexity. Mooney found that no students were at the fourth level in Statistical Thinking
Framework in all the four processes of data handling. Similarly, Akkaş found that most
students were at the second and third stages, and most students are at the third level.
Moreover, she also found that none of the students were at the fourth level in the data
representation procedures with no students were found at the fourth level in all of the
procedures. These results are in line with the previous research as she suggests.
20
There are also studies about the attitude and self-efficacy. Diri (2007) investigated
attitude towards statistics in a vocational school. He developed a scale called “Attitude
towards Statistics Scale” based on attitude scales in the literature and a mathematics
attitude scale which assumes to measure attitude in the dimensions of love, profession,
fear, pleasure, importance, interest, and confidence dimensions. Similarly the Attitude
towards Statistics Scale he developed was seen to consist of the same seven dimensions.
Moreover, these seven dimensions can be reduced to three dimensions where the first
dimension consist of love, interest, and pleasure dimensions; the second one consist of fear
and confidence dimension; and the third one consist of profession and importance
dimensions. From the data he collected from vocational school students, he observed that
students’ attitude varied for differed dimensions of attitude. Students were holding positive
attitude for fear and importance dimensions; medium attitude for profession and pleasure
dimension, and negative attitude for interest and confidence dimensions.
Sevimli (2010) studied about pre-service mathematics teachers’ misconceptions in
statistics lessons, their self-efficacy in statistics, and attitude towards statistics. She
translated Statistics Concept Inventory developed by Allen (2006) for measuring
participants’ achievement levels in statistics. She concluded that participants are at low
achievement level in statistics and have some misconceptions in statistics. Using the
“Attitude towards Statistics Scale” developed by Diri (2007), she investigated pre-service
mathematics teachers’ attitude levels. She found that participants attitude towards statistics
are medium levels of attitude in fear, pleasure, importance, confidence dimensions and
negative attitude towards profession and interest dimensions. Moreover, she also measured
self efficacy towards statistics with the instrument developed by Finney and Schraw (2003)
for this aim. She founded that preservice mathematics teachers in her sample showed high
levels of self- efficacy towards statistics.
In a study comparing intercultural modes of thinking and reasoning Akarsu (2009)
stated that there are differences between Western and Turkish cultures in terms of
attributing place to statistics in their everyday lives. For instance, the lack of recording and
reporting, and understanding of science, mathematics, and statistics as “unconnected” with
everyday life was stressed in the Turkish culture whereas recording and reporting, and
21
understanding of science, mathematics, and statistics are more connected with everyday
life in the Anglo-Saxon cultures.
To sum, when attitude of university students were examined (Diri, 2007 and Sevimli,
2010), it can be said that students hold medium and low levels of attitude towards
statistics. Studies related to questioning inferences (Şahin, 2011a and Yılmaz, 2003) signal
that many undergraduate students have the tendency to have idiosyncratic beliefs and
questioning information in terms of theory or agent. When 6th to 8th grade students’
statistical thinking was examined (Akkaş, 2009), students were found to be at medium
levels during different procedures. Finally, with a look to the culture, Akarsu (2009) found
that statistics was understood as unconnected with everyday life in the Turkish culture.
From this review, it can be said that thinking with statistics is not expected as a habit of
mind for most of the students in Turkey in different levels. That’s why, it is reasonable to
study statistical literacy as a basic competency in the context of Turkish undergraduate
students.
2.6. Statistical Literacy and Research Competency
The relationship between adult college students’ level of statistical literacy and their
academic background was examined by Wade (2009) and Wade and Goodfellow (2009)
with a quasi-experimental design of research. The sample was taken from students enrolled
in statistics, research methods course without a prior statistics course, research methods
course with a prior statistics course, and a control group consisting of people who had
taken neither of those courses. The results suggest that there were significant differences
between students who have taken any of these classes and those who have not taken any of
them in terms of the scores they gained from CAOS test. Moreover, there were statistically
significant differences between students who had research method courses with prior
statistics course and those who did not take that course, and those who have taken research
methods course without prior statistics course. This difference can stem from research
methodology course content which Cobb and Moore (1997) summarized as including (a)
experimental method and the use of experimental and control groups, (b) pilot studies, (c)
the logic of sampling and the need to infer from samples to populations, and (d) the notions
of representativeness (as cited in Wade, 2009) which have overlaps with the contents of
statistics courses offered. As an example, referring to the Table 2.5 it can be seen that
22
sampling which is a topic in research methods courses is a topic that is commonly covered
in statistics courses given in a public university.
Pérez López (2006) examined theses and dissertations in educational psychology in
terms of the statistics used in those studies and found that students had the following
difficulties: a) their choice of a suitable statistical test concerning their objective of
research, b) the way of interpreting data, c) selection of the design consistent with their
objectives, d) their comprehension of the meaning of some statistical concepts, and e) their
decision use of charts or graphs. Among the difficulties of comprehension of statistical
concepts identified by Pérez López (2006), confusing association and causation, and
validity and reliability are the most significant ones.
As for a study done in Turkey (Kabaca and Erdoğan, 2007) investigated about the
statistical mistakes done by thesis writers in the field of education. They randomly chose
129 Master of Science and Doctor of Science theses from different universities in the fields
of computer education, science education, physics education, chemistry education, and
mathematics education. In the results, they found that there were errors in many thesis
studies and those mistakes could be categorized into seven dimensions. These dimensions
could be listed as errors related to validity and reliability of data collection instruments,
sampling, using descriptive statistics, identifying normal distribution, using parametric and
non-parametric studies, expressions used, and format. They concluded that encountering
with many errors stems from insufficient statistics education. This study can be
informative for describing the academic proficiency of graduate students in terms of their
background in statistics.
In the Turkish context the national curriculum includes an elective course named as
“research methods” for 10th grade high school students who are pursuing a quantitative
oriented major and receiving a curriculum focusing on quantitative courses. The aims of
this course include defining basic concepts of research methods courses, recalling data
collection methods and explaining the importance of research (TMoE, 2010). However, it
is should be noted that this course is not frequently elected in high schools since it does not
cover material that students are responsible for the university entrance exams. That’s why,
23
the contribution of this course for students’ understanding of research and appreciating the
relationship between statistics and research methods is considered to be limited.
Review of these statistics signal that there is a relationship between competencies in
statistics competencies in research methodology. Students dealing more with research are
expected to gain some competencies related to statistics. It is important to look statistical
literacy in universities where research is conducted and preparing students to research is
among the aims of universities. In Turkey undergraduate students’ capabilities in research
and statistics can be low since their academic background may not be sufficient enough as
depicted from the curriculum. From the relationship between statistical literacy and
research competency, it is concluded that statistical literacy of undergraduate students is
important to be examined, however an understanding of basic competency should be
chosen as the framework of the study since students’ background can be limited.
2.7. Definition of Statistical Literacy Used in This Study
A definition of statistical literacy can be formed to be used in this study under the
understanding of statistical literacy as a basic competency using the themes emerged from
synthesis of the literature on definitions of statistical literacy. In this regard, a statistically
literate person is expected to understand basic concepts, vocabulary and symbols of
statistics, and some probability; and critically evaluate statistical information as he or she
encounters them in everyday life situations. Understanding basic concepts, vocabulary and
symbols of statistics, and some probability can be operationalized as knowing and
interpreting them using verbs that Bloom (1956) and Anderson and Krathwohl (2000)
associated with the levels of the taxonomies they suggested. Since criticizing can be
considered at the evaluation level in Bloom’s (1956) and Anderson and Krathwohl’s
(2000) taxonomy, it was necessary to specify the boundaries of criticizing to stick with the
comprehension or understanding level of cognitive engagement. For this reason, critical
evaluation of information can be clarified as criticizing the relationship between a given
statistics and a conclusion derived from it. The reason for clarifying narrow boundaries for
critical evaluation is to stick with the basic understanding of statistical literacy rather than
complex understanding of statistical literacy as these were explained previously. The
tabular representation of this definition can be found in the following table:
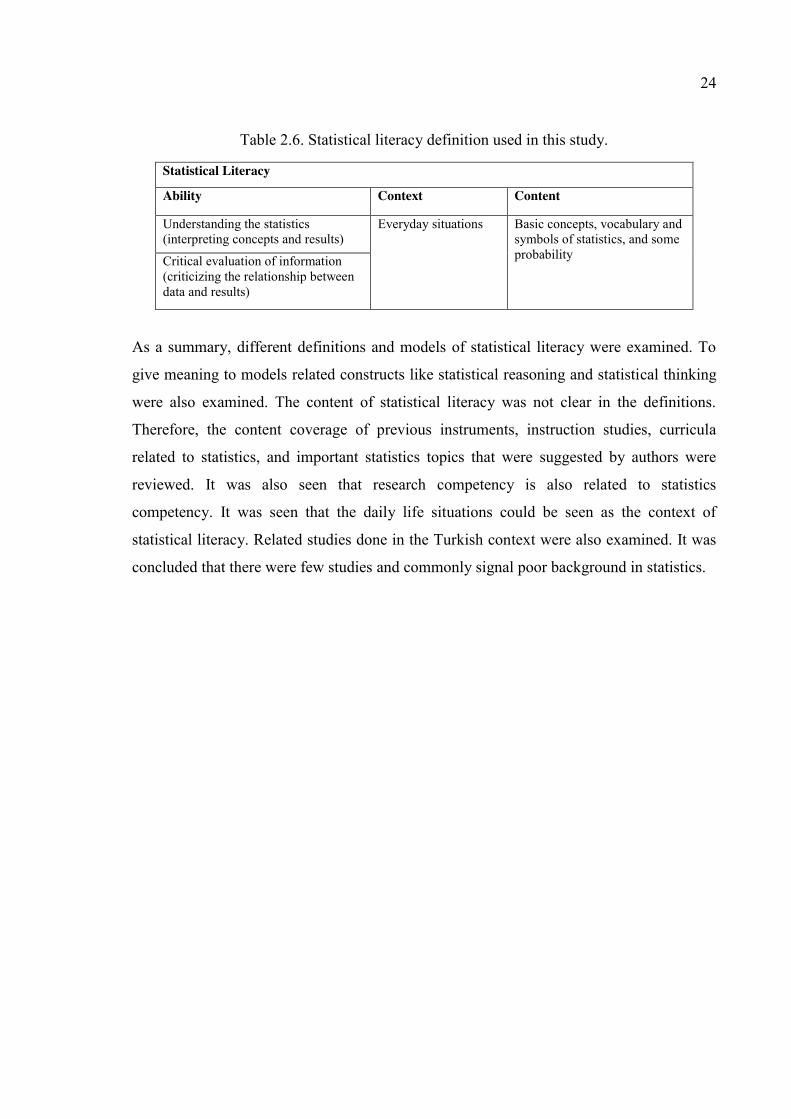
24
Table 2.6. Statistical literacy definition used in this study.
Statistical Literacy
Ability Context Content
Understanding the statistics (interpreting concepts and results)
Everyday situations Basic concepts, vocabulary and symbols of statistics, and some probability Critical evaluation of information
(criticizing the relationship between data and results)
As a summary, different definitions and models of statistical literacy were examined. To
give meaning to models related constructs like statistical reasoning and statistical thinking
were also examined. The content of statistical literacy was not clear in the definitions.
Therefore, the content coverage of previous instruments, instruction studies, curricula
related to statistics, and important statistics topics that were suggested by authors were
reviewed. It was also seen that research competency is also related to statistics
competency. It was seen that the daily life situations could be seen as the context of
statistical literacy. Related studies done in the Turkish context were also examined. It was
concluded that there were few studies and commonly signal poor background in statistics.
25
3. SIGNIFICANCE
Learners’ experiences with statistics in and outside of educational settings is thought
to affect their habit of mind, how they place statistics in understanding the world around
them and how they can understand statistical information in everyday life. There are
theories which claim that the way that people place statistics change as they their
experience with statistics becomes enhanced (delMas 2002 and Sanchez 2007).
Studies done in the Turkish context reveal employing statistics in evaluating
everyday life experiences may not be considered as a habit of mind for most of students
(Şahin, 2011a;; Akarsu, 2009;; Akkaş, 2009;; and Yılmaz 2003). Moreover, studies related to
statistics achievement (Sevimli, 2010;; Kabaca and Erdoğan, 2007) signal that there are
university students and thesis writers have some flaws in their knowledge in statistics.
Moreover, studies assert that university students have fear towards statistics and not
interested (Diri, 2007; Sevimli, 2010). Hence, it can be stated that statistical literacy is
important capability that needs to be addressed in the Turkish context. However, no
research study related to statistical literacy was found in the literature. This study will be
among the first studies about statistical literacy in Turkey.
There are different definitions understandings of statistical literacy. The researcher
tried to extract key themes in understanding and defining statistical literacy in the
literature, and come up with a statistical literacy definition that can be valid in the Turkish
context. The key themes of understanding statistical literacy extracted in this study are
expected to be a contribution to the literature.
Since there is no statistical literacy instrument measuring statistical literacy which
can be valid and practical at the same time, the instrument developed for this study can be
an instrument for researchers in statistics education to administer to university students and
to adapt to students from other levels of education. It is also hoped that, although this
instrument was tailored to the Turkish context, researchers from other countries can also
adapt the instrument for their use.
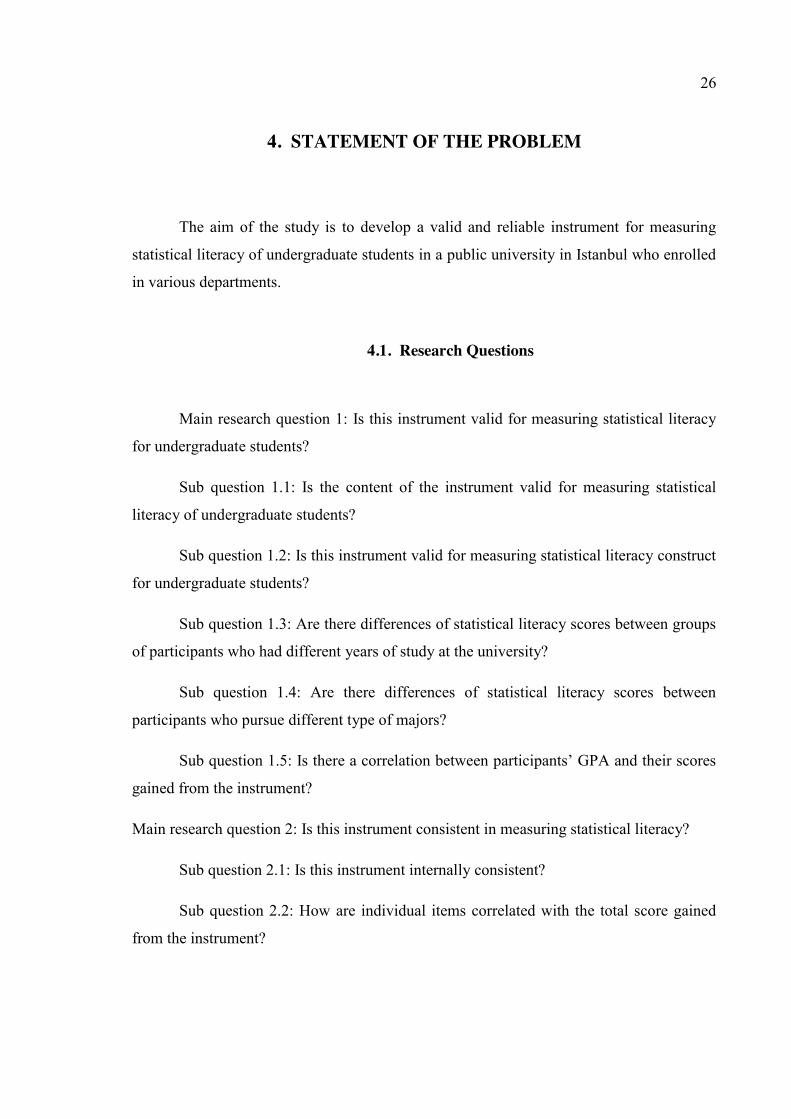
26
4. STATEMENT OF THE PROBLEM
The aim of the study is to develop a valid and reliable instrument for measuring
statistical literacy of undergraduate students in a public university in Istanbul who enrolled
in various departments.
4.1. Research Questions
Main research question 1: Is this instrument valid for measuring statistical literacy
for undergraduate students?
Sub question 1.1: Is the content of the instrument valid for measuring statistical
literacy of undergraduate students?
Sub question 1.2: Is this instrument valid for measuring statistical literacy construct
for undergraduate students?
Sub question 1.3: Are there differences of statistical literacy scores between groups
of participants who had different years of study at the university?
Sub question 1.4: Are there differences of statistical literacy scores between
participants who pursue different type of majors?
Sub question 1.5: Is there a correlation between participants’ GPA and their scores
gained from the instrument?
Main research question 2: Is this instrument consistent in measuring statistical literacy?
Sub question 2.1: Is this instrument internally consistent?
Sub question 2.2: How are individual items correlated with the total score gained
from the instrument?
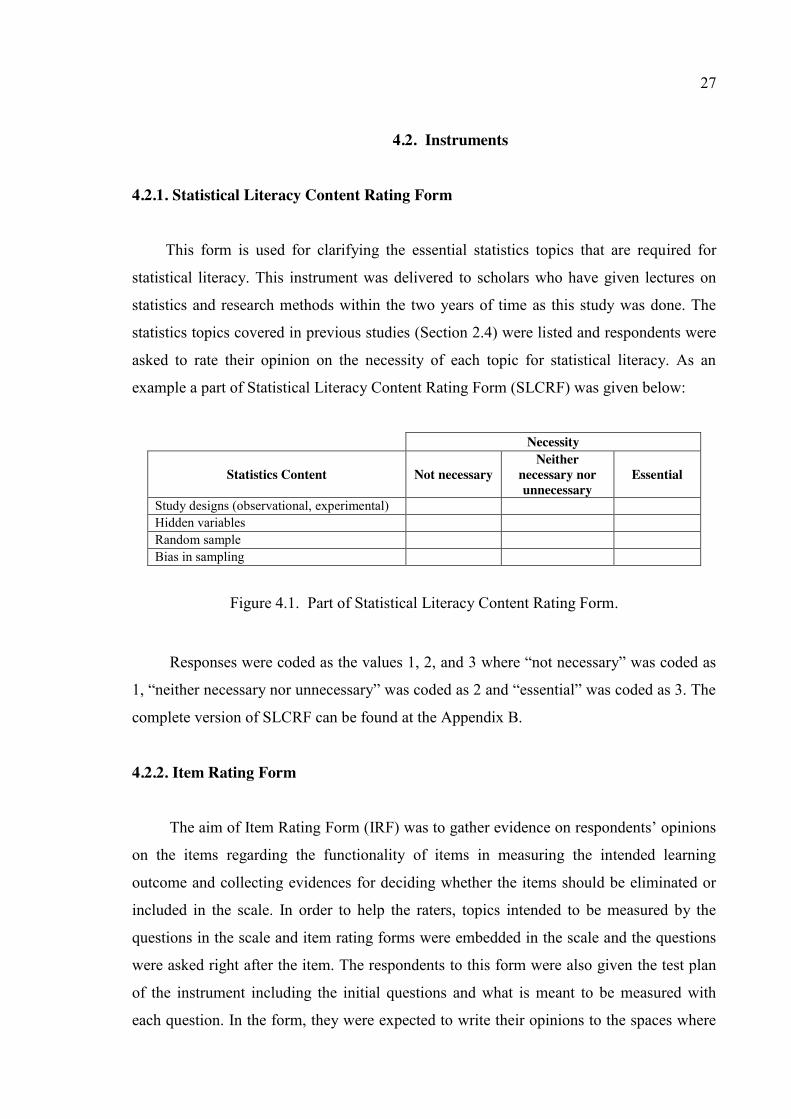
27
4.2. Instruments
4.2.1. Statistical Literacy Content Rating Form
This form is used for clarifying the essential statistics topics that are required for
statistical literacy. This instrument was delivered to scholars who have given lectures on
statistics and research methods within the two years of time as this study was done. The
statistics topics covered in previous studies (Section 2.4) were listed and respondents were
asked to rate their opinion on the necessity of each topic for statistical literacy. As an
example a part of Statistical Literacy Content Rating Form (SLCRF) was given below:
Figure 4.1. Part of Statistical Literacy Content Rating Form.
Responses were coded as the values 1, 2, and 3 where “not necessary” was coded as
1, “neither necessary nor unnecessary” was coded as 2 and “essential” was coded as 3. The
complete version of SLCRF can be found at the Appendix B.
4.2.2. Item Rating Form
The aim of Item Rating Form (IRF) was to gather evidence on respondents’ opinions
on the items regarding the functionality of items in measuring the intended learning
outcome and collecting evidences for deciding whether the items should be eliminated or
included in the scale. In order to help the raters, topics intended to be measured by the
questions in the scale and item rating forms were embedded in the scale and the questions
were asked right after the item. The respondents to this form were also given the test plan
of the instrument including the initial questions and what is meant to be measured with
each question. In the form, they were expected to write their opinions to the spaces where
Necessity
Statistics Content Not necessary Neither
necessary nor unnecessary
Essential
Study designs (observational, experimental) Hidden variables Random sample Bias in sampling
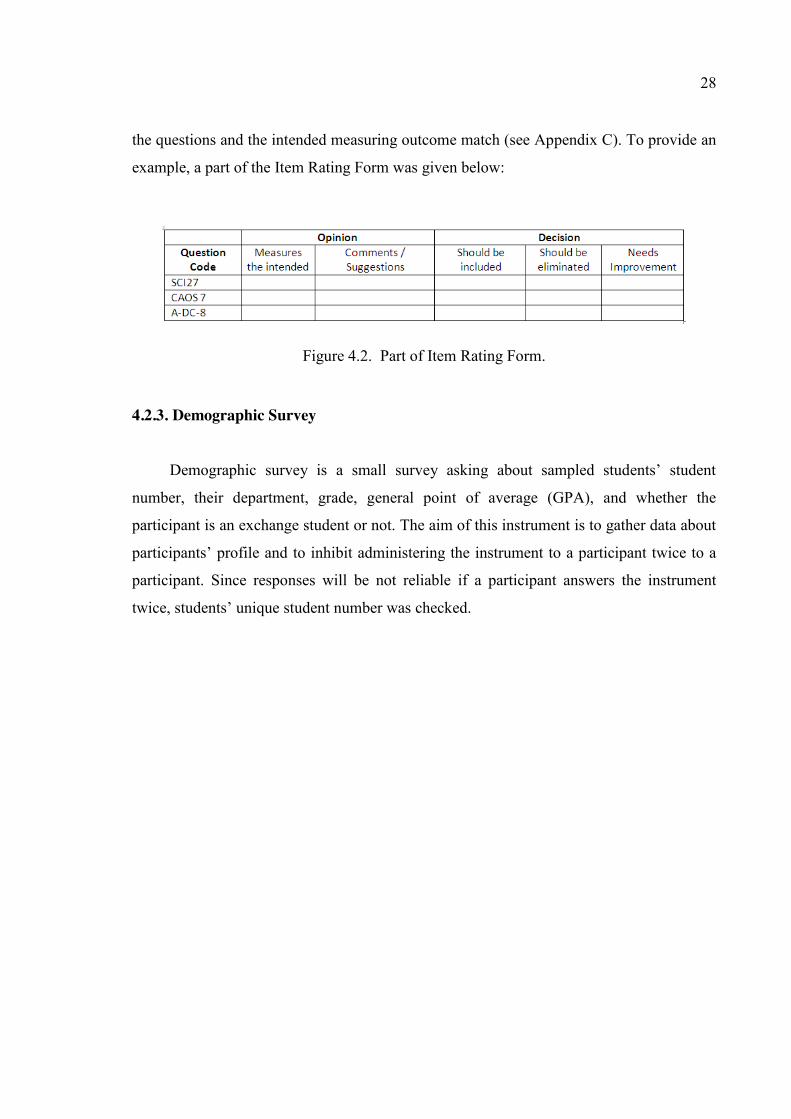
28
the questions and the intended measuring outcome match (see Appendix C). To provide an
example, a part of the Item Rating Form was given below:
Figure 4.2. Part of Item Rating Form.
4.2.3. Demographic Survey
Demographic survey is a small survey asking about sampled students’ student
number, their department, grade, general point of average (GPA), and whether the
participant is an exchange student or not. The aim of this instrument is to gather data about
participants’ profile and to inhibit administering the instrument to a participant twice to a
participant. Since responses will be not reliable if a participant answers the instrument
twice, students’ unique student number was checked.
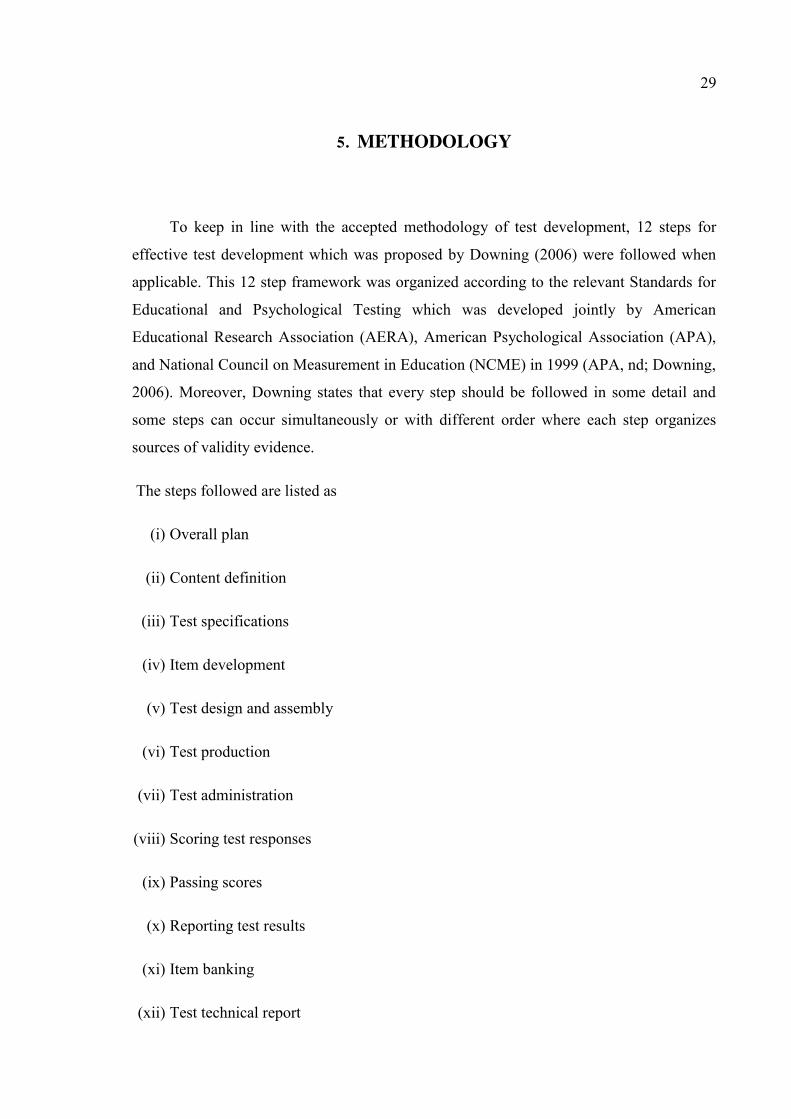
29
5. METHODOLOGY
To keep in line with the accepted methodology of test development, 12 steps for
effective test development which was proposed by Downing (2006) were followed when
applicable. This 12 step framework was organized according to the relevant Standards for
Educational and Psychological Testing which was developed jointly by American
Educational Research Association (AERA), American Psychological Association (APA),
and National Council on Measurement in Education (NCME) in 1999 (APA, nd; Downing,
2006). Moreover, Downing states that every step should be followed in some detail and
some steps can occur simultaneously or with different order where each step organizes
sources of validity evidence.
The steps followed are listed as
(i) Overall plan
(ii) Content definition
(iii) Test specifications
(iv) Item development
(v) Test design and assembly
(vi) Test production
(vii) Test administration
(viii) Scoring test responses
(ix) Passing scores
(x) Reporting test results
(xi) Item banking
(xii) Test technical report
30
The headings of these 12 stages Downing (2006) suggested will be explained in the
following paragraphs. In the overall plan, test developers are expected to decide on what
the construct to be measured is; what necessary score interpretations are; the format and
the administration mode of the test; major sources of validity evidence; and the purpose of
the test. In the content definition step, it is necessary to define the content that should be
tested, a defensible method for clarifying the content. At the test specification step, the
developers should clarify the operational definitions of the test characteristics, i.e. the type
and format of the test items, the cognitive classification etc. At the item development stage
the test developer must decide upon what item formats to use and need to write and edit
items. The step of test design and assembly includes designing and creating test forms,
formatting the test to maximize understandability and minimize the cognitive burden
unrelated to what the test is measuring. Test production step includes the publishing and
printing of examinations. Test administration is the step where concerns about validity are
handled by controlling extraneous variables and making the conditions identical for all
examinees. After administrating the test, it is necessary to apply scoring key to examinees’
responses which occur in scoring step of test development. Establishing passing scores are
necessary for most but not all of the tests and it is necessary for tests that require a cut
score. Reporting scores are essential especially for large scale test, it requires timely,
meaningful and useful reporting of scores to the examinees. Item banking is important for
ongoing testing programs where it requires storing potential items for future use. As for the
last step of test development, documenting the validity evidence for the test, identifying
threats to validity, providing a systematic summary of important test development
activities for review need to be accomplished.
The outlined steps of test development were followed in the process of developing
SLS. The phases of developing SLS can be thought as aligned with the steps mentioned
above. For example in Phase 1 of the study, initial preparation of the instrument was
carried out and steps one to six were performed. In Phase 2, 3 and 4 where two pilot
administrations and a final administration were done and revisions were made, the steps of
test design and production were revisited, and test administration and scoring were
actualized which correspond to steps seven and eight. Defining passing scores, reporting
test results, and item banking were considered but were not seen necessary within the
scope of this study which correspond to levels nine, 10, and 11. Lastly, this thesis can be
31
thought as the technical report of the test corresponding to 12th step of the test development
procedure. The phases of this study will be narrated in detail in the following parts. Within
each phase special instruments used, if any; participants, sampling, the administration
process, analysis of data yielded after the administration will be reported. Statistical
analysis for evaluating items will be done using methods suggested by Classical Test
Theory (CTT) such as item- total correlation, item difficulty, and item discrimination.
Detailed interpretation of the data analysis will be given in the results section.
5.1. Phase 1 - Initial Preparation of the Instrument
5.1.1. Clarifying the Content
After clarifying the cognitive dimensions of statistical literacy, the content of this
construct was to be clarified. Content of previous instruments and experimental instruction
studies were examined in terms of their content. Then, the content coverage was
questioned in terms of suitability in the Turkish context.
Previous instruments related to statistics learning were examined. Not only statistical
literacy instruments but also other related instruments were examined bearing in mind that
statistical literacy is a construct that can have overlappings with statistical reasoning and
statistical thinking as delMas (2002) claimed. The instruments examined for their content
coverage were Comprehensive Assessment of Outcomes for a first course in Statistics
(CAOS) developed by the Web ARTIST Project (2005), Statistical Literacy Skills Survey
(Schield, 2008), ARTIST Topic Scales (2006).
Meanwhile, instructional studies for developing statistical literacy were also
examined. Among them Wilson’s (1994) “A Brief Course in Statistical Literacy” was
chosen because this study was done with university students. The content coverage of Test
of Statistical Literacy used to measure the attainments of the instruction was used for
examining the content coverage of this instruction study.
Previous studies in Turkey were also searched, however; no measured instructional
experiments or measurement attempts were found during the time of conducting this study.
32
That’s why, statistics topics in The Turkish national curriculum on grades 6 to 12 (Turkish
Ministry of Education, 2005; 2009) were added. This way, a general list for statistics topics
was yielded.
This list of statistics topics were examined by four experts: a doctoral student
studying probability in Mathematics department, an associate professor in operations
research statistics in Industrial Engineering department , a full professor in operations
research statistics in Industrial Engineering department, and a full professor in
Mathematics Education department. With their comments, some new topics were added to
the list, the wordings of some topics were changed, and the sequence of the topics was
rearranged according to phases of methods of research. It was concluded that Statistical
Literacy Content Rating Form (SLCRF) could be developed with 35 topics.
After clarifying topics to be included in the SLCRF, a cover page describing briefly
what statistical literacy is prepared. Then the only question for collecting experts’ ideas
was written as “Please indicate the necessity of each statistics topic for being a statistically
literate undergraduate student”. For every topic, the answers of this scale consisted of three
options with increasing degree “Not necessary”, “neither necessary nor unnecessary”, and
“essential”.
As for the participants of SLCRF, scholars who are offering or have previously
offered statistics or research methods courses within the last two years were recruited as
experts. The website of the Registrar’s Office of the public university in which this study
held was searched for statistics and research methods courses that were given in previous
years. From this webpage, the title of the courses offered between 2009 and 2011 were
examined and those courses which hold the words research methods or statistics were
listed. The name of the instructor who gave the course was recorded and the email address
of the instructor was found via the university website. Thirty-two instructors were found
for being potential participants to respond SLCRF.
SLCRF was sent to 32 experts by email. Answers from experts who volunteered to
respond to the questionnaire were gathered. Eleven scholars responded to the survey, one
of them was from Management and Information Systems Department, one from
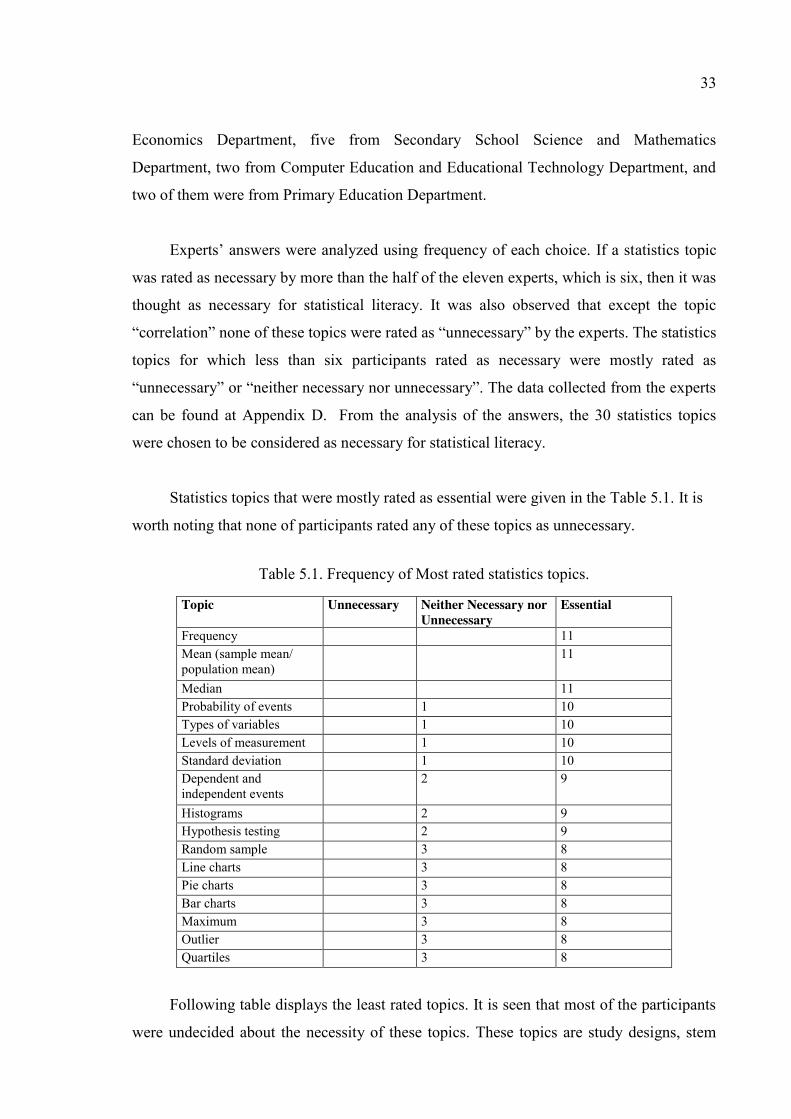
33
Economics Department, five from Secondary School Science and Mathematics
Department, two from Computer Education and Educational Technology Department, and
two of them were from Primary Education Department.
Experts’ answers were analyzed using frequency of each choice. If a statistics topic
was rated as necessary by more than the half of the eleven experts, which is six, then it was
thought as necessary for statistical literacy. It was also observed that except the topic
“correlation” none of these topics were rated as “unnecessary” by the experts. The statistics
topics for which less than six participants rated as necessary were mostly rated as
“unnecessary” or “neither necessary nor unnecessary”. The data collected from the experts
can be found at Appendix D. From the analysis of the answers, the 30 statistics topics
were chosen to be considered as necessary for statistical literacy.
Statistics topics that were mostly rated as essential were given in the Table 5.1. It is
worth noting that none of participants rated any of these topics as unnecessary.
Table 5.1. Frequency of Most rated statistics topics.
Topic
Unnecessary Neither Necessary nor Unnecessary
Essential
Frequency 11 Mean (sample mean/ population mean)
11
Median 11 Probability of events 1 10 Types of variables 1 10 Levels of measurement 1 10 Standard deviation 1 10 Dependent and independent events
2 9
Histograms 2 9 Hypothesis testing 2 9 Random sample 3 8 Line charts 3 8 Pie charts 3 8 Bar charts 3 8 Maximum 3 8 Outlier 3 8 Quartiles 3 8
Following table displays the least rated topics. It is seen that most of the participants
were undecided about the necessity of these topics. These topics are study designs, stem
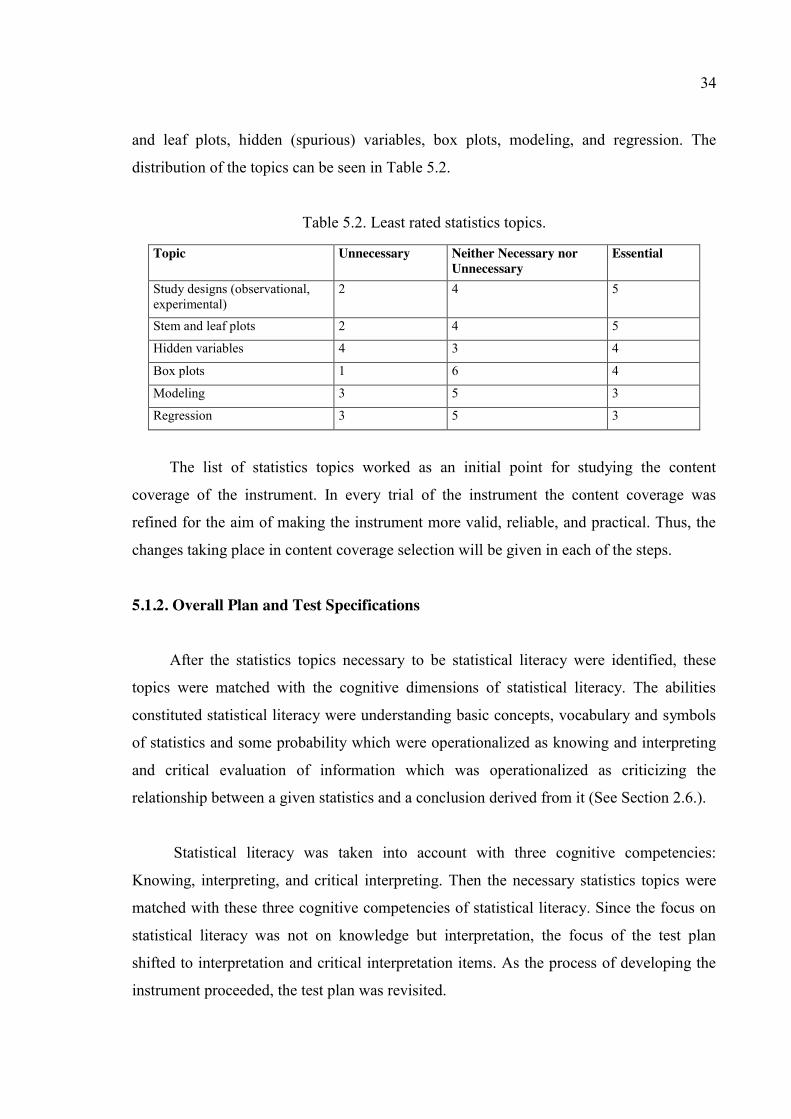
34
and leaf plots, hidden (spurious) variables, box plots, modeling, and regression. The
distribution of the topics can be seen in Table 5.2.
Table 5.2. Least rated statistics topics.
Topic Unnecessary Neither Necessary nor Unnecessary
Essential
Study designs (observational, experimental)
2 4 5
Stem and leaf plots 2 4 5
Hidden variables 4 3 4
Box plots 1 6 4
Modeling 3 5 3
Regression 3 5 3
The list of statistics topics worked as an initial point for studying the content
coverage of the instrument. In every trial of the instrument the content coverage was
refined for the aim of making the instrument more valid, reliable, and practical. Thus, the
changes taking place in content coverage selection will be given in each of the steps.
5.1.2. Overall Plan and Test Specifications
After the statistics topics necessary to be statistical literacy were identified, these
topics were matched with the cognitive dimensions of statistical literacy. The abilities
constituted statistical literacy were understanding basic concepts, vocabulary and symbols
of statistics and some probability which were operationalized as knowing and interpreting
and critical evaluation of information which was operationalized as criticizing the
relationship between a given statistics and a conclusion derived from it (See Section 2.6.).
Statistical literacy was taken into account with three cognitive competencies:
Knowing, interpreting, and critical interpreting. Then the necessary statistics topics were
matched with these three cognitive competencies of statistical literacy. Since the focus on
statistical literacy was not on knowledge but interpretation, the focus of the test plan
shifted to interpretation and critical interpretation items. As the process of developing the
instrument proceeded, the test plan was revisited.
35
As for the items, most of the items in the existing instruments were select response
type questions. Therefore, using multiple choice type questions was seen suitable for this
study. Although it is possible to have different number of choices in a test, it was preferred
to have the same number of options in each question whenever possible. The reason for
this decision is that the undergraduate students are accustomed to taking tests and they are
expected to be able to predict the keyed response of a test item if there were not sufficient
number of options. That’s why, the number of options in questions were tried to be kept at
a maximum and the same for almost all items for minimizing the factor of guessing.
5.1.3. Item Selection and Construction
As it was stated in the literature, there are several instruments developed for
measuring statistics learning and statistical literacy. After clarifying the necessary statistics
topics, the literature was searched again. It was seen that there were specific instruments
for measuring proficiency in some identified statistics or probability topic. For the topics
stated as necessary for statistical literacy, these new instruments were taken into account.
These instruments are The Statistics Concept Inventory (Allen, 2006), Statistical
Reasoning Assessment (SRA) (Garfield, 2003), Quantitative Reasoning Quotient (QRQ)
developed by Sundre (2003), A Test of "Representativeness" (Hirsch and O'Donnell,
2001), and A Scale for Assessing Probabilistic Thinking and the Representativeness
Tendency (Afantiti- Lamprianou and Williams, 2003).
The questions from the instruments were examined in terms of what they intend to
measure. If a test plan or table of specification was given with the instrument, that test plan
was used. In other occasions, the researcher tried to identify the statistics topic that the
question intended to measure and the cognitive level at which it measures that topic. After
examining each question according to its topic and cognitive level, an initial selection was
done according to the statistics topics that the questions are measuring about. Questions
that measuring the important statistics topics as revealed by the results of the Content
Rating Form were selected among all the questions found in previous instruments.
Moreover, there were some statistics topics that were not addressed before in any of the
previous instruments such as frequency or line chart. For such topics, new questions were
written taking the test plan into account. The aim of writing new questions was filling the
36
gaps in the questions necessary to measure the essential statistics topics as revealed by the
results of SLCRF. These new questions were written by the researcher and examined by
another researcher in terms of its suitability and understandability. Some questions were
linked to more than one topic, like expecting the participant making connections with their
knowledge about another but related topic. Such questions were eliminated to make every
question measure participants’ knowledge only one topic at a time. Taking into account
questions in existing instruments and the questions written by the researcher, a total of 110
questions were formed.
Among these 110 questions a second selection was done regarding other criteria like
measuring the topic at the cognitive levels at the adapted definition of statistical literacy
which are knowledge, interpretation, and critical interpretation. For example, questions that
require calculation were not thought to be suitable for selection because it requires a
cognitive engagement different than the intended, which is application. This second
selection was done regarding the cognitive level required for solving the items selected
according to their content in the first selection. Another criterion for selecting the questions
in this second selection was having stimulus that is understandable for Turkish students.
For example, questions which had stimuli which are not known by Turkish students like
box plots or stem and leaf plot either were not chosen or their stimuli were changed into
another form like tabular display. After this second selection, 52 questions were eliminated
from the item pool.
Finally remaining 58 questions were sent to the experts. The experts consisted of five
scholars: one of them was a full professor specialized in Measurement and Test
Construction, one was a full professor in Operations Research Statistics, one was assistant
professor in Operations Research Statistics, and two of them were holding doctoral degrees
in Mathematics Education. Among them, full professor in Operations Research Statistics
was consulted in the construction of SLCRF and the other full professor who specialized in
Measurement was a respondent to SLCRF. To guide the experts an Item Rating Form
(IRF) was prepared. In this form, experts were asked to voice their opinion on whether the
questions were measuring the intended topic at the intended cognitive level, were
understandable, and should be eliminated or included in SLS, and any additional comments
they would like to have.
37
In addition to experts’ answers on IRF, their comments on statistical correctness, the
length of the questions, understandability, and wording were also collected. According to
their answers and suggestions 16 questions were eliminated and 42 questions remained.
Some revisions were done in the questions like changing the wording, changing the
stimuli, shortening the questions, adding or removing some options to the questions. The
aim of these revisions was making the questions more understandable, shorter, and similar
with each other. Existing instruments had multiple choice questions with different number
of options. On the other hand, students are expected to be experienced in multiple choice
tests in nationwide exams, they are accustomed to taking tests with having fixed number of
options in the tests;; which usually have questions with four or five options. That’s why,
having a fixed number of choices in the questions was seen useful and some revisions were
done accordingly. All but two questions had four choices; other questions had two options.
The reason of this difference is that the questions that have two options were about
significance levels and the answers included “valid” or “invalid”. Although it was possible
to increase the number of the options, the questions would function like a two option
question because the students would easily guess that the keyed response would be either
“valid” or “invalid”.
5.1.4. Scoring
There was only one keyed response for every question and all the questions had four
options except two questions which had two options. Scoring was done by giving one point
to the questions that had four options and .5 points to the questions having only two
options. Hence, the minimum score a student can get was set as zero, and the maximum
score was number of questions in the instrument minus one. It is announced to the
participants that if they did not know the answer to a question, they should leave it blank
instead of marking by sole guessing. That’s why, blank answers did not contribute to
participants’ scores, and no point was given or taken for questions left blank.
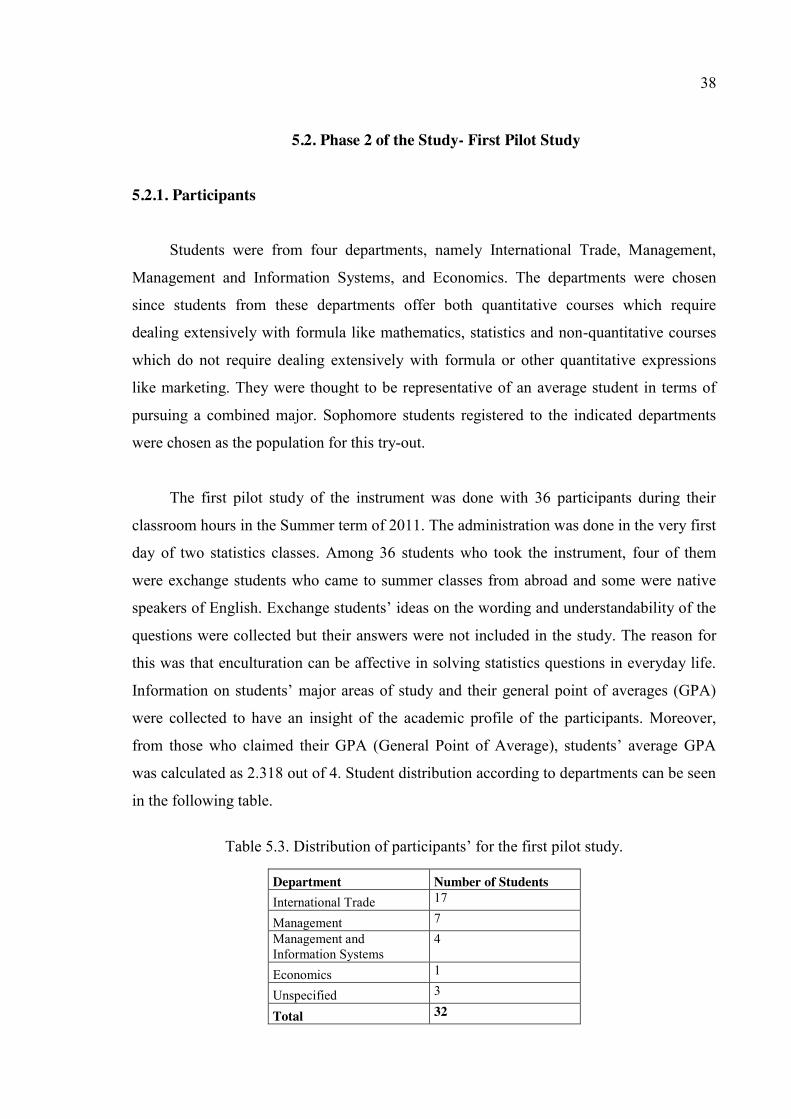
38
5.2. Phase 2 of the Study- First Pilot Study
5.2.1. Participants
Students were from four departments, namely International Trade, Management,
Management and Information Systems, and Economics. The departments were chosen
since students from these departments offer both quantitative courses which require
dealing extensively with formula like mathematics, statistics and non-quantitative courses
which do not require dealing extensively with formula or other quantitative expressions
like marketing. They were thought to be representative of an average student in terms of
pursuing a combined major. Sophomore students registered to the indicated departments
were chosen as the population for this try-out.
The first pilot study of the instrument was done with 36 participants during their
classroom hours in the Summer term of 2011. The administration was done in the very first
day of two statistics classes. Among 36 students who took the instrument, four of them
were exchange students who came to summer classes from abroad and some were native
speakers of English. Exchange students’ ideas on the wording and understandability of the
questions were collected but their answers were not included in the study. The reason for
this was that enculturation can be affective in solving statistics questions in everyday life.
Information on students’ major areas of study and their general point of averages (GPA)
were collected to have an insight of the academic profile of the participants. Moreover,
from those who claimed their GPA (General Point of Average), students’ average GPA
was calculated as 2.318 out of 4. Student distribution according to departments can be seen
in the following table.
Table 5.3. Distribution of participants’ for the first pilot study.
Department Number of Students International Trade 17
Management 7 Management and Information Systems
4
Economics 1
Unspecified 3
Total 32
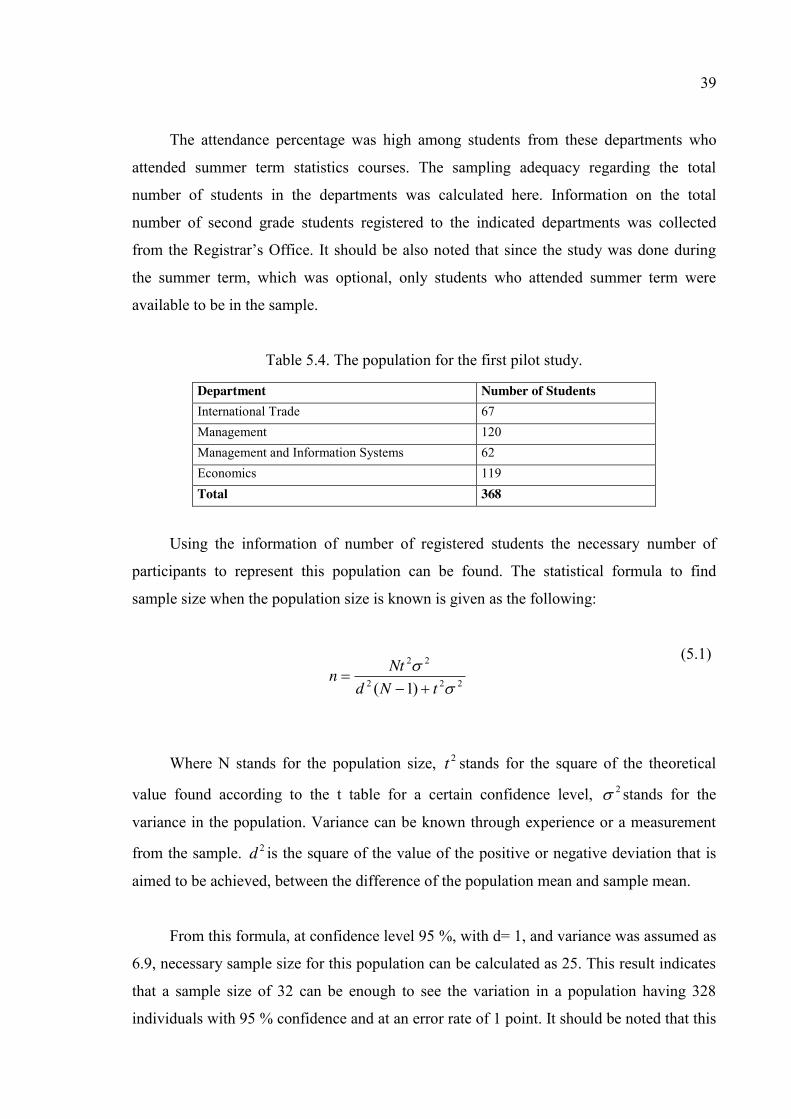
39
The attendance percentage was high among students from these departments who
attended summer term statistics courses. The sampling adequacy regarding the total
number of students in the departments was calculated here. Information on the total
number of second grade students registered to the indicated departments was collected
from the Registrar’s Office. It should be also noted that since the study was done during
the summer term, which was optional, only students who attended summer term were
available to be in the sample.
Table 5.4. The population for the first pilot study.
Department Number of Students International Trade 67 Management 120 Management and Information Systems 62 Economics 119 Total 368
Using the information of number of registered students the necessary number of
participants to represent this population can be found. The statistical formula to find
sample size when the population size is known is given as the following:
(5.1)
Where N stands for the population size, 2t stands for the square of the theoretical
value found according to the t table for a certain confidence level, 2 stands for the
variance in the population. Variance can be known through experience or a measurement
from the sample. 2d is the square of the value of the positive or negative deviation that is
aimed to be achieved, between the difference of the population mean and sample mean.
From this formula, at confidence level 95 %, with d= 1, and variance was assumed as
6.9, necessary sample size for this population can be calculated as 25. This result indicates
that a sample size of 32 can be enough to see the variation in a population having 328
individuals with 95 % confidence and at an error rate of 1 point. It should be noted that this
222
22
)1(
tNdNtn
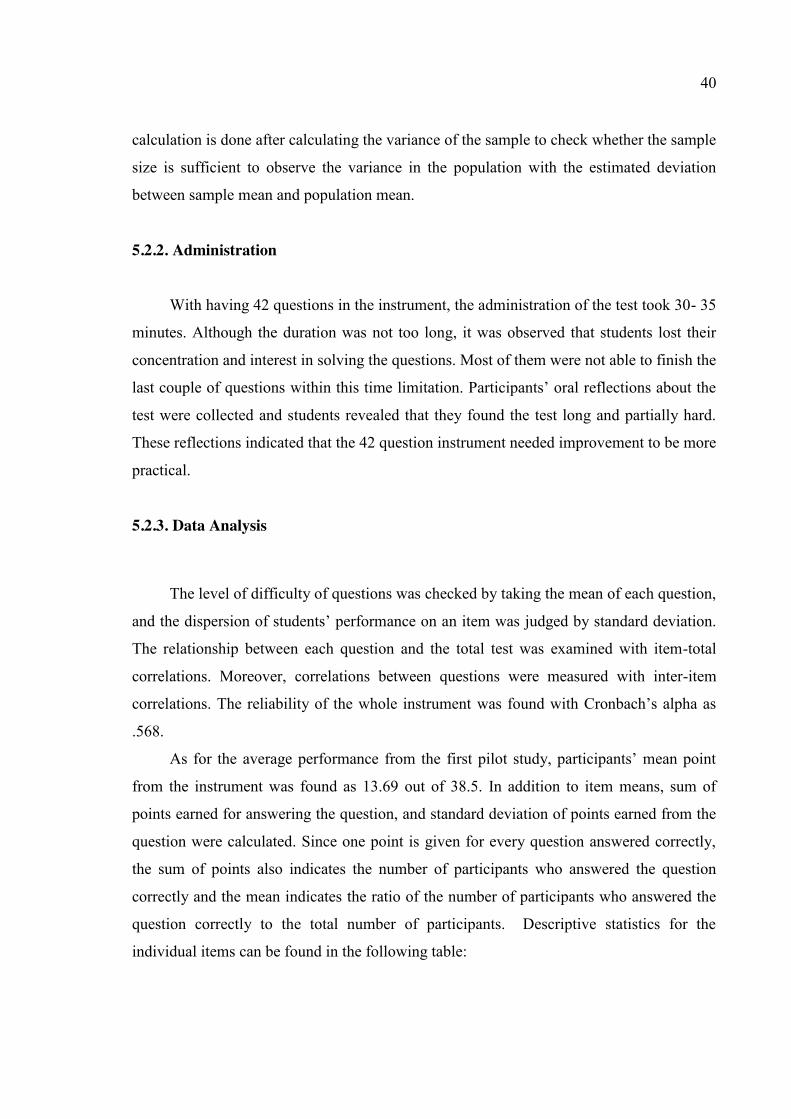
40
calculation is done after calculating the variance of the sample to check whether the sample
size is sufficient to observe the variance in the population with the estimated deviation
between sample mean and population mean.
5.2.2. Administration
With having 42 questions in the instrument, the administration of the test took 30- 35
minutes. Although the duration was not too long, it was observed that students lost their
concentration and interest in solving the questions. Most of them were not able to finish the
last couple of questions within this time limitation. Participants’ oral reflections about the
test were collected and students revealed that they found the test long and partially hard.
These reflections indicated that the 42 question instrument needed improvement to be more
practical.
5.2.3. Data Analysis
The level of difficulty of questions was checked by taking the mean of each question,
and the dispersion of students’ performance on an item was judged by standard deviation.
The relationship between each question and the total test was examined with item-total
correlations. Moreover, correlations between questions were measured with inter-item
correlations. The reliability of the whole instrument was found with Cronbach’s alpha as
.568.
As for the average performance from the first pilot study, participants’ mean point
from the instrument was found as 13.69 out of 38.5. In addition to item means, sum of
points earned for answering the question, and standard deviation of points earned from the
question were calculated. Since one point is given for every question answered correctly,
the sum of points also indicates the number of participants who answered the question
correctly and the mean indicates the ratio of the number of participants who answered the
question correctly to the total number of participants. Descriptive statistics for the
individual items can be found in the following table:
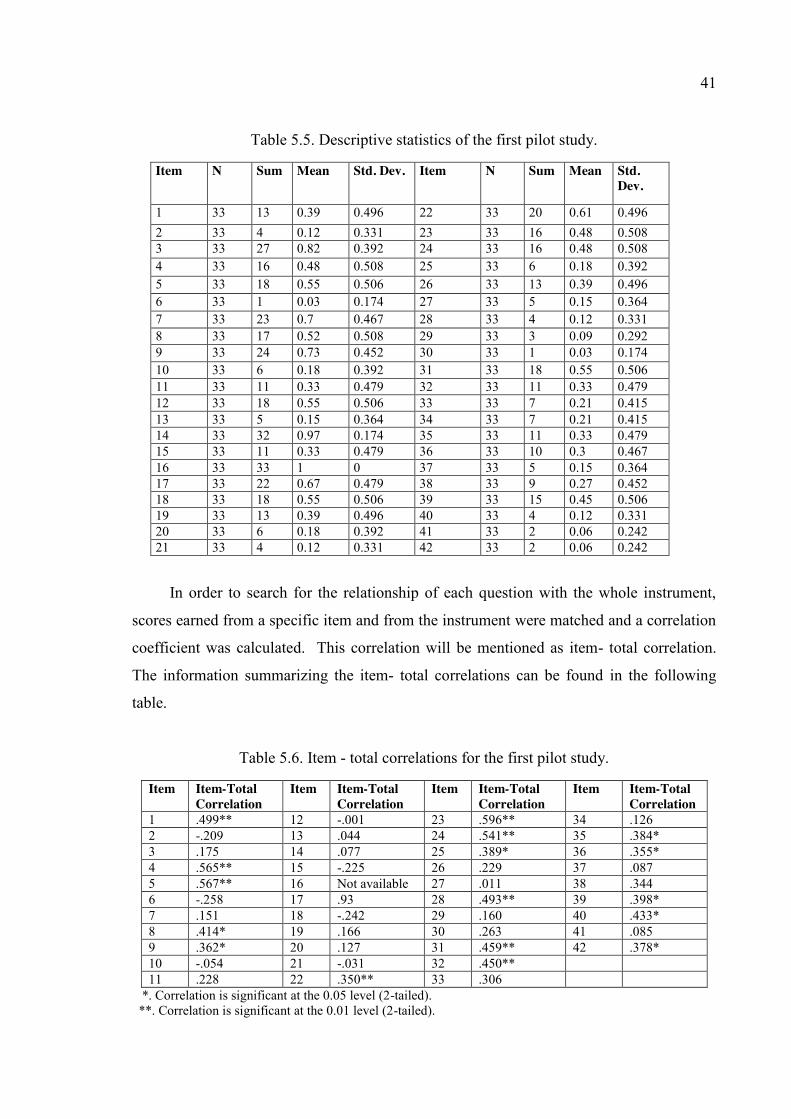
41
Table 5.5. Descriptive statistics of the first pilot study.
Item N Sum Mean Std. Dev. Item N Sum Mean Std. Dev.
1 33 13 0.39 0.496 22 33 20 0.61 0.496 2 33 4 0.12 0.331 23 33 16 0.48 0.508 3 33 27 0.82 0.392 24 33 16 0.48 0.508 4 33 16 0.48 0.508 25 33 6 0.18 0.392 5 33 18 0.55 0.506 26 33 13 0.39 0.496 6 33 1 0.03 0.174 27 33 5 0.15 0.364 7 33 23 0.7 0.467 28 33 4 0.12 0.331 8 33 17 0.52 0.508 29 33 3 0.09 0.292 9 33 24 0.73 0.452 30 33 1 0.03 0.174 10 33 6 0.18 0.392 31 33 18 0.55 0.506 11 33 11 0.33 0.479 32 33 11 0.33 0.479 12 33 18 0.55 0.506 33 33 7 0.21 0.415 13 33 5 0.15 0.364 34 33 7 0.21 0.415 14 33 32 0.97 0.174 35 33 11 0.33 0.479 15 33 11 0.33 0.479 36 33 10 0.3 0.467 16 33 33 1 0 37 33 5 0.15 0.364 17 33 22 0.67 0.479 38 33 9 0.27 0.452 18 33 18 0.55 0.506 39 33 15 0.45 0.506 19 33 13 0.39 0.496 40 33 4 0.12 0.331 20 33 6 0.18 0.392 41 33 2 0.06 0.242 21 33 4 0.12 0.331 42 33 2 0.06 0.242
In order to search for the relationship of each question with the whole instrument,
scores earned from a specific item and from the instrument were matched and a correlation
coefficient was calculated. This correlation will be mentioned as item- total correlation.
The information summarizing the item- total correlations can be found in the following
table.
Table 5.6. Item - total correlations for the first pilot study.
Item Item-Total Correlation
Item Item-Total Correlation
Item Item-Total Correlation
Item Item-Total Correlation
1 .499** 12 -.001 23 .596** 34 .126 2 -.209 13 .044 24 .541** 35 .384* 3 .175 14 .077 25 .389* 36 .355* 4 .565** 15 -.225 26 .229 37 .087 5 .567** 16 Not available 27 .011 38 .344 6 -.258 17 .93 28 .493** 39 .398* 7 .151 18 -.242 29 .160 40 .433* 8 .414* 19 .166 30 .263 41 .085 9 .362* 20 .127 31 .459** 42 .378* 10 -.054 21 -.031 32 .450** 11 .228 22 .350** 33 .306
*. Correlation is significant at the 0.05 level (2-tailed). **. Correlation is significant at the 0.01 level (2-tailed).
42
Assuming that the participants are consistent in their knowledge, the item total
correlations reveal the relationship between the question measures and what the instrument
measures as a whole. If the item-total correlation is high (and also significant), then it
means that the question is related with the construct measured in the instrument in general.
From the item-total correlations given above, it can be seen that there are highly related,
relatively less related questions, and unrelated questions in the instrument.
5.2.3. Item Reduction
Practicality is an important property of a test after its validity and reliability. Since
the participants also revealed that they found the test long and partially hard, it was
necessary to shorten the test. To have a more parsimonious instrument, it was necessary to
eliminate some questions. Questions that were measuring the same content at the same
cognitive level were compared with each other in terms of their means and item- total
correlations. The eliminations were done accordingly. The list of eliminated questions and
the reasons for elimination can be found in the following table.
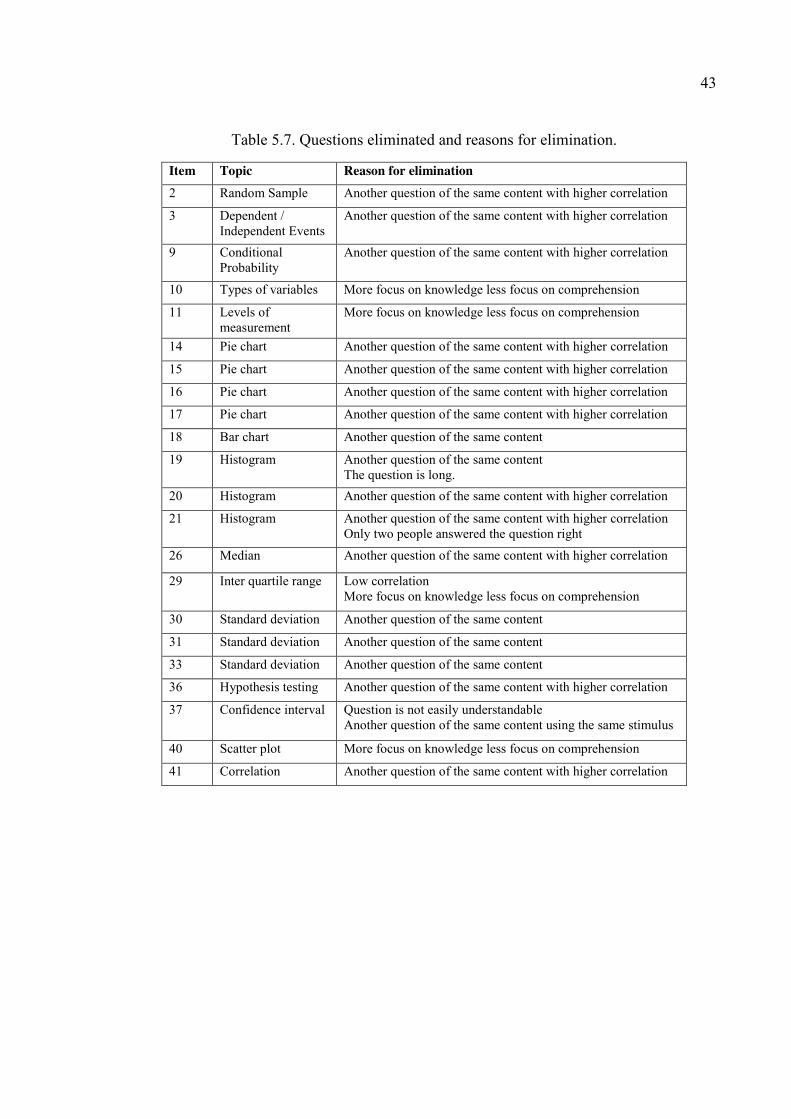
43
Table 5.7. Questions eliminated and reasons for elimination.
Item Topic Reason for elimination 2 Random Sample Another question of the same content with higher correlation
3 Dependent / Independent Events
Another question of the same content with higher correlation
9 Conditional Probability
Another question of the same content with higher correlation
10 Types of variables More focus on knowledge less focus on comprehension
11 Levels of measurement
More focus on knowledge less focus on comprehension
14 Pie chart Another question of the same content with higher correlation
15 Pie chart Another question of the same content with higher correlation
16 Pie chart Another question of the same content with higher correlation
17 Pie chart Another question of the same content with higher correlation
18 Bar chart Another question of the same content
19 Histogram Another question of the same content The question is long.
20 Histogram Another question of the same content with higher correlation
21 Histogram Another question of the same content with higher correlation Only two people answered the question right
26 Median Another question of the same content with higher correlation
29 Inter quartile range Low correlation More focus on knowledge less focus on comprehension
30 Standard deviation Another question of the same content
31 Standard deviation Another question of the same content
33 Standard deviation Another question of the same content
36 Hypothesis testing Another question of the same content with higher correlation
37 Confidence interval Question is not easily understandable Another question of the same content using the same stimulus
40 Scatter plot More focus on knowledge less focus on comprehension
41 Correlation Another question of the same content with higher correlation
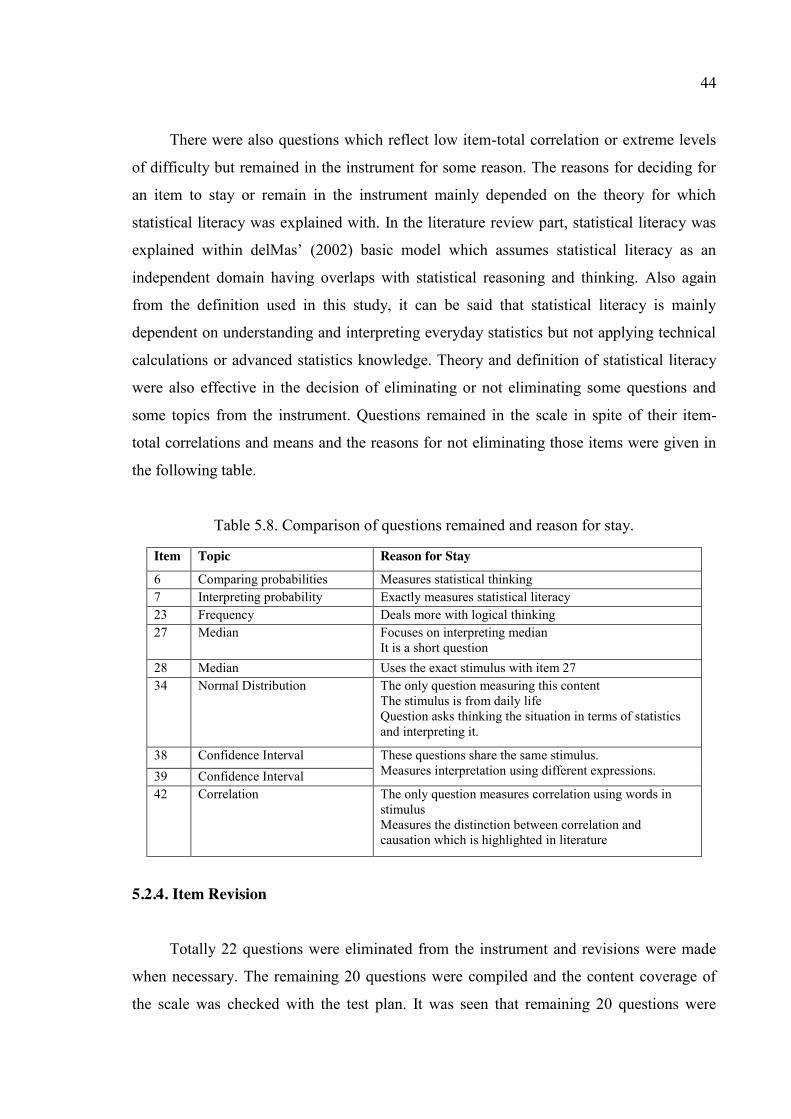
44
There were also questions which reflect low item-total correlation or extreme levels
of difficulty but remained in the instrument for some reason. The reasons for deciding for
an item to stay or remain in the instrument mainly depended on the theory for which
statistical literacy was explained with. In the literature review part, statistical literacy was
explained within delMas’ (2002) basic model which assumes statistical literacy as an
independent domain having overlaps with statistical reasoning and thinking. Also again
from the definition used in this study, it can be said that statistical literacy is mainly
dependent on understanding and interpreting everyday statistics but not applying technical
calculations or advanced statistics knowledge. Theory and definition of statistical literacy
were also effective in the decision of eliminating or not eliminating some questions and
some topics from the instrument. Questions remained in the scale in spite of their item-
total correlations and means and the reasons for not eliminating those items were given in
the following table.
Table 5.8. Comparison of questions remained and reason for stay.
Item Topic Reason for Stay
6 Comparing probabilities Measures statistical thinking 7 Interpreting probability Exactly measures statistical literacy 23 Frequency Deals more with logical thinking 27 Median Focuses on interpreting median
It is a short question 28 Median Uses the exact stimulus with item 27 34 Normal Distribution The only question measuring this content
The stimulus is from daily life Question asks thinking the situation in terms of statistics and interpreting it.
38 Confidence Interval These questions share the same stimulus. Measures interpretation using different expressions. 39 Confidence Interval
42 Correlation The only question measures correlation using words in stimulus Measures the distinction between correlation and causation which is highlighted in literature
5.2.4. Item Revision
Totally 22 questions were eliminated from the instrument and revisions were made
when necessary. The remaining 20 questions were compiled and the content coverage of
the scale was checked with the test plan. It was seen that remaining 20 questions were
45
sufficient to measure statistical literacy and the test was prepared for a second try out by
item revisions.
Among them some questions were revised when necessary. For example Q8 was
about conditional probability, to make the question more specific numbers were added to
the question, and a table was added to include these numbers. Q12 also necessitated a
revision. The line graph which had two lines in the question was replaced with a graph
having only one line. The reason for this revision is making this question more
understandable to the participants. Also, in Q13, the categories were changed to names of
the football teams in Turkey to make the question more meaningful in the context of
Turkey. Q23 was had only a little change of wording in one of the options, and option d of
Q24 was changed. It was intended to make option “d” more appealing to the respondents.
Also the wording was shortened in shared stimulus of Q27 and Q28 to make the question
more understandable. Lastly, in Q35 in the stimulus of the question, instead of saying “a
researcher”, “a zoologist, Aylin” was preferred and wording changed accordingly. The
results of data analysis and the decisions made for all the questions in the scale were given
in the following table:
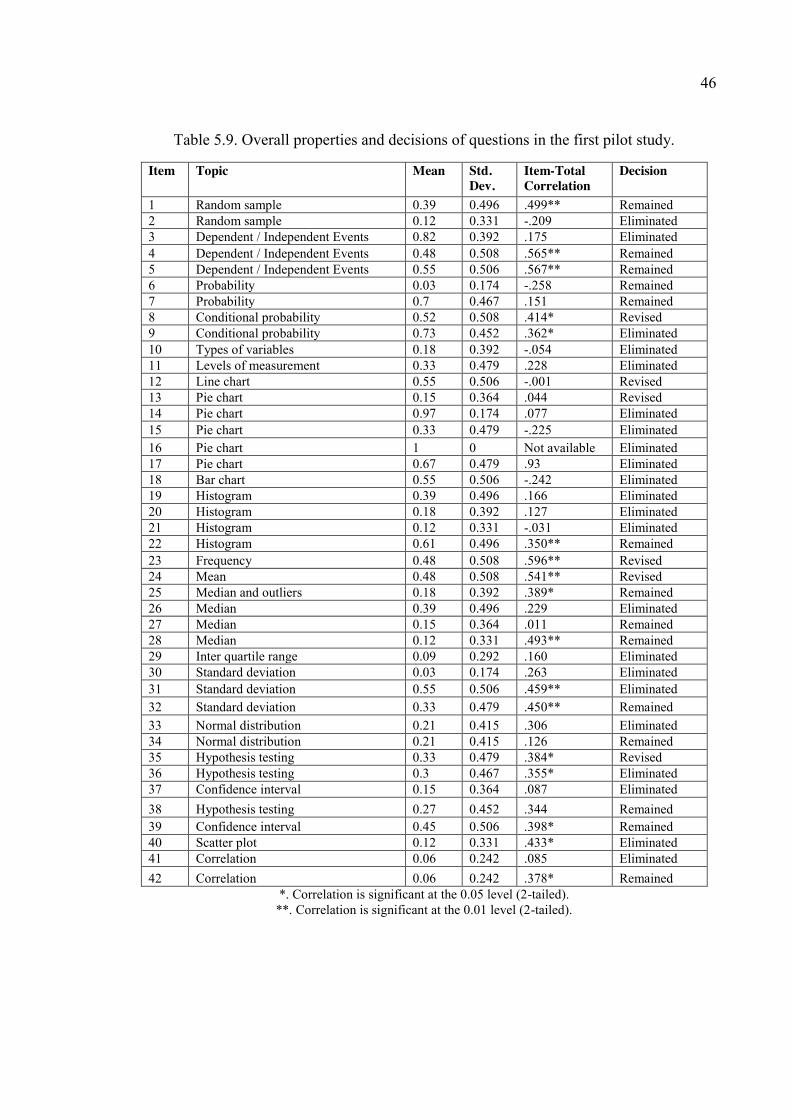
46
Table 5.9. Overall properties and decisions of questions in the first pilot study.
Item Topic Mean Std. Dev.
Item-Total Correlation
Decision
1 Random sample 0.39 0.496 .499** Remained 2 Random sample 0.12 0.331 -.209 Eliminated 3 Dependent / Independent Events 0.82 0.392 .175 Eliminated 4 Dependent / Independent Events 0.48 0.508 .565** Remained 5 Dependent / Independent Events 0.55 0.506 .567** Remained 6 Probability 0.03 0.174 -.258 Remained 7 Probability 0.7 0.467 .151 Remained 8 Conditional probability 0.52 0.508 .414* Revised 9 Conditional probability 0.73 0.452 .362* Eliminated 10 Types of variables 0.18 0.392 -.054 Eliminated 11 Levels of measurement 0.33 0.479 .228 Eliminated 12 Line chart 0.55 0.506 -.001 Revised 13 Pie chart 0.15 0.364 .044 Revised 14 Pie chart 0.97 0.174 .077 Eliminated 15 Pie chart 0.33 0.479 -.225 Eliminated 16 Pie chart 1 0 Not available Eliminated 17 Pie chart 0.67 0.479 .93 Eliminated 18 Bar chart 0.55 0.506 -.242 Eliminated 19 Histogram 0.39 0.496 .166 Eliminated 20 Histogram 0.18 0.392 .127 Eliminated 21 Histogram 0.12 0.331 -.031 Eliminated 22 Histogram 0.61 0.496 .350** Remained 23 Frequency 0.48 0.508 .596** Revised 24 Mean 0.48 0.508 .541** Revised 25 Median and outliers 0.18 0.392 .389* Remained 26 Median 0.39 0.496 .229 Eliminated 27 Median 0.15 0.364 .011 Remained 28 Median 0.12 0.331 .493** Remained 29 Inter quartile range 0.09 0.292 .160 Eliminated 30 Standard deviation 0.03 0.174 .263 Eliminated 31 Standard deviation 0.55 0.506 .459** Eliminated 32 Standard deviation 0.33 0.479 .450** Remained 33 Normal distribution 0.21 0.415 .306 Eliminated 34 Normal distribution 0.21 0.415 .126 Remained 35 Hypothesis testing 0.33 0.479 .384* Revised 36 Hypothesis testing 0.3 0.467 .355* Eliminated 37 Confidence interval 0.15 0.364 .087 Eliminated 38 Hypothesis testing 0.27 0.452 .344 Remained 39 Confidence interval 0.45 0.506 .398* Remained 40 Scatter plot 0.12 0.331 .433* Eliminated 41 Correlation 0.06 0.242 .085 Eliminated 42 Correlation 0.06 0.242 .378* Remained
*. Correlation is significant at the 0.05 level (2-tailed). **. Correlation is significant at the 0.01 level (2-tailed).
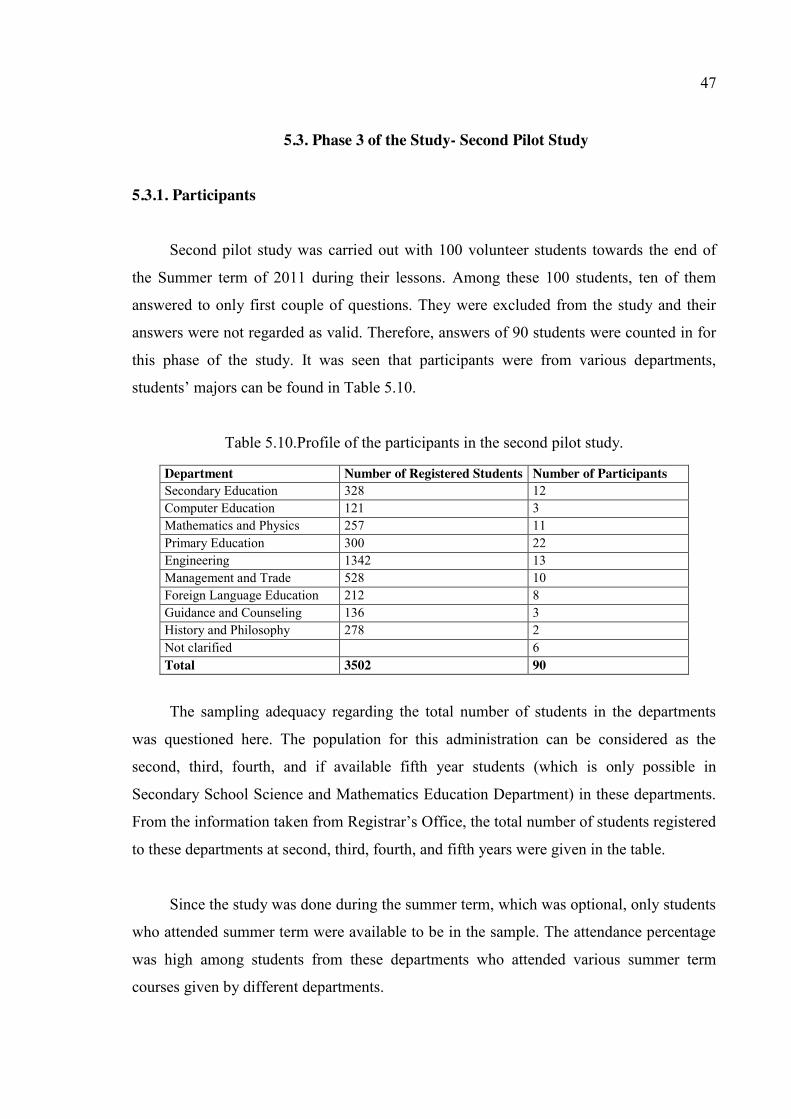
47
5.3. Phase 3 of the Study- Second Pilot Study
5.3.1. Participants
Second pilot study was carried out with 100 volunteer students towards the end of
the Summer term of 2011 during their lessons. Among these 100 students, ten of them
answered to only first couple of questions. They were excluded from the study and their
answers were not regarded as valid. Therefore, answers of 90 students were counted in for
this phase of the study. It was seen that participants were from various departments,
students’ majors can be found in Table 5.10.
Table 5.10.Profile of the participants in the second pilot study.
Department Number of Registered Students Number of Participants Secondary Education 328 12 Computer Education 121 3 Mathematics and Physics 257 11 Primary Education 300 22 Engineering 1342 13 Management and Trade 528 10 Foreign Language Education 212 8 Guidance and Counseling 136 3 History and Philosophy 278 2 Not clarified 6 Total 3502 90
The sampling adequacy regarding the total number of students in the departments
was questioned here. The population for this administration can be considered as the
second, third, fourth, and if available fifth year students (which is only possible in
Secondary School Science and Mathematics Education Department) in these departments.
From the information taken from Registrar’s Office, the total number of students registered
to these departments at second, third, fourth, and fifth years were given in the table.
Since the study was done during the summer term, which was optional, only students
who attended summer term were available to be in the sample. The attendance percentage
was high among students from these departments who attended various summer term
courses given by different departments.
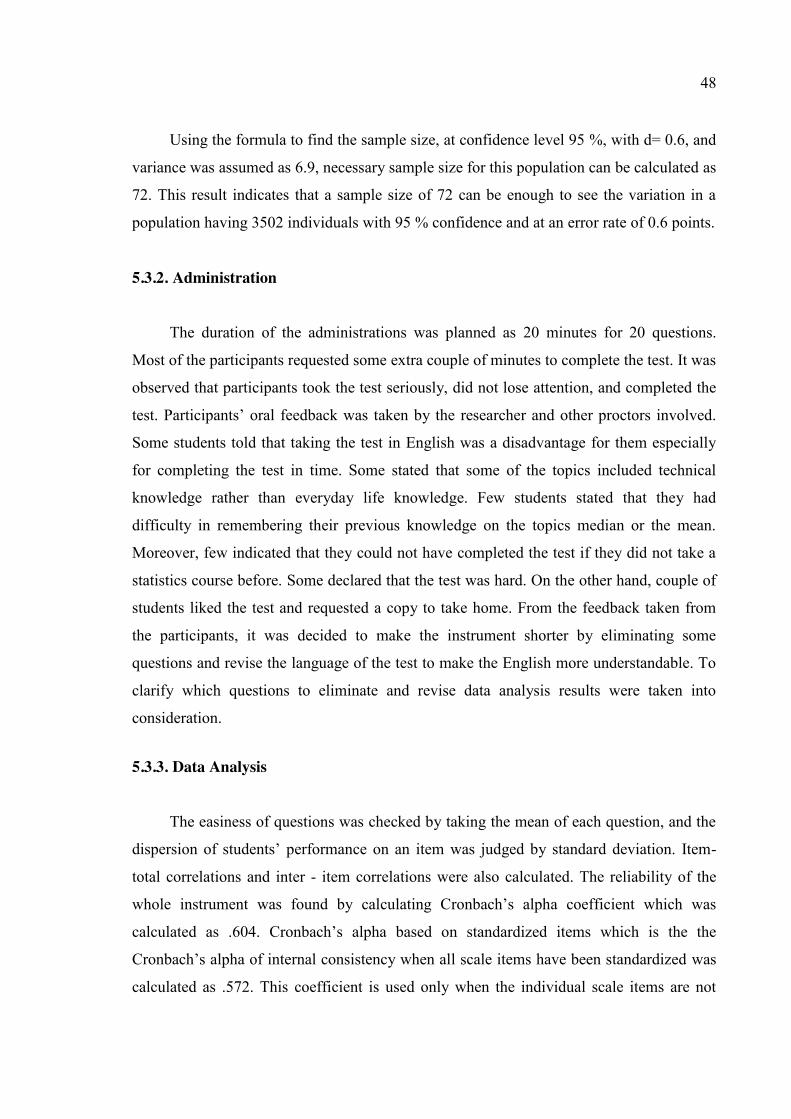
48
Using the formula to find the sample size, at confidence level 95 %, with d= 0.6, and
variance was assumed as 6.9, necessary sample size for this population can be calculated as
72. This result indicates that a sample size of 72 can be enough to see the variation in a
population having 3502 individuals with 95 % confidence and at an error rate of 0.6 points.
5.3.2. Administration
The duration of the administrations was planned as 20 minutes for 20 questions.
Most of the participants requested some extra couple of minutes to complete the test. It was
observed that participants took the test seriously, did not lose attention, and completed the
test. Participants’ oral feedback was taken by the researcher and other proctors involved.
Some students told that taking the test in English was a disadvantage for them especially
for completing the test in time. Some stated that some of the topics included technical
knowledge rather than everyday life knowledge. Few students stated that they had
difficulty in remembering their previous knowledge on the topics median or the mean.
Moreover, few indicated that they could not have completed the test if they did not take a
statistics course before. Some declared that the test was hard. On the other hand, couple of
students liked the test and requested a copy to take home. From the feedback taken from
the participants, it was decided to make the instrument shorter by eliminating some
questions and revise the language of the test to make the English more understandable. To
clarify which questions to eliminate and revise data analysis results were taken into
consideration.
5.3.3. Data Analysis
The easiness of questions was checked by taking the mean of each question, and the
dispersion of students’ performance on an item was judged by standard deviation. Item-
total correlations and inter - item correlations were also calculated. The reliability of the
whole instrument was found by calculating Cronbach’s alpha coefficient which was
calculated as .604. Cronbach’s alpha based on standardized items which is the the
Cronbach’s alpha of internal consistency when all scale items have been standardized was
calculated as .572. This coefficient is used only when the individual scale items are not
49
scaled the same. Moreover, item difficulty and item discrimination index were calculated
to see how distractors function for each item.
Table 5.11. Descriptive statistics for the second pilot study.
From the descriptive statistics it is seen that students’ performances vary among the
questions. There are relatively easy and relatively hard questions. The easiest question was
Q7, and the hardest question was Q4. In order to see how questions are related with the
test in general, item-total correlations can be seen in Table 5.12.
Item N Sum Mean Std. Dev.
1 90 49 0.54 0.501 2 90 40 0.44 0.5 3 90 49 0.54 0.501 4 90 5 0.06 0.23 5 90 68 0.76 0.432 6 90 27 0.3 0.461 7 90 76 0.84 0.364 8 90 58 0.64 0.481 9 90 17 0.19 0.394 10 90 72 0.8 0.402 11 90 66 0.73 0.445 12 90 43 0.48 0.502 13 90 27 0.3 0.461 14 90 37 0.41 0.495 15 90 35 0.39 0.49 16 90 39 0.43 0.498 17 90 29 0.32 0.47 18 90 20 0.61 0.49 19 90 33 0.37 0.485 20 90 16 0.18 0.384 Total 8.85 2.995
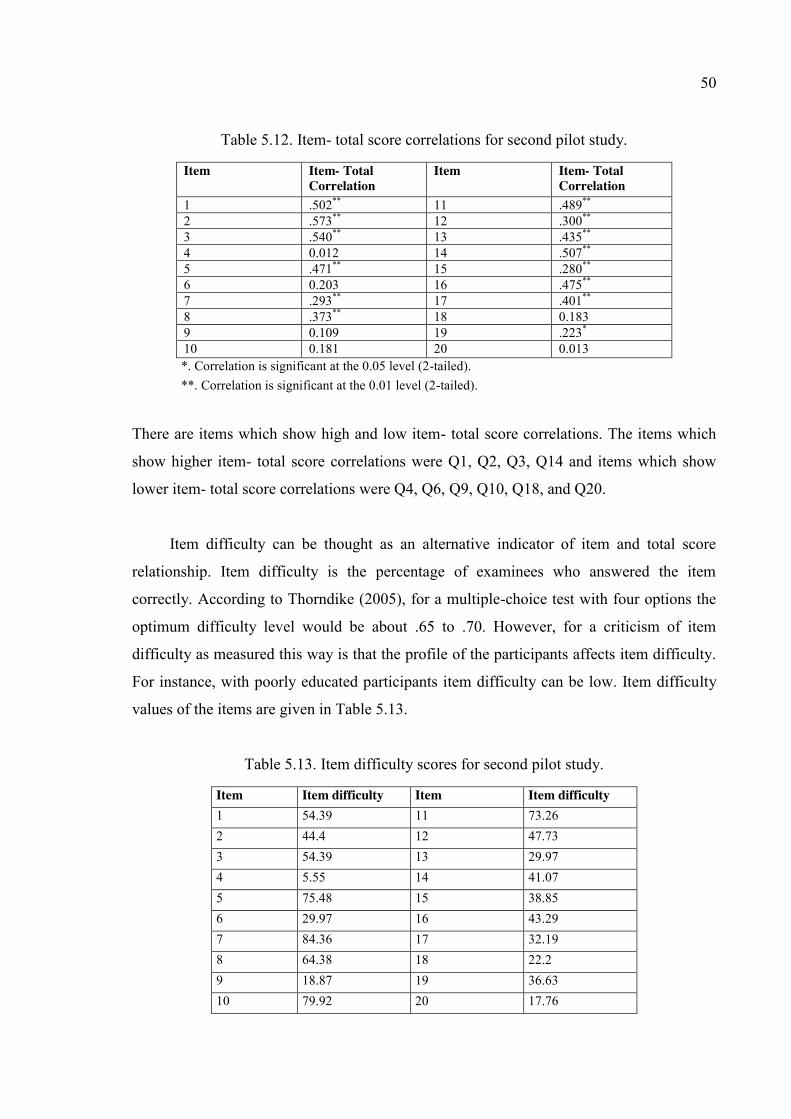
50
Table 5.12. Item- total score correlations for second pilot study.
Item Item- Total Correlation
Item Item- Total Correlation
1 .502** 11 .489** 2 .573** 12 .300** 3 .540** 13 .435** 4 0.012 14 .507** 5 .471** 15 .280** 6 0.203 16 .475** 7 .293** 17 .401** 8 .373** 18 0.183 9 0.109 19 .223* 10 0.181 20 0.013 *. Correlation is significant at the 0.05 level (2-tailed). **. Correlation is significant at the 0.01 level (2-tailed).
There are items which show high and low item- total score correlations. The items which
show higher item- total score correlations were Q1, Q2, Q3, Q14 and items which show
lower item- total score correlations were Q4, Q6, Q9, Q10, Q18, and Q20.
Item difficulty can be thought as an alternative indicator of item and total score
relationship. Item difficulty is the percentage of examinees who answered the item
correctly. According to Thorndike (2005), for a multiple-choice test with four options the
optimum difficulty level would be about .65 to .70. However, for a criticism of item
difficulty as measured this way is that the profile of the participants affects item difficulty.
For instance, with poorly educated participants item difficulty can be low. Item difficulty
values of the items are given in Table 5.13.
Table 5.13. Item difficulty scores for second pilot study.
Item Item difficulty Item Item difficulty 1 54.39 11 73.26 2 44.4 12 47.73 3 54.39 13 29.97 4 5.55 14 41.07 5 75.48 15 38.85 6 29.97 16 43.29 7 84.36 17 32.19 8 64.38 18 22.2 9 18.87 19 36.63 10 79.92 20 17.76
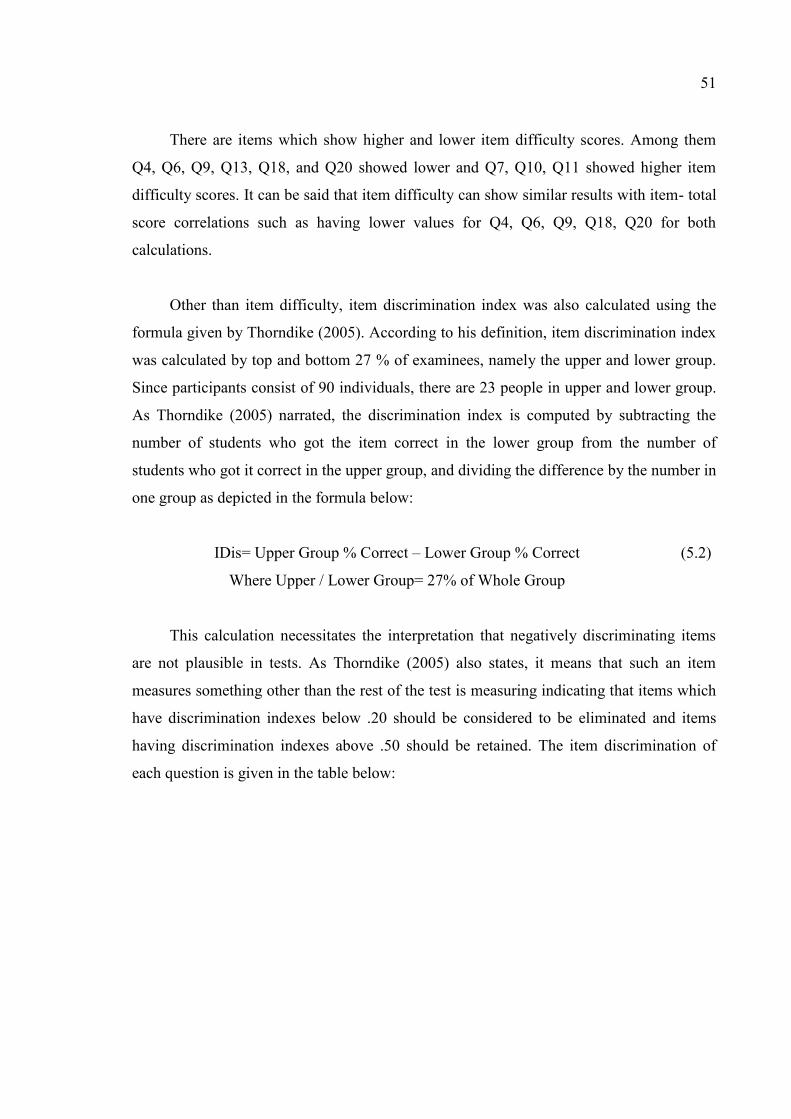
51
There are items which show higher and lower item difficulty scores. Among them
Q4, Q6, Q9, Q13, Q18, and Q20 showed lower and Q7, Q10, Q11 showed higher item
difficulty scores. It can be said that item difficulty can show similar results with item- total
score correlations such as having lower values for Q4, Q6, Q9, Q18, Q20 for both
calculations.
Other than item difficulty, item discrimination index was also calculated using the
formula given by Thorndike (2005). According to his definition, item discrimination index
was calculated by top and bottom 27 % of examinees, namely the upper and lower group.
Since participants consist of 90 individuals, there are 23 people in upper and lower group.
As Thorndike (2005) narrated, the discrimination index is computed by subtracting the
number of students who got the item correct in the lower group from the number of
students who got it correct in the upper group, and dividing the difference by the number in
one group as depicted in the formula below:
IDis= Upper Group % Correct – Lower Group % Correct
Where Upper / Lower Group= 27% of Whole Group
(5.2)
This calculation necessitates the interpretation that negatively discriminating items
are not plausible in tests. As Thorndike (2005) also states, it means that such an item
measures something other than the rest of the test is measuring indicating that items which
have discrimination indexes below .20 should be considered to be eliminated and items
having discrimination indexes above .50 should be retained. The item discrimination of
each question is given in the table below:
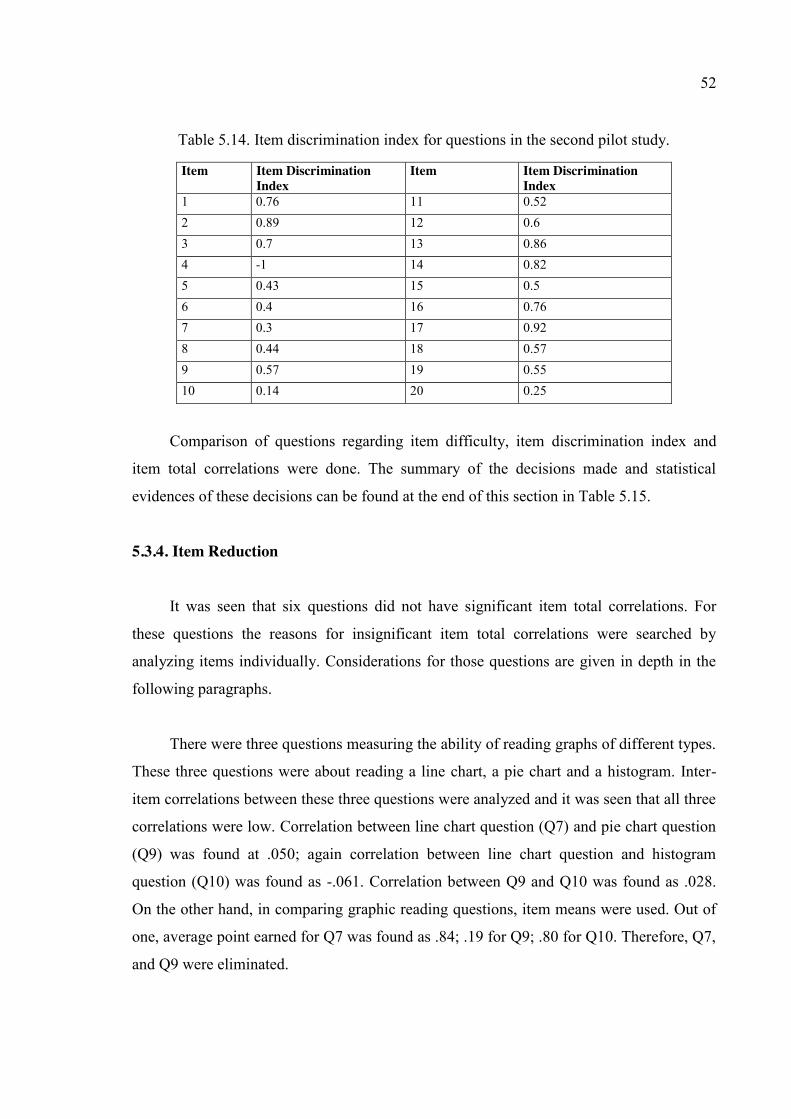
52
Table 5.14. Item discrimination index for questions in the second pilot study.
Item Item Discrimination Index
Item Item Discrimination Index
1 0.76 11 0.52 2 0.89 12 0.6 3 0.7 13 0.86 4 -1 14 0.82 5 0.43 15 0.5 6 0.4 16 0.76 7 0.3 17 0.92 8 0.44 18 0.57 9 0.57 19 0.55 10 0.14 20 0.25
Comparison of questions regarding item difficulty, item discrimination index and
item total correlations were done. The summary of the decisions made and statistical
evidences of these decisions can be found at the end of this section in Table 5.15.
5.3.4. Item Reduction
It was seen that six questions did not have significant item total correlations. For
these questions the reasons for insignificant item total correlations were searched by
analyzing items individually. Considerations for those questions are given in depth in the
following paragraphs.
There were three questions measuring the ability of reading graphs of different types.
These three questions were about reading a line chart, a pie chart and a histogram. Inter-
item correlations between these three questions were analyzed and it was seen that all three
correlations were low. Correlation between line chart question (Q7) and pie chart question
(Q9) was found at .050; again correlation between line chart question and histogram
question (Q10) was found as -.061. Correlation between Q9 and Q10 was found as .028.
On the other hand, in comparing graphic reading questions, item means were used. Out of
one, average point earned for Q7 was found as .84; .19 for Q9; .80 for Q10. Therefore, Q7,
and Q9 were eliminated.
53
For the fourth question (Q4), it is possible to say that the question measures
evaluating claims based on the statistical information rather than non-statistical
information which is peripheral to the intended measurement outcome with this question.
This ability can be assumed as a prerequisite of being statistically literate as well as
making judgments relying on statistics which is statistical thinking. Therefore, what is
measured with this question can be said to be at the intersection of statistical literacy and
statistical thinking which is possible according to delMas’ (2002) model. This theoretical
reliance on another interdependent construct, statistical thinking, can be responsible for the
low item-total correlation. Therefore, it was decided to eliminate the item from the test. It
is also seen that Q4 has a very low item discrimination index. This finding also supports
the idea that Q4 measures a theoretically different construct other than statistical literacy.
Question 6 (Q6) measures critical interpretation of conditional probability. The item
had been tried out in the first pilot study, had a relatively high item total correlation (.586)
and was revised after expert analysis. For the second pilot study, the stimulus of the
question was given with a table. Although few in number, some students narrated that they
had difficulty in reading table. Those students were pursuing majors related to social
sciences. The form the stimulus presented can be charged for the change in the value of
item-total correlation.
For question 20 (Q20), item total correlation was not significant (.127), and the mean
of the question was not high (.18 out of 1). This question was asking for the interpretation
of a given correlation. In the literature, the distinction between correlation and causation
was highlighted and listed among the things that statistically literate person should know
(Utts, 2003; Schield, 1999). In this question, one of the options reflected this
misinterpretation which worked as a distracter. This distractor can be responsible for the
low item mean and insignificant item-total correlation. Since the item measures an
indispensible topic for the study, this item has remained in the test.
Lastly, question number 18 (Q18) had low item-total correlation (.183) and a mean
of (.61). This question is about confidence intervals and shares the same stimulus with
question 19 (Q19). In the common stimulus, the situation is narrated and in each question a
statement is given and asked for its validity. The statements could be seen close to each
54
other especially for a participant who is not so competent in confidence intervals. That’s
why; the question remained in the instrument. After the analysis, the indicated questions
were eliminated for the pursuit of making the instrument even more practical, valid, and
reliable.
5.3.5. Item Revision
There was still need for revising some questions. For example, in order to decrease
necessary time for reading the question the common stimulus of Q18 and Q19 were refined
and shortened. The stimulus of Q20 was revised to better fit to the Turkish context. The
instrument was prepared to the third pilot study. The following table displays the content,
analysis results, and the decisions made regarding whole list of questions used in this
phase.
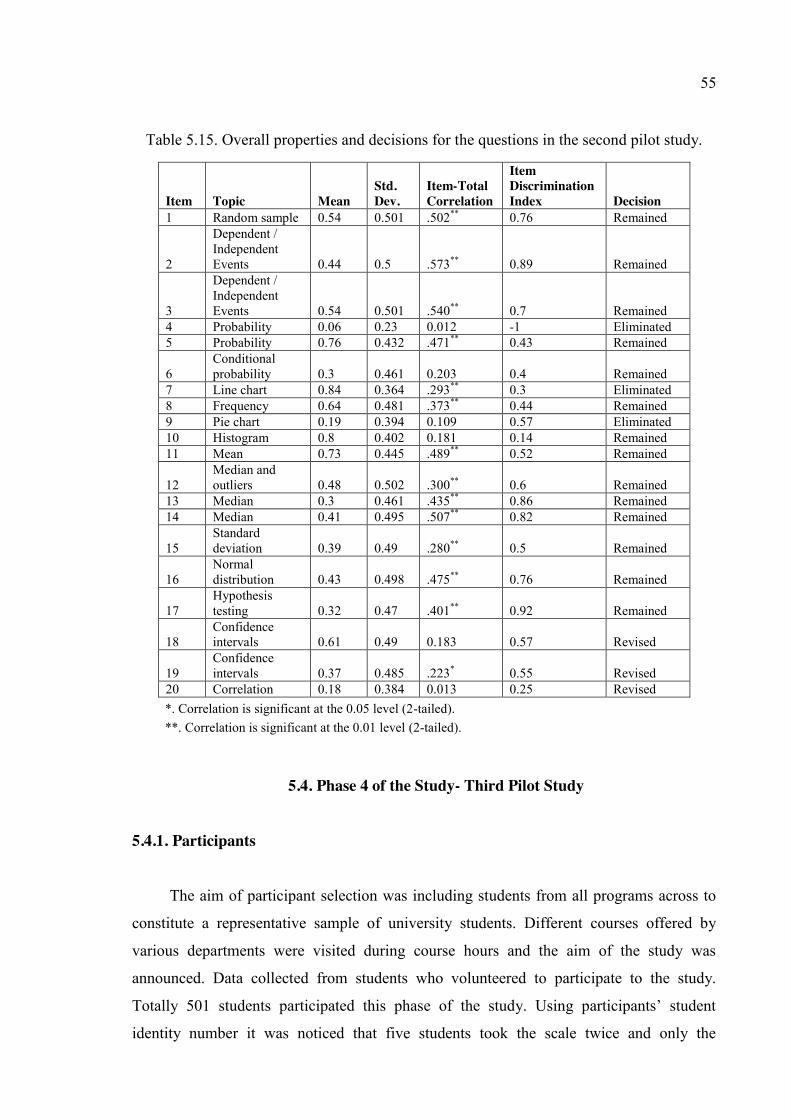
55
Table 5.15. Overall properties and decisions for the questions in the second pilot study.
Item Topic Mean Std. Dev.
Item-Total Correlation
Item Discrimination Index Decision
1 Random sample 0.54 0.501 .502** 0.76 Remained
2
Dependent / Independent Events 0.44 0.5 .573** 0.89 Remained
3
Dependent / Independent Events 0.54 0.501 .540** 0.7 Remained
4 Probability 0.06 0.23 0.012 -1 Eliminated 5 Probability 0.76 0.432 .471** 0.43 Remained
6 Conditional probability 0.3 0.461 0.203 0.4 Remained
7 Line chart 0.84 0.364 .293** 0.3 Eliminated 8 Frequency 0.64 0.481 .373** 0.44 Remained 9 Pie chart 0.19 0.394 0.109 0.57 Eliminated 10 Histogram 0.8 0.402 0.181 0.14 Remained 11 Mean 0.73 0.445 .489** 0.52 Remained
12 Median and outliers 0.48 0.502 .300** 0.6 Remained
13 Median 0.3 0.461 .435** 0.86 Remained 14 Median 0.41 0.495 .507** 0.82 Remained
15 Standard deviation 0.39 0.49 .280** 0.5 Remained
16 Normal distribution 0.43 0.498 .475** 0.76 Remained
17 Hypothesis testing 0.32 0.47 .401** 0.92 Remained
18 Confidence intervals 0.61 0.49 0.183 0.57 Revised
19 Confidence intervals 0.37 0.485 .223* 0.55 Revised
20 Correlation 0.18 0.384 0.013 0.25 Revised *. Correlation is significant at the 0.05 level (2-tailed). **. Correlation is significant at the 0.01 level (2-tailed).
5.4. Phase 4 of the Study- Third Pilot Study
5.4.1. Participants
The aim of participant selection was including students from all programs across to
constitute a representative sample of university students. Different courses offered by
various departments were visited during course hours and the aim of the study was
announced. Data collected from students who volunteered to participate to the study.
Totally 501 students participated this phase of the study. Using participants’ student
identity number it was noticed that five students took the scale twice and only the
56
responses when the instrument was first administered was used. Ten participants were
exchange students from other universities, they were not included in the sample and their
answers were not included in the study. Ten participants answered less than half of the
questions in the instrument which is eight. Their answers were examined and none of them
included in data analysis. After the exclusion of 25 participants, 476 participants remained
in the study. Information about participants’ departments, grades, and GPAs were
summarized. Participants were from 32 programs which is the total number of all programs
in the university that the study was carried meaning that students from all the departments
in the university were reached. The profile of the participants according to their programs
and years of study was given in Table 5.16 (Abbreviations were given as; BIO: Biology,
CHEM: Chemistry, HIST: History, MATH: Mathematics, PHIL: Philosophy, PHYS:
Physics, PSY: Psychology, SOC: Sociology, TI: Translation and Interpreting Studies, TLL:
Turkish Language and Literature, WLL: Western Language and Literatures, AD:
Management, EC: Economics, POLS: Political Science and International Relations, CET:
Computer Education and Educational Technology, ED: Educational Sciences, FLED:
Foreign Language Education, PRED-M: Undergraduate Program in Mathematics
Education, PRED-P: Undergraduate Program in Preschool Education, PRED-S:
Undergraduate Program in Science Education, CEDU: Integrated B.S. And M.S. Program
in Teaching Chemistry, MEDU: Integrated B.S. and M.S. Program in Teaching
Mathematics, PEDU: Integrated B.S. and M.S. Program in Teaching Physics, CHE:
Chemical Engineering, CE: Civil Engineering, CMPE: Computer Engineering, EE:
Electrical and Electronically Engineering, IE: Industrial Engineering, ME: Mechanical
Engineering, INTT: International Trade, MIS: Management and Information Systems, and
TA: Tourism Administration).
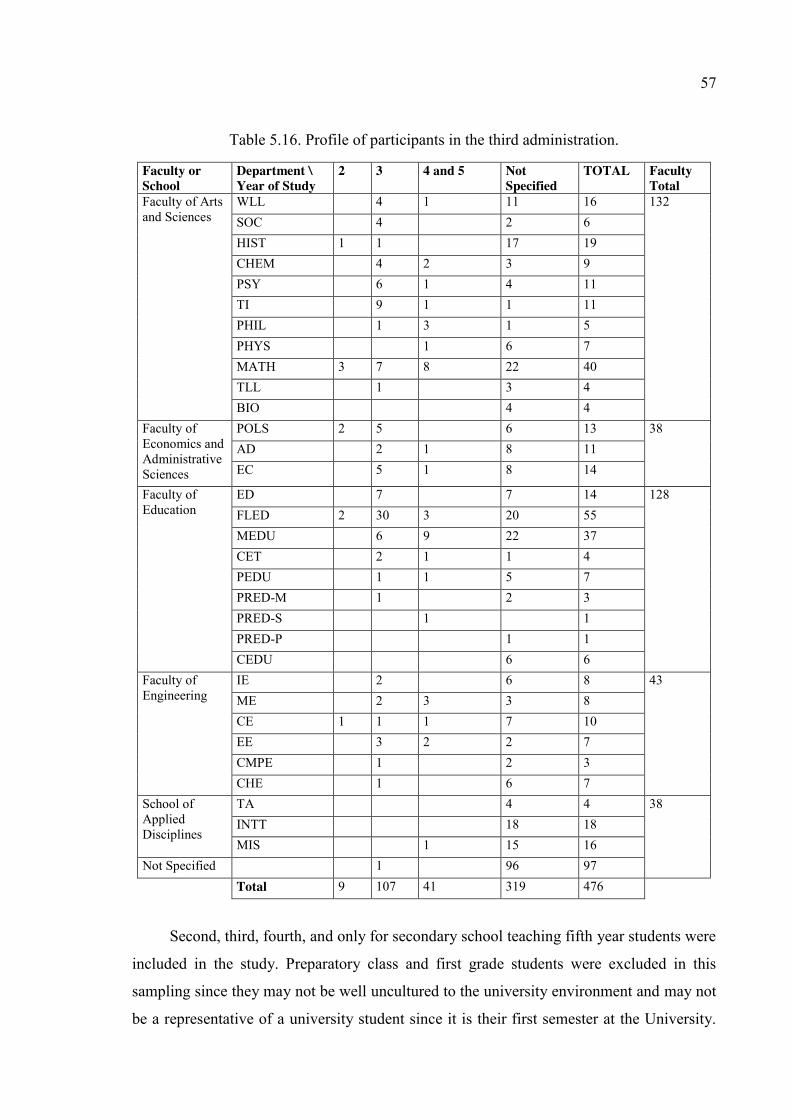
57
Table 5.16. Profile of participants in the third administration.
Faculty or School
Department \ Year of Study
2 3 4 and 5 Not Specified
TOTAL Faculty Total
Faculty of Arts and Sciences
WLL 4 1 11 16 132 SOC 4 2 6 HIST 1 1 17 19 CHEM 4 2 3 9 PSY 6 1 4 11 TI 9 1 1 11 PHIL 1 3 1 5 PHYS 1 6 7 MATH 3 7 8 22 40 TLL 1 3 4 BIO 4 4
Faculty of Economics and Administrative Sciences
POLS 2 5 6 13 38 AD 2 1 8 11 EC 5 1 8 14
Faculty of Education
ED 7 7 14 128 FLED 2 30 3 20 55 MEDU 6 9 22 37 CET 2 1 1 4 PEDU 1 1 5 7 PRED-M 1 2 3 PRED-S 1 1 PRED-P 1 1 CEDU 6 6
Faculty of Engineering
IE 2 6 8 43 ME 2 3 3 8 CE 1 1 1 7 10 EE 3 2 2 7 CMPE 1 2 3 CHE 1 6 7
School of Applied Disciplines
TA 4 4 38 INTT 18 18 MIS 1 15 16
Not Specified 1 96 97 Total 9 107 41 319 476
Second, third, fourth, and only for secondary school teaching fifth year students were
included in the study. Preparatory class and first grade students were excluded in this
sampling since they may not be well uncultured to the university environment and may not
be a representative of a university student since it is their first semester at the University.
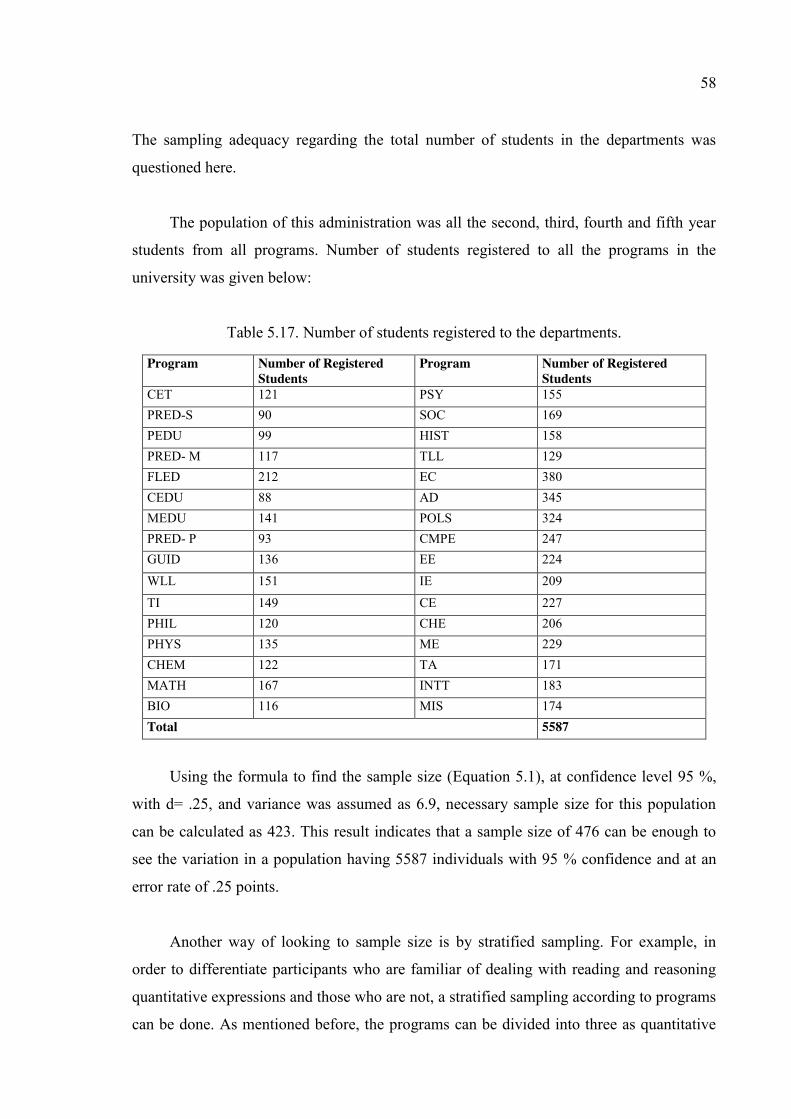
58
The sampling adequacy regarding the total number of students in the departments was
questioned here.
The population of this administration was all the second, third, fourth and fifth year
students from all programs. Number of students registered to all the programs in the
university was given below:
Table 5.17. Number of students registered to the departments.
Program Number of Registered Students
Program Number of Registered Students
CET 121 PSY 155 PRED-S 90 SOC 169 PEDU 99 HIST 158 PRED- M 117 TLL 129 FLED 212 EC 380 CEDU 88 AD 345 MEDU 141 POLS 324 PRED- P 93 CMPE 247 GUID 136 EE 224 WLL 151 IE 209 TI 149 CE 227 PHIL 120 CHE 206 PHYS 135 ME 229 CHEM 122 TA 171 MATH 167 INTT 183 BIO 116 MIS 174 Total 5587
Using the formula to find the sample size (Equation 5.1), at confidence level 95 %,
with d= .25, and variance was assumed as 6.9, necessary sample size for this population
can be calculated as 423. This result indicates that a sample size of 476 can be enough to
see the variation in a population having 5587 individuals with 95 % confidence and at an
error rate of .25 points.
Another way of looking to sample size is by stratified sampling. For example, in
order to differentiate participants who are familiar of dealing with reading and reasoning
quantitative expressions and those who are not, a stratified sampling according to programs
can be done. As mentioned before, the programs can be divided into three as quantitative
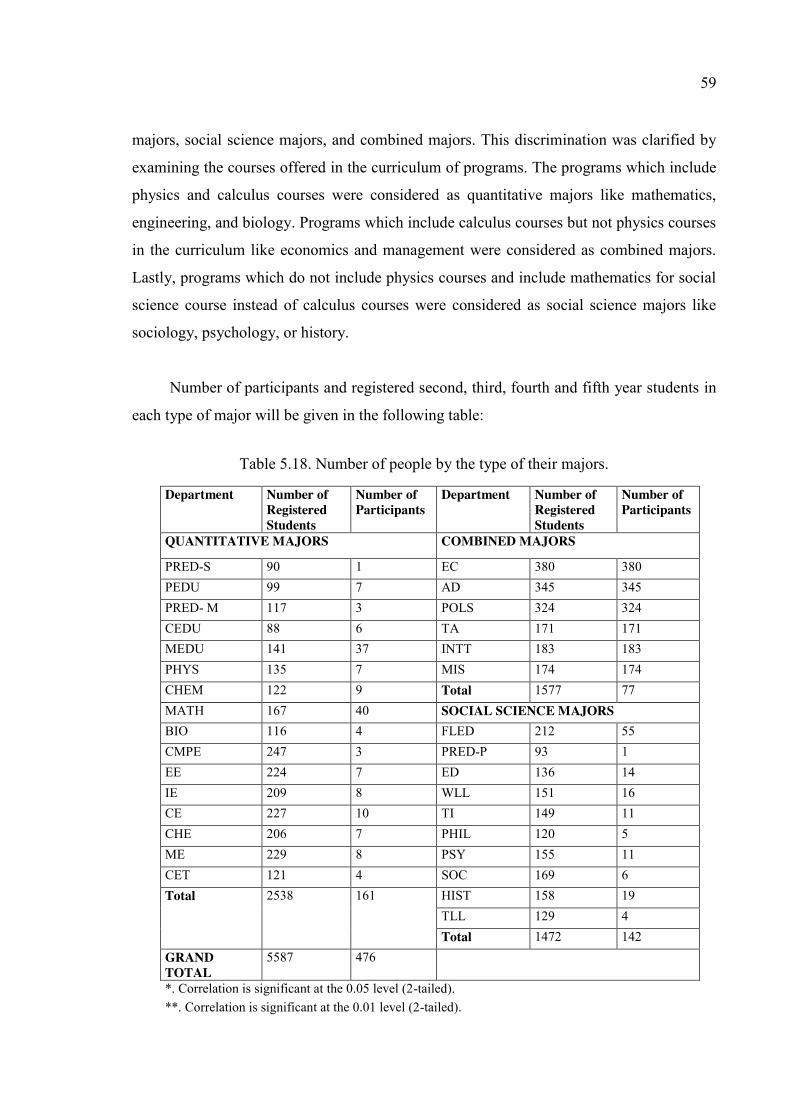
59
majors, social science majors, and combined majors. This discrimination was clarified by
examining the courses offered in the curriculum of programs. The programs which include
physics and calculus courses were considered as quantitative majors like mathematics,
engineering, and biology. Programs which include calculus courses but not physics courses
in the curriculum like economics and management were considered as combined majors.
Lastly, programs which do not include physics courses and include mathematics for social
science course instead of calculus courses were considered as social science majors like
sociology, psychology, or history.
Number of participants and registered second, third, fourth and fifth year students in
each type of major will be given in the following table:
Table 5.18. Number of people by the type of their majors.
Department Number of Registered Students
Number of Participants
Department Number of Registered Students
Number of Participants
QUANTITATIVE MAJORS COMBINED MAJORS
PRED-S 90 1 EC 380 380 PEDU 99 7 AD 345 345 PRED- M 117 3 POLS 324 324 CEDU 88 6 TA 171 171 MEDU 141 37 INTT 183 183 PHYS 135 7 MIS 174 174 CHEM 122 9 Total 1577 77 MATH 167 40 SOCIAL SCIENCE MAJORS BIO 116 4 FLED 212 55 CMPE 247 3 PRED-P 93 1 EE 224 7 ED 136 14 IE 209 8 WLL 151 16 CE 227 10 TI 149 11 CHE 206 7 PHIL 120 5 ME 229 8 PSY 155 11 CET 121 4 SOC 169 6 Total 2538 161 HIST 158 19
TLL 129 4 Total 1472 142
GRAND TOTAL
5587 476
*. Correlation is significant at the 0.05 level (2-tailed). **. Correlation is significant at the 0.01 level (2-tailed).
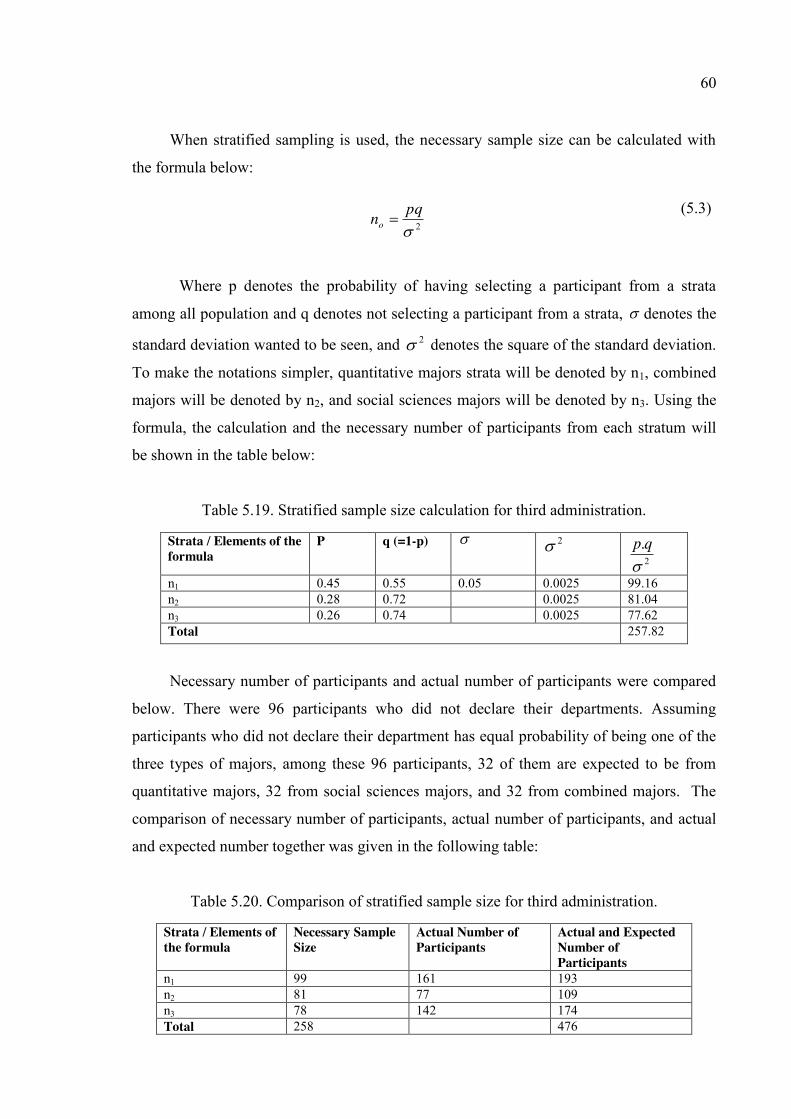
60
When stratified sampling is used, the necessary sample size can be calculated with
the formula below:
2pqno (5.3)
Where p denotes the probability of having selecting a participant from a strata
among all population and q denotes not selecting a participant from a strata, denotes the
standard deviation wanted to be seen, and 2 denotes the square of the standard deviation.
To make the notations simpler, quantitative majors strata will be denoted by n1, combined
majors will be denoted by n2, and social sciences majors will be denoted by n3. Using the
formula, the calculation and the necessary number of participants from each stratum will
be shown in the table below:
Table 5.19. Stratified sample size calculation for third administration.
Strata / Elements of the formula
P q (=1-p) 2 2.
qp
n1 0.45 0.55 0.05 0.0025 99.16 n2 0.28 0.72 0.0025 81.04 n3 0.26 0.74 0.0025 77.62 Total 257.82
Necessary number of participants and actual number of participants were compared
below. There were 96 participants who did not declare their departments. Assuming
participants who did not declare their department has equal probability of being one of the
three types of majors, among these 96 participants, 32 of them are expected to be from
quantitative majors, 32 from social sciences majors, and 32 from combined majors. The
comparison of necessary number of participants, actual number of participants, and actual
and expected number together was given in the following table:
Table 5.20. Comparison of stratified sample size for third administration.
Strata / Elements of the formula
Necessary Sample Size
Actual Number of Participants
Actual and Expected Number of Participants
n1 99 161 193 n2 81 77 109 n3 78 142 174 Total 258 476
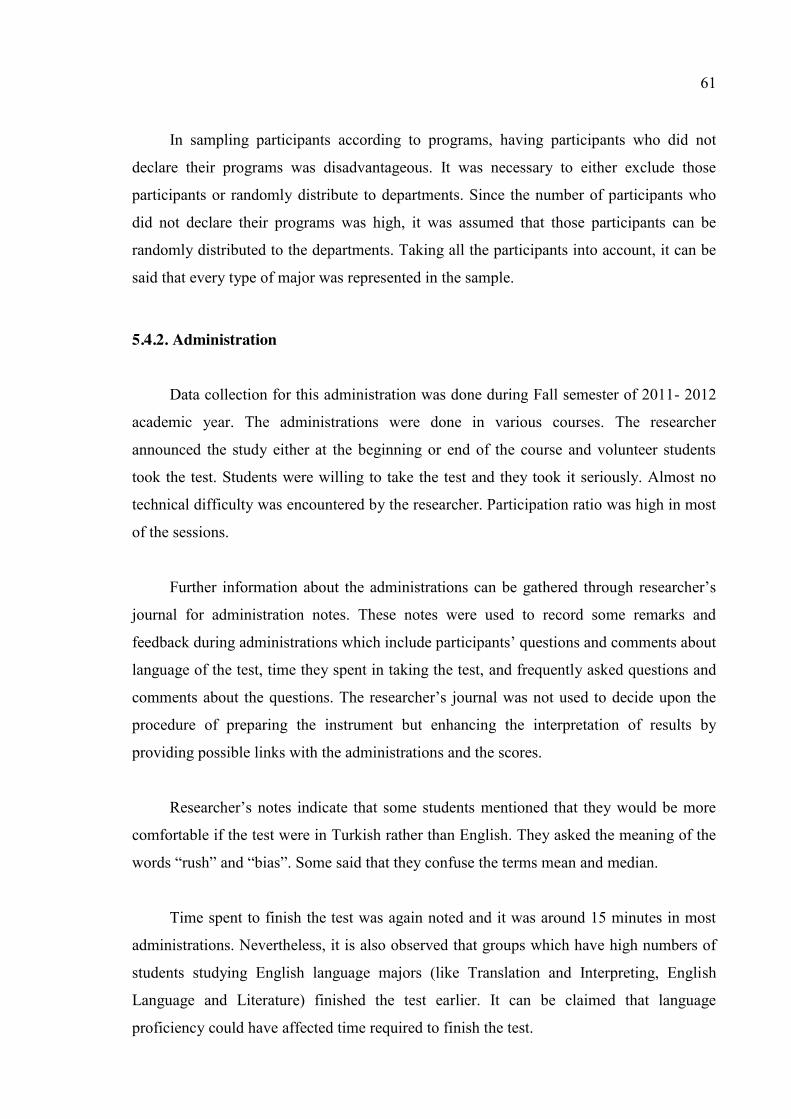
61
In sampling participants according to programs, having participants who did not
declare their programs was disadvantageous. It was necessary to either exclude those
participants or randomly distribute to departments. Since the number of participants who
did not declare their programs was high, it was assumed that those participants can be
randomly distributed to the departments. Taking all the participants into account, it can be
said that every type of major was represented in the sample.
5.4.2. Administration
Data collection for this administration was done during Fall semester of 2011- 2012
academic year. The administrations were done in various courses. The researcher
announced the study either at the beginning or end of the course and volunteer students
took the test. Students were willing to take the test and they took it seriously. Almost no
technical difficulty was encountered by the researcher. Participation ratio was high in most
of the sessions.
Further information about the administrations can be gathered through researcher’s
journal for administration notes. These notes were used to record some remarks and
feedback during administrations which include participants’ questions and comments about
language of the test, time they spent in taking the test, and frequently asked questions and
comments about the questions. The researcher’s journal was not used to decide upon the
procedure of preparing the instrument but enhancing the interpretation of results by
providing possible links with the administrations and the scores.
Researcher’s notes indicate that some students mentioned that they would be more
comfortable if the test were in Turkish rather than English. They asked the meaning of the
words “rush” and “bias”. Some said that they confuse the terms mean and median.
Time spent to finish the test was again noted and it was around 15 minutes in most
administrations. Nevertheless, it is also observed that groups which have high numbers of
students studying English language majors (like Translation and Interpreting, English
Language and Literature) finished the test earlier. It can be claimed that language
proficiency could have affected time required to finish the test.
62
Participants’ comments about the content of the test were also noted and occasionally
participants said that they did not remember mean and median. There were students saying
that they couldn’t complete the test if they would not take any statistics course before.
The last point seen in researcher’s journal was about a question which had a typing
error. In option “b” it was written as “This sample is too small to draw any conclusions
about the relationship between ... for adults in the U.S.” where it should be written as
Istanbul instead of U.S. Although the error did not change the keyed answer, it may have
confused participants. Number of students who recognized and asked about the error was
recorded, in most administrations it was noted that no one recognized the error. In some
administrations the number of participants recognized this error increased to three or even
five. It may be the case that most students answered the first option with thinking they
found the keyed response (true answer) and they did not read the rest of the options. It may
also be the case that since it was the last question in the instrument, with willing to finish
the test, they did not read all of the options. To sum, it is assumed that the type error did
not affect the results.
5.4.3. Data Analysis
Descriptive statistics about this administration were calculated using the sum of the
true answers, the mean, and standard deviation for each question and the mean and
standard deviation for the whole test.
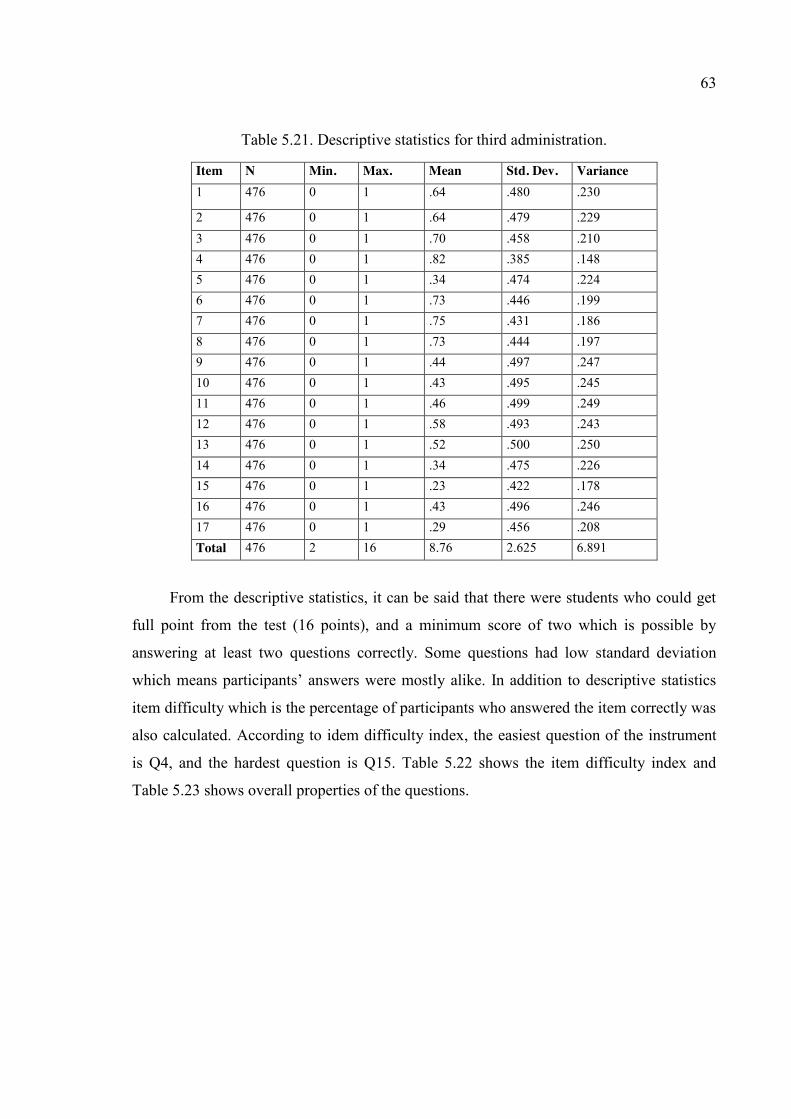
63
Table 5.21. Descriptive statistics for third administration.
Item N Min. Max. Mean Std. Dev. Variance 1 476 0 1 .64 .480 .230
2 476 0 1 .64 .479 .229 3 476 0 1 .70 .458 .210 4 476 0 1 .82 .385 .148 5 476 0 1 .34 .474 .224 6 476 0 1 .73 .446 .199 7 476 0 1 .75 .431 .186 8 476 0 1 .73 .444 .197 9 476 0 1 .44 .497 .247 10 476 0 1 .43 .495 .245 11 476 0 1 .46 .499 .249 12 476 0 1 .58 .493 .243 13 476 0 1 .52 .500 .250 14 476 0 1 .34 .475 .226 15 476 0 1 .23 .422 .178 16 476 0 1 .43 .496 .246 17 476 0 1 .29 .456 .208 Total 476 2 16 8.76 2.625 6.891
From the descriptive statistics, it can be said that there were students who could get
full point from the test (16 points), and a minimum score of two which is possible by
answering at least two questions correctly. Some questions had low standard deviation
which means participants’ answers were mostly alike. In addition to descriptive statistics
item difficulty which is the percentage of participants who answered the item correctly was
also calculated. According to idem difficulty index, the easiest question of the instrument
is Q4, and the hardest question is Q15. Table 5.22 shows the item difficulty index and
Table 5.23 shows overall properties of the questions.
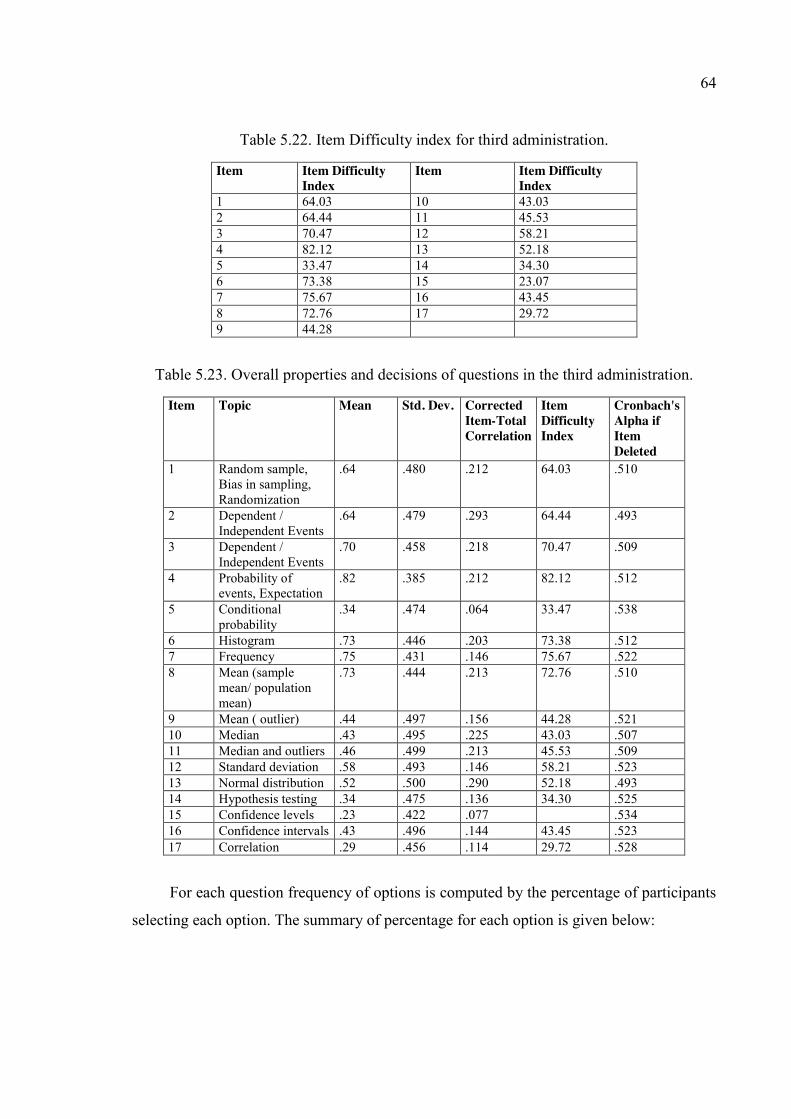
64
Table 5.22. Item Difficulty index for third administration.
Item Item Difficulty Index
Item Item Difficulty Index
1 64.03 10 43.03 2 64.44 11 45.53 3 70.47 12 58.21 4 82.12 13 52.18 5 33.47 14 34.30 6 73.38 15 23.07 7 75.67 16 43.45 8 72.76 17 29.72 9 44.28
Table 5.23. Overall properties and decisions of questions in the third administration.
Item Topic Mean Std. Dev. Corrected Item-Total Correlation
Item Difficulty Index
Cronbach's Alpha if Item Deleted
1 Random sample, Bias in sampling, Randomization
.64 .480 .212 64.03 .510
2 Dependent / Independent Events
.64 .479 .293 64.44 .493
3 Dependent / Independent Events
.70 .458 .218 70.47 .509
4 Probability of events, Expectation
.82 .385 .212 82.12 .512
5 Conditional probability
.34 .474 .064 33.47 .538
6 Histogram .73 .446 .203 73.38 .512 7 Frequency .75 .431 .146 75.67 .522 8 Mean (sample
mean/ population mean)
.73 .444 .213 72.76 .510
9 Mean ( outlier) .44 .497 .156 44.28 .521 10 Median .43 .495 .225 43.03 .507 11 Median and outliers .46 .499 .213 45.53 .509 12 Standard deviation .58 .493 .146 58.21 .523 13 Normal distribution .52 .500 .290 52.18 .493 14 Hypothesis testing .34 .475 .136 34.30 .525 15 Confidence levels .23 .422 .077 .534 16 Confidence intervals .43 .496 .144 43.45 .523 17 Correlation .29 .456 .114 29.72 .528
For each question frequency of options is computed by the percentage of participants
selecting each option. The summary of percentage for each option is given below:
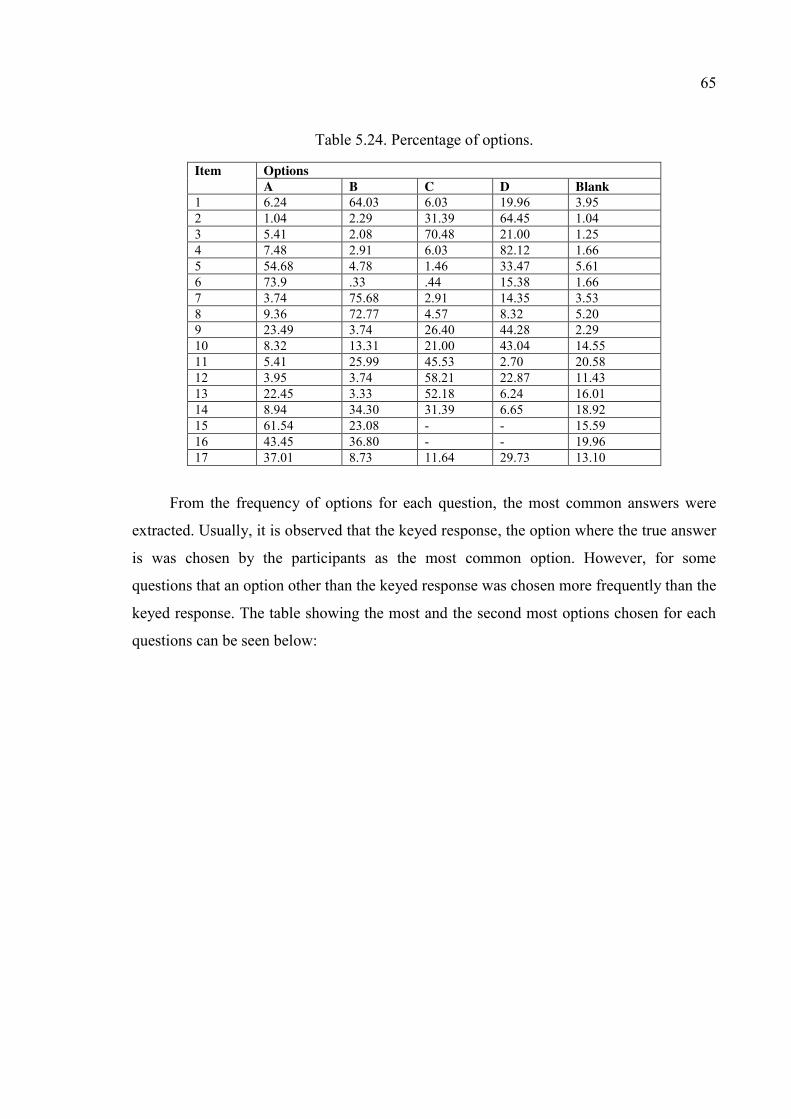
65
Table 5.24. Percentage of options.
Item Options A B C D Blank
1 6.24 64.03 6.03 19.96 3.95 2 1.04 2.29 31.39 64.45 1.04 3 5.41 2.08 70.48 21.00 1.25 4 7.48 2.91 6.03 82.12 1.66 5 54.68 4.78 1.46 33.47 5.61 6 73.9 .33 .44 15.38 1.66 7 3.74 75.68 2.91 14.35 3.53 8 9.36 72.77 4.57 8.32 5.20 9 23.49 3.74 26.40 44.28 2.29 10 8.32 13.31 21.00 43.04 14.55 11 5.41 25.99 45.53 2.70 20.58 12 3.95 3.74 58.21 22.87 11.43 13 22.45 3.33 52.18 6.24 16.01 14 8.94 34.30 31.39 6.65 18.92 15 61.54 23.08 - - 15.59 16 43.45 36.80 - - 19.96 17 37.01 8.73 11.64 29.73 13.10
From the frequency of options for each question, the most common answers were
extracted. Usually, it is observed that the keyed response, the option where the true answer
is was chosen by the participants as the most common option. However, for some
questions that an option other than the keyed response was chosen more frequently than the
keyed response. The table showing the most and the second most options chosen for each
questions can be seen below:
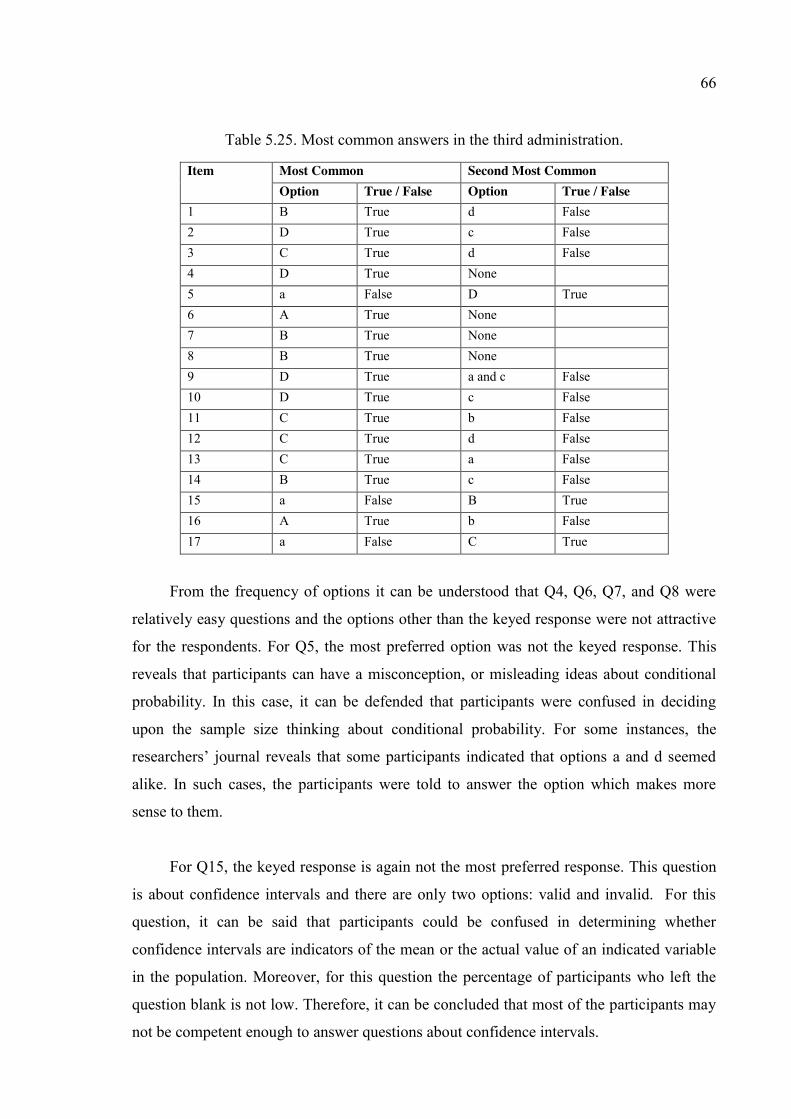
66
Table 5.25. Most common answers in the third administration.
Item Most Common Second Most Common Option True / False Option True / False
1 B True d False 2 D True c False 3 C True d False 4 D True None 5 a False D True 6 A True None 7 B True None 8 B True None 9 D True a and c False 10 D True c False 11 C True b False 12 C True d False 13 C True a False 14 B True c False 15 a False B True 16 A True b False 17 a False C True
From the frequency of options it can be understood that Q4, Q6, Q7, and Q8 were
relatively easy questions and the options other than the keyed response were not attractive
for the respondents. For Q5, the most preferred option was not the keyed response. This
reveals that participants can have a misconception, or misleading ideas about conditional
probability. In this case, it can be defended that participants were confused in deciding
upon the sample size thinking about conditional probability. For some instances, the
researchers’ journal reveals that some participants indicated that options a and d seemed
alike. In such cases, the participants were told to answer the option which makes more
sense to them.
For Q15, the keyed response is again not the most preferred response. This question
is about confidence intervals and there are only two options: valid and invalid. For this
question, it can be said that participants could be confused in determining whether
confidence intervals are indicators of the mean or the actual value of an indicated variable
in the population. Moreover, for this question the percentage of participants who left the
question blank is not low. Therefore, it can be concluded that most of the participants may
not be competent enough to answer questions about confidence intervals.
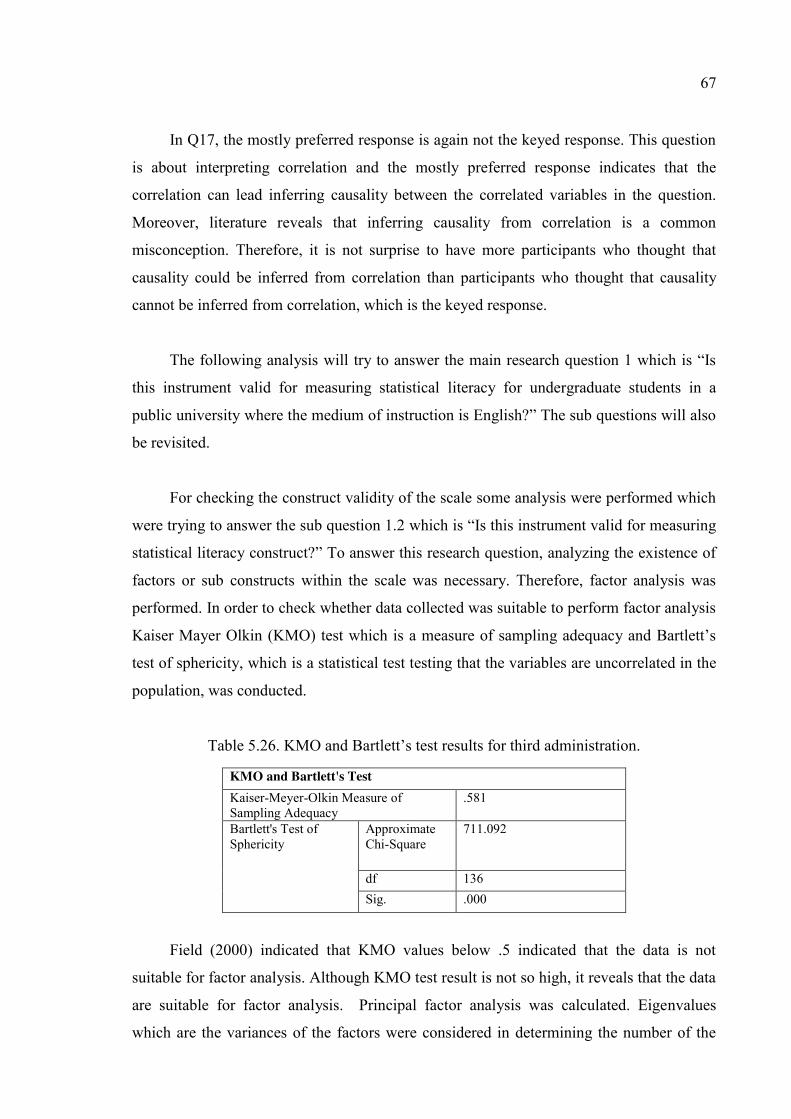
67
In Q17, the mostly preferred response is again not the keyed response. This question
is about interpreting correlation and the mostly preferred response indicates that the
correlation can lead inferring causality between the correlated variables in the question.
Moreover, literature reveals that inferring causality from correlation is a common
misconception. Therefore, it is not surprise to have more participants who thought that
causality could be inferred from correlation than participants who thought that causality
cannot be inferred from correlation, which is the keyed response.
The following analysis will try to answer the main research question 1 which is “Is
this instrument valid for measuring statistical literacy for undergraduate students in a
public university where the medium of instruction is English?” The sub questions will also
be revisited.
For checking the construct validity of the scale some analysis were performed which
were trying to answer the sub question 1.2 which is “Is this instrument valid for measuring
statistical literacy construct?” To answer this research question, analyzing the existence of
factors or sub constructs within the scale was necessary. Therefore, factor analysis was
performed. In order to check whether data collected was suitable to perform factor analysis
Kaiser Mayer Olkin (KMO) test which is a measure of sampling adequacy and Bartlett’s
test of sphericity, which is a statistical test testing that the variables are uncorrelated in the
population, was conducted.
Table 5.26. KMO and Bartlett’s test results for third administration.
KMO and Bartlett's Test Kaiser-Meyer-Olkin Measure of Sampling Adequacy
.581
Bartlett's Test of Sphericity
Approximate Chi-Square
711.092
df 136 Sig. .000
Field (2000) indicated that KMO values below .5 indicated that the data is not
suitable for factor analysis. Although KMO test result is not so high, it reveals that the data
are suitable for factor analysis. Principal factor analysis was calculated. Eigenvalues
which are the variances of the factors were considered in determining the number of the
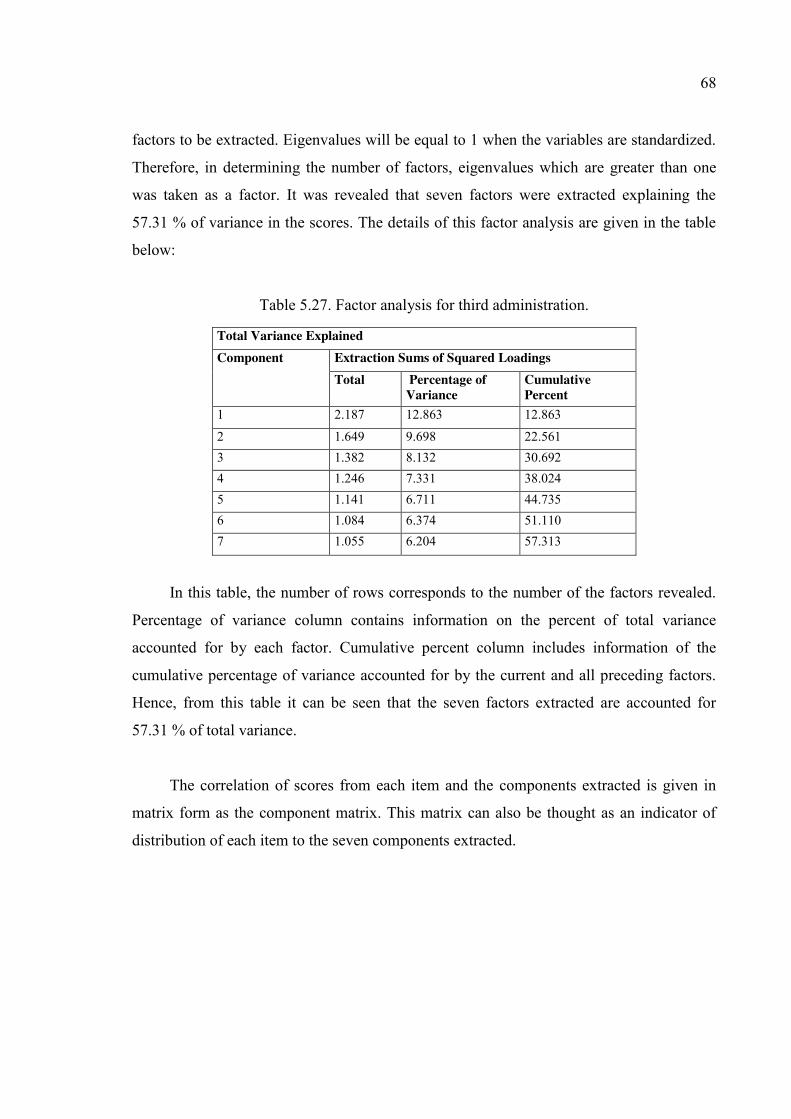
68
factors to be extracted. Eigenvalues will be equal to 1 when the variables are standardized.
Therefore, in determining the number of factors, eigenvalues which are greater than one
was taken as a factor. It was revealed that seven factors were extracted explaining the
57.31 % of variance in the scores. The details of this factor analysis are given in the table
below:
Table 5.27. Factor analysis for third administration.
Total Variance Explained Component Extraction Sums of Squared Loadings
Total Percentage of Variance
Cumulative Percent
1 2.187 12.863 12.863
2 1.649 9.698 22.561 3 1.382 8.132 30.692 4 1.246 7.331 38.024 5 1.141 6.711 44.735 6 1.084 6.374 51.110 7 1.055 6.204 57.313
In this table, the number of rows corresponds to the number of the factors revealed.
Percentage of variance column contains information on the percent of total variance
accounted for by each factor. Cumulative percent column includes information of the
cumulative percentage of variance accounted for by the current and all preceding factors.
Hence, from this table it can be seen that the seven factors extracted are accounted for
57.31 % of total variance.
The correlation of scores from each item and the components extracted is given in
matrix form as the component matrix. This matrix can also be thought as an indicator of
distribution of each item to the seven components extracted.
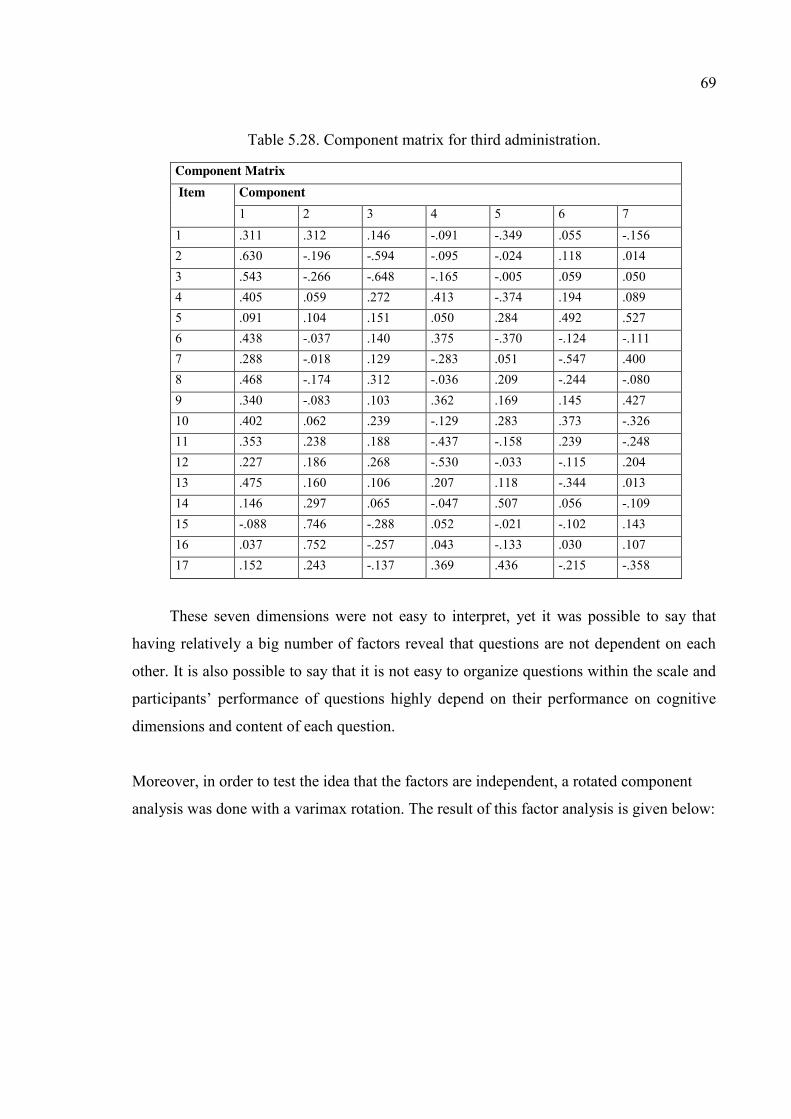
69
Table 5.28. Component matrix for third administration.
These seven dimensions were not easy to interpret, yet it was possible to say that
having relatively a big number of factors reveal that questions are not dependent on each
other. It is also possible to say that it is not easy to organize questions within the scale and
participants’ performance of questions highly depend on their performance on cognitive
dimensions and content of each question.
Moreover, in order to test the idea that the factors are independent, a rotated component
analysis was done with a varimax rotation. The result of this factor analysis is given below:
Component Matrix Item Component
1 2 3 4 5 6 7 1 .311 .312 .146 -.091 -.349 .055 -.156 2 .630 -.196 -.594 -.095 -.024 .118 .014 3 .543 -.266 -.648 -.165 -.005 .059 .050 4 .405 .059 .272 .413 -.374 .194 .089 5 .091 .104 .151 .050 .284 .492 .527 6 .438 -.037 .140 .375 -.370 -.124 -.111 7 .288 -.018 .129 -.283 .051 -.547 .400 8 .468 -.174 .312 -.036 .209 -.244 -.080 9 .340 -.083 .103 .362 .169 .145 .427 10 .402 .062 .239 -.129 .283 .373 -.326 11 .353 .238 .188 -.437 -.158 .239 -.248 12 .227 .186 .268 -.530 -.033 -.115 .204 13 .475 .160 .106 .207 .118 -.344 .013 14 .146 .297 .065 -.047 .507 .056 -.109 15 -.088 .746 -.288 .052 -.021 -.102 .143 16 .037 .752 -.257 .043 -.133 .030 .107 17 .152 .243 -.137 .369 .436 -.215 -.358
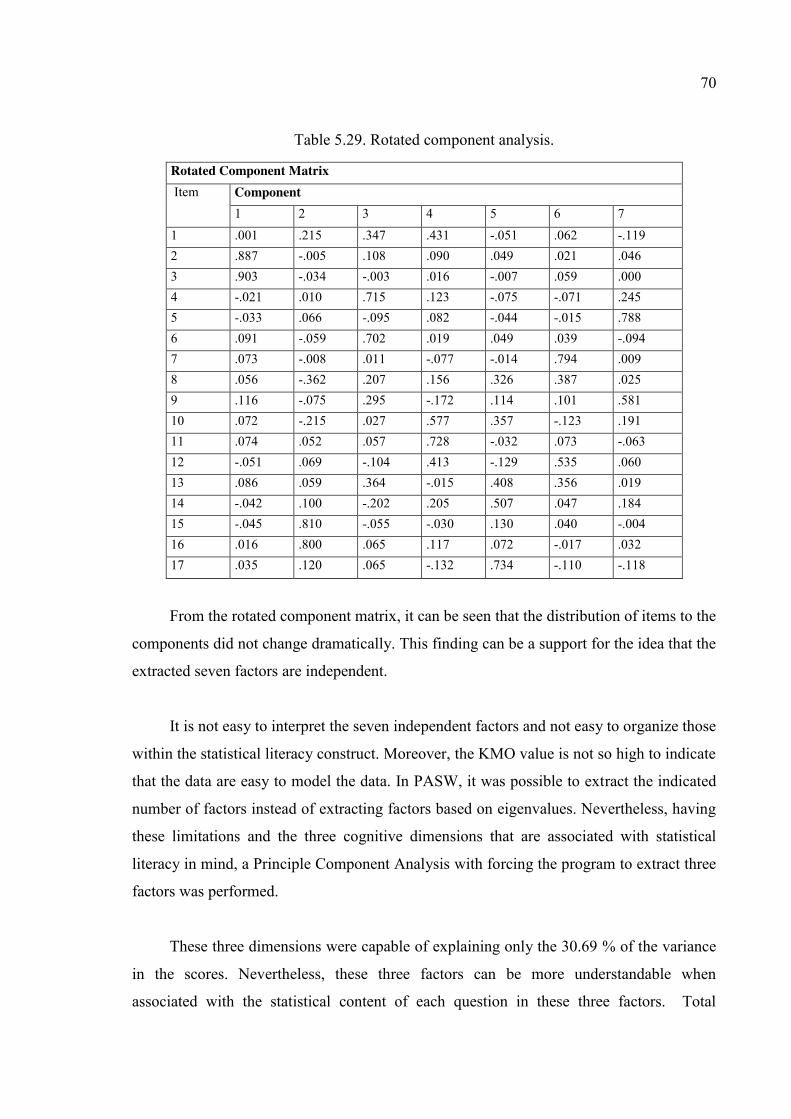
70
Table 5.29. Rotated component analysis.
Rotated Component Matrix Item Component
1 2 3 4 5 6 7 1 .001 .215 .347 .431 -.051 .062 -.119 2 .887 -.005 .108 .090 .049 .021 .046 3 .903 -.034 -.003 .016 -.007 .059 .000 4 -.021 .010 .715 .123 -.075 -.071 .245 5 -.033 .066 -.095 .082 -.044 -.015 .788 6 .091 -.059 .702 .019 .049 .039 -.094 7 .073 -.008 .011 -.077 -.014 .794 .009 8 .056 -.362 .207 .156 .326 .387 .025 9 .116 -.075 .295 -.172 .114 .101 .581 10 .072 -.215 .027 .577 .357 -.123 .191 11 .074 .052 .057 .728 -.032 .073 -.063 12 -.051 .069 -.104 .413 -.129 .535 .060 13 .086 .059 .364 -.015 .408 .356 .019 14 -.042 .100 -.202 .205 .507 .047 .184 15 -.045 .810 -.055 -.030 .130 .040 -.004 16 .016 .800 .065 .117 .072 -.017 .032 17 .035 .120 .065 -.132 .734 -.110 -.118
From the rotated component matrix, it can be seen that the distribution of items to the
components did not change dramatically. This finding can be a support for the idea that the
extracted seven factors are independent.
It is not easy to interpret the seven independent factors and not easy to organize those
within the statistical literacy construct. Moreover, the KMO value is not so high to indicate
that the data are easy to model the data. In PASW, it was possible to extract the indicated
number of factors instead of extracting factors based on eigenvalues. Nevertheless, having
these limitations and the three cognitive dimensions that are associated with statistical
literacy in mind, a Principle Component Analysis with forcing the program to extract three
factors was performed.
These three dimensions were capable of explaining only the 30.69 % of the variance
in the scores. Nevertheless, these three factors can be more understandable when
associated with the statistical content of each question in these three factors. Total
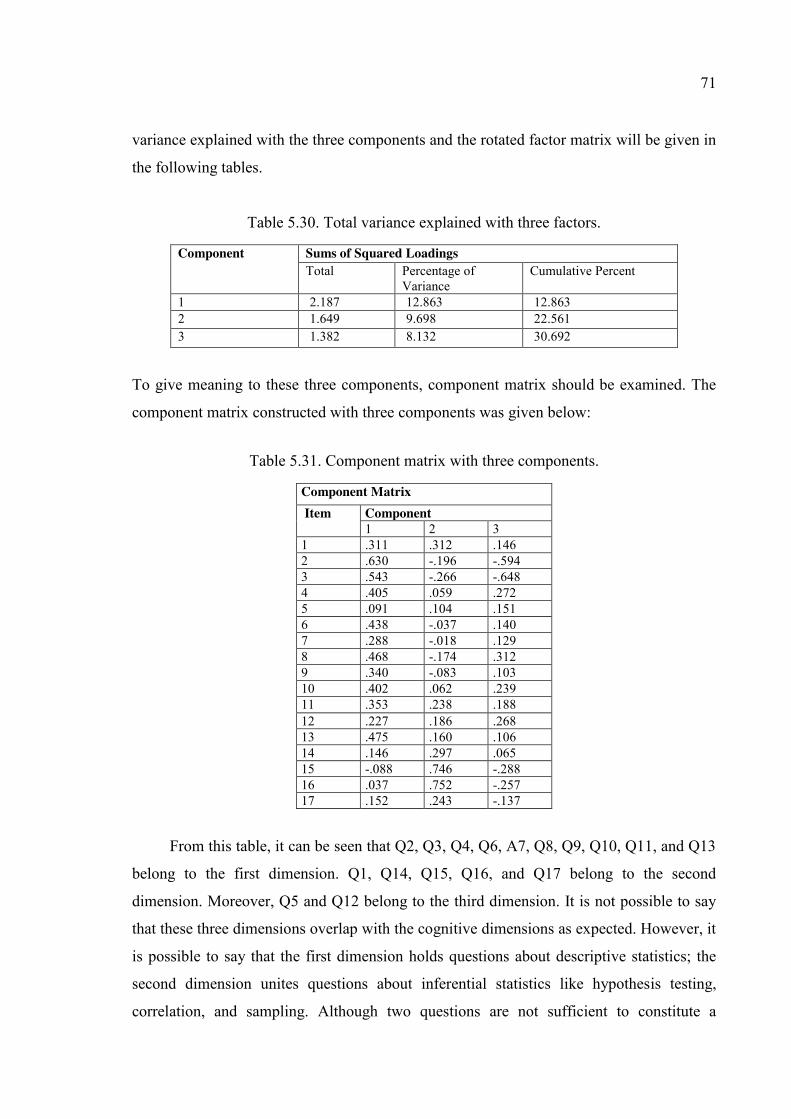
71
variance explained with the three components and the rotated factor matrix will be given in
the following tables.
Table 5.30. Total variance explained with three factors.
Component Sums of Squared Loadings Total Percentage of
Variance Cumulative Percent
1 2.187 12.863 12.863 2 1.649 9.698 22.561 3 1.382 8.132 30.692
To give meaning to these three components, component matrix should be examined. The
component matrix constructed with three components was given below:
Table 5.31. Component matrix with three components.
Component Matrix Item Component
1 2 3 1 .311 .312 .146 2 .630 -.196 -.594 3 .543 -.266 -.648 4 .405 .059 .272 5 .091 .104 .151 6 .438 -.037 .140 7 .288 -.018 .129 8 .468 -.174 .312 9 .340 -.083 .103 10 .402 .062 .239 11 .353 .238 .188 12 .227 .186 .268 13 .475 .160 .106 14 .146 .297 .065 15 -.088 .746 -.288 16 .037 .752 -.257 17 .152 .243 -.137
From this table, it can be seen that Q2, Q3, Q4, Q6, A7, Q8, Q9, Q10, Q11, and Q13
belong to the first dimension. Q1, Q14, Q15, Q16, and Q17 belong to the second
dimension. Moreover, Q5 and Q12 belong to the third dimension. It is not possible to say
that these three dimensions overlap with the cognitive dimensions as expected. However, it
is possible to say that the first dimension holds questions about descriptive statistics; the
second dimension unites questions about inferential statistics like hypothesis testing,
correlation, and sampling. Although two questions are not sufficient to constitute a
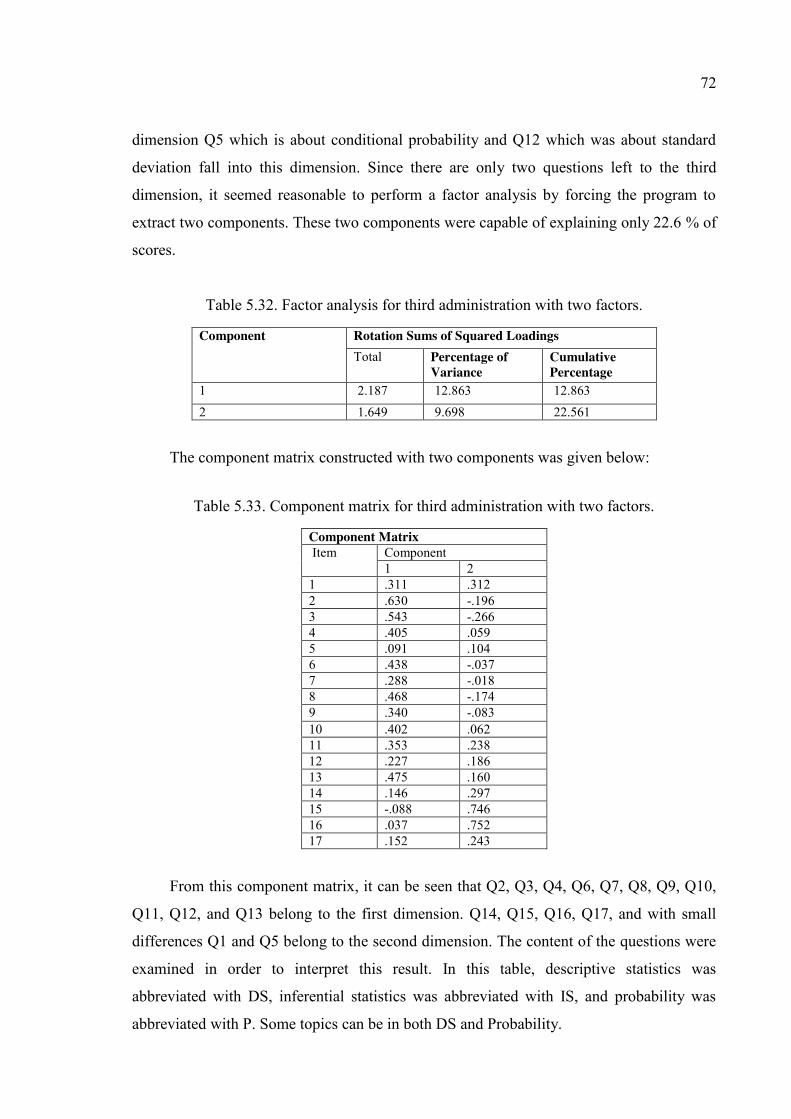
72
dimension Q5 which is about conditional probability and Q12 which was about standard
deviation fall into this dimension. Since there are only two questions left to the third
dimension, it seemed reasonable to perform a factor analysis by forcing the program to
extract two components. These two components were capable of explaining only 22.6 % of
scores.
Table 5.32. Factor analysis for third administration with two factors.
Component Rotation Sums of Squared Loadings Total Percentage of
Variance Cumulative Percentage
1 2.187 12.863 12.863 2 1.649 9.698 22.561
The component matrix constructed with two components was given below:
Table 5.33. Component matrix for third administration with two factors.
Component Matrix Item Component
1 2 1 .311 .312 2 .630 -.196 3 .543 -.266 4 .405 .059 5 .091 .104 6 .438 -.037 7 .288 -.018 8 .468 -.174 9 .340 -.083 10 .402 .062 11 .353 .238 12 .227 .186 13 .475 .160 14 .146 .297 15 -.088 .746 16 .037 .752 17 .152 .243
From this component matrix, it can be seen that Q2, Q3, Q4, Q6, Q7, Q8, Q9, Q10,
Q11, Q12, and Q13 belong to the first dimension. Q14, Q15, Q16, Q17, and with small
differences Q1 and Q5 belong to the second dimension. The content of the questions were
examined in order to interpret this result. In this table, descriptive statistics was
abbreviated with DS, inferential statistics was abbreviated with IS, and probability was
abbreviated with P. Some topics can be in both DS and Probability.
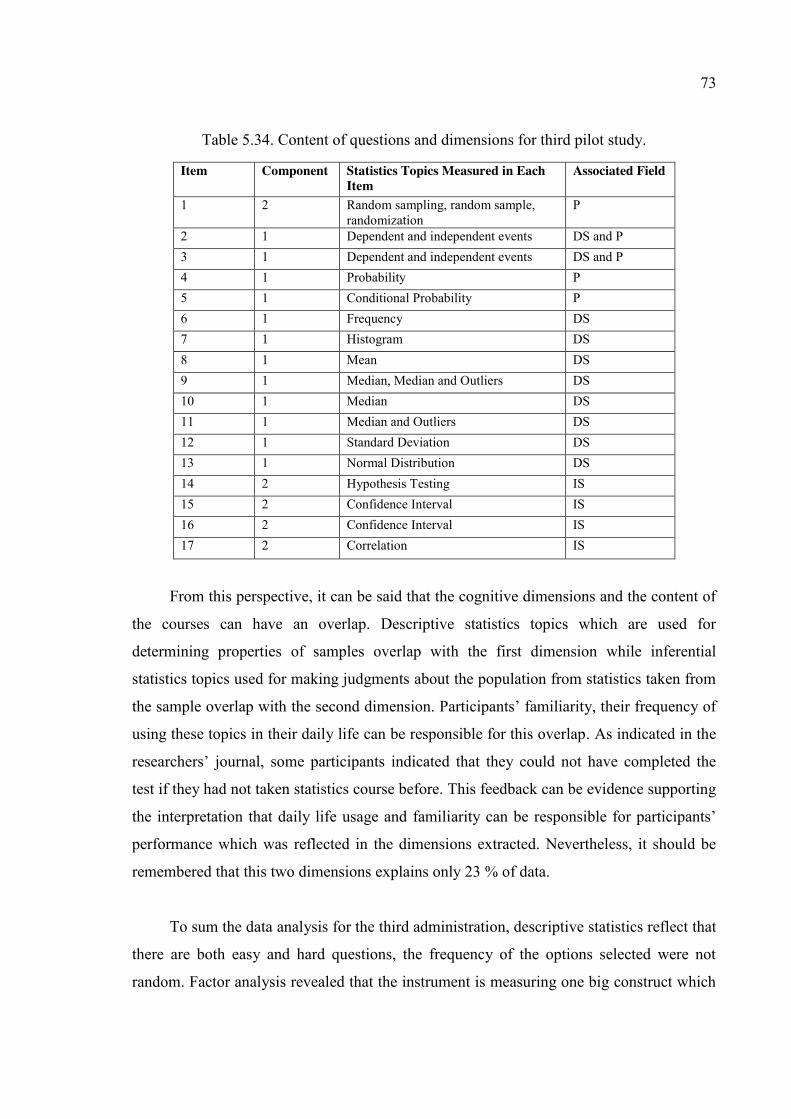
73
Table 5.34. Content of questions and dimensions for third pilot study.
Item Component Statistics Topics Measured in Each Item
Associated Field
1 2 Random sampling, random sample, randomization
P
2 1 Dependent and independent events DS and P 3 1 Dependent and independent events DS and P 4 1 Probability P 5 1 Conditional Probability P 6 1 Frequency DS 7 1 Histogram DS 8 1 Mean DS 9 1 Median, Median and Outliers DS 10 1 Median DS 11 1 Median and Outliers DS 12 1 Standard Deviation DS 13 1 Normal Distribution DS 14 2 Hypothesis Testing IS 15 2 Confidence Interval IS 16 2 Confidence Interval IS 17 2 Correlation IS
From this perspective, it can be said that the cognitive dimensions and the content of
the courses can have an overlap. Descriptive statistics topics which are used for
determining properties of samples overlap with the first dimension while inferential
statistics topics used for making judgments about the population from statistics taken from
the sample overlap with the second dimension. Participants’ familiarity, their frequency of
using these topics in their daily life can be responsible for this overlap. As indicated in the
researchers’ journal, some participants indicated that they could not have completed the
test if they had not taken statistics course before. This feedback can be evidence supporting
the interpretation that daily life usage and familiarity can be responsible for participants’
performance which was reflected in the dimensions extracted. Nevertheless, it should be
remembered that this two dimensions explains only 23 % of data.
To sum the data analysis for the third administration, descriptive statistics reflect that
there are both easy and hard questions, the frequency of the options selected were not
random. Factor analysis revealed that the instrument is measuring one big construct which
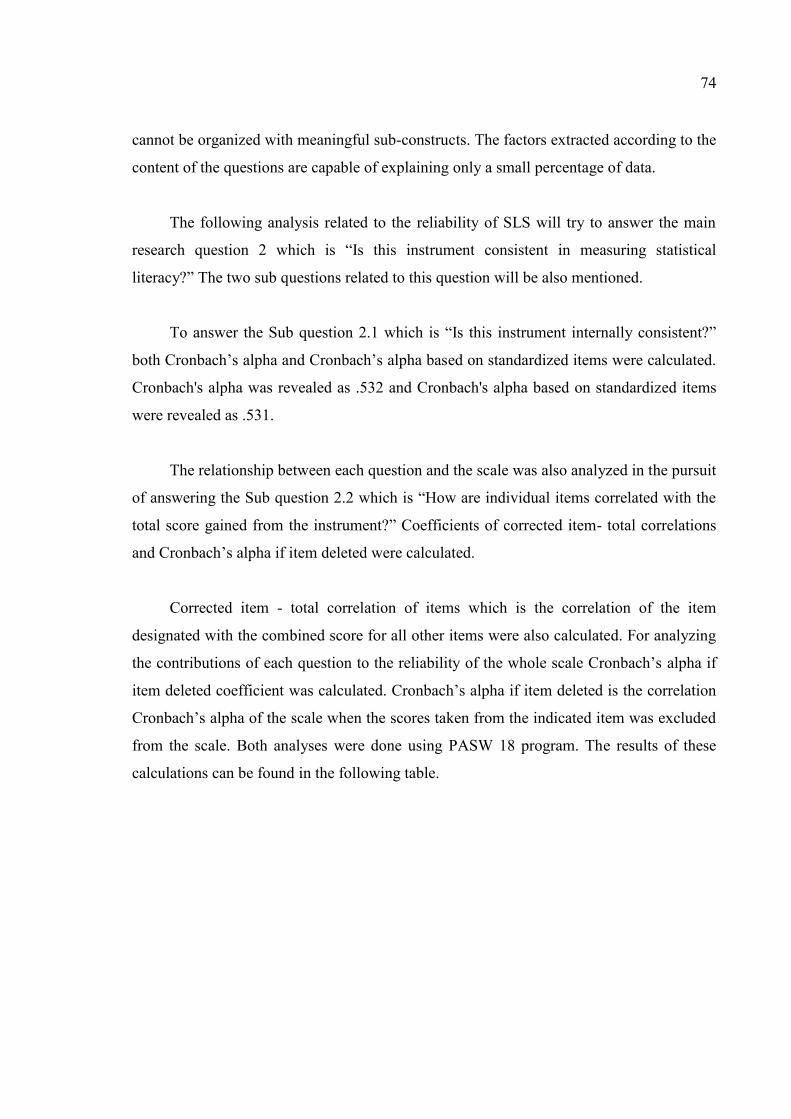
74
cannot be organized with meaningful sub-constructs. The factors extracted according to the
content of the questions are capable of explaining only a small percentage of data.
The following analysis related to the reliability of SLS will try to answer the main
research question 2 which is “Is this instrument consistent in measuring statistical
literacy?” The two sub questions related to this question will be also mentioned.
To answer the Sub question 2.1 which is “Is this instrument internally consistent?”
both Cronbach’s alpha and Cronbach’s alpha based on standardized items were calculated.
Cronbach's alpha was revealed as .532 and Cronbach's alpha based on standardized items
were revealed as .531.
The relationship between each question and the scale was also analyzed in the pursuit
of answering the Sub question 2.2 which is “How are individual items correlated with the
total score gained from the instrument?” Coefficients of corrected item- total correlations
and Cronbach’s alpha if item deleted were calculated.
Corrected item - total correlation of items which is the correlation of the item
designated with the combined score for all other items were also calculated. For analyzing
the contributions of each question to the reliability of the whole scale Cronbach’s alpha if
item deleted coefficient was calculated. Cronbach’s alpha if item deleted is the correlation
Cronbach’s alpha of the scale when the scores taken from the indicated item was excluded
from the scale. Both analyses were done using PASW 18 program. The results of these
calculations can be found in the following table.
75
Table 5.35. Corrected item- total correlations and Cronbach’s alpha if item deleted.
Item Corrected Item-Total Correlation
Cronbach's Alpha if Item Deleted
1 .211 .511 2 .300 .493 3 .215 .510 4 .213 .512 5 .068 .538 6 .200 .513 7 .147 .523 8 .211 .511 9 .162 .521 10 .229 .507 11 .217 .509 12 .143 .524 13 .290 .494 14 .132 .526 15 .074 .535 16 .146 .524 17 .109 .530
It is seen that Cronbach alpha if item deleted coefficient for Q5 is the highest and
Corrected item- total correlation is lowest among all questions. This means that Q5 did not
contribute to the reliability of the test in a positive way. The reason for this can be the
statistics topic this question is measuring. The question is asking for critical interpretation
of conditional probability and using a table as a stimulus. The reasons for participants’
lower performance will be discussed in the discussion part. In addition, it can be seen that
Q17 did not change the reliability of the scale in a remarkable way.
5.5. Phase 5 of the Study- Translation of the Instrument
5.5.1. Translation Method
The instrument was developed in English and administered to undergraduate students
in a specific public university in Istanbul in which the medium of instruction is English.
Students must pass an English proficiency exam in order to enroll courses. There is an
English preparatory class to prepare the proficiency exam, and there are Advanced English
courses to support students’ level of English. Students are expected to be capable of
76
reading, listening, writing, and speaking in English at levels that enable them do academic
studies.
There are few universities in Turkey in which the medium of instruction is English.
In order to make the instrument ready to use in other universities in Turkey, the instrument
was translated into Turkish. Since the instrument was developed in Turkey considering the
Turkish context, the translation of the instrument was seen sufficient to adapt the SLS.
Moreover, administrating the Turkish version of SLS to participants who also took English
version of SLS can be considered as a way to monitor the effect of language.
According to Hambleton ve Patsula (1999), there are two methods of translating an
instrument: forward translation and back translation. In forward translation, the instrument
is translated directly to the desired language whereas in back translation, the instrument is
translated to the desired language and then translated back to the original language. The
translators should be fluent in both languages, familiar with the context and the structure of
the test. Moreover, translators should look for any significant differences between the
original and the translated versions of the test and make necessary changes. For this study,
forward translation method was followed.
5.5.2. Translation of the Instrument
During the translation process, the researcher worked as the primary translator. Other
than the researcher, two more translators were recruited in the translation period. The
researcher, or the primary translator, translated the instrument. A mot à mot (word by
word) translation was done. Taking the Turkish context, the length, the frequency, and the
usage of the words into account some minor changes was done in the translation. An
example of this can be translating “chocolate chips cookies” as “cips” instead of “çikolata
parçacıklı kurabiye”, “rush” as “kızarıklık” instead of “kurdeşen, ağır kaşıntı”, and
“herbicide” as “zehirli ot” instead of “zararlı bitkileri yok eden ilaç” which are similar in
meaning and more frequent in use than the dictionary translation. For translations of
statistical terms, International Statistical Institute (ISI) glossary of statistical terms (ISI,
2012) was used.
77
Other translators were also recruited during this phase. One of the translators has a
Bachelor of Science degree in Computer Engineering and is working as a translator for
three years. Because this translator has a background in a quantitative major and taken
statistics or probability courses previously, she can be considered as competent in
understanding the content and the nature of the SLS. Another translator is a doctoral
student from Foreign Language Education Department who also works as a freelance
translator. Since this translator took courses on research methods and analysis during her
education, she can be considered as capable of understanding the content of the SLS. These
two translators were given the original English form of the scale and the researcher’s first
translation and asked for their interpretation and translations individually. The link to ISI’s
glossary of statistical terms was also shared with these translators.
The two translators made comments on the existing translation, suggested changes,
and supplied their own translation when necessary. Their comments and alternative
translations were collected and accepted or rejected according to the context by the
researcher. Among different suggestions of translations, the ones that are similar to the
daily usage and statistically correct were tried to be chosen. The researcher rewrote some
translations and formatted the document similar to the original test. Then, this form of the
test was sent to three scholars for evaluation.
5.5.3. Evaluation of translations
Three scholars helped in evaluating the translation. All of the scholars were native
speakers of Turkish and fluent in English. One of the scholars was a professor from
Operations Research Statistics in Industrial Engineering Department. He evaluated the
translation in terms of language and statistical correctness of expressions. Another scholar
was a doctoral student in mathematics education who also did similar tasks with CAOS
questions for her thesis study. She analyzed the translation in terms of language and
expressions that participants can have difficulty in understanding, or can find confusing.
Finally, the last scholar, a master student from Turkish Language and Literature
department who has a Bachelor of Arts degree in both Turkish Language and Literature
and English Language and Literature analyzed the usage of language in the Turkish scale
referring to the English version of the scale when necessary. Some of her suggestions were
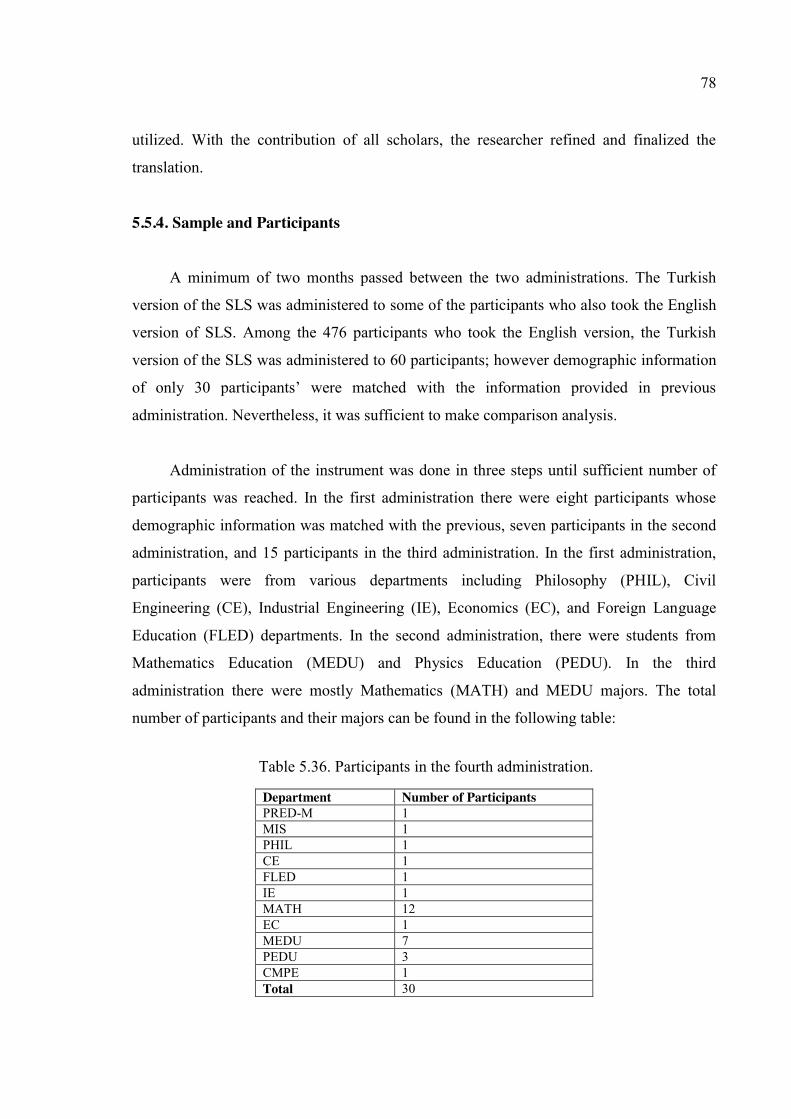
78
utilized. With the contribution of all scholars, the researcher refined and finalized the
translation.
5.5.4. Sample and Participants
A minimum of two months passed between the two administrations. The Turkish
version of the SLS was administered to some of the participants who also took the English
version of SLS. Among the 476 participants who took the English version, the Turkish
version of the SLS was administered to 60 participants; however demographic information
of only 30 participants’ were matched with the information provided in previous
administration. Nevertheless, it was sufficient to make comparison analysis.
Administration of the instrument was done in three steps until sufficient number of
participants was reached. In the first administration there were eight participants whose
demographic information was matched with the previous, seven participants in the second
administration, and 15 participants in the third administration. In the first administration,
participants were from various departments including Philosophy (PHIL), Civil
Engineering (CE), Industrial Engineering (IE), Economics (EC), and Foreign Language
Education (FLED) departments. In the second administration, there were students from
Mathematics Education (MEDU) and Physics Education (PEDU). In the third
administration there were mostly Mathematics (MATH) and MEDU majors. The total
number of participants and their majors can be found in the following table:
Table 5.36. Participants in the fourth administration.
Department Number of Participants PRED-M 1 MIS 1 PHIL 1 CE 1 FLED 1 IE 1 MATH 12 EC 1 MEDU 7 PEDU 3 CMPE 1 Total 30
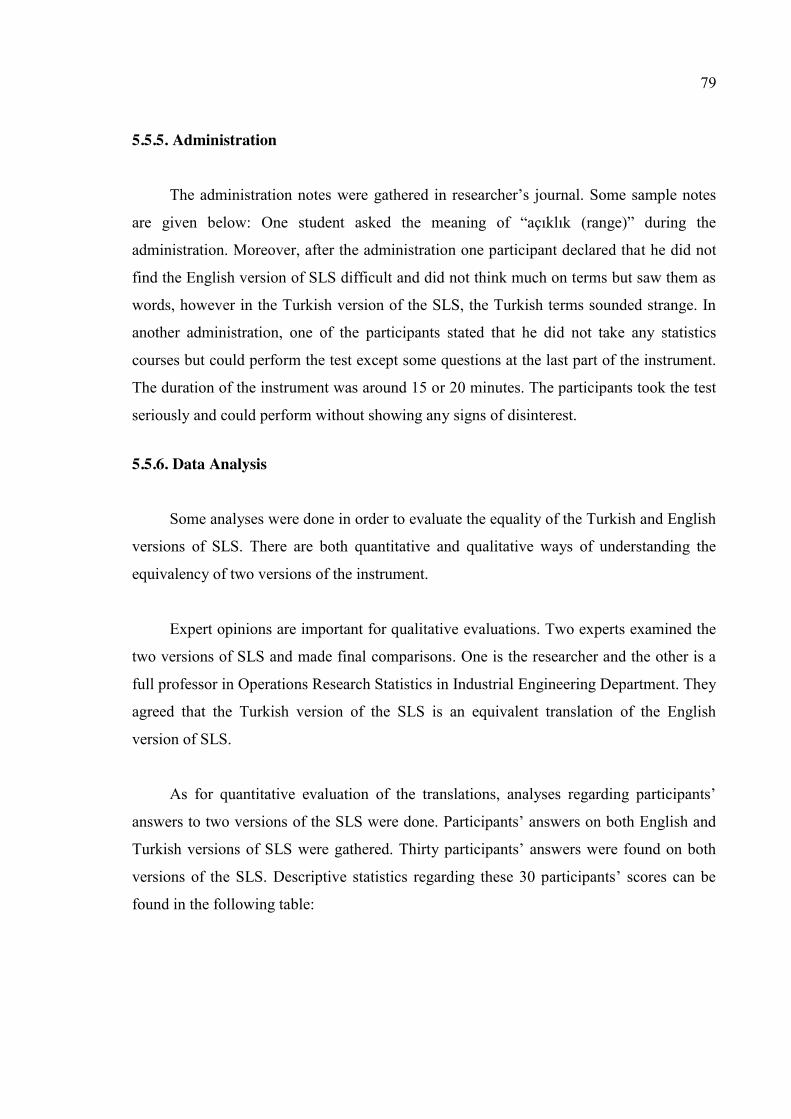
79
5.5.5. Administration
The administration notes were gathered in researcher’s journal. Some sample notes
are given below: One student asked the meaning of “açıklık (range)” during the
administration. Moreover, after the administration one participant declared that he did not
find the English version of SLS difficult and did not think much on terms but saw them as
words, however in the Turkish version of the SLS, the Turkish terms sounded strange. In
another administration, one of the participants stated that he did not take any statistics
courses but could perform the test except some questions at the last part of the instrument.
The duration of the instrument was around 15 or 20 minutes. The participants took the test
seriously and could perform without showing any signs of disinterest.
5.5.6. Data Analysis
Some analyses were done in order to evaluate the equality of the Turkish and English
versions of SLS. There are both quantitative and qualitative ways of understanding the
equivalency of two versions of the instrument.
Expert opinions are important for qualitative evaluations. Two experts examined the
two versions of SLS and made final comparisons. One is the researcher and the other is a
full professor in Operations Research Statistics in Industrial Engineering Department. They
agreed that the Turkish version of the SLS is an equivalent translation of the English
version of SLS.
As for quantitative evaluation of the translations, analyses regarding participants’
answers to two versions of the SLS were done. Participants’ answers on both English and
Turkish versions of SLS were gathered. Thirty participants’ answers were found on both
versions of the SLS. Descriptive statistics regarding these 30 participants’ scores can be
found in the following table:
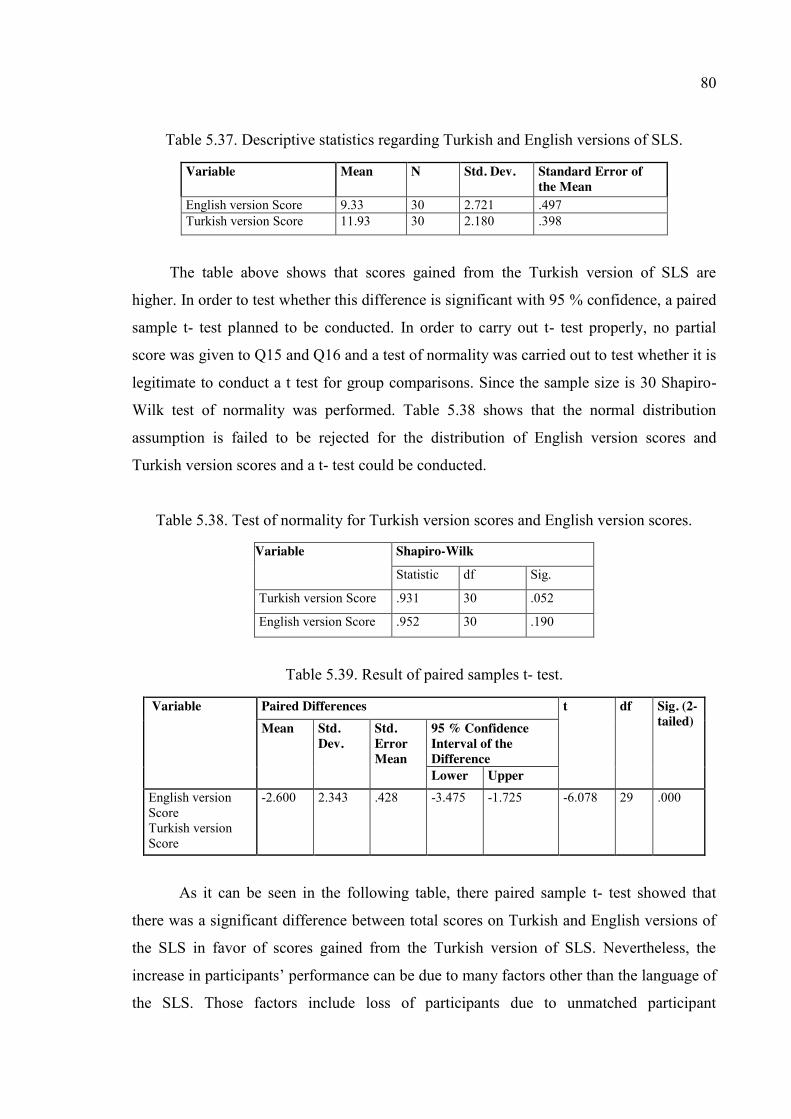
80
Table 5.37. Descriptive statistics regarding Turkish and English versions of SLS.
Variable Mean N Std. Dev. Standard Error of the Mean
English version Score 9.33 30 2.721 .497 Turkish version Score 11.93 30 2.180 .398
The table above shows that scores gained from the Turkish version of SLS are
higher. In order to test whether this difference is significant with 95 % confidence, a paired
sample t- test planned to be conducted. In order to carry out t- test properly, no partial
score was given to Q15 and Q16 and a test of normality was carried out to test whether it is
legitimate to conduct a t test for group comparisons. Since the sample size is 30 Shapiro-
Wilk test of normality was performed. Table 5.38 shows that the normal distribution
assumption is failed to be rejected for the distribution of English version scores and
Turkish version scores and a t- test could be conducted.
Table 5.38. Test of normality for Turkish version scores and English version scores.
Variable Shapiro-Wilk
Statistic df Sig.
Turkish version Score .931 30 .052
English version Score .952 30 .190
Table 5.39. Result of paired samples t- test.
Variable Paired Differences t df Sig. (2-tailed) Mean Std.
Dev. Std. Error Mean
95 % Confidence Interval of the Difference Lower Upper
English version Score Turkish version Score
-2.600 2.343 .428 -3.475 -1.725 -6.078 29 .000
As it can be seen in the following table, there paired sample t- test showed that
there was a significant difference between total scores on Turkish and English versions of
the SLS in favor of scores gained from the Turkish version of SLS. Nevertheless, the
increase in participants’ performance can be due to many factors other than the language of
the SLS. Those factors include loss of participants due to unmatched participant
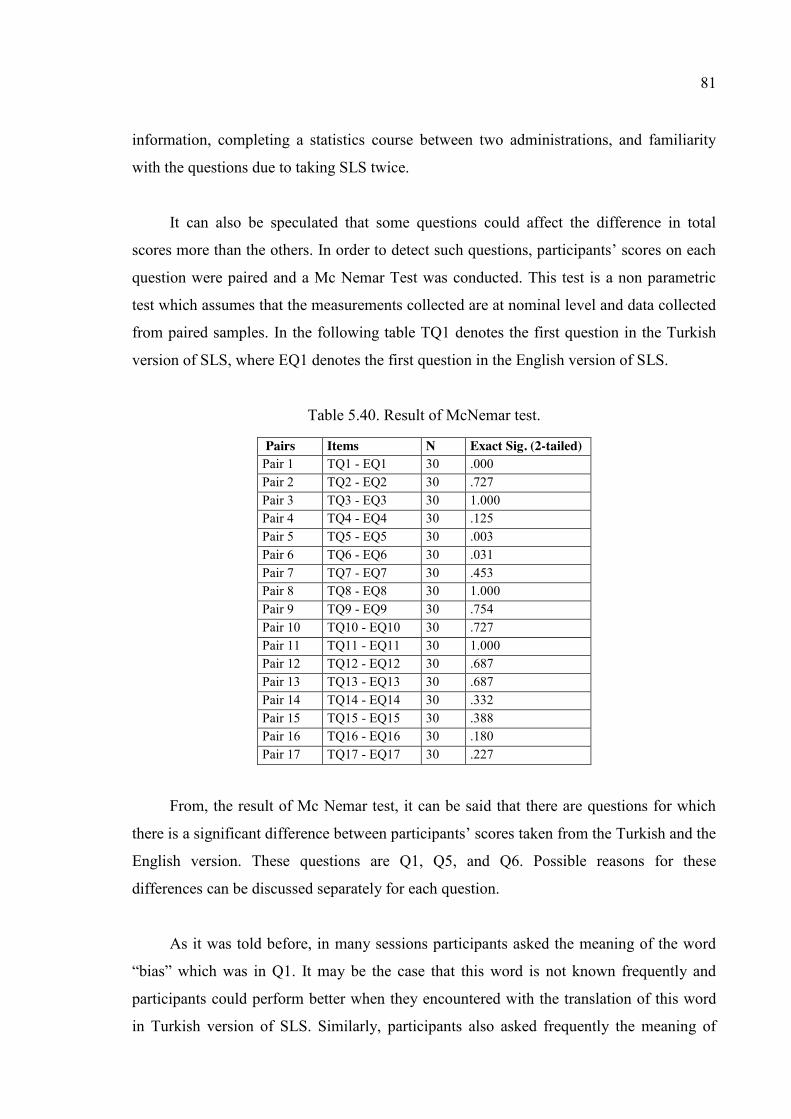
81
information, completing a statistics course between two administrations, and familiarity
with the questions due to taking SLS twice.
It can also be speculated that some questions could affect the difference in total
scores more than the others. In order to detect such questions, participants’ scores on each
question were paired and a Mc Nemar Test was conducted. This test is a non parametric
test which assumes that the measurements collected are at nominal level and data collected
from paired samples. In the following table TQ1 denotes the first question in the Turkish
version of SLS, where EQ1 denotes the first question in the English version of SLS.
Table 5.40. Result of McNemar test.
Pairs Items N Exact Sig. (2-tailed) Pair 1 TQ1 - EQ1 30 .000 Pair 2 TQ2 - EQ2 30 .727 Pair 3 TQ3 - EQ3 30 1.000 Pair 4 TQ4 - EQ4 30 .125 Pair 5 TQ5 - EQ5 30 .003 Pair 6 TQ6 - EQ6 30 .031 Pair 7 TQ7 - EQ7 30 .453 Pair 8 TQ8 - EQ8 30 1.000 Pair 9 TQ9 - EQ9 30 .754 Pair 10 TQ10 - EQ10 30 .727 Pair 11 TQ11 - EQ11 30 1.000 Pair 12 TQ12 - EQ12 30 .687 Pair 13 TQ13 - EQ13 30 .687 Pair 14 TQ14 - EQ14 30 .332 Pair 15 TQ15 - EQ15 30 .388 Pair 16 TQ16 - EQ16 30 .180 Pair 17 TQ17 - EQ17 30 .227
From, the result of Mc Nemar test, it can be said that there are questions for which
there is a significant difference between participants’ scores taken from the Turkish and the
English version. These questions are Q1, Q5, and Q6. Possible reasons for these
differences can be discussed separately for each question.
As it was told before, in many sessions participants asked the meaning of the word
“bias” which was in Q1. It may be the case that this word is not known frequently and
participants could perform better when they encountered with the translation of this word
in Turkish version of SLS. Similarly, participants also asked frequently the meaning of
82
rush which appears in the Q4. Their vocabulary may have affected their performance. In
Q5, some participants declared that they confused with options a and d in the English
version of SLS. These options included the expressions “a flutist who perform classical
music” and “a flutist among classical music players”. These expressions could sound
similar for a participant who did not think the situation in terms of sample and population.
However, in the Turkish version of SLS the difference between the options can be more
apparent for more participants. This could be a reason for difference in participants’
performance in Q5. Q6 is the shortest question in SLS, it includes no numbers or tables
which is easy to remember the question. This may be the reason for participants’
significantly increasing performance in this question.
Moreover, Pearson product moment correlation was performed in order to test
whether there is significant correlation between scores gained from Turkish and English
versions of SLS. Pearson correlation was found as .562 at .01 significance level. Moreover,
Spearman rho was founded as .637 at .01 significance level. These correlations can be
considered that there is respectively a moderate and moderately high, and significant
relationship between scores gained from the two versions of SLS.
5.6. Further Analysis
For the aim of searching for further evidences that can contribute to the argument
related to validity of SLS, further analysis was done. Participants’ information related to
their year of study, major, and GPA were collected in the demographic survey.
Participants’ statistical literacy scores were operationalized with the scores taken from SLS
in the third administration.
To start with, differences on participants’ scores on SLS will be examined when
participants were grouped according to their year of study at the university, related to the
Sub question 1.3 which is “Are there differences of statistical literacy scores between
groups of participants who had different years of study at the university?”
In addition to differences related to years of study at the university, differences
related to participants’ departments were examined. This section will try to answer the Sub
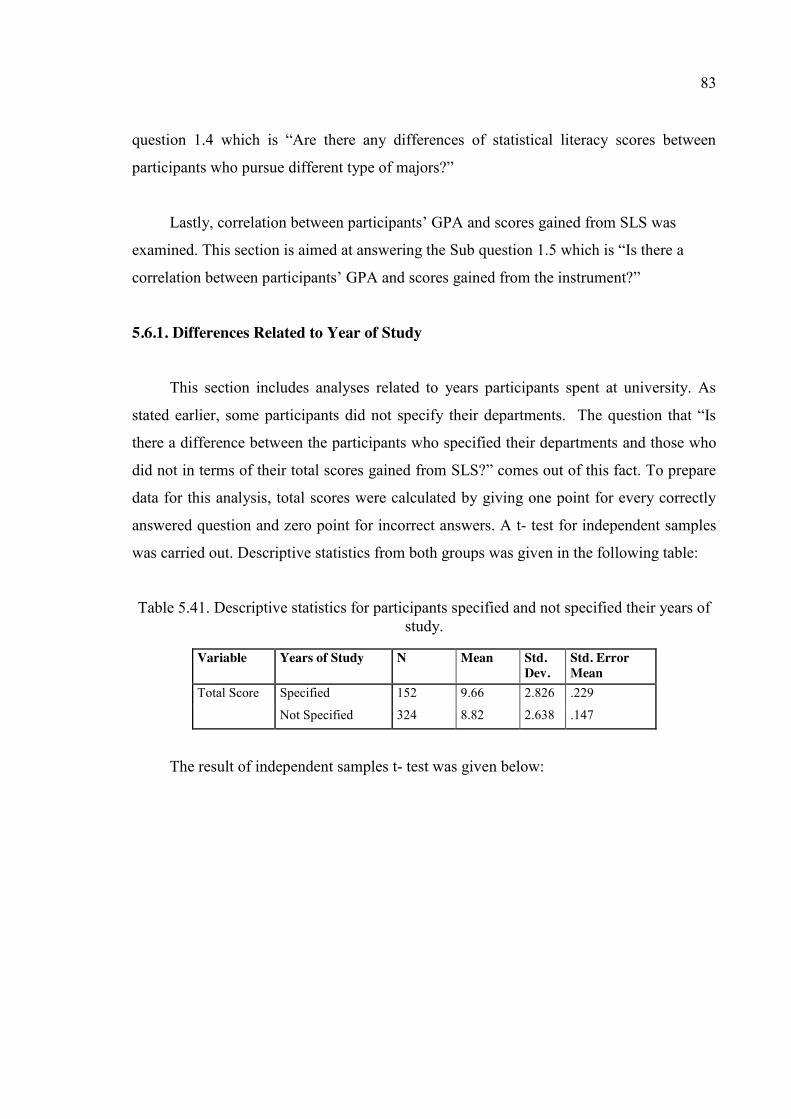
83
question 1.4 which is “Are there any differences of statistical literacy scores between
participants who pursue different type of majors?”
Lastly, correlation between participants’ GPA and scores gained from SLS was
examined. This section is aimed at answering the Sub question 1.5 which is “Is there a
correlation between participants’ GPA and scores gained from the instrument?”
5.6.1. Differences Related to Year of Study
This section includes analyses related to years participants spent at university. As
stated earlier, some participants did not specify their departments. The question that “Is
there a difference between the participants who specified their departments and those who
did not in terms of their total scores gained from SLS?” comes out of this fact. To prepare
data for this analysis, total scores were calculated by giving one point for every correctly
answered question and zero point for incorrect answers. A t- test for independent samples
was carried out. Descriptive statistics from both groups was given in the following table:
Table 5.41. Descriptive statistics for participants specified and not specified their years of study.
Variable Years of Study N Mean Std. Dev.
Std. Error Mean
Total Score Specified 152 9.66 2.826 .229
Not Specified 324 8.82 2.638 .147
The result of independent samples t- test was given below:
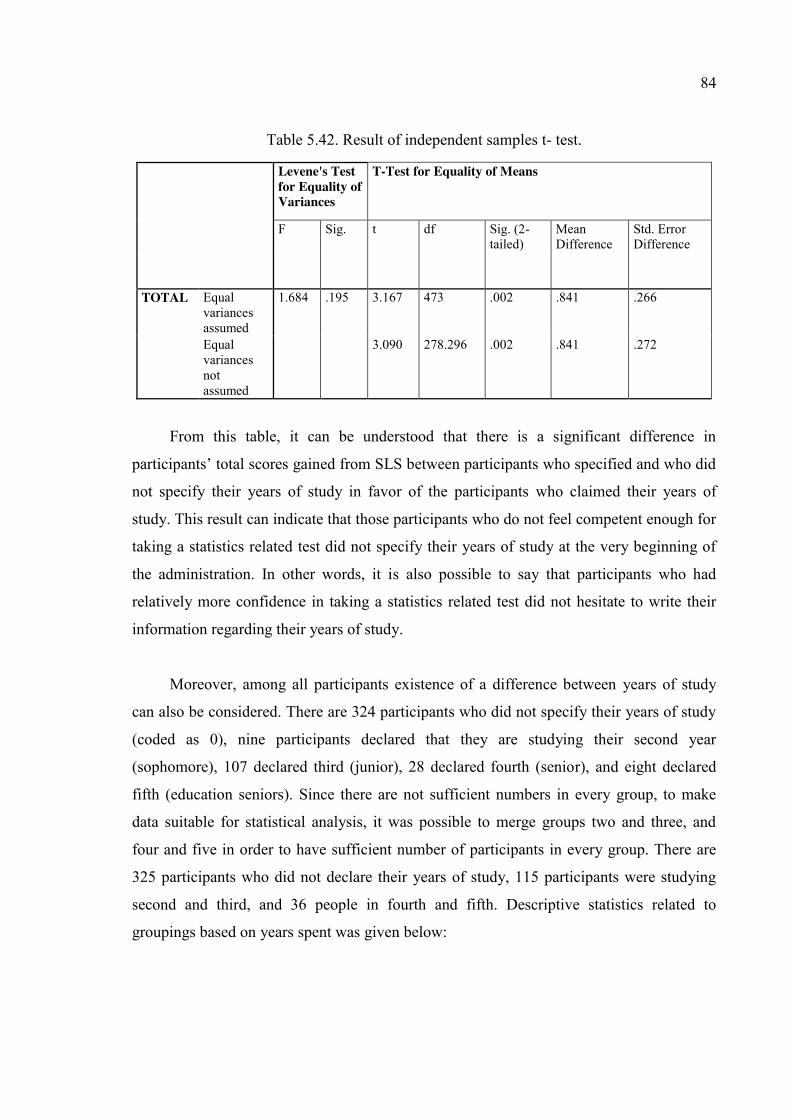
84
Table 5.42. Result of independent samples t- test.
Levene's Test for Equality of Variances
T-Test for Equality of Means
F Sig. t df Sig. (2-tailed)
Mean Difference
Std. Error Difference
TOTAL Equal variances assumed
1.684 .195 3.167 473 .002 .841 .266
Equal variances not assumed
3.090 278.296 .002 .841 .272
From this table, it can be understood that there is a significant difference in
participants’ total scores gained from SLS between participants who specified and who did
not specify their years of study in favor of the participants who claimed their years of
study. This result can indicate that those participants who do not feel competent enough for
taking a statistics related test did not specify their years of study at the very beginning of
the administration. In other words, it is also possible to say that participants who had
relatively more confidence in taking a statistics related test did not hesitate to write their
information regarding their years of study.
Moreover, among all participants existence of a difference between years of study
can also be considered. There are 324 participants who did not specify their years of study
(coded as 0), nine participants declared that they are studying their second year
(sophomore), 107 declared third (junior), 28 declared fourth (senior), and eight declared
fifth (education seniors). Since there are not sufficient numbers in every group, to make
data suitable for statistical analysis, it was possible to merge groups two and three, and
four and five in order to have sufficient number of participants in every group. There are
325 participants who did not declare their years of study, 115 participants were studying
second and third, and 36 people in fourth and fifth. Descriptive statistics related to
groupings based on years spent was given below:
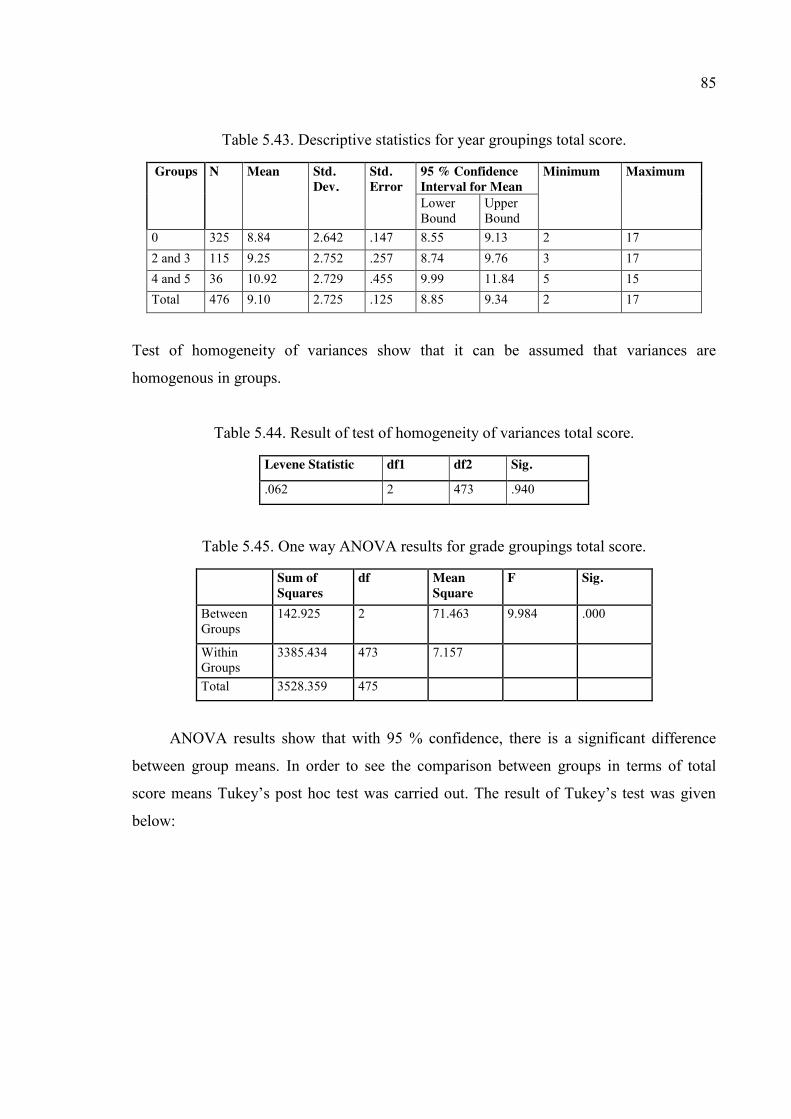
85
Table 5.43. Descriptive statistics for year groupings total score.
Groups N Mean Std. Dev.
Std. Error
95 % Confidence Interval for Mean
Minimum Maximum
Lower Bound
Upper Bound
0 325 8.84 2.642 .147 8.55 9.13 2 17 2 and 3 115 9.25 2.752 .257 8.74 9.76 3 17 4 and 5 36 10.92 2.729 .455 9.99 11.84 5 15 Total 476 9.10 2.725 .125 8.85 9.34 2 17
Test of homogeneity of variances show that it can be assumed that variances are
homogenous in groups.
Table 5.44. Result of test of homogeneity of variances total score.
Levene Statistic df1 df2 Sig.
.062 2 473 .940
Table 5.45. One way ANOVA results for grade groupings total score.
Sum of Squares
df Mean Square
F Sig.
Between Groups
142.925 2 71.463 9.984 .000
Within Groups
3385.434 473 7.157
Total 3528.359 475
ANOVA results show that with 95 % confidence, there is a significant difference
between group means. In order to see the comparison between groups in terms of total
score means Tukey’s post hoc test was carried out. The result of Tukey’s test was given
below:
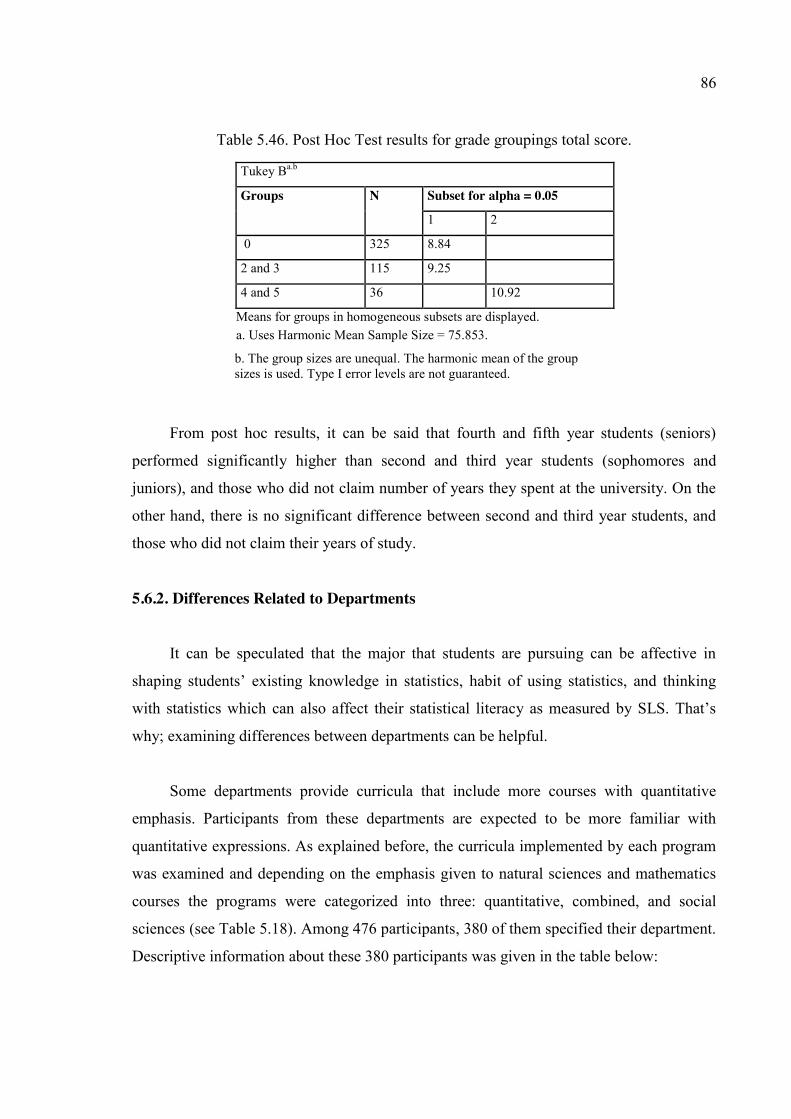
86
Table 5.46. Post Hoc Test results for grade groupings total score.
Tukey Ba.b
Groups N Subset for alpha = 0.05
1 2
0 325 8.84
2 and 3 115 9.25
4 and 5 36 10.92
Means for groups in homogeneous subsets are displayed. a. Uses Harmonic Mean Sample Size = 75.853.
b. The group sizes are unequal. The harmonic mean of the group sizes is used. Type I error levels are not guaranteed.
From post hoc results, it can be said that fourth and fifth year students (seniors)
performed significantly higher than second and third year students (sophomores and
juniors), and those who did not claim number of years they spent at the university. On the
other hand, there is no significant difference between second and third year students, and
those who did not claim their years of study.
5.6.2. Differences Related to Departments
It can be speculated that the major that students are pursuing can be affective in
shaping students’ existing knowledge in statistics, habit of using statistics, and thinking
with statistics which can also affect their statistical literacy as measured by SLS. That’s
why; examining differences between departments can be helpful.
Some departments provide curricula that include more courses with quantitative
emphasis. Participants from these departments are expected to be more familiar with
quantitative expressions. As explained before, the curricula implemented by each program
was examined and depending on the emphasis given to natural sciences and mathematics
courses the programs were categorized into three: quantitative, combined, and social
sciences (see Table 5.18). Among 476 participants, 380 of them specified their department.
Descriptive information about these 380 participants was given in the table below:
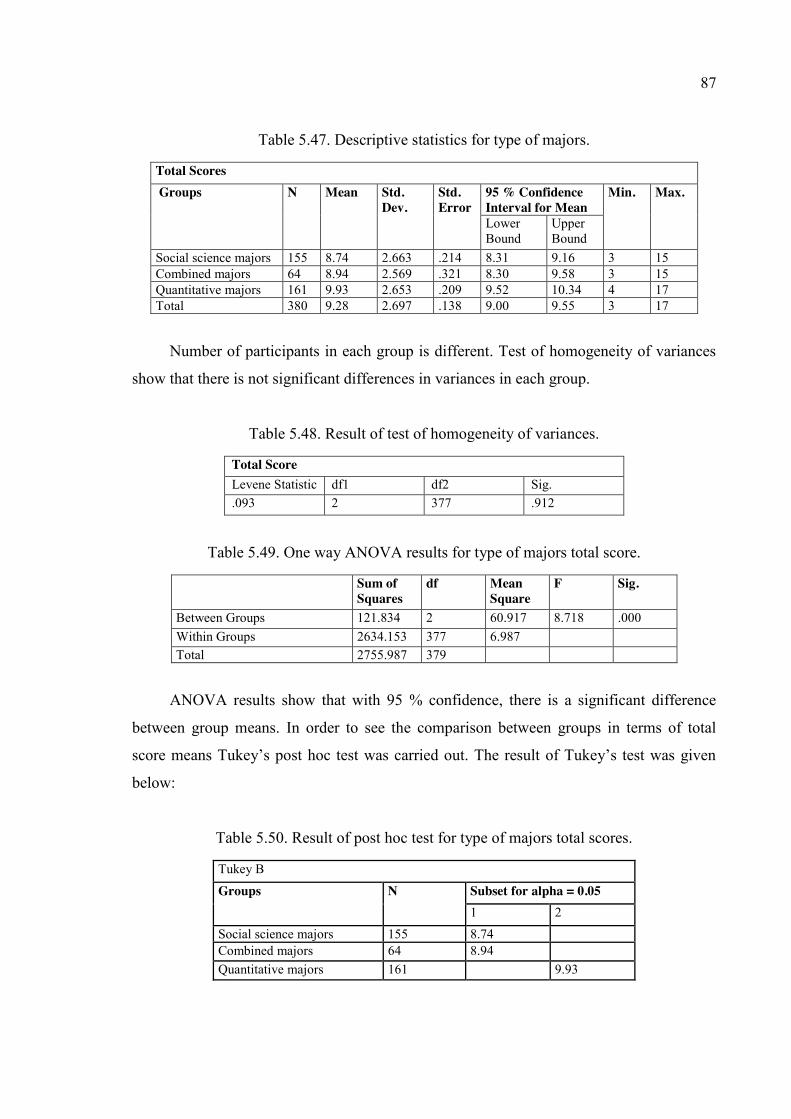
87
Table 5.47. Descriptive statistics for type of majors.
Total Scores Groups N Mean Std.
Dev. Std. Error
95 % Confidence Interval for Mean
Min. Max.
Lower Bound
Upper Bound
Social science majors 155 8.74 2.663 .214 8.31 9.16 3 15 Combined majors 64 8.94 2.569 .321 8.30 9.58 3 15 Quantitative majors 161 9.93 2.653 .209 9.52 10.34 4 17 Total 380 9.28 2.697 .138 9.00 9.55 3 17
Number of participants in each group is different. Test of homogeneity of variances
show that there is not significant differences in variances in each group.
Table 5.48. Result of test of homogeneity of variances.
Total Score Levene Statistic df1 df2 Sig. .093 2 377 .912
Table 5.49. One way ANOVA results for type of majors total score.
Sum of Squares
df Mean Square
F Sig.
Between Groups 121.834 2 60.917 8.718 .000 Within Groups 2634.153 377 6.987 Total 2755.987 379
ANOVA results show that with 95 % confidence, there is a significant difference
between group means. In order to see the comparison between groups in terms of total
score means Tukey’s post hoc test was carried out. The result of Tukey’s test was given
below:
Table 5.50. Result of post hoc test for type of majors total scores.
Tukey B
Groups N Subset for alpha = 0.05 1 2
Social science majors 155 8.74 Combined majors 64 8.94 Quantitative majors 161 9.93
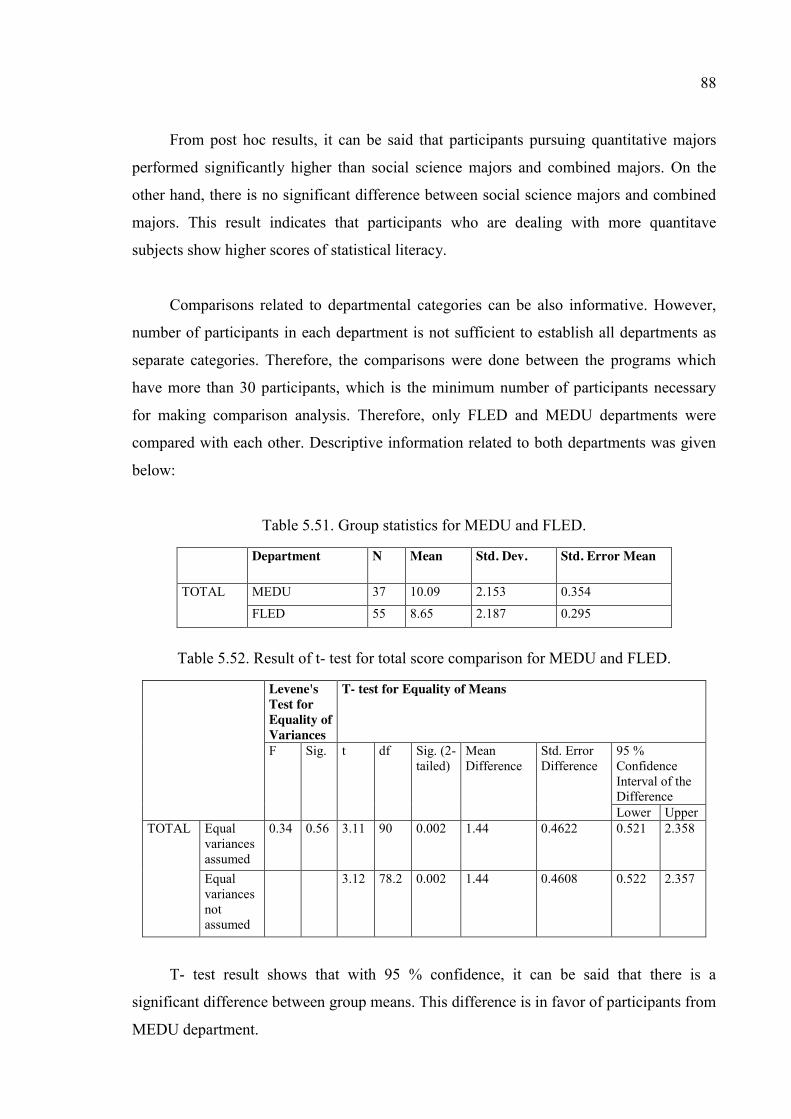
88
From post hoc results, it can be said that participants pursuing quantitative majors
performed significantly higher than social science majors and combined majors. On the
other hand, there is no significant difference between social science majors and combined
majors. This result indicates that participants who are dealing with more quantitave
subjects show higher scores of statistical literacy.
Comparisons related to departmental categories can be also informative. However,
number of participants in each department is not sufficient to establish all departments as
separate categories. Therefore, the comparisons were done between the programs which
have more than 30 participants, which is the minimum number of participants necessary
for making comparison analysis. Therefore, only FLED and MEDU departments were
compared with each other. Descriptive information related to both departments was given
below:
Table 5.51. Group statistics for MEDU and FLED.
Department N Mean Std. Dev. Std. Error Mean
TOTAL MEDU 37 10.09 2.153 0.354
FLED 55 8.65 2.187 0.295
Table 5.52. Result of t- test for total score comparison for MEDU and FLED.
Levene's Test for Equality of Variances
T- test for Equality of Means
F Sig. t df Sig. (2-tailed)
Mean Difference
Std. Error Difference
95 % Confidence Interval of the Difference Lower Upper
TOTAL Equal variances assumed
0.34 0.56 3.11 90 0.002 1.44 0.4622 0.521 2.358
Equal variances not assumed
3.12 78.2 0.002 1.44 0.4608 0.522 2.357
T- test result shows that with 95 % confidence, it can be said that there is a
significant difference between group means. This difference is in favor of participants from
MEDU department.
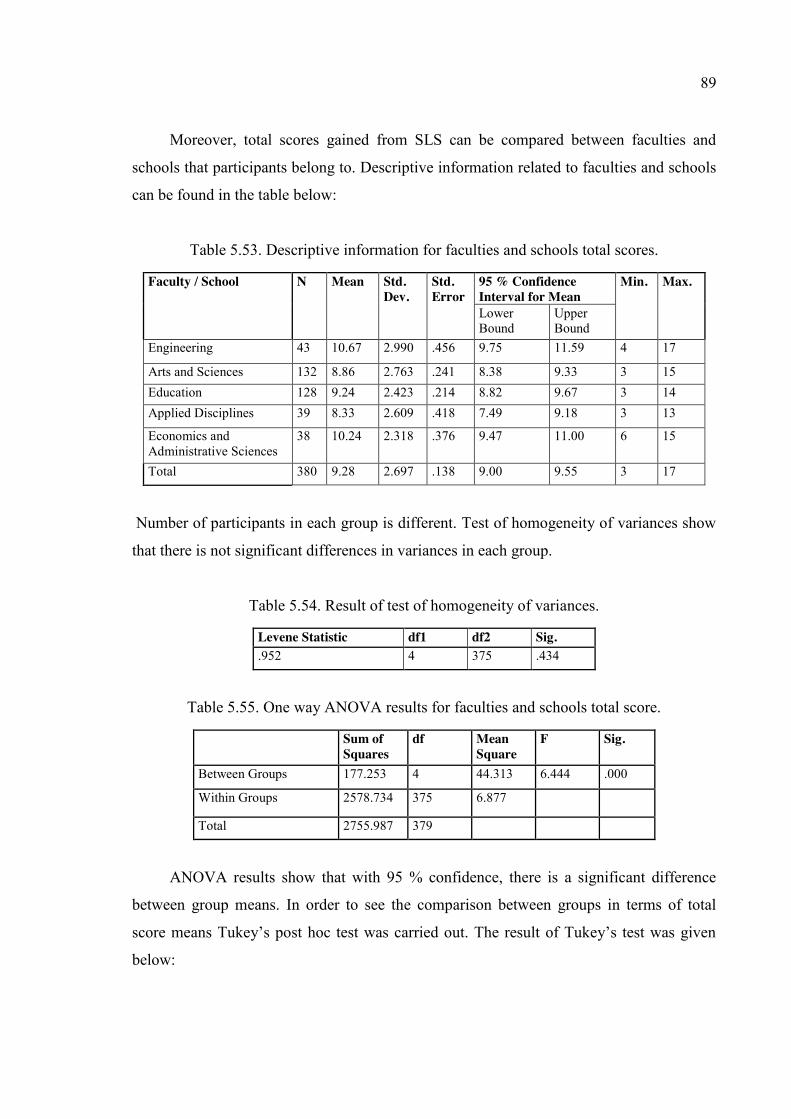
89
Moreover, total scores gained from SLS can be compared between faculties and
schools that participants belong to. Descriptive information related to faculties and schools
can be found in the table below:
Table 5.53. Descriptive information for faculties and schools total scores.
Faculty / School N Mean Std. Dev.
Std. Error
95 % Confidence Interval for Mean
Min. Max.
Lower Bound
Upper Bound
Engineering 43 10.67 2.990 .456 9.75 11.59 4 17
Arts and Sciences 132 8.86 2.763 .241 8.38 9.33 3 15 Education 128 9.24 2.423 .214 8.82 9.67 3 14 Applied Disciplines 39 8.33 2.609 .418 7.49 9.18 3 13
Economics and Administrative Sciences
38 10.24 2.318 .376 9.47 11.00 6 15
Total 380 9.28 2.697 .138 9.00 9.55 3 17
Number of participants in each group is different. Test of homogeneity of variances show
that there is not significant differences in variances in each group.
Table 5.54. Result of test of homogeneity of variances.
Levene Statistic df1 df2 Sig. .952 4 375 .434
Table 5.55. One way ANOVA results for faculties and schools total score.
Sum of Squares
df Mean Square
F Sig.
Between Groups 177.253 4 44.313 6.444 .000
Within Groups 2578.734 375 6.877
Total 2755.987 379
ANOVA results show that with 95 % confidence, there is a significant difference
between group means. In order to see the comparison between groups in terms of total
score means Tukey’s post hoc test was carried out. The result of Tukey’s test was given
below:
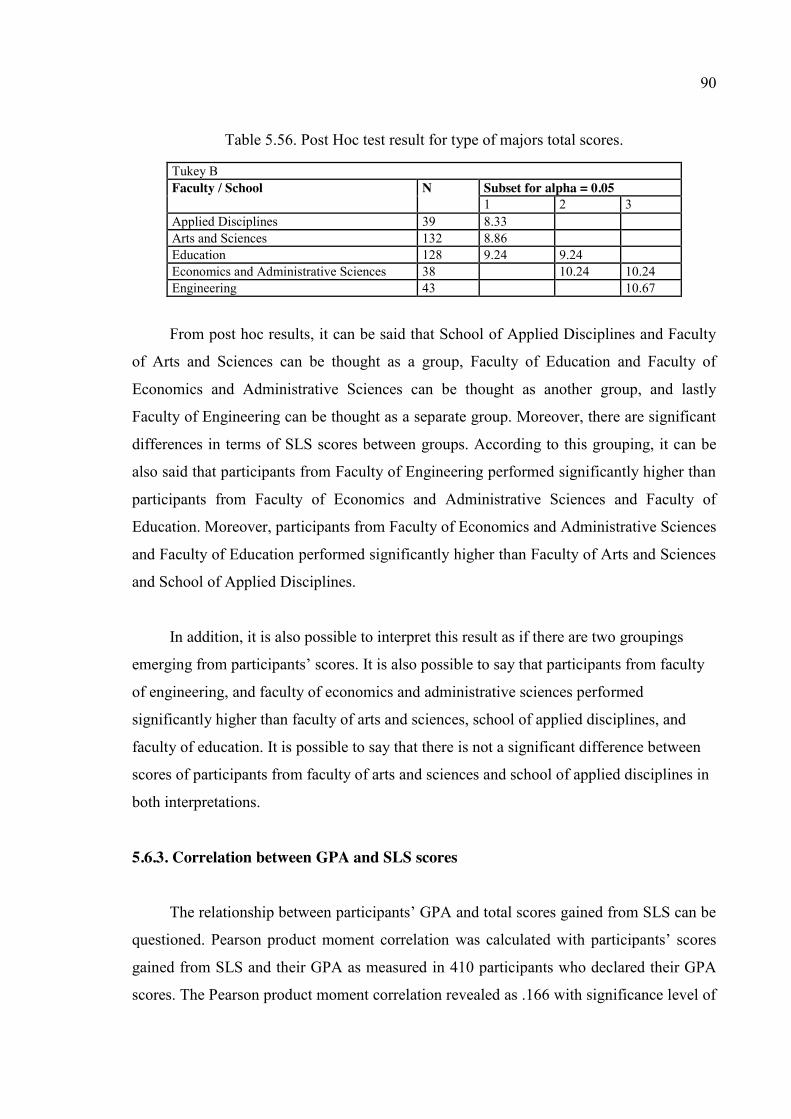
90
Table 5.56. Post Hoc test result for type of majors total scores.
Tukey B Faculty / School N Subset for alpha = 0.05
1 2 3 Applied Disciplines 39 8.33 Arts and Sciences 132 8.86 Education 128 9.24 9.24 Economics and Administrative Sciences 38 10.24 10.24 Engineering 43 10.67
From post hoc results, it can be said that School of Applied Disciplines and Faculty
of Arts and Sciences can be thought as a group, Faculty of Education and Faculty of
Economics and Administrative Sciences can be thought as another group, and lastly
Faculty of Engineering can be thought as a separate group. Moreover, there are significant
differences in terms of SLS scores between groups. According to this grouping, it can be
also said that participants from Faculty of Engineering performed significantly higher than
participants from Faculty of Economics and Administrative Sciences and Faculty of
Education. Moreover, participants from Faculty of Economics and Administrative Sciences
and Faculty of Education performed significantly higher than Faculty of Arts and Sciences
and School of Applied Disciplines.
In addition, it is also possible to interpret this result as if there are two groupings
emerging from participants’ scores. It is also possible to say that participants from faculty
of engineering, and faculty of economics and administrative sciences performed
significantly higher than faculty of arts and sciences, school of applied disciplines, and
faculty of education. It is possible to say that there is not a significant difference between
scores of participants from faculty of arts and sciences and school of applied disciplines in
both interpretations.
5.6.3. Correlation between GPA and SLS scores
The relationship between participants’ GPA and total scores gained from SLS can be
questioned. Pearson product moment correlation was calculated with participants’ scores
gained from SLS and their GPA as measured in 410 participants who declared their GPA
scores. The Pearson product moment correlation revealed as .166 with significance level of
91
.001. Hence, it can be said that although significant there is a weak correlation between
GPA and SLS total scores of participants.
92
6. RESULTS
6.1. Evidence on Validity
In this section, findings gathered throughout the development process of the
instrument will guide to infer about validity of the instrument. This section will try to
answer the following research questions:
Main research question 1: Is this instrument valid for measuring statistical literacy
for undergraduate students in a public university where the medium of instruction is
English?
Sub question 1.1: Is the content of the instrument valid for measuring statistical
literacy for undergraduate students in a public university where the medium of instruction
is English?
Sub question 1.2: Is this instrument valid for measuring statistical literacy construct
for undergraduate students in a public university where the medium of instruction is
English?
6.1.1. Confirming Evidence of Content Validity
Content validity refers the systematic examination of the test content to determine
whether it covers a representative sample of the behavior domain to be measured (Anastasi
and Urbina, 1997). To start with, the cognitive engagements necessary for being
statistically literate were clarified from the synthesis of literature. They constituted the
behavior domain of statistical literacy. The cognitive engagements were knowing,
interpretation, and critical interpretation. Knowing a definition of a statistics concept is not
a useful skill in everyday life, but a prerequisite for interpreting statistical information
encountered in everyday life, the weight of the instrument was given to interpretation and
critical interpretation. This way, it was believed that the focus of the instrument was
93
zoomed out technical knowledge but focused on everyday life skills by not taking technical
knowledge in the center of the study.
In addition to the cognitive levels, the statistics topics covered in the instrument are
also an important dimension for content validity. To clarify the statistics topics in the
instrument experts were recruited. Eleven scholars who taught statistics or research
methods courses at the university in which this study was done responded to Content
Rating Forms which was asking the necessity of statistics topics for helping undergraduate
students to be statistically literate. Their answers were used in clarifying the content of
SLS. Although some topics were eliminated from the content of SLS in revisions, it can be
seen that scholars did not agree upon the necessity of these topics, expert ratings were
partitioned to neither necessary nor unnecessary and essential categories. Moreover, all the
statistics that experts agreed to be necessary were seen as included in the final instrument.
The match and dispersion between statistics topics included in the scale and the
cognitive dimensions measured by the scale can be seen the test plan of SLS. The
distribution of questions to the cognitive dimensions can be seen in the Appendix E and the
intended measurement outcome for each question can be seen in Appendix F. These
evidences can constitute confirming evidence regarding the sub question 1.1, about having
content validity for this instrument.
In addition, the content covered in SLS is within the statistics topics covered in
related assessment studies (see Appendix A, Table A.1). It can be observed that topics
covered in SLS were within the range of the content covered in related assessment studies
except the topic of “frequency”. Frequency was not included in previous assessment
studies, adding the frequency topic to the range of statistics topics in an assessment study
can be thought as a contribution of this study.
Moreover, statistics topics in SLS can be seen within the range of the content
covered in statistical literacy instruction studies (Schield, 2003; Wilson, 1994) which can
be seen in Appendix A, Table A.3. In addition to the instruction studies, important
statistics as proposed by authors (see Appendix A, Table A.4.) can be a comparison for the
suitability of the content of SLS. For example, among the topics Scheaffer, Watkins, and
94
Landwehr (1998, as cited in Gal, 2004) suggested that the following aspects of statistics
were included in the SLS: interpreting tables and graphs, what constitutes a good sample,
summarizing key features with summary statistics, confidence intervals, and hypothesis
testing. Moreover, Garfield and Ben-Zvi (2005) suggested that topics about data,
distribution, association, samples and sampling, and inference. Among the ideas that Utts
(2003) suggested as necessary for every citizen the following ideas can be thought as
covered in SLS: when it can be concluded that a relationship is a cause and effect type of
relationship and when it is not, the difference between finding “no effect” or “no
difference” and statistical significance of the findings, common sources of bias that can
occur in surveys or experiments, confusion of statements with its inverse statements when
talking about conditional events, understanding of the idea that variability is natural and
“normal” is not the same as “average”. Lastly among Schield’s (1999) suggestions,
distinguishing statements of association from statements of causation, and interpreting
what a statistic means can be said to be included in SLS. As it can be compared with
Appendix D, the ratio of topics included in SLS within statistical ideas that were seen as
necessary by authors is high. Therefore, it can be said that SLS covers most of the
statistical ideas that were seen as necessary by authors. This can be thought as a support for
suitability of the content of SLS as a supporting the content validity of SLS.
6.1.2. Confirming Evidence of Construct Validity
Construct validity is an indispensable property of scales. There are two ways of
understanding construct validity. One way of seeing validity is as proposed by Cronbach
and Meehl in 1955. According to this understanding, construct validity is involved
whenever a test is to be interpreted as a measure of some attribute or quality. Moreover, the
possible validation procedures include correlation matrices and factor analysis and studies
of internal structure. Studies of internal structure propose that situations represented by the
specific items have the power to reflect general quality of the test.
Another understanding of construct validity was proposed by Messick (1989) as a
unified construct validity framework. According to him the definition of validity was
defined as (Messick, 1989):
95
“Validity is an integrated evaluative judgment of the degree to which empirical evidence and
theoretical rationales support the adequacy and appropriateness of inferences and actions based on test
scores and other modes of assessment. (p.13)”
According to Messick (1995), validity becomes a unified concept where the unifying
force is the meaningfulness or trustworthy interpretability of the test scores and their action
implications, which can be understood as the construct validity. Messick (1995) also
reveals that construct validity subsumes content relevance and representativeness because
such information about the range and limits of content coverage and about specific
criterion behaviors predicted by the test scores contributes to score interpretation.
Moreover, to ensure validity it is necessary to come up with a compelling argument that
the available evidence justifies the test interpretation and use. Hence, from this perspective
it can be deduced that evidences for content validity and other evidences contribute to the
construct validity.
Both perspectives of construct validity can be employed in analyzing construct
validity of SLS. From Cronbach and Meehl’s perspective, correlation matrices and factor
analysis were ways of examining construct validity. The factor analysis and related
correlation matrices revealed that the construct measured in SLS cannot be divided into
meaningful sub constructs. Even if the statistics topics were thought as the sub constructs
of SLS, it could explain only the 23 % of scores (see Table 5.33, Table 5.34, and Table
5.35).
In addition to quantitative evidences gathered from factor analysis and correlation
matrices qualitative evidences can also contribute to the exploration of construct of validity
of SLS. For this purpose, expert ideas on items that are collected by Item Rating Form can
be sources of examination of items. In Item Rating Form, experts were asked to voice their
opinion on whether each question measures the intended outcome. In this form, experts
were also asked whether each question should be included in the SLS. Only the questions,
which experts stated that the questions do measure the intended outcome were included in
the study. No item which experts suggested to be eliminated from the scale was included in
the SLS. Similarly, no item that experts agreed that should stay in the scale was eliminated
even after the revisions.
96
From another perspective of construct validity, Messick (1995) states that arguments
about the content, cognitive dimensions, test scores, and interpretation of test scores should
be given for assuring construct validity. Evidences of suitability of the content and
cognitive dimensions for measuring statistical literacy of undergraduate students were
stated under content validity. In addition to evidences supplied in content validity part,
participants’ reflections that were collected in researchers’ journal about the content of the
SLS can be another source of evidence.
For example, in the administration done in 16th of November, one participant stated
that “I exactly understood why we took statistics courses and learned statistics, the questions were related
with daily life, and [the test] was fun.”
Moreover, for some instances participants stated that they could not have completed
the test if they did not take statistics course before. These excerpts reveal that, SLS has
close relationship both with daily life experiences and statistics instruction.
The instances provided signal that scores gained from SLS are aligned with year of
study at university, dealing with quantitative information, and understanding statistics in
daily life. These instances can be counted as confirming evidences of validity. Since the
relationship between the content and items of the test, and the test itself, and the statistical
literacy construct can be claimed as a strong relationship, these also strengthen the
argument of construct validity of SLS.
6.1.3. Confirming Evidence of Curricular Validity
As supportive evidence for content related validity, curricular validity which is the
extent to which the content of the test matches the objectives of a specific curriculum can
be evaluated. The match between the content covered in statistics courses in a university
(see Appendix A, Table A.5) and high school (9-12) mathematics and research methods
curricula (see Appendix A, Table A.6) can be a way to examine curricular validity of SLS.
To start with, the match between the content covered in SLS and the common topics in
statistics course in a university as shown in Table 2.5 previously. From the table it was

97
shown that the following topics were mostly common in statistics courses offered by
different departments: Data representation, descriptive statistics, basic probability,
probability distributions, estimation, sampling, testing of hypothesis, hypothesis testing for
two population parameters, correlation, correlation analysis, and regression. Among these
common topics, the SLS can be claimed to cover all the topics except correlation analysis
and regression. Since the correlation analysis was not done in everyday life circumstances
and only interpretation of correlation was included in SLS, the exclusion of correlation
analysis from the content of SLS can be acceptable. Moreover, referring to Şahin’s (2011b)
study about pre-service teachers’ ideas on necessity of statistics topics for being
statistically literate, regression can be thought as peripheral to the university students’
everyday experiences. Therefore, it can be possible to state that excluding the topic
regression from SLS can be legitimate, and a great deal of the common topics in statistics
courses was included in SLS. Conversely, it can be also said that all the statistics content
covered in SLS were included in the common topics in statistics courses offered at
university. To sum, there is a significant match with the common statistics topics in
university statistics courses which ensures curricular validity for the university level
statistics curriculum.
To have an insight on participants’ background, statistics topics in mathematics and
related courses in grades 6-12 curricula were analyzed (see Appendix A, Table A.6). It can
be seen that the content of 6-12 mathematics curricula was included in the content of SLS
which cover the content measured in 12 of the 17 questions in SLS. The statistics topics
that were included in SLS but not included in the grades 6-12 mathematics curricula are
outliers, normal distribution, hypothesis testing, confidence intervals, and correlation.
Since participants’ knowledge on outliers were not directly checked using separate
questions but checked indirectly with questions asking the change in mean and median in
case of existence of outliers, it can be thought that participants can make educated guess
for outliers by using their knowledge in median and mean. It can also be stated that many
participants did not encounter normal distribution, hypothesis testing, confidence intervals,
and correlation during their high school years. These topics were covered in statistics
courses offered at university level. That’s why, it is reasonable that some participants
stated that they could not complete SLS, if they had not taken statistics course at the
university. Conversely, there is no topic that was not covered in any statistics or related
98
course. Therefore, it can be said that SLS is valid for statistics curricula covered in high
school and university.
6.1.4. Disconfirming Evidence of Validity
In addition to the confirming evidences related to validity, disconfirming evidences
should also be mentioned. The disconfirming evidences can be related to the language and
the content of SLS.
Some disconfirming evidences related to the language of SLS can be given. Some
participants requested the test to be in Turkish. Those participants were usually from
quantitative majors. As a more common reflection, in most administrations participants
asked the meaning of the words, “bias” and some asked “rush”. Some declared that
although they did not know the word itself, they could understand the meaning from the
context. To have a general understanding about the effect of the language of the scale, the
differences and correlations between Turkish and English versions of the scale will be
informative. The results of paired sample t- test showed that there was a significant
difference between total scores gained from English and Turkish versions of SLS in favor
of Turkish version. However, it is not possible to differentiate the effect of language of
SLS from other factors that may affect higher performance in the Turkish version of the
SLS. For example, taking the SLS twice, familiarity with the questions, and completing a
statistics course between the administrations of the two versions of SLS, losing some of the
participants because of not being able to match their student ID information supplied in
taking the two versions of SLS could have affected participants’ performance. All things
considered, it can be said that taking the Turkish version of SLS can be advantageous for
the participants’ performance.
Another issue about the validity of SLS can be related to the content of the scale.
Some participants declared that they found the test partially hard, especially last questions
in the instrument. As mentioned before, some of the participants also stated that they could
not complete the test, if they had not taken statistics course before. This can be due to
difference between taking or not taking any statistics course before and the content of the
statistics course if taken. In many departments at the university statistics related courses are
99
compulsory and some of the undergraduate statistics courses and their content were given
in the literature review part. However, as it was stated before, there are differences
between even the common content of the statistics courses depending on the departments
offering the courses. Therefore, it may be the case that some participants found the content
related to both their life and statistics courses they took, but some found that content of
some questions were related to the statistics courses they took but not to their life. That’s
why, it can be inferred that some topics in the test could be perceived as hard, only related
to statistics courses but not related to everyday experiences for participants from different
majors. Since there is variation between statistics courses and experiences of participants,
it was not possible to come up with a statistical literacy instrument that includes statistics
topics that are common for undergraduate students from all departments and is sufficient to
measure statistical literacy at the same time.
6.2. Evidence about Reliability
Cronbach and Meehl (1955) stated that internal consistency is an important aspect of
instruments and item-test correlations and certain reliability formulas are ways of obtaining
evidence related to internal consistency.
6.2.1. Confirming Evidence of Reliability
To be informed about the reliability of the instrument, Cronbach’s alpha coefficient
was calculated from the scores taken from each administration. It was seen that the
Cronbach’s alpha coefficient was seen increased between first and second administrations.
The reliability Cronbach alpha was calculated in .568 in the first administration and as .604
in the second administration. Moreover, for the second administration, Cronbach’s alpha
based on standardized items was revealed as .572. In the third administration, Cronbach's
alpha was revealed as .532 and Cronbach's alpha based on standardized items were
revealed as .531. According to Thorndike (2005), it is possible to appraise reliability
comparing with other available instrument serving the same function.
Moreover, it is seen that the difference in Cronbach’s alpha and Cronbach’s alpha
based on standardized items decreased and became insignificant through the third
100
administration. Since Cronbach’s alpha based on standardized items was used when the
scoring of the items are not equal, it can be thought that the scoring two items differently
may not have affected the reliability of the SLS in the third administration phase.
6.2.2. Disconfirming Evidence of Reliability
Although the Cronbach alpha coefficient for the third administration was sufficient, a
decrease in Cronbach alpha coefficient is seen between the second and third
administrations. The reason for the decrease in this reliability coefficient can be because of
having a more heterogeneous profile of participants in terms of having university students
from different programs as participants.
Moreover, Cronbach’s alpha based on standardized items is not high enough for
many of the items. From this information, it can be said that many items had significant
contributions to the reliability of SLS, but the contribution may not be aligned with other
items.
101
7. LIMITATIONS
7.1. Limitations about Participants
The selection of participants depended on the courses they were taking. The courses
were chosen depending on the year and department of the students taking the courses.
Permission to announce the study was taken from the instructor of the course. The purpose
of the study was explained to the students at the very beginning of the class time, and the
students who volunteered to take the scale participated in the study. Therefore, the
selection of the participants was not random. However, the number of the participants was
kept as large as possible to avoid any bias or effect of possible extraneous variables. The
sample size of the participants in administrations is even greater than the necessary sample
size (423 or alternatively 257) deduced after computations.
Another limitation about the participants is the general academic proficiency of
participants. The university chosen for conducting this study is a top-ranked university in
Turkey. The students of this university performed high on the nationwide university
entrance exams to be admitted to the university. Although participants were from different
departments, it can be said that they all had already proven their ability in understanding a
written text and test taking. When the instrument is to be delivered to students whose
capabilities in understanding written texts and test taking, this can be a limitation.
7.2. Limitations about the Content
The statistics content of the SLS was determined by compiling the content of similar
measurement studies from the literature, statistics courses in the particular university the
study was carried on, and ideas of experts who work in statistics or probability. Although
the statistics topics covered in similar studies in the literature is quite similar to each other,
the contents of the statistics course are not the same for all the courses from different
departments. Similarly, there is not unique and common statistics content among the
universities in the country. Scholars working in different fields from different universities
102
in the country can have different ideas on the statistics topics necessary for being
statistically literate undergraduate students. If different sample of experts were recruited,
the necessary topics for being statistically literate undergraduate students could be
modified.
Although there can be differences in experts’ ideas, no group of experts is solely
capable of exactly determining necessary statistics topics. The requirements of
understanding statistics in everyday life are affected from the necessities of the society and
related daily life experiences. Experts who responded SLCRF in this study were working at
the same university with the participants. This similarity can be thought as an advantage in
terms of knowing the necessity and capability of participants in terms of understanding
statistics in everyday life situations which is a central aim of statistical literacy. For further
studies done in different universities, although small, there can be variations in experts’
ideas on the suitability of set of necessary topics for being statistically literate.
103
8. DISCUSSIONS
Based on the limitations and the context of the study, reasons, interpretations and
implications of the results will be given in the discussion part. The discussions will be
analyzed as discussions related to participants, the content coverage, the questions used,
validity of SLS, and reliability of SLS.
8.1. Participants
Year of study of the participants were an important aspect of participant selection.
Second, third, fourth, and fifth year students were included in the study. Preparatory class
and first year students were excluded in this sampling since they may not be adapted to the
university environment and their statistical literacy levels may not be representative for an
average undergraduate student.
English level of participants is considered to be well enough to follow the courses in
English. Students need to pass the English proficiency exam to enroll the courses.
Therefore, participants are expected to be able to read and understand written English
materials in a proficient way. Nevertheless, it can be speculated that participants who are
pursuing in quantitatively concentrated majors focused on quantitative information in the
questions rather than the narrations within the questions. Similarly, participants who are
pursuing majors in social sciences or language related fields could focus on the narrations
but missed out the terminology. Comparisons done with MEDU and FLED students
showed that MEDU students performed higher than FLED students in the English version
of SLS, in spite of the assumption that FLED students have higher proficiency in English.
Such evidences can indicate that the requirement of language proficiency for answering
SLS does not dominate the statistical literacy requirement for performance of SLS.
104
8.2. Content of SLS
The statistics topics covered in SLCRF was mostly compiled from previous
instruments done about statistics education research. Scholars’ comments during the
formation of SLCRF suggested including the topic “frequency” to the form and it can be
seen that it is the first time that this topic was given place in an instrument about statistical
literacy.
Since statistical literacy was defined within everyday life context, it is necessary to
think the relatedness of the content of SLS with everyday life. As it was seen at the test
plan of SLS (see Appendix E), it can be said that most of the topics included in SLS can be
encountered in everyday life situations. Nevertheless, some topics included are not
frequently encountered in everyday life such as histograms, hypothesis testing, and
confidence intervals. It is observed that in the Turkish context, line charts and bar charts
are more frequently used than histograms in everyday life such as newspapers, and on
television broadcasts.
Morever, a study done by Şahin (2011b) can give insight to the relationship between
everyday life experiences of undergraduate students and the content of SLS. In that study,
Şahin asked the most necessary and least necessary statistics topics required for being
statistically literate undergraduate students to senior pre-service teachers in a public
university using the same SLCRF used in this study. The results of that study reveal that
the least necessary topics for being statistically literate according to senior year pre-service
teachers were listed as box plots, stem and leaf plots, outliers, extremes, quartiles,
modeling, regression, hypothesis testing, confidence intervals, confidence levels, and
margin of error. The case of pre-service teachers can be an example of the situation that
some statistics topics can be covered in the statistics courses but are not a part of their
everyday life experiences of undergraduate students. For example, Q15 in the third
administration was about “confidence intervals” which was not seen as a necessary topic
by participants. Moreover, the Cronbach alpha if item deleted coefficient was the highest
among all questions in SLS. It can be said that since confidence intervals do not seem to be
a part of everyday life experiences of undergraduate students, their performance on this
question may be relatively poorer than other questions in SLS. Likewise, there was
105
discrepancy between pre-service teachers’ and scholars’ ideas about the necessity of some
other topics for being statistically literate such as outliers, extremes, quartiles, hypothesis
testing, confidence intervals, confidence levels, and margin of error. Among them,
hypothesis testing and extremes were also included in SLS because answers of scholars
who responded SLCRF in this study indicated that these topics should be included in SLS.
It can be speculated that the conflict between undergraduate pre-service teachers and
university scholars in terms of the statistics topics required for statistical literacy in Şahin’s
(2011b) study can be due to scholars’ prescriptive attitude in responding SLCRF.
Prescribing for what should be in terms of statistical literacy capacity was not the central
aim for this study at the beginning of this study. However, it was seen that the high school
curricula for mathematics and research methods courses were insufficient for enhancing
statistical literacy for these grades and scholars who responded to SLCRF were motivated
to provide information about what undergraduate students should know about statistics and
probability. It turned out that the statistical literacy scale that is meant to be constructed for
this study should also have prescriptive property in addition to descriptive property.
In 2011, the national high school mathematics curriculum in Turkey was revised and
chapter on statistics was included in 11th grade rather than 10th grade as it was in the
curriculum established in 2005. New topics were added to the unit on statistics and
probability. These new topics are scatter plots, box plots, measures of central tendency
(minimum, maximum, mean, median, mod, range), measures of dispersion (standard
deviation), correlation, and z-scores (TMoE, 2011). Among these topics added to the topics
covered in previous curriculum, the topics minimum, maximum, mean, median, mod,
range, standard deviation, and correlation were seen necessary by the experts who
responded to SLCRF employed in this study and covered in SLS. This fact makes the
claim of the prescriptive property of SLS. Moreover, box plots were not seen as necessary
neither by experts nor students who responded to SLCRF. It is expected that since box
plots will be in students’ academic life, later studies using SLCRF can conclude that box
plots is a required topic for statistical literacy.
As a summary of evidences collected, it can be said that the SLS is both descriptive
and prescriptive in nature in terms of the content coverage for statistical literacy. Other
106
properties like validity and reliability of SLS should be evaluated by taking into account
prescriptive property.
8.3. Questions
The questions were multiple choice questions mostly compiled from other
instruments. Version of the questions in other instruments mostly had selected response
type of questions. The number of options in each question varied. Since participants were
accustomed to taking test, it was easier for them if there were three or less options for a
question. Therefore, the number of the options for each questions were tried to be kept at
maximum. Moreover, participants’ previous experiences in taking test having multiple
choice questions can make guessing the keyed responses possible for them without
knowing the correct answer. Hence, the number of options for each question was fixed not
to give any clue of the keyed response to participants.
Another possible discussion on the question can be about the type of the questions.
Select response type of questions were employed in the scale because this type of questions
were mostly used in previous instruments, it was practical to administer and score select
response type of questions especially for high number of participants. Hence, it can be said
that using select response, namely multiple choice items were helpful in making the
instrument more practical. The duration of the administrations was 15-20 minutes for 17
questions with the help of multiple choice questions. Some criticism of using multiple
choice questions can be about decreasing the gap between interpretation and critical
interpretation of statistical information giving in the question. Since possible
interpretations and criticisms of interpretations were given in the options, a participant can
select the keyed response for a question asking for interpretation by criticizing the
interpretations given hence critically interpreting the information. Nevertheless, using
multiple choice questions made it harder to classify the questions into interpretation and
critical interpretation categories.
Compiling questions from different studies was considered advantageous in many
cases. First of all, since the questions were tried out before, questions that may lead to
problems have already been eliminated. Such questions were not frequently encountered.
107
Moreover, previous measurement studies reported results of administration of questions
which made it possible for the researcher to identify questions working well while
preparing the instrument in the first phase of the study. In addition to monitoring the
quality of the questions, selecting among existing questions were advantageous in
developing an instrument that is tailored to the desired construct. Since a special definition
was used as the definition of statistical literacy for this study, questions that matched with
this definition were selected. Therefore, choosing among existing questions and writing
new questions when necessary was the strategy used in developing SLS. This way, it was
possible to select the questions that are most relevant to the Turkish context.
On the other hand, selecting questions from previous instruments was
disadvantageous in terms of language because there was no Turkish scale related to
statistical literacy, all previous instruments were in English. Since some important nuances
could be lost in translation, and participants were assumed to be proficient in English, it
was preferred to use the questions in English in developing SLS. Since in Turkey, there are
only few universities in which the medium of instruction is English, it was necessary to
translate the instrument into Turkish to increase usability of the instrument in Turkish
context SLS. Nevertheless, the instrument can be used in many other English speaking
countries by making minor changes for cultural suitability.
8.4. Validity of SLS
Validity of the SLS was one of the central aims of this study. Construct validity,
content validity, and curricular validity of SLS were examined.
Construct validity of SLS was explored from both Cronbach and Meehl’s and
Messick’s perspectives. From both perspectives, evidences show that SLS has construct
validity, content validity, and curricular validity for the undergraduate students in the given
public university.
The analyses were carried out using CTT. Item Response Theory (IRT, see Baker,
2001) could also be used. In making the decision of using CTT or IRT, the nature of the
construct was taken into account. At the initial preparation stage of SLS, it was foreseen
108
that there may be overlaps between statistical literacy, statistical reasoning, and statistical
thinking as it was proposed by delMas (2002). However, IRT assumes that the construct to
be measured should be uni-dimensional, i.e. consists of only one dimension. That’s why,
IRT was not used in exploring validity evidences for SLS. As it was calculated by factor
analysis, after the third administration SLS turned out to be an instrument measuring a
single dimension which is statistical literacy which paves the way for examining SLS using
IRT for making shorter, tailor made versions of SLS for different purposes.
8.5. Reliability of SLS
The reliability of SLS turned out to be moderate. As it was stated before, for
evaluating the reliability of an instrument, the reliability of existing instruments should be
considered. Since, there was no other instrument measuring statistical literacy for
undergraduate students in Turkey, the reliability of SLS can be suggested as acceptable.
The reliability of SLS could be affected from the participants’ language levels and
experience with statistics. The reliability of SLS when it is administered to groups whose
levels of statistics are different and who were given SLS in Turkish can be compared with
the reliability of SLS as reported in this study.
It can be also said that the prescriptive nature of SLS was reflected in the reliability
of the scale. For example, SLS covers content that may or may not have been covered in
statistics courses such as confidence intervals, which is not among the common statistics
topics covered in statistics courses in a public university as indicated Table 2.5. In addition
to the content, it can be said that statistical literacy is not among the aims of statistics
instruction. Therefore, participants answers can vary due to content coverage of the
statistics courses they took or how much attention was given to interpretation of statistical
information during the courses they took. Participants may not have given consistent
answers throughout responding to the scale which may affected the reliability of SLS.
109
9. FURTHER RESEARCH
Results gained from this study indicate possible suggestions for further research.
Measuring statistical literacy of undergraduate students was the aim of this study. The
instrument developed for this study is expected to pave the way to many research studies
about statistical literacy of undergraduate students.
First suggestion for further research can be administering the Turkish version of SLS
to larger groups of undergraduate students. By monitoring the properties of the scale like
validity, reliability, and practicality of the Turkish version of SLS will prepare the
instrument to be used effectively and efficiently with a larger sample of undergraduate
participants around Turkey.
Exploring for evidences of validity, such as criterion related validity can be possible
for further studies. For example, comparing participants’ scores from SLS with scores
taken from statistics achievement instruments can be informative about criterion related
validity of SLS. Moreover, it can be possible to monitor the effects of statistics instruction
to statistical literacy levels of students. Scores gained from statistics courses can be
compared with statistical literacy scores and the aims and effectiveness of statistics
instruction in enhancing statistical literacy of undergraduate students can be questioned in
detail.
Comparisons between statistical literacy performances of different groups can be
also done such as comparing graduate students and undergraduates. With such
comparisons, it can be possible to track the sort of experiences that can contribute to the
enhancement of statistical literacy.
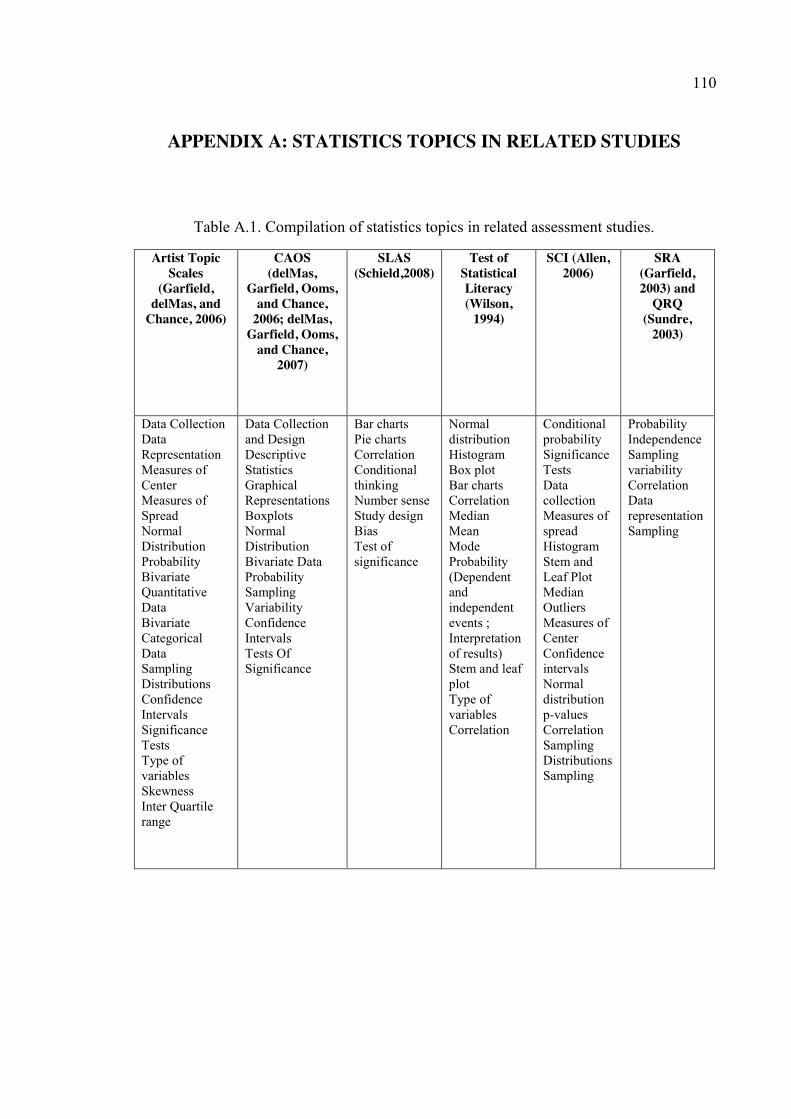
110
APPENDIX A: STATISTICS TOPICS IN RELATED STUDIES
Table A.1. Compilation of statistics topics in related assessment studies.
Artist Topic Scales
(Garfield, delMas, and
Chance, 2006)
CAOS (delMas,
Garfield, Ooms, and Chance,
2006; delMas, Garfield, Ooms,
and Chance, 2007)
SLAS (Schield,2008)
Test of Statistical Literacy (Wilson,
1994)
SCI (Allen, 2006)
SRA (Garfield, 2003) and
QRQ (Sundre,
2003)
Data Collection Data Representation Measures of Center Measures of Spread Normal Distribution Probability Bivariate Quantitative Data Bivariate Categorical Data Sampling Distributions Confidence Intervals Significance Tests Type of variables Skewness Inter Quartile range
Data Collection and Design Descriptive Statistics Graphical Representations Boxplots Normal Distribution Bivariate Data Probability Sampling Variability Confidence Intervals Tests Of Significance
Bar charts Pie charts Correlation Conditional thinking Number sense Study design Bias Test of significance
Normal distribution Histogram Box plot Bar charts Correlation Median Mean Mode Probability (Dependent and independent events ; Interpretation of results) Stem and leaf plot Type of variables Correlation
Conditional probability Significance Tests Data collection Measures of spread Histogram Stem and Leaf Plot Median Outliers Measures of Center Confidence intervals Normal distribution p-values Correlation Sampling Distributions Sampling
Probability Independence Sampling variability Correlation Data representation Sampling
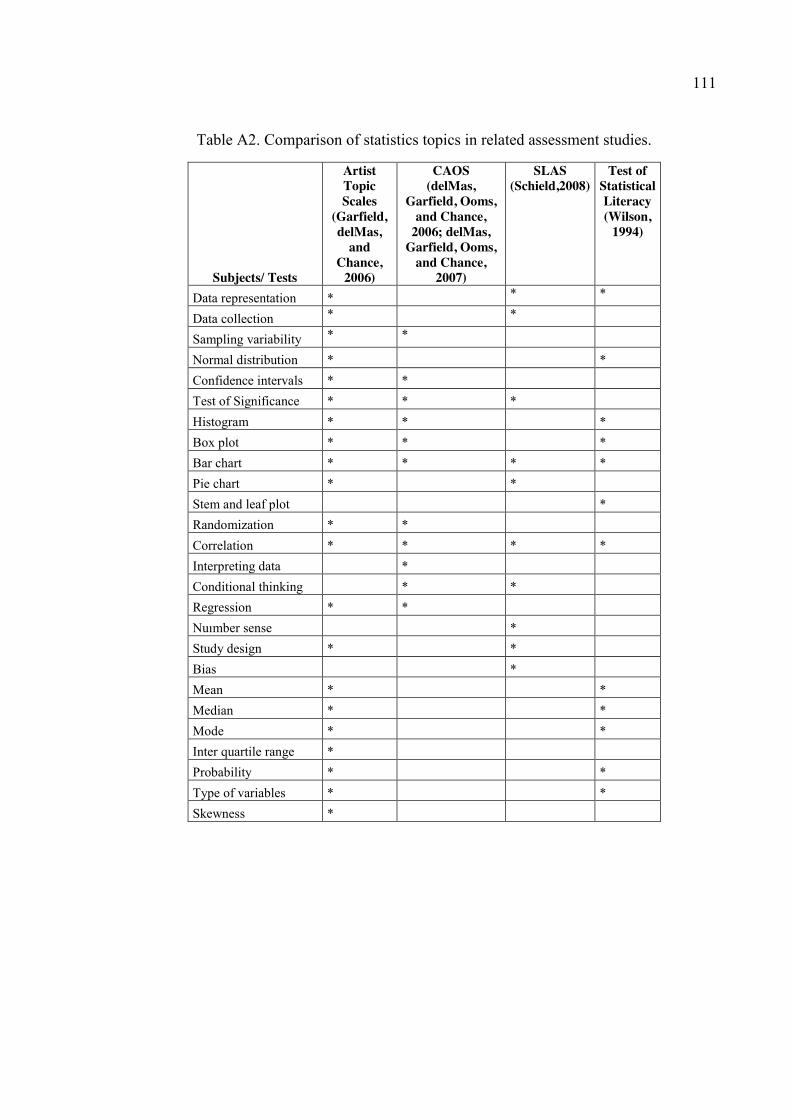
111
Table A2. Comparison of statistics topics in related assessment studies.
Subjects/ Tests
Artist Topic Scales
(Garfield, delMas,
and Chance,
2006)
CAOS (delMas,
Garfield, Ooms, and Chance,
2006; delMas, Garfield, Ooms,
and Chance, 2007)
SLAS (Schield,2008)
Test of Statistical Literacy (Wilson,
1994)
Data representation *
* *
Data collection * *
Sampling variability * *
Normal distribution *
* Confidence intervals * *
Test of Significance * * * Histogram * *
*
Box plot * *
* Bar chart * * * * Pie chart *
*
Stem and leaf plot
* Randomization * *
Correlation * * * * Interpreting data
*
Conditional thinking
* * Regression * *
Nuımber sense
* Study design *
*
Bias
* Mean *
*
Median *
* Mode *
*
Inter quartile range * Probability *
* Type of variables *
*
Skewness *
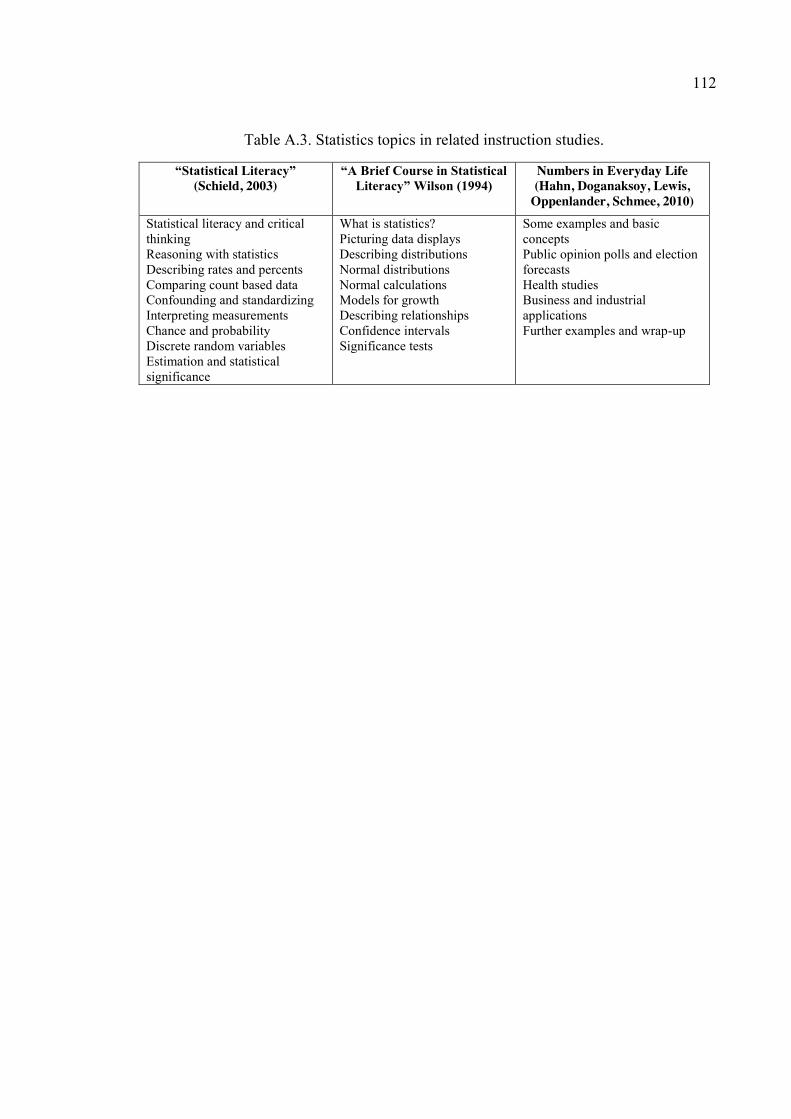
112
Table A.3. Statistics topics in related instruction studies.
“Statistical Literacy” (Schield, 2003)
“A Brief Course in Statistical Literacy” Wilson (1994)
Numbers in Everyday Life (Hahn, Doganaksoy, Lewis,
Oppenlander, Schmee, 2010) Statistical literacy and critical thinking Reasoning with statistics Describing rates and percents Comparing count based data Confounding and standardizing Interpreting measurements Chance and probability Discrete random variables Estimation and statistical significance
What is statistics? Picturing data displays Describing distributions Normal distributions Normal calculations Models for growth Describing relationships Confidence intervals Significance tests
Some examples and basic concepts Public opinion polls and election forecasts Health studies Business and industrial applications Further examples and wrap-up
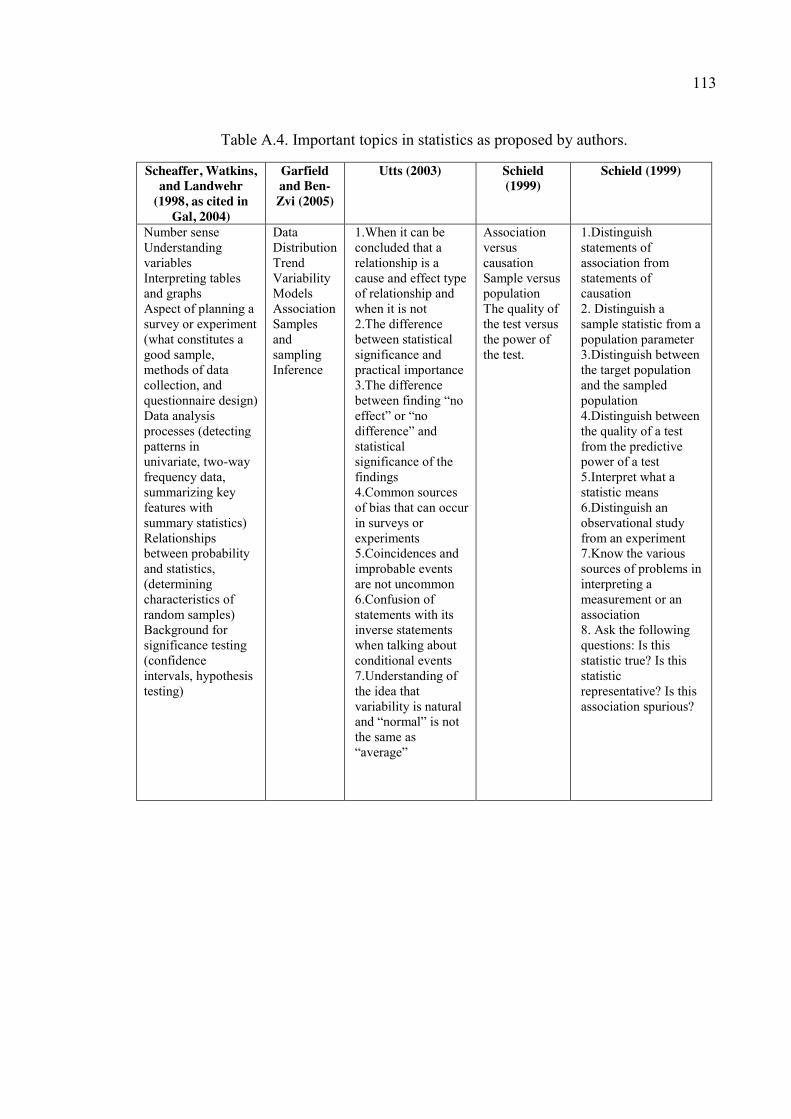
113
Table A.4. Important topics in statistics as proposed by authors.
Scheaffer, Watkins, and Landwehr
(1998, as cited in Gal, 2004)
Garfield and Ben-Zvi (2005)
Utts (2003) Schield (1999)
Schield (1999)
Number sense Understanding variables Interpreting tables and graphs Aspect of planning a survey or experiment (what constitutes a good sample, methods of data collection, and questionnaire design) Data analysis processes (detecting patterns in univariate, two-way frequency data, summarizing key features with summary statistics) Relationships between probability and statistics, (determining characteristics of random samples) Background for significance testing (confidence intervals, hypothesis testing)
Data Distribution Trend Variability Models Association Samples and sampling Inference
1.When it can be concluded that a relationship is a cause and effect type of relationship and when it is not 2.The difference between statistical significance and practical importance 3.The difference between finding “no effect” or “no difference” and statistical significance of the findings 4.Common sources of bias that can occur in surveys or experiments 5.Coincidences and improbable events are not uncommon 6.Confusion of statements with its inverse statements when talking about conditional events 7.Understanding of the idea that variability is natural and “normal” is not the same as “average”
Association versus causation Sample versus population The quality of the test versus the power of the test.
1.Distinguish statements of association from statements of causation 2. Distinguish a sample statistic from a population parameter 3.Distinguish between the target population and the sampled population 4.Distinguish between the quality of a test from the predictive power of a test 5.Interpret what a statistic means 6.Distinguish an observational study from an experiment 7.Know the various sources of problems in interpreting a measurement or an association 8. Ask the following questions: Is this statistic true? Is this statistic representative? Is this association spurious?
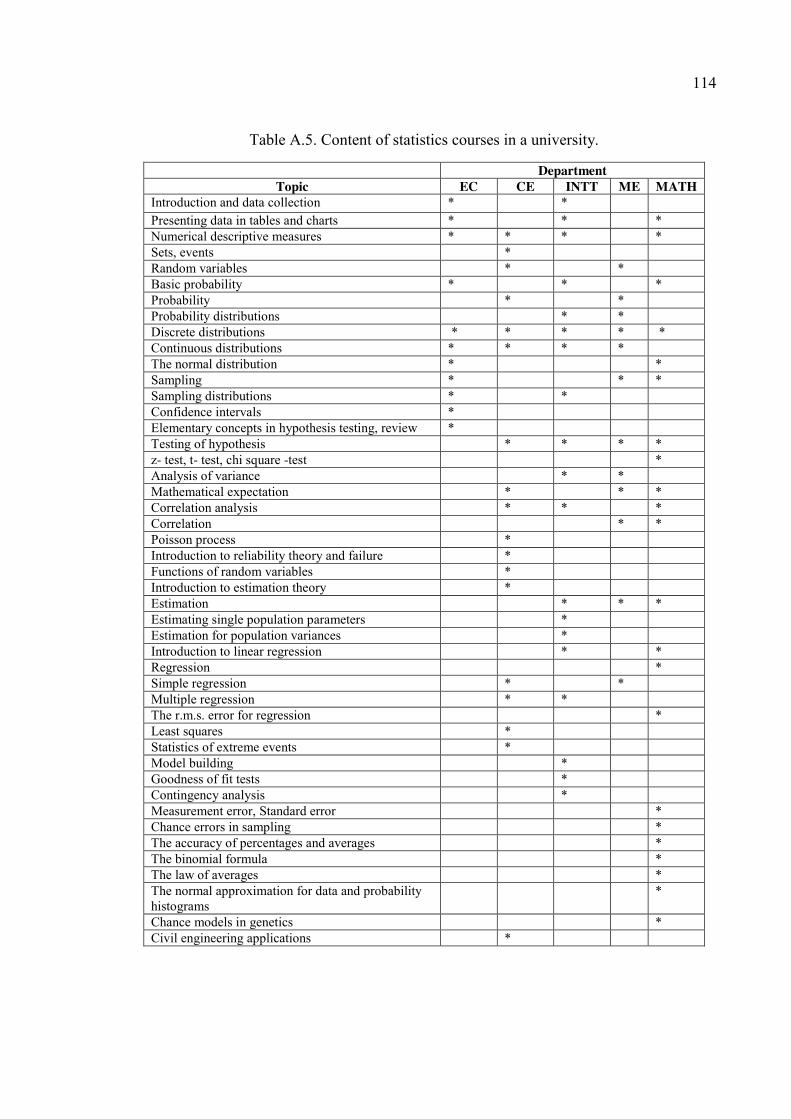
114
Table A.5. Content of statistics courses in a university.
Department Topic EC CE INTT ME MATH
Introduction and data collection * * Presenting data in tables and charts * * * Numerical descriptive measures * * * * Sets, events * Random variables * * Basic probability * * * Probability * * Probability distributions * * Discrete distributions * * * * * Continuous distributions * * * * The normal distribution * * Sampling * * * Sampling distributions * * Confidence intervals * Elementary concepts in hypothesis testing, review * Testing of hypothesis * * * * z- test, t- test, chi square -test * Analysis of variance * * Mathematical expectation * * * Correlation analysis * * * Correlation * * Poisson process * Introduction to reliability theory and failure * Functions of random variables * Introduction to estimation theory * Estimation * * * Estimating single population parameters * Estimation for population variances * Introduction to linear regression * * Regression * Simple regression * * Multiple regression * * The r.m.s. error for regression * Least squares * Statistics of extreme events * Model building * Goodness of fit tests * Contingency analysis * Measurement error, Standard error * Chance errors in sampling * The accuracy of percentages and averages * The binomial formula * The law of averages * The normal approximation for data and probability histograms
*
Chance models in genetics * Civil engineering applications *
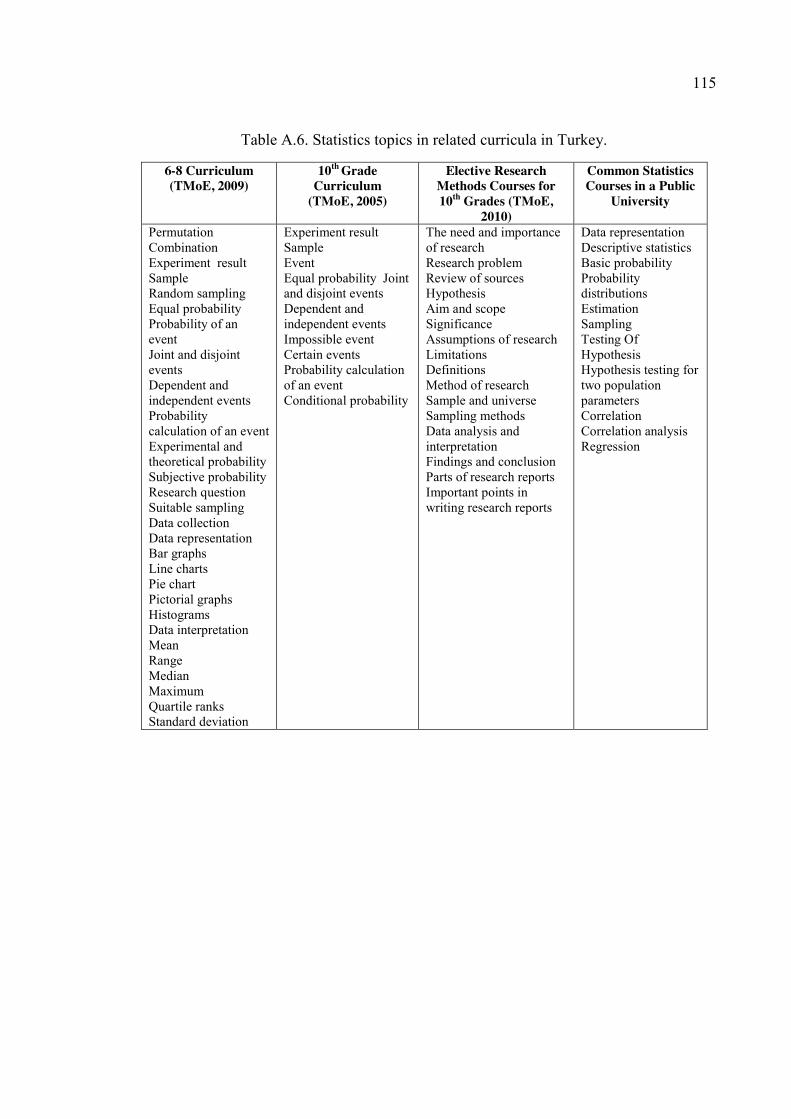
115
Table A.6. Statistics topics in related curricula in Turkey.
6-8 Curriculum (TMoE, 2009)
10th Grade Curriculum
(TMoE, 2005)
Elective Research Methods Courses for 10th Grades (TMoE,
2010)
Common Statistics Courses in a Public
University
Permutation Combination Experiment result Sample Random sampling Equal probability Probability of an event Joint and disjoint events Dependent and independent events Probability calculation of an event Experimental and theoretical probability Subjective probability Research question Suitable sampling Data collection Data representation Bar graphs Line charts Pie chart Pictorial graphs Histograms Data interpretation Mean Range Median Maximum Quartile ranks Standard deviation
Experiment result Sample Event Equal probability Joint and disjoint events Dependent and independent events Impossible event Certain events Probability calculation of an event Conditional probability
The need and importance of research Research problem Review of sources Hypothesis Aim and scope Significance Assumptions of research Limitations Definitions Method of research Sample and universe Sampling methods Data analysis and interpretation Findings and conclusion Parts of research reports Important points in writing research reports
Data representation Descriptive statistics Basic probability Probability distributions Estimation Sampling Testing Of Hypothesis Hypothesis testing for two population parameters Correlation Correlation analysis Regression
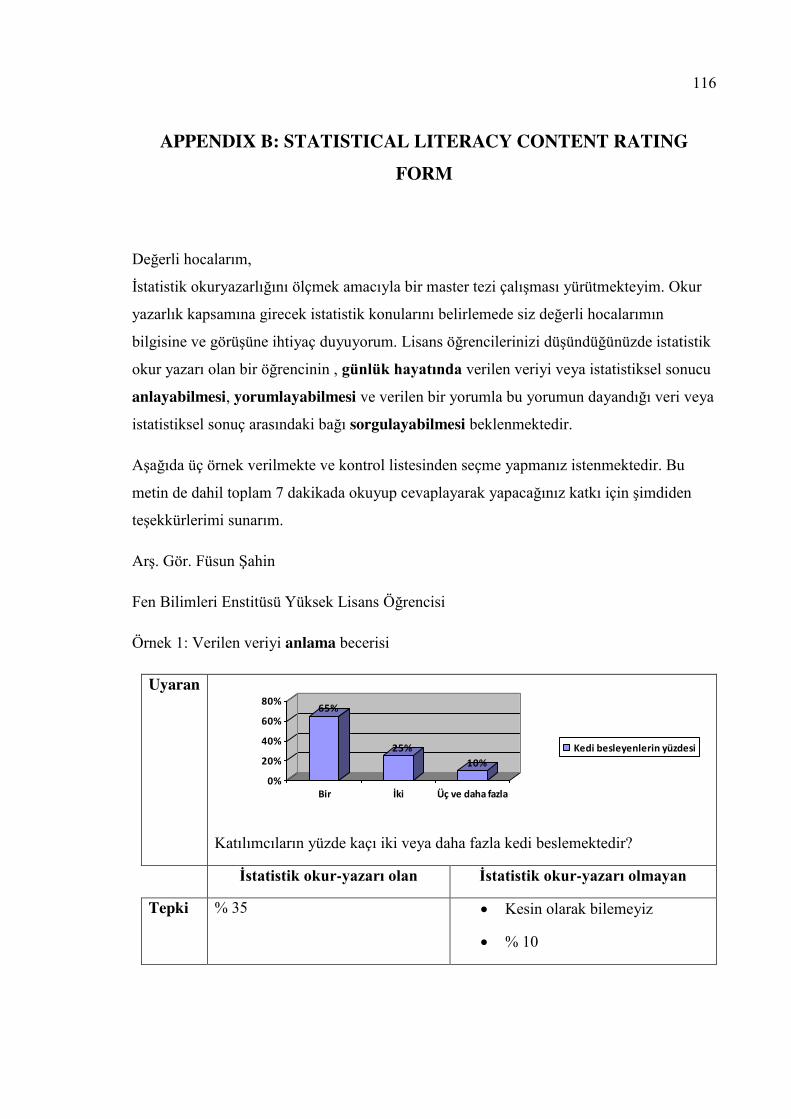
116
APPENDIX B: STATISTICAL LITERACY CONTENT RATING FORM
Değerli hocalarım,
İstatistik okuryazarlığını ölçmek amacıyla bir master tezi çalışması yürütmekteyim. Okur
yazarlık kapsamına girecek istatistik konularını belirlemede siz değerli hocalarımın
bilgisine ve görüşüne ihtiyaç duyuyorum. Lisans öğrencilerinizi düşündüğünüzde istatistik
okur yazarı olan bir öğrencinin , günlük hayatında verilen veriyi veya istatistiksel sonucu
anlayabilmesi, yorumlayabilmesi ve verilen bir yorumla bu yorumun dayandığı veri veya istatistiksel sonuç arasındaki bağı sorgulayabilmesi beklenmektedir.
Aşağıda üç örnek verilmekte ve kontrol listesinden seçme yapmanız istenmektedir. Bu
metin de dahil toplam 7 dakikada okuyup cevaplayarak yapacağınız katkı için şimdiden
teşekkürlerimi sunarım.
Arş. Gör. Füsun Şahin
Fen Bilimleri Enstitüsü Yüksek Lisans Öğrencisi
Örnek 1: Verilen veriyi anlama becerisi
Uyaran 65%
25%10%
0%
20%
40%
60%
80%
Bir İki Üç ve daha fazla
Kedi besleyenlerin yüzdesi
Katılımcıların yüzde kaçı iki veya daha fazla kedi beslemektedir?
İstatistik okur-yazarı olan İstatistik okur-yazarı olmayan
Tepki % 35 Kesin olarak bilemeyiz
% 10
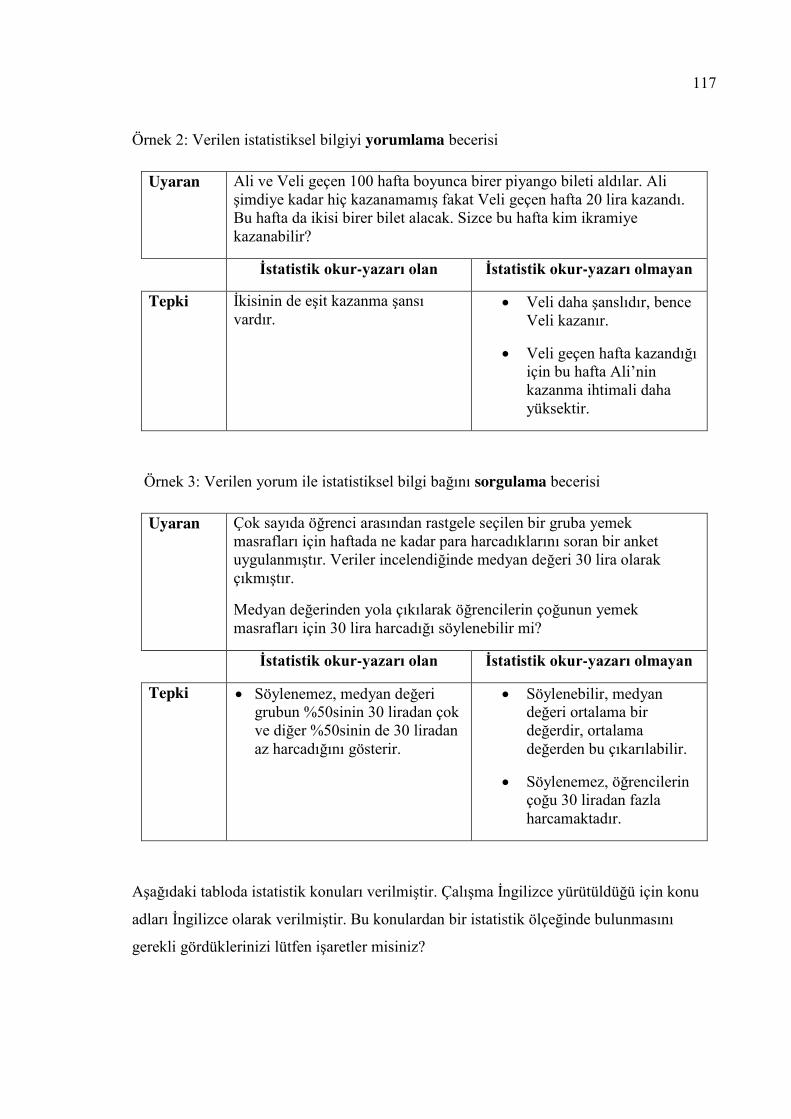
117
Örnek 2: Verilen istatistiksel bilgiyi yorumlama becerisi
Uyaran Ali ve Veli geçen 100 hafta boyunca birer piyango bileti aldılar. Ali şimdiye kadar hiç kazanamamış fakat Veli geçen hafta 20 lira kazandı. Bu hafta da ikisi birer bilet alacak. Sizce bu hafta kim ikramiye kazanabilir?
İstatistik okur-yazarı olan İstatistik okur-yazarı olmayan
Tepki İkisinin de eşit kazanma şansı vardır.
Veli daha şanslıdır, bence Veli kazanır.
Veli geçen hafta kazandığı için bu hafta Ali’nin kazanma ihtimali daha yüksektir.
Örnek 3: Verilen yorum ile istatistiksel bilgi bağını sorgulama becerisi
Uyaran Çok sayıda öğrenci arasından rastgele seçilen bir gruba yemek masrafları için haftada ne kadar para harcadıklarını soran bir anket uygulanmıştır. Veriler incelendiğinde medyan değeri 30 lira olarak çıkmıştır.
Medyan değerinden yola çıkılarak öğrencilerin çoğunun yemek masrafları için 30 lira harcadığı söylenebilir mi?
İstatistik okur-yazarı olan İstatistik okur-yazarı olmayan
Tepki Söylenemez, medyan değeri grubun %50sinin 30 liradan çok ve diğer %50sinin de 30 liradan az harcadığını gösterir.
Söylenebilir, medyan değeri ortalama bir değerdir, ortalama değerden bu çıkarılabilir.
Söylenemez, öğrencilerin çoğu 30 liradan fazla harcamaktadır.
Aşağıdaki tabloda istatistik konuları verilmiştir. Çalışma İngilizce yürütüldüğü için konu
adları İngilizce olarak verilmiştir. Bu konulardan bir istatistik ölçeğinde bulunmasını
gerekli gördüklerinizi lütfen işaretler misiniz?
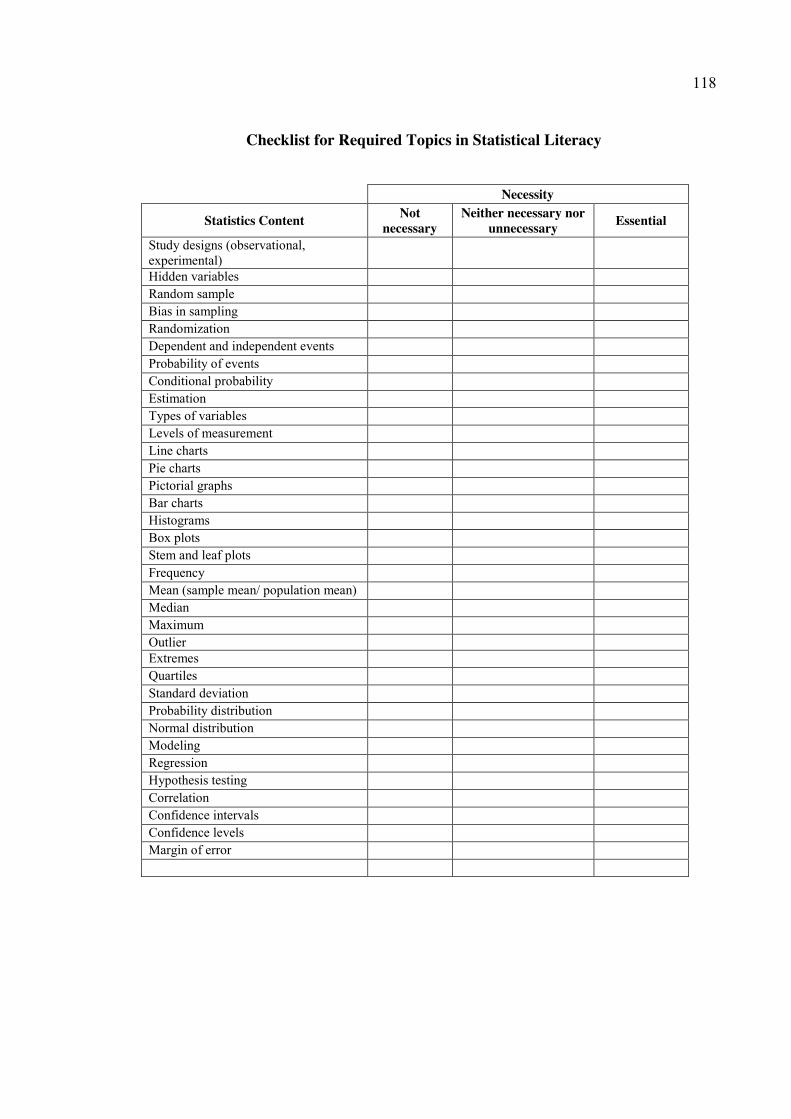
118
Checklist for Required Topics in Statistical Literacy
Necessity
Statistics Content Not necessary
Neither necessary nor unnecessary Essential
Study designs (observational, experimental)
Hidden variables Random sample Bias in sampling Randomization Dependent and independent events Probability of events Conditional probability Estimation Types of variables Levels of measurement Line charts Pie charts Pictorial graphs Bar charts Histograms Box plots Stem and leaf plots Frequency Mean (sample mean/ population mean) Median Maximum Outlier Extremes Quartiles Standard deviation Probability distribution Normal distribution Modeling Regression Hypothesis testing Correlation Confidence intervals Confidence levels Margin of error
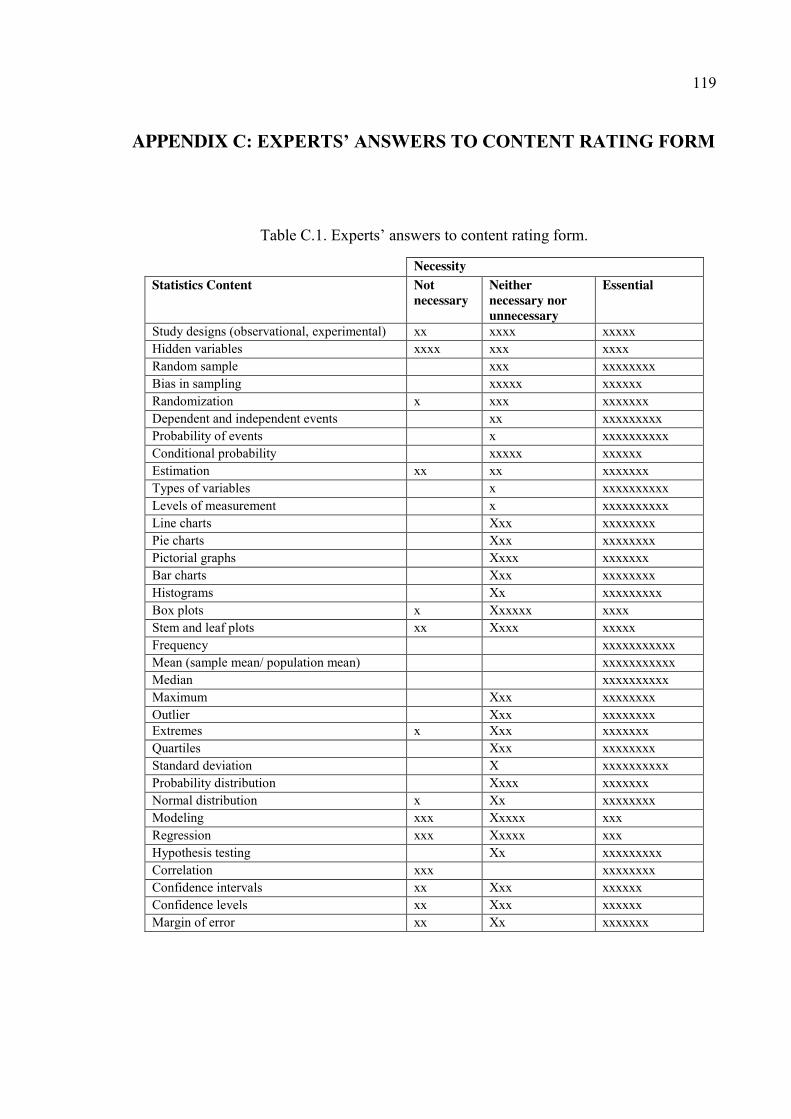
119
APPENDIX C: EXPERTS’ ANSWERS TO CONTENT RATING FORM
Table C.1. Experts’ answers to content rating form.
Necessity Statistics Content Not
necessary Neither necessary nor unnecessary
Essential
Study designs (observational, experimental) xx xxxx xxxxx Hidden variables xxxx xxx xxxx Random sample xxx xxxxxxxx Bias in sampling xxxxx xxxxxx Randomization x xxx xxxxxxx Dependent and independent events xx xxxxxxxxx Probability of events x xxxxxxxxxx Conditional probability xxxxx xxxxxx Estimation xx xx xxxxxxx Types of variables x xxxxxxxxxx Levels of measurement x xxxxxxxxxx Line charts Xxx xxxxxxxx Pie charts Xxx xxxxxxxx Pictorial graphs Xxxx xxxxxxx Bar charts Xxx xxxxxxxx Histograms Xx xxxxxxxxx Box plots x Xxxxxx xxxx Stem and leaf plots xx Xxxx xxxxx Frequency xxxxxxxxxxx Mean (sample mean/ population mean) xxxxxxxxxxx Median xxxxxxxxxx Maximum Xxx xxxxxxxx Outlier Xxx xxxxxxxx Extremes x Xxx xxxxxxx Quartiles Xxx xxxxxxxx Standard deviation X xxxxxxxxxx Probability distribution Xxxx xxxxxxx Normal distribution x Xx xxxxxxxx Modeling xxx Xxxxx xxx Regression xxx Xxxxx xxx Hypothesis testing Xx xxxxxxxxx Correlation xxx xxxxxxxx Confidence intervals xx Xxx xxxxxx Confidence levels xx Xxx xxxxxx Margin of error xx Xx xxxxxxx
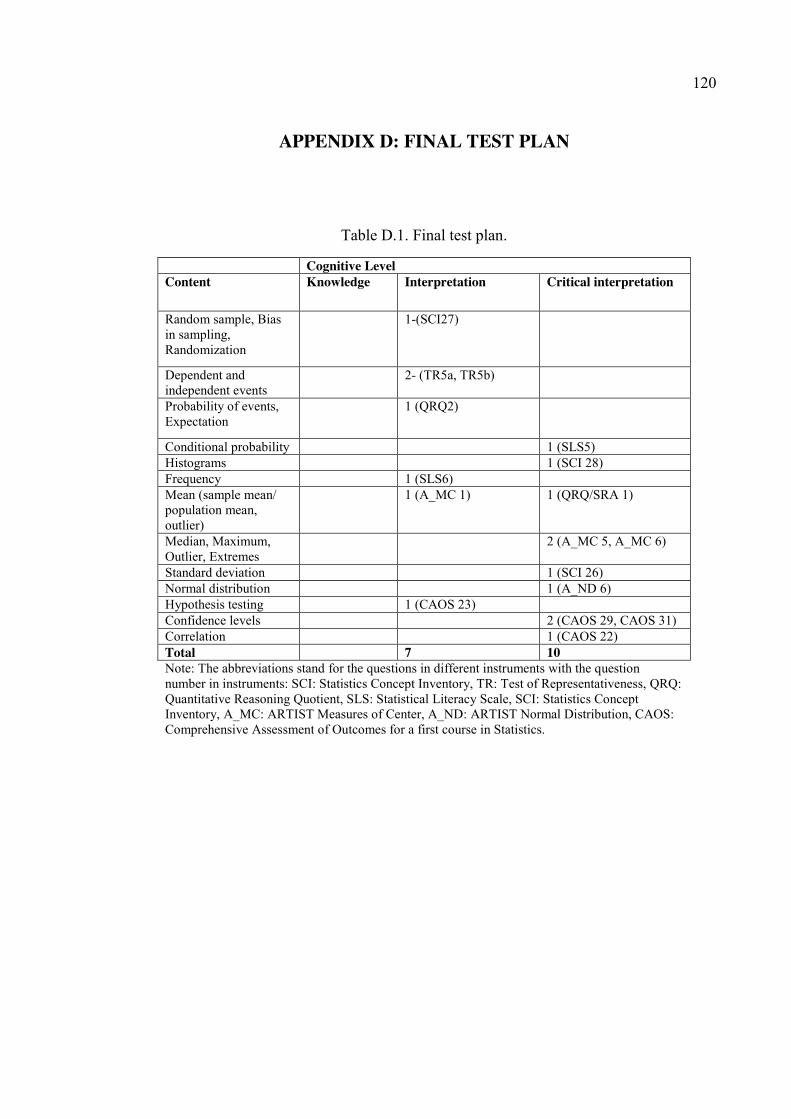
120
APPENDIX D: FINAL TEST PLAN
Table D.1. Final test plan.
Cognitive Level Content Knowledge Interpretation Critical interpretation
Random sample, Bias in sampling, Randomization
1-(SCI27)
Dependent and independent events
2- (TR5a, TR5b)
Probability of events, Expectation
1 (QRQ2)
Conditional probability 1 (SLS5) Histograms 1 (SCI 28) Frequency 1 (SLS6) Mean (sample mean/ population mean, outlier)
1 (A_MC 1) 1 (QRQ/SRA 1)
Median, Maximum, Outlier, Extremes
2 (A_MC 5, A_MC 6)
Standard deviation 1 (SCI 26) Normal distribution 1 (A_ND 6) Hypothesis testing 1 (CAOS 23) Confidence levels 2 (CAOS 29, CAOS 31) Correlation 1 (CAOS 22) Total 7 10 Note: The abbreviations stand for the questions in different instruments with the question number in instruments: SCI: Statistics Concept Inventory, TR: Test of Representativeness, QRQ: Quantitative Reasoning Quotient, SLS: Statistical Literacy Scale, SCI: Statistics Concept Inventory, A_MC: ARTIST Measures of Center, A_ND: ARTIST Normal Distribution, CAOS: Comprehensive Assessment of Outcomes for a first course in Statistics.
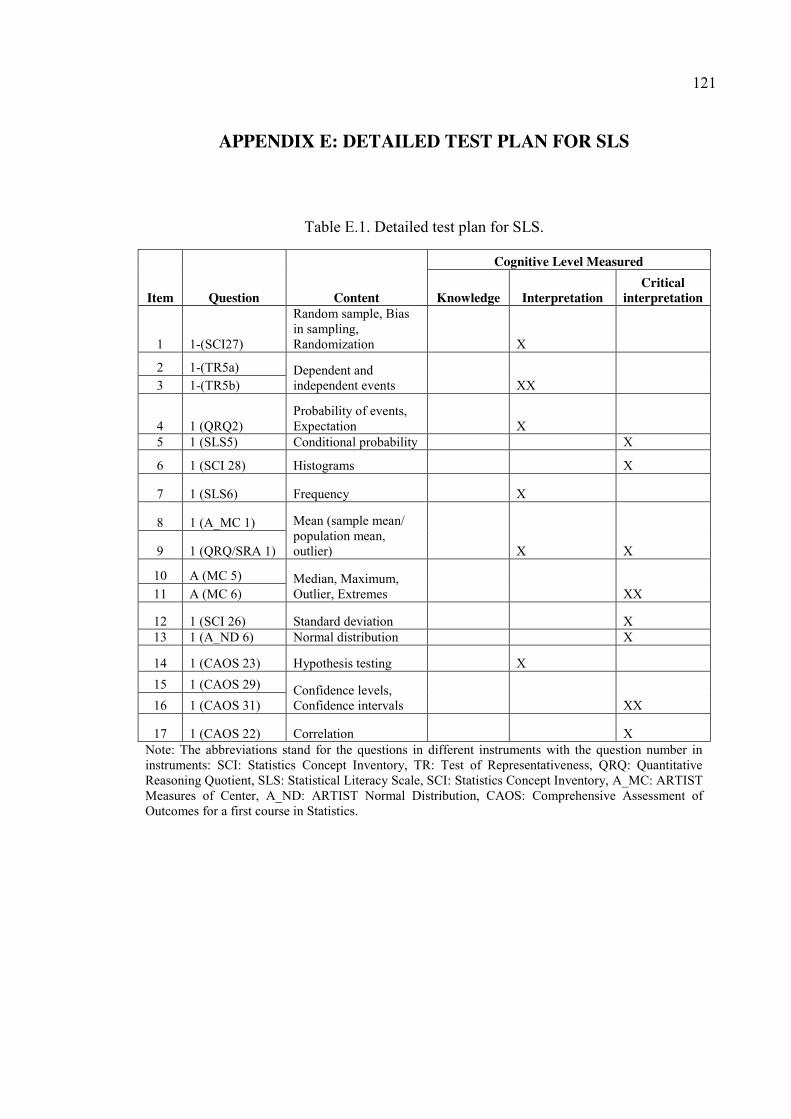
121
APPENDIX E: DETAILED TEST PLAN FOR SLS
Table E.1. Detailed test plan for SLS.
Item Question Content
Cognitive Level Measured
Knowledge Interpretation Critical
interpretation
1 1-(SCI27)
Random sample, Bias in sampling, Randomization X
2 1-(TR5a) Dependent and independent events XX 3 1-(TR5b)
4 1 (QRQ2) Probability of events, Expectation X
5 1 (SLS5) Conditional probability X
6 1 (SCI 28) Histograms X
7 1 (SLS6) Frequency X
8 1 (A_MC 1) Mean (sample mean/ population mean, outlier) X X 9 1 (QRQ/SRA 1)
10 A (MC 5) Median, Maximum, Outlier, Extremes XX 11 A (MC 6)
12 1 (SCI 26) Standard deviation X 13 1 (A_ND 6) Normal distribution X
14 1 (CAOS 23) Hypothesis testing X 15 1 (CAOS 29) Confidence levels,
Confidence intervals XX 16 1 (CAOS 31)
17 1 (CAOS 22) Correlation X Note: The abbreviations stand for the questions in different instruments with the question number in instruments: SCI: Statistics Concept Inventory, TR: Test of Representativeness, QRQ: Quantitative Reasoning Quotient, SLS: Statistical Literacy Scale, SCI: Statistics Concept Inventory, A_MC: ARTIST Measures of Center, A_ND: ARTIST Normal Distribution, CAOS: Comprehensive Assessment of Outcomes for a first course in Statistics.
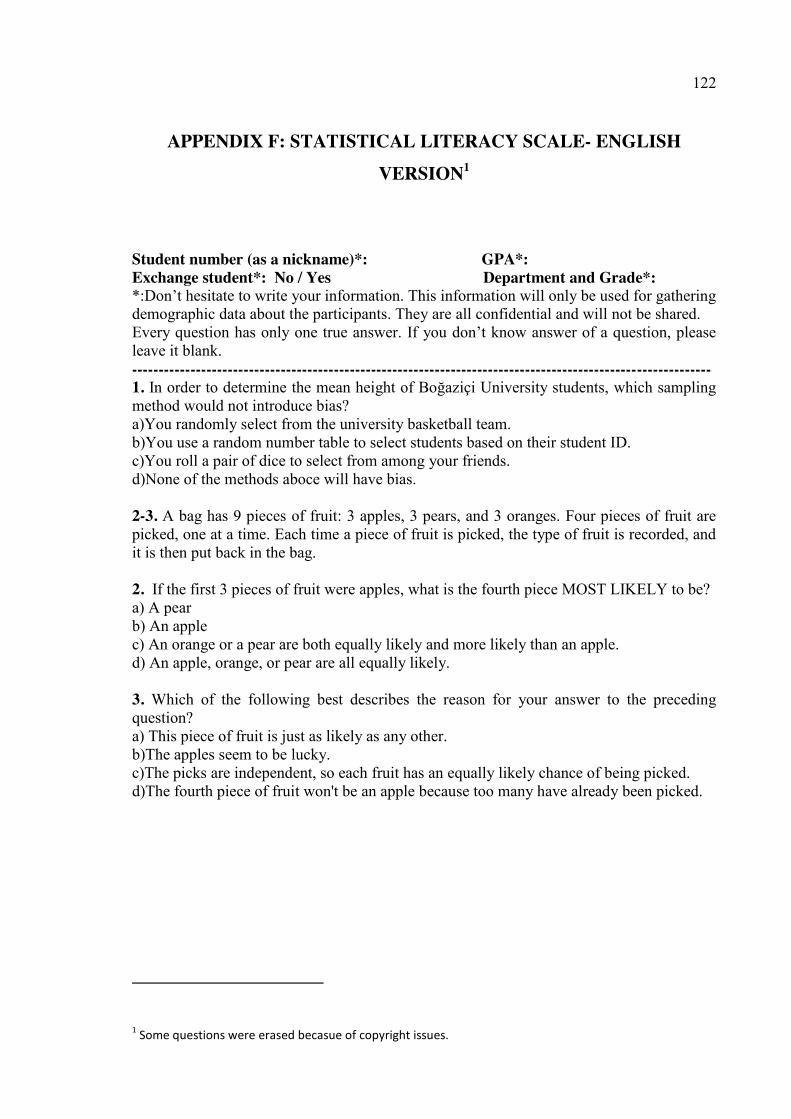
122
APPENDIX F: STATISTICAL LITERACY SCALE- ENGLISH VERSION1
Student number (as a nickname)*: GPA*: Exchange student*: No / Yes Department and Grade*: *:Don’t hesitate to write your information. This information will only be used for gathering demographic data about the participants. They are all confidential and will not be shared. Every question has only one true answer. If you don’t know answer of a question, please leave it blank. ------------------------------------------------------------------------------------------------------------- 1. In order to determine the mean height of Boğaziçi University students, which sampling method would not introduce bias? a)You randomly select from the university basketball team. b)You use a random number table to select students based on their student ID. c)You roll a pair of dice to select from among your friends. d)None of the methods aboce will have bias. 2-3. A bag has 9 pieces of fruit: 3 apples, 3 pears, and 3 oranges. Four pieces of fruit are picked, one at a time. Each time a piece of fruit is picked, the type of fruit is recorded, and it is then put back in the bag. 2. If the first 3 pieces of fruit were apples, what is the fourth piece MOST LIKELY to be? a) A pear b) An apple c) An orange or a pear are both equally likely and more likely than an apple. d) An apple, orange, or pear are all equally likely. 3. Which of the following best describes the reason for your answer to the preceding question? a) This piece of fruit is just as likely as any other. b)The apples seem to be lucky. c)The picks are independent, so each fruit has an equally likely chance of being picked. d)The fourth piece of fruit won't be an apple because too many have already been picked.
1 Some questions were erased becasue of copyright issues.
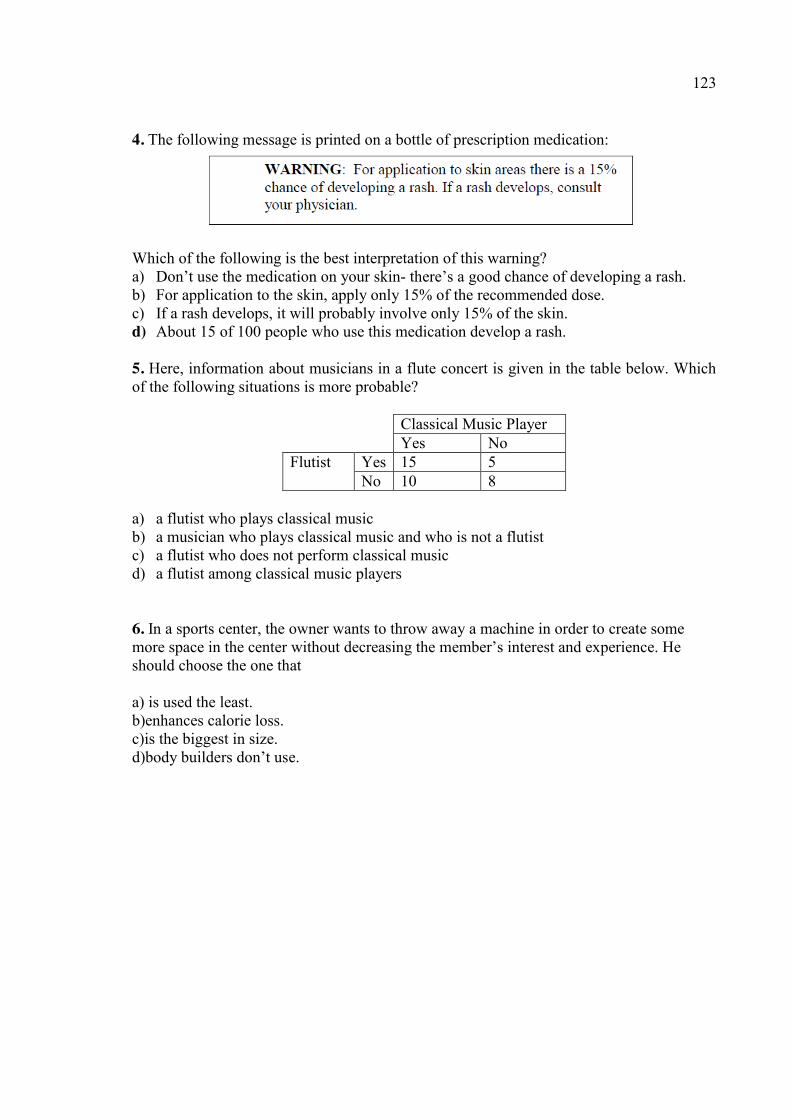
123
4. The following message is printed on a bottle of prescription medication:
Which of the following is the best interpretation of this warning? a) Don’t use the medication on your skin- there’s a good chance of developing a rash. b) For application to the skin, apply only 15% of the recommended dose. c) If a rash develops, it will probably involve only 15% of the skin. d) About 15 of 100 people who use this medication develop a rash.
5. Here, information about musicians in a flute concert is given in the table below. Which of the following situations is more probable?
Classical Music Player Yes No Flutist Yes 15 5
No 10 8 a) a flutist who plays classical music b) a musician who plays classical music and who is not a flutist c) a flutist who does not perform classical music d) a flutist among classical music players 6. In a sports center, the owner wants to throw away a machine in order to create some more space in the center without decreasing the member’s interest and experience. He should choose the one that a) is used the least. b)enhances calorie loss. c)is the biggest in size. d)body builders don’t use.
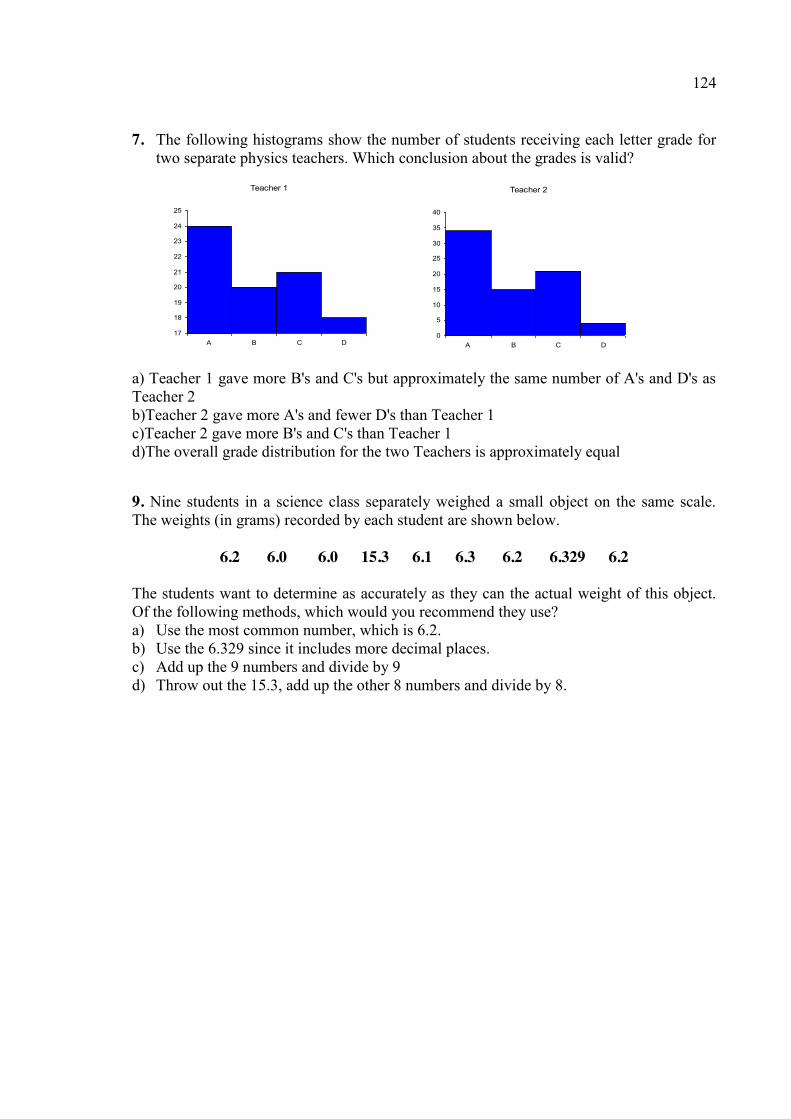
124
7. The following histograms show the number of students receiving each letter grade for two separate physics teachers. Which conclusion about the grades is valid?
a) Teacher 1 gave more B's and C's but approximately the same number of A's and D's as Teacher 2 b)Teacher 2 gave more A's and fewer D's than Teacher 1 c)Teacher 2 gave more B's and C's than Teacher 1 d)The overall grade distribution for the two Teachers is approximately equal
9. Nine students in a science class separately weighed a small object on the same scale. The weights (in grams) recorded by each student are shown below.
6.2 6.0 6.0 15.3 6.1 6.3 6.2 6.329 6.2
The students want to determine as accurately as they can the actual weight of this object. Of the following methods, which would you recommend they use? a) Use the most common number, which is 6.2. b) Use the 6.329 since it includes more decimal places. c) Add up the 9 numbers and divide by 9 d) Throw out the 15.3, add up the other 8 numbers and divide by 8.
Teacher 1
17
18
19
20
21
22
23
24
25
A B C D
Teacher 2
0
5
10
15
20
25
30
35
40
A B C D
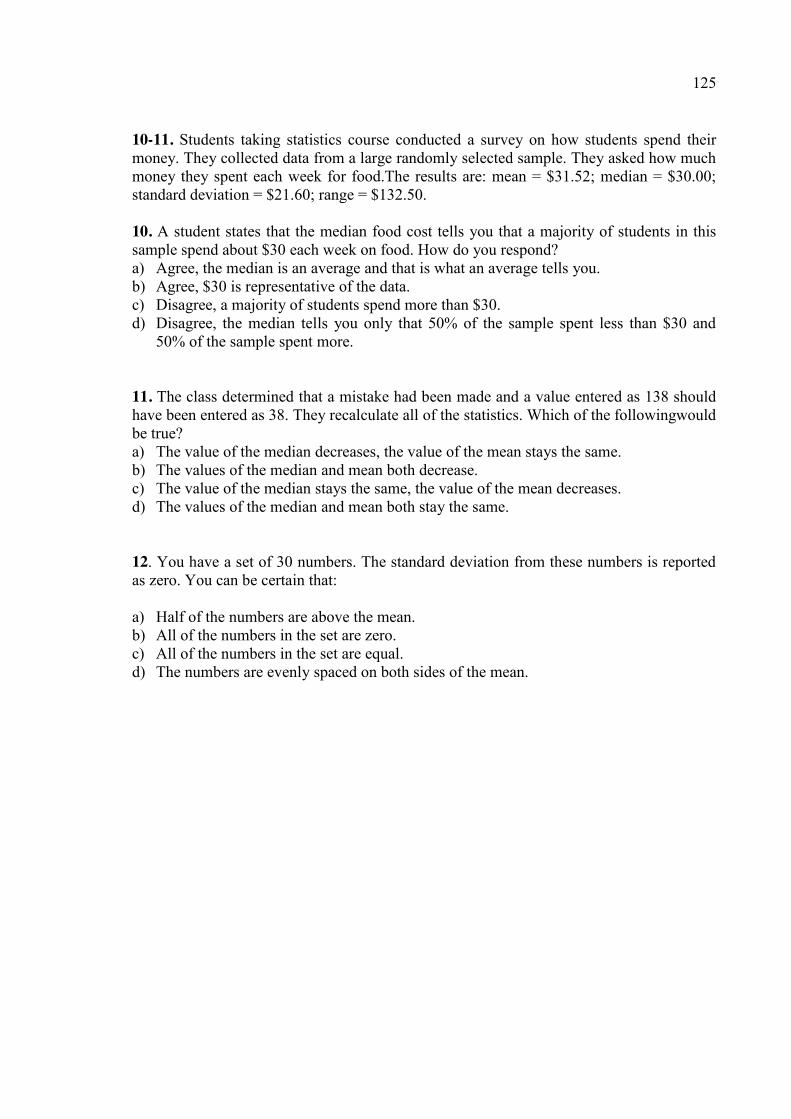
125
10-11. Students taking statistics course conducted a survey on how students spend their money. They collected data from a large randomly selected sample. They asked how much money they spent each week for food.The results are: mean = $31.52; median = $30.00; standard deviation = $21.60; range = $132.50. 10. A student states that the median food cost tells you that a majority of students in this sample spend about $30 each week on food. How do you respond? a) Agree, the median is an average and that is what an average tells you. b) Agree, $30 is representative of the data. c) Disagree, a majority of students spend more than $30. d) Disagree, the median tells you only that 50% of the sample spent less than $30 and
50% of the sample spent more. 11. The class determined that a mistake had been made and a value entered as 138 should have been entered as 38. They recalculate all of the statistics. Which of the followingwould be true? a) The value of the median decreases, the value of the mean stays the same. b) The values of the median and mean both decrease. c) The value of the median stays the same, the value of the mean decreases. d) The values of the median and mean both stay the same. 12. You have a set of 30 numbers. The standard deviation from these numbers is reported as zero. You can be certain that:
a) Half of the numbers are above the mean. b) All of the numbers in the set are zero. c) All of the numbers in the set are equal. d) The numbers are evenly spaced on both sides of the mean.
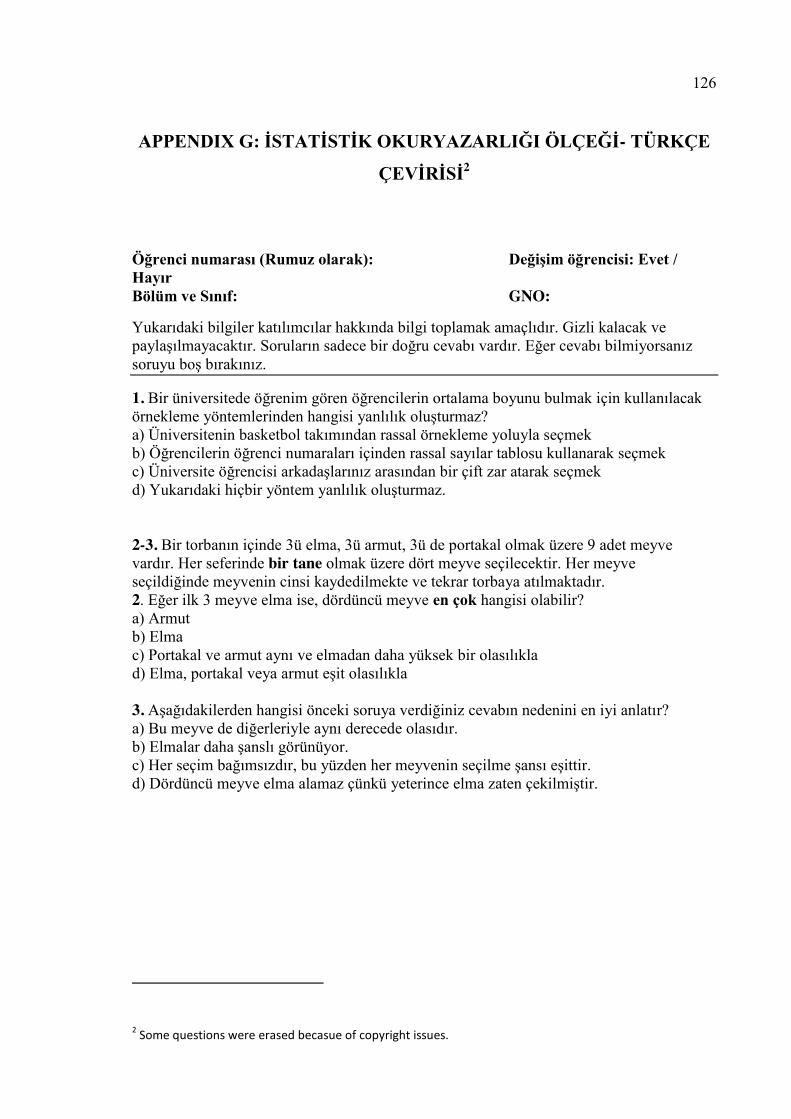
126
APPENDIX G: İSTATİSTİK OKURYAZARLIĞI ÖLÇEĞİ- TÜRKÇE ÇEVİRİSİ2
Öğrenci numarası (Rumuz olarak): Değişim öğrencisi: Evet / Hayır Bölüm ve Sınıf: GNO:
Yukarıdaki bilgiler katılımcılar hakkında bilgi toplamak amaçlıdır. Gizli kalacak ve paylaşılmayacaktır. Soruların sadece bir doğru cevabı vardır. Eğer cevabı bilmiyorsanız soruyu boş bırakınız.
1. Bir üniversitede öğrenim gören öğrencilerin ortalama boyunu bulmak için kullanılacak örnekleme yöntemlerinden hangisi yanlılık oluşturmaz? a) Üniversitenin basketbol takımından rassal örnekleme yoluyla seçmek b) Öğrencilerin öğrenci numaraları içinden rassal sayılar tablosu kullanarak seçmek c) Üniversite öğrencisi arkadaşlarınız arasından bir çift zar atarak seçmek d) Yukarıdaki hiçbir yöntem yanlılık oluşturmaz. 2-3. Bir torbanın içinde 3ü elma, 3ü armut, 3ü de portakal olmak üzere 9 adet meyve vardır. Her seferinde bir tane olmak üzere dört meyve seçilecektir. Her meyve seçildiğinde meyvenin cinsi kaydedilmekte ve tekrar torbaya atılmaktadır. 2. Eğer ilk 3 meyve elma ise, dördüncü meyve en çok hangisi olabilir? a) Armut b) Elma c) Portakal ve armut aynı ve elmadan daha yüksek bir olasılıkla d) Elma, portakal veya armut eşit olasılıkla 3. Aşağıdakilerden hangisi önceki soruya verdiğiniz cevabın nedenini en iyi anlatır? a) Bu meyve de diğerleriyle aynı derecede olasıdır. b) Elmalar daha şanslı görünüyor. c) Her seçim bağımsızdır, bu yüzden her meyvenin seçilme şansı eşittir. d) Dördüncü meyve elma alamaz çünkü yeterince elma zaten çekilmiştir.
2 Some questions were erased becasue of copyright issues.
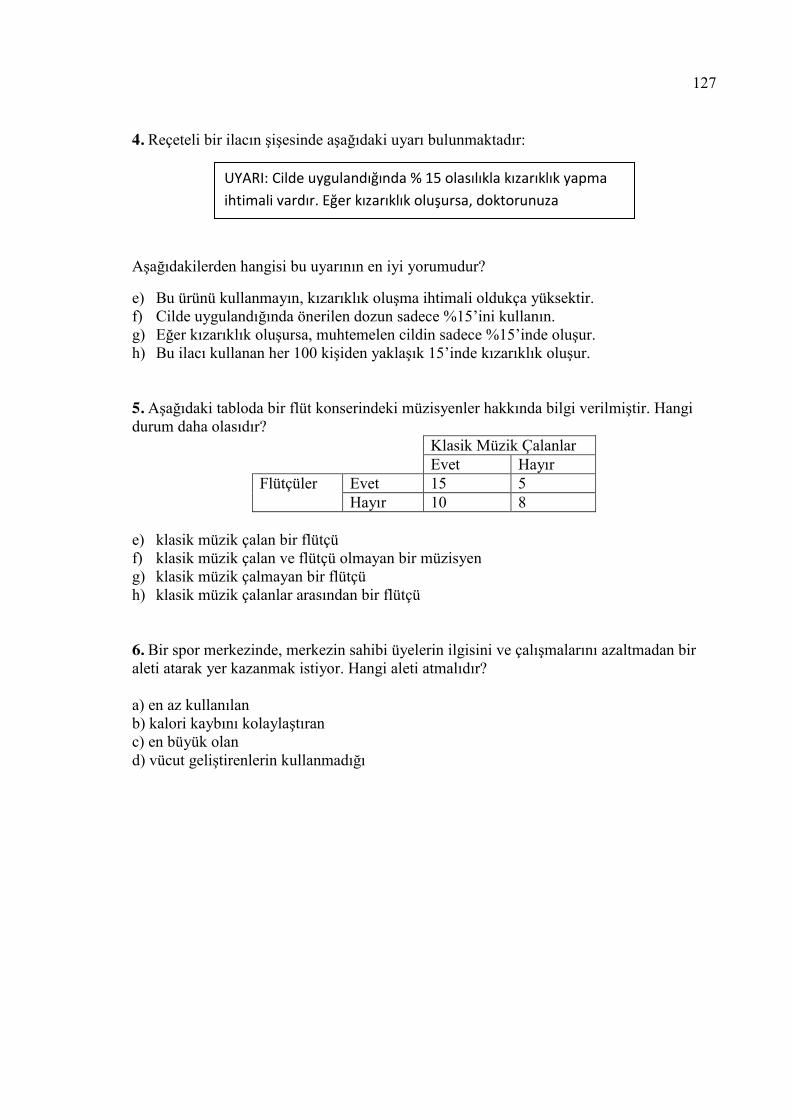
127
4. Reçeteli bir ilacın şişesinde aşağıdaki uyarı bulunmaktadır:
Aşağıdakilerden hangisi bu uyarının en iyi yorumudur?
e) Bu ürünü kullanmayın, kızarıklık oluşma ihtimali oldukça yüksektir. f) Cilde uygulandığında önerilen dozun sadece %15’ini kullanın. g) Eğer kızarıklık oluşursa, muhtemelen cildin sadece %15’inde oluşur. h) Bu ilacı kullanan her 100 kişiden yaklaşık 15’inde kızarıklık oluşur. 5. Aşağıdaki tabloda bir flüt konserindeki müzisyenler hakkında bilgi verilmiştir. Hangi durum daha olasıdır?
Klasik Müzik Çalanlar Evet Hayır Flütçüler Evet 15 5
Hayır 10 8 e) klasik müzik çalan bir flütçü f) klasik müzik çalan ve flütçü olmayan bir müzisyen g) klasik müzik çalmayan bir flütçü h) klasik müzik çalanlar arasından bir flütçü 6. Bir spor merkezinde, merkezin sahibi üyelerin ilgisini ve çalışmalarını azaltmadan bir aleti atarak yer kazanmak istiyor. Hangi aleti atmalıdır? a) en az kullanılan b) kalori kaybını kolaylaştıran c) en büyük olan d) vücut geliştirenlerin kullanmadığı
UYARI: Cilde uygulandığında % 15 olasılıkla kızarıklık yapma
ihtimali vardır. Eğer kızarıklık oluşursa, doktorunuza
başvurunuz.
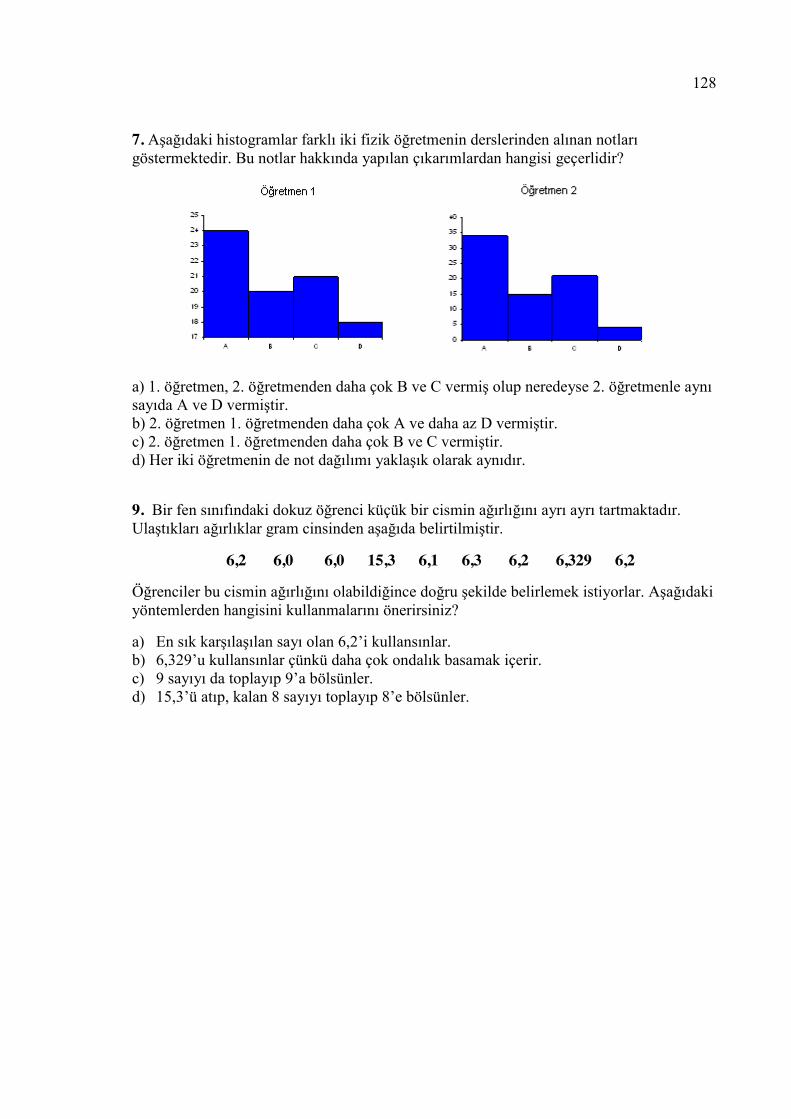
128
7. Aşağıdaki histogramlar farklı iki fizik öğretmenin derslerinden alınan notları göstermektedir. Bu notlar hakkında yapılan çıkarımlardan hangisi geçerlidir?
a) 1. öğretmen, 2. öğretmenden daha çok B ve C vermiş olup neredeyse 2. öğretmenle aynı sayıda A ve D vermiştir. b) 2. öğretmen 1. öğretmenden daha çok A ve daha az D vermiştir. c) 2. öğretmen 1. öğretmenden daha çok B ve C vermiştir. d) Her iki öğretmenin de not dağılımı yaklaşık olarak aynıdır.
9. Bir fen sınıfındaki dokuz öğrenci küçük bir cismin ağırlığını ayrı ayrı tartmaktadır. Ulaştıkları ağırlıklar gram cinsinden aşağıda belirtilmiştir.
6,2 6,0 6,0 15,3 6,1 6,3 6,2 6,329 6,2
Öğrenciler bu cismin ağırlığını olabildiğince doğru şekilde belirlemek istiyorlar. Aşağıdaki yöntemlerden hangisini kullanmalarını önerirsiniz?
a) En sık karşılaşılan sayı olan 6,2’i kullansınlar. b) 6,329’u kullansınlar çünkü daha çok ondalık basamak içerir. c) 9 sayıyı da toplayıp 9’a bölsünler. d) 15,3’ü atıp, kalan 8 sayıyı toplayıp 8’e bölsünler.
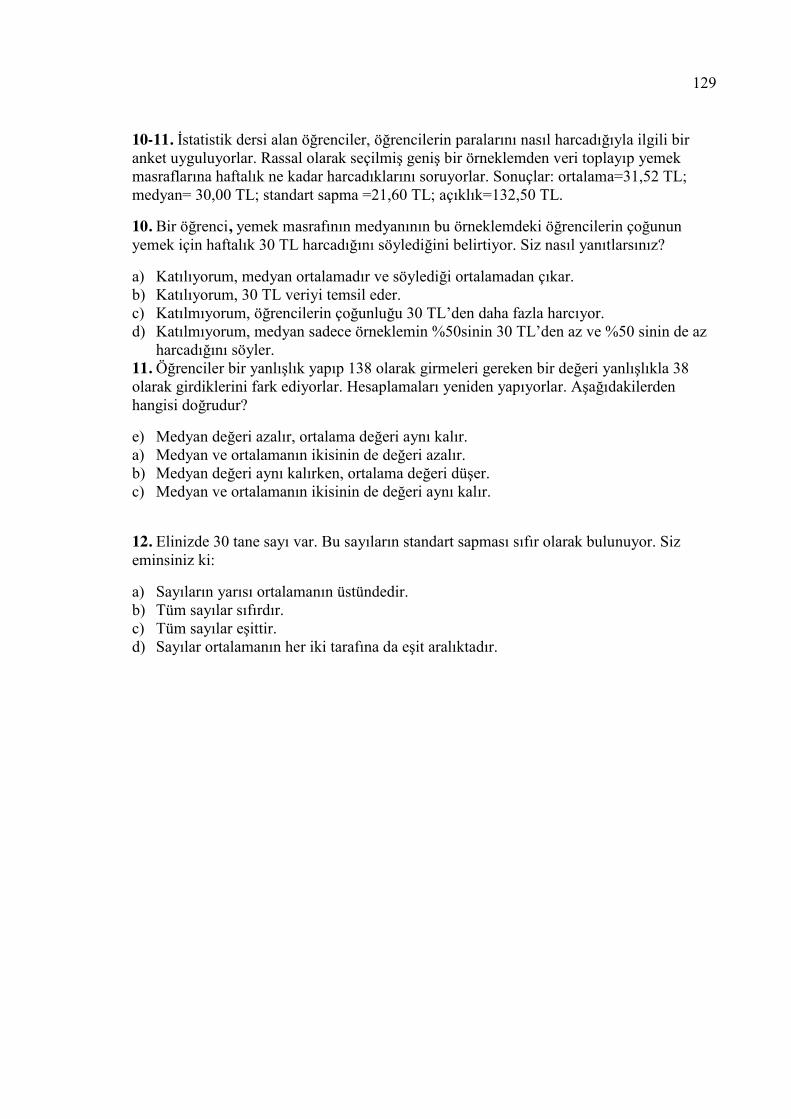
129
10-11. İstatistik dersi alan öğrenciler, öğrencilerin paralarını nasıl harcadığıyla ilgili bir anket uyguluyorlar. Rassal olarak seçilmiş geniş bir örneklemden veri toplayıp yemek masraflarına haftalık ne kadar harcadıklarını soruyorlar. Sonuçlar: ortalama=31,52 TL;; medyan= 30,00 TL;; standart sapma =21,60 TL;; açıklık=132,50 TL.
10. Bir öğrenci, yemek masrafının medyanının bu örneklemdeki öğrencilerin çoğunun yemek için haftalık 30 TL harcadığını söylediğini belirtiyor. Siz nasıl yanıtlarsınız?
a) Katılıyorum, medyan ortalamadır ve söylediği ortalamadan çıkar. b) Katılıyorum, 30 TL veriyi temsil eder. c) Katılmıyorum, öğrencilerin çoğunluğu 30 TL’den daha fazla harcıyor. d) Katılmıyorum, medyan sadece örneklemin %50sinin 30 TL’den az ve %50 sinin de az
harcadığını söyler. 11. Öğrenciler bir yanlışlık yapıp 138 olarak girmeleri gereken bir değeri yanlışlıkla 38 olarak girdiklerini fark ediyorlar. Hesaplamaları yeniden yapıyorlar. Aşağıdakilerden hangisi doğrudur?
e) Medyan değeri azalır, ortalama değeri aynı kalır. a) Medyan ve ortalamanın ikisinin de değeri azalır. b) Medyan değeri aynı kalırken, ortalama değeri düşer. c) Medyan ve ortalamanın ikisinin de değeri aynı kalır.
12. Elinizde 30 tane sayı var. Bu sayıların standart sapması sıfır olarak bulunuyor. Siz eminsiniz ki:
a) Sayıların yarısı ortalamanın üstündedir. b) Tüm sayılar sıfırdır. c) Tüm sayılar eşittir. d) Sayılar ortalamanın her iki tarafına da eşit aralıktadır.
130
REFERENCES
Afantiti- Lamprianou, T. and J., Williams, 2003, “A Scale for Assessing Probabilistic
Thinking and the Representativeness Tendency”, Research in Mathematics
Education, Vol. 5, No. 1, pp. 173 - 196.
Akarsu, F., 2009, “Intercultural Modes of Thinking and Reasoning Scale-English (Imtars-
E): A Validity and Reliability Study”, Boğazici University Journal of Education,
Vol. 24, No. 2, pp. 1-12.
Akkaş, E. N., 2009, 6. - 8. Sınıf Öğrencilerinin İstatistiksel Düşüncelerinin İncelenmesi,
M.S. Thesis, Abant İzzet Baysal University.
Allen, K., 2006, The Statistics Concept Inventory: Development and Analysis of a
Cognitive Assessment Instrument in Statistics, Ph.D. Dissertation, University of
Oklahoma.
American Psychological Associaion, 1999, Standards of Testing,
http://www.apa.org/science/programs/testing/standards.aspx, accessed at May 2012.
Anastasi, A. and S. Urbina, 1997, Psychological Testing, 7th Edition, Pearson Education,
Singapore.
Anderson, L. W. and D. R. Krathwohl (editors), 2000, A Taxonomy for Learning,
Teaching, and Assessing: A Revision of Bloom's Taxonomy of Educational
Objectives, Allyn and Bacon, Boston, MA.
Baker, F. B., 2001, The Basics of Item Response Theory, 2nd Edition, ERIC Clearinghouse
on Assessment and Evaluation.
131
Biggs, J. B. and K. F., Collis, 1991, “Multimodal Learning and Quality of Intelligent
Behavior”, in H. Rowe (eds.), Intelligence: Reconceptualization and Measurement,
pp. 57-76, Erlbaum, Hillsdale, NJ.
Bloom, B. S. (editor), 1956, “Taxonomy of Educational Objectives”, in The Classification
of Educational Goals- Handbook I: Cognitive Domain, McKay, New York.
Budgett, S. and M., Pfannkuch, 2007, “Assessing Students’ Statistical Literacy”,
International Association for Statistical Education (IASE) and International
Statistics Institute (ISI) Satellite, Guimaraes, Portugal,
http://www.stat.auckland.ac.nz/~iase/publications/sat07/Budgett_Pfannkuch.pdf,
accessed at May 2012.
Burnham, T., 2003, “Statistical Literacy: Purpose and Definitions”,
http://www.statlit.org/pdf/2003BurnhamStatLit.pdf, accessed at May 2012.
Ben-Zvi, D. and J. Garfield, 2004, The Challenge of Developing Statistical Literacy,
Reasoning and Thinking, Kluwer Academic Publishers, The Netherlands,
http://217.218.200.220/documents/10129/40274/The+challenge+of+developing+stati
stical+literacy.pdf#page=398, accessed at May 2012.
Chance, B. L., 2002, “Components of Statistical Thinking and Implications for Instruction
and Assessment”, Journal of Statistics Education, Vol. 10, No.3,
http://www.amstat.org/publications/jse/v10.n3/chance.html, accessed at May 2012.
Cobb, G. W. and D. S., Moore, 1997, “Mathematics, Statistics, and Teaching”, American
Mathematical Monthly, Vol. 104, pp. 801-823.
Cox, D. R. and N. Wermuth, 2004, “Causality: a Statistical View”, International Statistical
Review, Vol. 72, No. 3, pp. 285–305.
Cronbach, L. J. and P. E. Meehl, 1955, “Construct Validity in Psychological Tests”,
Psychological Bulletin, Vol. 52, pp. 281-302.
132
delMas, R. C., 2002, “Statistical Literacy, Reasoning, and Learning: A Commentary”,
Journal of Statistics Education, Vol. 10, No. 3,
http://www.amstat.org/publications/jse/v10n3/delmas_discussion.html, accessed at
March 2011.
delMas, R., J., Garfield, A., Ooms, and B., Chance, 2006, “Assessing Students' Conceptual
Understanding after A First Course in Statistics”, Annual Meeting of the American
Educational Research Association, San Francisco, CA.
delMas, R., J., Garfield, A., Ooms, and B., Chance, 2007, “Assessing Students’ Conceptual
Understanding after a First Course in Statistics”, Statistics Education Research
Journal, Vol. 6, No.2, pp. 28-58.
Diri, F. Ü., 2007, İstatistik Dersine Yönelik Tutumların Araştırılması- Meslek Yüksekokul
Örneği, M.S. Thesis, Gazi University.
Downing, S. M., 2006, “Twelve Steps for Effective Test Development”, in Downing, S. M.
and T. M., Haladyna, (eds.), Handbook of Test Development, Lawrance Erlbaum
Associates Publishers, London.
Fiedl, A., 2000, Discovering Statistics Using SPSS for Windows, Sage Publications,
London- Thousand Oaks-New Delhi.
Finney, S. and G., Schraw, 2003, “Self-Efficacy Beliefs in College Statistics Courses”,
Contemporary Educational Psychology, Vol. 28, pp. 161–186.
Gal, I. and J. Garfield (editors), 1997, The Assessment Challenge in Statistics Education,
IOS Press, Amsterdam.
Gal, I., 2000, “Statistical Literacy: Conceptual and Instructional Issues”, in D. Coben,
J., O’Donoghe, and G., Fitzsimons (eds.), Perspectives on Adults Learning
Mathematics, pp.135-150, Kluwer Academic Publishers, Dordrecht, The
Netherlands.
133
Gal, I., 2003, “Expanding Conceptions of Statistical Literacy: An Analysis of Products
from Statistics Agencies”, Statistics Education Research Journal, Vol. 2, No. 1, pp.
3-11.
Gal, I., 2004, “Statistical Literacy: Meanings, Components, Responsibilities”, in Zvi, D.,
and J. B., Garfield, 2004, The Challenge Of Developing Statistical Literacy,
Reasoning, and Thinking, pp. 47-78, Kluwer Academic Publishers, Dordrecht, The
Netherlands.
Garfield, J. B., 1995, “How students Learn Statistics”, International Statistics Review, Vol.
63, No. 1, pp. 25-34.
Garfield, J.B. and B. Chance, 2000, “Assessment in Statistics Education: Issues and
Challenges”, Mathematics Thinking and Learning, Vol. 2, pp. 99-125.
Garfield, J. B., 2003, “Assessing Statistical Reasoning”, Statistics Education Research
Journal, Vol. 2, No. 1, pp. 22-38.
Garfield, J. and D. Ben-Zvi, 2005, “Research on Statistical Literacy, Reasoning, and
Thinking: Issues, Challenges, and Implications”, in Zvi, D., and J. B., Garfield (eds.),
2004, The Challenge Of Developing Statistical Literacy, Reasoning, and Thinking,
pp. 397-409, Kluwer Academic Publishers, Dordrecht, The Netherlands.
Garfield, J., R., delMas, and B. Chance, 2003, “The Web-Based ARTIST: Assessment
Resource Tools for Improving Statistical Thinking”, Assessment of Statistical
Reasoning to Enhance Educational Quality, Chicago,
https://app.gen.umn.edu/artist/articles/AERA_2003.pdf, accessed at May 2012.
Garfield, J., R. delMas, and B. Chance, 2006, “Assessment Resource Tools for Improving
Statistical Thinking (ARTIST)”, app.gen.umn.edu/artist/scales.html, accessed at
March 2010.
134
Hahn, G., N. Doğanaksoy, R. Lewis, J. E. Oppenlander, J. Schmee, 2010, “Numbers in
Everyday Life: A Short Course for Adults”, Joint Statistics Meetings, Vancouver,
Canada, http://www.statlit.org/pdf/2010HahnASA.pdf, accessed at May 2012.
Hambleton, R. K. and L. Patsula, 1999, “Increasing the Validity of Adapted Tests: Myths
to be Avoided and Guidelines for Improving Test Adaptation Practices”, Journal of
Applied Testing Technology, Vol. 1, No. 1, pp. 1-30.
Hayden, R., 2004, Planning a Statistical Literacy Program at the College Level: Musings
and a Bibliography, http://www.statlit.org/pdf/2004/HaydenASA.pdf, accessed at
January 2010.
Hirsch, L. S., and A. M., O’Donnell, 2001, “Representativeness in Statistical Reasoning:
Identifying and Assessing Misconceptions”, Journal of Statistics Education, Vol.9,
No. 2, http://www.amstat.org/publications/jse/v9n2/hirsch.html, accessed at May
2012.
International Statistics Institute, 2011, Glossary of International Statistical Terms,
http://isi.cbs.nl/glossary/index.htm, accessed at May 2012.
Kabaca, T. and Y., Erdogan, 2007, “Fen Bilimleri, Bilgisayar ve Matematik Alanlarındaki
Tez Çalışmalarının İstatistiksel Açıdan İncelenmesi”, Pamukkale Üniversity, Eğitim
Fakültesi Dergisi, Vol. 22, No. 54, pp. 54-63.
Liu, T., Y., Lin, and C., Tsai, 2009, “Identifying Senior High School Students’
Misconceptions about Statistical Correlation, and Their Possible Causes: An
Exploratory Study Using Concept Mapping with Interviews”, International Journal
of Science and Mathematics Education, Vol. 7, pp. 791-820.
Messick, S. ,1989, “Validity”, in Robert L. (Ed), Educational Measurement, The American
Council on Education/Macmillan Series on Higher Education, 3rd Edition, pp. 13-
103, Macmillan Publishing Co, Inc, New York England.
135
Messick, S. , 1995, “Validity of Psychological Assessment Validation of Inferences from
Persons' Responses and Performances as Scientific Inquiry into Score Meaning”,
American Psychologist, Vol. 50, No. 9, pp. 741-749.
Merriman, L., 2006, “Using Media Reports to Develop Statistical Literacy in Year 10
Students”, International Conference on Teaching Statistics, Salvador, Brazil.
Mooney, E. S., 2002, “A Framework for Characterizing Middle School Students’
Statistical Thinking”, Mathematical Thinking and Learning, Vol. 4, No. 1, pp. 23-63.
Pérez López, C. G., S. Villaseñor Pedroza, and A., Palacios Luciano, 2006, “Graduate
Students and Their Use of Statistical Knowledge in Educational Psychology”,
International Conference on Teaching Statistics, Salvador, Brazil.
Reston, E., 2005, “Assessing Statistical Literacy in Graduate Level Statistics Education”,
55th Session of the International Statistical Institute, Sydney, Australia.
Sanchez, J. 2007, “Building Statistical Literacy Assessment Tools with the IASE/ISL”,
International Association for Statistical Education (IASE) /International Statistics
Institute (ISI) Satellite, California, http://www.statlit.org/pdf/2007SanchezIASE.pdf,
accessed at May 2012.
Scheaffer,R.L., A. E., Watkins, and , J. M. Landwehr, 1998, “What Every High School
Graduate Should Know About Statistics”, in S. P. Lajoije (eds.), Reflections On
Statistics: Learning, Teaching, and Assessment in Grades K-12, Erlbaum, New
Jersey.
Schield, M., 1995, “Correlation, Determination and Causality in Introductory Statistics”,
American Statistical Association, Section on Statistical Education, Alexandria, VA.
Schield, M., 1999a, Statistical Literacy: Thinking Critically about Statistics,
http://www.augsburg.edu/ppages/~schield/, accessed at December, 2010.
136
Schield, M., 1999b, “Simpson's Paradox and Cornfield’s Conditions”, American Statistical
Association, Joint Statistical Meeting, Alexandria, VA.
Schield, M., 2001, “Statistical Literacy: Reading Tables of Rates and Percentages”, Annual
Meeting of the American Statistical Association, 2001, Atlanta, Georgia,
http://www.statlit.org/pdf/2001SchieldASA.pdf, accessed at May 2012.
Schield, M., 2002, “Three Kinds of Statistical Literacy: What Should We Teach?”, Sixth
International Conference on Teaching Statistics, Cape Town, South Africa.
http://www.statlit.org/pdf/2002SchieldICOTS.pdf , accessed at May 2012.
Schield, M., 2004, “Information Literacy, Statistical Literacy and Data Literacy”,
International Association for Social Science Information Services and Technology
Quarterly, Vol. 28, pp. 6-11.
Schield, M., 2008, Statistical Literacy Skills Survey,
http://www.statlit.org/pdf/2008SchieldPKAL.pdf, accessed at May 2012.
Sevimli, N. E., 2010, Matematik Öğretmen Adaylarının Istatistik Dersi Konularındaki
Kavram Yanılgıları;; Istatistik Dersine Yönelik Öz Yeterlilik Inançları Ve
Tutumlarının Incelenmesi, M.S. Thesis, Marmara University.
Sorto, M. A., 2006, “Identifying Content Knowledge for Teaching Statistics”, 7th
International Conference on Teaching Statistics, Salvador, Brazil,
http://www.ime.usp.br/~abe/ICOTS7/Proceedings/PDFs/ContributedPapers/C130.pd
f, accessed at December 2010.
Sundre, L. A., 2001, Quantitative Reasoning Quotient Scale, Center for Assessment and
Research Studies. Harrisonburg, VA: James Madison University,
http://www.jmu.edu/assessment accessed at January 2012.
137
Şahin, F., 2011a, “Undergraduate Students’ Questioning of Causal Inferences in Media
Excerpts”, 3rd International Congress on Educational Sciences, Famagusta, North
Cyprus, http://www.statlit.org/pdf/2011SahinICES1up1Media.pdf, accessed at May
2012.
Şahin, F., 2011b, “Statistical Literacy of Turkish Pre-Service Teachers - The Content
Coverage”, 3rd International Congress on Educational Sciences, Famagusta, North
Cyprus, www.statlit.org/pdf/2011SahinICES1up2StatLit.pdf, accessed at May 2012.
Thorndike, R. M., 2005, Measurement and Evaluation in Educational Psychology, 7th
Edition, Pearson Publication, Columbus, Ohio.
Turkish Republic Ministry of Education Board of Education, 2011, Ortaöğretim
Matematik 9, 10, 11, ve 12. Sınıflar Öğretim Programı, Ankara,
http://ttkb.meb.gov.tr/, accessed at May 2012.
Turkish Republic Ministry of Education Board of Education, 2010, 10. Sınıf Araştırma
Teknikleri Dersi Programı, Ankara, http://ttkb.meb.gov.tr, accessed at May 2011.
Turkish Republic Ministry of Education Board of Education, 2009, İlköğretim Matematik
Dersi 6-8.Sınıflar Öğretim Programı, Ankara, http://ttkb.meb.gov.tr/, accessed at
November 2010.
Turkish Republic Ministry of Education Board of Education, 2005, Ortaöğretim
Matematik 9, 10, 11, ve 12. Sınıflar Öğretim Programı, Ankara,
http://ttkb.meb.gov.tr/, accessed at November 2010.
Utts, J., 2003, “What Educated Citizens Should Know about Statistics and Probability”,
The American Statistician, Vol. 52, No. 2, 74-79.
Wade, B. A., 2009, Statistical Literacy in Adult College Students, Ph.D Dissertation,
Pennsylvania State University.
138
Wade, B. and M. Goodfellow, 2009, “Confronting Statistical Literacy in The
Undergraduate Social Science Curriculum”, Sociological Viewpoints, pp.75-90.
Watson, J., 1997, “Assessing Statistical Thinking Using the Media”, in Gal, I., and J. B.,
Garfield, 1997, (Eds), The Assessment Challenge in Statistics Education, pp. 1-15,
IOS press, Amsterdam.
Watson, J. and R. Callingham, 2003, “Statistical Literacy: A Complex Hierarchical
Construct”, Statistics Education Research Journal, Vol. 2, No. 2, pp. 3-46.
Watson, J. and R. Callingham, 2004, “Statistical Literacy: From Idiosyncratic to Critical
Thinking”, Curricular Development in Statistics Education, Sweden, 2004, pp. 116-
162.
Wilson, B. L., 1994, The Development and Evaluation of Instructional Program in
Statistical Literacy for Use in Post-Secondary Education, Ph.D. Dissertation, Illinois
State University.
Wallman, K. K., 1993, “Enhancing Statistical Literacy: Enriching Our Society”, Journal of
the American Statistical Association, Vol. 88, No. 421, pp. 1-8.
Yılmaz, N., 2003, An Examination of Prospective Science And Mathematics Teachers’
Scientific Thinking Abilities in Terms of Media Report Evaluation. M.S. Thesis,
Boğaziçi University.