Deterrent Effects of Mandatory, License Suspension for DWI ...
182
C) U.S. Department of Transportation National Highway Traffic Safety Administration DOT HS 807 138 June 1987 Final Report Deterrent Effects of Mandatory, License Suspension for DWI Conviction This document is available to the public from the National Technical Information Service, Springfield, Virginia 22161.
-
Upload
khangminh22 -
Category
Documents
-
view
3 -
download
0
Transcript of Deterrent Effects of Mandatory, License Suspension for DWI ...
C) U.S. Department of Transportation
National Highway Traffic Safety Administration
DOT HS 807 138 June 1987
Final Report
Deterrent Effects of Mandatory, License Suspension for DWI Conviction
This document is available to the public from the National Technical Information Service, Springfield, Virginia 22161.
The United States Government does not endorse products or manufacturers. Trade or manufacturers' names appear only because they are considered essential to the object of this report.
v
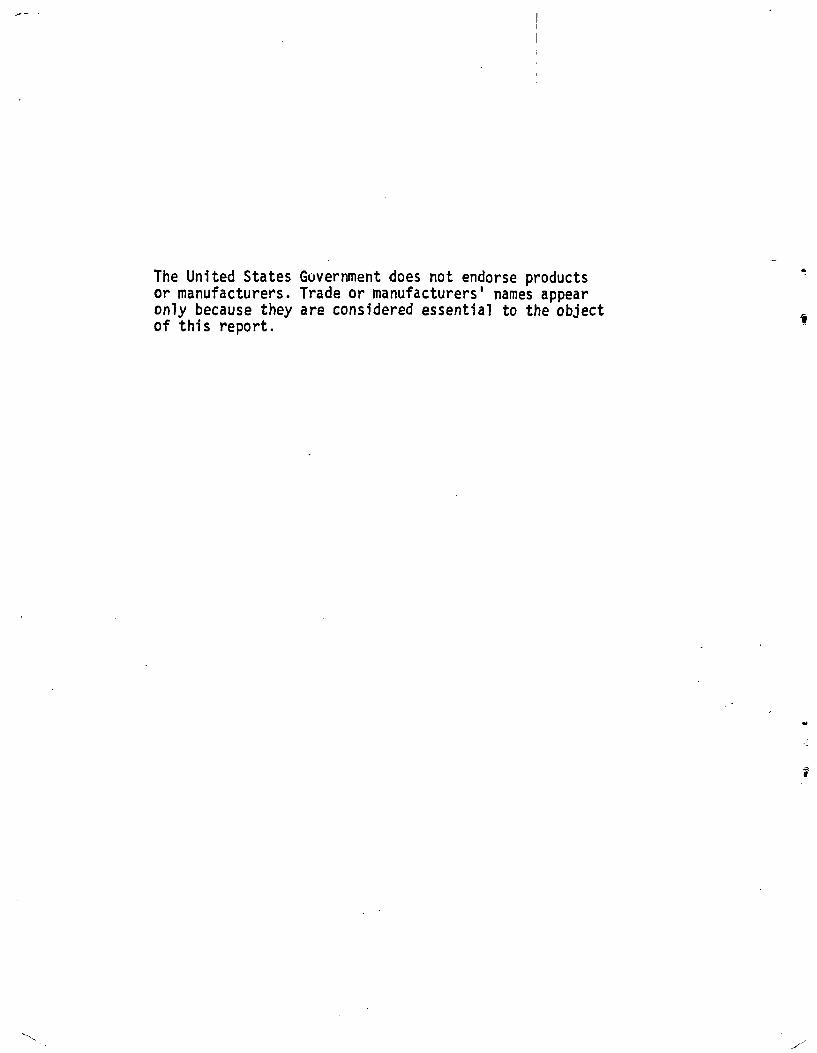
Technical Report Documentation Page
1. Report No. 2. Government Accession No. 3. Recipient's Catalog No.
DOT HS 807 138
4. Title and Subtitle 5. Report Dote
Deterrent Effects of Mandatory License June 1987
6. Performing Orgon-zor.on Code
Suspension for DWI Conviction
8. Performing Orgon,zotton Report No. 7. Authorls)
Blomberg, R.D., Preusser, D.F. and Ulmer, R.G. DA87-1
9. Performing Organization Name and Address 10. Work Unit No. (TRAIS)
Dunlap and Associ ates, Inc. 11. Contract or Grant No. 17 Washington Street Norwalk, CT 068 54
DTNH22-83-C-07014 13. Type of Report and Period Covered
12. Sponsoring Agency Name and Address
U.S. Department of Trans tortation ;.National Highway Traffic Safety Administration
Final Report
October 1983-July 1986 14. Sponsoring Agency Code 400 Seventh Street, S.W.
Washington, DC 20590 15. Supplementary Notes
16. Abstract
The present study examined the specific and general deterrent effects of Wisconsin's 1982 law mandating three to six month license suspensions for first-time convicted drinking drivers. Specific deterrence (stopping repeat drinking and driving among those convicted) was studied statewide before and after the new law. The results showed a reduction in subsequent convictions and crashes for those drivers convicted after May, 1982. General deterrence (stopping the general public from drinking and driving) was studied statewide and in Milwaukee. Statewide, the results suggested a substantial reduction in alcohol related crashes following passage of the law. In Milwaukee, a 1985 media campaign produced a substantial increase in the number of drivers aware of the mandatory suspension following a first drinking and driving conviction. It was concluded that 100% mandatory license suspension is an effective legal sanction against drinking and driving.
7. Key Words 18. Distribution Statement
Drinking and Driving Public Education Document is available to the U.S. Public Sanctions License Suspension
Driver Survey through the National Technical Information Service, Springfield, VA 22161
Alcohol Crashes
19. Security Clossif. (of this report) 20. Security Classif. (of this page) 21. No. of Pages 22. Price
Unclassified Unclassified
orm DOT F 1700.7 (8-72) Reproduction of completed page authorized
1
F
-i
DEPARTMENT OF TRANSPORTATION NATIONAL HIGHWAY TRAFFIC SAFETY ADMINISTRATION
TECHNICAL SUMMARY
CONTRACTOR Dunhill mid Asso('iiites, Inc. CONTRACT NUMBER
17 Wi shing1on Str•(eet D TN 1122-83-C-0 7014 Norwaalk, ('1' 06854
REPORT TITLE REI'ORT DATEDeterrent Effects of Mrlndatory License Suspension for DWI Conviction ,June 1987
REPORT AUTHOR(S) Blomberg, R.D., Preusser, D.F. and Ulmer, R.G.
Previous studies of traditional DWI sanctions (fines, jail, license suspension/revocation) have shown that a license action appears to offer the most promise in reducing recidivism (repeat DWI offenses). However, little is known about whether these sanctions, properly implemented, can serve as a general deterrent to DWI (reducing DWI among the general driving public).
In order for a general deterrent to be effective, the public must believe the penalty will be imposed on them if they are caught. In several states, the statutes specify that a license action is "mandatory," but a review of actual practices revealed that few states suspended or revoked the license of all or nearly all drivers following a first conviction.
One exception to this practice is the State of Wisconsin. In 1981, 45% of convicted Wisconsin drinking drivers lost their licenses. In 1982, mandatory loss of license legislation was implemented and from May 1982 to December 1985, 100% of convicted DWIs (reported to the Wisconsin Bureau of Driver Licensing) lost their licenses for at least 90 days.
The purpose of the present study was to examine the general and specific deterrent effects of mandatory license suspension within the context of Wisconsin's 1982 law. General deterrence refers to stopping drinking and driving among the general population and was measured using crash data. Specific deterrence refers to stopping repeat drinking and driving among those convicted and was measured using DWI recidivism rates.
General Deterrence I:
An examination of the trend in motor vehicle crashes under the old (pre-1982) and new Wisconsin DWI laws was conducted using a surrogate measure of alcohol related crashes (single vehicle night-time weekend accidents involving male drivers which resulted in an injury or fatality). It is known from previous research that these crashes are heavily alcohol involved.
(Continue on additional pages)
"PREPARED FOR THE DEPARTMENT OF TRANSPORTATION, NATIONAL HIGHWAY TRAFFIC SAFETY ADMINISTRATION
UNDER CONTRACT NO.: DTNH22-83-C-07014. THE OPINIONS, FINDINGS, AND CONCLUSIONS EXPRESSED IN THIS PUBLICATION ARE THOSE OF THE AUTHORS AND NOT NECESSARILY THOSE OF THE NATIONAL HIGHWAY TRAFFIC SAFETY ADMINISTRATION."
HS For. 321July 1974
*
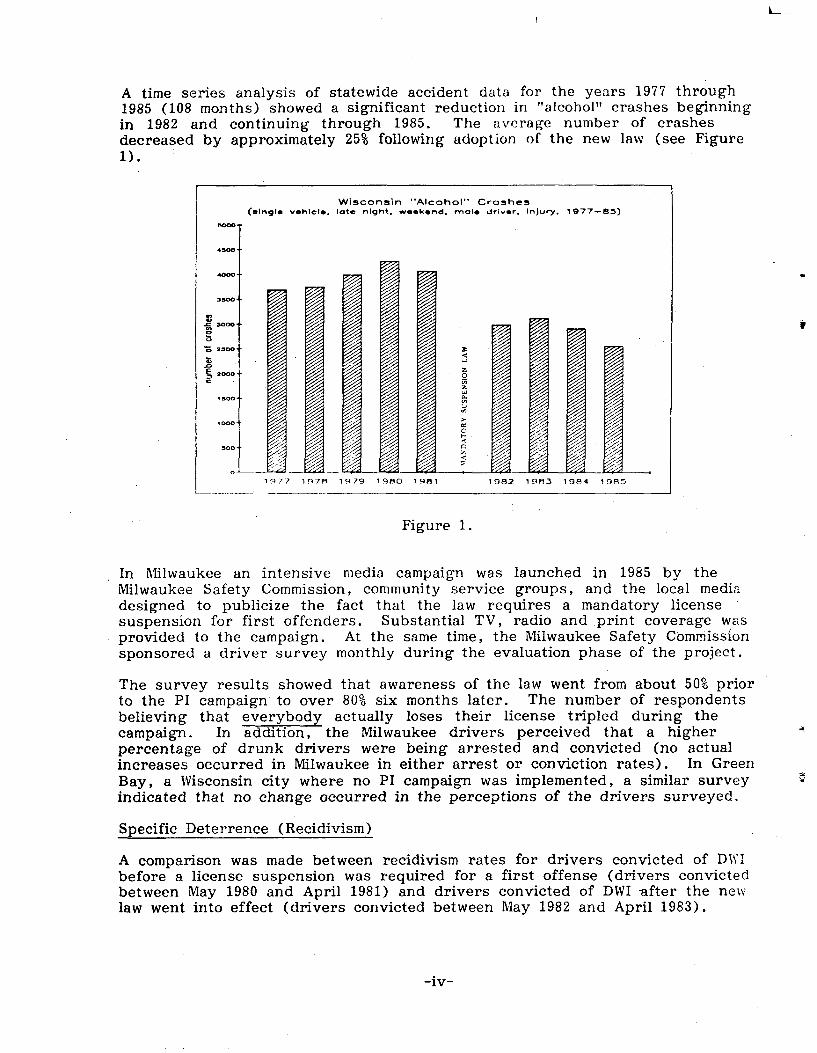
A time series analysis of statewide accident data for the years 1977 through1985 (108 months) showed a significant reduction in "alcohol" crashes beginningin 1982 and continuing through 1985. The average number of crashesdecreased by approximately 25% following adoption of the new law (see Figure1).
IWisconsin "Alcohol" Crushes
(single vehicle, late night, weekend, male driver. Injury. 1977-85)
5000 T
•900 4
3900 t
3000
1977 1978 1979 1980 1981
0 1_ L, _-
Figure 1.
1982 1953 1984 1985
In Milwaukee an intensive media campaign was launched in 1985 by theMilwaukee Safety Commission, community service groups, and the local mediadesigned to publicize the fact that the law requires a mandatory licensesuspension for first offenders. Substantial TV, radio and print coverage wasprovided to the campaign. At the same time, the Milwaukee Safety Commissionsponsored a driver survey monthly during the evaluation phase of the project.
The survey results showed that awareness of the law went from about 50% prior **
to the PI campaign to over 80% six months later. *
**
The number of respondentsbelieving that everybody actually loses their license tripled during thecampaign. In addition, the Milwaukee drivers perceived that a higherpercentage of drunk drivers were being arrested and convicted (no actualincreases occurred in Milwaukee in either arrest or conviction rates). In GreenBay, a Wisconsin city where no PI campaign was implemented, a similar surveyindicated that no change occurred in the perceptions of the drivers surveyed.
Specific Deterrence (Recidivism)
A comparison was made between recidivism rates for drivers convicted of DWIbefore a license suspension was required for a first offense (drivers convictedbetween May 1980 and April 1981) and drivers convicted of DWI -after the newlaw went into effect (drivers convicted between May 1982 and April 1983).
-iv-
*
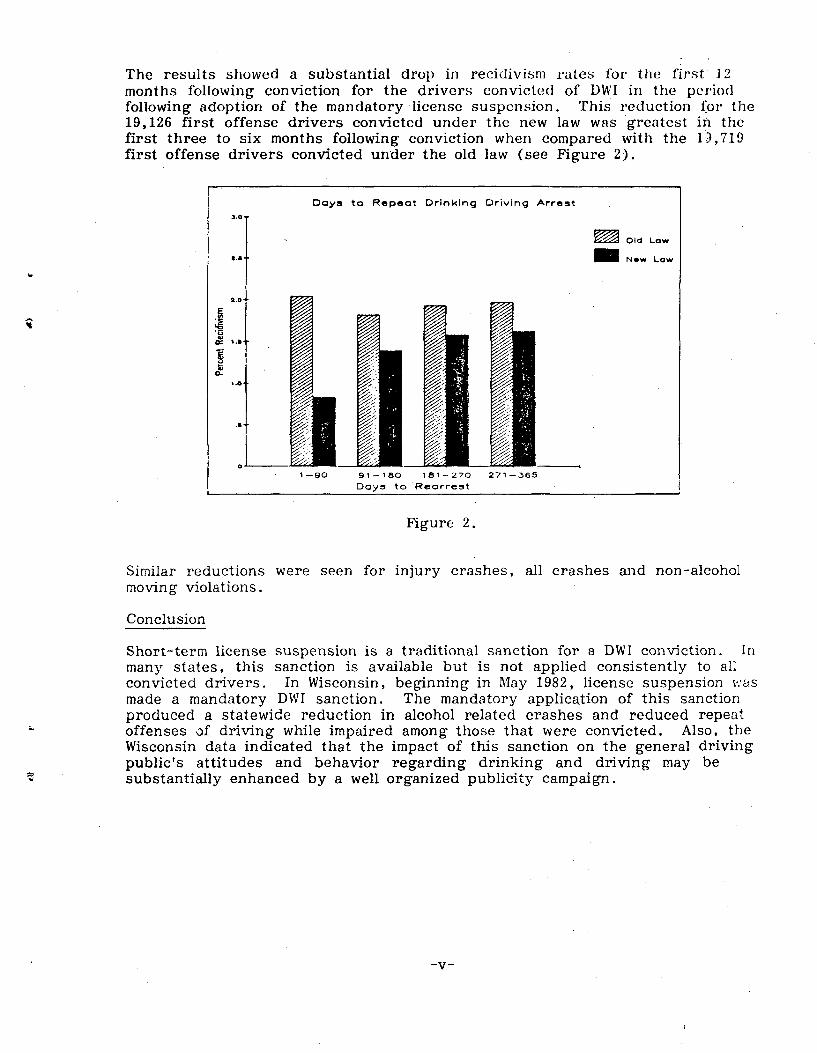
The results showed a substantial drop in recidivism rates for the first' 12months following conviction for the drivers convicted of DWI in the periodfollowing adoption of the mandatory license suspension. This reduction for the19,126 first offense drivers convicted under the new law was greatest in thefirst three to six months following conviction when compared with the 0,719first offense drivers convicted under the old law (see Figure 2).
Days to Repeat Drinking Driving Arrest
].o
Old Law
_•, N.w Low
Ci
7
0-
1.0
1_90 91 - 1 80 1 81 - 270 271 -365
Days to Rearrest
Figure 2.
Similar reductions were seen for injury crashes, all crashes and non-alcoholmoving violations.
Conclusion
Short-term license suspension is a traditional sanction for a DWI conviction. Inmany states, this sanction is available but is not applied consistently to allconvicted drivers. In Wisconsin, beginning in May 1982, license suspension wasmade a mandatory DWI sanction. The mandatory application of this sanctionproduced a statewide reduction in alcohol related crashes and reduced repeat *
offenses of driving while impaired among those that were convicted. Also, theWisconsin data indicated that the impact of this sanction on the general drivingpublic's attitudes and behavior regarding drinking and driving may besubstantially enhanced by a well organized publicity campaign.
i
ACKNOWLEDGMENTS
It would be impossible to acknowledge all of the people who contributed to this project from the National Highway Traffic Safety Administration, the Wisconsin Department of Transportation, the Milwaukee Safety Commission, the Milwaukee Chapter of Mothers Against Drunk Driving and Milwaukee media, schools and other organizations. Nevertheless, what follows is a partial list of the many people who generously provided their time and effort and without whose help this project would not have been possible.
National Highway Traffic Safety Administration
Dr. Richard P. Compton, Contract Technical Manager
Wisconsin Department of Transportation
Mr. Eugene C. Fencl, SupervisorMotor Vehicle Services
Mr. Russell R. Flemming, ChiefAccident Data Section
Ms Julie Hughey, Alcohol CoordinatorOffice of Traffic Safety
Ms Dorothy KapkeCommunications, Wisconsin D.O.T.
Mr. Russell Karweik, Manager, District 8Driver Examination and Improvement
Mr. Robert E. Kindschi, DirectorBureau of Driver Licensing
Mr. Maynard StoehrWisconsin State Highway Safety Coordinator
Milwaukee
Mr. Darwin G. Cone, Assistant Managing DirectorMilwaukee Safety Commission
Mr. Robert J. Lanier, PresidentBob Lanier Enterprises
Ms Augustine Moore, StudentUniversity of Wisconsin at Milwaukee
Mr. Joseph Phillips, PresidentTorii Advertising, Inc.
-vi
Milwaukee (Continued)
Neil H. Rathjen, Curriculum SpecialistMilwaukee Public Schools
Mr. George Al. Richard, Safety EducatorMilwaukee Safety Commission
Mrs. Micky Sadoff, PresidentMilwaukee Chapter, MADD
Mr. Paul Sara, Assistant. Regional ManagerFoster and Kleiser, Inc.
Mr. Rod SynnesMr. Edward HinshawPublic Affairs, WTMJ
Hon. Jeffrey A. Wagner, JudgeMunicipal Court, Branch 2
Mr. Henry A. Wantoch, Managing DirectorMilwaukee Safety Commission
Mr. Robert J. Ziarnik, ChiefMilwaukee Police Department
Special thanks should be extended to the Honorable Henry Maier, Mayor of Milwaukee for his active support throughout this project. We would also like to thank WTMMMJ-TV for generously donating studio time for the production of TV and radio materials. And, we would like to thank the Outdoor Advertising Association, and Foster and Kleiser, Inc., for generously donating space on 100 billboards for the period of the media effort.
TABLE OF CONTENTS
1. INTRODUCTION
II. SITE SELECTION AND METHODS
A. IntroductionB. Wisconsin LawC. General DeterrenceD. Specific Deterrence
III. OWI ARREST AND ADJUDICATION PROCESS EVALUATION
A. StatewideB. Milwaukee
IV. GENERAL DETERRENCE ANALYSIS
A. ApproachB. Survey Results
V. ACCIDENT DATA ANALYSIS
A. ApproachB. Statewide ResultsC. Milwaukee Results
VI. SPECIFIC DETERRENCE ANALYSIS
A. ApproachB. Results
VII. DISCUSSION
VIII. REFERENCES
APPENDIX A - Survey Forms
APPENDIX B - Survey Data
Page
1
4
445
11
13
1319
22
2224
36
363839
49
4951
57
61
TABLE OF CONTENTS
Page
1
4
445
11
ON 13
1319
22
2224
36
363839
49
4951
57
61
I. INTRODUCTION
II. SITE SELECTION AND METHODS
A. IntroductionB. Wisconsin LawC. General DeterrenceD. Specific Deterrence
III. Owl ARREST AND ADJUDICATION PROCESS EVALU
A. StatewideB. Milwaukee
IV. GENERAL DETERRENCE ANALYSIS
A. ApproachB. Survey Results
V. ACCIDENT DATA ANALYSIS
A. ApproachB. Statewide ResultsC. Milwaukee Results
VI. SPECIFIC DETERRENCE ANALYSIS
A. ApproachB. Results
VII. DISCUSSION
VIII. REFERENCES
APPENDIX A - Survey Forms
APPENDIX B - Survey Data
ATIe
1
LIST OF TABLES
Table No. Page
1 Comparison of Licensed Drivers, OWI Arrests and 15 OWI Convictions
2 Disposition of OWI Cases 16
3 OWI Revocations and Suspensions 17
4 Drinking and Driving Arrests, City of Milwaukee 19
5 Exposure to Media Materials, November 1984 - June 1985 26
6 Knowledge of Loss of License 29
i 7 Perceived Probability of Arrest and Conviction 32
8 Self-Reported Violations of DWI Law 35
9 Wisconsin Accident Distributions 40
10 Models for Wisconsin Alcohol Series .41.
11 Milwaukee Accident Distributions 43
12 Models for Milwaukee Alcohol Series 46
13 Forecast Model for Milwaukee Alcohol Series 48
14 Subsequent Convictions and Crashes of Old Law and 52 New Law Groups
LIST OF FIGURES
Figure No. Page
1 Newspaper Coverage of Press Conference 10
2 Comparison of Occupational Licenses Issues and 18 OWl Convictions
3 "Alcohol" Monthly Accident Series Statewide in Wisconsin 42
4 "Non-Alcohol" Monthly Accident Series Statewide in 42 Wisconsin
5 "Alcohol" Monthly Accident Series in Milwaukee 44
6 "Non-Alcohol" Monthly Accident Series in Milwaukee 44
7 Days to OWI Recidivism 55
8 Days to Injury or Fatal Crash 55
9 Days to Motor Vehicle Crash 56
10 Days to Moving Violation - 56
I. INTRODUCTION
This is the final report under Contract Number DTNH22-83-C-07014 between the U. S. Department of Transportation, National Highway Traffic Safety Administration (NHTSA), and Dunlap and Associates, Inc. The project reported herein was entitled "Deterrence Value of Traditional DWI Sanctions."
The problem of the drinking driver has been a major highway safety concern for some time. Numerous efforts have been mounted by federal, state and local governments as well as private organizations to reduce the role alcohol plays in highway deaths and injuries. One obvious way to accomplish this, reduction is by deterring driving after the consumption of a quantity of alcohol which would raise a person's blood alcohol concentration (BAC) to a point at which accident risk is greatly increased. This point has been legally defined by most states as a presumptive limit, i.e., a BAC at which a driver is presumed to be intoxicated as a matter of evidence, and/or a "per se" level, i.e., a BAC at which it is, per se, illegal to operate a motor vehicle.
When considering deterrence in the context of drinking and driving, two separate notions arise. The first is typically called "general deterrence" and refers to the prevention of a driving while intoxicated offense (DWI or OWI--operating while intoxicated as it is referred to in some states) among the driving population. In essence, general deterrence, focuses on stopping the initial DWI event. The second type of deterrence considered is "specific deterrence." This refers to the prevention of a subsequent DWI event, i.e., recidivism, among those drivers already arrested and convicted for the offense. This two part view of drinking and driving deterrence is a useful structure as it distinguishes the types of impact one could expect from specific countermeasure activities as well as the techniques required to assess such impact.
One class of countermeasures which is universally applied to the deterrence of drinking and driving is the law. In most state and local laws, there are vehicle and traffic sections as well as criminal statutes which address driving while intoxicated or under the influence of alcohol. Operationally, these laws provide a definition of the offense and specify sanctions for drivers convicted of a violation. It is anticipated that the contemplation of the applicable sanctions will deter people from committing the offense and that those exposed to the sanctions will thereby be deterred from repeating the offense. However, the issue of the relationship between the type and severity of the sanction imposed for DWI and the resulting effect on general and specific deterrence is largely unresolved.
In order to examine some of the relationships of sanctions to deterrence, NHTSA embarked on a program of research. This program divided the realm of sanctions into "traditional" sanctions, such as fines and license actions, and "innovative" sanctions, such as mandatory community service. This division separated the examination of new levels and methods of application of existing or "traditional" sanctions from research on new approaches which are being adopted in some locales.
i
The study reported herein was delimited to focus on traditional sanctions. Mandatory, short-term l:iaense suspension (nominally 90 days) for a first DWI offense was the particular traditional sanction selected for study. Although the suspension of a convicted DWI's license has been a generally available judicial or administrative sanction for some time, the notion of mandating it and thereby eliminating its discretionary employment in the sanctioning process is relatively new. It has been postulated that the sure, unavoidable loss of a drivers license would provide a greater deterrent effect than a possible suspension which might be avoided through plea bargaining or opting for- an alternative such as entry into an alcohol education program. Short-term suspensions as opposed to longer-term license suspensions or revocations (i.e., 6 months to 1 year duration) were selected for study because they appear to be amenable to legislative adoption, likely to be viewed as "appropriate" by the general public and less likely to be ignored by those to whom the sanction was applied. That is, they are postulated to be sufficiently strong to yield a meaningful deterrent effect while not being viewed as so harsh as to discourage legislative enactment or causing disruption by significantly increasing contested case loads.
In order for a short-term, mandatory suspension law, or any law for that matter, to operate as a deterrent, its existence and consequences must be known by the target population. In the context of this study, then, the large majority of alcohol-using drivers would have to be aware of the fact that a first conviction for DWI would lead without fail to a loss of the driving privilege for a minimum of 90 days. To the extent that this fact is not known by the driving population, the law cannot be fully operative as a deterrent. One problem, therefore, which faced the current effort was to identify an environment in which a mandatory short-term suspension law for a first conviction DWI ("the law') was sufficiently operative to support an examination of its deterrent effect.
The ideal climate in which to examine the benefits of a mandatory short-term license suspension ("the sanction") would be a jurisdiction in which the law would be debated and passed after a set of baseline data had been collected. These data would include measures of pre-existing general deterrence, knowledge of sanctioning practices, an analysis of recidivism to assess specific deterrence and data on alcohol-related accidents. After the adoption of the mandatory license sanction, these measures would be repeated to determine if meaningful changes occurred. One or more comparison areas which were quite similar to the study site in all relevant aspects except the adoption of the sanction would be available and used as comparisons. This would yield a pre/post experimental design with comparisons.
Unfortunately, real-world situations rarely arise which fit this ideal mold. Such was the case when this study began. Several states were found which had recently adopted the sanction but none could be located in which a transition to a mandatory, short-term suspension sanction was likely to occur during the study period.
In light of these realities, a surrogate design was sought which could address all of the salient issues in a valid if not ideal manner. Such a design was devised and is described in detail in Section II. This design involved the use of a state, Wisconsin, in which the sanction had been passed but in which available data indicated that the prevailing operability of its deterrent effect
0
c
-2
was low. That is, relatively few people were aware that a license suspension for a minimum of 90 days was assured for a first DWI (OWI in Wisconsin) conviction. It was reasoned that raising the operability level of the law through public information and education (PI&E) efforts would be a reasonable surrogate for a pre/post situation in which the newly adopted law reached a level of operability consistent with that achieved by the PI&E efforts.
The adopted study approach necessitated the division of the research into several sub-studies. Since the Wisconsin law was already in effect, no true "before" or baseline data could be collected. However, existing state accident and driver records files did cover the period prior to the May 1, 1982 enactment of the sanction. Analyses of the law's impact on general deterrence were possible by mounting a PI&E campaign to increase the operability of the sanction to a level at which the law could truly be considered to be in effect. Specific deterrence could be examined from the state driver record files, but only for the limited time span over which records were retained in that file. Potential accident effects could be studied over a longer period of time because the data were available from previous studies, but no quantitative measures of alcohol involvement were contained in the accident files.
The differences in approach and scope among a PI&E campaign aimed at increasing awareness of an existing law, a recidivism (specific deterrence) analysis based on a driver records file and a multi-year accident analysis suggested the need to partition the current effort into sub-studies. In addition, there was interest in assessing the impact of the new law on the process of adjudicating OWI offenses in Wisconsin. Hence, four separate efforts were undertaken and are documented in the balance of this report. Section III covers the process evaluation. Section IV addresses the general deterrence analysis while Section V contains related analyses of Milwaukee and statewide traffic accident data. Analyses regarding specific deterrence are then presented in Section VI. Before turning to these various sub-studies, a detailed discussion of the criteria used to select Wisconsin as the study site and the overall experimental design philosophy and methods for all of the project's activities are reported in Section II. A discussion integrating the various findings concludes the report.
11. SITE SELECTION and METHODS
A. Introduction
The objective of this study was to investigate the general and specific deterrence value of traditional DWI sanctions in reducing drinking and driving. As just noted, this project focused on short-term license suspension.
Most states allow for license suspensions or revocations of one month to one year for a first conviction of drinking driving. Longer suspensions are common for second and third convictions. This suspension /revocation is listed as "mandatory" in several states, but a review of actual practice as well as site visits revealed that few states suspended or revoked the licenses of all or nearly all drivers following a first conviction. The objectives of this. project suggested that license suspension /revocation should be studied in a pure form as opposed to situations in which some drivers are suspended and others are not. Therefore, the first requirement for site selection was to locate an area where all convicted drinking drivers lose their license for a first offense.
The second site selection requirement was to identify an area in which some form of pre versus post comparisons were possible. Ideally, for the study of general deterrence, this would have involved a state that was changing from no or only limited suspensions to a policy of suspending all convicted drinking drivers such that pre vs. post comparisons would be possible. Such a state was not found. Therefore, this situation was approximated by selecting an area where all drivers were suspended or revoked but in which the general population was largely unaware of this fact. In such an area, a public information program which reached all or most of the population could inform people of this fact and approximate a pre versus post situation. In other words, the population was unaware of the mandatory nature of the law and later became aware.
Following site visits to several States and extensive negotiations, the state selected was Wisconsin and the selected general deterrence test site was Milwaukee. In conjunction with state and local groups and individuals, initial knowledge and awareness measures were collected in Milwaukee and in Green Bay, Wisconsin; which was selected as the comparison community. A public information program aimed at achieving general deterrence was launched in 11
V
Milwaukee and the effects of this program were monitored through monthly surveys. Specific deterrence was evaluated statewide by comparing drivers convicted prior to May 1, 1982, when mandatory suspension was introduced, to drivers convicted of first offense drinking and driving after that date. The following discusses the Wisconsin law, the characteristics of Milwaukee as a general deterrence test site, the general deterrence test and the specific deterrence test.
B. Wisconsin Law
In 1981, Wisconsin enacted new and greatly strengthened drinking driver legislation referred to as "Chapter 20" of the state budget bill and codified in Sections 346.63 and 343.30 of the Wisconsin Motor Vehicle Law. The major elements of this new legislation became effective on May 1, 1982. The
-4
legislation included ar. illegal per se (.10%) provision, possible impounding of the vehicle of someone driving while under suspension, a $150 surcharge on the fine, mandatory mini-mum three month license suspension and a provision discouraging plea bargaining to a lesser charge. The law also strengthened an existing "Assessment" program under which a convicted drinking driver must undergo screening for alcohol problems and accept atreatment assignment based on the assessment results. Typically, this involved attending an alcohol-education school.
For this study, the key provision of the new legislation was the mandatory suspension of the license. Also, mandatory suspension was the most significant change in the new law as compared with existing statutes. An analysis of court activity conducted by the State showed that in 1981, the last full year under the old law, 45 percent of convicted drinking drivers had their licenses suspended or revoked. In 1983, the first full year under the new law, 100 percent of convicted drinking drivers had their license suspend or revoked. Also, the May 1, 1982 effective date was a convenient one for a pre versus post analysis of specific deterrence. As discussed later in this report, driver record data for the periods before and after the new law could be obtained and analyzed for repeat alcohol violations and accidents among people convicted before and after May 1, 1982.
The present project was concerned with assessing both the general and specific deterrent effects of short term license suspension as a mandatory sanction for first offense drinking and driving. General deterrence was studied in Milwaukee, the impact of adoption of the new law was examined statewide as was the question of the specific deterrent effects of the law. The paragraphs below discuss the characteristics of Milwaukee and the methods employed for the general deterrence test. Specific deterrence is discussed in the next section.
C. General Deterrence
1. Milwaukee Overview
Approximately one-third of Wisconsin's four million people live in the greater Milwaukee area. Milwaukee has an active chapter of Mothers Against Drunk Driving (MADD) and a Safety Commission with a full-time staff. No other city in the State is as large nor does any other city have Milwaukee's full range of media outlets. Therefore, Milwaukee was the obvious first choice as a Wisconsin test site for general deterrence.
The various activities of this project impacted differentially on Milwaukee City, County and full Standard Metropolitan Statistical Area (SMSA). That is, all PI&E activities involved the City, nearly all involved County communities beyond the City and only some activities involved communities in the fringe areas of the SMSA. Therefore, for practical purposes, the test site for this project should be considered as Milwaukee County with possible impact in the outlying areas of the SMSA.
The primary target group was the driving age public in Milwaukee County. The minimum licensing age in Wisconsin is 16 years, therefore, as per the 1980 U.S. Census, the primary target group consisted of 743,791 people 16 years of age and older who resided in Milwaukee County. These people are 85 percent White, 13 percent Black, and 2 percent Hispanic. They come from
-5
households with a median income of $18,122 (1979) and 87 percent consider English as their primary :anguage. The city has many ethnic neighborhoods of German and Eastern European extraction. It is a major port on Lake Michigan, is a center for banking and commerce and has several large industrial facilities.
The selected comparison city for Milwaukee was Green Bay. Green Bay is substantially smaller than Milwaukee (population 175,280 in Brown County) but has many of Milwaukee's characteristics and is sufficiently distant from Milwaukee to avoid contact with Milwaukee media. Green Bay is also a major port on Lake Michigan, is basically an industrial city and, most importantly, is subject to the same Wisconsin Vehicle and Traffic Law as Milwaukee.
2. Milwaukee Awareness of Law
The selection of Milwaukee as the test site rested on the noted existence of the recent Wisconsin legal changes, the willingness of individuals, groups and government agencies to cooperate and on the city's characteristics key among which was low awareness among the population of OWI sanctioning practices. That is, to be appropriate, the general deterrence test in Milwaukee required that drivers be generally unaware of mandatory license suspension at the outset of the project.
In September o: 1984, a locally sponsored telephone survey was conducted among 100 licensed drivers from the greater Milwaukee area. This survey, conducted through the Milwaukee Safety Commission, had the limited objective of assessing driver awareness of the mandatory provisions of the law. That is, the survey ascertained how many licensed drivers in the general population were aware that a first offense drunk driving conviction entailed certain loss of license for at least three months. The survey was conducted between September 11 and September 14 from 5:30 to 9:00 in the evening. The sample was drawn using randomly selected residence telephone numbers from the Milwaukee Metro Area Telephone Directory.
The results indicated that only ten percent of the respondents were aware of the mandatory aspect of license suspension following a first conviction for drinking driving. An additional one percent were aware after the interviewer provided a "prompt" for license suspension and an additional two percent were aware of the certainty of suspension but felt that it was for a period of less than three months. Of the remaining respondents, many mentioned license suspension as a penalty for drinking driving but none felt that a large majority of convicted drivers let their license. As 100 percent of convicted drinking drivers have lost their Lr=enses since May 1982, these results suggested that a pre versus post evalua. ion was feasible in which the intervening treatment was a public information program informing drivers that a drinking driving conviction guarantees c.:rtain loss of license. These small-sample telephone results ultimately were found to be very similar to the larger sample baseline survey results collected at the driver licensing stations after Milwaukee was formally selected as the general deterrence test site (see Section IV).
3. Program Organization
The primary local agency in the Milwaukee program was the Milwaukee Safety Commission. The Commission is composed of government and private
-6
9
i
sector leaders who have an interest in safety. Private and public schools, city transit, industry etc., are represented. The Commission has a full-time Managing Director, a. senior staff of safety professionals and a support staff. These individuals implement safety programs for the schools, for industry and for private groups.
The Safety Commission was approached in early September, 1984 and asked if they would be interested in not only having the general deterrence test in Milwaukee, but in serving as the coordinating agency and assisting in the distribution of materials. They expressed interest in the project and sponsored the pilot telephone survey mentioned above. Contact was also, made with the Milwaukee Chapter of MADD. They strongly supported the project and offered their help both in the distribution of materials and in promoting the project within their own activities.
The Safety Commission provided the project team with introductions to various other officials in Milwaukee including those officials who were members of the Commission. In this way, liaison for the project was established with the school system, the police, the Municipal Court, the Office of the Mayor, local media and others. For the remainder of the general deterrence test, all press and media releases prepared by the project were distributed under the auspices of the Commission. While it was clear that funding for this effort was coming from NHTSA, every attempt was made to utilize local resources and build the media effort as a local program.
Contacts were also initiated with the Office of Highway Safety for the State of Wisconsin. The Alcohol Coordinator in this Office arranged meetings for the project team with the Office of Communications (to coordinate the Milwaukee program with statewide efforts), the Director of Field Operations (to implement the Milwaukee Safety Commission survey at Driver Licensing Stations) and the Driver Licensing Bureau (to arrange for the driver records which would be needed for the specific deterrence evaluation). Provisions were also made to secure accident data for use in evaluating both the Milwaukee and statewide portions of this project.
4. Media Plan
The primary general deterrence "treatment" in this study was a city-wide public information program to increase awareness of the fact that loss of license is guaranteed following a drinking driving conviction in Wisconsin. The project-developed campaign was launched through the Milwaukee Safety Commission and was supported by the local MADD Chapter. Elements of the campaign were coordinated through the State's Office of Highway Safety.
The campaign began in late 1984 and ran until June of 1985. Obviously, as with any public service campaign that is scheduled to run for six months, campaign materials and activities had to be phased in and scheduled such that the campaign remained active and new materials were continually available to maintain interest. This was accomplished by conducting the campaign in four phases.
Phase 1 of the campaign was conducted utilizing donated production and air time of - TMJ-TV and WTMJ-AM and FM radio. WTMJ was planning to conduct an alcohol public service campaign for the Christmas season of 1984.
-7
i
They had discussed their plans with the Safety Commission. Thus, when the present project began, the first media contacts were with this station and they agreed to offer a substantial amount of help. WTMJ donated studio and finishing time to produce six 30 second television, six 10 second television and six radio spots.
Each of the six WTMJ 30 second television spots begins with a voice-over announcer and graphic information concerning the certainty of loss of license. Then, one of six local personalities or officials reiterate the basic message:
"The day you are convicted of drunk driving is the day you will lose your license. In Milwaukee, it's guaranteed!"
The six people delivering the message were: The Milwaukee Chief of Police; the Managing Director of the Safety Commission; a Judge from the Municipal Court; the local President of MADD; a student from the University of Wisconsin at Milwaukee; and Bob Lanier, a former star with the Milwaukee Bucks basketball team. These same individuals also recorded the companion radio spots.
The Phase 1 materials aired on the WTMJ stations from Thanksgiving to Christmas in 1984. WTMJ continued to air the spots, though at a reduced level, for the remaining five months of the campaign. All spots were "tagged" as public service messages from WTMJ and the Milwaukee Safety Commission.
Phase 2 of the campaign marked the formal county-wide kickoff. One new 30 second television spot, and three new radio spots were produced for distribution to all stations. The theme of these materials was that "Nobody", not the judge, not your lawyer, and not the prosecutor can keep you from losing your license if you are convicted of drinking and driving - "In Milwaukee it's Guaranteed." Also, five live copy radio spots were prepared for use by on-air radio announcers and a slide package was prepared for Safety Commission presentations to industry and civic groups.
The starting date for the main campaign was January 15, 1985. The campaign began with a press conference at the Municipal Court in the same court room where convicted drivers routinely lose their licenses. The purpose of this press conference was to demonstrate total community support for the program and to obtain news coverage for the campaign theme. The following groups, organizations and agencies were represented:
Milwaukee Safety Commission Municipal Court Milwaukee Police Milwaukee County Sheriff City Attorney Wisconsin State Highway Patrol Wisconsin Department of Transportation Wisconsin Office of Highway Safety Milwaukee Mother's Against Drunk Driving Milwaukee Council on Alcoholism Outdoor Advertising Association
9
8
-8
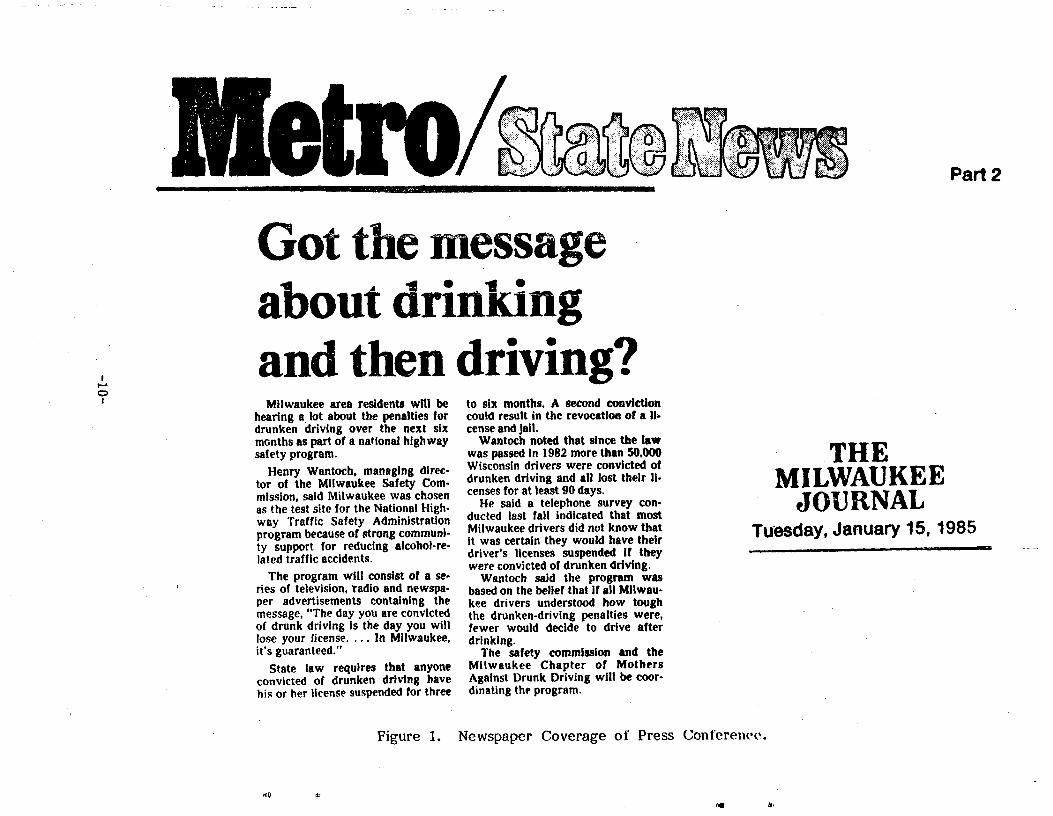
All three Milwaukee network television affiliates covered the press conference and approximately five radio stations were represented. The Milwaukee Journal wrote a story based on the news release. This newspaper coverage is shown in Figure 1. The new television and radio spots were distributed to all Milwaukee stations immediately following the press conference. In Milwaukee, there are three network television stations, two major television independents and 16 radio stations.
Phase 3 of the campaign also began immediately after Phase 1 and consisted of the distribution of print materials. The first print item was a large poster which read:
"The day you are convicted of drunk driving is the day you will lose your license ...... GUARANTEED
This was distributed to the 500 largest employers in the City, schools and City office buildings. Distribution was accomplished by the Safety Commission and AIADD.
The second print item was an outdoor billboard which depicted the fact that a drunk driving conviction equals a suspended license ... GUARANTEED. Foster and Kleiser, Inc., through the Outdoor Advertising Association, donated 100 billboards in Milwaukee County for the four month period February to May, 1985. The commercial value of this advertising space was approximately $136,000. The first billboard was unveiled by the Mayor of Milwaukee on February 8.
Phase 4 of the campaign consisted of re-editing the original WTPUUJ spots from hase 1 and distributing these to the other television stations in the city. Originally, these spots contained a tag line which said that they were a public service of WTMJ and the Safety Commission. With the permission of WTT.IJ, the I;ag line was changed to say only that they were a public service of the Safety Commission. The spots were distributed to the other stations in early April, 1985. It was felt that the original distribution to these stations in January would have run its course by this time and that this second distribution would help continue the campaign.
The progress of the campaign was continually monitored both through reports from the Safety Commission and local groups and through the Safety Commission survey which was being conducted at the Driver Licensing Stations. Anecdotal evidence clearly indicated that the television and radio materials were being aired frequently, and, at least for the months of March, April and May, it was virtually impossible to drive for any distance in the County without passing one of the billboards.
5. Evaluation
Three very different activities were undertaken to evaluate the effects of the Milwaukee test of general deterrence. First, a driver survey was conducted by the state as part of the photo-licensing process -at Driver Licensing Stations in Milwaukee and in Green Bay. The objectives of this survey, conducted for one week per month during each month from November, 1984 to June, 1985, were to: measure exposure to the campaign materials; measure knowledge of guaranteed loss of license for a first drinking driving
-9
*
Part 2
Got the messageabout drinkingand then driving?
Milwaukee area residents will be to six months. A second convictionhearing a lot about the penalties for could result in the revocation of a ii=drunken driving over the next six cense and jail.months as part of a national highway Wantoch noted that since the lawsafety program. was passed in 1982 more than 50,000
Wisconsin drivers were convicted ofHenry Wantoch, managing direc-drunken driving and all lost their li-tor of the Milwaukee Safety Com-censes for at least 90 days.mission, said Milwaukee was chosen
He said a telephone survey con-as the test site for the National High-ducted last fall indicated that mostway Traffic Safety AdministrationMilwaukee drivers did not know thatprogram because of strong communi-it was certain they would have theirty support for reducing alcohol-re-driver's licenses suspended if theylated traffic accidents. were convicted of drunken driving.
The program will consist of a se- Wantoch said the program wasries of television, radio and newspa- based on the belief that if all Milwau-per advertisements containing the kee drivers understood how toughmessage, "The day you are convicted the drunken-driving penalties were,of drunk driving is the day you will fewer would decide to drive afterlose your license. ... In Milwaukee, drinking.it's guaranteed." The safety commission and the
State law requires that anyone Milwaukee Chapter of Mothersconvicted of drunken driving have Against Drunk Driving will be coor-his or her license suspended for three dinating the program.
*
THEMILWAUKEE
JOURNALTuesday, January 15, 1985
Figure 1. Newspaper Coverage of Press Conference.
4r
l'S
i
conviction; and to measure any changes in attitudes and behavior concerning drinking and driving as the campaign developed. Second, a.process evaluation was conducted examining arrest and adjudication for drinking and driving : offenses both before and during the campaign. Third, accident data supplied by the state were examined for any effects of the campaign on alcohol related crashes. The specific methods employed in conducting each of these evaluation activities are discussed in those sections of this report which deal with the evaluation results.
6. Accident Data
Through the cooperation of the Wisconsin Department of Transportation, statewide accident data tapes covering the period 1974-85 were obtained. General deterrent effects of the OWI law were examined by performing interrupted time-series analyses on surrogate measures of alcohol related crashes during the months prior to May 1, 1982 and the months since that date for which data were available. As just noted, accident data analyses were also conducted for Milwaukee covering the periods before and after the May 1, 1982, change in the law and before and after the 1985 media program. A complete description of the methods and results for these analyses is presented ;in Section :. V .
D. Specific Deterrence
Whi e_ ; general deterrence refers. ,to -stopping, drinking and driving in the general population , specific ` dete,rrrence refers to stopping the repeat occurrence of drinking and. driving among those who have _been convicted of the offense. Specific deterrence was examined statewide in Wisconsin for the period prior. to the, May, ;1982..nerw law as-compared to the. period, after the law.
Y-I The State of Wisconsin Department of Transportation maintains a
compreh:en_sive,. computer-based driver record system. containing the details of violation convictions, accidents, license actions and related' matters for individual motorists during the most recent five year period. For the specific deterrence analysis, arrangements were made to obtain data from the driver record system for all motorists in the State covering the period 1979 to 1984.
1. Analysis Issues
As the Wisconsin OWI statute which mandates short-term license suspension became effective on May 1, 1982 and because experimental manipulation of current sanctioning practices was not possible, the topic of specific deterrence was approached employing a pre-post analysis. That is, the following questions were addressed:
o Was the OWI reconviction rate of persons charged under the present law different from the reconviction rate of persons charged under the prior law?
o Was the post-conviction injury accident experience of these two groups different?
o What was the "during suspension" injury accident and violation experience of persons convicted under the present law. How did
-11
these rates compare with the accident and violation experience during the first 90 days following conviction under the old law?
2. Analysis Approach
Four driver groups were created from the driver record system data noted above. These were:
o Drivers charged under the new OWI law and convicted between May 1, 1982 and April 30, 1983.
o Drivers charged under the old OWI law and convicted between May 1, 1980 and April 30, 1981.
A random sample from the total driver file to determine statewide accident, OWI and other violations experience during the May 1, 1980 to April 30, 1981 period.
o A second random sample to generate comparable data for the May 1, 1982 to April 30, 1983 period.
Analytic measures (e.g., subsequent injury accidents) were developed for the two OWI groups using a 12-month exposure period. That is, the accident experience of a motorist convicted on, say, September 27, 1982 was tallied through the 12-month period ending September 26, 1984.
The primary threat to the validity of a pre-post comparison of this type is that there were time dependent changes in OWI enforcement and/or in accident levels. The two noted random samples were used to assess these possible effects. A complete description of methods and results for this analysis is presented in Section VI.
9
III. OWI ARREST AND ADJUDICATION PROCESS EVALUATION
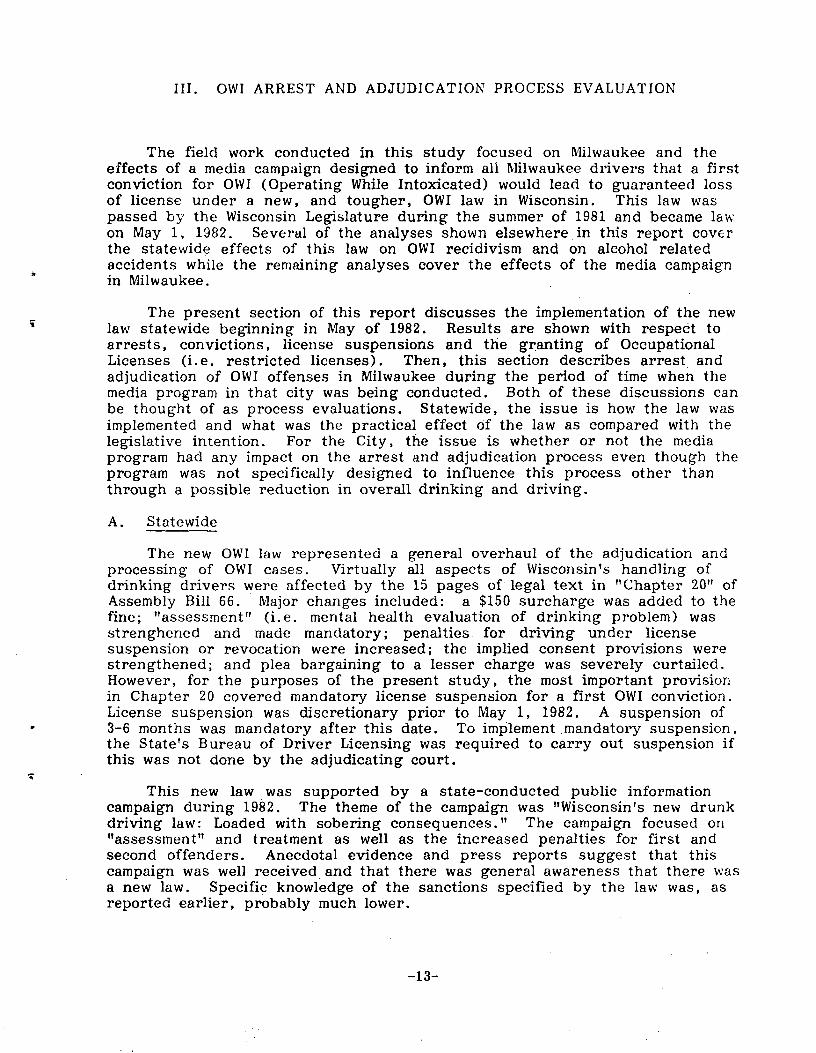
The field work conducted in this study focused on Milwaukee and the effects of a media campaign designed to inform all Milwaukee drivers that a first conviction for OWI (Operating While Intoxicated) would lead to guaranteed loss of license under a new, and tougher, OWI law in Wisconsin. This law was passed by the Wisconsin Legislature during the summer of 1981 and became law on May 1, 1982. Several of the analyses shown elsewhere in this report cover the statewide effects of this law on OWI recidivism and on alcohol related accidents while the remaining analyses cover the effects of the media campaign in Milwaukee.
The present section of this report discusses the implementation of the new law statewide beginning in May of 1982. Results are shown with respect to arrests, convictions, license suspensions and the granting of Occupational Licenses (i.e. restricted licenses). Then, this section describes arrest, and adjudication of OWI offenses in Milwaukee during the period of time when the media program in that city was being conducted. Both of these discussions can be thought of as process evaluations. Statewide, the issue is how the law was implemented and what was the practical effect of the law as compared with the legislative intention. For the City, the issue is whether or not the media program had any impact on the arrest and adjudication process even though the program was not specifically designed to influence this process other than through a possible reduction in overall drinking and driving.
A. Statewide
The new OWI law represented a general overhaul of the adjudication and processing of OWI cases. Virtually all aspects of Wisconsin's handling of drinking drivers were affected by the 15 pages of legal text in "Chapter 20" of Assembly Bill 66. Major changes included: a $150 surcharge was added to the fine; "assessment" (i.e. mental health evaluation of drinking problem) was strenghened and made mandatory; penalties. for driving under license suspension or revocation were increased; the implied consent provisions were strengthened; and plea bargaining to a lesser charge was severely curtailed. However, for the purposes of the present study, the most important provision in Chapter 20 covered mandatory license suspension for a first OWI conviction. License suspension was discretionary prior to May 1, 1982. A suspension of 3-6 months was mandatory after this date. To implement mandatory suspension, the State's Bureau of Driver Licensing was required to carry out suspension if this was not done by the adjudicating court.
This new law was supported by a state-conducted public information campaign during 1982. The theme of the campaign was "Wisconsin's new drunk driving law: Loaded with sobering consequences." The campaign focused on "assessment" and treatment as well as the increased penalties for first and second offenders. Anecdotal evidence and press reports suggest that this campaign was well received and that there was general awareness that there was a new law. Specific knowledge of the sanctions specified by the law was, as reported earlier, probably much lower.
-13
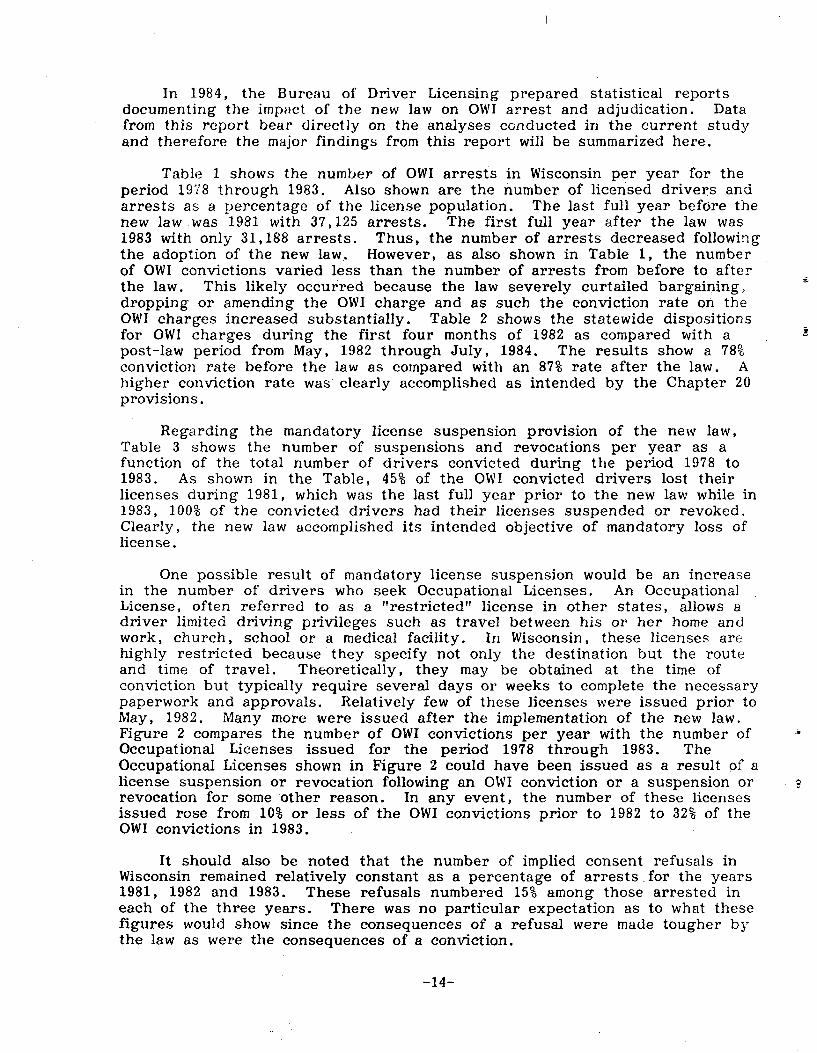
In 1984, the Bureau of Driver Licensing prepared statistical reports documenting the impact of the new law on OWI arrest and adjudication. Data from this report bear directly on the analyses conducted in the current study and therefore the major findings from this report will be summarized here.
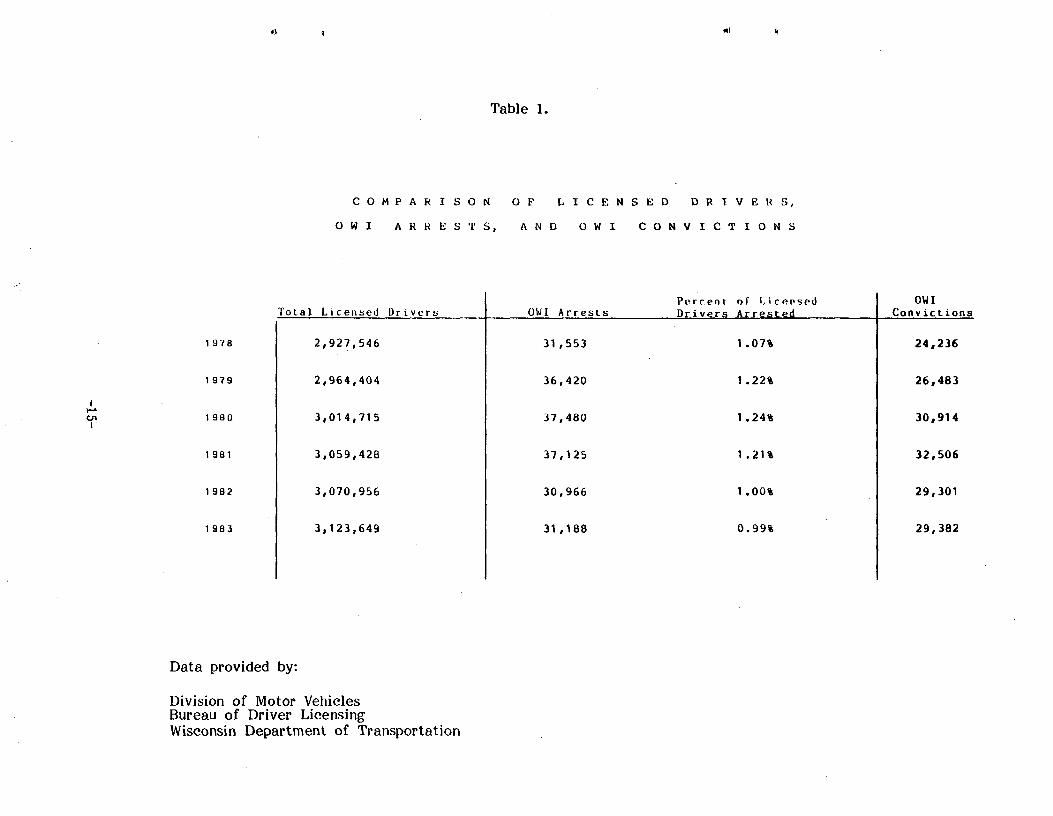
Table 1 shows the number of OWI arrests in Wisconsin per year for the period 1978 through 1983. Also shown are the number of licensed drivers and arrests as a percentage of the license population. The last full year before the new law was 1981 with 37,125 arrests. The first full year after the law was 1983 with only 31,188 arrests. Thus, the number of arrests decreased following the adoption of the new law. However, as also shown in Table 1, the number of OWI convictions varied less than the number of arrests from before to after the law. This likely occurred because the law severely curtailed bargaining, dropping or amending the OWI charge and as such the conviction rate on the OWI charges increased substantially. Table 2 shows the statewide dispositions for OWI charges during the first four months of 1982 as compared with a post-law period from May, 1982 through July, 1984. The results show a 78% conviction rate before the law as compared with an 87% rate after the law. A higher conviction rate was' clearly accomplished as intended by the Chapter 20 provisions.
Regarding the mandatory license suspension provision of the new law, Table 3 shows the number of suspensions and revocations per year as a function of the total number of drivers convicted during the period 197.8 to 1983. As shown in the Table, 45% of the OWI convicted drivers lost their licenses during 1981, which was the last full year prior to the new law while in 1983, 100% of the convicted drivers had their licenses suspended or revoked. Clearly, the new law accomplished its intended objective of mandatory loss of license.
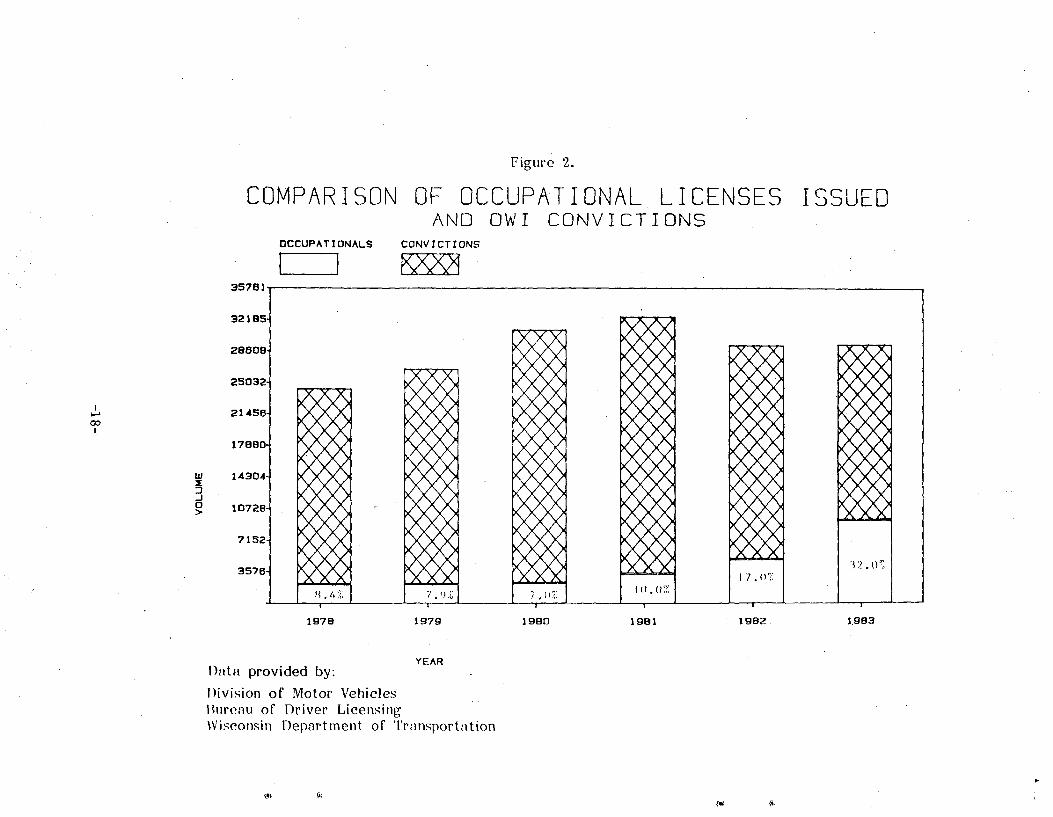
One possible result of mandatory license suspension would be an increase in the number of drivers who seek Occupational Licenses. An Occupational License, often referred to as a "restricted" license in other states, allows a driver limited driving privileges such as travel between his or her home and work, church, school or a medical facility. In Wisconsin, these licenses are highly restricted because they specify not only the destination but the route and time of travel. Theoretically, they may be obtained at the time of conviction but typically require several days or weeks to complete the necessary paperwork and approvals. Relatively few of these licenses were issued prior to May, 1982. Many more were issued after the implementation of the new law. Figure 2 compares the number of OWI convictions per year with the number of Occupational Licenses issued for the period 1978 through 1983. The Occupational Licenses shown in Figure 2 could have been issued as a result of a license suspension or revocation following an OWI conviction or a suspension or revocation for some other reason. In any event, the number of these licenses issued rose from 10% or less of the OWI convictions prior to 1982 to 32% of the OWI convictions in 1983.
It should also be noted that the number of implied consent refusals in Wisconsin remained relatively constant as a percentage of arrests-for the years 1981, 1982 and 1983. These refusals numbered 15% among those arrested in each of the three years. There was no particular expectation as to what these figures would show since the consequences of a refusal were made tougher by the law as were the consequences of a conviction.
-14
.> a dl
Table 1.
C O M P A R I S O N O F L I C E N S E D D R I V E R S,
O W I A R R E S T S, A N D O W I C O N V I C T I O N S
Percent. of Licensed owl Total Licensed Drivers OWL Arrests Drivers Arrested Convictions
1978 2,927,546 31,553 1.07% 24,236
1979 2,964,404 36,420 1.22% 26,483
1980 3,014,715 37,480 1.24% 30,914
1981 3,059,428 37,125 1 .21% 32,506
1982 3,070,956 30,966 1.00% 29,301
1983 3,123,649 31,188 0.99% 29,382
Data provided by:
Division of Motor Vehicles Bureau of Driver Licensing Wisconsin Department of Transportation
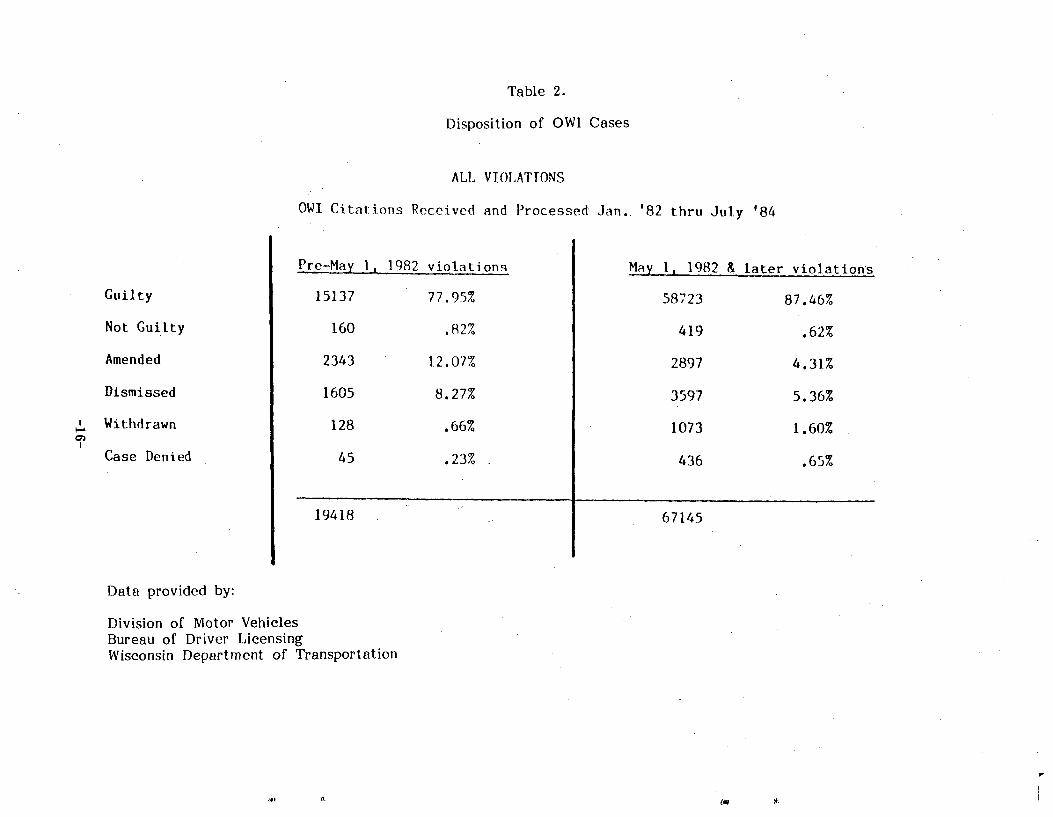
Table 2.
Disposition of OWI Cases
ALL VIOLATIONS
OWl Citations Received and Processed Jan. '82 thru July '84
L rn
Guilty
Not Guilty
Amended
Dismissed
Withdrawn
Case Denied
Pre-May 1, 1982 violations
15137 77.95%
160 .82%
2343 12.07%
1605 8.27%
128 .66%
45 .23%
May 1, 1982 &
58723
419
2897
3597
1073
436
later violations
87.46%
.62%
4.31%
5.36%
1.60%
.65%
19418 67145
Data provided by:
Division of Motor Vehicles Bureau of Driver Licensing Wisconsin Department of Transportation
!u
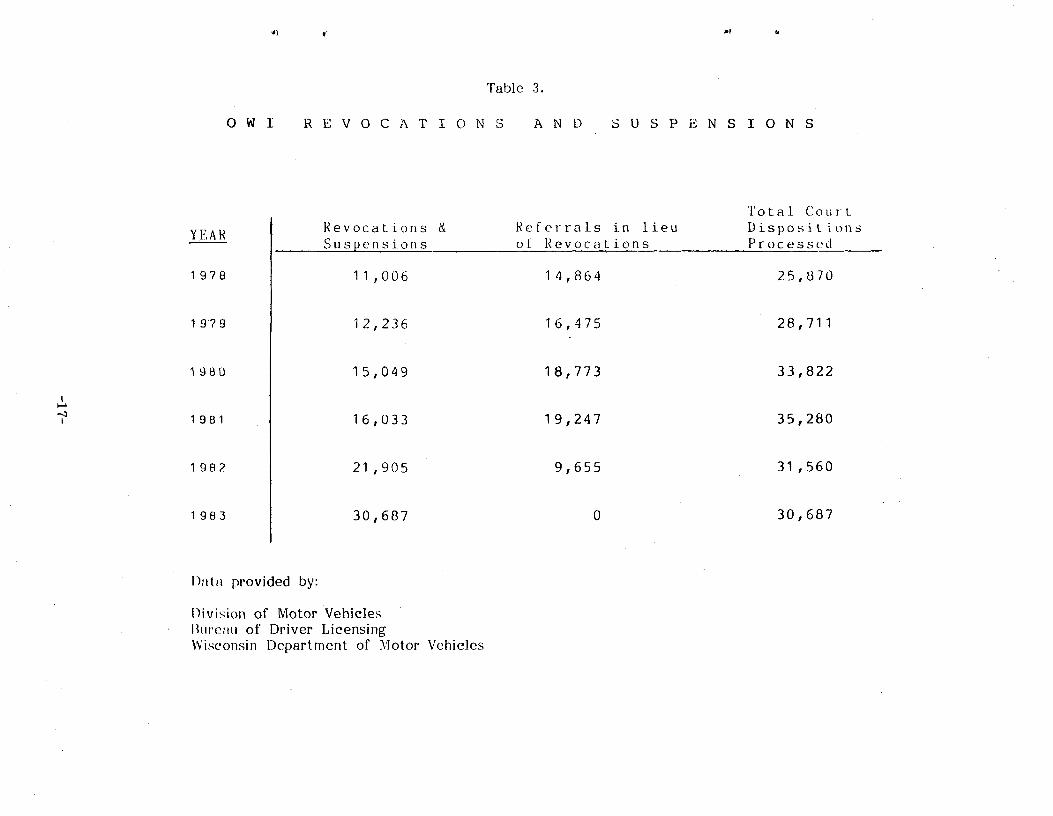
Table 3.
O W I R E V O C A T I O N S A N D S U S P E N S I O N S
'Total Court Revocations & Referrals in lieu DispositionsYEAR Suspensions of Revocations Processed
1978 11,006 14,864 25,870
1979 12,236 16,475 28,711
1980 15,049 18,773 33,822
1981 16,033 19,247 35,280
1982 21,905 9,655 31,560
1983 30,687 0 30,687
I)ntrr provided by:
Division of Motor Vehicles Uurenu of Driver Licensing Wisconsin Department of Motor Vehicles
*
Figure 2.
COMPARISON OF OCCUPATIONAL LICENSES ISSUED
35781-
92185-
28809-
25032-
21458-
17880-
14304-
10728-
7152-
3578-
OCCUPATIONALS
I
AND OWI CONVICTIONSCONVICTIONS
32,017.
4',. 7.'), 7. )'i,III,(J
1978 1979 1990 1982. 1.983
*
YEARData provided by:
Division of Motor VehiclesBureau of Driver LicensingWisconsin Department of 't'ransportation
Cb N:(w f^.
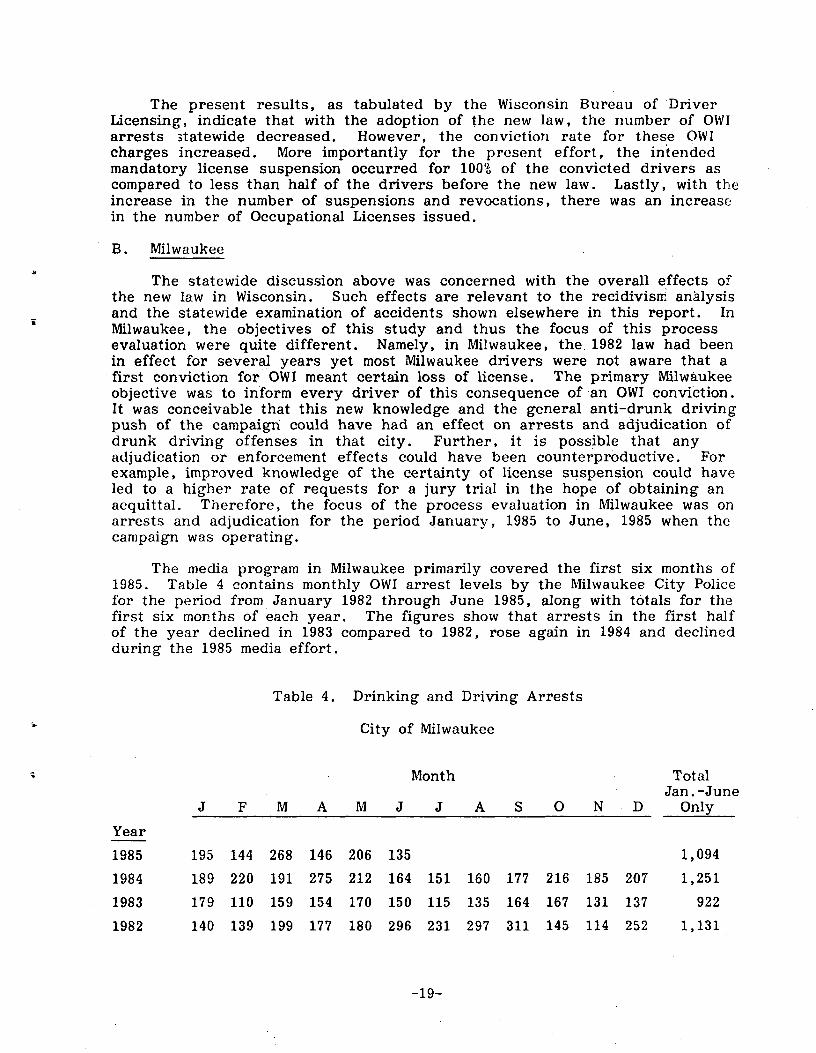
The present results, as tabulated by the Wisconsin Bureau of Driver Licensing, indicate that with the adoption of the new law, the number of OWI arrests statewide decreased. However, the conviction rate for these OWI charges increased. More importantly for the present effort, the intended mandatory license suspension occurred for 100% of the convicted drivers as compared to less than half of the drivers before the new law. Lastly, with the increase in the number of suspensions and revocations, there was an increase in the number of Occupational Licenses issued.
B. Milwaukee
a
The statewide discussion above was concerned with the overall effects of the new law in Wisconsin. Such effects are relevant to the recidivism analysis and the statewide examination of accidents shown elsewhere in this report. In Milwaukee, the objectives of this study and thus the focus of this process evaluation were quite different. Namely, in Milwaukee, the. 1982 law had been in effect for several years yet most Milwaukee drivers were not aware that a first conviction for OWI meant certain loss of license. The primary Milwaukee objective was to inform every driver of this consequence of an OWI conviction. It was conceivable that this new knowledge and the general anti-drunk driving push of the campaign could have had an effect on arrests and adjudication of drunk driving offenses in that city. Further, it is possible that any adjudication or enforcement effects could have been counterproductive. For example, improved knowledge of the certainty of license suspension could have led to a higher rate of requests for a jury trial in the hope of obtaining an acquittal. Therefore, the focus of the process evaluation in Milwaukee was on arrests and adjudication for the period January, 1985 to June, 1985 when the campaign was operating.
The media program in Milwaukee primarily covered the first six months of 1985. Table 4 contains monthly OWI arrest levels by the Milwaukee City Police for the period from January 1982 through June 1985, along with totals for the first six months of each year. The figures show that arrests in the first half of the year declined in 1983 compared to 1982, rose again in 1984 and declined during the 1985 media effort.
Table 4. Drinking and Driving Arrests
City of Milwaukee
Month Total Jan.-June
J F M A M J J A S 0 N D Only
Year
1985 195 144 268 146 206 135 1,094
1984 189 220 191 275 212 164 151 160 177 216 185 207 1,251
1983 179 110 159 154 170 150 115 135 164 167 131 137 922
1982 140 139 199 177 180 296 231 297 311 145 114 252 1,131
The entire series of monthly arrest data (42 months) was analyzed by time series intervention analysis and no statistically significant intervention effect was found. Thus, it is reasonable to conclude that during the media campaign emphasizing the fact of mandatory license actions in OWI convictions, no enforcement "crackdown" nor diminution of enforcement activities took place. From the point of view of the project's objectives, this was a desirable outcome as it avoided confounding efforts to increase awareness of license sanctions with other changes in the criminal-justice environment surrounding OWI.
In Milwaukee, the first step in the adjudication process requires the Police to determine whether the defendant is a first time offender or whether conviction on the present charge would represent a repeat offense. Cases involving multiple (approximately 15-20 percent of those arrested) offenders are sent to Circuit Court and are not adjudicated within the City system. First time offenders are referred to the City Attorney for prosecution in Municipal Court. The City Attorney reviews the case and decides whether or not to prosecute. Approximately 2% of the cases are nolled or otherwise not prosecuted by the City Attorney; the remaining cases are filed with the Municipal Court.
Once at Municipal Court, the defendant enters a plea, and if the plea is not guilty, the defendant has the additional option of requesting a jury trial. Jury trials are requested in about 10%-20% of the cases; these are also referred to Circuit Court and may require -as much as two years before they are adjudicated. At Municipal Court, approximately 80% of the original arrested population are eventually found guilty and approximately 5% are dismissed, stayed, found not guilty, appealed, etc. Data regarding dispositions at Circuit Court could not be obtained because of the generally long elapsed times from arrest to adjudication.
The Municipal Court, on the other hand, runs monthly status tabulations cumulatively for the cases filed in a given calendar year. In February, for example, it is possible to determine the status of all cases filed in January while in March it is possible to determine the status of all cases filed in both January and February. This procedure has been in effect for several years and the monthly printouts are retained by the Court. Therefore, in July of 1985, it was possible to check the status of all cases filed to date in 1985. It was also possible to review data as of each previous July of all cases filed in the first six months of 1984, 1983 and 1982.
The relevant figures are as follows:
1982 1983 1984 1985
Cases Filed (Jan.-June) 590 651 879 840 Guilty 381 369 484 493
Presumably, if the media program operating in Milwaukee was to have had a counterproductive effect on the adjudication process, this effect would be seen in. a reduction in the number of guilty findings at Municipal Court. Drivers can avoid a guilty finding, at least temporarily, by requesting a trial since trial dates are set six months to two years in the future depending on whether or not a jury is requested. In 1985, guilty findings as of July accounted for 59% (493 of 840 filings) of the cases filed in that year. This
-20
compares with 55% in 1984 and 57% in 1983. The 1982 figure was 65%, but this figure is probably not comparable to the 1983-1985 data since four of the first six months in 1982 were prior to the implementation of the new tougher OWI law. Thus, the present data provide no evidence that the media program had an adverse impact on the adjudication of first offender OWI cases.
In addition to examining available arrest and adjudication data, interviews were conducted with representatives of the police, the court and the Safety Commission following completion of the media campaign. No negative effects of the campaign were related by these representatives.
In summary, a media program was implemented in Milwaukee to inform all Milwaukee drivers that one of the consequences of a first OWI conviction was mandatory loss of license. This program operated from January to June of 1985. The present results suggest that the number of OWI arrests may possibly have decreased very slightly but clearly did not increase during the period of the program. Also, there was no apparent negative impact of the program on the adjudication of first offenders at the Milwaukee Municipal Court.
IV. GENERAL DETERRENCE ANALYSIS a
A. Approach
The general deterrence part of the present study was primarily a public service educational, program in support of the new tougher Wisconsin OWI (Operating While Intoxicated) Law. The primary media objective was to inform every driver in Milwaukee County that loss of license was absolutely guaranteed upon first conviction for OWI. The primary project objective was to increase driver knowledge of loss of license and to assess the effects of this new knowledge.
These objectives were measured by locally conducted surveys of drivers asking them directly about the media program and the effects of the law on their own attitudes and behavior. The survey covered the following topics:
o Recall of campaign materials and themes
o Knowledge of certain loss of license following first OWI conviction
o Attitudes about drinking and driving and perceived risk of apprehension
o Influence of law on behavior
The Milwaukee Safety Commission, in cooperation with the State of Wisconsin and the Milwaukee Chapter of the Mother's Against Drunk Driving (MADD), conducted the surveys.
The Safety Commission survey was designed as a one page paper and pencil instrument to be administered at the photo-licensing stations of the Wisconsin Department of Transportation. Such surveys have been routinely conducted by the State of Wisconsin since drivers coming to the stations within any time period represent a random sample of all Wisconsin drivers, and these individuals must wait at the station for a few minutes while their photos are being developed and their licenses are being prepared. Milwaukee County has five such photo-licensing stations all of which participated in the survey effort. Also participating, as a comparison location, was Green Bay since this was an urban area sufficiently distant from Milwaukee such that Green Bay drivers would not likely have contact with Milwaukee media. Green Bay has one 11.
photo-licensing station. Thus a total of six stations participated.
Surveys were conducted for one week per month over an eight month period. All drivers visiting any one of the six photo-licensing stations for the purpose of obtaining a license during each of the eight survey weeks were asked to complete a survey form. All surveys were completed anonymously and' were not a condition for obtaining a license. While it was not possible to calculate a refusal rate, it is felt that nearly all drivers asked to complete a survey form complied with the request.
Surveys were delivered to each of the Milwaukee stations by MADD volunteers, typically on the Friday before the survey week. MADD volunteers returned to each station, typically on the Monday following the survey week, to
-22
0
collect the completed and the unused forms. An overnight delivery service was used to deliver and return survey forms for the Green Bay Station. All survey forms were returned to the project for processing and tabulation. Delivery, pick-up and survey administration procedures were pretested during the period November 7-9, 1984.
The survey weeks typically began on the second Monday of the month from November, 1984 through June, 1985. The actual starting dates for each of the eight survey weeks were: November 12; December 10 (1984); January 14; February 11; March 11; April 8; May 13; and June 10 (1985). The November, 1984 survey week may be considered as a baseline or pre measure. The December week was largely a baseline measure as well although some media materials were being broadcast by one of the television and one of the radio stations in Milwaukee. The January measure coincided with the main kickoff for the campaign. Most of the media materials were not yet in place but there was substantial press coverage for the effort. The February survey week was the first week when all or nearly all of the media materials were in place. The March, April and May measures coincided with the main campaign activities. By June, most of the billboards had been taken down and the broadcast materials were not being aired as frequently.
As mentioned above, each survey was contained on one page since a multi-page survey would have been too long for the photo-licensing survey administration. However, the one page format was not sufficient to accommodate all of the survey questions needed to satisfy the measurement objectives. Therefore, five separate forms of the survey were developed. Each form contained a set of "core" questions common to all the survey forms as well as unique questions covered by only one of the forms. The forms were collated such that the first driver at the station would receive Form A, the second driver Form B etc., and the sixth driver would again get Form A.
The "core" questions covered driver sex, zip code, age, reason for visiting the photo-licensing station, perceived "unpleasantness" of the consequences of an OWI conviction, and perceived "influence" on personal drinking and driving decisions of certain loss of license following OWI conviction. Also, four of the five forms asked "What percent of drivers convicted of drunk driving for the first time in Wisconsin actually lose their licenses?" This question was not asked on the survey form that contained an open-ended or unaided question about the penalties for first OWI conviction in Wisconsin since it was felt that this question could bias the open-ended responses.
The five survey forms employed are shown in Appendix A. The first survey form (exposure, see page A-1) was designed to measure how many people had seen the media materials. It asked specific questions concerning exposure to the television, radio and print materials. The second form (aided knowledge, see page A-2) listed several possible penalties for first OWI conviction and asked the driver to indicate which would and which would not apply in Wisconsin. The third form (unaided knowledge, see page A-3) simply asked what are the required penalties in Wisconsin for first OWI conviction without providing any cues or possible responses. This form also asked about personal violation of the OWI law and how often the driver would seek alternate transportation if he or she had been drinking. The fourth form (attitudes, see page A-4) asked drivers to agree or disagree with six highway safety related
-23
statements. The fifth form (page A-5) was devoted to "Occupational Licenses". Data from this form was primarily of interest to the State of Wisconsin and is not covered in this report. In general, the results showed that Milwaukee and Green Bay drivers favored the granting of "Occupational Licenses" but only after the convicted OWI driver had spent some time with no driving privileges whatsoever.
Across the eight survey weeks, a total of 9 , 844 Milwaukee drivers and 3,372 Green Bay drivers completed the survey. In Milwaukee, the number of responding drivers was g::°eatest in the first survey week (1,690 in November) and dropped steadily to the last survey week (879 in June). Much of this drop was accounted for by one of the five stations where the number of respondents declined from 578 in November and 608 in December to 113 in June. In Green Bay, there were 587 respondents in November, declining to a low of 208 respondents during the winter months and recovering to 610 respondents in June.
The results shown in this report cover data from all five Milwaukee Stations. Nevertheless, it was possible that the precipitious drop in sample size at one of the five Milwaukee Stations could have had a biasing or influencing effect on any of the conclusions drawn from the data. Therefore, each of the major analyses performed on the data was repeated using only the four remaining Milwaukee Stations. None of the primary conclusions were altered when examining only those four Stations with relatively stable sample sizes.
An analysis of zip codes showed that drivers living in the City of Milwaukee accounted for 53% of the Milwaukee sample; 84% resided in Milwaukee County; and 99% resided in the Milwaukee Standard Metropolitan Statistical Area (SMSA). Similarly, 98% of the Green Bay respondents resided in the Green Bay SMSA. The median age of the Milwaukee drivers was 36.0 years as compared with 32.8 years in Green Bay. Males accounted for 52% of the Milwaukee sample and 51% of the Green Bay sample.
B. Survey Results
The survey of Milwaukee and Green Bay drivers had several different measurement objectives. The first of these objectives was to determine if the media messages concerning guaranteed loss of license following an OWI conviction were being seen by Milwaukee drivers. The second objective was to determine if the messages were leading to increased knowledge on the part of drivers concerning guaranteed loss of license. The remaining objectives dealt, with the effect of this increased knowledge on attitudes and behavior.
Obviously, each succeeding objective was dependent on the previous objective. That is, if drivers reported that they never saw the messages, it would be highly unlikely that any knowledge gain could have occurred. Similarly, a positive knowledge gain would appear to be a necessary precondition for any attitudinal or behavioral change.
The present section presents results with respect to exposure to the media materials, knowledge gain, attitudes, perceived risk and self-reported behavior. Appendix B shows complete results by survey month for each survey question.
Y
-24
1. Exposure
The media campaign consisted of television spots, radio spots and printed materials, including the billboards, posters and press releases. Survey respondents were asked three separate "Yes-No" questions; one for each of the three media forms. Each question asked about recall of the campaign theme within the specified media. The first question was:
"Have you seen any TV commercials in the last month which talked about : Convicted drunk drivers guaranteed to lose their licenses?"
The results for this question across all eight survey months for both Milwaukee and for Green Bay are shown in Table 5. These results indicate that 32% of the Milwaukee drivers and 28% of the Green Bay drivers responded affirmatively to this question during the November, 1984 baseline or "pre" survey week. While these numbers may appear quite high given that the campaign had not started at this time, it is felt that drivers were simply responding to the fact that it is common to see drunk driving messages of all kinds as part of public service television advertising. During subsequent months in Green Bay, the numbers varied from a low of 25% affirmative responses to a high of 41% and ended w.;.th 29% in June of 1985. There seemed to be no particular pattern to the Green Bay results other than statistical variation.
The results for Milwaukee, however, showed a substantial increase in affirmative responses to the TV exposure question consistent with the course of the campaign. From a low of 32% at baseline, the percentage of affirmative responses rose to 39% in December when only one of the Milwaukee stations was airing the spots and 48% in January when news coverage for the program was beginning. In February, when all of the Milwaukee stations had been asked to air public service spots, the percentage of affirmative responses rose to 64%. From February to June, the percentage of affirmative responses ranged from a low of 59% in March to a high of 72% in May. Clearly, Milwaukee drivers had been exposed to the TV materials and were able to recall the campaign theme.
The question concerning radio exposure was identical to the one dealing with television except that "saw TV" was replaced with "heard radio." The results for this question are also shown in Table 5. In general, they parallel the results for television exposure though at a somewhat lower level. In the November baseline, 24% of the Milwaukee drivers and 25% of the Green Bay drivers responded affirmatively. Across the next eight months, the percentage of affirmative responses in Green Bay varied from a low of 21% to a high of 39% with no particular pattern to the responses. In Milwaukee, however, there was an increase to 32% in December when only one radio station was airing the materials, and an increase in January to 41% coincident with the beginning of the full campaign. Over the next five months, the percentage of affirmative responses varied from a low of 46% in March to a high of 57% in May. These results indicate that Milwaukee drivers were exposed to the radio materials and were able to recall that exposure.
The last exposure question dealt with the print materials. While respondents may have seen the poster, or read an article in the newspaper, it
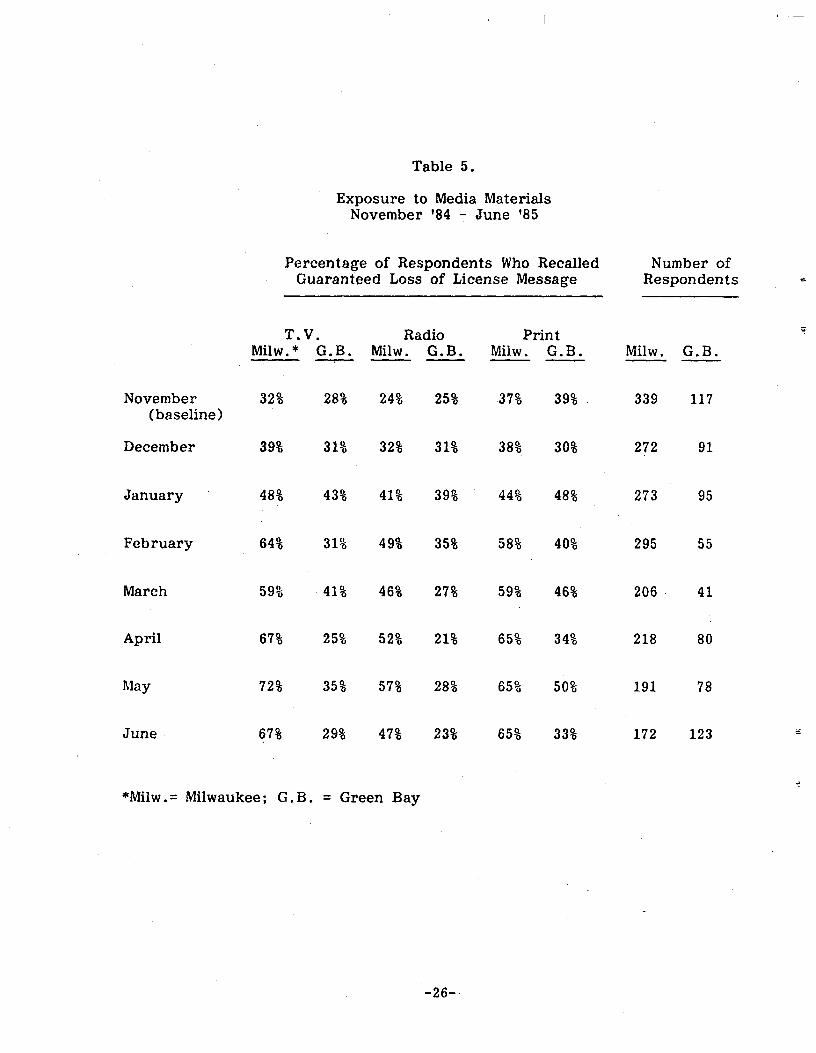
Table 5.
Exposure to Media Materials November '84 - June '85
Percentage of Respondents Who Recalled Number of Guaranteed Loss of License Message Respondents
T. V. Radio Print Milw.* G.B. Milw. G.B. Milw. G.B. Milw. G.B.
November 32% 28% 24% 25% 37% 39% 339 117 (baseline)
December 39% 31% 32% 31% 38% 30% 272 91
January 48% 43% 41% 39% 44% 48% 273 95
February 64% 31% 49% 35% 58% 40% 295 55
March 59% 41% 46% 27% 59% 46% 206 41
April 67% 25% 52% 21% 65% 34% 218 80
May 72% 35% 57% 28% 65% 50% 191 78
June 67% 29% 47% 23% 65% 33% 172 123
*Milw.= Milwaukee; G.B. = Green Bay
is felt that the primary print medium were the billboards. The print exposure question read as follows :
"Have you read any printed materials (posters, pamphlets, newspaperads, etc.) in the last month which talked about:Convicted drunk drivers guaranteed to lose their licenses?"
In November, 37% of the Milwaukee drivers and 39% of the Green Bay drivers responded affirmatively to this question. As shown in Table 5, the percentage of affirmative responses in Green Bay across all of the surveys varied from a low of 30% to a high of 50% with no particular pattern. In Milwaukee, the percentage of affirmative responses was 38% in December which is consistent with the fact that no billboards or posters had yet been printed. By: January, when the first few billboards were unveiled, the affirmative percentage was 44%. Between February and June, when the billboards were in place and the posters were being distributed, the percentage of affirmative responses varied between 58% and 65%. These results indicate that Milwaukee drivers were exposed to the print materials and were able to recall that exposure.
As shown in Appendix A, each of the three exposure questions reported above was in the form of a lead statement ("Have you read, seen or heard anything") followed by four possible campaign themes only one of which was the present theme concerning guaranteed loss of license. The other three themes were included largely as "distractors" but nonetheless the results. for these three themes are of some interest. The first distractor theme concerned the general notion of "Death and injuries on the highway due to drunk driving." The results showed an increase in the percentage of affirmative responses to this theme across the eight survey months in both Milwaukee and in Green Bay. The second theme concerned "The legal drinking age." The results with respect to this theme showed no particular pattern in either Milwaukee or in Green Bay across the eight survey months. The last theme concerned "Enforcement of drunk driving laws." Here, there was no consistent pattern of change across the eight months in Green Bay. In Milwaukee, however, there was a consistent pattern with more drivers reporting that they saw, heard or read this theme as the guaranteed loss of license campaign was implemented. With respect to the TV exposure question, 61% of the Milwaukee drivers reported that they saw the enforcement theme in November as compared with a peak response of 80% in April, 75% in May and 71% in June. For the radio question, the November figure was 47% as compared with a peak response of 61% in April. For the print question, the November figure was 54% as compared with 69% in April, 73% in May and 66% in June. It appears that while the campaign was actually devoted to OWI sanctions, many drivers may have interpreted the campaign materials to mean both OWI sanctions and OWI enforcement. Complete results can be found on pages B13-B36 of Appendix B.
2. Knowledge
Milwaukee drivers clearly remembered seeing, hearing and reading the campaign materials and thus it can be concluded that they were exposed to the campaign and that these exposures were memorable. The next step was to determine if these exposures led to a knowledge gain. The primary knowledge objective was to convince drivers that anyone convicted of OWI would lose their license. Loss of license occurs under Wisconsin law even for a first OWI conviction.
-27
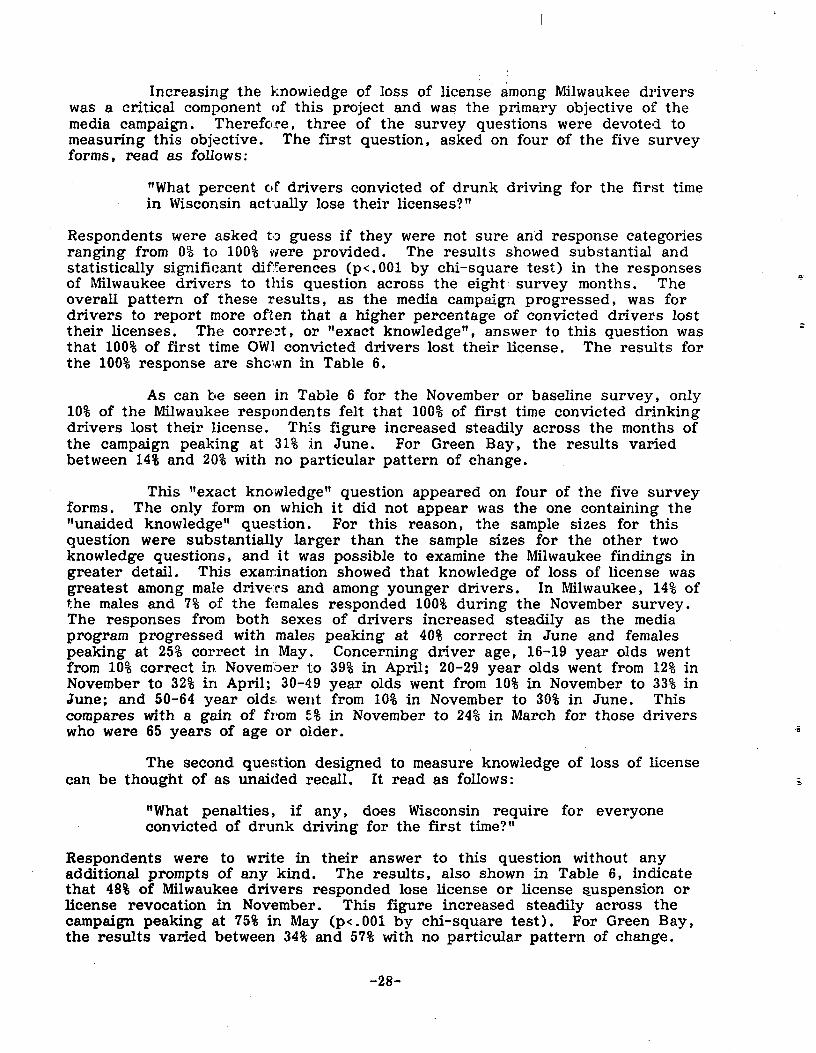
I
Increasing the knowledge of loss of license among Milwaukee drivers was a critical component of this project and was the primary objective of the media campaign. Therefore, three of the survey questions were devoted to measuring this objective. The first question, asked on four of the five survey forms, read as follows:
"What percent of drivers convicted of drunk driving for the first time in Wisconsin actually lose their licenses?"
Respondents were asked to guess if they were not sure and response categories ranging from 0% to 100% were provided. The results showed substantial and statistically significant differences (p<.001 by chi-square test) in the responses of Milwaukee drivers to this question across the eight survey months. The overall pattern of these results, as the media campaign progressed, was for drivers to report more often that a higher percentage of convicted drivers lost their licenses. The correct, or "exact knowledge", answer to this question was that 100% of first time OW) convicted drivers lost their license. The results for the 100% response are shown in Table 6.
As can be seen in Table 6 for the November or baseline survey, only 10% of the Milwaukee respondents felt that 100% of first time convicted drinking drivers lost their license. This figure increased steadily across the months of the campaign peaking at 31% in June. For Green Bay, the results varied between 14% and 20% with no particular pattern of change.
This "exact knowledge" question appeared on four of the five survey forms. The only form on which it did not appear was the one containing the "unaided knowledge" question. For this reason, the sample sizes for this question were substantially larger than the sample sizes for the other two knowledge questions, and it was possible to examine the Milwaukee findings in greater detail. This exarrdnation showed that knowledge of loss of license was greatest among male drivers and among younger drivers. In Milwaukee, 14% of the males and 7% of the females responded 100% during the November survey. The responses from both sexes of drivers increased steadily as the media program progressed with males peaking at 40% correct in June and females peaking at 25% correct in May. Concerning driver age, 16-19 year olds went from 10% correct in. Novemoer to 39% in April; 20-29 year olds went from 12% in November to 32% in April; 30-49 year olds went from 10% in November to 33% in June; and 50-64 year old" went from 10% in November to 30% in June. This compares with a gain of from 5% in November to 24% in March for those drivers who were 65 years of age or older.
The second question designed to measure knowledge of loss of license can be thought of as unaided recall. It read as follows:
"What penalties, if any, does Wisconsin require for everyone convicted of drunk driving for the first time?"
Respondents were to write in their answer to this question without any additional prompts of any kind. The results, also shown in Table 6, indicate that 48% of Milwaukee drivers responded lose license or license suspension or license revocation in November. This figure increased steadily across the campaign peaking at 75% in May (p<.001 by chi-square test). For Green Bay, the results varied between 34% and 57% with no particular pattern of change.
-28
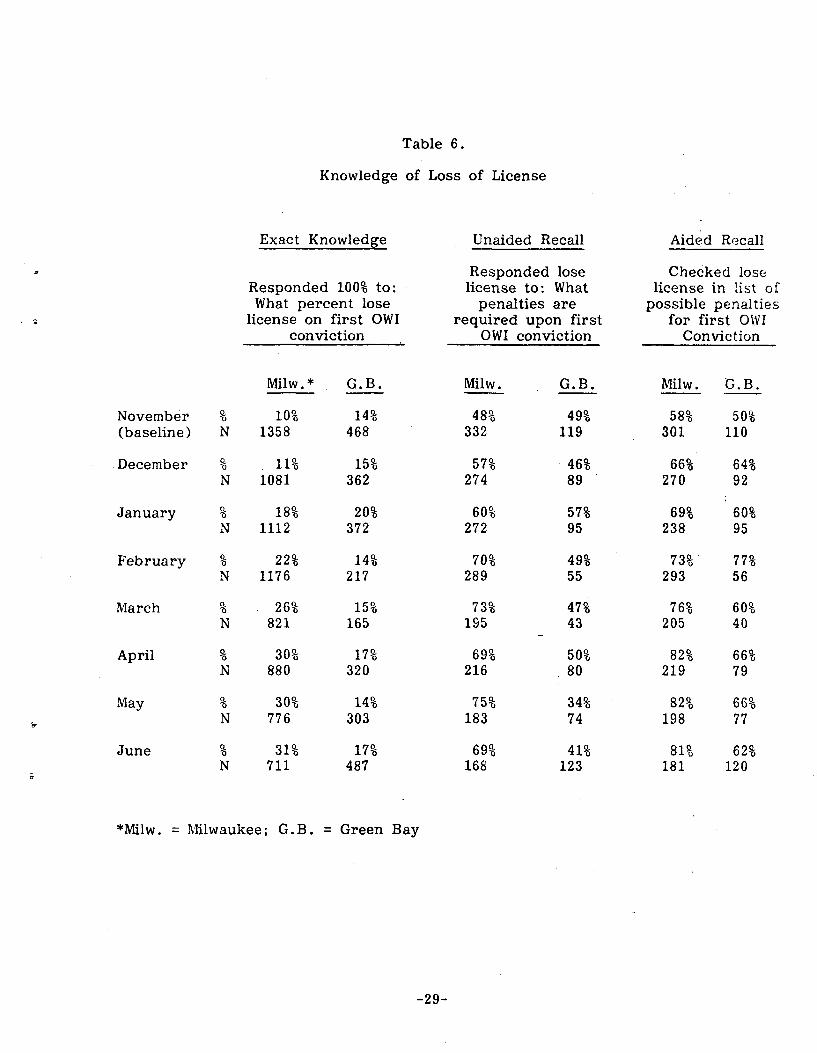
Table 6.
Knowledge of Loss of License
Exact Knowledge Unaided Recall Aided Recall
Responded lose Checked lose Responded 100% to: license to: What license in list of What percent lose penalties are possible penalties
license on first OWI required upon first for first OWI conviction OWI conviction Conviction
Milw.* G.B. Milw. G.B. Milw. G. B.
November % 10% 14% 48% 490 580 50% (baseline) N 1358 468 332 119 301 110
December % 11% 15% 570 460 660 640 N 1081 362 274 89 270 92
January % 18% 20% 600 570 69% 60% N 1112 372 272 95 238 95
February % 22% 14% 700 490 73 0 770 N 1176 217 289 55 293 56
March % 26% 15% 730 470 760 600 N 821 165 195 43 205 40
April % 30 % 17% 690 500 82 0 660 N 880 320 216 80 219 79
May % 300 14% 75% 34% 820 660 N 776 303 183 74 198 77
June % 31% 17% 69% 410 810 620 N 711 487 168 123 181 120
*Milw. = Milwaukee; G.B. = Green Bay
The third question designed to measure knowledge of loss of license can be thought of as aided recall. It read as follows:
"What penalties does Wisconsin law require for a first drunk driving conviction? (Please check all that you think apply)"
This question was followed by seven possible penalties one of which was "Lose license." This form of the question is referred to as aided recall since the correct answer(s) is provided and the respondent's task is to identify this answer from among the several possible choices. It is considered to be a generally easier form of the question than unaided recall. The results, also shown in Table 6, indicate that 58% of Milwaukee drivers checked loss of license as a required penalty in November. This figure increased as the campaign progressed peaking at 827_0 in both April and May (p<.001 by chi-square test). For Green Bay drivers, the comparable figures varied between 50% and 77%. While the Green Bay responses to this question appear to increase for the first few months, then decrease, it must be remembered that the Green Bay results are based on substantially lower sample sizes and are thus subject to more statistical variation. The distribution of Green Bay responses across the eight survey months was not statistically significant at the p=.05 level using the chi-square test.
The present results, whether in terms of "exact knowledge", unaided recall or aided recall, indicate that Milwaukee drivers were more aware of loss of license as the campaign progressed than they were before the campaign began. While the campaign certainly did not reach all drivers, the extent of the knowledge gain was substantial. Measured in terms of "exact knowledge", the figures show a knowledge gain of from 10% in November to 30% in May and 31% in June. In terms of unaided recall, the gain was from 48% in November to 75% in May and in terms of aided recall the gain was from 58% in November to 82% in May. It should also be noted that different samples of drivers responded to the aided and unaided recall questions as these were on different forms of the survey.
3. Attitudes
Milwaukee drivers were exposed to the media materials and their knowledge of loss of license following a first OWI conviction improved. The next step was to determine if that knowledge increase led to any changes in attitudes or perceptions of drinking and driving. Five of the survey questions were devoted to measuring attitudes.
Two of the attitude questions were "core" questions and thus appeared on every form of the survey. The first of these read as follows:
"If you were convicted of a drunk driving first offense, how unpleasant would the consequences be?"
Five possible scaled responses were provided ranging from "extremely unpleasant" to "not at all unpleasant." Averaged across all survey months, only 1% of the Milwaukee drivers responded "not at all unpleasant" and only 2% responded "not very unpleasant". Fully 88% of the Milwaukee drivers thought that the consequences would be "extremely" or "very" unpleasant with little variation across the eight survey months. Similar results were obtained in
-30
Green Bay. Obviously, even before knowledge of the new law was transmitted, people knew or imagined that OWI sanctions would be unpleasant.
The second "core" attitude question read:
"How much do these consequences influence whether or not you drive while in violation of the OWI (drunk driving) law?"
Four possible scaled response categories were provided ranging from "very much" to "not at all." As with the first attitude question reported above, the results were heavily weighted toward the high end of the scale. Fully 72% of the respondents in :Milwaukee reported that the influence is "very much", and only 5% reported "not at all" with little variation across the eight survey months. Similar results were obtained in Green Bay.
The remaining three attitude questions were contained on only one: of the survey forms. All three were statements about drinking and driving and, using a five point Likert scale, the respondent could agree or disagree with the statement. As above, the results showed little variation across the eight survey months and were heavily weighted toward the high end of the scale. The three statements and the percentage of Milwaukee drivers agreeing or strongly agreeing w:;th each were:
"The penalties for drunk driving should be more severe" (82%)
"People are less likely to drive when drunk than they were a year ago." (68%)
"Drunk drivers should lose their licenses for at least 90 days." (84%)
Similar results were obtained in Green Bay. Thus, the present results provide no evidence that attitudes about drinking and driving were affected by the media p.^ogram. Milwaukee drivers held strong attitudes against drinking and driving both before the media program began and while the program was operating.
4. Perceived Risk
While attitudes may have remained stable during the program, the perception of Milwaukee drivers concerning the risk of apprehension and the certainty of conviction did not. Such a result was not unexpected since, as reported earlier, drivers felt that the present campaign dealing with license sanctions was also concerned with enforcement.
The question dealing with the perceived risk of apprehension read as follows :
"On a typical night, what percent of the people who drive in violation of the OWl (drunk driving) law are arrested?" (If you are not sure, please mark your best guess)
Respondents were provided with seven possible response categories ranging from 0% to 100%. Table 7 shows the percentage of these respondents who felt that 40% or more of the drunk drivers on any given night are arrested. . In
-31
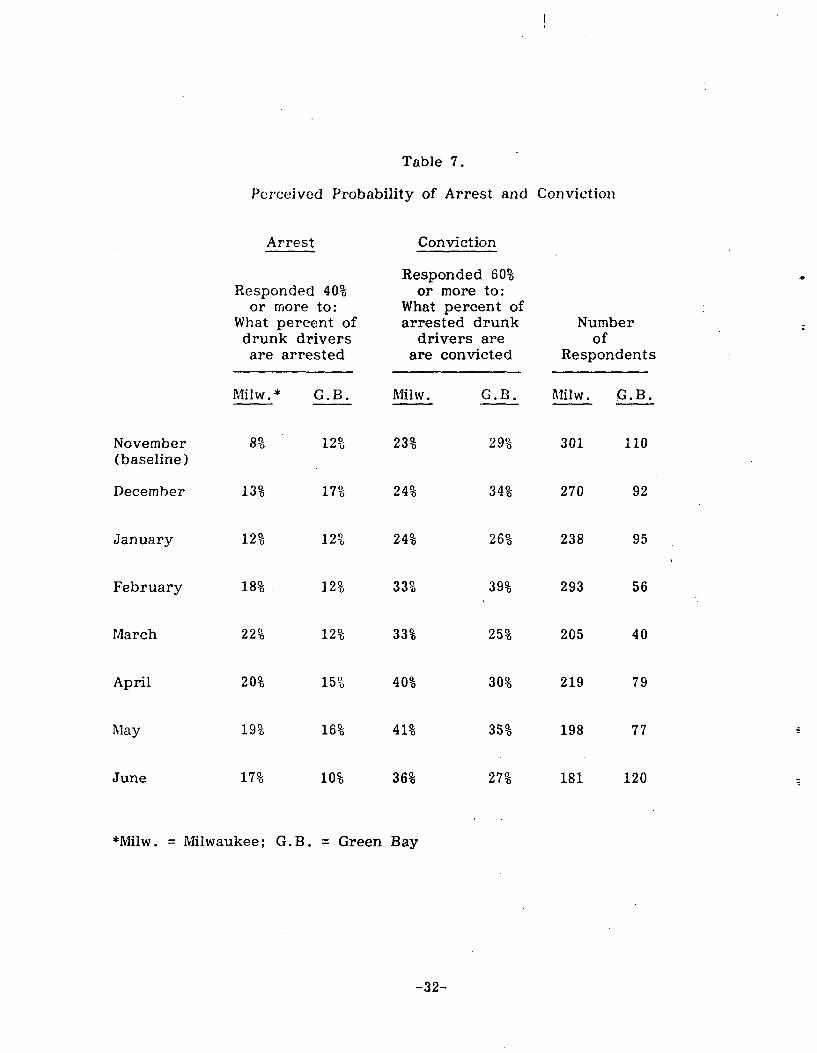
Table 7.
Perceived Probability of Arrest and Conviction
Arrest Conviction
Responded 60% Responded 40% or more to:
or more to: What percent of What percent of arrested drunk Number drunk drivers drivers are of are arrested are convicted Respondents
Milw.* G.B. Milw. G.B. Milw. G.B.
November 8% 12% 23% 29% 301 110 (baseline)
December 13% 17% 24% 34% 270 92
January 12% 12 24% 26% 238 95
February 18% 12% 33% 39% 293 56
March 22% 12% 33% 25% 205 40
April 20% 15% 40% 30% 219 79
May 19 % 16% 41% 35% 198 77
June 17% 10% 36% 27% 181 120
*Milw. = Milwaukee; G. B. = Green Bay
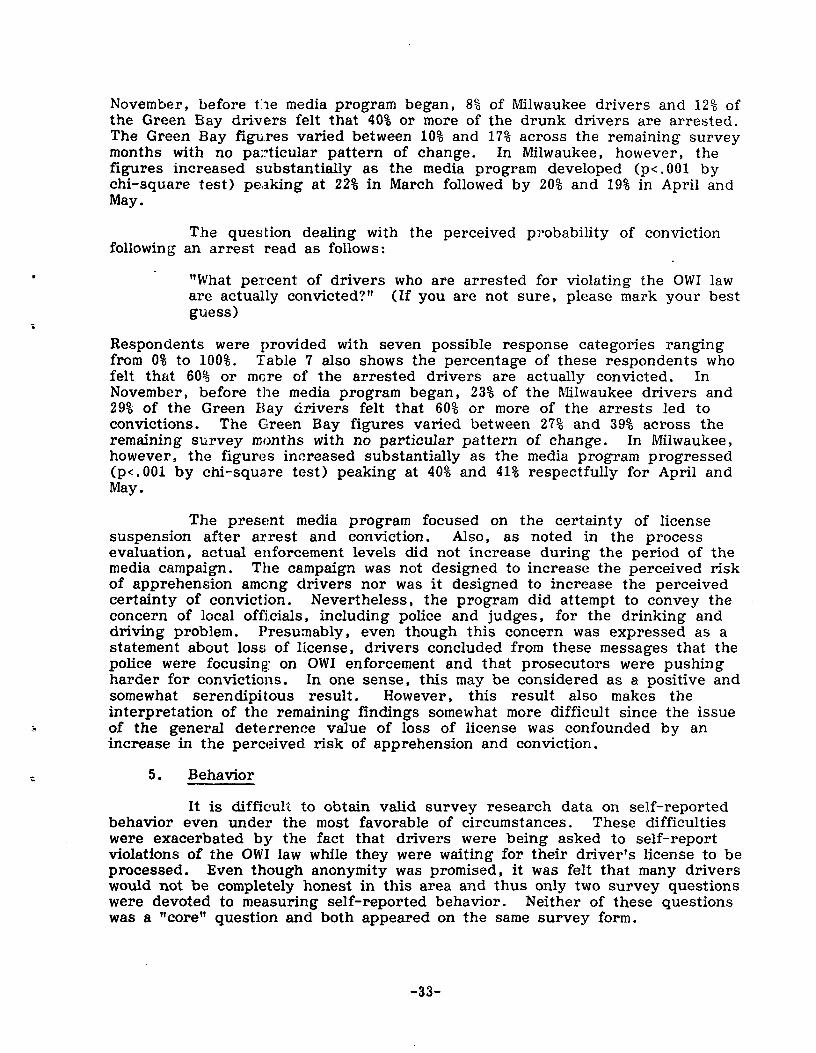
November, before the media program began, 8% of Milwaukee drivers and 12% of the Green Bay drivers felt that 40% or more of the drunk drivers are arrested. The Green Bay figures varied between 10% and 17% across the remaining survey months with no particular pattern of change. In Milwaukee, however, the figures increased substantially as the media program developed (p<.001 by chi-square test) peaking at 22% in March followed by 20% and 19% in April and May.
The question dealing with the perceived probability of conviction following an arrest read as follows:
"What percent of drivers who are arrested for violating the OWI law are actually convicted?" (If you are not sure, please mark your best guess)
Respondents were provided with seven possible response categories ranging from 0% to 100%. Table 7 also shows the percentage of these respondents who felt that 60% or more of the arrested drivers are actually convicted. In November, before the media program began, 23% of the Milwaukee drivers and 29% of the Green Bay drivers felt that 60% or more of the arrests led to convictions. The Green Bay figures varied between 27% and 39% across the remaining survey months with no particular pattern of change. In Milwaukee, however, the figures increased substantially as the media program progressed (p<.001 by chi-square test) peaking at 40% and 41% respectfully for April and May.
The present media program focused on the certainty of license suspension after arrest and conviction. Also, as noted in the process evaluation, actual enforcement levels did not increase during the period of the media campaign. The campaign was not designed to increase the perceived risk of apprehension among drivers nor was it designed to increase the perceived certainty of conviction. Nevertheless, the program did attempt to convey the concern of local officials, including police and judges, for the drinking and driving problem. Presumably, even though this concern was expressed as a statement about loss of license, drivers concluded from these messages that the police were focusing on OWI enforcement and that prosecutors were pushing harder for convictions. In one sense, this may be considered as a positive and somewhat serendipitous result. However, this result also makes the interpretation of the remaining findings somewhat more difficult since the issue of the general deterrence value of loss of license was confounded by an increase in the perceived risk of apprehension and conviction.
5. Behavior
It is difficult to obtain valid survey research data on self-reported behavior even under the most favorable of circumstances. These difficulties were exacerbated by the fact that drivers were being asked to self-report violations of the OWI law while they were waiting for their driver's license to be processed. Even though anonymity was promised, it was felt that many drivers would not be completely honest in this area and thus only two survey questions were devoted to measuring self-reported behavior. Neither of these questions was a "core" question and both appeared on the same survey form.
The first question dealing with self-reported drinking and driving behavior read as follows:
"In the past month, how often do you think you may have driven after you had been drinking enough to violate the Operating While Intoxicated (OWI) law? (Please check one)"
Drivers were provided with six possible response categories ranging from "Daily" to "Never." The results for this question across all survey months are shown in Table 8. These results sum the first five of the six response categories ranging from daily to once a month. They exclude only the last category which was "Never." The results show that about 20% of the drivers reported any violations and this percentage did not vary in any particular pattern across the survey months. Similarly, about 30% of the Green Bay drivers reported violations without any particular pattern of variation across the survey months.
The second question dealing with self-reported drinking and driving behavior read as follows:
"If you had been drinking and needed to get home, how often would you: Drive yourself?"
Drivers were provided with five possible response categories ranging from "Always" to "Never." The results for this question, summed for the response categories "Always" and "Usually", are also shown in Table 8. Only about 10% to 15% of the Milwaukee drivers provided the always or usually responses and these figures did not vary in any particular pattern across the eight survey months. In Green Bay, about 15% to 20% of the drivers provided the always or usually response with again no particular pattern of change across the eight survey months.
Overall, the results for self-reported behavior do not show evidence for an effect of the media program. These results may be interpreted to mean that the program did not change the drinking and driving behavior of Milwaukee respondents. Alternatively, these results may simply be a reflection of the difficulties in obtaining valid survey data on personal drinking and driving behavior particularly when that survey is being administered within a Department of Transportation Licensing Station.
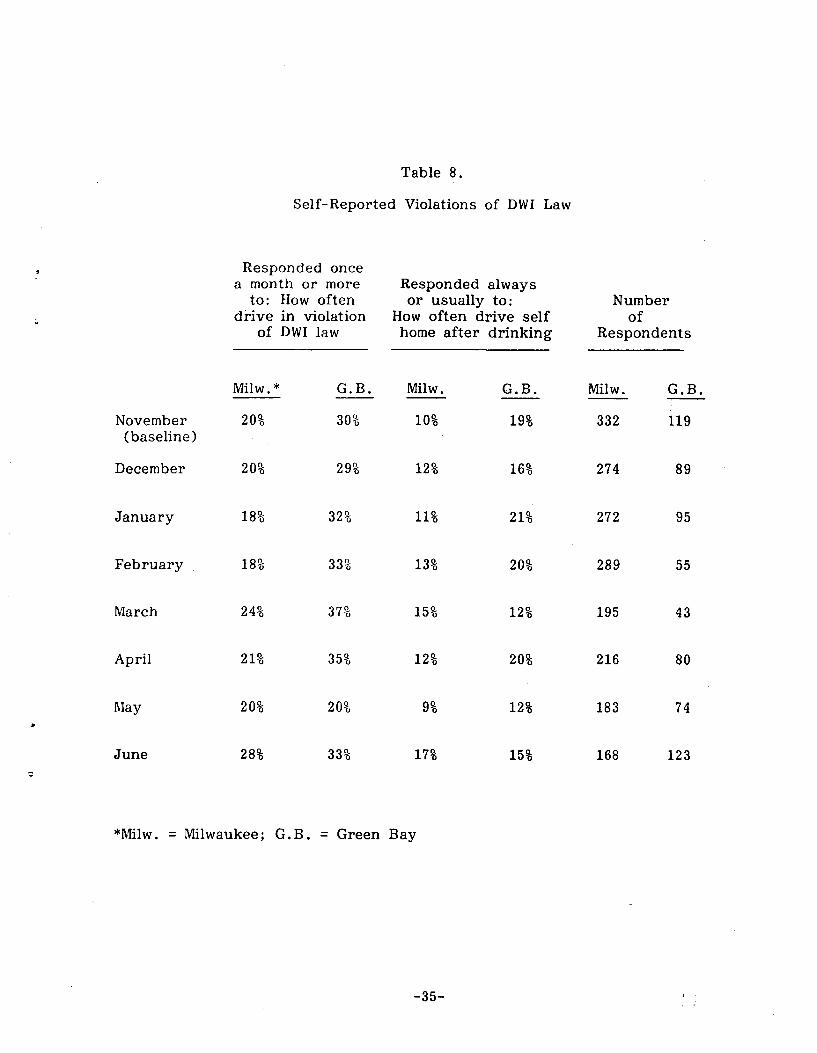
Table 8.
Self-Reported Violations of DWI Law
Responded once a month or more Responded always
to: How often or usually to: Number drive in violation How often drive self of
of DWI law home after drinking Respondents
Milw.* G.B. Milw. G.B. Milw. G.B.
November 20% 30% 10% 19% 332 119 (baseline)
December 20% 29% 12% 16% 274 89
January 18% 32% 11% 21% 272 95
February 18% 33% 13% 20% 289 55
March 24% 37% 15% 12% 195 43
April 21% 35% 12% 20% 216 80
May 20% 20% 9% 12% 183 74
June 28% 33% 17% 15% 168 123
*Milw. = Milwaukee; G.B. = Green Bay
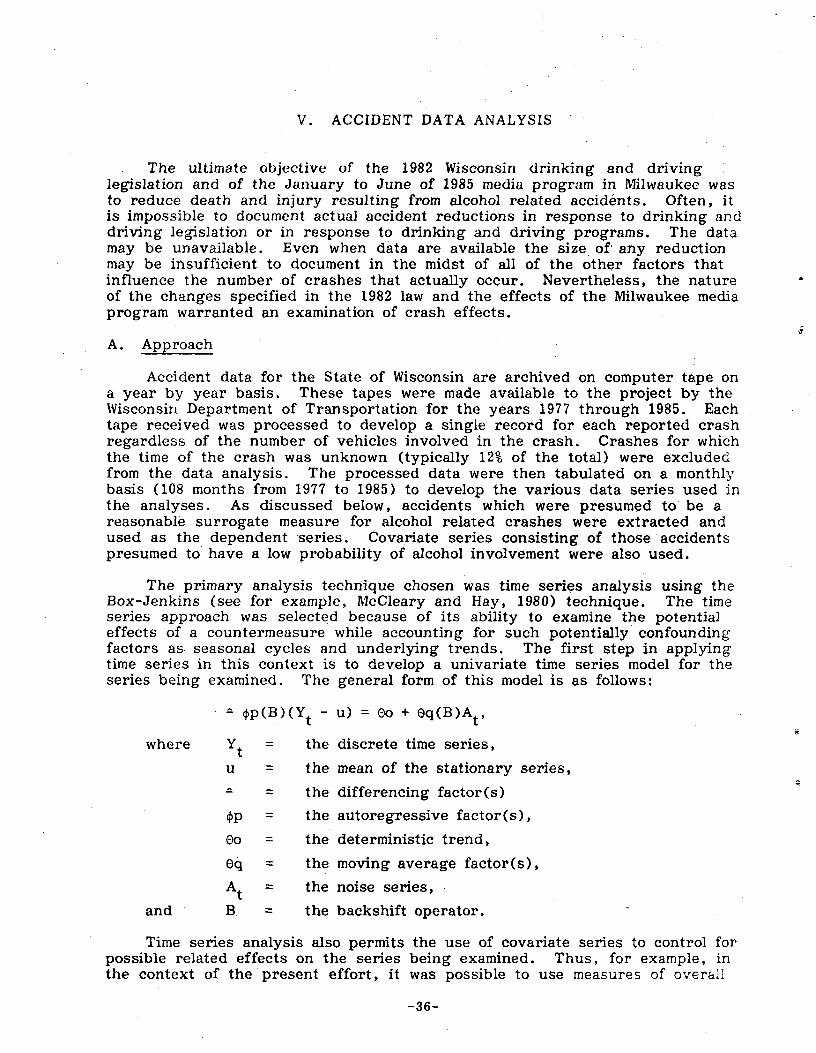
V. ACCIDENT DATA ANALYSIS
The ultimate objective of the 1982 Wisconsin drinking and driving legislation and of the January to June of 1985 media program in Milwaukee was to reduce death and injury resulting from alcohol related accidents. Often, it is impossible to document actual accident reductions in response to drinking and driving legislation or in response to drinking and driving programs. The data may be unavailable. Even when data are available the size of- any reduction may be insufficient to document in the midst of all of the other factors that influence the number of crashes that actually occur. Nevertheless, the nature of the changes specified in the 1982 law and the effects of the Milwaukee media program warranted an examination of crash effects.
A. Approach
Accident data for the State of Wisconsin are archived on computer tape on a year by year basis. These tapes were made available to the project by the Wisconsin Department of Transportation for the years 1977 through 1985. Each tape received was processed to develop a single record for each reported crash regardless of the number of vehicles involved in the crash. Crashes for which the time of the crash was unknown (typically 12% of the total) were excluded from the data analysis. The processed data were then tabulated on a monthly basis (108 months from 1977 to 1985) to develop the various data series used in the analyses. As discussed below, accidents which were presumed to be a reasonable surrogate measure for alcohol related crashes were extracted and used as the dependent series. Covariate series consisting of those accidents presumed to have a low probability of alcohol involvement were also used.
The primary analysis technique chosen was time series analysis using the Box-Jenkins (see for example, McCleary and Hay, 1980) technique. The time series approach was selected because of its ability to examine the potential effects of a countermeasure while accounting for such potentially confounding factors as seasonal cycles and underlying trends. The first step in applying time series in this context is to develop a univariate time series model for the series being examined. The general form of this model is as follows:
^p(B)(Yt - u) = Oo + Oq(B)At,
where Yt = the discrete time series,
u = the mean of the stationary series,
the differencing factor(s)
4p = the autoregressive factor(s),
Oo = the deterministic trend,
Oq the moving average factor(s),
At = the noise series,
and B. = the backshift operator.
Time series analysis also permits the use of covariate series to control for possible related effects on the series being examined. Thus, for example, in the context of the present effort, it was possible to use measures of overall
-36
accident experience as a covariate for the series presumed to be alcohol related. The analyses could then conclude directly if there were any effects found in the dependent alcohol series which could not be explained by the variation in the covariate series of all accidents. The general form of a time series model with transfer functions is as follows :
Yt = fl(Xit) + f2(X2t) + ... fN(XNt) + fA(At),
where Yt = the dependent output series,
Xit = independent input series #1 (covariate series),
X2t = independent input series #2 (coveriate series),
XNt = independent input series #N (coveriate series),
At = the noise series,
fl = the transfer function between series Y and series X1,
f2 = the transfer function between series Y and series X2,
fN = the transfer function between series Y and series XN,
fA = the noise model.
Each developed time series model must satisfy three basic diagnostic checks before the model building process is complete and the final model is accepted. First, each identified model parameter must be statistically significant. Second, it must be invertible. And third, the residuals from the model should be white noise (i.e., the residuals should not display any time dependencies).
The Box-Jenkins technique can generally be applied in two ways in the context of a monthly accident series. The first is to model the entire series, including the time periods before and after the countermeasure program was instituted. An intervention series can be postulated for the effects of the program. This series is typically in the form of a zero for each month in which the countermeasure is not assumed to be operative and a one for each month in which it is assumed the countermeasure is operating. Alternatively, it is possible to search for interventions heuristically and then attempt to interpret any statistically significant ones found.
The second basic way to apply the Box-Jenkins technique is by modeling only the series prior to the application of the countermeasure. This model of the "before" series is used to forecast values for the periods after the application of the countermeasure. The actual and forecast values can then be compared to see if they are different statistically. Either approach is a valid application of the Box-Jenkins technique in the current context. Both were utilized as work progressed. In fact, many models of both types were identified using micro-computer software ("AutoBox," Automatic Forecasting Systems, 1986). This software is designed to identify automatically a time series model with or without an intervention series and to develop automatically any transfer functions for covariate series. It iterates through parameters until the model satisfies the three basic diagnostic checks discussed above.
The major focus of the accident analyses was on accidents involving alcohol as a primary causative factor. The hypotheses being tested were that alcohol involved accidents statewide in Wisconsin declined as a result of the passage of
-37
the new law, and that alcohol involved accidents in Milwaukee showed an additional decline coincident with the general deterrence media program. Since a quantitative measure of the blood alcohol content of crash-involved drivers was not routinely available for all crashes, it was necessary to utilize a surrogate measure of alcohol involvement. In addition, it was decided to limit the surrogate alcohol measure to injury and fatal accidents. Property damage only accidents were excluded because they are the most susceptible to reporting biases and, by definition, of lower societal cost than accidents which result in an injury or fatality.
There is no universally accepted surrogate ' measure for alcohol involvement in injury and fatal hi;hway crashes. However, the majority of studies which have examined this subject, usually only with respect to fatal accidents, have concluded that alcohol involvement is correlated `with injury and fatal crashes; single vehicle crashes.; crashes which occur late at night; crashes involving male drivers; and crashes which occur on Thursday, Friday and Saturday nights. For the present study, it was decided to use the most conservative measure possible by combining each of these characteristics into a single measure. Thus, the "Alcohol" accident series were defined as single vehicle injury and fatal accidents involving male drivers which occurred between 10 p.m. and 4:59 a. m. on Thursday, Friday or Saturday nights. Although this restrictive definition somewhat limited the number of accidents per month in the series, the total remaining was still considered more than sufficient to yield a stable estimator.
Once the "Alcohol" series was defined, it was necessary to develop a covariate series of "Noon-Alcohol" accidents. The purpose of this series, was to control for any overall accident reporting changes or global accident trends which might account for any observed changes in the alcohol series. Since the alcohol series was defined as one in which the probability of alcohol involvement was high, the "Non-alcohol" series was defined as the opposite, i.e., those accidents with a low probability of alcohol involvement. This was accomplished by excluding single vehicle injury and fatal accidents whose time of occurrence was between 10 p.m. and 4:59 a. m. from the series composed of all Wisconsin crashes. Crashes fo:r which time of occurrence was unknown were also excluded. The result is presumed to be an accident series with a presumed low number of alcohol involved incidents since all late night single vehicle injury and fatal crashes are excluded while daylight property damage (only) crashes are the largest single category.
The definitional process led to five different monthly accident series for use in the analyses. Three of these series were the "Alcohol" series for all Wisconsin, Milwaukee (Milwaukee County) and Green Bay (Brown County, the study's comparison community), respectively. The remaining two series were covariate series and covered "Non-alcohol" crashes for Wisconsin and Milwaukee (County). As mentioned above, the "Alcohol" series were intended as the tightest possible surrogate measure of drinking and driving crashes while the "Non-alcohol" series were intended as measures of the general traffic environment exclusive of alcohol.
B. Statewide Results
As already noted, the 1982 Wisconsin law was adopted by the legislature during the summer of .1981 and implemented on May 1, 1982. The adoption of
-38
the law was associated with a state-sponsored wave of publicity concerning the law and the alcohol crash problem. Therefore, any effect on accidents of this law and/or its attendant publicity could have been realized at any time from the public debate of the measure through its adoption to its implementation and beyond.
Table 9 shows the "Alcohol" series for Wisconsin. It is depicted graphically in Figure 3. As shown in the Table, there were 3,696 of these crashes with a high probability of being alcohol related in 1977 increasing to more than 4,000 crashes in 1980 and 1981. In 1982, the number dropped to 2,990 and remained at approximately this level through 1985. Clearly, the raw data suggest a drop in alcohol related crashes during the 1981-82 period. This series was examined using the automatic intervention detection approach. That is, many different intervention points were examined heuristically to determine if any statistically significant interventions could be identified. The results showed a statistically significant "step intervention" beginning in January of 1982 and lasting until the end of the series (December, 1985). That is, crashes "stepped down" by a significant amount at the start of the intervention and remained at the new, lower mean level for the duration. The estimated crash reduction associated with this intervention was 117.0 crashes per month (t = -5.71). Table 10 presents the details of this model. Although the start of the intervention is prior to the May 1, 1982 date on which the law became totally effective, it is well after adoption of the law and the peak of the publicity surrounding the law's debate. Some provisions of the law, although not the license suspension portion, were also already in effect.
Table 9 also shows the "Non-alcohol" series data for Wisconsin while Figure 4 shows this series graphically. This series was considered to be a measure of the total traffic environment in Wisconsin, exclusive of the major effects of alcohol, including any changes in accident reporting practice or requirements. This series, along with the step. intervention identified above, were used as covariates in a second time series analysis of the Wisconsin "Alcohol" series. The results showed that the step intervention in the alcohol series was again statistically significant with an estimated crash reduction of 108.1 crashes per month (t = -9.89). These results suggest that the 1982 law achieved its primary objective of reducing alcohol related crashes. Simply, any variation or reduction in the "Non-alcohol" series was not sufficient to account for the observed step down in the "Alcohol" series. Table 10 also shows the model details for this second model utilizing the intervention and covariate series.
C. Milwaukee Results
Table 11 and Figure 5 show the "Alcohol" series for Milwaukee County. As shown in the Table, the annual number of these crashes remained relatively stable (in the mid 400's) for the years 1977 to 1981 and then dropped (to the mid 300's) thereafter. This suggests that the statewide effect of the 1982 law was equally present in Milwaukee. It can also be seen in the Table that the fewest number of these crashes occurred in 1985 and that the numbers for the first half of 1985, coincident with the media program, are particularly low. However, the 1985 media effect is not at all as pronounced as the 1982 effect of the law.
The Milwaukee "Alcohol" series was examined using the automatic intervention detection approach. The results showed a significant step
-39
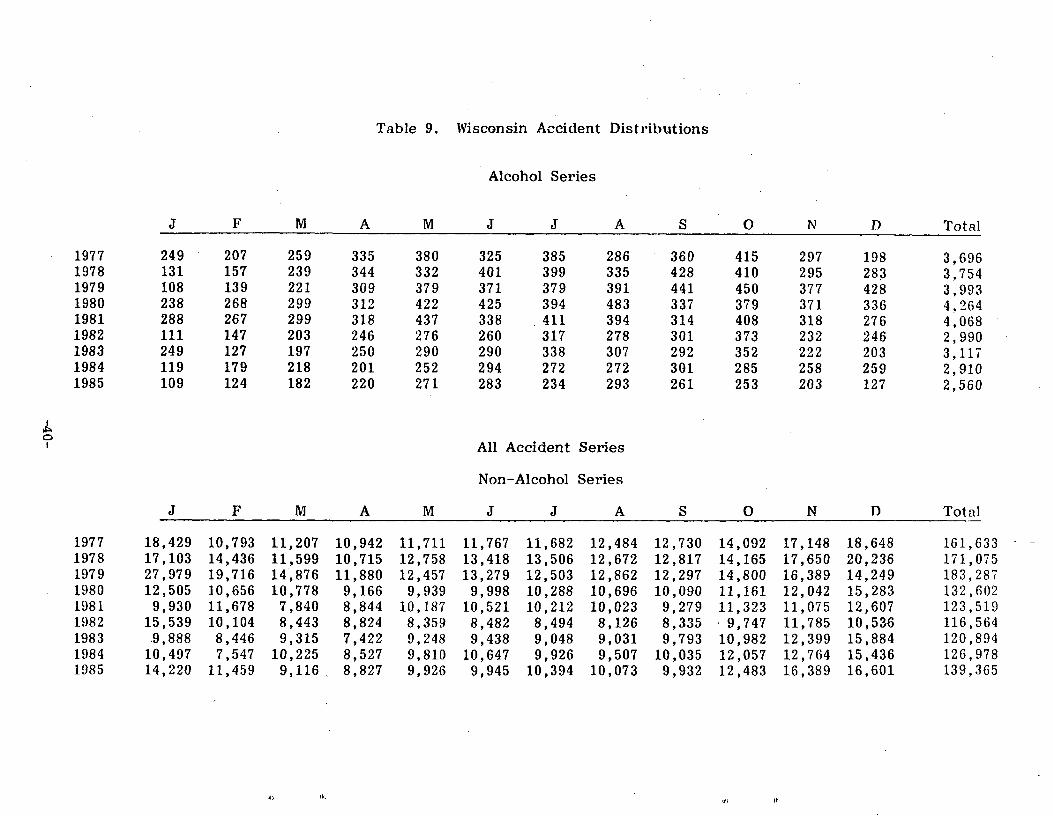
Table 9. Wisconsin Accident Distributions
Alcohol Series
J F M A M J J A S 0 N D Total
1977 249 207 259 335 380 325 385 286 360 415 297 198 3,696 1978 131 157 239 344 332 401 399 335 428 410 295 283 3,754 1979 108 139 221 309 379 371 379 391 441 450 377 428 3,993 1980 238 268 299 312 422 425 394 483 337 379 371 336 4,264 1981 288 267 299 318 437 338 411 394 314 408 318 276 4,068 1982 111 147 203 246 276 260 317 278 301 373 232 246 2,990 1983 249 127 197 250 290 290 338 307 292 352 222 203 3,117 1984 119 179 218 201 252 294 272 272 301 285 258 259 2,910 1985 109 124 182 220 271 283 234 293 261 253 203 127 2,560
All Accident Series
Non-Alcohol Series
J F M A M J J A S 0 N D Total
1977 18,429 10,793 11,207 10,942 11,711 11,767 11,682 12,484 12,730 14,092 17,148 18,648 161,633 1978 17,103 14,436 11,599 10,715 12,758 13,418 13,506 12,672 12,817 14,165 17,650 20,236 171,075 1979 27,979 19,716 14,876 11,880 12,457 13,279 12,503 12,862 12,297 14,800 16,389 14,249 183,287 1980 12,505 10,656 10,778 9,166 9,939 9,998 10,288 10,696 10,090 11,161 12,042 15,283 132,602 1981 9,930 11,678 7,840 8,844 10,187 10,521 10,212 10,023 9,279 11,323 11,075 12,607 123,519 1982 15,539 10,104 8,443 8,824 8,359 8,482 8,494 8,126 8,335 - 9,747 11,785 10,536 116,564 1983 .9,888 8,446 9,315 7,422 9,248 9,438 9,048 9,031 9,793 10,982 12,399 15,884 120,894 1984 10,497 7,547 10,225 8,527 9,810 10,647 9,926 9,507 10,035 12,057 12,764 15,436 126,978 1985 14,220 11,459 9,116, 8,827 9,926 9,945 10,394 10,073 9,932 12,483 16,389 16,601 139,365
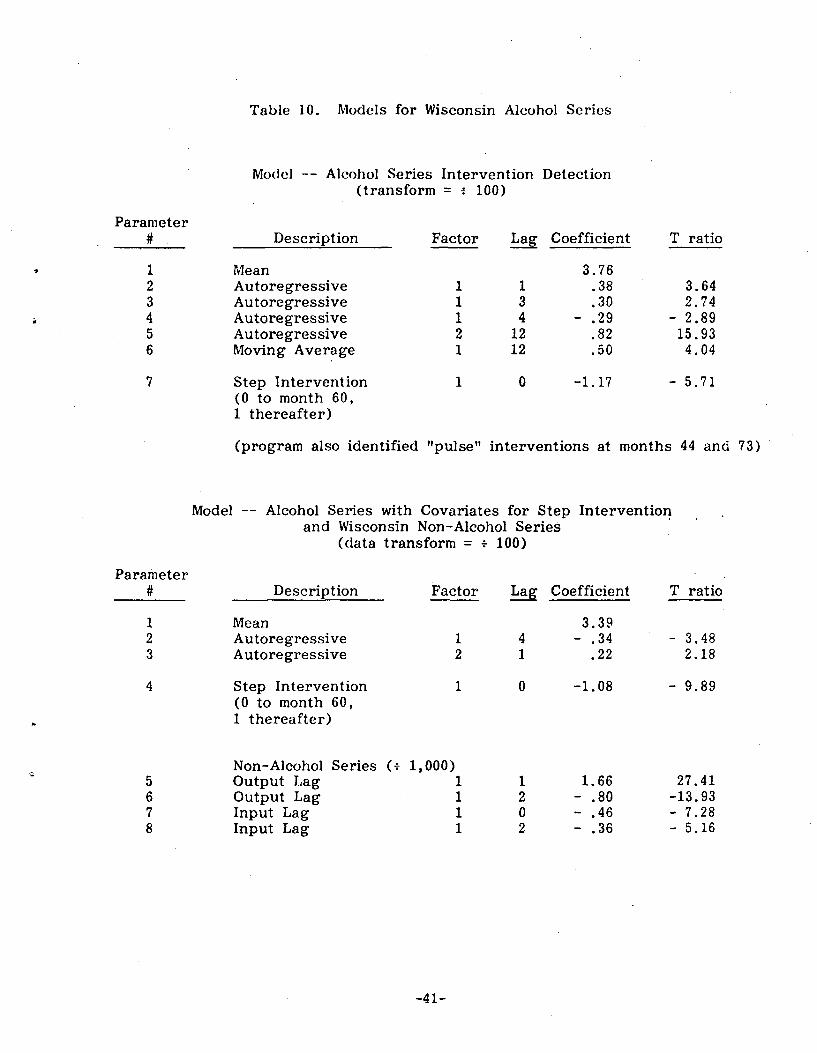
Table 10. Models for Wisconsin Alcohol Series
Model -- Alcohol Series Intervention Detection (transform = : 100)
Parameter Description Factor Lea Coefficient T ratio
1 Mean 3.76 2 Autoregressive 1 1 .38 3.64 3 Autoregressive 1 3 .30 2.74 4 Autoregressive 1 4 - .29 - 2.89 5 Autoregressive 2 12 .82 15.93 6 Moving Average 1 12 .50 4.04
7 Step Intervention 1 0 -1.17 - 5.71 (0 to month 60, 1 thereafter)
(program also identified "pulse" interventions at months 44 and 73)
Model -- Alcohol Series with Covariates for Step Interventionand Wisconsin Non-Alcohol Series
(data transform = : 100)
Parameter Description Factor Lag Coefficient T ratio
1 Mean 3.39 2 Autoregressive 1 4 - .34 - 3.48 3 Autoregressive 2 1 .22 2.18
4 Step Intervention 1 0 -1.08 - 9.89 (0 to month 60, 1 thereafter)
Non-Alcohol Series (: 1,000) 5 Output Lag 1 1 1.66 27.41 6 Output Lag 1 2 - .80 -13.93 7 Input Lag 1 0 - .46 - 7.28 8 Input Lag 1 2 - .36 - 5.16
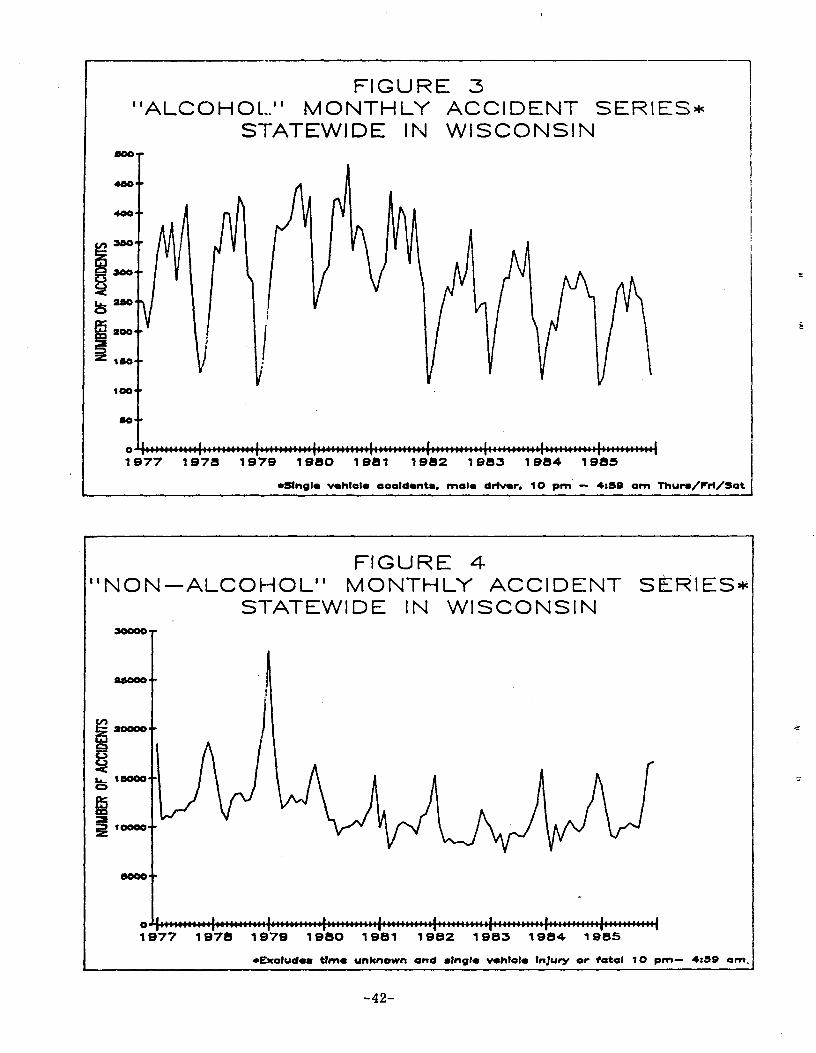
*
i
FIGURE 3''ALCOHOL'' MONTHLY ACCIDENT SERIES*
STATEWIDE IN WISCONSIN
280
2
1100+
5001977 1978
iV
I
? r
1979 1980 1981 1982 1983 1984 1985
*Single vehicle accidents. male driver. 10 pm - 4:39 am Thur./rr1/Sat
*
FIGURE 4"NON--ALCOHOL" MONTHLY ACCIDENT SERIES*
STATEWIDE IN WISCONSIN30000-r
26000--
laccat
8000 t
0
1977 1978 1979 1980 1981 1982 1983 1984 1985
+Excludes time unknown and single vehicle Injury or fatal 10 pm- 4:59 am,
-42-
*
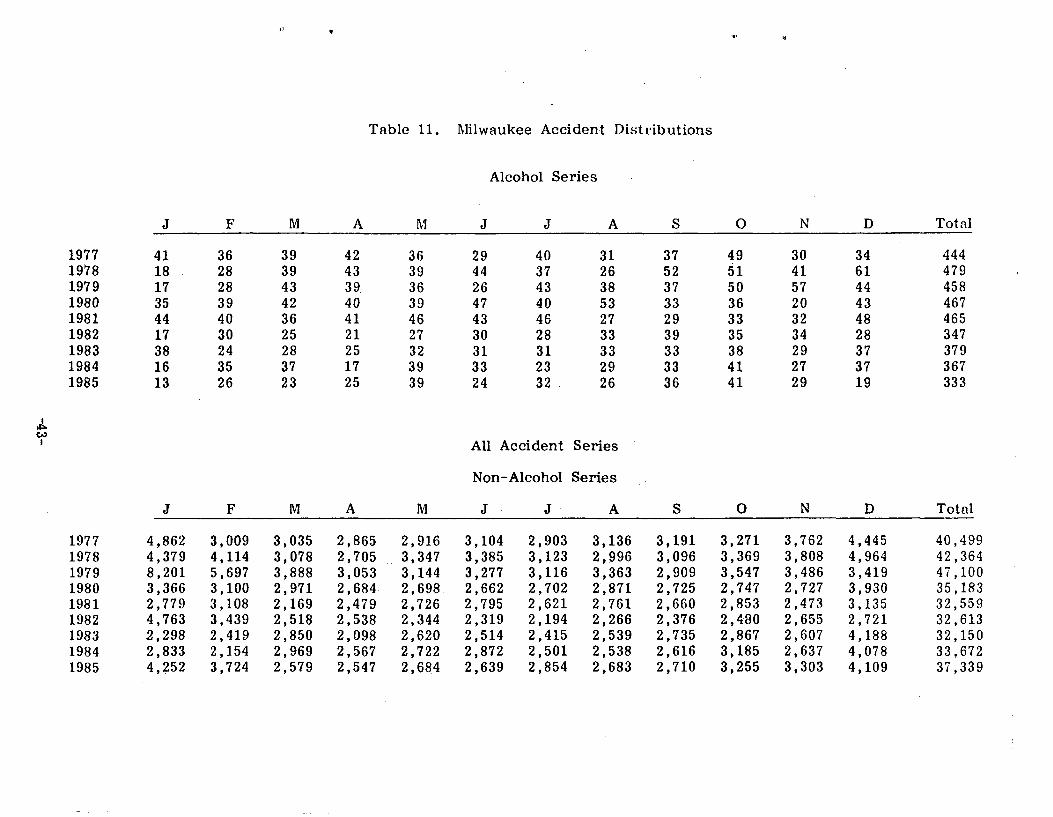
Table 11. Milwaukee Accident Distributions
Alcohol Series
J F M A M J J A S 0 N D Total
1977 41 36 39 42 36 29 40 31 37 49 30 34 444 1978 18 28 39 43 39 44 37 26 52 51 41 61 479 1979 17 28 43 39. 36 26 43 38 37 50 57 44 458 1980 35 39 42 40 39 47 40 53 33 36 20 43 467 1981 44 40 36 41 46 43 46 27 29 33 32 48 465 1982 17 30 25 21 27 30 28 33 39 35 34 28 347 1983 38 24 28 25 32 31 31 33 33 38 29 37 379 1984 16 35 37 17 39 33 23 29 33 41 27 37 367 1985 13 26 23 25 39 24 32 26 36 41 29 19 333
All Accident Series
Non-Alcohol Series
J F M A M J J A S 0 N D Total
1977 4,862 3,009 3,035 2,865 2,916 3,104 2,903 3,136 3,191 3,271 3,762 4,445 40,499 1978 4,379 4,114 3,078 2,705 3,347 3,385 3,123 2,996 3,096 3,369 3,808 4,964 42,364 1979 8,201 5,697 3,888 3,053 3,144 3,277 3,116 3,363 2,909 3,547 3,486 3,419 47,100 1980 3,366 3,100 2,971 2,684 2,698_ 2,662 2,702 2,871 2,725 2,747 2,727 3,930 35,183 1981 2,779 3,108 2,169 2,479 2,726 2,795 2,621 2,761 2,660 2,853 2,473 3,135 32,559 1982 4,763 3,439 2,518 2,538 2,344 2,319 2,194 2,266 2,376 2,480 2,655 2,721 32,613 1983 2,298 2,419 2,850 2,098 2,620 2,514 2,415 2,539 2,735 2,867 2,607 4,188 32,150 1984 2,833 2,1.54 2,969 2,567 2,722 2,872 2,501 2,538 2,616 3,185 2,637 4,078 33,672 1985 4,252 3,724 2,579 2,547 2,684 2,639 2,854 2,683 2,710 3,255 3,303 4,109 37,339
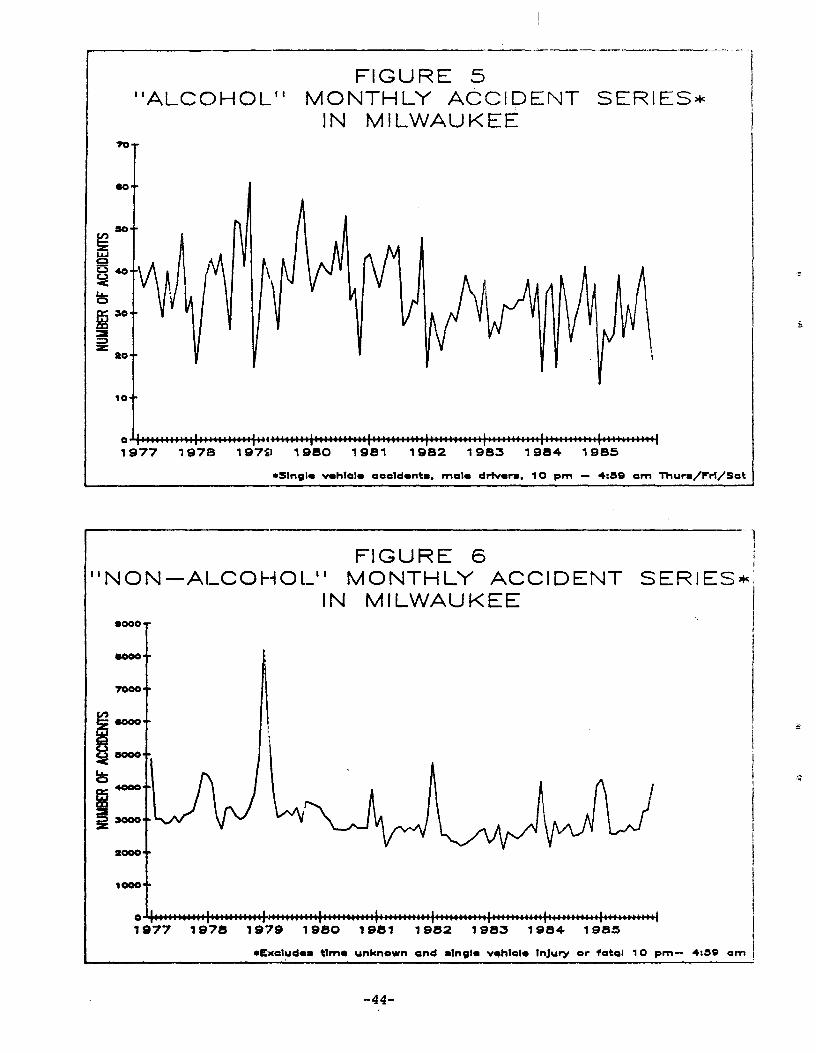
*
FIGURE 5"ALCOHOL" MONTHLY ACCIDENT SERIES*
IN MILWAUKEE70 -r
40
ac tio,
10t
O i
1977 1978 197£) 1980 1981 1982 1983 1984 1985
*Single vehicle accidents. male drivers. 10 pm - 4:59 am Thurs/Fri/Sot
*
I
FIGURE 6"NON-ALCOHOL" MONTHLY ACCIDENT SERIES*,
IN MILWAUKEE0000 -r
01977 1978 1979 1980 1981 1982 1983 1984 1985
*Excludes time unknown and single vehicle injury or fatal 10 pm- 4:39 am
-44-
it
1000
1o00
A**
*
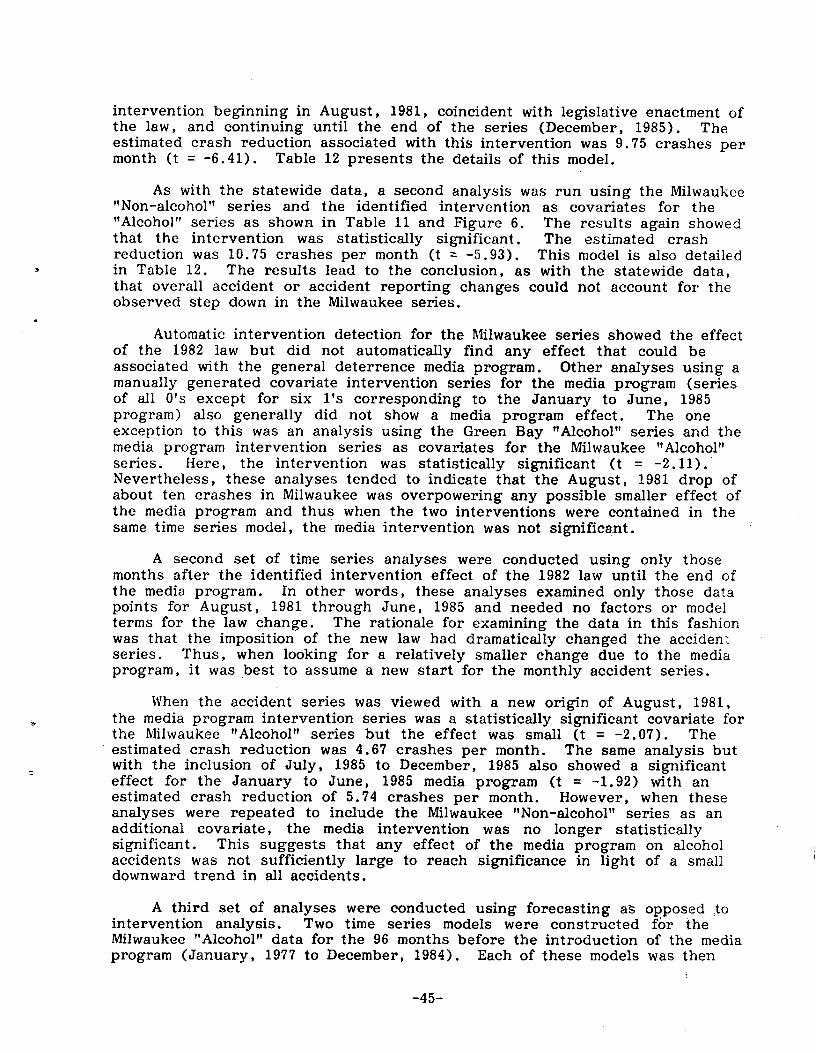
intervention beginning in August, 1981, coincident with legislative enactment of the law, and continuing until the end of the series (December, 1985). The estimated crash reduction associated with this intervention was 9.75 crashes per month (t = -6.41). Table 12 presents the details of this model.
As with the statewide data, a second analysis was run using the Milwaukee "Non-alcohol" series and the identified intervention as covariates for the "Alcohol" series as shown in Table 11 and Figure 6. The results again showed that the intervention was statistically significant. The estimated crash reduction was 10.75 crashes per month (t = -5.93). This model is also detailed in Table 12. The results lead to the conclusion, as with the statewide data, that overall accident or accident reporting changes could not account for the observed step down in the Milwaukee series.
Automatic intervention detection for the Milwaukee series showed the effect of the 1982 law but did not automatically find any effect that could be associated with the general deterrence media program. Other analyses using a manually generated covariate intervention series for the media program (series of all 0's except for six l's corresponding to the January to June, 1985 program) also generally did not show a media program effect. The one exception to this was an analysis using the Green Bay "Alcohol" series and the media program intervention series as covariates for the Milwaukee "Alcohol" series. Here, the intervention was statistically significant (t = -2.11). Nevertheless, these analyses tended to indicate that the August, 1981 drop of about ten crashes in Milwaukee was overpowering any possible smaller effect of the media program and thus when the two interventions were contained in the same time series model, the media intervention was not significant.
A second set of time series analyses were conducted using only those months after the identified intervention effect of the 1982 law until the end of the media program. In other words, these analyses examined only those data points for August, 1981 through June, 1985 and needed no factors or model terms for the law change. The rationale for examining the data in this fashion was that the imposition of the new law had dramatically changed the accident series. Thus, when looking for a relatively smaller change due to the media program, it was best to assume a new start for the monthly accident series.
When the accident series was viewed with a new origin of August, 1981, the media program intervention series was a statistically significant covariate for the Milwaukee "Alcohol" series but the effect was small (t = -2.07). The estimated crash reduction was 4.67 crashes per month. The same analysis but with the inclusion of July, 1985 to December, 1985 also showed a significant effect for the January to June, 1985 media program (t = -1.92) with an estimated crash reduction of 5.74 crashes per month. However, when these analyses were repeated to include the Milwaukee "Non-alcohol" series as an additional covariate, the media intervention was no longer statistically significant. This suggests that any effect of the media program on alcohol accidents was not sufficiently large to reach significance in light of a small downward trend in all accidents.
A third set of analyses were conducted using forecasting as opposed to intervention analysis. Two time series models were constructed for the Milwaukee "Alcohol" data for the 96 months before the introduction of the media program (January, 1977 to December, 1984). Each of these models was then
-45
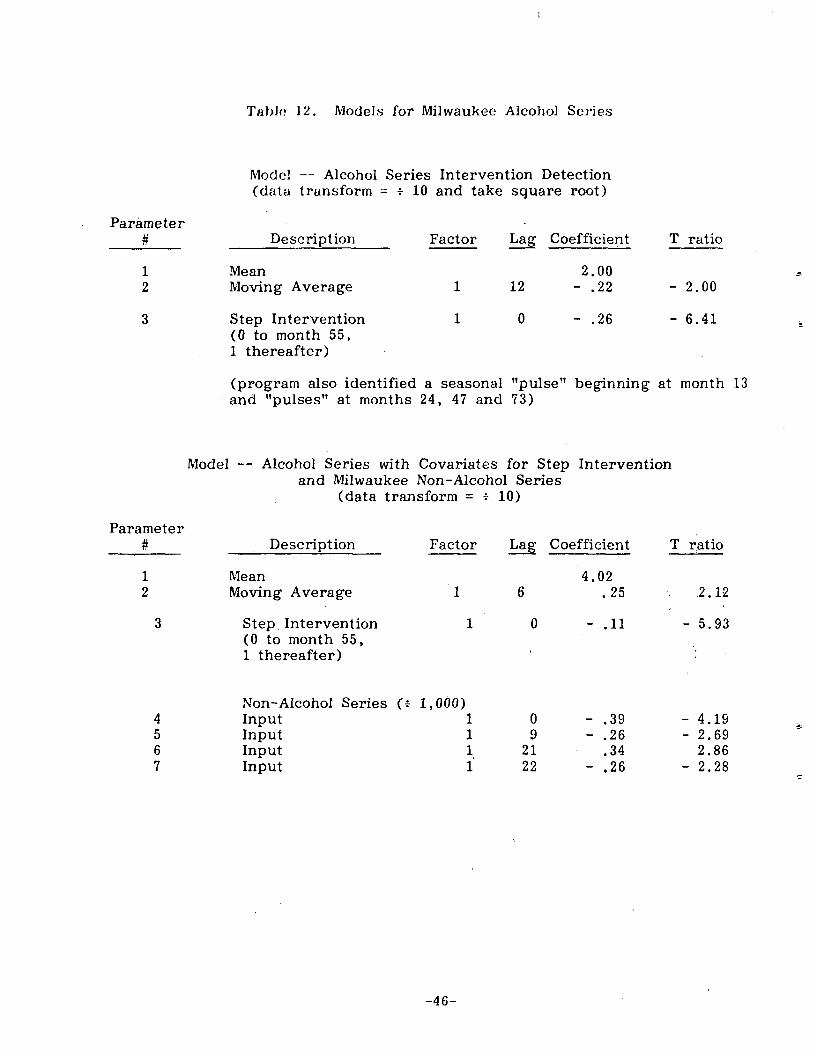
Table 12. Models for Milwaukee Alcohol Series
Model -- Alcohol Series Intervention Detection (data transform = : 10 and take square root)
Parameter
1 2
3
Description Factor Lag Coefficient T ratio
Mean 2.00 Moving Average 1 12 - .22 - 2.00
Step Intervention 1 0 - .26 - 6.41 (0 to month 55, 1 thereafter)
(program also identified a seasonal "pulse" beginning at month 13 and "pulses" at months 24, 47 and 73)
Model -- Alcohol Series with Covariates for Step Interventionand Milwaukee Non-Alcohol Series
(data transform = : 10)
Parameter Description Factor Lag Coefficient T ratio
1 Mean 4.02 2 Moving Average 1 6 .25 2.12
3 Step. Intervention 1 0 - .11 - 5.93 (0 to month 55, 1 thereafter)
Non-Alcohol Series (: 1,000) 4 Input 1 0 - .39 - 4.19 5 Input 1 9 - .26 - 2.69 6 Input 1 21 .34 2.86 7 Input 1 22 - .26 - 2.28
used to predict or forecast an expected number of accidents for the January to June, 1985 period of the media program. The first of these models used only a covariate series for the effect of the law change (all 0's until August, 1981, all 1's thereafter). It forecast a total of 184.7 crashes for the six month period of the media program. The actual number of crashes was 150 for an average reduction (actual versus forecast) of 5.78 crashes per month. The second model used the same covariate series for the effect of the intervention of the law plus the Milwaukee "Non-alcohol" and Green Bay "Alcohol" series as additional covariates. This model with three covariate series estimated 186.0 crashes for the six month media program period suggesting a reduction of 6.00 crashes per month based on the 150 crashes actually observed in the Milwaukee "Alcohol" series over that period.
Table 13 presents the details of the model using covariate series for the effect of the intervention of the law, Milwaukee "Non-alcohol" and Green Bay "Alcohol" crashes. The Table also presents the actual and forecast monthly values for January through June 1985. The average monthly forecast for the first six months of 1985 was approximately 31 crashes. The actual number of crashes was substantially lower for January to April of 1985 which correspond to the first four months of the primary media program. In fact, when looking at only these first four months, the difference from the forecast values is statistically significant (t = -3.31). The number of crashes was above the forecast value for May and below the forecast value for June. For the full six months of the program the difference between the actual and forecast values was not statistically significant (t = -1.78). The results for July to December, 1985 which correspond to the six months after the program, are not shown in Table 13. During this six month period, there was little difference between the actual (183) and forecast (189.2) values.
In summary, the Wisconsin and Milwaukee "Alcohol" data clearly show crash reductions associated with the 1982 change in the law. Statewide, this reduction was estimated at about 110 crashes per month in the very tightly defined "Alcohol" series. In Milwaukee, the reduction was estimated at about 10 crashes per month. Both of these reductions suggest a drop in alcohol related crashes of approximately 25%. In addition, the January to June, 1985 Milwaukee media program may have produced an additional reduction in alcohol related crashes of about 5 per month (approximately 15%). However, this additional reduction was not consistently demonstrated in the analyses conducted. It was apparently confined to the first four months of the media effort, and there is no evidence that the reduction continued beyond the life of the program.
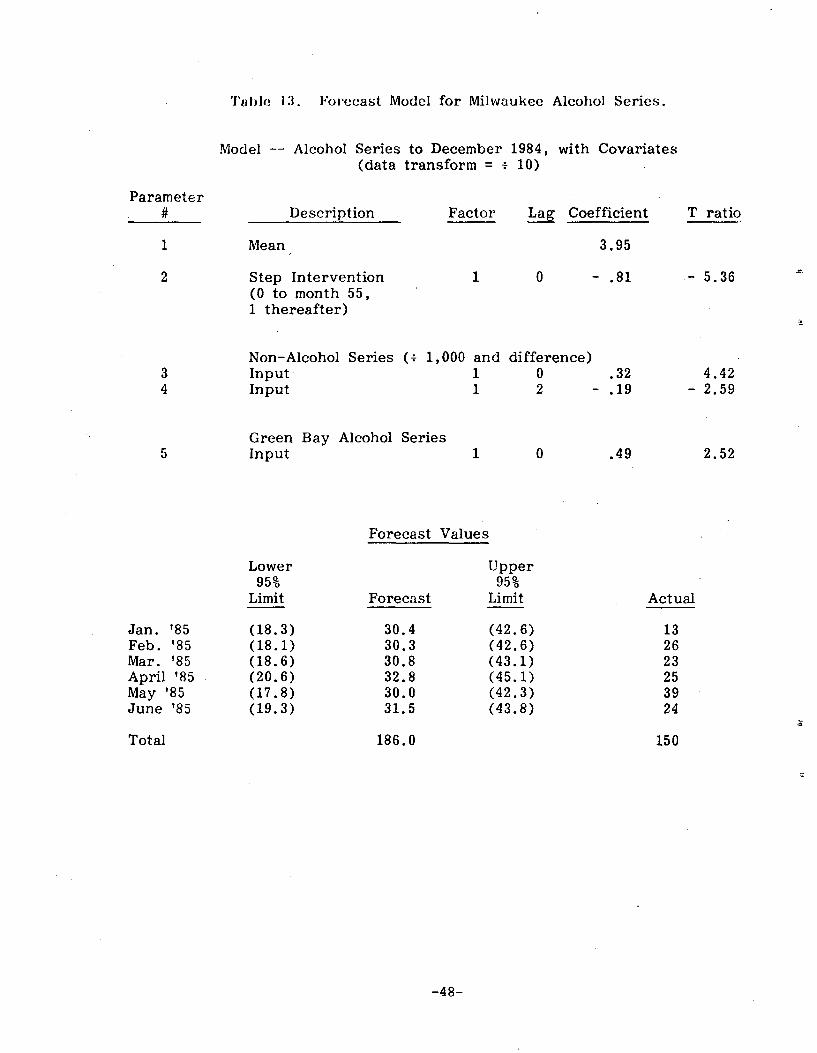
i
Table 13. Forecast Model for Milwaukee Alcohol Series.
Model -- Alcohol Series to December 1984, with Covariates (data transform = = 10)
Parameter # Description Factor Lag Coefficient T ratio
1 Mean 3.95
2 Step Intervention 1 0 - .81 - 5.36 (0 to month 55, 1 thereafter)
Non-Alcohol Series (: 1,000 and difference) 3 Input 1 0 .32 4.42 4 Input 1 2 - .19 - 2.59
Green Bay Alcohol Series 5 Input 1 0 .49 2.52
Forecast Values
Lower Upper 95% 95%
Limit Forecast Limit Actual
Jan. '85 (18.3) 30.4 (42.6) 13 Feb. '85 (18.1) 30.3 (42.6) 26 Mar. '85 (18.6) 30.8 (43.1) 23 April '85 (20.6) 32.8 (45.1) 25 May '85 (17.8) 30.0 (42.3) 39 June '85 (19.3) 31.5 (43.8) 24
Total 186.0 150
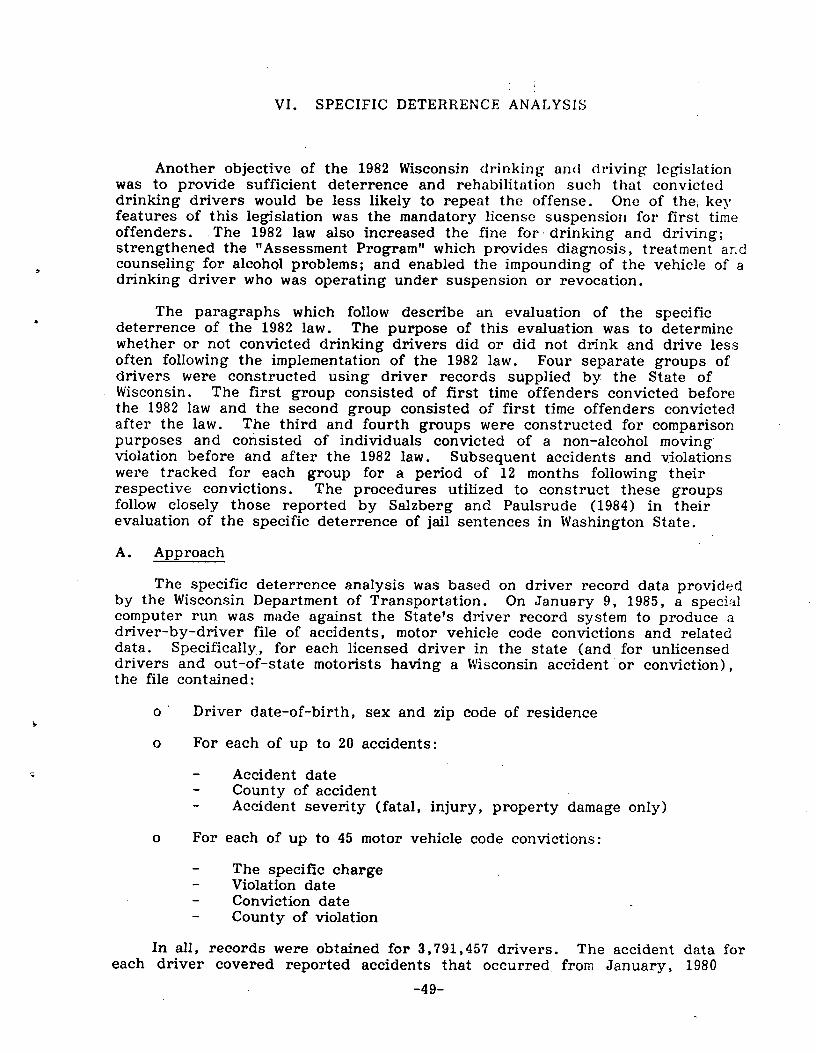
VI. SPECIFIC DETERRENCE ANALYSIS
Another objective of the 1982 Wisconsin drinking and driving legislation was to provide sufficient deterrence and rehabilitation such that convicted drinking drivers would be less likely to repeat the offense. One of the, key features of this legislation was the mandatory license suspension for first time offenders. The 1982 law also increased the fine for - drinking and driving; strengthened the "Assessment Program" which provides diagnosis, treatment and counseling for alcohol problems; and enabled the impounding of the vehicle of a drinking driver who was operating under suspension or revocation.
The paragraphs which follow describe an evaluation of the specific deterrence of the 1982 law. The purpose of this evaluation was to determine whether or not convicted drinking drivers did or did not drink and drive less often following the implementation of the 1982 law. Four separate groups of drivers were constructed using driver records supplied by the State of Wisconsin. The first group consisted of first time offenders convicted before the 1982 law and the second group consisted of first time offenders convicted after the law. The third and fourth groups were constructed for comparison purposes and consisted of individuals convicted of a non-alcohol moving violation before and after the 1982 law. Subsequent accidents and violations were tracked for each group for a period of 12 months following their respective convictions. The procedures utilized to construct these groups follow closely those reported by Salzberg and Paulsrude (1984) in their evaluation of the specific deterrence of jail sentences in Washington State.
A. Approach
The specific deterrence analysis was based on driver record data provided by the Wisconsin Department of Transportation. On January 9, 1985, a special computer run was made against the State's driver record system to produce a driver-by-driver file of accidents, motor vehicle code convictions and related data. Specifically, for each licensed driver in the state (and for unlicensed drivers and out-of-state motorists having a Wisconsin accident or conviction), the file contained:
Driver date-of-birth, sex and zip code of residence
o For each of up to 20 accidents:
- Accident date County of accident Accident severity (fatal, injury, property damage only)
o For each of up to 45 motor vehicle code convictions:
- The specific charge Violation date Conviction date County of violation
In all, records were obtained for 3,791,457 drivers. The accident data for each driver covered reported accidents that occurred from January, 1980
-49
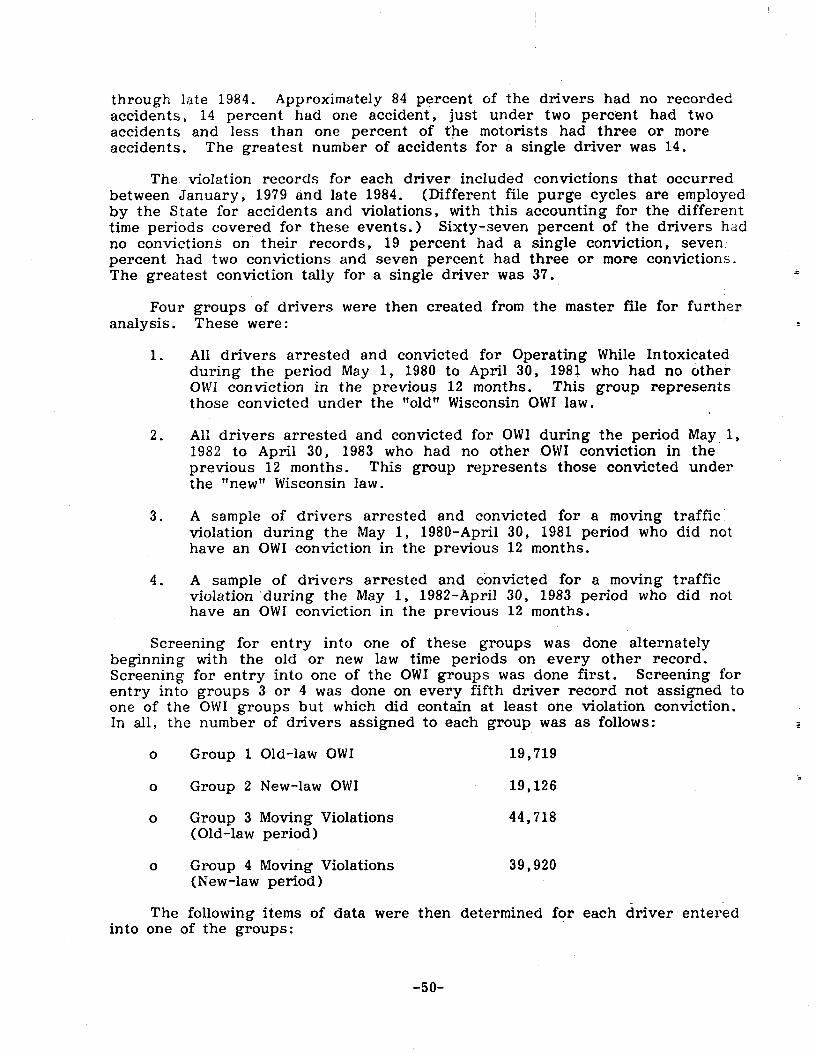
through late 1984. Approximately 84 percent of the drivers had no recorded accidents, 14 percent had one accident, just under two percent had two accidents and less than one percent of the motorists had three or more accidents. The greatest number of accidents for a single driver was 14.
The. violation records for each driver included convictions that occurred between January, 1979 and late 1984. (Different file purge cycles are employed by the State for accidents and violations, with this accounting for the different time periods covered for these events.) Sixty-seven percent of the drivers had no convictions on their records, 19 percent had a single conviction, seven percent had two convictions and seven percent had three or more convictions. The greatest conviction tally for a single driver was 37.
Four groups of drivers were then created from the master file for further analysis. These were:
1. All drivers arrested and convicted for Operating While Intoxicated during the period, May 1, 1980 to April 30, 1981 who had no other OWI conviction in the previous 12 months. This group represents those convicted under the "old" Wisconsin OWI law.
2. All drivers arrested and convicted for OWI during the period May. 1, 1982 to April 30, 1983 who had no other .OWI conviction in the previous 12 months. This group represents those convicted under the "new" Wisconsin law.
3. A sample of drivers arrested and convicted for a moving traffic, violation during the May 1, 1980-April 30, 1981 period who did not have an OWI conviction in the previous 12 months.
4. A sample of drivers arrested and convicted for a moving traffic violation 'during the May 1, 1982-April 30, 1983. period who did not have an OWI conviction in the previous 12 months.
Screening for entry into one of these groups was done alternately beginning with the old or new law time periods on every other record. Screening for entry into one of the OWI groups was done first. Screening for entry into groups 3 or 4 was done on every fifth driver record not assigned to one of the OWI groups but which did contain at least one violation conviction. In all, the number of drivers assigned to each group was as follows:
o Group 1 Old-law OWI 19,719
o Group 2 New-law OWI 19,126
o Group 3 Moving Violations 44,718(Old-law period)
o Group 4 Moving Violations 39,920(New-law period)
The following items of data were then determined for each driver entered into one of the groups:
-50
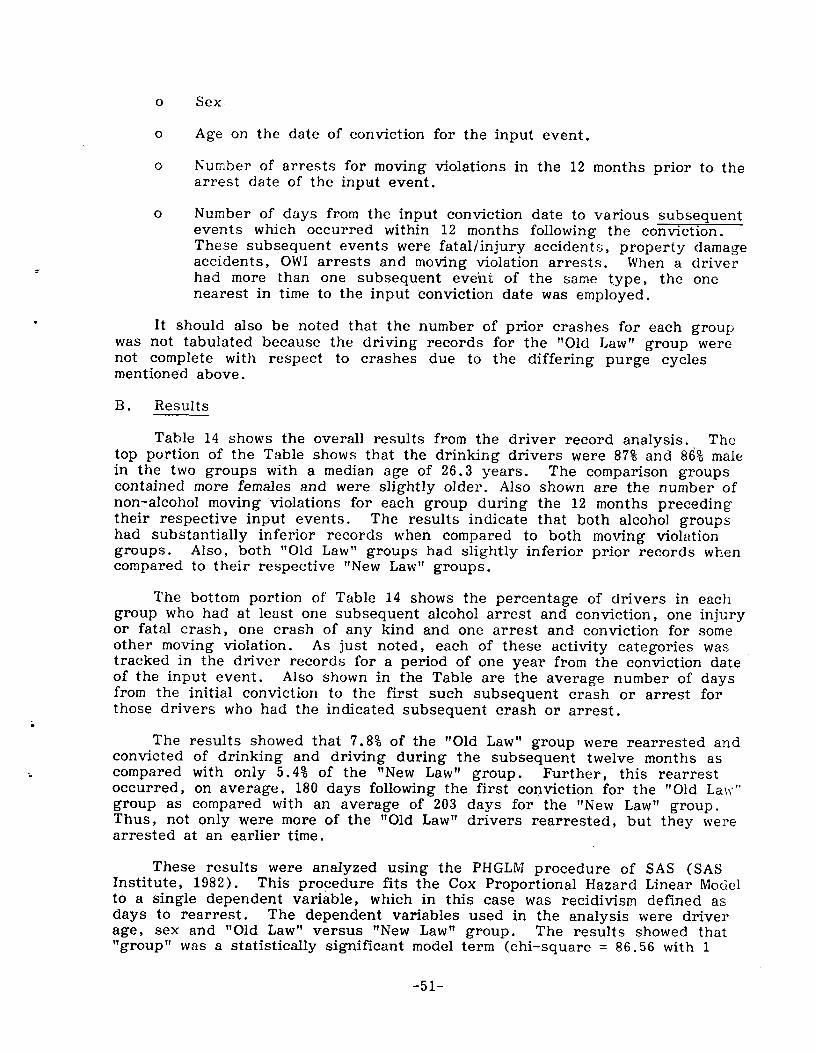
o Sex
o Age on the date of conviction for the input event.
o Number of arrests for moving violations in the 12 months prior to the arrest date of the input event.
o Number of days from the input conviction date to various subsequent events which occurred within 12 months following the conviction. These subsequent events were fatal/injury accidents, property damage accidents, OWI arrests and moving violation arrests. When a driver had more than one subsequent event of the same type, the one nearest in time to the input conviction date was employed.
It should also be noted that the number of prior crashes for each group was not tabulated because the driving records for the "Old Law" group were not complete with respect to crashes due to the differing purge cycles mentioned above.
B. Results
Table 14 shows the overall results from the driver record analysis. The top portion of the Table shows that the drinking drivers were 87% and 86% male in the two groups with a median age of 26.3 years. The comparison groups contained more females and were slightly older. Also shown are the number of non-alcohol moving violations for each group during the 12 months preceding their respective input events. The results indicate that both alcohol groups had substantially inferior records when compared to both moving violation groups. Also, both "Old Law" groups had slightly inferior prior records when compared to their respective "New Law" groups.
The bottom portion of Table 14 shows the percentage of drivers in each group who had at least one subsequent alcohol arrest and conviction, one injury or fatal crash, one crash of any kind and one arrest and conviction for some other moving violation. As just noted, each of these activity categories was tracked in the driver records for a period of one year from the conviction date of the input event. Also shown in the Table are the average number of days from the initial conviction to the first such subsequent crash or arrest for those drivers who had the indicated subsequent crash or arrest.
The results showed that 7.8% of the "Old Law" group were rearrested and convicted of drinking and driving during the subsequent twelve months as compared with only 5.4% of the "New Law" group. Further, this rearrest occurred, on average, 180 days following the first conviction for the "Old Law;" group as compared with an average of 203 days for the "New Law" group. Thus, not only were more of the "Old Law" drivers rearrested, but they were arrested at an earlier time.
These results were analyzed using the PHGLNI procedure of SAS (SAS Institute, 1982). This procedure fits the Cox Proportional Hazard Linear Model to a single dependent variable, which in this case was recidivism defined as days to rearrest. The dependent variables used in the analysis were driver age, sex and "Old Law" versus "New Law" group. The results showed that "group" was a statistically significant model term (chi-square = 86.56 with 1
-51
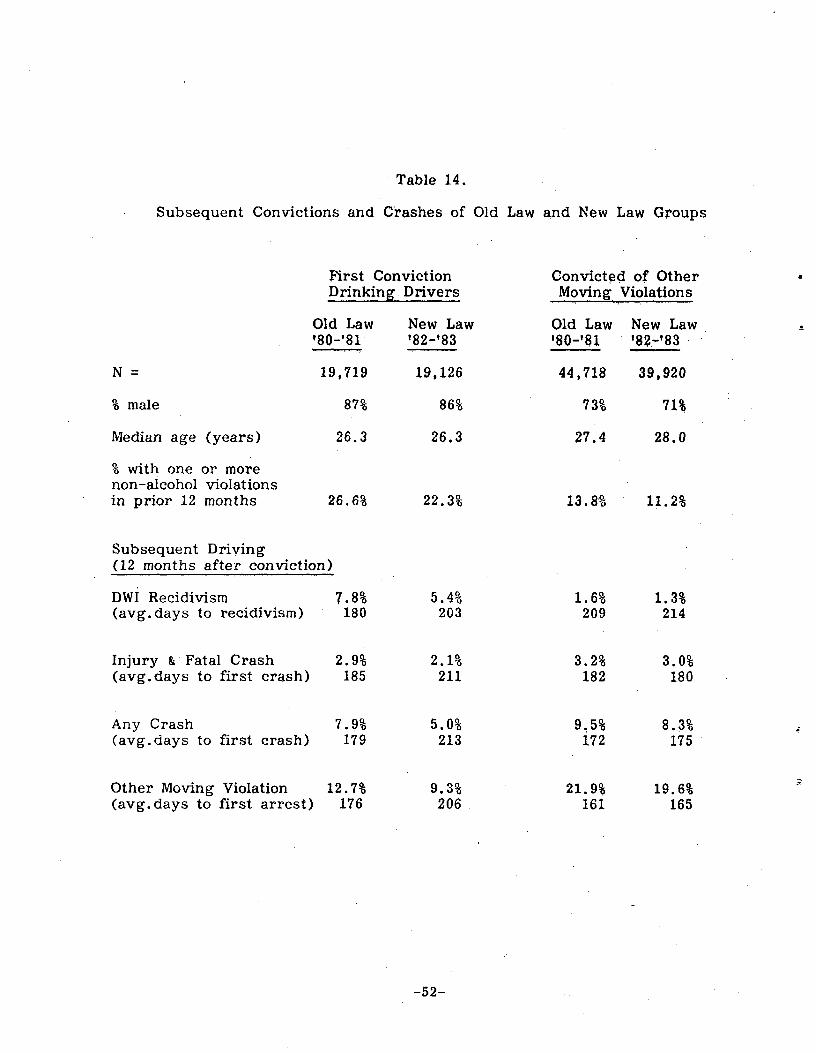
Table 14.
Subsequent Convictions and Crashes of Old Law and New Law Groups
First Conviction Convicted of Other Drinking Drivers Moving Violations
Old Law New Law Old Law New Law '80-'81 '82-'83 180-'81 '82.-'83
N = 19,719 19,126 44,718 39,920
% male 87% 86% 73% 71%
Median age (years) 26.3 26.3 27.4 28.0
% with one or more non-alcohol violationsin prior 12 months 26.6% 22.3% 13.8-% 11.2%
Subsequent Driving(12 months after conviction)
DWI Recidivism 7.8% 5.4% 1.6% 1.3%(avg.days to recidivism) 180 203 209 214
Injury & ,Fatal Crash 2.9% 2.1% 3.2% 3.0% (avg.days to first crash) 185 211 182 180
Any Crash 7.9% 5.0% 9.5% 8.3% (avg.days to first crash) 179 213 172 175
Other Moving Violation 12.7% 9.3% 21.9$ 19.6% (avg. days to first arrest) 176 206 161 165
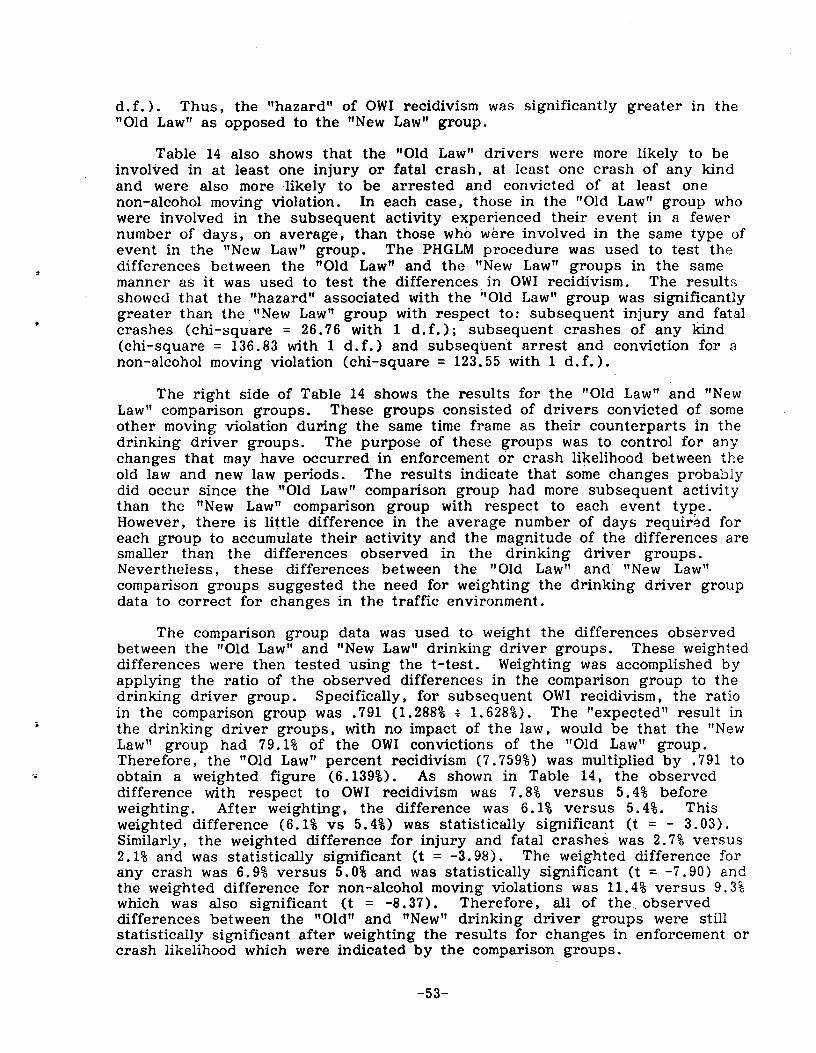
d.f.). Thus, the "hazard" of OWI recidivism was significantly greater in the "Old Law" as opposed to the "New Law" group.
Table 14 also shows that the "Old Law" drivers were more likely to be involved in at least one injury or fatal crash, at least one crash of any kind and were also more likely to be arrested and convicted of at least one non-alcohol moving violation. In each case, those in the "Old Law" group who were involved in the subsequent activity experienced their event in a fewer number of days, on average, than those who were involved in the same type of event in the "New Law" group. The PHGLM procedure was used to test the differences between the "Old Law" and the "New Law" groups in the same manner as it was used to test the differences in OWI recidivism. The results showed that the "hazard" associated with the "Old Law" group was significantly greater than the "New Law" group with respect to: subsequent injury and fatal crashes (chi-square = 26.76 with 1 d. f.) ; subsequent crashes of any kind (chi-square = 136.83 with 1 d.f.) and subsequent arrest and conviction for a non-alcohol moving violation (chi-square = 123.55 with 1 d. f.) .
The right side of Table 14 shows the results for the "Old Law" and "New Law" comparison groups. These groups consisted of drivers convicted of some other moving violation during the same time frame as their counterparts in the drinking driver groups. The purpose of these groups was to control for any changes that may have occurred in enforcement or crash likelihood between the old law and new law periods. The results indicate that some changes probably did occur since the "Old Law" comparison group had more subsequent activity than the "New Law" comparison group with respect to each event type. However, there is little difference in the average number of days required for each group to accumulate their activity and the magnitude of the differences are smaller than the differences observed in the drinking driver groups. Nevertheless, these differences between the "Old Law" and "New Law" comparison groups suggested the need for weighting the drinking driver group data to correct for changes in the traffic environment.
The comparison group data was used to weight the differences observed between the "Old Law" and "New Law" drinking driver groups. These weighted differences were then tested using the t-test. Weighting was accomplished by applying the ratio of the observed differences in the comparison group to the drinking driver group. Specifically, for subsequent OWI recidivism, the ratio in the comparison group was .791 (1.288% : 1.628%). The "expected" result in the drinking driver groups, with no impact of the law, would be that the "New Law" group had 79.1% of the OWi convictions of the "Old Law" group. Therefore, the "Old Law" percent recidivism (7.759%) was multiplied by .791 to obtain a weighted figure (6.139%). As shown in Table 14, the observed difference with respect to OWI recidivism was 7.8% versus 5.4% before weighting. After weighting, the difference was 6.1% versus 5.4%. This weighted difference (6.1% vs 5.4%) was statistically significant (t = - 3.03). Similarly, the weighted difference for injury and fatal crashes was 2.7% versus 2.1% and was statistically significant (t = -3.98). The weighted difference for any crash was 6.9% versus 5.0% and was statistically significant (t = -7.90) and the weighted difference for non-alcohol moving violations was 11.4% versus 9.3% which was also significant (t = -8.37). Therefore, all of the. observed differences between the "Old" and "New" drinking driver groups were still statistically significant after weighting the results for changes in enforcement or crash likelihood which were indicated by the comparison groups.
-53
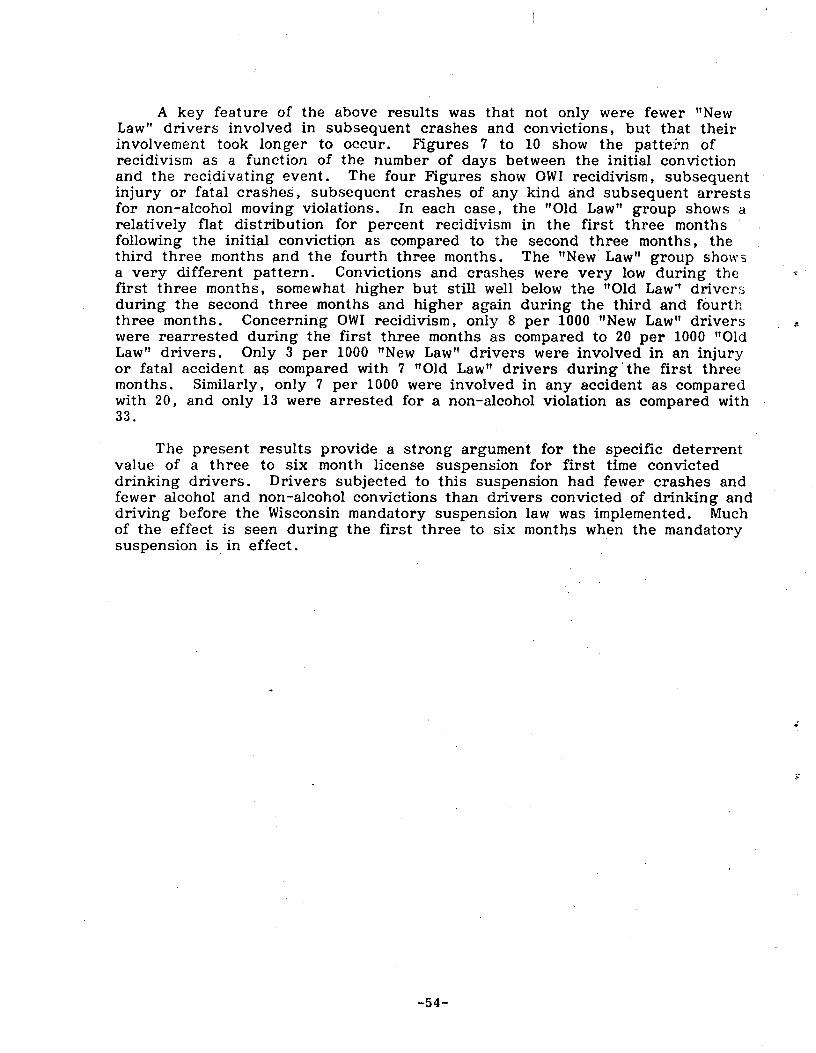
A key feature of the above results was that not only were fewer "New Law" drivers involved in subsequent crashes and convictions, but that their involvement took longer to occur. Figures 7 to 10 show the pattern of recidivism as a function of the number of days between the initial conviction and the recidivating event. The four Figures show OWI recidivism, subsequent injury or fatal crashes, subsequent crashes of any kind and subsequent arrests for non-alcohol moving violations. In each case, the "Old Law" group shows a relatively flat distribution for percent recidivism in the first three months following the initial conviction as compared to the second three months, the third three months and the fourth three months. The "New Law" group shows a very different pattern. Convictions and crashes were very low during the first three months, somewhat higher but still well below the "Old Law" drivers during the second three months and higher again during the third and fourth three months. Concerning OWI recidivism, only 8 per 1000 "New Law" drivers were rearrested during the first three months as compared to 20 per 1000 "Old Law" drivers. Only 3 per 1000 "New Law" drivers were involved in an injury or fatal accident as compared with 7 "Old Law" drivers during ' the first three months. Similarly, only 7 per 1000 were involved in any accident as compared with 20, and only 13 were arrested for a non-alcohol violation as compared with 33.
The present results provide a strong argument for the specific deterrent value of a three to six month license suspension for first time convicted drinking drivers. Drivers subjected to this suspension had fewer crashes and fewer alcohol and non-alcohol convictions than drivers convicted of drinking and driving before the Wisconsin mandatory suspension law was implemented. Much of the effect is seen during the first three to six months when the mandatory suspension is in effect.
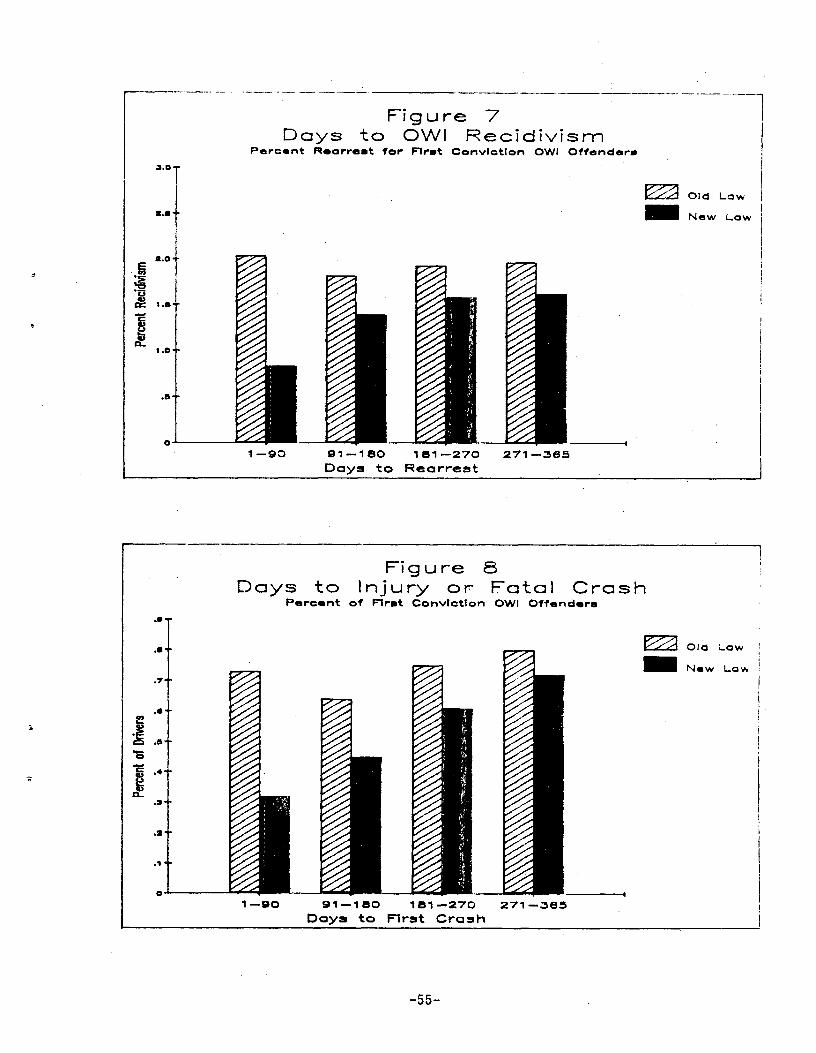
*
Figure 7Days to OWI Recidivism
Percent Rearrest for First Conviction OWl Offenders
Old Low
New Low
a.o
ac +.a
+.o
1-90 91-160 161-270Days to Rearrest
271 -365
*
Figure 8Days to Injury or Fatal Crash
Percent of First Conviction OW1 Offenders
Old Law
Now Law
1-90 91-180 181-270 271-365Days to First Crash
*
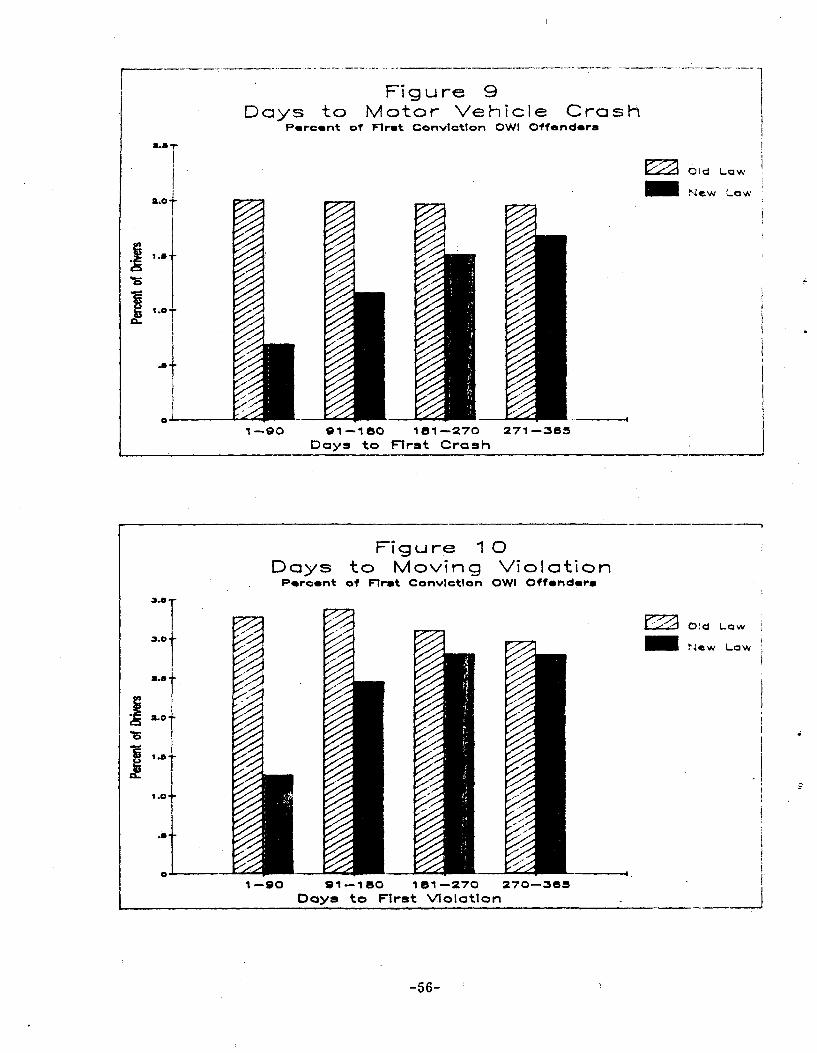
*
Figure 9Days to Motor Vehicle Crash
Percent of First Conviction OWI Offenders
a.o
^.a
1.0
01-90 91-180 181-270 271-365
Days to First Crash
Old Law
New Law
*
*
Figure 10Days to Moving Violation
Percent of First Conviction OWI Offenders
3.0
3.0
2.0
1 .0
.2
01-90 91-180 1 61 -270 270-363
Days to First Violation
O!d Law
New Law
I
*
VII. DISCUSSION
Present concepts about the nature and role of deterrence in affecting anti-social behavior have arisen largely from the work of criminologists and others concerned with the criminal justice system. For example, Andenaes (1966) was one of those to highlight the distinction between the effects of punishment on the person being punished (specific deterrence) and the effects of punishment upon members of society (general deterrence). Regarding the mechanism of deterrence he noted,
"By means of the criminal law, and by means of specific applications of this law, 'messages' are sent to members of society. The criminal law lists those actions which are liable to prosecution, and it specifies the penalties involved. The decisions of the courts and actions by police... transmit knowledge about the law, underlining the fact that criminal laws are not mere empty threats, and providing detailed information as to what kind of penalty might be expected for violations of specific laws." (p. 949)
Andenaes (1966), Chambliss (1967), and Crampton (1969) among others have discussed the necessary conditions for general deterrents to operate. Here, there is a consensus that for legal sanctions to be effective deterrents, there must exist, 1) a perceived risk of detection, apprehension and ;conviction, and 2) a perception that the applicable sanctions are relatively severe and swiftly and surely applied.
In the alcohol-highway safety area, there is a growing body of evidence indicating that well publicized enforcement campaigns can produce at least a temporary general deterrent effect. The classic outcome in this regard is found in the British Road Safety Act of 1967 which outlawed motor vehicle operation with Blood Alcohol Concentrations (BAC) of .08 percent or more, and authorized the police to stop and screen motorists suspected of having alcohol in their blood. As reported by Codling and Samson (1974), alcohol related crashes declined sharply when the act was introduced but returned to former levels several years later. Other positive results of "crackdowns" have been reported in New Zealand (Hurst and Wright, 1980), Canada (Mercer, 1985), and the U. S. (Levy et al., 1978).
As noted by Ross (1985), it is common for DWI enforcement campaigns to follow the pattern of the British experience, i.e., an initial decline in measures of alcohol-related crashes followed by a return to pre-campaign levels. Possible explanations of this outcome include changes over time among potential drinking drivers in the perceived risk of apprehension and/or a growing perception that possible sanctions are not necessarily applied or are not especially severe. In the case of the British Road Safety Act, for example, it was found that the police rarely made use of their new enforcement powers and the impact on ' accidents has been attributed more to the publicity surrounding the adoption of the act than to changes in the enforcement environment. The short-term effects of other "crackdowns" have also been attributed to the ending of the special enforcement efforts and to waning publicity about them (c.f., Ennis, 1977, Mercer, 1985).
From the general deterrence model, it is believed to be clear that enforcement, sanctioning and public awareness are closely intertwined.
-57
However, while the effects of well publicized enforcement efforts have been demonstrated, considerably less is known about the role of various types and levels of sanctions in deterring drunk driving.
As noted at the outset, the present study was a part of an NHTSA research program examining the general and specific deterrence value of traditional and innovative sanctions in DWI cases. Short term license suspension was selected as the specific traditional sanction of interest as it is widely available in states' laws, is relatively simple and inexpensive to apply, and has "face validity" in that it removes the offender's driving privilege. Also, studies of license actions in DWI cases have shown specific deterrent effects (Hagen, 1978, Williams et al., 1984a, Preusser et al., 1976).
When the present effort began, it was anticipated that several states would soon be adopting mandatory short term license suspension legislation and that one of these would be found that would be willing to participate as the locale for the intended study. That is, it was hoped that the study could be conducted during the period of transition to mandatory license suspension so that "before and after" measures of public attitudes and awareness could be obtained and the possible effects of the legal change on the criminal justice system could be observed at first hand. However, as these events did not transpire, it was necessary to employ an alternative design involving the use of a community with mandatory short-tern suspension in effect but with low, public awareness that the sanction was actually imposed. The primary project "manipulation" therefore became stimulating the target community to conduct a public information campaign focusing on the mandatory license suspension action in DWI cases, with this activity intended to enchance the general deterrence value of the sanction.
Analyses of surrogate measures of alcohol related motor vehicle accidents statewide and in the project community (Milwaukee) showed a significant downward "step" during the period of transition to the new State law, with this effect remaining through the end of the examined accident series (1982-1985).. It is likely, therefore, that the legislation enacted in 1982 contributed to the general deterrence of DWI at least among a portion of the potentially at-risk population. A major component of the legal change was the adoption of the mandatory suspension provision, with state records indicating that the requirement was fulfilled by the courts/driver licensing agency. Although DWI enforcement levels did not increase following the law change, it is not possible to disentangle the effect of the mandatory suspension action from other changes in the law (e.g., increased fines) nor from a global public perception that a "crackdown" was in process. Indeed, the September, 1984 survey by the Milwaukee Safety Commission and the baseline survey conducted shortly thereafter on behalf of the project, showed generally low public awareness that short-term license suspensions were being imposed in all DWI convictions.
The public information campaign conducted in Milwaukee during late 1984 through June, 1985 was of the type that could be readily employed at the community level without large expenditures. That is, media time and space were donated, as were production facilities. Local figures were featured in the broadcast materials and distribution of items was carried out by local groups and agencies. Also, the surveys of drivers done for the project were low-cost efforts with the main cost coming from the data analysis stage.
-58
The survey results clearly showed public exposure to the media materials and a large increase in awareness of the fact of mandatory license suspension. However, charges were also detected in the perception of risk of apprehension, despite the fact that this was not a campaign theme nor did the enforcement environment in Milwaukee change during the public information effort. Such "spillover" effects are not uncommon in public information efforts and do not mitigate against the conclusion that the primary media objective was achieved. However, the increase in awareness of the certainty of the license sanction cannot be isolated from other possible changes in perception.
Analyses of accidents in Milwaukee through the period of the media effort showed a possible, small general deterrent effect coincident with the campaign. However, the evidence for this was not strong and it is not possible to conclude that the increased knowledge of the certainty of short-term license suspension translated into behavioral changes as measured by alcohol related crashes. On the other hand, the specific deterrence analysis showed that drivers convicted under the mandatory license suspension provision had significantly better subsequent driving records than did persons convicted during the period when less than half of offenders were subjected to a license action. This outcome is similar to that reported by Hagen (1978) for multiple DWI offenders subjected to license withdrawals of 12 months to three years duration. Williams, et al. (1984b) indicate that the majority of suspended or revoked DWI offenders reported driving during the period of their license withdrawal. However, the nature of the driving was said to have changed and its extent was reduced. Also, a sizeable minority of their DWI group reported no driving during the suspension/ revocation period. Similarly, the Wisconsin drivers examined in the present study were not entirely accident or violation free during their suspension period, indicating that driving was taking place. However, their driving record as a group was. better than among pre-law DWI offenders wherein more than one-half were free to drive immediately after conviction.
Williams et al., (1984a) report that the better driving records of the suspended /revoked group originally studied by Hagen (1978), extended well beyond the period of the term of the license action itself, with this suggesting a specific deterrent effect continuing after the return of driving privileges. The present data regarding specific deterrence also have shown that a significant highway safety benefit was obtained during the short term license suspension period and that this effect may have continued after the suspension period. However, the time frame of the study did not permit an examination of driving records for an extended period during which post-conviction driving was legal.
The 1982 DWI law enacted in Wisconsin contained numerous provisions regarding the offense (e.g., the adoption of illegal per se) and its processing. The mandatory short-term license provision in the law was guaranteed by requiring the State's driver licensing agency to carry out the suspension if one was not specifically imposed by the adjudicating court and, indeed, State records indicate that all drivers convicted since the legal changes have had their licenses suspended.
The present study found that a significant drop in alcohol related crashes took place coincident with the adoption of the law, with this effect lasting at least until the end of 1985.
-59
I
Also, the specific deterrence value of the sanction was clearly shown, at least during the suspension period and possibly thereafter. The study has also shown that it is entirely feasible to relatively inexpensively conduct and measure a public information effort at the local level intended to increase the general deter°ence value of the license sanction. Greatly increased awareness of the sanction was shown and the evidence, though not conclusive, suggests that such an activity can contribute to general deterrence.
Mandatory, short-term license suspension in DWI cases is obviously less severe than longer term license actions and may be considered less severe than some other penalties such as incarceration. However, the sanction was part of a legislative package in Wisconsin that generated a general and specific deterrent effect. Also, :;lo evidence was found to indicate that the sanction caused disruptions to the adjudication process, an undesirable outcome often reported in locales adopting "severe" penalties. While the perceived severity of short term suspension cannot be precisely established, the certainty of its application can be legislatively adopted without dire consequences and the public can be made aware of this fact.
The interrelationship of enforcement activities, sanctioning practices and public perceptions make it impossible to isolate the "pure" effect of mandatory license suspensions in DWI cases. Nevertheless, the results of the present study and other research are believed to offer a compelling argument to public policy makers that short term license actions should be made mandatory sanctions as part of the overall effort to combat the toll of alcohol related motor vehicle accidents.
VIII. REFERENCES
Andenaes, J. The General Preventive Effects of Punishment. U. of Penn. Law Review, 1966, 114, 949-983.
Automatic Forecasting Systems, Inc. Autdbox Manual. Automatic Forecasting Systems, Inc., Hatboro, PA, 1986.
Chambliss, W.J. Types of Deviance and the Effectiveness of Legal Sanctions. Wisconsin Law Review, Summer 1967, 703-719.
Crampton, R.C. Driver Behavior and Legal Sanctions: A Study of Deterrence. Michigan Law Review, 1969, 67, 421-454.
Codling, P.J. and Samson, P. Blood-Alcohol in Road Fatalities Before and After the Road Safety Act, 1967. Crowthorne, Berkshire: Transport and Road Research Laboratory, Supplementary Report 45UC, 1974.
Ennis, P. K. General Deterrence and Police Enforcement: Effective Countermeasures Against Drinking and Driving? Journal of Safety Research, 1977, 9, 15-25.
Hagen, R.E. The Efficacy of Licensing Controls as a Countermeasure for Multiple DUI Offenders. Journal of Safety Research, 1978, 10, 115-122.
Hurst, P. and Wright, R. Deterrence at Last: The Ministry of Transport's Alcohol Blitzes. Paper presented to the Eighth International Conference on Alcohol, Drugs and Traffic Safety, Stockholm, 1980.
Kindschi, R.E. Review of Drinking Driver Facts. Wisconsin Bureau of Driver Licensing, Madison, WI, 1984.
Levy, P., Voas, R., Johnson, P. and Klein, T.M. An Evaluation of the Department of Transportation's Alcohol Safety Action Projects. Journal of Safety Research, 1978, 10, 162-176.
McCleary, R. and Hay, R.A., Jr. Applied Time Series Analysis for the Social Sciences. Sage Publications, Beverly Hills, CA, 1980.
Mercer, G.W. The Relationship Among Driving While Impaired Charges, Police Drinking-Driving Roadcheck Activity, Media Coverage and Alcohol-Related Casualty Traffic Accidents. Accident Analysis and Prevention, 1985, 17, 467-474.
Preusser, D.F., Ulmer, R.G., and Adams, J.R. Driver record evaluation of a drinking drivers rehabilitation program. Journal of Safety Research, 1976, 8(3), 98-105.
Ross, H.L. Deterring Drunken Driving: An Analysis of Current Efforts. Journal of Studies on Alcohol, 1985, Supplement No. 10, 122-128.
Salzberg, P.M. and Paulsrude, S.P. An evaluation of Washington's driving while intoxicated law: Effects on drunk driving recidivism. Journal of Safety Research, 1984, 15, 117-124.
SAS Institute, Inc. SAS User's Guide: Statistics. SAS Institute, Inc., Cary, NC, 1982.
Williams, R.L., Hagen, R.E. and McConnell, E.J. A Driving Record Analysis of Suspension and Revocation Effects on the Drinking-Driver Offender. Accident Analysis and Prevention, 1984a, 16, 333-338.
Williams, R.L., Hagen, R.E. and McConnell, E.J. A Summary of Suspension and Revocation Effects on the Drinking-Driving Offender. Accident Analysis and Prevention, 1984b, 16, 339-350.
APPENDIX A
Survey Forms
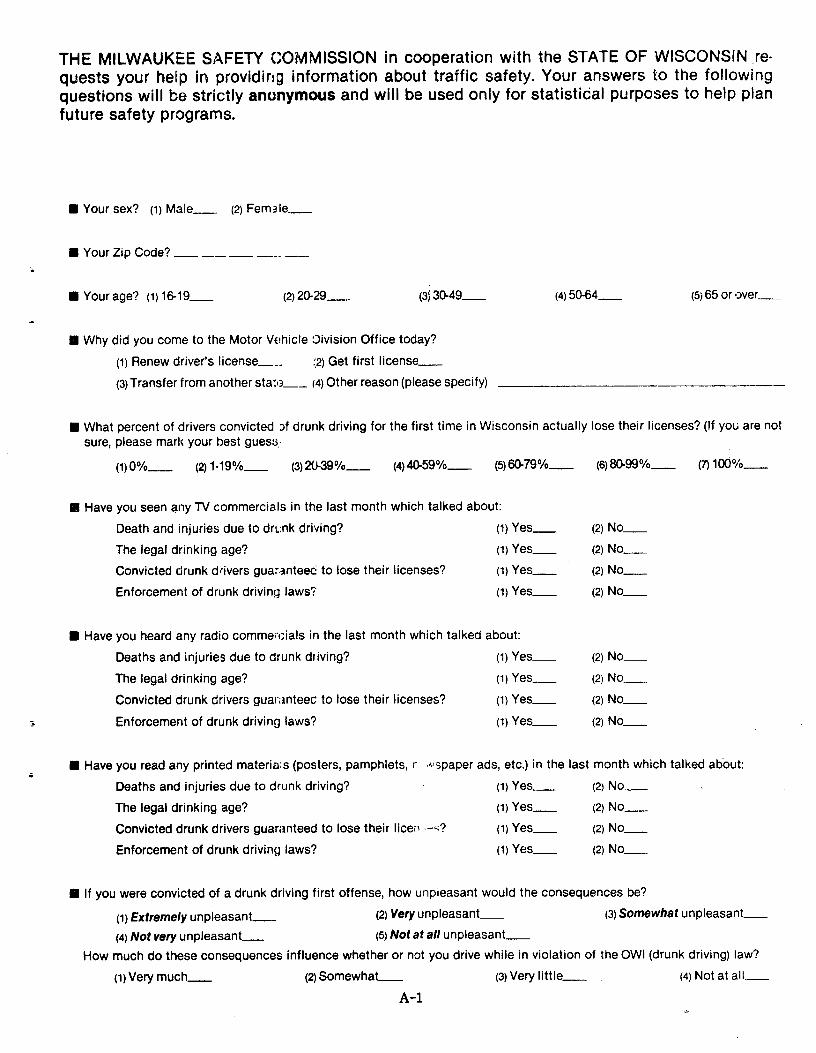
THE MILWAUKEE SAFETY COMMISSION in cooperation with the STATE OF WISCONSIN.requests your help in providing information about traffic safety. Your answers to the following questions will be strictly anonymous and will be used only for statistical purposes to help plan future safety programs.
n Your sex? (1) Male_ (2) Fem3Ie_
n Your Zip Code? __ _ ___
n Your age? (1)16-19_ (2) 20.29_ (3j 30-49_ (4) 50-64_ (5) 65 or over-
n Why did you come to the Motor Vehicle Division Office today?
(1) Renew driver's license--- :2) Get first license
(3) Transfer from another stan3__ (4) Other reason (please specify)
n What percent of drivers convicted Df drunk driving for the first time in Wisconsin actually lose their licenses? (If you are not sure, please mark your best guess,.
(1) 0%_ (2)1.19%_ (3)2039%_ (4)40-59%_ (5)60-79%_ (6)80.99%_ (7)100%_
n Have you seen any TV commercials in the last month which talked about:
Death and injuries due to drL:nk driving? (1) Yes_ (2) No_
The legal drinking age? (1) Yes_ (2) No_
Convicted drunk drivers guaranteed to lose their licenses? (1) Yes_ (2) No_
Enforcement of drunk driving laws? (1) Yes_ (2) No
n Have you heard any radio commercials in the last month which talked about:
Deaths and injuries due to drunk driving? (1) Yes._ (2) No
The legal drinking age? (1) Yes_ (2) No_
Convicted drunk drivers guar nteec to lose their licenses? (1) Yes_ (2) No
Enforcement of drunk driving laws? (1) Yes_ (2) No-
N Have you read any printed materia:s (posters, pamphlets, r ,,,spaper ads, etc.) in the last month which talked about:
Deaths and injuries due to drunk driving? (1) Yes_ (2) No_
The legal drinking age? (1) Yes_ (2) No_
Convicted drunk drivers guaranteed to lose their licen--'? (1) Yes_ (2) No_
Enforcement of drunk driving laws? (1) Yes_ (2) No
n If you were convicted of a drunk driving first offense, how unpleasant would the consequences be?
(1) Extremely unpleasant- (2) Very unpleasant- (3) Somewhat unpleasant
(4) Not very unpleasant- (5) Not at all unpleasant-
How much do these consequences influence whether or not you drive while in violation of the OWI (drunk driving) law?
(1) Very much- (2) Somewhat- (3) Very little- (4) Not at all
A-1
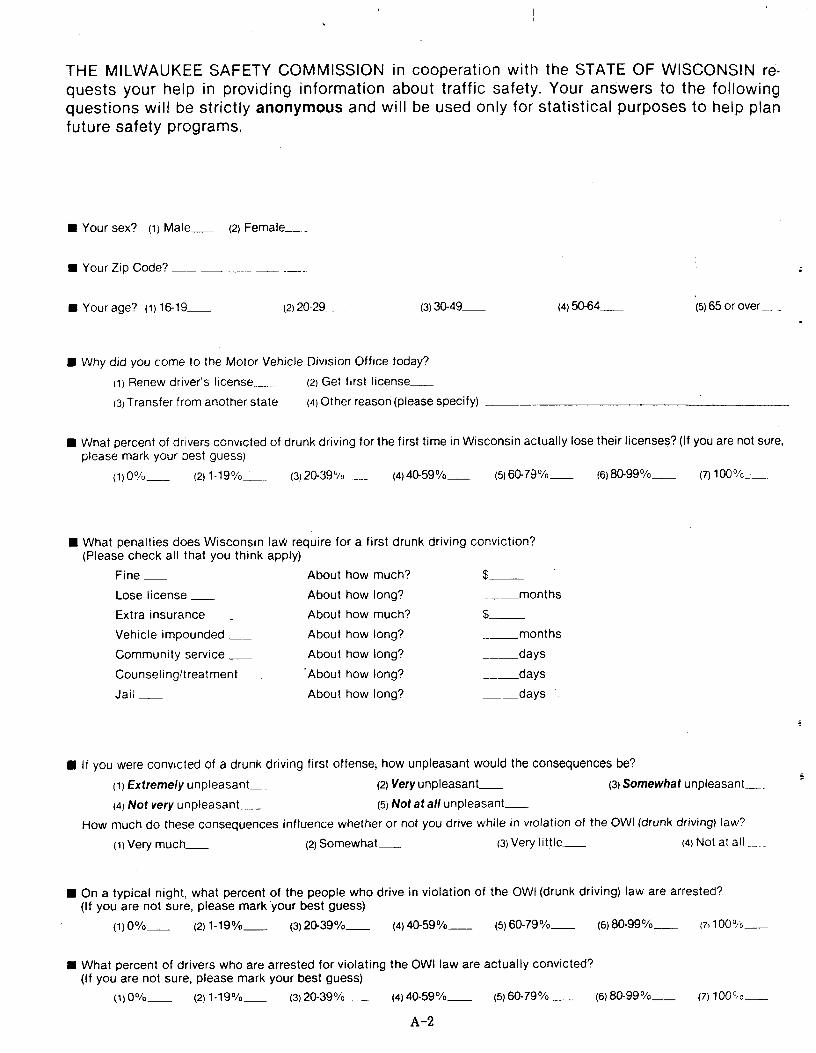
THE MILWAUKEE SAFETY COMMISSION in cooperation with the STATE OF WISCONSIN requests your help in providing information about traffic safety. Your answers to the following questions will be strictly anonymous and will be used only for statistical purposes to help plan future safety programs.
n Your sex? (1) Male_ (2) Female-.
• Your Zip Code?
n Your age? (1)16-19 (2) 20-29 (3)30-49_ (4)50-64 (5) 65 or over- _
n Why did you come to the Motor Vehicle Division Office today?
(1) Renew driver's license-.-. (2) Get first license
(3) Transfer from another state (4) Other reason (please specify)
n What percent of drivers convicted of drunk driving for the first time in Wisconsin actually lose their licenses? (If you are not sure, please mark your best guess)
(1)0%-- (2)1.19% (3)20-39,/o (4) 40-59% (5) 60-79% (6)80-99°/o_.__. (7)100%
n What penalties does Wisconsin law require for a first drunk driving conviction? Please check all that you think apply)
Fine About how much? $
Lose license About how long? months
Extra insurance About how much?
Vehicle impounded About how long? months
Community service About how long? __ days
Counseling/treatment About how long? days
Jail About how long? --days
(
n If you were convicted of a drunk driving first offense; how unpleasant would the consequences be?
(1) Extremely unpleasant- (2) Very unpleasant- (3) Somewhat unpleasant-
(4) Not very unpleasant-- (5) Not at all unpleasant
How much do these consequences influence whether or not you drive while in violation of the OWI (drunk driving) law?
(1) Very much- (2) Somewhat-- (3) Very little- (4) Not at all ___
n On a typical night, what percent of the people who drive in violation of the OWI (drunk driving) law are arrested? (If you are not sure, please mark your best guess)
(1) 0% (2)1-19%_ (3) 20-39% (4) 40-59% (5) 60-79% (6) 80-99% (7)1000/0
n What percent of drivers who are arrested for violating the OWI law are actually convicted? (If you are not sure, please mark your best guess)
(1) 0% (2)1-19% (3) 20-39% (4) 40.59% (5)60-79%- (6) 80-99% (7) 100°.c_
A-2
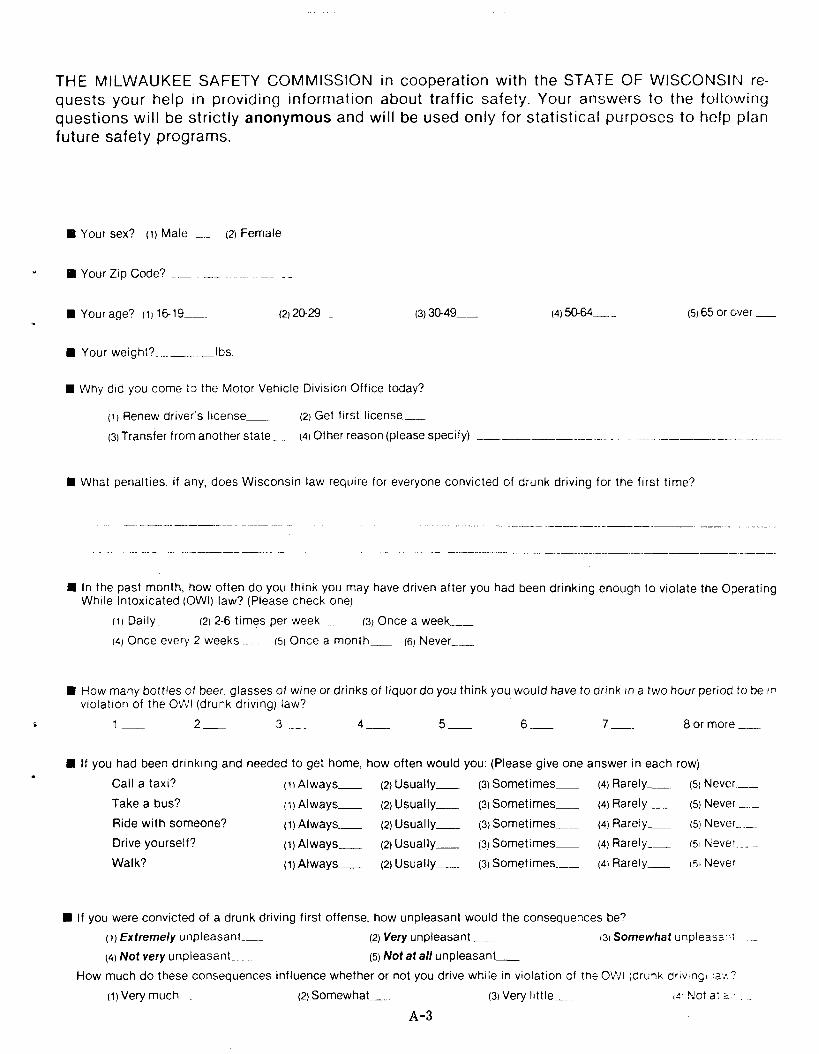
THE MILWAUKEE SAFETY COMMISSION in cooperation with the STATE OF WISCONSIN requests your help in providing information about traffic safety. Your answers to the following questions will be strictly anonymous and will be used only for statistical purposes to help plan future safety programs.
n Your sex? (1) Male (2) Female
n Your Zip Code?
n Your age? (1) 16-19._- (2)20-29 (3)30-49-, (4) 50-64___ (5) 65 or over __
n Your weight? _lbs.
n Why did you come to the Motor Vehicle Division Office today?
(1) Renew driver's license--- (2) Get first license..--
(3) Transfer from another state-- (4) Other reason (please specify)
n What penalties, if any, does Wisconsin law require for everyone convicted of drunk driving for the first time?
n In the past month, how often do you think you may have driven after you had been drinking enough to violate the Operating While Intoxicated (OWl) law? (Please check one)
(1) Daily.____ (2) 2-6 times per week __ (3) Once a week
(4) Once every 2 weeks--- - (5) Once a month__ (6) Never-
N How many bottles of beer. glasses of wine or drinks of liquor do you think you would have to drink in a two hour period to be in violation of the OWI (drunk driving) law?
1 2 3 ...._- 4 5 6 7_ 8ormore._
n If you had been drinking and needed to get home, how often would you: (Please give one answer in each row)
Call a taxi? (1) Always_ (2) Usually_ (3) Sometimes (4) Rarely_ (5) Never.__
Take a bus? (1) Always_ (2) Usually- (3) Sometimes- (4) Rarely __ (5) Never
Ride with someone? (1) Always_._ (2) Usually- (3) Sometimes-- (4) Rarely_ (5) Never__
Drive yourself? (1) Always__ (2) Usually- (3) Sometimes (4) Rarely__ (5, Never_
Walk? (1) Always__ (2) Usually- (3) Sometimes-- (41 Rarely_ i5, Never __
n If you were convicted of a drunk driving first offense. how unpleasant would the consequences be?
(1) Extremely unpleasant___ (2) Very unpleasant (3) Somewhat unpleasant _
(4) Not very unpleasant-- - _. (5) Not at all unpleasant
How much do these consequences influence whether or not you drive while in violation of the OW) (drunk drivingi la.,,?
(1) Very much (2) Somewhat-- (3) Very little---- (^: Not at G.
A-3
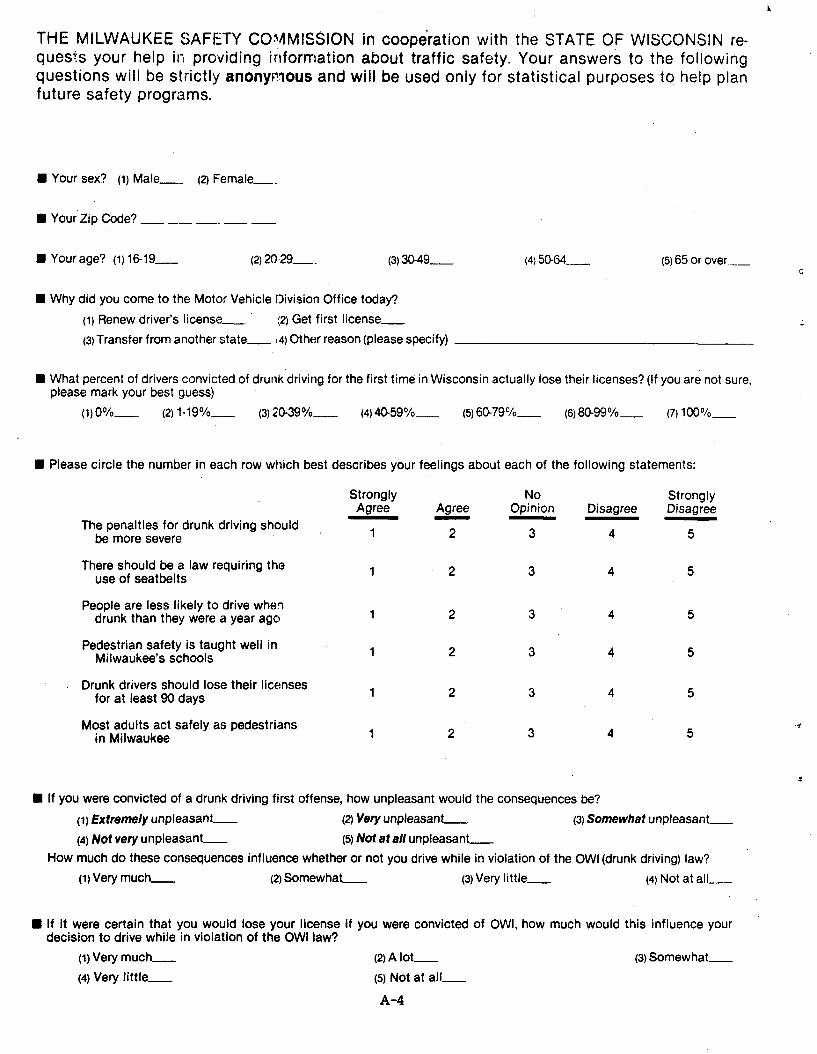
THE MILWAUKEE SAFETY COMMISSION in cooperation with the STATE OF WISCONSIN requests your help in providing information about traffic safety. Your answers to the following questions will be strictly anonymous and will be used only for statistical purposes to help plan future safety programs.
n Your sex? (1) Male_ (2) Female__
n Your Zip Code? _
n Your age? (1)16.19_ (2) 2029_. (3)30-49_ (4)50-64_ (5) 65 or over-
• Why did you come to the Motor Vehicle Division Office today?
(1) Renew driver's license- ;2) Get first license__
(3) Transfer from another state- 4) Other reason (please specify) _
n What percent of drivers convicted of drunk driving for the first time in Wisconsin actually lose their licenses? (If you are not sure, please mark your best guess)
(1)O%......_ (2)1-19%_ (3)20-39%- (4)4&59%- (5)60-79%- (6)80-99%_ (7)100%
N Please circle the number in each row which best describes your feelings about each of the following statements:
Strongly No Strongly Agree Agree Opinion Disagree Disagree
The penalties for drunk driving should be more severe 1 2 3 4 5
There should be a law requiring the 1 2 3 4use of seatbelts
People are less likely to drive when drunk than they were a year ago 1 2 3 4 5
Pedestrian safety is taught well in 1 2Milwaukee's schools 3 4 5
Drunk drivers should lose their licenses for at least 90 days 1 2 3 4 5
Most adults act safely as pedestrians in Milwaukee 1 3 4 5
n If you were convicted of a drunk driving first offense, how unpleasant would the consequences be?
(1) Extremely unpleasant- (2) Very unpleasant= (3) Somewhat unpleasant
(4) Not very unpleasant- (5) Not at all unpleasant-
How much do these consequences influence whether or not you drive while in violation of the OWl (drunk driving) law?
(1) Very much- (2) Somewhat- (3) Very little__ (4) Not at al I
0 If it were certain that you would lose your license if you were convicted of OWl, how much would this influence your decision to drive while in violation of the OWI law?
(1) Very much- (2) A lot- (3) Somewhat
(4) Very little- (5) Not at all-
A-4
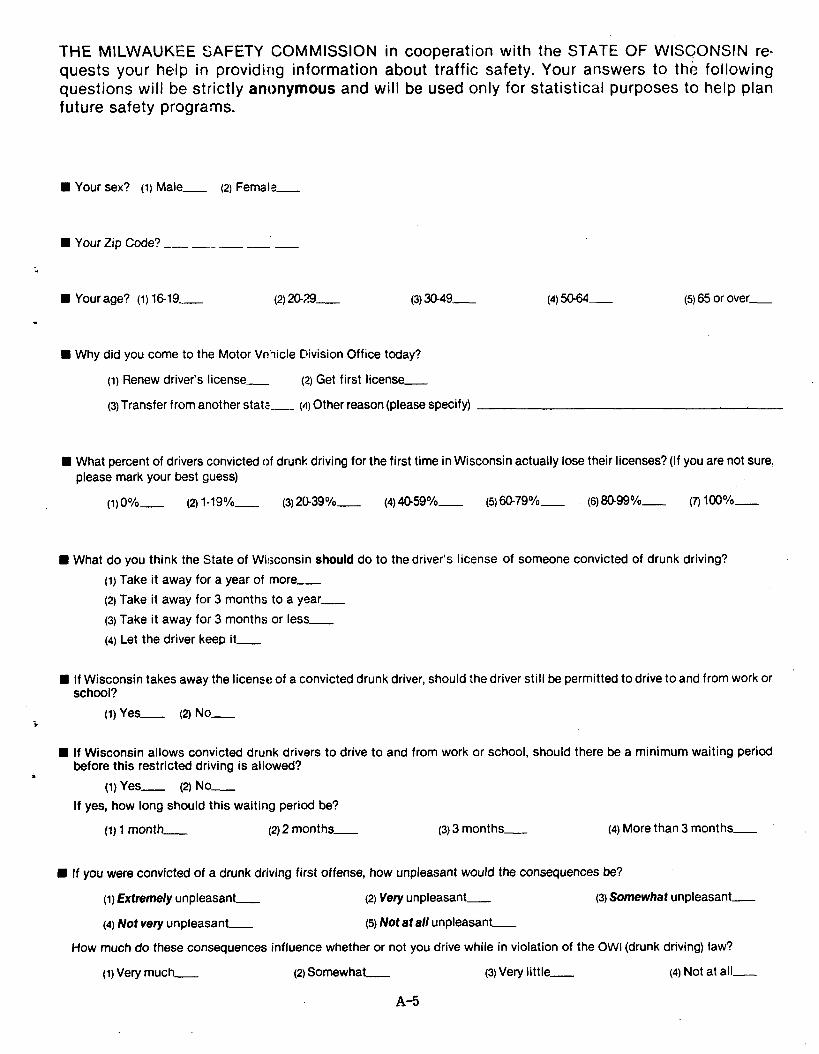
THE MILWAUKEE SAFETY COMMISSION in cooperation with the STATE OF WISCONSIN requests your help in providing information about traffic safety. Your answers to the following questions will be strictly anonymous and will be used only for statistical purposes to help plan future safety programs.
n Your sex? (1) Male_ (2) Female--.
n Your Zip Code? _- __ - , _
n Your age? (1)16.19- (2) 20-2.9. (3) 30-49_ (4) 504664 (5) 65 or over-
n Why did you come to the Motor Vehicle Division Office today?
(1) Renew driver's license- (2) Get first license
(3) Transfer from another stata___ (n) Other reason (please specify)
n What percent of drivers convicted of drunk driving for the first time in Wisconsin actually lose their licenses? (If you are not sure, please mark your best guess)
(1)0%- (2)1-19%_ (3) 20-39%_ (4)40-59%- (5)60-79%_ (6)80.99%_ (7)100%
N What do you think the State of Wisconsin should do to the driver's license of someone convicted of drunk driving?
(1) Take it away for a year of more,
(2) Take it away for 3 months to a year..
(3) Take it away for 3 months or less
(4) Let the driver keep it-
N If Wisconsin takes away the license of a convicted drunk driver, should the driver still be permitted to drive to and from work or school?
(1) Yes_ (2) No
0 If Wisconsin allows convicted drunk drivers to drive to and from work or school, should there be a minimum waiting period before this restricted driving is allowed?
(1) Yes_ (2) No.
If yes, how long should this waiting period be?
(1) 1 month__ (2) 2 months- (3) 3 months- (4) More than 3 months-
n If you were convicted of a drunk driving first offense, how unpleasant would the consequences be?
(1) Extremely unpleasant- (2) Very unpleasant- (3) Somewhat unpleasant___
(4) Not very unpleasant- (5) Not at all unpleasant
How much do these consequences influence whether or not you drive while in violation of the OWl (drunk driving) law?
(1) Very much, (2) Somewhat- (3) Very little- (4) Not at all_
A-5
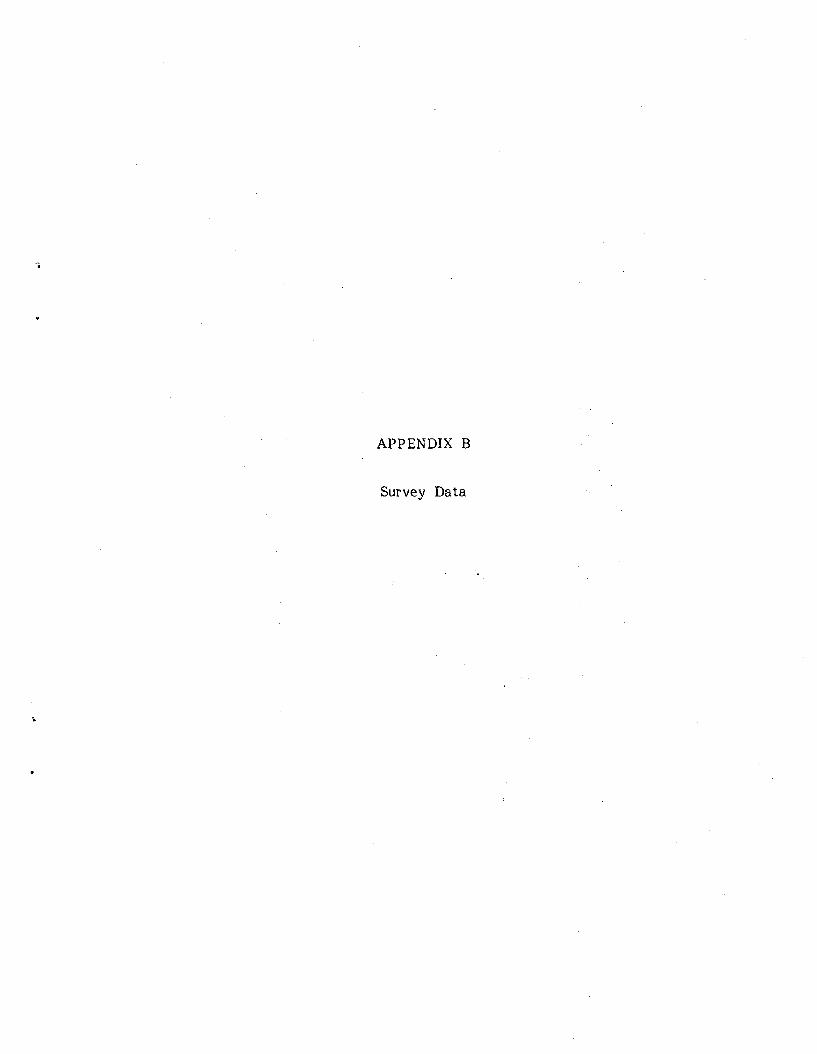
APPENDIX B
Survey Data
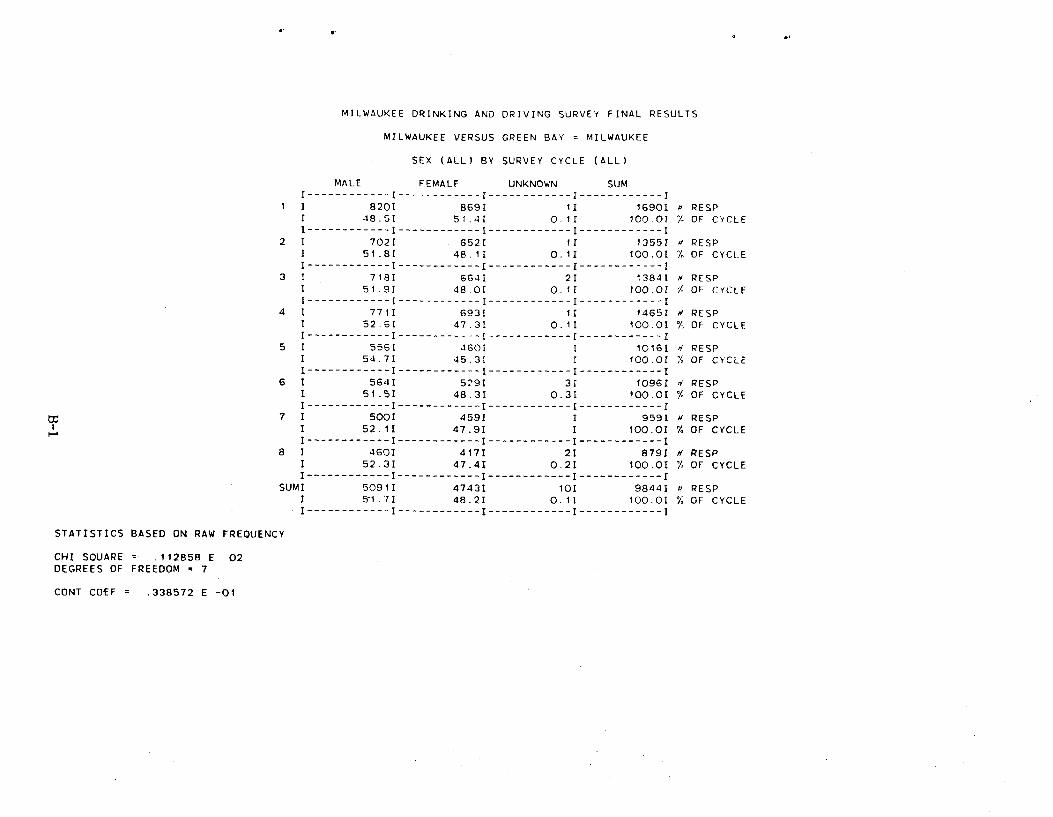
MILWAUKEE DRINKING AND DRIVING SURVEY FINAL RESULTS
MILWAUKEE VERSUS GREEN BAY = MILWAUKEE
SEX (ALL) BY SURVEY CYCLE (ALL)
MALE FEMALE UNKNOWN SUM I ------------ I ------------ I ------------- I ------------ I
1 I 8201 8691 11 16901 RESP T 48.51 51.41 0.11 100.0I % OF CYCLE I------------ I ------------ I ------------ I ------------ I
2 1 7021 6521 11 13551 RESP I 51.81 48.11 0.11 100.01 . OF CYCLE I ------------ I ------------ I ------------ I ------------ I
3 I 7181 6641 21 13841 a RESP I 51.91 48,01 0.11 100.01 OF CYCLE I------------ I ------------ I ------------ I ------------ I
4 I 7711 6931 11 14651 a RESP I 52.61 47.31 0.11 100.01 % OF CYCLE I ------------ I ------------ I ------------ I ------------ I
5 I 5561 46OI I 10161 d RESP I 54.71 45.31 I 100.0I X OF CYCLE I ------------ I ------------ I ------------ I ------------ I
6 I 564I 5291 31 1O96I d RESP I 51.51 48.31 0.31 100.0I % OF CYCLE I------------ I ------------ I ------------ I ------------ I
7 I 5001 4591 I 9591 a RESP I 52.11 47.91 I 100.01 % OF CYCLE I------------ I ------------ I ------------ I ------------ I
8 I 460I 4171 21 8791 N RESP I 52.31 47.41 0.21 100.01 % OF CYCLE I ------------ I ------------ I ------------ I ------------ I
SUMI 50911 47431 101 98441 a RESP I 5'1.71 48.21 0.11 100.01 % OF CYCLE I------------ I ------------ I ------------ I ------------ I
STATISTICS BASED ON RAW FREQUENCY
CHI SQUARE _ .112858 E 02 DEGREES OF FREEDOM = 7
CONT COEF = .338572 E -01
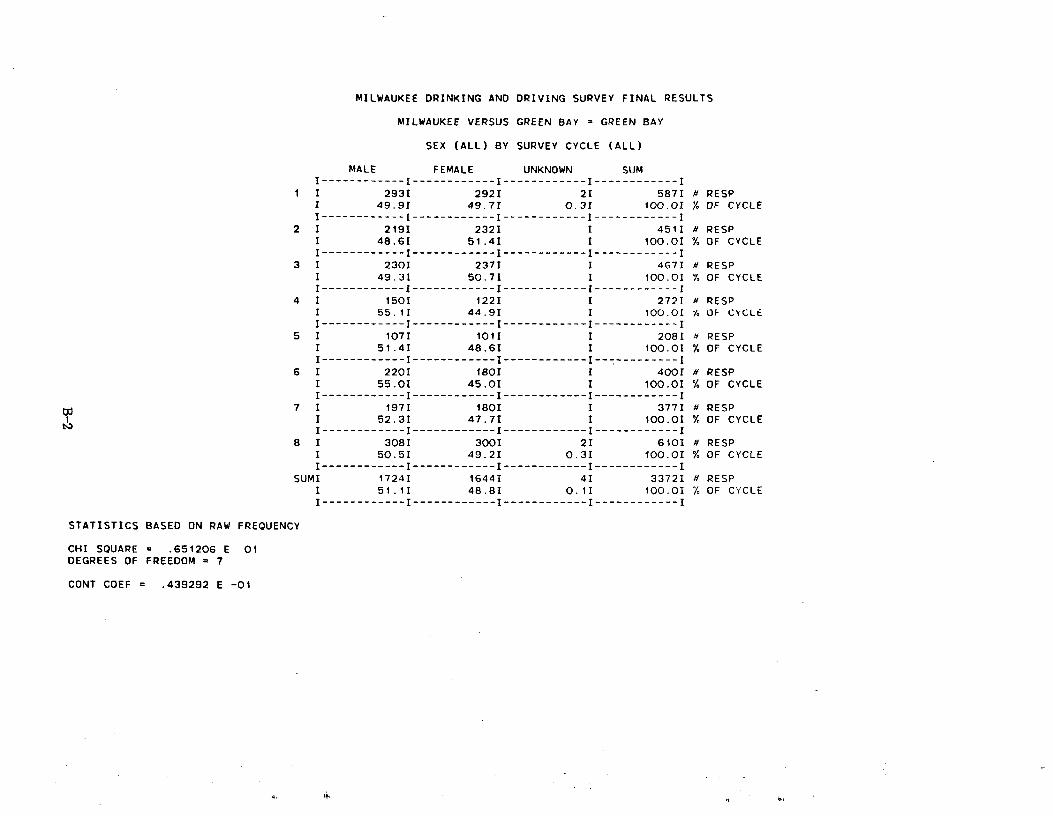
MILWAUKEE DRINKING AND DRIVING SURVEY FINAL RESULTS
MILWAUKEE VERSUS GREEN BAY = GREEN BAY
SEX (ALL) BY SURVEY CYCLE (ALL)
MALE FEMALE UNKNOWN SUM i------------ I ------------ I ------------ I ------------ I
1 I 2931 2921 21 5871 N RESP I 49.91 49.7I 0.3I 100.01 % OF CYCLE I------------ I ------------ I ------------ I ------------ I
2 1 2191 2321 I 4511 a RESP I 48.6I 51.41 I 100.01 % OF CYCLE I ------------ I ------------ I ------------ I ------------ I
3 I 2301 2371 I 4G7I a RESP I 49.31 50.71 I 100.01 % OF CYCLE I ------------ I ------------ I ------------ I ------------ I
4 I 1501 1221 I 2721 N RESP 1 55.11 44.91 I 100.01 / OF CYCLE I ------------ I ------------ I ------------ I ------------ I
5 I 1071 1011 I 2081 N RESP I 51.41 48.61 I 100.01 % OF CYCLE I ------------ I ------------ I ------------ I------------ I
6 1 2201 1801 1 4001 N RESP I 55.01 45.01 I 100.01 % OF CYCLE I ------------ I ------------ I ------------ I ------------ I
7 I 1971 1801 I 3771 N RESP I 52.31 47.71 I 100.01 % OF CYCLE I ------------ I ------------ I ------------ I ------------ I
8 I 3081 3001 21 610I N RESP I 50.51 49.21 0.31 100.01 % OF CYCLE I ------------ I ------------ I ------------ I ------------ I
SUMI 1724I 16441 4I 3372I N RESP I 51.11 48.81 0.11 100.01 % OF CYCLE I------------ I ------------ I ------------ I ------------ I
STATISTICS BASED ON RAW FREQUENCY
CHI SQUARE = .651206 E 01 DEGREES OF FREEDOM = 7
CONT COEF = .439292 E -01
A:
MILWAUKEE DRINKING AND DRIVING SURVEY FINAL RESULTS
MILWAUKEE VERSUS GREEN BAY = MILWAUKEE
AGE (ALL) BY SURVEY CYCLE (ALL)
16 TO 19 20 TO 29 30 TO 49 50 TO 64 65 OR OVER NO ANSWER SUM I------------ I ------------ I ------------ I ------------ I ------------ I ------------ I ------------I
1 I 150I 449I 662I 297I 129I 3I 16901 a RESP I 8.9I 26.61 39.2I 17.6I 7.6I 0.21 100.01 % OF CYCLE I ------------ I ------------ I ------------ I ------------ I ------------ I ------------ I ------------ I
2 1 145I 348I 5151 240I 107I 1 1355I RESP I 10.71 25.71 38.01 17.71 7.91 1 100.0I % OF CYCLE I ------------ I ------------ I ------------ I ------------ I ------------ I ------------ I ------------ I
3 1 99I 395I 561I 235I 93I 11 1384I RES2' I 7.2I 28.5I 40.5I 17.01 6.7I 0.11 100.01 CF I ------------ I ------------ I ------------ I ------------ I ------------ I-=---------- I ------------ I
4 I 1051 407I 5611 262I 128I 2I 14651 RESP I 7.2I 27.8I 38.31 17.9I 8.7I 0.1I 100.01 V OF C'+CLE I------------I------------I------------I------------I------------I------------I------------1
5 I 118I 30GI 349I 177I 661 I 101GI > PESP 1 11.61 30.11 34.4I 17.41 6.51 I 100.01 X OF CYCLE I ------------ I ------------ I ------------ I ------------ I ------------ I ------------ I ------------ I
6 I 80I 284I 432I 205I 93I 2I 109GI -V RESP 1 7.31 25.9I 39.4I 18.7I 8.51 0.2I 100.0I % OF CYCLE I ------------ I ------------ I ------------ I ------------ I ------------ I ------------ I ------------ I
7 I 91I 331I 364I 133I 40I 1 959I N RESP I 9.5I 34.5I 38.0I 13.91 4.2I 1 100.01 % OF CYCLE I ------------ I ------------ I ------------ I ------------ I ------------ I ------------ I ------------ I
8 1 110I 270I 318I 123I 58I I 879I # RESP I 12.51 30.71 36.21 14.01 6.61 1 100.01 % OF CYCLE I ------------ I ------------ I ------------ I ------------ I ------------ I ------------ I ------------ I
SUMI 8981 2790I 3762I 1672I 7141 81 9844I a RESP I 9.1I 28.3I 38.2I 17.01 7.3I 0.11 100.0I %'OF CYCLE I------------ I ------------ I ------------ I ------------ I ------------ I ------------ I ------------ I
STATISTICS BASED ON RAW FREQUENCY
CHI SQUARE _ .105031 E 03 (SIGNIFICANT AT .001 LEVEL) DEGREES OF FREEDOM = 28
CONT COEF = .102788
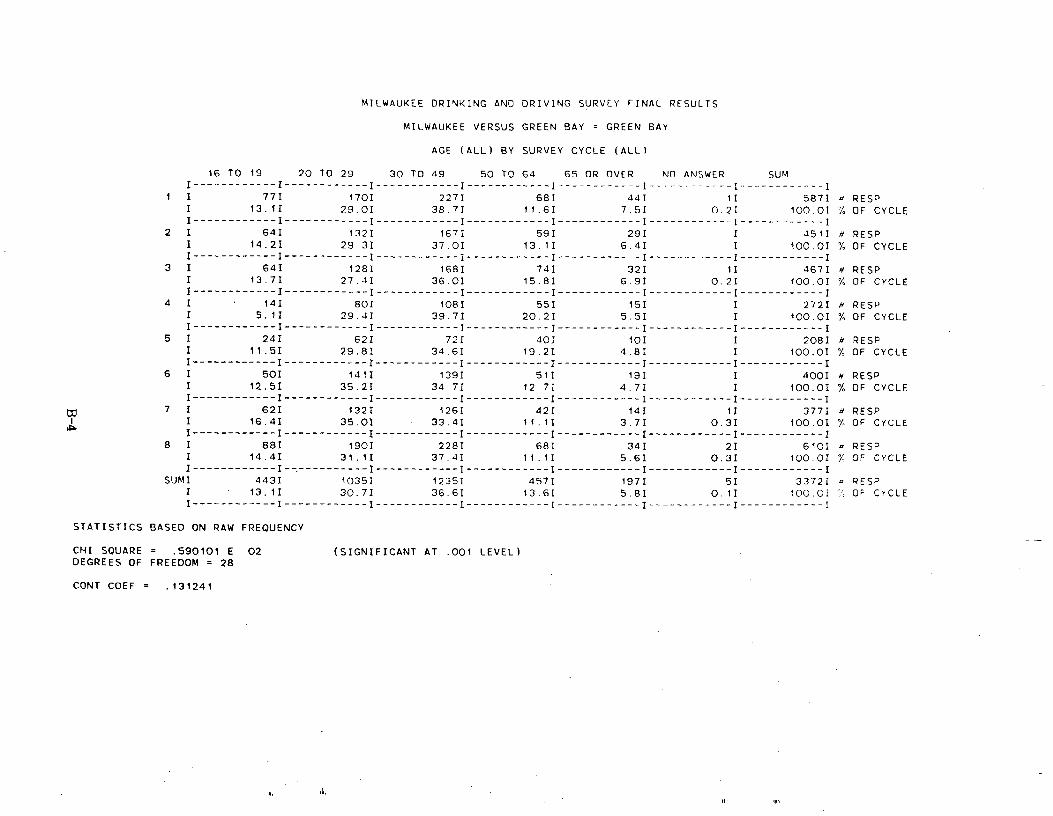
MILWAUKEE DRINKING AND DRIVING SURVEY FINAL RESULTS
MILWAUKEE VERSUS GREEN BAY = GREEN BAY
AGE (ALL) BY SURVEY CYCLE (ALL)
16 TO 19 20 TO 29 30 TO 49 50 TO 64 65 OR OVER NO ANSWER SUM I------------ I ------------ I ------------ I ------------ I ------------ I ------------ I ------------ I
I I 771 170I 227I 68I 44I 1I 587I = RESP I 13.11 29.01 38.7I 11.6I 7.61 0.2I 100.0I OF CYCLE I ------------ I ------------ I ------------ I ------------ I ------------ I ------------ I ------------ I
2 1 64I 132I 1671 59I 29I I 4511 a RESP 1 14,21 29.31 37.01 13.11 6.4I 1 100.01 % OF CYCLE I------------I------------I------------5------------I------------I------------I------------I
3 I 64I 128I 168I 741 321 1I 467I a RESP I 13.7I 27.41 36.0I 15.8I 6.9I 0.21 100.0I % OF CYCLE I ------------ I ------------ I ------------ I ------------ I ------------ I ------------ I ------------ I
4 1 141 801 108I 55I 15I I 2721 a RESP 1 5.1I 29.4I 39.71 20.21 5.5I I 100.0I % OF CYCLE I ------------ I ------------ I ------------ I ------------ I ------------ I ------------ I ------------ I
5 1 24I 62I 721 40I 10I 1 208I N RESP I 11.51 29.81 34.61 19.21 4.81 I 100.01 OF CYCLE I ------------ I ------------ I ------------ I ------------ I ------------ I ------------ I ------------ I
6 I 501 1411 139I 511 19I I 400I a RESP I 12.51 35.21 34.7I 12.7I 4.7I I 100.0I % OF CYCLE I------------ I ------------ I ------------ I ------------ I ------------ I ------------ I ------------ I
7 I 621 1321 1261 421 14I 1I 377I RESP 1 16.4I 35.0I 33.4I 11.1I 3.7I 0.3I 100.0I % OF CYCLE I ------------ I ------------ I ------------ I ------------ I ------------ I ------------ I ------------ I
8 I 881 190I 228I 68I 34I 2I 610I e RESP I 14.41 31.1I 37.41 11.1I 5.6I 0.3I 100.0I % OF CYCLE I------------ I------------ I ------------ I ------------ I ------------ I ------------ I ------------ I
SUMI 4431 10351 12351 457I 197I 5I 3372I = RESP I 13.11 30.71 36.61 13.6I 5.8I 0.11 100.01 OF CYCLE I------------ I ------------ I ------------ I ------------ I ------------ I ------------ I ------------ I
STATISTICS BASED ON RAW FREQUENCY
CHI SQUARE = .590101 E 02 (SIGNIFICANT AT .001 LEVEL) DEGREES OF FREEDOM = 28
CONT COEF = .131241
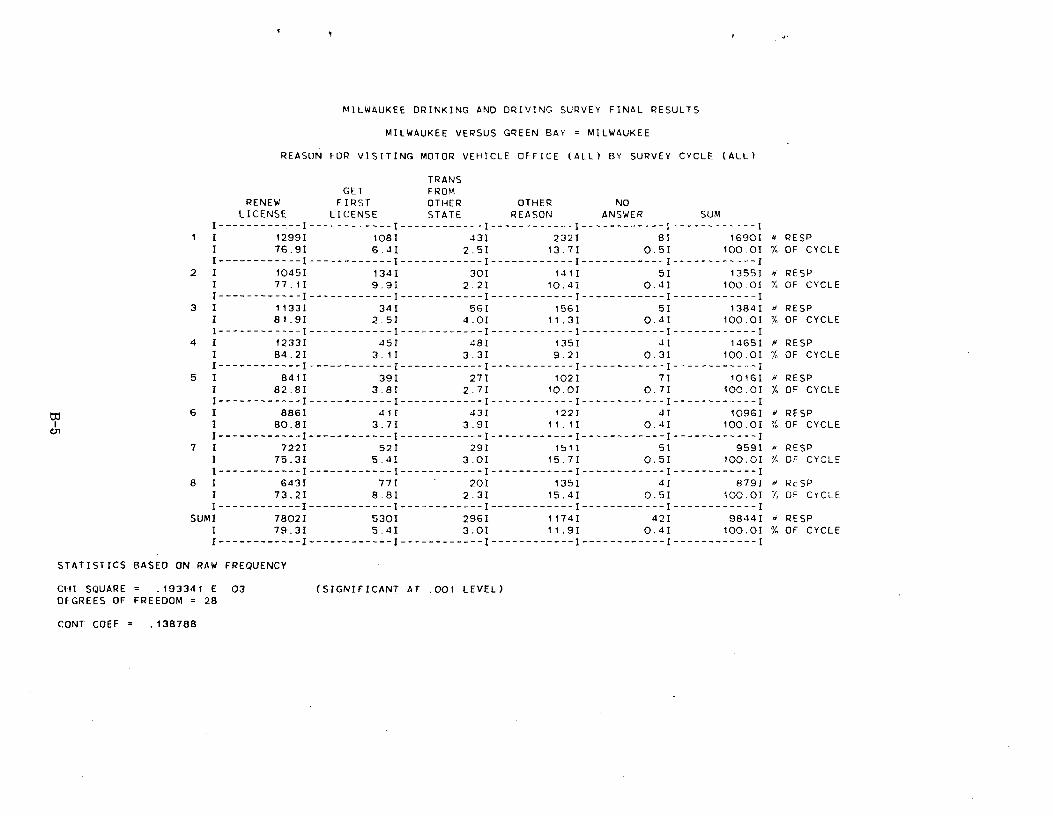
MILWAUKEE DRINKING AND DRIVING SURVEY FINAL RESULTS
MILWAUKEE VERSUS GREEN BAY = MILWAUKEE
REASON FOR VISITING MOTOR VEHICLE OFFICE (ALL) BY SURVEY CYCLE (ALL)
TRANS
GET FROM RENEW FIRST OTHER OTHER NO
LICENSE LICENSE STATE REASON ANSWER SUM I ------------ I ------------ I ------------ I ------------ I ------------ I ------------I
1 1 1299I 108I 43I 232I 8I 1690I H RESP I 76.91 6.4I 2,51 13.71 0.51 100.01 OF CYCLE I ------------ I ------------ I ------------ I ------------ I ------------ I ------------ I
2 1 1045I 134I 30I 141I 5I 1355I RESP I 77.1I 9.9I 2.2I 10.41 0.4I 100.01 % OF CYCLE I ------------ I ------------ I ------------ I ------------ I ------------ I ------------ I
3 I 1133I 341 561 156I 51 13841 p RESP I 81.91 2.51 4.0I 11.3I 0.41 100.01 % OF CYCLE I ------------ I ------------ I ------------ I ------------ I ------------ I ------------ I
4 1 1233I 451 481 1351 41 14651 a RESP I 84.21 3.11 3.31 9.21 0.31 100.01 % OF CYCLE I ------------ I ------------ I ------------ I ------------ I ------------ I ------------ I
5 1 841I 39I 27I 102I 71 101GI H RESP I 82.81 3.81 2.71 10.01 0.7I 100.0I % OF CYCLE I ------------ I ------------ I ------------ I ------------ I ------------ I ------------ I
6 I 886I 41I 43I 122I 4I 109GI RESP I 80.81 3.71 3.91 11.11 0.4I 100.01 ; OF CYCLE I------------I------------I------------I------------I------------I------------1
7 I 722I 52I 29I 1511 51 959I RESP I 75.31 5.41 3.01 15.71 0.51 100.01 % OF CYCLE I ------------ I ------------ I ------------ I ------------ I ------------ I ------------ I
8 I 643I 771 20I 135I 4I 879I RESP I 73.21 8.8I 2.3I 15.41 0.5I 100.0I Y OF CYCLE I ------------ I ------------ I ------------ I ------------ I ------------ I ------------ I
SUMI 7802I 5301 296I 1174I 421 9844I a RESP I 79.31 5.41 3.01 11.91 0.41 100.01 % OF CYCLE I ------------ I ------------ I ------------ I ------------ I ------------ I ------------ I
STATISTICS BASED ON RAW FREQUENCY
CHI SQUARE = .193341 E 03 (SIGNIFICANT AT .001 LEVEL) DEGREES OF FREEDOM = 28
CONT COEF = .138788
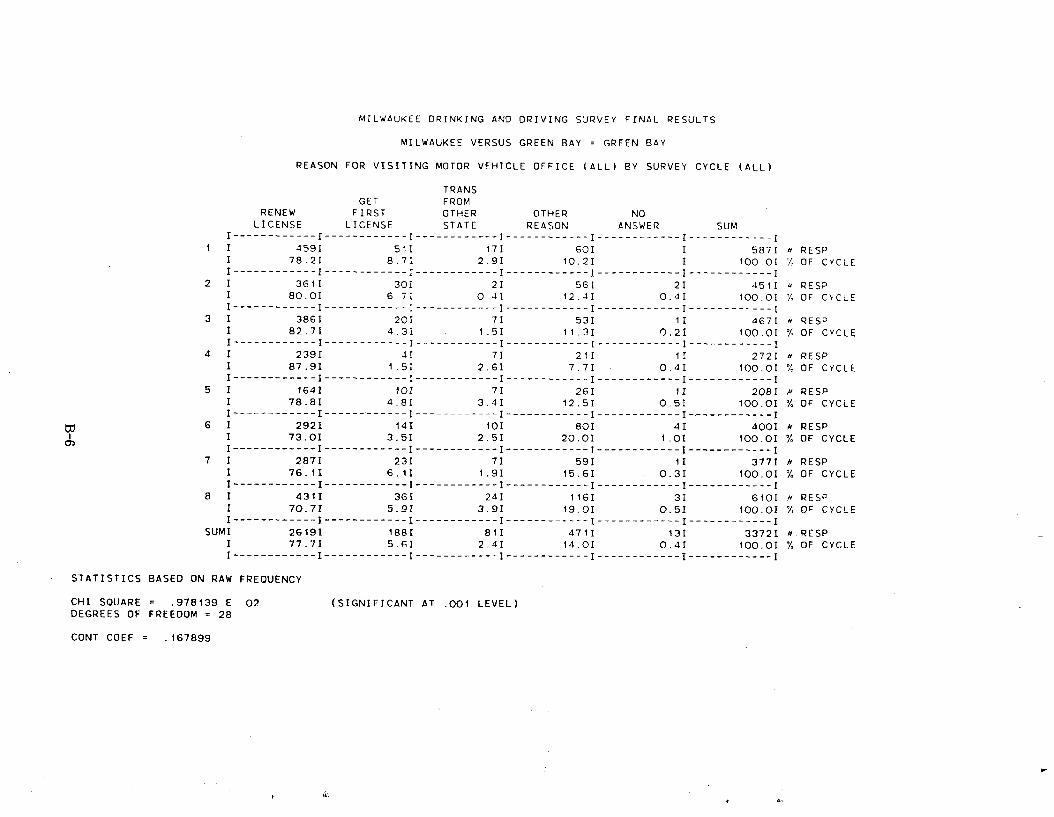
MILWAUKEE DRINKING AND DRIVING SURVEY FINAL RESULTS
MILWAUKEE VERSUS GREEN BAY = GREEN BAY
REASON FOR VISITING MOTOR VEHICLE OFFICE (ALL) BY SURVEY CYCLE (ALL)
TRANS GET FROM
RENEW FIRST OTHER OTHER NO LICENSE LICENSE STATE REASON ANSWER SUM
I ------------ I ------------ I ------------ I ------------ I ------------ I ------------ I 1 1 4591 51I 17I 601 I 587I a RESP
I 78.21 8.71 2.91 10.21 1 100.01 % OF CYCLE I ------------ I ------------ I ------------ I ------------ I ------------ I ------------ I
2 I 361I 301 21 56I 2I 4511 > RESP I 80.01 6.71 0.4I 12,41 0.41 100.01 OF CYCLE I------------ I ------------ I ------------ I ------------ I ------------ I ------------ I
3 I 3861 20I 7I 53I 1I 467I a RESP 1 82.7I 4.3I 1.5I 11.31 0.2I 100.0I % OF CYCLE I ------------ I ------------ I ------------ I ------------ I ------------ I ------------ I
4 1 239I 41 7I 211 11 2721 RESP 1 87.91 1.51 2.61 7.71 0.41 100.01 % OF CYCLE I ------------ I ------------ I ------------ I ------------ I ------------ I ------------ I
5 I 164I 10I 71 26I 1I 208I a RESP I 78.81 4.81 3.41 12.51 0.51 100.01 % OF CYCLE I ----------- I ------------ I ------------ I ------------ I ------------ I ------------ I
6 I 2921 14I 10I 60I 4I 400I # RESP I 73.01 3.51 2.51 20.01 1.01 100.01 % OF CYCLE I ------------ I ------------ I ------------ I ------------ I ------------ I ------------ I
7 I 287I 231 7I 59I 1I 377I # RESP 1 76.11 6.11 1.91 15.6I 0.31 100.01 % OF CYCLE I ------------ I ------------ I ------------ I ------------ I ------------ I ------------ I
8 I 431I 361 24I 116I 31 610I # RESP 1 70.71 5.9I 3.91 19.01 0.51 100.0I % OF CYCLE I ------------ I ------------ I ------------ I ------------ I ------------ I ------------ I
SUMI 26191 188I 81I 471I 13I 3372I #.RESP 1 77.71 5.6I 2.4I 14.01 0.41 100.0I % OF CYCLE I ------------ I ------------ I ------------ I ------------ I ------------ I ------------ I
STATISTICS BASED ON RAW FREQUENCY
CHI SQUARE _ .978139 E 02 (SIGNIFICANT AT .001 LEVEL) DEGREES OF FREEDOM = 28
CONT COEF = .167899
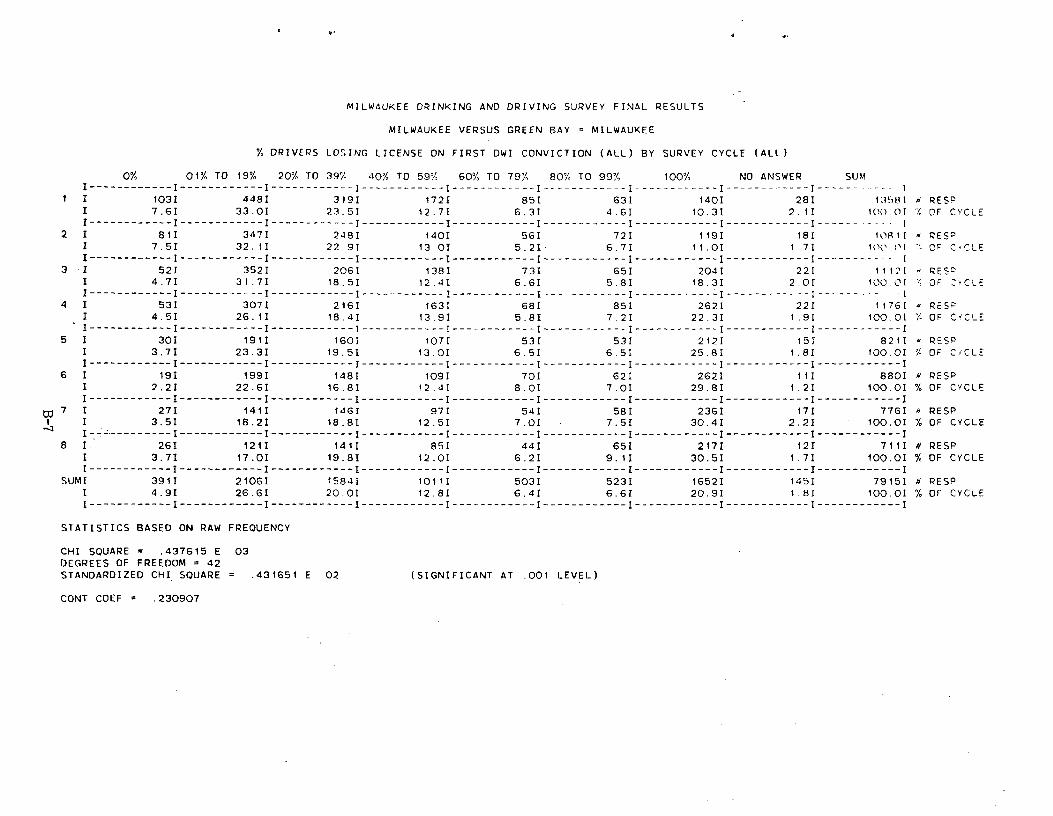
MILWAUKEE DRINKING AND DRIVING SURVEY FINAL RESULTS
MILWAUKEE VERSUS GREEN BAY = MILWAUKEE
% DRIVERS LOSING LICENSE ON FIRST DWI CONVICTION (ALL) BY SURVEY CYCLE (ALL)
0% 01% TO 19% 20% TO 39% 40% TO 59% 60% TO 79% 80% TO 99% 100% NO ANSWER SUMI ------------ I ------------ I ------------ I ------------ I ------------ I ------------ I ------------ I -----------I
1 I 1031 448I 319I 172I 85I 631 140I 28I 1,1581 a RESP I 7.61 33.01 23.51 12.71 6.3I 4.6I 10.31 2.11 100 Of X„ OF CYCLE I------------ I ------------ I ------------ I ------------ I ------------ I ------------ I ------------ I ------------ I ---------- 1
2 I 811 347I 248I 140I 561 721 119I 181 10811 RESP 1 7.51 32.11 22.91 13.01 5.21 6.71 11.01 1.71 100 01 CF C•CLE I ------------ I ------------ I ------------ I ------------ I ------------ I ------------ I ------------ I ------------ I ---------------- 1
3 1 52I 352I 20GI 138I 73I 65I 2041 22I 11121 RES' I 4.71 31.71 18.51 12.41 6.6I 5.81 18.31 2.01 100. 0I OF --'•CLE I------------I------------I------------I------------I------------I------------I------------I------------I------------I
4 I 53I 307I 21GI 163I 68I 85I 2621 22I 11761 RESP I 4.5I 26.11 16.4I 13.91 5.8I 7.2I 22.3I 1.9I 100.01 % OF CrCL_ I------------ I ------------ I ------------ I ------------ I ------------ I ------------ I ------------ I ------------ I ------------ I
5 I 301 191I 1601 107I 53I 53I 2121 15I 8211 - RESP I 3.7I 23.3I 19.5I 13.0I 6.5I 6.5I 25.8I 1.81 100.0I ! OF CYCLE I------------ I ------------ I ------------ I ------------ I ------------ I ------------ I ------------ I ------------ I ------------ I
6 I 19I 199I 148I 109I 70I 621 262I 11I 880I RESP I 2.2I 22.61 16.8I 12.4I 8.0I 7.0I 29.8I 1.2I 100.0I % OF CYCLE I------------ I ------------ I ------------ I ------------ I ------------ I ------------ I ------------ I ------------ I ------------ I
7 I 27I 141I 14GI 97I 54I 58I 2361 17I 776I a RESP I 3.5I 18.2I 18.8I 12.5I 7.01 7.5I 30.4I 2.2I 100.01 % OF CYCLE I ------------ I ------------ I ------------ I ------------ I ------------ I ------------ I ------------ I ------------ I ------------ I
8 I 261 1211 141I 851 44I 65I 2171 121 711I # RESP I 3,71 17.0I 19.8I 12.0I 6.2I 9.1I 30.5I 1.7I 100.0I % OF CYCLE I ------------ I ------------ I ------------ I ------------ I ------------ I ------------ I ------------ I ------------ I ------------ I
SUMI 391I 21061 1584I 1011I 503I 523I 16521 145I 79151 a RESP 1 4.9I 26.6I 20.0I 12.81 6.41 6.6I 20.9I 1.81 100.0I % OF CYCLE I ------------ I ------------ I ------------ I ------------ I ------------ I ------------ I ------------ I ------------ I ------------ I
STATISTICS BASED ON RAW FREQUENCY
CHI SQUARE = .437615 E 03 DEGREES OF FREEDOM = 42 STANDARDIZED CHI SQUARE = .431651 E 02 (SIGNIFICANT AT .001 LEVEL)
CONT COEF = .230907
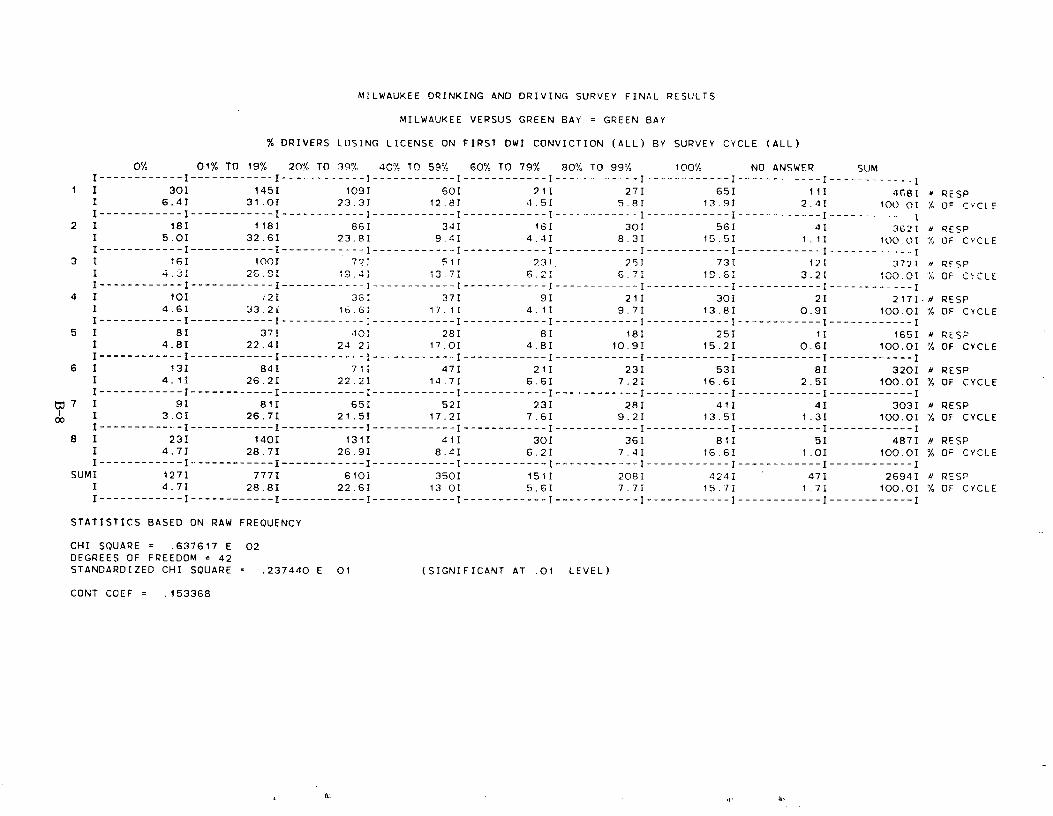
MILWAUKEE DRINKING AND DRIVING SURVEY FINAL RESULTS
MILWAUKEE VERSUS GREEN BAY = GREEN BAY
DRIVERS LOSING LICENSE ON FIRST DWI CONVICTION (ALL) BY SURVEY CYCLE (ALL)
0% 01% TO 19% 20% TO 39% 40% TO 59% 60% TO 79% 80% TO 99% 100% NO ANSWER SliMI------------ I ------------ I ------------ I ------------ I ------------ I ------------ I ------------ I ------------ I -----------
i I 30I 145I 109I 60I 21I 27I 65I III 46,81 M RESP I 6.4I 31.01 23.31 12.81 4.51 5.8I 13.91 2.41 100 01 Y OF CYCLE I ------------ I ------------ I ------------ I ------------ I ------------ I ----------- I ------------ I ------------ I -------- 1
2 I 18I 118I 86I 341 161 30I 581 4I 3621 RESP I 5.0I 32.61 23.8I 9.4I 4.41 8.3I 15.51 1.1I 100.01 % OF CYCLE I ------------ I ------------ I ------------ I ------------ I ------------ I ------------ I ------------ I ------------ I ------------I
3 I 16I 1001 7?J 51T 231 75J 731 121 3771 a RF5P I 4..I 26.31 1S.41 13.71 6.21 6.71 19.61 3.21 100.01 ' OF CYCLE I ------------ I ------------ I ------------ I ------------ I ------------ I ------------ I ------------ I ------------ I ------------ I
4 I 10I ;2I 361 37I 9I 21I 30I 2I 217I.N RESP I 4.61 33.21 16.61 17.11 4.11 9.7I 13.81 0.9I 100.0I % OF CYCLE I ------------ I ------------- I ------------ I ------------ I ------------ I ------------ I ------------ I ------------ I ------------ I
5 I 8I 37I 40I 281 81 18I 251 11 165I RESP I 4.8I 22.4I 24.2I 17.01 4.81 10.9I 15.2I 0.61 100.0I % OF CYCLE I------------ I ------------ I ------------ I ------------ I ------------ I ------------ I ------------ I ------------ I ------------ I
6 I 13I 84I 71I 471 211 23I 531 8I 320I N RESP I 4.11 26.2I 22.21 14.71 6.6I 7.2I 16.61 2.5I 100.0I % OF CYCLE I ------------ I ------------ I ------------ I ------------ I ------------ I ------------ I ------------ I ------------ I ------------ I
7 I 91 81I 65I 521 23I 28I 41I 4I 303I N RESP I 3.0I 26.7I 21.51 17.21 7.61 9.21 13.51 1.3I 100.01 % OF CYCLE I -------------I------------ I ------------ I ------------ I ------------ I ------------ I ------------ I ------------ I ------------ I
8 I 23I 140I 1311 411 30I 36I 811 51 4871 N RESP I 4.71 28.7I 26.91 8.4I 6.2I 7.4I 16.61 1.01 100.01 % OF CYCLE I------------ I ------------- I ------------ I ------------ I ------------ I ------------ I ------------ I ------------ I ------------ I
SUMI 127I 7771 610I 3501 1511 208I 4241 47I 26941 N RESP 1 4.7I 28.8I 22.61 13.01 5.6I 7.7I 15.71 1.7I 100.01 % OF CYCLE I ------------ I ------------ I ------------ I ------------ I ------------ I ------------ I ------------ I ------------ I ------------ I
STATISTICS BASED ON RAW FREQUENCY
CHI SQUARE = .637617 E 02 DEGREES OF FREEDOM = 42 STANDARDIZED CHI SQUARE = .237440 E 01 (SIGNIFICANT AT .01 LEVEL)
CONT COEF = .153368
d, h,
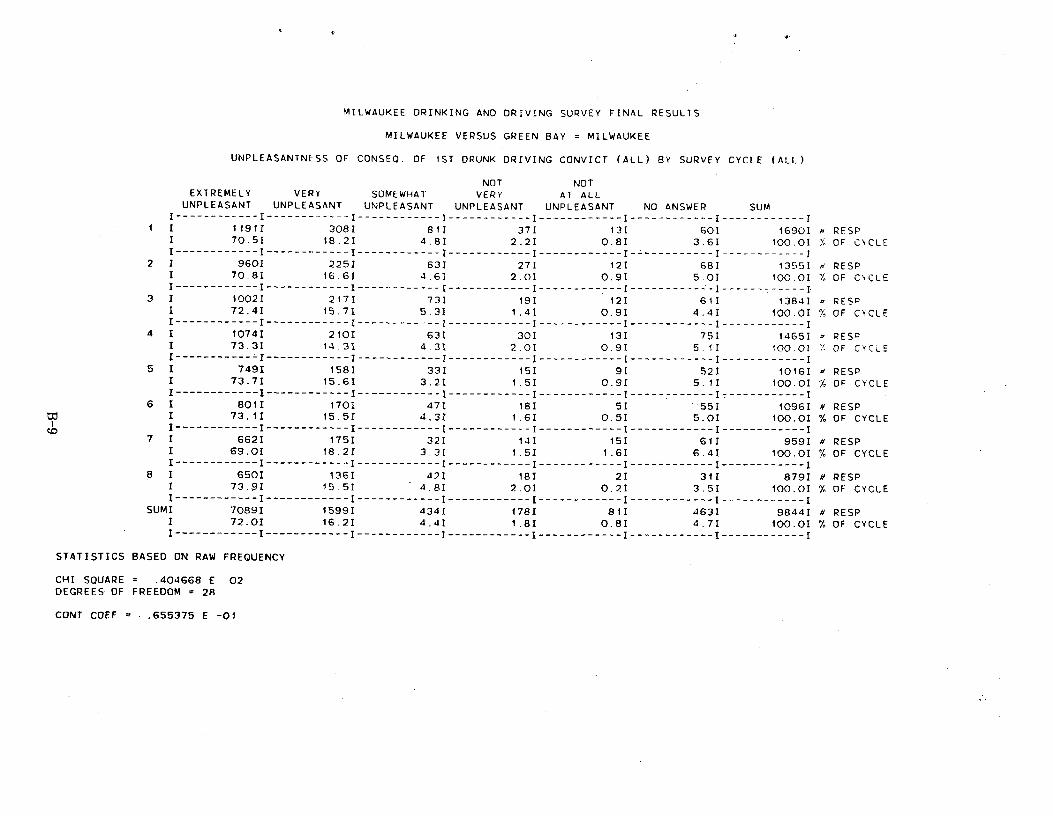
MILWAUKEE DRINKING AND DRIVING SURVEY FINAL RESULTS
MILWAUKEE VERSUS GREEN BAY = MILWAUKEE
UNPLEASANTNESS OF CONSEO. OF 1ST DRUNK DRIVING CONVICT (ALL) BY SURVEY CYCLE (ALL)
NOT NOT EXTREMELY VERY SOMEWHAT VERY AT ALL
UNPLEASANT UNPLEASANT UNPLEASANT UNPLEASANT UNPLEASANT NO ANSWER SUM I ------------ I ------------ I ------------ I ------------ I ------------ I ------------ I -----------
1 r 1191I 308I all 37I 131 601 1690I a RESP I 70.51 18.21 4.81 2.21 0.81 3.61 100.01 OF CYCLE I ------------ I ------------ I ------------ I ------------ I ------------ I ------------ I ------------ I
2 I 960I 225I 63I 27I 121 68I 13551 PESP I 70.8I 16.61 4.61 2.01 0.91 5.01 100.01 % OF CYCLE I ------------ I ------------ I ------------ I ------------ I ------------ I ---------- -I ------------ I
3 I 1002I 217I 73I 191 12I 611 13841 b RESP I 72.41 15.71 5.31 1.41 0.91 4.41 100.01 `,4 OF CYCLE I------------ I ------------ I ------------ I ------------ I ------------ I ------------ I ------------ I
4 I 1074I 2101 63I 301 13I 75I 14651 a RESc I 73.3I 1-1.31 4.3I 2.01 0.9I 5.11 100.01 ; OF CYCLE I ------------ I ------------ I ------------ I ------------ I ------------ I ------------ I ------------ I
5 I 749I 158I 33I 151 91 52I 1016I tl RESP I 73.71 15.61 3.21 1.51 0.91 5.11 100.0I % OF CYCLE I ------------ I ------------ I ------------ I ------------ I ------------ I ------------ I ------------ I
6 1 801I 1701 471 18I 5I 55I 109GI # RESP I 73.11 15.51 4.31 1.61 0.51 5.01 100.01 % OF CYCLE I ------------ I ------------ I ------------ I ------------ I ------------ I ------------ I ------------ I
7 I 662I 175I 32I 141 15I 611 959I RESP 1 69.0I 18.21 3.31 1.5I 1.61 6.4I 100.01 % OF CYCLE I ------------ I ------------ I ------------ I ------------ I ------------ I ------------ I ------------ I
8 I 650I 136I 42I 18I 2I 31I 879I # RESP I 73.9I 15.5I 4.8I 2.01 0.2I 3.51 100.0I % OF CYCLE I ------------ I ------------ I ------------ I ------------ I ------------ I ------------ I ------------ I
SUMI 7089I 1599I 4341 178I all 463I 9844I a RESP I 72.OI 16.2I 4.41 1.81 0.81 4.71 100.01 % OF CYCLE I ------------ I ------------ I ------------ I ------------ I ------------ I ------------ I ------------ I
STATISTICS BASED ON RAW FREQUENCY
CHI SQUARE = .404668 E 02 DEGREES OF FREEDOM = 28
CONT COEF = .655375 E -01
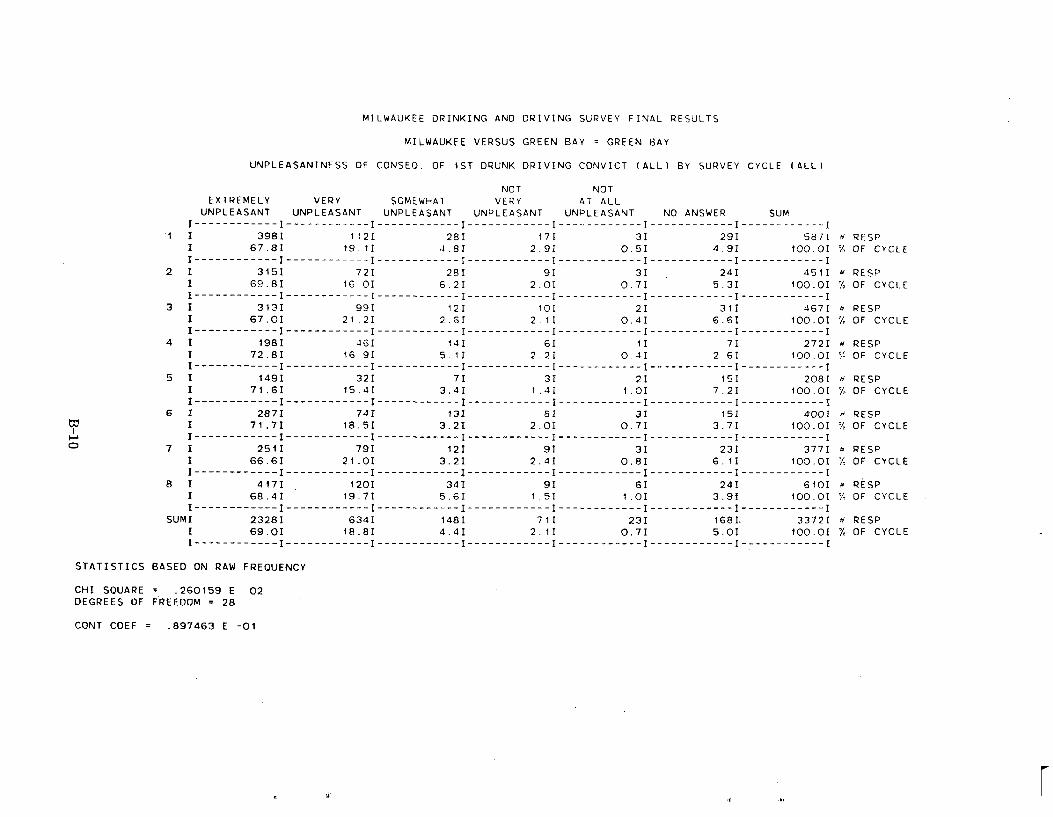
MILWAUKEE DRINKING AND DRIVING SURVEY FINAL RESULTS
MILWAUKEE VERSUS GREEN BAY = GREEN BAY
UNPLEASANTNESS OF CONSEQ. OF 1ST DRUNK DRIVING CONVICT (ALL) BY SURVEY CYCLE (ALL)
NOT NOT EXTREMELY VERY SOMEWHAT VERY AT ALL
UNPLEASANT UNPLEASANT UNPLEASANT UNPLEASANT UNPLEASANT NO ANSWER SUM I------------ I ------------ I ------------ I ------------ I ------------ I ------------ I ------------I
I I 398I 112I 28I 171 3I 291 5871 RESP I 67.8I 19.11 4.8I 2.91 0.5I 4.9I 100.0I % OF CYCLE I------------ I ------------ I ------------ I ------------ I ------------ I ------------ I ------------ I
2 I 315I 72I 28I 9I 31 24I 451I RESP 1 69.8I 16.01 6.2I 2.0I 0.71 5.3I 100.0I % OF CYCLE I ------------ I ------------ I ------------ I ------------ I ------------ I ------------ I ------------ I
3 I 3131 991 12I 101 21 31I 4671 RESP I 67.OI 21.21 2.6I 2.11 0.41 6.6I 100.01 % OF CYCLE I------------ I ------------ I ------------ I ------------ I ------------ I ------------ I ------------ I
4 1 198I 46I 14I 61 1I 7I 272I a RESP I 72.81 16.9I 5,11 2.21 0.4I 2 6I 100.01 % OF CYCLE I ------------ I ------------ I ------------ I ------------ I ------------ I ------------ I ------------ I
5 I 149I 32I 7I 3I 2I 151 2081 RESP I 71.61 15.41 3.41 1.41 1.01 7.21 100.01 % OF CYCLE I ------------ I ------------ I ------------ I ------------ I ------------ I ------------ I ------------ I
6 1 287I 74I 13I 8I 3I 15I 400I ti RESP I 71.71 18.51 3.21 2.01 0.71 3.71 100.01 % OF CYCLE I ------------ I ------------ I ------------ I ------------ I ------------ I ------------ I ------------ I
7 I 251I 79I 12I 91 3I 231 377I RESP I 66.6I 21.01 3.21 2.41 0.81 6.1I 100.01 OF CYCLE I ------------ I ------------ I ------------ I ------------ I ------------ I ------------ I ------------ I
8 I 417I _ 120I 34I 9I 6I 24I 610I a PESP I 68.4I 19.71 5.6I 1.51 1.0I 3.91 100.01 OF CYCLE I ------------ I ------------ I ------------ I ------------ I ------------ I ------------ I ------------ I
SUMI 2328I 634I 148I 711 23I 1681. 3372I a RESP I 69.01 18.81 4.41 2.11 0.71 5.01 100.01 % OF CYCLE I ------------ I ------------ I ------------ I ------------ I ------------ I ------------ I ------------ I
STATISTICS BASED ON RAW FREQUENCY
CHI SQUARE _ .260159 E 02 DEGREES OF FREEDOM = 28
CONT COEF = .897463 E -01
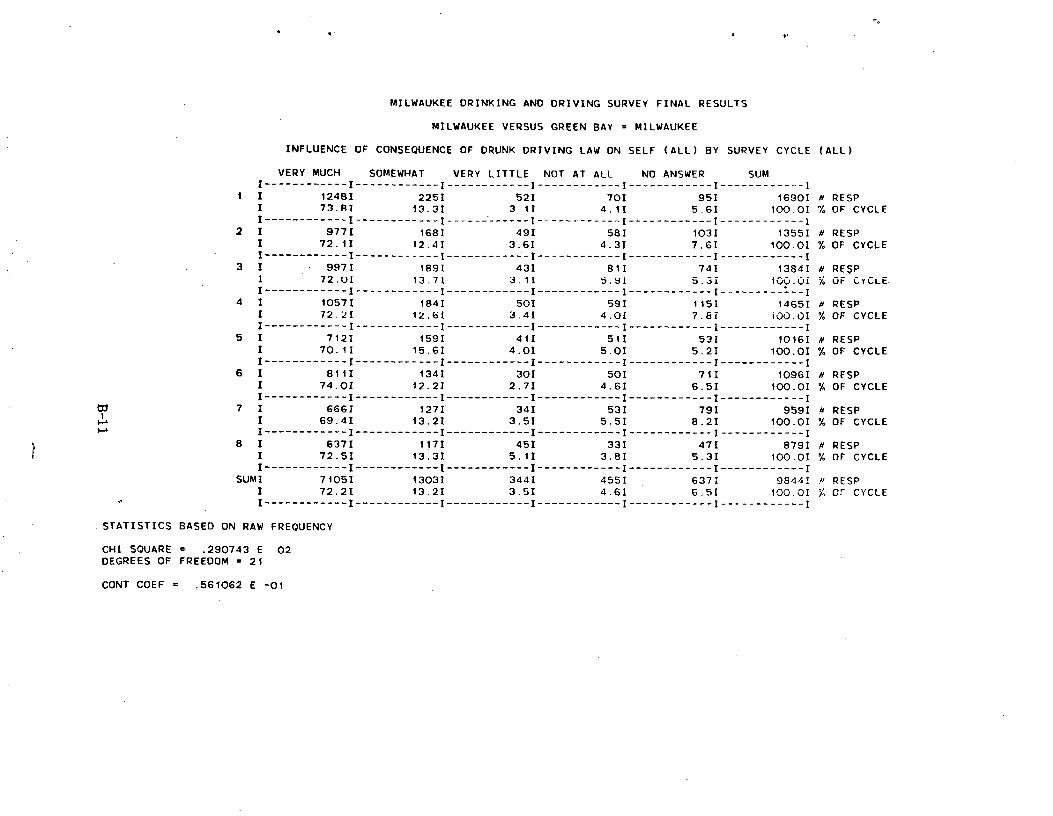
MILWAUKEE DRINKING AND DRIVING SURVEY FINAL RESULTS
MILWAUKEE VERSUS GREEN BAY = MILWAUKEE
INFLUENCE OF CONSEQUENCE OF DRUNK DRIVING LAW ON SELF (ALL) BY SURVEY CYCLE (ALL)
VERY MUCH SOMEWHAT VERY LITTLE NOT AT ALL NO ANSWER SUM I------------ I ------------ I ------------ I ------------ I ------------ I ------------I
I I 12481 2251 521 701 951 1690I a RESP I 73.81 13.31 3.11 4.11 5.6I 100.01 % OF CYCLE I------------I------------I------------I------------I------------I------------1
2 1 9771 168I 49I 58I 103I 1355I H RESP I 72.1I 12.41 3.61 4.3I 7.61 100.01 % OF CYCLE I------------ I ------------ I ------------ I ------------ I ------------ I ------------ I
3 I 997I 1891 43I 81I 74I 13841 a RESP 1 72.01 13.71 3.11 5.91 5.3i 100.01 OF CYCLE I ------------ I ------------ I ------------ I ------------ I ------------ I ---------I
4 I 1057I 184I 501 59I 115I 1465I a RESP I 72.21 12.(ij 3.41 4.01 7.81 iOO.01 % OF CYCLE I------------ I ------------ I ------------ I ------------ I ------------ I ------------ I
5 I 712I 1591 411 51I 53I 1016I k RESP I 70.11 15.61 4.01 5.01 5.21 100.01 % OF CYCLE I ------------ I ------------ I ------------ I ------------ I ------------ I ------------ I
6 I 8111 1341 30I 50I 71I 109GI H RESP I 74.01 12.21 2.71 4.61 6.5I 100.0I % OF CYCLE I ------------ I ------------ I ------------ I ------------ I ------------ I ------------ I
7 1 6661 1271 341 53I 791 959I H RESP I 69.4I 13.22 3.5I 5.5I 8.21 100.0I % OF CYCLE I ------------ I ------------ I ------------ I ------------ I ------------ I ------------ I
8 I 637I 117I 451 33I 471 8791 a RESP I 72.5I 13.31 5.1I 3.8I 5.3I 100.01 % OF CYCLE I------------ I ------------ I ------------ I ------------ I ------------ I ------------ I
SUMI 7105I 1303I 344I 455I 637I 9844I a RESP I 72.2I 13.2I 3.51 4.61 6.51 100.01 % Or CYCLE I ------------ I ------------ I ------------ I ------------ I ------------ I ------------ I
STATISTICS BASED ON RAW FREQUENCY
CHI SQUARE = .290743 E 02 DEGREES OF FREEDOM = 21
CONT COEF = .561062 E -01
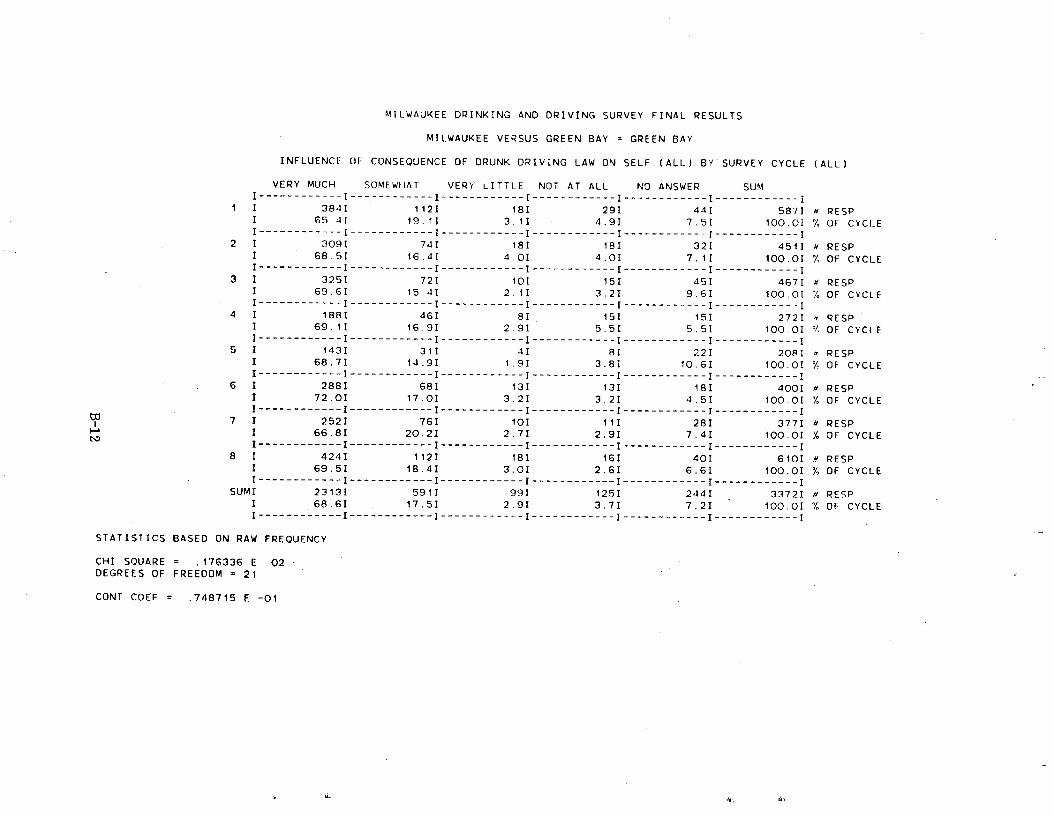
MILWAUKEE DRINKING AND DRIVING SURVEY FINAL RESULTS
MILWAUKEE VERSUS GREEN BAY = GREEN BAY
INFLUENCE OF CONSEQUENCE OF DRUNK DRIVING LAW ON SELF (ALL) BY SURVEY CYCLE (ALL)
VERY MUCH SOMEWHAT VERY LITTLE NOT AT ALL NO ANSWER SUM I ------------ I ------------ I ------------ I ------------ I------------ I ------------ I
1 1 3841 112I 18I 29I 44I 587I # RESP I 65.41 19.11 3.1I 4.9I 7.5I 100.0I % OF CYCLE I ------------ I ------------ I ------------ I ------------ I ------------ I ------------ I
2 1 309I 74I 181 18I 32I 451I a RESP I 68.51 16.41 4.01 4.01 7.11 100.0I Of CYCLE I ------------ I ------------ I ------------ I ------------ I ------------ I ------------ I
3 I 3251 72I 101 151 45I 4671 RESP I 69.6I 15.4I 2.11 3.2I 9.61 100.01 % OF CYCLE I ------------ I ------------ I ------------ I ------------ I ------------ I ------------ I
4 I 188I 46I 8I, 15I 151 2721 RESP I 69.11 16.91 2.9I 5.5I 5.5I 100.01 V OF CYCLE I ------------ I ------------ I ------------ I ------------ I ------------ I ------------ I
5 I 1431 31I 4I 8I 221 208I RESP I 68.71. 14.91 1.91 3.81 10.6I 100.01 % OF CYCLE I -----------I ------------ I ------------ I ------------ I ------------ I ------------ I
6 I 288I 68I 13I 13I 18I 400I # RESP I 72.01 17.01 3.21 3.21 4.51 100.01 % OF CYCLE I ------------ I ------------ I ------------ I ------------ I ------------ I ------------ I
7 I 2521 76I 10I 11I 28I 377I a RESP I 66.8I 20.2I 2.7I 2.91 7.4I 100.01 Y. OF CYCLEI ------------ I ------------ I ------------ I ------------ I ------------ I ------------ I
8 1 424I 112I 181 16I 401 610I # RESP I 69.51 18.41 3.01 2.61 6.61 100.01 % OF CYCLE I ------------ I ------------ I ------------ I ------------ I ------------ I ------------ I
SUMI 2313I 591I 99I 125I 2441 33721 # RESP I 68.61 17.51 2.91 3.71 7.21 100.01 % OF CYCLE I ------------ I ------------ I ------------ I ------------ I ------------ I ------------ I
ON RAW FREQUENCY
CU
N
STATISTICS BASED
CHI SQUARE = .176336 E 02DEGREES OF FREEDOM = 21
CONT COEF = .748715 E -01
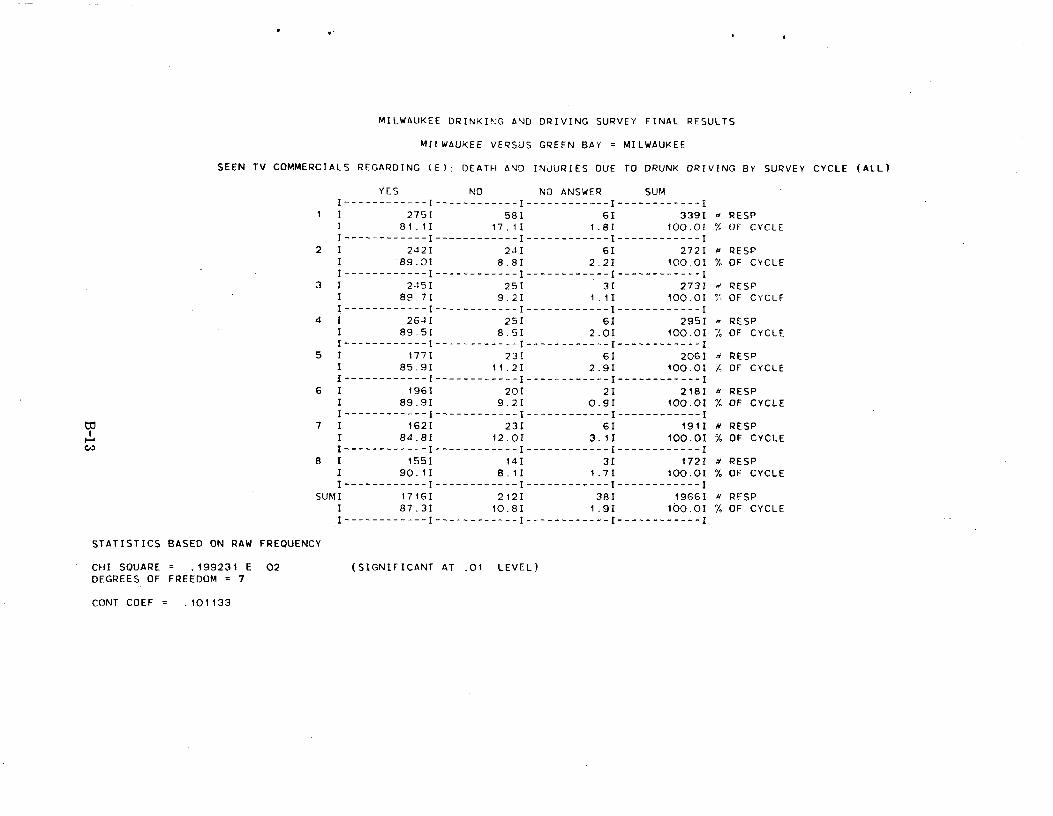
MILWAUKEE DRINKING AND DRIVING SURVEY FINAL RESULTS
MILWAUKEE VERSUS GREEN BAY = MILWAUKEE
SEEN TV COMMERCIALS REGARDING (E): DEATH AND INJURIES DUE TO DRUNK DRIVING BY SURVEY CYCLE (ALL)
YES NO NO ANSWER SUM I------------ I ------------ I ------------ I ------------I
i I 2751 581 6I 3391 # RESP 81.11 17.11 1.81 100.01 % OF CYCLE
I------------ I ------------ I ------------ I ------------ I 2 I 22421 241 6I 2721 RESP
I 89.0I 8.81 2.21 100.01 OF CYCLE I ------------ I ------------ I ------------ I ------------ I
3 I 2-15I 251 31 2731 RESP I 89.71 9.21 1.11 100.01 OF CYCLE I ------------ I ------------ I ------------ I ------------ I
4 1 2641 251 61 2951 - RESP I 89.51 8.51 2.01 100.01 ! OF CYCLE I ------------ I ------------ I ------------ I ------------ I
5 I 1771 231 61 20GI RESP I 85.91 11.21 2.91 100.01 A OF CYCLE I------------ I ------------ I ------------ I ------------ I
6 I 19GI 201 21 2181 RESP I 89.91 9.21 0.91 100.01 7. OF CYCLE I ------------ I ------------ I ------------ I ------------ I
7 I 162I 231 6I 1911 a RESP I 84.81 12.01 3.1I 100.01 % OF CYCLE I ------------ I ------------ I ------------ I ------------ I
8 I 1551 141 31 1721 # RESP I 90.11 8.11 1.71 100.01 % OF CYCLE I------------ I ------------ I ------------ I ------------ I
SUMI t716I 2121 381 1966I a RESP I 87.31 10.81 1.91 100.01 % OF CYCLE I ------------ I ------------ I ------------ I ------------ I
STATISTICS BASED ON RAW FREQUENCY
CHI SQUARE _ .199231 E 02 (SIGNIFICANT AT .01 LEVEL) DEGREES OF FREEDOM = 7
CONT COEF = .101133
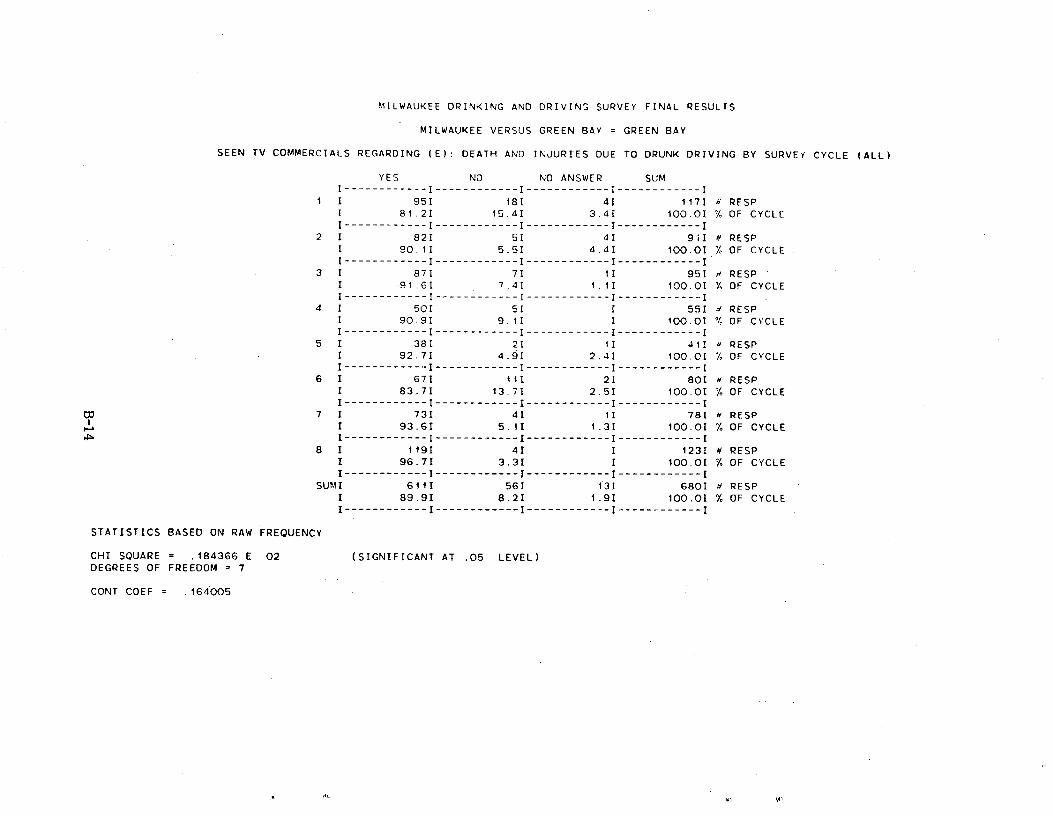
MILWAUKEE DRINKING AND DRIVING SURVEY FINAL RESULTS
MILWAUKEE VERSUS GREEN BAY = GREEN BAY
SEEN TV COMMERCIALS REGARDING (E): DEATH AND INJURIES DUE TO DRUNK DRIVING BY SURVEY CYCLE (ALL)
YES NO NO ANSWER SUMI -----------I------------I------------I------------I
1 I 951 181 41 1171 RESP I 81.21 15.41 3.41 100.01 % OF CYCLE I ------------ I ------------ I ------------ I ------------ I
2 I 821 51 41 9'iI RESP I 90.11 5.51 4.4I 100.01 '/,• OF CYCLE I ------------ I ------------ I ------------ I ------------ I
3 I 871 71 II 951 a RESP I 91.61 7.41 1.11 100.01 % OF CYCLE I ------------ I ------------ I ------------ I ------------ I
4 1 501 51 1 551 RESP I 90.91 9.11 I 100.01 74 OF CYCLE I ------------ I ------------ I ------------ I ------------I
5 I 381 21 11 11I RESP I 92.71 4.9I 2.4I 100.0I OF CYCLE I ------------ I ------------ I ------------ I ------------ I
6 I 671 111 21 801 RESP I 83.7I 13.71 2.51 100.01 % OF CYCLE I ------------ I ------------ I ------------ I ------------ I
7 I 731 41 11 781 a RESP I 93.61 5.11 1.31 100.0I % OF CYCLE I ------------ I ------------ I ------------ I ------------ I
8 I 1191 41 I 1231 N RESP I 96.71 3.31 I 100.OI % OF CYCLE I ------------ I ------------ I ------------ I ------------ I
SUMI 6111 561 131 6801 a RESP I 89.91 8.21 1.91 100.01 % OF CYCLE I ------------ I ------------ I ------------ I ------------ I
STATISTICS BASED ON RAW FREQUENCY
CHI SQUARE _ .184366 E 02 (SIGNIFICANT AT .05 LEVEL) DEGREES OF FREEDOM = 7
CONT COEF = .164005
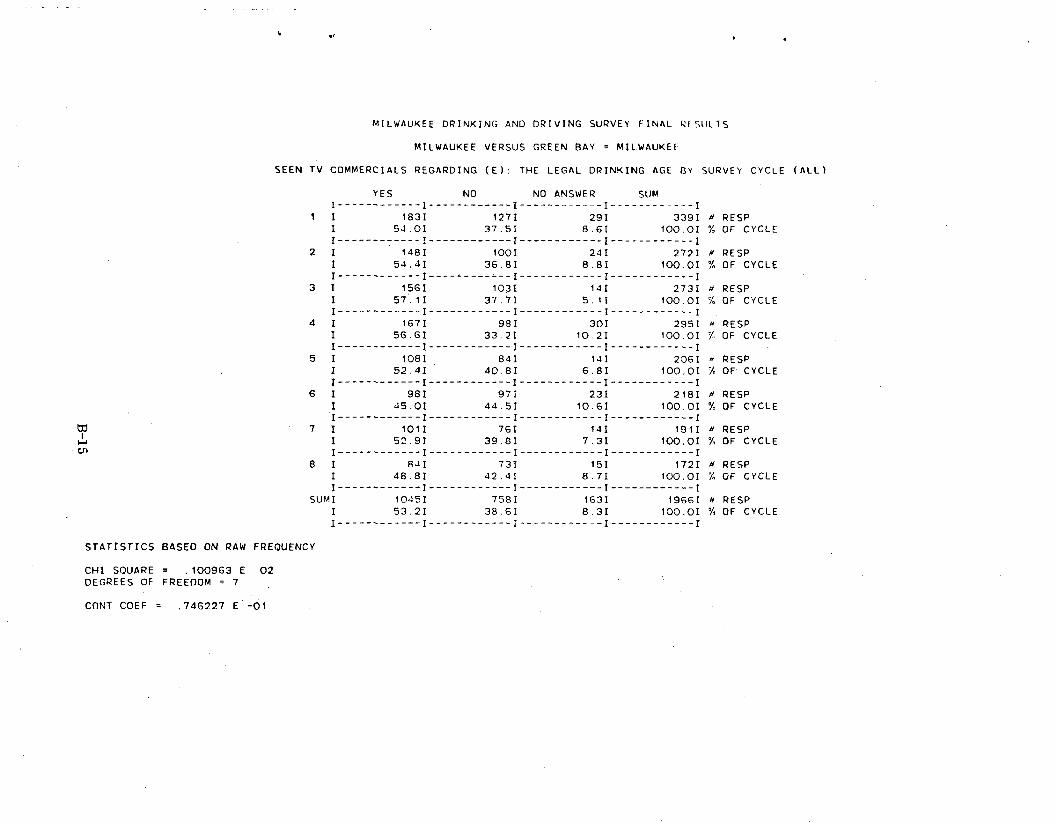
MILWAUKEE DRINKING AND DRIVING SURVEY FINAL RESULTS
MILWAUKEE VERSUS GREEN BAY = MILWAUKEE
SEEN TV COMMERCIALS REGARDING (E): THE LEGAL DRINKING AGE BY SURVEY CYCLE (ALL)
YES NO NO ANSWER SUM I ------------ I ------------ I ------------ I ------------ I
1 I 1831 127I 291 339I a RESP I 54.01 37.51 8.61 100.01 % OF CYCLE I ------------ I ------------ I ------------ I ------------ I
2 I 148I 100I 241 2721 a RESP I 54.41 36.8I 8.8I 100.01 % OF CYCLE I ------------ I ------------ I ------------ I ------------ I
3 I 1561 1031 141 2731 a RESP I 57.1I 37.7I 5.11 100.01 % OF CYCLE I ------------ I ------------ I ------------ I ------------ I
4 I 1671 98I 30I 2951 x RESP 1 56.6I 33.21 10.21 100.01 %• OF CYCLE I ------------ I ------------ I ------------ I ------------ I
5 1 1081 841 141 206I - RESP 1 52.4I 40.8I 6.81 100.01 7 OF CYCLE I ------------ I ------------ I ------------ I ------------ I
6 I 981 971 231 2181 a RESP I 45.01 44.51 10.6I 100.01 % OF CYCLE I ------------ I ------------ I ------------ I ------------ I
7 I 1011 76I 141 1911 a RESP I 52.91 39.81 7.31 100.01 % OF CYCLE I ------------ I ------------ I ------------ I ------------ I
8 I 841 731 151 172I # RESP I 48.8I 42.41 8.71 100.0I % OF CYCLE I ------------ I ------------ I ------------ I ------------ I
SUMI 10451 7581 163I 19661 a RESP I 53.21 38.61 8.31 100.01 OF CYCLE I ------------ I ------------ I ------------ I ------------ I
STATISTICS BASED ON RAW FREQUENCY
CHI SQUARE = .100963 E 02 DEGREES OF FREEDOM = 7
CONT COEF = .746227 E -01
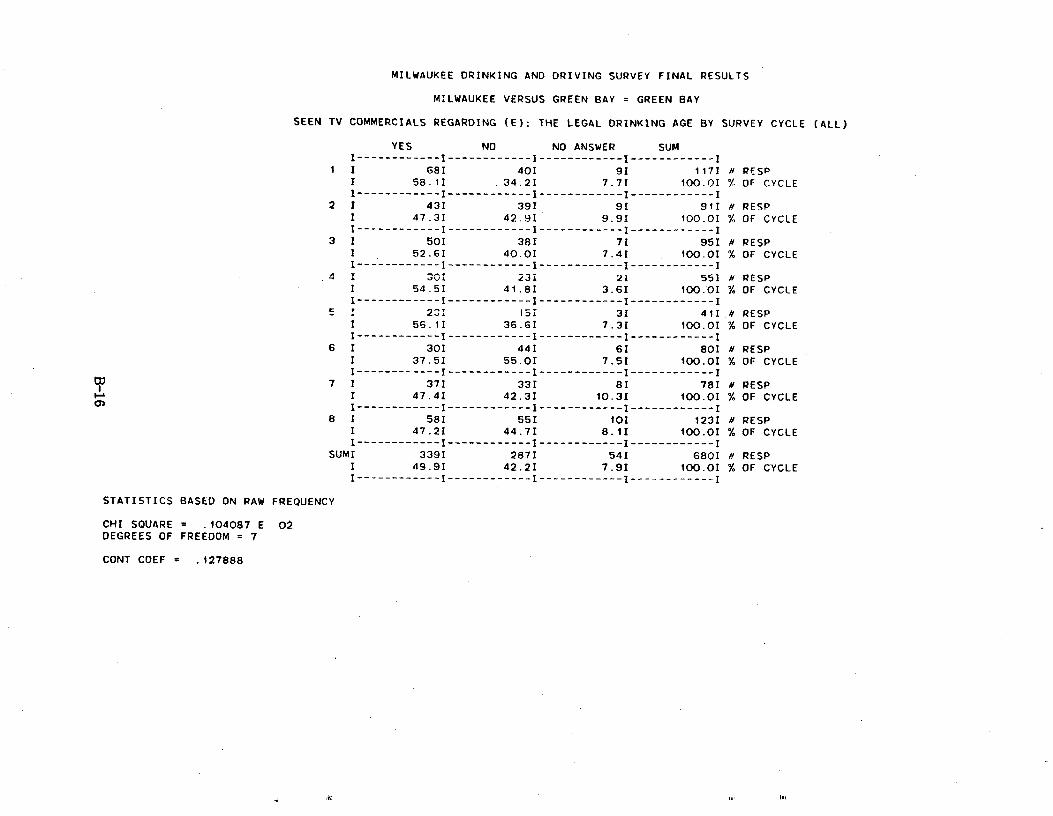
MILWAUKEE DRINKING AND DRIVING SURVEY FINAL RESULTS
MILWAUKEE VERSUS GREEN BAY = GREEN BAY
SEEN TV COMMERCIALS REGARDING (E): THE LEGAL DRINKING AGE BY SURVEY CYCLE (ALL)
YES NO NO ANSWER SUM I ------------ I ------------ I ------------ I ------------ I
1 I 681 401 91 1171 RESP I 58,11 .34.2I 7.71 100.01 % OF CYCLE I ------------ I ------------ I ------------ I ------------ I
2 I 431 391 91 91I N RESP I 47.31 42.91 9.91 100.01 % OF CYCLE I ------------ I ------------ I ------------ I ------------ I
3 I 501 381 71 951 # RESP I 52.61 40.01 7.41 100.0I % OF CYCLE I------------ I ------------ I ------------ I ------------ I
4 1 301 23! 2l 551 a RESP I 54.51 41.81 3.6I 100.01 % OF CYCLE I ------------ I ------------ I ------------ I ------------ I
231 151 31 411 N RESP I 56.11 36.61 7.31 100.01 % OF CYCLE I ------------ I ------------ I ------------ I ------------ I
6 I 301 441 61 801 a RESP I 37.51 55.01 7.51 100.01 % OF CYCLE I ------------ I ------------ I ------------ I ------------ I
7 I 371 331 81 781 a RESP I 47.41 42.31 10.31 100.01 % OF CYCLE I------------ I ------------ I ------------ I ------------ I
8 I 581 551 tOI 1231 a RESP I 47.21 44.71 8.11 100.01 % OF CYCLE I ------------ I ------------ I ------------ I ------------ I
SUMI 3391 2871 541 6801 a RESP I 49.91 42.21 7.91 100.01 % OF CYCLE I------------ I ------------ I ------------ I ------------ I
STATISTICS BASED ON RAW FREQUENCY
CHI SQUARE = .104087 E 02 DEGREES OF FREEDOM = 7
CONT COEF = .127888
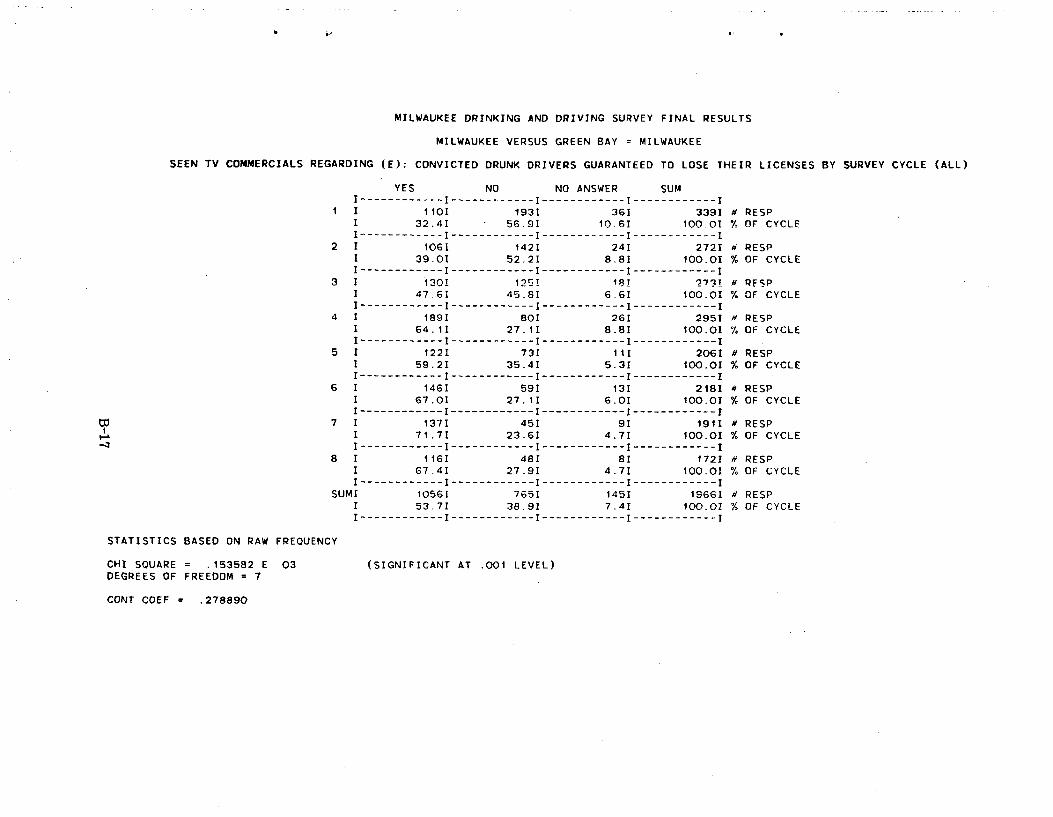
MILWAUKEE DRINKING AND DRIVING SURVEY FINAL RESULTS
MILWAUKEE VERSUS GREEN BAY = MILWAUKEE
SEEN TV COMMERCIALS REGARDING (E): CONVICTED DRUNK DRIVERS GUARANTEED TO LOSE THEIR LICENSES BY SURVEY CYCLE (ALL)
YES NO NO ANSWER SUMI ------------ I ------------ I ------------ I ------------I
1 I 1101 1931 361 3391 a RESP I 32.41 56.9I 10.61 100.OI % OF CYCLE I ------------ I ------------ I ------------ I ------------ I
2 I 1061 1421 241 2721 H RESP I 39.OI 52.21 8.81 100.01 % OF CYCLE I ------------ I ------------ I ------------ I ------------ I
3 I 1301 1251 18I 2731 x RFSP I 47.61 45.81 6.61 100.02 % OF CYCLE I ------------ I ------------ I ------------ I ------------ I
4 I 1891 801 261 2951 a RESP I 64.1I 27.11 8.81 100.01 % OF CYCLE I------------ I ------------ I ------------ I ------------ I
5 1 1221 731 111 2061 a RESP I 59.21 35.41 5.31 100.01 % OF CYCLE I ------------ I ------------ I ------------ I ------------ I
6 I 1461 591 131 2181 a RESP I 67.01 27.11 6.0I 100.01 % OF CYCLE I------------ I ------------ I ------------ I ------------ I
G1 7 I 1371 451 91 1911 a RESP
r 1 71.71 23.61 4.71 100.01 % OF CYCLE I ------------ I ------------ I ------------ I ------------ I
8 1 1161 481 81 1721 H RESP I 67.41 27.91 4.71 100.01 % OF CYCLE I ------------ I ------------ I ------------ I ------------ I
SUMI 10561 7651 1451 196GI N RESP 1 53.71 38.91 7.41 100.01 % OF CYCLE I ------------ I ------------ I ------------ I ------------ I
STATISTICS BASED ON RAW FREQUENCY
CHI SQUARE = .153582 E 03 (SIGNIFICANT AT .001 LEVEL)DEGREES OF FREEDOM = 7
CONT COEF = .278890
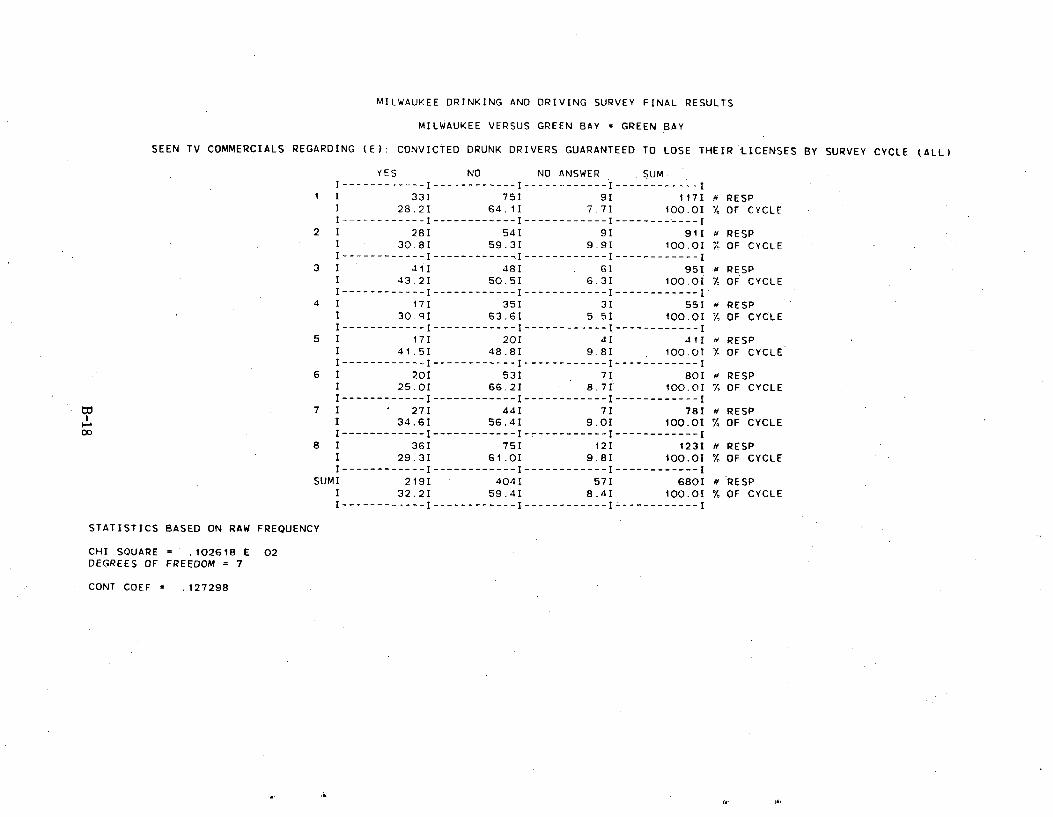
MILWAUKEE DRINKING AND DRIVING SURVEY FINAL RESULTS
MILWAUKEE VERSUS GREEN BAY = GREEN BAY
SEEN TV COMMERCIALS REGARDING (E): CONVICTED DRUNK DRIVERS GUARANTEED TO LOSE THEIR'LICENSES BY SURVEY CYCLE (ALL)
YES NO NO ANSWER SUM I ------------ I ------------ I ------------ I ------------ I
1 I 331 751 91 1172 A RESP 28.21 64.11 7.71 100.01 / OF CYCLE
I------------ I ------------ I ------------ I ------------ I 2 I 281 541 91 911 d RESP
I 30.8I 59.31 9.91 100.01 i= OF CYCLE I ------------ I ------------ I ------------ I ------------ I
3 I 411 481 6I 951 a RESP I 43.2I 50.51 6.31 100.01 % OF CYCLE I ------------ I ------------ I ------------ I ------------ I
4 1 171 351 31 551 RESP I 30.9I 63.61 5.51 100.01 % OF CYCLE I ------------ I ------------ I ------------ I ------------ I
5 I 171 201 41 411 RESP I 41.51 48.81 9.81 100.01 '/- OF CYCLE I ------------ I ------------ I ------------ I ------------ I
6 I 201 531 71 801 RESP 1 25.01 66.21 8.71 100.01 7, OF CYCLE I ------------ I ------------ I ------------ I ------------ I
7 I 271 441 71 781 a RESP I 34.6I 56.41 9.01 100.01 % OF CYCLE I ------------ I ------------ I------------ I ------------ I
8 I 36I 751 121 1231 # RESP I 29.31 61.01 9.81 100.01 % OF CYCLE I ------------ I ------------ I ------------ I ------------ I
SUMI 2191 4041 571 680I a RESP I 32.21 59.41 8.41 100.01 % OF CYCLE I ------------ I ------------ I ------------ I ------------ I
STATISTICS BASED ON RAW FREQUENCY
CHI SQUARE .102618 E 02 DEGREES OF FREEDOM = 7
CONT COEF = .127298
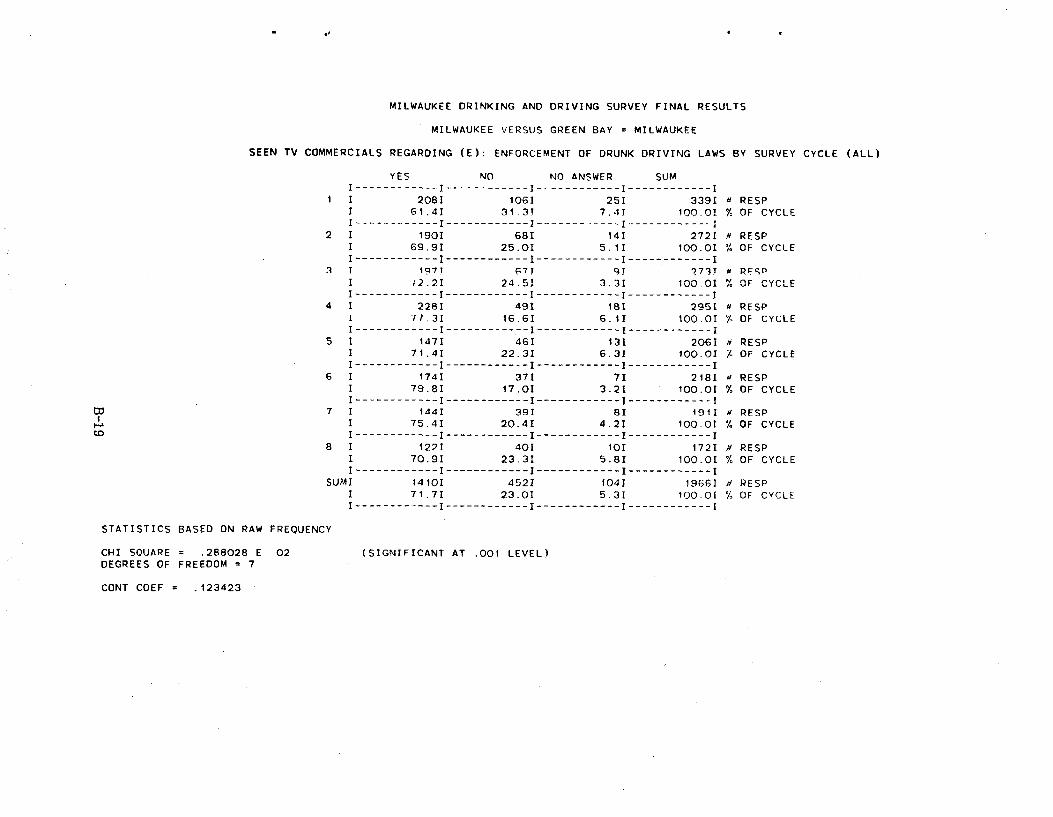
MILWAUKEE DRINKING AND DRIVING SURVEY FINAL RESULTS
MILWAUKEE VERSUS GREEN BAY = MILWAUKEE
SEEN TV COMMERCIALS REGARDING (E): ENFORCEMENT OF DRUNK DRIVING LAWS BY SURVEY CYCLE (ALL)
YES NO NO ANSWER SUM I ------------ I ------------ I ------------ I ------------ I
1 I 2081 106I 251 3391 M RESP I 61.41 31.3T 7.4T 100.01 % OF CYCLE I ------------ I -----------I I------------I
2 1 190I 681 141 2721 H RESP I 69.91 25.01 5.11 100.01 % OF CYCLE I ------------ I ------------ I ------------ I ------------ I T 1 q7T F7J 4T 77'3T M RFSD
I ,2.2I 214.51 3.31 100.01 ! OF CYCLE I------------I------------I------------I------------1
4 1 228I 49I 181 2951 M RESP I 71.31 16.61 6.1I 100.01 7- OF CYCLE I------------ I ------------ I ------------ I ------------ I
5 I 1471 461 13I 2061 # RESP I 71.41 22.31 6.31 100.01 X OF CYCLE I------------ I ------------ I ------------ I ------------ I
6 I 1741 371 71 2181 M RESP I 79.81 17.01 3.21 100.01 % OF CYCLE I ------------ I ------------ I ------------ I ------------ I
7 I 1441 391 81 1911 M RFSP I 75.41 20.41 4.2I 100.0I % OF CYCLE I ------------ I ------------ I ------------ I ------------ I
8 1 1221 401 101 1721 N RESP I 70.91 23.31 5.81 100.01 % OF CYCLE I ------------ I ------------ I ------------ I ------------ I
SUMI 1410I 452I 104I 1966I H RESP I 71.71 23.01 5.31 100.01 % OF CYCLE I ------------ I ------------ I ------------ I ------------ I
STATISTICS BASED ON RAW FREQUENCY
CHI SQUARE = .288028 E 02 (SIGNIFICANT AT .001 LEVEL) DEGREES OF FREEDOM = 7
CONT COEF = .123423
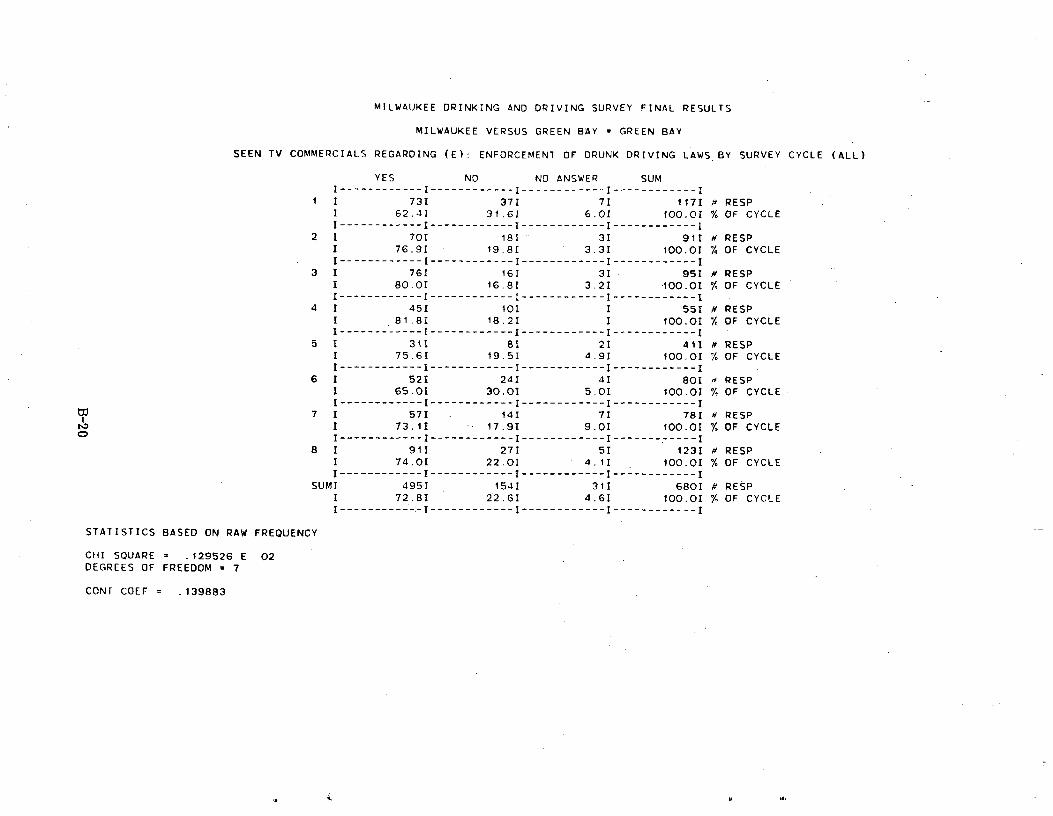
MILWAUKEE DRINKING AND DRIVING SURVEY FINAL RESULTS
MILWAUKEE VERSUS GREEN BAY = GREEN BAY
SEEN TV COMMERCIALS REGARDING (E): ENFORCEMENT OF DRUNK DRIVING LAWS BY SURVEY CYCLE (ALL)
YES NO NO ANSWER SUM I------------ I ------------ I ------------ I ------------ I
1 I 731 371 71 1171 r RESP i 62.41 31.61 6.01 100.01 % OF CYCLE I------------ I ------------ I ------------ I ------------ I
2 I 701 181 31 911 N RESP I 76.91 19.81 3.31 100.01 % OF CYCLE I ------------ I ------------ I ------------ I ------------ I
3 I 761 161 31 951 H RESP I 80.01 16.81 3.21 100.01 % OF CYCLE I ------------ I ------------ I ------------ I ------------ I
4 1 451 101 I 551 b RESP I 81.81 18.21 I 100.01 % OF CYCLE I ------------ I ------------ I ------------ I ------------ I
5 1 311 81 21 41I H RESP I 75.61 19.51 4.91 100.01 % OF CYCLE I ------------ I ------------ I ------------ I ------------ I
6 I 521 241 41 801 # RESP I 65.01 30.01 5.01 100.01 % OF CYCLE I ------------ I ------------ I ------------ I ------------ I
7 I 571 141 71 781 p RESP I 73.11 17.91 9.01 100.01 % OF CYCLE I ------------ I ------------ I ------------ I -------.----- I
8 I 911 271 51 1231 # RESP 1 74.01 2.2.01 4.11 100.01 % OF CYCLE I ------------ I ------------ I ------------ I ------------ I
SUMI 4951 1541 311 6801 k RESP I 72.81 22.61 4.6I 100.01 % OF CYCLE I ----------- :-I ------------ I ------------ I ------------ I
STATISTICS BASED ON RAW FREQUENCY
CHI SQUARE = .129526 E 02 DEGREES OF FREEDOM = 7
CONT COEF = .139883
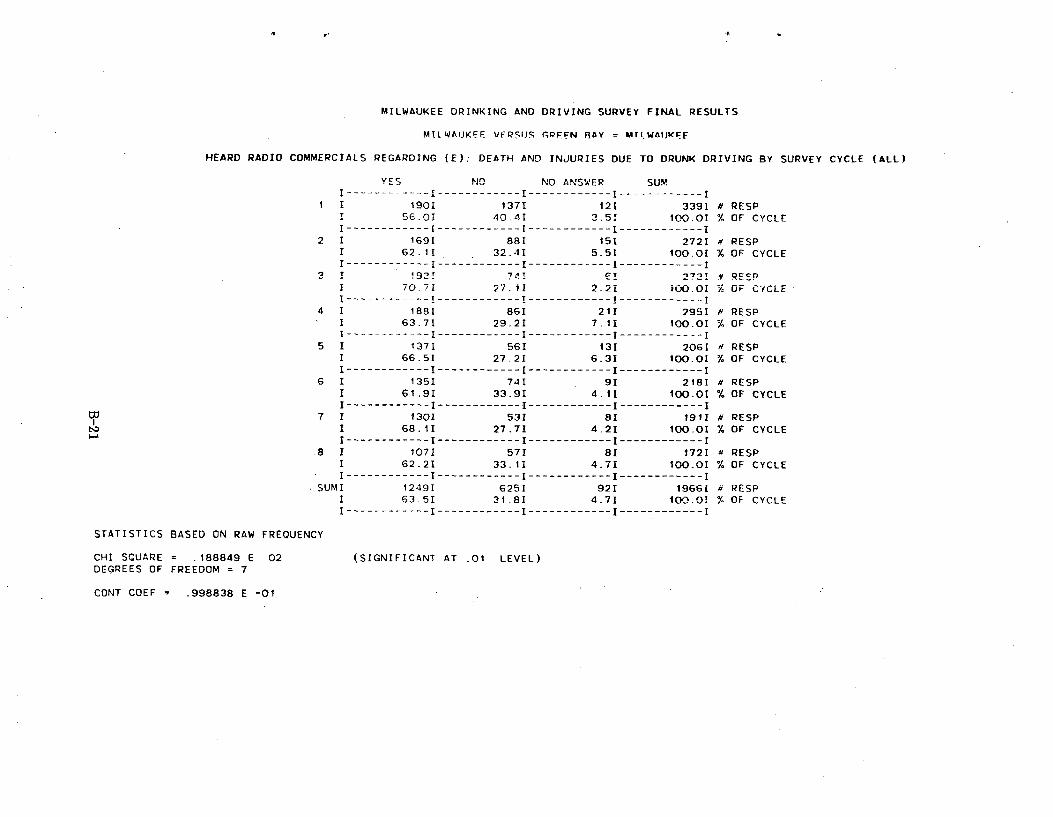
MILWAUKEE DRINKING AND DRIVING SURVEY FINAL RESULTS
MIIWAIJKFF. VFP I)S (RFFN RAY = MTi.WAUKFF
HEARD RADIO COMMERCIALS REGARDING (E): DEATH AND INJURIES DUE TO DRUNK DRIVING BY SURVEY CYCLE (ALL)
YES NO NO ANSWER SUMI------------ I ------------ I ------------ I ------------I
1 I 190I 1371 121 339I # RESP I 56.01 40.41 3.51 100.01 % OF CYCLE I ------------ I ------------ I ------------ I ------------ I
2 I 169I 881 151 2721 . RESP 1 62.11 32.41 5.51 100.01 % OF CYCLE I------------ I ------------ I ------------ I ------------ I
2 _T 193_1 7t1 cT 2721 -1 BEEP
I 70.71 27.11 2-2I 100-0I h OF CYCLE I ------------ T ------------ I ------------ I ------------ I
4 I 1881 86I 211 2951 H RESP I 63.7I 29.21 7.11 100.0I % OF CYCLE I ------------ I ------------ I ------------ I ------------ I
5 I 1371 561 131 2061 H RESP I 66.51 27.2I 6.31 100.01 % OF CYCLE I ------------ I ------------ I ------------ I ------------ I
6 I 1351 741 91 2181 a RESP I 61.9I 33.91 4.11 100.01 % OF CYCLE I ------------ I ------------ i ------------ I ------------ I
7 1 1301 531 8I 1911 N RESP I 68.1I 27.71 4.2I 100.0I % OF CYCLE I ------------ I ------------ I ------------ I ------------ I
8 1 1071 571 81 1721 H RESP I 62.21 33.11 4.71 100.0I % OF CYCLE I------------1------------I------------I------------I
SUMI 1249I 625I 92I 19661 RESP I 63.51 31.81 4.71 100.01 % OF CYCLE I ------------ I ------------ I ------------ I ------------ I
STATISTICS BASED ON RAW FREQUENCY
CHI SQUARE = .188849 E 02 (SIGNIFICANT AT .01 LEVEL) DEGREES OF FREEDOM = 7
CONT COEF = .998838 E -01
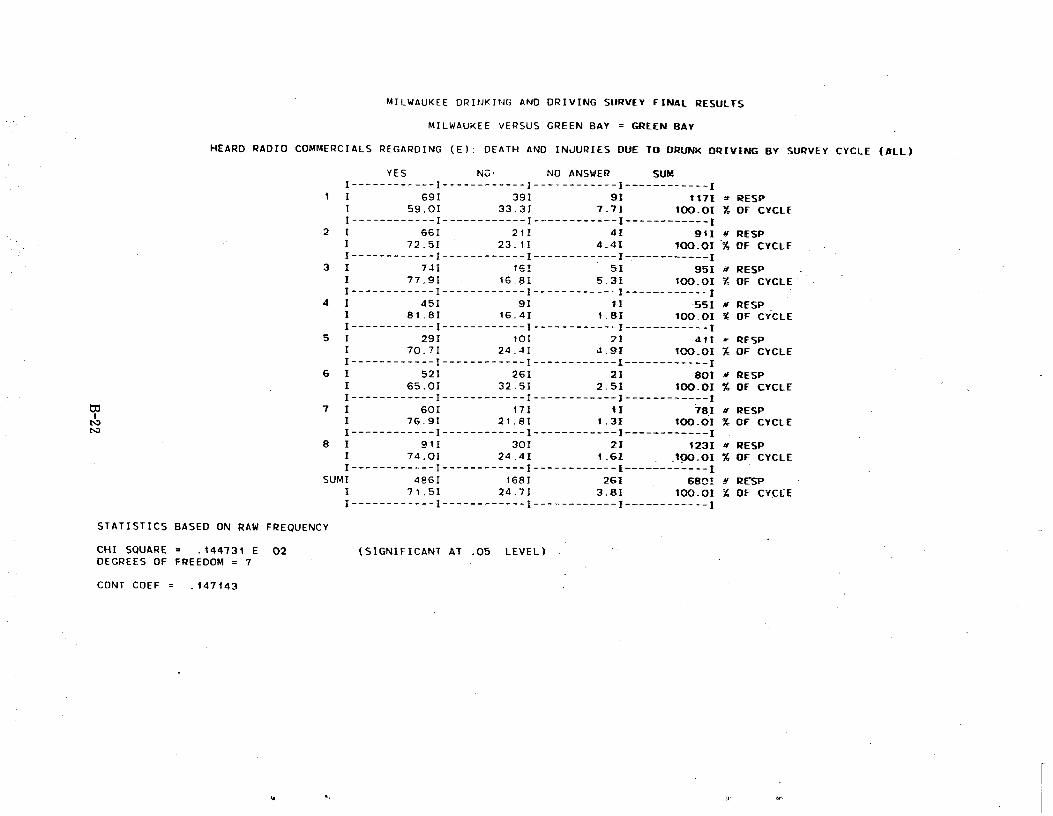
------------
MILWAUKEE DRINKING AND DRIVING SURVEY FINAL RESULTS
MILWAUKEE VERSUS GREEN BAY = GREEN BAY
HEARD RADIO COMMERCIALS REGARDING (E): DEATH AND INJURIES DUE TO DRUNK DRIVING BY SURVEY CYCLE (ALL)
YES NO, NO ANSWER SUM I ------------ I ------------ I ------------ I -----------
I I 691 391 91 1171 Y RESP I 59.01 33.3I 7.71 100.01 ) OF CYCLE I------------I------------I------------I------------1
2 I 661 211 41 911 4' RESP I 72.51 23.11 4.41 100.0I % OF CYCLE I ------------ I ------------ I ------------ I ------------ I
3 I 741 161 51 951 4' RESP I 77.91 16.81 5.31 100.01 1 OF CYCLE I------------ I ------------ I ------------ I ----------- I
4 I 451 91 11 -55I K RESP 1 81.8I 16.4I 1.81 100.01 L OF CYCLE I------------ I ------------ I ------------ I ------------ I
5 I 291 101 21 41I RESP I 70.71 24.41 1.9I 100.0I OF CYCLE I ------------ I ------------ I ------------ I ------------ I
6 1 521 261 21 80I 4' RESP I 65.01 32.5I 2.51 100.01 % OF CYCLE I ------------ I ------------ I ------------ I ------------I
7 I 601 171 11 781 a RESP I 76.91 21.81 1.31 tOO.OI % OF CYCLE I ------------ I ------------ I ------------ I ------------ I
8 I 911 301 21 1231 a RESP 1 74.0I 24.4I 1.61 100.01 % OF CYCLE I ------------ I ------------ I ------------ I ------------ I
SUMI 4861 168I 261 6801 a RESP I 71.51 24.71 3.81 100.0I % OF CYCLE I ------------ I ------------ I ------------ I ------------ I
STATISTICS BASED ON RAW FREQUENCY
CHI SQUARE _ .144731 E 02 (SIGNIFICANT AT .05 LEVEL) DEGREES OF FREEDOM = 7
CONT COEF = .147143
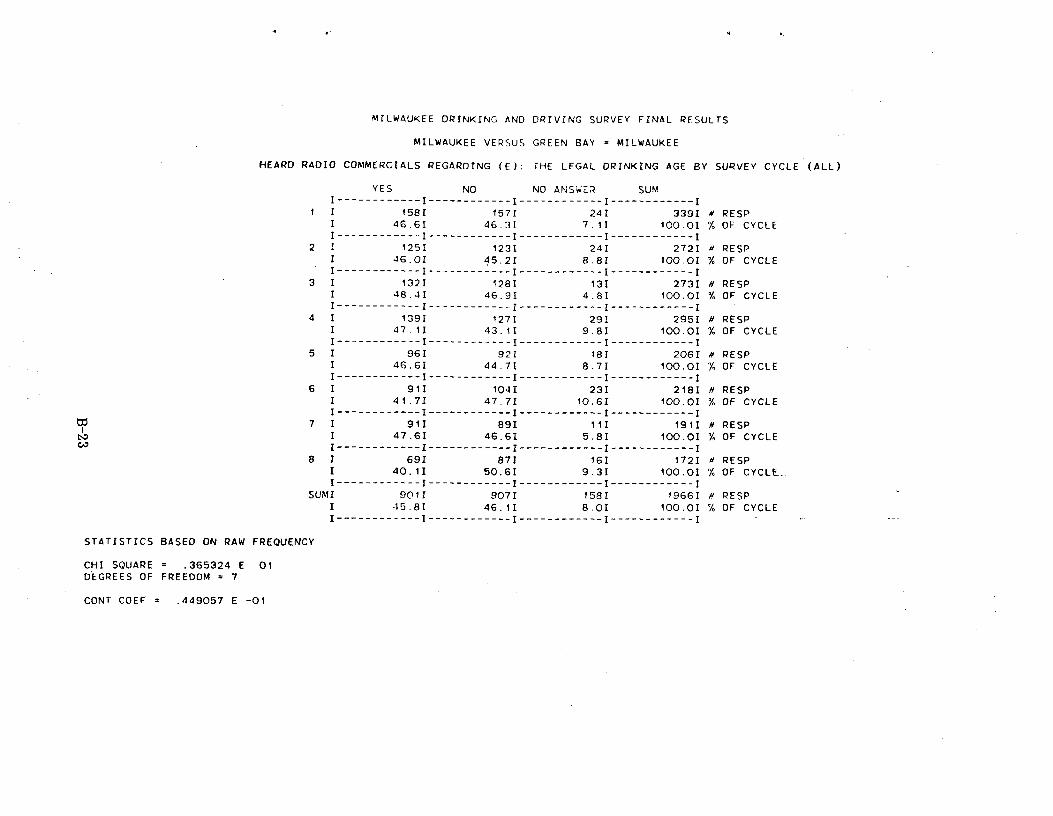
MILWAUKEE DRINKING AND DRIVING SURVEY FINAL RESULTS
MILWAUKEE VERSUS GREEN BAY = MILWAUKEE
HEARD RADIO COMMERCIALS REGARDING (E): THE LEGAL DRINKING AGE BY SURVEY CYCLE (ALL)
YES NO NO ANSWER SUM I------------ I ------------ I ------------ I ------------I
1 I 158I 1571 241 3391 a RESP 1 46.6I 46.3I 7.11 100.01 % OF CYCLE I------------ I ------------ I ------------ I ------------ I
2 1 1251 123I 24I 272I a RESP I 46.0I 45.21 8.81 100.01 % OF CYCLE I ------------ I ------------ I ------------ I ------------ I
3 I 1321 128I 13I 2731 # RESP I 48.4I 46.9I 4.81 100.01 % OF CYCLE I------------ I ------------ I ------------ I ------------ I
4 1 139I 127I 291 295I a RESP I 47.11 43.1I 9.8I 100.01 % OF CYCLE I------------ I ------------ I ------------ I ------------ I
5 I 961 921 181 2061 # RESP I 46.61 44.7I 8.7I 100.01 % OF CYCLE I ------------ I ------------ I ------------ I ------------ I
6 I 91I 1041 231 218I a RESP I 41.71 47.71 1O.6I 100.01 % OF CYCLE I ------------ I ------------ I ------------ I ------------ I
7 I 911 891 111 1911 a RESP I 47.61 46.61 5.8I 100.0I % OF CYCLE I ------------ I ------------ I ------------ I ------------ I
8 1 69I 871 161 1721 a RESP I 40.11 50.61 9.31 100.01 % OF CYCLE., I------------I------------I------------I------------I
SUMI 901I 907I 158I 19661 N RESP I 45.81 46.11 8.01 100.01 % OF CYCLE I ------------ I ------------ I ------------ I ------------ I
STATISTICS BASED ON RAW FREQUENCY
CHI SQUARE = .365324 E 01 DEGREES OF FREEDOM = 7
CONT COEF = .449057 E -01
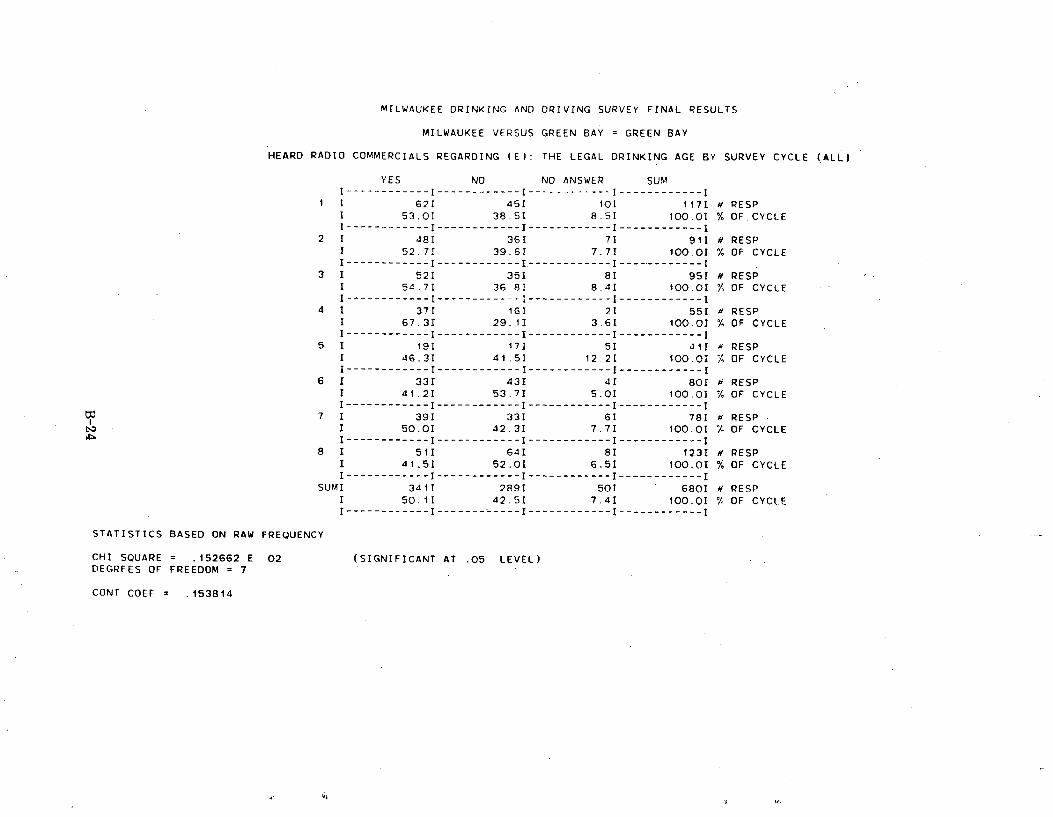
MILWAUKEE DRINKING AND DRIVING SURVEY FINAL RESULTS
MILWAUKEE VERSUS GREEN BAY = GREEN BAY
HEARD RADIO COMMERCIALS REGARDING (E): THE LEGAL DRINKING AGE BY SURVEY CYCLE (ALL)
YES NO NO ANSWER SUM I ------------ I ------------ I ------------ I ------------I
1 I 62I 451 10I 1171 # RESP I 53.01 38.51 8.51 100.01 % OF CYCLE I ------------ I ------------ I ------------ I ------------ I
2 I 481 361 71 911 # RESP I 52.71 39.6I 7.71 100.0I % OF CYCLE I ------------ I ------------ I.------------ I ------------ I
3 I 521 351 81 951 a RESP I 54.71 36.8I 8.41 100.01 % OF CYCLE I ------------ I ------------ I ------------ I ------------ I
4 I 371 16I 21 551 RESP I 67.31 29.11 3.61 100.01 % OF CYCLE I ------------ I ------------ I ------------ I ------------ I
5 I 191 171 51 411 a RESP I 46.31 41.51 12.21 100.0I % OF CYCLE I ------------ I ------------ I ------------ I ------------ I
6 1 331 431 41 801 RESP I 41.21 53.71 5.01 100.01 % OF CYCLE I ------------ I ------------ I ------------ I ------------ I
7 1 391 331 61 781 a RESP I 50.0I 42.31 7.71 100.0I % OF CYCLE I------------ I ------------ I ------------ I ------------ I
8 I 511 641 81 1231 a RESP I 41.51 52.01 6.51 100.01 % OF CYCLE I------------ I ------------ I ------------ I ------------ I
SUMI 3411 2891 501 6801 a RESP I 50.11 42.51 7.41 100.01 % OF CYCLE I ------------ I -------=---- I--= --------- I -------------I
STATISTICS BASED ON RAW FREQUENCY
CHI SQUARE = .152662 E 02 (SIGNIFICANT AT .05 LEVEL) DEGREES OF FREEDOM = 7
CONT COEF = .153814
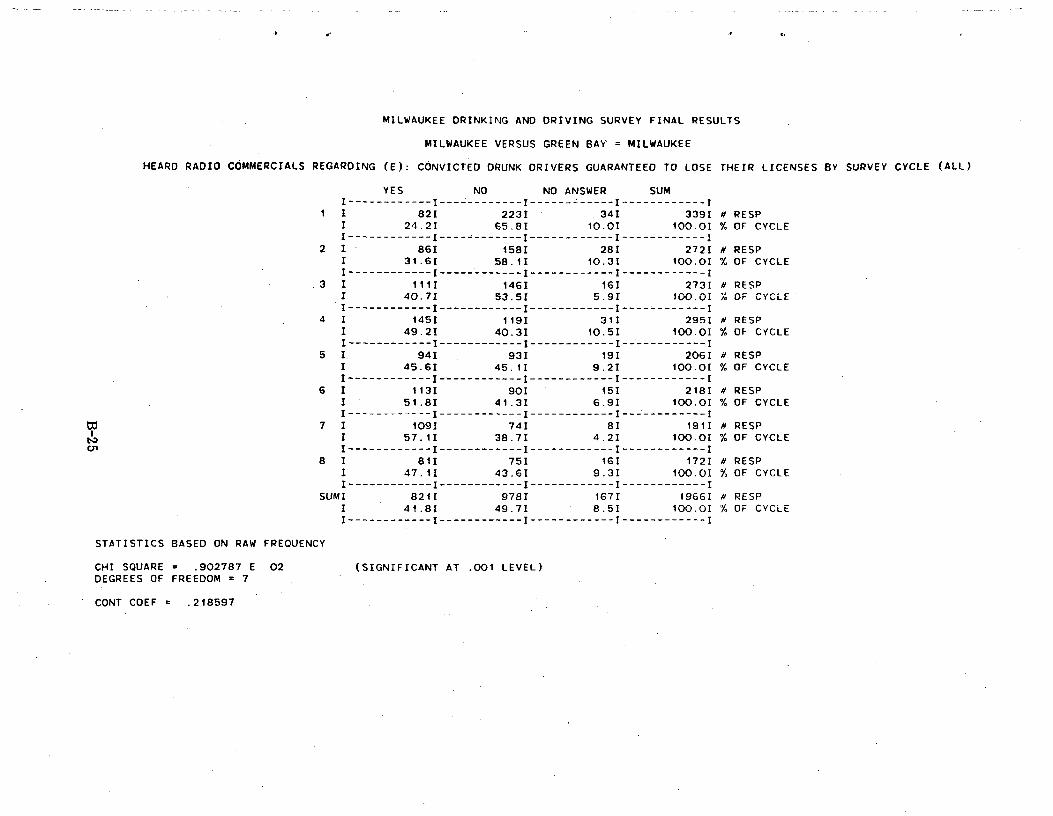
MILWAUKEE DRINKING AND DRIVING SURVEY FINAL RESULTS
MILWAUKEE VERSUS GREEN BAY = MILWAUKEE
HEARD RADIO COMMERCIALS REGARDING (E): CONVICTED DRUNK DRIVERS GUARANTEED TO LOSE THEIR LICENSES BY SURVEY CYCLE (ALL)
YES NO NO ANSWER SUMI ------------ I ------------ I ------= -----I------------I
1 I 821 2231 .34I 3391 # RESP I 24.21 65.81 10.01 100.01 % OF CYCLE I ------------ I ------------ I ------------ I ------------ I
2 I 861 1581 281 2721 a RESP I 31.6I 58.1I 10.31 100.01 % OF CYCLE I ------------ I ------------ I ------------ I ------------ I
3 I 1111 14GI 161 2731 H RESP I 40.7I 53.5I 5.91 100.01 % OF CYCLE I------------ I ------------ I ------------ I ------------ I
4 I 145I 119I 31I 2951 N RESP I 49.21 40.31 10.51 100.01 % OF CYCLE I------------ I ------------ I ------------ I ------------ I
5 I. 941 931 191 2061 a RESP I 45.61 45.11 9.21 100.01 % OF CYCLE I ------------ I ------------ I ------------ I ------------ I
6 I 113I 901 151 2181 N RESP I 51.81 41.31 6.91 100.01 % OF CYCLE I------------ I ------------ I ------------ I ------------ I
7 I 1091 741 81 1911 a RESP I 57.11 38.71 4.21 100.01 % OF CYCLE I ------------ I ------------ I ------------ I ------------ I
8 I 811 751 161 1721 a RESP I 47.11 43.61 9.31 100.01 % OF CYCLE I ------------ I ------------ I ------------ I ------------ I
SUMI 8211 9781 1671 196GI a RESP I 41.81 49.71 8.51 100.01 % OF CYCLE I ------------ I ------------ I ------------ I ------------ I
STATISTICS BASED ON RAW FREQUENCY
CHI SQUARE = .902787 E 02 (SIGNIFICANT AT .001 LEVEL) DEGREES OF FREEDOM = 7
CONT COEF = .218597

MILWAUKEE DRINKING AND DRIVING SURVEY FINAL RESULTS
MILWAUKEE VERSUS GREEN BAY = GREEN BAY
HEARD RADIO COMMERCIALS REGARDING (E): CONVICTED DRUNK DRIVERS GUARANTEED TO LOSE THEIR LICENSES BY SURVEY CYCLE (ALL)
YES NO NO ANSWER SUM I ------------ I ------------ I ------------ I ------------I
1 1 291 711 171 1171 a RESP I 24.81 60.71 14.51 100.01 % OF CYCLE I ------------ I ------------ I ------------ I ---------
2 I 281 521 111 911 # RESP I 30.81 57.11 .12.11 100.01 % OF CYCLE I ------------ I ------------ I ------------ I ------------ I
3 I 371 481 101 .95I # RESP I 38.91 50.51 10.51 100.01 % OF CYCLE I ------------ I ------------ I ------------ I ------------I
4 I 191 341 21 551 # RESP I 34.5I 61.8I 3.61 100.01 % OF CYCLE I ------------ I ------------ I ------------ I ------------ I
5 I 11I 251 51 411 # RESP I 26.81 61.0I 12.21 100.01 % OF CYCLE I ------------ I ------------ I ------------ I ------------ I
6 I 171 571 61 801 # RESP I 21.2I 71.21 7.51 100.01 % OF CYCLE I ------------ I ------------ I ------------ I ------------I
7 1 221 451 III 781 RESP I 28.21 57.71 14.11 100.01 % OF CYCLE
.I ------------ I ------------ I ------------ I ------.------ I 8 I 281 831 121 1231 RESP
I 22.81 67.5I 9.81 100.01 % OF CYCLE I ------------ I ------------ I ------------ I ------------ I
SUMI 1911 4151 741 6801 # RESP I 28.11 61.0I 10.91 100.01 % OF CYCLE I ------------ I ------------ I ------------ I ------------ I
STATISTICS BASED ON RAW FREQUENCY
CHI SQUARE = .114945 E 02 DEGREES OF FREEDOM = 7
CONT COEF = .136436
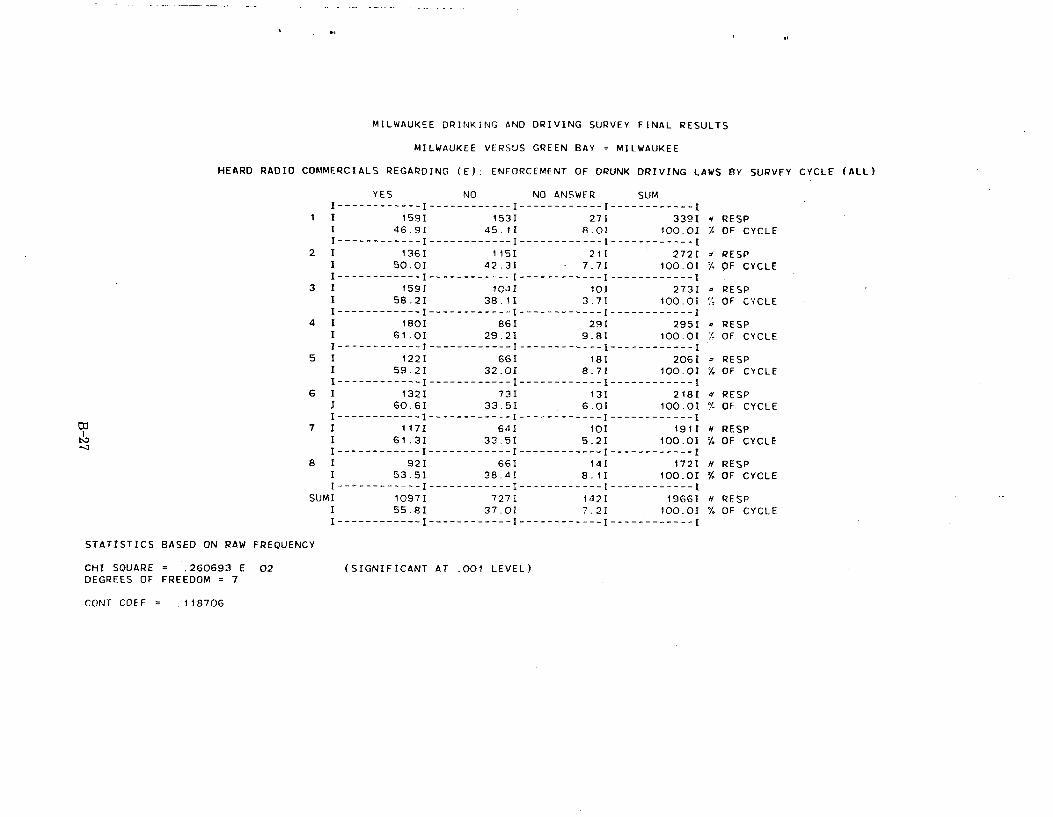
MILWAUKEE DRINKING AND DRIVING SURVEY FINAL RESULTS
MILWAUKEE VERSUS GREEN BAY = MILWAUKEE
HEARD RADIO COMMERCIALS REGARDING (E): ENFORCEMENT OF DRUNK DRIVING LAWS BY SURVEY CYCLE (ALL)
YES NO NO ANSWER SUM I ------------ I ------------ I ------------ I ------------ I
1 I 1591 153I 27I 339I a RESP I 46.9I 45.11 8.0I 100.01 OF CYCLE I ------------ I ------------ I --------- --I------------I
2 I 1361 1151 211 272I RESP 1 50.01 42.31 - 7.71 100.01 I OF CYCLE I ------------ I ------------ I ------------ I ------------ I
3 1 .159I 104I 10I 273R RESP I 58.21 38.11 3.71 100.01 OF CYCLE I ------------ I ------------ I ------------ I ------------ I
4 I 180I 86I 291 295I RESP I 61.OI 29.21 9.81 100.01 % OF CYCLE I ------------ I ------------ I ------------ I ------------ I
5 I 1221 661 18I 206I - RESP I 59.2I 32.01 8.7I 100.01 % OF CYCLE I ------------ I ------------ I ------------ I ------------ I
6 I 132I 731 13I 2181 # RESP I 60.61 33.51 6.01 100.0I % OF CYCLE I ------------ I ------------ I ------------ I ------------ I
7 1 1171 641 101 1911 RESP I 61.31 33.51 5.21 100.0I % OF CYCLE I ------------ I ------------ I ------------ I ------------ I
8 I 921 66I 141 1721 n RESP I 53.51 38.41 8.11 100.01 % OF CYCLE I ------------ I ------------ I ------------ I ------------ I
SUMI 1097I 727I 142I 19661 H RESP I 55.81 37.01 7.21 100.01 % OF CYCLE I------------ I ------------ I ------------ I ------------I
STATISTICS BASED ON RAW FREQUENCY
CHI SQUARE = .260693 E 02 (SIGNIFICANT AT .001 LEVEL) DEGREES OF FREEDOM = 7
CONT COEF = .118706
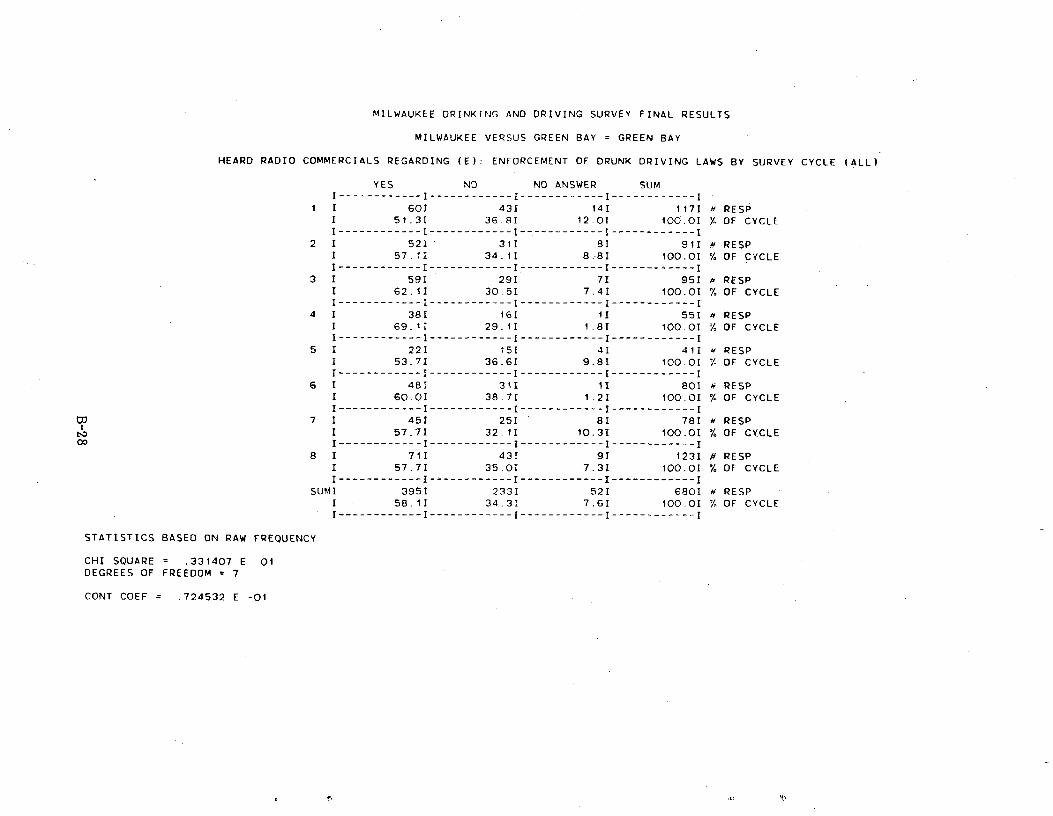
MILWAUKEE DRINKING AND DRIVING SURVEY FINAL RESULTS
MILWAUKEE VERSUS GREEN BAY = GREEN BAY
HEARD RADIO COMMERCIALS REGARDING (E): ENFORCEMENT OF DRUNK DRIVING LAWS BY SURVEY CYCLE (ALL)
YES NO NO ANSWER SUM I ------------ I ------------ I ------------ I ------------ I
I I 601 431 141 1171 a RESP I 51.31 36.8I 12.01 100.0I % OF CYCLE I ------------ I ------------ I --.---------- I ------------ I
2 I 521 311 81 91I RESP I 57.11 34.11 8,81 100.01 % OF CYCLE I ------------ I ------------ I ------------ I ------------ I
3 I 591 291 71 951 p RESP I 62.11 30.51 7.4I 100.01 OF CYCLE I ------------ I ------------I------------ I ------------ I
4 I 381 161 11 551 RESP I 69.11 29.11 1.81 100.OT Y OF CYCLE I ------------ I ------------ I ------------ I ------------ I
5 I 221 151 41 411 RESP I 53.71 36.6I 9.81 100.01 '/- OF CYCLE I ------------ I ------------ I ------------ I ------------ I
6 1 481 31I II 801 RESP I 6O.OI 38.71 1.21 100.01 % OF CYCLE I ------------ I ------------ I ------------ I ------------ I
00 7 I 451 251 81 781 a RESP I 57.71 32.11 10.31 100.01 % OF CYCLE
W I------------ I ------------ I ------------ I ------------ I 8 I 711 431 91 1231 # RESP
I 57.71 35.0I 7.31 100.01 % OF CYCLE I ------------ I ------------ I ------------ I ------------ I
SUMI 3951 2331 521 6801 # RESP I 58.11 34.31 7.61 100.01 % OF CYCLE I ------------ I ------------ I ------------ I ------------ I
STATISTICS BASED ON RAW FREQUENCY
CHI SQUARE = .331407 E 01DEGREES OF FREEDOM = 7
CONT COEF = .724532 E -01

------
MILWAUKEE DRINKING AND DRIVING SURVEY FINAL RESULTS
MILWAUKEE VERSUS GREEN BAY = MILWAUKEE
READ ANY PRINTED MATERIALS REGARDING (E): DEATH AND INJURIES DUE TO DRUNK DRIVING BY SURVEY CYCLE (ALL)
YES NO NO ANSWER SUM
I ------------ I ------------ I ------------ I ------------ I1 I 2301 981 111 3391 a RESP
I 67.8I 28.91 3.2I 100.01 % OF CYCLE I ------------ I ------------ I ------------ I ------------I
2 I 1881 691 15I 2721 RESP 1 69.11 25.41 5.51 100.0I % OF CYCLE I ------------ I ------------ I ------------ I ------------ I
3 1 186I 821 51 2731 RESP I 68.1I 30.01 1.8I 100.01 % OF CYCLE I ------------ I ------------ I ------------ I ------------ I
4 I 2231 SGI 16I 2951 a RESP I 75.6I 19.01 5.41 100.01 % OF CYCLE I ------------ I ------------ I ------------ I ------------ I
5 I 1541 431 91 20GI = RESP I 74.81 20.91 4.41 100 01 % OF CYCLE I ------------ I ------------ I ------------ I ----
6 I 159I 471 121 2181 d RESP I 72.91 21.61 5.51 100.0I % OF CYCLE I------------ I ------------ I ------------ I ------------ I
7 I 1421 381 11I 1911 H RESP
I 74.31 19.91 5.81 100.01 % OF CYCLE I ------------ I ------------ I ------------ I ------------ I
8 I 1311 331 81 1721 H RESP I 76.21 19.21 4.71 100.OI % OF CYCLE I------------ I ------------ I ------------ I ------------ I
SUMI 1413I 466I 87I 19661 d RESP I 71.91 23.71 4,41 100.01 % OF CYCLE I ------------ I ------------ I ------------ I ------------ I
STATISTICS BASED ON RAW FREQUENCY
CHI SQUARE = .178932 E 02 (SIGNIFICANT AT .05 LEVEL) DEGREES OF FREEDOM = 7
CONT COEF = .971230 E -01
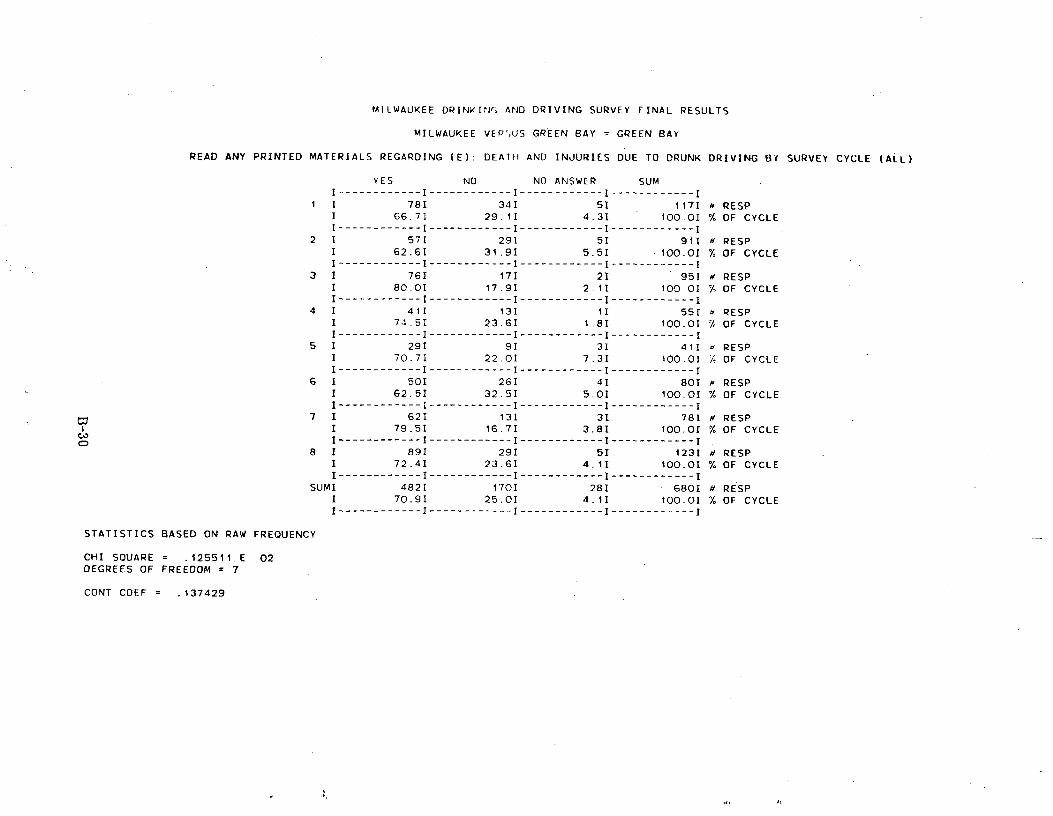
MILWAUKEE DRINKIN; AND DRIVING SURVEY FINAL RESULTS
MILWAUKEE VEP',US GREEN BAY = GREEN BAY
READ ANY PRINTED MATERIALS REGARDING (E): DEATH AND INJURIES DUE TO DRUNK DRIVING BY SURVEY CYCLE (ALL)
YES NO NO ANSWER - SUM I------------ I ------------ I ------------ I ------------I
1 1 781 341 51 117I a RESP I 66.71 29,11 4.31 100.0I % OF CYCLE I ------------ I ------------ I ------------ I ------------ I
2 1 571 291 51 911 a RESP I 62.61 31.91 5.51 100.0I % OF CYCLE I------------ I ------------ I ------------ I ------------ I
3 1 761 171 21 951 d RESP I 80.0I 17.91 2.11 100.OI % OF CYCLE I ------------ I ------------ I ------------ I ------------ I
4 I 411 131 11 551 d RESP I 74.51 23.61 1.81 100.01 OF CYCLE I ------------ I ------------ I ------------ I ------------ I
5 I 291 91 31 411 RESP I 70,71 22.0I 7.31 100.01 - OF CYCLE I ------------ I ------------ I ------------ I ------------ I
6 I 501 261 41 801 RESP I 62.51 32.51 5.01 100,01 % OF CYCLE I ------------ I ------------ I ------------ I ------------ I
7 I 621 131 31 781 RESP 1 79.51 16.71 3.81 100.01 OF CYCLE I ------------ I ------------ I ------------ I ------------ I
8 I 891 291 51 1231 a RESP I 72.41 23.61 4.1I 100.01 % OF CYCLE I ------------ I ------------ I ------------ I ------------ I
SUMI 4821 1701 281 6801 a RESP I 70.91 25.01 4.11 100.01 % OF CYCLE I ------------ I ------------ I ------------ I ------------ I
STATISTICS BASED ON RAW FREQUENCY
CHI SQUARE _ .125511.E 02 DEGREES OF FREEDOM = 7
CONT COEF = .137429

MILWAUKEE DRINKING AND DRIVING SURVEY FINAL RESULTS
MILWAUKEE VERSUS GREEN BAY = MILWAUKEE
READ ANY PRINTED MATERIALS REGARDING (E): THE LEGAL DRINKING AGE BY SURVEY CYCLE (ALL)
YES NO NO ANSWER SUM I------------ I ------------ I ------------ I ------------I
1 1 194I 1211 241 339I n RESP I 57.2I 35.71 7.11 100.01 OF CYCLE I ------------ I ------------ I ------------ I ------------ I
2 I 149I 971 261 272I H RESP 1 54.81 35.71 9.61 100.01. % OF CYCLE I ------------ I ------------ I ------------ I ------------ I
3 I 14GI 1101 171 2731 x RESP I 53.51 40.31 6.2I 100.0,1 % OF CYCLE I ------------ I ------------ I ------------ I ------------ I
4 I 1741 981 231 2951 a RESP I 59.01 33.21 7.81 100.01 % OF CYCLE I ------------ I ------------ I ------------ I ------------ I
5 I 1131 771 161 2061 p RESP I 54.91 37,41 7.81 100.01 % OF CYCLE I ------------ I ------------ I ------------ I ------------ I
6 I 1141 811 231 2181 a RESP 1 52.31 37.2I 10.6I 100.01 % OF CYCLE I ------------ I ------------ I ------------ I ------------ I
7 I 1181 601 131 1911 a RESP I 61.8I 31.41 6.81 100.01 % OF CYCLE I----- ------ I ------------ I ------------ I ------------ I
8 I 981 591 151 1721 H RESP I 57.0.1. 34.31 8.71 100.01 % OF CYCLE I------------ I ------------ I ------------ I ------------ I
SUMI 1106I 703I 157I 1966I H RESP 1 56.31 35.81 8.0I 100.0I % OF CYCLE I ------------ I ------------ I ------------ I ------------ I
STATISTICS BASED ON RAW FREQUENCY
CHI SQUARE _ .570433 E 01 DEGREES OF FREEDOM = 7
CONT COEF = .560659 E -01
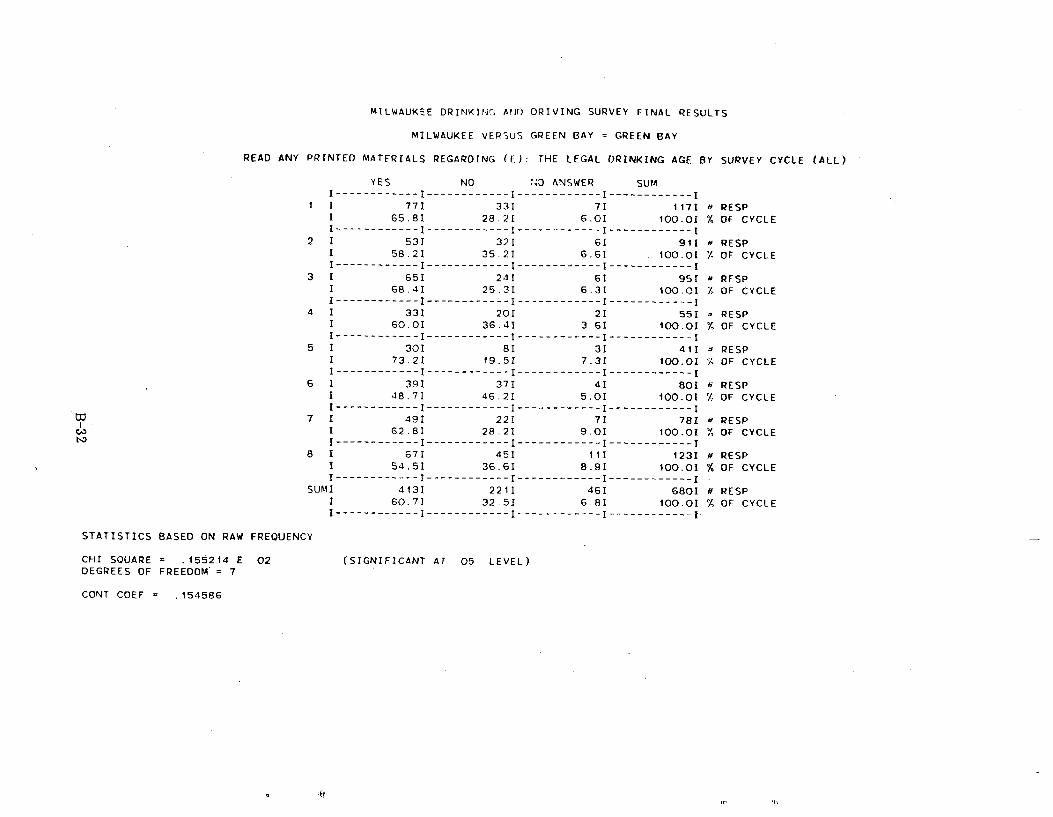
MILWAUKEE DRINKINr; AIJD DRIVING SURVEY FINAL RESULTS
MILWAUKEE VERSUS GREEN BAY = GREEN BAY
READ ANY PRINTED MATERIALS REGARDING (E): THE LEGAL DRINKING AGE BY SURVEY CYCLE (ALL)
YES NO 7.40, ANSWER . SUM
I ------------ I ------------ I ------------ I ------------ I
1 I 771 331 71 117I # RESP I 65.81 28.21 6.01 100.01 % OF CYCLE I------------ I ------------ I ------------ I ------------ I
2 I 531 321 61 911 M RESP I 58.21 35.21 6.61 100.01 % OF CYCLE I------------ I ------------ I ------------ I ------------ I
3 I 651 241 61 951 d RESP I 68.41 25.31 6.31 100.01 Y OF CYCLE I ------------ I ------------ I ------------ I ------------ I
4 I 331 201 21 551 RESP I 60.0I 36.4I 3.6I 100.01 OF CYCLE I ------------ I ------------ I ------------ I ------------ I
5 I 301 81 31 411 RESP 1 73.21 19.51 7.31 100.01 'A OF CYCLE I ------------ I ------------ I ------------ I ------------ I
6 I 391 371 41 801 a RESP I 48.71 46.21 5.01 100.01 OF CYCLE I ------------ I ------------ I ------------ I ------------ I
7 I 49I 221 71 781 RESP I 62.8I 28.21 9.01 100.01 OF CYCLE I ------------ I ------------ I ------------ I ------------ I
8 I 671 451 111 1231 a RESP 1 54.51 36.6I 8.91 100.01 % OF CYCLE I ------------ I ------------ I ------------ I ------------ I
SUMI 4131 2211 461 6801 a RESP 1 60.71 32.51 6.8I 100.01 % OF CYCLE I ------------ I ------------ I ------------ I ------------ I
STATISTICS BASED ON RAW FREQUENCY
CHI SQUARE = .1552.14 E 02 (SIGNIFICANT AT .05 LEVEL) DEGREES OF FREEDOM '= 7
CONT COEF = .154586
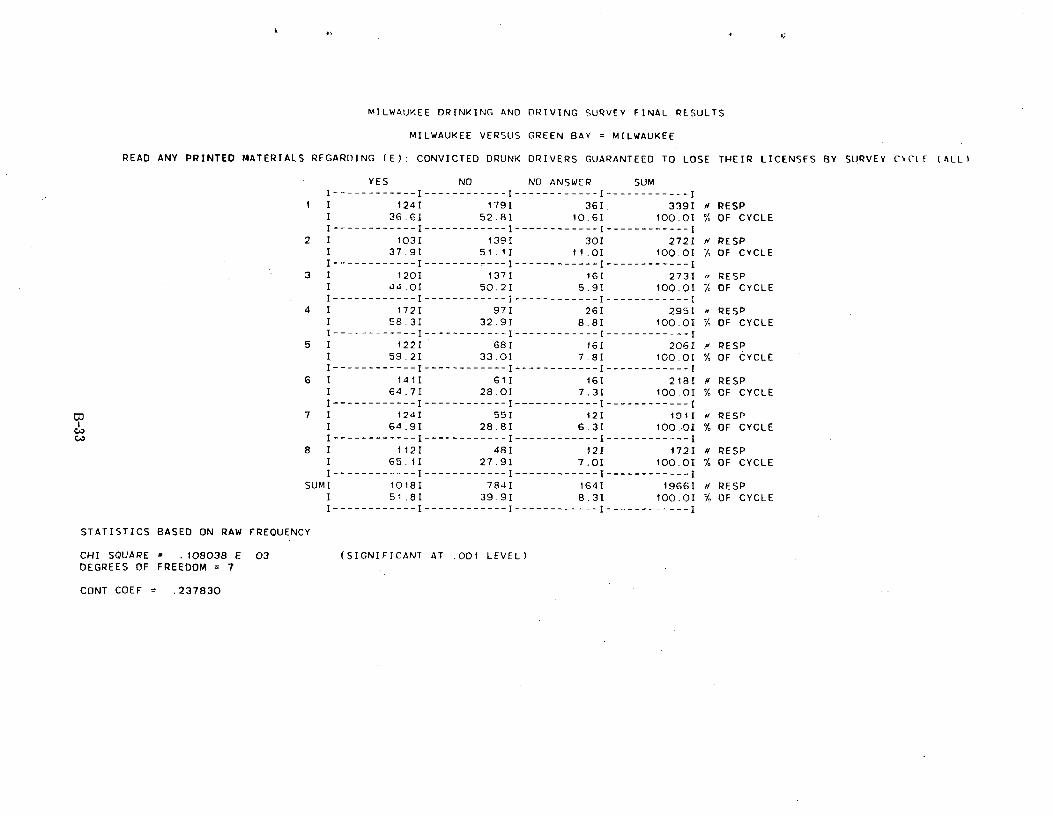
MILWAUKEE DRINKING AND DRIVING SURVEY FINAL RESULTS
MILWAUKEE VERSUS GREEN BAY = MILWAUKEE
READ ANY PRINTED MATERIALS REGARDING (E): CONVICTED DRUNK DRIVERS GUARANTEED TO LOSE THEIR LICENSES BY SURVEY C\CIE (ALL)
YES NO NO ANSWER SUMI------------ I ------------ I ------------ I ------------ I
I I 1241 1791 36I. 3391 a RESP I 36.6I 52.81 10.61 100.01 % OF CYCLE I ------------ I ------------ I ------------ I ------------ I
2 I 1031 1391 301 2721 a RESP 1 37.9I 51.11 11.01 100.0I OF CYCLE I ------------ I ------------I ------------ I ------------ I
3 1 120I 137I 161 273I RESP I 44.01 50.2I 5.9I 100.01 % OF CYCLE I ------------ I ------------ I ------------ I ------------ I
4 I 1721 971 261 2951 RESP I 58.31 32.9I 8.81 100.0I % OF CYCLE I ------------ I ------------ I ------------ I ------------ I
5 I 1221 681 161 2061 . RESP I 59.21 33.01 7.81 100.01 % OF CYCLE I ------------ I ------------ I ------------ I ------------ I
6 1 1411 61I 16I 2181 a RESP I 64.71 28.01 7.31 100.01 % OF CYCLE I ------------ I ------------ I ------------ I ------------ I
7 I 124I 551 121 191I a RESP I 64.91 28.81 6.3I 100:01 % OF CYCLE I ------------ I ------------ I ------------ I ------------ I
8 1 1121 481 121 1721 # RESP I 65.11 27.91 7.01 100.01 % OF CYCLE I ------------ I ------------ I ------------ I ------------ I
SUMI 1018I 784I 1641 1966"I N RESP I 51.81 39.91 8.31 100.01 % OF CYCLE I ------------ I ------------ I ------------ I ------------ I
STATISTICS BASED ON RAW FREQUENCY
CHI SQUARE = .108038 E 03 (SIGNIFICANT AT .001 LEVEL) DEGREES OF FREEDOM = 7
CONT COEF .237830
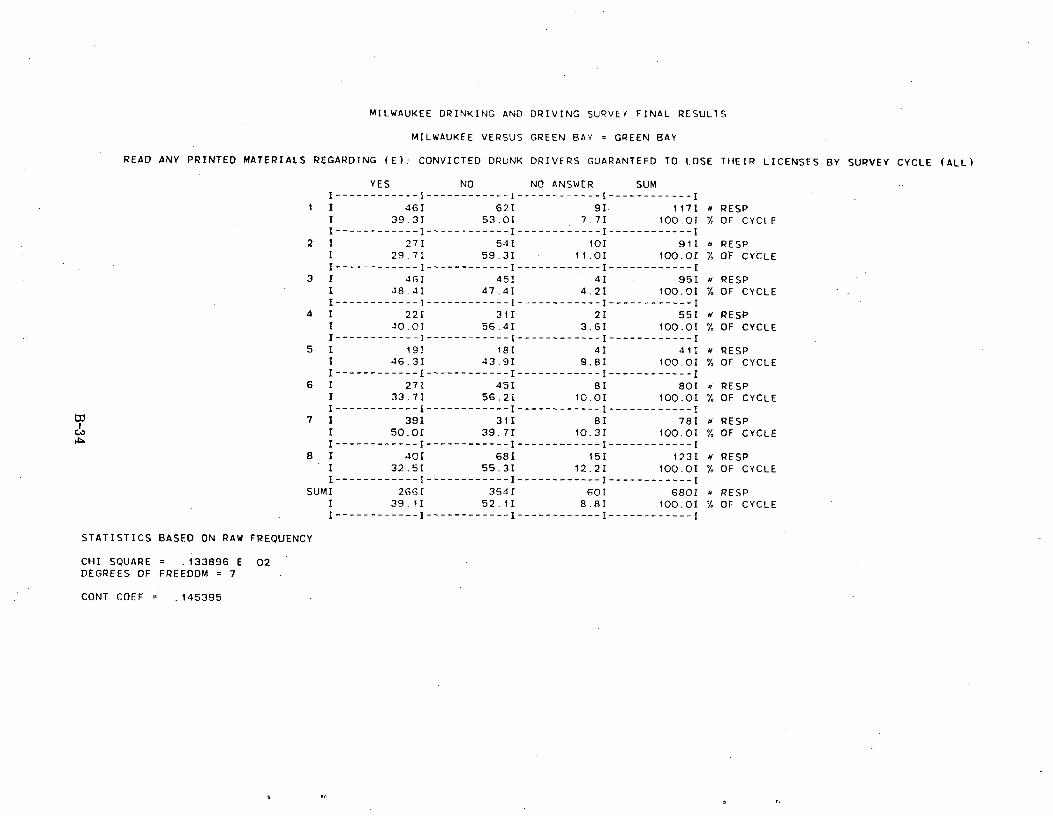
MILWAUKEE DRINKING AND DRIVING SURVEY FINAL RESULTS
MILWAUKEE VERSUS GREEN BAY = GREEN BAY
READ ANY PRINTED MATERIALS REGARDING (E): CONVICTED DRUNK DRIVERS GUARANTEED TO LOSE THEIR LICENSES BY SURVEY CYCLE (ALL)
YES NO NO ANSWER SUMI ------------ I ------------ I ------------ I ------------ I
I I 46I 621 91 1171 a RESP I 39.31 53.01 7.71 100.01 % OF CYCLE I ------------ I ------------ I ------------ I ------------ I
2 1 271 541 101 911 a PESP 1 29.71 59.31 11.01 100.0I ''A OF CYCLE I ------------ I ------------- I ------------ I ------------ I
3 1 46I 451 41 951 a RESP I 48.4I 47.41 4.2I 100.01 % OF CYCLE I ------------ I ------------ I ------------ I ------------ I
4 I 221 311 21 551 a RESP I 40.0I 56.41 3.61 100.01 % OF CYCLE I ------------ I ------------ I ------------ I ------------ I
5 I 191 181 41 411 a RESP I 46.31 43.91 9.81 100.01 % OF CYCLE I ------------ I ------------ I ------------ I ------------ I
6 I 271 451 81 801 a RESP I 33.71 56.2I 10.01 100.01 % OF CYCLE I------------ I ------------ I ------------ I ------------ I
7 I 391 311 81 781 a RESP I 50.01 39.71 10.31 100.0I % OF CYCLE I ------------ I ------------ I ------------ I ------------ I
8 1 401 681 151 1231 a RESP I 32.51 55.31 12.21 100.01 % OF CYCLE I ------------ I ------------ I ------------ I ------------ I
SUMI 266I 3541 601 6801 a RESP I 39.11 52.11 8.81 100.01 % OF CYCLE I ------------- I ------------ I ------------ I ------------ I
STATISTICS BASED ON RAW FREQUENCY
CHI SQUARE = .133896 E 02 DEGREES OF FREEDOM = 7
CONT COEF = .145395
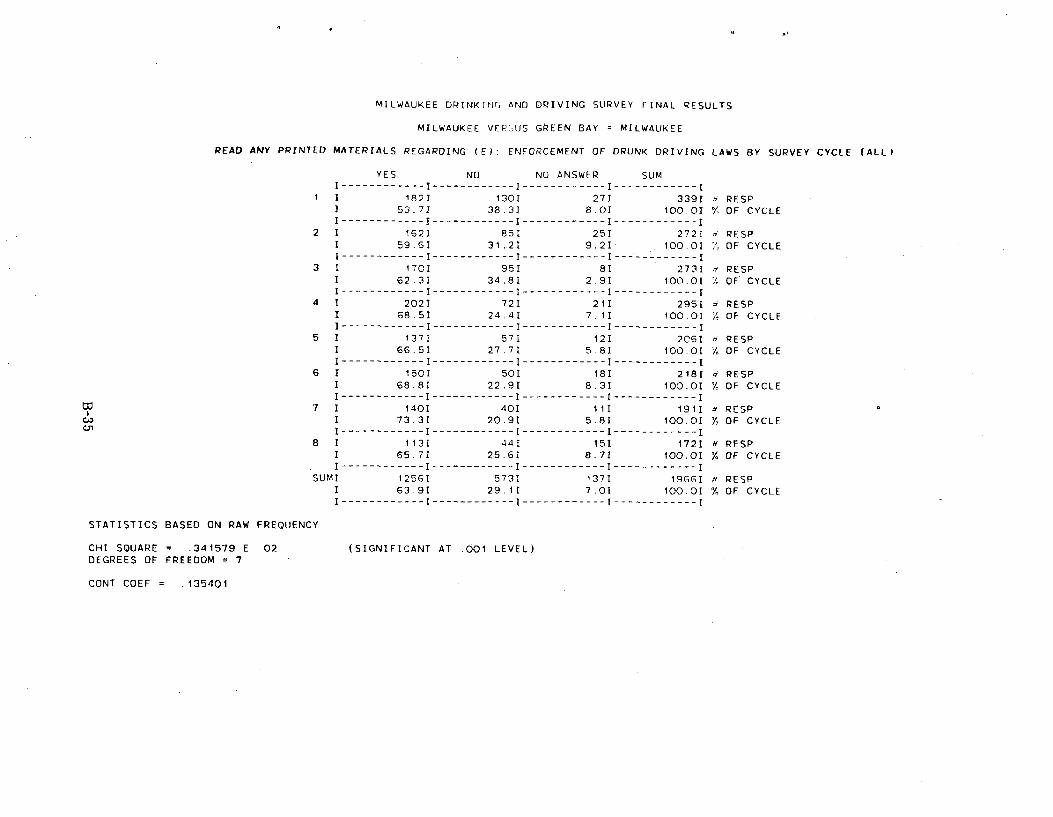
MILWAUKEE DRINKING AND DRIVING SURVEY FINAL RESULTS
MILWAUKEE VER:;US GREEN BAY = MILWAUKEE
READ ANY PRINTED MATERIALS REGARDING (E): ENFORCEMENT OF DRUNK DRIVING LAWS BY SURVEY CYCLE (ALL)
YES NO NO ANSWER SUM I------------ I ------------ I ------------ I ------------I
1 I 182I 1301 271 3391 .y RESP 53.71 38.31 8.01 100.01 % OF CYCLE
I------------ I ------------ I ------------ I ------------ I 2 I 1621 851 251 2721 RESP
I 59.6I 31.,21 9.21 100.01 OF CYCLE I ------------ I ------------ I ------------ I ------------ I
3 I 1701 951 81 2711 RESP I 62.31 34.81 2.91 100.01 OF CYCLE I ------------ I ------------ I ------------ I ------------ I
4 I 2021 721 211 2951 RESP I 68.5I 24.41 7.11 100.01 OF CYCLE I ------------ I ------------ I ------------ I ------------ I
5 I 1371 571 121 2061 RESP I 66.5I 27.71 5.81 100.OI / OF CYCLE I ------------ I ------------ I ------------ I ------------ I
6 I 1501 501 181 2181 a RESP I 68.8I 22.91 8.31 100.0I % OF CYCLE I------------ I ------------ I ------------ I ------------ I
7 I 1401 401 111 1911 RESP I 73.31 20.9I 5.81 100.01 '4 OF CYCLE I ------------ I ------------ I ------------ I ------------ I
8 I 1131 441 151 1721 ' RESP I 65.71 25.6I 8.71 100.01 % OF CYCLE I ------------ I ------------ I ------------ I ------------ I
SUMI 125GI 5731 1371 19GGI a RESP I 63.91 29.11 7.01 100.01 % OF CYCLE I------------ I ------------ I ------------ I ------------ I
STATISTICS BASED ON RAW FREQUENCY
CHI SQUARE _ .341579 E 02 (SIGNIFICANT AT .001 LEVEL) DEGREES OF FREEDOM = 7
CONT COEF = .135401

MILWAUKEE DRINKING AND DRIVING SURVEY FINAL RESULTS
MILWAUKEE VERSUS GREEN BAY = GREEN BAY
READ ANY PRINTED MATERIALS REGARDING (E): ENFORCEMENT OF DRUNK DRIVING LAWS BY SURVEY CYCLE (ALL)
YES NO NO ANSWER SUM I ------------ I ------------ I ------------ I ------------ I
1 I 731 381 6I 1171 a RESP I 62.41 32.51 5.11 100.01 % OF CYCLE I------------ I ------------ I ------------ I ------------ I
2 I 471 381 61 911 a RESP 1 51.61 41.81 6.61 100.01 OF CYCLE I ------------ I ------------ I ------------ I ------------I
3 I 701 201 51 951 RESP I 73.71 21.11 5.31 100.01 'A OF CYCLE I------------ I ------------ I ------------ I ------------I
4 I 371 16I 21 551 a RESP I 67.31 29.11 3.61 100.01 % OF CYCLE I ------------ I ------------ I ------------ I ------------ I
5 1 261 111 41 411 p RESP I 63.41 26.8I 9.81 100.01 '4 OF CYCLE I------------ I ------------ I ------------ I ------------ I
6 I 461 291 51 801 N RESP I 57.51 36.21 6.21 100.01 '/ OF CYCLE I ------------ I ------------ I ------------ I ------------ I
7 I 571 131 81 781 a RESP I 73.11 16.71 10.31 100.01 % OF CYCLE I ------------ I ------------ I ------------ I ------------ I
8 I 741 391 101 1231 a RESP I 60.21 31.71 8.11 100.01 % OF CYCLE I ------------ I ------------ I ------------ I ------------ I
SUMI 4301 2041 461 6801 N PESP I 63.2I 30.01 6.81 100.01 % OF CYCLE I ------------ I ------------ I ------------ I ------------ I
STATISTICS BASED ON RAW FREQUENCY
CHI SQUARE = .182812 E 02 (SIGNIFICANT AT .05 LEVEL) DEGREES OF FREEDOM = 7
CONT COEF = .167411
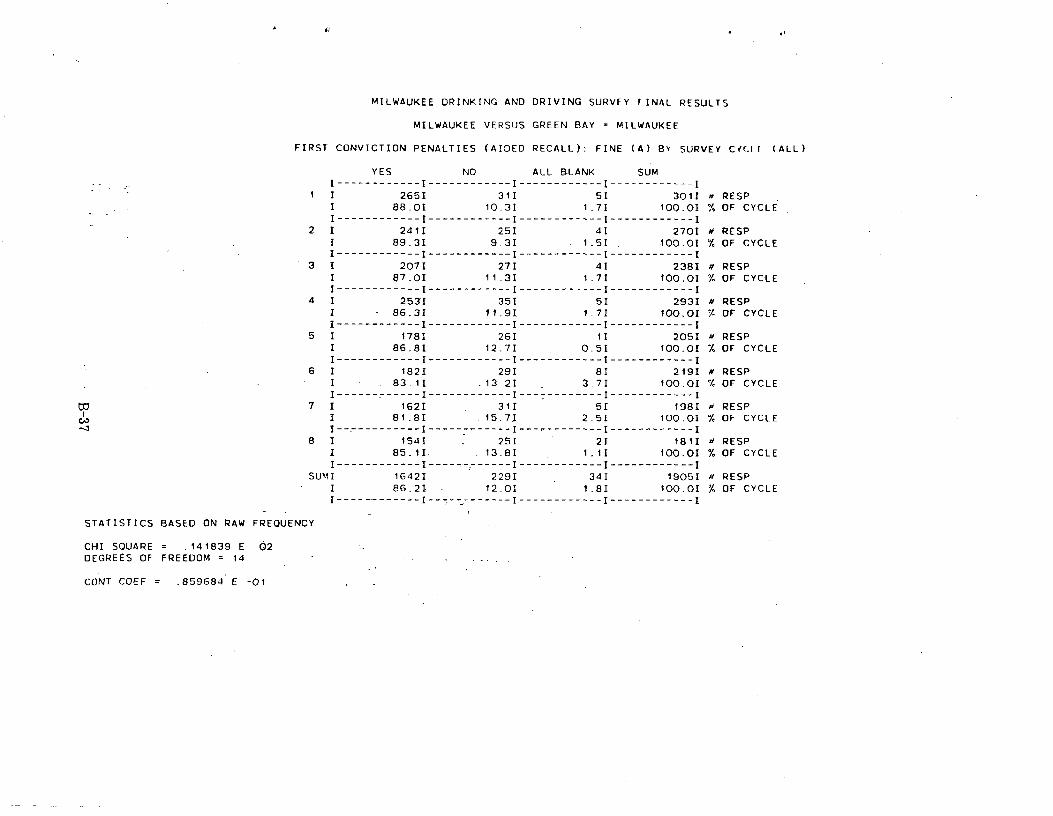
------------
MILWAUKEE DRINKING AND DRIVING SURVEY FINAL RESULTS
MILWAUKEE VERSUS GREEN BAY = MILWAUKEE
FIRST CONVICTION PENALTIES (AIDED RECALL): FINE (A) B' SURVEY CICIF (ALL)
YES NO ALL BLANK SUM I------------ I ------------ I ------------ I -
I I 2651 31I 51 3011 n RESP I 88.0I 10.31 1.7I 100.01 OF CYCLE I ------------ I ------------ I ------------ I ------------ I
2 I 2411 251 41 2701 a RESP I 89.31 9.31 1.51 100.01 % OF CYCLE I ------------ I ------------ I ------------ I ------------ I
3 I 2071 271 41 2381 # RESP I 87.01 11.31 1.71 100.01 % OF CYCLE I ------------ I ------------ I ------------ I ------------ I
4 I 2531 351 51 2931 a RESP I - 86.3I 11.91 1.71 100.01 OF CYCLE I ------------ I ------------ I ------------ I ------------ I
5 I 1781 26I 11 2051 RESP I 86.81 12.71 0.51 100.01 . OF CYCLE I ------------ I ------------ I ------------ I ------------ I
6 I 1821 291 81 2191 a RESP I 83.1I .13.21 3.71 100.01 % OF CYCLE I -- - - -I------------ I ----- -------- I ------------ I
7 I 1621 311 51 1981 si RESP I 81.81 15.71 2.51 100.01 % OF CYCLE I ------------ I ------------ I ------------ I ------------ I
8 I 1541 251 21 1811 u RESP I 85.11. 13.81 1.11 100.01 % OF CYCLE I ------------ I ------.------ I ------------ I ------------ I
SUMI 1642I 229I 34I 1905I u RESP I 86.21 12.01 1.81 100.01 % OF CYCLE I ------------ I------------- I ------------ I ------------ I
STATISTICS BASED ON RAW FREQUENCY
CHI SQUARE _ .141839 E 02 DEGREES OF FREEDOM = 14
CONT COEF = .859684 E -01
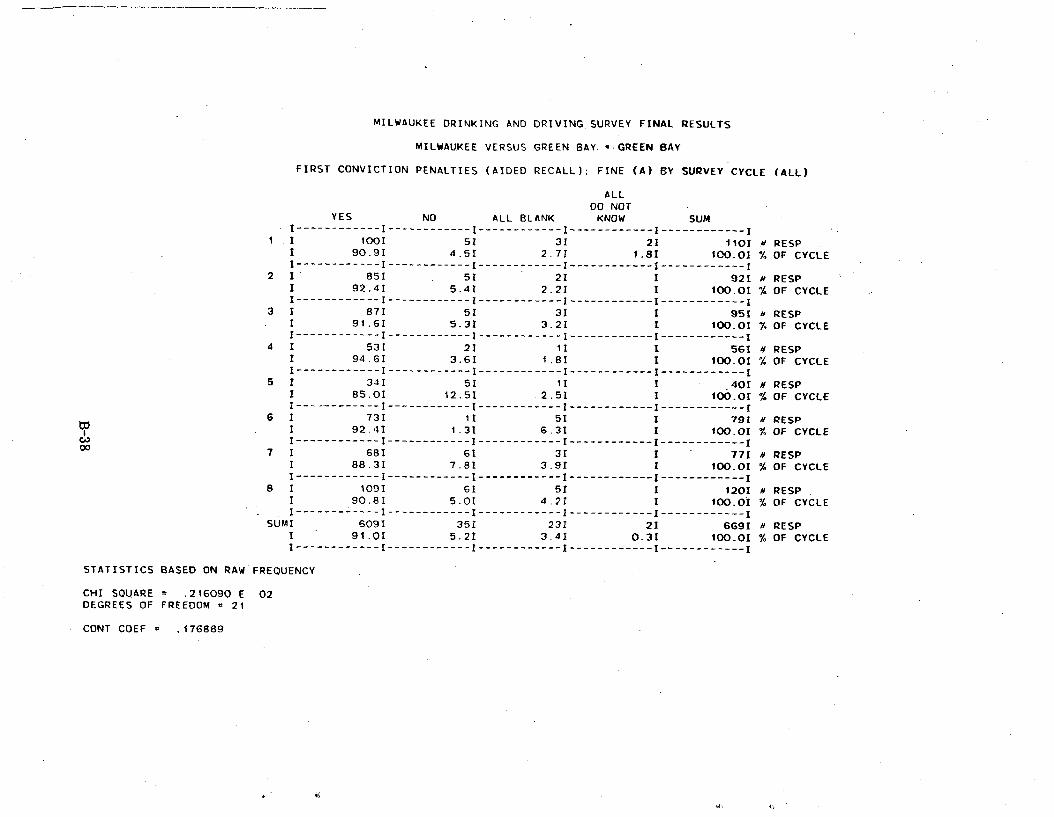
MILWAUKEE DRINKING AND DRIVING. SURVEY FINAL RESULTS
MILWAUKEE VERSUS GREEN BAY. = .GREEN BAY
FIRST CONVICTION PENALTIES (AIDED RECALL): FINE (A) BY SURVEY CYCLE (ALL)
ALL 00 NOT
YES NO ALL BLANK KNOW SUM f------------ I ------------ I ------------ I ------------ I ------------I
1 I 100I 51 31 21 1107 RESP I 90.91 4.51 2.71 1.81 100.01 % OF CYCLE I------------ I ------------ I ------------ I ------------ I ----------- I
2 I 851 51 21 1 921 a RESP I 92.41 5.41 2.21 I 100.01 % OF CYCLE I ------------ I ------------ I ------------ I ------------ I ------------ I
3 I 871 51 31 1 951 a RESP I 91.61 5.31 3.21 1 100.01 % OF CYCLE I ------------ I ------------ I ------------ I ------------ I ------------ I
4 1 531 21 11 1 561 H RESP I 94.61 3.61 1.81 1 100.01 % OF CYCLE I ------------ I ------------ I------------ I ------------ I------------ I
5 1 341 51 II I 401 N RESP I 85.01 12.51 2.5I I 100.01 % OF CYCLE I ------------ I ------------ I ------------ I ------------ I ------------ I
6 1 731 11 51 I 791 a RESPI 92.41 1.31 6.3I 1 100.0I % OF CYCLE I------------I------------I------------I------------I------------1
7 I 681 61 31 I 771 N RESP I 88.31 7.8I 3.91 1 100.01 % OF CYCLE I ------------ I ------------ I ------------ I ------------ I ------------ I
8 I 109I 61 51 I 1201 N RESP I 90.8I 5.01 4.21 I 100.01 % OF CYCLE I ------------ I ------------ I ------------ I ------------ I ------------ I
SUMI 609I 35I 23I 21 6691 x RESP 1 91.01 5.21 3.41 0.31 100.01 % OF CYCLE I ------------ I ------------ I ------------ I ------------ I ------------ I
G7
00
STATISTICS BASED ON RAW FREQUENCY
CHI SQUARE _ .216090 E 02DEGREES OF FREEDOM = 21
CONT COEF = .176889
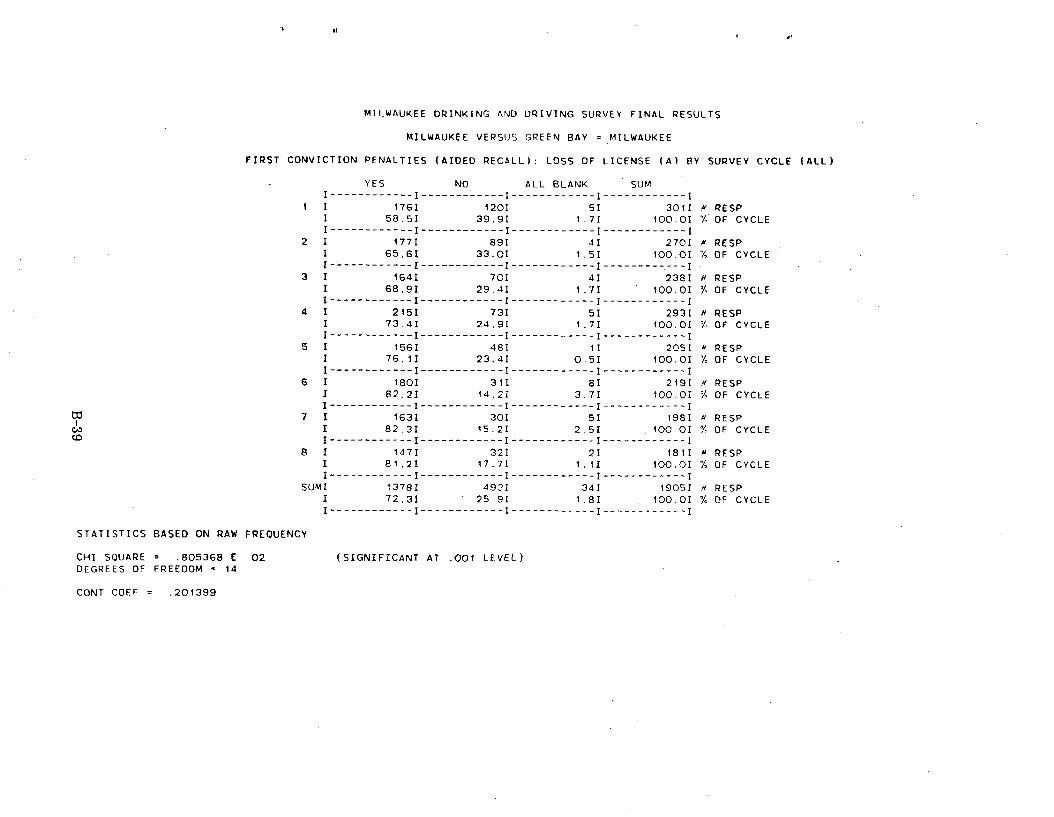
41
MILWAUKEE DRINKING AND DRIVING SURVEY FINAL RESULTS
MILWAUKEE VERSUS GREEN BAY = MILWAUKEE
FIRST CONVICTION PENALTIES (AIDED RECALL): LOSS OF LICENSE (A) BY SURVEY CYCLE (ALL)
YES NO ALL BLANK SUM I ------------ I ------------ I ------------ I ------------I
I I 17GI 1201 51 3011 a RESP I 58.51 39.91 1.71 100.01 % OF CYCLE I------------ I ------------ I ------------ I ------------ I
2 I 1771 891 41 2701 a RESP I 65.62 33.01 1.5I 100.01 % OF CYCLE I------------ I ------------ I ------------ I ------------I
3 I 1641 701 41 2381 a RESP I 68.91 29.41 1.71 100.01 OF CYCLE I ------------ I ------------ I ------------ I ------------ I
4 I 215I 731 51 2931 a RESP I 73.41 24.91 1.71 100.01 Y OF CYCLE I ------------ I ------------ I ------------ I ------------ I
5 1 1561 481 11 2051_d RESP I 76.11 23.4I 0.51 100.01 Y OF CYCLE I ------------ I ------------ I ------------ I ------------ I
6 I 1801 311 81 2191 RESP 1 82.2I 14.21 3.7I 100.01 % OF CYCLE I ------------ I ------------ I ------------ I ------------ I
7 1 1631 301 51 1981 d RESP I 82.31 15.21 2.51 100.0I % OF CYCLE I ------------ I ------------ I ------------ I ------------ I
8 I 1471 321 21 181I N RESP I 81.21 17.7I 1.11 100.01 % OF CYCLE I ------------ I ------------ I ------------ I ------------ I
SUMI 1378I 493I 34I 1905I RESP I 72.31 25.91 1.81 100.01 % OF CYCLE I ------------ I ------------ I ------------ I ------------ I
STATISTICS BASED ON RAW FREQUENCY
CHI SQUARE = .805368 E 02 (SIGNIFICANT AT .001 LEVEL) DEGREES OF FREEDOM = 14
CONT COEF = .201399
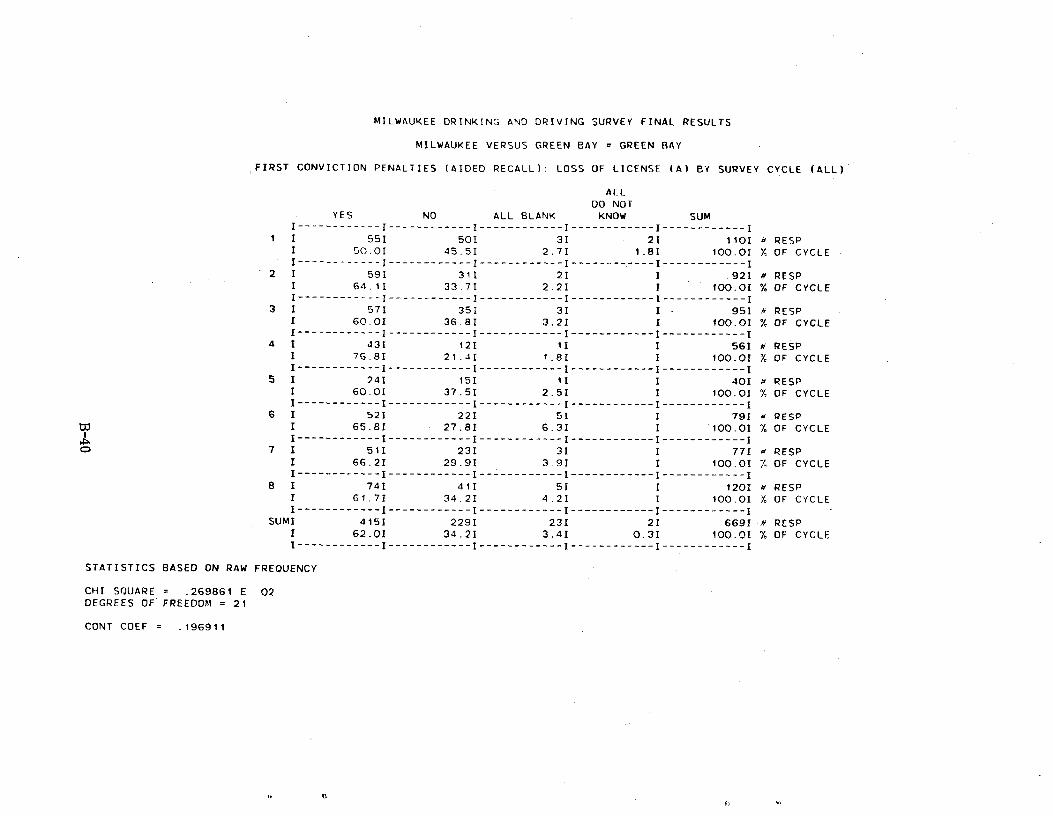
MILWAUKEE DRINKING AND DRIVING SURVEY FINAL RESULTS
MILWAUKEE VERSUS GREEN BAY = GREEN BAY
FIRST CONVICTION PENALTIES (AIDED RECALL): LOSS OF LICENSE (A) BY SURVEY CYCLE (ALL)
ALL DO NOT
YES NO ALL BLANK KNOW SUM I------------ I ------------ I ------------ I ------------ I ------------ I
1 I 551 501 31 21 110I b RESP I 50.01 45.5I 2.71 1.81 100.01 X OF CYCLE I------------ I ------------ I ------------ I ------------ I ------------ I
2 1 591 311 21 I 921 # RESP I 64.11 33.71 2.21 1 100.0I % OF CYCLE I------------ I ------------ I ------------ I ------------ I------------ I
3 1 571 351 31 I 951 RESP 1 60.0I 36.81 3.21 1 100.01 % OF CYCLE I------------ I ------------ I ------------ I ------------ I------------I
4 I 431 121 II I 561 # RESP I 76.8I 21.41 1.81 1 100.01 % OF CYCLE I------------ I ------------ I ------------ I ------------ I------------ I
5 1 241 151 1I I 401 RESP I 60.OI 37.51 2.51 1 100.01 7, OF CYCLE I------------ I ------------ I ------------ I ------------ I ------------ I
6 I 521 221 51 I 791 d RESP I 65.81 27.81 6.31 I 100.01 % OF CYCLE I------------ I ------------ I ------------ I ------------ I ------------ I
7 I 511 231 31 1 771 a RESP I 66.2I 29.91 3.91 1 100.0I 7 OF CYCLE I ------------ I ------------ I ------------ I ------------ I ------------ I
8 I 741 411 51 1 1201 a RESP 1 61,71 34.21 4.2I I 100.01 % OF CYCLE I ------------ I ------------ I ------------ I ------------ I ------------ I
SUMI 4151 2291 231 21 669I-a RESP I 62.0I 34.21 3.41 0.31 100.01 % OF CYCLE I ------------ I ------------ I ------------ I ------------ I ------------ I
STATISTICS BASED ON RAW FREQUENCY
CHI SQUARE = .269861 E 02 DEGREES OF FREEDOM = 21
CONT COEF = .196911
u
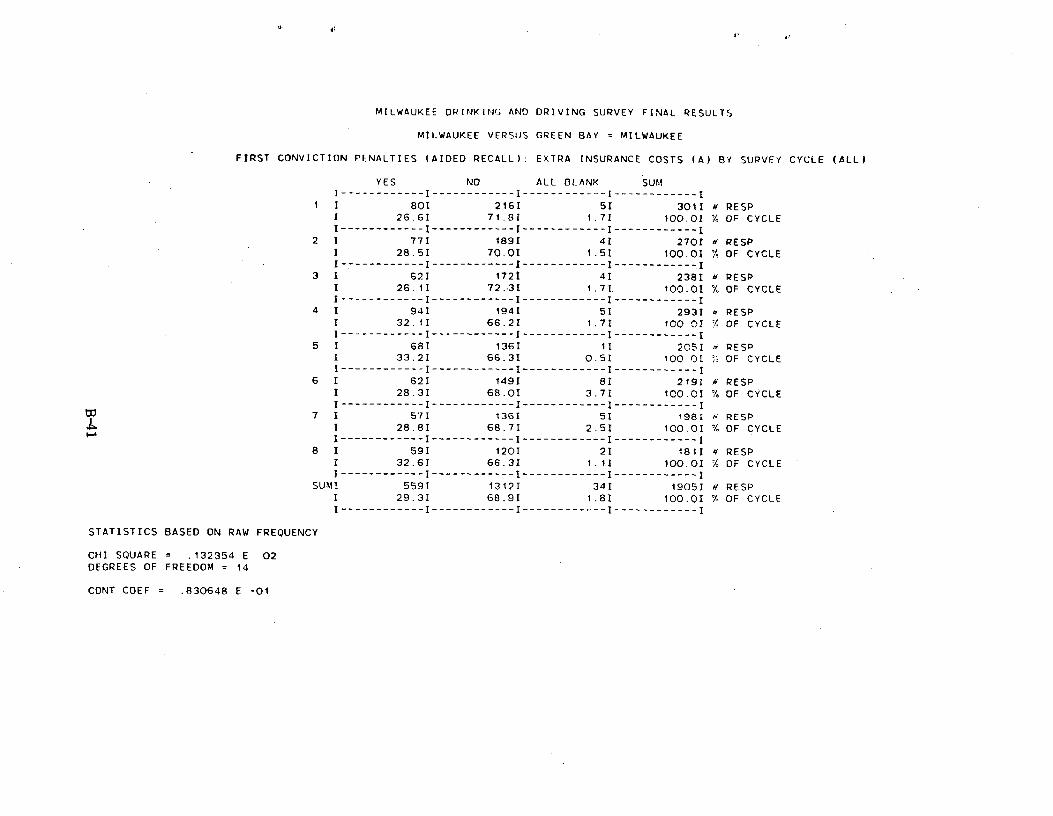
b
MILWAUKEE DRINKING AND DRIVING SURVEY FINAL RESULTS
MILWAUKEE VERSUS GREEN BAY = MILWAUKEE
FIRST CONVICTION PENALTIES (AIDED RECALL): EXTRA INSURANCE COSTS (A) BY SURVEY CYCLE (ALL)
YES NO ALL BLANK SUM I------------ I ------------ I ------------ I ------------I
1 I 80I 2161 51 3011 a RESP 26.6I 71.81 1.71 100.01 ''A OF CYCLE
I------------ I ------------ I ------------ I ------------ I 2 I 771 1891 41 2701 a RESP
I 28.51 70.01 1.51 100.01 "/• OF CYCLE I ------------ I ------------ I ------------ I ------------.I
3 I 621 1721 41 2381 N RESP I 26.11 72.31 1.71. 100.01 % OF CYCLE I ------------ I ------------ I ------------ I ------------ I
4 I 941 1941 51 2931 PESP 1 32.11 66.21 1.71 100.0I OF CYCLE I ------------ I ------------ I ------------ I ------------ I
5 1 68I 1361 11 205I RESP I 33.21 66.31 0.51 100.01 OF CYCLE I ------------ I ------------ I ------------ I ------------ I
6 1 621 1491 81 2191 a RESP I 28.31 68.01 3.71 1C0.0I OF CYCLE I------------ I ------------ I ------------ I ------------ I
7 I 571 1361 51 1981 n RESP I 28.81 68.71 2.51 100.0I '4 OF CYCLE I------------ I ------------ I ------------ I ------------ I
8 I 591 1201 21 1811 RESP I 32.61 66.31 1.1I 100.01 % OF CYCLE I ------------ I ------------ I ------------ I ------------ I
SUMI 559I 1312I 34I 1905I a RESP I 29.31 68.91 1.81 100.0I % OF CYCLE I------------ I ------------ I ------------ I ------------ I
STATISTICS BASED ON RAW FREQUENCY
CHI SQUARE = .132354 E 02 DEGREES OF FREEDOM = 14
CONT COEF = .830648 E -01
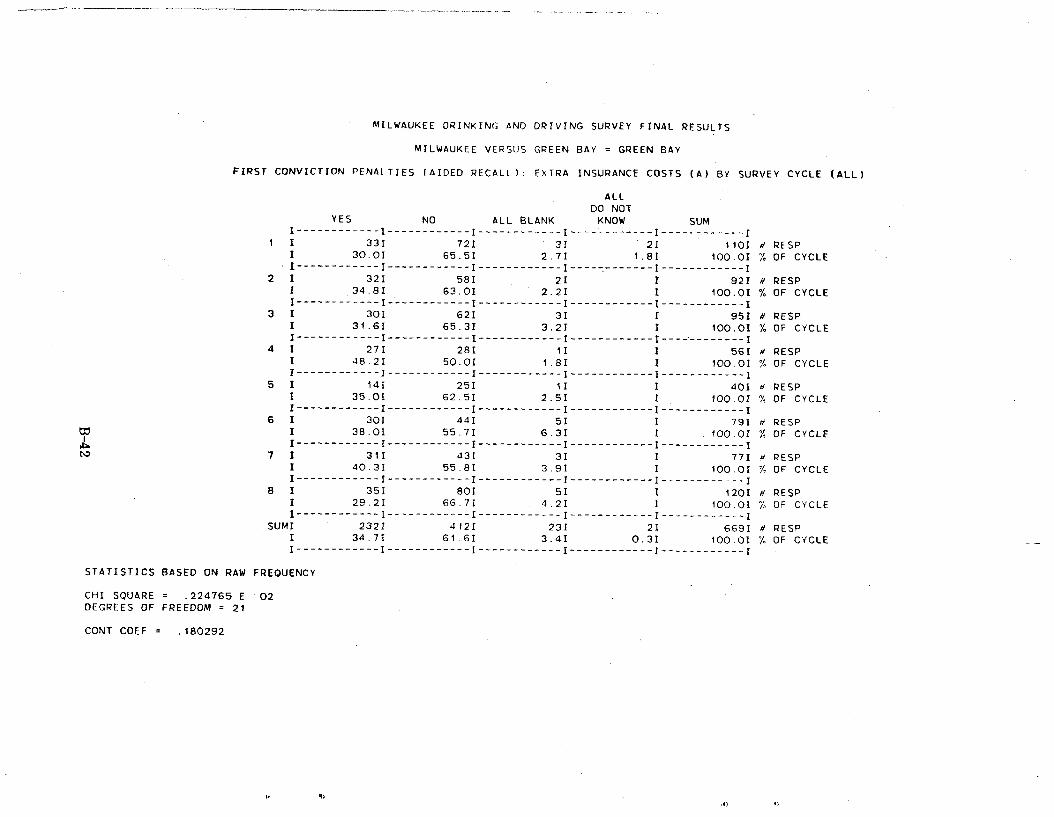
MILWAUKEE DRINKING AND DRIVING SURVEY FINAL RESULTS
MILWAUKEE VERSUS GREEN BAY = GREEN BAY
FIRST CONVICTION PENALTIES (AIDED RECALL): EXTRA INSURANCE COSTS (A) BY SURVEY CYCLE (ALL)
ALL DO NOT
YES NO ALL BLANK KNOW SUM I------------ I ------------ I ------------ I ------------ I ------------I
1 1 331 721 3I 2I 1101 a RESP I 30.01 65.5I 2.71 1.8I 100.01 % OF CYCLE I,------------ I ------------ I ------------ I ------------ I------------ I
2 I 321 581 21 I 921 # PESP 1 34.81 63.01 2.2I I 100.01 % OF CYCLE I ------------ I ------------ I ------------ I ----------I------------I
3 I 301 621 31 1 951 # RESP I 31.61 65.31 3.21 I 100.01 % OF CYCLE I ------------ I ------------ I ------------ I ------------ I -----------I
4 1 271 281 11 I 561 a RESP I 48.21 50.01 1.81 I 100.01 % OF CYCLE I ------------ I ------------ I ------------ I ------------ I ------------- I
5 I 141 251 11 I 401 PESP I 35.01 62.51 2.51 I 100.01 % OF CYCLE I ------------ I ------------ I ------------ I ------------ I ------------ I
6 I 301 441 51 I 791 # RESP I 38.01 55.7I 6.31 1 100.01 % OF CYCLE I ------------ I ------------ I ------------- I ------------ I ------------ I
7 I 311 431 31 I 771 p RESP I 40.31 55.81 3.91 1 100.01 % OF CYCLE I------------ I ------------ I ------------ I ------------ I ------------ I
8 I 351 801 51 1 1201 N PESP I 29.21 66.7I 4.21 I 100.01 % OF CYCLE I------------ I ------------ I ------------ I ------------ I ------------ I
SUMI 232I 4121 23I 21 6691 a RESP 1 34.71 61.6I 3.41 0.31 100.01 % OF CYCLE I ------------ I ------------ I ------------ I ------------ I ------------ I
STATISTICS BASED ON RAW FREQUENCY
CHI SQUARE = .224765 E 02 DEGREES OF FREEDOM = 21
CONT COEF = .180292
vo .q n
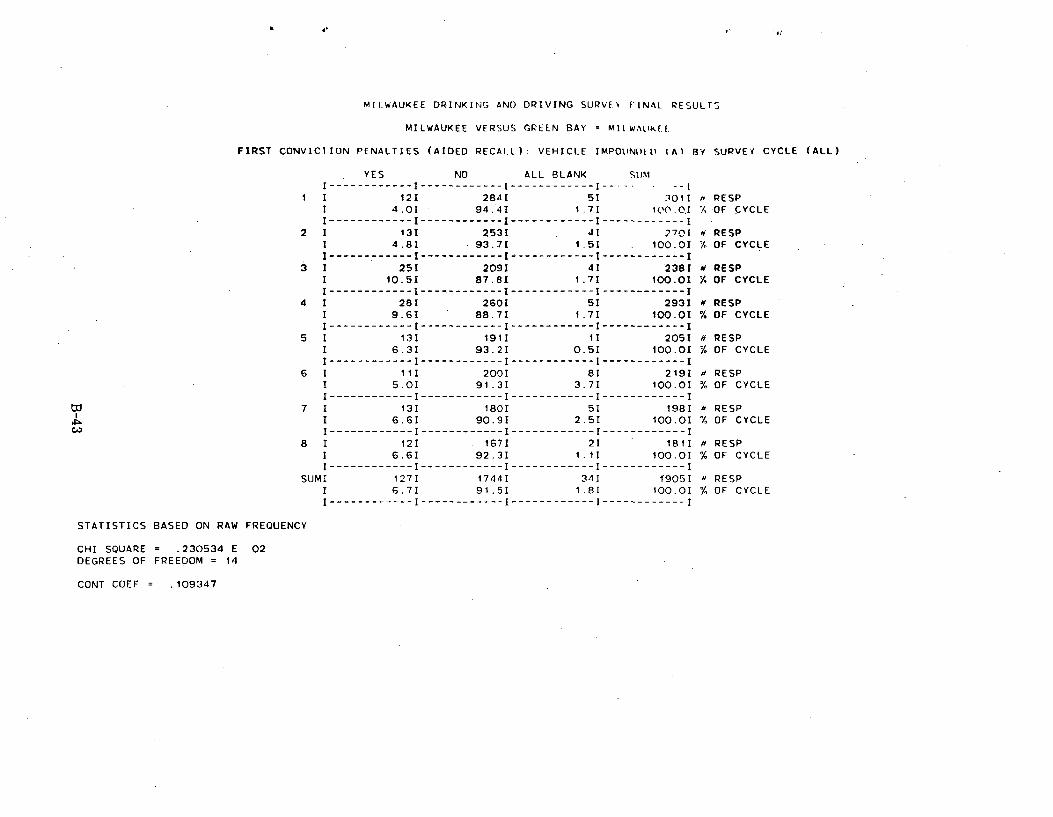
MILWAUKEE DRINKING AND DRIVING SURVFN FINAL RESULT,
MILWAUKEE VERSUS GREEN BAY = MIIWAIjKF.L
FIRST CONVICTION PENALTIES (AIDED RECALL): VEHICLE IMPOUNDtU (Al BY SURVEY CYCLE (ALL)
YES NO ALL BLANK CUM I------------ I ------------ I ------------I I
1 1 121 2841 51 3011 a RESP I 4.01 94.41 1.71 100.0.1 OF CYCLE I ------------ I ------------ I ------------ I ------------ I
2 1 131 2531 41 7701 RESP I 4.81 93.71 1.51 100.01 % OF CYCLE I ------------ I ------------ I ------------ I ------------ I
3 1 251 2091 41 2381 # RESP I 10.51 87.81 1.71 100.01 % OF CYCLE I ------------ I ------------ I ------------ I ------------ I:
4 I 281 2601 51 2931 a RESP I 9.61 88.71 1.71 100.01 % OF CYCLE I------------ I ------------ I ------------ I ------------ I
5 I 131 1911 11 2051 s RESP I 6.31 93.21 0.51 100.01 OF CYCLE I ------------ I ------------ I ------------ I ------------ I
6 I 111 2001 81 219I RESP I 5.01 91.31 3.71 100.01 % OF CYCLE I ------------ I ------------ I ------------ I ------------ I
7 I 131 1801 51 1981 RESP 1 6.61 90.91 2.51 100.01 % OF CYCLE I ------------ I ------------ I ------------ I ------------ I
8 I 121 1671 21 1811 a RESP I 6.61 92.31 1.11 100.01 % OF CYCLE I ------------ I ------------ I ------------ I ------------ I
SUMI 1271 17441 341 19051 a RESP I 6.71 91.51 1.81 100.01 % OF CYCLE I ------------ I ------------ I ------------ I ------------ I
STATISTICS BASED ON RAW FREQUENCY
CHI SQUARE = .230534 E 02 DEGREES OF FREEDOM = 14
CONT COEF = .109347
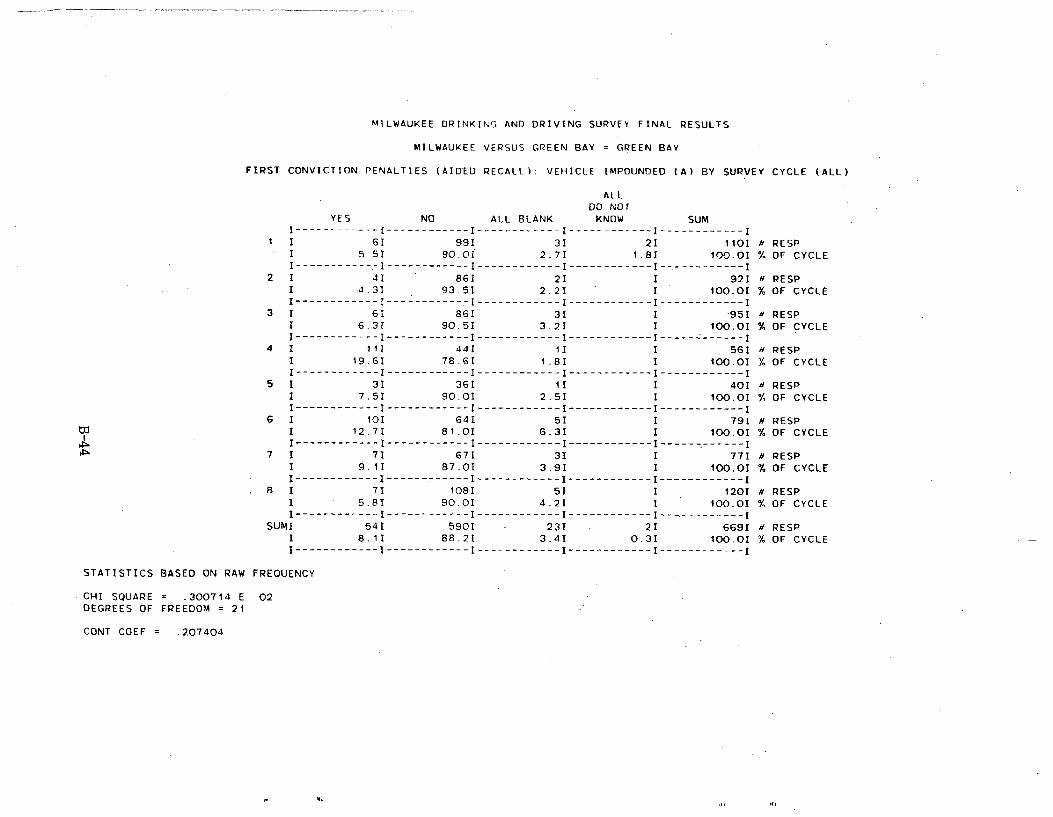
MILWAUKEE DRINKING AND DRIVING SURVEY FINAL RESULTS
MILWAUKEE VERSUS GREEN BAY = GREEN BAY
FIRST CONVICTION PENALTIES (AIDED RECALL): VEHICLE IMPOUNDED (A) BY SURVEY CYCLE (ALL)
ALL DO NOT
YES NO ALL BLANK KNOW SUM I------------ I ------------ I ------------ I ------------ I ------------ I
1 1 61 991 31 21 1101 a RESP I 5 51 90.OI 2.71 1.81 100.01 % OF CYCLE 1----------- I------------I------------I------------I------------I
2 1 41 861 21 1 921 a RESP I 4.31 93.51 2.21 I 100.01 % OF CYCLE I ------------ I -----------I------------I------------I------------I
3 I 61 861 31 1 -951 u RESP I 6.31 90.51 3.21 I 100.01 % OF CYCLE I------------ I ------------ I ------------ I ------------ I -----------I
4 I 111 441 11 I 561 4 RESP .1 19.6I 78.61 1.81 I 100.0I Y. OF CYCLE I ------------ I ------------ I ------------ I ------------ I ------------ I
5 I 31 361 11 I 401 u RESP I 7.51 90,01 2.51 1 100.01 % OF CYCLE I ------------ I ------------ I ------------ I ------------ I ------------ I
6 I 101 64I 51 1 791 # RESP I 12.71 81.01 6.31 I 100.01 % OF CYCLE I ------------ I ------------ I ------------ I ------------ I ------.------ I
7 I 71 671 31 I 771 N RESP I 9.11 87.01 3.9I I 100.0I % OF CYCLE I ------------ I ------------ I ------------ I ------------ I ------------ I
8 I 71 1081 51 I 1201 a RESP I 5.81 90.01 4.2I 1 100.0I % OF CYCLE I ------------ I ------------ I ------------ I ------------ I ------------ I
SUMI 541 5901 231 21 6691 d RESP I 8.11 88.21 3.41 0.31 100.01 % OF CYCLE I ------------ I ------------ I ------------ I ------------ I ------------ I
STATISTICS BASED ON RAW FREQUENCY
CHI SQUARE = .300714 E 02 DEGREES OF FREEDOM = 21
CONT COEF = .207404
,t, a^
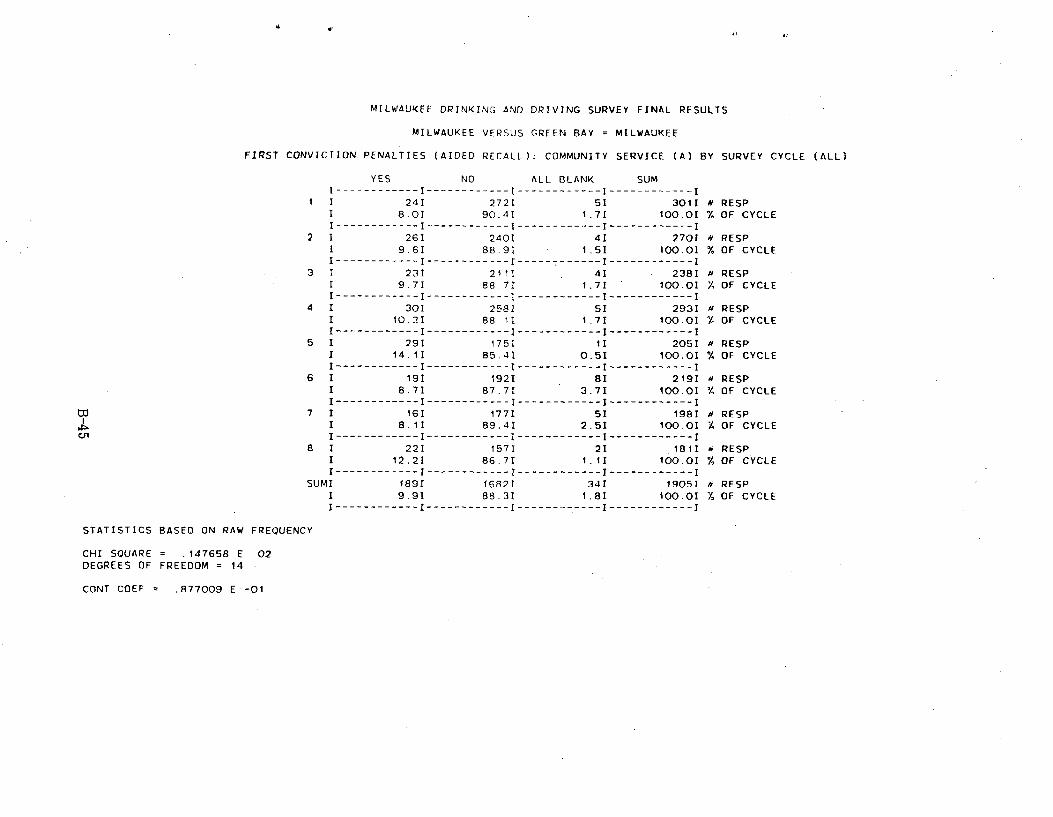
MILWAUKEE DRINKING AND DRIVING SURVEY FINAL RESULTS
MILWAUKEE VERSUS GREEN BAY = MILWAUKEE
FIRST CONVICTION PENALTIES (AIDED RECALL): COMMUNITY SERVICE (A) BY SURVEY CYCLE (ALL)
YES NO ALL BLANK SUM I ------------ I ------------ I ------------ I ------------ I
1 I 241 2721 51 3011 a RESP I 8.01 90.41 1.71 100.01 % OF CYCLE I------------ I ------------ I ------------ I ------------ I
2 I 26I 2401 41 2701 a RESP I 9.61 88.91 1.51 100.01 % OF CYCLE I ------------ I ------------ I ------------ I ------------ I
3 T 231 211I 41 2381 a RESP I 9.71 88.71 1.71 100.01 % OF CYCLE I ------------ I ------------ I ------------ I ------------ I
4 1 301 2581 51 2931 a RESP I 10.21 88.11 1.71 100.01 % OF CYCLE I------------ I ------------ I ------------ I ------------ I
5 I 291 1751 11 2051 a RESP I 14.1I 85.41 0.51 100.01 % OF CYCLE I ------------ I ------------ I ------------ I ------------ I
6 I 191 1921 81 2191 a RESP I 8.71 87.71 3.71 100.01 OF CYCLE I ------------ I ------------ I ------------ I ------------ I
7 I 16I 1771 51 1981 a RESP I 8.11 89.41 2.51 100.01 7 OF CYCLE I ------------ I ------------ I ------------ I ------------ I
8 I 221 1571 21 181I 4 RESP I 12.21 86.71 1.11 100.01 % OF CYCLE I ------------ I ------------ I ------------ I ------------ I
SUMI 189I 1682I 34I 1905I a RESP I 9.91 88.31 1.81 100.01 % OF CYCLE I ------------ I ------------ I ------------ I -----------I
STATISTICS BASED ON RAW FREQUENCY
CHI SQUARE = .147658 E 02 DEGREES OF FREEDOM = 14
CONT COEF = .877009 E -01
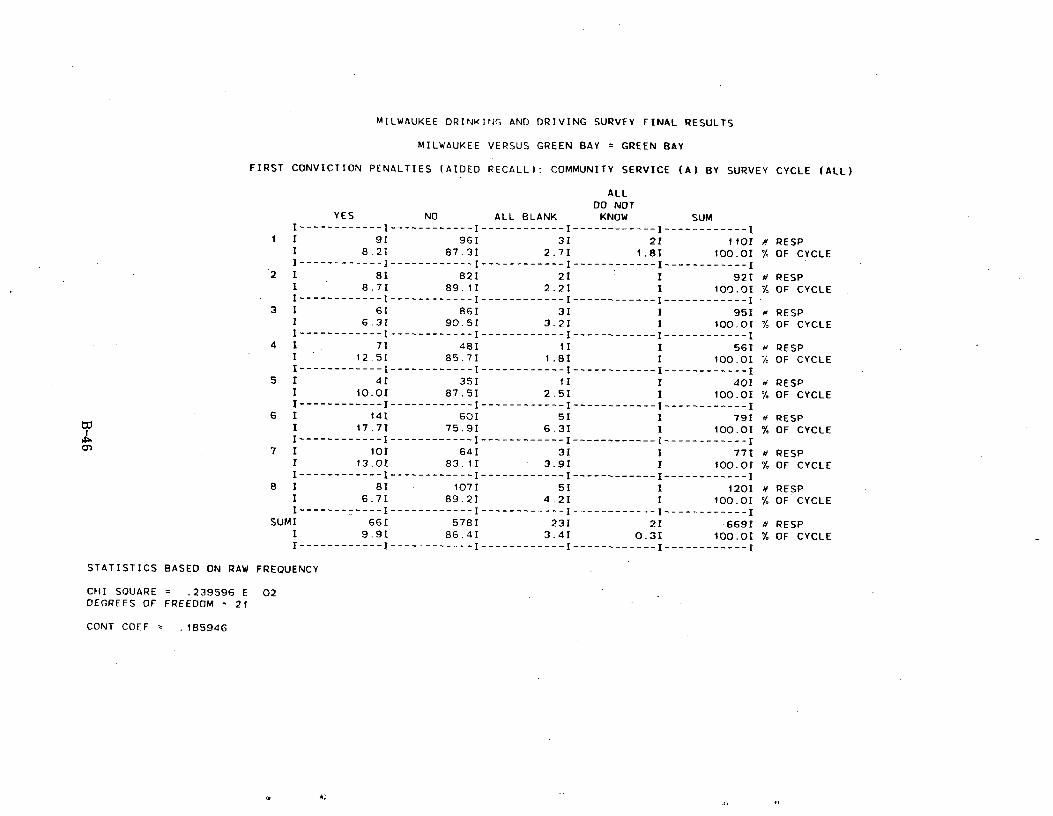
MILWAUKEE DRINKING AND DRIVING SURVEY FINAL RESULTS
MILWAUKEE VERSUS GREEN BAY = GREEN BAY
FIRST CONVICTION. PENALTIES (AIDED RECALL): COMMUNITY SERVICE (A) BY SURVEY CYCLE (ALL)
ALL DO NOT
YES NO ALL BLANK KNOW SUM I ------------ I ------------ I ------------ I ------------ I ------------I
1 I 91 961 31 21 1101 a RESP I 8.21 87.31 2.71 1.81 100.0I % OF CYCLE I ------------ I ------------ I ------------ I ------------ I ------------ I
2 I 81 821 21 I 921 a RESP I 8.71 89.11 2.21 I 100.01 % OF CYCLE I------------ I ------------ I ------------ I ------------ I ------------ I
3 I 61 861 31 I 951 RESP 1 6.31 90.51 3.21 I 100.0I % OF CYCLE I ------------ I ------------ I ------------ I ------------ I------------ I
4 I 71 481 II I 561 RESP I 12.5I 85.71 1.81 I 100.0I 7 OF CYCLE I------------ I ------------ I ------------ I ------------ I------------ I
5 1 41 351 11 I 401 p RESP I 10.0I 87.51 2.51 I 100.01 % OF CYCLE I------------ I ------------ I ------------ I ------------ I ------------ I
6 1 141 601 51 1 791 a RESP W
rn
I 17.71 75.91 6.3I I 100.01 % OF CYCLE I------------ I ------------ I ------------ I ------------ I ------------ I
7 I 101 641 31 1 771 a RESP 1 13.0I 83.11 3.91 1 100.01 % OF CYCLE I ------------ I ------------ I ------------ I ------------ I------------ I
8 I 81 1071 51 I 1201 H RESP I 6.71 89.21 4.21 I 100.01 % OF CYCLE I------------ I ------------ I ------------ I ------------ I ------------ I
SUMI 661 578I 23I 2I 6691 a RESP 1 9.91 86.4I 3.41 0.3I 100.01 % OF CYCLE I ------------ I ------------ I ------------ I ------------ I ------------ I
STATISTICS BASED ON RAW FREQUENCY
CHI SQUARE = .239596 E 02DEGREES OF FREEDOM = 21
CONT COEF = .185946

4
MILWAUKEE DRINKING AND DRIVING SURVEY FINAL RESULTS
MILWAUKEE VERSUS GREEN BAY = MILWAUKEE
FIRST CONVICTION PENALTIES (AIDED RECALL) COUNSELING/TREATMENT (A) BY SURVEY CYCLE (ALL)
YES NO ALL BLANK SUM I------------ I ------------ I ------------ I ------------ I
1 I 891 2071 51 301I RESP I 29.61 68.81 1.71 100.0I '1, OF CYCLE I ------------ I ------------ I ------------ I ------------ I
2 I 841 1821 41 2701 RESP I 31.11 67.41 1.51 100.01 % OF CYCLE I ------------ I ------------ I ------------ I ------------ I
3 I 821 1521 41 2381 a RESP I 34.51 63.91 1,71 100.01 % OF CYCLE I ------------ I ------------ I ------------ I ------------ I
4 I 1091 1791 51 2931 a RESP I 37.21 61.1I 1.71 100.01 % OF CYCLE I ------------ I ------------ I ------------ I ------------ I
5 1 711 1331 11 2051 RESP I 34.61 64.91 0.51 100.01 OF CYCLE I ------------ I ------------ I ------------ I ------------ I
6 I 751 136I 81 2191 RESP I 34.21 62.11 3.71 100.01 '. OF CYCLE I ------------ I ------------ I ------------ I -----------I
7 I 651 1281 51 1981 -y RESP I 32.81 64.61 2.51 100.0I % OF CYCLE I------------ I ------------ I ------------ I ------------ I
8 I 751 1041 21 1811 y RESP I 41.41 57.51 1.11 100.0I % OF CYCLE I ------------ I ------------ I ------------ I ------------ I
SUMI 6501 12211 341 19051 a RESP I 34.11 64.11 1.81 100.0I % OF CYCLE I ------------ I ------------ I ------------ I ------------ I
STATISTICS BASED ON RAW FREQUENCY
CHI SQUARE = .171135 E 02 DEGREES OF FREEDOM = 14
CONT COEF = .943582 E -01
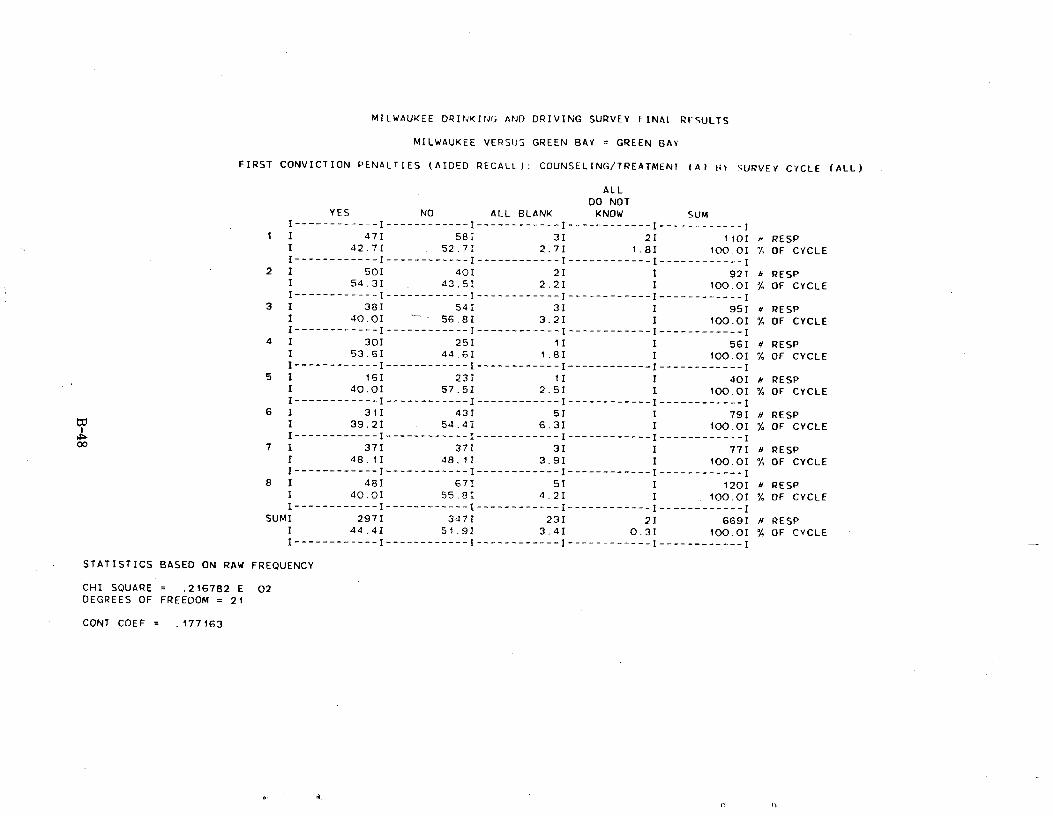
MILWAUKEE DRINKING AND DRIVING SURVEY FINAL RFSULTS
MILWAUKEE VERSUS GREEN BAY = GREEN BAY
FIRST CONVICTION PENALTIES (AIDED RECALL): COUNSELING/TREATMENT 1A) t:t SURVEY CYCLE (ALL)
ALL DO NOT
YES NO ALL BLANK KNOW SUM 1------------I------------I------------I------------I------------I
1 I 471 581 31 21 1101 = RESP I 42.71 52.71 2.71 1.81 100.01 7. OF CYCLE I------------ I ------------ I ------------ I ------------ I ------------ I
2 1 501 401 21 I 921 RESP I 54.31 43.51 2.21 I 100.0I OF CYCLE I------------I------------I------------I------------I------------1
3 1 381 541 31 1 951 a RESP 1 40.01 56.81 3.21 1 100.0I % OF CYCLE I------------ I ------------ I ------------ I ------------ I ------------ I
4 I 301 251 11 I 561 H RESP I 53.6I 44.81 1.81 I 100.01 % OF CYCLE I ------------ I ------------ I ------------ I ------------ I ------------ I
5 1 16I 231 11 1 401 a RESP 1 40.01 57.51 2.51 1 100.01 % OF CYCLE I ------------ I ------------ I ------------ I ------------ I ------------ I
6 I 311 431 51 I 791 # RESP I 39.21 54.41 6.31 I 100.0I % OF CYCLE
rP I------------I------------I------------I------------I------------1 00 7 I 371 371 31 I 771 u RESP
I 48.11 48,11 3.9I I 100.01 % OF CYCLE I ------------ I ------------ I ------------ I ------------ I ------------ I
8 I 481 671 51 I 1201 a RESP I 40.01 55.81 4.21 I . 100.01 % OF CYCLE I ------------ I ------------ I ------------ I ------------ I ------------ I
SUMI 297I 3471 23I 21 669I # RESP I 44.41 51.91 3.4I 0.31 100.0I % OF CYCLE I ------------ I ------------ I ------------ I ------------ I ------------ I
STATISTICS BASED ON RAW FREQUENCY
CHI SQUARE = .216782 E 02DEGREES OF FREEDOM = 21
CONT COEF = .177163
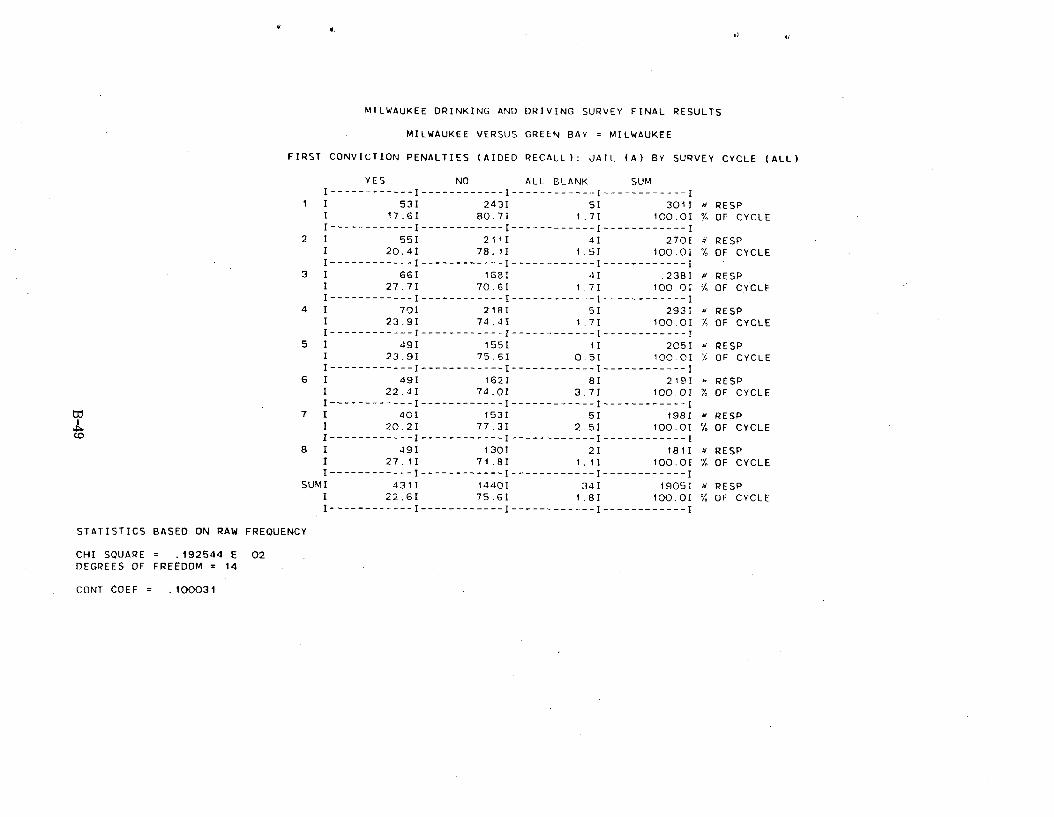
ei Y,
MILWAUKEE DRINKING AND DRIVING SURVEY FINAL RESULTS
MILWAUKEE VERSUS GREEN BAY = MILWAUKEE
FIRST CONVICTION PENALTIES (AIDED RECALL): JAIL (A) BY SURVEY CYCLE (ALL)
YES NO ALL BLANK SUM I------------ I ------------ I ------------ I ------------I
1 I 53I 2431 51 3011 RESP I 17.51 80.7I 1.71 100.0I % OF CYCLE I------------ I ------------ I ------------ I ------------ I
2 I 551 2111 41 2701 RESP I 20.41 78.11 1.51 100.01 ! OF CYCLE I ------------ I ------------ I ------------ I ------------ I
3 I 66I 1681 41 2381 PESP I 27.7I 70.61 1.71 100.01 OF CYCLE I ------------ I ------------ I ------------ I ------------ I
4 I 701 2181 51 2931 r" RESP I 23.91 74.41 1.71 100.01 1. OF CYCLE I------------I------------I------------I------------1
5 I 491 1551 11 2051 RESP 1 23.91 75.51 0.51 10C.0I OF CYCLE I ------------ I ------------ I ------------ I ------------ I
6 I 491 1621 81 2191 h RESP 1 22.41 74.01 3.71 100.01 Y. OF CYCLE I ------------ I ------------ I ------------ I ------------ I
7 1 401 1531 51 1981 d RESP I 20.21 77.31 2.51 100.01 % OF CYCLE I ------------ I ------------ I ------------ I ------------ I
8 I 491 1301 21 1811 .a RESP I 27.11 71.81 1.11 100.01 % OF CYCLE I ------------ I ------------ I ------------ I ------------ I
SUMI 4311 1440I 34I 1905I a RESP I 22.51 75.61 1.8I 100.01 % OF CYCLE I ------------ I ------------ I ------------ I ------------ I
STATISTICS BASED ON RAW FREQUENCY
CHI SQUARE = .192544 E 02 DEGREES OF FREEDOM = 14
CONT COEF = .100031
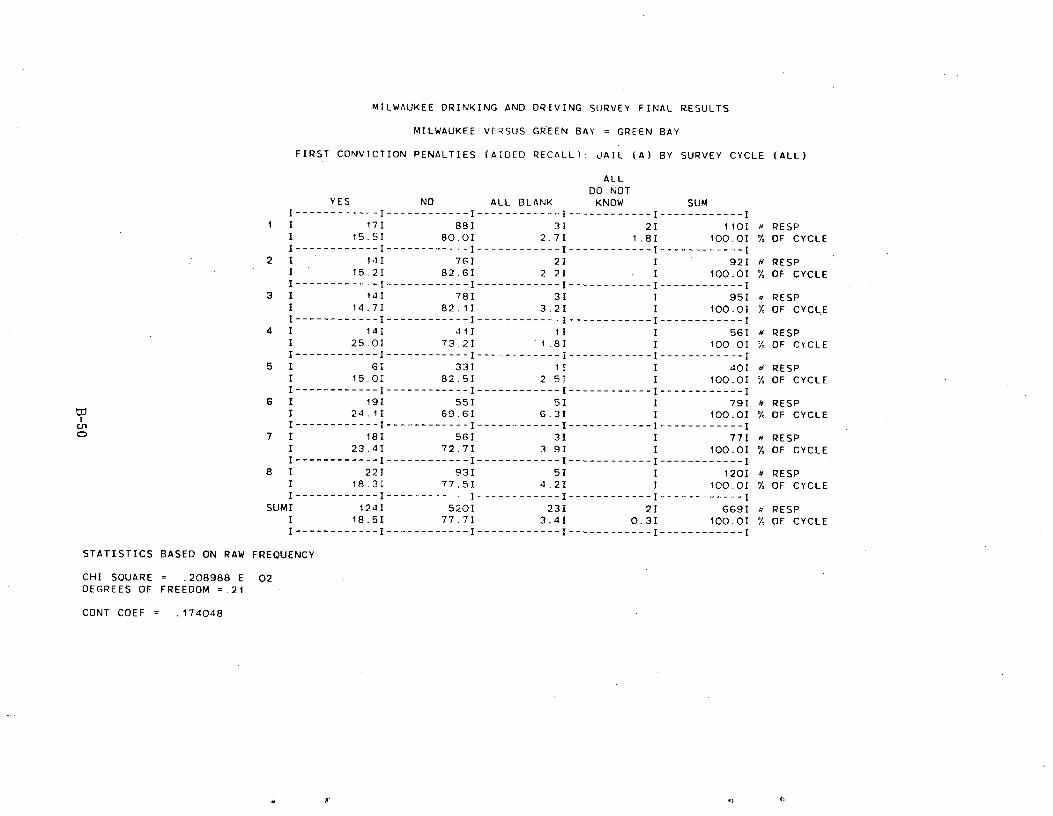
MILWAUKEE DRINKING AND DRIVING SURVEY FINAL RESULTS
MILWAUKEE VERSUS GREEN BAY = GREEN BAY
FIRST CONVICTION PENALTIES (AIDED RECALL): JAIL (A) BY SURVEY CYCLE (ALL)
ALL DO NOT
YES NO ALL BLANK KNOW SUM I------------ I ------------ I ------------ I ------------ I ------------ I
1 I 17I 88I 31 2I 1101 a RESP I 15.5I 80.0I 2.7I 1.81 100.01 % OF CYCLE I------------ I ------------ I ------------ I ------------ I ------------ I
2 I 14I 761 21 I 921 N RESP I 15.2I 82.6I 2.21 I 100.01 % OF CYCLE I ------------ I ------------ I ------------ I ------------ I ------------ I
3 I 14I 781 31 I 95I RESP I 14.71 82.11 3.21 I 100.0I % OF CYCLE I------------ I ------------ I ------------ I ------------ I ------------ I
4 I 141 411 11 I 56I N RESP I 25.01 73.21 1.81 1 100.0I OF CYCLE I ------------ I ------------ I ------------ I ------------ I ------------ I
5 I 6I 331 II I 401 RESP 1 15.0I 82.51 2.51 I 100.Oi % OF CYCLE I ------------ I ------------ I ------------ I ------------ I ------------ I
6 I 191 551 51 I 791 a RESP 1 24.11 69.6I 6.3I I 100.0I % OF CYCLE I ------------ I ------------ I ------------- I ------------ I ------------ I
7 I 181 561 31 I 771 a RESP I 23.41 72.71 3.91 I 100.01 % OF CYCLE I ------------ I ------------ I ------------ I ------------ I ------------ I
8 I 221 931 51 I 1201 N RESP I 18,31 77.51 4.21 I 100.01 % OF CYCLE I ------------ I ------------ I ------------ I ------------ I ------------ I
SUMI 124I 520I 23I 2I 6691 a RESP I 18.51 77.71 3.41 0.31 100.01 % OF CYCLE I------------ I ------------ I ------------ I ------------ I ------------ I
STATISTICS BASED ON RAW FREQUENCY
CHI SQUARE = .208988 E 02 DEGREES OF FREEDOM =.21
CONT COEF = .174048
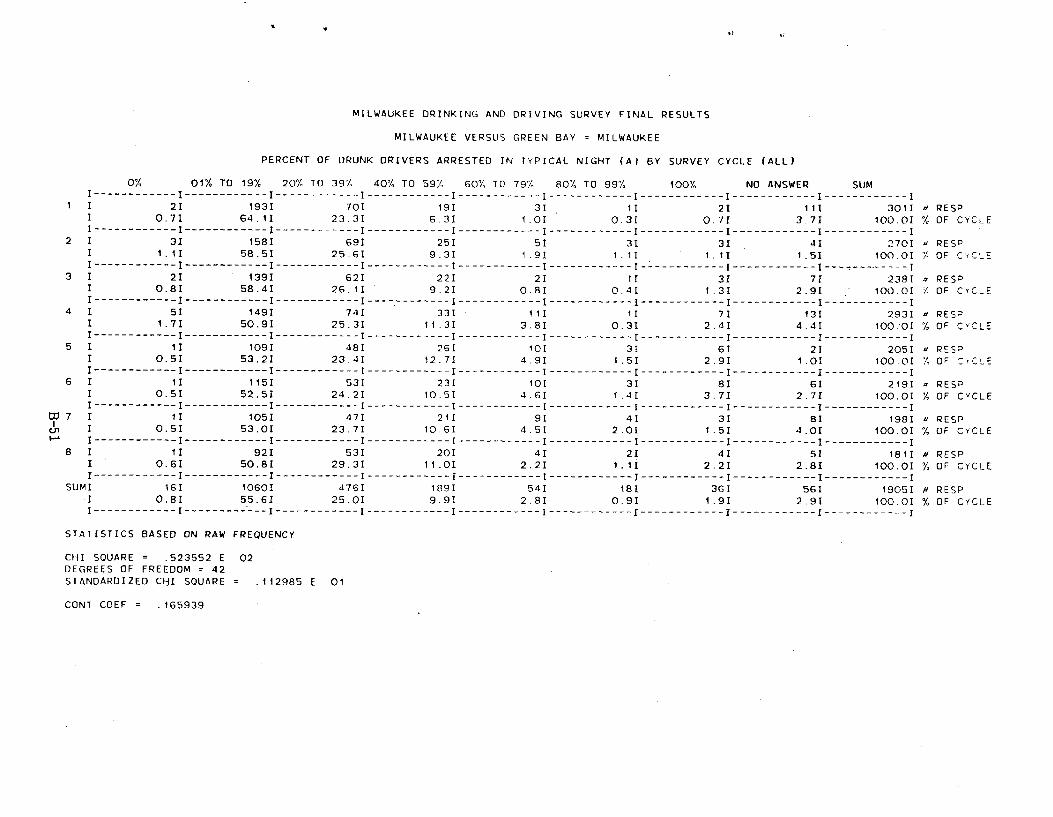
MILWAUKEE DRINKING AND DRIVING SURVEY FINAL RESULTS
MILWAUKEE VERSUS GREEN BAY = MILWAUKEE
PERCENT OF DRUNK DRIVERS ARRESTED IN TYPICAL NIGHT (A) BY SURVEY CYCLE (ALL)
0% 01% TO 19% 20% TO 39% 40% TO 591 60% TO 79% 80% TO 99% 100% NO ANSWER SUM I ------------ I ------------ I ------------ I ------------ I ------------ I ------------ I ------------ I ------------ I ------------ I
1 1 21 1931 701 191 31 11 21 111 3011 a RESP 1 0.71 64.11 23.31 6.31 1.01 0.31 0.71 3.71 100.01 % OF CYCLE I ------------ I ------------ I ------------ I ------------ I ------------ I ------------ I ------------ I ------------ I ------------ I
2 1 31 1581 691 251 51 31 31 41 2701 RESP I 1.11 58.51 25.61 9:31 1.91 1.11 1.11 1.51 100.01 % OF CYCLE I------------ I ------------ I ------------ I ------------ I ------------ I ------------ I ------------ I ------------ I ------------- I
3 I 21 1391 62I 22I 21 11 31 71 2381 RESP I 0.81 58.41 26.11 9.21 0.81 0.41 1.31 2.91 100.01 % OF CYCLE I ------------ I ------------ I ------------ I ----.-------- I ------------ I ------------ I ------------ I ------------ I ------------ I
4 1 51 1491 741 331 111 11 71 131 2931 b RESP I 1.71 50.91 25.31 11.31 3.81 0.31 2.41 4.41 100.01 % OF CYCLE I------------ I ------------ I ------------ I ------------ I ------------ I ------------ I ------------ I ------------ I ------------ I
5 I 11 1091 481 261 101 31 61 21 2051 - RESD 1 0.51 53.21 23.41 12.71 4.91 1.51 2.91 1.01 100.01 1 OF = C-= I------------I------------I------------I------------I------------I------------I------------I------------I------------I
6 I 11 1151 531 231 101 31 81 61 2191 RESD I 0.51 52.51 24.21 10.51 4.61 1.41 3.71 2.71 100.01 1 OF C'"CLE I ------------ I ------------ I ------------ I ------------ I ------------ I ------------ I ------------ I ------------ I ------------ I
CO 7 1 11 1051 471 211 91 41 31 81 1981 RESP I 0.51 53.01 23.71 10.61 4.51 2.01 1.51 4.01 100.01 OF CYCLE I ------------ I ------------ I ------------ I ------------ I ------------ I ------------ I ------------ I ------------ I ------------ I
8 I 11 921 531 201 41 21 41 51 1811 a RESP I 0.61 50.81 29.31 11.01 2.21 1.11 2.21 2.81 100.01 % OF CYCLE I ------------- I ------------ I ------------ I ------------ I ------------ I ------------ I ------------ I ------------ I ------------ I
SUMI 161 10601 4761 1891 541 181 361 561 19051 a RESP I 0.81 55.61 25.01 9.91 2.81 0.91 1.91 2.91 100.01 % OF CYCLE I ------------ I ------------ I ------------ I ------------ I ------------ I ------------ I ------------ I ------------ I ------------ I
STATISTICS BASED ON RAW FREQUENCY
CHI SQUARE = .523552 E 02DEGREES OF FREEDOM = 42STANDARDIZED CHI SQUARE = .112985 E 01
CONT COEF = .165939
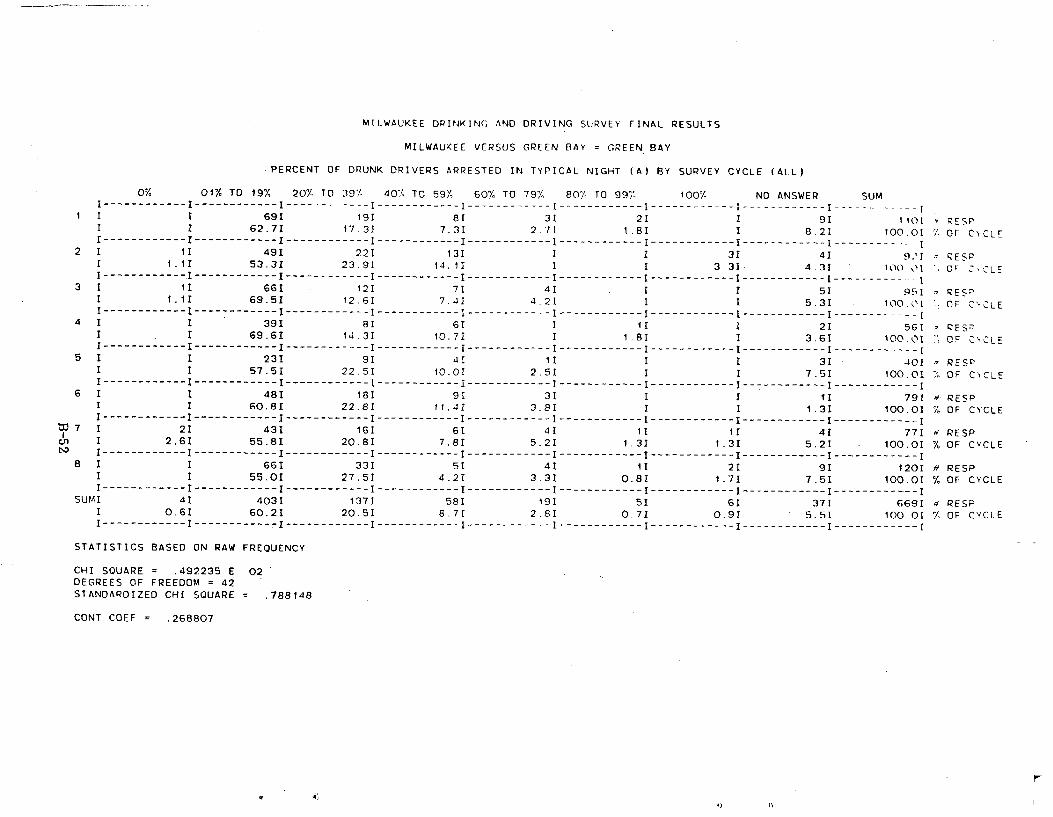
MILWAUKEE DRINKINC3 AND DRIVING SURVEY FINAL RESULTS
MILWAUKEE VERSUS GREEN BAY = GREEN BAY
PERCENT OF DRUNK DRIVERS ARRESTED IN TYPICAL NIGHT (A) BY SURVEY CYCLE (ALL)
0% 01% TO 19% 20% TO 39Y. 40 TO 59% 60% TO 79% 80"i TO 99% 100% NO ANSWER SUMI------------ I------------ I ------------ I ------------ I ------------ I ------------ I ------------ I------------ I -----------
691 191 81 31 21 I 91 1IOI RESP I I 62.71 17.31 7,31 2.71 1.81 I 8.21 100.01 ;; OF CYCLE I------------ I------------ I ------------ I ------------ I ------------ I------------ I------------ I------------ I --------I
2 I II 491 221 131 1 I 31 41 9:I •= RESP I 1.1I 53.3I 23.9I 14.1I I I 3.3I 4.3I 100.01 . 0C7 CL` I7-----------.I------------I------------I------------I------------I------------I------------I------------I----------- I
3 I II 661 121 71 41 I I 51 951 RES^,I 1. 1I 69.51 12.61 7.41 4.21 I I 5.31 100.:'1 OF CYCLE I------------I------------ I------------ I------------ I------------ I------------I------------I------------ I------- _---- 1
4 I I 391 81 6I I if I 21 561 ' RES I I 69.61 14.3I 10.71 1 1.81 I 3.61 100.01 `'. OF C.'CLE I------------ I------------ I ------------ I ------------ I ------------ I ------------ I ------------ I------------ I ------------ I
5 I I 231 9I 41 11 I I 31 401 -. R E S D I I 57.51 22.51 10.01 2.51 I 1 7.51 100.0I OF CYCLE I------------ I------------ I ------------ I ------------ I ------------ I ------------ I ------------ I ------------ I ------------ I
6 I I 481 181 91 3I I I 1I 79I RESP I I 60.8I 22.81 11.41 3.81 I I 1.31 100.01 Y. OF CYCLE I------------ I------------ I ------------ I ------------ I ------------ I ------------ I ------------ I ------------ I --- --------I
1W 7 I 2I 43I 161 6I 4I 1I 1I 4I 77I b RESP
Cn I 2.61 55.8I 20.8I 7.8I 5.2I 1.31 1.3I 5.21 100.01 % OF CYCLE I ------------ I ------------ I ------------ I ------------ I ------------ I ------------ I ------------ I ------------ I ------------ I
8 I I 66I 33I 5I 41 1I 2I 9I 120I a RESP I I 55.01 27.51 4.21 3.31 0.81 1.71 7.51 100.01 % OF CYCLE I ------------ I ------------ I ------------ I ------------ I ------------ I ------------ I ------------ I ------------ I ------------ I
SUMI 4I 403I . 137I 58I 19I 5I 6I 37I 669I RESP I 0.61 60.2I 20.51 8.7I 2.8I 0.71 0.9I 5.5I 100.01 OF CYCLE I ------------ I ------------ I ------------ I ------------ I ------------ I ------------ I ------------ I ------------ I --- --------I
STATISTICS BASED ON RAW FREQUENCY
CHI SQUARE = .492235 E 02DEGREES OF FREEDOM = 42STANDARDIZED CHI SQUARE _ .788148
CONT COEF = .268807
T
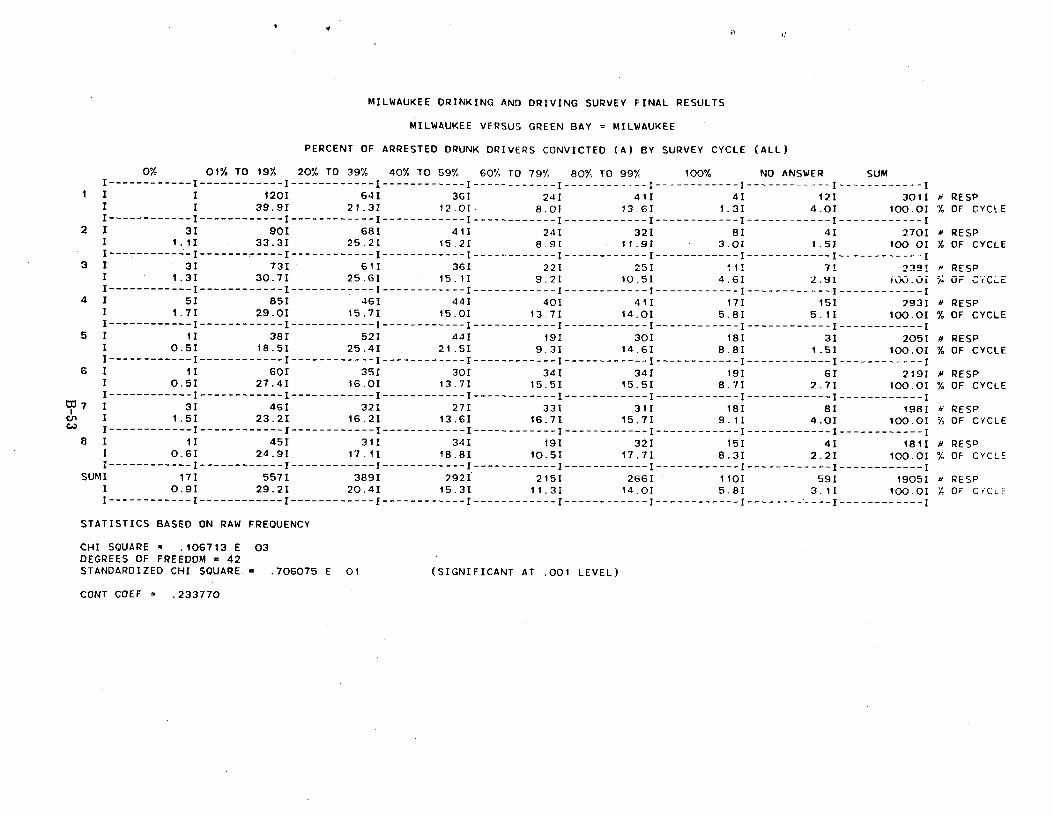
MILWAUKEE DRINKING AND DRIVING SURVEY FINAL RESULTS
MILWAUKEE VERSUS GREEN BAY = MILWAUKEE
PERCENT OF ARRESTED DRUNK DRIVERS CONVICTED (A) BY SURVEY CYCLE (ALL)
0% 01% TO 19% 20% TO 39% 40% TO 59% 60% TO 79% 80% TO 99% 100% NO ANSWER SUMI ------------ I ------------ I ------------ I ------------ I ------------ I ------------ I ------------ I ------------ I -----------I
I I I 120I 64I 36I 24I 41I 4I 121 301I a RESP 1 I 39.9I 21.31 12.0I 8.01 13.61 1.3I 4.01 100.0I % OF CYCLE I ------------ I ------------ I ------------ I ------------ I ------------ I ------------ I ------------ I ------------ I ------------ I
2 I 3I 90I 681 41I 24I 32I 8I 4I 270I P RESP I 1.1I 33.3I 25.2I 15.21 8.91 11.9I 3.0I 1.5I 100.0I % OF CYCLE I ------------ I ------------ I ------------ I ------------ I ------------ I ------------ I ------------ I ------------ I ------------ I
3 I 3I 73I 611 36I 221 25I 112 71 2391 N RESP I 1.31 30.7I 25.6I 15.1I 9.2I 10.5I 4.6I 2.91 100.01 % OF CiCLE I ------------ I ------------ I ------------ I ------------ I ------------ I ------------ I ------------ I ------------ I ------------ I
4 1 51 85I 46I 44I 40I 41I 17I 15I 293I RESP I 1.7I 29.0I 15.7I 15.0I 13.71 14.0I 5.8I 5.1I 100.0I % OF CYCLE I------------ I ------------ I ------------ I ------------ I ------------ I ------------ I ------------ I ------------ I ------------ I
5 I II 38I 52I 44I 19I 30I 181 31 2051 # RESP I 0.51 18.51 25.4I 21.5I 9.3I 14.6I 8.8I 1.51 100.0I % OF CYCLE I------------ I ------------ I ------------ I ------------ I ------------ I ------------ I ------------ I ------------ I ------------ I
6 I 1I 601 351 30I 34I 341 191 6I 219I P RESP 1 0.5I 27.4I 16.0I 13.71. 15.5I 15.5I 8.7I 2.71 100.0I % OF CYCLE I ------------ I ------------ I ------------ I ------------ I ------------ I ------------ I ------------ I ------------ I ------------ I
7 I 31 46I 32I 27I 33I 311 18I 81 1981 RESP cn I 1.5I 23.2I 16.2I 13.6I 16.7I 15.7I 9.11 4.0I 100.01 % OF CYCLECA
I ------------ I ------------ I ------------ I ------------ I ------------ I ------------ I ------------ I ------------ I ------------ I 8 I 1I 45I 31I 34I 19I 32I 15I 4I 1811 a RESP
I 0.61 24.91 17.11 18.81 10.51 17.71 8.31 2.21 100.01 ! OF CYCLE I ------------ I ------------ I ------------ I ------------ I ------------ I ------------ I ------------ I ------------ I ------------ I
SUMI 17I 557I 389I 292I 215I 266I 110I 59I 1905I P RESP I 0.91 29.21 20.4I 15.3I 11.31 14.0I 5.8I 3.1I 100.0I % OF C'+'CLE I------------I------------I------------I------------I------------I------------I------------I------------I------------I
STATISTICS BASED ON RAW FREQUENCY
CHI SQUARE .106713 E 03DEGREES OF FREEDOM = 42STANDARDIZED CHI SQUARE.= .706075 E 01 (SIGNIFICANT AT .001 LEVEL)
CONT COEF = .233770
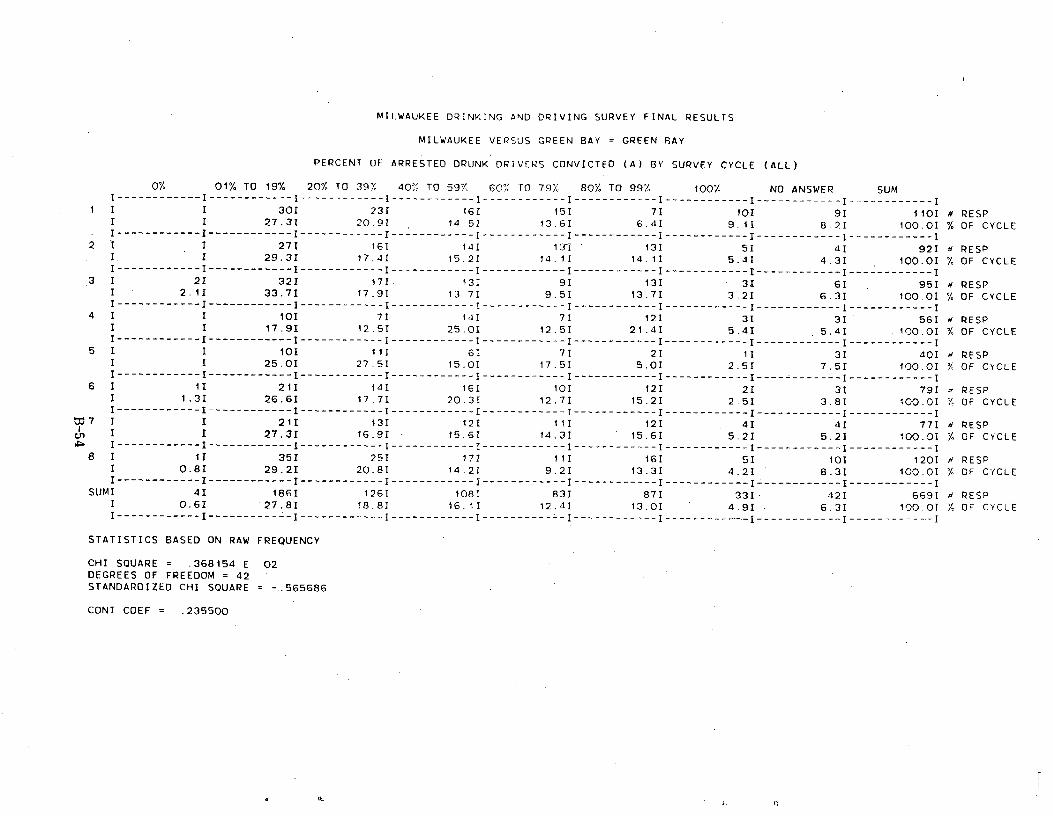
MILWAUKEE DRINKING AND DRIVING SURVEY FINAL RESULTS
MILWAUKEE VERSUS GREEN BAY = GREEN RAY
PERCENT OF ARRESTED DRUNK DRIVERS CONVICTED (A) BY SURVEY CYCLE (ALL)
0% 01% TO 19% 20% TO 39% 40% TO 59% 60% TO 79% 80% TO 99% 100%• NO ANSWER SUM I ------------ I ------------ I ------------ I ------------ I ------------ I ------------ I ------------ I ------------ I ------------ I
1 I 1 30I 23I 16I 15I 7I 10I 9I 110I # RESP 1 1 27.31 20.91 14.5I 13.6I 6.4I 9.1I 8.21 100.0I % OF CYCLE I ------------ I ------------ I ------------ I ------------ I ------------ I ------------ I ------------ I ------------ I ------------ I
2 I I 27I 16I 14I 131 13I 5I dI 92I d RESP 1 1 29.3I 17.4I 15.2I 14.11 14.1I 5.4I 4.3I 100.0I % OF CYCLE I ------------ I ------------ I ------------ I ------------ I ------------ I ------------ I ------------ I ------------ I ------------ I
3 I 2I 32I 17I 13I 9I 13I 31 6I 95I a RESP I 2.1I 33.7I 17.9I 13.7I 9.5I 13.7I 3.2I 6.31 100.0I % OF CYCLE I ------------ I------------ I ------------ I ------------ I ------------ I ------------ I ------------ I ------------ I ------------ I
4 I I 10I 71 141 71 12I 31 31 56I d RESP I I 17.91 12.51 25.01 12.51 21.41 5.41 5.41 .100.0I % OF CYCLE I ------------ I------------ I ------------ I ------------ I ------------ I ------------ I ------------ I ------------ I ------------ I
5 I I 101 111 61 71 21 II 31 40I d RESP I I 25.OI 27.5I 15.0I 17.5I 5.01 2.5I 7.51 100.01 % OF CYCLE I ------------ I ------------ I ------------ I ------------ I ------------ I ------------ I ------------ I ------------ I ------------ I
6 I 1I 21I 14I 16I 10I 121 2I 3I 791 RESP I 1.3I 26.6I 17.7I 20.3I 12.71 15.2I 2.5I 3.8I 100.0I 4 OF CYCLE I------------ I ------------ I ------------ I ------------ I ------------ I ------------ I ------------ I ------------ I ------------ I
W7 I I 211 131 121 Ill 121 41 41 771 d RESP I I 27.3I 16.91 . 15.6I 14.31 15.6I 5.2I 5.21 100.0I % OF CYCLE
OP. I ------------ I ------------ I ------------ I ------------ I ------------ I ------------ I ------------ I ------------ I ------------ I 8 1 1I 351 25I 171 III 16I 5I 10I 120I a RESP
I 0.8I 29.2I 20.8I 14.2I 9.21 13.3I 4.2I 8.31 100.0I OF CYCLE I------------ I ------------ I ------------ I ------------ I ------------ I ------------ I ------------ I ------------ I ------------ I
SUMI 41 186I 126I 108I 83I 87I 33I 42I 669I a RESP 1 0.61 27.8I 18.81 16.11 12.4I 13.0I 4.9I 6.3I 100.0I OF CYCLE I ------------ I ------------ I ------------ I ------------ I ------------ I ------------ I --------- -1 ------------ I -------- 7---1
STATISTICS BASED ON RAW FREQUENCY
CHI SQUARE = .368154 E 02DEGREES OF FREEDOM = 42STANDARDIZED CHI SQUARE _ -..565686
CONT COEF = .235500
^. o
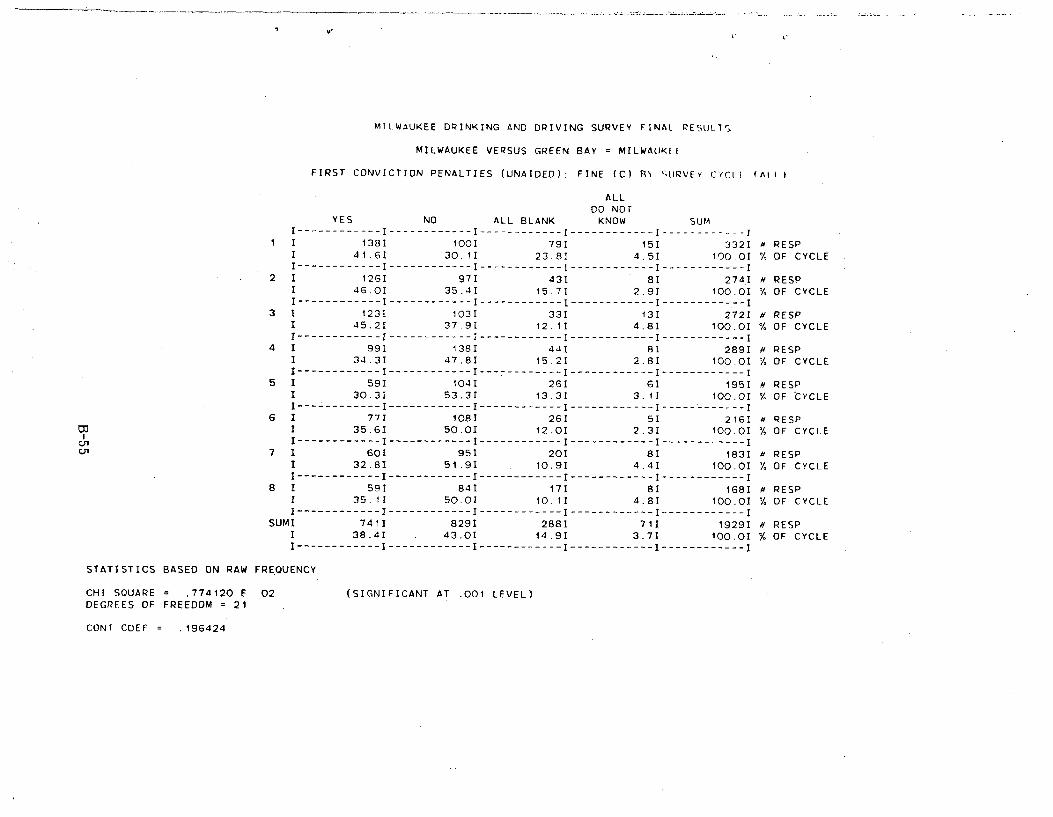
tl'
MILWAUKEE DRINKING AND DRIVING SURVEY FINAL RESULT;.
MILWAUKEE VERSUS GREEN BAY = MILWAUKEE
FIRST CONVICTION PENALTIES (UNAIDED): FINE (C) R' :URVFY CYCIf (All)
ALL DO NOT
YES NO ALL BLANK KNOW SUM
I------------ I ------------ I ------------ I ------------ I ------------I 1 I 138I 1001 791 15I 3321 N RESP
I 41.61 30.11 23.81 4,5I 100.0I % OF CYCLE I ------------ I ------------ I ------------ I ------------ I ------------ I
2 I 12GI 971 431 81 274.1 N RESP I 46.OI 35.41 15.71 2.91 100.01 % OF CYCLE I ------------ I ------------ I ------------ I ------------ I ------------ I
3 I 123I 103I 33I 13I 2721 N RESP I 45.21 37.91 12.11 4.81 100.01 % OF CYCLE I ------------ I ------------ I ------------ I ------------ I ------------ I
4 I 991 138I 441 8I 289I N RESP I 34.3I 47.81 15.2I 2.81 100.0I % OF CYCLE I ------------ I ------------ I ------------ I ------------ I ------------ I
5 I 59I 104I 261 61 1951 a RESP I 30.3I 53.3I 13.31 3.1I 100.01 % OF CYCLE I ------------ I ------------ I ------------ I ------------ I ------------ I
6 1 771 1081 261 51 2161 it RESP I 35.61 50.01 12.01 2.31 100.01 % OF CYCLE I ------------ I ------------ I ------------ I ------------ I ------------ I
7 1 601 951 201 81 1831 N RESP I 32.81 51.91 10.91 4.41 100.01 % OF CYCLE I ------------ I ------------ I ------------ I ------------ I ------------ I
8 I 591 841 171 81 1681 a RESP I 35.11 50.01 10.11 4.81 100.01 % OF CYCLE I ------------ I ------------ I ------------ I ------------ I ------------ I
SUMI 741I 829I 288I 71I 19291 N RESP I 38.41 43.01 14.9I 3.7I 100.01 % OF CYCLE I ------------ I ------------ I ------------ I ------------ I ------------ I
STATISTICS BASED ON RAW FREQUENCY
CHI SQUARE = .774120 E 02 (SIGNIFICANT AT .001 LEVEL) DEGREES OF FREEDOM = 21
CONT COEF = .196424
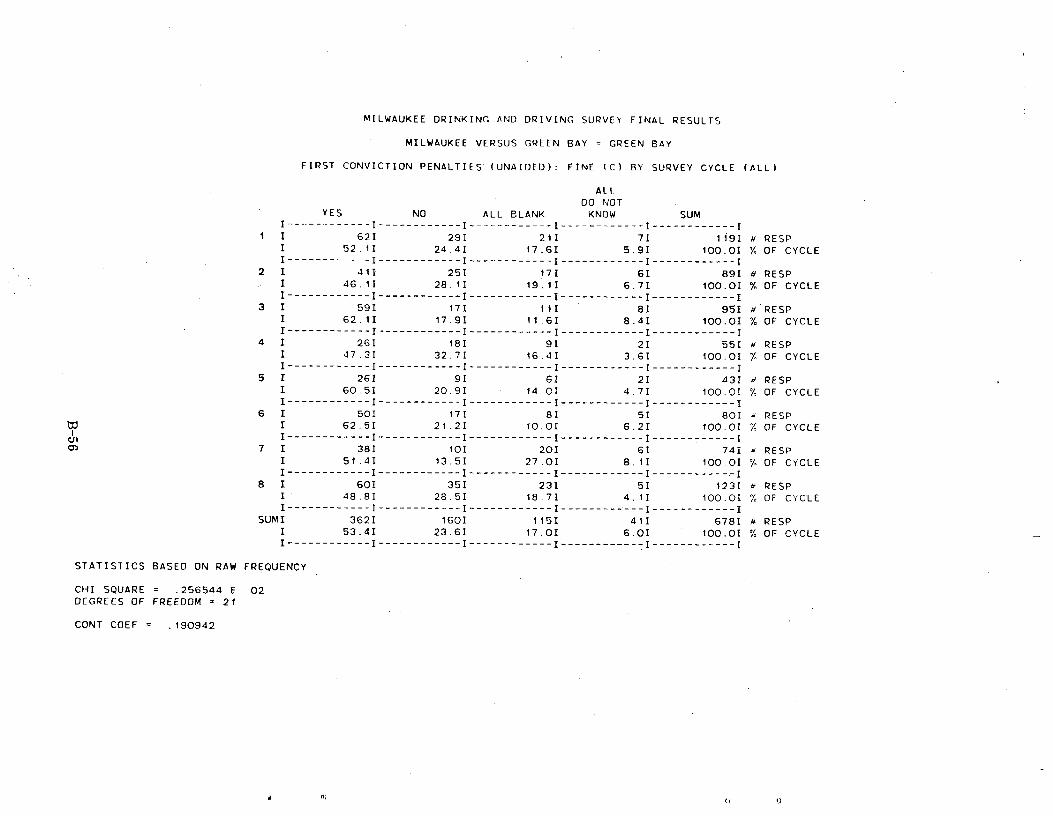
MILWAUKEE DRINKING AND DRIVING SURVEY FINAL RESULTS
MILWAUKEE VERSUS GREEN BAY = GREEN BAY
FIRST CONVICTION PENALTIES (UNAIDED): FINE (C) BY SURVEY CYCLE (ALL)
ALL DO NOT
YES NO ALL BLANK KNOW SUM I------------ I ------------ I ------------ I ------------ I ------------I
1 I 62I 291 211 71 1191 N RESP I 52.1I 24.41 17.61 5.91 100.0I '/, OF CYCLE I------------ I ------------ I ------------ I ------------ I ------------ I
2 1 411 251 171 61 891 # RESP I 46.1I 28.1I 19.11 6.7I 100.01 % OF CYCLE I ------------ I ------------ I ------------ I ------------ I -----------I
3 I 591 171 11I 81 951 # RESP I 62.11 17.91 11.6I 8.41 100.01 % OF CYCLE I------------ I ------------ I ------------ I ------------ I ------------ I
4 I 261 181 91 21 551 a RESP I 47.3I 32.71 16.41 3.6I 100.01 '/- OF CYCLE I------------ I ------------ I ------------ I ------------ I ------------ I
5 1 261 91 61 21 431 PESP I 60.51 20.91 14.01 4.71 100.01 OF CYCLE I------------ I ------------ I ------------ I ------------ I ------------ I
6 I 501 171 81 51 801 RESP I 62.5I 21.21 10.01 6.21 100.0I % OF CYCLE I------------ I ------------ I ------------ I ------------ I ------------ I
7 1 38I 101 20I 61 74I RESP I 51.4I 13.51 27.01 8.11 100.0I % OF CYCLE I------------ I ------------ I ------------ I ------------ I ------------I
8 I 601 351 231 51 1231 RESP I 48.81 28.51 18.71 4.11 100.0I % OF CYCLE I ------------ I ------------ I ------------ I ------------ I ------------ I
SUMI 3621 1601 115I 41I 678I ft RESP I 53.4I 23.61 17.0I 6.01 100.01 % OF CYCLE I------------ I ------------ I ------------ I ------------ I ------------ I
STATISTICS BASED ON RAW FREQUENCY
CHI SQUARE = .256544 E 02 DEGREES OF FREEDOM = 21
CONT COEF = .190942
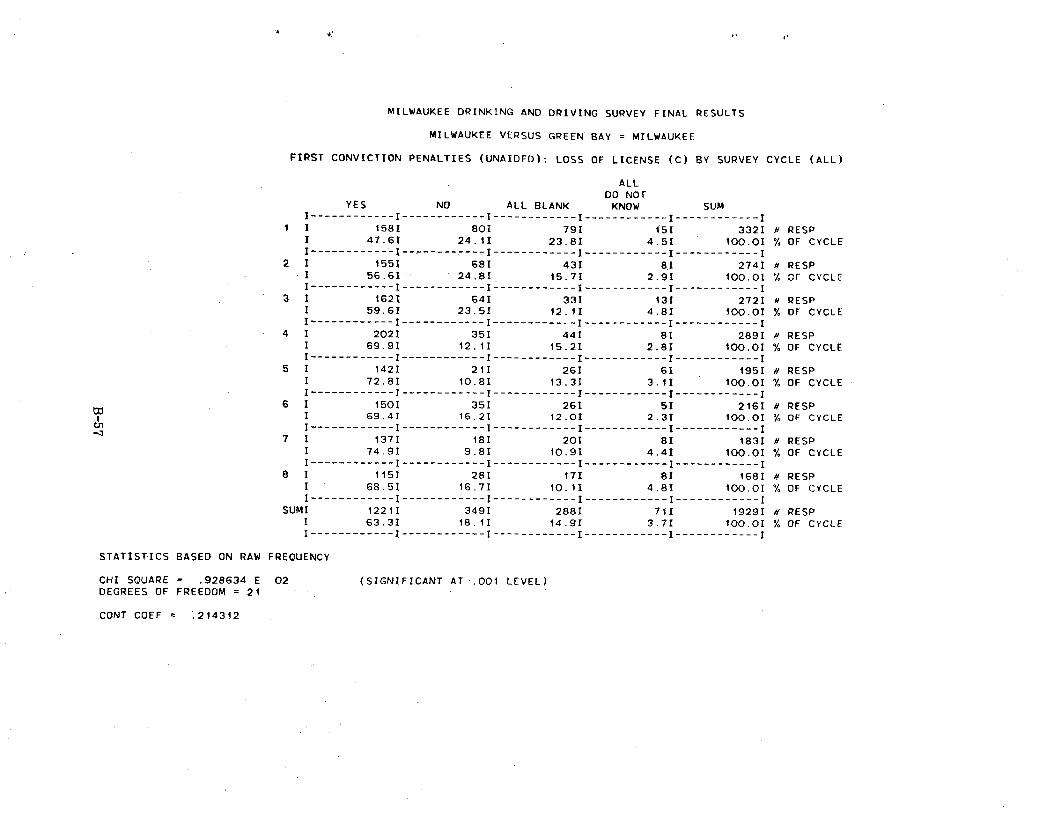
MILWAUKEE DRINKING AND DRIVING SURVEY FINAL RESULTS
MILWAUKEE VERSUS GREEN BAY = MILWAUKEE
FIRST CONVICTION PENALTIES (UNAIDED): LOSS OF LICENSE (C) BY SURVEY CYCLE (ALL)
ALL DO NOT
YES NO ALL BLANK KNOW SUM I ------------ I ------------ I ------------ I ------------ I ------------I
1 I 1581 80I 79I 15I 332I # RESP I 47.61 24.11 23.81 4.51 100.01 % OF CYCLE I----------- 1------------I------------I------------I------------I
2 I 1551 681 431 81 2741 # RESP I 56.61 24.81. 15.71 2.91 100.01 % Cr CYCLE I ------------ I ------------ I ------------ I ------------ I ------------ I
3 I 162I 64I 33I 131 272I RESP I 59.61 23.51 12.11 4.81 100.01 % OF CYCLE I ------------ I ------------ I ------------ I ------------ I ------------ I
4 1 2021 351 441 81 2891 a RESP I 69.91 12.11 15.21 2.81 100.01 % OF CYCLE I ------------ I ------------ I ------------ I ------------ I ------------ I
5 I 1421 21I 26I 6I 195I # RESP I 72.81 10.8I 13.31 3.11 100.01 % OF CYCLE I ------------ I ------------ I ------------ I ------------ I ------------ I
6 I 1501 351 261 51 2161 # RESP I 69.41 16.21 12.01 2.31 100.01 % OF CYCLE I ------------ I ------------ I ------------ I ------------ I ------------ I
7 I 1371 181 201 81 1831 N RESP I 74.91 9.81 10.91 4.41 100.01 % OF CYCLE I ------------ I ------------ I ------------ I ------------ I ------------ I
8 I 1151 28I 171 8I 1681 N RESP I 68.51 16.71 10.1I 4.81 100.01 % OF CYCLE I ------------ I ------------ I ------------ I ------------ I ------------ I
SUMI 1221I 349I 288I 71I 19291 N RESP I 63.31 18.11 14.91 3.71 100.01 % OF CYCLE I ------------ I ------------ I ------------ I ------------ I ------------ I
STATISTICS BASED ON RAW FREQUENCY
CHI SQUARE = .928634 E 02 (SIGNIFICANT AT .001 LEVEL) DEGREES OF FREEDOM = 21
CONT COEF = .214312
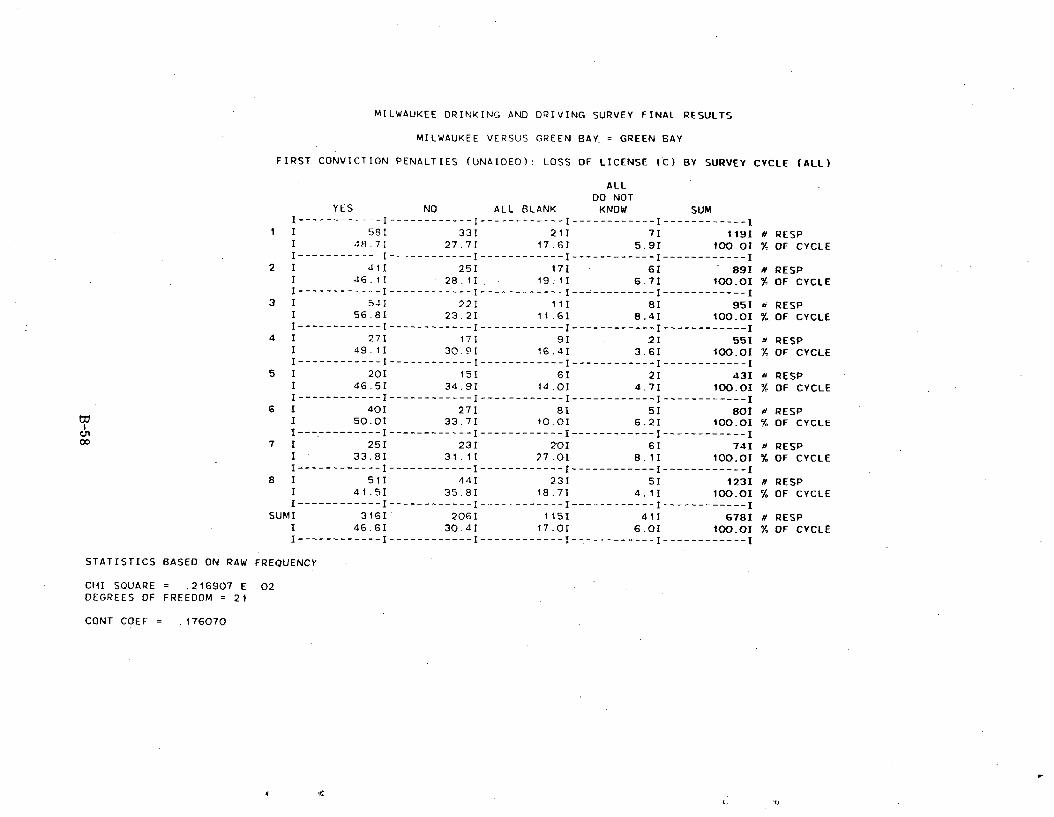
MILWAUKEE DRINKING AND DRIVING SURVEY FINAL RESULTS
MILWAUKEE VERSUS GREEN BAY. = GREEN SAY
FIRST CONVICTION PENALTIES (UNAIDED): LOSS OF LICENSE (C) BY SURVEY CYCLE (ALL)
ALL DO NOT
YES NO ALL BLANK KNOW SUM I ------------ I ------------ I ------------ I ------------ I ------------I
1 I 58I 331 21I 7I 1191 a RESP I •18.7I 27.71 17.6I 5.91 100.0I % OF CYCLE I------------ I ----------- I ------------ I ------------ I ------------ I
2 I 41I 251 17I 61 891 # RESP I 46.1I 28.1I. 19.1I 6.71 100.01 % OF CYCLE I ------------ I ------------ I ------------ I------------ I ------------ I
3 I 541 221 111 81 951 RESP I 56.81 23.2I 11.61 8.41 100.01 %_ OF CYCLE I------------ I ------------ I ------------ I ------------ I ------------ I
4 I 27I 171 91 21 551 d RESP I 49.11 30.9I 16.4I 3.6I 100.01 Y OF CYCLE I ------------ I ------------ I ------------ I ------------ I ------------ I
5 I 201 151 61 21 431 RESP i 46.5I 34.9I 14.01 4.7I 100.01 % OF CYCLE I------------ I ------------ I ------------ I ------------ I ------------ I
6 I 401 271 81 51 801 a RESP I 50.01 33.7I 10.0I 6.21 100.01 % OF CYCLE I ---.--------- I ------------ I ------------ I ------------ I ------------ I
7 1 251 231 2'0I 61 741 RESP I 33.81 3-1.11 27.01 8.11 100.0I % OF CYCLE I------------ I ------------ I ------------ I ------------ I ------------ I
8 I 511 441 231 51 1231 a RESP I 41.51 35.8I 18.71 4.11 100.01 `/, OF CYCLE I ------------ I ------------ I ------------ I ------------ I ------------ I
SUMI 3161 20GI 115I 41I 6781 H RESP I 46.6I 30.41 17.01 6.01 100.0I % OF CYCLE I------------ I ------------ I ------------ I ------------ I ------------ I
STATISTICS BASED ON RAW FREQUENCY
CHI SQUARE = .216907 E 02 DEGREES OF FREEDOM = 21
CONT COEF = .176070
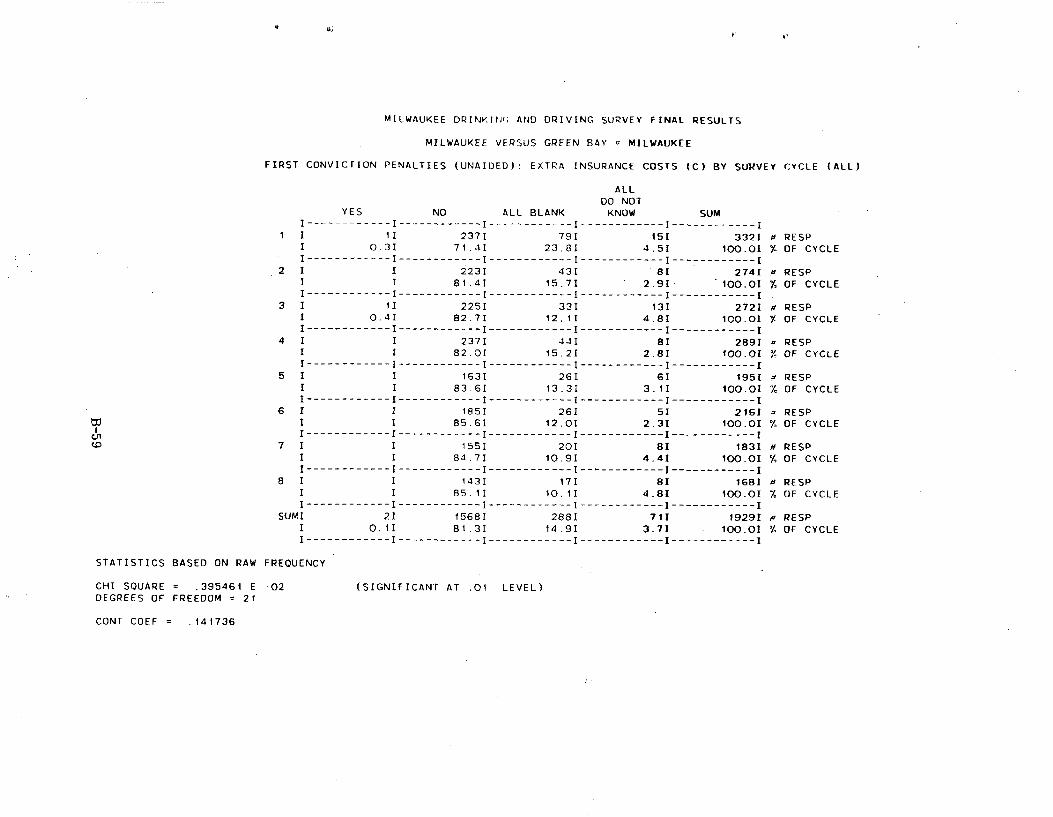
MILWAUKEE DRINKING AND DRIVING SURVEY FINAL RESULTS
MILWAUKEE VERSUS GREEN BAY = MILWAUKEE
FIRST CONVICTION PENALTIES (UNAIDED): EXTRA INSURANCE COSTS (C) BY SURVEY CYCLE (ALL)
ALL 00 NOT
YES NO ALL BLANK KNOW SUM I------------ I ------------ I ------------ I ------------ I ------------I
1 I 1I 237I 79I 151 332I a RESP 1 0.31 71.41 23.81 4.51 100.01 % OF CYCLE I ------------ I ----- ------I------------I------------I------------I
2 I 1 2231 431 81 2741 u RESP I i 81.41 15.71 2.91 100.01 % OF CYCLE I------------ I------------.I ------------ I ------------ I ------------ I
3 I 11 2251 331 13I 2721 a RESP I 0.41 82.71 12,11 4.81 100.0I OF CYCLE I------------ I ------------ I ------------ I ------------ I ------------ I
4 I I 2371 441 81 2891 ++ RESP I I 82.OI 15.21 2.81 100.01 % OF CYCLE I------------ I ------------ I ------------ I ------------ I ------------ I
5 I I 1631 261 61 1951 RESP I I 83.61 13.31 3.11 100.01 % OF CYCLE I ------------ I ------------ I ------------ I ------------ I ------------ I
6 I I 1851 261 51 2161 = RESP I I 85.61 12.01 2.31 100.01 % OF CYCLE I ------------ I ------------ I ------------ I ------------ I ------------ I
7 I I 1551 201 81 1831 a RESP I I 64.71 10.91 4.41 100.01 % OF CYCLE I ------------ I ------------ I ------------ I ------------ I ------------ I
8 I I 1431 171 81 1681 a RESP I I 85.11 10.11 4.81 100.01 OF CYCLE I ------------ I ------------ I ------------ I ------------ I ------------ I
Si1MI 2I 1568I 288I 71I 1929I .H RESP 1 0.11 81.31 14.9I 3.7I 100.01 % OF CYCLE I ------------ I ------------ I ------------ I ------------ I ------------ I
STATISTICS BASED ON RAW FREQUENCY
CHI SQUARE = .395461 E 02 (SIGNIFICANT AT .01 LEVEL) DEGREES OF FREEDOM = 21
CONT COEF = .141736

MILWAUKEE DRINKING AND DRIVING SURVEY FINAL- RESULTS
MILWAUKEE VERSUS GREEN BAY = GREEN BAY
FIRST CONVICTION PENALTIES (UNAIDED): EXTRA INSURANCE COSTS (C) BY SURVEY CYCLE (ALL)
ALL DO NOT
NO ALL BLANK KNOW SUM I------------ I ------------ I ------------ I ------------ I
1 I 911 211 71 1191 = RESP 76.51 17.61 5.9i 100.01 % OF CYCLE
I------------ I ------------ I ------------ I ------------ I 2 I 66I 171 6I 891 RESP
I 74.2I 19.11 6.7I 100.01 % OF CYCLE I -----------I------------I------------I------------I
3 I 761 111 8I 951 H RESP I 80.01 11.61 8.41 100.0I 70 OF CYCLE I ------------ I ------------ I ------------ I ------------ I
4 I 441 91 21 551 - RESP 1 80.01 16.4I 3.61 100.0I I OF CYCLE I ------------ I ------------ I ------------ I ------------ I
5 I 351 6I 21 431 H RESP I 81.41 14.0I 4.71 100.0I % OF CYCLE I------------ I ------------ I ------------ I ------------ I
6 I 671 81 5I 801 H PESP I 83,71 10.01 6.21 100.0I % OF CYCLE I------------ I ------------- I ------------ I ------------ I
7 I 481 201 6I 741 H RESP 1 64.91 27.01 8.11 100.01 % OF CYCLE I ------------ I ------------ I ------------ I ------------ I
8 1 951 231 51 1231 H RESP I 77.21 18.71 4.11 100.01 % OF CYCLE I ------------ I ------------ I ------------ I ------------ I
SUMI 5221 115I 411 678I H RESP 1 77.01 17.01 6.01 100.01 % OF CYCLE I ------------ I ------------ I ------------ I ------------ I
STATISTICS BASED ON RAW FREQUENCY
CHI SQUARE = .142855 E 02 DEGREES OF FREEDOM = 14
CONT COEF = .143650
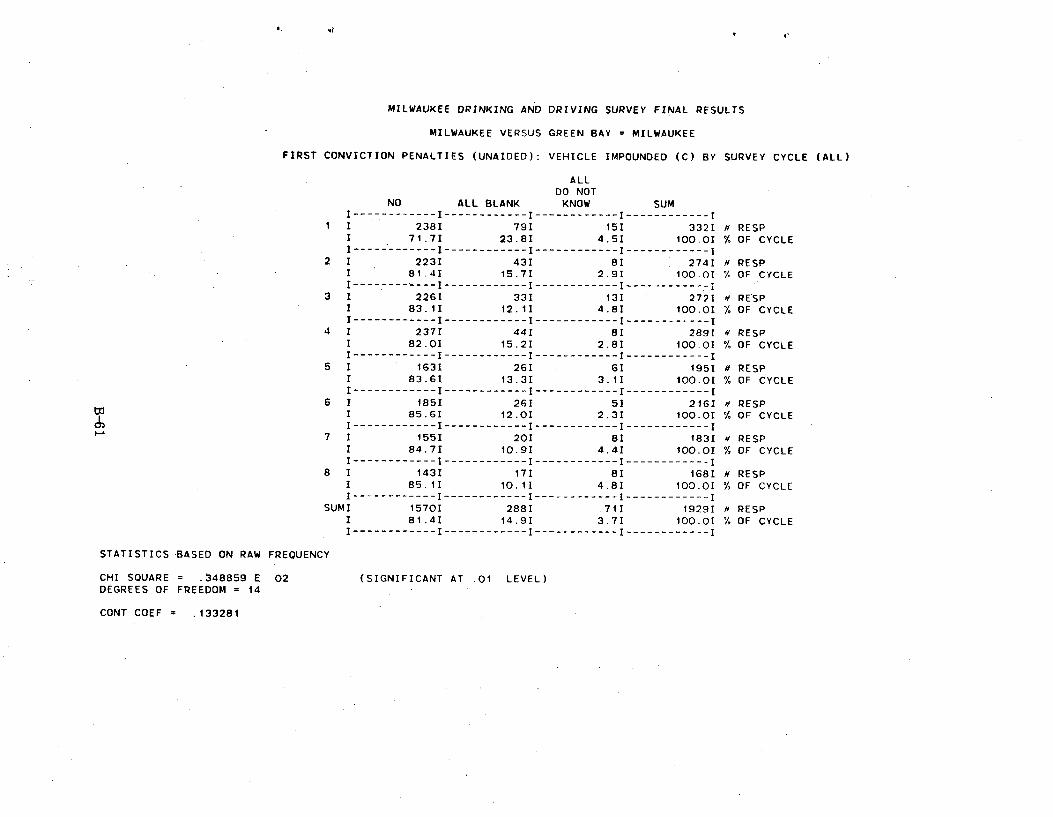
VI
MILWAUKEE DRINKING AND DRIVING SURVEY FINAL RESULTS
MILWAUKEE VERSUS GREEN BAY = MILWAUKEE
FIRST CONVICTION PENALTIES (UNAIDED): VEHICLE IMPOUNDED (C) BY SURVEY CYCLE (ALL)
ALL DO NOT
NO ALL BLANK KNOW SUM I------------ I ------------ I ------------ I ------------ I
I I 2381 791 151 3321 a RESP I 71.71 23.81 4.51 100.01 % OF CYCLE I ------------ I ------------ I ------------ I ------------ I
2 I 2231 431 81 2741 a RESP I 81.41 15.71 2.91 100.01 % OF CYCLE I------------ I ------------ I ------------ I ------------ I
3 I 2261 331 131 2721 a RESP I 83.11 12.11 4.81 100.01 % OF CYCLE I ------------ I ------------ I ------------ I ------------ I
4 1 2371 441 81 2891 RESP I 82.01 15.21 2.81 100.01 % OF CYCLE I ------------ I ------------ I ------------ I ------------ I
5 1 1631 261 61 1951 H RESP I 83.61 13.31 3.1I 100.01 % OF CYCLE I ------------ I ------------ I ------------ I ------------ I
6 1 1851 261 51 21GI H RESP I 85.6I 12.01 2.31 100.01 % OF CYCLE I ------------ I ------------ I ------------ I ------------ I
7 I 1551 201 81 1831 a RESP I 84.71 10.91 4.41 100.01 % OF CYCLE I ------------ I ------------ I ------------ I ------------ I
8 I 1431 171 81 1681 a RESP I 85.11 10.11 4.81 100.01 % OF CYCLE I ------------ I ------------ I ------------ I ------------ I
SUMI 1570I 2881 .71I 1929I # RESP I 81.41 14.91 3.71 100.01 % OF CYCLE I ------------ I ------------ I ------------ I ------------ I
STATISTICS BASED ON RAW FREQUENCY
CHI SQUARE _ .348859 E 02 (SIGNIFICANT AT .01 LEVEL) DEGREES OF FREEDOM = 14
CONT COEF = .133281
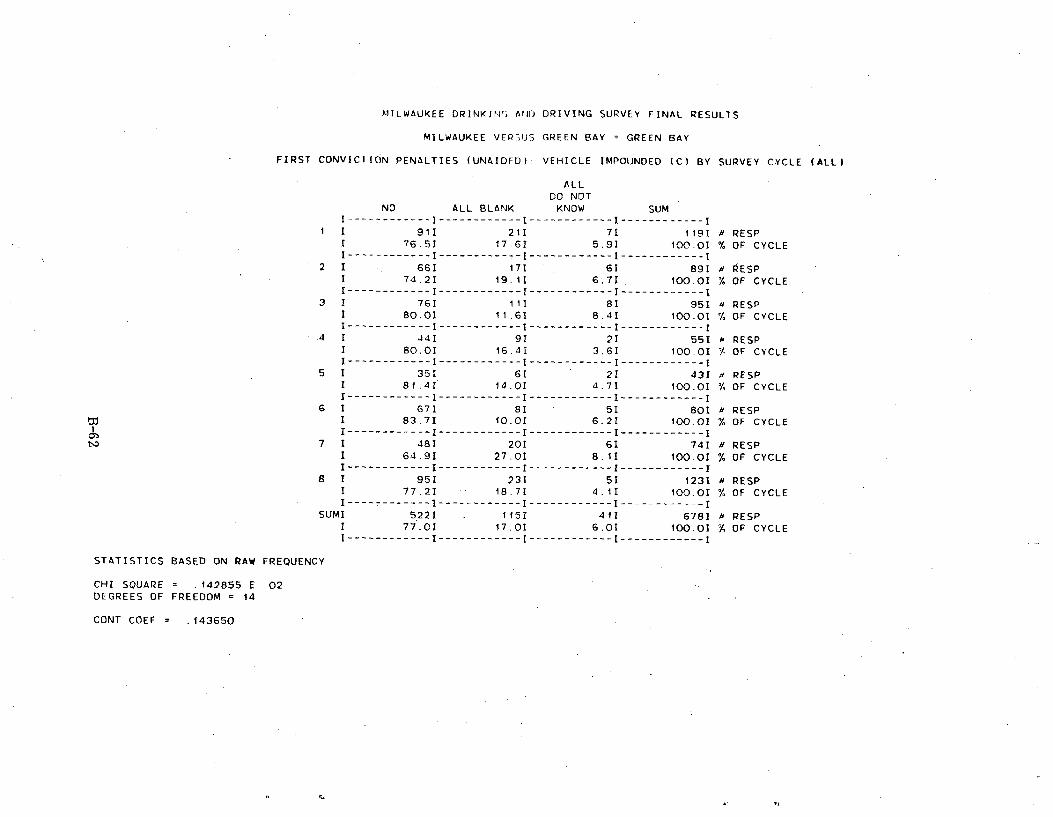
MILWAUKEE DRINKIN; AND DRIVING SURVEY FINAL RESULTS
MILWAUKEE VERSUS GREEN BAY = GREEN BAY
FIRST CONVICTION PENALTIES (UNAIDED): VEHICLE IMPOUNDED (C) BY SURVEY CYCLE (ALL)
ALL DO NOT
NO ALL BLANK KNOW SUM I------------ I ------------ I ------------ I ------------ I
1 I 911 211 71 1191 a RESP I 76.51 17.61 5.91 100.0I % OF CYCLE I------------ I ------------ I ------------ I ------------ I
2 I 66I 171 6I 89I a RESP I 74.21 19.11 6.71 100-0I % OF CYCLE I ------------ I ------------ I ------------ I ------------ I
3 I 761 11I 81 951 RESP I 80.01 11.61 8.41 100.01 % OF CYCLE I ------------ I ------------ I ------------ I ------------ I
4 I 441 91 21 551 RESP I 80.01 16.41 3.6I 100.01 7, OF CYCLE I ------------ I ------------ I ------------ I ------------ I
5 I 351 6[ 21 431 RESP I 81.41 14.01 4.71 100.01 I OF CYCLE I ------------ I ------------ I ------------ I ------------ I
6 I 671 81 51 801 RESP I 83.71 10.01 6.21 100.0I % OF CYCLE I ------------ I ------------ I ------------ I ------------ I
7 I 481 201 61 741 a RESP I 64.91 27.01 8.11 100.01 % OF CYCLE I ------------ I ------------ I ------------ I ------------ I
8 1 951 231 51 1231 a RESP I 77.21 18.71 4,11 100.01 % OF CYCLE I ------------ I ------------ I ------------ I ------------ I
SUMI 5221 1151 411 6781 a RESP I 77.01 17.01 6.01 100.01 % OF CYCLE I------------I------------I------------I------------1
STATISTICS BASED ON RAW FREQUENCY
CHI SQUARE = .142855 E 02 DEGREES OF FREEDOM = 14
CONT COEF = .143650
,L Y)
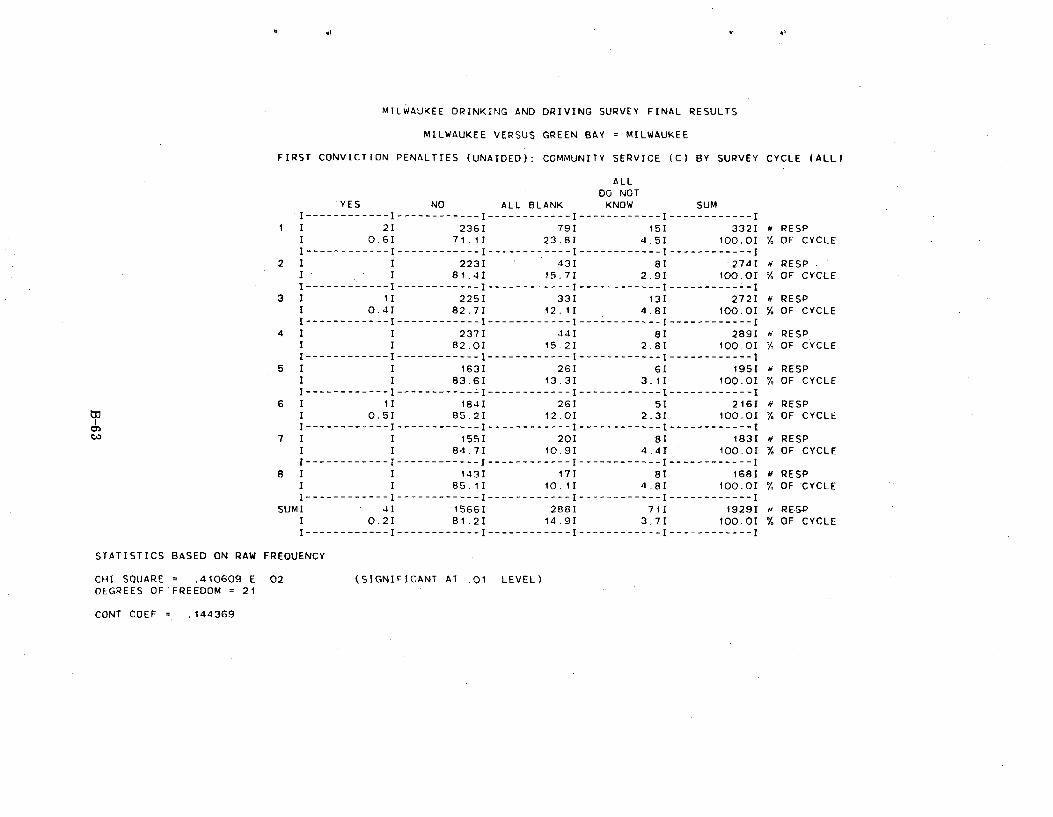
MILWAUKEE DRINKING AND DRIVING SURVEY FINAL RESULTS
MILWAUKEE VERSUS GREEN BAY = MILWAUKEE
FIRST CONVICTION PENALTIES (UNAIDED): COMMUNITY SERVICE (C) BY SURVEY CYCLE (ALL)
ALL DO NOT
YES NO ALL BLANK KNOW SUM I------------ I ------------ I ------------ I ------------ I ------------ I
1 I 21 236I 791 151 332I # RESP I 0.6I 71.11 23.81 4.51 100.01 % OF CYCLE I------------ I ------------ I ------------ I -----------I ------------ I
2 1 I 223I 431 8I 2741 a RESP 1 1 81.41 15.7I 2.91 100.01 % OF CYCLE I ------------ I ------------ I ------------ I ------------ I ---------- =-I
3 I 11 2251 331 131 2721 RESP I 0.41 82.71 12.11 4.81 100.01 % OF CYCLE I ------------ I ------------ I ------------ I ------------ I ------------ I
4 I 1 2371 441 81 2891 a RESP I I 82.01 15.21 2.81 100.01 % OF CYCLE I ------------ I ------------ I ------------ I ------------ I ------------ I
5 I I 1631 261 61 1951 r RESP I I 83.61 13.31 3.11 100.01 % OF CYCLE I------------ I ------------ I ------------ I ------------ I ------------ I
6 I 1I 1841 261 5I 2161 # RESP I 0.51 85.21 12.01 2.31 100.01 % OF CYCLE I ------------ I ------------ I ------------ I ------------ I ------------ I
7 I I 1551 201 81 1831 a RESP I I 84.71 10.9I 4.4I 100.01 % OF CYCLE I ------------ I ------------ I ------------ I ------------ I ------------ I
8 I I 1431 171 81 1681 # RESP I I 85.11 10.11 4.81 100.01 % OF CYCLE I ------------ I ------------ I ------------ I ------------ I ------------ I
SUMI 41 15661 2881 71I 1929I a RESP I 0.21 81.21 14.91 3.71 100.01 % OF CYCLE I ------------ I ------------ I ------------ I ------------ I ------------ I
STATISTICS BASED ON RAW FREQUENCY
CHI SQUARE = .410609 E 02 (SIGNIFICANT AT .01 LEVEL) DEGREES OF'FREEDOM = 21
CONT COEF = .144369
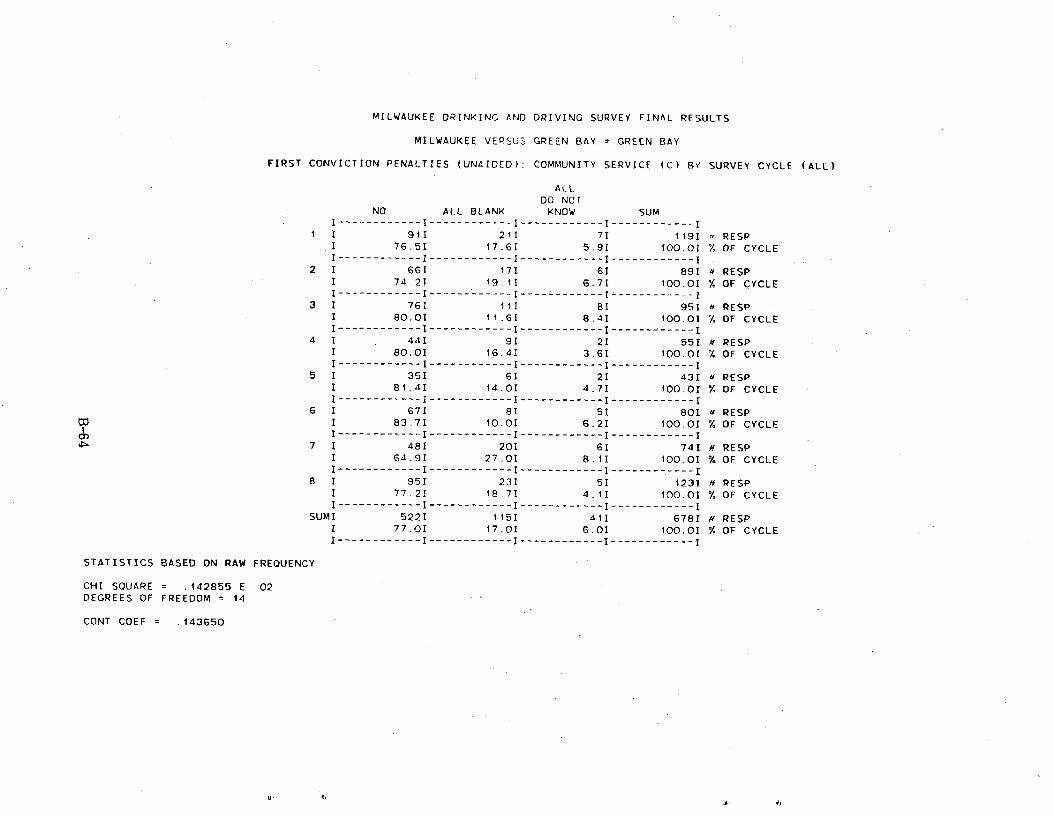
MILWAUKEE DRINKING AND DRIVING SURVEY FINAL RESULTS
MILWAUKEE VERSUS GREEN BAY = GREEN BAY
FIRST CONVICTION PENALTIES (UNAIDED): COMMUNITY SERVICE (C) BY SURVEY CYCLE (ALL)
ALL DO NOT
NO ALL BLANK KNOW SUM I------------ I ------------ I ------------ I ------------I
1 I 91I 211 71 1191 n RESP I 76.51 17.61 5.91 100.01 OF CYCLE' I------------ I ------------ I ------------ I ------------ I
2 I 66I 171 61 891 H RESP I 74.21 19.11 6.7I 100.0I % OF CYCLE I - I------------ I ------------ I------------ 1
3 I 761 III 81 951 a RESP I 80.01 11.61 8.4I 100.01 % OF CYCLE I ------------ I ------------ I ------------ I ------------ I
4 I 441 91 21 551 a RESP I 80.0I 16.41 3.61 100.01 ' OF CYCLE I ------------ I ------------ I ------------ I ------------ I
5 I 351 61 21 431 N RESP I 81.41 14.01 4.71 100.01 % OF CYCLE I ------------ I ------------ I ------------ I ------------ I
6 I 671 81 51 801 a RESP 1 63.71 10.01 6.21 100.01 % OF CYCLE I ------------ I ------------ I ------------ I ------------ I
7 I 481 201 6I 741 N RESP I 64.91 27.01 8.11 100.0I % OF CYCLE I ------------ I ------------ I ------------ I ------------ I
8 I 951. 231 51 1231 a RESP 1 77.21 18.71 4.1I 100.0I % OF CYCLE I ------------ I ------------ I ------------ I ------------ I
SUMI 5221 1151 411 6781 N RESP 1 77.01 17.01 6.0I 100.01 % OF CYCLE I ------------ I ------------ I ------------ I ------------ I
STATISTICS BASED ON RAW FREQUENCY
CHI SQUARE = 142855 E 02 DEGREES OF FREEDOM = 14
CONT COEF = .143650
6
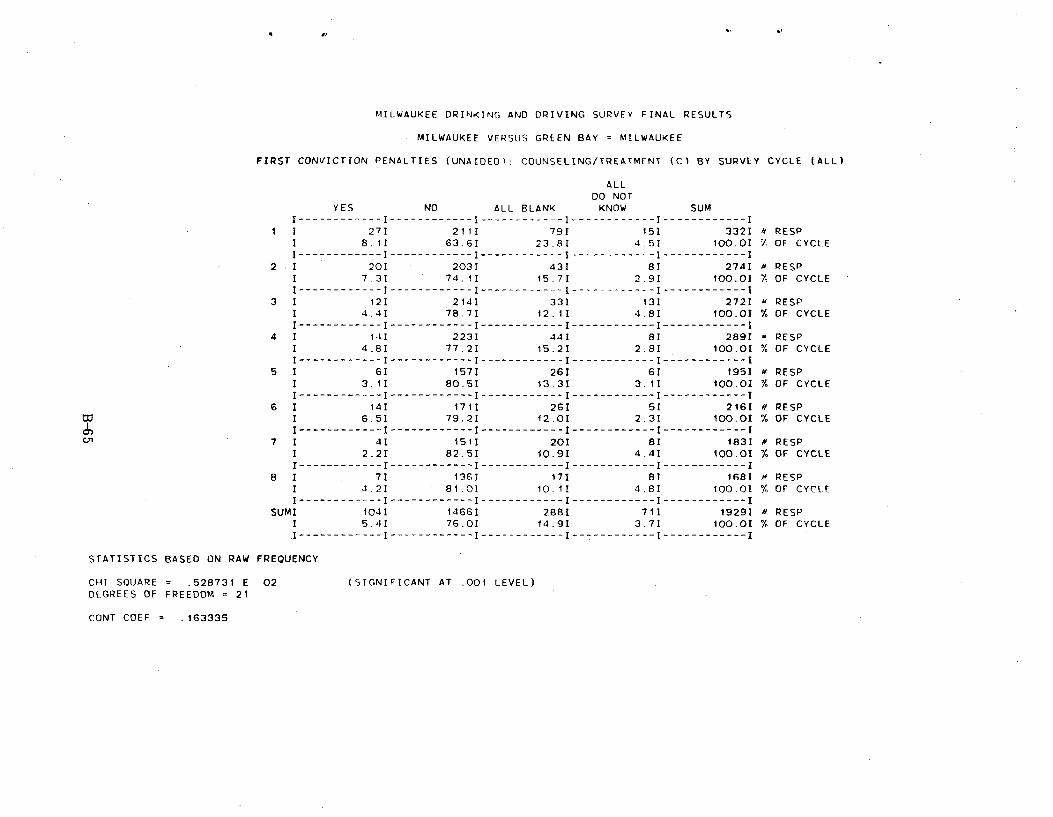
MILWAUKEE DRINKING AND DRIVING SURVEY FINAL RESULTS
MILWAUKEE VERSUS GREEN BAY = MILWAUKEE
FIRST CONVICTION PENALTIES (UNAIDED): COUNSELING/TREATMENT (C) BY SURVEY CYCLE (ALL)
ALL DO NOT
YES NO ALL BLANK KNOW SUM I------------ I ------------ I ------------ I ------------ I ------------ I
1 I 27I 211I 79I 15I 332I a RESP 1 8.11 63.61 23.81 4.51 100.01 %: OF CYCLE I ------------ I ------------ I ------------ I ------------ I ------------ I
2 I 201 2031 431 8I 2741 # RESP I 7.31 74.11 15.71 2.9I 100.0I % OF CYCLE I ------------ I ------------ I ------------ I ------------ I ------------ I
3 I 12I 214I 33I 13I 272I a RESP I 4.41 78.71 12.11 4.81 100.01 % OF CYCLE I ------------ I ------------ I ------------ I ------------ I ------------ I
4 I 141 2231 441 81 2891 n PESP I 4.81 77.21 15.21 2.81 100.01 % OF CYCLE I ------------ I ------------ I ------------ I ------------ I ------------ I
5 1 61 1571 261 61 1951 N RESP I 3.11 80.51 13.31 3.11 100.01 % OF CYCLE I------------ I ------------ I ------------ I ------------ I ------------ I
6 I 141 1711 26I 51 2161 a RESP I 6.51 79.21 12.01 2.31 100.01 % OF CYCLE I ------------ I ------------ I ------------ I ------------ I ------------ I
7 1 41 151I 201 8I 1831 a PESP I 2.21 82.51 10.9I 4.41 100.02 % OF CYCLE I ------------ I ------------ I ------------ I ------------ I ------------ I
8 I 71 136I 171 8I 1681 PESP I 4.21 81.01 10.1I 4.81 100.01 % OF CYCLE I ------------ I ------------ I ------------ I ------------ I ------------ I
SUMI 104I 1466I 2881 711 1929I a RESP I 5.41 76.01 14.91 3.71 100.01 % OF CYCLE I ------------ I ------------ I ------------ I ------------ I ------------ I
STATISTICS BASED ON RAW FREQUENCY
CHI SQUARE = .528731 E 02 (SIGNIFICANT AT .001 LEVEL) DEGREES OF FREEDOM = 21
CONT COEF = .163335
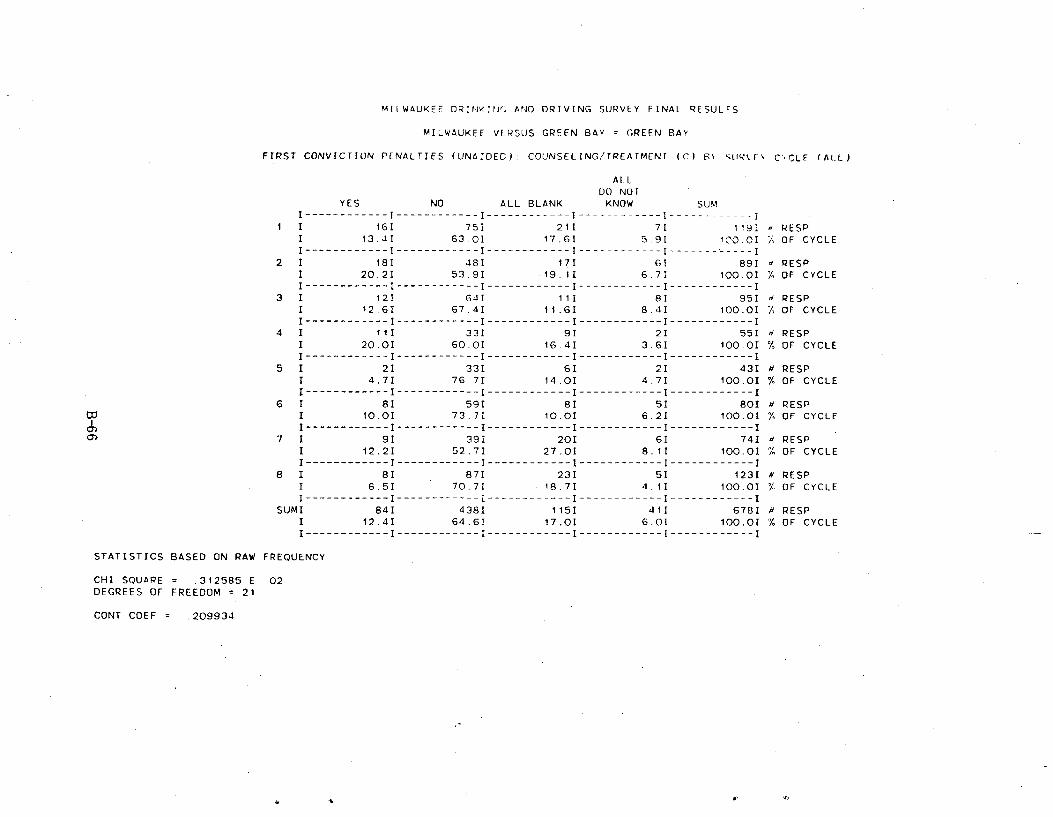
MILWAUKEE DRINKIIJc AND DRIVING SURVEY FINAL RESULTS
MILWAUKEE VERSUS GREEN BAY = GREEN BAY
FIRST CONVICTION PENALTIES (UNAIDED): COUNSELING/TREATMENT (C) FS `lfR.i, C',CLE (ALL)
ALL
DO NOT
YES NO ALL BLANK KNOW SUM
I------------ I ------------ I ------------ I ------------ I ------------I
I I 16I 75I 211 71 1191 RESP I 13.4I 63.01 17.61 5.91 100.01 i- OF CYCLE I ------------ I ------------ I ------------ I ------------ I ------------ I
2 I 181 481 171 61 891 RESP I 20.21 53.91 19.11 6.71 100.01 % OF CYCLE I ------------ I ------------ I ------------ I ------------ I ------------ I
3 1 121 64I 11I 81 951 4 RESP I 12.61 67,41 11.6I 8.4I 100.01 % OF CYCLE I ------------ I ------------ I ------------ I ------------ I ------------ I
4 I 111 331 91 21 551 4 RESP I 20.01 60.OI 16.4I 3.6I 100.01 % OF CYCLE I ------------ I ------------ I ------------ I ------------ I ------------ I
5 I 21 331 61 21 431 a RESP I 4.71 76.7I 14.01 4.71 100.01 % OF CYCLE I ------------ I ------------ I ------------ I ------------ I ------------ I
6 I 81 591 81 51 801 a RESP I 10.01 73.71 10.01 6.21 100.01 OF CYCLE I------------ I ------------ I ------------ I ------------ I ------------I
7 I 91 391 201 6I 741 a RESP I 12.21 52.7I 27.01 8.11 100.01 % OF CYCLE I ------------ I ------------ I ------------ I ------------ I ------------ I
8 I 81 871 231 51 1231 a RESP I 6.5I 70.71 18.7I 4.11 100.0I % OF CYCLE I ------------ I ------------ I ------------ I ------------ I ------------ I
SUMI 84I 438I 115I 41I 678I # RESP I 12.41 64.61 17.01 6.01 100.01 % OF CYCLE I ------------ I ------------ I ------------ I ------------ I ------------ I
STATISTICS BASED ON RAW FREQUENCY
CHI SQUARE = .312585 E 02 DEGREES OF FREEDOM = 21
CONT COEF = .209934
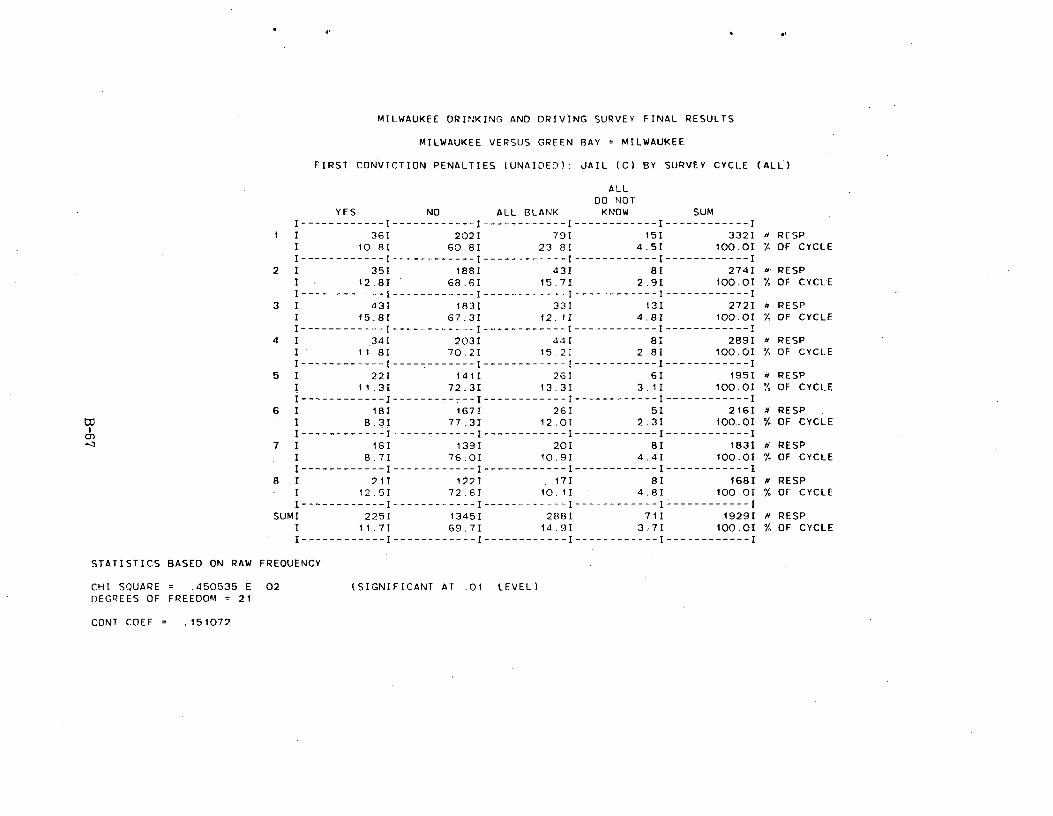
N
MILWAUKEE DRINKING AND DRIVING SURVEY FINAL RESULTS
MILWAUKEE VERSUS GREEN BAY = MILWAUKEE
FIRST CONVICTION PENALTIES (UNAIDED): JAIL (C) BY SURVEY CYCLE (ALL)
ALL DO NOT
YES NO ALL BLANK KNOW SUM I ------------- I ------------ I ------------ I ------------ I ------------ I
I I 36I 2021 791 151 3321 RESP I 10.81 60.81 23.81 4.51 100.01 % OF CYCLE I------------ I ------------ I ------------ I ------------ I ------------ I
2 I 351 1881 431 81 2741 a RESP I 12.81 68.61 15.7I 2.91 100.0I % OF CYCLE I ------------ I ------------ I ------------ I ------------ I ------------ I
3 I 43I 183I 33I 13I 2721 a RESP 1 15.81 67.31 12.1I 4.8I 100.0I 7 OF CYCLE I ------------ I ------------ I ------------ I ------------ I ------------ I
4 I .341 2031 441 81 2891 u RESP I 11.81 70.21 15.21 2.81 100.01 7, OF CYCLE I------------ I ------------ I ------------ I ------------ I ------------ I
5 I 221 1411 26I 6I 1951 a RESP I 11.31 72.31 13.31 3.11 100.01 OF CYCLE I ------------ I ------------ I ------------ I ------------ I ------------ I
6 I 181 1671 261 51 2161 a RESP I 8.31 77.31 12.01 2.31 100..0I % OF CYCLE I ------------ I ------------ I ------------ I ------------ I ------------ I
7 I 161 1391 201 81 1831 a RESP I 8.71 76:0I 10.91 4.41 100.01 % OF CYCLE I ------------ I ------------ I ------------ I ------------ I ------------ I
8 1 21I 122I 17I 8I 1681 a RESP I 12.51 72.6I 10.11 4.81 100.01 % OF CYCLE I ------------ I ------------ I ------------ I ------------ I ------------ I
SUMI 225I 1345I 288I 71I 19291 a PESP 1 11.71 69.71 14.91 3.7I 100.01 % OF CYCLE I ------------ I ------------ I ------------ I ------------ I ------------ I
STATISTICS BASED ON RAW FREQUENCY
CHI SQUARE = .450535 E 02 (SIGNIFICANT AT .01 LEVEL) DEGREES OF FREEDOM = 21
CONT COEF = .151072
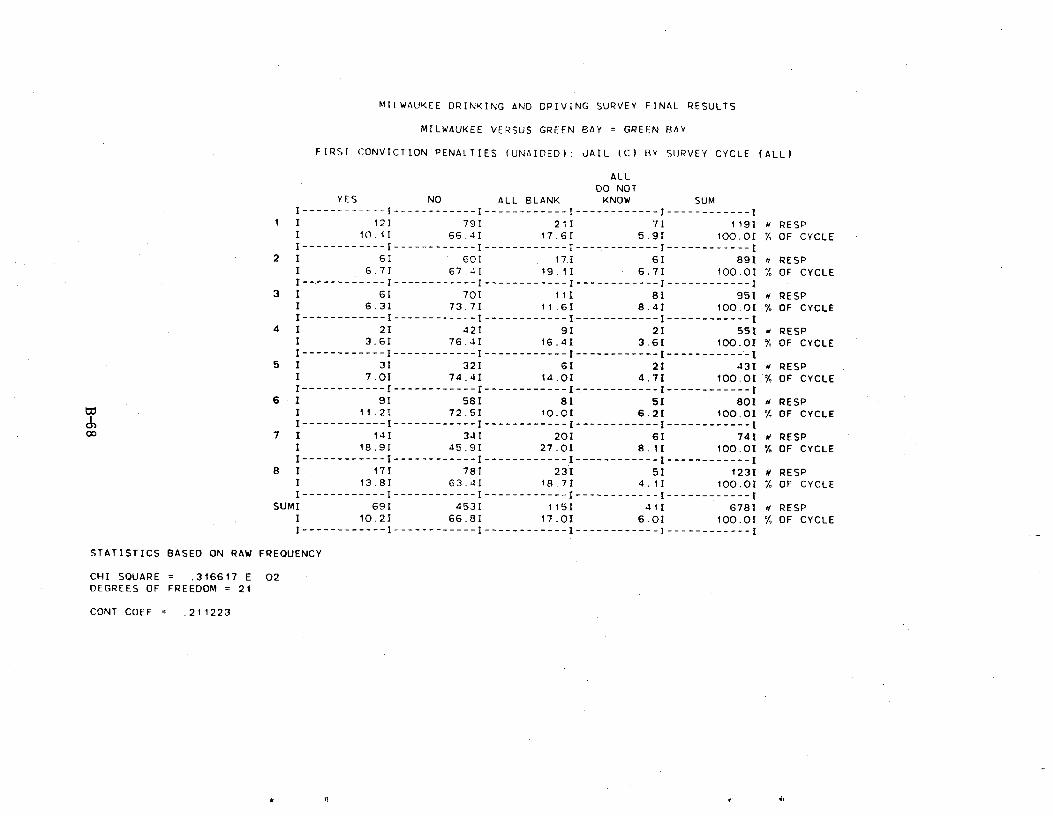
MILWAUKEE DRINKING AND DPIVING SURVEY FINAL RESULTS
MILWAUKEE VERSUS GREEN BAY = GREEN BAY
FIRST CONVICTION PENALTIES (UNAIDED): JAIL (C) BY SURVEY CYCLE (ALL)
ALL DO NOT
YES NO ALL BLANK KNOW SUM
I ------------ I ------------ I ------------ I ------------ I ------------I I I 121 791 211 71 1191 o RESP
I 10.1I 66.4I 17.61 5.91 100.01 % OF CYCLE I------------ I ------------ I ------------ I ------------ I ------------ I
2 I 6I 601 17.I 61 891 # RESP I 6.71 67.41 19.1I 6.7I 100.0I % OF CYCLE I ------------ I ------------ I ------------ I ------------ I ------------ I
3 I 61 701 III 81 951 a RESP I 6.3I 73.71 11,61 8.41 100.01 % OF CYCLE I ------------ I ------------ I ------------ I ------------ I ------------ I
4 I 21 421 91 21 551 RESP I 3.61 76.4I 16.41 3.61 100.01 q OF CYCLE I ------------ I ------------ I ------------ I ------------ I ------------I
5 I 31 321 61 21 431 w RESP I 7.0I 74.41 14.0I 4.71 100.01 % OF CYCLE I ------------ I ------------ i ------------ I ------------ I ------------ I
6 I 91 581 81 51 801 # RESP I 11.21 72.51 10.01 6.21 100.01 % OF CYCLE I ------------ I ------------ I ------------ I ------------ I ------------ I
7 I 141 341 201 61 741 # RESP I 18.9I 45.9I 27.01 8.11 100.01 % OF CYCLE I ------------ I ------------ I ------------ I ------------ I ------------ I
8 1 171 781 231 51 1231 # RESP I 13.81 63.41 18.71 4.11 100.0I % OF CYCLE I ------------ I ------------ I ------------ I ------------ I ------------ I
SUMI 69I 4531 115I 41I 678I # RESP I 10.21 66.81 17.01 6.01 100.01 % OF CYCLE I------------ I ------------ I ------------ I ------------ I ------------ I
STATISTICS BASED ON RAW FREQUENCY
CHI SQUARE = .316617 E 02 DEGREES OF FREEDOM = 21
CONT COEF = .211223
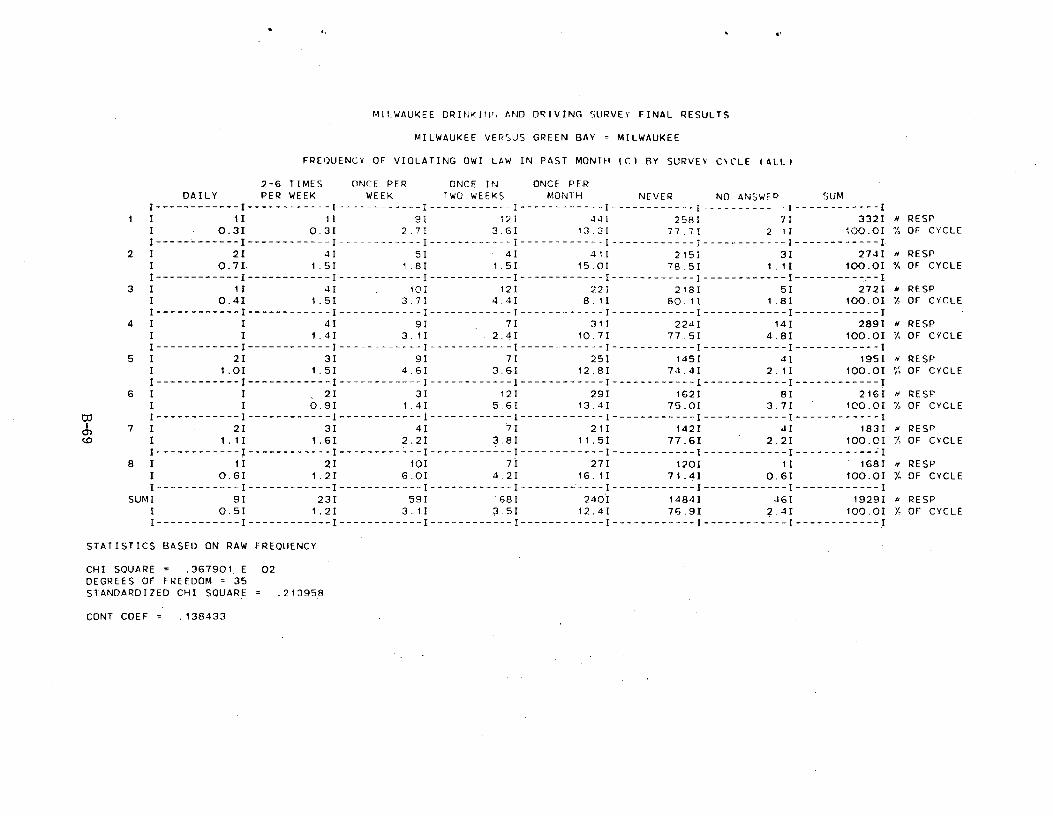
MILWAUKEE DRINKItU. AND DRIVING SURVEY FINAL RESULTS
MILWAUKEE VER;US GREEN BAY = MILWAUKEE
FREQUENCY OF VIOLATING DWI LAW IN PAST MONTH (C) BY SURVEY CYCLE (ALL)
2-6 TIMES ONCE PER ONCE IN ONCE PER DAILY PER WEEK WEEK TWO WEEKS MONTH NEVER NO ANSWEP SUM
I ------------ I ------------ I ------------ I ------------ I ------------ I ------------ I ------------ I ------------I I I II 11 9I 12I 441 2581. 7I 3321 # RESP
I 0.31 0.31 2.7I 3.61 13.3I 77.71 2 1I 100.0I OF CYCLE I ------------ I ------------ I ------------ I ------------ I -----------I------------I------------I------------I
2 I 2I 4I 5I 4I 411 2151 3I 2741 RESP I 0.71 1.5I 1.8I 1.5I 15.0I 78.5I 1.1I 100.01 % OF CYCLE I ------------ I ------------ I ------------ I ------------ I ------------ I ------------ I ------------ I ------------ I
3 I 1I 4I 10I 121 22I 218I 5I 2721 a RESP I 0.4I 1.51 3.7I 4.4I 8.11 80.11 1.81 100.01 Y OF CYCLE I------------ I ------------ I ------------ I ------------ I ------------ I ------------ I ------------ I ------------ I
4 1 I 41 9I 7I 31I 224I 141 289I U RESP I I 1,41 3.1I 2.41 10.71 77.51 4.81 100.01 % OF CYCLE I ------------ I ------------ I ------------ I ------------ I ------------ I ------------ I ------------ I ------------ I
5 I 21 31 9I 7I 251 145I 41 195I . RESP I 1.01 1.5I 4.6I 3.61 12.8I 74.4I 2.11 100.0I % OF CYCLE I ------------ I ------------ I ------------ I ------------ I ------------ I ------------ I ------------ I ------------ I
6 I I 21 3I 12I 29I 162I 8I 216I RESP I I 0.91 1.41 5.61 13,41 75.01 3.71 100.01 OF CYCLE
Cz7 I------------ I ------------ I ------------ I ------------ I ------------ I ------------ I ------------ I ------------ I 0, 7 I 2I 31 41 7I 211 1421 41 1831 RESP co I 1.11 1.61 2.21 3.81 11.51 77.61 2.21 100.01 ;! OF CYCLE
I ------------ I ------------ I ------------I ------------ I ------------ I ------------ I ------------ I -----------=I 8 I 1I 21 10I 71 27I 120I 1I 1681 RESP
I 0.6I 1.2I 6.0I 4.21 16.1I 71.41 0.6I 100.0I . OF CYCLE I ------------ I ------------ 'I ------------ I ------------ I ------------ I ------------ I ------------ I ------------ I
SUMI 9I 231 59I 681 240I 14841 46I 19291 e RESP I 0.51 1.2I 3.11 3.5I 12.4I 76.91 2.4I 100.0I '/ OF CYCLE I ------------ I ------------ I ------------ I ------------ I ------------ I ------------ I ------------I ------------ I
STATISTICS BASED ON RAW FREQUENCY
CHI SQUARE = .367901. E 02DEGREES OF FREEDOM = 35STANDARDIZED CHI SQUARE = .213958
CONT COEF = .138433
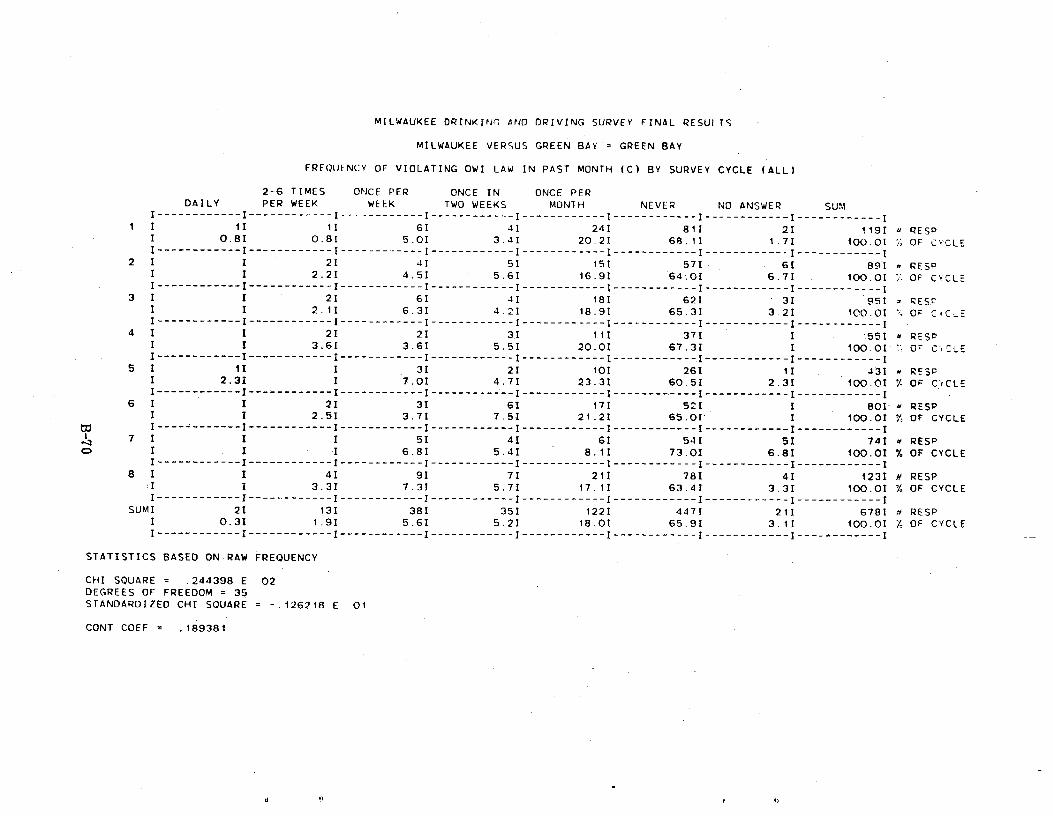
MILWAUKEE DRINKING AND DRIVING SURVEY FINAL RESULTS
MILWAUKEE VERSUS GREEN BAY = GREEN BAY
FRFOUFNCY OF VIOLATING DWI LAW IN PAST MONTH (C) BY SURVEY CYCLE (ALL)
2-6 TIMES ONCE PER ONCE IN ONCE PER DAILY PER WEEK WEEK TWO WEEKS MONTH NEVER NO ANSWER SUM
I ------------- I ------------ I ------------ I ------------ I ------------ I ------------ I ------------ I ------------I I I 1I 1I 6I 4I 241 81I 21 1191 u PESP
I 0.81 0.81 5.01 3.41 20.21 68.11 1.71 100.0I ;;. OF CYCLE I------------ I ------------ I ------------ I ------------ I ------------ I ------------ I ------------ I ------------ I
2 I 1 2I 4I 5I 15I 57I 61 891 - RESP I I 2.2I 4.51 5.61 16.9I 64.01 6.7I 100.01 OF C'rCLE I------------ I------------ I ------------ I ------------ I ------------ I ------------ I ------------ I ------------ I
3 I I 2I 6I 4I 18I 62I 31 951 RESP I I 2.11 6.3I 4.21 18.91 65.31 3.21 100.0I OF CTC_E I------------ I------------ I ------------ I ------------ I ------------ I ------------ I ------------ I ------------ I
4 I I 21 21 31 11I 371 I 55I RESP I I 3.61 3.61 5.51 20.01 67.31 1 0;7 100.01 C<.-LE I ------------ I ------------ I ------------ I ------------ I ------------ I -------------I ------------ I ------------ I
5 I 1I I 3I 21 10I 26I 1I 431 a RESP I 2.31 I 7.0I 4.7I 23.31 60.5I 2.31 100.01 Y OF C',CLE I ------_------ I ------------ I ------------ I ------------ I ------------ I ------------------- I ------------ I --
6 I I 21 3I 6I 171 521 1 80I- RESP I I 2.51 3.71 7.5I 21.21 65.01 I 100.0I OF CYCLE
trJ I ------------ I ------------ I ------------ I ------------ I ------------ I ------------ I ------------ I ------------ I 7 I I I 51 41 61 541 51 741 a RESP
I I 1 6.81 5.41 8.11 73.01 6.81 100.01 % OF CYCLE I ------------ I ------------ I ------------ I ------------ I ------------ I ------------ I ------------ I ------------ I
8 1 I 4I 9I 7I 211 78I 4I 123I # RESP I I 3.31 7.31 5.71 17.11 63.41 3.31 100.01 % OF CYCLE I ------------ I ------------ I ------------ I ------------ I ------------ I ------------ I ------------ I ------------ I
SUMI 2I 13I 38I 35I 1221 447I 211 678I # RESP I 0.31 1.91 5.61 5.21 18.01 65.91 3.1I 100.01 7 OF CYCLE I ------------ I ------------ I ------------ I ------------ I ------------ I ------------ I ------------ I ------------ I
STATISTICS BASED ON RAW FREQUENCY
CHI SQUARE = .244398 E 02DEGREES OF FREEDOM = 35STANDARDIZED CHI SQUARE = -.126218 E 01
CONT COEF = .189381
0
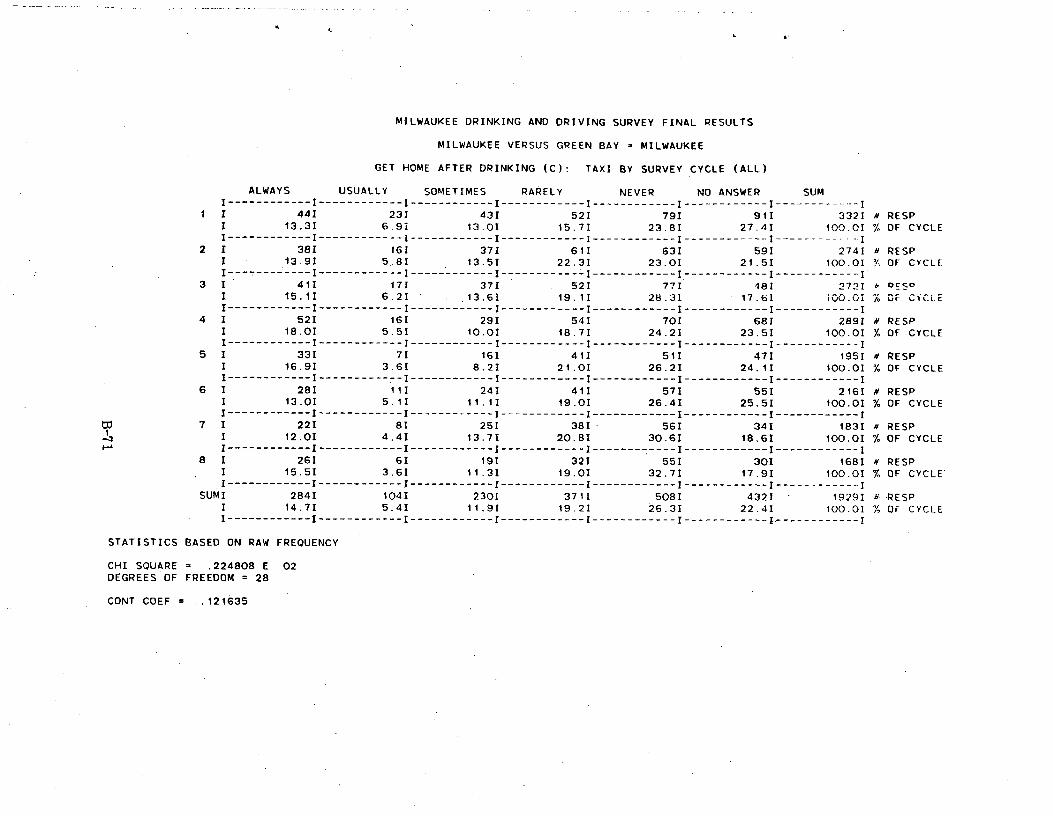
MILWAUKEE DRINKING AND DRIVING SURVEY FINAL RESULTS
MILWAUKEE VERSUS GREEN BAY = MILWAUKEE
GET HOME AFTER DRINKING (C): TAXI BY SURVEY CYCLE (ALL)
ALWAYS USUALLY SOMETIMES RARELY NEVER NO ANSWER SUM I------------ I ------------ I ------------ I ------------ I ------------ I ------------ I ------------ I
1 1 44I 23I 431 521 791 911 332I N RESP I 13.31 6.9I 13.0I 15.7I 23.81 27.41 100.0I % OF CYCLE I ------------ I ------------ I ------------ I ------------ I ------------ I ------------ I ------------ I
2 I 38I 161 371 611 631 591 274I N RESP I 13.91 5.81 13.5I 22.31 23.01 21.5I 100.01 % OF CYCLE I------------I------------I------------I------------I------------I------------I------------1
3 I 411 17I 371 521 771 481 2721 DESD I 15.11 6.2I .13.61 19.11 28.31 17.61 i00.0I 7 OF CYCLE I------------ I ------------ I ------------ I ------------ I ------------ I ------------ I ------------ I
4 I 521 16I 29I 54I 701 681 2891 a RESP 1 18.0I 5.51 10.01 18.71 24.2I 23.51 100.0I % OF CYCLE I ------------ I ------------ I ------------ I ------------ I ------------ I ------------ I ------------ I
5 I 331 7I 16I 41I 51I 47I 1951 N RESP I 16.9I 3.61 8.21 21.0I 26.2I 24.11 100.0I % OF CYCLE I------------ I ------------ I ------------ I ------------ I ------------ I ------------ I ------------ I
6 I 281 11I 241 41I 571 55I 2161 N RESP I 13.01 5.1I 11.1I 19.01 26.41 25.51 100.0I % OF CYCLE I ------------ I ------------ I ------------ I ------------ I ------------ I ------------ I ------------ I
7 1 221 81 25I 38I 56I 341 1831 N RESP 1 12.01 4.41 13.71 20.81 30.GI 18.61 100.01 % OF CYCLE I------------I------------I------------I------------I------------I------------I------------1
8 I 261 61 19I 32I 55I 301 1681 N RESP I 15.5I 3.6I 11.31 19.0I 32.7I 17.9I 100.01 % OF CYCLE I ------------ I ------------ I ------------ I ------------ I ------------ I ------------ I ------------ I
SUMI 2841 1041 230I 371I 508I 4321 19291 u RESP I 14.7I 5.4I 11.9I 19.2I 26.3I 22.41 100.0I 3141 OF CYCLE I------------I------------I------------I------------I------------I------------1------------I
STATISTICS BASED ON RAW FREQUENCY
CHI SQUARE _ .224808 E 02 DEGREES OF FREEDOM = 28
CONT COEF = .121635
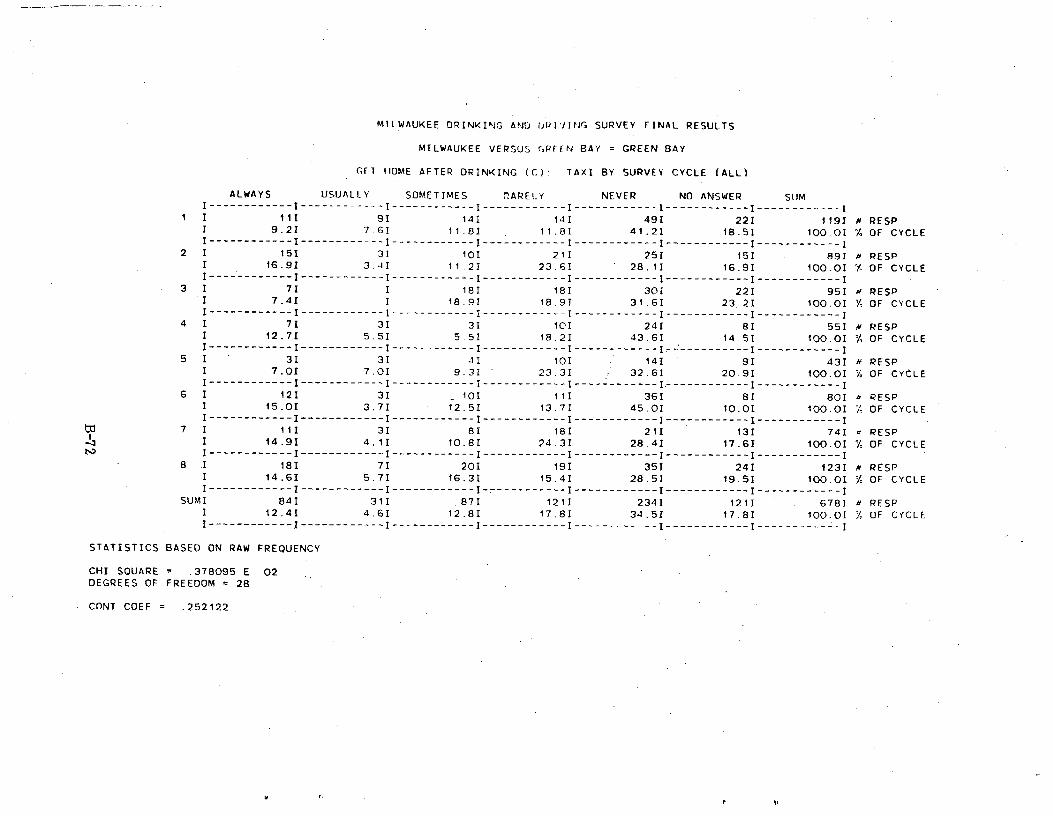
MILWAUKEE DRINKING AND I,PIVING SURVEY FINAL RESULTS
MILWAUKEE VERSUS ,PEEN BAY = GREEN BAY
GET HOME AFTER DRINKING (C): TAXI BY SURVEY CYCLE (ALL)
ALWAYS USUALLY SOMETIMES ^ARELY NEVER NO ANSWER SUM I ------------ I------------ I ------------ I ------------ I ------------ I ------------ I------------ I
1 I 11I 9I 141 14I 491 22I 1191 RESP 1 9.21 7.6I 11.81 11.81 41.21 18.5I 100.0I / OF CYCLE I------------I------------I------------I------------I------------I------------I------------1
2 I 151 3I 10I 21I 251 15I 891 RESP I 16.91 3.4I 11.2I 23.6I 28.1I 16.9I 100.0I A OF CYCLE I ------------ I ------------ I ------------ I ------------ I ------------ I ------------ I ------------ I
3 1 71 I 18I 181 301 22I 951 RESP I 7.4I I 18.9I 18.91 31.61 23.2I 100.0I OF CYCLE I ------------ I ------------ I ------------ I ------------ I ------------ I ------------ I ------------ I
4 I 7I 3I 3I 10I 241 81 551 # RESP I 12.71 5.51 5.51 18.21 43.6I 14.51 100.0I % OF CYCLE I------------ I ------------ I ------------ I ------------ I -----=------ I.------------ I ------------ I
5 1 3I 3I 41 10I 14I 9I 431 r RESP I 7.01 7.01 9.31 23.31 32.61 20.91 100.0I OF CYCLE I------------I------------I------------I------------I------------1=-----------I------------I
6 I 121 31 ._ 10I 11I 361 81 80I b RESP I 15.0I 3.71 12.5I 13.7I 45.0I 10.0I 100.0I OF CYCLE I------------ I ------------ I ------------ I ------------ I ------------ I ------------ I ------------ I
7 I 11I 3I 8I 18I 21I 131 74I RESP I 14.91 4.1I 10.8I 24.31 28.41 17.61 100.0I % OF CYCLE I------------ I ------------ I ------------ I ------------ I ------------ I ------------ I ------------ I
8 .I 181 7I 201 19I 35I 24I 123I H RESP I 14.61 5.7I 16.3I 15.4I 28.51 19.51 100.01 % OF CYCLE I ------------ I ------------ I ------------ I ------------ I ------------ I ------------ I ------------ I
SUMI 84I 31I 87I 121I 234I 1211 6781 RESP I 12.41 4.6I 12.8I 17.8I 34.51 17.81 100.0I 7 OF CYCLE I------------ I ------------ I ------------ I ------------ I ------------ I ------------ I ------------ I
STATISTICS BASED ON RAW FREQUENCY
CHI SQUARE = .378095 E 02 DEGREES OF FREEDOM = 28
CONT COEF = .252122
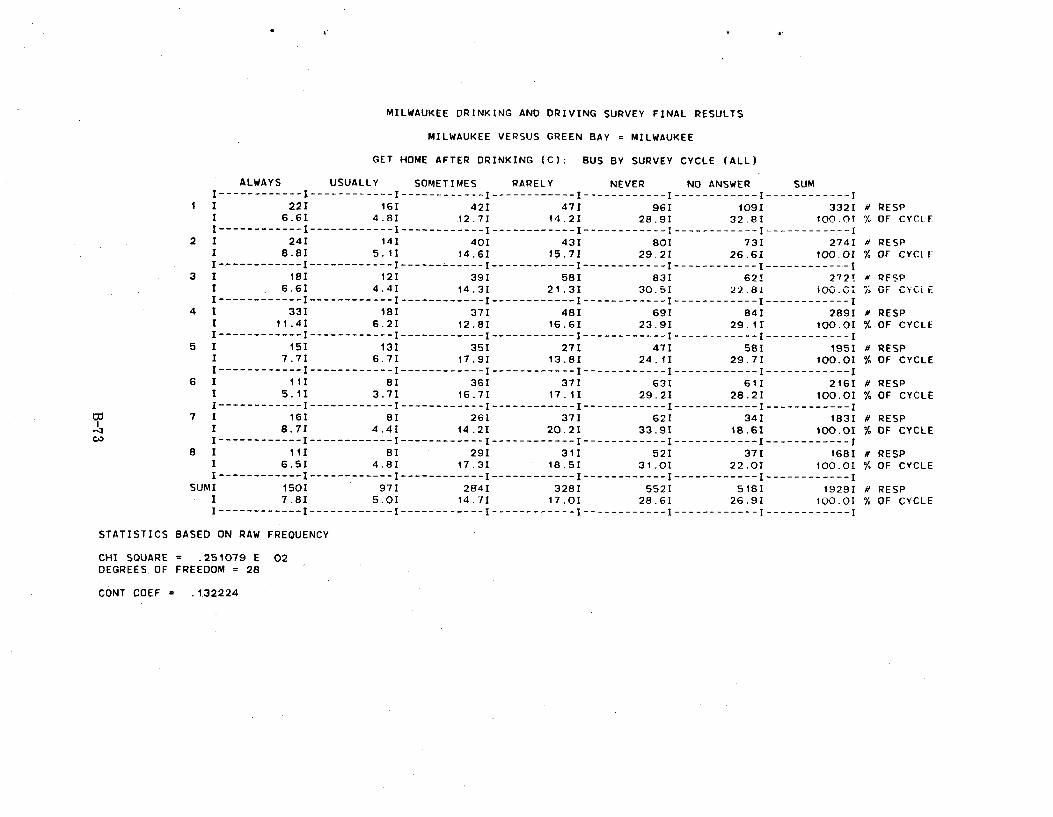
MILWAUKEE DRINKING AND DRIVING SURVEY FINAL RESULTS
MILWAUKEE VERSUS GREEN BAY = MILWAUKEE
GET HOME AFTER DRINKING (C): BUS BY SURVEY CYCLE (ALL)
ALWAYS USUALLY SOMETIMES RARELY NEVER NO ANSWER SUM I------------I------------I------------I------------I------------I------------I------------1
1 I 22I 16I 42I 47I 96I 1091 3321 H RESP I 6.6I 4.8I 12.7I 14.2I 28.9I 32.81 100.01 % OF CYCLE I------------ I ------------ I ------------ I ------------ I ------------ I ------------ I ------------ I
2 I 24I 141 40I 431 80I 73I 274I N RESP I 8.8I 5.1I 14.6I 15.7I 29.21 26.6I 100.01 % OF CVCIF I ------------ I ------------ I ------------I------------ I ------------ I ------------ I ------------ I
3 I 18I 121 39I 58I 83I 621 2721 N RfSP I 6.6I 4.4I 14.3I 21.31 30.5I 22.81 100.01 i^ GF CrCiF I ------------ I ------------ I ------------ I ------------ I ------------ I ------------ I ------------ I
4 I 33I 181 37I 48I 69I 841 2891 a RESP I 11.42 6.2I 12.8I 16.6I 23.9I 29.1I 100.01 % OF CYCLE I ------------ I ------------ I ------------ I ------------ I ------------ I ------------ I ------------ I
5 I 15I 13I 35I 27I 47I 58I 195I # RESP I 7.71 6.7I 17.9I 13.8I 24.1I 29.7I 100.0I % OF CYCLE I ------------ I ------------ I ------------ I ------------ I ------------ I ------------ I ------------ I
6 I III 8I 36I 37I 631 61I 2161 H RESP I 5.11 3.71 16.7I 17.1I 29.2I 28.21 100.0I % OF CYCLE I------------ I ------------ I ------------ I ------------ I ------------ I ------------ I ------------ I
Gd 7 I 16I 8I 26I 37I 621 34I 183I H RESP .13 1 8.71 4.4I 14.2I 20.2I 33.9I 18.6I 100.01 % OF CYCLE W I ------------ I ------------ I ------------ I ------------ I ------------ I ------------ I ------------ I
8 I 11I 8I 29I 311 52I 37I 168I H RESP I 6.51 4.81 17.31 18.51 31.01 22.01 100.01 % OF CYCLE I ------------ I ------------ I ------------ I ------------ I ------------ I ------------ I ------------ I
SUMI 150I 971 294I 328I 552I 5181 1929I H RESP I 7.8I 5.0I 14.7I 17.0I 28.61 26.9I 100.0I % OF CYCLE I------------ I ------------ I ------------ I ------------ I ------------ I ------------ I ------------ I
STATISTICS BASED ON RAW FREQUENCY
CHI SQUARE _ .251079 E 02DEGREES. OF FREEDOM = 28
CONT COEF = .132224
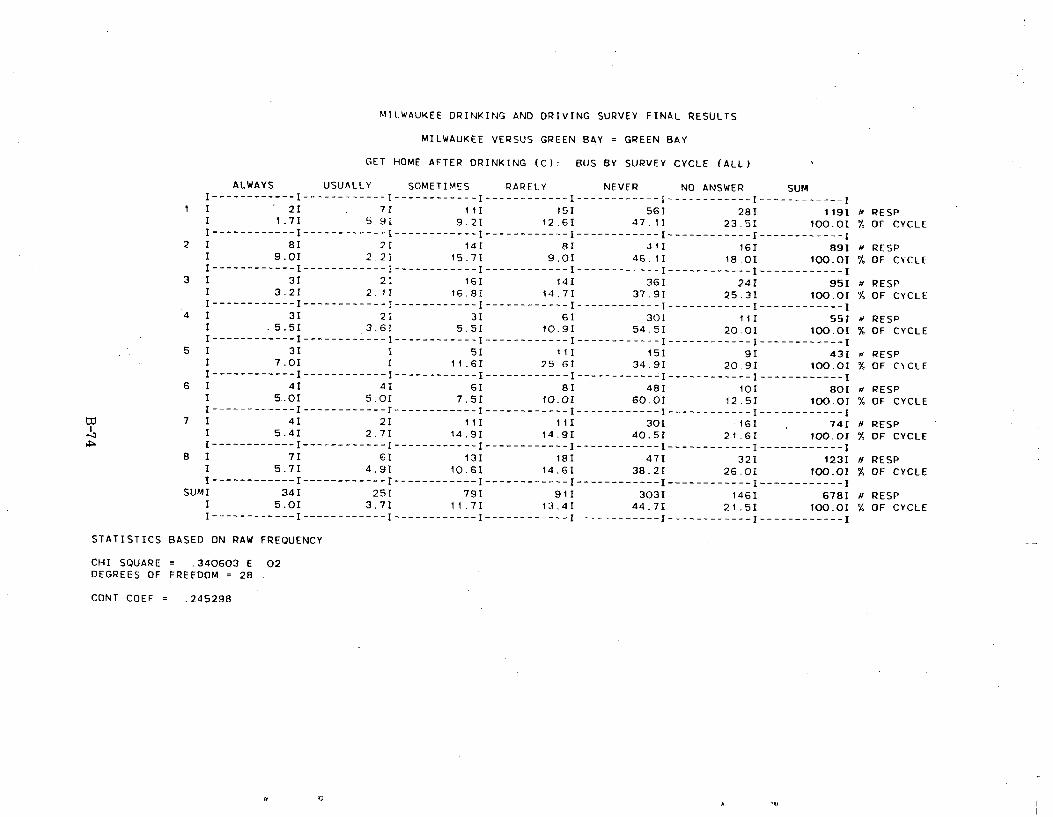
MILWAUKEE DRINKING AND DRIVING SURVEY FINAL RESULTS
MILWAUKEE VERSUS GREEN BAY = GREEN BAY
GET HOME AFTER DRINKING (C): BUS BY SURVEY CYCLE (ALL)
ALWAYS USUALLY SOMETIMES RARELY NEVER NO ANSWER SUM I ------------ I ------------ I ------------ I ------------ I ------------ I ------------ I -----------I
1 1 2I 71 III 15I 56I 28I 119I if RESP 1 1.71 5.91 9.21 12.61 47.11 23.51 100.01 % OF CYCLE I------------I------------I------------I------------I------------I------------I------------1
2 I 8I 2I 141 8I 411 16I 89I if RESP I 9.01 2.21 15.71 9.01 46.11 18.01 100.01 % OF CYCLE I------------I------------I------------I------------I------------I------------I------------1
3 I 3I 2I 16I 14I 361 24I 95I if RESP 1 3.2I 2.1I 16.81 14.7I 37.9I 25.3I 100.01 % OF CYCLE I ------------ I ------------ I ------------ I ------------ I ------------ I ------------ I ------------ I
4 I 3I 2I 3I 61 301 111 551 a PESP I .5.51 3.6I 5.51 10.91 54.51 20.01 100.01 OF CYCLE I------------ I ------------ I ------------ I ------------ I ------------ I ------------ I ------------ I
5 I 31 I 51 11I 151 9I 431 RESP 1 7.01 1 11.61 25.61 34.9I 20.9I 100.0I % OF CYCLE I ------------ I ------------ I ------------ I ------------ I ----------- =I ------------ I ------------ I
6 1 4I 4I 61 8I 48I 10I 801 a RESP I 5..0I 5.01 7.5I 10.0I 60.0I 12.5I 100.01 % OF CYCLE I ------------ I ------------ I ------------ I ------------ I ------------ I ------------ I ------------ 1
7 I 41 21 III 11I 301 16I 741 a RESP I 5.4I 2.71 14.91 14.91 40.51 21.GI 100.01 OF CYCLE I ------------ I ------------ I ------------ I ------------ I ------------ I ------------ I ------------ I
B I 7I 6I 13I 18I 47I 32I 123I N RESP 1 5.7I 4.9I 10.6I 14.6I 38.2I 26.01 100.0I % OF CYCLE I ------------ I ------------ I ------------ I ------------ I ------------ I ------------ I ------------ I
SUMI 34I 25I 79I 91I 303I 146I 678I a RESP I 5.0I 3.7I 11.7I 13.4I 44.7I 21.5I 100.01 % OF CYCLE I ------------ I ------------ I ------------ I ------------ I ------------ I ------------ I ------------ I
STATISTICS BASED ON RAW FREQUENCY
CHI SQUARE = .340603 E 02 DEGREES OF FREEDOM = 28 .
CONT COEF = .245298
.11
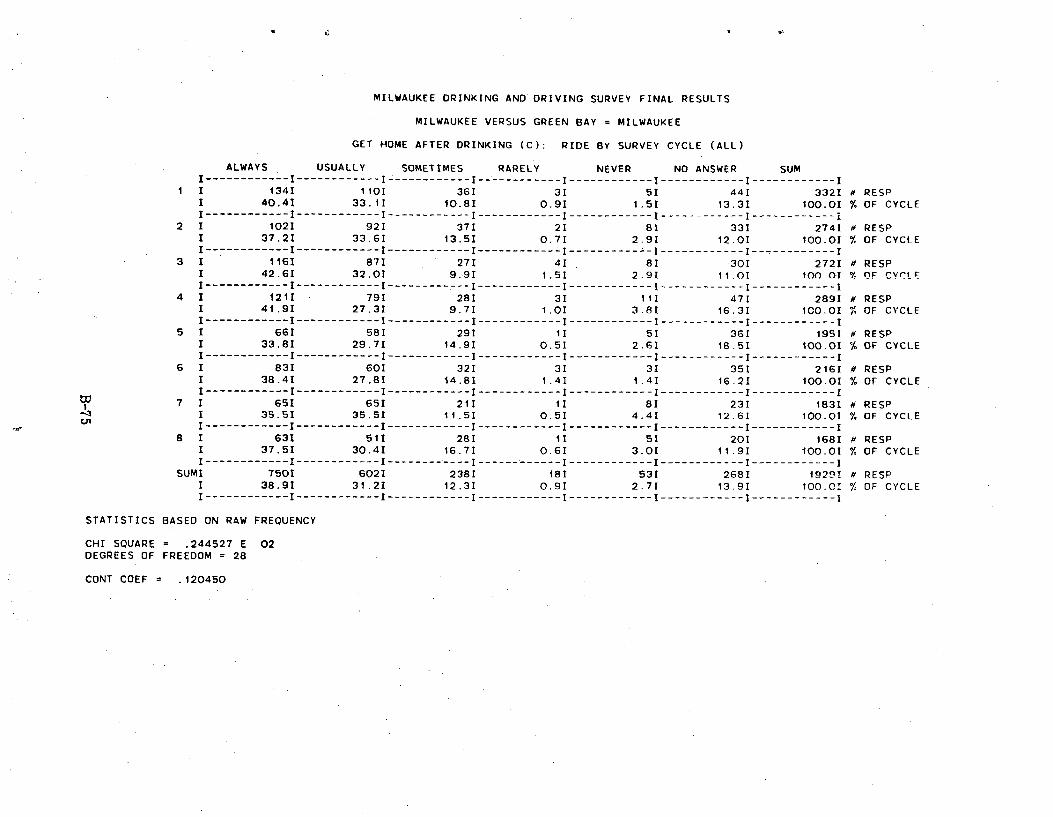
MILWAUKEE DRINKING AND DRIVING SURVEY FINAL RESULTS
MILWAUKEE VERSUS GREEN BAY = MILWAUKEE
GET HOME AFTER DRINKING (C): RIDE BY SURVEY CYCLE (ALL)
ALWAYS . USUALLY SOMETIMES RARELY NEVER NO ANSWER SUM I ------------ I ------------ I ------------ I ------------ I ------------ I ------------ I ------------ I
1 I 1341 1101 36I 31 5I 44I 332I # RESP I 40.41 33,11 10.8I 0.91 1.51 13.31 100.01 % OF CYCLE I ------------ I ------------ I ------------ I ------------ I ------------ I ------------ I ------------ i
2 I 102I 921 37I 2I 81 331 274I a RESP I 37.21 33.61 13,51 0.71 2.91 12.01 100.01 % OF CYCLE I------------ I ------------ I ------------ I ------------ I ------------ I ------------ I ------------ I
3 I 1161 87I 27I 41 8I 301 272I a RESP I 42.61 32.01 9.91 1.51 2.91 11.01 100 of G OF CYCLE I ------------ I ------------ I ------------ I ------------ I ------------ I ------------ I ------------ I
4 I 1211 79I 28I 31 11I 47I 289I a RESP I 41.91 27.31 9.71 1.01 3.81 16.31 ICO.OI i OF CYCLE I ------------ I ------------ I ------------ I ------------ I ------------ I ------------ I ------------ I
5 I 66I 58I 29I 1I 5I 36I 195I a RESP I 33.81 29.71 14.91 0.51 2.61 18.51 100.0I % OF CYCLE I ------------ I ------------ I ------------ I ------------ I ------------ I ------------ I ------------ I
6 I 831 60I 32I 3I 3I 35I 216I a RESP I 38.4I 27.8I 14.8I 1.4I 1.4I 16.21 100.0I % OF CYCLE I ------------ I ------------ I ------------ I ------------ I ------------ I ------------ I ------------ I
7 I 651 651 21I 1I 81 231 183I a RESP I 35.51 35.51 11.51 O.5I 4.41 12.GI 100.01 % OF CYCLE I ------------ I ------------ I ------------ I ------------ I ------------ I ------------ I ------------ I
8 I 63I 51I 28I 11 5I 20I 168I a RESP I 37.51 30.41 16.71 0.61 3.01 11.91 100.01 % OF CYCLE I------------ I ------------ I ------------ I ------------ I ------------ I ------------ I ------------I
SUMI 7501 602I 238I 181 53I 2681 1929T a RESP I 38.9I 31.2I 12.3I 0.9I 2.7I 13.91 100.01 % OF CYCLE I ------------ I ------------ I ------------ I ------------ I ------------ I ------------ I ------------ I
STATISTICS BASED ON RAW FREQUENCY
CHI SQUARE = .244527 E 02 DEGREES OF FREEDOM = 28
CONT COEF = .120450
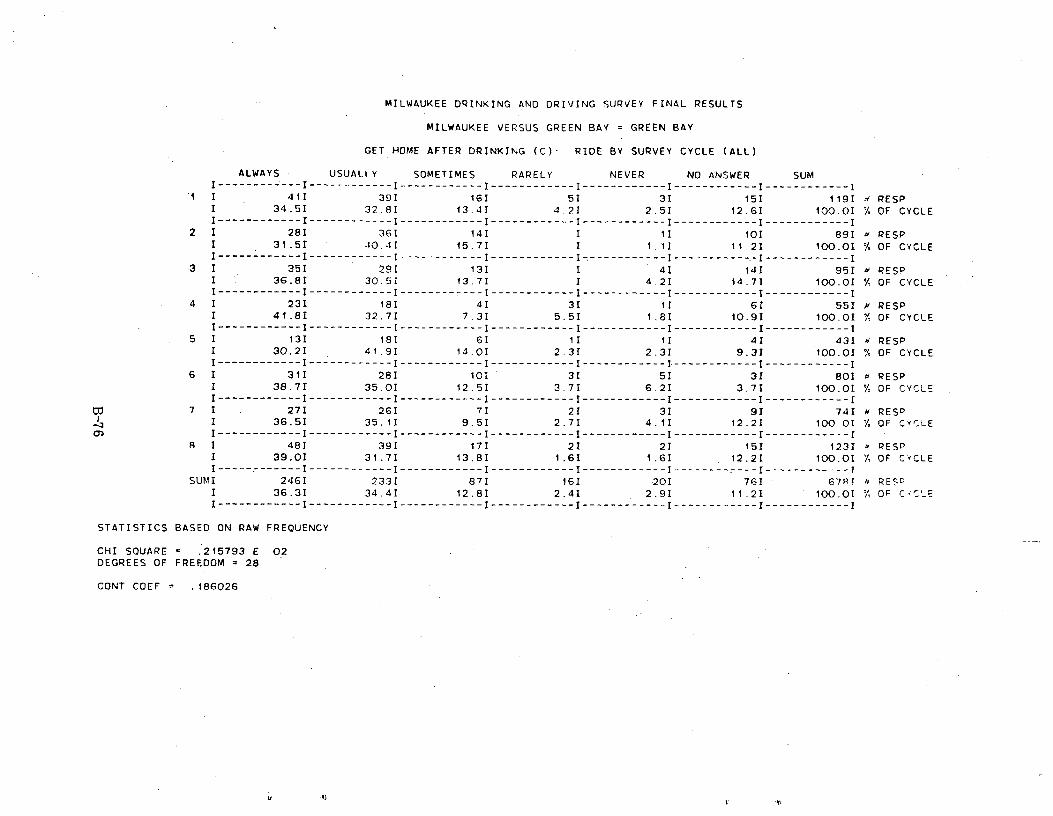
MILWAUKEE DRINKING AND DRIVING SURVEY FINAL RESULTS
MILWAUKEE VERSUS GREEN BAY = GREEN BAY
GET HOME AFTER DRINKING (C): RIDE BY SURVEY CYCLE (ALL)
ALWAYS USUALLY SOMETIMES RARELY NEVER NO ANSWER SUM I ------------ I ------------ I ------------ I ------------ I ------------ I ------------ I ------------ I
I I 411 391 161 51 3I 15I 119I H RESP I 34.51 32.81 13.41 4.2I 2.51 12.61 100.01 % OF CYCLE I ------------ I ------------ I ------------ I ------------ I ------------ I ------------ I ------------ I
2 I 28I 361 14I I II 101 89I RESP I 31.51 •10..11 15,7I I 1.11 11.21 100.01 % OF CYCLE I ------------ I ------------ I ------------ I ------------ I-.----------- I ----------- .-I ------------ I
3 I 351 29I 131 I 41 14I 951 H RESP I 36.8I 30.51 13.71 I 4,21 14.71 100.01 % OF CYCLE I ------------ I ------------ I ------------ I ------------ I ------------ I ------------ I ------------ I
4 I 231 181 4I 3I 11 6I 551 # RESP I 41.81 32.7I 7.3I 5.5I 1.8I 10.91 100.0I % OF CYCLE I ------------ I ------------ I ------------ I ------------ I ------------ I ------------ I ------------ I
5 I 131 18I 6I 1I 11 4I 431 H RESP 1 30.21 41.91 14.01 2.31 2.31 9.31 100.01 OF CYCLE I ------------ I ------------ I ------------ I ------------ I ------------ I ------------ I ------------ I
6 I all 28I 101 3I 51 3I 801 a RESP I 38.7I 35.0I 12.5I 3.71 6.21 3.71 100.0I % OF CYCLE I ------------ I ------------ I ------------ I ------------ I ------------ I ------------ I ------------ I
7 I 27I 261 71 21 3I 91 74I a RE SO 1 36.51 35.11 9.51 2.71 4.11 12.21 100.0I % OF CYCLE
o^ I ------------ I ------------ I ------------ I ------------ I ------------ I ------------ I ------------ I 8 I 48I 39I 17I 21 2I 151 1231 RESP
I 39.01 31.71 13.81 1.6I 1.6I 12.21 100.01 OF CYCLE I- - ----I ------------ I ------------ I ------------ I ------------ I ------------ I ------------ T
SUMI 2461 233I 87I 161 201 761 67RT " RES° I 36.3I 34.41 12.81 2.41 2.9I 11.21 100.0I '/-. OF C C'-= I------------ I ------------ I ------------ I ------------ I ------------ I ------------ I ------------ I
STATISTICS BASED ON RAW FREQUENCY
CHI SQUARE _ .215793 E 02 DEGREES OF FREEDOM = 28
CONT COEF = .186026
d Wi
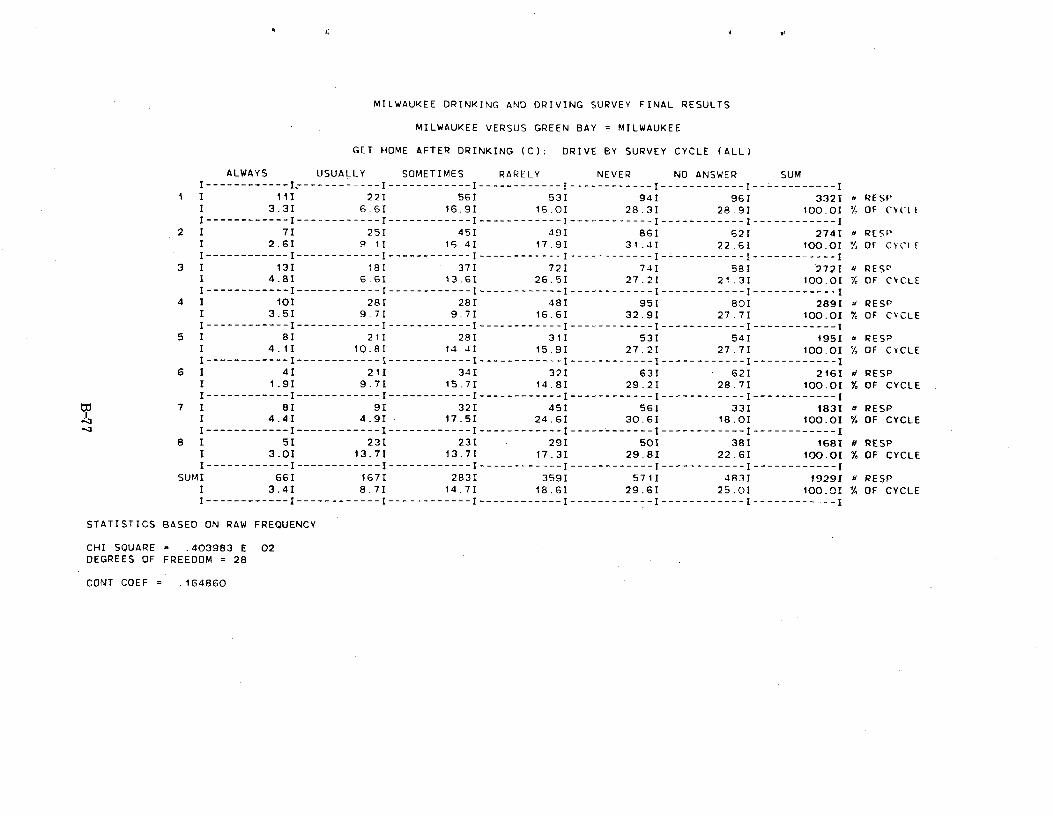
MILWAUKEE DRINKING AND DRIVING SURVEY FINAL RESULTS
MILWAUKEE VERSUS GREEN BAY = MILWAUKEE
GET HOME AFTER DRINKING (C): DRIVE BY SURVEY CYCLE (ALL)
ALWAYS USUALLY SOMETIMES RARELY NEVER NO ANSWER SUM I ------------ I. ------------ I ------------ I ------------ I ------------ I ------------ I ------------ I
1 I 11I 22I 561 53I 941 961 332I RESP I 3.31 6.6I 16.9I 16.0I 28.3I 28.9I 100.01 % OF CYuii I------------ I ------------ I ------------ I ------------ I ------------ I ------------ I ------------ I
2 I 7I 25I 45I -19I 861 62I 2741 d RESP I 2.61 9.11 16.4I 17.91 31.4I 22.61 100.0I % OF CYCIF I ------------ I ------------ I ------------ I ------------ I ------------ I ------------ I ------------ I
3 I 13I 18I 37I 72I 74I 58I 2721 RES' 1 4.81 6.61 13.61 26.51 27.21 21.31 100.01 % OF CYCLE I ------------ I ------------ I ------------ I ------------ I ------------ I ------------ I ------------ I
4 I 10I 281 28I 48I 95I 80I 289I RESP I 3.51 9.71 9.71 16.6I 32.91 27.71 100.0I % OF CYCLE I ------------ I ------------ I ------------ I ------------ I ------------ I ------------ I ------------ I
5 I 81 21I 28I 31I 53I 54I 195I RESP I 4.11 10.8I 14.4I 15.9I 27.21 27.7I 100.0I % OF CYCLE I------------ I ------------ I ------------ I ------------ I ------------ I ------------ I ------------ I
6 I 41 21I 34I 32I 63I 621 21GI W RESP I 1.91 9.7I 15.7I 14.8I 29.2I 28.7I 100.0I % OF CYCLE I ------------ I ------------ I ------------ I ------------ I ------------ I ------------ I ------------ I
7 I 81 9I 32I 45I 561 33I 183I p RESP I 4.41 4.91 17.5I 24.6I 30.61 18.0I 100.0I % OF CYCLE I------------ I ------------ I ------------ I ------------ I ------------ I ------------ I ------------ I
8 I 51 231 23I 291 50I 381 1681 a RESP I 3.01 13.7I 13.7I 17.3I 29.81 22.6I 100.01 % OF CYCLE I ------------ I ------------ I ------------ I ------------ I ------------ I ------------ I ------------ I
SUMI 661 167I 283I 359I 5711 483I 1929I N RESP I 3.4I 8.7I 14.7I 18.61 29.6I 25.0I 100.01 % OF CYCLE I ------------ I ------------ I ------------ I ------------ I ------------I ------------ I ------------ I
STATISTICS BASED ON RAW FREQUENCY
CHI SQUARE = .403983 E 02 DEGREES OF FREEDOM = 28
CONT COEF = .164860
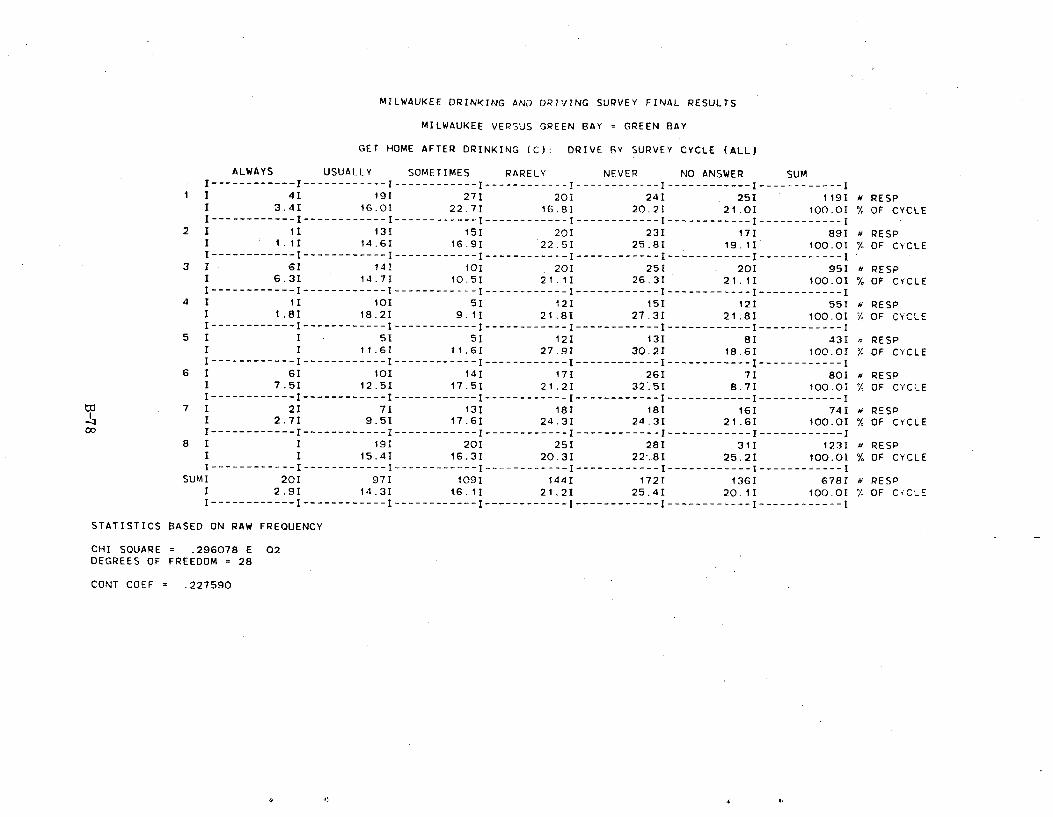
MILWAUKEE DRINKING AND DRIVING SURVEY FINAL RESULTS
MILWAUKEE VERSUS GREEN BAY = GREEN BAY
GET HOME AFTER DRINKING (C): DRIVE BY SURVEY CYCLE (ALL)
ALWAYS USUALLY SOMETIMES RARELY NEVER NO ANSWER SUM I------------ I ------------ I ------------ I ------------ I ------------ I ------------ I ------------I
1 I 4I 19I 271 201 24I 251 1191 # RESP I 3.4I 16.01 22.71 16.81 20.21 21.01 100.0I % OF CYCLE I ------------ I ------------ I ------------ I ------------ I ------------ I ------------ I ------------ I
2 1 1I 131 151 20I 23I 17I 89I a RESP I 1.1I 14.61 16.91 22.51 25.81 19.11 100.01 OF CYCLE I ------------ I ------------ I ------------ I ------------ I ------------ I ------------ I ------------ I
3 I 61 14I 10I 201 25I 20I 951 RESP I 6.31 14.7I 10.51 21.1I 26.31 21.11 100.01 % OF CYCLE I ------------ I ------------ I ------------ I ------------ I ------------ I ------------ I ------------ I
4 I II 101 51 121 15I 12I 551 a RESP I 1.81 18.2I 9.1I 21.8I 27.31 21.81 100.0I I OF CYCLE I ------------ I ------------ I ------------ I ------------ I ------------ I -----------I ------------ I
5 1 I 51 51 121 131 8I .431 = RESP I 1 11.6I 11.6I 27.9I 30.2I 18.6I 100.01 OF CYCLE I ------------ I ------------ I ------------ I ------------ I ------------ I ------------ I ------------ I
6 1 6I 101 141 171 261 71 801 RESP I 7.51 12.51 17.51 21.2I 32.5I 8.7I 100.01 % OF CYCLE I ------------ I ------------ I ------------ I ------------ I ------------ I ------------ I ------------ I
7 I 2I 7I 13I 18I 18I 16I 741 RESP I 2.71 9.51 17.61 24.3I 24.31 21.6I 100.01 % OF CYCLE I ------------ I ------------ I ------------ I ------------ I ------------ I ------------ I ------------ I
8 I I 191 20I 25I 28I 31I 123I RESP I I 15.41 16.3I 20.3I 22-.81 25.21 100.01 % OF CYCLE I ------------ I ------------ I ------------ I ------------ I ------------ I ------------ I ------------ I
SUMI 20I 971 1091 1441 1721 1361 6781 a RESP I 2.9I 14.31 16.1I 21.2I 25.4I 20.1I 100.01 % OF CYCLE I------------I------------I------------I------------I------------I------------I------------I
STATISTICS BASED ON RAW FREQUENCY
CHI SQUARE _ .296078 E 02DEGREES OF FREEDOM = 28
CONT COEF = .227590
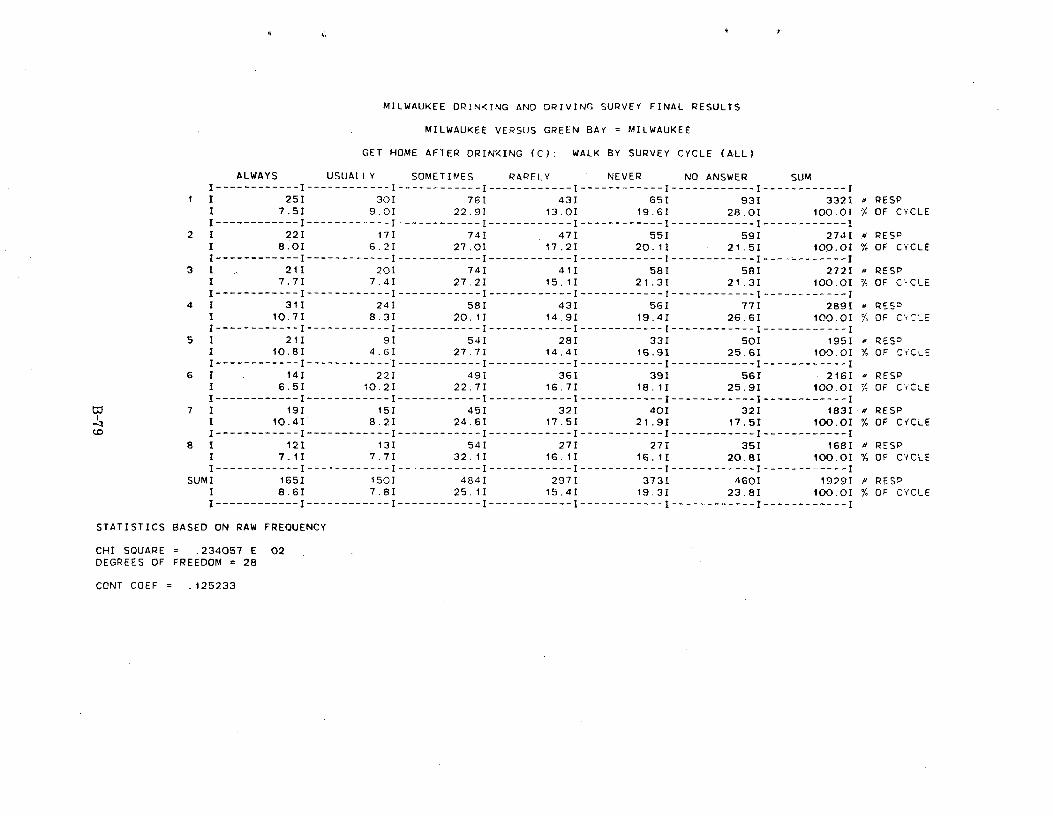
MILWAUKEE DRINKING AND DRIVING SURVEY FINAL RESULTS
MILWAUKEE VERSUS GREEN BAY = MILWAUKEE
GET HOME AFTER DRINKING (C): WALK BY SURVEY CYCLE (ALL)
ALWAYS USUALLY SOMETIMES RARELY NEVER NO ANSWER SUM I ------------ I ------------ I ------------ I ------------ I ------------ I ------------ I ------------ I
1 1 25I 301 76I 43I 65I 93I 332I RESP I 7.51 9.01 22.91 13.01 19.61 28.01 100.01 % OF CYCLE I ------------ I ------------ I ------------ I ------------ I ------------ I ------------ I ------------ I
2 I 22I 17I 74I 47I 55I 59I 2741 0 RESP I 8.0I 6.2I 27.0I 17.2I 20.1I 21.51 100.01 % OF CYCLE I ------------ I ------------ I ------------ I ------------ I ------------ I ------------ I ------------ I
3 I 21I 201 74I 41I 58I 58I 2721 d RESP I 7.71 7.4I 27.2I 15.1I 21.3I 21.3I 100.01 % OF C•CLE I ------------ I ------------ I ------------ I ------------ I ------------ I ------------ I ------------ I
4 1 31I 24I 58I 43I 56I 77I 269I d RES0 I 10.71 8.31 20.11 14.91 19.41 26.6I 100.01 % OF C'f__E I ------------ I ------------ I ------------ I ------------ I ------------ I ------------ I ------------ I
5 1 21I 9I 54I 28I 33I 50I 195I - RES I 10.8I 4.6I 27.7I 14.4I 16.91 25.6I 100.0I % OF CYCLE I ------------ I ------------ I ------------ I ------------ I ------------ I ------------ I ------------ I
6 1 14I 22I 491 361 39I 561 - 2161 - RESP I 6.51 10.21 22.71 16.7I 18.11 25.91 100.01 OF CYCLE I ------------ I ------------ I ------------ I ------------ I ------------ I ------------ I ------------ I
7 I 19I 15I 45I 32I 40I 32I 183I a RESP 1 10.41 6.21 24.61 17.51 21.91 17.51 100.01 % OF CYCLE
CD I ------------ I ------------ I ------------ I ------------ I ------------ I ------------ I ------------ I 8 1 121 131 54I 27I 27I 351 168I d RESP
I 7.11 7.71 32.11 16.1I 16.11 20.81 100.01 % OF CYCLE I ------------ I ------------ I ------------ I ------------ I ------------ I ------------ I ------------ I
SUMI 165I 1501 484I 2971 373I 4601 1929I P RESP I 8.61 7.81 25.11 15.41 19.31 23.81 100.01 % OF CYCLE I ------------ I ------------ I ------------ I ------------ I ------------ I ------------ I ------------ I
STATISTICS BASED ON RAW FREQUENCY
CHI SQUARE = .234057 E 02 DEGREES OF FREEDOM = 28
CONT COEF = .125233
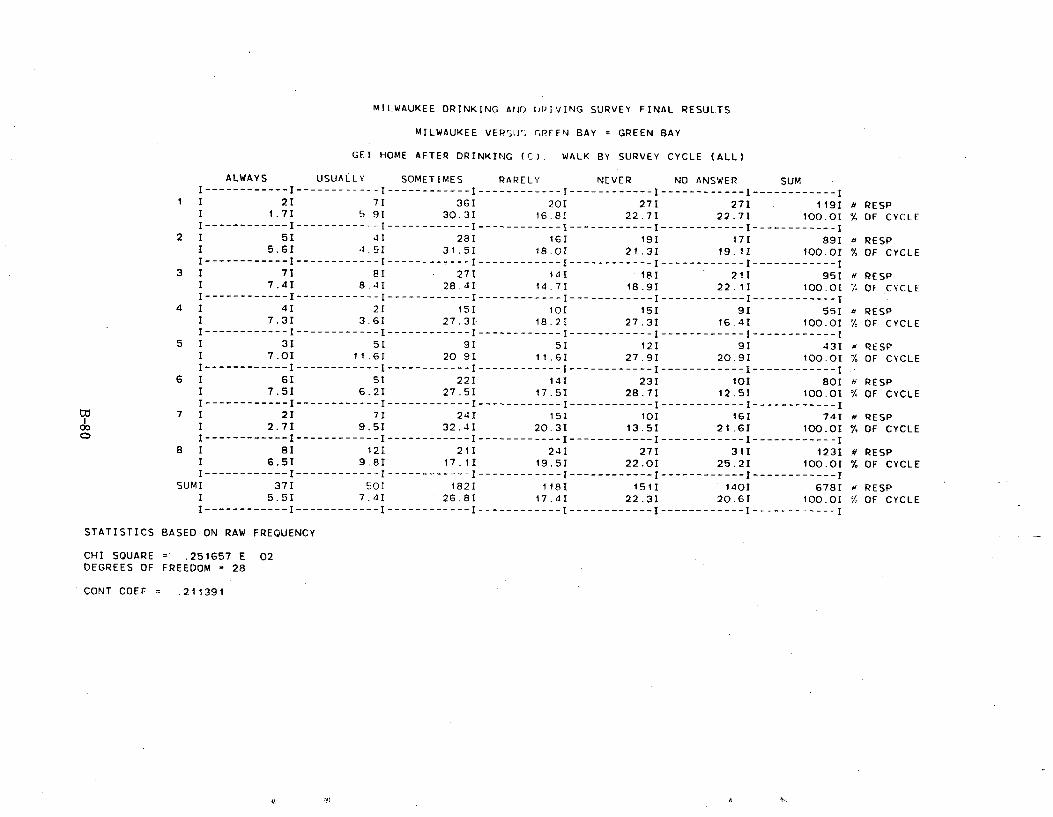
MILWAUKEE DRINKING A.FJf) f1PIVING SURVEY FINAL RESULTS
MILWAUKEE VERTU; GREEN BAY = GREEN BAY
GFT HOME AFTER DRINKING (C): WALK BY SURVEY CYCLE (ALL)
ALWAYS USUALLY SOMETIMES RARELY NEVER NO ANSWER SUM I------------ I ------------ I ------------ I ------------ I ------------ I ------------ I -----------------------
1 I 21 7I 361 20I 271 271 119I a RESP I 1.71 5.91 30.3I 16.8I 22.71 22.71 100.0I % OF CYCLE I ------------ I ------------ I ------------ I ------------ I ------------ I ------------ I ------------ I
2 I 51 41 281 161 191 17I 891 H RESP I 5.6I 4.5I 31.51 18.0I 21.3I 19.11 100.01 % OF CYCLE I------------ I ------------- I ------------ I ------------ I ------------ I ------------ I ------------ I
3 I 71 8I 271 141 18I 211 95I a RESP I 7.41 8.4I 28.41 14.7I 18.9I 22.1I 100.0I OF CYCLE I------------ I ------------ I ------------ I ------------ I ------------ I ------------ I ------------ I
4 I 41 21 15I 10I 151 91 55I RESP I 7.31 3.61 27.3I 18.2I 27.31 16.41 100.01 % OF CYCLE I ------------ I ------------ I ------------ I ------------ I ------------ I ------------ I ------------ I
5 I 31 5I 91 5I 121 9I 431 u RESP I 7.0I 11.61 20.9I 11.61 27.91 20.9I 100.01 % OF CYCLE I ------------ I ------------ I ------------ I ------------ I ------------ I ------------ I ------------ I
6 I 6I 51 221 141 231 101 80I ti RESP I 7.5I 6.2I 27.51 17.5I 28.71 12.5I 100.01 % OF CYCLE I ------------ I ------------ I ------------ I ------------ I ------------ I ------------ I ------------ I
7 I 2I 7I 24I 15I 101 161 741 a RESP I 2.7I 9.51 32.41 20.31 13.51 21.6I 100.0I % OF CYCLE I ------------ I ------------ I=----------- I ------------ I ------------ I ------------ I ------------ I
8 I 8I 12I 211 24I 27I 311 1231 # RESP I 6.51 9.8I 17.1I 19.51 22.0I 25.2I 100.01 % OF CYCLE I ------------ I ------------ I ------------ I ------------ I ------------ I ------------ I ------------ I
SUMI 37I 50I 182I 118I 151I 1401 678I N RESP I 5.51 7.4I 26.8I 17.41 22.3I 20.GI 100.0I % OF CYCLE I ------------ I ------------ I ------------ I ------------ I ------------ I ------------ I ------------ I
STATISTICS BASED ON RAW FREQUENCY
CHI SQUARE = .251657 E 02 DEGREES OF FREEDOM = 28
CONT COEF = .211391
V) A
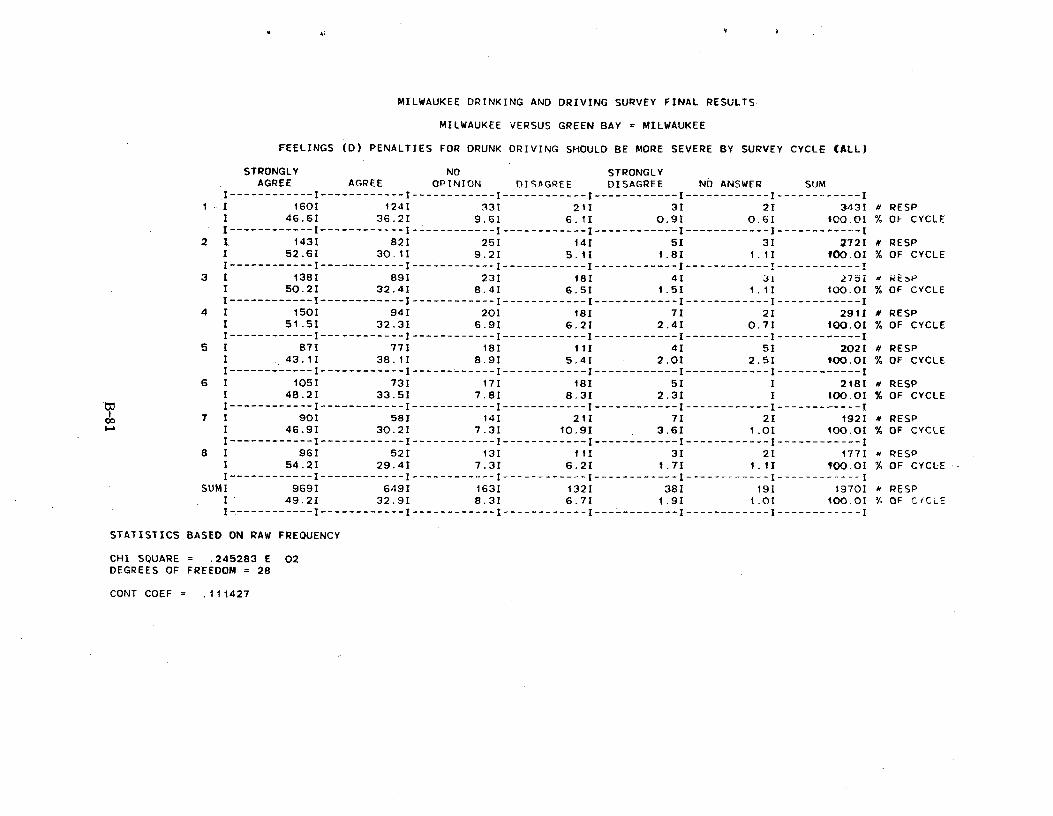
MILWAUKEE DRINKING AND DRIVING SURVEY FINAL RESULTS
MILWAUKEE VERSUS GREEN BAY = MILWAUKEE
FEELINGS (D) PENALTIES FOR DRUNK DRIVING SHOULD BE MORE SEVERE BY SURVEY CYCLE CALL)
STRONGLY NO STRONGLY AGREE AGREE OPINION DISAGREE DISAGREE NO ANSWER SUM
I ------------ I ------------ I ------------ I ------------ I ------------ I ------------ I ------------ I 1 I 160I 124I 331 211 31 2I 3431 # RESP
I 46.61 36.21 9.6I 6.11 0.91 0.61 100.01 % OF CYCLE I ------------ I ------------ I ------------ I ------------ I ------------ I ------------ I ------------ I
2 1 143I 821 25I 141 51 31 272I N RESP I 52.6I 30.11 9.2I 5.1I 1.81 1.11 100.01 % OF CYCLE I ------------ I ------------ I ------------ I ------------ I ------------ I ------------ I ------------ i
3 1 138I 89I 231 181 4I 3i 2751 a RESN I 50.21 32.41 8.41 6.51 1.5! 1.11 100.01 % OF CYCLE I------------I------------I------------I------------I------------I------------I------------1
4 1 150I 94I 20I 18I 7I 2I 2911 a RESP 1 51.5I 32.31 6.91 6.2I 2,4I 0.7I 100.0I % OF CYCLE I ------------ I ------------ I ------------ I ------------ I ------------ I ------------ I ------------ I
5 1 871 77I 18I III 4I 5I 202I N RESP I 43.1I 38.1I 8.9I 5.4I 2.01 2.51 100.0I % OF CYCLE I ------------ I ------------ I ------------ I ------------ I ------------ I ------------ I ------------ I
6 I 105I 731 171 181 51 I 2181 a RESP 1 48.2I 33.51 7.8I 8.31 2.31 I 100.01 % OF CYCLE I ------------ I ------------ I ------------ I ------------ I ------------ I ------------ I -----------I
7 1 901 58I 14I 21I 7I 2I 192I N RESP I 46.9I 30.2I 7.3I 10.91 3.6I 1.0I 100.01 % OF CYCLE I ------------ I ------------ I ------------ I ------------ I ------------ I ------------ I ------------ I
8 I 96I 521 13I 11I 3I 21 177I # RESP 1 54.21 29.41 7.3I 6.21 1.7I 1.11 100.0! % OF CYCLE I ------------ I ------------ I ------------ I ------------ I ------------ I ------------ I ------------ I
SUM! 9691 649I 1631 132I 38I 19I 19701 RESP I' 49.21 32.91 8.31 6.7I 1.91 1.01 100.01 i OF C!CLE I-.----------- I ------------ I ------------ I ------------ I ------------ I ------------ I ------------ I
STATISTICS BASED ON RAW FREQUENCY
CHI SQUARE _ .245283 E 02 DEGREES OF FREEDOM = 28
CONT COEF = .111427
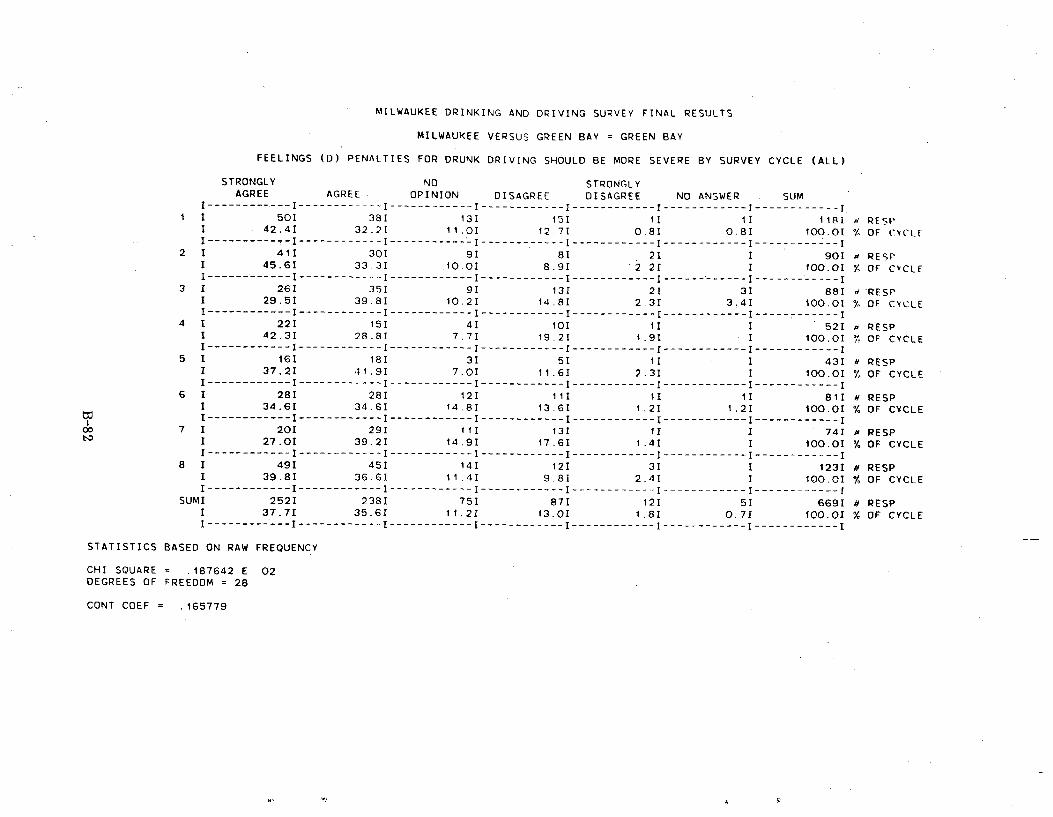
MILWAUKEE DRINKING AND DRIVING SURVEY FINAL RESULTS
MILWAUKEE VERSUS GREEN BAY = GREEN BAY
FEELINGS (D) PENALTIES FOR DRUNK DRIVING SHOULD BE MORE SEVERE BY SURVEY CYCLE (ALL)
STRONGLY NOAGREE AGREE OPINION DISAGREE DISAGREE NO ANSWER SUM
I------------ I ------------ I ------------ I ------------ I ------------ I ------------ I ------------I1 I 50I 38I 13I 15I 1I 1I 118I RECD
I 42.41 32.21 11,OI 12.71 0.81 0.81 100.01 % OF CYCt_F I------------I ------------ I -----------I ------------ I ------------ I ------------ I ------------ I
2 I 411 30I 9I 8I 21 1 90I a RESP I 45.61 33.31 .10,0I 8.91 2.21 I 100.01 % OF CYCLE I ------------ I ------------ I ------------ I ------------ I ------------ I ------------ I ------------ I
3 I 261 351 91 131 21 31 881 d'RESP I 29.51 39.81 10.2I 14.81 2.31 3.4I 100.01 % OF CYCLE I ------------ I ------------ I ------------ I ------------ I ------------ I ------------ I ------------ I
4 1 22I 15I 41 10I 1I I 521 RESP I 42.31 28.8I 7.7I 19.21 1.91 I 100.01 OF CYCLE I ------------ I ------------ I ------------ I ------------ I ------------ I ------------ I ------------ I
5 I 16I 181 31 51 11 I 431 RESP I 37.21 41.91 7.01 11.61 2.31 I 100.OI OF CYCLE I ------------ I ------------ I ------------ I ------------ I ------------ I ------------ I ------------ I
6 I 28I 28I 12I 111 1I 1I 811 N RESP I 34.6I 34.61 14.81 13.61 1.2I 1.21 100.0I % OF CYCLE I ------------ I ------------ I ------------ I ------------ I ------------ I ------------ I ------------ I
7 I 201 291 III 131 11 I - 741 # RESP I 27.01 39.21 14.91 17.61 1.41 I 100.01 % OF CYCLE I ------------ I ------------ I ------------ I ------------ I ------------ I ------------ I ------------ I
8 I 49I 45I 141 12I 3I I 123I N RESP I 39.81 36.61 11.41 9.81 2.41 I 100.01 % OF CYCLE I ------------ I ------------ I ------------ I ------------ I ------------ I ------------ I ------------ I
SUMI 2521 238I 75I 87I 12I 5I 669I N RESP I 37.71 35.61 11.21 13.01 1.81 0.71 100.0I % OF CYCLE I ------------ I ------------ I ------------ I ------------ I ------------ I ------------ I ------------ I
STRONGLY
STATISTICS BASED ON RAW FREQUENCY
CHI SQUARE = .187642 E 02 DEGREES OF FREEDOM = 28
CONT COEF = .165779
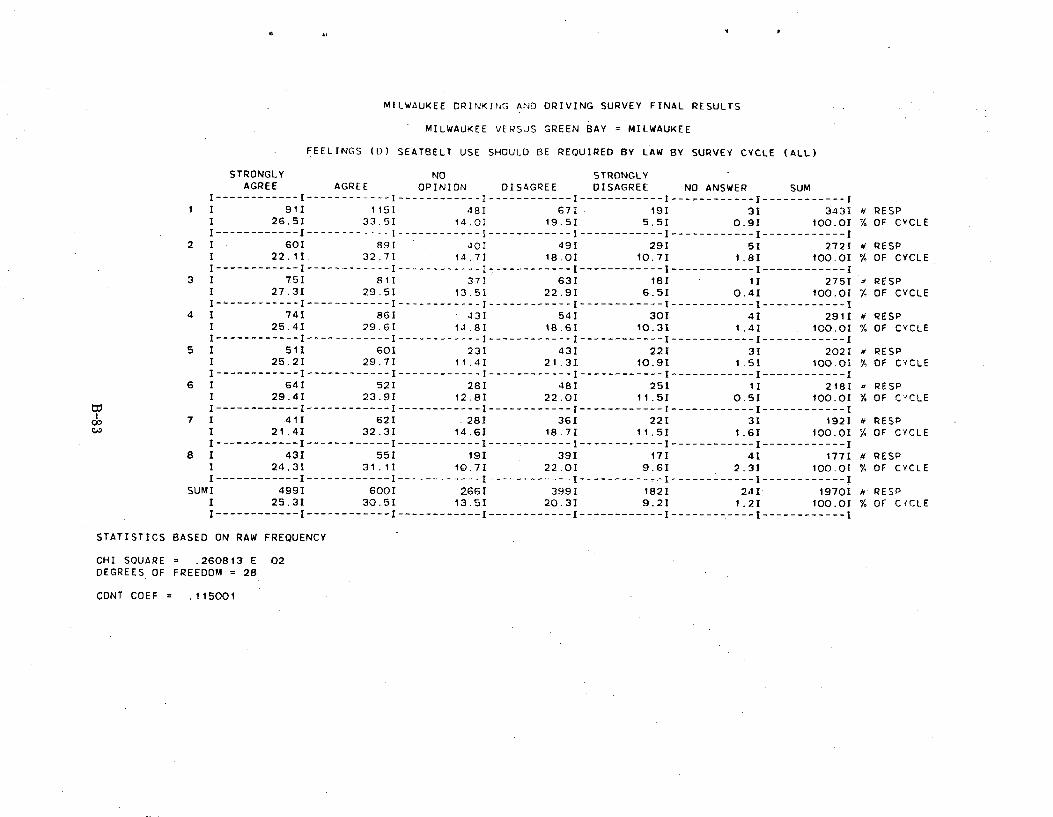
MILWAUKEE DRINKING AND DRIVING SURVEY FINAL RESULTS
MILWAUKEE VERSUS GREEN BAY = MILWAUKEE
FEELINGS (D) SEATBELT USE SHOULD BE REQUIRED BY LAW BY SURVEY CYCLE (ALL)
STRONGLY NO STRONGLY AGREE AGREE OPINION DISAGREE DISAGREE NO ANSWER SUM
I ------------ I ------------ I ------------ I ------------ I ------------ I------------ I ------------I I I 91I 1151 481 67I 191 3I 343I M RESP
1 26.5I 33.51 14.0I 19.51 5.5I 0.91 100.0I OF CYCLE I ------------ I ------------ I ------------ I ------------ I ------------ I ------------ I ------------ I
2 I 60I 891 40I 491 29I 5I 2721 a RESP I 22.1I. 32.71 14.71 18.0I 10.7I 1.8I 100.0I % OF CYCLE I ------------ I ------------ I ------------ I ------------ I ------------ I ------------ I ------------ I
3 I 75I 811 371 631 18I 1I 2751 d RESP I 27.31 29.51 13.5I 22.9I 6.5I 0.4I 100.0I % OF CYCLE I ------------ I ------------ I ------------ I ------------ I ------------ I ------------ I ------------ I
4 I 741 86I 431 54I 30I 4I 291I N RESP I 25.4I 29.6I 14.8I 18.61 10.3I 1.4I 100.0I OF CYCLE I ------------ I ------------ I ------------ I ------------ I ------------ I ------------ I ------------ I
5 I 51I 60I 23I 43I 22I 3I 202I RESP I 25.2I 29.7I 11.41 21.3I. 10.91 1.5I 100.01 % OF CYCLE I ------------ I ------------ I ------------ I ------------ I ------------ I ------------ I ------------ I
6 I 64I 521 28I 48I 25I 1I 218I RESP I 29.41 23.91 12.81 22.01 11.5I 0.51 100.0I % OF CYCLE I------------1------------I------------I------------I------------I------------I------------I
7 I 41I 62I 28I 36I 221 3I 192I a RESP 1 21.41 32.31 14.61 18.71 11.51 1.61 100.01 % OF CYCLE I ------------ I ------------ I ------------ I ------------ I ------------ I ------------ I ------------ I
8 I 43I 551 19I 39I 17I 4I 1771 H RESP I 24.3I 31.11 10.7I 22.0I 9.6I 2.3I 100.01 % OF CYCLE I------------ I ------------ I ------------ I ------------ I ------------ I ------------ I ------------ I
SUMI 499I 6001 2661 399I 182I 24I 1970I # RESP I 25.31 30.51 13.51 20.31 9.21 1.21 100.01 % OF C(CLE I ------------ I ------------ I ------------ I ------------ I ------------ I ------------ I ------------ I
STATISTICS BASED ON RAW FREQUENCY
CHI SQUARE = .260813 E 02 DEGREES OF FREEDOM = 28
CONT COEF = .115001
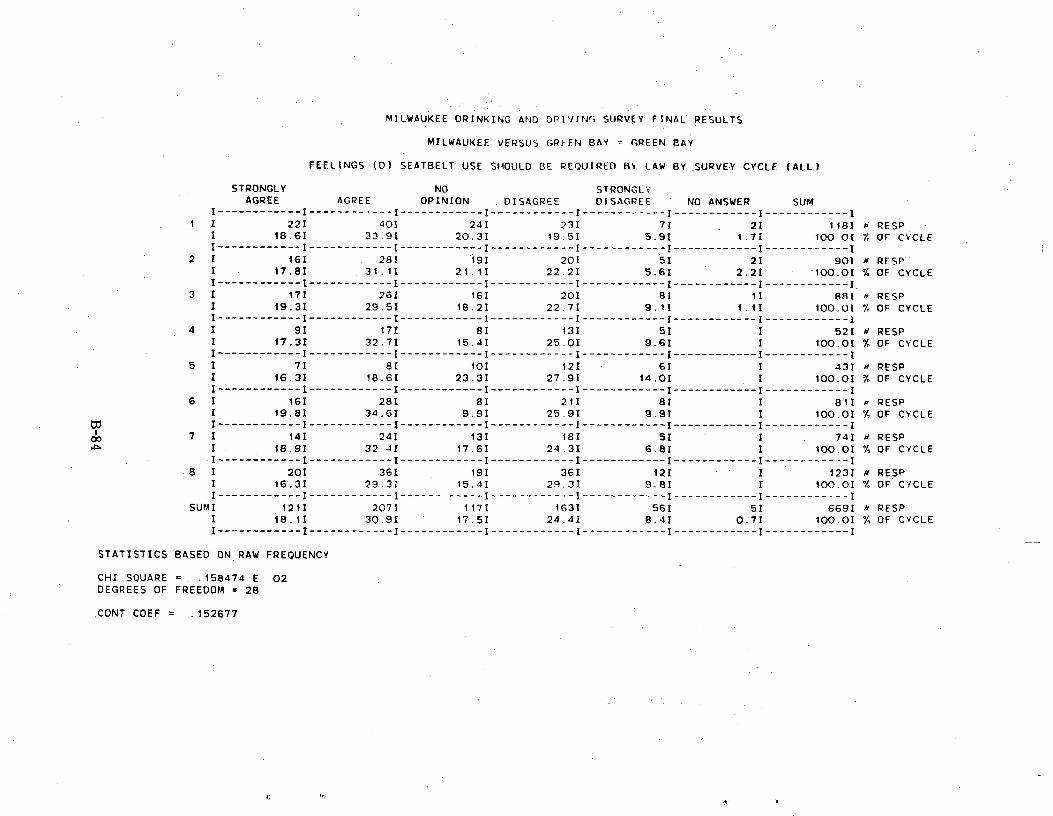
MILWAUKEE DRINKING AND DRIVING SURVEY FINAL RESULTS
MILWAUKEE VERSUS GREEN BAY = GREEN BAY
FEELINGS (D) SEATBELT USE SHOULD BE REQUIRED Rr LAW BY SURVEY CYCLE (ALL)
STRONGLY NO STRONGLY AGREE AGREE OPINION DISAGREE DISAGREE NO ANSWER SULK
I ------------ I ------------ I ------------ I ------------ I ------------ I------------ I ------------I 1 I 221 40I 241 23I 7I 21 118I s RESP
I 18.61 33.9I 20.3I 19.5I 5.9I 1.71 100-01 % OF CYCLE I------------ I ------------ I ------------I ------------ I ------------ I ------------ I ------------ I
2 I 16I 28I 19I 20I 5I 2I 90I N RESP' 1 17.8I 31.1I 21.1I 22.2I 5.61 2.2I 100.01 % OF CYCLE I------------I------------I------------I------------I------------I---------=--I------------1
3 I 171 261 161 20I 8I 1I 88I N RESP 1 19.3I 29.5I 18.2I 22.7I 9.1I 1.11 100.0I % OF CYCLE I------------I------------I------------I------------I------------I------------I------------1
4 I 91 171 81 131 51 I 521 a RESP I 17.31 32.71 15.41 25.01 9.61 I 100.01 % OF CYCLE I ------------I------------ I ------------ I ------------ I ------------ I ------------ I ------------ I
5 I 71 81 101 12I 61 I 431 M RESP 1 16.31 18.6I 23.3I 27.9I 14.0I 1 100.0I % OF CYCLE I ------------ I ------------ I ------------ I ------------ I ------------ I ------------ I ------------ I
6 I 161 281 81 211 81 I 81I a RESP I 19.81 34.61 9,91 25.91 9.91 I 100.01 OF CYCLE
C17 I ------------ I ------------ I ------------ I ------------ I ------------ I ------------ I ------------ I
do 7 I 14I 2 4 I 1131 i8I SI 1 741 N RESP I 18.9I 32.44I 17.61 24.31 6.8I I 100.0I % OF CYCLE 1------------I------------I------------I------------I------------I------------I------------I
8 I 20I 361 19I 361 12I 1 123I a RESP I 16.3I 29.31 15.41 29.31 9-8I 1 100.01 % OF CYCLE I ------------ I ------------ I ------------ I ------------- I ------------ I ------------ I ------------ I
SUMI 121I 207I 117I 163I 561 51 669I N PESP I 18.1I 30.9I 17.5I 24.41 8.4I 0.71 100.0I % OF CYCLE I ------------ I ------------ I ------------ I ------------ I ------------ I ------------ I ------------ I
STATISTICS BASED ON RAW FREQUENCY
CHI SQUARE _. .158474 E 02DEGREES OF FREEDOM = 28
.CONT COEF = .152677
0
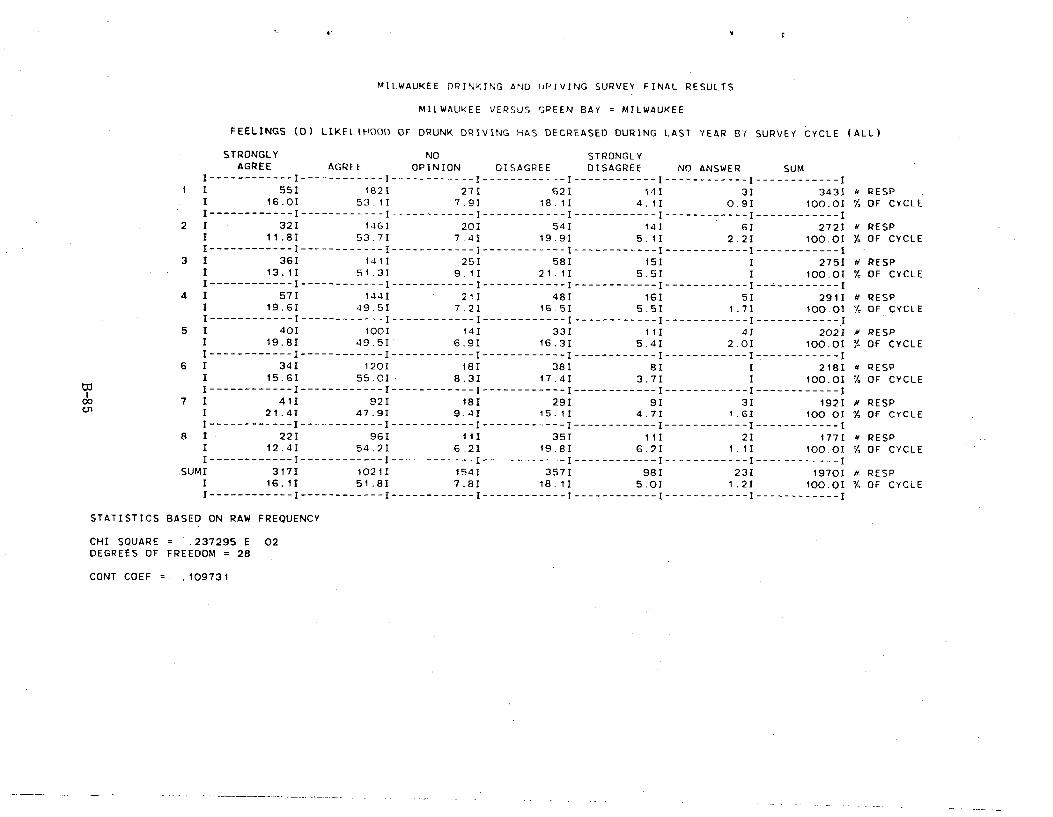
MILWAUKEE DRINKING AND OPIVING SURVEY FINAL RESULTS
MILWAUKEE VERSUS GREEN BAY = MILWAUKEE
FEELINGS (0) LIKELIHOOD OF DRUNK DRIVING HAS DECREASED DURING LAST YEAR BY SURVEY CYCLE (ALL)
STRONGLY NO STRONGLY AGREE AGREE OPINION DISAGREE DISAGREE NO ANSWER SUM
I ------------ I ------------ I ------------ I ------------ I ------------ I ------------ I ------------ I 1 1 55I 182I 27I 621 141 3I 3431 4 RESP
I 16.0I 53.11 7.91 18.11 4.11 0.91 100.01 % OF CYCLE I ------------ I ------------ I ------------ I ------------ I ------------ I ------------ I ------------ I
2 I 321 1481 20I 541 141 6I 2721 a RESP I 11.81 53.7I 7.41 19.91 5.1I 2.21 100.0I % OF CYCLE I ------------ I ------------ I ------------ I ------------ I ------------ I ------------ I ------------ I
3 I 36I 1411 25I 581 15I I 275I a RESP I 13.11 51.31 9.11 21.11 5.51 I 100.01 % OF CYCLE I ------------ I ------------ I ------------ I ------------ I ------------ I ------------ I ------------ I
4 I 571 1441 21I 48I 161 51 2911 a RESP I 19.6I 49.5I 7.21 16.51 5.51 1.71 100.01 ! OF CYCLE I ------------ I ------------ I ------------ I ------------ I ------------ I ------------ I ------------ I
5 I 401 100I 14I 33I III 4I 2021 a RESP I 19.81 49.5I 6.9I 16.31 5.4I 2.0I 100.0I OF CYCLE I ------------ I ------------ I ------------ I ------------ I ------------ I ------------ I ------------ I
6 I 341 120I 18I 381 81 1 218I a RESP I 15.6I 55.01 8.31 17.41 3.71 I 100.01 % OF CYCLE I ------------ I ------------ I ------------ I ------------ I ------------ I ------------ I ------------ I
7 I 41I 92I 18I 291 9I 3I 192I a RESP I 21.4I 47.91 9.4I 15.11 4.71 1.61 100.01 % OF CYCLE I ------------ I ------------ I ------------ I ------------ I ------------ I ------------ I ------------I
8 I 22I 96I 111 351 III 2I 1771 a RESP I 12.41 54.21 6.2I 19.81 6.2I 1.1I 100.01 A OF CYCLE I ------------ I ------------ I ------------ I ------------ I ------------ I ------------ I ------------ I
.SUMI 3171 10211 154I 3571 98I 23I 1970I a RESP I 16.11 51.81 7.81 18.11 5.0I 1.2I 100.01 OF CYCLE I ------------ I ------------ I ------------ I ------------ I ------------ I ------------ I ------------ I
STATISTICS BASED ON RAW FREQUENCY
CHI SQUARE = .237295 E 02 DEGREES OF FREEDOM = 28
CONT COEF .109731
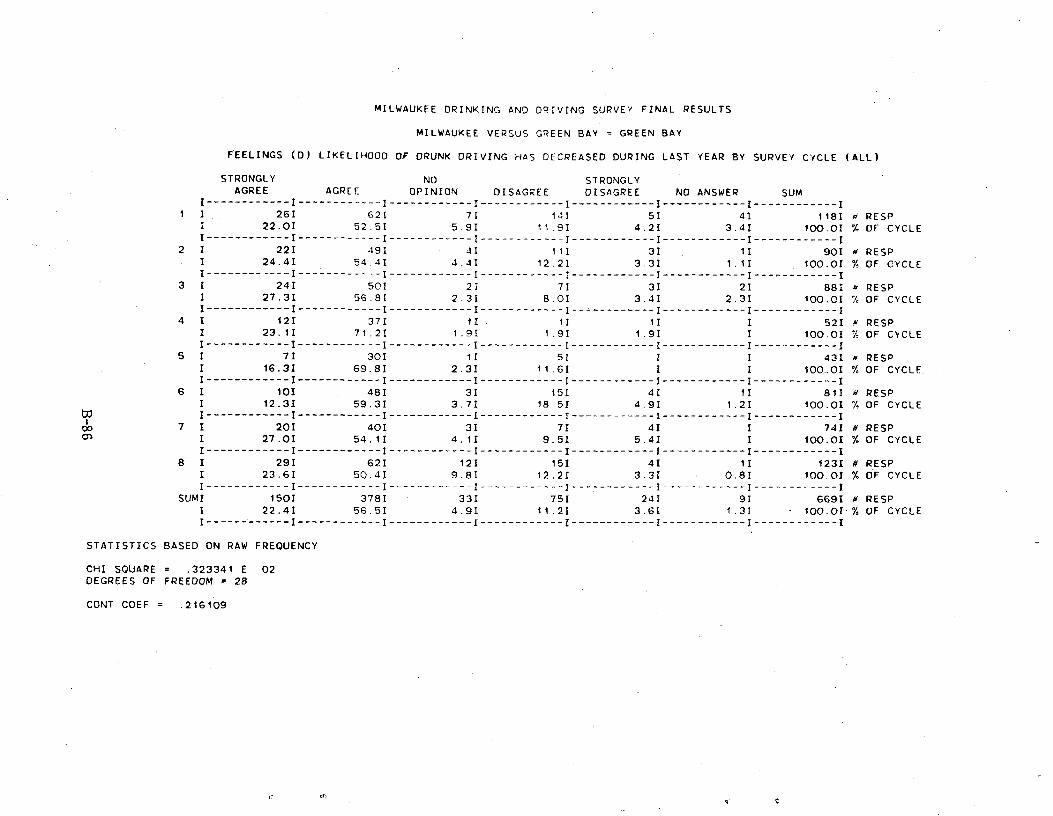
MILWAUKEE DRINKING AND DRIVING SURVEY FINAL RESULTS
MILWAUKEE VERSUS GREEN BAY = GREEN BAY
FEELINGS (0) LIKELIHOOD OF DRUNK DRIVING HAS DECREASED DURING LAST YEAR BY SURVEY CYCLE (ALL)
STRONGLY NO STRONGLY AGREE AGREE OPINION DISAGREE DISAGREE NO ANSWER SUM
I ------------ I ------------ I ------------ I ------------ I ------------ I ------------ I ------------ I1 1 26I 62I 7I 14I 5I 4I 118I RESP
I 22.01 52.51 5.91 11.91 4.21 3.41 100.01 % OF CYCLE I ------------ I ------------ I ------------ I ------------ I ------------ I ------------ I ------------ I
2 I 221 491 41 111 31 1I 901 a RESP I 24.41 54.41 4.4I 12.21 3.31 1.11 100.0I % OF CYCLE I ------------ I ------------ I ------------ I ------------ I ------------ I ------------ I ------------ I
3 1 241 501 21 71 31 21 881 a RESP I 27.31 56.81 2.31 8.01 3.41 2.31 100.01 % OF CYCLE I ------------ I ------------ I ------------ I ------------ I ------------ I ------------ I ------------ I
4 1 121 371 11, 11 1i 1 521 p RESP I 23.1I 71.2I 1.91 1.9I 1.9I 1 100.0I 7 OF CYCLE I------------I------------I------------I------------I------------I------------I------------1
5 I 71 301 11 51 1 I 431 # RESP I 16.31 69.81 2.31 11.61 1 I 100.0I % OF CYCLE. I------------I------------I------------I------------I------------I------------I------------I
6 I 101 481 31 151 41 11 811 H RESP I 12.31 59.31 3.71 18.51 4.91 1.21 100.01 % OF CYCLE
b7 I ------------ I ------------ I ------------ I ------------ I ------------ I ------------ I ------------ I 00 7 I 201 401 31 71 41 1 741 N RESP
I 27.01 54.11 4.11 9.51 5.41 1 100.01 % OF CYCLE I ------------ I ------------ I ------------ I ------------ I ------------ I ------------ I ------------ I
8 I 29I 62I 121 15I 4I II 123I N RESP I 23.61 50.41 9.8I 12.2I 3.31 0.8I 100.0I % OF CYCLE I ------------ I ------------ I ------------ I ------------ I ------------ I ------------ I ------------ I
SUMI 150I 378I 33I 75I 241 9I 669I N RESP 1 22.41 56.5I 4.91 11.21 3.61 1.31 - 100.0I-% OF CYCLE I ------------ I ------------ I ------------ I ------------ I ------------ I ------------ I ------------I
STATISTICS BASED ON RAW FREQUENCY
CHI SQUARE _ .323341 E 02DEGREES OF FREEDOM = 28
CONT COEF = .216109
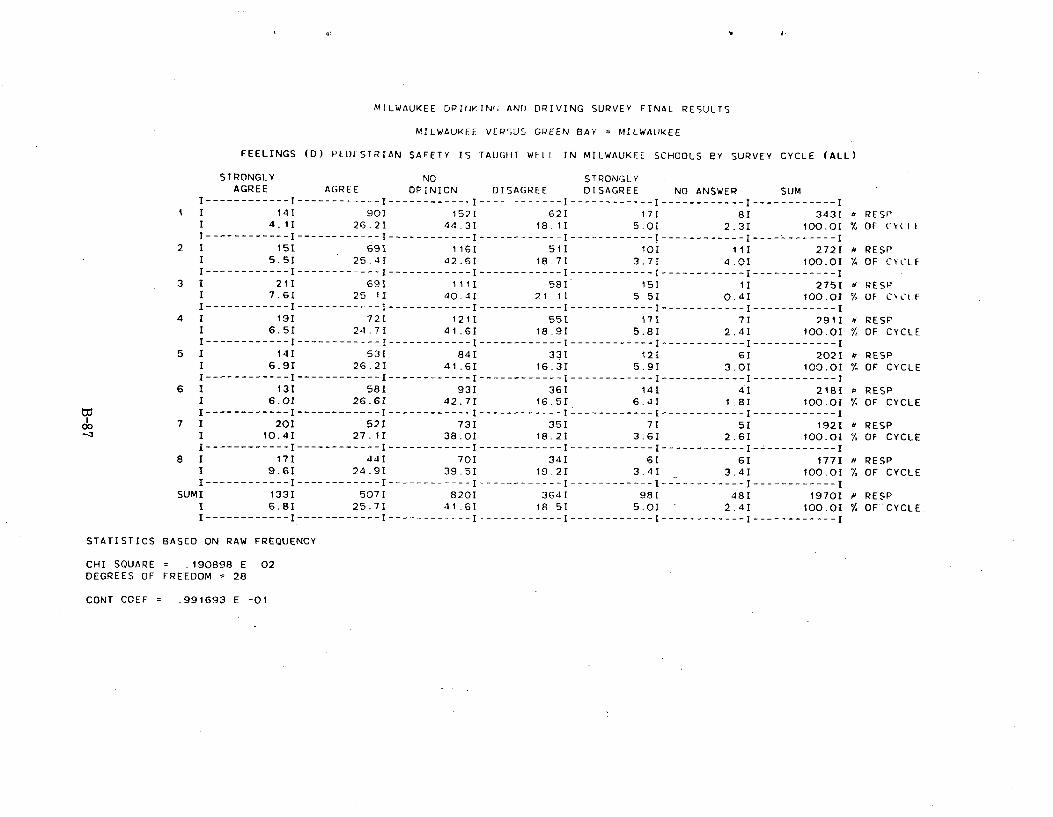
MILWAUKEE DPINKIN, AND DRIVING SURVEY FINAL RESULTS
MILWAUKEE VERSUS GREEN SAY = MILWAUKEE
FEELINGS (D) PEDESTRIAN SAFETY IS TAUGHT WELL IN MILWAUKEE SCHOOLS BY SURVEY CYCLE (ALL)
STRONGLY NO STRONGLY AGREE AGREE OPINION DISAGREE DISAGREE NO ANSWER SUM
I------------ I ------------ I ------------ I ------------ I ------------ I ------------ I ------------I 1 I 141 901 152I 62I 17I 8I 343I a RESP
I 4.11 26.21 44.3I 18.1I 5.0I 2.3I 100.0I % OF CYCt1 I------------ I ------------ I ------------ I ------------ I ------------ I ------------ I ------------ 1
2 I 151 691 1161 51I 101 111 2721 a RESP I 5.51 25.41 42.6I 18.71 3.71 4.01 100.01 % OF C1CLF I ------------ I ------------ I -----------I ------------ I ------------ I ------------ I ------------ I
3 I 21I 691 1111 581 15I 1I 275I H RESP I 7.6I 25.11 40.41 21.11 5.51 0.41 100.01 '/- OF CYCLE I ------------ I ------------ I ------------ I ------------ I ------------ I ------------ I ------------ I
4 I 19I 72I 121I 551 171 7I 2911 x RESP I 6.5I 24.71 41.61 18.91 5.81 2.41 100.01 % OF CYCLE I ------------ I ------------ I ------------ I ------------ I ------------ I ------------ I ------------ I
5 I 14I 53I 84I 33I 12I 6I 2021 RESP I 6.9I 26.2I 41.6I 16.3I 5.91 3.01 100.01 % OF CYCLE I ------------ I ------------ I ------------ I ------------ I ------------ I ------------ I ------------ I
6 I 13I 58I 931 36I 141 4I 2191 a RESP 1 6.01 26.61 42.7I 16.5I 6.41 1.81 100.01 % OF CYCLE I ------------ I ------------ I ------------ I ------------ I ------------ I ------------ I ------------ I
7 I 20I 52I 73I 35I 7I 5I 1921 RESP I 10.4I 27.11 38.0I 18.21 3.61 2.61 100.0I % OF CYCLE I----------- I ------------ I ------------ I ------------ I ------------ I ------------ I ------------ I
8 I 17I 44I 701 34I 6I 61 177I a RESP 1 9.61 24.91 39.5I 19.2I 3.41 3.4I 100.01 % OF CYCLE I ------------ I ----------- I ------------ I ------------ I ------------ I ------------ I ------------ I
SUMI 133I 507I 820I 3641 98I 48I 19701 # RESP I 6.81 25.71 41.6I 18.5I 5.0I 2.4I 100.0I % OF-CYCLE I ------------ I ------------ I ------------ I ------------ I ------------ I ------------ I ------------ I
STATISTICS BASED ON RAW FREQUENCY
CHI SQUARE= .190898 E 02 DEGREES OF FREEDOM = 28
CONT COEF = .991693 E -01
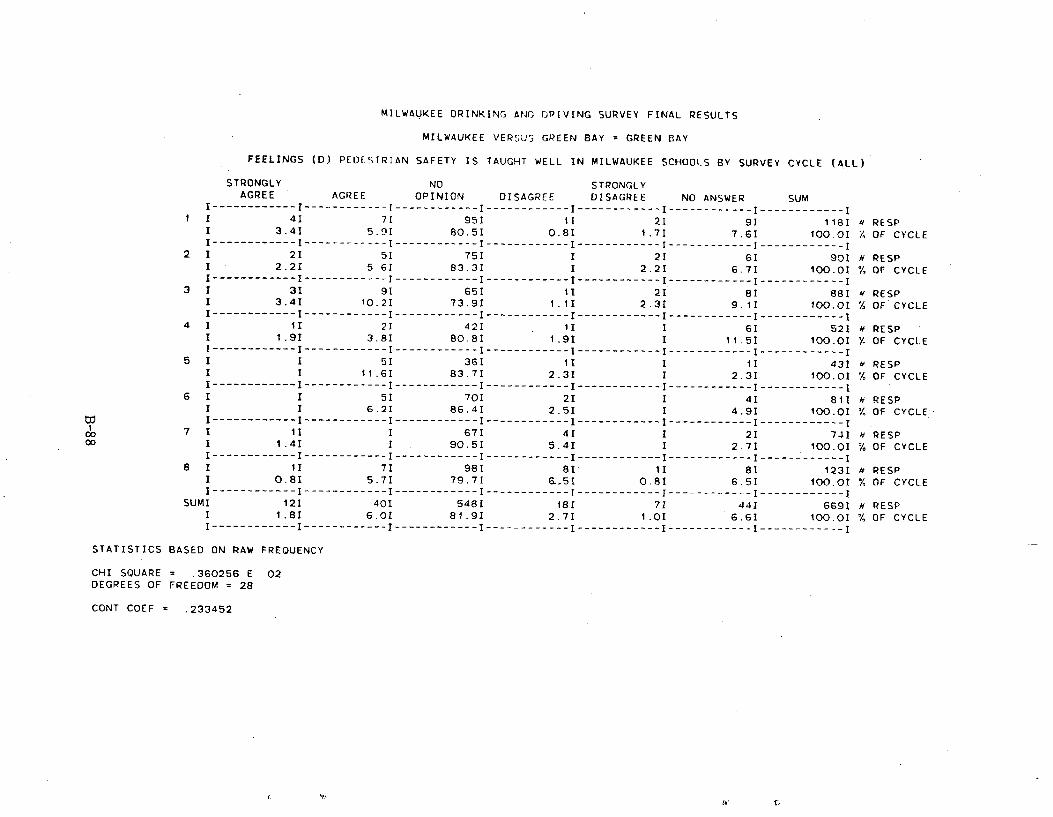
MILWAUKEE DRINKING AND UPIVING SURVEY FINAL RESULTS
MILWAUKEE VERSUS GREEN SAY = GREEN BAY
FEELINGS (D) PEDESTRIAN SAFETY IS TAUGHT WELL IN MILWAUKEE SCHOOLS BY SURVEY CYCLE (ALL)
STRONGLYAGREE AGREE OPINION DISAGREE DISAGREE NO ANSWER SUM
I ------------ I ------------ I ------------ I ------------ I ------------ I ------------ I ------------ I 1 1 4I 71 951 1I 21 91 118I a RESP
I 3.41 5.91 80.51 0.81 1.71 7.6I 100.01 Y OF CYCLE I ------------ I ------------ I ------------ I ------------ I ------------ I ------------ I ------------ I
2 I 21 51 751 I 21 6I 901 a RESP I 2.21 5.61 83.31 I 2.21 6.71 100.01 % OF CYCLE I ------------ I ------------ I ------------I ------------ I ------------ I ------------ I ------------ I
3 I 31 91 651 1I 2I 8I 88I if RESP 1 3.4I 10.21 73.9I 1.11 2.31 9.1I 100.0I % OF CYCLE I ------------ I ------------ I ------------ I ------------ I ------------ I ------------ I ------------ I
4 1 ti 21 421 11 I 61 521 a RESP 1 1.91 3.81 80.81 1.91 I 11.51 100.OI 7 OF CYCLE I ------------ I ------------ I ------------ I ------------ I ------------ I ------------ I ------------ I
5 I I 51 361 11 I 11 431 a RESP I I 11.61 83.7I 2.3I 1 2.31 100.01 % OF CYCLE I------------1------------I------------I------------I------------I------------I------------I
6 1 I 51 701 21 1 41 811 a RESP I I 6.21 86.41 2.51 I 4.91 100.01 % OF CYCLE I------------I------------I------------I------------I------------I------------I------------I
7 1 1I I 67I 4I 1 21 741 4 RESP I 1.41 1 90.5I 5.41 I 2.71 100.01 Y. OF CYCLE I ------------ I ------------ I ------------ I ------------ I ------------ I ------------ I ----------1
8 1 II 71 981 81 11 81 1231 a RESP I 0.81 5.71 79.71 6..51 0.81 6.51 100.01 % OF CYCLE I ------------ I ------------ I ------------ I ------------ I ------------ I ------------ I ------------ I
SUMI 121 401 548I 181 71 441 6691 b RESP I 1.8I 6.0I 81.91 2.7I 1.01 6.61 100.01 I OF CYCLE I ------------ I ------------ I ------------ I ------------ I ------------ I ------------ I ------------ I
NO STRONGLY
0. 00
STATISTICS BASED ON RAW FREQUENCY
CHI SQUARE = .360256 E 02DEGREES OF FREEDOM = 28
CONT COEF = .233452
41 f^'
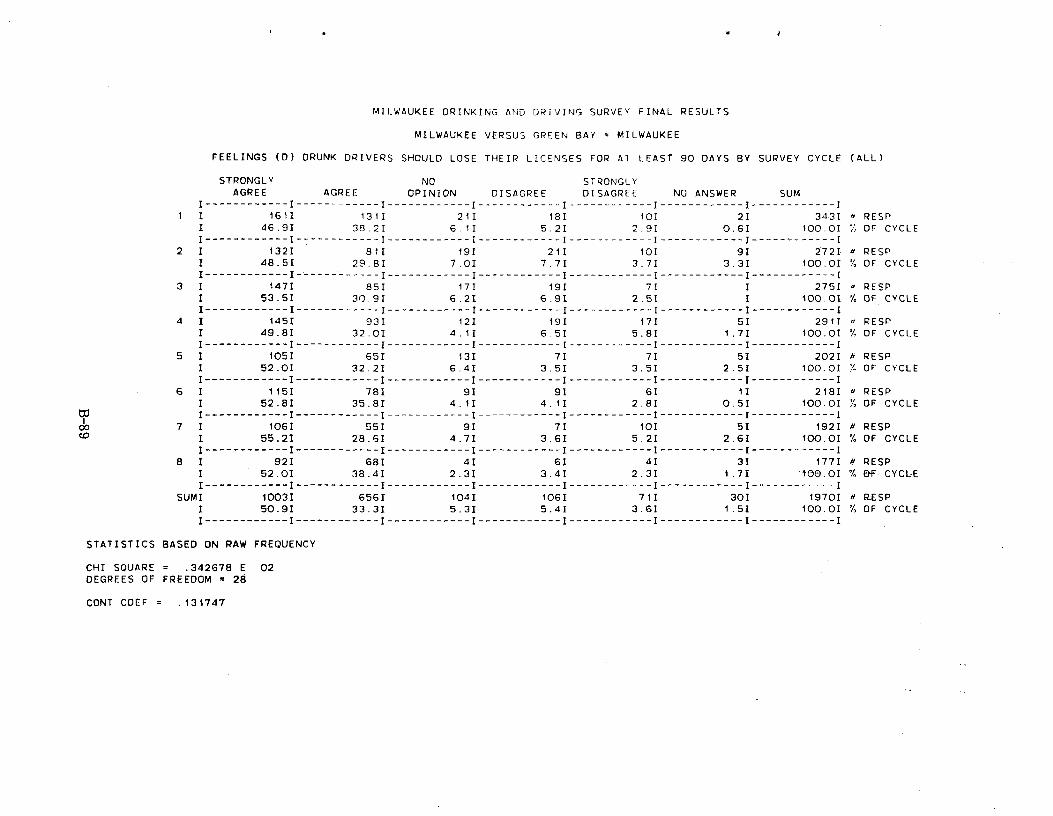
MILWAUKEE DRINKING AND DRIVING SURVEY FINAL RESULTS
MILWAUKEE VERSUS GREEN BAY = MILWAUKEE
FEELINGS (D) DRUNK DRIVERS SHOULD LOSE THEIR LICENSES FOR AT LEAST 90 DAYS BY SURVEY CYCLE (ALL)
STRONGLY NO STRONGLY AGREE AGREE OPINION DISAGREE DISAGREE NO ANSWER SUM
I------------ I ------------ I ------------ I ------------ I ------------ I ------------ I ------------ I 1 I 161I 1311 21I 18I 10I 2I 343I RESP
I 46.91 38.21 6.1I 5.21 2.91 0.6I 100.01 OF CYCLE I ------------ I ------------ I ------------ I ------------ I ------------ I ------------ I ------------ I
2 I 1321 811 19I 21I 10I 91 2721 RESP I 48.51 29.81 7.01 7.7I 3.71 3.3I 100.0I % OF CYCLE I------------ I -'----------- I ------------ I ------------ I ------------ I ------------ I ------------ I
3 I 1471 85I 171 19I 7I I 2751 - RESP I 53.51 30.91 6.21 6.91 2.51 I 100.01 % OF CYCLE I------------ I ------------ I ------------ I ------------ I ------------ I ------------ I ------------ I
4 I 145I 931 121 191 17I 51 291T RESP I 49.81 32.01 4.11 6.51 5.81 1.71 100.0I % OF CYCLE I ------------ I ------------ I ------------ I ------------ I ------------ I ------------ I ------------ I
5 I 105I 651 13I 71 7I 5I 202I RESP I 52.0I 32.21 6.41 3.51 3.51 2.51 100.0I Y OF CYCLE I ------------ I ------------ I ------------ I ------------ I ------------ I ------------ I ------------ I
6 1 115I 78I 9I 91 61 1I 218I RESP I 52.81 35.8I 4.1I 4.11 2.8I 0.5I 100.0I % OF CYCLE
Cz7 I------------ I ------------ I ------------ I ------------ I ------------ I ------------ I ------------ I 00 7 I 106I 55I 9I 7I 101 51 192I p RESP to I 55.21 28.61 4.71 3.6I 5.2I 2.6I 100.01 % OF CYCLE
I ------------ I ------------ I ------------ I ------------ I ------------ I ------------ I ------------ I 8 I 92I 681 4I 61 4I 3I 177I # RESP
I 52.01 38.41 2.31 3.41 2.31 1.71 tOO.OI % &F'CYCLE I ------------ I ------------ I ------------ I ------------ I ------------ I ------------ I ------------ I
SUMI 10031 656I 104I 106I 71I 30I 19701 RESP I 50.91 33.31 5.31 5.41 3.6I 1.51 100.0I % OF CYCLE I ------------ I ------------ I ------------ I ------------ I ------------ I ------------ I ------------ I
STATISTICS BASED ON RAW FREQUENCY
CHI SQUARE = .342678 E 02DEGREES OF FREEDOM = 28
CONT COEF = .131747
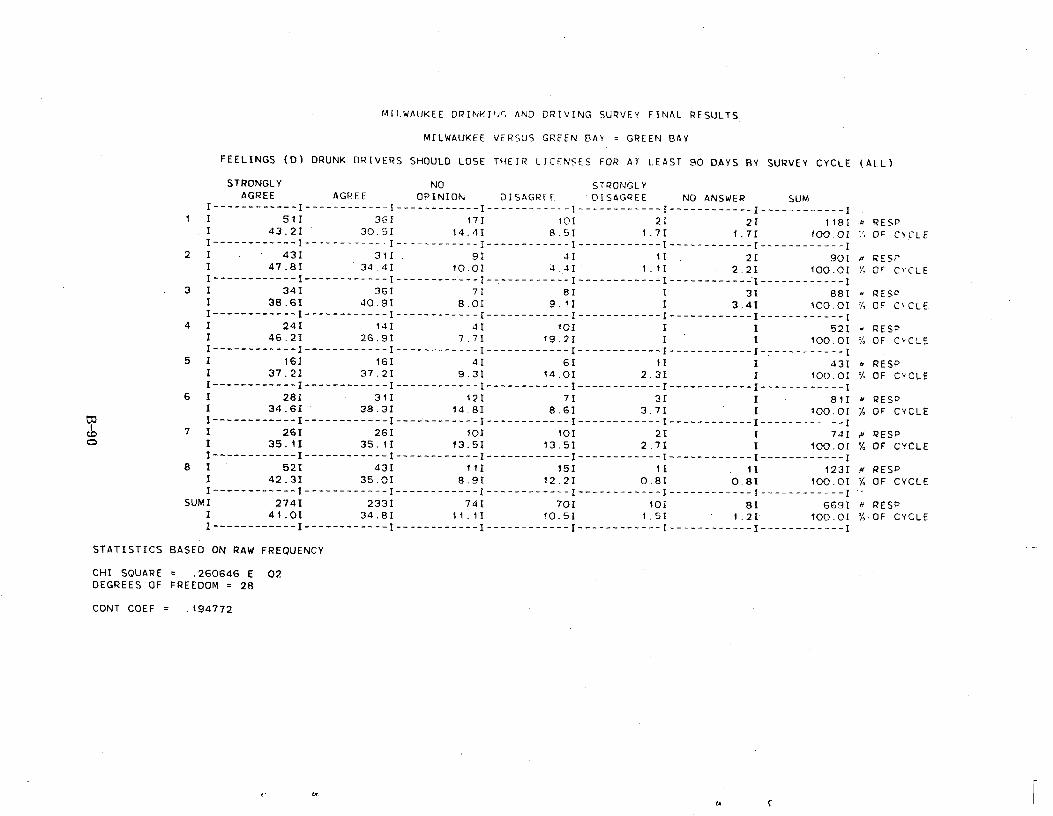
MILWAUKEE OPINKItlr. AND DRIVING SURVEY FINAL RESULTS
MILWAUKEE VERSUS GREEN BAY = GREEN BAY
FEELINGS (D) DRUNK DRIVERS SHOULD LOSE THEIR LICENSES FOR AT LEAST 90 DAYS BY SURVEY CYCLE (ALL)
STRONGLY NO STRONGLY AGREE AGREE OPINION DISAGREE. DISAGREE NO ANSWER SUM
I------------ I ------------ I ------------ I --1 I 51I 361 171
1 43.2I 30.51 14.41 I ------------ I ----------- I------------I----
2 I 43I 311 91 1 47.81 34.41 10.01
---------I------------I------------I------------I 10I 21 2I 1181 RESP
8.5I 1.71 1.7I 100.01 OF CYCLE --------I------------I------------I------------1
4I 1I , 2I 901 a RESP 4,4I 1.11 2.21 100.01 '/A OF CYCLE
I ------------ I ------------ I ------------- I ------------ I ------------ I ------------ I ------------ I 3 1 34I 36I 7I 81 I 31 881 = RESP
I 38.6I 40.91 8.01 9.11 1 3.41 100.01 % OF CYCLE 1------------I------------I------------I------------I------------I------------I------------I
4 I 241 141 41 101 1 I 521 RESP I 46.2I 26.91 7.71 19.21 I I 100.01 OF CYCLE I ------------ I ------------ I ------------ I ------------ I ------------ I ------------ I ------------ I
5 I 16I 16I 41 61 1I 1 431 x RESP I 37.2I 37.21 9.31 14.01 2.3I I 100.OI % OF CYCLE I ------------ I ------------ I ------------ I ------------ I ------------ I ------------ I ------------ I
6 I 281 31I 121 71 31 I 81I H RESP I 34.6I 38.3I 14.8I 8.6I 3.71 1 100.0I % OF CYCLE I ------------ I ------------ I ------------ I ------------ I ------------ I ------------ I ------------ I
7 I 261 261 10I 10I 21 I 741 # RESP I 35.1I 35.11 13.51 13.5I 2.7I 1 100.01 % OF CYCLE I ------------ I ------------ I ------------ I ------------ I ------------ I ------------ I ------------ I
8 1 521 43I 11I 15I 1I 1I 123I u RESP I 42.31 35.0I 8.9I 12.2I 0.81 0.8I 100.0I % OF CYCLE I ------------ I ------------ I ------------ I ------------ I ------------ I ------------ I ------------ I
SUMI 274I 2331 741 70I 101 8I 669I N RESP 1 41.01 34.81 11.11 10.51 1.5I 1.2I 100.01 '/,-OF CYCLE I ------------ I ------------ I ------------ I ------------ I ------------ I ------------ I ------------ I
STATISTICS BASED ON RAW FREQUENCY
CHI SQUARE = .260646 E 02 DEGREES OF FREEDOM = 28
CONT COEF = .194772
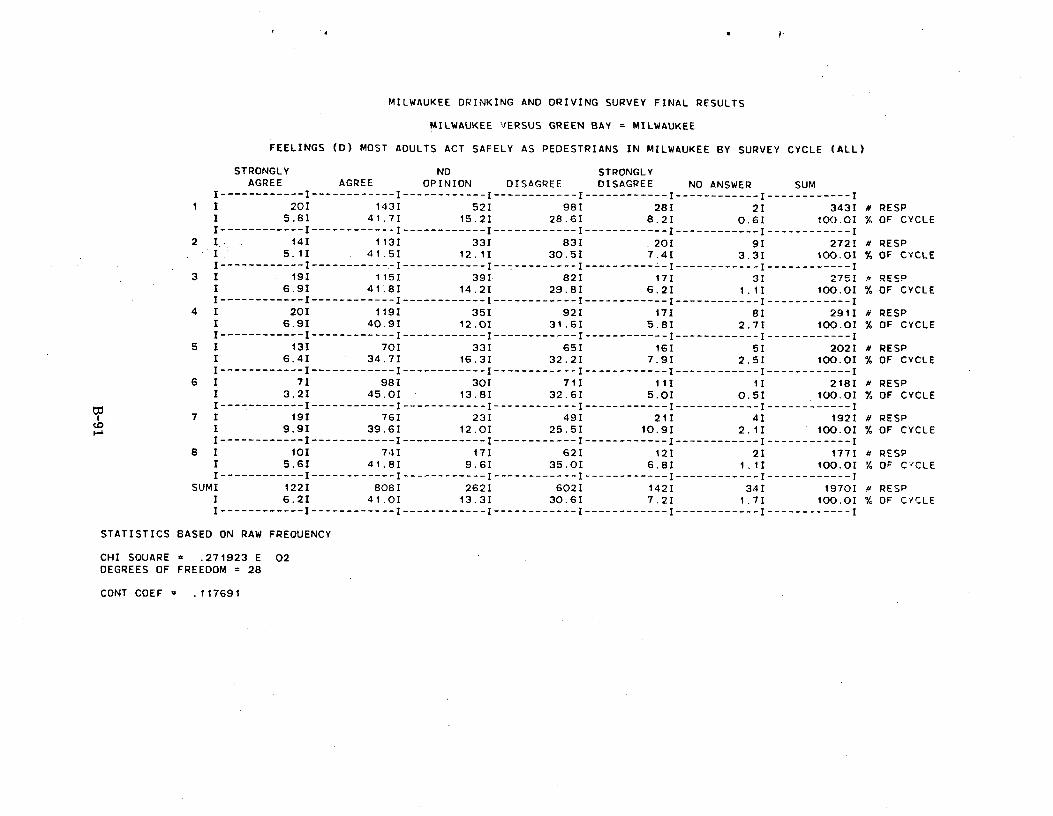
MILWAUKEE DRINKING AND DRIVING SURVEY FINAL RESULTS
MILWAUKEE VERSUS GREEN BAY = MILWAUKEE
FEELINGS (D) MOST ADULTS ACT SAFELY AS PEDESTRIANS IN MILWAUKEE BY SURVEY CYCLE (ALL)
STRONGLY NO STRONGLY AGREE AGREE OPINION DISAGREE DISAGREE NO ANSWER SUM
I------------ I ------------ I ------------ I ------------ I ------------ I ------------ I ------------I I 1 201 143I 521 982 28I 21 3431 # RESP
I 5.81 41.7I 15.21 28.61 8.21 0.6I 100.0I % OF CYCLE I ------------ I ------------ I ------------ I ------------ I ------------ I ------------ I ------------ I
2 I.. 14I 1131 33I 831 _201 91 2721 a RESP I 5.1I 41.51 12.1I 30.5I 7.4I 3.3I 100.01 % OF CYCLE I ------------ I -----------.- I ------------ I------------ I ----------=- I------------ I ------------ I
3 I 191 115I 39I 821 171 3I 2751 RESP
I 6.91 41.81 14.2I 29.8I 6.21 1.11 100.0I % OF CYCLE I------------ I ------------ I ------------ I ------------ I ------------ I ------------ I ------------ I
4 I 20I 1191 35I 92I 171 81 2911 N RESP I 6.9I 40.9I 12.01 31.6I 5.81 2.7I 100.0I % OF CYCLE I ------------ I ------------ I ------------ I ------------ I ------------ I ------------ I ------------ I
5 I 13I 701 33I 65I 16I 51 202I # RESP 1 6.4I 34.71 16.31 32.2I 7.9I 2.5I 100.01 % OF CYCLE I ------------ I ------------ I ------------ I ------------ I ------------ I ------------ I ------------ I
6 I 7I 981 30I 711 11I 1I 218I N RESP I 3.21 45.01 13.81 32.6I 5.01 0.51 100.01 % OF CYCLE I ------------ I ------------ I ------------ I ------------ I ------------ I ------------ I ------------ I
7 I 19I 76I 23I 491 21I 4I 192I N RESP I 9.9I 39.6I 12.0I 25.51 10.9I 2.1I 100.0I % OF CYCLE I ------------ I ------------ I ------------ I ------------ I ------------ I ------------ I ------------ I
8 I 101 74I 17I 62I 121 21 177I N RESP I 5.6I 41.81 9.61 35.01 6.81 1.11 100.0I % OF CYCLE I ------------ I ------------ I ------------ I ------------ I ------------ I ------------ I ------------ I
SUMI 122I 808I 2621 602I 142I 342 1970I N RESP I 6.21 41.01 13.31 30.61 7.21 1.71 100.01 % OF CYCLE I ------------ I ------------ I ------------ I ------------ I ------------ I ------------ I ------------ I
STATISTICS BASED ON RAW FREQUENCY
CHI SQUARE = .271923 E 02 DEGREES OF FREEDOM = 28
CONT COEF = .117691
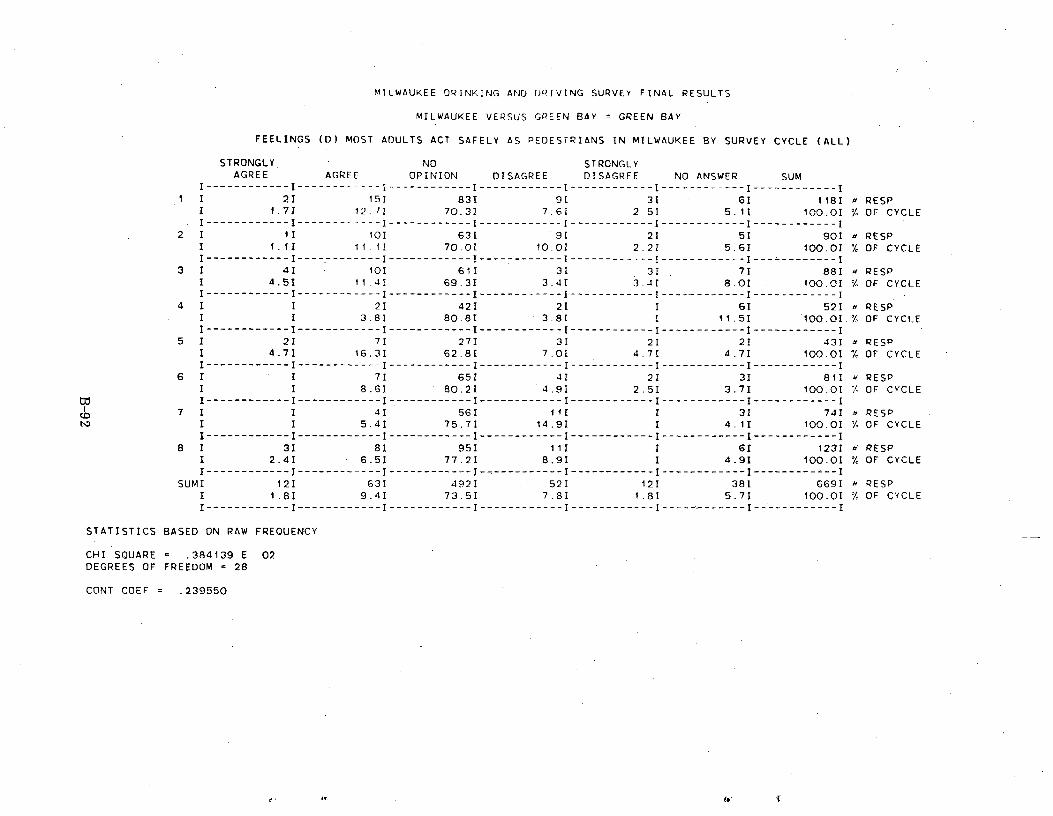
MILWAUKEE DRINKING AND DRIVING SURVEY FINAL RESULTS
MILWAUKEE VERSUS GREEN SAY = GREEN SAY
FEELINGS (D) MOST ADULTS ACT SAFELY AS PEDESTRIANS IN MILWAUKEE BY SURVEY CYCLE (ALL)
STRONGLY, NO STRONGLY AGREE AGREE OPINION DISAGREE DISAGREE NO ANSWER SUM
I ------------ I ------------ I ------------ I ------------ I ------------ I ------------ I ------------ I 1 I 2I 151 83I 91 31 6I 118I RESP
1 1.71 12.71 70.31 7.61 2 51 5.11 100.01 % OF CYCLE I ------------ I ------------ I ------------ I ------------ I ------------ I ------------ I ------------ I
2 I 11 101 63I 91 21 51 901 RESP I 1.11 11. II 70.01 10.01 2.2.1 5.61 100:01 % OF CYCLE I ------.------ I -----------I------------I------------I------------I------------I---=--------I
3 I 41 101 61I 31 31 . 71 881 RESP I 4.51 11.4I 69.31 3.41 3.-1T 8.01 1O0.01 OF CYCLE I ------------ I ------------ I ------------ I ------------ I ------------ I ------------ I ------------ I
4 1 I 21 421 21 I 61 521 RESP I I 3.81 80.81 3.81 1 11.51 100.01.% OF CYCLE I ------------ I------------ I ------------ I ------------ I ------------ I ------------ I ------------ I
5 1 21 71 271 31 21 21 431. RESP I 4.71 16.31 62.81 7.01 4.71 4.71 100.01 7, OF CYCLE I ------------ I ------------ I ------------ I ------------ I ------------ I ------------ I ------------ I
6 1 1 71 65I 41 21 31 811 > RESP I I 8.61 80.21 4.91 2.51 3.7I 100.01 % OF CYCLE I------------ I ------------ I ------------ I ------------ I ------------ I ------------ I ------------ I
7 I 1 41 56I 111 1 31 741 n RESP I I 5.41 75.71 14.91 I 4.11 100.01 % OF CYCLE I------------ I ------------ I ------------ I ------------ I ------------ I ------------ I ------------ I
8 I 31 81 951 111 1 61 1231 a RESP I 2.41 6.51 77.21 8.91 I 4.91 100.01 % OF CYCLE I ------------ I ------------ I ------------ I ------------ I ------------ I ------------ I ------------ I
SUMI 12I 631 492I 52I 12I 38I 669I RESP I 1.81 9.41 73.51 7.81 1.81 5.71 100.01 % OF CYCLE I ------------ I ------------ I ------------ I ------------ I ------------ I ------------ I ------------ I
STATISTICS BASED ON RAW FREQUENCY
CHI SQUARE = .384139 E 02 DEGREES OF FREEDOM = 28
CONT COEF = .239550
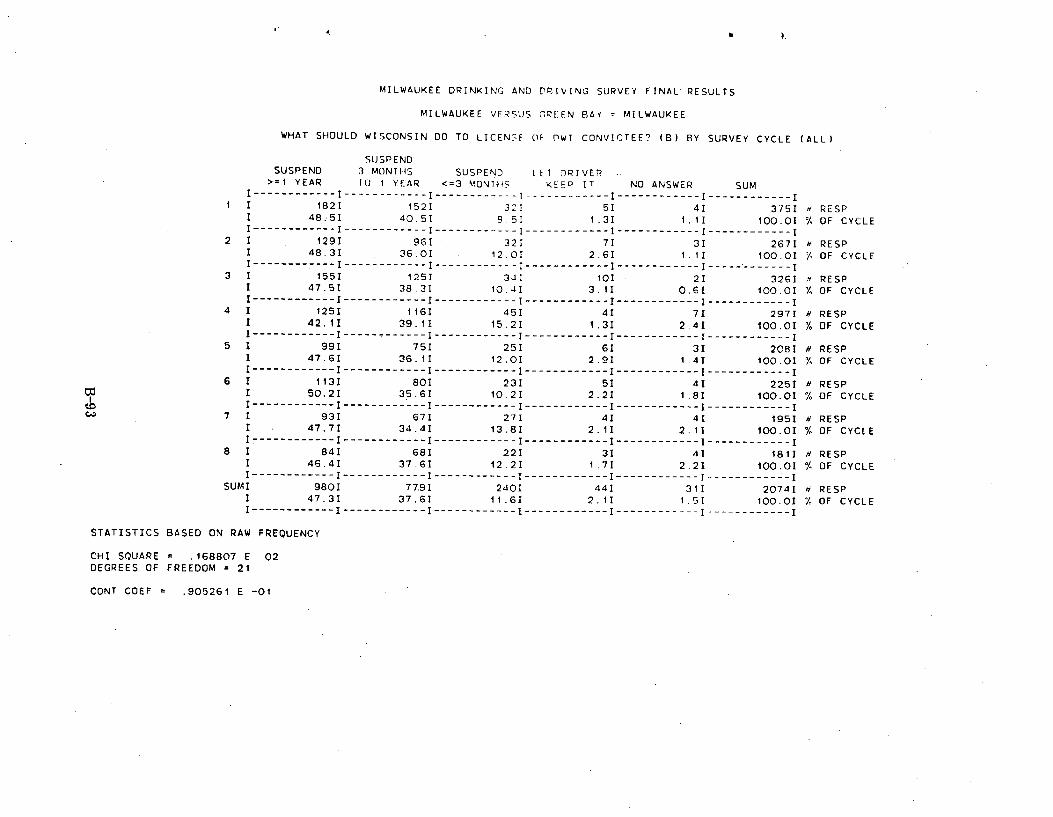
MILWAUKEE DRINKING AND DRIVING SURVEY FINAL RESULTS
MILWAUKEE VERSUS C'RE:EN BAY = MILWAUKEE
WHAT SHOULD WISCONSIN 00 TO LICEN,;F CIF DWI CONVICTEE? (B) BY SURVEY CYCLE (ALL)
SUSPEND SUSPEND 3 MONTFIS SUSPEND LET DRIVER
>=1 YEAR IU 1 YEAR <=3 MONTHS KEEP IT NO ANSWER SUM I------------ I ------------ I ------------ I ------------ I ------------ I ------------I
1 I 1821 152I 321 51 4I 375I N RESP I 48.51 40.51 8.51 1.31 1.1I 100.01 % OF CYCLE I------------ I ---.--------- I ------------ I ------------ I ------------ I ------------ I
2 I 129I 96I 321 71 3I 2671 RESP I 48.3I 36.0I 12.0I 2.61 1.1I 100.01 7 OF CYCLE I------------ I ------------ I ------------ I ------------ I ------------ I ----------
3 I 155I 125I 34I 10I 2I 326I N RESP I 47.51 38.31 10.41 3.11 0.6I 100.01 % OF CYCLE I ------------ I ------------ I ------------ I ------------ I ------------ I ------------ I
4 I 125I 11GI 45I 4I 7I 2971 a RESP I 42.11 39.11 15.21 1.31 2.41 100.01 % OF CYCLE I ------------ I ------------ I ------------ I ------------ I ------------ I ------------ I
5 I 991 75I 25I 6I 31 208I H RESP I 47.61 36.11 12.01 2.91 1.41 100.01 '% OF CYCLE I ------------ I ------------ I ------------ I ------------ I ------------ I ------------ I
6 I 113I 80I 231 5I 4I 2251 N RESP I 50.21 35.61 10.21 2.2I 1.8I 100.0I % OF CYCLE I ------------ I ------------ I ------------ I ------------ I ------------ I ------------ I
7 I 931 671 27I 41 4I 195I a RESP I 47.7I 34.41 13.8I 2.1I 2.11 100.0I % OF CYCLE I ------------ I ------------ I ------------ I ------------ I ------------ I ------------ I
8 I 84I 681 22I 3I 4I 1811 N RESP I 46.41 37.61 12.21 1.71 2.21 100.01 % OF CYCLE I ------------ I ------------ I ------------ I ------------ I ------------ I ------------ I
SUMI 9801 77.91 240I 441 311 2074I a RESP I 47.31 37.61 11.6I 2.11 1.51 100.01 % OF CYCLE I ------------ I ------------ I -----.------- I ------------ I ------------ I ------------ I
N RAW FREQUENCY STATISTICS BASED O
CHI SQUARE = .168807 E 02 DEGREES OF FREEDOM = 21
CONT COEF = .905261 E -01
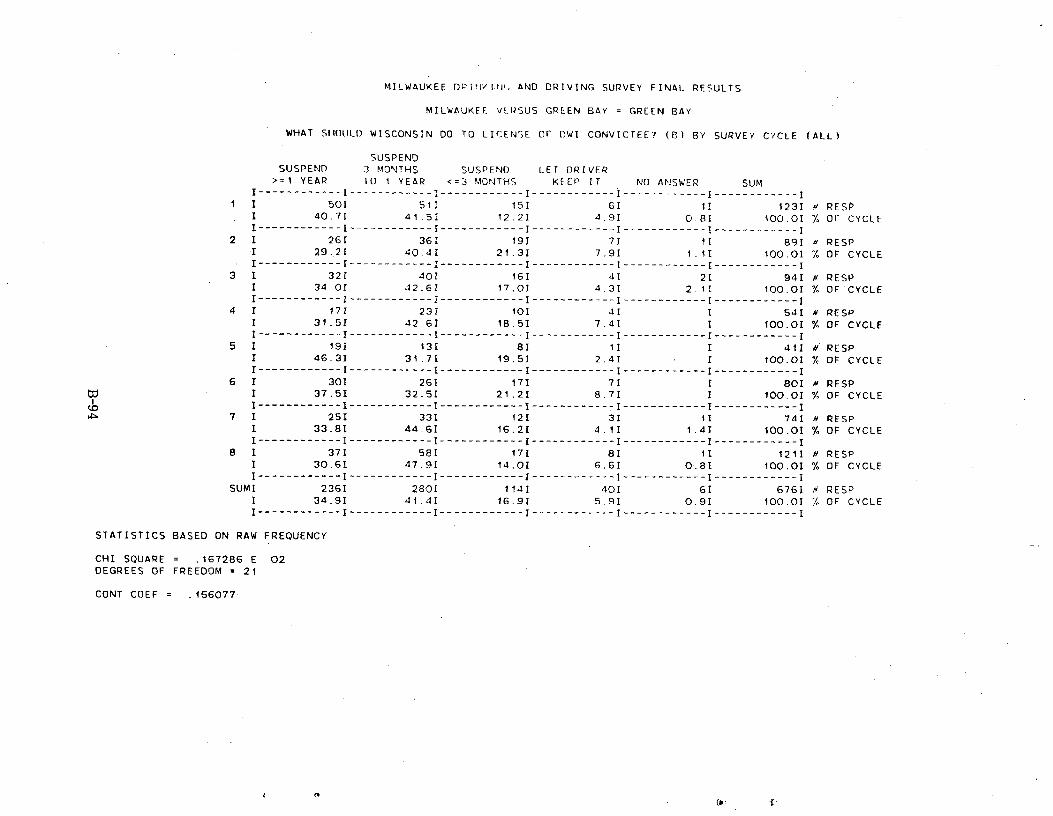
MILWAUKEE DPlrlvl.rl'. AND DRIVING SURVEY FINAL RESULTS
MILWAUKEE VERSUS GREEN BAY = GREEN BAY
WHAT SHOULD WISCONSIN DO TO LICENSE OF DWI CONVICTEE? (B) BY SURVEY CYCLE (ALL)
SUSPEND SUSPEND 3 MONTHS SUSPEND LET DRIVER
>=1 YEAR 10 1 YEAR <=3 MONTHS KEEP IT NO ANSWER SUM I------------ I ------------ I ------------ I ------------ I ------------ I ------------ I
1 I 50I 511 15I 6I 1I 123I RESP I 40.7I 41.51 12.2I 4.9I 0.8I 100.01 % or CYCLE I------------ I ------------ I ------------ I ------------ I ------------ I ------------ I
2 I 281 381 19I 71 1I 89I s RESP I 29.21 40.41 21.31 7,91 1.11 100.01 % OF CYCLE I ------------ I ------------ I ------------ I ------------ I ------------ I -----------I
3 I 321 401 161 41 21 941 a RESP I 34-01 42.6I 17.0I 4.31 2.1I 100.0I % OF CYCLE I ------------ I ------------ I ------------ I ------------ I ------------ I ------------ I
4 I 17I 23I 101 41 I 541 a RESP I 31.5I 42.61 18.5I 7.4I 1 100.01 % OF CYCLE I ------------ I ------------ I ------------ I ------------ I ------------ I ------------ I
5 I 191 13I 81 II 1 411 a RESP I 46.31 31.71 19.51 2.41 1 100.01 % OF CYCLE I------------ I ------------ I ------------ I ------------ I ------------ I ------------ I
6 I 301 261 171 71 I 801 N RESP I 37.51 32.51 21.21 8.71 1 100.0I % OF CYCLE I------------ I ------------ I ------------ I ------------ I ------------ I ------------ I
7 I 25I 33I 121 31 11 74I m PESP I 33.81 44.61 16.2I 4.11 1.41 100.01 % OF CYCLE I ------------ I ------------ I ------------ I ------------ I ------------ I ------------ I
8 I 371 58I 17I 8I 1I 121I a RESP I 30.6I 47.91 14.01 6.6I 0.81 100.01 % OF CYCLE I------------ I ------------ I ------------ I ------------ I ------------ I ------------ I
SUMI 236I 280I 114I 401 6I 6761 a RESP 1 34.9I 41.41 16.9I 5.91 0.9I 100.01 OF CYCLE I ------------ I ----------=-I ------------ I ------------ I ------------ I ------------ I
STATISTICS BASED ON RAW FREQUENCY
CHI SQUARE = .167286 E 02 DEGREES OF FREEDOM = 21
CONT COEF = .156077
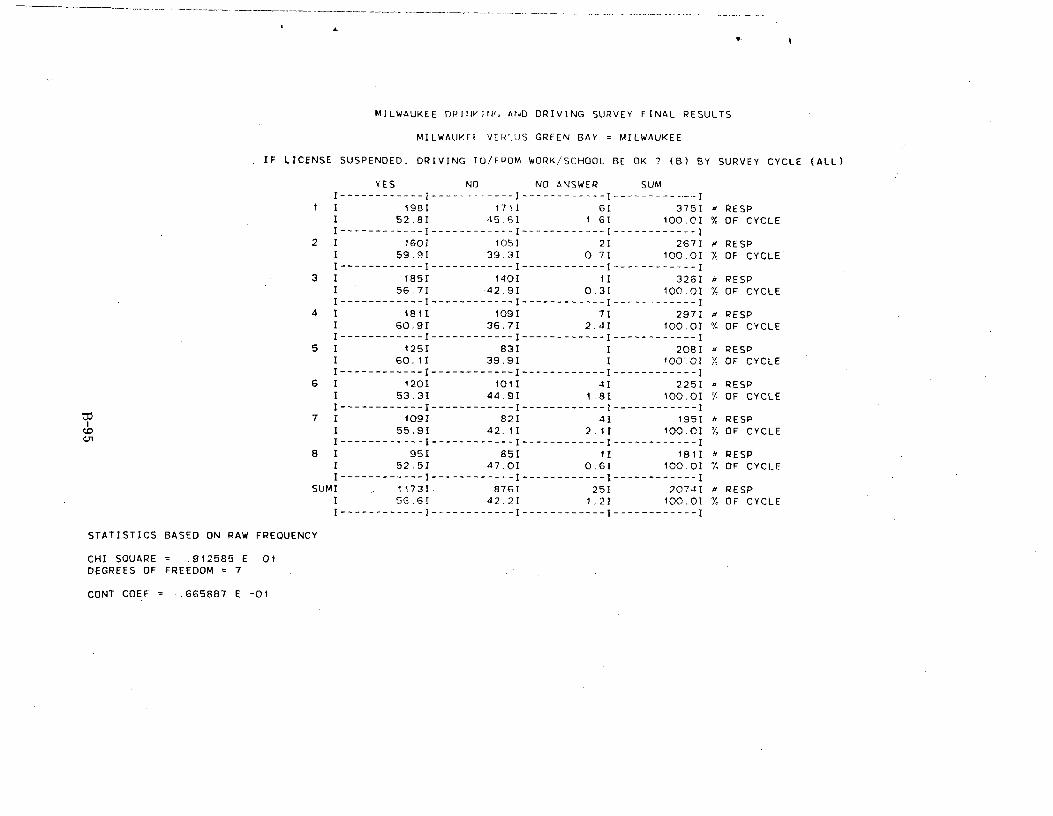
1
MILWAUKEE DNIIIVIN4 AND DRIVING SURVEY FINAL RESULTS
MILWAUKFI VER',US GREEN BAY = MILWAUKEE
IF LICENSE SUSPENDED. DRIVING TO/FROM WORK/SCHOOL BE OK ? (B) BY SURVEY CYCLE (ALL)
YES NO NO ANSWER SUM
I ------------ I ------------ I ------------ I -----------1 I 198I 1711 61 3751 RESP
I 52.81 45.6I 1.6I 100.0I % OF CYCLE I------------ I ------------ I ------------ I ------------ I
2 I 1601 1051 21 2671 RESP I 59.9I 39.31 0.71 100.01 OF CYCLE I -----------I------------I------------I------------I
3 I 185I 1401 11 3261 . RESP I 56.71 42.9I 0.31 100.01 / OF CYCLE I------------ I ------------ I ------------ I ------------ I
4 I 181I 1091 71 297I a RESP I 60.9I 36.71 2.41 100.01 OF CYCLE I ------------ I ------------ I ------------ I ------------ I
5 I 1251 831 I 2081 RESP I 60.11 39.91 I 100.0I OF CYCLE I ------------ I ------------ I ------------ I ------------ I
6 I 1201 1011 41 2251 = RESP I 53.31 44.91 1.8I 100.01 I OF CYCLE I ------------ I ------------ I ------------ I ------------ I
7 1 1091 821 41 1951 fi RESP 1 55.91 42.11 2.11 100.01 % OF CYCLE I------------I------------I------------I------------1
8 I 951 851 II 1811 a RESP I 52.51 47,01 0.61 100.01 OF CYCLE I ------------ I ------------ I ------------ I ------------ I
SUMI 1173I. 876I 25I 2074I a RESP I 5G.6I 42.21 1.21 100.01 % OF CYCLE I------------ I ------------ I ------------ I ------------ I
STATISTICS BASED ON RAW FREQUENCY
CHI SQUARE _ .912585 E 01 DEGREES OF FREEDOM = 7
CONT COEF = .665887 E -01
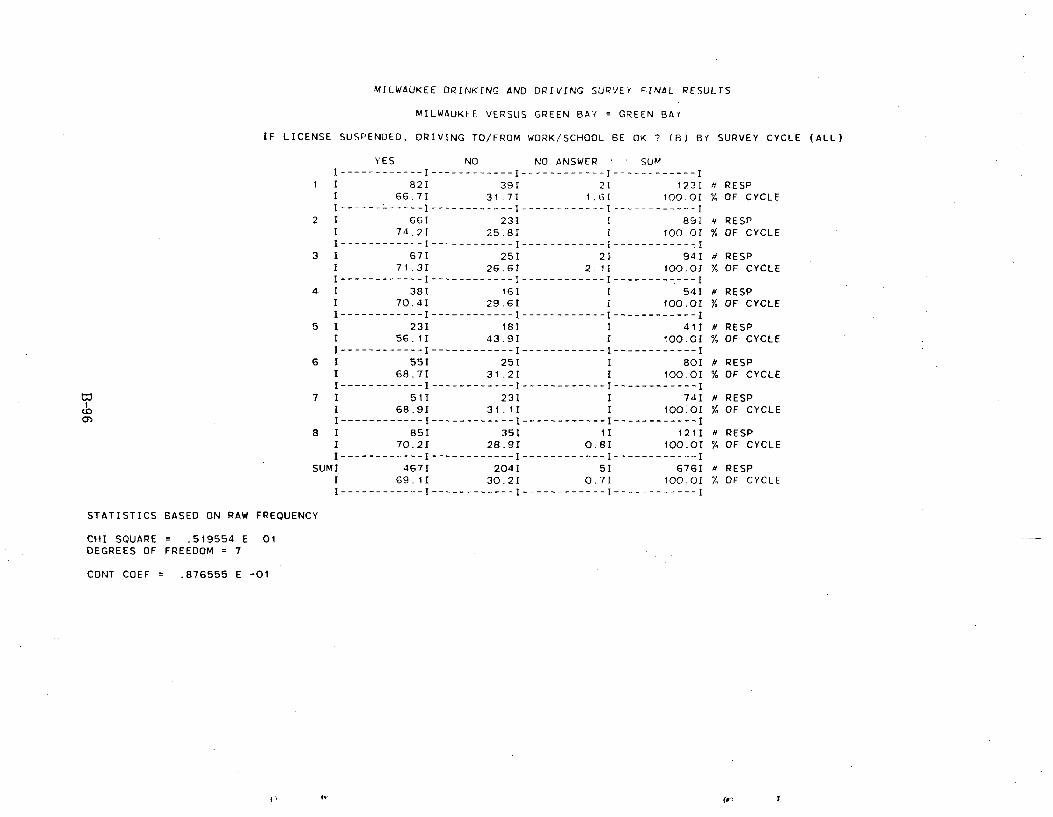
MILWAUKEE DRINKING AND DRIVING SURVEY FINAL RESULTS
MILWAUKEE VERSUS GREEN BAY = GREEN BAY
IF LICENSE SUSPENDED. DRIVING TO/FROM WORK/SCHOOL BE OK 7 (8) BY SURVEY CYCLE (ALL)
YES NO NO ANSWER ' ' SUM I------------ I ------------ I ------------ I ------------I
1 I 82I 391 21 1231 H RESP I 66.71 31,71 1.61 100.01 % OF CYCLE I------------ I ------------ I ------------ I------------ I
2 I 66I 231 I 891 a RESP I 74.21 25.81 I 100.01 % OF CYCLE I ------------ I ------------ I ------------ I ------------I
3 I 671 251 21 941 RESP I 71.3I 26.61 2.11 100.01 % OF CYCLE I ------------ I ------------ I ------------ I -------.---I
4 1 381 161 I 541 # RESP I 70.41 29.61 1 100.01 % OF CYCLE I ------------ I ------------ I ------------ I ------------ I
5 I 231 181 I 411 # RESP I 56.11 43.91 1 100.01 % OF CYCLE I ------------ I ------------ I ------------ I ------------ I
6 1 551 251 I 801 # RESP I 68.71 31.21 1 100.01 % OF CYCLE I ------------ I ------------ I ------------ I ------------ I
7 I 511 231 I 741 a RESP I 68.91 31.11 1 100.01 % OF CYCLE I ------------ I ------------ I ------------ I ------------ I
8 I 851 351 11 1211 RESP I 70.21 28.91 0.81 100.01 % OF CYCLE I ------------ I ------------ I ------------ I ------------ I
SUMI 4671 2041 51 G76I H RESP I 69.1I 30.21 0.71 100.01 % OF CYCLE I ------------ I ------------ I ------------ I ------------ I
STATISTICS BASED ON RAW FREQUENCY
CHI SQUARE _ .519554 E 01 DEGREES OF FREEDOM = 7
CONT COEF = .876555 E -01
b (a t
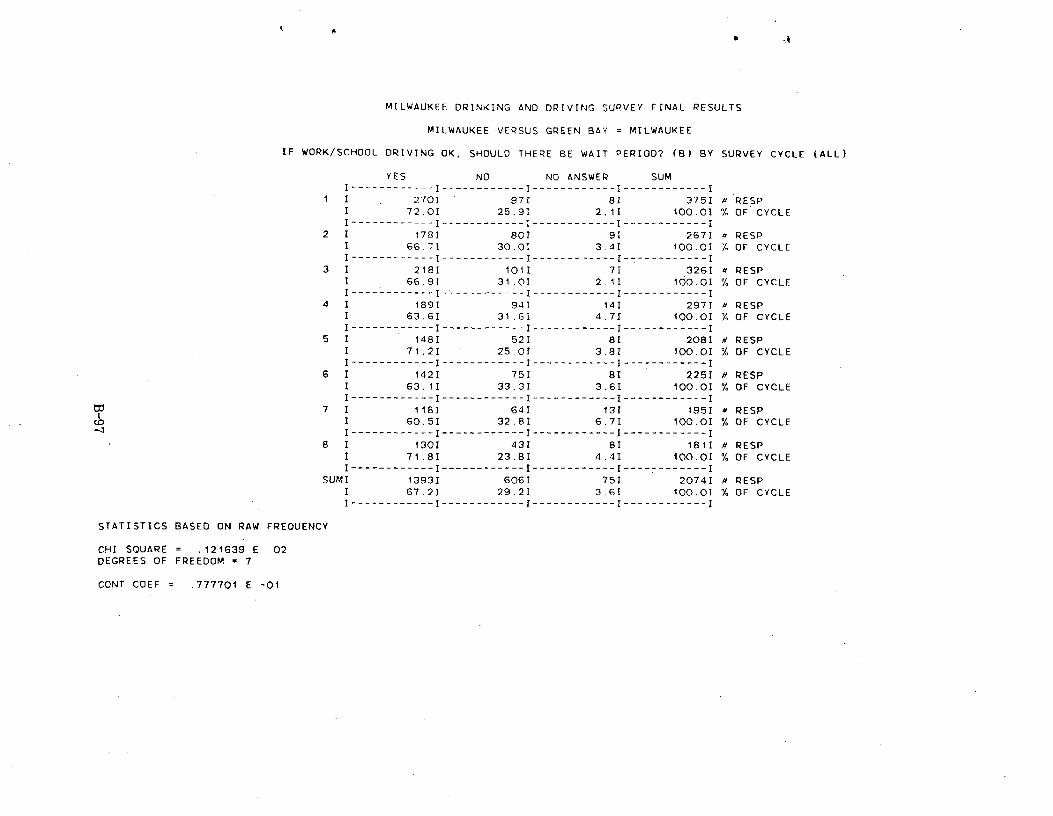
k
MILWAUKEE DRINKING AND DRIVING SURVEY FINAL RESULTS
MILWAUKEE VERSUS GREEN BAY = MILWAUKEE
IF WORK/SCHOOL DRIVING OK. SHOULD THERE BE WAIT PERIOD? (B) BY SURVEY CYCLE (ALL)
YES NO NO ANSWER SUM
I ------------ I ------------ I ------------ I ------------I 1 I 2701 971 81 3751 a RESP
1 72.01 25.91 2.11 100.0I % OF CYCLE I ------------ I ------------ I ------------ I ------------ I
2 1 1781 801 91 2671 a RESP I 66.71 30.01 3.41 100.01 % OF CYCLE I ------------ I ------------ I ------------ I ------------ I
3 I 2181 101I 71 3261 RESP I 66.91 31.0I 2.1I 100.01 % OF CYCLE I ------------ I------------ I ------------ I ----=------- I
4 I 1891 941 14I 2971 a RESP I 63.61 31.6I 4.71 100.01 % OF CYCLE I------------ I ------------ I ------------ I ------------ I
5 I 1481 521 81 2081 a PESP I 71.2I 25.01 3.81 100.01 % OF CYCLE I ------------ I ------------ I ------------ I ------------ I
6 I 1421 751 81 2251 H RESP I 63.11 33.31 3.61 100.01 % OF CYCLE I ------------ I ------------ I ------------ I ------------ I
7 I 1181 64I 131 1951 a RESP 1 60.51 32.81 6.71 100.01 % OF CYCLE I ------------ I ------------ I ------------ I ------------ I
8 1 1301 431 81 1811 a RESP I 71.8I 23.81 4.41 100.0I % OF CYCLE I ------------ I ------------ I ------------ I ------------ I
SUMI 1393I 6061 751 2074I a RESP I 67.2I 29.21 3.61 100.01 % OF CYCLE I ------------ I ------------ I ------------ I ------------ I
STATISTICS BASED ON RAW FREQUENCY
CHI SQUARE _ .121639 E 02 DEGREES OF FREEDOM = 7
CONT COEF = .777701 E -01
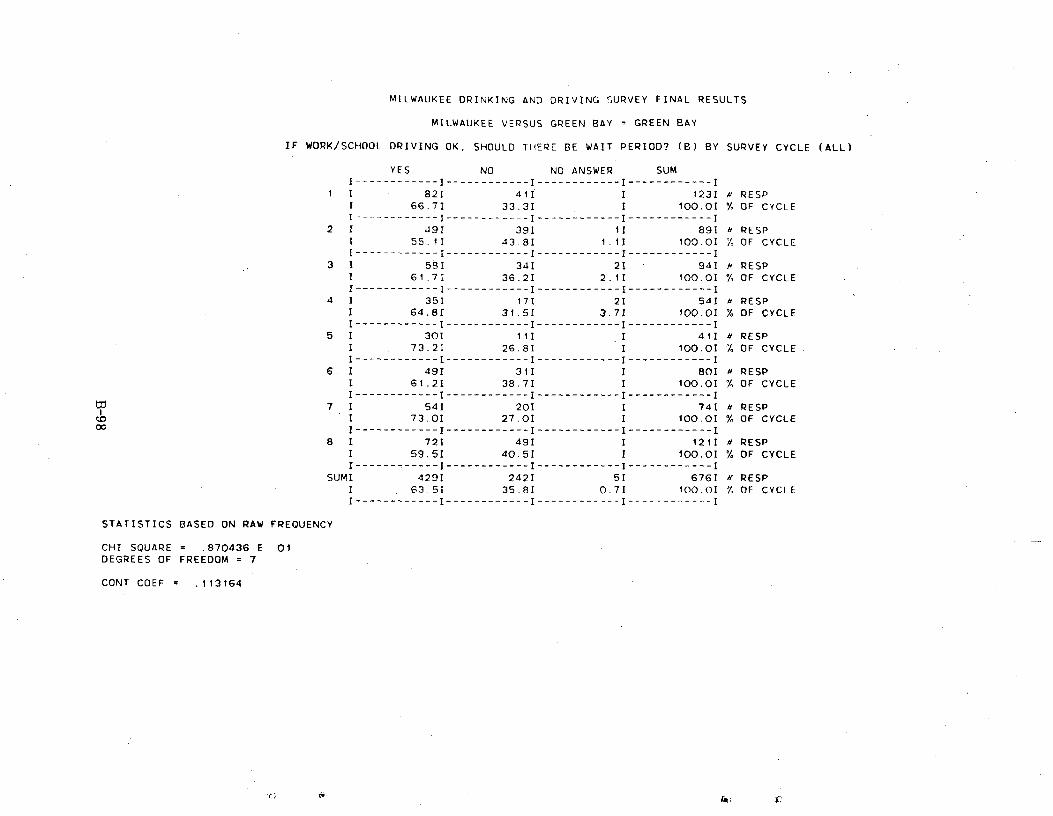
MILWAUKEE DRINKING AND DRIVING SURVEY FINAL RESULTS
MILWAUKEE VERSUS GREEN BAY = GREEN SAY
IF WORK/SCHOOL DRIVING OK, SHOULD THERE BE WAIT PERIOD? (S) BY SURVEY CYCLE (ALL)
YES NO NO ANSWER SUM I ------------ I ------------ I ------------ I ------------I
1 1 821 411 I 1231 # RESP I 66.71 33.31 I 100.01 % OF CYCLE I ------------ I ------------ I ------------ I ------------ I
2 I 49I 391 11 891 a RESP I 55.11 43.81 1.11 1,00.01 % OF CYCLE I ------------ I ------------ I ------------ I ------------I
3 I 581 341 21 941 r RESP I 61.71 36.21 2.11 100.01 % OF CYCLE I ------------ I ------------ I ------------ I -----.------- I
4 I 351 171 21 541 a RESP I 64.81 31.51 3.71 100.01 % OF CYCLE I ------------ I ------------ I ------------ I ------------ I
5 I 301 11I I 411 a RESP I 73.21 26.81 I 100.01 % OF CYCLE. I ------------ I ------------ I ------------ I ------------ I
6. 1 491 311 I 801 a RESP I 61.2I 38.71 I 100.01 . OF CYCLE I ------------ I ------------ I ------------ I ------------ I
7 I 541 201 I 741 a RESP I 73.01 27.01 I 100.01 % OF CYCLE I ------------ I ------------ I ------------ I ------------ I
8 I 721 491 I 1211 a RESP I 59.51 40.51 1 100.OI % OF CYCLE I ------------ I ------------ I ------------ I ------------ I
SUMI 4291 2421 51 6761 a RESP I 63 51 35.81 0.71 100.01 G OF CYCLE I ------------ I ------------ I ------------ I ------------ I
STATISTICS BASED ON RAW FREQUENCY
CHI SQUARE = .870436 E 01 DEGREES OF FREEDOM = 7
CONT COEF = .113164

MILWAUKEE DRINKING AND DRIVING SURVEY FINAL RESULTS
MILWAUKEE VERSUS GREEN BAY = MILWAUKEE
WORK/SCHOOL DRIVING OK AFTER WAITING PERIOD OF: (B) BY SURVEY CYCLE (ALL)
I MONTH 2 MONTHS 3 MONTHS >3 MONTHS NO ANSWER SUM I ------------ I ------------ I ------------ I ------------ I ------------ I ------------ I
I I 821 321 831 711 21 2701 a RESP I 30.41 11.91 30.71 26.31 0.71 100.01 % OF CYCLE I ------------ I ------------ I ------------ I ------------ I ------------ I ------------ I
2 1 441 221 611 491 21 1781 a RESP I 24.71 12.41 34.31 27.51 1.1I 100.0I % OF CYCLE I---------- -I------------ I ------------ I ------------ I ------------ I ------------ I
3 I 571 211 741 641 21 2182 N RESP 2 26.11 9.61 33.91 29.41 0.91 100.01 % OF CYCLE I------------I------------I------------1------------I------------I------------I
4 1 611 221 561 491 11 1891 a RESP1 32.31 11.61 29.61 25.91 0.51 100.01 % OF CYCLE I ------------ I ------------ I ------------ I ------------ I ------------ I ------------ I
5 I 491 171 431 351 41 1481 N RESP I 33.11. 11.51 29.11 23.61 2.71 100.01 % OF CYCLE I------------ I ------------ I ------------ I ------------ I ------------ I ------------ I
6 1 361 121 381 551 11 1421 N RESP 1 25.41 8.51 26.81 38.71 0.71 100.01 % OF CYCLE I ------------ I ------------ I ------------ I ------------ I ------------ I ------------ I
7 1 291 131 371 371 21 1181 RESP I 24.61 11.01 31.41 31.41 1.71 100.01 % OF CYCLE I------------1------------I------------I------------I------------I------------I
8 I 321 151 471 341 21 1301 N RESP I 24.61 11.51 36.21 26.21 1.51 100.01 % OF CYCLE I ------------ I ------------ I ------------ I ------------ I ------------ I ------------ I
SUMI 3901 1541 4391 3941 161 13931 # RESP I 28.01 11.11 31.51 28.31 1.11 100.01 % OF CYCLE I------------ I ------------ I ------------ I ------------ I ------------ I ------------ I
STATISTICS BASED ON RAW FREQUENCY
CHI SQUARE _ .186168 E 02 DEGREES OF FREEDOM = 21
CONT COEF = .115497
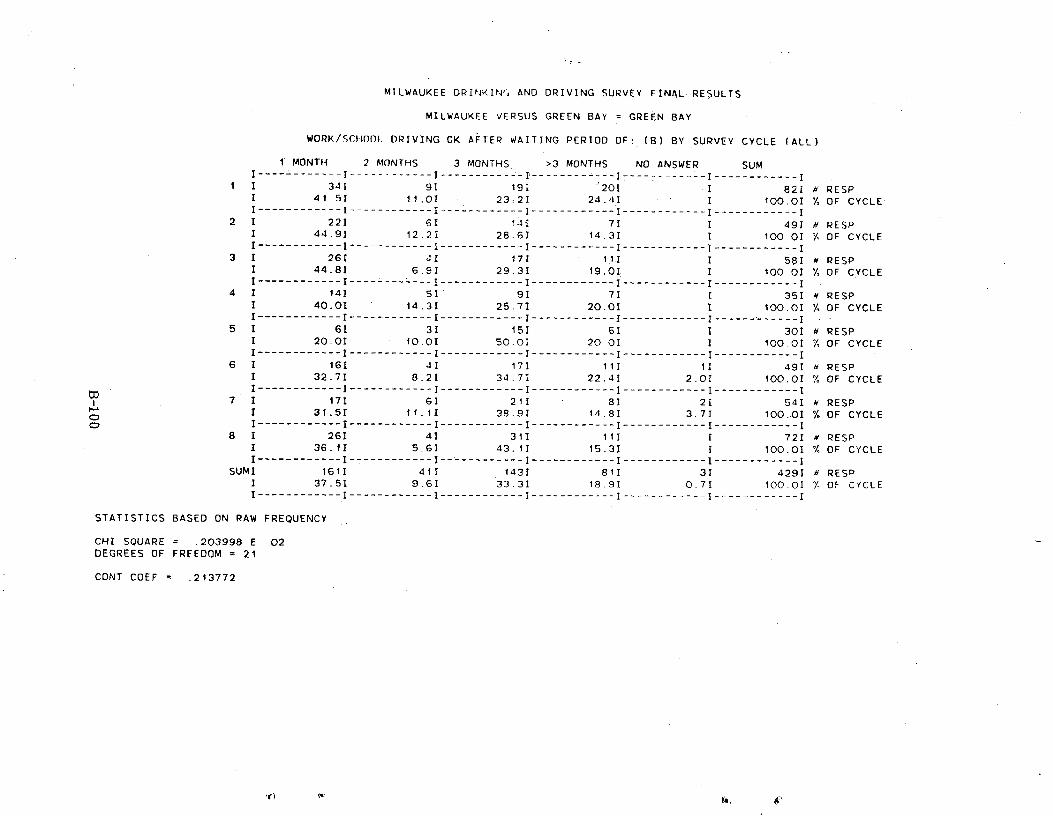
MILWAUKEE DRINKIN(, AND DRIVING SURVEY FINAL-RESULTS
MILWAUKEE VERSUS GREEN BAY = GREEN BAY
WORK/SCHOOI. DRIVING OK AFTER WAITING PERIOD OF: (B) BY SURVEY CYCLE (ALL)
I MONTH 2 MONTHS 3 MONTHS >3 MONTHS NO ANSWER SUM I------------ I ------------ I ---------- =-I------------- I ------------I ------------ I
1 I 341 91 191 20I I 821 k' RESP I 41.51 11.0I 23.2I 24.41 I 100.0I % OF CYCLE I ------------ I ------------ I ------------ I ------------ I ------------ I ------------ I
2 1 221 6I 141 71 1 491 a RESP I 44.91 12.2I 28.6I 14.31 1 100 01 V. OF CYCLE I------------ I ------------ I ------------ I ------------ I ------------ I ------------ I
3 I 261 41 171 Ill I 58I # RESP I 44.81 6.91 29.31 19.01 I 100.01 % OF CYCLE I------------ I ------------ I ------------ I ------------ I------------ I ------------ I
4 1 141 51 91 71 I 351 H RESP I 40.01 14.31 25.71 20.01 I 100.01 % OF CYCLE 1------------I------------I------------I------------I------------I------ -----I
5 I 61 31 151 61 I 301 a RESP I 20.01 10.01 50.0I 20 0I I 100.0I % OF CYCLE I ------------ I ------------ I ------------ I ------------ I ------------ I ------------ I
6 I 161 41 171 111 11 491 RESP I 32.71 8.21 34.71 22.41 2.01 100.01 % OF CYCLE 2------------I------------I------------I------------I------------I------------1
7 I 171 6I 211 81 21 541 a RESP I 31.5I 11.11 38.91 14.81 3.71 100.0I % OF CYCLE I ------------ I ------------ I ------------ I ------------ I ------------ I ------------ I
8 I 261 41 311 111 I 721 N RESP I 36.11 5.61 43.11 15.3I 1 100.01 OF CYCLE I------------ I------------ I ------------ I ------------ I ------------ I ------------ I
SUMI 1611 41I 1431 81I 3I 4291 a RESP I 37.5I 9.61 33.3I 18.91 0.7I 100.0I 7- OF CYCLE I ------------ I ------------ I ------------ I ------------ I ------------ I ------------ I
STATISTICS BASED ON RAW FREQUENCY
CHI SQUARE = .203998 E 02 DEGREES OF FREEDOM = 21
CDNT COEF = .213772
W r4)
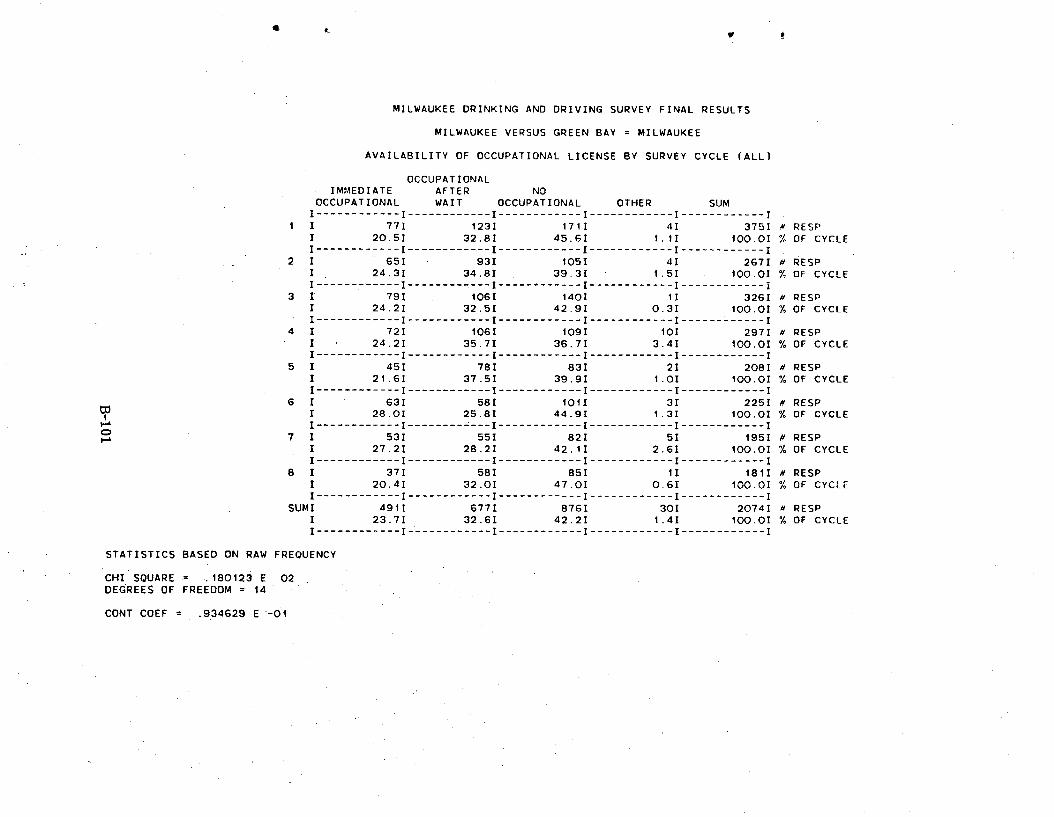
MILWAUKEE DRINKING AND DRIVING SURVEY FINAL RESULTS
MILWAUKEE VERSUS GREEN BAY = MILWAUKEE
AVAILABILITY OF OCCUPATIONAL LICENSE BY SURVEY CYCLE (ALL)
OCCUPATIONAL IMMEDIATE AFTER NO
OCCUPATIONAL WAIT OCCUPATIONAL OTHER SUM I------------ I ------------ I ------------ I ------------ I ------------ I
1 I 77I 123I 1711 4I 375I RESP 1 20.51 32.8I 45.61 1.1! 100.01 % OF CYCLE I ------------ I ----------I ------------ I ------------ I ------------ I
2 I 65I 93I 105I 41 2671 a RESP I 24.3I 34.8I 39.31 1.5I 100.01 % OF CYCLE I ------------ I ------------ I ------------ I ------------ I ------------ I
3 I 79I 106I 140I 11 3261 a RESP I 24.21 32.51 42.91 0.31 100.01 % OF CYCLE I ------------ I ------------ I ------------ I ------------ I -----------I
4 I 72I 106I 109I 101 2971 # RESP I 24.21 35.7I 36.7! 3.41 100.0I % OF CYCLE I------------ I ------------ I ------------ I ------------ I ------------ I
5 I 451 781 831 21 2081 a RESP I 21.61 37.5I 39.9I 1.01 100.0I % OF CYCLE I ------------ I ------------ I ------------ I ------------ I ------------ I
6 1 631 581 1011 3I 225I a RESP I 28.01 25.81 44.91 1.31 100.01 % OF CYCLE I ------------ I --------= ---I ------------ I ------------ I ------------ I
7 I 531 551 821 51 1951 a RESP I 27.21 28.21 42.1I 2.61 100.0I % OF CYCLE I ------------ I ------------ I ------------ I ------------ I ------------ I
8 I 371 581 851 11 1811 a RESP 1 20.41 32.01 47.01 0.61 100.01 % OF CYCLE I ------------ I ------------ I ------------ I ------------ I ------------ I
SUM! 4911 677I 876I 301 2074I a RESP I 23.71 32.61 42.21 1.41 100.01 % OF CYCLE I ------------ I ------------ I ------------ I ------------ I ------------ I
STATISTICS BASED ON RAW FREQUENCY
CHI SQUARE = .180123 E 02 DEGREES OF FREEDOM = 14
CONT COEF = .934629 E"-01
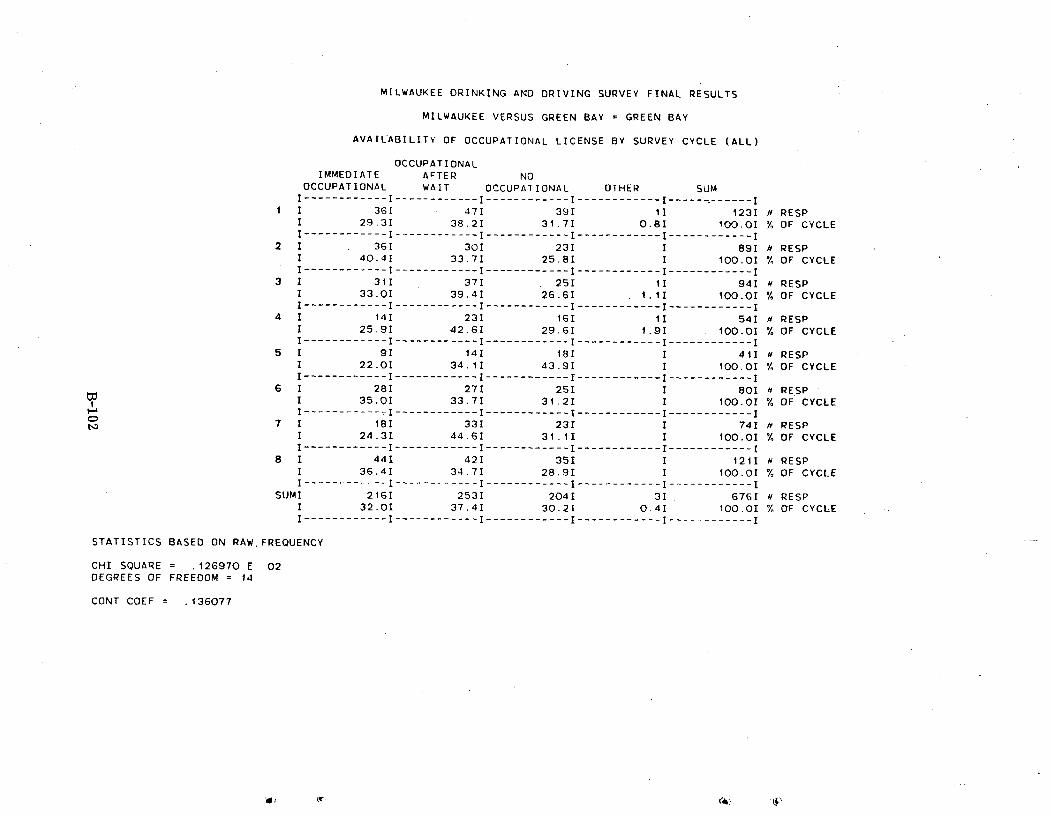
MILWAUKEE DRINKING AND DRIVING SURVEY FINAL RESULTS
MILWAUKEE VERSUS GREEN BAY = GREEN BAY
AVAILABILITY OF OCCUPATIONAL LICENSE BY SURVEY CYCLE (ALL)
OCCUPATIONAL IMMEDIATE AFTER NO
OCCUPATIONAL WAIT OCCUPATIONAL OTHER SUM I------------- I ------------ I ------------ I ------------ I ------.------ I
i I 361 471 391 1I 1231 a RESP I 29.31 38.21 31.71 0.81 100.01 % OF CYCLE I------------ I ------------ I ------------ I ------------ I ------------ I
2 I 361 301 231 I 891 a RESP 1 40.41 33.7I 25.81 1 100.0I % OF CYCLE I------------ I ------------ I ------------ I ------------ I ------------ I
3 1 311 371 251 ti 941 a RESP I 33.01 39.41 26.61 1.1I 100.01 % OF CYCLE I------------ I ------------ I ------------ I ------------ I ------------ I
4 1 141 231 16I II 541 a RESP 1 25.91 42.61 29.61 1.91 100.01 % OF CYCLE I ------------ I ------------ I ------------ I ------------ I ------------ I
5 1 91 141 181 1 411 s RESP 1 22.01 34.11 43.91 I 100.01 % OF CYCLE I ------------ I ------------ I ------------ I ------------ I ------------ I
6 I 281 271 251 I 801 a RESP I 35.01 33.71 31.21 I 100.01 % OF CYCLE I------------ I ------------ I ------------ I ------------ I ------------ I
7 I 181 331 23I I 741 # RESP I 24.31 44.61 31.11 I 100.01 % OF CYCLE I ------------ I ------------ I ------------ I ------------ I ------------ I
8 I 441 421 351 I 121I a RESP I 36.4I 34.71 28.91 I 100.01 % OF CYCLE I ------------ I ------------ I ------------ I ------------ I ------------ I
SUMI 216I 253I 2041 3I 676I a RESP I 32.01 37.41 30.21 0.41 100.01 % 1F CYCLE I ------------ I ------------ I ------------ I ------------ I ------------ I
, FREQUENCY STATISTICS BASED ON RAW
CHI SQUARE = .126970 E 02DEGREES OF FREEDOM = 14
CONT COEF = .136077
r 0 N
do (4)