Determining optimal clothing ensembles based on weather forecasts, with particular reference to...
31
1 DETERMINING OPTIMAL CLOTHING ENSEMBLES BASED ON WEATHER FORECASTS : WITH PARTICULAR REFERENCE TO OUTDOOR WINTER MILITARY ACTIVITIES Marco Morabito 1 , Daniela Z. Pavlinic 2 , Alfonso Crisci 3 , Valerio Capecchi 1 , Simone Orlandini 1 , Igor B. Mekjavic 4 1 Interdepartmental Centre of Bioclimatology, University of Florence, Florence, Italy 2 BIOMED d.o.o., Ljubljana, Slovenia 3 Institute of Biometeorology, National Research Council, Florence, Italy 4 Department of Automation, Biocybernetics and Robotics, Josef Stefan Institute, Ljubljana, Slovenia Corresponding author: Dr Marco Morabito, Piazzale delle Cascine 18, 50144, Firenze – Italy. (�) e-mail: [email protected] ; Tel: +39 055 5226041; Mobile: +39 348 0937319 Short title: Optimal clothing ensembles based on weather forecast Manuscript metrics: � word count for abstract: 248 � word count for main text: 5198 � number of references: 21 � number of tables: 3 � number of figures: 2 *Manuscript Click here to download Manuscript: Manuscript_revision1.doc Click here to view linked References
-
Upload
independent -
Category
Documents
-
view
0 -
download
0
Transcript of Determining optimal clothing ensembles based on weather forecasts, with particular reference to...

1
DETERMINING OPTIMAL CLOTHING ENSEMBLES BASED ON WEATHER
FORECASTS : WITH PARTICULAR REFERENCE TO OUTDOOR WINTER MILITARY
ACTIVITIES
Marco Morabito1, Daniela Z. Pavlinic2, Alfonso Crisci3, Valerio Capecchi1,
Simone Orlandini1, Igor B. Mekjavic4
1Interdepartmental Centre of Bioclimatology, University of Florence, Florence, Italy
2BIOMED d.o.o., Ljubljana, Slovenia
3Institute of Biometeorology, National Research Council, Florence, Italy
4Department of Automation, Biocybernetics and Robotics, Josef Stefan Institute, Ljubljana,
Slovenia
Corresponding author: Dr Marco Morabito, Piazzale delle Cascine 18, 50144, Firenze – Italy.
(�) e-mail: [email protected]; Tel: +39 055 5226041; Mobile: +39 348 0937319
Short title: Optimal clothing ensembles based on weather forecast
Manuscript metrics:
� word count for abstract: 248
� word count for main text: 5198
� number of references: 21
� number of tables: 3
� number of figures: 2
*ManuscriptClick here to download Manuscript: Manuscript_revision1.doc Click here to view linked References

2
Abstract
Military and civil defense personnel are often involved in complex activities in a variety of outdoor
environments. The choice of appropriate clothing ensembles represents an important strategy to
establish the success of a military mission. The main aim of this study was to compare the known
clothing insulation of the garment ensembles worn by soldiers during two winter outdoor field trials
(hike and guard duty) with the estimated optimal clothing thermal insulations recommended to
maintain thermoneutrality, assessed by using two different biometeorological procedures. The
overall aim was the applicability of such biometeorological procedures in a weather forecast
system, developing a comprehensive biometeorological tool for military operational forecast
purposes. Military trials were carried out during the winter 2006 in Pokljuka (Slovenia) by Slovene
Armed Forces personnel. Gastrointestinal temperature, heart rate and environmental parameters
were measured with portable data acquisition systems. The thermal characteristic of the clothing
ensembles worn by the soldiers, namely thermal resistance, was determined with a sweating thermal
manikin. Results showed that the clothing ensemble worn by militaries was appropriate during the
guard duty but, on the other hand, it was generally inappropriate during the hike. A general under-
estimation of the biometeorological forecast model in predicting the optimal clothing insulation
value was observed and a following post-processing calibration might further improve the goodness
of the forecast. This study represents the first step in the development of a comprehensive
personalized biometeorological forecast system to improve recommendations regarding the optimal
thermal insulation of military garment ensembles for winter activities.
Key words
Clothing insulation – Cold – Biometeorology – Forecast model

3
Introduction
Weather, particularly the thermal environment, represents an important factor which can
significantly influence physical and intellectual performance, especially when personnel are
suddenly exposed to stressful or extreme thermal conditions without any prior acclimatization or
adaptation (Stocks et al. 2004). Since clothing creates a barrier for heat exchange, accurate spatial
and temporal recommendations regarding appropriate military clothing ensembles for specific
thermal conditions and activities is essential for unhindered performance.
Biometeorology provides useful tools helpful to estimate the appropriate clothing insulation needed
for cold exposure. Holmér (1988) developed a heat exchange model based on the heat balance
equation named Required Clothing Insulation (IREQ) also published as an international test
standard (ISO 11079 1993). The IREQ integrate the effects of air temperature, mean radiant
temperature, humidity, air velocity and metabolic heat production to determine the insulation
required to maintain body thermal equilibrium under given conditions. In particular two different
IREQ levels were defined (Griefahn 2000): IREQmin defined as the the minimal insulation required
to maintain thermal equilibrium at a subnormal level (that is, the highest admissible body cooling
during work); IREQneutral defined as the insulation required to maintain thermal equilibrium at a
normal level (that is no or minimal cooling of the body). In a recent study (Morabito et al., 2008)
we suggested a biometeorological method based on the human energy balance that allows the
assessment of the optimal minimum outdoor clothing insulation value required to reach the thermal
neutrality (min_clo) starting from the main weather parameters and accounting for the activity level
and anthropometric characteristics. In this study it was also demonstrated an example of an
operational biometeorological procedure which derives 72-hour forecast maps estimating the
min_clo over Tuscany and all of Italy.
The implementation of such, or similar biometeorological information (such as the IREQ) in a
personalized forecast system may help to improve the level of recommendations regarding the
optimal thermal characteristics of clothing ensembles for specific activities and in particular for

4
winter military activities. As described in a previous study (Santee 2002), the armed forces have
specific needs that differ from those of the civilian population and sophisticated biometeorological
tools based on the human energy balance are required. Although most countries maintain an
advanced weather forecast service for the military, there is a lack of specific biometeorological
forecast, such as information regarding the optimal clothing ensemble suitable for soldiers involved
in any given outdoor environmental condition.
Soldiers involved in specific outdoor activities are often at high risk of either cold injury or heat
illness, if the insulation of their clothing ensemble is too low, or too high, respectively. Thus the
main aim of the present study was to compare the known clothing insulation of the garment
ensembles worn by soldiers during two military outdoor field trials (12 km hike and guard duty),
during winter in the Julian Alps, with the estimated (predicted) optimal clothing thermal insulation
recommended to maintain thermoneutrality assessed by using real weather field trials and forecast
data as input values for the calculation of two different biometeorological procedures: the Optimal
Clothing Insulation Range (OCIR) and the REQuired clothing Insulation (IREQneutral). A crosscheck
with physiological variables measured during trials, such as core temperature variation from onset
to completion of trials, and the variation in heart rate, was also carried out. This analysis was useful
to confirm that the clothing ensemble worn by soldiers was appropriate to maintain the monitored
physiological variables and in particular core temperature within safe and acceptable limits during
different winter activities.
The overall aim of the research programme was to verify the applicability of such
biometeorological procedures in a weather forecast system. This was achieved by the comparison of
the estimated optimal clothing thermal insulation values assessed by using weather forecast data
with those estimated by using weather field trial data. In this manner, this study illustrates the
procedure for developing a comprehensive biometeorological tool for military operational forecast
purposes.

5
Materials and methods
Subject characteristics and study design
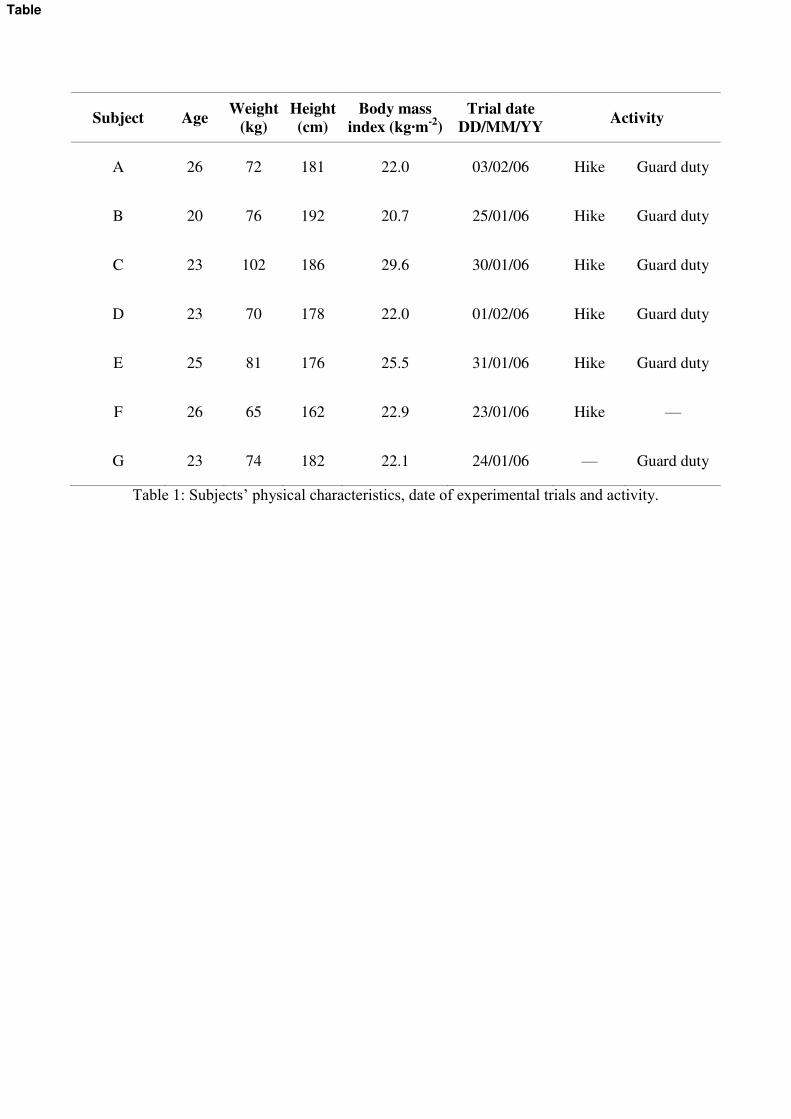
The study involved six male of the Slovene Armed Forces (SAF) personnel volunteered for each
field trial (Table 1).
In the first part of the study it was evaluated the functional properties of the Slovene Armed Forces
(SAF) winter clothing ensemble. Clothing ensembles were derived for guard duty and hikes, and the
appropriateness of these clothing ensembles was tested in a series of field trials. The thermal
insulation values of the individual components of each clothing ensemble were tested previously on
a thermal manikin.
In the second part of the study a biometeorological model used to estimate the optimal clothing
thermal insulation recommended to maintain thermoneutrality was provided with the geographical
location of the military trials, the exact date and time of the activities, the physical characteristics of
the volunteer soldiers participating in the study, and their heart rates, core temperatures and weather
conditions, directly measured during the field trials performed in the first part of the study. The
relationships between the clothing insulation of the garment ensembles worn by soldiers, obtained
by thermal manikin tests, and the biometeorological model output, in the form of the “estimated
optimal clothing thermal insulation ”, were investigated. Crosscheck analyses by using
physiological variables such as the core temperature variation from the onset to the completion of
the military trial, and the variation in heart rate, measured during field trials, were also carried out.
The biometeorological model was then implemented as a post-processing procedure in a weather
forecast system and its applicability was tested through the comparison between the estimated
optimal clothing thermal insulation values assessed by using weather forecast data and those
estimated by using weather data recorded with a portable meteorological stations during the field
trials.

6
Field trials
SAF personnel volunteered were requested to participate in two field trials, which were conducted
during the winter of 2006, from January 23 to February 3, in the mountain area surrounding the
Alpine military training facility in Pokljuka (Republic of Slovenia) (λ = 13°92' E; Φ = 46°34' N),
located at an altitude of 1360 m, in the eastern part of the Julian Alps, characterized by a temperate
alpine climate.
For a given subject, each trial was conducted on a specific day (Table 1). In one trial the subjects
were required to conduct a 12 km hike of 3-hour duration on a snow covered course through the
surrounding wooded terrain. In the other trial, subjects conducted a 3-hour guard duty. During these
trials, subjects wore a knapsack with a total weight of 20kg. The protocol of the study was approved
by the National Committee for Medical Ethics at the Ministry of Health of the Republic of
Slovenia.
During the 3-hour outdoor trials one minute recordings were made of gastrointestinal temperature
(VitalSense, Physiological Monitor, Mini Mitter Company, Inc., Bend, Oregon, USA) and heart rate
(Polar, Finland). Both these physiological parameters were used for crosscheck analyses, aiding the
interpretation of the results. Environmental conditions were assessed with a portable meteorological
station (Almemo, Ahlborg, Germany). The environmental parameters were measured with a
temporal format of 10 minutes and included air temperature (°C), relative humidity (%), wind
velocity (m·s-1) and global radiation (W·m-2).
The clothing thermal insulation worn by soldiers during the field trials
The garment ensembles worn by soldiers during winter in the two typologies of outdoor field trials
were standard issues for such environmental conditions in the Slovene Armed Forces. The thermal
insulation of the garment ensembles worn by soldiers during the two trials were determined with a
sweating thermal manikin: a) the guard duty ensemble (3.98 clo = 0.60 m2·°K/W) comprised
thermal undershirt and underpants from polyester, cotton shirt and pullover from wool/polyacril

7
blend, polyester fleece trousers, winter cotton trousers, cotton anorak with under layer from
polyester, upper trousers with Goretex membrane (polyamide upper fabric and functional layer of
two composite membranes on the base of PTFE and polyester under layer), anorak with Goretex
membrane; b) the hiking ensemble (2.95 clo = 0.38 m2·°K/W) comprised thermal undershirt and
underpants from polyester, cotton thin pullover and pullover from wool/polyacril blend, polyester
fleece trousers, winter cotton trousers, cotton anorak with under layer from polyester.
The estimated optimal clothing thermal insulation assessed by using measured field trial data
The estimated optimal clothing thermal insulation recommended to maintain thermoneutrality was
assessed using as input values those collected during the two military field trials: environmental
parameters (air temperature, relative humidity, air velocity and global radiation) and physical
characteristics of the subjects (age, gender, weight and height). In addition, it was necessary to
estimate another two fundamental input values that were not directly measured during military
trials: a) the mean radiant temperature (Tmrt), which represents the main weather parameter affecting
human energy balance; b) metabolic rate, which represents an important determinant of the comfort
or the strain resulting from exposure to a thermal environment. In this study, Tmrt was assessed by
using the method proposed by Jendritzky (1990).
For the assessment of metabolic rate, an algorithm for energy expenditure (Pandolf et al. 1977)
valid for standing or slowly walking that incorporates subject weight, carried load, walking speed,
gradient and terrain type, was adopted. This algorithm, validated by a number of other researchers,
is represented by the following expression: M = 1.5·W + 2.0·(W + L)·(L / W)2 + η·(W + L)·(1.5·V2
+ 0.35·VG), where M is the metabolic rate (watts); W is the subject nude body weight (kg); L is the
load carried, clothing and equipment (kg); V is the speed of walking (m·s-1); G is the gradient (%);
η is a factor which expresses the nature of terrain (η =1 for treadmill). In this study the load carried
was fixed at 25 kg (20 kg knapsack and 5 kg of clothing and shoes); the speed of walking and the
gradient were assessed by using the geographical coordinates recorded by portable sensors; the

8
terrain factor chosen for the compact snow found during the field trials was 1.3, that represents the
coefficient for “hard packed snow” (Pandolf et al. 1977).
To determine the estimated optimal clothing thermal insulation for the two trials, we computed the
neutral REQuired clothing Insulation (IREQneutral) and the associated neutral Intrinsic clothing
insulation (Iclneutral) as outlined by Holmér (1984) and ISO 11079 (1993), and the Optimal Clothing
Insulation Range (OCIR) index as described by Morabito et al. (2008).
The calculation of the IREQneutral index is based, like the OCIR index, on the energy balance
equation and is applied to continuous, intermittent and occasional exposures, either for indoor or
outdoor working conditions.
The assessment of the OCIR index is based on the same theoretical framework as that of the PMV
(Fanger 1967) by using an extension of the automatic biometeorological procedure already
described in another study to calculate the minimum clothing insulation value required to reach the
thermal neutrality (min_clo) (Morabito et al. 2008). This automatic biometeorological procedure
allowed the calculation of a personalized PMV starting from a prefixed clo value of 0.1 defined
“Start clo”. The procedure ran recursively with a progressively increasing clo value, with
increments of 0.1 clo, and it scanned all the PMV values identifying the min_clo and max_clo
values when the PMV thresholds of thermal neutrality (-0.5 < PMV < +0.5) were attained. The two
values of clo so assessed (min_clo and max_clo) represent the “optimal clothing insulation range
index”.
Both IREQneutral (Iclneutral) and OCIR (max_clo and min_clo) indices are expressed in m2·ºC/W or
“clo” where 1 clo = 0.155 m2·ºC/W.
The estimated optimal clothing thermal insulation assessed by using weather forecast data
The estimated optimal clothing thermal insulation was also assessed using as input values the
forecasted weather variables provided by the Weather Research and Forecasting - Nonhydrostatic
Mesoscale Model (Skamarock 2005) version 3.01 developed by the National Oceanic and

9
Atmospheric Administration and the National Centre for Environmental Prediction. This forecast
was customized taking into consideration the individual (age and gender) and anthropometric
(weight and height) characteristics of all soldiers involved in the study.
The regional meteorological layers for the area of interest, centered over Slovenia, were generated
by providing the model with data from the global National Centre for Environmental Prediction /
Global Forecasting System, with approximately 50 km of horizontal resolution, by using the 00
UTC (Coordinated Universal Time) analysis, which is updated every 6 hours with forecast data (not
analysis).
Air temperature (Ta, °C), relative humidity (RH, %) 2 meters above the ground, wind speed (v, m·s-
1) 10 meters above the ground, long-wave and short-wave radiation (LWR and SWR, W·m-2) and
direct solar radiation (W·m-2) were forecasted at an hourly temporal resolution for the selected grid
point corresponding to the study area during the winter 2006 (from January 23 to February 3).
All weather variables, the Tmrt assessed by using the method proposed by Jendritsky (1990) and the
metabolic rate assessed by using the algorithm developed by Pandolf et al. (1977) were provided by
the biometeorological forecast procedure during the testing days with a temporal format of 10
minutes (weather data were constant over 1 hour and were replicated 6 times) to correspond to the
observed field measurements. These computations were made possible by the "MeteoSalute" library
developed by the research group. The library is written in ANSI C++ language taking into account
as input the gridded meteo layers and the provided biometeorological layers at the geographical
location of interest.
Statistical analyses
All statistical analyses were carried out using R statistical environment version 2.8.1 (R version
2.8.1 2008) and “Verification” package was used (NCAR - Research Application Program 2010.
Verification: Forecast verification utilities. R package version 1.31 http://cran.r-
project.org/web/packages/verification/index.html). Descriptive analyses of measured weather
10
variables (Ta, RH, v) and the estimated Tmrt and metabolic rate for each soldier, during the 12 km
hike and guard duty, were conducted. For the purpose attaining the main aim of the study, the
deviation of the estimated optimal clothing thermal insulation assessed by using measured field trial
data from the thermal insulation of the garment ensembles worn by the subjects (2.95 clo for the
hike ensemble and 3.98 for the guard duty ensemble), was assessed and presented graphically. In
addition, the core temperature variation from the onset of the trial and upon completion of both
trials was tested by the student’s t- test and the individual average heart rate during each trial was
also calculated.
To achieve the overall aim of the study, linear correlation analyses between the estimated OCIR
values assessed by using measured field trial data and weather forecast data were carried out for
each trial. In this way the temporal agreement of the individual biometeorological predictions was
tested. For each trial, the estimated OCIR index values were compared at 10 min intervals, whereby
each 10 minute value represent a 10 minute average (the trial duration was of 180 minutes). A
verification analysis of the biometeorological forecast biases was shown by using the Mean Error
(ME) and the Mean Square Error (MSE). These indices represent the current operator to measure
the reliability of quantitative forecast in meteorology. ME is also called the “additive bias” because
it represented by the arithmetical mean of the sum of the differences between forecasts (the
estimated OCIR values assessed by using weather forecast data) and observations (the estimated
OCIR values assessed by using measured field trial data). Theoretically it might range from minus
infinity to infinity and a perfect score is represented by ME equal to 0, but it is not a measure of
correspondence between forecasts and observations. For this reason, the correct interpretation of
ME is very important because it is also possible to get a perfect score for an accurate forecast if
there are compensating errors. MSE is helpful to evaluate the goodness of the forecast skill. MSE
represents the mean squared difference between forecasts and observations and provides a measure
of the degree of correspondence. MSE ranged from 0 to infinity. MSE equal to 0 meaning that the
forecasts predict observations with perfect accuracy.

11
Results
Descriptive analyses
Weather
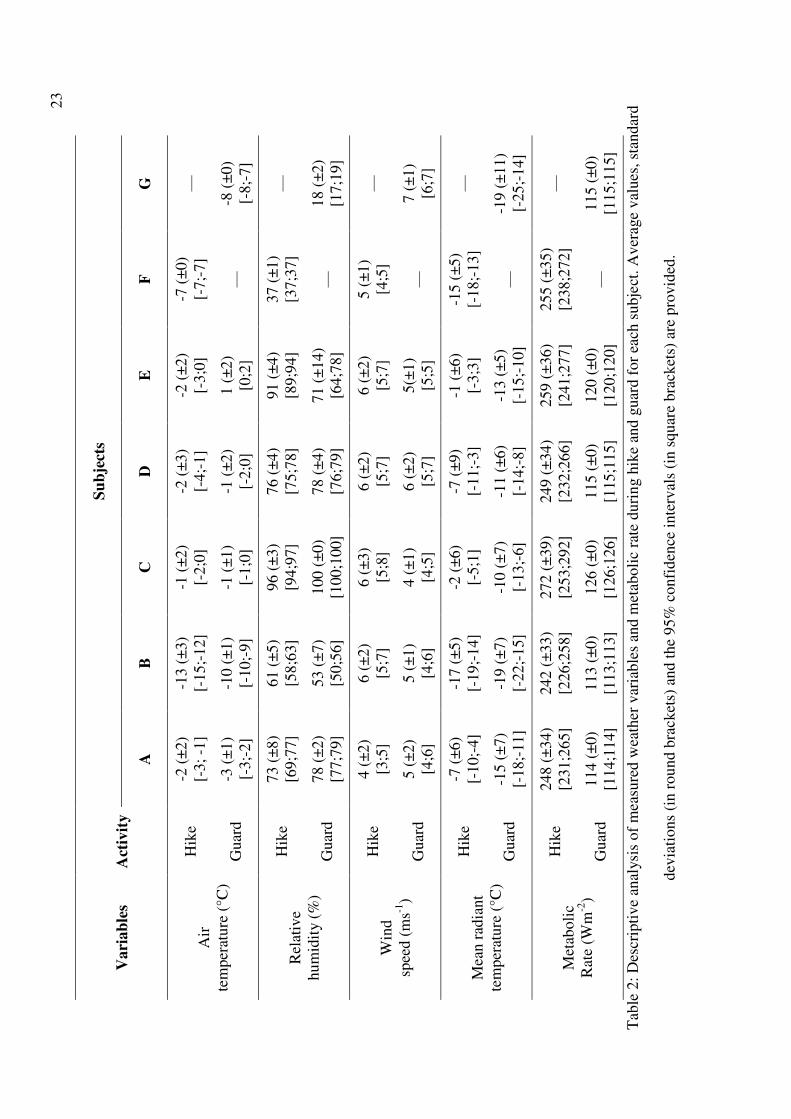
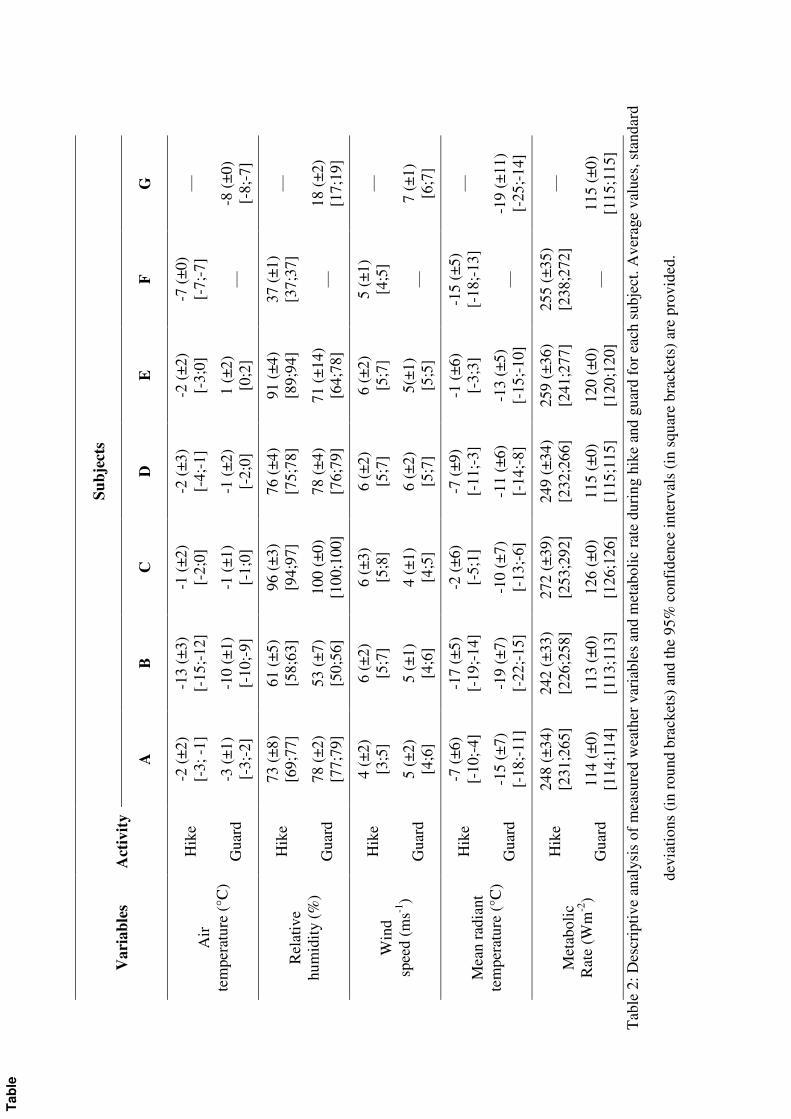
Descriptive analyses of measured weather variables (Table 2) showed negative values for both
average air temperature and mean radiant temperature for all trials, with the only exception being
the guard duty trial performed by subject E.
The lowest values (≤ -10 °C) were observed during both the 12 km hike and guard for subject B,
followed by subjects F and G. For most trials the relative humidity during both outdoor military
activities was moderate-to-high (>50%), with values reaching 100% observed for subject C. In
contrast, low values were observed during the hike for subject F and during guard for subject G.
Wind speed exhibited the lowest variability among all subjects, when compared with the other
weather variables. The average wind observed for each trial can be empirically classified as being a
gentle or moderate breeze according to the Beaufort scale (leaves and smaller twigs in constant
motion, with dust and loose paper raised and small branches beginning to move).
Activity level & clothing
According to the activity classification as defined by ISO 8996 (2004), most of subjects had an
average value of metabolic rate ranging from 200 to 260 W·m-2 (Table 2) during the 12 km hike,
which would be classified as a “high” metabolic rate, with the only exception being subject C who
demonstrated a “very high” average value of metabolic rate (over 260 W·m-2). On the other hand,
during the guard duty, the average values of metabolic rate always ranged from 70 to 130 W·m-2
(Table 2) and for this reason are classified as “low” metabolic rate.
All subjects completed both the hike and guard duty without any problems and the clothing was
never removed during both trials. In some of the cases during the hike, fasteners were open and
gloves removed, but the remainder of the clothing remained on.
12
Core temperature
During the guard duty there was no difference in the core temperature before (37.3 + 0.3 °C) and
after the 3 hour guard duty (37.2 + 0.4 °C), whereas during the hike core temperature increased
significantly from 37.2 + 0.2 at onset of the hike to 38.2 + 0.4 °C upon completion of the hike.
Relationship between the thermal insulation of the garment ensembles worn by the subjects and the
estimated optimal clothing thermal insulation (biometeorological models) assessed by using
measured field trial data
The 12 km hike
The thermal insulation of the garment ensembles worn by subjects during the 12 km hike (Fig. 1A)
was, for most subjects, higher than that estimated by the OCIR (max_clo and min_clo) and
IREQneutral (Iclneutral) indices, with the only exception being subject B. In particular, in all subjects
(with the exception of subject B), the estimated max_clo was on average 0.8 clo (±0.4) lower than
the thermal insulation worn by subjects and the differences increased when the min_clo and the
Iclneutral were considered (1.5 ±0.2 clo and 1.6 ±0.1 clo for the estimated min_clo and Iclneutral
respectively). The exception was subject B, who also showed significantly (p<0.01) higher
estimated OCIR and Iclneutral values than those estimated for the other subjects. Subject B completed
the 12 km hike with the lowest average air temperature (Table 2) and only in this case the thermal
insulation worn by the soldiers ranged between the estimated OCIR values: the thermal insulation
worn by subjects was on average 0.5 clo lower than the estimated max_clo and 0.7 clo higher than
the estimated min_clo. Moreover subject B showed the lowest increase in core temperature from the
onset to the completion of the 3-hour 12 km hike and the lowest average and variation of heart rate
(Fig. 1B).
In all other subjects, larger increases in core temperatures from the onset to the completion of the
military trial were observed (Fig. 1B). The highest increases in core temperature was observed for
subject C (Fig. 1B), which also showed the highest average heart rate during the 12 km hike.
13
The guard duty
A different situation was observed for the guard duty as opposed to the 12 km hike. In this case the
thermal insulation of the garment ensembles worn by the subjects during the guard duty (Fig. 1C )
in all subjects ranged between the estimated OCIR values (max_clo and min_clo). In particular the
estimated max_clo values were in all cases higher than the thermal insulation worn by soldiers with
an average differences of 0.8 clo (±0.5 clo). The highest differences (1.5 clo for subject B and 1.2
clo for subject G) were observed when the guard duty was carried out with the lowest air
temperature and relative humidity values (Table 2). The lowest differences (0.2 clo for subject C
and E) were observed in the opposite situation: subjects that experienced the highest air temperature
and relative humidity values during the guard duty (Table 2).
In contrast, the estimated min_clo was always lower than the thermal insulation worn by subjects
with an average difference of 1.0 clo (±0.5 clo) and a trend very similar to that observed for the
max_clo (Fig. 1C).
Concerning the estimated Iclneutral, the values for most subjects (4 subjects: subject A, C, D and E)
were close (±0.4 clo) to the values of thermal insulation worn by soldiers (Fig. 1C). As already seen
for the estimated max_clo, higher Iclneutral values than the thermal insulation worn by subjects
during trials were observed for subjects B and E, with an estimated increase of 1.4 clo and 1.1 clo
respectively.
Very little or no core temperature variation between the onset and the completion of the guard duty
were observed in all subjects (Fig. 1D). The average heart rate and its variation were in all subjects
significantly lower than that observed for the 12 km hike (Fig. 1D).
Linear correlation analysis between the estimated optimal clothing thermal insulation assessed by
using measured field trial data and weather forecast data
Highly significant correlations (p<0.01) between the estimated OCIR values assessed by using
weather data directly measured during field trials and those calculated using as input values weather

14
data predicted by a weather forecast model, were observed (Fig. 2). The correlation was higher
during the guard duty (Fig. 2B), especially for the estimated max_clo, than during the 12 km hike
(Fig. 2A).
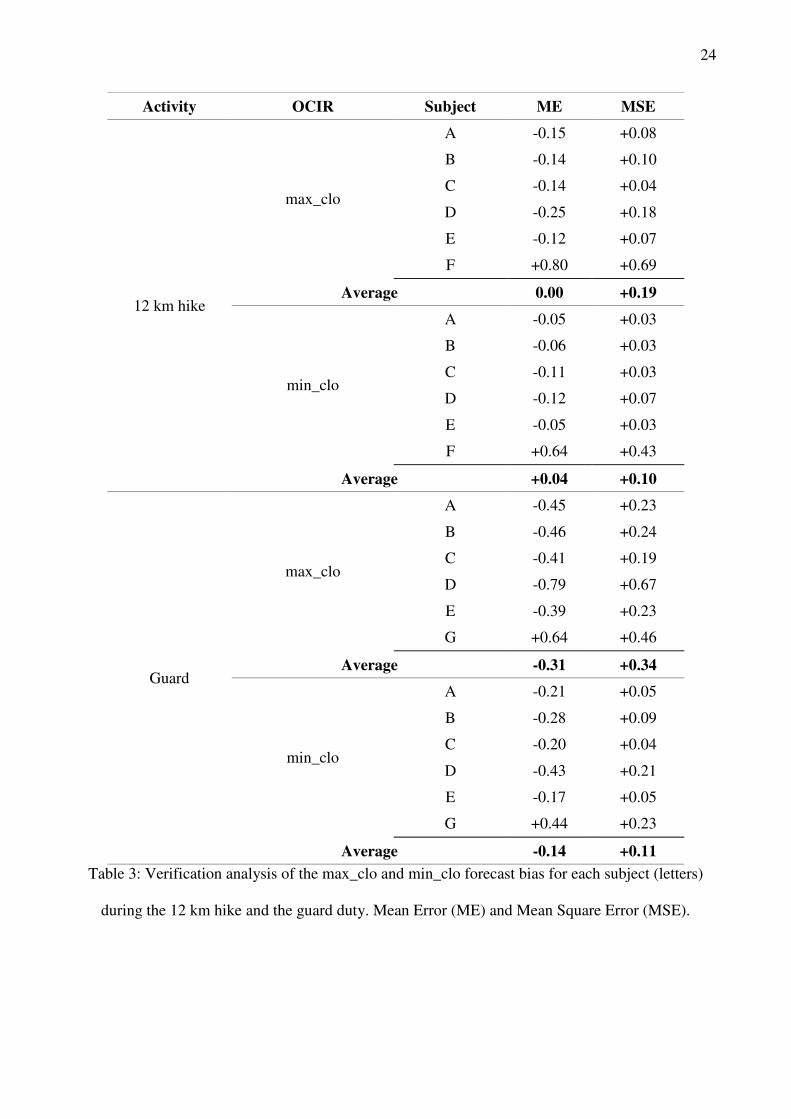
Statistical analysis for the test showed a general under-estimation of the biometeorological forecast
model in predicting the OCIR index values (Table 3) for both the hike and guard duty.
In particular, for most subjects the hike (Table 3) demonstrated a small OCIR under-estimation of
the forecast model with one exception. With the exception of subject F, the average ME was -0.16
clo and -0.08 clo for max_clo and min_clo respectively. Subject F was the only one for which an
over-estimation of the forecast model was observed for both max_clo and min_clo (Table 3). For all
subjects the magnitude of errors (MSE) taking into consideration both max_clo and min_clo, was
about 0.15 clo during the hike.
A greater general under-estimation during the guard duty than during the hike was observed (Table
3). Even in this case there was just one subject (subject G) which showed an opposite response.
Without subject G, the average ME was -0.50 clo and -0.26 clo for max_clo and min_clo,
respectively. Taking into consideration both max_clo and min_clo, the average magnitude of errors
was greater in the guard duty (0.22 clo) than in the hike trial.

15
Discussion
This study clearly show the possibility to predict the appropriate clothing insulation needed for
outdoor cold exposure by using both field trails and weather forecast data. This biometeorological
advice takes on strategic importance specifically for soldiers during outdoor military mission and
generally for all people involved in outdoor working activity with prolonged exposure to
changeable cold conditions.
This study confirms that the clothing ensemble worn by soldiers during the worst case scenario in
winter, namely no activity in outdoor environment (guard duty), was generally appropriate. Core
temperature was stable during the guard duty, confirming that the clothing insulation used by the
SAF for such conditions, and estimated by biometeorological models, was appropriate to maintain a
stable core temperature, within safe and acceptable limits.
In contrast, the thermal insulation of the garment ensemble worn by soldiers during the hike was, in
most cases, higher than those estimated by the biometeorological models and for this reason it
might be considered inappropriate for such activity in these environmental conditions. This
statement is also confirmed by the exercise-induced increase in core temperature during the hike,
which was on average 1.0 °C. During such activity, there will always be an elevation in core
temperature; the insulation of the clothing layers worn by the subjects will only potentiate the
increase in core temperature. The highest increase in core temperature during the hike (1.3 °C) was
observed in subject C. This subject was the soldier with the greatest body mass index (29.6 kg·m-2)
(Table 2) and according to the WHO BMI classification (WHO 1995), categorized as “overweight”,
at the border line with the “Obese Class I” category. Moreover, subject C also experienced the
highest air temperatures (approximately 0 °C) and relative humidity values (on average over 95%)
during the hike (Table 2). All these individual and environmental characteristics were also
favourable to determine the highest metabolic rate in subject C.
An example of a hike trial, during which the subject (subject B) demonstrated the lowest core
temperature variation (0.4 °C) and the estimation of the optimal clothing insulation enclosed the
16
thermal insulation worn by the subject, concerned a trial carried out at very low air temperatures
(average -13 °C).
This study demonstrates how the biometeorological model can provide a specific “optimal clothing
insulation range”, identifying the lower and upper boundaries of clothing thermal insulation
necessary to maintain thermoneutrality during specific outdoor military field trials. Thus, during the
guard duty, where maximum heat retention is the goal, it is the clo_max value which is critical for
maintaining thermoneutrality. During the hike, heat retention is important during the rest breaks, but
it is the clo_min value which is important during the hike, as it should maximize the heat loss.
Therefore, for a given outdoor activity, the anticipated minimum and maximum activities should be
anticipated in the determination of the minimum and maximum clothing insulation values. Clothing
ensembles should also allow soldiers to adjust the number of clothing layers, and the ventilation of
the clothing environment depending on their activity.
Furthermore, the present study demonstrates that the developed operative biometeorological
forecast system, allows the determination of optimal clothing thermal insulation values for a variety
of activities in cold environments based on the weather forecast, which currently allows accurate
forecasting up to 72 hours. This could provide essential information in the planning of missions,
significantly contributing to the prevention of cold weather injuries.
This is especially true when soldiers are suddenly deployed in geographical areas where they are
exposed to very low thermal conditions and to a wide intra- or inter-daily thermal variability,
without any acclimatization. In such situations, thermal strain management can be impaired and
may compromise the soldiers health, and the goals of the mission. Soldiers dressed with too light or
heavy clothing during specific outdoor activities could be at higher risk of cold injuries or heat
illness, respectively. In particular, cold weather injuries are of great importance for soldiers because
of their wide-ranging impact on military readiness. In a large epidemiological study (DeGroot et al.
2003) the authors showed that most cold weather injuries (about 80%) were on-duty training and for
this reason preventable. Besides the improvement of individual soldier equipment, cold weather
17
injuries were a serious problem even during modern warfare, such as the Falklands war and
especially the recent war in Afghanistan, where about 20% of Soviet troops suffered cold weather
injuries (DeGroot et al. 2003). In addition, data from soldiers stationed in Germany indicates that a
majority of injuries occurred operationally during field training (Taylor 1992), mainly due to
prolonged climatic exposure combined with physical exhaustion and multiple stressors (Castellani
et al. 2001).
This experimental study represents the first step in the development of a comprehensive
personalized biometeorological forecast system, able to manage information provided by
physiological models and to improve the level of recommendations regarding the optimal thermal
characteristics of clothing ensembles for specific military activities in cold environments.
The temporal fit between the estimated optimal clothing thermal insulation assessed by using
measured field trial data and weather forecast data, attained a good agreement during both guard
and hike. Nevertheless, a general under-estimation of the biometeorological model was observed
and a following post-processing calibration might further improve the goodness of the predictions.
The reason of this under-estimation is due because a forecast biometeorological model uses as input
variables several meteorological parameters predicted by a weather forecast model. The main aim
of a weather forecast model is to predict the meteorological dynamics along the atmospheric profile
and a decrease of accuracy especially occurs when meteorological parameters are forecasted at
ground surface layer. This is caused by the complex interaction between the atmosphere and land
surfaces. Ground meteorological parameters are the environmental variables used as input variables
for the biometeorological model. In addition when low weather forecast model resolution is used
for ordinary operative purposes a further reduction in the meteorological forecast accuracy occurs.
Improvements and Conclusion
Further studies should focus on improving the assessment of the Optimal Clothing Insulation Range
index, even by integration with more sophisticated multi-node physiological models, i.e. the Wissler
18
model (Wissler 1985), or with the proposed Universal Thermal Climate Index (COST-730 UTCI,
http://www.utci.org/), a multi-node model which enables the calculation not only of the thermal
status of the whole body, but also local information for face and extremities (hands, feet) separately.
The UTCI will most likely become the international standard for outdoor comfort assessment,
accounting for both hot and cold, as well as short and long term outdoor exposure.
Furthermore, new algorithms for calculation of the dynamic heat transfer through multilayer
clothing, by correcting the insulation values for the effect of air movements and body motion
(walking speed), should be considered as proposed by other authors (Havenith et al. 2002).
In the present study, only the thermal insulation was considered, because it determines the
elementary function of garments (Li and Wong 2006), but in future, other thermal proprieties, such
as thermal conductivity and diffusion, should also be taken into consideration.
With the aim of improving the performance of a reliable operative biometeorological forecast
system for predicting optimal clothing thermal insulation for outdoor military activities, further
experimental studies are needed. The replication of a similar study design, conducted in other
geographical areas, as well as increasing the sample of soldiers employed in different military
activities, could provide valuable information to be implemented in the development of the
biometeorological forecast system.
It would also be interesting to compare the predictive power of different weather forecast models
(ensemble approach) studying the prediction of clothing thermal insulation.
Finally, the prediction of optimal thermal clothing insulation in biometeorological forecasts may
become an important part of the planning of outdoor military activities, accounting for the great
complexity of the outdoor environment, in terms of variability, temporally and spatially, as well as
the great range of possible physical activities. It is envisaged that such forecasting capability
incorporating physiological responses will assist in the planning and supporting of winter military
activities, developing general guidelines for identifying optimal outdoor clothing ensembles for a
multiplicity of activities in cold environments.

19
Acknowledgments
This study was supported, in part, by Knowledge for Security and Peace grant administered by the
Ministries of Defence, and of Science of the Republic of Slovenia and by the MeteoSalute Project,
Regional Health System of Tuscany, Italy. The authors wish to thank Dr R. Cioffi, Psychometrist,
of the Customer Satisfaction Center (University of Siena) for his precious support in the analyses.
20
References
1. Castellani JW, Young AJ, DeGroot DW, Stulz DA, Cadarette BS, Rhind SG, Zamecnik J,
Shek PN, Sawka MN (2001) Thermoregulation during cold exposure after several days of
exhaustive exercise. J Appl Physiol 90:939-946.
2. DeGroot DW, Castellani JW, Williams JO, Amoroso J (2003) Epidemiology of U.S. army
cold weather injuries, 1980-1999. Aviat Space Environ Med 74:564-570.
3. Fanger PO (1967) Calculation of thermal Comfort - Introduction of a basic comfort
equation. ASHRAE Transactions 73-II.
4. Gagge AP, Burton AC, Bazett HC (1941) A practical system of units for the description of
heat exchange of man with his environment. Science 94:428-430.
5. Griefahn B (2000) Limits of and possibilities to improve the IREQ cold stress model
(ISO/TR 11079). A validation study in the field. Applied Ergonomics 31:423-431
6. Havenith, G, Holmer, I, Parsons, K (2002) Personal factors in thermal comfort assessment:
clothing properties and metabolic heat production. Energy and Buildings 34:581-591.
7. Holmér I (1984) Required clothing insulation (IREQ) as an analytical index of cold stress.
ASHRAE Trans 90:1116-1128.
8. ISO 11079 (1993) Evaluation of cold environments: Determination of required clothing
insulation. International Organization for Standardization, Geneva, Switzerland.
9. ISO 8996 (2004) Ergonomics of the thermal environment - Determination of metabolic rate.
International Organization for Standardization, Geneva, Switzerland.
10. ISO 15831 (2004) Clothing - Physiological effects - Measurement of thermal insulation by
means of a thermal manikin. International Organization for Standardization, Geneva,
Switzerland.
11. Jendritzky G (1990) Bioklimatische Bewertungsgrundlage der Räume am Beispiel von
mesoskaligen Bioklimakarten. Akad f Räumforsch u Landesplanung 114:7-69.
21
12. Li Y, Wong ASW (2006) Introduction to clothing biosensory engineering. Woodheaed
Publishing Limited, Cambridge England.
13. Morabito M, Crisci A, Cecchi L, Modesti PA, Maracchi G, Gensini GF, Orlandini S (2008)
A biometeorological procedure for weather forecast to assess the optimal outdoor clothing
insulation. Eur J Appl Physiol 104:221-228.
14. Pandolf KB, Givoni B, Goldman RF (1977) Predicting energy expenditure with loads while
standing or walking very slowly. J Appl Physiol 43:577-581.
15. R version 2.8.1. (2008) The R Foundation for Statistical Computing. ISBN 3-900051-07-0.
16. Santee WR (2002) Windchill index and military applications. Aviat Space Environ Med
73:699-702.
17. Skamarock WC, Klemp JB, Dudhia J, Gill DO, Barker DM, Wang W, Powers JG (2005) A
Description of the Advanced Research WRF. Version 2. NCAR technical note, NCAR/TN-
468+STR.
18. Stocks JM, Taylor NA, Tipton MJ, Greenleaf JE (2004) Human physiological responses to
cold exposure. Aviat Space Environ Med 75:444-457.
19. Taylor M (1992) Cold weather injuries during peacetime military training. Mil Med
157:602-604.
20. WHO (1995) Physical status: the use and interpretation of anthropometry. Report of a WHO
Expert Committee. WHO Technical Report Series 854. Geneva: World Health Organization.
21. Wissler EH (1985) Mathematical simulation of human thermal behaviour using whole body
models. In: Shitzer A and Eberhart RC (ed) Heat transfer in medicine and biology -analysis
and applications, Plenum Press, New York and London pp 325-373.

22
Tables
Subject Age Weight
(kg) Height (cm)
Body mass index (kg·m-2)
Trial date DD/MM/YY
Activity
A 26 72 181 22.0 03/02/06 Hike Guard duty
B 20 76 192 20.7 25/01/06 Hike Guard duty
C 23 102 186 29.6 30/01/06 Hike Guard duty
D 23 70 178 22.0 01/02/06 Hike Guard duty
E 25 81 176 25.5 31/01/06 Hike Guard duty
F 26 65 162 22.9 23/01/06 Hike —
G 23 74 182 22.1 24/01/06 — Guard duty
Table 1: Subjects’ physical characteristics, date of experimental trials and activity.
23
Var
iab
les
Act
ivit
y
Su
bje
cts
A
B
C
D
E
F
G
Air
te
mpe
ratu
re (
°C)
Hik
e -2
(±
2)
[-3;
-1]
-1
3 (±
3)
[-15;
-12]
-1
(±
2)
[-2;
0]
-2 (
±3)
[-
4;-1
] -2
(±
2)
[-3;
0]
-7 (
±0)
[-
7;-7
] —
Gua
rd
-3 (
±1)
[-
3;-2
] -1
0 (±
1)
[-10
;-9]
-1
(±
1)
[-1;
0]
-1 (
±2)
[-
2;0]
1
(±2)
[0
;2]
—
-8 (
±0)
[-
8;-7
]
Rel
ativ
e hu
mid
ity
(%)
Hik
e 73
(±
8)
[69;
77]
61
(±
5)
[58;
63]
96 (
±3)
[9
4;97
] 76
(±
4)
[75;
78]
91 (
±4)
[8
9;94
] 37
(±
1)
[37;
37]
—
Gua
rd
78 (
±2)
[7
7;79
] 53
(±
7)
[50;
56]
100
(±0)
[1
00;1
00]
78 (
±4)
[7
6;79
] 71
(±
14)
[64;
78]
—
18 (
±2)
[1
7;19
]
Win
d
spee
d (m
s-1)
Hik
e 4
(±2)
[3
;5]
6 (±
2)
[5;7
] 6
(±3)
[5
;8]
6 (±
2)
[5;7
] 6
(±
2)
[5;7
] 5
(±1)
[4
;5]
—
Gua
rd
5 (±
2)
[4;6
] 5
(±1)
[4
;6]
4 (±
1)
[4;5
] 6
(±2)
[5
;7]
5(±
1)
[5;5
] —
7
(±1)
[6
;7]
Mea
n r
adia
nt
tem
pera
ture
(°C
)
Hik
e -7
(±
6)
[-10
;-4]
-1
7 (±
5)
[-19;
-14]
-2
(±
6)
[-5;
1]
-7 (
±9)
[-
11;-
3]
-1 (
±6)
[-
3;3]
-1
5 (±
5)
[-18
;-13
] —
Gua
rd
-15
(±7)
[-
18;-
11]
-19
(±7)
[-
22;
-15]
-1
0 (±
7)
[-13
;-6]
-1
1 (±
6)
[-14
;-8]
-1
3 (±
5)
[-15
;-10
] —
-1
9 (±
11)
[-25
;-14
]
Met
abol
ic
Rat
e (W
m-2
)
Hik
e 24
8 (±
34)
[231
;265
] 24
2 (±
33)
[226
;258
] 27
2 (±
39)
[253
;292
] 24
9 (±
34)
[232
;266
] 25
9 (±
36)
[241
;277
] 25
5 (±
35)
[238
;272
] —
Gua
rd
114
(±0)
[1
14;1
14]
113
(±0)
[1
13;1
13]
126
(±0)
[1
26;1
26]
115
(±0)
[1
15;1
15]
120
(±0)
[1
20;1
20]
—
115
(±0)
[1
15;1
15]
Tab
le 2
: D
escr
ipti
ve
anal
ysis
of
mea
sure
d w
eath
er v
aria
bles
and
met
abol
ic r
ate
duri
ng
hike
and
gua
rd f
or e
ach
subj
ect.
Av
erag
e v
alue
s, s
tand
ard
devi
atio
ns (
in r
ound
bra
cket
s) a
nd t
he 9
5% c
onf
iden
ce i
nter
val
s (i
n sq
uar
e br
acke
ts)
are
prov
ided
.
24
Activity OCIR Subject ME MSE
12 km hike
max_clo
A -0.15 +0.08
B -0.14 +0.10
C -0.14 +0.04
D -0.25 +0.18
E -0.12 +0.07
F +0.80 +0.69
Average 0.00 +0.19
min_clo
A -0.05 +0.03
B -0.06 +0.03
C -0.11 +0.03
D -0.12 +0.07
E -0.05 +0.03
F +0.64 +0.43
Average +0.04 +0.10
Guard
max_clo
A -0.45 +0.23
B -0.46 +0.24
C -0.41 +0.19
D -0.79 +0.67
E -0.39 +0.23
G +0.64 +0.46
Average -0.31 +0.34
min_clo
A -0.21 +0.05
B -0.28 +0.09
C -0.20 +0.04
D -0.43 +0.21
E -0.17 +0.05
G +0.44 +0.23
Average -0.14 +0.11
Table 3: Verification analysis of the max_clo and min_clo forecast bias for each subject (letters)
during the 12 km hike and the guard duty. Mean Error (ME) and Mean Square Error (MSE).
25
Captions for figures
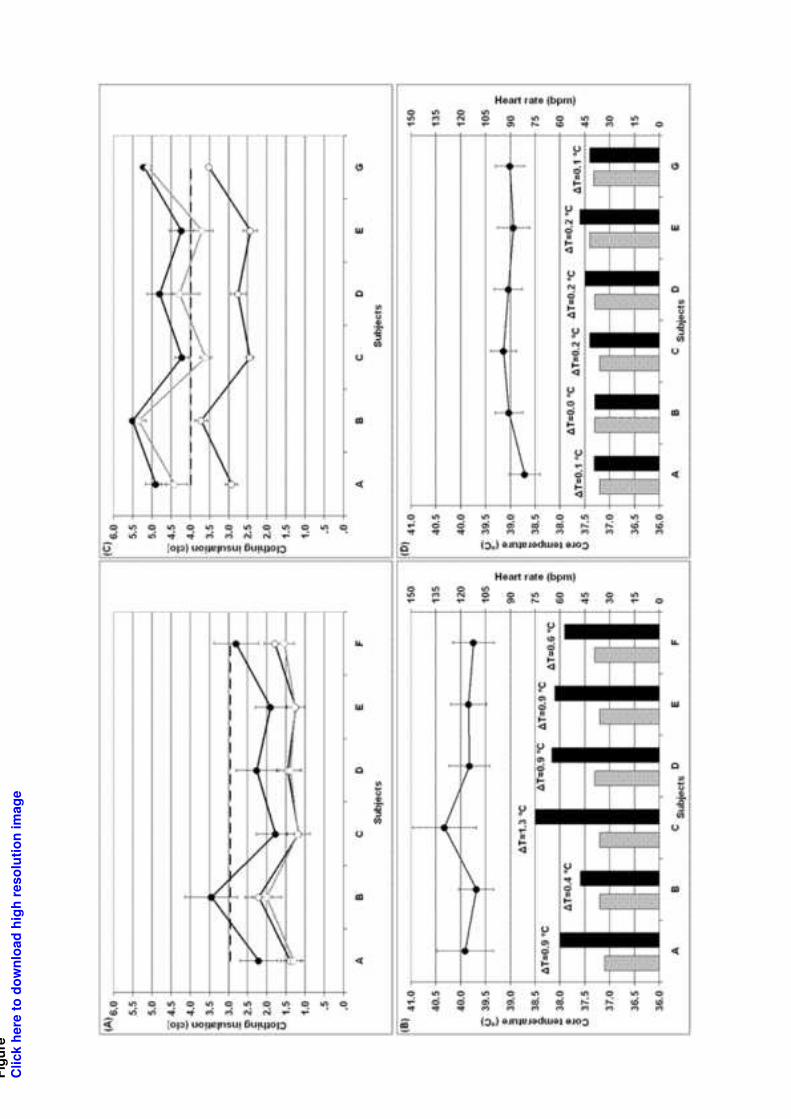
Figure 1:
Upper graphs: Relationship between the thermal insulation of the garment ensembles worn by the
subjects during the trials (graph A: 2.95 clo for 12 km hike; graph C: 3.98 clo for guard duty) and
the estimated optimal clothing thermal insulation assessed for each subject by using measured field
trial data as input values for the OCIR (max_clo and min_clo) and IREQneutral (Iclneutral) indices.
Dashed black line represents the thermal insulation of the garment ensemble worn by soldiers. Solid
black lines represent the estimated OCIR index values: closed circles max_clo; open circles
min_clo. Grey line represent the estimated Iclneutral values.
Lower graphs: Core temperature at onset (grey bars) and at conclusion (black bars) of the 3-hour 12
km hike (graph B) and guard duty (graph D) for each subject. ΔT represents the core temperature
difference between conclusion and onset field trials. The average heart rate and standard deviation
is also indicated for each subject.
Figure 2: Estimated OCIR index (max_clo and min_clo) values assessed by using weather forecast
data vs. estimated OCIR index values assessed by using measured field trail data. Graph (A) = 12
km hike; graph (B) = guard duty.
Editor-in-Chief,
International Journal of Biometeorology
Dr Scott C. Sheridan
Marco Morabito PhD
Interdepartmental Centre of Bioclimatology -
University of Florence, Piazzale delle Cascine 18,
50144, Florence, Italy [email protected]
May 19 2010
Dear Editor-in-Chief,
Please find enclosed the revised form of the paper entitled:
“DETERMINING OPTIMAL CLOTHING ENSEMBLES BASED ON WEATHER
FORECASTS : WITH PARTICULAR REFERENCE TO OUTDOOR WINTER MILITARY
ACTIVITIES”
The work is original, has not been published elsewhere, and is not currently under consideration by
another journal.
There is no financial or other relationship that might be perceived as leading to a conflict of interest.
The manuscript has been read and approved by all co-authors.
Authors do not have specific preference concerning the name or scientists that might reviewer this
paper.
Best regards
Marco Morabito
Electronic Supplementary Material
Fig
ure
Clic
k h
ere
to
do
wn
loa
d h
igh
reso
luti
on
im
ag
e

FigureClick here to download high resolution image
Subject Age Weight
(kg) Height (cm)
Body mass index (kg·m-2)
Trial date DD/MM/YY
Activity
A 26 72 181 22.0 03/02/06 Hike Guard duty
B 20 76 192 20.7 25/01/06 Hike Guard duty
C 23 102 186 29.6 30/01/06 Hike Guard duty
D 23 70 178 22.0 01/02/06 Hike Guard duty
E 25 81 176 25.5 31/01/06 Hike Guard duty
F 26 65 162 22.9 23/01/06 Hike —
G 23 74 182 22.1 24/01/06 — Guard duty
Table 1: Subjects’ physical characteristics, date of experimental trials and activity.
Table
Var
iab
les
Act
ivit
y
Su
bje
cts
A
B
C
D
E
F
G
Air
te
mpe
ratu
re (
°C)
Hik
e -2
(±
2)
[-3;
-1]
-1
3 (±
3)
[-15;
-12]
-1
(±
2)
[-2;
0]
-2 (
±3)
[-
4;-1
] -2
(±
2)
[-3;
0]
-7 (
±0)
[-
7;-7
] —
Gua
rd
-3 (
±1)
[-
3;-2
] -1
0 (±
1)
[-10
;-9]
-1
(±
1)
[-1;
0]
-1 (
±2)
[-
2;0]
1
(±2
) [0
;2]
—
-8 (
±0)
[-
8;-7
]
Rel
ativ
e hu
mid
ity
(%)
Hik
e 73
(±
8)
[69;
77]
61
(±
5)
[58;
63]
96 (
±3)
[9
4;97
] 76
(±
4)
[75;
78]
91 (
±4)
[8
9;94
] 37
(±
1)
[37;
37]
—
Gua
rd
78 (
±2)
[7
7;79
] 53
(±
7)
[50;
56]
100
(±0)
[1
00;1
00]
78 (
±4)
[7
6;79
] 71
(±
14)
[64;
78]
—
18 (
±2)
[1
7;19
]
Win
d
spee
d (m
s-1)
Hik
e 4
(±2)
[3
;5]
6 (±
2)
[5;7
] 6
(±3)
[5
;8]
6 (±
2)
[5;7
] 6
(±2)
[5
;7]
5 (±
1)
[4;5
] —
Gua
rd
5 (±
2)
[4;6
] 5
(±1)
[4
;6]
4 (±
1)
[4;5
] 6
(±2)
[5
;7]
5(±
1)
[5;5
] —
7
(±1)
[6
;7]
Mea
n r
adia
nt
tem
pera
ture
(°C
)
Hik
e -7
(±
6)
[-10
;-4]
-1
7 (±
5)
[-19;
-14]
-2
(±
6)
[-5;
1]
-7 (
±9)
[-
11;-
3]
-1 (
±6)
[-
3;3]
-1
5 (±
5)
[-18
;-13
] —
Gua
rd
-15
(±7)
[-
18;-
11]
-19
(±7)
[-
22;
-15]
-1
0 (±
7)
[-13
;-6]
-1
1 (±
6)
[-14
;-8]
-1
3 (±
5)
[-15
;-10
] —
-1
9 (±
11)
[-25
;-14
]
Met
abol
ic
Rat
e (W
m-2
)
Hik
e 24
8 (±
34)
[231
;265
] 24
2 (±
33)
[226
;258
] 27
2 (±
39)
[253
;292
] 24
9 (±
34)
[232
;266
] 25
9 (±
36)
[241
;277
] 25
5 (±
35)
[238
;272
] —
Gua
rd
114
(±0)
[1
14;1
14]
113
(±0)
[1
13;1
13]
126
(±0)
[1
26;1
26]
115
(±0)
[1
15;1
15]
120
(±0)
[1
20;1
20]
—
115
(±0)
[1
15;1
15]
Tab
le 2
: D
escr
ipti
ve
anal
ysis
of
mea
sure
d w
eath
er v
aria
bles
and
met
abol
ic r
ate
duri
ng
hike
and
gua
rd f
or e
ach
subj
ect.
Av
erag
e v
alue
s, s
tand
ard
devi
atio
ns (
in r
ound
bra
cket
s) a
nd t
he 9
5% c
onf
iden
ce i
nter
val
s (i
n sq
uar
e br
acke
ts)
are
prov
ided
.
Ta
ble

Activity OCIR Subject ME MSE
12 km hike
max_clo
A -0.15 +0.08
B -0.14 +0.10
C -0.14 +0.04
D -0.25 +0.18
E -0.12 +0.07
F +0.80 +0.69
Average 0.00 +0.19
min_clo
A -0.05 +0.03
B -0.06 +0.03
C -0.11 +0.03
D -0.12 +0.07
E -0.05 +0.03
F +0.64 +0.43
Average +0.04 +0.10
Guard
max_clo
A -0.45 +0.23
B -0.46 +0.24
C -0.41 +0.19
D -0.79 +0.67
E -0.39 +0.23
G +0.64 +0.46
Average -0.31 +0.34
min_clo
A -0.21 +0.05
B -0.28 +0.09
C -0.20 +0.04
D -0.43 +0.21
E -0.17 +0.05
G +0.44 +0.23
Average -0.14 +0.11
Table 3: Verification analysis of the max_clo and min_clo forecast bias for each subject (letters)
during the 12 km hike and the guard duty. Mean Error (ME) and Mean Square Error (MSE).
Table