DETERMINATION OF RESOURCE QUALITY OBJECTIVES IN ...
149
DETERMINATION OF RESOURCE QUALITY OBJECTIVES IN THE OLIFANTS WATER MANAGEMENT AREA (WMA4) WP10536 RESOURCE UNIT PRIORITISATION REPORT REPORT NUMBER: RDM/WMA04/00/CON/RQO/0213 OCTOBER 2014 FINAL
-
Upload
khangminh22 -
Category
Documents
-
view
0 -
download
0
Transcript of DETERMINATION OF RESOURCE QUALITY OBJECTIVES IN ...
DETERMINATION OF RESOURCE QUALITY
OBJECTIVES IN THE OLIFANTS WATER
MANAGEMENT AREA (WMA4)
WP10536
RESOURCE UNIT PRIORITISATION REPORT
REPORT NUMBER: RDM/WMA04/00/CON/RQO/0213
OCTOBER 2014
FINAL
Determination of Resource Quality Objectives in the Olifants Water Management Area (WMA4) - WP10536
Resource Unit Prioritisation Report
ii
Published by
Department of Water and Sanitation
Private Bag X313
Pretoria, 0001
Republic of South Africa
Tel: (012) 336 7500/ +27 12 336 7500
Fax: (012) 336 6731/ +27 12 336 6731
Copyright reserved
No part of this publication may be reproduced in any manner
without full acknowledgement of the source.
Department of Water and Sanitation (DWS). 2014. Determination of Resource Quality Objectives in the
Olifants Water Management Area (WMA4): RESOURCE UNIT PRIORITISATION REPORT. Report No.:
RDM/WMA04/00/CON/RQO/0213. Chief Directorate: Water Ecosystems. Study No.: WP10536. Prepared by
the Institute of Natural Resources (INR) NPC. INR Technical Report No.: INR 492/14.(iv). Pietermaritzburg,
South Africa.
Prepared by:
Institute of Natural Resources NPC PO Box 100396, Scottsville, 3209, South Africa
67 St Patricks Road, Scottsville, Pietermaritzburg, 3201
Determination of Resource Quality Objectives in the Olifants Water Management Area (WMA4) - WP10536
Resource Unit Prioritisation Report
iii
Title: Resource Unit Prioritisation Report
Authors: Dr. Chris Dickens, Dr. Gordon O’Brien, Dr. Nick Rivers-Moore, Mrs. Catherine Pringle,
Dr. Ranier Dennis, Ms. Retha Stassen, Mr. Doug Macfarlane, Mr. Regan Rose, Mr. Leo
Quale, Mrs. Melissa Wade, Ms. Pearl Mzobe, Ms. Pearl Gola, Mrs. S Oosthuizen, Dr.
Peter Wade.
Study Name: Determination of Resource Quality Objectives in the Olifants Water Management Area
(WMA4)
DWS Report No: RDM/WMA04/00/CON/RQO/0213
Status of Report: Final
First Issue: October 2013
Final Issue: October 2014
Professional Service Providers: Institute of Natural Resources NPC
Approved for the Professional Service Providers by:
……………………………………….. …………………………………
Dr Chris Dickens Date
Project Leader
DEPARTMENT OF WATER AND SANITATION (DWS)
Directorate: Water Resource Classification
Approved for DWS by:
………………………………………. …………………………………
Ms Ndileka Mohapi Date
Chief Director: Water Ecosystems
Determination of Resource Quality Objectives in the Olifants Water Management Area (WMA4) - WP10536
Resource Unit Prioritisation Report
iv
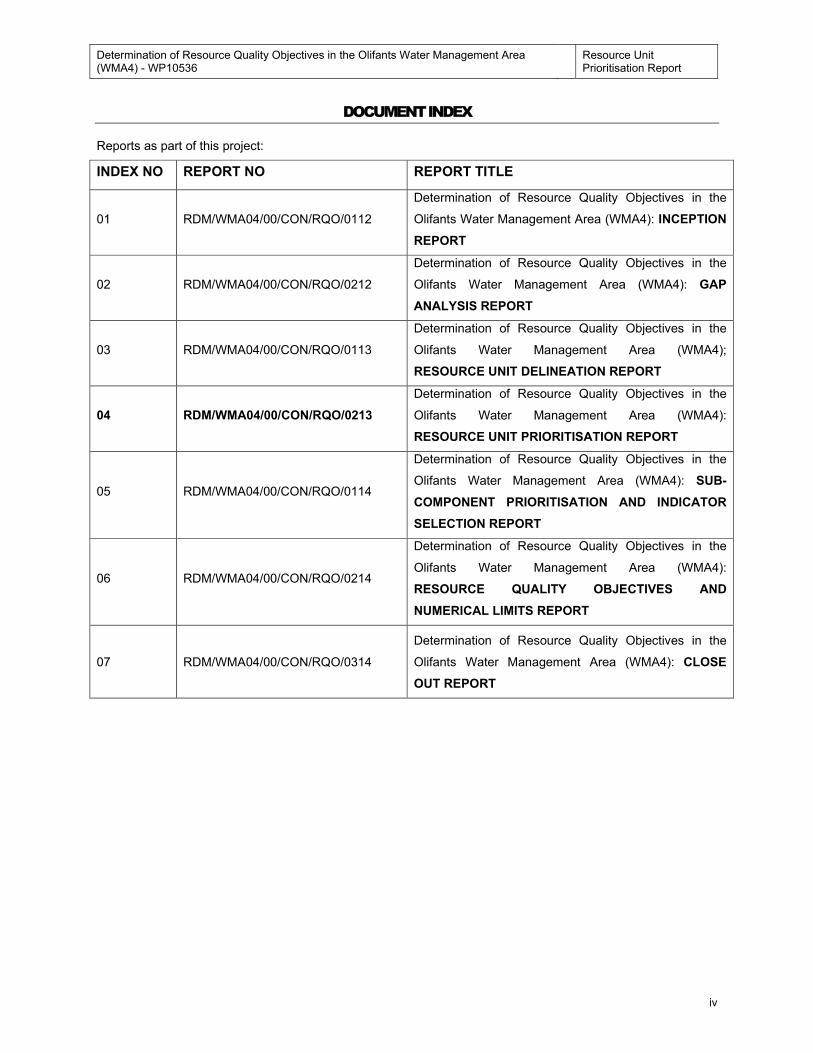
DOCUMENT INDEX
Reports as part of this project:
INDEX NO REPORT NO REPORT TITLE
01 RDM/WMA04/00/CON/RQO/0112
Determination of Resource Quality Objectives in the
Olifants Water Management Area (WMA4): INCEPTION
REPORT
02 RDM/WMA04/00/CON/RQO/0212
Determination of Resource Quality Objectives in the
Olifants Water Management Area (WMA4): GAP
ANALYSIS REPORT
03 RDM/WMA04/00/CON/RQO/0113
Determination of Resource Quality Objectives in the
Olifants Water Management Area (WMA4);
RESOURCE UNIT DELINEATION REPORT
04 RDM/WMA04/00/CON/RQO/0213
Determination of Resource Quality Objectives in the
Olifants Water Management Area (WMA4):
RESOURCE UNIT PRIORITISATION REPORT
05 RDM/WMA04/00/CON/RQO/0114
Determination of Resource Quality Objectives in the
Olifants Water Management Area (WMA4): SUB-
COMPONENT PRIORITISATION AND INDICATOR
SELECTION REPORT
06 RDM/WMA04/00/CON/RQO/0214
Determination of Resource Quality Objectives in the
Olifants Water Management Area (WMA4):
RESOURCE QUALITY OBJECTIVES AND
NUMERICAL LIMITS REPORT
07 RDM/WMA04/00/CON/RQO/0314
Determination of Resource Quality Objectives in the
Olifants Water Management Area (WMA4): CLOSE
OUT REPORT
Determination of Resource Quality Objectives in the Olifants Water Management Area (WMA4) - WP10536
Resource Unit Prioritisation Report
v
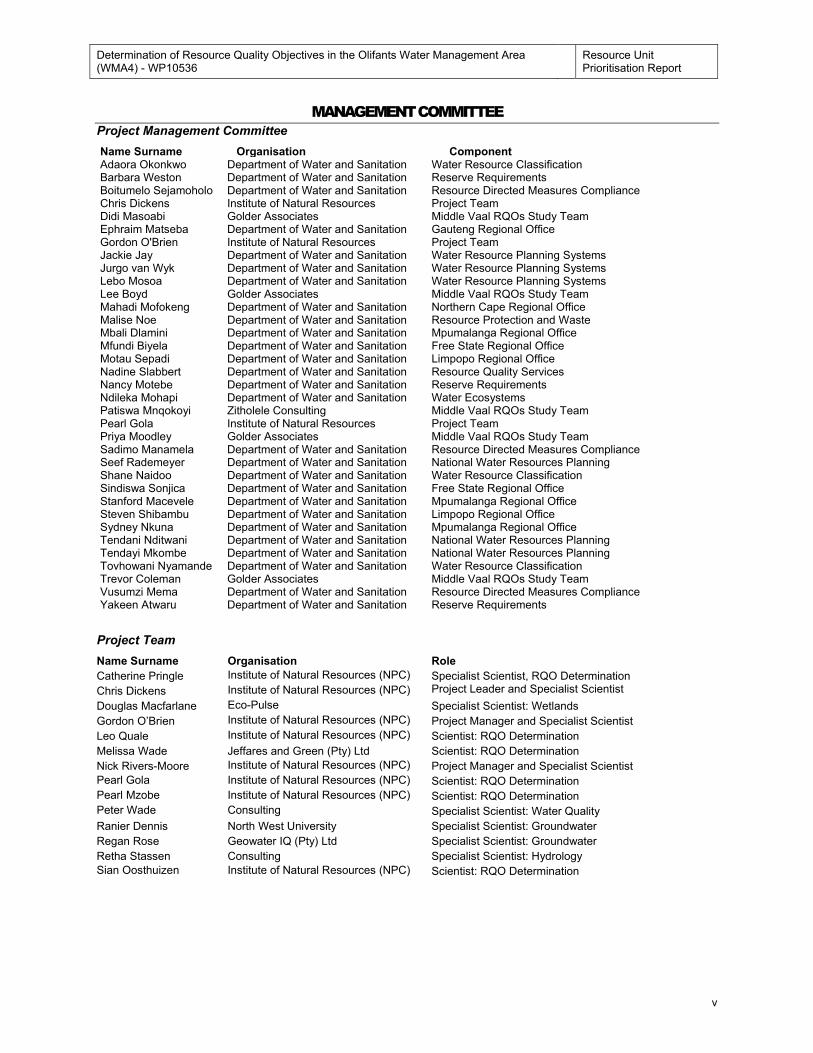
MANAGEMENT COMMITTEE
Project Management Committee
Name Surname Organisation Component Adaora Okonkwo Department of Water and Sanitation Water Resource Classification Barbara Weston Department of Water and Sanitation Reserve Requirements Boitumelo Sejamoholo Department of Water and Sanitation Resource Directed Measures Compliance Chris Dickens Institute of Natural Resources Project Team Didi Masoabi Golder Associates Middle Vaal RQOs Study Team Ephraim Matseba Department of Water and Sanitation Gauteng Regional Office Gordon O'Brien Institute of Natural Resources Project Team Jackie Jay Department of Water and Sanitation Water Resource Planning Systems Jurgo van Wyk Department of Water and Sanitation Water Resource Planning Systems Lebo Mosoa Department of Water and Sanitation Water Resource Planning Systems Lee Boyd Golder Associates Middle Vaal RQOs Study Team Mahadi Mofokeng Department of Water and Sanitation Northern Cape Regional Office Malise Noe Department of Water and Sanitation Resource Protection and Waste Mbali Dlamini Department of Water and Sanitation Mpumalanga Regional Office Mfundi Biyela Department of Water and Sanitation Free State Regional Office Motau Sepadi Department of Water and Sanitation Limpopo Regional Office Nadine Slabbert Department of Water and Sanitation Resource Quality Services Nancy Motebe Department of Water and Sanitation Reserve Requirements Ndileka Mohapi Department of Water and Sanitation Water Ecosystems Patiswa Mnqokoyi Zitholele Consulting Middle Vaal RQOs Study Team Pearl Gola Institute of Natural Resources Project Team Priya Moodley Golder Associates Middle Vaal RQOs Study Team Sadimo Manamela Department of Water and Sanitation Resource Directed Measures Compliance Seef Rademeyer Department of Water and Sanitation National Water Resources Planning Shane Naidoo Department of Water and Sanitation Water Resource Classification Sindiswa Sonjica Department of Water and Sanitation Free State Regional Office Stanford Macevele Department of Water and Sanitation Mpumalanga Regional Office Steven Shibambu Department of Water and Sanitation Limpopo Regional Office Sydney Nkuna Department of Water and Sanitation Mpumalanga Regional Office Tendani Nditwani Department of Water and Sanitation National Water Resources Planning Tendayi Mkombe Department of Water and Sanitation National Water Resources Planning Tovhowani Nyamande Department of Water and Sanitation Water Resource Classification Trevor Coleman Golder Associates Middle Vaal RQOs Study Team Vusumzi Mema Department of Water and Sanitation Resource Directed Measures Compliance Yakeen Atwaru Department of Water and Sanitation Reserve Requirements
Project Team
Name Surname Organisation Role
Catherine Pringle Institute of Natural Resources (NPC) Specialist Scientist, RQO Determination
Chris Dickens Institute of Natural Resources (NPC) Project Leader and Specialist Scientist
Douglas Macfarlane Eco-Pulse Specialist Scientist: Wetlands
Gordon O’Brien Institute of Natural Resources (NPC) Project Manager and Specialist Scientist
Leo Quale Institute of Natural Resources (NPC) Scientist: RQO Determination
Melissa Wade Jeffares and Green (Pty) Ltd Scientist: RQO Determination
Nick Rivers-Moore Institute of Natural Resources (NPC) Project Manager and Specialist Scientist
Pearl Gola Institute of Natural Resources (NPC) Scientist: RQO Determination
Pearl Mzobe Institute of Natural Resources (NPC) Scientist: RQO Determination
Peter Wade Consulting Specialist Scientist: Water Quality
Ranier Dennis North West University Specialist Scientist: Groundwater
Regan Rose Geowater IQ (Pty) Ltd Specialist Scientist: Groundwater
Retha Stassen Consulting Specialist Scientist: Hydrology
Sian Oosthuizen Institute of Natural Resources (NPC) Scientist: RQO Determination
Determination of Resource Quality Objectives in the Olifants Water Management Area (WMA4) - WP10536
Resource Unit Prioritisation Report
vi
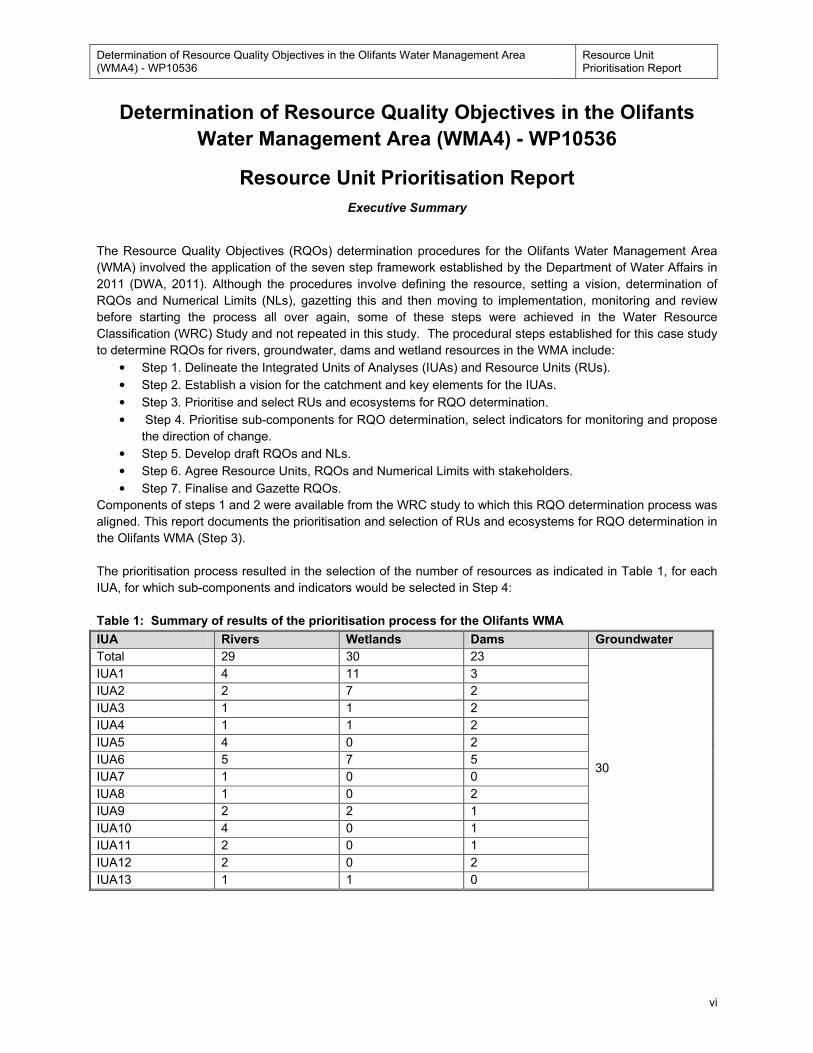
Determination of Resource Quality Objectives in the Olifants
Water Management Area (WMA4) - WP10536
Resource Unit Prioritisation Report
Executive Summary
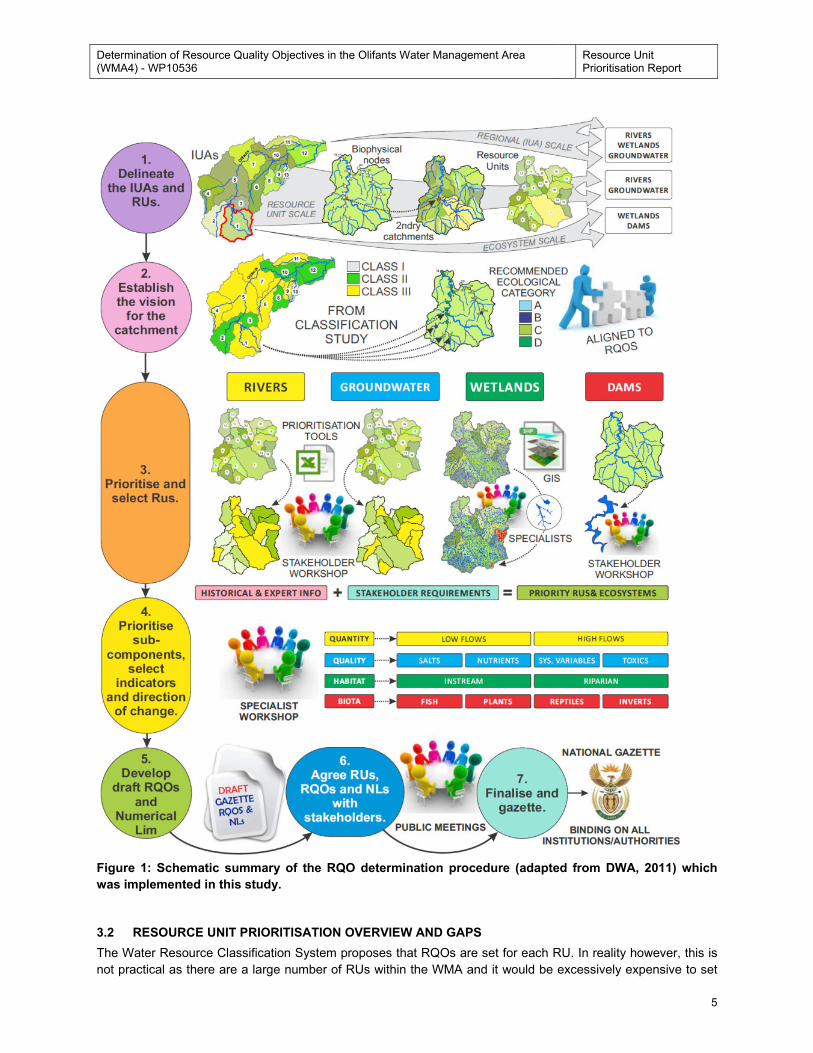
The Resource Quality Objectives (RQOs) determination procedures for the Olifants Water Management Area
(WMA) involved the application of the seven step framework established by the Department of Water Affairs in
2011 (DWA, 2011). Although the procedures involve defining the resource, setting a vision, determination of
RQOs and Numerical Limits (NLs), gazetting this and then moving to implementation, monitoring and review
before starting the process all over again, some of these steps were achieved in the Water Resource
Classification (WRC) Study and not repeated in this study. The procedural steps established for this case study
to determine RQOs for rivers, groundwater, dams and wetland resources in the WMA include:
• Step 1. Delineate the Integrated Units of Analyses (IUAs) and Resource Units (RUs).
• Step 2. Establish a vision for the catchment and key elements for the IUAs.
• Step 3. Prioritise and select RUs and ecosystems for RQO determination.
• Step 4. Prioritise sub-components for RQO determination, select indicators for monitoring and propose
the direction of change.
• Step 5. Develop draft RQOs and NLs.
• Step 6. Agree Resource Units, RQOs and Numerical Limits with stakeholders.
• Step 7. Finalise and Gazette RQOs.
Components of steps 1 and 2 were available from the WRC study to which this RQO determination process was
aligned. This report documents the prioritisation and selection of RUs and ecosystems for RQO determination in
the Olifants WMA (Step 3).
The prioritisation process resulted in the selection of the number of resources as indicated in Table 1, for each
IUA, for which sub-components and indicators would be selected in Step 4:
Table 1: Summary of results of the prioritisation process for the Olifants WMA
IUA Rivers Wetlands Dams Groundwater
Total 29 30 23
30
IUA1 4 11 3
IUA2 2 7 2
IUA3 1 1 2
IUA4 1 1 2
IUA5 4 0 2
IUA6 5 7 5
IUA7 1 0 0
IUA8 1 0 2
IUA9 2 2 1
IUA10 4 0 1
IUA11 2 0 1
IUA12 2 0 2
IUA13 1 1 0
Determination of Resource Quality Objectives in the Olifants Water Management Area (WMA4) - WP10536
Resource Unit Prioritisation Report
vii
Determination of Resource Quality Objectives in the Olifants
Water Management Area (WMA4) - WP10536
Resource Unit Prioritisation Report
TABLE OF CONTENTS
1 INTRODUCTION .......................................................................................................................................... 1
2 SCOPE OF THE STUDY .............................................................................................................................. 2
3 METHODOLOGY ......................................................................................................................................... 3
3.1 Resource Quality Objectives methodology overview ........................................................................... 3
3.2 Resource Unit prioritisation overview and gaps ................................................................................... 5
3.3 Stakeholder workshops ....................................................................................................................... 6
3.4 Step 3: River Resource Unit Prioritisation for the Olifants WMA .......................................................... 6
3.4.1 Application of the Resource Unit Prioritisation Tool ...................................................................... 6
3.4.2 Scoring of criteria and sub-criteria in the RUPT ............................................................................ 6
3.4.3 Evaluation of the relative ranking and weighting of each criterion and sub-criterion ...................... 6
3.4.4 Selection of preliminary Resource Units for RQO determination ................................................... 7
3.4.5 Presentation and revision of RUPT and prioritised Resource Units with stakeholders .................. 7
3.4.6 Amendment of desktop scores with stakeholders ......................................................................... 9
3.4.7 Adjustment of relative rankings and weightings of criteria and sub-criteria with stakeholders ..... 10
3.4.8 Selection of final priority Resource Units ..................................................................................... 10
3.5 Wetland ecosystem prioritisation for the Olifants WMA ..................................................................... 11
3.6 Methodology used for desktop prioritization ...................................................................................... 12
3.6.1 Development of a consolidated wetland map .............................................................................. 12
3.6.2 Consolidation and formatting of data to inform wetland prioritization .......................................... 12
3.6.3 Position of resource unit within the IUA ....................................................................................... 13
3.6.4 Concern for users ....................................................................................................................... 13
3.6.5 Importance to users (Current & anticipated future) ..................................................................... 13
3.6.6 Threat posed to users ................................................................................................................. 15
3.6.7 Assessment of the importance of each Resource Unit to ecological components ....................... 16
3.6.8 Environmental concern ............................................................................................................... 16
3.6.9 Level of threat posed to water resource quality for the environment ........................................... 17
3.6.10 Identifying Resource Units for which management action should be prioritised .......................... 18
Determination of Resource Quality Objectives in the Olifants Water Management Area (WMA4) - WP10536
Resource Unit Prioritisation Report
viii
3.6.11 Assessing practical considerations associated with RQO determination for each Resource Unit 18
3.6.12 Evaluating the relative ranking and weighting of each criterion ................................................... 18
3.6.13 Undertaking a formal GIS analysis to develop prioritisation layers .............................................. 19
3.6.14 IUA-level verification and selection of candidate wetlands for RQO determination. .................... 20
3.7 Stakeholder engagement and selection of priority wetlands .............................................................. 20
3.7.1 Identification of potential candidate wetlands through stakeholder engagement ......................... 20
3.7.2 Final selection of priority sites ..................................................................................................... 21
3.8 Dams ecosystem prioritisation for the Olifants WMA ......................................................................... 22
3.9 Groundwater Resource Unit and ecosystem prioritisation for the Olifants WMA ............................... 22
3.9.1 Importance for Users .................................................................................................................. 23
3.9.2 Threat Posed to Users ................................................................................................................ 29
3.9.3 Ecological Importance ................................................................................................................. 35
3.9.4 Management Considerations ...................................................................................................... 39
4 FINDINGS .................................................................................................................................................. 42
4.1 Priority River Resource Units for the Olifants WMA ........................................................................... 42
4.2 Priority wetland ecosystems for the Olifants WMA ............................................................................ 43
4.2.1 Extent of mapped wetlands in the Olifants catchment ................................................................. 43
4.2.2 Results of the desktop prioritisation exercise .............................................................................. 44
4.2.3 Wetlands initially identified by key stakeholders .......................................................................... 48
4.2.4 Wetlands selected for RQO determination .................................................................................. 49
4.3 Priority dam ecosystems for the Olifants WMA .................................................................................. 73
4.4 Priority groundwater Resource Units and ecosystems for the Olifants WMA ..................................... 75
4.5 Stakeholders comment management ................................................................................................ 77
4.5.1 The purpose of the workshop ...................................................................................................... 77
4.5.2 The participation level ................................................................................................................. 77
4.5.3 The availability of information ...................................................................................................... 77
4.5.4 The timing or scheduling of activities within the workshop .......................................................... 77
4.5.5 The facilitation of the workshop ................................................................................................... 78
5 LIMITATIONS AND UNCERTAINTIES ....................................................................................................... 79
Some of the key limitations which may influence the confidence of the outcomes of the Resource Unit and
ecosystem prioritisation process which should be considered when implementing these priority RUs and
ecosystems include: ....................................................................................................................................... 79
Determination of Resource Quality Objectives in the Olifants Water Management Area (WMA4) - WP10536
Resource Unit Prioritisation Report
ix
5.1 Rivers ................................................................................................................................................ 79
5.2 Wetlands ........................................................................................................................................... 79
5.3 Dams ................................................................................................................................................. 79
5.4 Groundwater ..................................................................................................................................... 79
6 WAY FORWARD ........................................................................................................................................ 81
7 ACKNOWLEDGEMENTS ........................................................................................................................... 82
8 REFERENCES ........................................................................................................................................... 83
9 APPENDICES ............................................................................................................................................ 85
9.1 Appendix A: Summary of the Data Used to Score the Desktop Application of the RU Prioritisation
Tool for Rivers in the Study. ........................................................................................................................... 85
9.2 Appendix A2: RU scores for each criterion and sub-criterion applied in the desktop application of the
RUPT for rivers in the study. .......................................................................................................................... 92
9.3 APPENDIX A3: MOTIVATION FOR CHANGES TO SCORES FROM DESKTOP RU
PRIORITISATION TOOL WHICH RESULTED IN THE AMENDED PRIORITISATION TOOL. ...................... 99
9.4 APPENDIX B. GIS METADATA INCLUDING SCORES APPLIED TO SELECTED ATTRIBUTES
WITHIN EACH OF THE GIS DATASETS USED TO INFORM THE PRIORITISATION PROCESS. ............ 111
9.5 APPENDIX C: List of primary spatial (GIS) information used to inform the wetland prioritisation
process for the Olifants catchment ............................................................................................................... 126
9.6 APPENDIX D. Criteria and associated weightings used in prioritizing wetlands for RQO
determination. Initial GIS datasets are shaded in grey. ............................................................................... 127
9.7 Appendix E – PLOTTING PROCEDURE FOR EXPANDED DUROV DIAGRAM ............................ 131
9.8 APPENDIX F: WORKSHOP EVALUATION QUESTIONNAIRE ...................................................... 135
Determination of Resource Quality Objectives in the Olifants Water Management Area (WMA4) - WP10536
Resource Unit Prioritisation Report
x
LIST OF TABLES Table 1: Summary of results of the prioritisation process for the Olifants WMA .................................................. vi
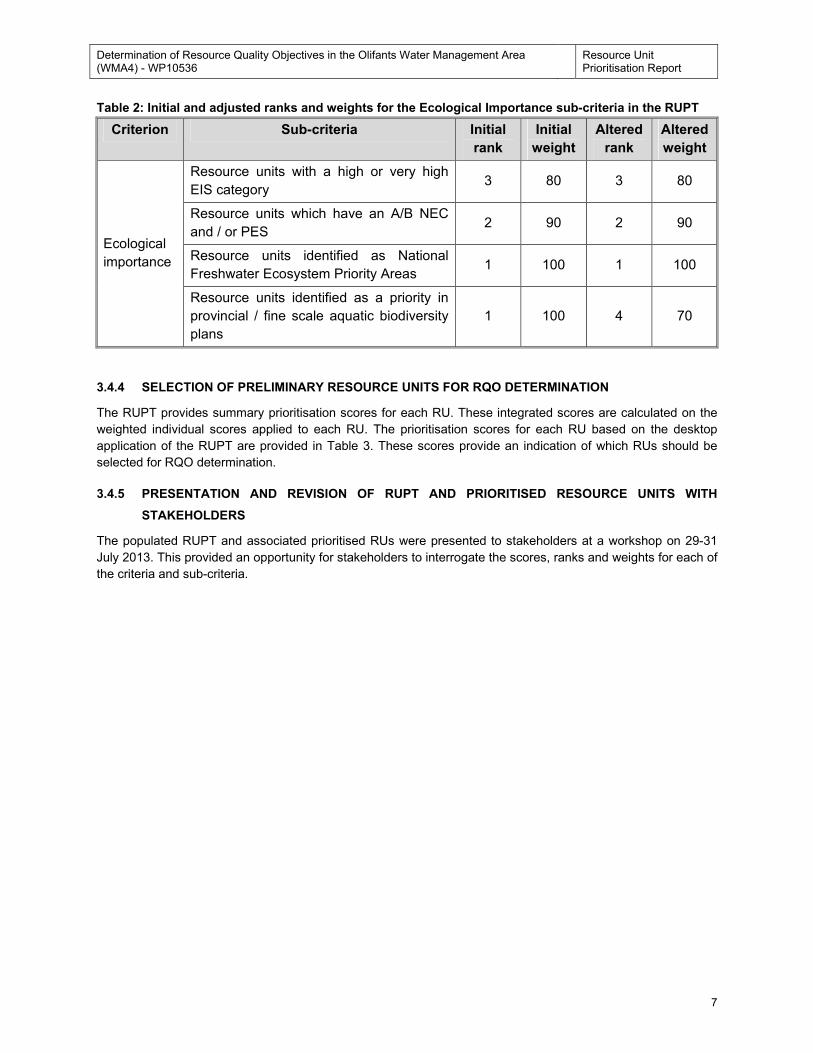
Table 2: Initial and adjusted ranks and weights for the Ecological Importance sub-criteria in the RUPT .............. 7
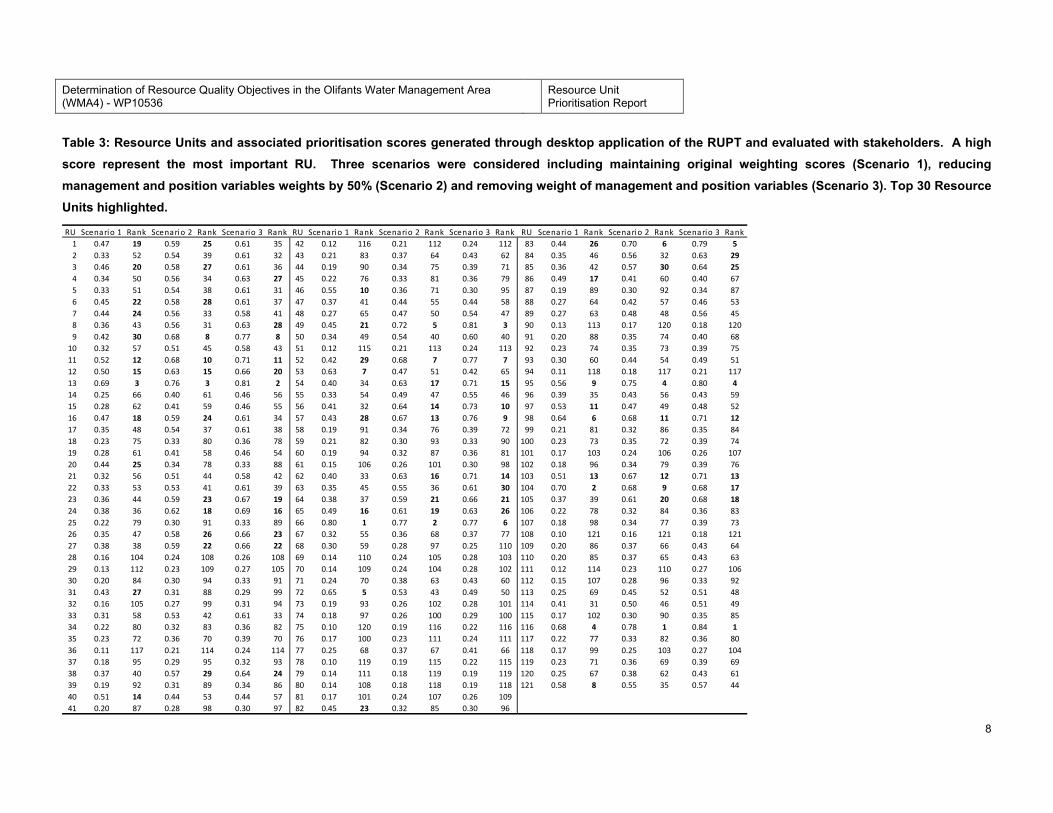
Table 3: Resource Units and associated prioritisation scores generated through desktop application of the
RUPT and evaluated with stakeholders. A high score represent the most important RU. Three scenarios were
considered including maintaining original weighting scores (Scenario 1), reducing management and position
variables weights by 50% (Scenario 2) and removing weight of management and position variables (Scenario
3). Top 30 Resource Units highlighted. ................................................................................................................ 8
Table 4: Overview of amendments by stakeholders to each criterion and sub-criterion ....................................... 9
Table 5: Additional RUs selected by stakeholders and the associated rationale for their selection .................... 10
Table 6: List of key stakeholders contacted and summary of feedback obtained. ............................................. 20
Table 7: Groundwater prioritisation criteria ......................................................................................................... 22
Table 8: Water character rating guideline ........................................................................................................... 25
Table 9: Aquifer yield class ................................................................................................................................. 25
Table 10: Major aquifer rating guideline ............................................................................................................. 26
Table 11: Contribution to economy rating guideline ............................................................................................ 28
Table 12: Relative aquifer stress rating guideline ............................................................................................... 30
Table 13: Water quality that is threatened rating guideline ................................................................................. 32
Table 14: DRASTIC Parameters ........................................................................................................................ 33
Table 15: Aquifer vulnerability rating guideline ................................................................................................... 34
Table 16: Groundwater importance to wetlands rating guideline ........................................................................ 37
Table 17: Surface-groundwater interaction rating guideline ................................................................................ 38
Table 18: Important groundwater fauna rating guideline ..................................................................................... 39
Table 19: Contribution to economy rating guideline ............................................................................................ 40
Table 20: Priority River Resource Units selected for the Olifants WMA. ............................................................. 42
Table 21: Motivation for selected wetlands in IUA1. .......................................................................................... 52
Table 22: Motivation for selected wetlands in IUA2. .......................................................................................... 55
Table 23: Motivation for the selection of wetlands in IUA3. .................................. Error! Bookmark not defined.
Table 24: Motivation for selecting wetlands in IUA4. ......................................................................................... 59
Table 25: Motivation for selecting wetlands in IUA6. ............................................ Error! Bookmark not defined.
Table 26: Motivation for wetlands selected in IUA9. .......................................................................................... 67
Table 27: Motivation for the wetland selected in IUA13. .................................................................................... 72
Table 28: Final selected priority dams for the Olifants WMA .............................................................................. 73
Table 29: Comments on workshop process by workshop participants who attended the Olifants RQO
prioritisation workshop from 29 – 31 July 2013. .................................................................................................. 78
Determination of Resource Quality Objectives in the Olifants Water Management Area (WMA4) - WP10536
Resource Unit Prioritisation Report
xi
LIST OF FIGURES Figure 1: Schematic summary of the RQO determination procedure (adapted from DWA, 2011) which was
implemented in this study. .................................................................................................................................... 5
Figure 2: Structured hierarchy used to inform the prioritisation process. ............................................................ 19
Figure 3: Class assignment of expanded Durov diagram ................................................................................... 24
Figure 4: Expanded Durov diagram with evaluation of EC ................................................................................. 24
Figure 5: Spatial distribution of water character rating ........................................................................................ 25
Figure 6: Major aquifer classification map .......................................................................................................... 26
Figure 7: Spatial distribution of major aquifers rating .......................................................................................... 27
Figure 8: Activities that contribute to the economy ............................................................................................. 28
Figure 9: Spatial distribution of contribution to the economy rating ..................................................................... 29
Figure 10: Relative aquifer stress ....................................................................................................................... 30
Figure 11: Spatial distribution of relative aquifer stress rating ............................................................................ 31
Figure 12: Groundwater quality distribution map ................................................................................................ 32
Figure 13: Spatial distribution of threat to water quality rating ............................................................................ 33
Figure 14: DRASTIC aquifer vulnerability ........................................................................................................... 34
Figure 15: Spatial distribution of aquifer vulnerability rating ................................................................................ 35
Figure 16: Wetlands directly affected by groundwater in the study area. ............................................................ 36
Figure 17: Spatial distribution of wetlands directly affected by groundwater rating. ............................................ 37
Figure 18: Surface-groundwater interaction........................................................................................................ 38
Figure 19: Spatial distribution of surface-groundwater interaction rating ............................................................ 39
Figure 20: Current mining positions assumed to have management plans ......................................................... 40
Figure 21: Spatial distribution of management plans rating ................................................................................ 41
Figure 22: River Resource Units prioritised for the Olifants WMA ..................................................................... 43
Figure 23: Distribution of mapped wetlands in the Olifants catchment. .............................................................. 44
Figure 24: Rating of wetlands based in their location along main stem rivers and potential for integrating
impacts associated with the upstream IUA. ........................................................................................................ 45
Figure 25: Prioritisation of wetlands based on concern for users in the Olifants catchment. .............................. 46
Figure 26: Map indicating the ratings of wetlands based on environmental criteria. .......................................... 47
Figure 27: Wetland rating based on practical considerations (reflecting available data sources)....................... 48
Figure 28: Priority wetlands identified by local stakeholders. ............................................................................. 49
Figure 29: Map indicating the distribution and location of wetlands prioritized for RQO determination in the
Olifants catchment. ............................................................................................................................................. 50
Figure 30: Wetland types and consolidated PES data for IUA 1. ....................................................................... 50
Figure 31: Map showing the location of prioritised wetlands for RQO determination in IUA1. ........................... 52
Figure 32: Wetland types and consolidated PES data for IUA 2. ....................................................................... 53
Figure 33: Map showing the location of prioritised wetlands for RQO determination in IUA2. ........................... 55
Figure 34: Wetland types and consolidated PES data for IUA 3. ....................................................................... 56
Figure 35: Map showing the location of prioritised wetlands for RQO determination in IUA3. ........................... 57
Figure 36: Wetland types and consolidated PES data for IUA 4. ....................................................................... 58
Figure 37: Map showing the location of the single wetland prioritised for RQO determination in IUA4. ............. 59
Determination of Resource Quality Objectives in the Olifants Water Management Area (WMA4) - WP10536
Resource Unit Prioritisation Report
xii
Figure 38: Wetland types and consolidated PES data for IUA 5. ....................................................................... 60
Figure 39: Wetland types and consolidated PES data for IUA 6. ....................................................................... 61
Figure 40: Map showing the location of wetlands prioritized for RQO determination in IUA6. ........................... 62
Figure 41: Wetland types and consolidated PES data for IUA 7. ....................................................................... 63
Figure 42: Wetland types and consolidated PES data for IUA 8. ....................................................................... 64
Figure 43: Wetland types and consolidated PES data for IUA 9. ....................................................................... 65
Figure 44: Map showing the location of prioritised wetlands for RQO determination in IUA9. ........................... 67
Figure 45: Wetland types and consolidated PES data for IUA 10. ..................................................................... 68
Figure 46: Wetland types and consolidated PES data for IUA 11. ..................................................................... 69
Figure 47: Wetland types and consolidated PES data for IUA 12. ..................................................................... 70
Figure 48: Wetland types and consolidated PES data for IUA 13. ..................................................................... 71
Figure 49: Map showing the location of the wetland selected for RQO determination in IUA13. ....................... 72
Figure 50: Prioritised dam ecosystems selected for the Resource Quality Objectives determination study
through the Resource Unit Prioritisation process. ............................................................................................... 74
Figure 51: Olifants groundwater RU prioritization outcomes. .............................................................................. 75
Figure 52: Top 30 groundwater resource units selected for the determination of Ground Water Resource Quality
Objectives in the study. ...................................................................................................................................... 76
Determination of Resource Quality Objectives in the Olifants Water Management Area (WMA4) - WP10536
Resource Unit Prioritisation Report
xiii
ABBREVIATIONS
Acronym Meaning
Al Aluminium
As Arsenic
CaCO₃ Calcium Carbonate
Cd Cadmium
Chl-a Chlorophyll a
Cl Chlorine
Cr(VI) Hexavalent chromium
Cu Copper
DOC Dissolved organic carbon
DRM Desktop Reserve Model
DWA Department of Water Affairs
DWAF Department of Water Affairs and Forestry
DWS Department of Water and Sanitation
EIS Ecological Importance and Sensitivity
EWR Ecological Water Requirements
F Fluorine
FEPA Freshwater Ecosystem Priority Areas
FRAI Fish Response Assessment Index
GIS Geographical Information Science
Hg Mercury
Og/l Micrograms per litre
IBA Important Bird Areas
IRHI Index of Reservoir Habitat Impairment
IUA Integrated Unit of Analysis
IWRM Integrated Water Resource Management
IWRMP Integrated Water Resources Management Plan
KNP Kruger National Park
m3/s Cubic meters per meter (cumecs)
MAR Mean Annual Runoff
MC Management Class
mg/l Milligrams per litre
MIRAI Macroinvertebrate Response Assessment Index
Mn Manganese
NFEPA National Freshwater Ecosystem Priority Areas
NL Numerical Limit
NO₂ Nitrite
NO₃ Nitrate
NTU Turbidity
NWA National Water Act
NWRS National Water Resource Strategy
O₂ Oxygen
Pb Lead
Determination of Resource Quality Objectives in the Olifants Water Management Area (WMA4) - WP10536
Resource Unit Prioritisation Report
xiv
PES Present Ecological State
pH power of hydrogen
PO₄ Phosphate
RDM Resource Directed Measures
REC Recommended Ecological Category
REC Recommended ecological category
RHAM Rapid Habitat Assessment Method
RHP River Health Programme
RO Regional Office
RQOs Resource Quality Objectives
RR Reporting rates
RU / RUs Resource Unit/s
RUET Resource Unit Evaluation Tool
RUPT Resource Unit Prioritisation Tool
SASS5 South African Scoring System version 5
Se Selenium
SPI Specific Pollution sensitivity Index
TDS Total Dissolved Solids
TIN Total Inorganic Nitrogen
TPC Threshold of Probable Concern
VEGRAI Vegetation Response Assessment Index
VMAR Virgin Mean Annual Runoff
WE Water Ecosystems
WMA Water Management Area
WRC Water Resource Classification
WWTW Waste Water Treatment Works
Zn Zinc
DEFINITION OF PROJECT SPECIFIC ACRONYMS:
EWR – Ecological Water Requirements is synonymous with the ecological component of the Reserve as defined in the Water Act (1998).
IUA – Integrated Unit of Analysis or spatial units that will be defined as significant resources (as prescribed by the NWA).They are finer-scale units aligned to watershed boundaries, in which socio-economic activities are likely to be similar.
MC – The Management Class is set by the WRC and describes the degree of alteration that resources may be subjected to.
REC – Recommended Ecological Category – this is a recommendation purely from the ecological perspective designed to meet a possible future state.
RU – Resource Unit is a stretch of river that is sufficiently ecologically distinct to warrant its own specification of Ecological Water Requirements
WRC – Water Resources Classification is a procedure required by the Water Act 1998 that produces a MC per IUA for all water resources.
Determination of Resource Quality Objectives in the Olifants Water Management Area (WMA4) - WP10536
Resource Unit Prioritisation Report
1
Determination of Resource Quality Objectives in the Olifants
Water Management Area (WMA4) - WP10536
Resource Unit Prioritisation Report
1 INTRODUCTION
The rationale for requiring RQOs, their components, their applicability and implementation procedures emanate
from the National Water Act of South Africa (NWA, 1998). The Water Act (1998) requires that all water
resources are protected in order to secure their future and sustainable use. It lays out a plan where each
significant water resources (surface water, wetlands, groundwater and estuaries) are classified according to a
WRC System. In the process, the Reserve is also determined for the water resource, i.e. the amount of water,
and the quality of water, that is required to sustain both the ecosystem and provide for basic human needs.
This Reserve then contributes to the Classification of the resource. This classification results in a Management
Class and associated RQOs for water resources, which then gives direction for future management activities in
the WMA. According to the Water Act (NWA, 1998), the purpose of RQOs are to establish clear goals relating to
the quality of the relevant water resources and stipulates that in determining RQOs a balance must be sought
between the need to protect and sustain water resources and the need to use them (sensu DWA, 2011). Thus
the “working part” of the Classification of water resources, is the RQOs that are produced. These are numerical
and narrative descriptors of conditions that need to be met in order to achieve the required management
scenario as provided during the resource classification. Such descriptors relate to the:
(a) quantity, pattern, timing, water level and assurance of instream flow
(b) water quality including the physical, chemical, and biological characteristics of the water
(c) character and condition of the instream and riparian habitat; and
(d) characteristics, condition and distribution of the aquatic biota (DWA, 2011).
This section of the RQO determination procedure includes the prioritisation and selection of RUs and
ecosystems RQO determination in the Olifants WMA (Step 3; DWA, 2011). The Water Resource Classification
System proposes that RQOs are set for each RU. In reality however, this may not be practical as there may be
a large number of RUs within a selected catchment. A rationalisation process is necessary to prioritise and
select the most useful RUs for RQO determination. The objective of Step 3 is therefore to prioritise and select
preliminary RUs which will then be discussed and agreed with stakeholders during Step 6.
Determination of Resource Quality Objectives in the Olifants Water Management Area (WMA4) - WP10536
Resource Unit Prioritisation Report
2
2 SCOPE OF THE STUDY
The study entails the determination of Resource Quality Objectives (RQOs) for all significant water resources
(rivers, wetlands, dams (or lakes) and groundwater ecosystems) in the Olifants Water Management Area
(WMA). The RQO determination procedure established by DWA (2011) has been implemented to determine
RQOs in this case study. The RQO determination procedure is based on a seven step framework including
(DWA, 2011; Figure 1):
• Step 1. Delineate the Integrated Units of Analysis (IUAs) and define the Resource Units.
• Step 2. Establish a vision for the catchment and key elements for the IUAs.
• Step 3. Prioritise and select preliminary Resource Units for RQO determination.
• Step 4. Prioritise sub-components for RQO determination, select indicators for monitoring and propose
the direction of change.
• Step 5. Develop draft RQOs and Numerical Limits (NLs).
• Step 6. Agree RUs, RQOs and NLs with stakeholders.
• Step 7. Finalise and Gazette RQOs.
In 2013 the Department of Water Affairs completed the Water Resource Classification (WRC) study for the
Olifants WMA which included the delineation IUAs and established a vision for the catchment and key elements
for the IUAs (DWA, 2013). This resulted in the determination of Management Classes for each IUA and
Recommended Ecological Categories for biophysical nodes selected to represent the riverine ecosystem in the
WMA. These outcomes met the IUA delineation requirements for the study and provided the vision information,
including Management Classes for the study. As such this study did not duplicate these components but rather
adopted the outcomes from the WRC study (DWA, 2013). Apart from these components that were obtained
from the WRC study, some developments/adaptations were made to the DWA (2011) RQO determination
procedure to the groundwater, wetland and dam components of the study in particular. This report documents
the approach adopted and the outcomes of the implementation of Step 3 of the RQO determination procedure
(DWA, 2011).
Determination of Resource Quality Objectives in the Olifants Water Management Area (WMA4) - WP10536
Resource Unit Prioritisation Report
3
3 METHODOLOGY
3.1 RESOURCE QUALITY OBJECTIVES METHODOLOGY OVERVIEW
The Resource Quality Objectives determination procedures established by DWA (2011) were implemented in
this study. This included the implementation of the seven-step procedural framework which is repeatable and as
such allows for an adaptive management cycle with additional steps (Figure 1). Overall the procedure involved
defining the resource, setting a vision, determining RQOs and Numerical Limits (NLs), gazetting the RQOs and
NLs and then moving to implementation, monitoring and review of these RQOs and NLs before starting the
process all over again. A summary of the procedural steps established for this case study, with some
adaptations that were required to include groundwater, dams and wetland resources include:
• Step 1. Delineate the IUAs and RUs: In this case study IUAs were obtained from the Water Resource
Classification (WRC) study (DWA, 2012) and applied to all water resources considered in the study
(rivers, wetlands, dams and groundwater ecosystems). Three spatial levels for resources were
considered for RQO determination in this case study:
o Regional (IUA) scale assessments were considered for rivers, wetlands and groundwater
resources in the study.
o Resource Unit scale assessments that were aligned to biophysical nodes obtained from the
WRC study (DWA, 2012) were considered for river and groundwater resources alone.
o Ecosystem scale assessments were considered for wetland and dam ecosystems/resources in
the study.
The RU delineation procedure initially involved the identification of sub-quaternary reaches of rivers in
the WMA for each biophysical node obtained from the WRC study. The RU delineation process then
involved amalgamating the upstream associated sub-quaternary reaches of riverine ecosystems, and
their associated catchment areas. As a result, the number of RUs selected for the study was identical to
and could later be aligned to the information associated with the biophysical nodes from the WRC
study. The delineation procedure for ecosystem scale resource assessment involved the use of
Geographical Information System (GIS) spatial ecosystem data.
• Step 2. Establish a vision for the catchment and key elements for the IUAs: The stakeholder
requirements and their associated outcomes, which include the Management Classes for IUAs and
RECs for RUs from the WRC study, were adopted as the vision for this study (DWA, 2012). No further
visioning process was appropriate as this could have conflicted with the WRC process. The WRC
outcomes were skewed towards river resources in the WMA which necessitated obtaining additional
information for the other resources considered in the study (i.e. wetlands, dams and groundwater
ecosystems). This additional information is highlighted in the applicable reports.
• Step 3. Prioritise and select RUs and ecosystems for RQO determination: This step involved the
use of existing ecological specifications (EcoSpecs) and user specifications (UserSpecs) information
from the Olifants Reserve and WRC studies. This information was used to implement the RU
Prioritisation Tool for rivers (DWA, 2011) and the new RU Prioritisation Tools developed for
groundwater RUs as part of this study. Wetland ecosystem prioritisation involved the implementation of
a new GIS based prioritisation approach developed for the study and dam ecosystem prioritisation was
based on a desktop assessment of available user- and eco-spec information. During this step, RU and
ecosystem prioritisation stakeholder participation workshops were carried out during which available
information was discussed and amended according to available local information regarding the
protection and use requirements for the WMA. During these RU and ecosystem prioritisation
stakeholder workshops, consensus was reached to select the final lists of prioritised RUs and
ecosystems for the RQO determination process.
• Step 4. Prioritise sub-components for RQO determination, select indicators for monitoring and
propose the direction of change: This step included the hosting of a range of specialist workshops for
rivers, dams, wetlands and groundwater resources where RU Evaluation Tools were used to select sub-
components for RQO determination, select indicators and propose the direction of change. The RU
Evaluation Tools used for wetlands, dams and groundwater were developed for the study. This
information was then used to develop draft RQOs and Numerical Limits in the next step. The relevant
activities of this step were:
Determination of Resource Quality Objectives in the Olifants Water Management Area (WMA4) - WP10536
Resource Unit Prioritisation Report
4
4.1 Identify and assess the impact of current and anticipated future use on water resource components
4.2 Identify requirements of important user groups 4.3 Selection of sub-components for RQO determination 4.4 Establish the desired direction of change for selected sub-components 4.5 Complete the information sheet for the Resource Unit Evaluation Tool
• Step 5. Develop draft RQOs and Numerical Limits: This step was based on the outcomes of the RU
and ecosystem prioritisation step (Step 4). From the outcomes of the RU and ecosystem prioritisation
step, draft RQOs were established and provided to recognised specialists to establish NLs that were
generally quantitative descriptors of the different components of the resource (such as the water
quantity, quality, habitat and biota). These descriptors were designed to give a quantitative measures of
the RQOs (DWA, 2011). Although the NLs may have had some uncertainty associated with them and
were not originally intended for gazetting (DWA, 2011), they were considered for gazetting in the study
at the request of the Department of Water and Sanitation (DWS) Chief Directorate: Legal Services.
Refer to the RQO and NL reports for more information. The relevant activities of this step were:
5.1 Carry over sub-component and indicator information from the Resource Unit Evaluation Tool
5.2 Extract available data to determine the present state for selected sub-components and
indicators
5.3 Assess the suitability of the data
5.4 Where necessary, collect data to determine the Present State for selected indicators
5.5 Determine the level at which to set RQOs
5.6 Set appropriate draft RQOs
5.7 Set appropriate draft Numerical Limits in line with the draft RQO
5.8 Determine confidence in the RQOs and process
• Step 6. Agree on Resource Units, RQOs and Numerical Limits with stakeholders: This component
included the consideration of RQO and NL outcomes with stakeholders prior to the initiation of the
gazetting process. The relevant activities of this step were:
6.1 Notify stakeholders and plan the workshop
6.2 Present and refine the Resource Unit selection with stakeholders
6.3 Present the sub-components and indicators selected for the RQO determination
6.4 Present the proposed direction of change and associated rationale
6.5 Present and revise RQOs and Numerical Limits
• Step 7. Finalise and Gazette RQOs: This component of the RQO determination process is still to be
carried out. A Legal Notice was developed as a part of this study for submission to Chief Directorate:
Legal Services of the DWS for gazetting.
Determination of Resource Quality Objectives in the Olifants Water Management Area (WMA4) - WP10536
Resource Unit Prioritisation Report
5
Figure 1: Schematic summary of the RQO determination procedure (adapted from DWA, 2011) which
was implemented in this study.
3.2 RESOURCE UNIT PRIORITISATION OVERVIEW AND GAPS
The Water Resource Classification System proposes that RQOs are set for each RU. In reality however, this is
not practical as there are a large number of RUs within the WMA and it would be excessively expensive to set
Determination of Resource Quality Objectives in the Olifants Water Management Area (WMA4) - WP10536
Resource Unit Prioritisation Report
6
RQOs and to monitor all of them. A rationalisation process is therefore necessary to prioritise and select the
most useful RUs for RQO determination. The objective of Step 3 was therefore to prioritise and select
preliminary RUs which were discussed and agreed with stakeholders. Different approaches were used to
prioritise the river, wetland, groundwater and dam resources within the Olifants WMA. Each of these respective
approaches is discussed below.
3.3 STAKEHOLDER WORKSHOPS
For this component of the study a resource unit prioritisation workshop for the Olifants Water Management Area
was carried out at the Loskop Dam Nature Reserve from 29-31 July 2013. The workshop was well attended by
local community representatives and representatives from the agriculture, industry, mining sectors, regional and
national conservation authorities, local and regional water resource managers and scientists. The following
tasks were assessed with stakeholders at the workshop:
• Evaluation of the study area, resource units (RU), desktop RU prioritisation results.
• Evaluation of the data used for the desktop RIVER RU prioritisation.
• Evaluation of the data used for the desktop GROUND WATER RU prioritisation.
• Evaluation of the data used for the desktop Lakes and Wetlands RU prioritisation.
• Evaluation of amended RU prioritisation results.
• Selection of RUs for RQO determination of the Olifants WMA RQO study.
3.4 STEP 3: RIVER RESOURCE UNIT PRIORITISATION FOR THE OLIFANTS WMA
3.4.1 APPLICATION OF THE RESOURCE UNIT PRIORITISATION TOOL
The RQO methodology provides a decision support tool, the Resource Unit Prioritisation Tool (RUPT), to guide
the selection process (DWA, 2011). This tool was used to determining the relative importance of monitoring
each RU in the Olifants WMA as part of management operations. All of the RUs are ranked in order, from
highly important to not important.
3.4.2 SCORING OF CRITERIA AND SUB-CRITERIA IN THE RUPT
The RUPT assesses a range of criteria and sub-criteria including the following:
• Position of the Resource Unit within the IUA
• Importance of each Resource Unit to users and level of threat posed to water resource quality for users
• Importance of each RU to ecological components and level of threat posed to water resource quality for
the environment
• Resource Units for which management action should be prioritised
• Practical considerations associated with RQO determination for each RU
The information used to evaluate each of these criteria was gathered from a range of sources including the
Water Resource Classification, StatsSA Census 2011, the Reconciliation Study for the Olifants, and the PES-
EIS study. The method of data processing and scoring of each of criterion and sub-criterion is detailed in
Appendix A1. The actual scores assigned to each RU for each sub-criterion are detailed in Appendix A2.
3.4.3 EVALUATION OF THE RELATIVE RANKING AND WEIGHTING OF EACH CRITERION AND SUB-
CRITERION
The RUPT assigns standard ranks and relative weights to each criterion and sub-criterion. These ranks and
relative weights remained unchanged for all criteria and sub-criteria with the exception of the Ecological
Importance sub-criteria. The ranks and weights of these sub-criteria were adjusted as the data included in the
provincial biodiversity aquatic plans incorporated the NFEPA data which had already been assessed as a
separate sub-criterion. The initial and adjusted ranks and weights for each of these sub-criteria are detailed in
Table 2.
Determination of Resource Quality Objectives in the Olifants Water Management Area (WMA4) - WP10536
Resource Unit Prioritisation Report
7
Table 2: Initial and adjusted ranks and weights for the Ecological Importance sub-criteria in the RUPT
Criterion Sub-criteria Initial
rank
Initial
weight
Altered
rank
Altered
weight
Ecological
importance
Resource units with a high or very high
EIS category 3 80 3 80
Resource units which have an A/B NEC
and / or PES 2 90 2 90
Resource units identified as National
Freshwater Ecosystem Priority Areas 1 100 1 100
Resource units identified as a priority in
provincial / fine scale aquatic biodiversity
plans
1 100 4 70
3.4.4 SELECTION OF PRELIMINARY RESOURCE UNITS FOR RQO DETERMINATION
The RUPT provides summary prioritisation scores for each RU. These integrated scores are calculated on the
weighted individual scores applied to each RU. The prioritisation scores for each RU based on the desktop
application of the RUPT are provided in Table 3. These scores provide an indication of which RUs should be
selected for RQO determination.
3.4.5 PRESENTATION AND REVISION OF RUPT AND PRIORITISED RESOURCE UNITS WITH
STAKEHOLDERS
The populated RUPT and associated prioritised RUs were presented to stakeholders at a workshop on 29-31
July 2013. This provided an opportunity for stakeholders to interrogate the scores, ranks and weights for each of
the criteria and sub-criteria.
Determination of Resource Quality Objectives in the Olifants Water Management Area (WMA4) - WP10536
Resource Unit Prioritisation Report
8
Table 3: Resource Units and associated prioritisation scores generated through desktop application of the RUPT and evaluated with stakeholders. A high
score represent the most important RU. Three scenarios were considered including maintaining original weighting scores (Scenario 1), reducing
management and position variables weights by 50% (Scenario 2) and removing weight of management and position variables (Scenario 3). Top 30 Resource
Units highlighted.
RU Scenario 1 Rank Scenario 2 Rank Scenario 3 Rank RU Scenario 1 Rank Scenario 2 Rank Scenario 3 Rank RU Scenario 1 Rank Scenario 2 Rank Scenario 3 Rank
1 0.47 19 0.59 25 0.61 35 42 0.12 116 0.21 112 0.24 112 83 0.44 26 0.70 6 0.79 5
2 0.33 52 0.54 39 0.61 32 43 0.21 83 0.37 64 0.43 62 84 0.35 46 0.56 32 0.63 29
3 0.46 20 0.58 27 0.61 36 44 0.19 90 0.34 75 0.39 71 85 0.36 42 0.57 30 0.64 25
4 0.34 50 0.56 34 0.63 27 45 0.22 76 0.33 81 0.36 79 86 0.49 17 0.41 60 0.40 67
5 0.33 51 0.54 38 0.61 31 46 0.55 10 0.36 71 0.30 95 87 0.19 89 0.30 92 0.34 87
6 0.45 22 0.58 28 0.61 37 47 0.37 41 0.44 55 0.44 58 88 0.27 64 0.42 57 0.46 53
7 0.44 24 0.56 33 0.58 41 48 0.27 65 0.47 50 0.54 47 89 0.27 63 0.48 48 0.56 45
8 0.36 43 0.56 31 0.63 28 49 0.45 21 0.72 5 0.81 3 90 0.13 113 0.17 120 0.18 120
9 0.42 30 0.68 8 0.77 8 50 0.34 49 0.54 40 0.60 40 91 0.20 88 0.35 74 0.40 68
10 0.32 57 0.51 45 0.58 43 51 0.12 115 0.21 113 0.24 113 92 0.23 74 0.35 73 0.39 75
11 0.52 12 0.68 10 0.71 11 52 0.42 29 0.68 7 0.77 7 93 0.30 60 0.44 54 0.49 51
12 0.50 15 0.63 15 0.66 20 53 0.63 7 0.47 51 0.42 65 94 0.11 118 0.18 117 0.21 117
13 0.69 3 0.76 3 0.81 2 54 0.40 34 0.63 17 0.71 15 95 0.56 9 0.75 4 0.80 4
14 0.25 66 0.40 61 0.46 56 55 0.33 54 0.49 47 0.55 46 96 0.39 35 0.43 56 0.43 59
15 0.28 62 0.41 59 0.46 55 56 0.41 32 0.64 14 0.73 10 97 0.53 11 0.47 49 0.48 52
16 0.47 18 0.59 24 0.61 34 57 0.43 28 0.67 13 0.76 9 98 0.64 6 0.68 11 0.71 12
17 0.35 48 0.54 37 0.61 38 58 0.19 91 0.34 76 0.39 72 99 0.21 81 0.32 86 0.35 84
18 0.23 75 0.33 80 0.36 78 59 0.21 82 0.30 93 0.33 90 100 0.23 73 0.35 72 0.39 74
19 0.28 61 0.41 58 0.46 54 60 0.19 94 0.32 87 0.36 81 101 0.17 103 0.24 106 0.26 107
20 0.44 25 0.34 78 0.33 88 61 0.15 106 0.26 101 0.30 98 102 0.18 96 0.34 79 0.39 76
21 0.32 56 0.51 44 0.58 42 62 0.40 33 0.63 16 0.71 14 103 0.51 13 0.67 12 0.71 13
22 0.33 53 0.53 41 0.61 39 63 0.35 45 0.55 36 0.61 30 104 0.70 2 0.68 9 0.68 17
23 0.36 44 0.59 23 0.67 19 64 0.38 37 0.59 21 0.66 21 105 0.37 39 0.61 20 0.68 18
24 0.38 36 0.62 18 0.69 16 65 0.49 16 0.61 19 0.63 26 106 0.22 78 0.32 84 0.36 83
25 0.22 79 0.30 91 0.33 89 66 0.80 1 0.77 2 0.77 6 107 0.18 98 0.34 77 0.39 73
26 0.35 47 0.58 26 0.66 23 67 0.32 55 0.36 68 0.37 77 108 0.10 121 0.16 121 0.18 121
27 0.38 38 0.59 22 0.66 22 68 0.30 59 0.28 97 0.25 110 109 0.20 86 0.37 66 0.43 64
28 0.16 104 0.24 108 0.26 108 69 0.14 110 0.24 105 0.28 103 110 0.20 85 0.37 65 0.43 63
29 0.13 112 0.23 109 0.27 105 70 0.14 109 0.24 104 0.28 102 111 0.12 114 0.23 110 0.27 106
30 0.20 84 0.30 94 0.33 91 71 0.24 70 0.38 63 0.43 60 112 0.15 107 0.28 96 0.33 92
31 0.43 27 0.31 88 0.29 99 72 0.65 5 0.53 43 0.49 50 113 0.25 69 0.45 52 0.51 48
32 0.16 105 0.27 99 0.31 94 73 0.19 93 0.26 102 0.28 101 114 0.41 31 0.50 46 0.51 49
33 0.31 58 0.53 42 0.61 33 74 0.18 97 0.26 100 0.29 100 115 0.17 102 0.30 90 0.35 85
34 0.22 80 0.32 83 0.36 82 75 0.10 120 0.19 116 0.22 116 116 0.68 4 0.78 1 0.84 1
35 0.23 72 0.36 70 0.39 70 76 0.17 100 0.23 111 0.24 111 117 0.22 77 0.33 82 0.36 80
36 0.11 117 0.21 114 0.24 114 77 0.25 68 0.37 67 0.41 66 118 0.17 99 0.25 103 0.27 104
37 0.18 95 0.29 95 0.32 93 78 0.10 119 0.19 115 0.22 115 119 0.23 71 0.36 69 0.39 69
38 0.37 40 0.57 29 0.64 24 79 0.14 111 0.18 119 0.19 119 120 0.25 67 0.38 62 0.43 61
39 0.19 92 0.31 89 0.34 86 80 0.14 108 0.18 118 0.19 118 121 0.58 8 0.55 35 0.57 44
40 0.51 14 0.44 53 0.44 57 81 0.17 101 0.24 107 0.26 109
41 0.20 87 0.28 98 0.30 97 82 0.45 23 0.32 85 0.30 96
Determination of Resource Quality Objectives in the Olifants Water Management Area (WMA4) - WP10536
Resource Unit Prioritisation Report
9
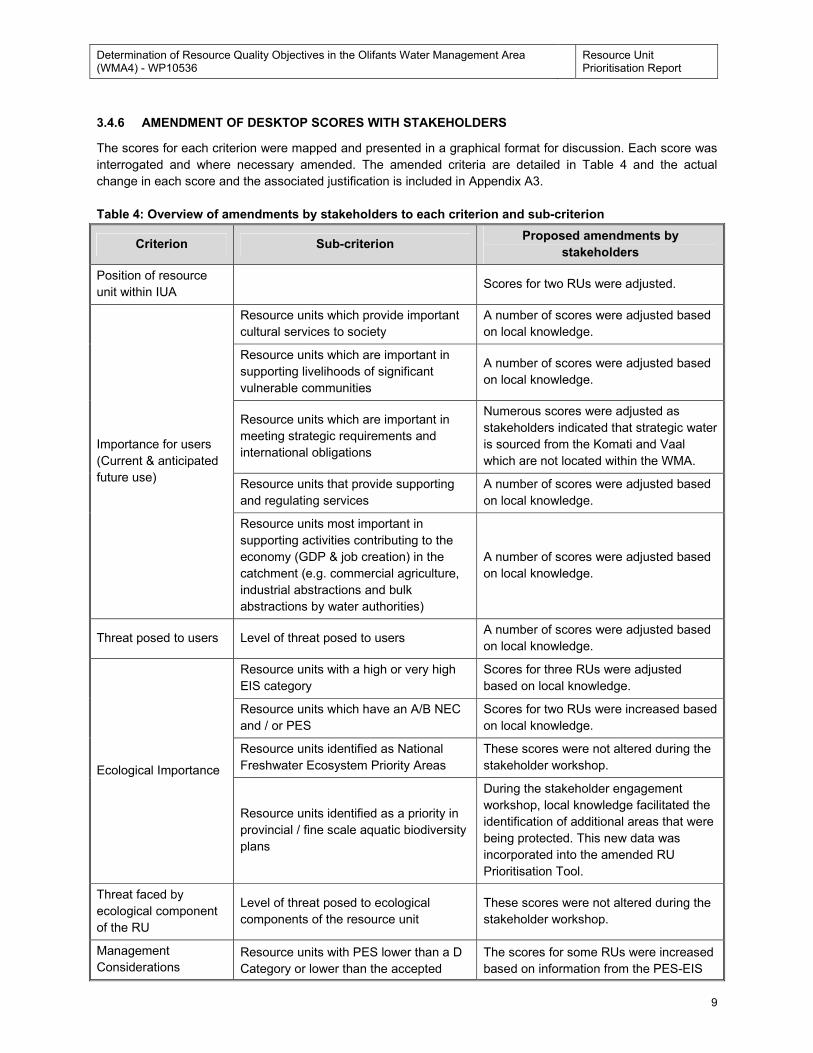
3.4.6 AMENDMENT OF DESKTOP SCORES WITH STAKEHOLDERS
The scores for each criterion were mapped and presented in a graphical format for discussion. Each score was
interrogated and where necessary amended. The amended criteria are detailed in Table 4 and the actual
change in each score and the associated justification is included in Appendix A3.
Table 4: Overview of amendments by stakeholders to each criterion and sub-criterion
Criterion Sub-criterion Proposed amendments by
stakeholders
Position of resource
unit within IUA Scores for two RUs were adjusted.
Importance for users
(Current & anticipated
future use)
Resource units which provide important
cultural services to society
A number of scores were adjusted based
on local knowledge.
Resource units which are important in
supporting livelihoods of significant
vulnerable communities
A number of scores were adjusted based
on local knowledge.
Resource units which are important in
meeting strategic requirements and
international obligations
Numerous scores were adjusted as
stakeholders indicated that strategic water
is sourced from the Komati and Vaal
which are not located within the WMA.
Resource units that provide supporting
and regulating services
A number of scores were adjusted based
on local knowledge.
Resource units most important in
supporting activities contributing to the
economy (GDP & job creation) in the
catchment (e.g. commercial agriculture,
industrial abstractions and bulk
abstractions by water authorities)
A number of scores were adjusted based
on local knowledge.
Threat posed to users Level of threat posed to users A number of scores were adjusted based
on local knowledge.
Ecological Importance
Resource units with a high or very high
EIS category
Scores for three RUs were adjusted
based on local knowledge.
Resource units which have an A/B NEC
and / or PES
Scores for two RUs were increased based
on local knowledge.
Resource units identified as National
Freshwater Ecosystem Priority Areas
These scores were not altered during the
stakeholder workshop.
Resource units identified as a priority in
provincial / fine scale aquatic biodiversity
plans
During the stakeholder engagement
workshop, local knowledge facilitated the
identification of additional areas that were
being protected. This new data was
incorporated into the amended RU
Prioritisation Tool.
Threat faced by
ecological component
of the RU
Level of threat posed to ecological
components of the resource unit
These scores were not altered during the
stakeholder workshop.
Management
Considerations
Resource units with PES lower than a D
Category or lower than the accepted
The scores for some RUs were increased
based on information from the PES-EIS
Determination of Resource Quality Objectives in the Olifants Water Management Area (WMA4) - WP10536
Resource Unit Prioritisation Report
10
Criterion Sub-criterion Proposed amendments by
stakeholders
gazetted category (NEC) study.
Practical
Considerations
Availability of EWR site data or other
monitoring data (RHP, DWAF gauging
weirs etc) located within reach?
These scores were not altered during the
stakeholder workshop.
Accessibility of resource unit for
monitoring
These scores were not altered during the
stakeholder workshop.
Safety risk associated with monitoring
resource units.
These scores were not altered during the
stakeholder workshop.
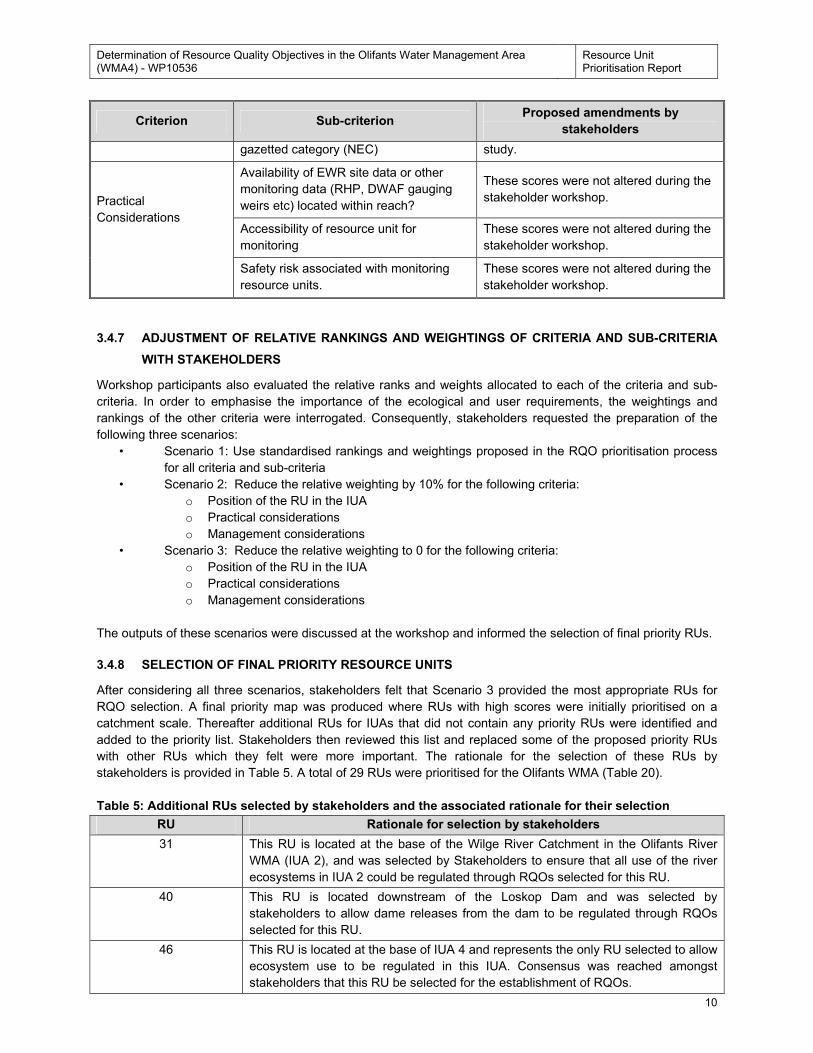
3.4.7 ADJUSTMENT OF RELATIVE RANKINGS AND WEIGHTINGS OF CRITERIA AND SUB-CRITERIA
WITH STAKEHOLDERS
Workshop participants also evaluated the relative ranks and weights allocated to each of the criteria and sub-
criteria. In order to emphasise the importance of the ecological and user requirements, the weightings and
rankings of the other criteria were interrogated. Consequently, stakeholders requested the preparation of the
following three scenarios:
• Scenario 1: Use standardised rankings and weightings proposed in the RQO prioritisation process
for all criteria and sub-criteria
• Scenario 2: Reduce the relative weighting by 10% for the following criteria:
o Position of the RU in the IUA
o Practical considerations
o Management considerations
• Scenario 3: Reduce the relative weighting to 0 for the following criteria:
o Position of the RU in the IUA
o Practical considerations
o Management considerations
The outputs of these scenarios were discussed at the workshop and informed the selection of final priority RUs.
3.4.8 SELECTION OF FINAL PRIORITY RESOURCE UNITS
After considering all three scenarios, stakeholders felt that Scenario 3 provided the most appropriate RUs for
RQO selection. A final priority map was produced where RUs with high scores were initially prioritised on a
catchment scale. Thereafter additional RUs for IUAs that did not contain any priority RUs were identified and
added to the priority list. Stakeholders then reviewed this list and replaced some of the proposed priority RUs
with other RUs which they felt were more important. The rationale for the selection of these RUs by
stakeholders is provided in Table 5. A total of 29 RUs were prioritised for the Olifants WMA (Table 20).
Table 5: Additional RUs selected by stakeholders and the associated rationale for their selection
RU Rationale for selection by stakeholders
31 This RU is located at the base of the Wilge River Catchment in the Olifants River
WMA (IUA 2), and was selected by Stakeholders to ensure that all use of the river
ecosystems in IUA 2 could be regulated through RQOs selected for this RU.
40 This RU is located downstream of the Loskop Dam and was selected by
stakeholders to allow dame releases from the dam to be regulated through RQOs
selected for this RU.
46 This RU is located at the base of IUA 4 and represents the only RU selected to allow
ecosystem use to be regulated in this IUA. Consensus was reached amongst
stakeholders that this RU be selected for the establishment of RQOs.
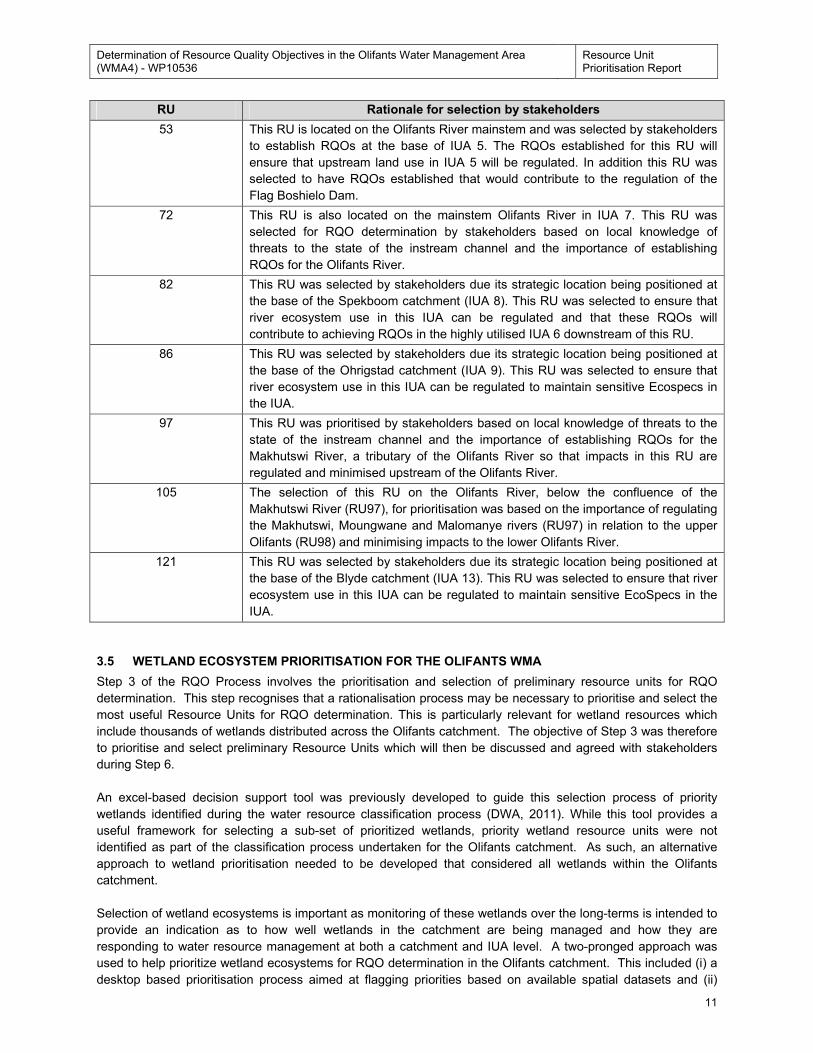
Determination of Resource Quality Objectives in the Olifants Water Management Area (WMA4) - WP10536
Resource Unit Prioritisation Report
11
RU Rationale for selection by stakeholders
53 This RU is located on the Olifants River mainstem and was selected by stakeholders
to establish RQOs at the base of IUA 5. The RQOs established for this RU will
ensure that upstream land use in IUA 5 will be regulated. In addition this RU was
selected to have RQOs established that would contribute to the regulation of the
Flag Boshielo Dam.
72 This RU is also located on the mainstem Olifants River in IUA 7. This RU was
selected for RQO determination by stakeholders based on local knowledge of
threats to the state of the instream channel and the importance of establishing
RQOs for the Olifants River.
82 This RU was selected by stakeholders due its strategic location being positioned at
the base of the Spekboom catchment (IUA 8). This RU was selected to ensure that
river ecosystem use in this IUA can be regulated and that these RQOs will
contribute to achieving RQOs in the highly utilised IUA 6 downstream of this RU.
86 This RU was selected by stakeholders due its strategic location being positioned at
the base of the Ohrigstad catchment (IUA 9). This RU was selected to ensure that
river ecosystem use in this IUA can be regulated to maintain sensitive Ecospecs in
the IUA.
97 This RU was prioritised by stakeholders based on local knowledge of threats to the
state of the instream channel and the importance of establishing RQOs for the
Makhutswi River, a tributary of the Olifants River so that impacts in this RU are
regulated and minimised upstream of the Olifants River.
105 The selection of this RU on the Olifants River, below the confluence of the
Makhutswi River (RU97), for prioritisation was based on the importance of regulating
the Makhutswi, Moungwane and Malomanye rivers (RU97) in relation to the upper
Olifants (RU98) and minimising impacts to the lower Olifants River.
121 This RU was selected by stakeholders due its strategic location being positioned at
the base of the Blyde catchment (IUA 13). This RU was selected to ensure that river
ecosystem use in this IUA can be regulated to maintain sensitive EcoSpecs in the
IUA.
3.5 WETLAND ECOSYSTEM PRIORITISATION FOR THE OLIFANTS WMA
Step 3 of the RQO Process involves the prioritisation and selection of preliminary resource units for RQO
determination. This step recognises that a rationalisation process may be necessary to prioritise and select the
most useful Resource Units for RQO determination. This is particularly relevant for wetland resources which
include thousands of wetlands distributed across the Olifants catchment. The objective of Step 3 was therefore
to prioritise and select preliminary Resource Units which will then be discussed and agreed with stakeholders
during Step 6.
An excel-based decision support tool was previously developed to guide this selection process of priority
wetlands identified during the water resource classification process (DWA, 2011). While this tool provides a
useful framework for selecting a sub-set of prioritized wetlands, priority wetland resource units were not
identified as part of the classification process undertaken for the Olifants catchment. As such, an alternative
approach to wetland prioritisation needed to be developed that considered all wetlands within the Olifants
catchment.
Selection of wetland ecosystems is important as monitoring of these wetlands over the long-terms is intended to
provide an indication as to how well wetlands in the catchment are being managed and how they are
responding to water resource management at both a catchment and IUA level. A two-pronged approach was
used to help prioritize wetland ecosystems for RQO determination in the Olifants catchment. This included (i) a
desktop based prioritisation process aimed at flagging priorities based on available spatial datasets and (ii)
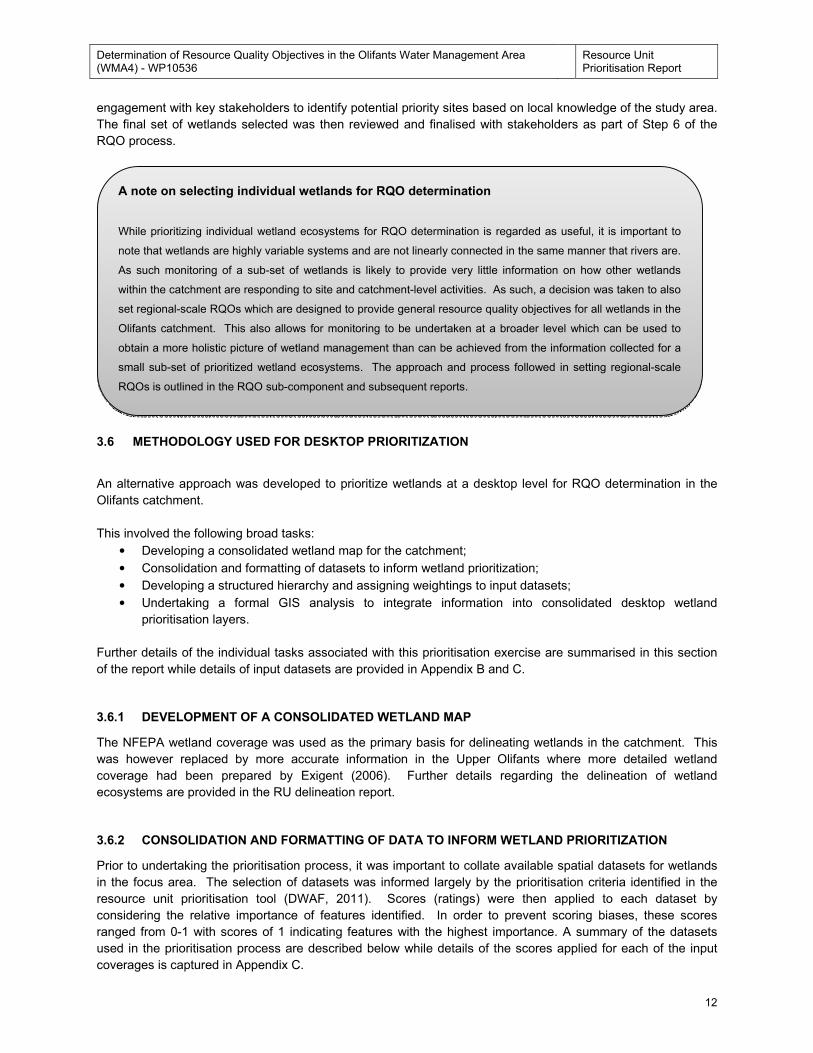
Determination of Resource Quality Objectives in the Olifants Water Management Area (WMA4) - WP10536
Resource Unit Prioritisation Report
12
engagement with key stakeholders to identify potential priority sites based on local knowledge of the study area.
The final set of wetlands selected was then reviewed and finalised with stakeholders as part of Step 6 of the
RQO process.
3.6 METHODOLOGY USED FOR DESKTOP PRIORITIZATION
An alternative approach was developed to prioritize wetlands at a desktop level for RQO determination in the
Olifants catchment.
This involved the following broad tasks:
• Developing a consolidated wetland map for the catchment;
• Consolidation and formatting of datasets to inform wetland prioritization;
• Developing a structured hierarchy and assigning weightings to input datasets;
• Undertaking a formal GIS analysis to integrate information into consolidated desktop wetland
prioritisation layers.
Further details of the individual tasks associated with this prioritisation exercise are summarised in this section
of the report while details of input datasets are provided in Appendix B and C.
3.6.1 DEVELOPMENT OF A CONSOLIDATED WETLAND MAP
The NFEPA wetland coverage was used as the primary basis for delineating wetlands in the catchment. This
was however replaced by more accurate information in the Upper Olifants where more detailed wetland
coverage had been prepared by Exigent (2006). Further details regarding the delineation of wetland
ecosystems are provided in the RU delineation report.
3.6.2 CONSOLIDATION AND FORMATTING OF DATA TO INFORM WETLAND PRIORITIZATION
Prior to undertaking the prioritisation process, it was important to collate available spatial datasets for wetlands
in the focus area. The selection of datasets was informed largely by the prioritisation criteria identified in the
resource unit prioritisation tool (DWAF, 2011). Scores (ratings) were then applied to each dataset by
considering the relative importance of features identified. In order to prevent scoring biases, these scores
ranged from 0-1 with scores of 1 indicating features with the highest importance. A summary of the datasets
used in the prioritisation process are described below while details of the scores applied for each of the input
coverages is captured in Appendix C.
A note on selecting individual wetlands for RQO determination
While prioritizing individual wetland ecosystems for RQO determination is regarded as useful, it is important to
note that wetlands are highly variable systems and are not linearly connected in the same manner that rivers are.
As such monitoring of a sub-set of wetlands is likely to provide very little information on how other wetlands
within the catchment are responding to site and catchment-level activities. As such, a decision was taken to also
set regional-scale RQOs which are designed to provide general resource quality objectives for all wetlands in the
Olifants catchment. This also allows for monitoring to be undertaken at a broader level which can be used to
obtain a more holistic picture of wetland management than can be achieved from the information collected for a
small sub-set of prioritized wetland ecosystems. The approach and process followed in setting regional-scale
RQOs is outlined in the RQO sub-component and subsequent reports.
Determination of Resource Quality Objectives in the Olifants Water Management Area (WMA4) - WP10536
Resource Unit Prioritisation Report
13
3.6.3 POSITION OF RESOURCE UNIT WITHIN THE IUA
Resource Units on large mainstem rivers at the downstream end of the IUAs are located at the edge of socio-
economic zones where user requirements are likely to differ. Such Resource Units also aggregate the upstream
impacts from the entire IUA and can therefore be a useful gauge of the success of upstream management
activities. In the case of wetlands, large river-linked wetlands (valley bottoms & floodplains) may therefore be
useful candidates for selection. A GIS coverage was therefore created by selecting and rating the relative
usefulness of wetlands along mainstem rivers within the Olifants catchment.
3.6.4 CONCERN FOR USERS
The importance of wetlands from a user perspective is based on the joint-consideration of the importance of
wetlands in supporting user requirements and the threat posed to such resources. The rationale is therefore
that those wetland that are highly important and under threat should be targeted for RQO determination above
other wetland units. Details of the criteria used to assess these criteria are detailed below.
3.6.5 IMPORTANCE TO USERS (CURRENT & ANTICIPATED FUTURE)
This assessment was designed to consider both current and anticipated future use. A number of sub-criteria
relevant to different user considerations were included in the assessment and are detailed below.
Resource Units which provide cultural services
Cultural services are less tangible than material services but nonetheless may be highly valued by society.
Relevant benefits may include recreational use, tourism or scientific benefits, and aesthetic, cultural or spiritual
values. Resource Units which provide these benefits should be protected as they contribute to the wellbeing of
society. User groups for which this service is likely to be particularly important include subsistence users,
recreation and tourism and real estate and property owners/developers. In the case of the Olifants catchment,
the following datasets were used to obtain an indication of the potential importance of wetlands in providing
cultural services:
• Important Bird Areas: The purpose of the IBA Programme is to identify and protect a network of sites,
at a biogeographical scale, critical for the long-term viability of naturally-occurring bird populations.
Such sites are targeted for research and birding activities.
• Ramsar sites: Ramsar sites have been identified based on unique site attributes that emphasise their
conservation value at both a National and International level.
• Formally Protected Areas: Formal conservation areas are also typically the focus of tourism, research
and education activities. Wetlands within these areas are therefore likely to contribute towards these
cultural values.
Note that wetlands that are likely to be important from a cultural perspective for subsistence users were not
specifically identified. Such wetlands are however likely to be linked with vulnerable communities and would
therefore be covered by that criteria.
Resource Units which support the livelihoods of significant vulnerable communities
Many poor communities are directly reliant on wetlands for domestic water use, food, grazing, medicine, and
building materials. Poor communities are particularly vulnerable to wetland degradation as these changes affect
their livelihoods directly. The level of vulnerability determines the degree of impact caused by changes in the
level of service provision. Resource units which support significant vulnerable communities should therefore be
prioritised. The following datasets were used to identify and rank regions in terms of the likely reliance of
communities on wetland resources:
• Statistics South Africa Census Data: Poorer communities are likely to be more reliant on natural
resources that more affluent communities. Income levels therefore provide a useful indicator of areas in
which reliance on natural resources (including those available from wetlands) is likely to be higher.
Population density is also a useful indicator, with higher levels of reliance anticipated in areas with
higher population densities. Dwelling type also provides useful information and can be used to
differentiate between rural communities (e.g. living in huts) and more formal housing which would
suggest more affluent communities.
Determination of Resource Quality Objectives in the Olifants Water Management Area (WMA4) - WP10536
Resource Unit Prioritisation Report
14
• Climatic conditions: Reliance of communities on water provision from water resources (including
wetlands) is likely to be particularly high in situations where rainfall variability is high and where there
are prolonged periods of no rainfall. The number of months without rainfall (available at a quaternary
catchment level) therefore provides another useful indicator of potential community reliance on wetland
resources.
Resource Units used for strategic requirements or international obligations
Resource Units which are used for strategic purposes or are important in meeting international obligations
should be prioritised to ensure that obligations are met. International obligations are linked to river flows in this
case, with no specific focus on wetlands1. As such, this criterion was excluded from the prioritisation process.
Resource Units which provide supporting and regulating services
Regulating and supporting services provided by wetlands include flood attenuation, stream flow regulation,
sediment trapping, erosion control, water quality enhancement and carbon storage. Assessing the relative
importance of wetlands in providing these services is not easily achieved at a desktop level and is influenced by
the ability of the wetland to supply these services (determined by wetland attributes) and the demand for these
services (determined by catchment context and surrounding land use). An attempt has been made to rate the
potential importance of wetlands in providing a sub-set of these regulating and supporting services using
available GIS datasets as outlined below:
Flood attenuation
• Supply of flood attenuation service: Wetland type provides a broad surrogate for the ability of different
wetlands to provide a flood attenuation function. Ranking of types was informed by WET-Ecoservices
(Kotze et. al., 2009).
• Demand for flood attenuation service: This is influenced by a range of factors including:
o Catchment slope: The greater the average slope of the catchment, the higher the likelihood of
increased runoff, particularly after heavy storm events.
o Runoff potential: The higher the runoff potential of soils in the catchment, the greater the
likelihood of elevated flows after heavy rains.
o Dams in catchment: Dams typically help to attenuate floods. Wetlands within catchments
characterised by high dam densities are therefore likely to be less important in providing this
service than wetlands located in catchments with low dam densities.
o Land use: Land use can also have a significant impact on storm flows by altering infiltration
capacities and increasing natural runoff levels. Catchments with high levels of urban
infrastructure and transformation are therefore more likely to be characterised by elevated flood
peaks.
o Rainfall intensity: Catchments characterised by intense rainfall events are likely to exhibit more
flashy flows with higher incidences of flooding.
This information had been summarised for the Olifants catchment at a quaternary catchment level as part of the
Wet-Win Project (IWMI, 2011) and was used to inform this assessment.
Sediment trapping and erosion control
• Supply of sediment trapping & erosion control services: Wetland type provides a broad surrogate for
the ability of different wetlands to provide a sediment trapping & erosion control function. Ranking of
types was informed by WET-Ecoservices (Kotze et. al., 2009).
• Demand for sediment trapping & erosion control services: This is influenced by a range of factors
including:
o Dams in catchment: Dams typically capture sediment from their receiving catchments this
reducing sediment loads in downstream water resources. Wetlands within catchments
characterised by high dam densities are therefore likely to be less important in providing this
service than wetlands located in catchments with low dam densities.
1 Note: The importance of Ramsar sites is recognised but is addressed under ecological aspects.
Determination of Resource Quality Objectives in the Olifants Water Management Area (WMA4) - WP10536
Resource Unit Prioritisation Report
15
o Sediment sources: The demand for this service is likely to be higher in catchments
characterised by high sediment sources in the catchment.
o Land use and erodibility: Catchments characterised by land uses that are typically
characterised by high levels of erosion are likely to contribute towards high sediment loads in
water resources. Wetlands in these catchments are therefore likely to be more important in
providing this service.
This information had been summarised for the Olifants catchment at a quaternary catchment level as part of the
Wet-Win Project (IWMI, 2011) and was used to inform this assessment.
Water quality enhancement:
• Supply of water quality enhancement service: Wetland type provides a broad surrogate for the ability of
different wetlands to provide a water quality enhancement function. Ranking of types was informed by
WET-Ecoservices (Kotze et. al., 2009).
• Demand for water quality enhancement services: This is influenced by the water quality entering
wetland resources. A range of surrogates can be used to obtain an indication of water quality impacts
including:
o Non-point source agriculture and irrigation: Water resources within catchments characterised
by high levels of agricultural activities are likely to be subject to higher levels of diffuse pollution
than wetlands within catchments with low levels of agricultural use.
o Mining activities: Mining activities are known to have a range of negative impacts on water
quality. Catchments characterised by a high proportion of mines are therefore likely to have
greater water quality problems than those with low levels of mining activity.
o Population density: This provides a surrogate for pressure on the environment and potential
negative impacts on water quality. Water resources in catchments characterised by high
population densities are therefore likely to be more impacted than those located in less
populated landscapes.
This information had been summarised for the Olifants catchment at a quaternary catchment level as part of the
Wet-Win Project (IWMI, 2011) and was used to inform this assessment.
Levels of Physico-Chemical impacts on water resources have also been subjectively assessed at a sub-
quaternary catchment scale as part of the desktop PES/EIS assessment (Kleynhans, 2013). This provides
another useful indicator of potential water quality impacts.
Resource Units which support activities which contribute to the economy
This criterion was not regarded as an important variable for wetlands in this case study and was excluded from
the prioritisation process.
3.6.6 THREAT POSED TO USERS
This assessment should consider the risk of the water resource to users in each resource unit. Resource units
which are threatened or are likely to be threatened by current or planned future activities (e.g. mines, towns,
industries, dams, intensive agriculture) should be monitored.
Threats have effectively been determined at a quaternary catchment level through the Wet-Win project (IWMI,
2011) which used available data to assess the potential impact of catchment-related activities on wetland
condition. Aspects considered as part of this assessment included:
• Hydrological threats which considered potential impacts associated with dams and withdrawals for
irrigation, bulk, rural and urban use;
• Geomorphological threats including potential reductions in sediment input from dams and increased
sediment inputs associated with various land uses;
• Modifications to wetland vegetation as a result of land uses in the catchment;
• The PES of rivers in the quaternary catchment; and
• The population density as a surrogate for potential water quality impacts.
Determination of Resource Quality Objectives in the Olifants Water Management Area (WMA4) - WP10536
Resource Unit Prioritisation Report
16
These threats were integrated into a single score representing the anticipated levels of impact to wetlands within
each quaternary catchment (Scores ranged from 0 (no impact) to 10 (maximum impact)).
The PES/EIS project (Kleynhans, 2013) also provides ratings for a suite of criteria that provides an indication of
current pressures on aquatic resources. The most relevant from a wetland perspective which were used to
inform the prioritisation process include:
• Riparian – Wetland Zone Modification;
• Potential Flow Modification; and
• Potential Physico-Chemical modifying activities.
These threat scores were integrated to provide another surrogate measure of threats facing wetland
ecosystems. Scores from this and the Wet-Win datasets were then integrated to provide an indication of
pressures facing wetlands across the study area.
3.6.7 ASSESSMENT OF THE IMPORTANCE OF EACH RESOURCE UNIT TO ECOLOGICAL
COMPONENTS
As with anthropogenic users, there are a range of attributes that affect the importance of setting RQOs for
different Resource Units. In order to help highlight Resource Units that are important from an ecological
perspective, four sub-criteria were proposed in the RQO manual:
• Ecological Importance and Sensitivity (EIS) Categories
• Present Ecological State (PES) and Recommended Ecological Category (REC)
• National Freshwater Ecosystem Priority Areas; and
• Priority habitats / species identified in provincial conservation plans.
Available datasets were reviewed and used to develop a suite of GIS coverages indicating the importance of
wetlands from an ecological perspective. The approach and rationale followed is briefly described here.
3.6.8 ENVIRONMENTAL CONCERN
The importance of wetlands from a conservation perspective is based on the joint-consideration of the
ecological importance and sensitivity of wetlands and the threat posed to such resources. The rationale is
therefore that those wetland that are highly important and under threat should be targeted for RQO
determination above other wetland units. Details of the criteria used to assess these criteria are detailed below,
Ecological importance and sensitivity
Resource Units with high or very high Ecological Importance and Sensitivity Category require special attention
to prevent deterioration of these resource units. These areas are considered vital for protecting important or
sensitive species and maintaining aquatic biodiversity.
An assessment of the ecological importance and sensitivity of wetlands within the Olifants catchment was
informed by a range of available datasets. This included:
• Protection status of the wetland: Wetlands falling within protected areas (including Ramsar sites)
contribute towards the long-term protection of ecosystems and species.
• Threat status of the wetland vegetation group: Threat status of wetland vegetation groups have
been determined as part of the National Freshwater Ecosystem Priority Areas (NFEPA) project. The
threat status of the wetland vegetation group is based on levels of transformation and protection of
wetland ecosystems with similar characteristics. Wetlands occurring within a threatened wetland group
are regarded as having a greater ecological importance than those occurring within wetland vegetation
groups of lower threat status.
• Importance associated with wetlands in the catchment: The importance of threatened taxa was
assessed by experts for river reaches at a desktop level as part of the desktop PES/EIS assessment
(DWA, 2013). This provides another level of information on ecological importance that was integrated
into this assessment.
Determination of Resource Quality Objectives in the Olifants Water Management Area (WMA4) - WP10536
Resource Unit Prioritisation Report
17
• Sensitivity to changes in floods: Floodplains are regarded as most sensitive, followed by valley
bottoms, seeps and pans. This was therefore evaluating by linking sensitivity to wetland type
information.
• Sensitivity to changes in low flows / dry season: Unchannelled valley bottom wetlands are regarded
as most sensitive, followed by seeps and other wetland types. This was therefore evaluating by linking
sensitivity to wetland type information.
Intolerance to water level / flow changes: Vertebrate taxon (excluding fish) and vegetation that are sensitive
/ intolerant to water level changes were assessed at a desktop level as part of the desktop PES/EIS process
(DWA, 2012). Relevant attributes were therefore extracted from this dataset to inform this assessment.
Resource Units which have an A/B NEC and /or PES
Resource Units with an A/B PES or an agreed A/B NEC (in the case where Water Resource Classification has
been undertaken) need to be carefully managed to prevent deterioration of these reaches. This is particularly
relevant given the poor state of South Africa’s rivers and the need to protect aquatic biodiversity. PES was
based on information available in the Wetland FEPA coverage and that provided in the Exigent dataset.
Resource Units which have been identified as a National Freshwater Ecosystem Priority Area
Resource Units identified as National Freshwater Ecosystem Priority Areas have been identified using spatial
modelling and expert review. Such areas are regarded as priorities for protection and monitoring from an
ecological perspective. A range of datasets were used and include:
• Wetland FEPA datasets: A range of important data is available in this coverage which was used to
select priority wetlands for protection. This includes data on important wetlands in Mpumalanga;
wetlands prioritised by experts for their biodiversity importance and wetlands occurring in proximity to a
range of recorded threatened species. For the purposes of this assessment, two attributes are
regarded as most important:
o Rank: Wetlands were ranked (1=most important to 6=least important) in terms of their
importance. This provides a useful basis for comparing the relative importance of wetlands in
contributing towards biodiversity objectives.
o WETFEPA: Here, priority wetlands have been selected to meet national wetland conservation
targets.
• Wetland clusters: Wetland clusters are groups of wetlands within 1 km of each other and embedded
in a relatively natural landscape. This allows for important ecological processes such as migration of
frogs and insects between wetlands.
• FEPA Catchments: FEPAs support the biodiversity sector’s input into the development of Catchment
Management Strategies and into the Water Resource Classification process2. This database including
FEPAs, RehabFEPAs, Fish Support Areas and Upstream management areas therefore highlights
catchments where water resource management (including wetland management) is important to meet
biodiversity targets.
Resource Units which have been identified as a priority in provincial aquatic systematic conservation
plans
NFEPA datasets are regarded as providing an adequate representation of priority areas identified through a
systematic conservation planning approach. Provincial-level aquatic conservation plans were therefore not
used as part of this prioritisation exercise.
3.6.9 LEVEL OF THREAT POSED TO WATER RESOURCE QUALITY FOR THE ENVIRONMENT
Resource units which are threatened or are likely to be threatened by current or planned future upstream
activities (e.g. mines, towns, industries, dams, intensive agriculture) should be monitored due to the potential
risk posed to ecological elements of the water resource. Threats to wetland resources have already been
assessed (See Section 2.2.2) and were used again here.
2 Note that the FEPA datasets have effectively replaced the previous Aquatic Conservation Plan previously used to identify
conservation priorities in Mpumulanga (Mervyn Lotter, Pers. comm..)
Determination of Resource Quality Objectives in the Olifants Water Management Area (WMA4) - WP10536
Resource Unit Prioritisation Report
18
3.6.10 IDENTIFYING RESOURCE UNITS FOR WHICH MANAGEMENT ACTION SHOULD BE
PRIORITISED
In the case of rivers, priority is given to river reaches where the PES is lower than a D category which needs to
be improved. This is not regarded as a critical requirement for prioritizing wetland resources. By contrast,
monitoring should probably rather focus on remaining intact systems.
3.6.11 ASSESSING PRACTICAL CONSIDERATIONS ASSOCIATED WITH RQO DETERMINATION FOR
EACH RESOURCE UNIT
Apart from the criteria already considered, there are additional practical considerations which are worth
considering during the Resource Unit prioritisation process. These include the availability of data to inform RQO
determination and practical constraints associated with accessibility and security risks. In the case of wetlands,
the availability of data is a key consideration. Unfortunately much wetland information resides with mining
companies and consultants and there was not sufficient time to try and consolidate such information. Sites that
have been prioritised and worked on by Working for Wetlands do typically have baseline wetland data and
therefore could act as useful sites. Wetlands associated with WFWetlands activities were therefore highlighted
together with those associated with DWA monitoring and EWR sites.
3.6.12 EVALUATING THE RELATIVE RANKING AND WEIGHTING OF EACH CRITERION
Once available datasets were collated, the ranking and relative weighting of various criteria and sub-criteria
were re-evaluated. Decision Analyst (Queensland Government Department of Natural Resources and Mines,
2005) was used to assist in ranking the various input criteria. This was done by first developing a simple
structured hierarchy reflecting the relationships between various variables (Figure 1). AHP Pairwise analysis
was then used to make pair-wise comparisons of the all elements in the same level of the hierarchy which
allowed input criteria to be objectively rated against one another based on the perceived accuracy and
relevance of the various input datasets. The resultant scores were used to assign weightings to the various
input layers as detailed in Appendix E of this report.
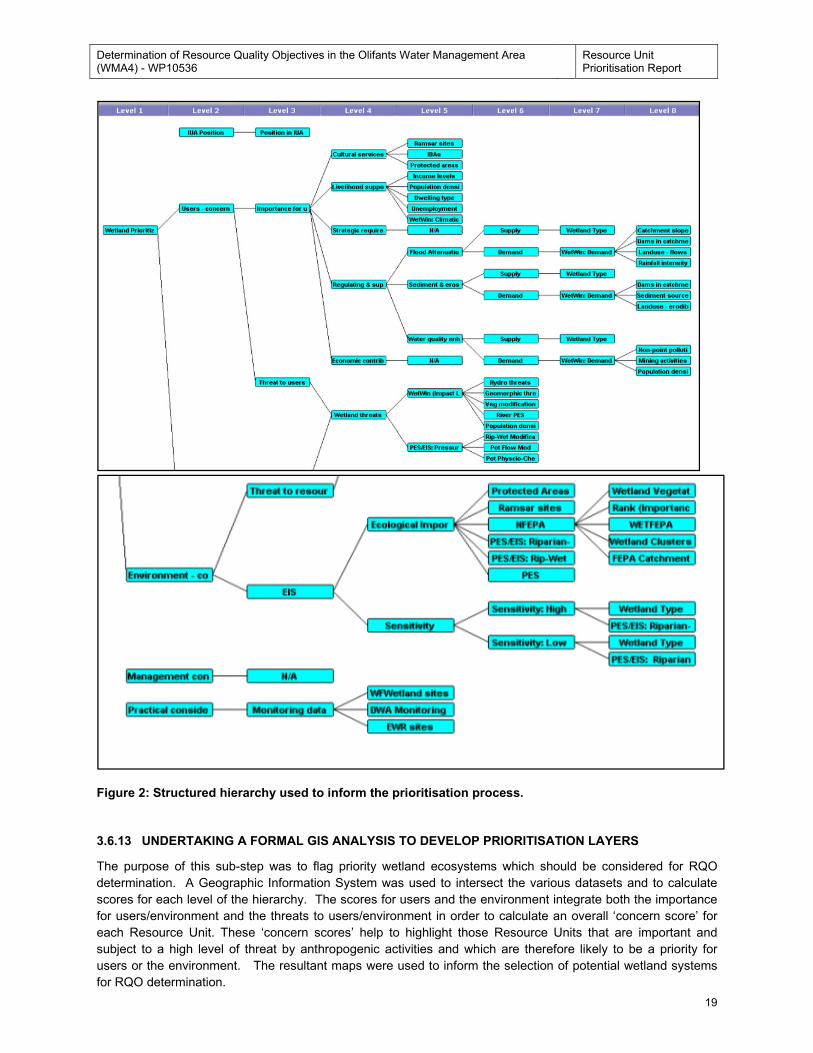
Determination of Resource Quality Objectives in the Olifants Water Management Area (WMA4) - WP10536
Resource Unit Prioritisation Report
19
Figure 2: Structured hierarchy used to inform the prioritisation process.
3.6.13 UNDERTAKING A FORMAL GIS ANALYSIS TO DEVELOP PRIORITISATION LAYERS
The purpose of this sub-step was to flag priority wetland ecosystems which should be considered for RQO
determination. A Geographic Information System was used to intersect the various datasets and to calculate
scores for each level of the hierarchy. The scores for users and the environment integrate both the importance
for users/environment and the threats to users/environment in order to calculate an overall ‘concern score’ for
each Resource Unit. These ‘concern scores’ help to highlight those Resource Units that are important and
subject to a high level of threat by anthropogenic activities and which are therefore likely to be a priority for
users or the environment. The resultant maps were used to inform the selection of potential wetland systems
for RQO determination.
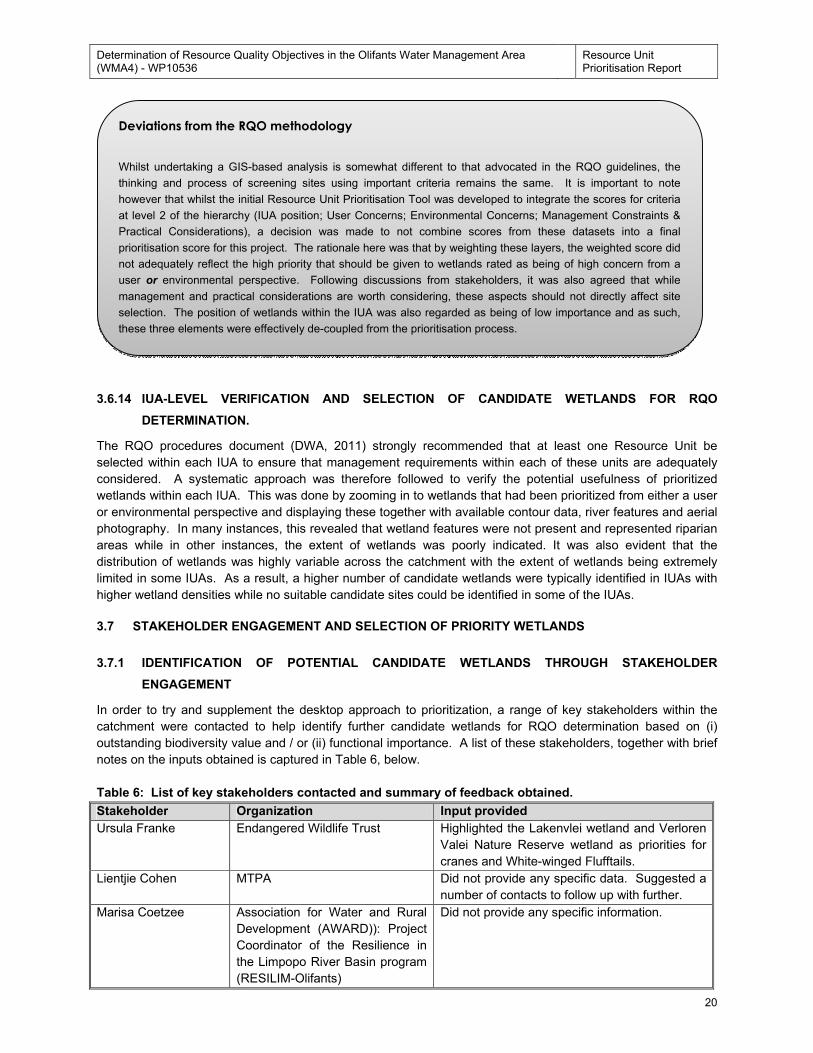
Determination of Resource Quality Objectives in the Olifants Water Management Area (WMA4) - WP10536
Resource Unit Prioritisation Report
20
3.6.14 IUA-LEVEL VERIFICATION AND SELECTION OF CANDIDATE WETLANDS FOR RQO
DETERMINATION.
The RQO procedures document (DWA, 2011) strongly recommended that at least one Resource Unit be
selected within each IUA to ensure that management requirements within each of these units are adequately
considered. A systematic approach was therefore followed to verify the potential usefulness of prioritized
wetlands within each IUA. This was done by zooming in to wetlands that had been prioritized from either a user
or environmental perspective and displaying these together with available contour data, river features and aerial
photography. In many instances, this revealed that wetland features were not present and represented riparian
areas while in other instances, the extent of wetlands was poorly indicated. It was also evident that the
distribution of wetlands was highly variable across the catchment with the extent of wetlands being extremely
limited in some IUAs. As a result, a higher number of candidate wetlands were typically identified in IUAs with
higher wetland densities while no suitable candidate sites could be identified in some of the IUAs.
3.7 STAKEHOLDER ENGAGEMENT AND SELECTION OF PRIORITY WETLANDS
3.7.1 IDENTIFICATION OF POTENTIAL CANDIDATE WETLANDS THROUGH STAKEHOLDER
ENGAGEMENT
In order to try and supplement the desktop approach to prioritization, a range of key stakeholders within the
catchment were contacted to help identify further candidate wetlands for RQO determination based on (i)
outstanding biodiversity value and / or (ii) functional importance. A list of these stakeholders, together with brief
notes on the inputs obtained is captured in Table 6, below.
Table 6: List of key stakeholders contacted and summary of feedback obtained.
Stakeholder Organization Input provided
Ursula Franke Endangered Wildlife Trust Highlighted the Lakenvlei wetland and Verloren
Valei Nature Reserve wetland as priorities for
cranes and White-winged Flufftails.
Lientjie Cohen MTPA Did not provide any specific data. Suggested a
number of contacts to follow up with further.
Marisa Coetzee Association for Water and Rural
Development (AWARD)): Project
Coordinator of the Resilience in
the Limpopo River Basin program
(RESILIM-Olifants)
Did not provide any specific information.
Deviations from the RQO methodology
Whilst undertaking a GIS-based analysis is somewhat different to that advocated in the RQO guidelines, the
thinking and process of screening sites using important criteria remains the same. It is important to note
however that whilst the initial Resource Unit Prioritisation Tool was developed to integrate the scores for criteria
at level 2 of the hierarchy (IUA position; User Concerns; Environmental Concerns; Management Constraints &
Practical Considerations), a decision was made to not combine scores from these datasets into a final
prioritisation score for this project. The rationale here was that by weighting these layers, the weighted score did
not adequately reflect the high priority that should be given to wetlands rated as being of high concern from a
user or environmental perspective. Following discussions from stakeholders, it was also agreed that while
management and practical considerations are worth considering, these aspects should not directly affect site
selection. The position of wetlands within the IUA was also regarded as being of low importance and as such,
these three elements were effectively de-coupled from the prioritisation process.
Determination of Resource Quality Objectives in the Olifants Water Management Area (WMA4) - WP10536
Resource Unit Prioritisation Report
21
Stakeholder Organization Input provided
Charmaine Uys Birdlife South Africa Highlighted the importance of a number of
wetlands for bird conservation and provided
contact details for other key stakeholders.
Frank Webb BotSoc (Lowveld) Did not identify any priority wetlands but flagged
the Eastern MP Highveld as an important area
from a botanical perspective.
Anton Linström Wet-earth eco-specs Identified 12 potential candidate wetlands
based on his experience in working in the area.
Craig Whittington-
Jones
GDARD Provided documentation regarding the
importance of a number of wetlands for grass-
owl conservation.
Peter Ardurne FOSAF / Steenkampsberg
Environmental Initiative
No feedback obtained.
Mattheuns Pretorius Endangered Wildlife Trust Highlighted the importance of the Elandsvlei
pan systems for Grass-Owls and provide
supporting documentation.
Professor Ray Jansen Tshwane University of
Technology
He indicated that he was not familiar with the
Olifants catchment and would not be able to
contribute substantially to this project.
Ian Little Endangered Wildlife Trust No feedback obtained.
Frans Krige MTPA and Dullstroom Wildflower
Club
Emphasised the importance of Lakenvlei
Gary Marneweck Wetland Consulting Services Identified a range of priority wetlands in
consultation with his consulting team.
Hannes Marais MTPA Did not identify any priority sites but suggested
that Brian Morris be contacted for further
information.
Mervyn Lotter MTPA Indicated that priority wetlands had been
identified as part of the NFEPA project. No
additional spatial data was available.
Piet-Louis Grundling Ixhaphozi Enviro Services CC
(I.E.S)
No feedback obtained.
Brian Morris EnviroTeq No feedback obtained.
Allan Abel Witwatersrand orchid Society No feedback obtained.
Andre Beetge Working for Wetlands and head of
Mpumalanga Wetland Forum
Assisted in providing information on wetlands
systems where WFWetlands had undertaken
work in the past.
Graham Alexander WITS University Indicated that the catchment was not
particularly important for amphibians. No
priority sites were identified.
3.7.2 FINAL SELECTION OF PRIORITY SITES
Once potential candidate wetlands had been identified through these two different approaches, a stakeholder
workshop was arranged to finalise the list of priority sites and to continue with the sub-component and indicator
selection process. This was held on 27th and 28
th November 2013 and was attended by the following
stakeholders:
• Wietsche Roets (DWA);
• Valerie Killian (DWA);
• Namisha Muthraparsad (DWA);
• Anton Linström (Wet-earth eco-specs);
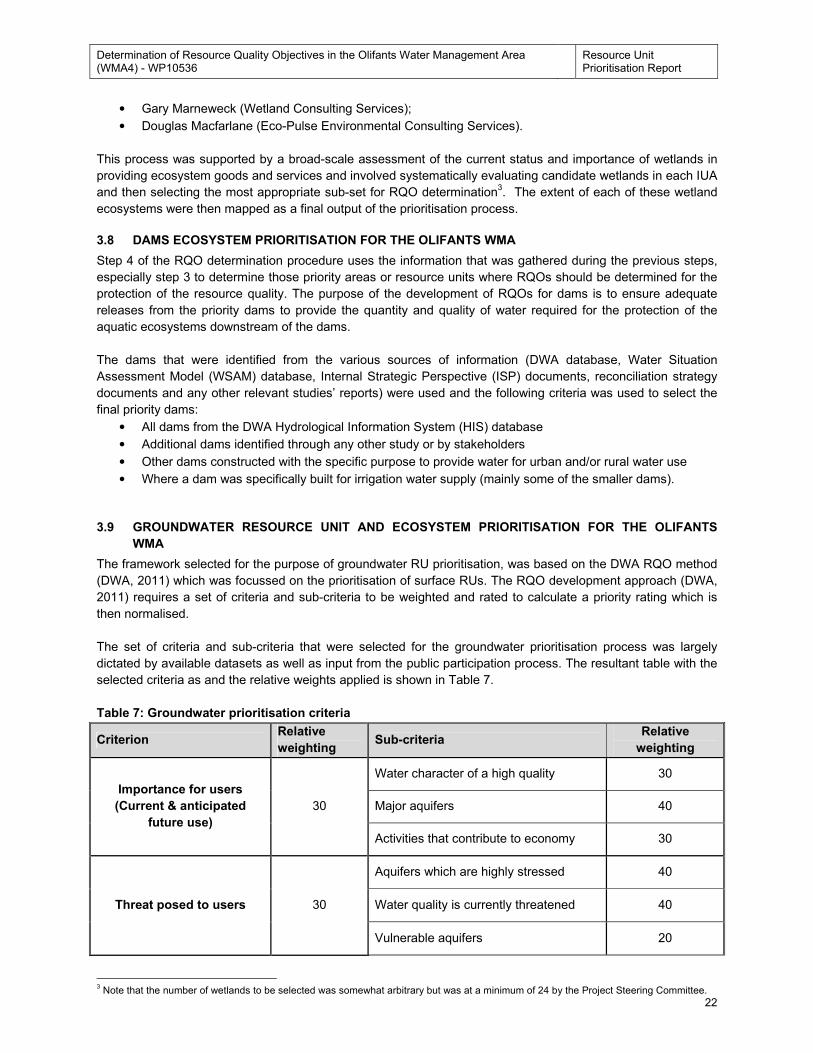
Determination of Resource Quality Objectives in the Olifants Water Management Area (WMA4) - WP10536
Resource Unit Prioritisation Report
22
• Gary Marneweck (Wetland Consulting Services);
• Douglas Macfarlane (Eco-Pulse Environmental Consulting Services).
This process was supported by a broad-scale assessment of the current status and importance of wetlands in
providing ecosystem goods and services and involved systematically evaluating candidate wetlands in each IUA
and then selecting the most appropriate sub-set for RQO determination3. The extent of each of these wetland
ecosystems were then mapped as a final output of the prioritisation process.
3.8 DAMS ECOSYSTEM PRIORITISATION FOR THE OLIFANTS WMA
Step 4 of the RQO determination procedure uses the information that was gathered during the previous steps,
especially step 3 to determine those priority areas or resource units where RQOs should be determined for the
protection of the resource quality. The purpose of the development of RQOs for dams is to ensure adequate
releases from the priority dams to provide the quantity and quality of water required for the protection of the
aquatic ecosystems downstream of the dams.
The dams that were identified from the various sources of information (DWA database, Water Situation
Assessment Model (WSAM) database, Internal Strategic Perspective (ISP) documents, reconciliation strategy
documents and any other relevant studies’ reports) were used and the following criteria was used to select the
final priority dams:
• All dams from the DWA Hydrological Information System (HIS) database
• Additional dams identified through any other study or by stakeholders
• Other dams constructed with the specific purpose to provide water for urban and/or rural water use
• Where a dam was specifically built for irrigation water supply (mainly some of the smaller dams).
3.9 GROUNDWATER RESOURCE UNIT AND ECOSYSTEM PRIORITISATION FOR THE OLIFANTS
WMA
The framework selected for the purpose of groundwater RU prioritisation, was based on the DWA RQO method
(DWA, 2011) which was focussed on the prioritisation of surface RUs. The RQO development approach (DWA,
2011) requires a set of criteria and sub-criteria to be weighted and rated to calculate a priority rating which is
then normalised.
The set of criteria and sub-criteria that were selected for the groundwater prioritisation process was largely
dictated by available datasets as well as input from the public participation process. The resultant table with the
selected criteria as and the relative weights applied is shown in Table 7.
Table 7: Groundwater prioritisation criteria
Criterion Relative
weighting Sub-criteria
Relative
weighting
Importance for users
(Current & anticipated
future use)
30
Water character of a high quality 30
Major aquifers 40
Activities that contribute to economy 30
Threat posed to users 30
Aquifers which are highly stressed 40
Water quality is currently threatened 40
Vulnerable aquifers 20
3 Note that the number of wetlands to be selected was somewhat arbitrary but was at a minimum of 24 by the Project Steering Committee.
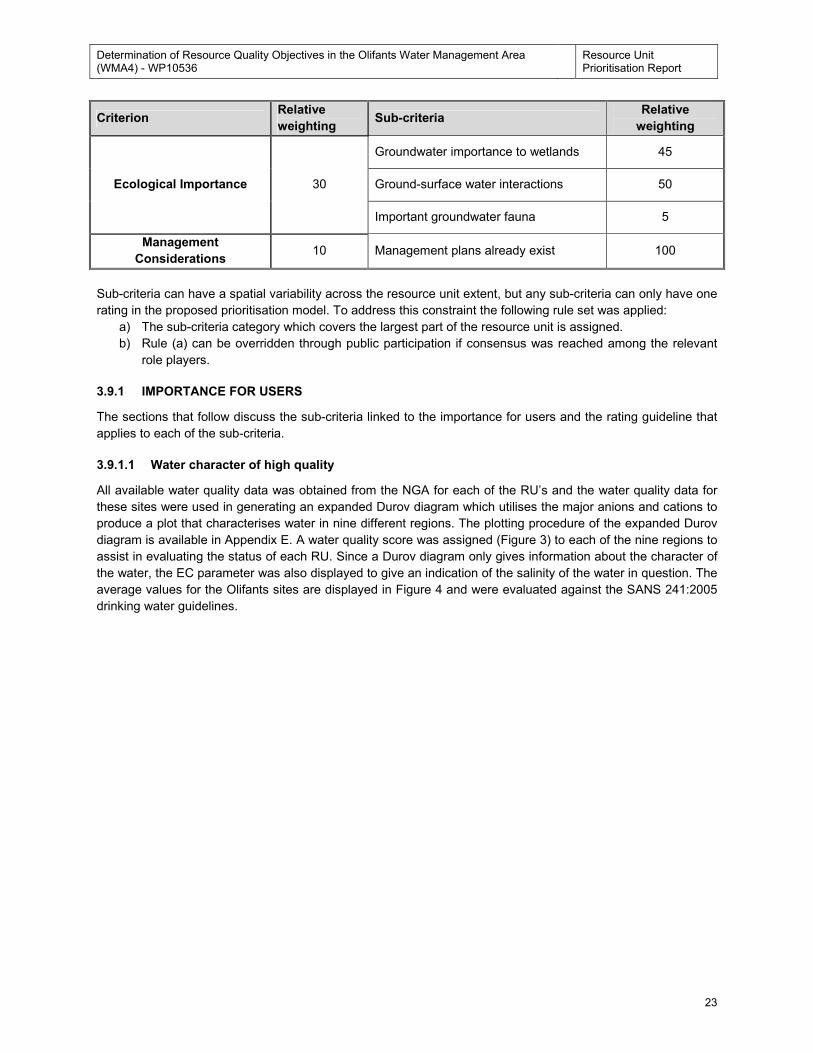
Determination of Resource Quality Objectives in the Olifants Water Management Area (WMA4) - WP10536
Resource Unit Prioritisation Report
23
Criterion Relative
weighting Sub-criteria
Relative
weighting
Ecological Importance 30
Groundwater importance to wetlands 45
Ground-surface water interactions 50
Important groundwater fauna 5
Management
Considerations 10 Management plans already exist 100
Sub-criteria can have a spatial variability across the resource unit extent, but any sub-criteria can only have one
rating in the proposed prioritisation model. To address this constraint the following rule set was applied:
a) The sub-criteria category which covers the largest part of the resource unit is assigned.
b) Rule (a) can be overridden through public participation if consensus was reached among the relevant
role players.
3.9.1 IMPORTANCE FOR USERS
The sections that follow discuss the sub-criteria linked to the importance for users and the rating guideline that
applies to each of the sub-criteria.
3.9.1.1 Water character of high quality
All available water quality data was obtained from the NGA for each of the RU’s and the water quality data for
these sites were used in generating an expanded Durov diagram which utilises the major anions and cations to
produce a plot that characterises water in nine different regions. The plotting procedure of the expanded Durov
diagram is available in Appendix E. A water quality score was assigned (Figure 3) to each of the nine regions to
assist in evaluating the status of each RU. Since a Durov diagram only gives information about the character of
the water, the EC parameter was also displayed to give an indication of the salinity of the water in question. The
average values for the Olifants sites are displayed in Figure 4 and were evaluated against the SANS 241:2005
drinking water guidelines.
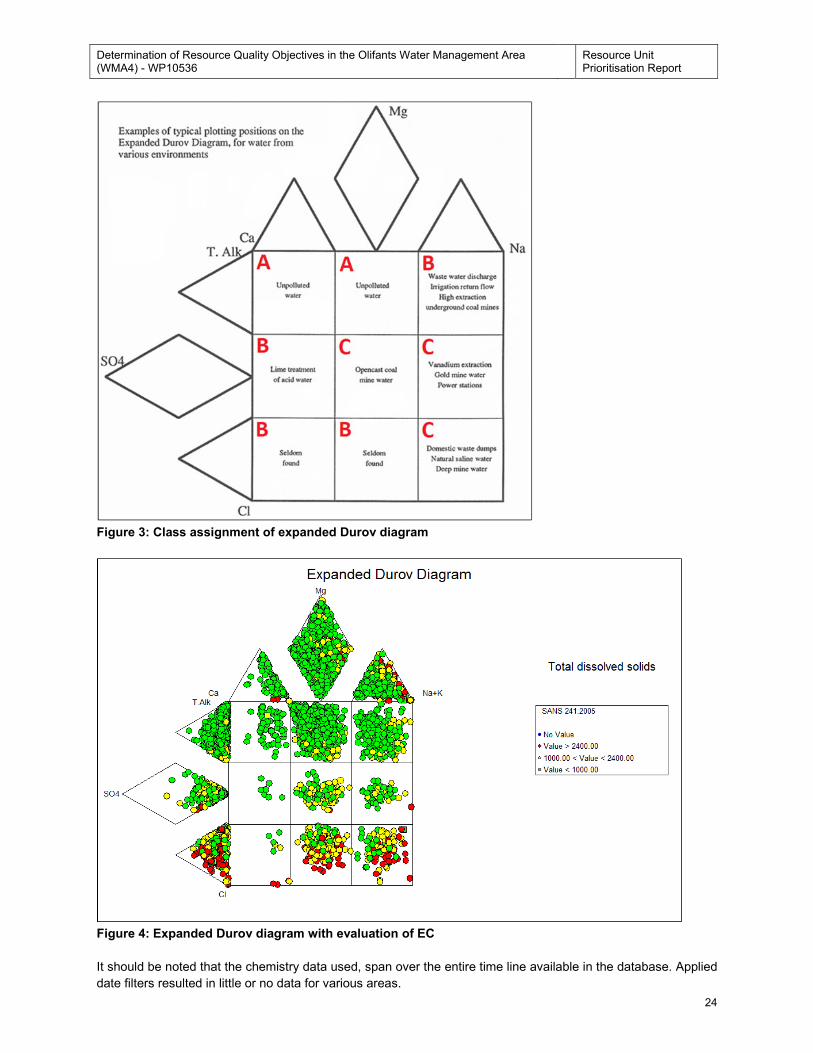
Determination of Resource Quality Objectives in the Olifants Water Management Area (WMA4) - WP10536
Resource Unit Prioritisation Report
24
Figure 3: Class assignment of expanded Durov diagram
Figure 4: Expanded Durov diagram with evaluation of EC
It should be noted that the chemistry data used, span over the entire time line available in the database. Applied
date filters resulted in little or no data for various areas.
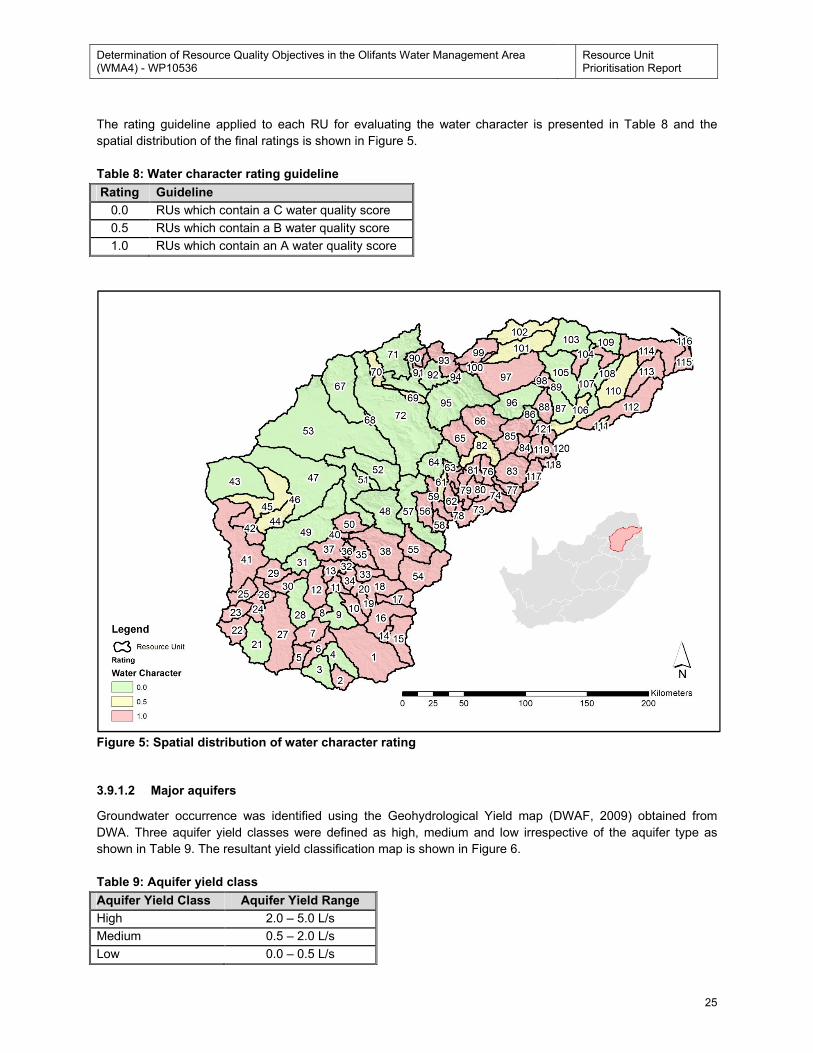
Determination of Resource Quality Objectives in the Olifants Water Management Area (WMA4) - WP10536
Resource Unit Prioritisation Report
25
The rating guideline applied to each RU for evaluating the water character is presented in Table 8 and the
spatial distribution of the final ratings is shown in Figure 5.
Table 8: Water character rating guideline
Rating Guideline
0.0 RUs which contain a C water quality score
0.5 RUs which contain a B water quality score
1.0 RUs which contain an A water quality score
Figure 5: Spatial distribution of water character rating
3.9.1.2 Major aquifers
Groundwater occurrence was identified using the Geohydrological Yield map (DWAF, 2009) obtained from
DWA. Three aquifer yield classes were defined as high, medium and low irrespective of the aquifer type as
shown in Table 9. The resultant yield classification map is shown in Figure 6.
Table 9: Aquifer yield class
Aquifer Yield Class Aquifer Yield Range
High 2.0 – 5.0 L/s
Medium 0.5 – 2.0 L/s
Low 0.0 – 0.5 L/s
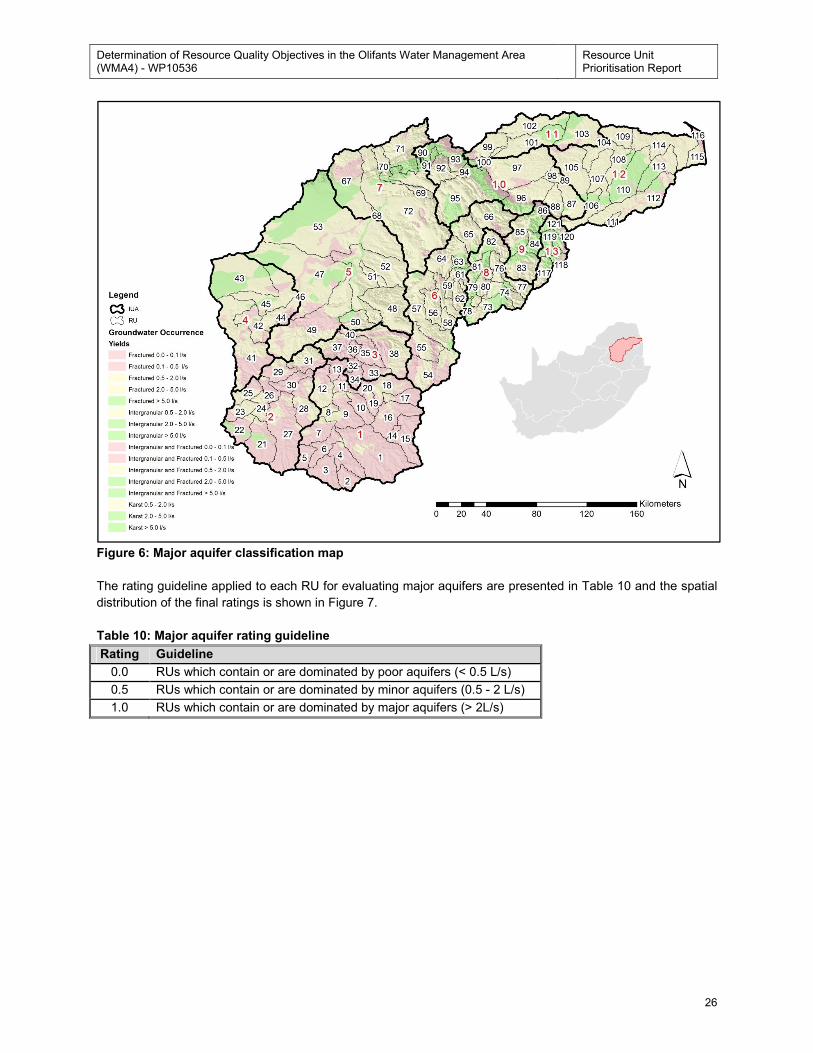
Determination of Resource Quality Objectives in the Olifants Water Management Area (WMA4) - WP10536
Resource Unit Prioritisation Report
26
Figure 6: Major aquifer classification map
The rating guideline applied to each RU for evaluating major aquifers are presented in Table 10 and the spatial
distribution of the final ratings is shown in Figure 7.
Table 10: Major aquifer rating guideline
Rating Guideline
0.0 RUs which contain or are dominated by poor aquifers (< 0.5 L/s)
0.5 RUs which contain or are dominated by minor aquifers (0.5 - 2 L/s)
1.0 RUs which contain or are dominated by major aquifers (> 2L/s)
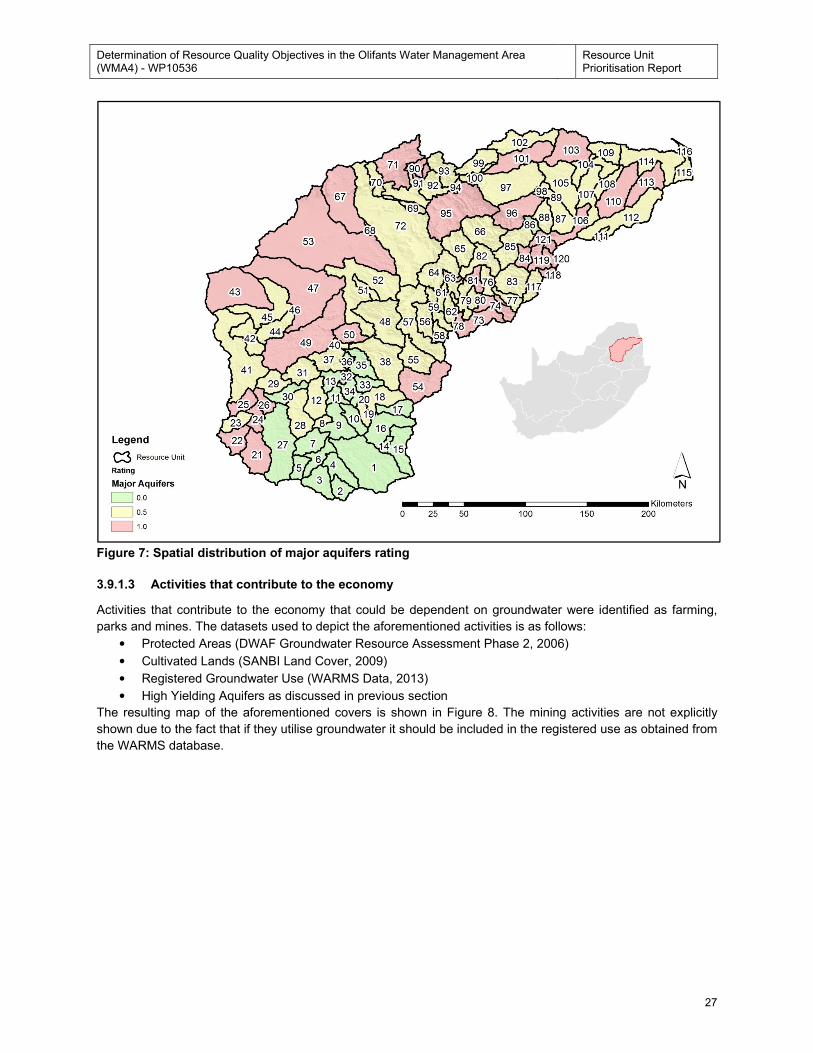
Determination of Resource Quality Objectives in the Olifants Water Management Area (WMA4) - WP10536
Resource Unit Prioritisation Report
27
Figure 7: Spatial distribution of major aquifers rating
3.9.1.3 Activities that contribute to the economy
Activities that contribute to the economy that could be dependent on groundwater were identified as farming,
parks and mines. The datasets used to depict the aforementioned activities is as follows:
• Protected Areas (DWAF Groundwater Resource Assessment Phase 2, 2006)
• Cultivated Lands (SANBI Land Cover, 2009)
• Registered Groundwater Use (WARMS Data, 2013)
• High Yielding Aquifers as discussed in previous section
The resulting map of the aforementioned covers is shown in Figure 8. The mining activities are not explicitly
shown due to the fact that if they utilise groundwater it should be included in the registered use as obtained from
the WARMS database.
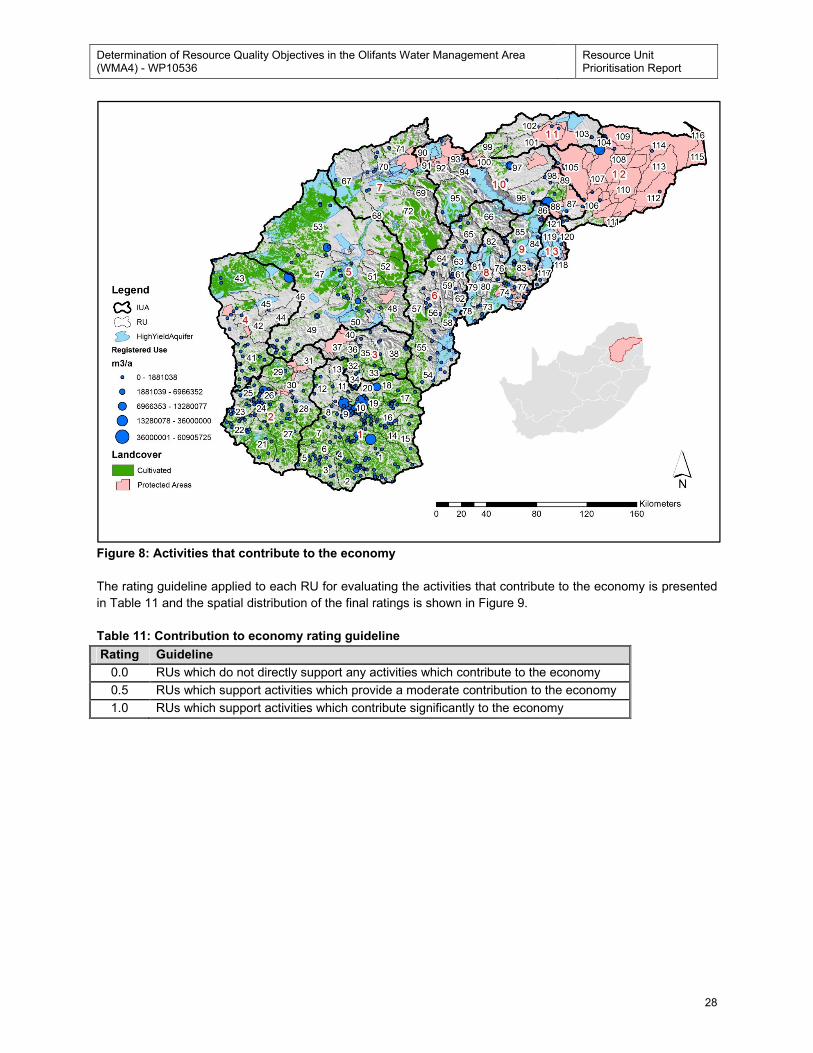
Determination of Resource Quality Objectives in the Olifants Water Management Area (WMA4) - WP10536
Resource Unit Prioritisation Report
28
Figure 8: Activities that contribute to the economy
The rating guideline applied to each RU for evaluating the activities that contribute to the economy is presented
in Table 11 and the spatial distribution of the final ratings is shown in Figure 9.
Table 11: Contribution to economy rating guideline
Rating Guideline
0.0 RUs which do not directly support any activities which contribute to the economy
0.5 RUs which support activities which provide a moderate contribution to the economy
1.0 RUs which support activities which contribute significantly to the economy
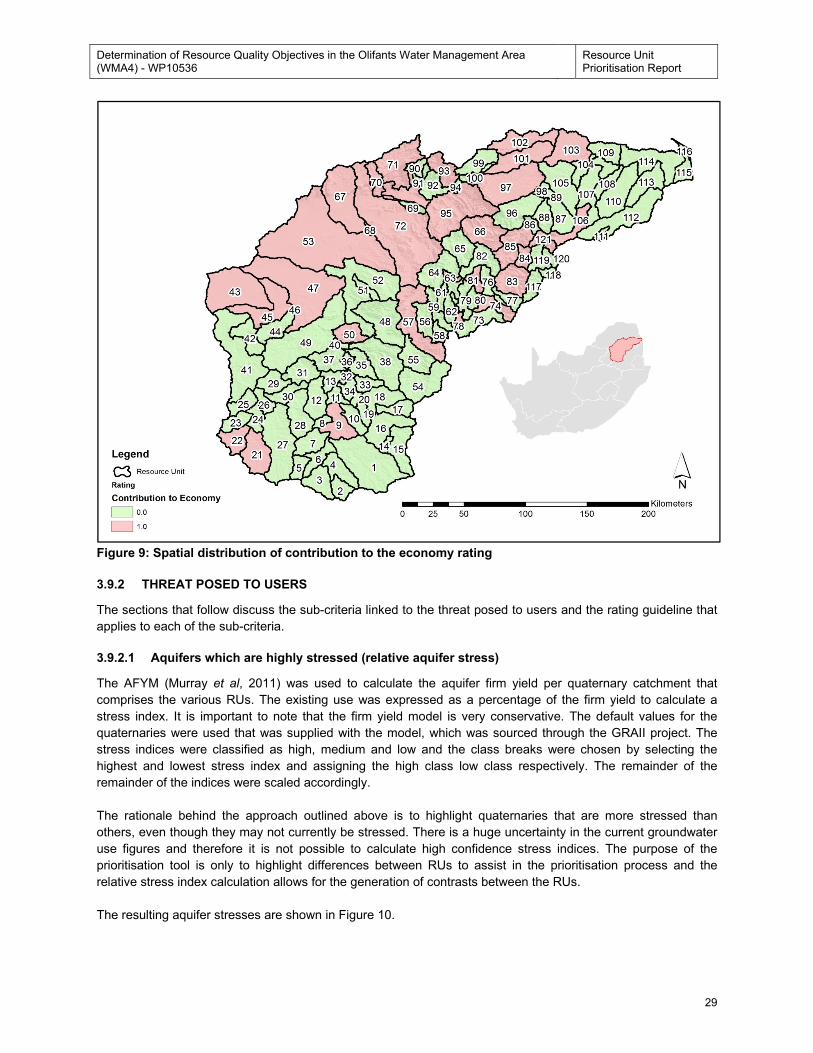
Determination of Resource Quality Objectives in the Olifants Water Management Area (WMA4) - WP10536
Resource Unit Prioritisation Report
29
Figure 9: Spatial distribution of contribution to the economy rating
3.9.2 THREAT POSED TO USERS
The sections that follow discuss the sub-criteria linked to the threat posed to users and the rating guideline that
applies to each of the sub-criteria.
3.9.2.1 Aquifers which are highly stressed (relative aquifer stress)
The AFYM (Murray et al, 2011) was used to calculate the aquifer firm yield per quaternary catchment that
comprises the various RUs. The existing use was expressed as a percentage of the firm yield to calculate a
stress index. It is important to note that the firm yield model is very conservative. The default values for the
quaternaries were used that was supplied with the model, which was sourced through the GRAII project. The
stress indices were classified as high, medium and low and the class breaks were chosen by selecting the
highest and lowest stress index and assigning the high class low class respectively. The remainder of the
remainder of the indices were scaled accordingly.
The rationale behind the approach outlined above is to highlight quaternaries that are more stressed than
others, even though they may not currently be stressed. There is a huge uncertainty in the current groundwater
use figures and therefore it is not possible to calculate high confidence stress indices. The purpose of the
prioritisation tool is only to highlight differences between RUs to assist in the prioritisation process and the
relative stress index calculation allows for the generation of contrasts between the RUs.
The resulting aquifer stresses are shown in Figure 10.
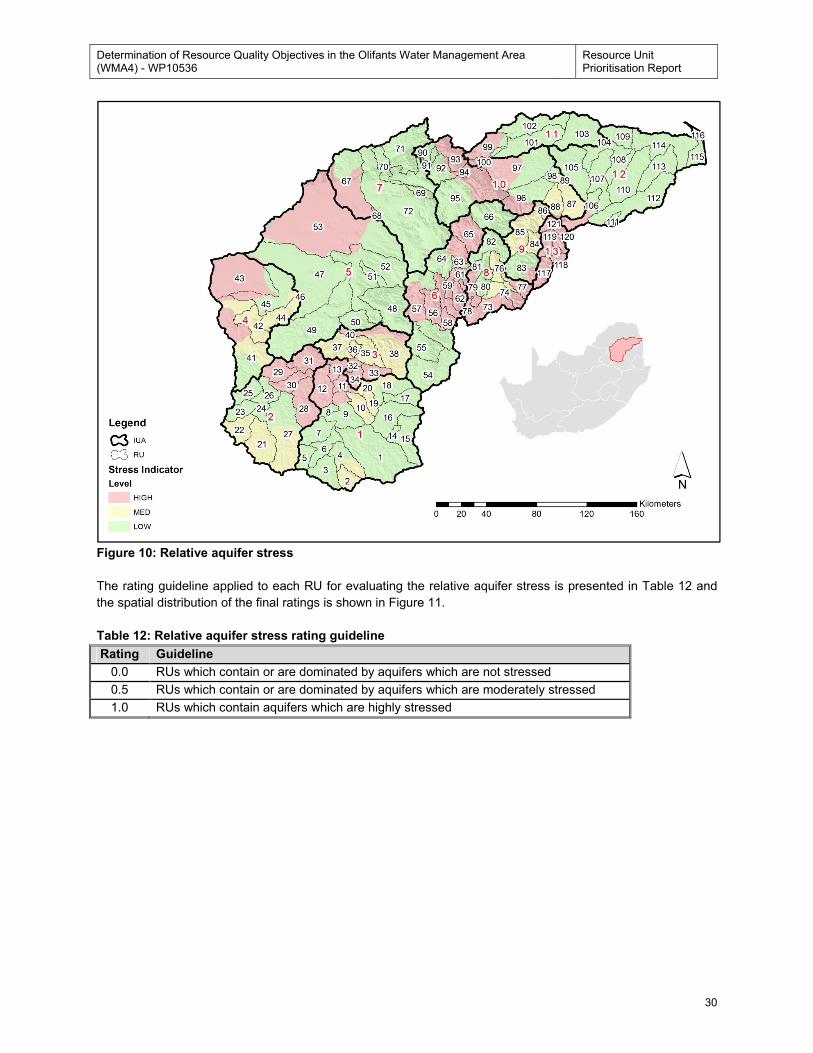
Determination of Resource Quality Objectives in the Olifants Water Management Area (WMA4) - WP10536
Resource Unit Prioritisation Report
30
Figure 10: Relative aquifer stress
The rating guideline applied to each RU for evaluating the relative aquifer stress is presented in Table 12 and
the spatial distribution of the final ratings is shown in Figure 11.
Table 12: Relative aquifer stress rating guideline
Rating Guideline
0.0 RUs which contain or are dominated by aquifers which are not stressed
0.5 RUs which contain or are dominated by aquifers which are moderately stressed
1.0 RUs which contain aquifers which are highly stressed
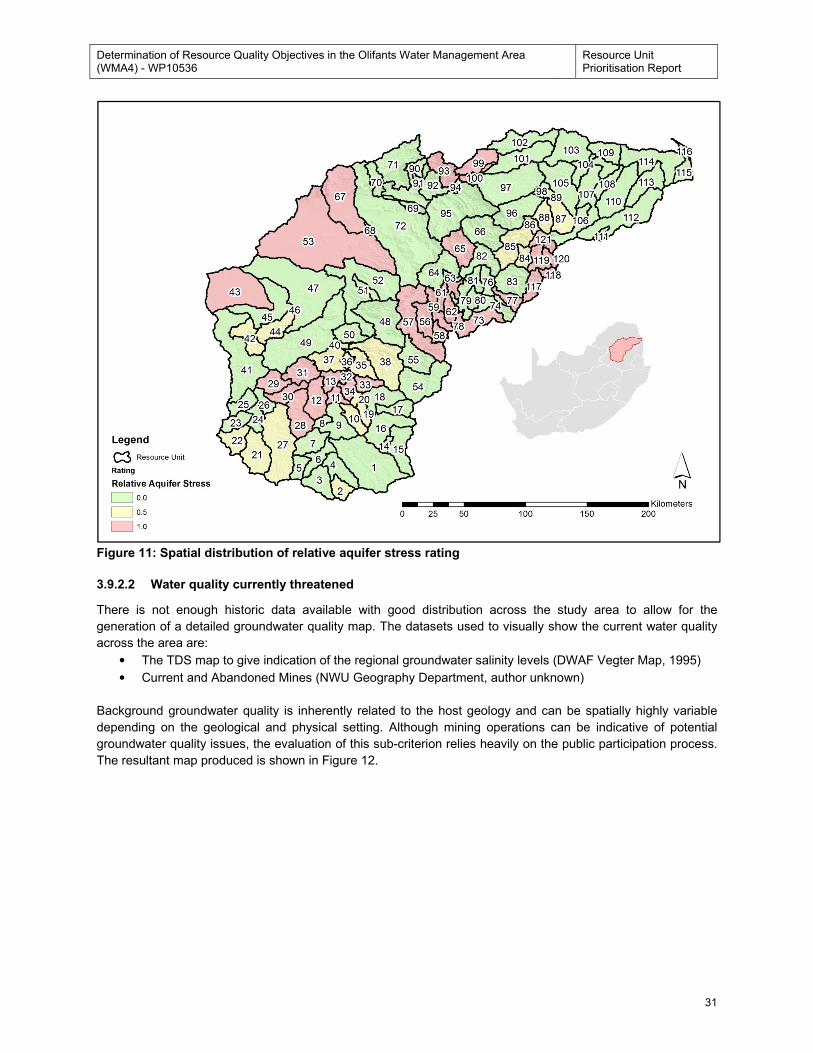
Determination of Resource Quality Objectives in the Olifants Water Management Area (WMA4) - WP10536
Resource Unit Prioritisation Report
31
Figure 11: Spatial distribution of relative aquifer stress rating
3.9.2.2 Water quality currently threatened
There is not enough historic data available with good distribution across the study area to allow for the
generation of a detailed groundwater quality map. The datasets used to visually show the current water quality
across the area are:
• The TDS map to give indication of the regional groundwater salinity levels (DWAF Vegter Map, 1995)
• Current and Abandoned Mines (NWU Geography Department, author unknown)
Background groundwater quality is inherently related to the host geology and can be spatially highly variable
depending on the geological and physical setting. Although mining operations can be indicative of potential
groundwater quality issues, the evaluation of this sub-criterion relies heavily on the public participation process.
The resultant map produced is shown in Figure 12.
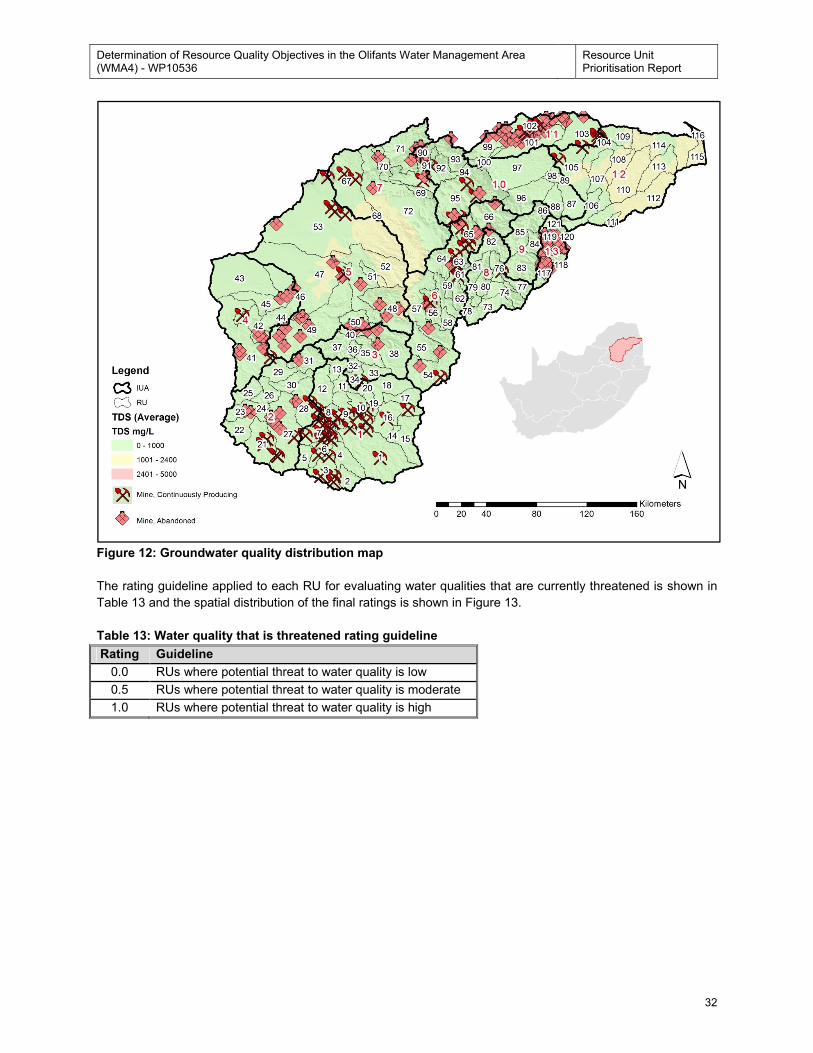
Determination of Resource Quality Objectives in the Olifants Water Management Area (WMA4) - WP10536
Resource Unit Prioritisation Report
32
Figure 12: Groundwater quality distribution map
The rating guideline applied to each RU for evaluating water qualities that are currently threatened is shown in
Table 13 and the spatial distribution of the final ratings is shown in Figure 13.
Table 13: Water quality that is threatened rating guideline
Rating Guideline
0.0 RUs where potential threat to water quality is low
0.5 RUs where potential threat to water quality is moderate
1.0 RUs where potential threat to water quality is high
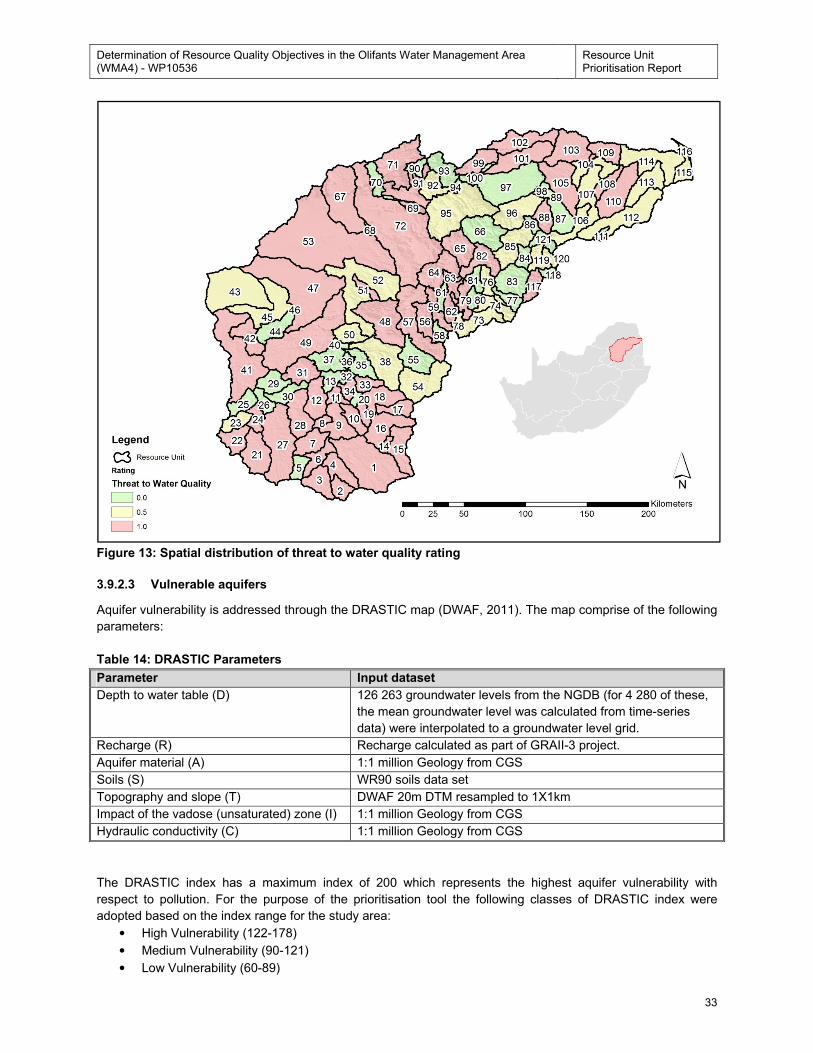
Determination of Resource Quality Objectives in the Olifants Water Management Area (WMA4) - WP10536
Resource Unit Prioritisation Report
33
Figure 13: Spatial distribution of threat to water quality rating
3.9.2.3 Vulnerable aquifers
Aquifer vulnerability is addressed through the DRASTIC map (DWAF, 2011). The map comprise of the following
parameters:
Table 14: DRASTIC Parameters
Parameter Input dataset
Depth to water table (D) 126 263 groundwater levels from the NGDB (for 4 280 of these,
the mean groundwater level was calculated from time-series
data) were interpolated to a groundwater level grid.
Recharge (R) Recharge calculated as part of GRAII-3 project.
Aquifer material (A) 1:1 million Geology from CGS
Soils (S) WR90 soils data set
Topography and slope (T) DWAF 20m DTM resampled to 1X1km
Impact of the vadose (unsaturated) zone (I) 1:1 million Geology from CGS
Hydraulic conductivity (C) 1:1 million Geology from CGS
The DRASTIC index has a maximum index of 200 which represents the highest aquifer vulnerability with
respect to pollution. For the purpose of the prioritisation tool the following classes of DRASTIC index were
adopted based on the index range for the study area:
• High Vulnerability (122-178)
• Medium Vulnerability (90-121)
• Low Vulnerability (60-89)
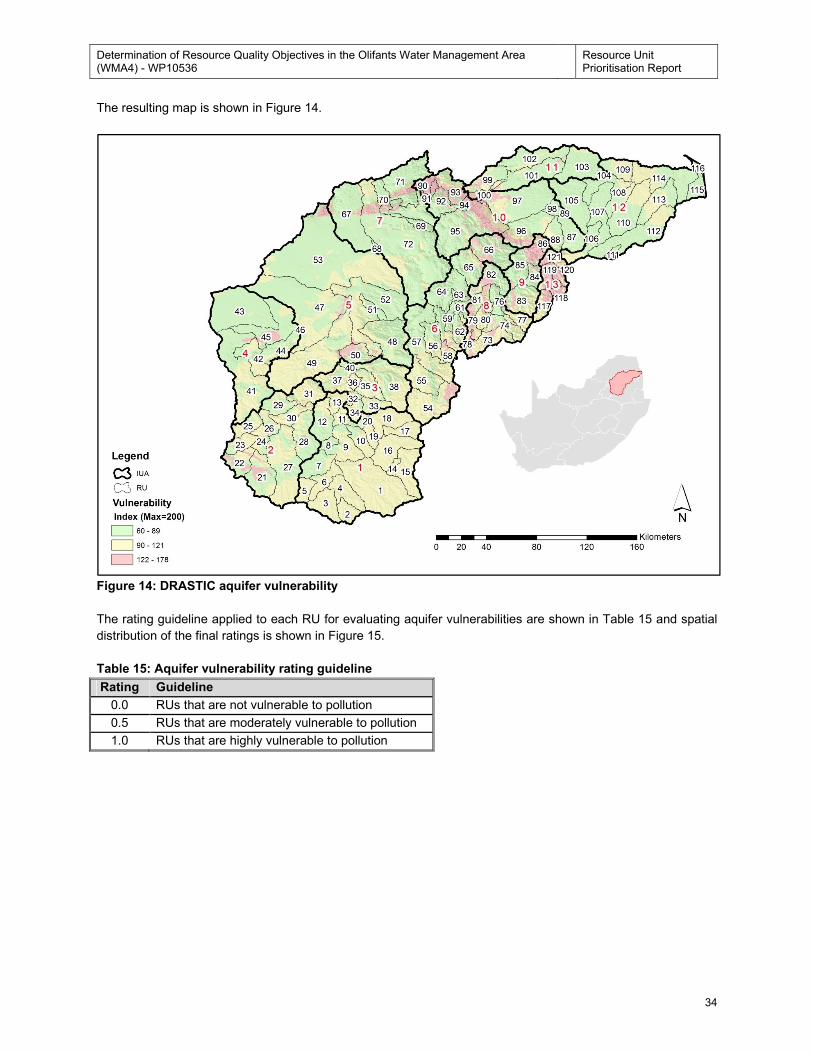
Determination of Resource Quality Objectives in the Olifants Water Management Area (WMA4) - WP10536
Resource Unit Prioritisation Report
34
The resulting map is shown in Figure 14.
Figure 14: DRASTIC aquifer vulnerability
The rating guideline applied to each RU for evaluating aquifer vulnerabilities are shown in Table 15 and spatial
distribution of the final ratings is shown in Figure 15.
Table 15: Aquifer vulnerability rating guideline
Rating Guideline
0.0 RUs that are not vulnerable to pollution
0.5 RUs that are moderately vulnerable to pollution
1.0 RUs that are highly vulnerable to pollution
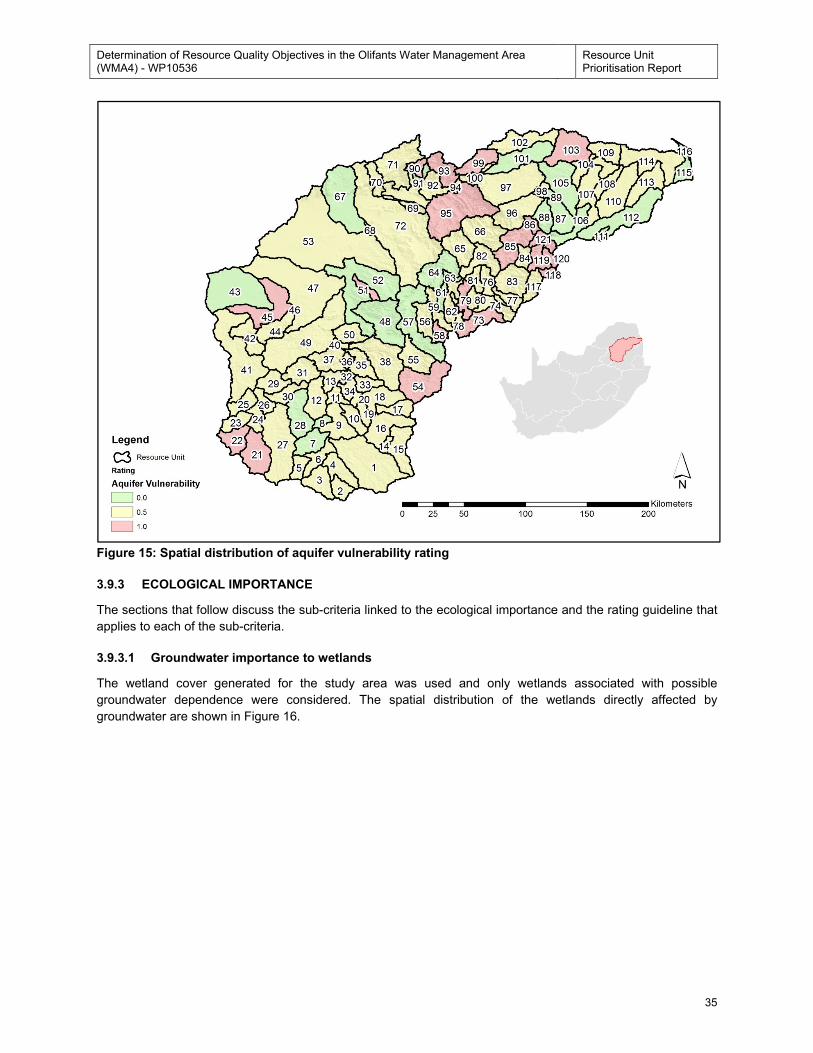
Determination of Resource Quality Objectives in the Olifants Water Management Area (WMA4) - WP10536
Resource Unit Prioritisation Report
35
Figure 15: Spatial distribution of aquifer vulnerability rating
3.9.3 ECOLOGICAL IMPORTANCE
The sections that follow discuss the sub-criteria linked to the ecological importance and the rating guideline that
applies to each of the sub-criteria.
3.9.3.1 Groundwater importance to wetlands
The wetland cover generated for the study area was used and only wetlands associated with possible
groundwater dependence were considered. The spatial distribution of the wetlands directly affected by
groundwater are shown in Figure 16.
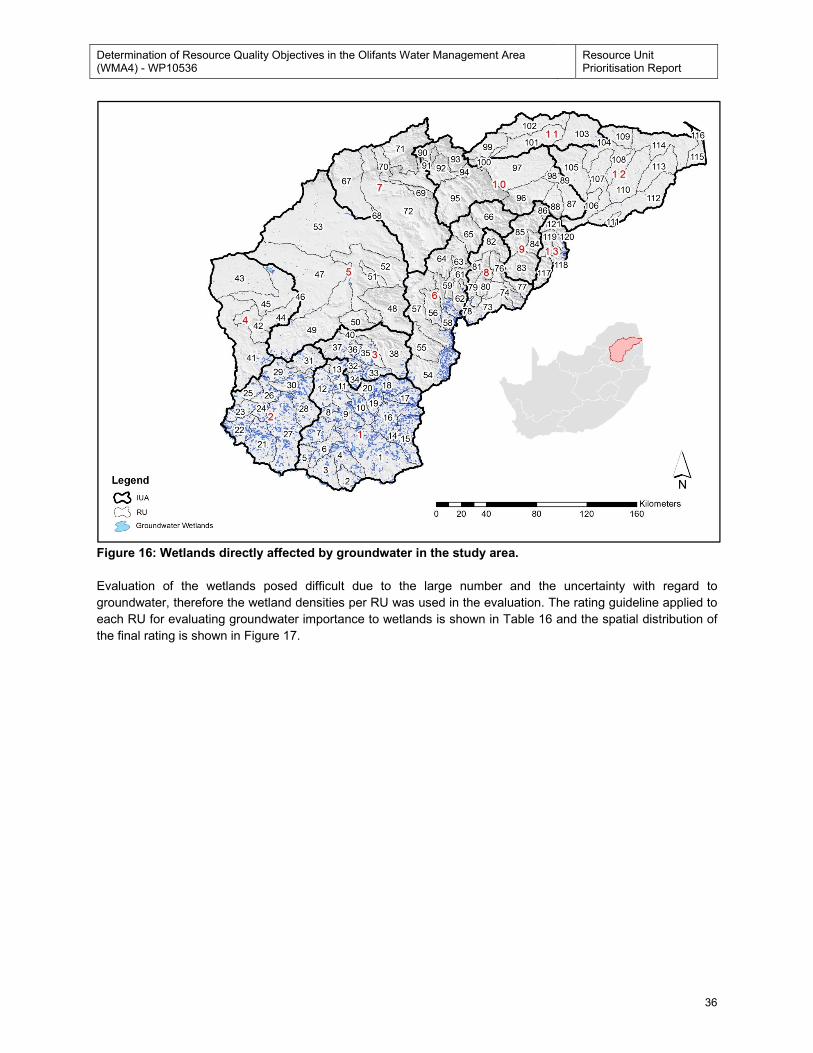
Determination of Resource Quality Objectives in the Olifants Water Management Area (WMA4) - WP10536
Resource Unit Prioritisation Report
36
Figure 16: Wetlands directly affected by groundwater in the study area.
Evaluation of the wetlands posed difficult due to the large number and the uncertainty with regard to
groundwater, therefore the wetland densities per RU was used in the evaluation. The rating guideline applied to
each RU for evaluating groundwater importance to wetlands is shown in Table 16 and the spatial distribution of
the final rating is shown in Figure 17.
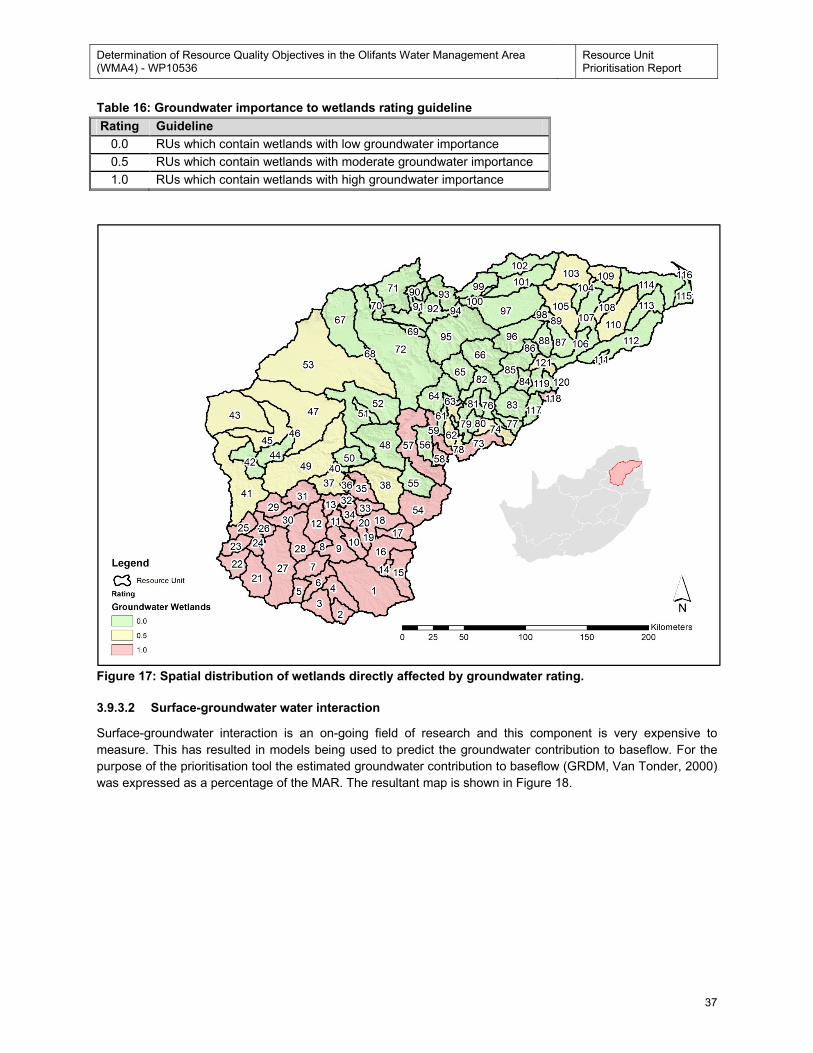
Determination of Resource Quality Objectives in the Olifants Water Management Area (WMA4) - WP10536
Resource Unit Prioritisation Report
37
Table 16: Groundwater importance to wetlands rating guideline
Rating Guideline
0.0 RUs which contain wetlands with low groundwater importance
0.5 RUs which contain wetlands with moderate groundwater importance
1.0 RUs which contain wetlands with high groundwater importance
Figure 17: Spatial distribution of wetlands directly affected by groundwater rating.
3.9.3.2 Surface-groundwater water interaction
Surface-groundwater interaction is an on-going field of research and this component is very expensive to
measure. This has resulted in models being used to predict the groundwater contribution to baseflow. For the
purpose of the prioritisation tool the estimated groundwater contribution to baseflow (GRDM, Van Tonder, 2000)
was expressed as a percentage of the MAR. The resultant map is shown in Figure 18.
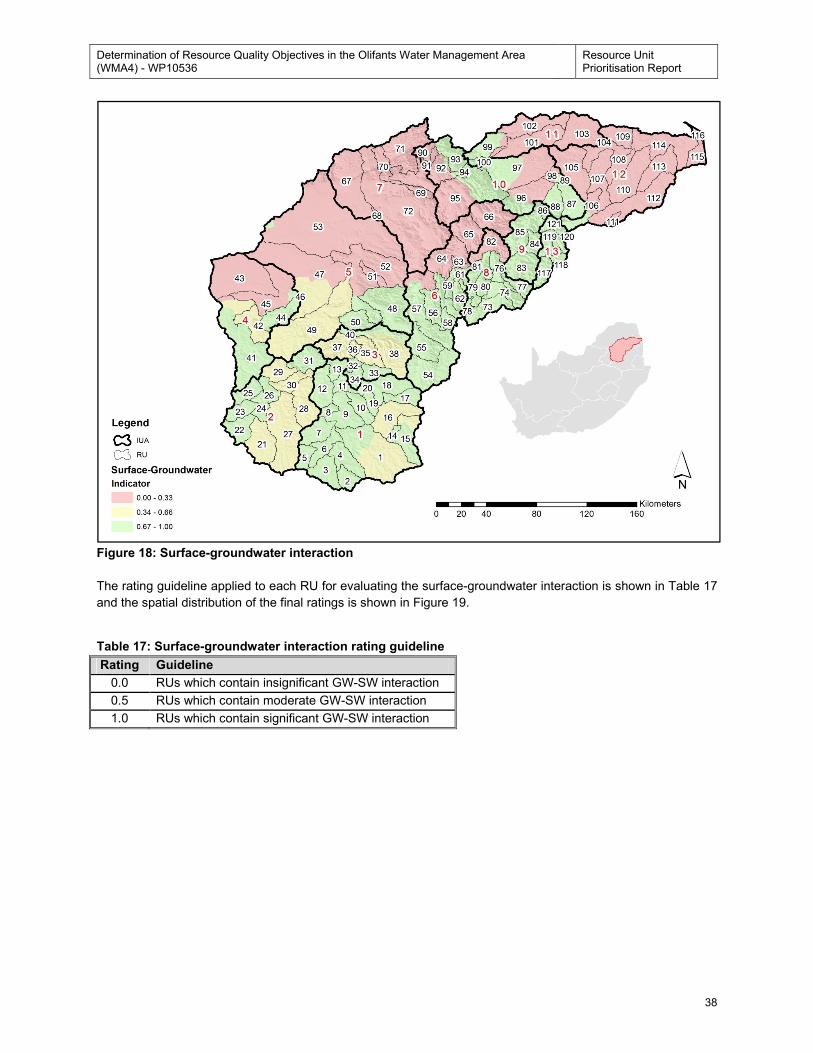
Determination of Resource Quality Objectives in the Olifants Water Management Area (WMA4) - WP10536
Resource Unit Prioritisation Report
38
Figure 18: Surface-groundwater interaction
The rating guideline applied to each RU for evaluating the surface-groundwater interaction is shown in Table 17
and the spatial distribution of the final ratings is shown in Figure 19.
Table 17: Surface-groundwater interaction rating guideline
Rating Guideline
0.0 RUs which contain insignificant GW-SW interaction
0.5 RUs which contain moderate GW-SW interaction
1.0 RUs which contain significant GW-SW interaction
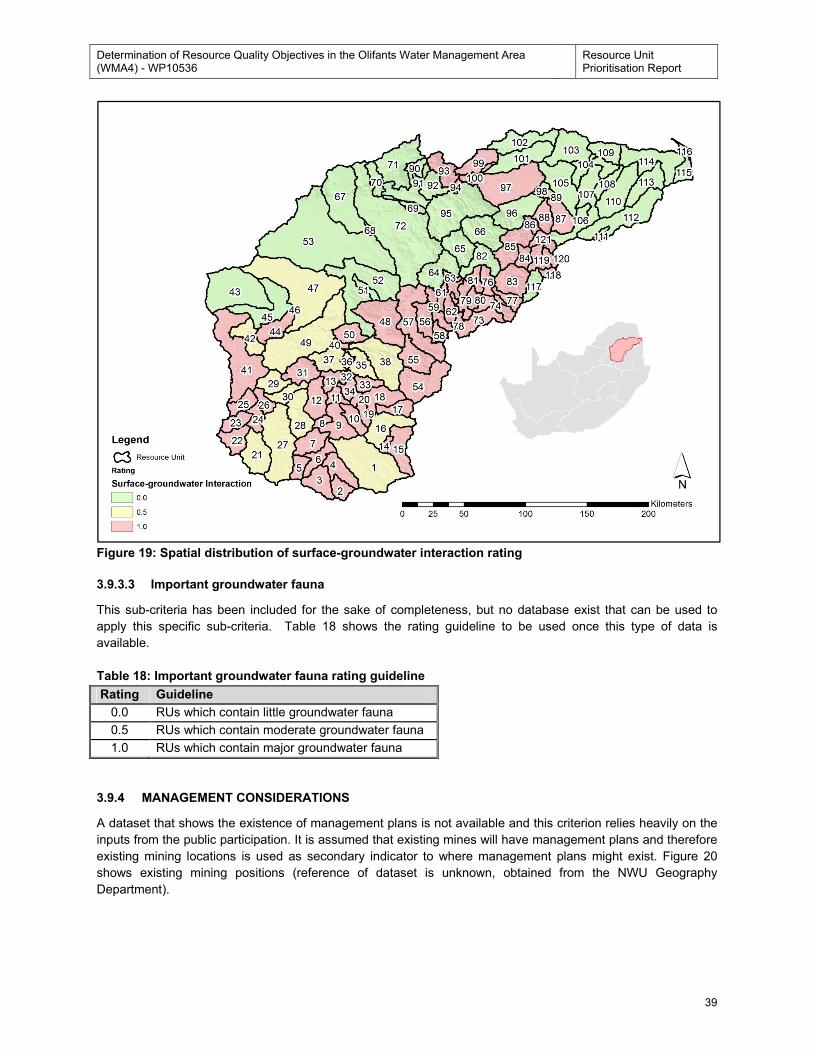
Determination of Resource Quality Objectives in the Olifants Water Management Area (WMA4) - WP10536
Resource Unit Prioritisation Report
39
Figure 19: Spatial distribution of surface-groundwater interaction rating
3.9.3.3 Important groundwater fauna
This sub-criteria has been included for the sake of completeness, but no database exist that can be used to
apply this specific sub-criteria. Table 18 shows the rating guideline to be used once this type of data is
available.
Table 18: Important groundwater fauna rating guideline
Rating Guideline
0.0 RUs which contain little groundwater fauna
0.5 RUs which contain moderate groundwater fauna
1.0 RUs which contain major groundwater fauna
3.9.4 MANAGEMENT CONSIDERATIONS
A dataset that shows the existence of management plans is not available and this criterion relies heavily on the
inputs from the public participation. It is assumed that existing mines will have management plans and therefore
existing mining locations is used as secondary indicator to where management plans might exist. Figure 20
shows existing mining positions (reference of dataset is unknown, obtained from the NWU Geography
Department).
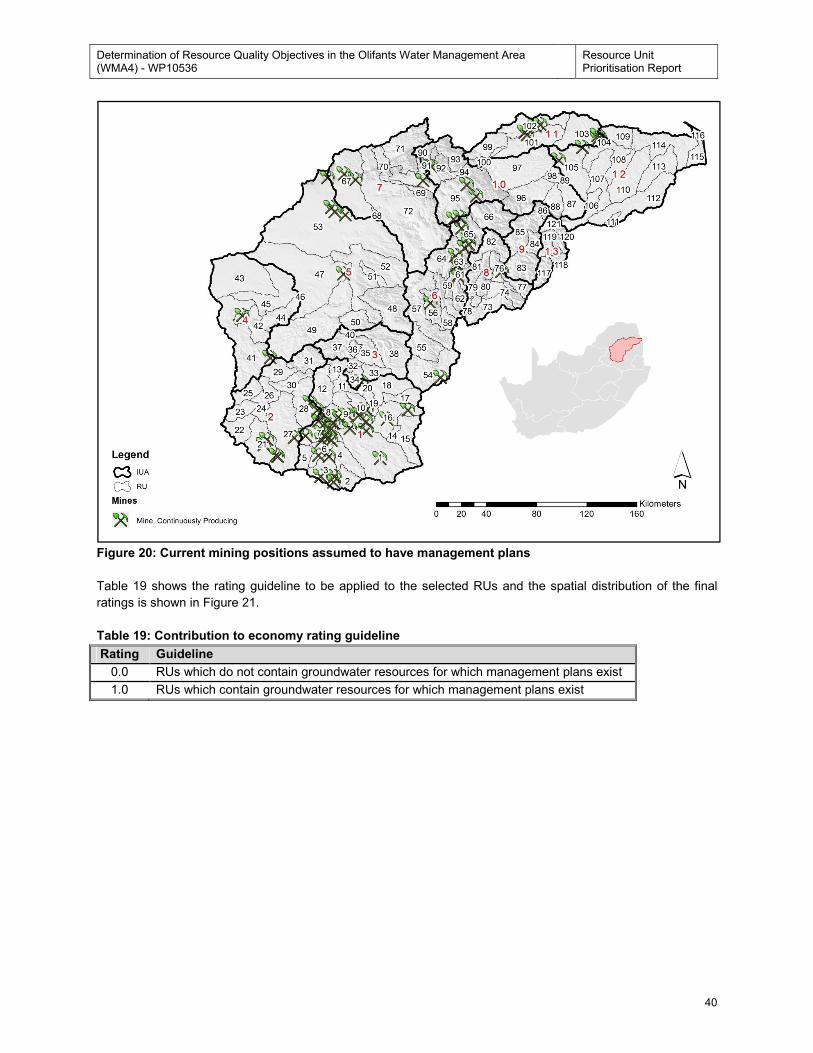
Determination of Resource Quality Objectives in the Olifants Water Management Area (WMA4) - WP10536
Resource Unit Prioritisation Report
40
Figure 20: Current mining positions assumed to have management plans
Table 19 shows the rating guideline to be applied to the selected RUs and the spatial distribution of the final
ratings is shown in Figure 21.
Table 19: Contribution to economy rating guideline
Rating Guideline
0.0 RUs which do not contain groundwater resources for which management plans exist
1.0 RUs which contain groundwater resources for which management plans exist
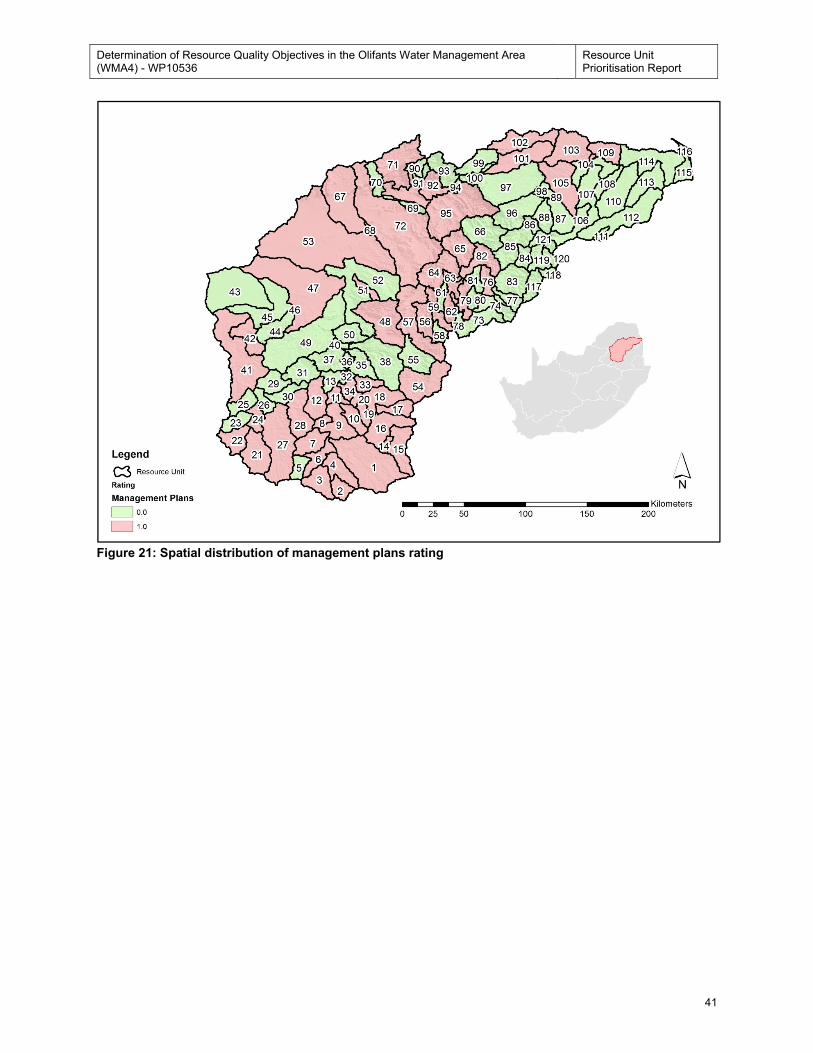
Determination of Resource Quality Objectives in the Olifants Water Management Area (WMA4) - WP10536
Resource Unit Prioritisation Report
41
Figure 21: Spatial distribution of management plans rating
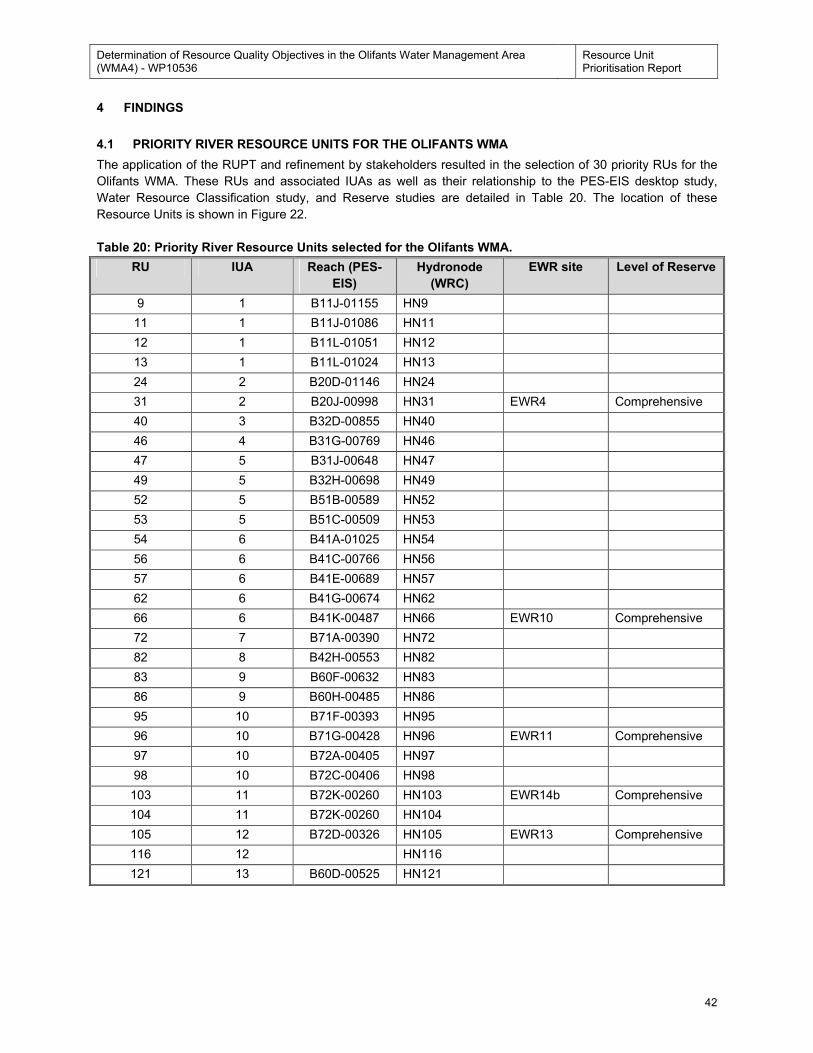
Determination of Resource Quality Objectives in the Olifants Water Management Area (WMA4) - WP10536
Resource Unit Prioritisation Report
42
4 FINDINGS
4.1 PRIORITY RIVER RESOURCE UNITS FOR THE OLIFANTS WMA
The application of the RUPT and refinement by stakeholders resulted in the selection of 30 priority RUs for the
Olifants WMA. These RUs and associated IUAs as well as their relationship to the PES-EIS desktop study,
Water Resource Classification study, and Reserve studies are detailed in Table 20. The location of these
Resource Units is shown in Figure 22.
Table 20: Priority River Resource Units selected for the Olifants WMA.
RU IUA Reach (PES-
EIS)
Hydronode
(WRC)
EWR site Level of Reserve
9 1 B11J-01155 HN9
11 1 B11J-01086 HN11
12 1 B11L-01051 HN12
13 1 B11L-01024 HN13
24 2 B20D-01146 HN24
31 2 B20J-00998 HN31 EWR4 Comprehensive
40 3 B32D-00855 HN40
46 4 B31G-00769 HN46
47 5 B31J-00648 HN47
49 5 B32H-00698 HN49
52 5 B51B-00589 HN52
53 5 B51C-00509 HN53
54 6 B41A-01025 HN54
56 6 B41C-00766 HN56
57 6 B41E-00689 HN57
62 6 B41G-00674 HN62
66 6 B41K-00487 HN66 EWR10 Comprehensive
72 7 B71A-00390 HN72
82 8 B42H-00553 HN82
83 9 B60F-00632 HN83
86 9 B60H-00485 HN86
95 10 B71F-00393 HN95
96 10 B71G-00428 HN96 EWR11 Comprehensive
97 10 B72A-00405 HN97
98 10 B72C-00406 HN98
103 11 B72K-00260 HN103 EWR14b Comprehensive
104 11 B72K-00260 HN104
105 12 B72D-00326 HN105 EWR13 Comprehensive
116 12 HN116
121 13 B60D-00525 HN121
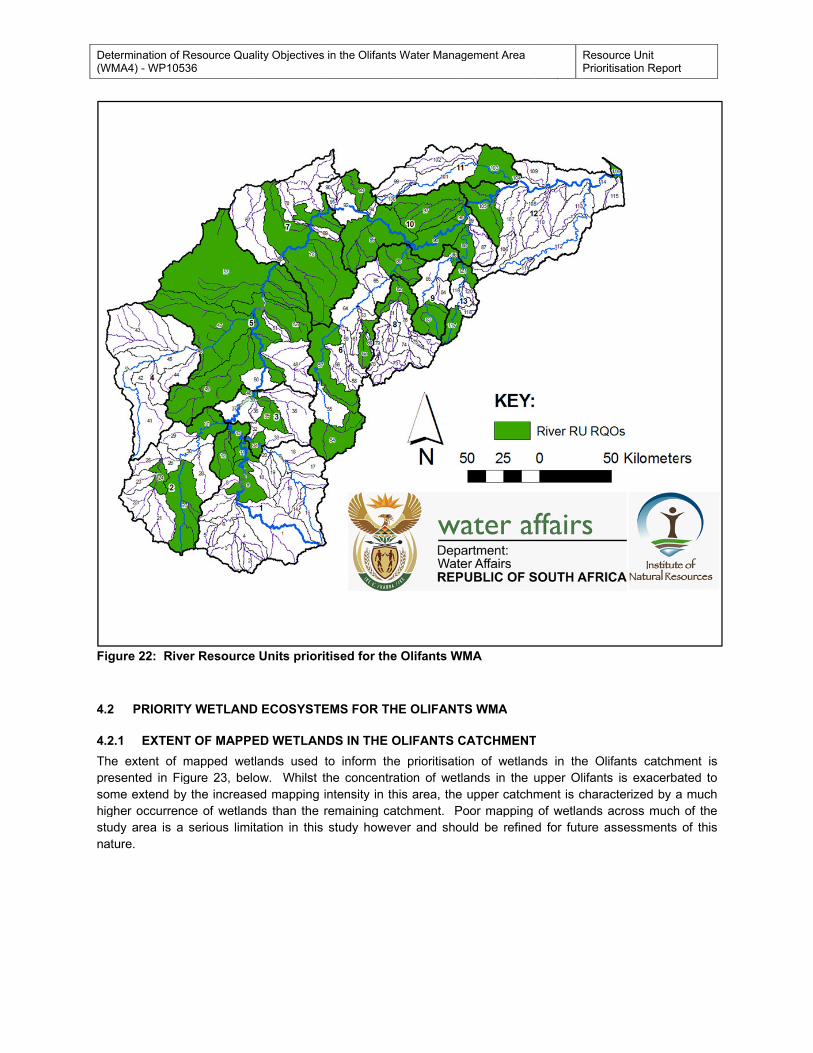
Determination of Resource Quality Objectives in the Olifants Water Management Area (WMA4)
Figure
4.2
4.2.1
The extent of mapped wetlands used to inform the
presented in
some extend by the increased mapping intensity in this area, the upper catchment is characterized by a much
higher occurrence of wetlands than the remaining catchment. Poor mapping of wetlands
study area is a serious limitation in this study however and should be refined for future assessments of this
nature.
Determination of Resource Quality Objectives in the Olifants Water Management Area (WMA4) - WP10536
Figure 22: River Resource Units prioritised for the Olifants WMA
4.2 PRIORITY WETLAND ECO
4.2.1 EXTENT OF MAPPED WET
The extent of mapped wetlands used to inform the
presented in Figure
some extend by the increased mapping intensity in this area, the upper catchment is characterized by a much
higher occurrence of wetlands than the remaining catchment. Poor mapping of wetlands
study area is a serious limitation in this study however and should be refined for future assessments of this
nature.
Determination of Resource Quality Objectives in the Olifants Water Management Area WP10536
River Resource Units prioritised for the Olifants WMA
PRIORITY WETLAND ECO
EXTENT OF MAPPED WET
The extent of mapped wetlands used to inform the
Figure 23, below. Whilst the con
some extend by the increased mapping intensity in this area, the upper catchment is characterized by a much
higher occurrence of wetlands than the remaining catchment. Poor mapping of wetlands
study area is a serious limitation in this study however and should be refined for future assessments of this
Determination of Resource Quality Objectives in the Olifants Water Management Area
River Resource Units prioritised for the Olifants WMA
PRIORITY WETLAND ECOSYSTEMS FOR THE OLIF
EXTENT OF MAPPED WETLANDS IN THE OLIFANT
The extent of mapped wetlands used to inform the
, below. Whilst the con
some extend by the increased mapping intensity in this area, the upper catchment is characterized by a much
higher occurrence of wetlands than the remaining catchment. Poor mapping of wetlands
study area is a serious limitation in this study however and should be refined for future assessments of this
Determination of Resource Quality Objectives in the Olifants Water Management Area
River Resource Units prioritised for the Olifants WMA
SYSTEMS FOR THE OLIF
LANDS IN THE OLIFANT
The extent of mapped wetlands used to inform the
, below. Whilst the concentration of wetlands in the upper Olifants is exacerbated to
some extend by the increased mapping intensity in this area, the upper catchment is characterized by a much
higher occurrence of wetlands than the remaining catchment. Poor mapping of wetlands
study area is a serious limitation in this study however and should be refined for future assessments of this
Determination of Resource Quality Objectives in the Olifants Water Management Area
River Resource Units prioritised for the Olifants WMA
SYSTEMS FOR THE OLIFANTS WMA
LANDS IN THE OLIFANTS CATCHMENT
The extent of mapped wetlands used to inform the prioritisation
centration of wetlands in the upper Olifants is exacerbated to
some extend by the increased mapping intensity in this area, the upper catchment is characterized by a much
higher occurrence of wetlands than the remaining catchment. Poor mapping of wetlands
study area is a serious limitation in this study however and should be refined for future assessments of this
Determination of Resource Quality Objectives in the Olifants Water Management Area
River Resource Units prioritised for the Olifants WMA
ANTS WMA
S CATCHMENT
prioritisation of wetlands in the Olifants catchment is
centration of wetlands in the upper Olifants is exacerbated to
some extend by the increased mapping intensity in this area, the upper catchment is characterized by a much
higher occurrence of wetlands than the remaining catchment. Poor mapping of wetlands
study area is a serious limitation in this study however and should be refined for future assessments of this
Resource Unit Prioritisation Report
S CATCHMENT
of wetlands in the Olifants catchment is
centration of wetlands in the upper Olifants is exacerbated to
some extend by the increased mapping intensity in this area, the upper catchment is characterized by a much
higher occurrence of wetlands than the remaining catchment. Poor mapping of wetlands
study area is a serious limitation in this study however and should be refined for future assessments of this
Resource Unit Prioritisation Report
of wetlands in the Olifants catchment is
centration of wetlands in the upper Olifants is exacerbated to
some extend by the increased mapping intensity in this area, the upper catchment is characterized by a much
across much of the
study area is a serious limitation in this study however and should be refined for future assessments of this
Prioritisation Report
of wetlands in the Olifants catchment is
centration of wetlands in the upper Olifants is exacerbated to
some extend by the increased mapping intensity in this area, the upper catchment is characterized by a much
across much of the
study area is a serious limitation in this study however and should be refined for future assessments of this
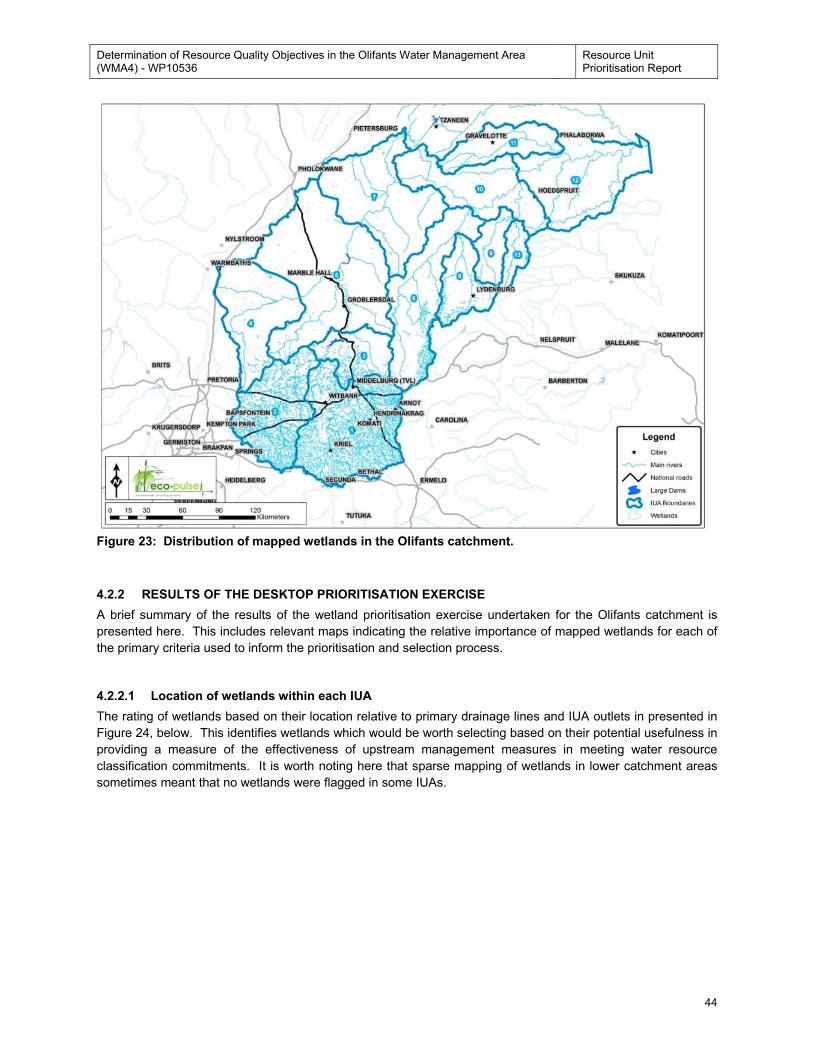
Determination of Resource Quality Objectives in the Olifants Water Management Area (WMA4) - WP10536
Resource Unit Prioritisation Report
44
Figure 23: Distribution of mapped wetlands in the Olifants catchment.
4.2.2 RESULTS OF THE DESKTOP PRIORITISATION EXERCISE
A brief summary of the results of the wetland prioritisation exercise undertaken for the Olifants catchment is
presented here. This includes relevant maps indicating the relative importance of mapped wetlands for each of
the primary criteria used to inform the prioritisation and selection process.
4.2.2.1 Location of wetlands within each IUA
The rating of wetlands based on their location relative to primary drainage lines and IUA outlets in presented in
Figure 24, below. This identifies wetlands which would be worth selecting based on their potential usefulness in
providing a measure of the effectiveness of upstream management measures in meeting water resource
classification commitments. It is worth noting here that sparse mapping of wetlands in lower catchment areas
sometimes meant that no wetlands were flagged in some IUAs.
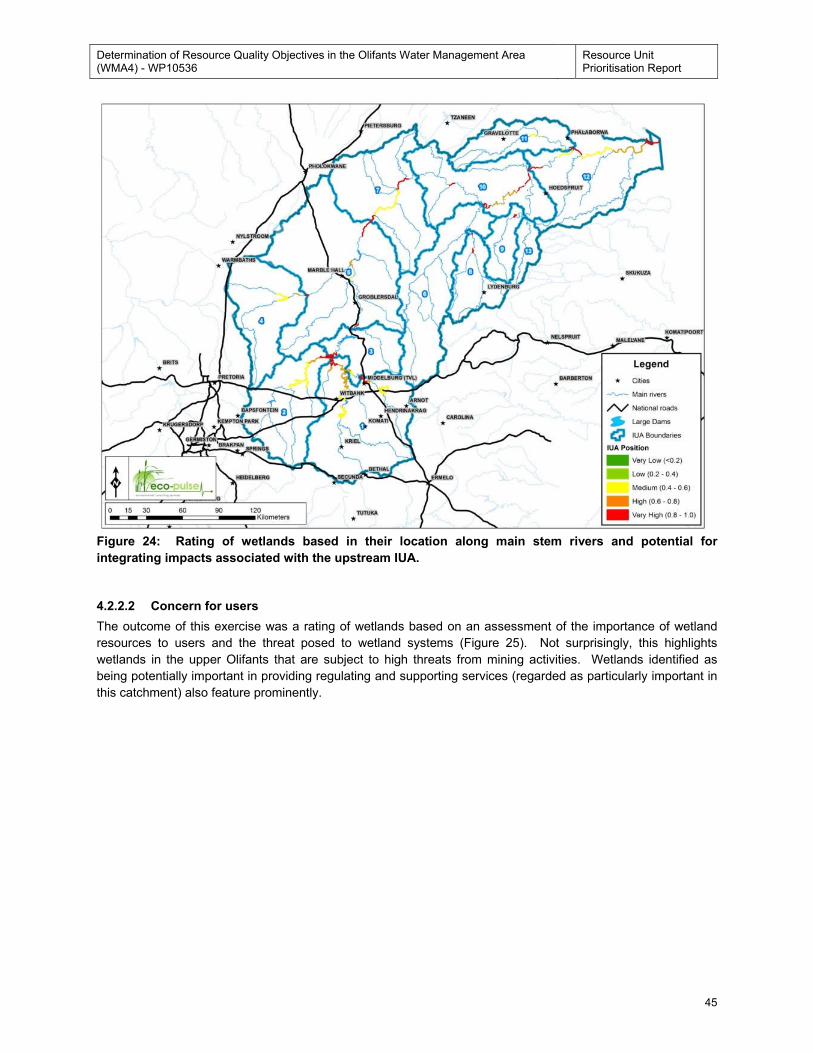
Determination of Resource Quality Objectives in the Olifants Water Management Area (WMA4) - WP10536
Resource Unit Prioritisation Report
45
Figure 24: Rating of wetlands based in their location along main stem rivers and potential for
integrating impacts associated with the upstream IUA.
4.2.2.2 Concern for users
The outcome of this exercise was a rating of wetlands based on an assessment of the importance of wetland
resources to users and the threat posed to wetland systems (Figure 25). Not surprisingly, this highlights
wetlands in the upper Olifants that are subject to high threats from mining activities. Wetlands identified as
being potentially important in providing regulating and supporting services (regarded as particularly important in
this catchment) also feature prominently.
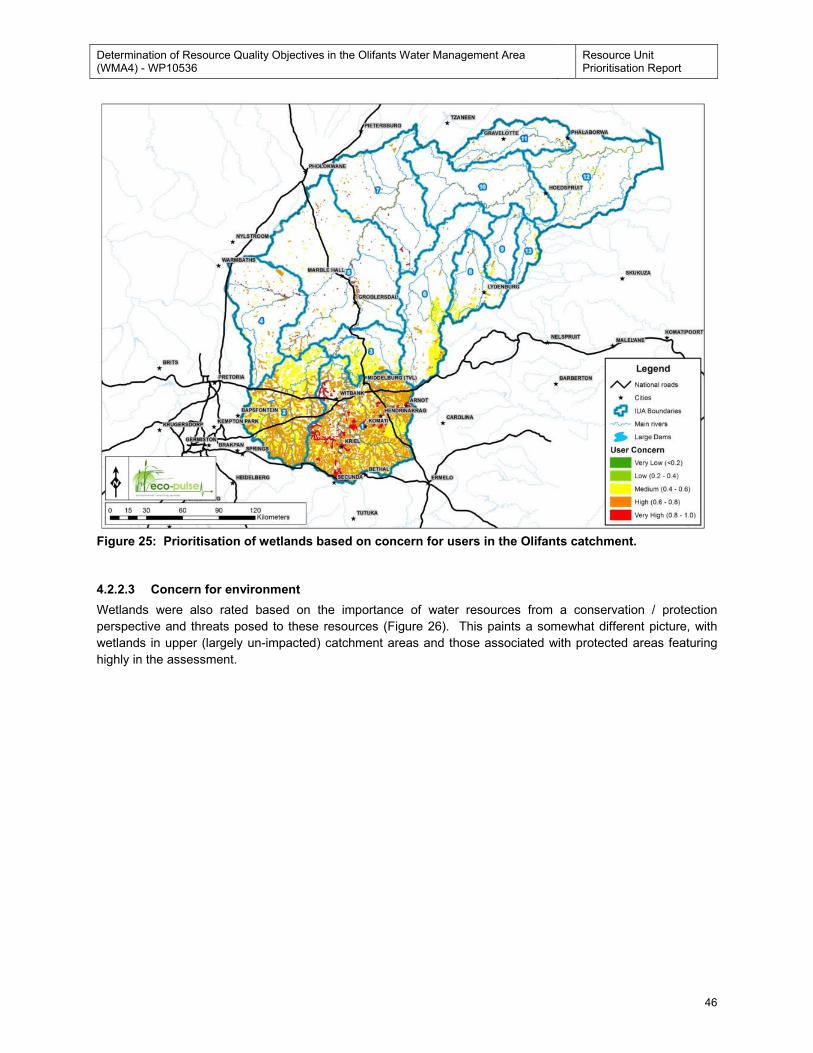
Determination of Resource Quality Objectives in the Olifants Water Management Area (WMA4) - WP10536
Resource Unit Prioritisation Report
46
Figure 25: Prioritisation of wetlands based on concern for users in the Olifants catchment.
4.2.2.3 Concern for environment
Wetlands were also rated based on the importance of water resources from a conservation / protection
perspective and threats posed to these resources (Figure 26). This paints a somewhat different picture, with
wetlands in upper (largely un-impacted) catchment areas and those associated with protected areas featuring
highly in the assessment.
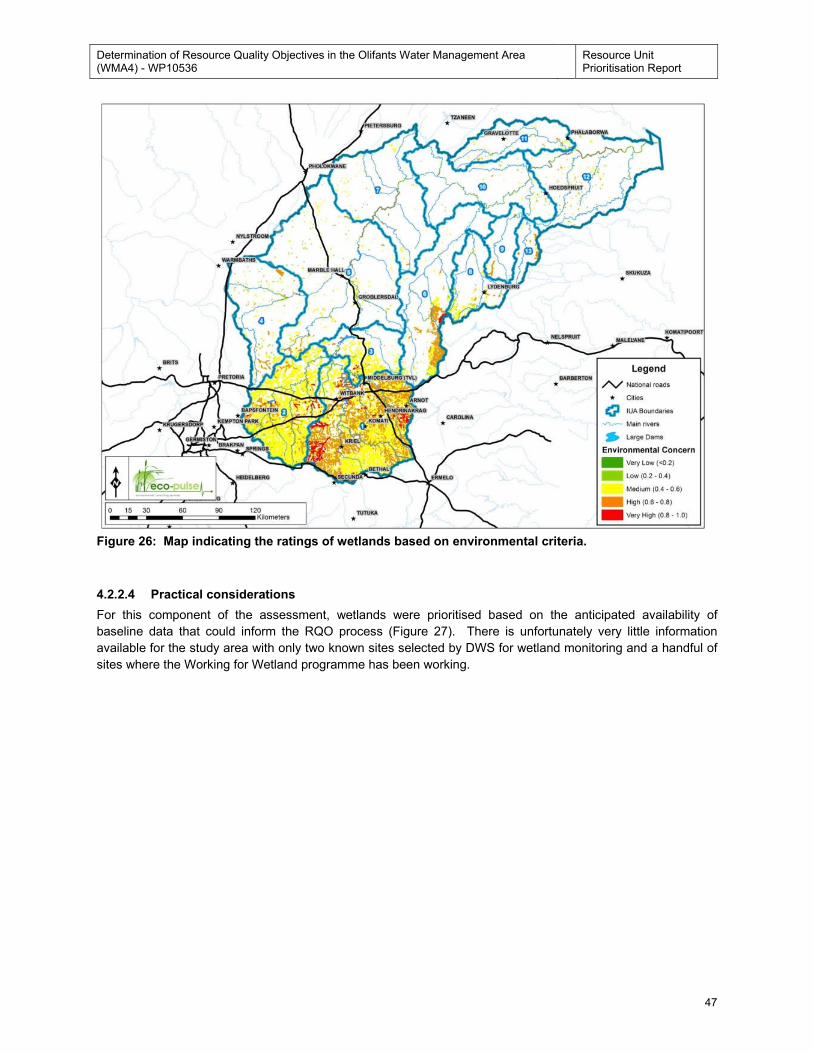
Determination of Resource Quality Objectives in the Olifants Water Management Area (WMA4) - WP10536
Resource Unit Prioritisation Report
47
Figure 26: Map indicating the ratings of wetlands based on environmental criteria.
4.2.2.4 Practical considerations
For this component of the assessment, wetlands were prioritised based on the anticipated availability of
baseline data that could inform the RQO process (Figure 27). There is unfortunately very little information
available for the study area with only two known sites selected by DWS for wetland monitoring and a handful of
sites where the Working for Wetland programme has been working.
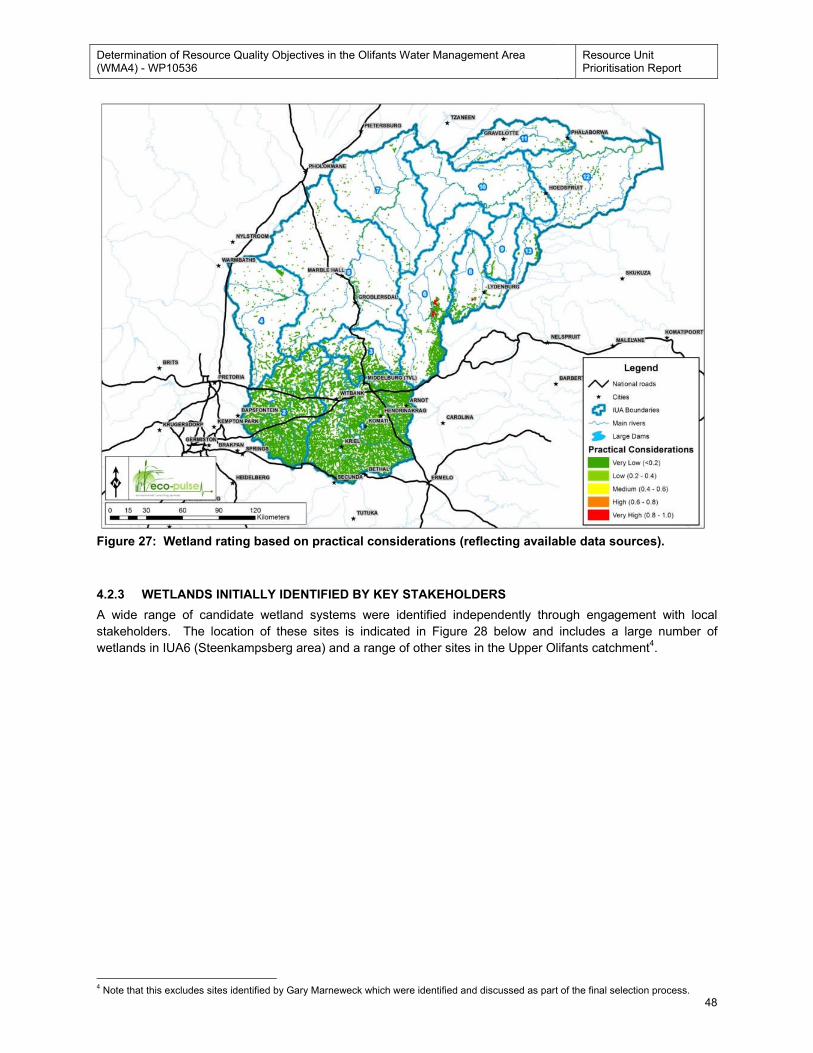
Determination of Resource Quality Objectives in the Olifants Water Management Area (WMA4) - WP10536
Resource Unit Prioritisation Report
48
Figure 27: Wetland rating based on practical considerations (reflecting available data sources).
4.2.3 WETLANDS INITIALLY IDENTIFIED BY KEY STAKEHOLDERS
A wide range of candidate wetland systems were identified independently through engagement with local
stakeholders. The location of these sites is indicated in Figure 28 below and includes a large number of
wetlands in IUA6 (Steenkampsberg area) and a range of other sites in the Upper Olifants catchment4.
4 Note that this excludes sites identified by Gary Marneweck which were identified and discussed as part of the final selection process.
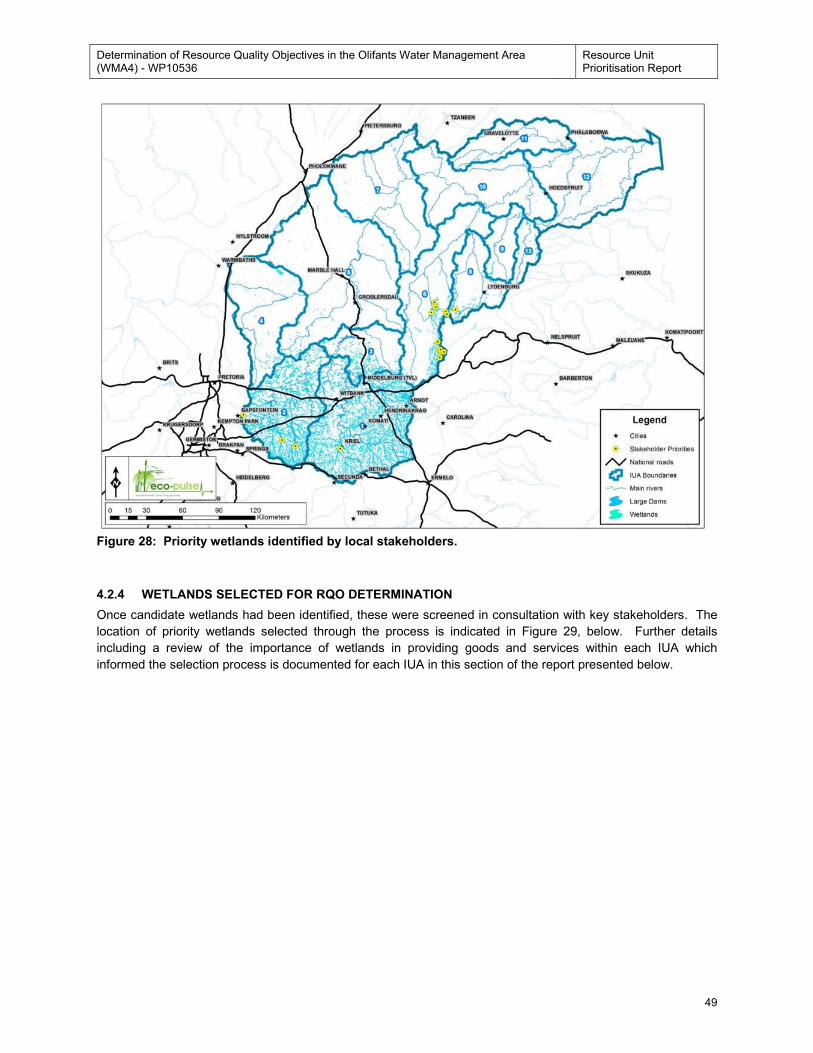
Determination of Resource Quality Objectives in the Olifants Water Management Area (WMA4) - WP10536
Resource Unit Prioritisation Report
49
Figure 28: Priority wetlands identified by local stakeholders.
4.2.4 WETLANDS SELECTED FOR RQO DETERMINATION
Once candidate wetlands had been identified, these were screened in consultation with key stakeholders. The
location of priority wetlands selected through the process is indicated in Figure 29, below. Further details
including a review of the importance of wetlands in providing goods and services within each IUA which
informed the selection process is documented for each IUA in this section of the report presented below.
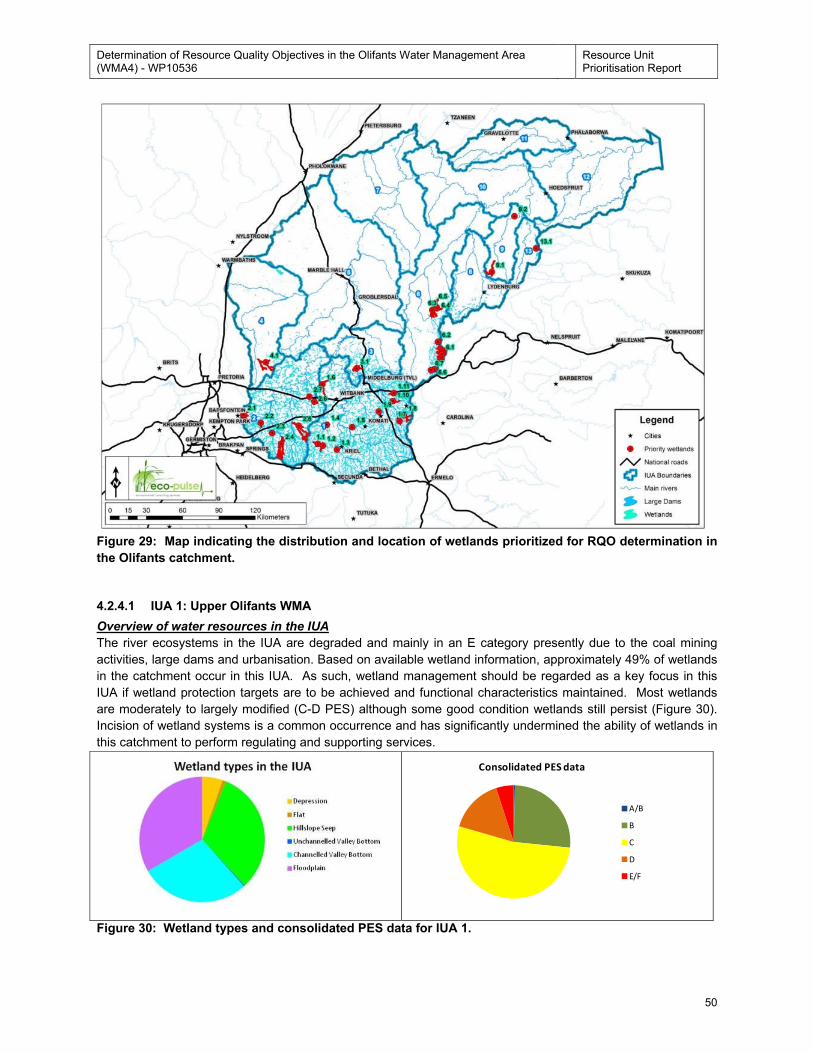
Determination of Resource Quality Objectives in the Olifants Water Management Area (WMA4) - WP10536
Resource Unit Prioritisation Report
50
Figure 29: Map indicating the distribution and location of wetlands prioritized for RQO determination in
the Olifants catchment.
4.2.4.1 IUA 1: Upper Olifants WMA
Overview of water resources in the IUA
The river ecosystems in the IUA are degraded and mainly in an E category presently due to the coal mining
activities, large dams and urbanisation. Based on available wetland information, approximately 49% of wetlands
in the catchment occur in this IUA. As such, wetland management should be regarded as a key focus in this
IUA if wetland protection targets are to be achieved and functional characteristics maintained. Most wetlands
are moderately to largely modified (C-D PES) although some good condition wetlands still persist (Figure 30).
Incision of wetland systems is a common occurrence and has significantly undermined the ability of wetlands in
this catchment to perform regulating and supporting services.
Figure 30: Wetland types and consolidated PES data for IUA 1.
Consolidated PES data
A/B
B
C
D
E/F
Determination of Resource Quality Objectives in the Olifants Water Management Area (WMA4) - WP10536
Resource Unit Prioritisation Report
51
Goods and services provided by wetlands
Regulating & supporting services Provisioning
services Cultural
Support
Biodiversity
maintenance Flood
attenuation
Sediment
trapping &
erosion Control
Water Quality
Enhancement
Livelihood
Support
Moderate Moderate Very High Very Low Very Low High
An evaluation of flood attenuation suggests that a large number of floodplain and unchannelled valley bottom
wetlands are potentially important in providing this service. The report by Anchor Environmental (DWA, 2010)
suggests that the value of this service is quite low relative to other wetlands such as those located in the
Pongola catchment.
Wetlands in the upper reaches of the catchment have been flagged as having a potentially high importance for
sediment and erosion control. Wetlands lower in the catchment are typically regarded as having a lower
importance for this service.
Coal mining and power generation results in significant impacts on water quality with significant impacts on
electrical conductivity and sulphate concentrations (DWA, 2012). Defunct coal mines also contribute
significantly to acid mine drainage (low pH). This has been reported in the Middelburg dam where the pH,
nitrate, nitrite and ammonia fall within the unacceptable range. Available information on heavy metals shows
unacceptably high levels in parts of the catchment. Indeed, high aluminium concentrations have been cited as
possible cause of fish deaths in Loskop dam (DWA, 2012). Extensive agricultural areas are also likely to
contribute nutrients and toxic organic chemicals associated with herbicides and pesticides. As such, water
quality enhancement functions are regarded as very important in this IUA. This is clearly reflected in the
prioritisation process which highlighted a large number of wetlands as having a very high water quality
enhancement potential. The importance of wetlands and rivers in providing a water purification function was
also highlighted by Anchor Environmental (DWA, 2010) as highest in the Upper Olifants catchment.
While many wetlands are heavily impacted, some wetlands of high ecological importance do occur, particularly
in the upper reaches of the catchment. Such wetlands are typically associated with critically endangered
wetland types. Overall importance of wetlands from a biodiversity maintenance perspective is regarded as high.
Focus of wetland selection
Given the extremely high importance of water quality enhancement functions provided by wetlands, it is
important to ensure that these services are maintained and enhanced where possible. As such, a series of
wetlands providing this service have been prioritised and selected for RQO determination.
Wetlands have also been flagged as having a high biodiversity maintenance function with a large number of
wetlands flagged as NFEPA wetlands. As such, a series of wetlands have also been selected to monitor
changes to wetlands flagged as having a high biodiversity priority.
Selected wetlands
The location of wetlands selected for RQO determination in this IUA is indicated in Figure 31 whilst details of
each of the selected wetlands is included in Table 21.
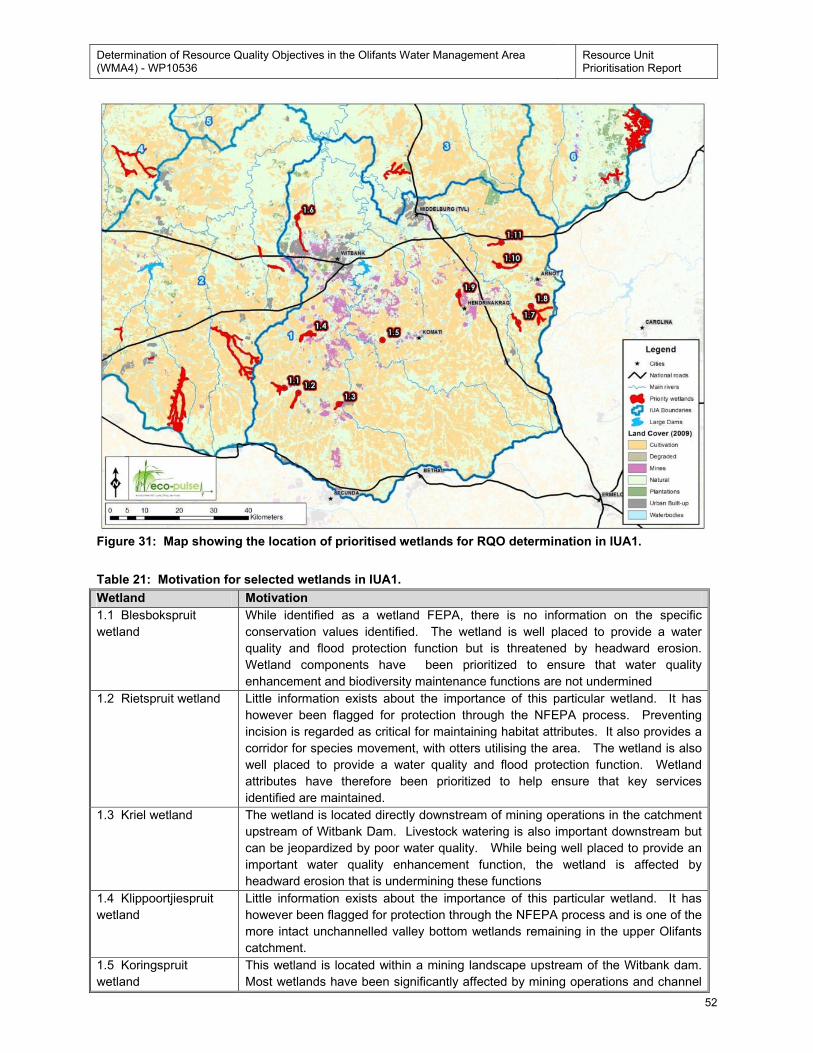
Determination of Resource Quality Objectives in the Olifants Water Management Area (WMA4) - WP10536
Resource Unit Prioritisation Report
52
Figure 31: Map showing the location of prioritised wetlands for RQO determination in IUA1.
Table 21: Motivation for selected wetlands in IUA1.
Wetland Motivation
1.1 Blesbokspruit
wetland
While identified as a wetland FEPA, there is no information on the specific
conservation values identified. The wetland is well placed to provide a water
quality and flood protection function but is threatened by headward erosion.
Wetland components have been prioritized to ensure that water quality
enhancement and biodiversity maintenance functions are not undermined
1.2 Rietspruit wetland Little information exists about the importance of this particular wetland. It has
however been flagged for protection through the NFEPA process. Preventing
incision is regarded as critical for maintaining habitat attributes. It also provides a
corridor for species movement, with otters utilising the area. The wetland is also
well placed to provide a water quality and flood protection function. Wetland
attributes have therefore been prioritized to help ensure that key services
identified are maintained.
1.3 Kriel wetland The wetland is located directly downstream of mining operations in the catchment
upstream of Witbank Dam. Livestock watering is also important downstream but
can be jeopardized by poor water quality. While being well placed to provide an
important water quality enhancement function, the wetland is affected by
headward erosion that is undermining these functions
1.4 Klippoortjiespruit
wetland
Little information exists about the importance of this particular wetland. It has
however been flagged for protection through the NFEPA process and is one of the
more intact unchannelled valley bottom wetlands remaining in the upper Olifants
catchment.
1.5 Koringspruit
wetland
This wetland is located within a mining landscape upstream of the Witbank dam.
Most wetlands have been significantly affected by mining operations and channel
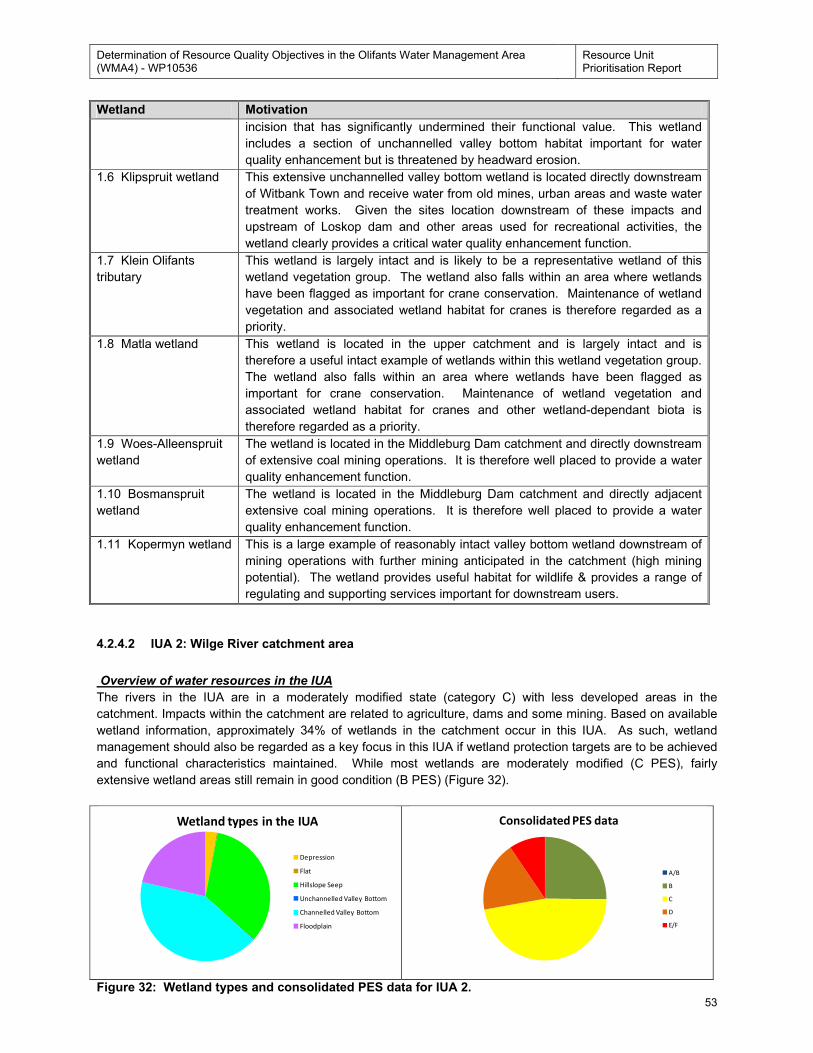
Determination of Resource Quality Objectives in the Olifants Water Management Area (WMA4) - WP10536
Resource Unit Prioritisation Report
53
Wetland Motivation
incision that has significantly undermined their functional value. This wetland
includes a section of unchannelled valley bottom habitat important for water
quality enhancement but is threatened by headward erosion.
1.6 Klipspruit wetland This extensive unchannelled valley bottom wetland is located directly downstream
of Witbank Town and receive water from old mines, urban areas and waste water
treatment works. Given the sites location downstream of these impacts and
upstream of Loskop dam and other areas used for recreational activities, the
wetland clearly provides a critical water quality enhancement function.
1.7 Klein Olifants
tributary
This wetland is largely intact and is likely to be a representative wetland of this
wetland vegetation group. The wetland also falls within an area where wetlands
have been flagged as important for crane conservation. Maintenance of wetland
vegetation and associated wetland habitat for cranes is therefore regarded as a
priority.
1.8 Matla wetland This wetland is located in the upper catchment and is largely intact and is
therefore a useful intact example of wetlands within this wetland vegetation group.
The wetland also falls within an area where wetlands have been flagged as
important for crane conservation. Maintenance of wetland vegetation and
associated wetland habitat for cranes and other wetland-dependant biota is
therefore regarded as a priority.
1.9 Woes-Alleenspruit
wetland
The wetland is located in the Middleburg Dam catchment and directly downstream
of extensive coal mining operations. It is therefore well placed to provide a water
quality enhancement function.
1.10 Bosmanspruit
wetland
The wetland is located in the Middleburg Dam catchment and directly adjacent
extensive coal mining operations. It is therefore well placed to provide a water
quality enhancement function.
1.11 Kopermyn wetland This is a large example of reasonably intact valley bottom wetland downstream of
mining operations with further mining anticipated in the catchment (high mining
potential). The wetland provides useful habitat for wildlife & provides a range of
regulating and supporting services important for downstream users.
4.2.4.2 IUA 2: Wilge River catchment area
Overview of water resources in the IUA
The rivers in the IUA are in a moderately modified state (category C) with less developed areas in the
catchment. Impacts within the catchment are related to agriculture, dams and some mining. Based on available
wetland information, approximately 34% of wetlands in the catchment occur in this IUA. As such, wetland
management should also be regarded as a key focus in this IUA if wetland protection targets are to be achieved
and functional characteristics maintained. While most wetlands are moderately modified (C PES), fairly
extensive wetland areas still remain in good condition (B PES) (Figure 32).
Figure 32: Wetland types and consolidated PES data for IUA 2.
Wetland types in the IUA
Depression
Flat
Hillslope Seep
Unchannelled Valley Bottom
Channelled Valley Bottom
Floodplain
Consolidated PES data
A/B
B
C
D
E/F
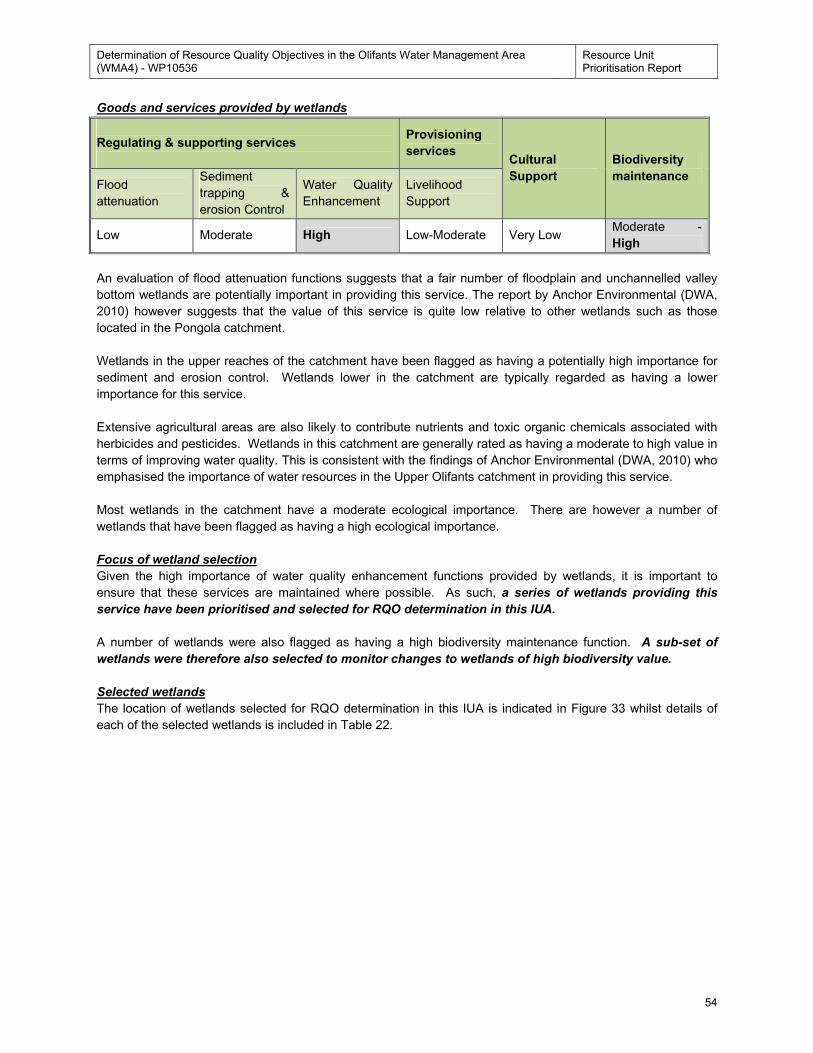
Determination of Resource Quality Objectives in the Olifants Water Management Area (WMA4) - WP10536
Resource Unit Prioritisation Report
54
Goods and services provided by wetlands
Regulating & supporting services
Provisioning
services Cultural
Support
Biodiversity
maintenance Flood
attenuation
Sediment
trapping &
erosion Control
Water Quality
Enhancement
Livelihood
Support
Low Moderate High Low-Moderate Very Low Moderate -
High
An evaluation of flood attenuation functions suggests that a fair number of floodplain and unchannelled valley
bottom wetlands are potentially important in providing this service. The report by Anchor Environmental (DWA,
2010) however suggests that the value of this service is quite low relative to other wetlands such as those
located in the Pongola catchment.
Wetlands in the upper reaches of the catchment have been flagged as having a potentially high importance for
sediment and erosion control. Wetlands lower in the catchment are typically regarded as having a lower
importance for this service.
Extensive agricultural areas are also likely to contribute nutrients and toxic organic chemicals associated with
herbicides and pesticides. Wetlands in this catchment are generally rated as having a moderate to high value in
terms of improving water quality. This is consistent with the findings of Anchor Environmental (DWA, 2010) who
emphasised the importance of water resources in the Upper Olifants catchment in providing this service.
Most wetlands in the catchment have a moderate ecological importance. There are however a number of
wetlands that have been flagged as having a high ecological importance.
Focus of wetland selection
Given the high importance of water quality enhancement functions provided by wetlands, it is important to
ensure that these services are maintained where possible. As such, a series of wetlands providing this
service have been prioritised and selected for RQO determination in this IUA.
A number of wetlands were also flagged as having a high biodiversity maintenance function. A sub-set of
wetlands were therefore also selected to monitor changes to wetlands of high biodiversity value.
Selected wetlands
The location of wetlands selected for RQO determination in this IUA is indicated in Figure 33 whilst details of
each of the selected wetlands is included in Table 22.
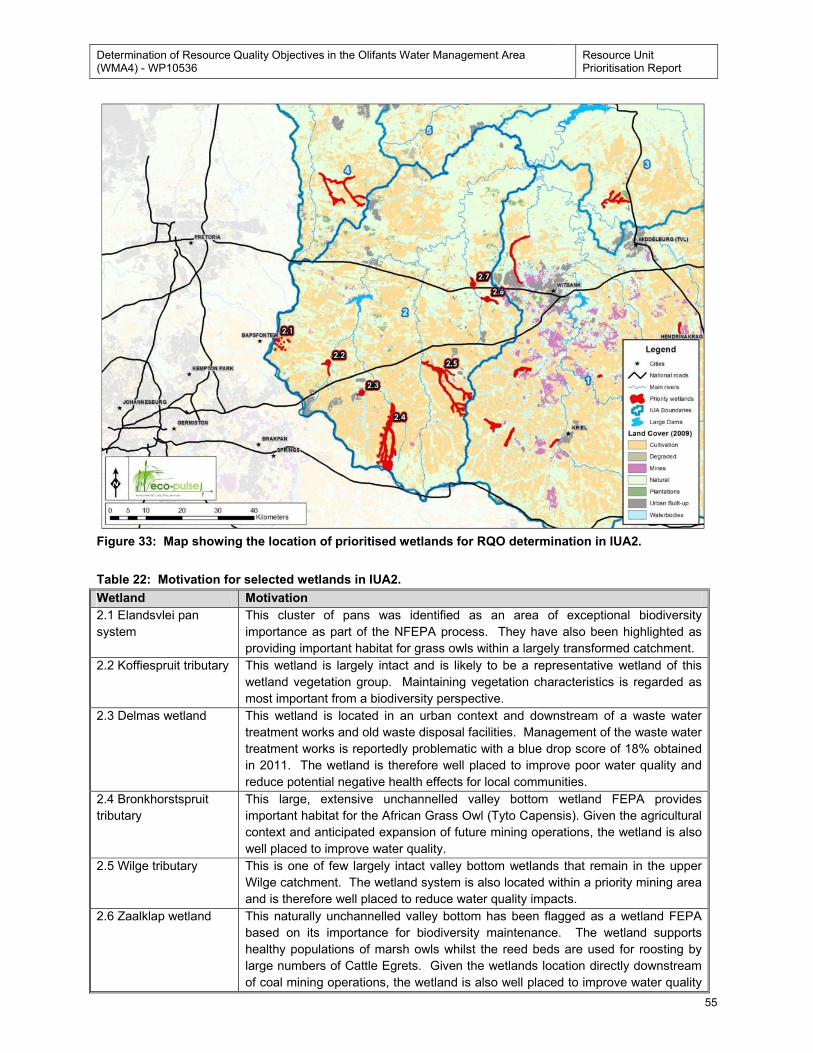
Determination of Resource Quality Objectives in the Olifants Water Management Area (WMA4) - WP10536
Resource Unit Prioritisation Report
55
Figure 33: Map showing the location of prioritised wetlands for RQO determination in IUA2.
Table 22: Motivation for selected wetlands in IUA2.
Wetland Motivation
2.1 Elandsvlei pan
system
This cluster of pans was identified as an area of exceptional biodiversity
importance as part of the NFEPA process. They have also been highlighted as
providing important habitat for grass owls within a largely transformed catchment.
2.2 Koffiespruit tributary This wetland is largely intact and is likely to be a representative wetland of this
wetland vegetation group. Maintaining vegetation characteristics is regarded as
most important from a biodiversity perspective.
2.3 Delmas wetland This wetland is located in an urban context and downstream of a waste water
treatment works and old waste disposal facilities. Management of the waste water
treatment works is reportedly problematic with a blue drop score of 18% obtained
in 2011. The wetland is therefore well placed to improve poor water quality and
reduce potential negative health effects for local communities.
2.4 Bronkhorstspruit
tributary
This large, extensive unchannelled valley bottom wetland FEPA provides
important habitat for the African Grass Owl (Tyto Capensis). Given the agricultural
context and anticipated expansion of future mining operations, the wetland is also
well placed to improve water quality.
2.5 Wilge tributary This is one of few largely intact valley bottom wetlands that remain in the upper
Wilge catchment. The wetland system is also located within a priority mining area
and is therefore well placed to reduce water quality impacts.
2.6 Zaalklap wetland This naturally unchannelled valley bottom has been flagged as a wetland FEPA
based on its importance for biodiversity maintenance. The wetland supports
healthy populations of marsh owls whilst the reed beds are used for roosting by
large numbers of Cattle Egrets. Given the wetlands location directly downstream
of coal mining operations, the wetland is also well placed to improve water quality
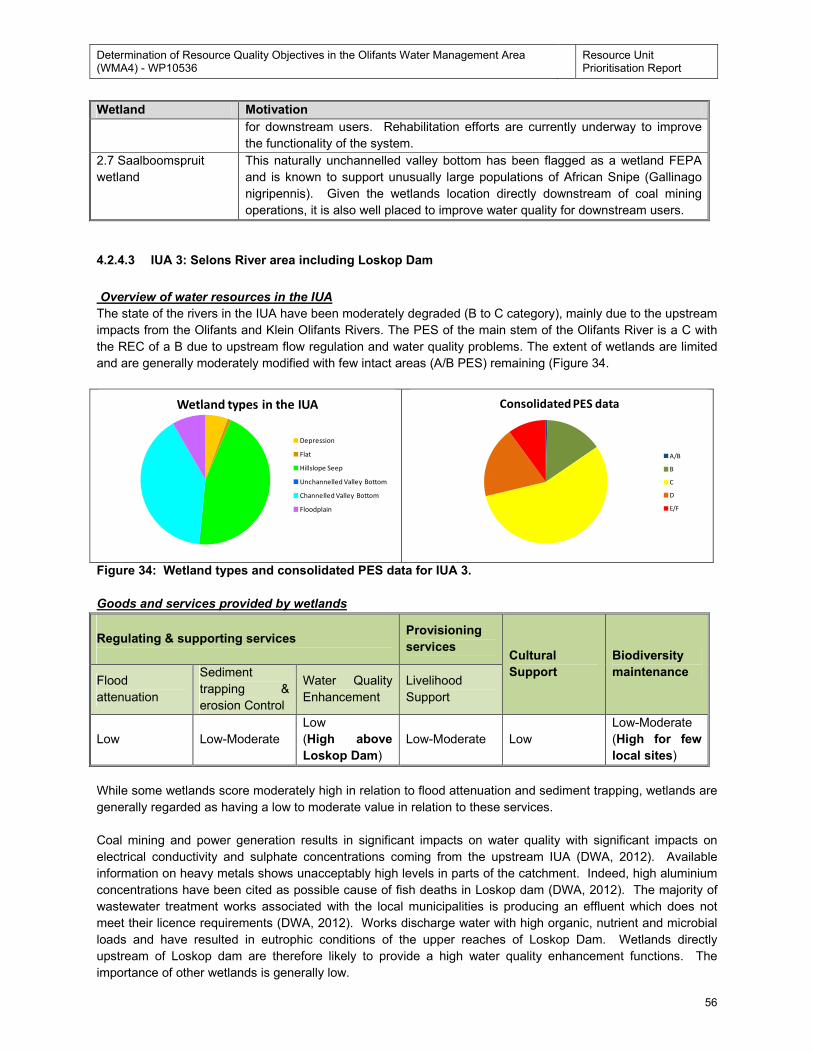
Determination of Resource Quality Objectives in the Olifants Water Management Area (WMA4) - WP10536
Resource Unit Prioritisation Report
56
Wetland Motivation
for downstream users. Rehabilitation efforts are currently underway to improve
the functionality of the system.
2.7 Saalboomspruit
wetland
This naturally unchannelled valley bottom has been flagged as a wetland FEPA
and is known to support unusually large populations of African Snipe (Gallinago
nigripennis). Given the wetlands location directly downstream of coal mining
operations, it is also well placed to improve water quality for downstream users.
4.2.4.3 IUA 3: Selons River area including Loskop Dam
Overview of water resources in the IUA
The state of the rivers in the IUA have been moderately degraded (B to C category), mainly due to the upstream
impacts from the Olifants and Klein Olifants Rivers. The PES of the main stem of the Olifants River is a C with
the REC of a B due to upstream flow regulation and water quality problems. The extent of wetlands are limited
and are generally moderately modified with few intact areas (A/B PES) remaining (Figure 34.
Figure 34: Wetland types and consolidated PES data for IUA 3.
Goods and services provided by wetlands
Regulating & supporting services
Provisioning
services Cultural
Support
Biodiversity
maintenance Flood
attenuation
Sediment
trapping &
erosion Control
Water Quality
Enhancement
Livelihood
Support
Low Low-Moderate
Low
(High above
Loskop Dam)
Low-Moderate Low
Low-Moderate
(High for few
local sites)
While some wetlands score moderately high in relation to flood attenuation and sediment trapping, wetlands are
generally regarded as having a low to moderate value in relation to these services.
Coal mining and power generation results in significant impacts on water quality with significant impacts on
electrical conductivity and sulphate concentrations coming from the upstream IUA (DWA, 2012). Available
information on heavy metals shows unacceptably high levels in parts of the catchment. Indeed, high aluminium
concentrations have been cited as possible cause of fish deaths in Loskop dam (DWA, 2012). The majority of
wastewater treatment works associated with the local municipalities is producing an effluent which does not
meet their licence requirements (DWA, 2012). Works discharge water with high organic, nutrient and microbial
loads and have resulted in eutrophic conditions of the upper reaches of Loskop Dam. Wetlands directly
upstream of Loskop dam are therefore likely to provide a high water quality enhancement functions. The
importance of other wetlands is generally low.
Wetland types in the IUA
Depression
Flat
Hillslope Seep
Unchannelled Valley Bottom
Channelled Valley Bottom
Floodplain
Consolidated PES data
A/B
B
C
D
E/F
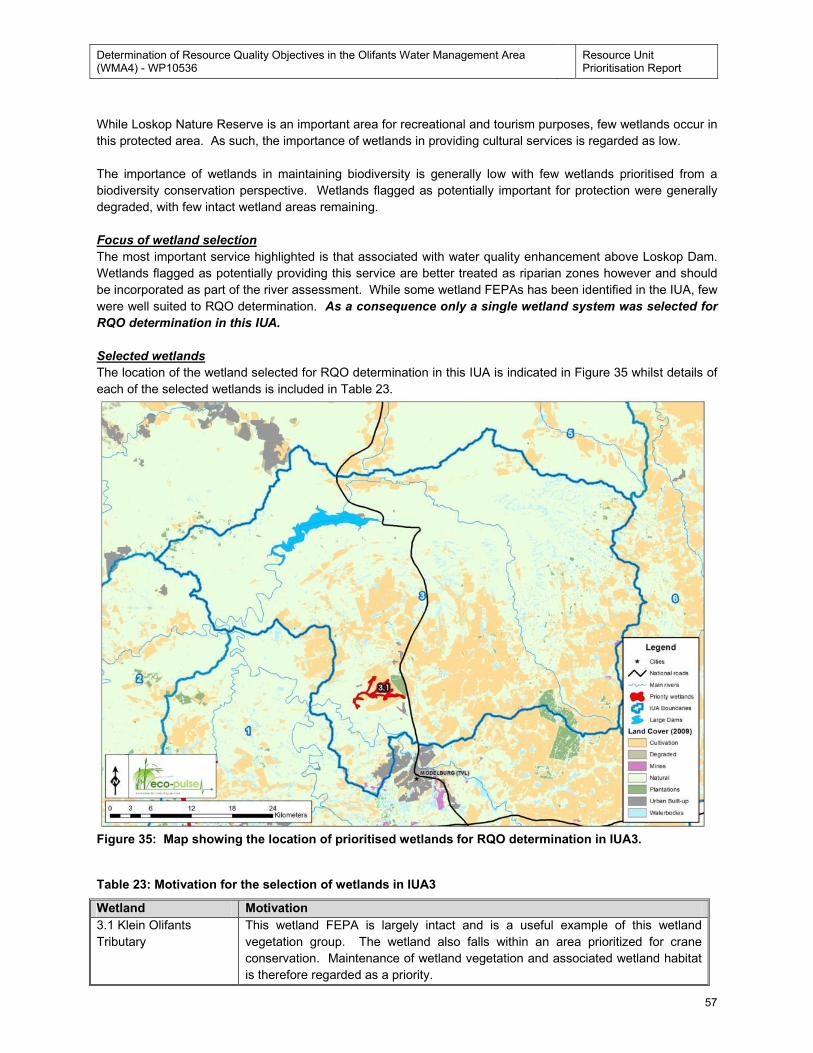
Determination of Resource Quality Objectives in the Olifants Water Management Area (WMA4) - WP10536
Resource Unit Prioritisation Report
57
While Loskop Nature Reserve is an important area for recreational and tourism purposes, few wetlands occur in
this protected area. As such, the importance of wetlands in providing cultural services is regarded as low.
The importance of wetlands in maintaining biodiversity is generally low with few wetlands prioritised from a
biodiversity conservation perspective. Wetlands flagged as potentially important for protection were generally
degraded, with few intact wetland areas remaining.
Focus of wetland selection
The most important service highlighted is that associated with water quality enhancement above Loskop Dam.
Wetlands flagged as potentially providing this service are better treated as riparian zones however and should
be incorporated as part of the river assessment. While some wetland FEPAs has been identified in the IUA, few
were well suited to RQO determination. As a consequence only a single wetland system was selected for
RQO determination in this IUA.
Selected wetlands
The location of the wetland selected for RQO determination in this IUA is indicated in Figure 35 whilst details of
each of the selected wetlands is included in Table 23.
Figure 35: Map showing the location of prioritised wetlands for RQO determination in IUA3.
Table 23: Motivation for the selection of wetlands in IUA3
Wetland Motivation
3.1 Klein Olifants
Tributary
This wetland FEPA is largely intact and is a useful example of this wetland
vegetation group. The wetland also falls within an area prioritized for crane
conservation. Maintenance of wetland vegetation and associated wetland habitat
is therefore regarded as a priority.
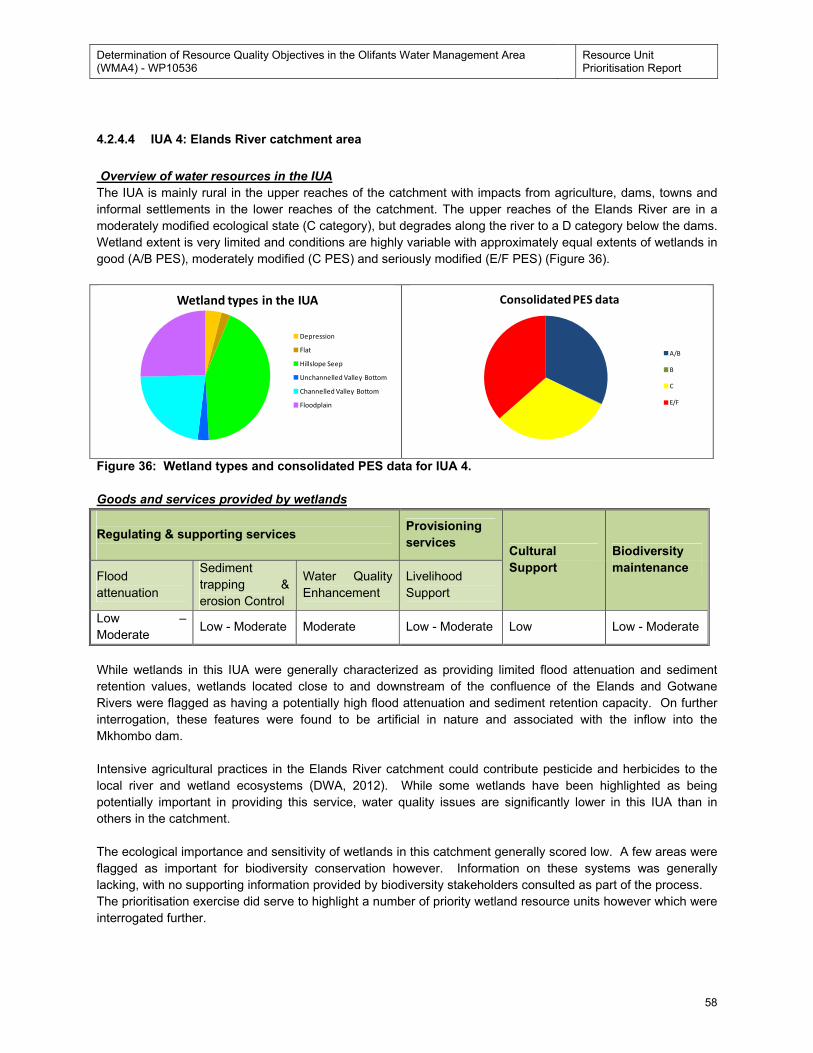
Determination of Resource Quality Objectives in the Olifants Water Management Area (WMA4) - WP10536
Resource Unit Prioritisation Report
58
4.2.4.4 IUA 4: Elands River catchment area
Overview of water resources in the IUA
The IUA is mainly rural in the upper reaches of the catchment with impacts from agriculture, dams, towns and
informal settlements in the lower reaches of the catchment. The upper reaches of the Elands River are in a
moderately modified ecological state (C category), but degrades along the river to a D category below the dams.
Wetland extent is very limited and conditions are highly variable with approximately equal extents of wetlands in
good (A/B PES), moderately modified (C PES) and seriously modified (E/F PES) (Figure 36).
Figure 36: Wetland types and consolidated PES data for IUA 4.
Goods and services provided by wetlands
Regulating & supporting services
Provisioning
services Cultural
Support
Biodiversity
maintenance Flood
attenuation
Sediment
trapping &
erosion Control
Water Quality
Enhancement
Livelihood
Support
Low –
Moderate Low - Moderate Moderate Low - Moderate Low Low - Moderate
While wetlands in this IUA were generally characterized as providing limited flood attenuation and sediment
retention values, wetlands located close to and downstream of the confluence of the Elands and Gotwane
Rivers were flagged as having a potentially high flood attenuation and sediment retention capacity. On further
interrogation, these features were found to be artificial in nature and associated with the inflow into the
Mkhombo dam.
Intensive agricultural practices in the Elands River catchment could contribute pesticide and herbicides to the
local river and wetland ecosystems (DWA, 2012). While some wetlands have been highlighted as being
potentially important in providing this service, water quality issues are significantly lower in this IUA than in
others in the catchment.
The ecological importance and sensitivity of wetlands in this catchment generally scored low. A few areas were
flagged as important for biodiversity conservation however. Information on these systems was generally
lacking, with no supporting information provided by biodiversity stakeholders consulted as part of the process.
The prioritisation exercise did serve to highlight a number of priority wetland resource units however which were
interrogated further.
Wetland types in the IUA
Depression
Flat
Hillslope Seep
Unchannelled Valley Bottom
Channelled Valley Bottom
Floodplain
Consolidated PES data
A/B
B
C
E/F
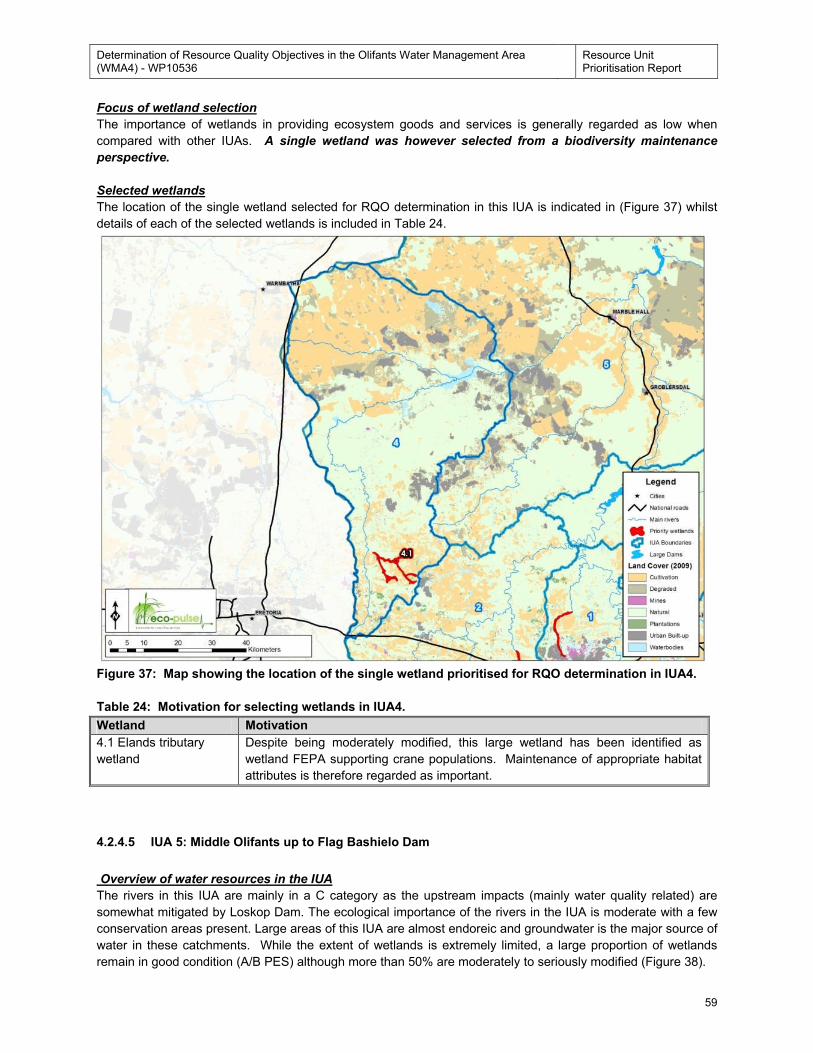
Determination of Resource Quality Objectives in the Olifants Water Management Area (WMA4) - WP10536
Resource Unit Prioritisation Report
59
Focus of wetland selection
The importance of wetlands in providing ecosystem goods and services is generally regarded as low when
compared with other IUAs. A single wetland was however selected from a biodiversity maintenance
perspective.
Selected wetlands
The location of the single wetland selected for RQO determination in this IUA is indicated in (Figure 37) whilst
details of each of the selected wetlands is included in Table 24.
Figure 37: Map showing the location of the single wetland prioritised for RQO determination in IUA4.
Table 24: Motivation for selecting wetlands in IUA4.
Wetland Motivation
4.1 Elands tributary
wetland
Despite being moderately modified, this large wetland has been identified as
wetland FEPA supporting crane populations. Maintenance of appropriate habitat
attributes is therefore regarded as important.
4.2.4.5 IUA 5: Middle Olifants up to Flag Bashielo Dam
Overview of water resources in the IUA
The rivers in this IUA are mainly in a C category as the upstream impacts (mainly water quality related) are
somewhat mitigated by Loskop Dam. The ecological importance of the rivers in the IUA is moderate with a few
conservation areas present. Large areas of this IUA are almost endoreic and groundwater is the major source of
water in these catchments. While the extent of wetlands is extremely limited, a large proportion of wetlands
remain in good condition (A/B PES) although more than 50% are moderately to seriously modified (Figure 38).
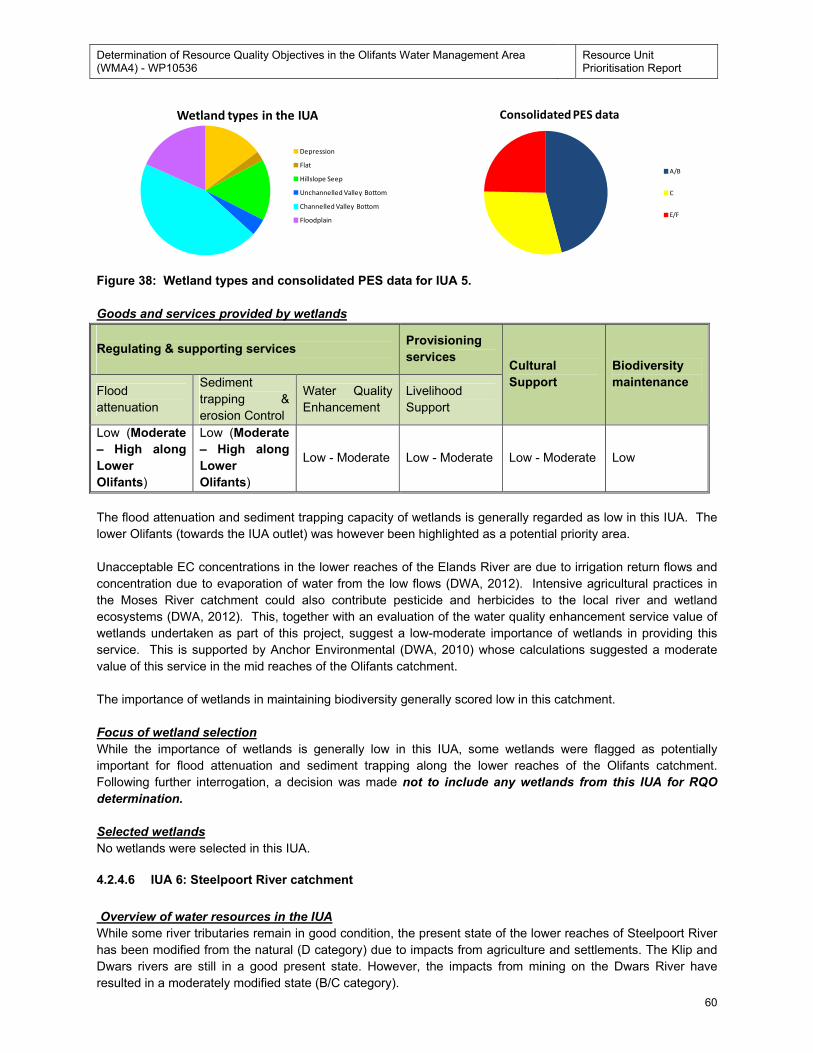
Determination of Resource Quality Objectives in the Olifants Water Management Area (WMA4) - WP10536
Resource Unit Prioritisation Report
60
Figure 38: Wetland types and consolidated PES data for IUA 5.
Goods and services provided by wetlands
Regulating & supporting services
Provisioning
services Cultural
Support
Biodiversity
maintenance Flood
attenuation
Sediment
trapping &
erosion Control
Water Quality
Enhancement
Livelihood
Support
Low (Moderate
– High along
Lower
Olifants)
Low (Moderate
– High along
Lower
Olifants)
Low - Moderate Low - Moderate Low - Moderate Low
The flood attenuation and sediment trapping capacity of wetlands is generally regarded as low in this IUA. The
lower Olifants (towards the IUA outlet) was however been highlighted as a potential priority area.
Unacceptable EC concentrations in the lower reaches of the Elands River are due to irrigation return flows and
concentration due to evaporation of water from the low flows (DWA, 2012). Intensive agricultural practices in
the Moses River catchment could also contribute pesticide and herbicides to the local river and wetland
ecosystems (DWA, 2012). This, together with an evaluation of the water quality enhancement service value of
wetlands undertaken as part of this project, suggest a low-moderate importance of wetlands in providing this
service. This is supported by Anchor Environmental (DWA, 2010) whose calculations suggested a moderate
value of this service in the mid reaches of the Olifants catchment.
The importance of wetlands in maintaining biodiversity generally scored low in this catchment.
Focus of wetland selection
While the importance of wetlands is generally low in this IUA, some wetlands were flagged as potentially
important for flood attenuation and sediment trapping along the lower reaches of the Olifants catchment.
Following further interrogation, a decision was made not to include any wetlands from this IUA for RQO
determination.
Selected wetlands
No wetlands were selected in this IUA.
4.2.4.6 IUA 6: Steelpoort River catchment
Overview of water resources in the IUA
While some river tributaries remain in good condition, the present state of the lower reaches of Steelpoort River
has been modified from the natural (D category) due to impacts from agriculture and settlements. The Klip and
Dwars rivers are still in a good present state. However, the impacts from mining on the Dwars River have
resulted in a moderately modified state (B/C category).
Wetland types in the IUA
Depression
Flat
Hillslope Seep
Unchannelled Valley Bottom
Channelled Valley Bottom
Floodplain
Consolidated PES data
A/B
C
E/F
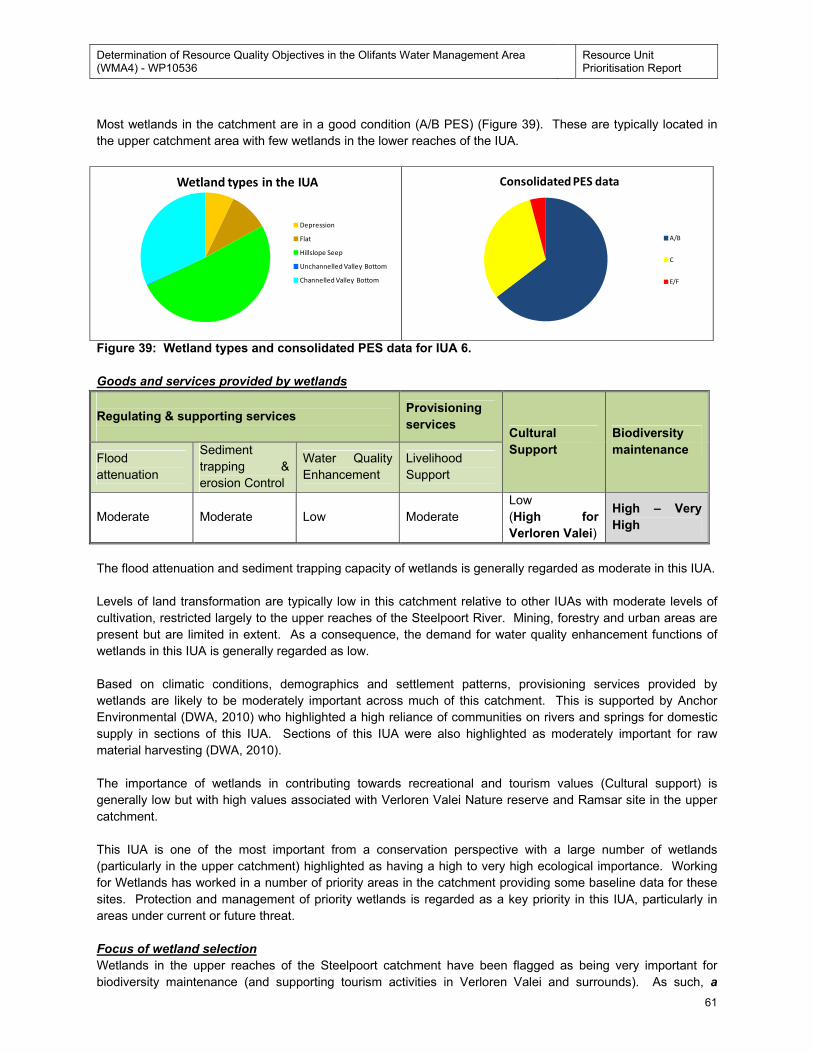
Determination of Resource Quality Objectives in the Olifants Water Management Area (WMA4) - WP10536
Resource Unit Prioritisation Report
61
Most wetlands in the catchment are in a good condition (A/B PES) (Figure 39). These are typically located in
the upper catchment area with few wetlands in the lower reaches of the IUA.
Figure 39: Wetland types and consolidated PES data for IUA 6.
Goods and services provided by wetlands
Regulating & supporting services
Provisioning
services Cultural
Support
Biodiversity
maintenance Flood
attenuation
Sediment
trapping &
erosion Control
Water Quality
Enhancement
Livelihood
Support
Moderate Moderate Low Moderate
Low
(High for
Verloren Valei)
High – Very
High
The flood attenuation and sediment trapping capacity of wetlands is generally regarded as moderate in this IUA.
Levels of land transformation are typically low in this catchment relative to other IUAs with moderate levels of
cultivation, restricted largely to the upper reaches of the Steelpoort River. Mining, forestry and urban areas are
present but are limited in extent. As a consequence, the demand for water quality enhancement functions of
wetlands in this IUA is generally regarded as low.
Based on climatic conditions, demographics and settlement patterns, provisioning services provided by
wetlands are likely to be moderately important across much of this catchment. This is supported by Anchor
Environmental (DWA, 2010) who highlighted a high reliance of communities on rivers and springs for domestic
supply in sections of this IUA. Sections of this IUA were also highlighted as moderately important for raw
material harvesting (DWA, 2010).
The importance of wetlands in contributing towards recreational and tourism values (Cultural support) is
generally low but with high values associated with Verloren Valei Nature reserve and Ramsar site in the upper
catchment.
This IUA is one of the most important from a conservation perspective with a large number of wetlands
(particularly in the upper catchment) highlighted as having a high to very high ecological importance. Working
for Wetlands has worked in a number of priority areas in the catchment providing some baseline data for these
sites. Protection and management of priority wetlands is regarded as a key priority in this IUA, particularly in
areas under current or future threat.
Focus of wetland selection
Wetlands in the upper reaches of the Steelpoort catchment have been flagged as being very important for
biodiversity maintenance (and supporting tourism activities in Verloren Valei and surrounds). As such, a
Wetland types in the IUA
Depression
Flat
Hillslope Seep
Unchannelled Valley Bottom
Channelled Valley Bottom
Consolidated PES data
A/B
C
E/F
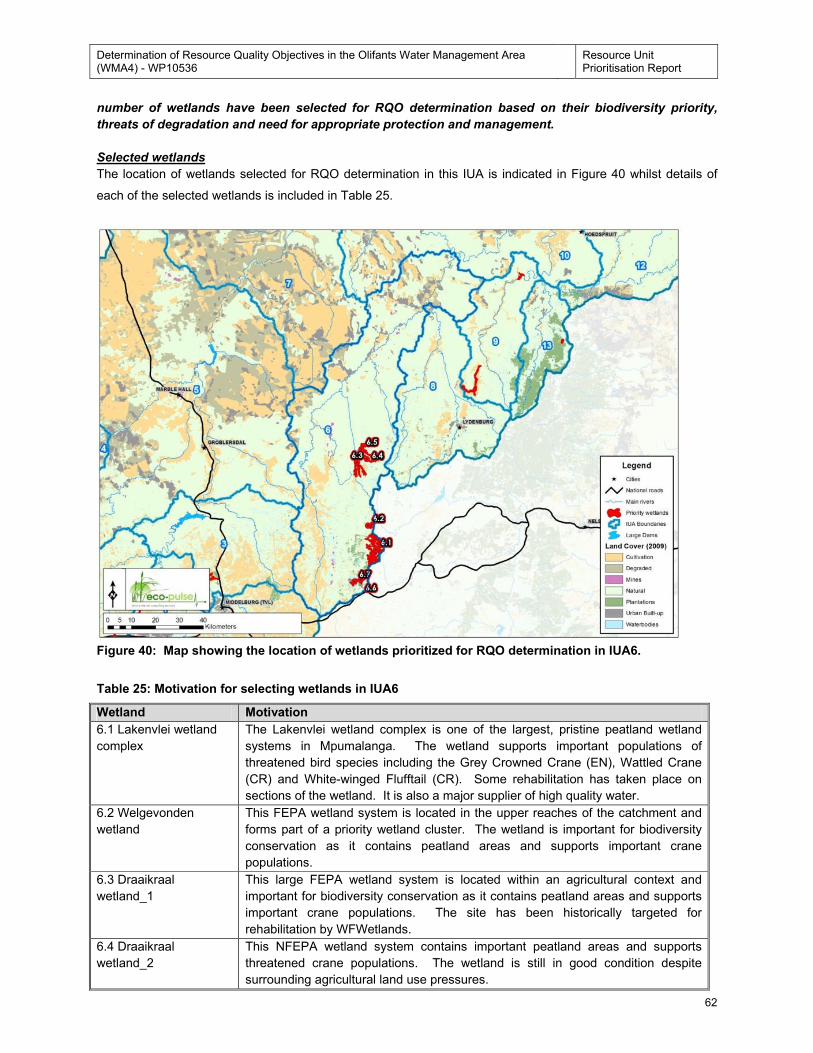
Determination of Resource Quality Objectives in the Olifants Water Management Area (WMA4) - WP10536
Resource Unit Prioritisation Report
62
number of wetlands have been selected for RQO determination based on their biodiversity priority,
threats of degradation and need for appropriate protection and management.
Selected wetlands
The location of wetlands selected for RQO determination in this IUA is indicated in Figure 40 whilst details of
each of the selected wetlands is included in Table 25.
Figure 40: Map showing the location of wetlands prioritized for RQO determination in IUA6.
Table 25: Motivation for selecting wetlands in IUA6
Wetland Motivation
6.1 Lakenvlei wetland
complex
The Lakenvlei wetland complex is one of the largest, pristine peatland wetland
systems in Mpumalanga. The wetland supports important populations of
threatened bird species including the Grey Crowned Crane (EN), Wattled Crane
(CR) and White-winged Flufftail (CR). Some rehabilitation has taken place on
sections of the wetland. It is also a major supplier of high quality water.
6.2 Welgevonden
wetland
This FEPA wetland system is located in the upper reaches of the catchment and
forms part of a priority wetland cluster. The wetland is important for biodiversity
conservation as it contains peatland areas and supports important crane
populations.
6.3 Draaikraal
wetland_1
This large FEPA wetland system is located within an agricultural context and
important for biodiversity conservation as it contains peatland areas and supports
important crane populations. The site has been historically targeted for
rehabilitation by WFWetlands.
6.4 Draaikraal
wetland_2
This NFEPA wetland system contains important peatland areas and supports
threatened crane populations. The wetland is still in good condition despite
surrounding agricultural land use pressures.
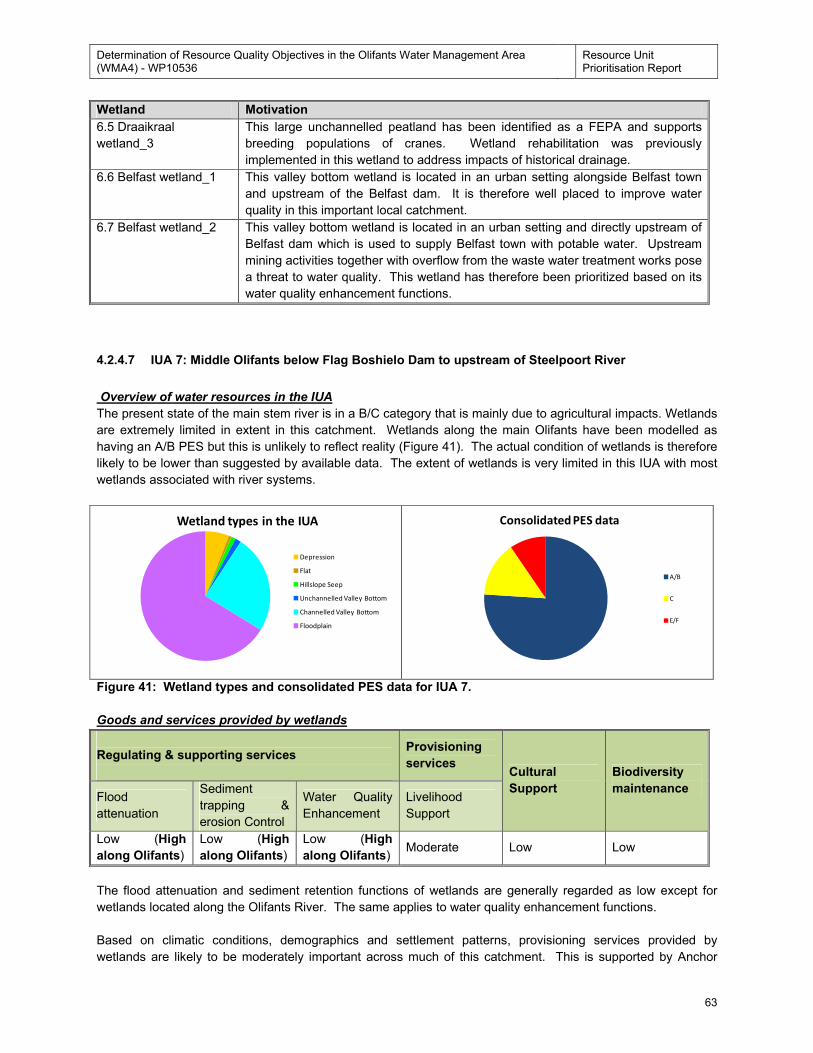
Determination of Resource Quality Objectives in the Olifants Water Management Area (WMA4) - WP10536
Resource Unit Prioritisation Report
63
Wetland Motivation
6.5 Draaikraal
wetland_3
This large unchannelled peatland has been identified as a FEPA and supports
breeding populations of cranes. Wetland rehabilitation was previously
implemented in this wetland to address impacts of historical drainage.
6.6 Belfast wetland_1 This valley bottom wetland is located in an urban setting alongside Belfast town
and upstream of the Belfast dam. It is therefore well placed to improve water
quality in this important local catchment.
6.7 Belfast wetland_2 This valley bottom wetland is located in an urban setting and directly upstream of
Belfast dam which is used to supply Belfast town with potable water. Upstream
mining activities together with overflow from the waste water treatment works pose
a threat to water quality. This wetland has therefore been prioritized based on its
water quality enhancement functions.
4.2.4.7 IUA 7: Middle Olifants below Flag Boshielo Dam to upstream of Steelpoort River
Overview of water resources in the IUA
The present state of the main stem river is in a B/C category that is mainly due to agricultural impacts. Wetlands
are extremely limited in extent in this catchment. Wetlands along the main Olifants have been modelled as
having an A/B PES but this is unlikely to reflect reality (Figure 41). The actual condition of wetlands is therefore
likely to be lower than suggested by available data. The extent of wetlands is very limited in this IUA with most
wetlands associated with river systems.
Figure 41: Wetland types and consolidated PES data for IUA 7.
Goods and services provided by wetlands
Regulating & supporting services
Provisioning
services Cultural
Support
Biodiversity
maintenance Flood
attenuation
Sediment
trapping &
erosion Control
Water Quality
Enhancement
Livelihood
Support
Low (High
along Olifants)
Low (High
along Olifants)
Low (High
along Olifants) Moderate Low Low
The flood attenuation and sediment retention functions of wetlands are generally regarded as low except for
wetlands located along the Olifants River. The same applies to water quality enhancement functions.
Based on climatic conditions, demographics and settlement patterns, provisioning services provided by
wetlands are likely to be moderately important across much of this catchment. This is supported by Anchor
Wetland types in the IUA
Depression
Flat
Hillslope Seep
Unchannelled Valley Bottom
Channelled Valley Bottom
Floodplain
Consolidated PES data
A/B
C
E/F
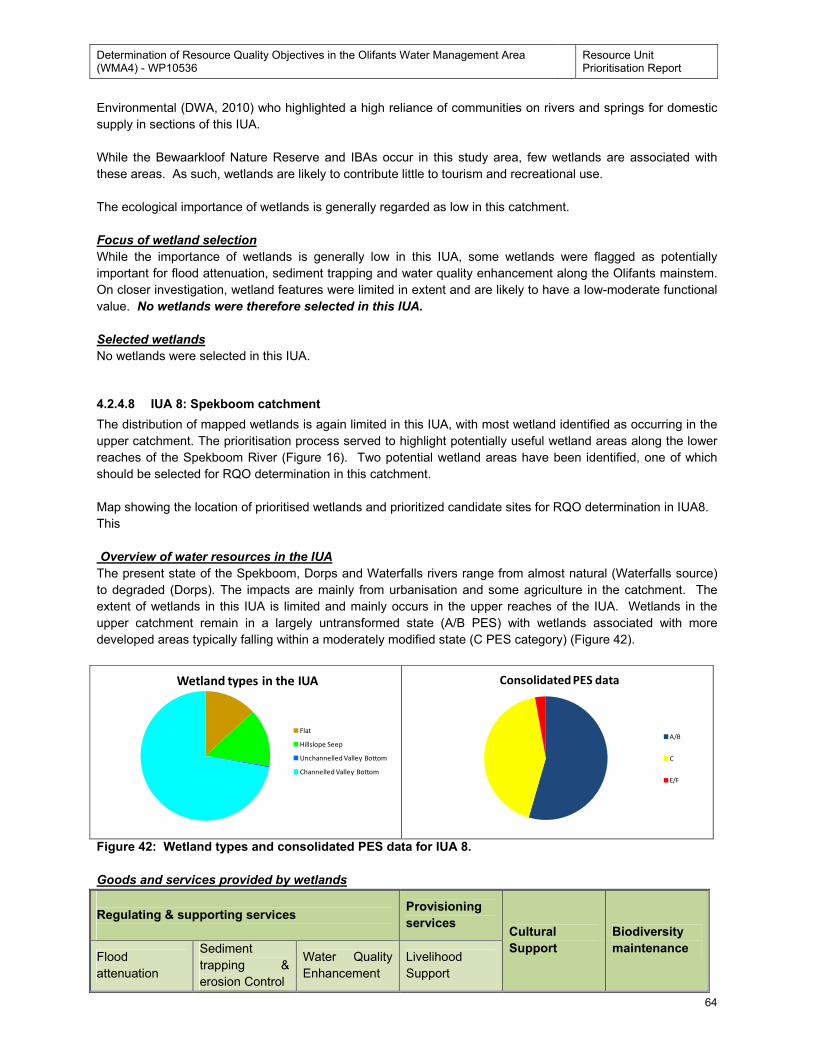
Determination of Resource Quality Objectives in the Olifants Water Management Area (WMA4) - WP10536
Resource Unit Prioritisation Report
64
Environmental (DWA, 2010) who highlighted a high reliance of communities on rivers and springs for domestic
supply in sections of this IUA.
While the Bewaarkloof Nature Reserve and IBAs occur in this study area, few wetlands are associated with
these areas. As such, wetlands are likely to contribute little to tourism and recreational use.
The ecological importance of wetlands is generally regarded as low in this catchment.
Focus of wetland selection
While the importance of wetlands is generally low in this IUA, some wetlands were flagged as potentially
important for flood attenuation, sediment trapping and water quality enhancement along the Olifants mainstem.
On closer investigation, wetland features were limited in extent and are likely to have a low-moderate functional
value. No wetlands were therefore selected in this IUA.
Selected wetlands
No wetlands were selected in this IUA.
4.2.4.8 IUA 8: Spekboom catchment
The distribution of mapped wetlands is again limited in this IUA, with most wetland identified as occurring in the
upper catchment. The prioritisation process served to highlight potentially useful wetland areas along the lower
reaches of the Spekboom River (Figure 16). Two potential wetland areas have been identified, one of which
should be selected for RQO determination in this catchment.
Map showing the location of prioritised wetlands and prioritized candidate sites for RQO determination in IUA8.
This
Overview of water resources in the IUA
The present state of the Spekboom, Dorps and Waterfalls rivers range from almost natural (Waterfalls source)
to degraded (Dorps). The impacts are mainly from urbanisation and some agriculture in the catchment. The
extent of wetlands in this IUA is limited and mainly occurs in the upper reaches of the IUA. Wetlands in the
upper catchment remain in a largely untransformed state (A/B PES) with wetlands associated with more
developed areas typically falling within a moderately modified state (C PES category) (Figure 42).
Figure 42: Wetland types and consolidated PES data for IUA 8.
Goods and services provided by wetlands
Regulating & supporting services
Provisioning
services Cultural
Support
Biodiversity
maintenance Flood
attenuation
Sediment
trapping &
erosion Control
Water Quality
Enhancement
Livelihood
Support
Wetland types in the IUA
Flat
Hillslope Seep
Unchannelled Valley Bottom
Channelled Valley Bottom
Consolidated PES data
A/B
C
E/F
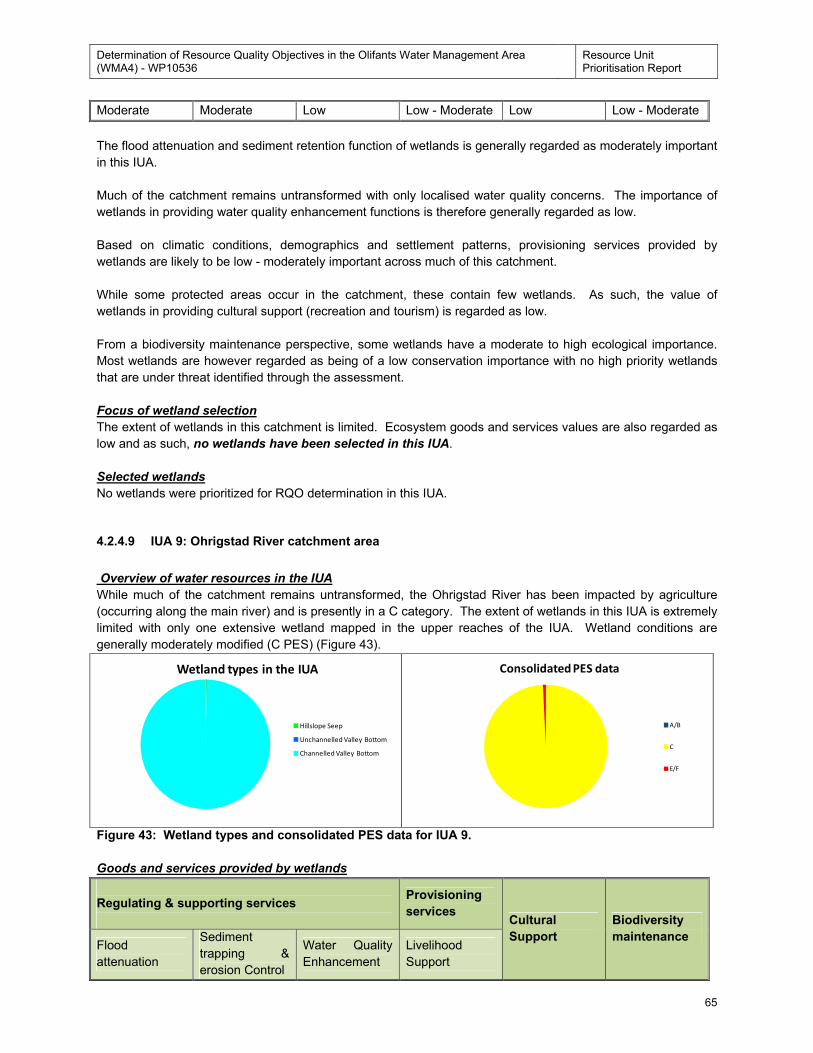
Determination of Resource Quality Objectives in the Olifants Water Management Area (WMA4) - WP10536
Resource Unit Prioritisation Report
65
Moderate Moderate Low Low - Moderate Low Low - Moderate
The flood attenuation and sediment retention function of wetlands is generally regarded as moderately important
in this IUA.
Much of the catchment remains untransformed with only localised water quality concerns. The importance of
wetlands in providing water quality enhancement functions is therefore generally regarded as low.
Based on climatic conditions, demographics and settlement patterns, provisioning services provided by
wetlands are likely to be low - moderately important across much of this catchment.
While some protected areas occur in the catchment, these contain few wetlands. As such, the value of
wetlands in providing cultural support (recreation and tourism) is regarded as low.
From a biodiversity maintenance perspective, some wetlands have a moderate to high ecological importance.
Most wetlands are however regarded as being of a low conservation importance with no high priority wetlands
that are under threat identified through the assessment.
Focus of wetland selection
The extent of wetlands in this catchment is limited. Ecosystem goods and services values are also regarded as
low and as such, no wetlands have been selected in this IUA.
Selected wetlands
No wetlands were prioritized for RQO determination in this IUA.
4.2.4.9 IUA 9: Ohrigstad River catchment area
Overview of water resources in the IUA
While much of the catchment remains untransformed, the Ohrigstad River has been impacted by agriculture
(occurring along the main river) and is presently in a C category. The extent of wetlands in this IUA is extremely
limited with only one extensive wetland mapped in the upper reaches of the IUA. Wetland conditions are
generally moderately modified (C PES) (Figure 43).
Figure 43: Wetland types and consolidated PES data for IUA 9.
Goods and services provided by wetlands
Regulating & supporting services
Provisioning
services Cultural
Support
Biodiversity
maintenance Flood
attenuation
Sediment
trapping &
erosion Control
Water Quality
Enhancement
Livelihood
Support
Wetland types in the IUA
Hillslope Seep
Unchannelled Valley Bottom
Channelled Valley Bottom
Consolidated PES data
A/B
C
E/F
Determination of Resource Quality Objectives in the Olifants Water Management Area (WMA4) - WP10536
Resource Unit Prioritisation Report
66
Moderate Moderate Low Low (High) Low Low (High)
The flood attenuation and sediment retention function of wetlands is generally regarded as moderately important
in this IUA.
Much of the catchment remains untransformed with only localised water quality concerns. Mapped wetlands
are typically not associated with areas of water quality concerns. As such, water quality enhancement functions
provided by wetlands in this catchment are generally regarded as low.
The importance of wetlands in maintaining livelihood support and promoting cultural services was rated as
extremely limited based on the desktop assessment. A number of wetlands are used extensively for
subsistence purposes however, suggesting that some wetland areas provide an important livelihood support
function.
Wetlands are generally regarded as being of low ecological importance in this catchment. A large wetland in
the upper catchment has however been flagged as being of high ecological concern.
Focus of wetland selection
The extent of wetlands in this catchment is limited. Ecosystem goods and services values are also regarded as
low with few wetlands flagged as playing an important functional role. A single wetland along the lower
reaches of the Ohrigstad River has been prioritised as an indicator wetland where a balance between
maintenance of regulating and supporting services and subsistence use has been flagged as important.
An additional wetland flagged as being of high ecological concern has also been selected for RQO
determination in the upper catchment of this IUA.
Selected wetlands
The location of wetlands selected for RQO determination in this IUA is indicated in Figure 44 whilst details of
each of the selected wetlands is included in Table 26.
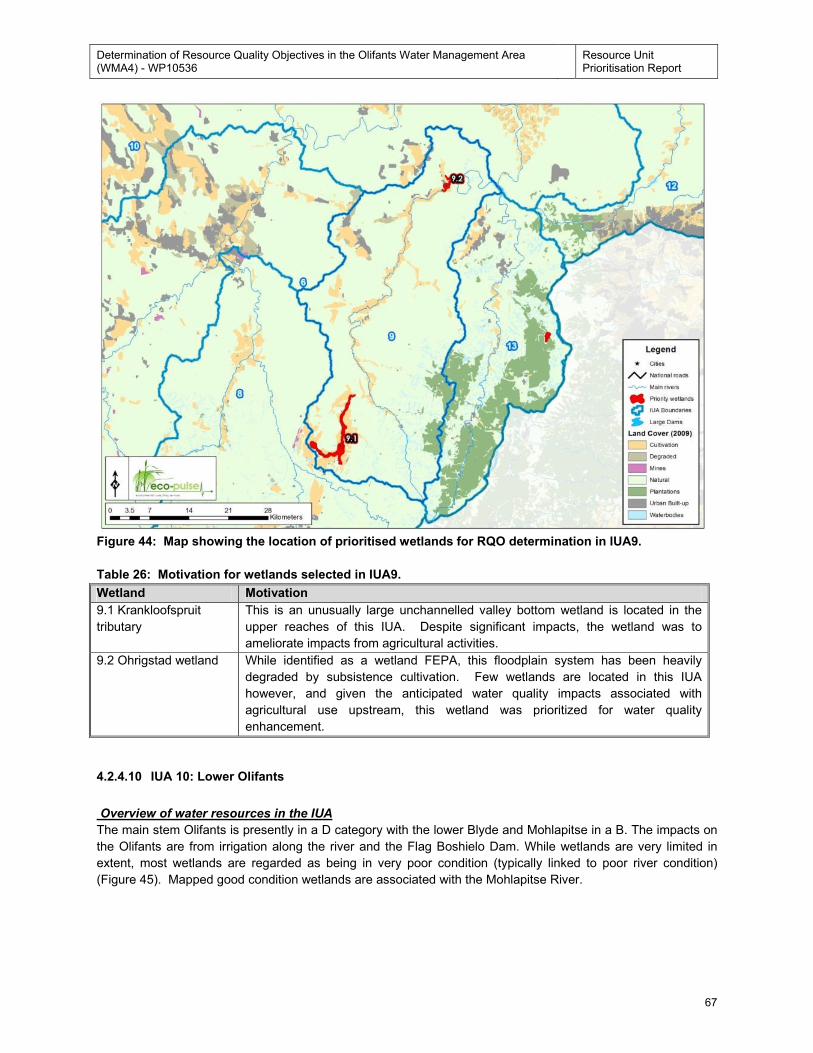
Determination of Resource Quality Objectives in the Olifants Water Management Area (WMA4) - WP10536
Resource Unit Prioritisation Report
67
Figure 44: Map showing the location of prioritised wetlands for RQO determination in IUA9.
Table 26: Motivation for wetlands selected in IUA9.
Wetland Motivation
9.1 Krankloofspruit
tributary
This is an unusually large unchannelled valley bottom wetland is located in the
upper reaches of this IUA. Despite significant impacts, the wetland was to
ameliorate impacts from agricultural activities.
9.2 Ohrigstad wetland While identified as a wetland FEPA, this floodplain system has been heavily
degraded by subsistence cultivation. Few wetlands are located in this IUA
however, and given the anticipated water quality impacts associated with
agricultural use upstream, this wetland was prioritized for water quality
enhancement.
4.2.4.10 IUA 10: Lower Olifants
Overview of water resources in the IUA
The main stem Olifants is presently in a D category with the lower Blyde and Mohlapitse in a B. The impacts on
the Olifants are from irrigation along the river and the Flag Boshielo Dam. While wetlands are very limited in
extent, most wetlands are regarded as being in very poor condition (typically linked to poor river condition)
(Figure 45). Mapped good condition wetlands are associated with the Mohlapitse River.
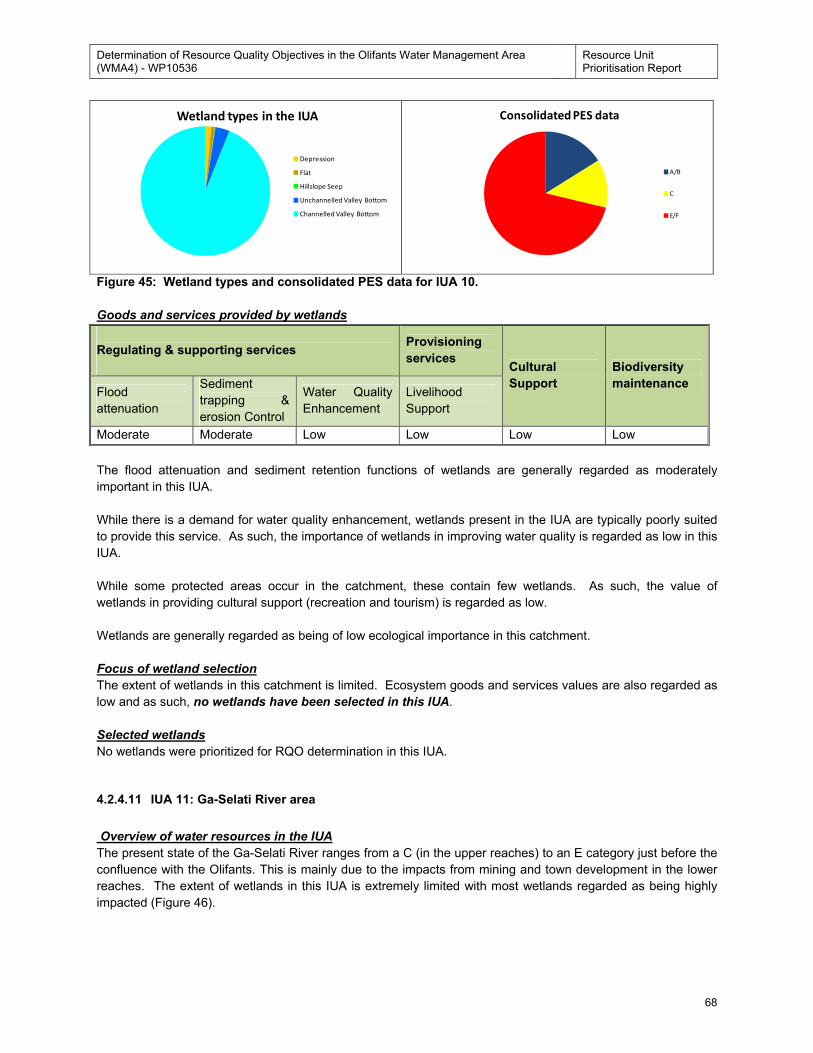
Determination of Resource Quality Objectives in the Olifants Water Management Area (WMA4) - WP10536
Resource Unit Prioritisation Report
68
Figure 45: Wetland types and consolidated PES data for IUA 10.
Goods and services provided by wetlands
Regulating & supporting services
Provisioning
services Cultural
Support
Biodiversity
maintenance Flood
attenuation
Sediment
trapping &
erosion Control
Water Quality
Enhancement
Livelihood
Support
Moderate Moderate Low Low Low Low
The flood attenuation and sediment retention functions of wetlands are generally regarded as moderately
important in this IUA.
While there is a demand for water quality enhancement, wetlands present in the IUA are typically poorly suited
to provide this service. As such, the importance of wetlands in improving water quality is regarded as low in this
IUA.
While some protected areas occur in the catchment, these contain few wetlands. As such, the value of
wetlands in providing cultural support (recreation and tourism) is regarded as low.
Wetlands are generally regarded as being of low ecological importance in this catchment.
Focus of wetland selection
The extent of wetlands in this catchment is limited. Ecosystem goods and services values are also regarded as
low and as such, no wetlands have been selected in this IUA.
Selected wetlands
No wetlands were prioritized for RQO determination in this IUA.
4.2.4.11 IUA 11: Ga-Selati River area
Overview of water resources in the IUA
The present state of the Ga-Selati River ranges from a C (in the upper reaches) to an E category just before the
confluence with the Olifants. This is mainly due to the impacts from mining and town development in the lower
reaches. The extent of wetlands in this IUA is extremely limited with most wetlands regarded as being highly
impacted (Figure 46).
Wetland types in the IUA
Depression
Flat
Hillslope Seep
Unchannelled Valley Bottom
Channelled Valley Bottom
Consolidated PES data
A/B
C
E/F
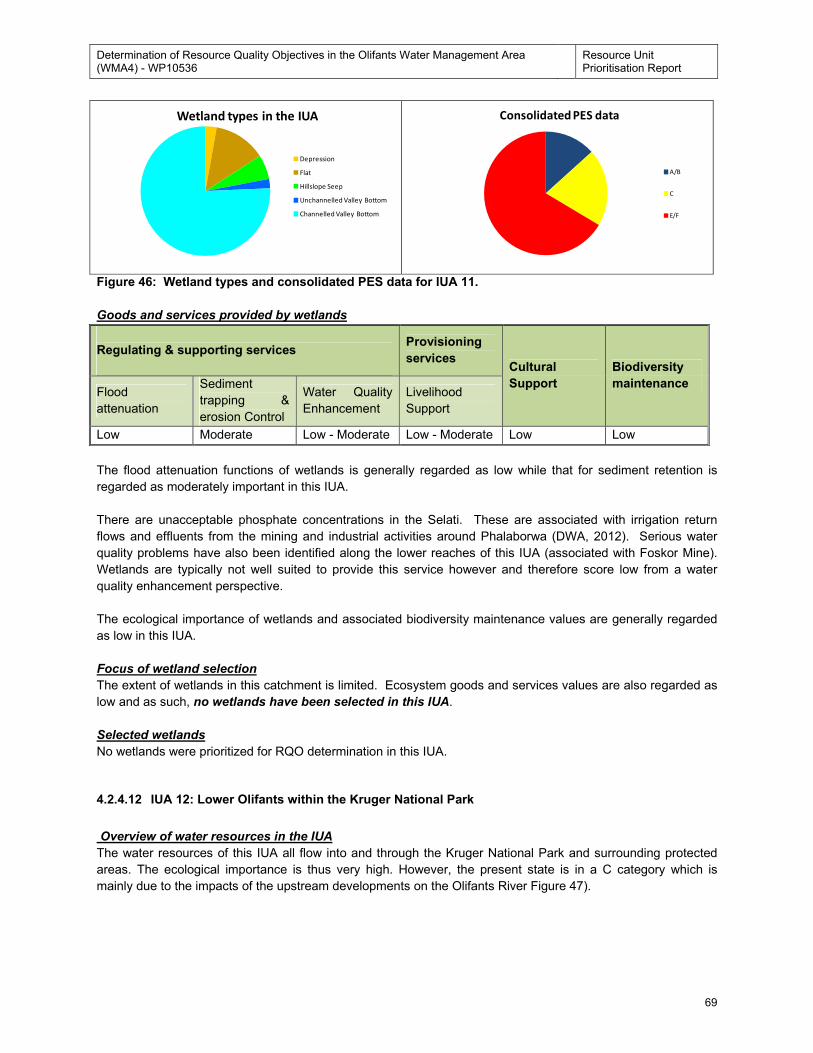
Determination of Resource Quality Objectives in the Olifants Water Management Area (WMA4) - WP10536
Resource Unit Prioritisation Report
69
Figure 46: Wetland types and consolidated PES data for IUA 11.
Goods and services provided by wetlands
Regulating & supporting services
Provisioning
services Cultural
Support
Biodiversity
maintenance Flood
attenuation
Sediment
trapping &
erosion Control
Water Quality
Enhancement
Livelihood
Support
Low Moderate Low - Moderate Low - Moderate Low Low
The flood attenuation functions of wetlands is generally regarded as low while that for sediment retention is
regarded as moderately important in this IUA.
There are unacceptable phosphate concentrations in the Selati. These are associated with irrigation return
flows and effluents from the mining and industrial activities around Phalaborwa (DWA, 2012). Serious water
quality problems have also been identified along the lower reaches of this IUA (associated with Foskor Mine).
Wetlands are typically not well suited to provide this service however and therefore score low from a water
quality enhancement perspective.
The ecological importance of wetlands and associated biodiversity maintenance values are generally regarded
as low in this IUA.
Focus of wetland selection
The extent of wetlands in this catchment is limited. Ecosystem goods and services values are also regarded as
low and as such, no wetlands have been selected in this IUA.
Selected wetlands
No wetlands were prioritized for RQO determination in this IUA.
4.2.4.12 IUA 12: Lower Olifants within the Kruger National Park
Overview of water resources in the IUA
The water resources of this IUA all flow into and through the Kruger National Park and surrounding protected
areas. The ecological importance is thus very high. However, the present state is in a C category which is
mainly due to the impacts of the upstream developments on the Olifants River Figure 47).
Wetland types in the IUA
Depression
Flat
Hillslope Seep
Unchannelled Valley Bottom
Channelled Valley Bottom
Consolidated PES data
A/B
C
E/F
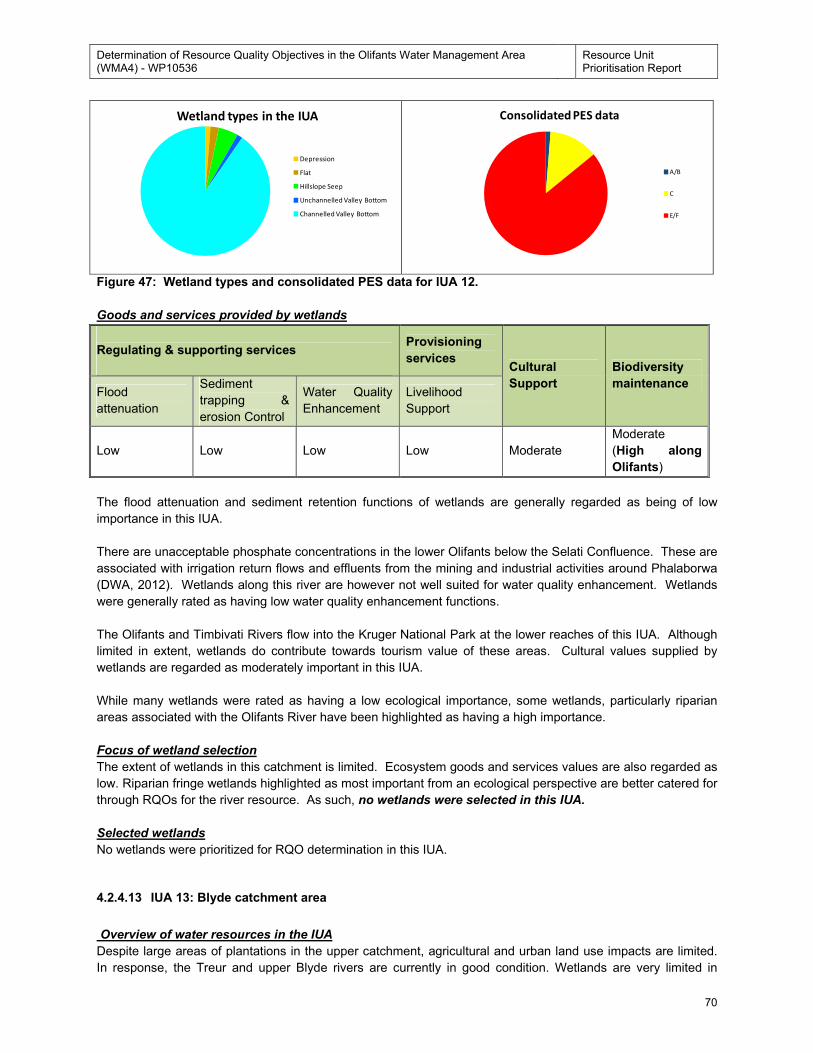
Determination of Resource Quality Objectives in the Olifants Water Management Area (WMA4) - WP10536
Resource Unit Prioritisation Report
70
Figure 47: Wetland types and consolidated PES data for IUA 12.
Goods and services provided by wetlands
Regulating & supporting services
Provisioning
services Cultural
Support
Biodiversity
maintenance Flood
attenuation
Sediment
trapping &
erosion Control
Water Quality
Enhancement
Livelihood
Support
Low Low Low Low Moderate
Moderate
(High along
Olifants)
The flood attenuation and sediment retention functions of wetlands are generally regarded as being of low
importance in this IUA.
There are unacceptable phosphate concentrations in the lower Olifants below the Selati Confluence. These are
associated with irrigation return flows and effluents from the mining and industrial activities around Phalaborwa
(DWA, 2012). Wetlands along this river are however not well suited for water quality enhancement. Wetlands
were generally rated as having low water quality enhancement functions.
The Olifants and Timbivati Rivers flow into the Kruger National Park at the lower reaches of this IUA. Although
limited in extent, wetlands do contribute towards tourism value of these areas. Cultural values supplied by
wetlands are regarded as moderately important in this IUA.
While many wetlands were rated as having a low ecological importance, some wetlands, particularly riparian
areas associated with the Olifants River have been highlighted as having a high importance.
Focus of wetland selection
The extent of wetlands in this catchment is limited. Ecosystem goods and services values are also regarded as
low. Riparian fringe wetlands highlighted as most important from an ecological perspective are better catered for
through RQOs for the river resource. As such, no wetlands were selected in this IUA.
Selected wetlands
No wetlands were prioritized for RQO determination in this IUA.
4.2.4.13 IUA 13: Blyde catchment area
Overview of water resources in the IUA
Despite large areas of plantations in the upper catchment, agricultural and urban land use impacts are limited.
In response, the Treur and upper Blyde rivers are currently in good condition. Wetlands are very limited in
Wetland types in the IUA
Depression
Flat
Hillslope Seep
Unchannelled Valley Bottom
Channelled Valley Bottom
Consolidated PES data
A/B
C
E/F
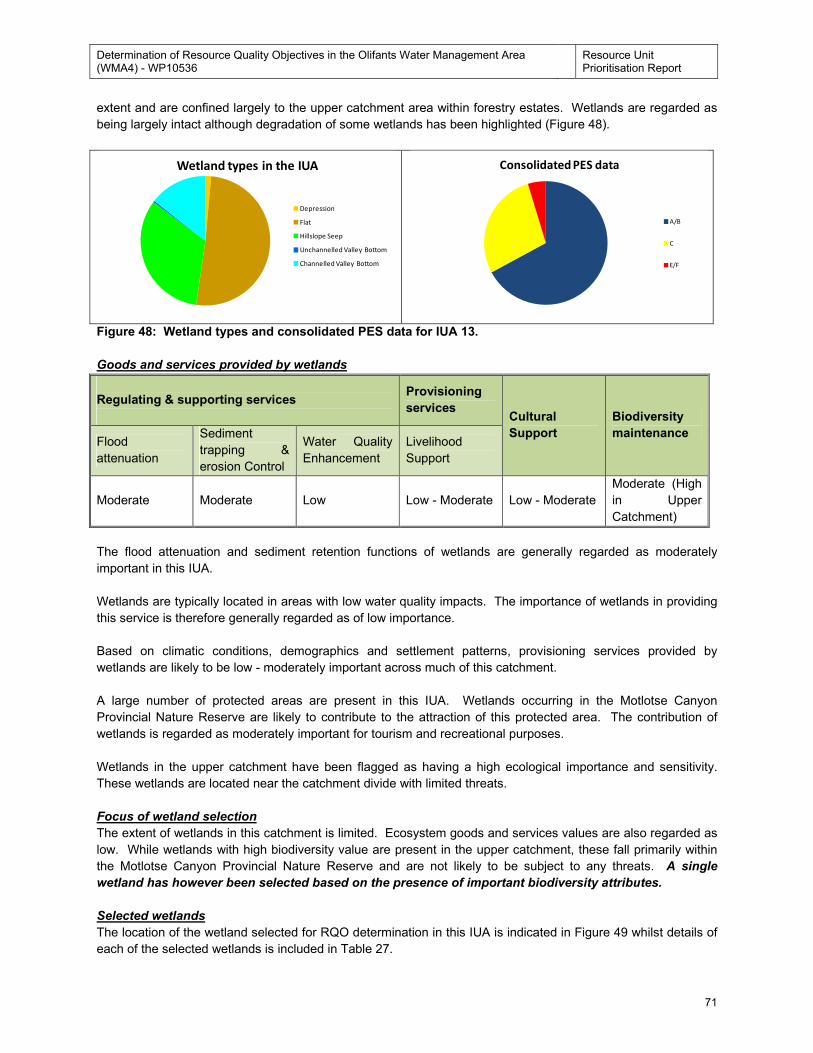
Determination of Resource Quality Objectives in the Olifants Water Management Area (WMA4) - WP10536
Resource Unit Prioritisation Report
71
extent and are confined largely to the upper catchment area within forestry estates. Wetlands are regarded as
being largely intact although degradation of some wetlands has been highlighted (Figure 48).
Figure 48: Wetland types and consolidated PES data for IUA 13.
Goods and services provided by wetlands
Regulating & supporting services
Provisioning
services Cultural
Support
Biodiversity
maintenance Flood
attenuation
Sediment
trapping &
erosion Control
Water Quality
Enhancement
Livelihood
Support
Moderate Moderate Low Low - Moderate Low - Moderate
Moderate (High
in Upper
Catchment)
The flood attenuation and sediment retention functions of wetlands are generally regarded as moderately
important in this IUA.
Wetlands are typically located in areas with low water quality impacts. The importance of wetlands in providing
this service is therefore generally regarded as of low importance.
Based on climatic conditions, demographics and settlement patterns, provisioning services provided by
wetlands are likely to be low - moderately important across much of this catchment.
A large number of protected areas are present in this IUA. Wetlands occurring in the Motlotse Canyon
Provincial Nature Reserve are likely to contribute to the attraction of this protected area. The contribution of
wetlands is regarded as moderately important for tourism and recreational purposes.
Wetlands in the upper catchment have been flagged as having a high ecological importance and sensitivity.
These wetlands are located near the catchment divide with limited threats.
Focus of wetland selection
The extent of wetlands in this catchment is limited. Ecosystem goods and services values are also regarded as
low. While wetlands with high biodiversity value are present in the upper catchment, these fall primarily within
the Motlotse Canyon Provincial Nature Reserve and are not likely to be subject to any threats. A single
wetland has however been selected based on the presence of important biodiversity attributes.
Selected wetlands
The location of the wetland selected for RQO determination in this IUA is indicated in Figure 49 whilst details of
each of the selected wetlands is included in Table 27.
Wetland types in the IUA
Depression
Flat
Hillslope Seep
Unchannelled Valley Bottom
Channelled Valley Bottom
Consolidated PES data
A/B
C
E/F
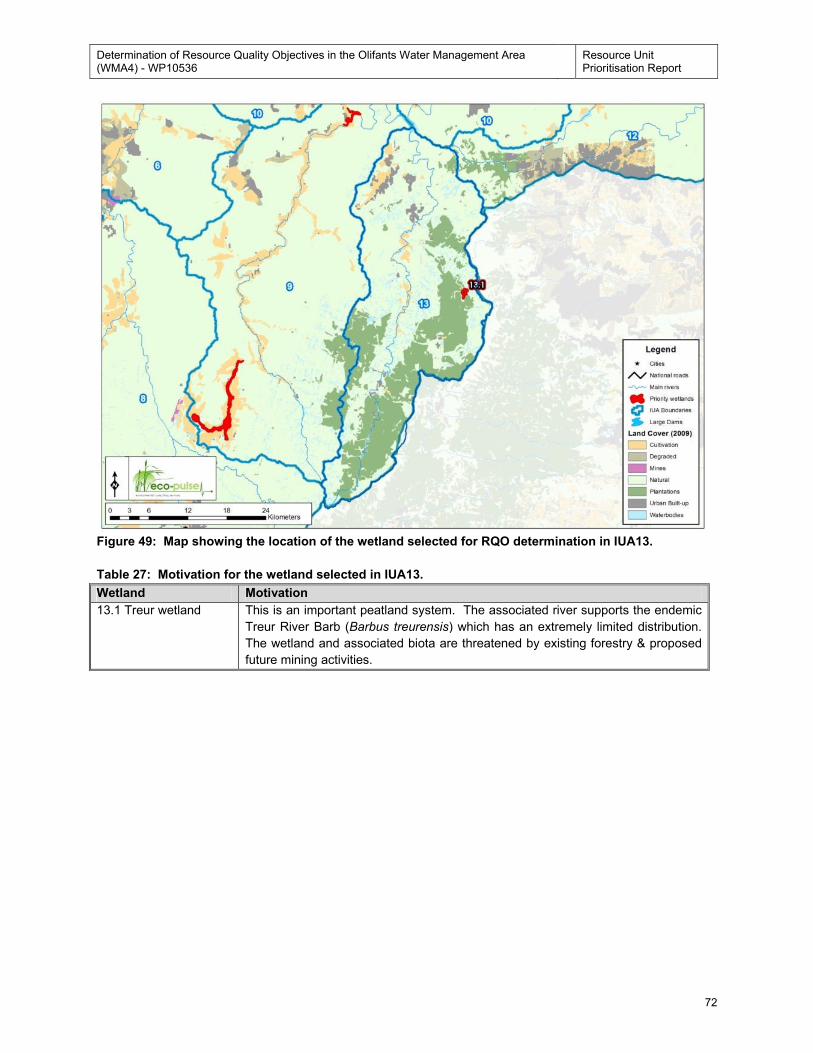
Determination of Resource Quality Objectives in the Olifants Water Management Area (WMA4) - WP10536
Resource Unit Prioritisation Report
72
Figure 49: Map showing the location of the wetland selected for RQO determination in IUA13.
Table 27: Motivation for the wetland selected in IUA13.
Wetland Motivation
13.1 Treur wetland This is an important peatland system. The associated river supports the endemic
Treur River Barb (Barbus treurensis) which has an extremely limited distribution.
The wetland and associated biota are threatened by existing forestry & proposed
future mining activities.
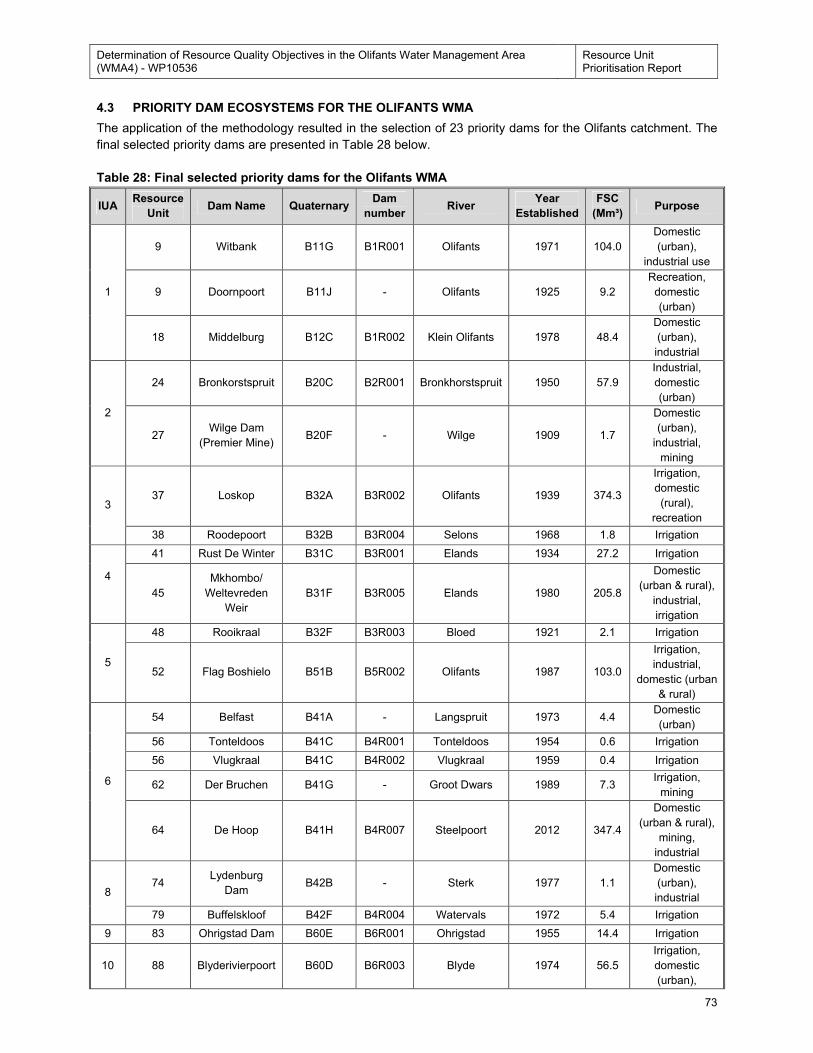
Determination of Resource Quality Objectives in the Olifants Water Management Area (WMA4) - WP10536
Resource Unit Prioritisation Report
73
4.3 PRIORITY DAM ECOSYSTEMS FOR THE OLIFANTS WMA
The application of the methodology resulted in the selection of 23 priority dams for the Olifants catchment. The
final selected priority dams are presented in Table 28 below.
Table 28: Final selected priority dams for the Olifants WMA
IUA Resource
Unit Dam Name Quaternary
Dam
number River
Year
Established
FSC
(Mm³) Purpose
1
9 Witbank B11G B1R001 Olifants 1971 104.0
Domestic
(urban),
industrial use
9 Doornpoort B11J - Olifants 1925 9.2
Recreation,
domestic
(urban)
18 Middelburg B12C B1R002 Klein Olifants 1978 48.4
Domestic
(urban),
industrial
2
24 Bronkorstspruit B20C B2R001 Bronkhorstspruit 1950 57.9
Industrial,
domestic
(urban)
27 Wilge Dam
(Premier Mine) B20F - Wilge 1909 1.7
Domestic
(urban),
industrial,
mining
3 37 Loskop B32A B3R002 Olifants 1939 374.3
Irrigation,
domestic
(rural),
recreation
38 Roodepoort B32B B3R004 Selons 1968 1.8 Irrigation
4
41 Rust De Winter B31C B3R001 Elands 1934 27.2 Irrigation
45
Mkhombo/
Weltevreden
Weir
B31F B3R005 Elands 1980 205.8
Domestic
(urban & rural),
industrial,
irrigation
5
48 Rooikraal B32F B3R003 Bloed 1921 2.1 Irrigation
52 Flag Boshielo B51B B5R002 Olifants 1987 103.0
Irrigation,
industrial,
domestic (urban
& rural)
6
54 Belfast B41A - Langspruit 1973 4.4 Domestic
(urban)
56 Tonteldoos B41C B4R001 Tonteldoos 1954 0.6 Irrigation
56 Vlugkraal B41C B4R002 Vlugkraal 1959 0.4 Irrigation
62 Der Bruchen B41G - Groot Dwars 1989 7.3 Irrigation,
mining
64 De Hoop B41H B4R007 Steelpoort 2012 347.4
Domestic
(urban & rural),
mining,
industrial
8 74
Lydenburg
Dam B42B - Sterk 1977 1.1
Domestic
(urban),
industrial
79 Buffelskloof B42F B4R004 Watervals 1972 5.4 Irrigation
9 83 Ohrigstad Dam B60E B6R001 Ohrigstad 1955 14.4 Irrigation
10 88 Blyderivierpoort B60D B6R003 Blyde 1974 56.5
Irrigation,
domestic
(urban),
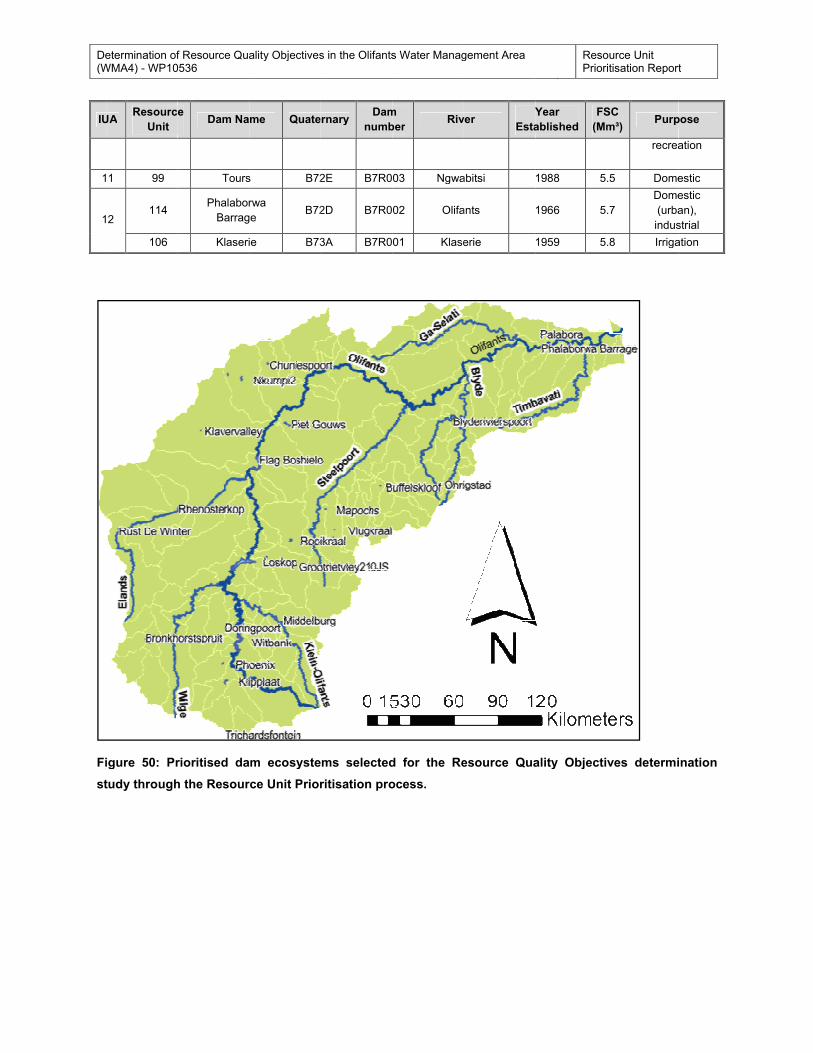
Determination of Resource Quality Objectives in the Olifants Water Management Area (WMA4)
IUA
11
12
Figure
study through the Resource Unit Prioritisation process.
Determination of Resource Quality Objectives in the Olifants Water Management Area (WMA4) - WP10536
IUA Resource
Unit
11 99
12 114
106
Figure 50: Prioritised dam ecosystems selected for the Resource Quality Objectives determination
study through the Resource Unit Prioritisation process.
Determination of Resource Quality Objectives in the Olifants Water Management Area WP10536
Resource Dam Name
Tours
Phalaborwa
Barrage
Klaserie
: Prioritised dam ecosystems selected for the Resource Quality Objectives determination
study through the Resource Unit Prioritisation process.
Determination of Resource Quality Objectives in the Olifants Water Management Area
Dam Name Quaternary
Tours B72E
Phalaborwa
Barrage B72D
Klaserie B73A
: Prioritised dam ecosystems selected for the Resource Quality Objectives determination
study through the Resource Unit Prioritisation process.
Determination of Resource Quality Objectives in the Olifants Water Management Area
Quaternary Dam
number
B72E B7R003
B72D B7R002
B73A B7R001
: Prioritised dam ecosystems selected for the Resource Quality Objectives determination
study through the Resource Unit Prioritisation process.
Determination of Resource Quality Objectives in the Olifants Water Management Area
Dam
number River
B7R003 Ngwabitsi
B7R002 Olifants
B7R001 Klaserie
: Prioritised dam ecosystems selected for the Resource Quality Objectives determination
study through the Resource Unit Prioritisation process.
Determination of Resource Quality Objectives in the Olifants Water Management Area
River Year
Established
Ngwabitsi 1988
Olifants 1966
Klaserie 1959
: Prioritised dam ecosystems selected for the Resource Quality Objectives determination
Resource Unit Prioritisation Report
Year
Established
FSC
(Mm³)
1988 5.5
1966 5.7
1959 5.8
: Prioritised dam ecosystems selected for the Resource Quality Objectives determination
Resource Unit Prioritisation Report
FSC
(Mm³) Purpose
recreation
5.5 Domestic
5.7
Domestic
(urban),
industrial
5.8 Irrigation
: Prioritised dam ecosystems selected for the Resource Quality Objectives determination
Prioritisation Report
Purpose
recreation
Domestic
Domestic
(urban),
industrial
Irrigation
: Prioritised dam ecosystems selected for the Resource Quality Objectives determination
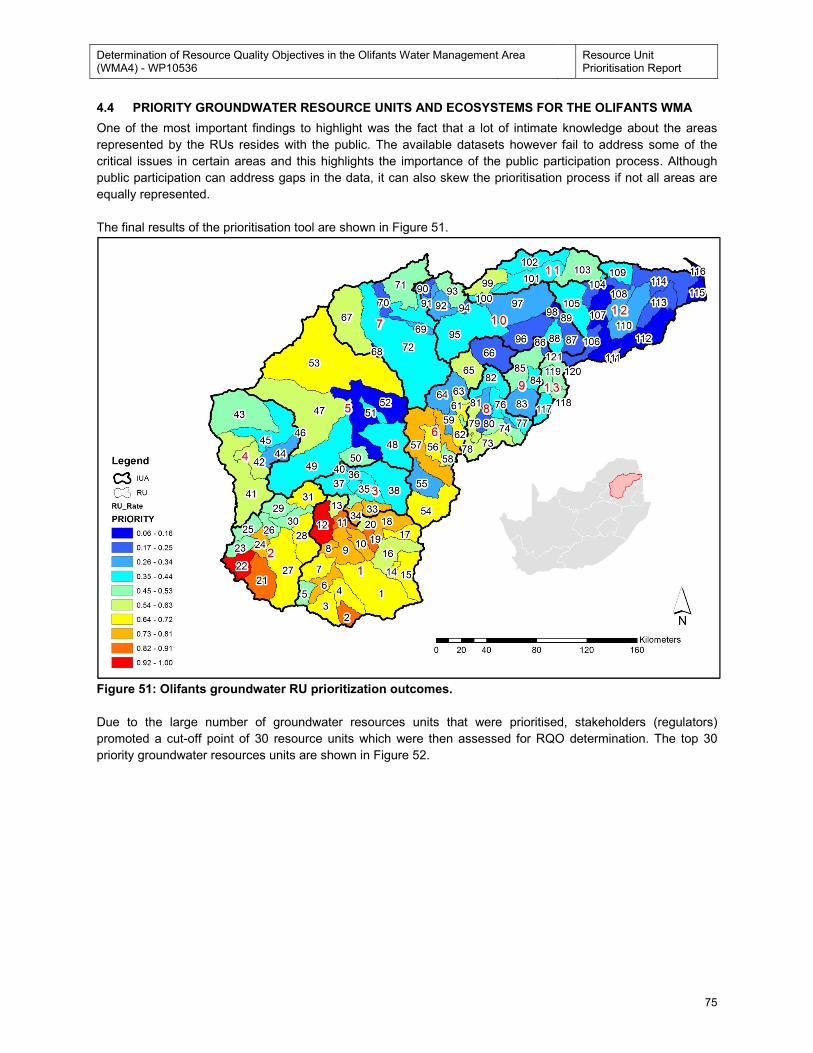
Determination of Resource Quality Objectives in the Olifants Water Management Area (WMA4) - WP10536
Resource Unit Prioritisation Report
75
4.4 PRIORITY GROUNDWATER RESOURCE UNITS AND ECOSYSTEMS FOR THE OLIFANTS WMA
One of the most important findings to highlight was the fact that a lot of intimate knowledge about the areas
represented by the RUs resides with the public. The available datasets however fail to address some of the
critical issues in certain areas and this highlights the importance of the public participation process. Although
public participation can address gaps in the data, it can also skew the prioritisation process if not all areas are
equally represented.
The final results of the prioritisation tool are shown in Figure 51.
Figure 51: Olifants groundwater RU prioritization outcomes.
Due to the large number of groundwater resources units that were prioritised, stakeholders (regulators)
promoted a cut-off point of 30 resource units which were then assessed for RQO determination. The top 30
priority groundwater resources units are shown in Figure 52.
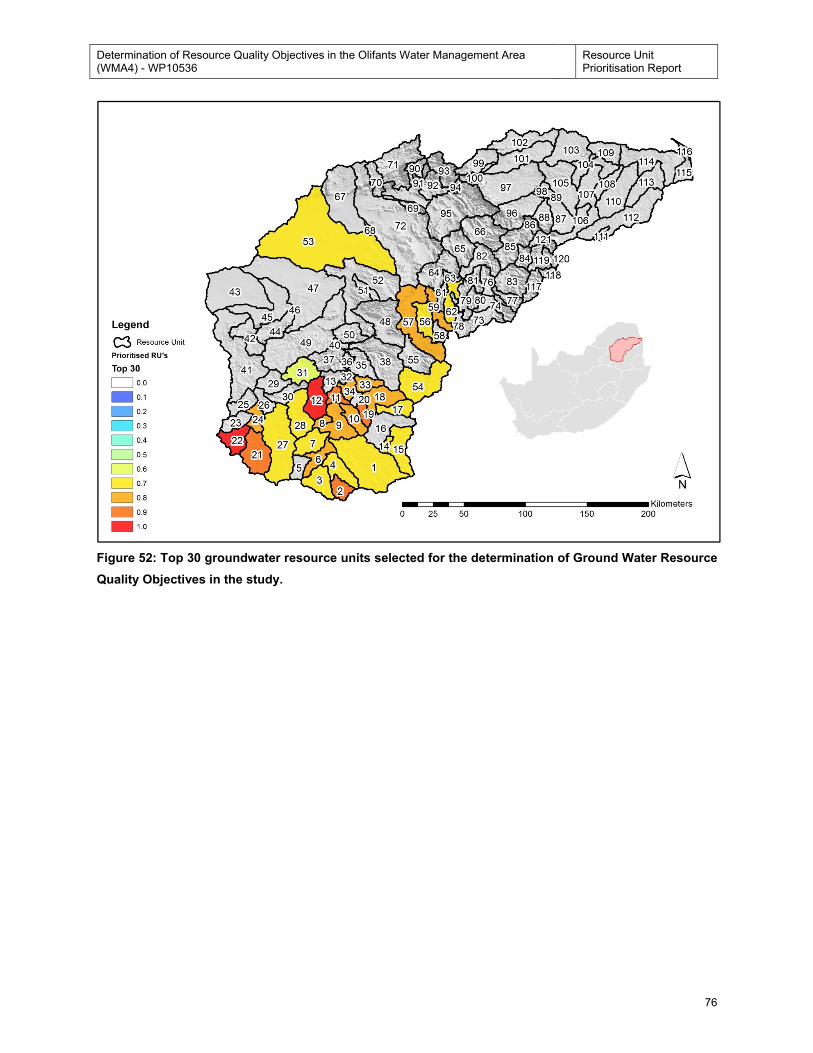
Determination of Resource Quality Objectives in the Olifants Water Management Area (WMA4) - WP10536
Resource Unit Prioritisation Report
76
Figure 52: Top 30 groundwater resource units selected for the determination of Ground Water Resource
Quality Objectives in the study.
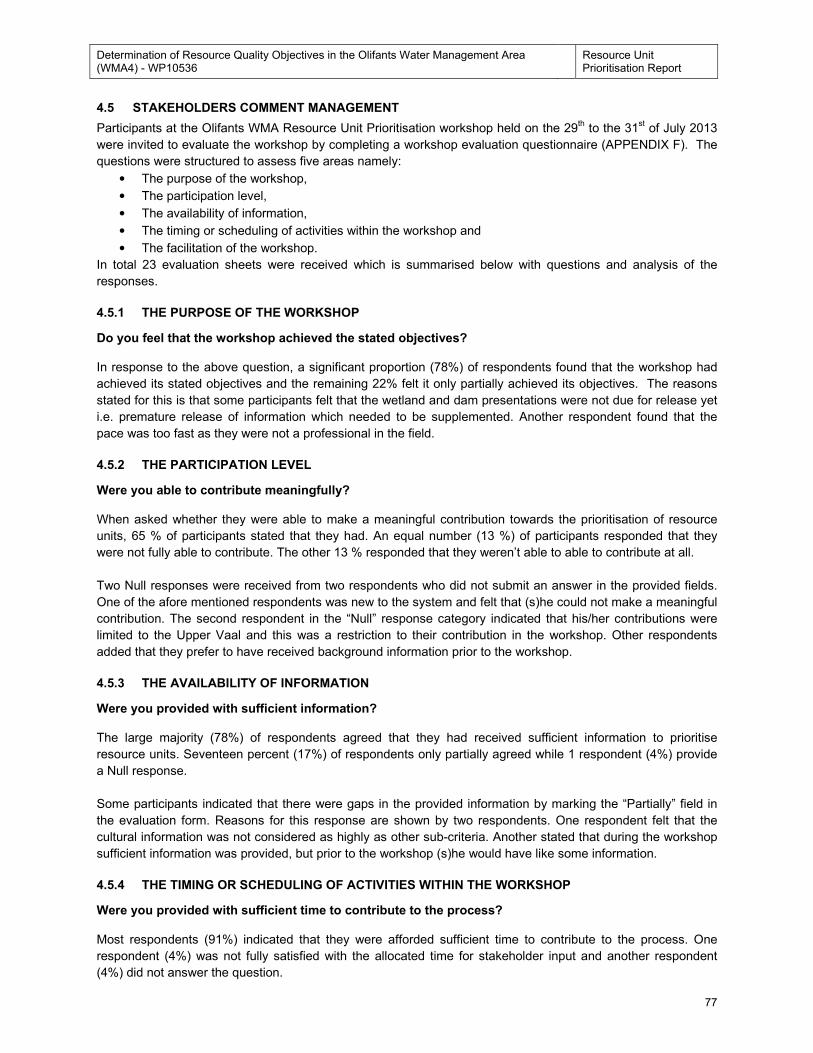
Determination of Resource Quality Objectives in the Olifants Water Management Area (WMA4) - WP10536
Resource Unit Prioritisation Report
77
4.5 STAKEHOLDERS COMMENT MANAGEMENT
Participants at the Olifants WMA Resource Unit Prioritisation workshop held on the 29th to the 31
st of July 2013
were invited to evaluate the workshop by completing a workshop evaluation questionnaire (APPENDIX F). The
questions were structured to assess five areas namely:
• The purpose of the workshop,
• The participation level,
• The availability of information,
• The timing or scheduling of activities within the workshop and
• The facilitation of the workshop.
In total 23 evaluation sheets were received which is summarised below with questions and analysis of the
responses.
4.5.1 THE PURPOSE OF THE WORKSHOP
Do you feel that the workshop achieved the stated objectives?
In response to the above question, a significant proportion (78%) of respondents found that the workshop had
achieved its stated objectives and the remaining 22% felt it only partially achieved its objectives. The reasons
stated for this is that some participants felt that the wetland and dam presentations were not due for release yet
i.e. premature release of information which needed to be supplemented. Another respondent found that the
pace was too fast as they were not a professional in the field.
4.5.2 THE PARTICIPATION LEVEL
Were you able to contribute meaningfully?
When asked whether they were able to make a meaningful contribution towards the prioritisation of resource
units, 65 % of participants stated that they had. An equal number (13 %) of participants responded that they
were not fully able to contribute. The other 13 % responded that they weren’t able to able to contribute at all.
Two Null responses were received from two respondents who did not submit an answer in the provided fields.
One of the afore mentioned respondents was new to the system and felt that (s)he could not make a meaningful
contribution. The second respondent in the “Null” response category indicated that his/her contributions were
limited to the Upper Vaal and this was a restriction to their contribution in the workshop. Other respondents
added that they prefer to have received background information prior to the workshop.
4.5.3 THE AVAILABILITY OF INFORMATION
Were you provided with sufficient information?
The large majority (78%) of respondents agreed that they had received sufficient information to prioritise
resource units. Seventeen percent (17%) of respondents only partially agreed while 1 respondent (4%) provide
a Null response.
Some participants indicated that there were gaps in the provided information by marking the “Partially” field in
the evaluation form. Reasons for this response are shown by two respondents. One respondent felt that the
cultural information was not considered as highly as other sub-criteria. Another stated that during the workshop
sufficient information was provided, but prior to the workshop (s)he would have like some information.
4.5.4 THE TIMING OR SCHEDULING OF ACTIVITIES WITHIN THE WORKSHOP
Were you provided with sufficient time to contribute to the process?
Most respondents (91%) indicated that they were afforded sufficient time to contribute to the process. One
respondent (4%) was not fully satisfied with the allocated time for stakeholder input and another respondent
(4%) did not answer the question.
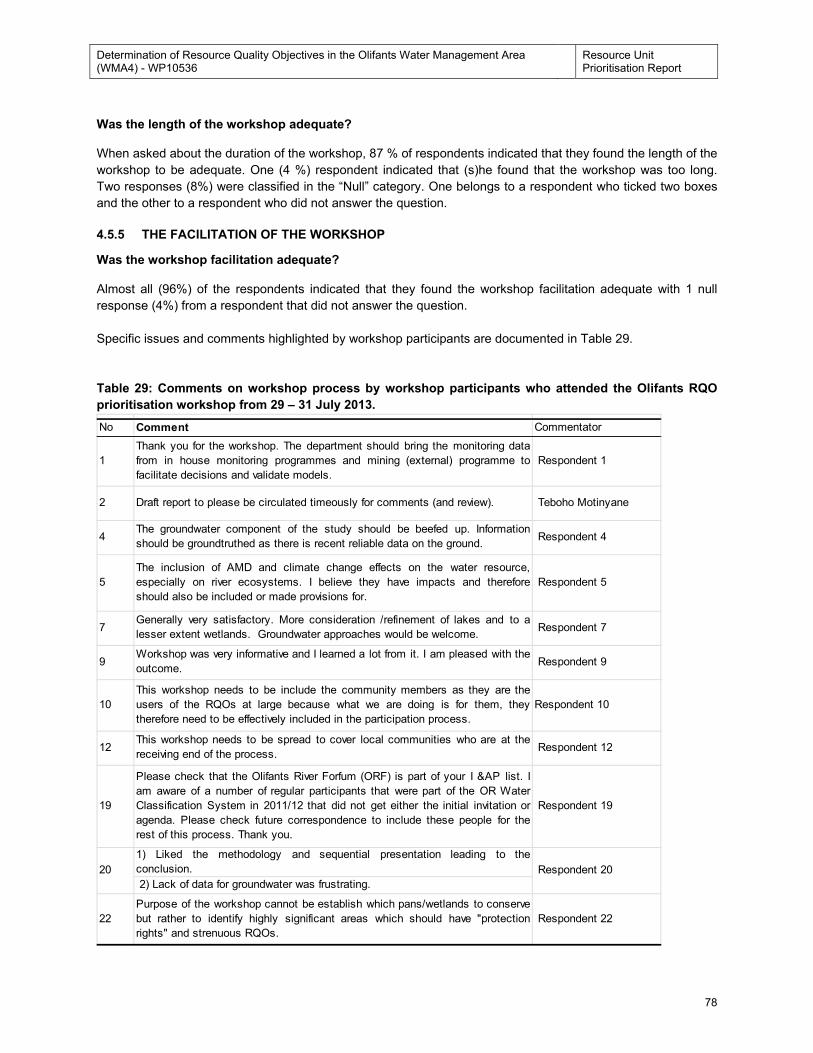
Determination of Resource Quality Objectives in the Olifants Water Management Area (WMA4) - WP10536
Resource Unit Prioritisation Report
78
Was the length of the workshop adequate?
When asked about the duration of the workshop, 87 % of respondents indicated that they found the length of the
workshop to be adequate. One (4 %) respondent indicated that (s)he found that the workshop was too long.
Two responses (8%) were classified in the “Null” category. One belongs to a respondent who ticked two boxes
and the other to a respondent who did not answer the question.
4.5.5 THE FACILITATION OF THE WORKSHOP
Was the workshop facilitation adequate?
Almost all (96%) of the respondents indicated that they found the workshop facilitation adequate with 1 null
response (4%) from a respondent that did not answer the question.
Specific issues and comments highlighted by workshop participants are documented in Table 29.
Table 29: Comments on workshop process by workshop participants who attended the Olifants RQO
prioritisation workshop from 29 – 31 July 2013.
No Comment Commentator
1) Liked the methodology and sequential presentation leading to the
conclusion.
2) Lack of data for groundwater was frustrating.
19
Please check that the Olifants River Forfum (ORF) is part of your I &AP list. I
am aware of a number of regular participants that were part of the OR Water
Classification System in 2011/12 that did not get either the initial invitation or
agenda. Please check future correspondence to include these people for the
rest of this process. Thank you.
Respondent 19
20 Respondent 20
22
Purpose of the workshop cannot be establish which pans/wetlands to conserve
but rather to identify highly significant areas which should have "protection
rights" and strenuous RQOs.
Respondent 22
10
This workshop needs to be include the community members as they are the
users of the RQOs at large because what we are doing is for them, they
therefore need to be effectively included in the participation process.
Respondent 10
12This workshop needs to be spread to cover local communities who are at the
receiving end of the process. Respondent 12
7Generally very satisfactory. More consideration /refinement of lakes and to a
lesser extent wetlands. Groundwater approaches would be welcome. Respondent 7
9Workshop was very informative and I learned a lot from it. I am pleased with the
outcome. Respondent 9
4The groundwater component of the study should be beefed up. Information
should be groundtruthed as there is recent reliable data on the ground. Respondent 4
5
The inclusion of AMD and climate change effects on the water resource,
especially on river ecosystems. I believe they have impacts and therefore
should also be included or made provisions for.
Respondent 5
1
Thank you for the workshop. The department should bring the monitoring data
from in house monitoring programmes and mining (external) programme to
facilitate decisions and validate models.
Respondent 1
2 Draft report to please be circulated timeously for comments (and review). Teboho Motinyane
Determination of Resource Quality Objectives in the Olifants Water Management Area (WMA4) - WP10536
Resource Unit Prioritisation Report
79
5 LIMITATIONS AND UNCERTAINTIES
SOME OF THE KEY LIMITATIONS WHICH MAY INFLUENCE THE CONFIDENCE OF THE OUTCOMES OF
THE RESOURCE UNIT AND ECOSYSTEM PRIORITISATION PROCESS WHICH SHOULD BE
CONSIDERED WHEN IMPLEMENTING THESE PRIORITY RUS AND ECOSYSTEMS INCLUDE:
5.1 RIVERS
• Quantitate data availability was limited which necessitated the use of qualitative data and specialist
solicitations. This limitation was particularly evident in the moderately to minimally impacted areas of the
Water Management Area. Through the implementation of RQOs real data would be generated to
evaluate the accuracy of RU prioritisation process.
• Stakeholder representation of some IUAs (particularly IUAs 4, 5 and 7) were limited which may have
resulted in these areas being neglected during the prioritisation process.
• The requisite simplicity principal was adopted in the study to prioritise RUs. In addition, stakeholders
considered the capacity and resource availability of the regional regulators to prioritise RUs for RQO
determination. These may result in the prioritisation of insufficient RUs for RQO determination which
may inadequately address the protection requirement of the vision of the RQO determination process
(available from the WRC study).
5.2 WETLANDS
• It should be noted that available datasets used, were either datasets generated at a national scale or
surrogate datasets. Therefore, the prioritisation of wetlands is based on broad scale datasets.
• The number of specialist / stakeholders who were able to attend the final stakeholder / specialist
workshops.
• The requisite simplicity principal was adopted in the study to prioritise wetlands. In addition,
stakeholders considered the capacity and resource availability of the regional regulators to prioritise
wetlands for RQO determination. These may result in the prioritisation of insufficient RUs for RQO
determination which may inadequately address the protection requirement of the vision of the RQO
determination process (available from the WRC study).
5.3 DAMS
• Quantitate data availability was limited which necessitated the use of qualitative data and specialist
solicitations. This limitation was particularly evident in the moderately to minimally impacted areas of the
Water Management Area. Through the implementation of RQOs real data would be generated to
evaluate the accuracy of RU prioritisation process.
• Stakeholder representation of some IUAs (particularly IUAs 4, 5 and 7) were limited which may have
resulted in these areas being neglected during the prioritisation process.
5.4 GROUNDWATER
• Quantitate data availability was limited which necessitated the use of qualitative data and specialist
solicitations. This limitation was particularly evident in the moderately to minimally impacted areas of the
Water Management Area. Through the implementation of RQOs real data would be generated to
evaluate the accuracy of RU prioritisation process.
Determination of Resource Quality Objectives in the Olifants Water Management Area (WMA4) - WP10536
Resource Unit Prioritisation Report
80
• Stakeholder representation of some IUAs (particularly IUAs 4, 5 and 7) were limited which may have
resulted in these areas being neglected during the prioritisation process.
• The requisite simplicity principal was adopted in the study to prioritise groundwater RUs. In addition,
stakeholders considered the capacity and resource availability of the regional regulators to prioritise
groundwater RUs for RQO determination. These may result in the prioritisation of insufficient RUs for
RQO determination which may inadequately address the protection requirement of the vision of the
RQO determination process (available from the WRC study).
Determination of Resource Quality Objectives in the Olifants Water Management Area (WMA4) - WP10536
Resource Unit Prioritisation Report
81
6 WAY FORWARD
Step 4 of the RQO methodology entails prioritising sub-components for RQO determination and the selection of
indicators for monitoring. Each of the prioritised Resource Units (detailed in this report) will therefore by
subjected to more detailed analyses to identify which sub-components present in these Resource Units should
be protected in order to support water resource dependent activities and/or maintain the integrity and ecological
functioning of the water resource. This information is then used to prioritise sub-components for RQO
determination.
Wetlands were prioritized for RQO determination through a systematic desktop GIS process and supplemented
with priorities identified by key local stakeholders. A final subset of wetlands was then selected at a focussed
stakeholder meeting based on their importance for biodiversity conservation and / or their functional importance.
The focus during subsequent steps will be to select sub-components and indicators for RQO determination for
these prioritised wetlands. Regional-level RQOs will also be developed to cater for the plethora of other wetland
ecosystems not catered for through this resource unit based approach.
Determination of Resource Quality Objectives in the Olifants Water Management Area (WMA4) - WP10536
Resource Unit Prioritisation Report
82
7 ACKNOWLEDGEMENTS
We would like to acknowledge the contributions made by the stakeholders of the Olifants Water Management
Area who participated in the stakeholder workshop to the RQO determination process. The information and
direction provided by these stakeholders has made a noticeable contribution to the study. In addition we
acknowledge the contributions made by scientists and consultants who provided information to the study team.
Determination of Resource Quality Objectives in the Olifants Water Management Area (WMA4) - WP10536
Resource Unit Prioritisation Report
83
8 REFERENCES
CSIR. 2011. National Freshwater Ecosystem Priority Areas (NFEPA) Project. NFEPA Wetland Layer. GIS
Coverage. Council for Scientific and Industrial Research, Pretoria, South Africa.
DWA (Department of Water Affairs), 2011. Procedures to Develop and Implement Resource Quality
Objectives. Department of Water Affairs, Pretoria, South Africa
Department of Water Affairs (DWA). 2012a. Determination of Resource Quality Objectives in the Olifants Water
Management Area (WMA4): INCEPTION REPORT. Report No.: RDM/WMA04/00/CON/RQO/0112. Chief
Directorate: Water Ecosystems: Compliance. Study No.: WP10536. Prepared by the Institute of Natural
Resources (INR) NPC. INR Technical Report No.: INR 492/14 (i). Pietermaritzburg, South Africa
Department of Water Affairs (DWA). 2012b. Determination of Resource Quality Objectives in the Olifants Water
Management Area (WMA4): GAP ANALYSIS REPORT. Report No.: RDM/WMA04/00/CON/RQO/0212.
Chief Directorate: Water Ecosystems: Compliance. Study No.: WP10536. Prepared by the Institute of
Natural Resources (INR) NPC. INR Technical Report No.: INR 492/14 (ii). Pietermaritzburg, South Africa.
Department of Water Affairs (DWA). 2013a. Determination of Resource Quality Objectives in the Olifants Water
Management Area (WMA4): RESOURCE UNIT DELINEATION REPORT. Report No.:
RDM/WMA04/00/CON/RQO/0113. Chief Directorate: Water Ecosystems: Compliance. Study No.:
WP10536. Prepared by the Institute of Natural Resources (INR) NPC. INR Technical Report No.: INR
492/14 (iii). Pietermaritzburg, South Africa.
Department of Water Affairs (DWA). 2013b. Determination of Resource Quality Objectives in the Olifants Water
Management Area (WMA4): RESOURCE UNIT PRIORITISATION REPORT. Report No.:
RDM/WMA04/00/CON/RQO/0213. Chief Directorate: Water Ecosystems: Compliance. Study No.:
WP10536. Prepared by the Institute of Natural Resources (INR) NPC. INR Technical Report No.: INR
492/14 (iv). Pietermaritzburg, South Africa.
Department of Water Affairs, South Africa, January 2013. Classification of Significant Water
Resources in the Olifants Water Management Area (WMA 4): Management Classes of the Olifants
WMA. Report No: RDM/WMA04/00/CON/CLA/0113
Department of Water and Sanitation (DWS). 2014a. Determination of Resource Quality Objectives in the
Olifants Water Management Area (WMA4): SUB-COMPONENT PRIORITISATION AND INDICATOR
SELECTION REPORT. Report No.: RDM/WMA04/00/CON/RQO/0114. Chief Directorate: Water
Ecosystems: Compliance. Study No.: WP10536. Prepared by the Institute of Natural Resources (INR)
NPC. INR Technical Report No.: INR 492/14 (v). Pietermaritzburg, South Africa.
Department of Water and Sanitation (DWS). 2014b. Determination of Resource Quality Objectives in the
Olifants Water Management Area (WMA4): RESOURCE QUALITY OBJECTIVES AND NUMERICAL
LIMITS REPORT. Report No.: RDM/WMA04/00/CON/RQO/0214. Chief Directorate: Water Ecosystems:
Compliance. Study No.: WP10536. Prepared by the Institute of Natural Resources (INR) NPC. INR
Technical Report No.: INR 492/14 (vi). Pietermaritzburg, South Africa
DWAF (Department of Water Affairs and Forestry), 2007. Upper Olifants River Catchment Framework
Management Strategy. Directorate: Water Abstraction and In-stream Use, Sub-directorate: Environment
and Recreation. Pretoria.
Department of Water Affairs, South Africa (DWA) (2013a) Classification of Significant Water Resources in the
Olifants Water Management Area (WMA 4): Management Classes of the Olifants WMA. Report No:
RDM/WMA04/00/CON/CLA/0113
Exigent Engineering Consultants, 2006. An inventory of wetlands in the Upper Olifants catchment.
IWMI (International Water Management Institute), 2011. Wet-Win Project. Reported in a Special issue of
Environmental Science & Policy, 34: 1-146, 2013 .
Kleynhans, C.J., 2013. Preliminary PES/EIS Assessment of river ecosystems. Unpublished draft spreadsheets
for the Olifants catchment. Department of Water Affairs, Pretoria.
Kotze, D.C., Marnewick, G.C., Batchelor, A.L., Lindley, D.S. and Collins, N.B. 2007. WET-Ecoservices: A
technique for rapidly assessing ecosystem services supplied by wetlands. WRC Report No TT
339/08,Water Research Commission, Pretoria.
Macfarlane, D.M. and Teixeira-Leite, A. (2012). Strategic Management Plan: Verloren Valei Nature Reserve.
Version 1.0. Report prepared for the Department of Environmental Affairs.
Determination of Resource Quality Objectives in the Olifants Water Management Area (WMA4) - WP10536
Resource Unit Prioritisation Report
84
Murray R, Baker K, Ravenscroft P, Musekiwa C and Dennis R (2011) A Groundwater Planning Toolkit for the
Main Karoo Basin: Identifying and quantifying groundwater development options incorporating the
concept of wellfield yields and aquifer firm yields. WRC Report No: 1763/1/11 Water Research
Commission, Pretoria.
Palmer, R.W., Turpie, J., Marneweck, G.C. & Batchelor, A.L. 2002. Ecological and economic evaluation of
wetlands in the Upper Olifants River catchment, South Africa. WRC Report no. 1162/1/02.
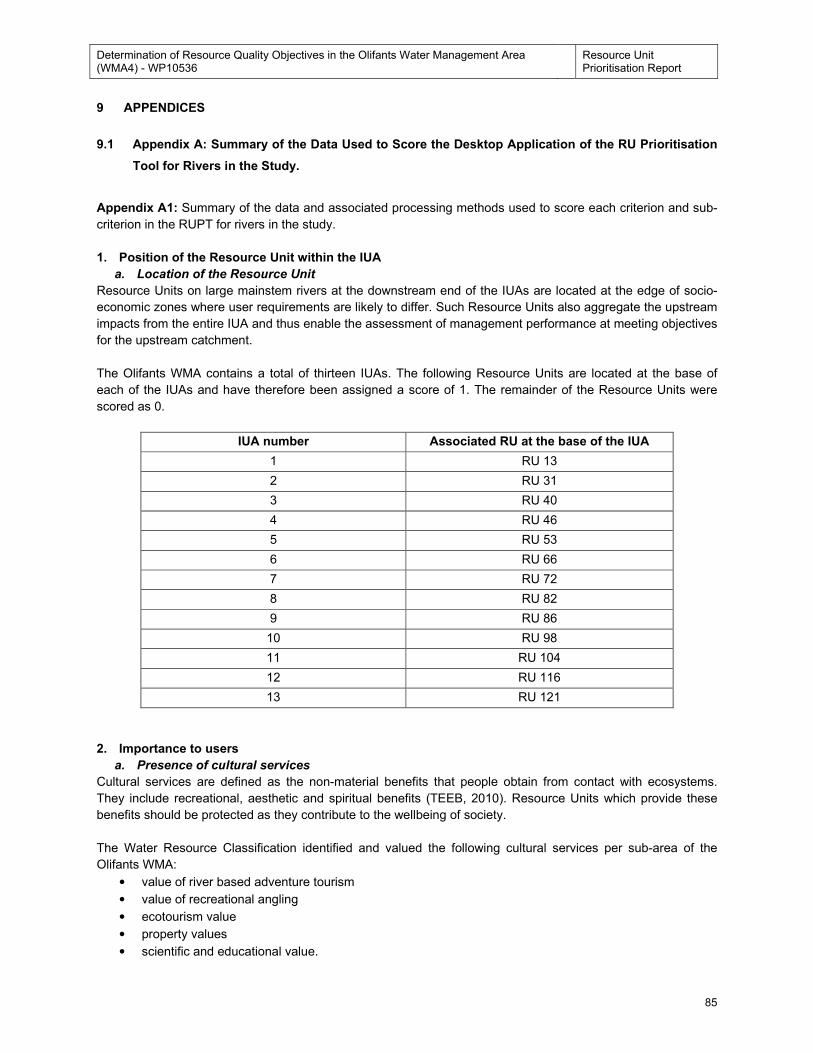
Determination of Resource Quality Objectives in the Olifants Water Management Area (WMA4) - WP10536
Resource Unit Prioritisation Report
85
9 APPENDICES
9.1 Appendix A: Summary of the Data Used to Score the Desktop Application of the RU Prioritisation
Tool for Rivers in the Study.
Appendix A1: Summary of the data and associated processing methods used to score each criterion and sub-
criterion in the RUPT for rivers in the study.
1. Position of the Resource Unit within the IUA
a. Location of the Resource Unit
Resource Units on large mainstem rivers at the downstream end of the IUAs are located at the edge of socio-
economic zones where user requirements are likely to differ. Such Resource Units also aggregate the upstream
impacts from the entire IUA and thus enable the assessment of management performance at meeting objectives
for the upstream catchment.
The Olifants WMA contains a total of thirteen IUAs. The following Resource Units are located at the base of
each of the IUAs and have therefore been assigned a score of 1. The remainder of the Resource Units were
scored as 0.
IUA number Associated RU at the base of the IUA
1 RU 13
2 RU 31
3 RU 40
4 RU 46
5 RU 53
6 RU 66
7 RU 72
8 RU 82
9 RU 86
10 RU 98
11 RU 104
12 RU 116
13 RU 121
2. Importance to users
a. Presence of cultural services
Cultural services are defined as the non-material benefits that people obtain from contact with ecosystems.
They include recreational, aesthetic and spiritual benefits (TEEB, 2010). Resource Units which provide these
benefits should be protected as they contribute to the wellbeing of society.
The Water Resource Classification identified and valued the following cultural services per sub-area of the
Olifants WMA:
• value of river based adventure tourism
• value of recreational angling
• ecotourism value
• property values
• scientific and educational value.
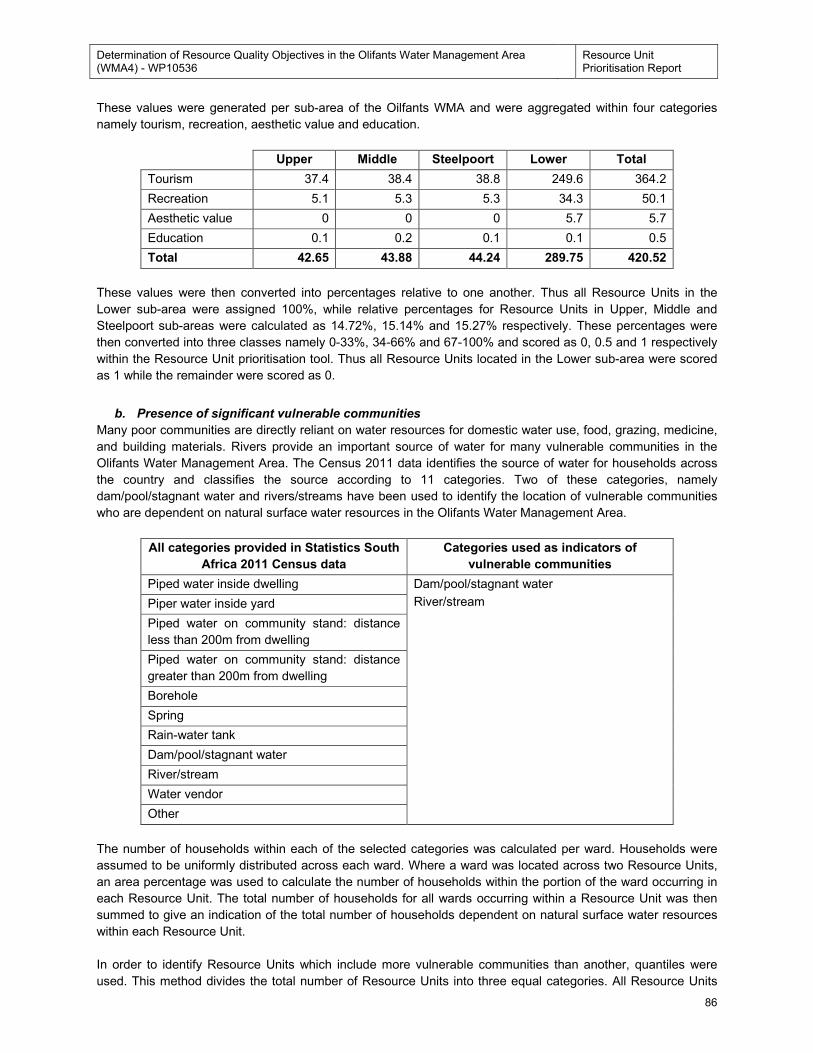
Determination of Resource Quality Objectives in the Olifants Water Management Area (WMA4) - WP10536
Resource Unit Prioritisation Report
86
These values were generated per sub-area of the Oilfants WMA and were aggregated within four categories
namely tourism, recreation, aesthetic value and education.
Upper Middle Steelpoort Lower Total
Tourism 37.4 38.4 38.8 249.6 364.2
Recreation 5.1 5.3 5.3 34.3 50.1
Aesthetic value 0 0 0 5.7 5.7
Education 0.1 0.2 0.1 0.1 0.5
Total 42.65 43.88 44.24 289.75 420.52
These values were then converted into percentages relative to one another. Thus all Resource Units in the
Lower sub-area were assigned 100%, while relative percentages for Resource Units in Upper, Middle and
Steelpoort sub-areas were calculated as 14.72%, 15.14% and 15.27% respectively. These percentages were
then converted into three classes namely 0-33%, 34-66% and 67-100% and scored as 0, 0.5 and 1 respectively
within the Resource Unit prioritisation tool. Thus all Resource Units located in the Lower sub-area were scored
as 1 while the remainder were scored as 0.
b. Presence of significant vulnerable communities
Many poor communities are directly reliant on water resources for domestic water use, food, grazing, medicine,
and building materials. Rivers provide an important source of water for many vulnerable communities in the
Olifants Water Management Area. The Census 2011 data identifies the source of water for households across
the country and classifies the source according to 11 categories. Two of these categories, namely
dam/pool/stagnant water and rivers/streams have been used to identify the location of vulnerable communities
who are dependent on natural surface water resources in the Olifants Water Management Area.
All categories provided in Statistics South
Africa 2011 Census data
Categories used as indicators of
vulnerable communities
Piped water inside dwelling Dam/pool/stagnant water
River/stream Piper water inside yard
Piped water on community stand: distance
less than 200m from dwelling
Piped water on community stand: distance
greater than 200m from dwelling
Borehole
Spring
Rain-water tank
Dam/pool/stagnant water
River/stream
Water vendor
Other
The number of households within each of the selected categories was calculated per ward. Households were
assumed to be uniformly distributed across each ward. Where a ward was located across two Resource Units,
an area percentage was used to calculate the number of households within the portion of the ward occurring in
each Resource Unit. The total number of households for all wards occurring within a Resource Unit was then
summed to give an indication of the total number of households dependent on natural surface water resources
within each Resource Unit.
In order to identify Resource Units which include more vulnerable communities than another, quantiles were
used. This method divides the total number of Resource Units into three equal categories. All Resource Units
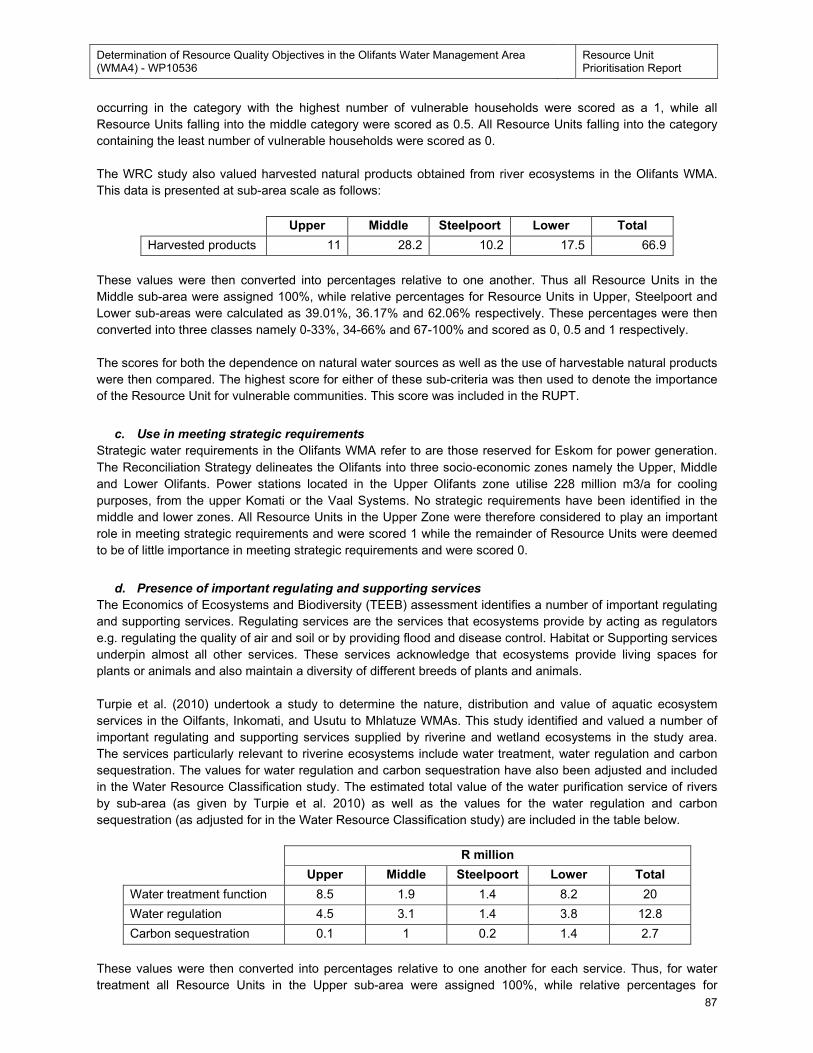
Determination of Resource Quality Objectives in the Olifants Water Management Area (WMA4) - WP10536
Resource Unit Prioritisation Report
87
occurring in the category with the highest number of vulnerable households were scored as a 1, while all
Resource Units falling into the middle category were scored as 0.5. All Resource Units falling into the category
containing the least number of vulnerable households were scored as 0.
The WRC study also valued harvested natural products obtained from river ecosystems in the Olifants WMA.
This data is presented at sub-area scale as follows:
Upper Middle Steelpoort Lower Total
Harvested products 11 28.2 10.2 17.5 66.9
These values were then converted into percentages relative to one another. Thus all Resource Units in the
Middle sub-area were assigned 100%, while relative percentages for Resource Units in Upper, Steelpoort and
Lower sub-areas were calculated as 39.01%, 36.17% and 62.06% respectively. These percentages were then
converted into three classes namely 0-33%, 34-66% and 67-100% and scored as 0, 0.5 and 1 respectively.
The scores for both the dependence on natural water sources as well as the use of harvestable natural products
were then compared. The highest score for either of these sub-criteria was then used to denote the importance
of the Resource Unit for vulnerable communities. This score was included in the RUPT.
c. Use in meeting strategic requirements
Strategic water requirements in the Olifants WMA refer to are those reserved for Eskom for power generation.
The Reconciliation Strategy delineates the Olifants into three socio‐economic zones namely the Upper, Middle
and Lower Olifants. Power stations located in the Upper Olifants zone utilise 228 million m3/a for cooling
purposes, from the upper Komati or the Vaal Systems. No strategic requirements have been identified in the
middle and lower zones. All Resource Units in the Upper Zone were therefore considered to play an important
role in meeting strategic requirements and were scored 1 while the remainder of Resource Units were deemed
to be of little importance in meeting strategic requirements and were scored 0.
d. Presence of important regulating and supporting services
The Economics of Ecosystems and Biodiversity (TEEB) assessment identifies a number of important regulating
and supporting services. Regulating services are the services that ecosystems provide by acting as regulators
e.g. regulating the quality of air and soil or by providing flood and disease control. Habitat or Supporting services
underpin almost all other services. These services acknowledge that ecosystems provide living spaces for
plants or animals and also maintain a diversity of different breeds of plants and animals.
Turpie et al. (2010) undertook a study to determine the nature, distribution and value of aquatic ecosystem
services in the Oilfants, Inkomati, and Usutu to Mhlatuze WMAs. This study identified and valued a number of
important regulating and supporting services supplied by riverine and wetland ecosystems in the study area.
The services particularly relevant to riverine ecosystems include water treatment, water regulation and carbon
sequestration. The values for water regulation and carbon sequestration have also been adjusted and included
in the Water Resource Classification study. The estimated total value of the water purification service of rivers
by sub-area (as given by Turpie et al. 2010) as well as the values for the water regulation and carbon
sequestration (as adjusted for in the Water Resource Classification study) are included in the table below.
R million
Upper Middle Steelpoort Lower Total
Water treatment function 8.5 1.9 1.4 8.2 20
Water regulation 4.5 3.1 1.4 3.8 12.8
Carbon sequestration 0.1 1 0.2 1.4 2.7
These values were then converted into percentages relative to one another for each service. Thus, for water
treatment all Resource Units in the Upper sub-area were assigned 100%, while relative percentages for
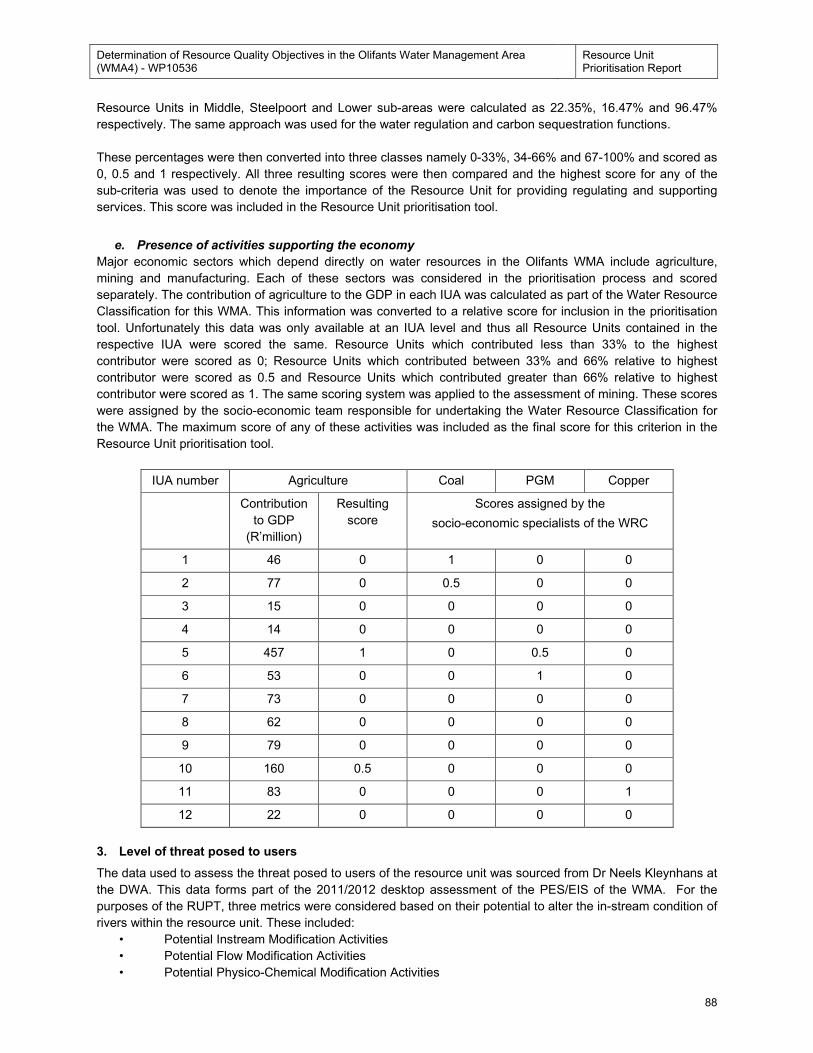
Determination of Resource Quality Objectives in the Olifants Water Management Area (WMA4) - WP10536
Resource Unit Prioritisation Report
88
Resource Units in Middle, Steelpoort and Lower sub-areas were calculated as 22.35%, 16.47% and 96.47%
respectively. The same approach was used for the water regulation and carbon sequestration functions.
These percentages were then converted into three classes namely 0-33%, 34-66% and 67-100% and scored as
0, 0.5 and 1 respectively. All three resulting scores were then compared and the highest score for any of the
sub-criteria was used to denote the importance of the Resource Unit for providing regulating and supporting
services. This score was included in the Resource Unit prioritisation tool.
e. Presence of activities supporting the economy
Major economic sectors which depend directly on water resources in the Olifants WMA include agriculture,
mining and manufacturing. Each of these sectors was considered in the prioritisation process and scored
separately. The contribution of agriculture to the GDP in each IUA was calculated as part of the Water Resource
Classification for this WMA. This information was converted to a relative score for inclusion in the prioritisation
tool. Unfortunately this data was only available at an IUA level and thus all Resource Units contained in the
respective IUA were scored the same. Resource Units which contributed less than 33% to the highest
contributor were scored as 0; Resource Units which contributed between 33% and 66% relative to highest
contributor were scored as 0.5 and Resource Units which contributed greater than 66% relative to highest
contributor were scored as 1. The same scoring system was applied to the assessment of mining. These scores
were assigned by the socio-economic team responsible for undertaking the Water Resource Classification for
the WMA. The maximum score of any of these activities was included as the final score for this criterion in the
Resource Unit prioritisation tool.
IUA number Agriculture Coal PGM Copper
Contribution
to GDP
(R’million)
Resulting
score
Scores assigned by the
socio-economic specialists of the WRC
1 46 0 1 0 0
2 77 0 0.5 0 0
3 15 0 0 0 0
4 14 0 0 0 0
5 457 1 0 0.5 0
6 53 0 0 1 0
7 73 0 0 0 0
8 62 0 0 0 0
9 79 0 0 0 0
10 160 0.5 0 0 0
11 83 0 0 0 1
12 22 0 0 0 0
3. Level of threat posed to users
The data used to assess the threat posed to users of the resource unit was sourced from Dr Neels Kleynhans at
the DWA. This data forms part of the 2011/2012 desktop assessment of the PES/EIS of the WMA. For the
purposes of the RUPT, three metrics were considered based on their potential to alter the in-stream condition of
rivers within the resource unit. These included:
• Potential Instream Modification Activities
• Potential Flow Modification Activities
• Potential Physico-Chemical Modification Activities
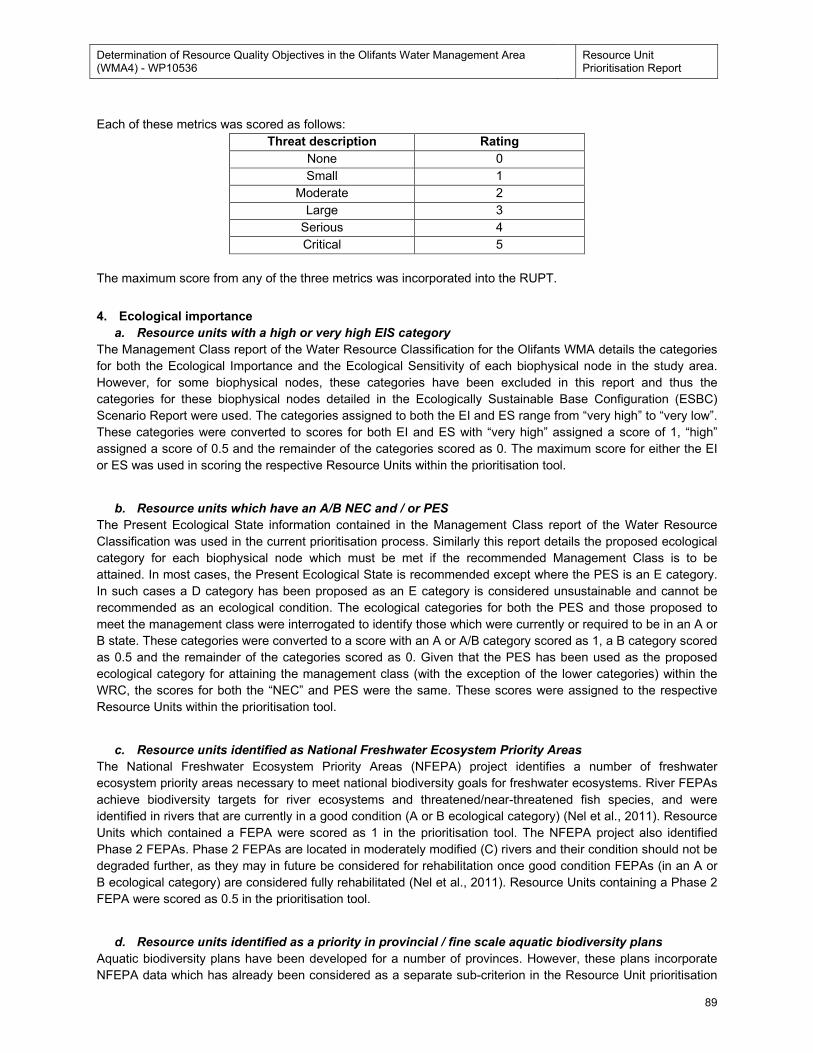
Determination of Resource Quality Objectives in the Olifants Water Management Area (WMA4) - WP10536
Resource Unit Prioritisation Report
89
Each of these metrics was scored as follows:
Threat description Rating
None 0
Small 1
Moderate 2
Large 3
Serious 4
Critical 5
The maximum score from any of the three metrics was incorporated into the RUPT.
4. Ecological importance
a. Resource units with a high or very high EIS category
The Management Class report of the Water Resource Classification for the Olifants WMA details the categories
for both the Ecological Importance and the Ecological Sensitivity of each biophysical node in the study area.
However, for some biophysical nodes, these categories have been excluded in this report and thus the
categories for these biophysical nodes detailed in the Ecologically Sustainable Base Configuration (ESBC)
Scenario Report were used. The categories assigned to both the EI and ES range from “very high” to “very low”.
These categories were converted to scores for both EI and ES with “very high” assigned a score of 1, “high”
assigned a score of 0.5 and the remainder of the categories scored as 0. The maximum score for either the EI
or ES was used in scoring the respective Resource Units within the prioritisation tool.
b. Resource units which have an A/B NEC and / or PES
The Present Ecological State information contained in the Management Class report of the Water Resource
Classification was used in the current prioritisation process. Similarly this report details the proposed ecological
category for each biophysical node which must be met if the recommended Management Class is to be
attained. In most cases, the Present Ecological State is recommended except where the PES is an E category.
In such cases a D category has been proposed as an E category is considered unsustainable and cannot be
recommended as an ecological condition. The ecological categories for both the PES and those proposed to
meet the management class were interrogated to identify those which were currently or required to be in an A or
B state. These categories were converted to a score with an A or A/B category scored as 1, a B category scored
as 0.5 and the remainder of the categories scored as 0. Given that the PES has been used as the proposed
ecological category for attaining the management class (with the exception of the lower categories) within the
WRC, the scores for both the “NEC” and PES were the same. These scores were assigned to the respective
Resource Units within the prioritisation tool.
c. Resource units identified as National Freshwater Ecosystem Priority Areas
The National Freshwater Ecosystem Priority Areas (NFEPA) project identifies a number of freshwater
ecosystem priority areas necessary to meet national biodiversity goals for freshwater ecosystems. River FEPAs
achieve biodiversity targets for river ecosystems and threatened/near-threatened fish species, and were
identified in rivers that are currently in a good condition (A or B ecological category) (Nel et al., 2011). Resource
Units which contained a FEPA were scored as 1 in the prioritisation tool. The NFEPA project also identified
Phase 2 FEPAs. Phase 2 FEPAs are located in moderately modified (C) rivers and their condition should not be
degraded further, as they may in future be considered for rehabilitation once good condition FEPAs (in an A or
B ecological category) are considered fully rehabilitated (Nel et al., 2011). Resource Units containing a Phase 2
FEPA were scored as 0.5 in the prioritisation tool.
d. Resource units identified as a priority in provincial / fine scale aquatic biodiversity plans
Aquatic biodiversity plans have been developed for a number of provinces. However, these plans incorporate
NFEPA data which has already been considered as a separate sub-criterion in the Resource Unit prioritisation
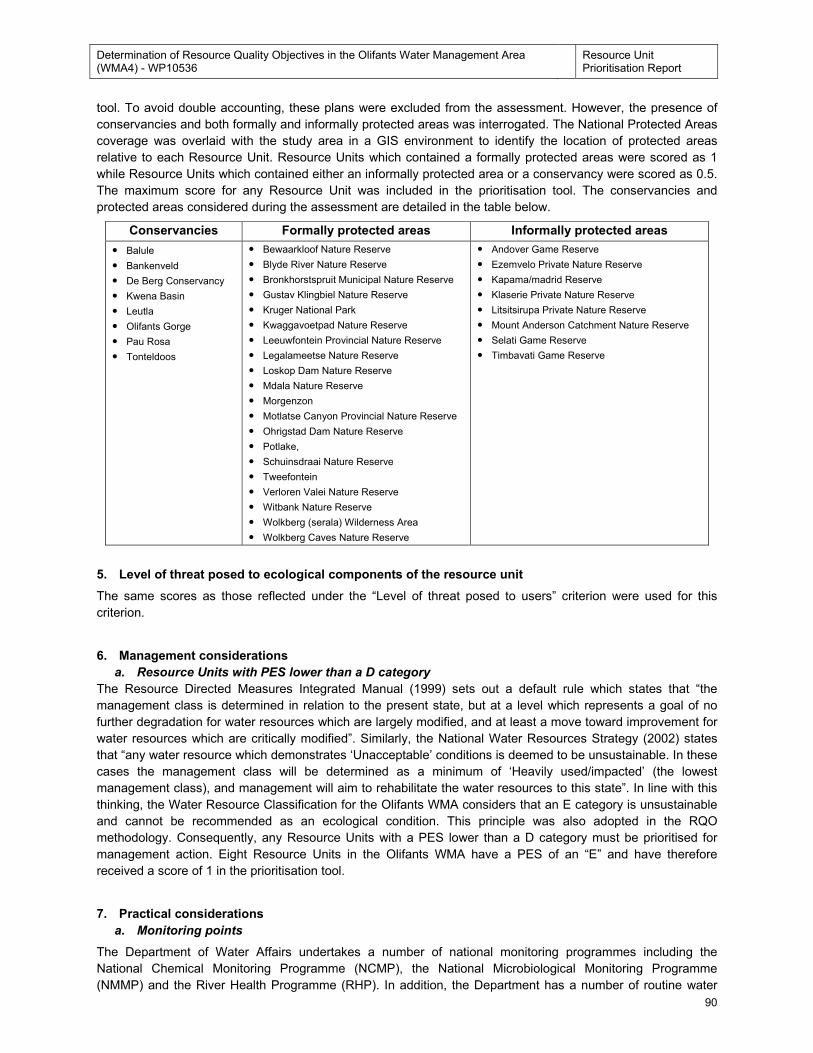
Determination of Resource Quality Objectives in the Olifants Water Management Area (WMA4) - WP10536
Resource Unit Prioritisation Report
90
tool. To avoid double accounting, these plans were excluded from the assessment. However, the presence of
conservancies and both formally and informally protected areas was interrogated. The National Protected Areas
coverage was overlaid with the study area in a GIS environment to identify the location of protected areas
relative to each Resource Unit. Resource Units which contained a formally protected areas were scored as 1
while Resource Units which contained either an informally protected area or a conservancy were scored as 0.5.
The maximum score for any Resource Unit was included in the prioritisation tool. The conservancies and
protected areas considered during the assessment are detailed in the table below.
Conservancies Formally protected areas Informally protected areas
• Balule
• Bankenveld
• De Berg Conservancy
• Kwena Basin
• Leutla
• Olifants Gorge
• Pau Rosa
• Tonteldoos
• Bewaarkloof Nature Reserve
• Blyde River Nature Reserve
• Bronkhorstspruit Municipal Nature Reserve
• Gustav Klingbiel Nature Reserve
• Kruger National Park
• Kwaggavoetpad Nature Reserve
• Leeuwfontein Provincial Nature Reserve
• Legalameetse Nature Reserve
• Loskop Dam Nature Reserve
• Mdala Nature Reserve
• Morgenzon
• Motlatse Canyon Provincial Nature Reserve
• Ohrigstad Dam Nature Reserve
• Potlake,
• Schuinsdraai Nature Reserve
• Tweefontein
• Verloren Valei Nature Reserve
• Witbank Nature Reserve
• Wolkberg (serala) Wilderness Area
• Wolkberg Caves Nature Reserve
• Andover Game Reserve
• Ezemvelo Private Nature Reserve
• Kapama/madrid Reserve
• Klaserie Private Nature Reserve
• Litsitsirupa Private Nature Reserve
• Mount Anderson Catchment Nature Reserve
• Selati Game Reserve
• Timbavati Game Reserve
5. Level of threat posed to ecological components of the resource unit
The same scores as those reflected under the “Level of threat posed to users” criterion were used for this
criterion.
6. Management considerations
a. Resource Units with PES lower than a D category
The Resource Directed Measures Integrated Manual (1999) sets out a default rule which states that “the
management class is determined in relation to the present state, but at a level which represents a goal of no
further degradation for water resources which are largely modified, and at least a move toward improvement for
water resources which are critically modified”. Similarly, the National Water Resources Strategy (2002) states
that “any water resource which demonstrates ‘Unacceptable’ conditions is deemed to be unsustainable. In these
cases the management class will be determined as a minimum of ‘Heavily used/impacted’ (the lowest
management class), and management will aim to rehabilitate the water resources to this state”. In line with this
thinking, the Water Resource Classification for the Olifants WMA considers that an E category is unsustainable
and cannot be recommended as an ecological condition. This principle was also adopted in the RQO
methodology. Consequently, any Resource Units with a PES lower than a D category must be prioritised for
management action. Eight Resource Units in the Olifants WMA have a PES of an “E” and have therefore
received a score of 1 in the prioritisation tool.
7. Practical considerations
a. Monitoring points
The Department of Water Affairs undertakes a number of national monitoring programmes including the
National Chemical Monitoring Programme (NCMP), the National Microbiological Monitoring Programme
(NMMP) and the River Health Programme (RHP). In addition, the Department has a number of routine water
Determination of Resource Quality Objectives in the Olifants Water Management Area (WMA4) - WP10536
Resource Unit Prioritisation Report
91
quality monitoring sites and Ecological Water Requirement (EWR) sites. The location of these monitoring sites
relative to each of the Resource Units was identified. Resource Units which contained either a EWR or RHP site
were scored as 1 while those Resource Units which contained any other monitoring site received a score of 0.5.
The maximum score assigned to each Resource Unit was included as the final score for this sub-criterion in the
Resource Unit prioritisation tool.
b. Accessibility
No desktop data was available to score this sub-criterion and it was therefore excluded from the initial
prioritisation process.
c. Safety risk
No desktop data was available to score this sub-criterion and it was therefore excluded from the initial
prioritisation process.
92
9.2 APPENDIX A2: RU SCORES FOR EACH CRITERION AND SUB-CRITERION APPLIED IN THE DESKTOP APPLICATION OF THE RUPT FOR
RIVERS IN THE STUDY.
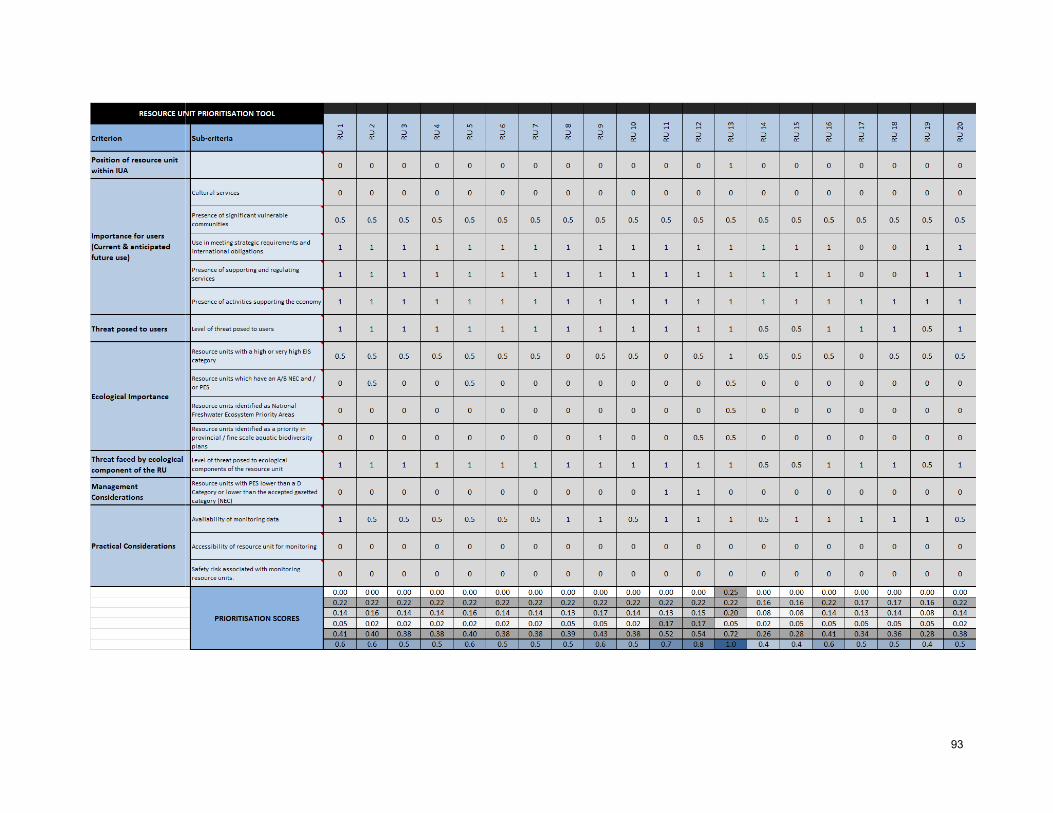
93
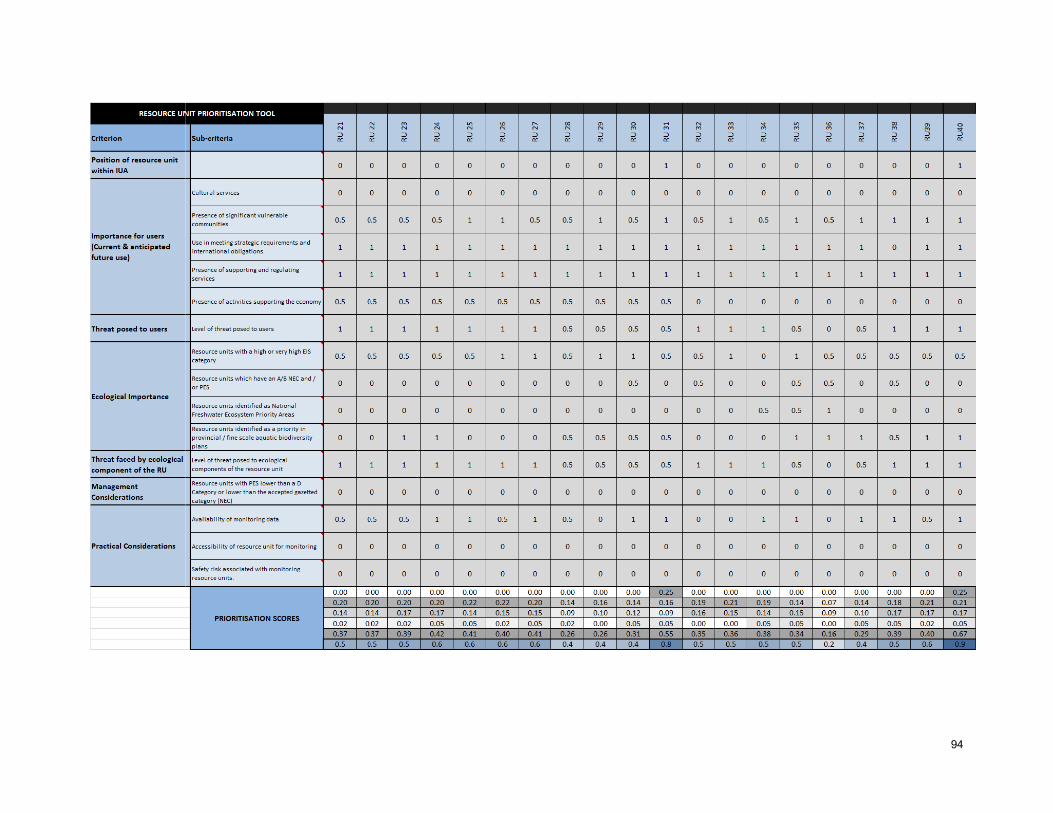
94
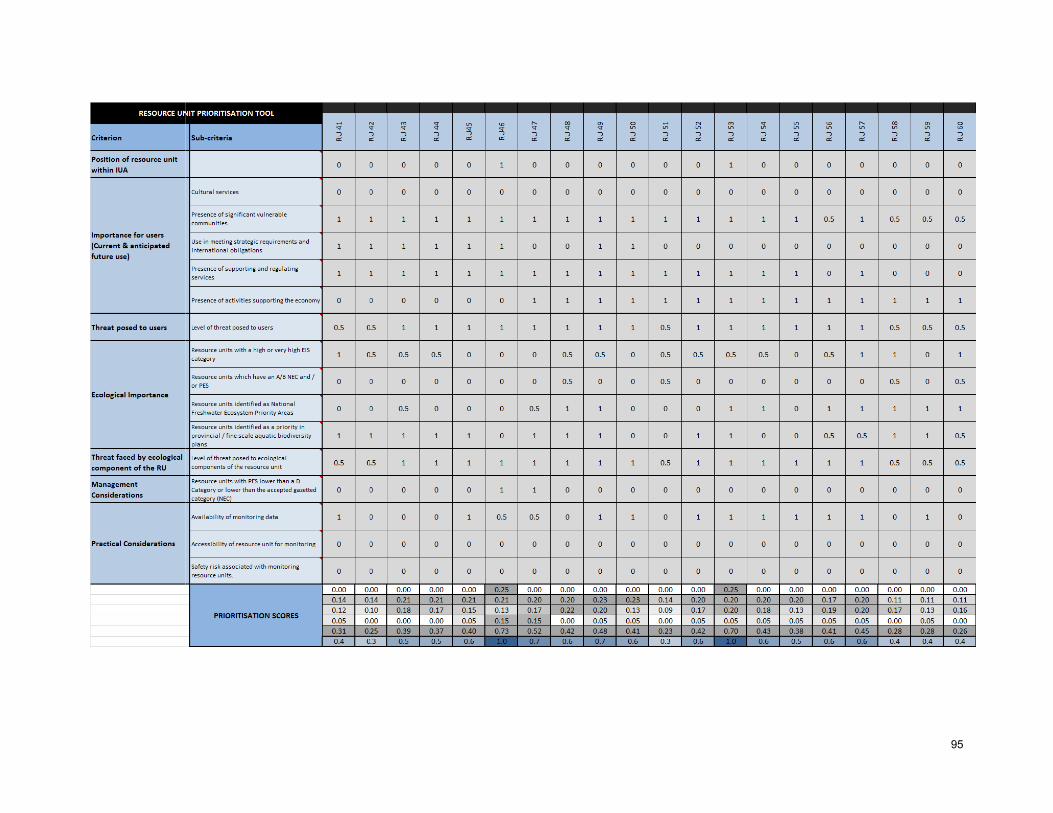
95
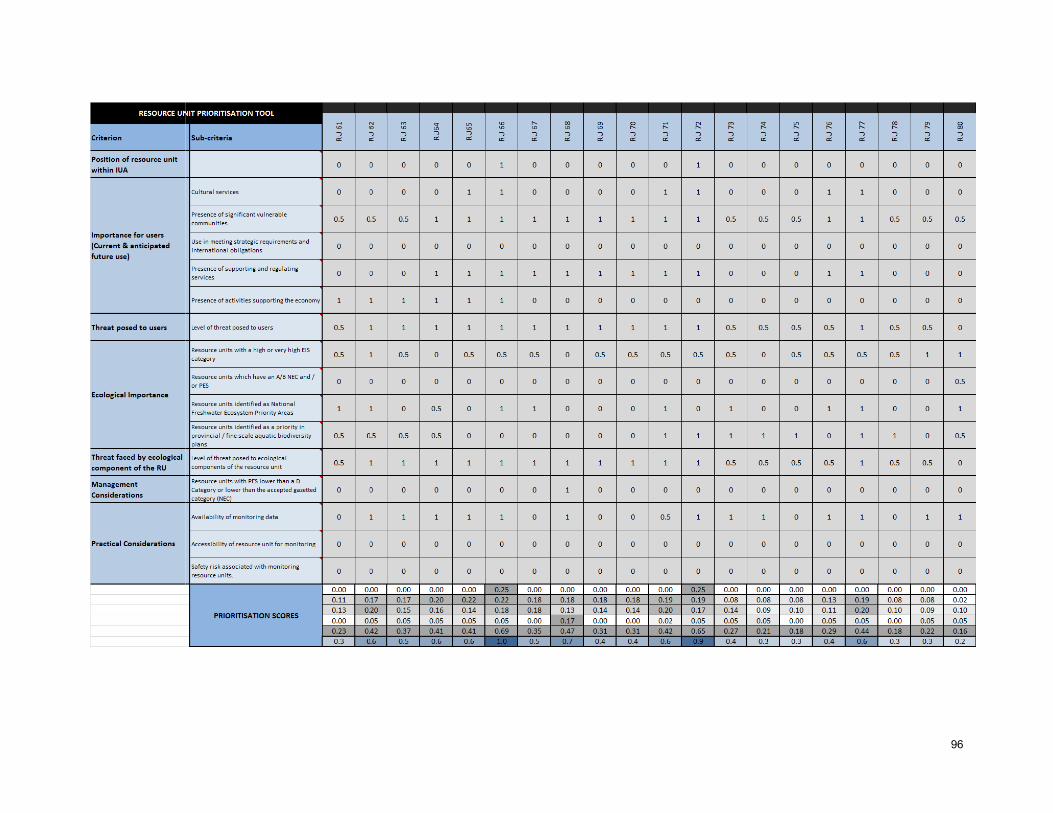
96

97
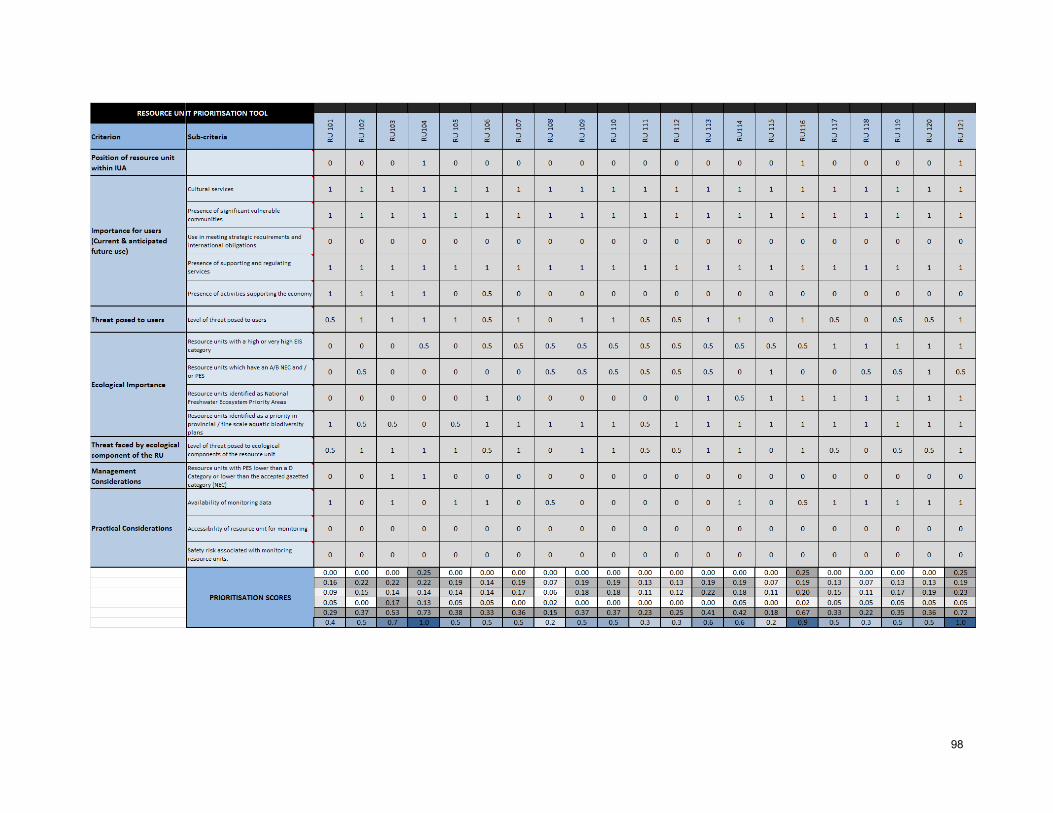
98
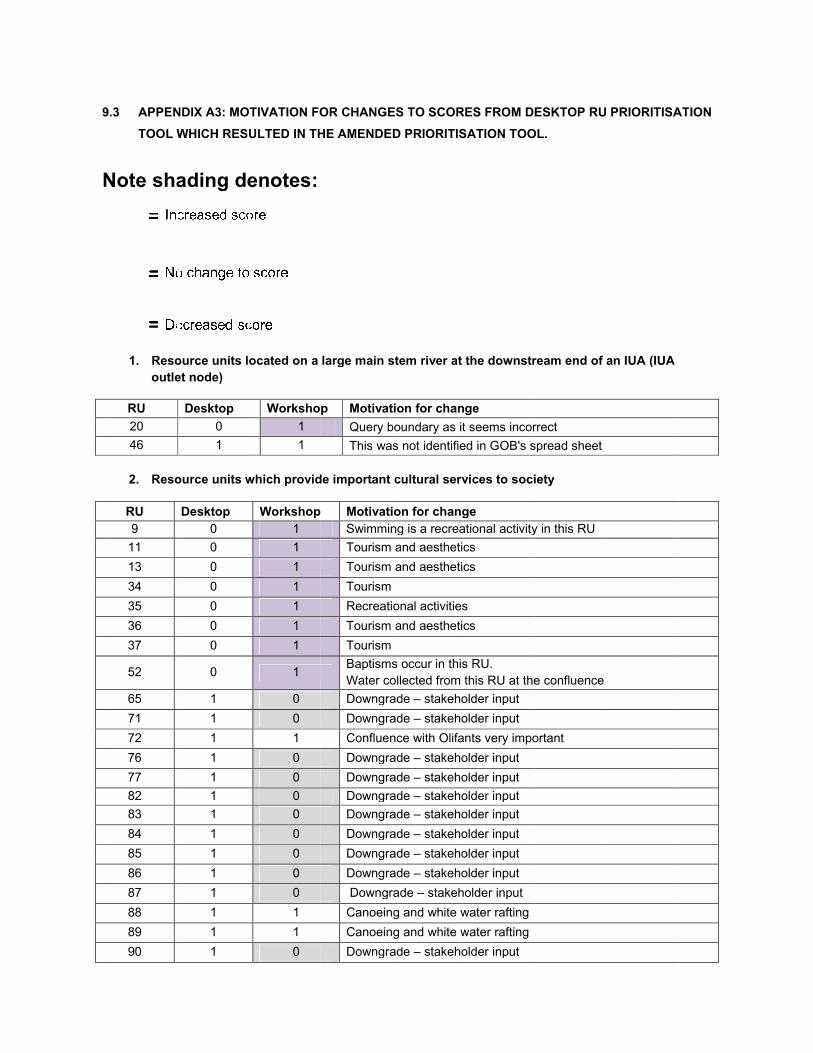
9.3
Note shading denotes:
9.3 APPENDIX A3:
TOOL WHICH RESULTED
Note shading denotes:
1. Resource units located on a large main stem river at the downstream end of an IUA (IUA
outlet node)
RU
20
46
2. Resource units which provide important cultural services to society
RU
9
11
13
34
35
36
37
52
65
71
72
76
77
82
83
84
85
86
87
88
89
90
APPENDIX A3: MOTIVATION FOR CHANG
TOOL WHICH RESULTED
Note shading denotes:
Resource units located on a large main stem river at the downstream end of an IUA (IUA
outlet node)
Desktop
0
1
Resource units which provide important cultural services to society
Desktop
0
0
0
0
0
0
0
0
1
1
1
1
1
1
1
1
1
1
1
1
1
1
MOTIVATION FOR CHANG
TOOL WHICH RESULTED IN THE AMENDED PRIOR
Note shading denotes:
Resource units located on a large main stem river at the downstream end of an IUA (IUA
Workshop
1
1
Resource units which provide important cultural services to society
Workshop
1
1
1
1
1
1
1
1
0
0
1
0
0
0
0
0
0
0
0
1
1
0
MOTIVATION FOR CHANGES TO SCORES FROM DE
IN THE AMENDED PRIOR
Note shading denotes:
Resource units located on a large main stem river at the downstream end of an IUA (IUA
Workshop Motivation for change
Query boundary as it seems incorrect
This was not identified in GOB's spread sheet
Resource units which provide important cultural services to society
Workshop Motivation for change
Swimming is a recreational activity in this RU
Tourism and aesthetics
Tourism and aesthetics
Tourism
Recreational activities
Tourism and aesthetics
Tourism
Baptisms occur in this RU.
Water collected
Downgrade
Downgrade
Confluence with Olifants very important
Downgrade
Downgrade
Downgrade
Downgrade
Downgrade
Downgrade
Downgrade
Downgrade
Canoeing and white water rafting
Canoeing and white water rafting
Downgrade
ES TO SCORES FROM DE
IN THE AMENDED PRIORITISATION TOOL.
Resource units located on a large main stem river at the downstream end of an IUA (IUA
Motivation for change
Query boundary as it seems incorrect
This was not identified in GOB's spread sheet
Resource units which provide important cultural services to society
Motivation for change
Swimming is a recreational activity in this RU
Tourism and aesthetics
Tourism and aesthetics
Tourism
Recreational activities
Tourism and aesthetics
Baptisms occur in this RU.
Water collected from this RU at the confluence
Downgrade – stakeholder input
Downgrade – stakeholder input
Confluence with Olifants very important
Downgrade – stakeholder input
Downgrade – stakeholder input
Downgrade – stakeholder input
Downgrade – stakeholder input
Downgrade – stakeholder input
Downgrade – stakeholder input
Downgrade – stakeholder input
Downgrade – stakeholder input
Canoeing and white water rafting
Canoeing and white water rafting
Downgrade – stakeholder input
ES TO SCORES FROM DE
ITISATION TOOL.
Resource units located on a large main stem river at the downstream end of an IUA (IUA
Motivation for change
Query boundary as it seems incorrect
This was not identified in GOB's spread sheet
Resource units which provide important cultural services to society
Motivation for change
Swimming is a recreational activity in this RU
Tourism and aesthetics
Tourism and aesthetics
Recreational activities
Tourism and aesthetics
Baptisms occur in this RU.
from this RU at the confluence
stakeholder input
stakeholder input
Confluence with Olifants very important
stakeholder input
stakeholder input
stakeholder input
stakeholder input
stakeholder input
stakeholder input
stakeholder input
stakeholder input
Canoeing and white water rafting
Canoeing and white water rafting
stakeholder input
ES TO SCORES FROM DESKTOP RU PRIORITISAT
ITISATION TOOL.
Resource units located on a large main stem river at the downstream end of an IUA (IUA
Query boundary as it seems incorrect
This was not identified in GOB's spread sheet
Resource units which provide important cultural services to society
Swimming is a recreational activity in this RU
from this RU at the confluence
Confluence with Olifants very important
SKTOP RU PRIORITISAT
Resource units located on a large main stem river at the downstream end of an IUA (IUA
SKTOP RU PRIORITISATION
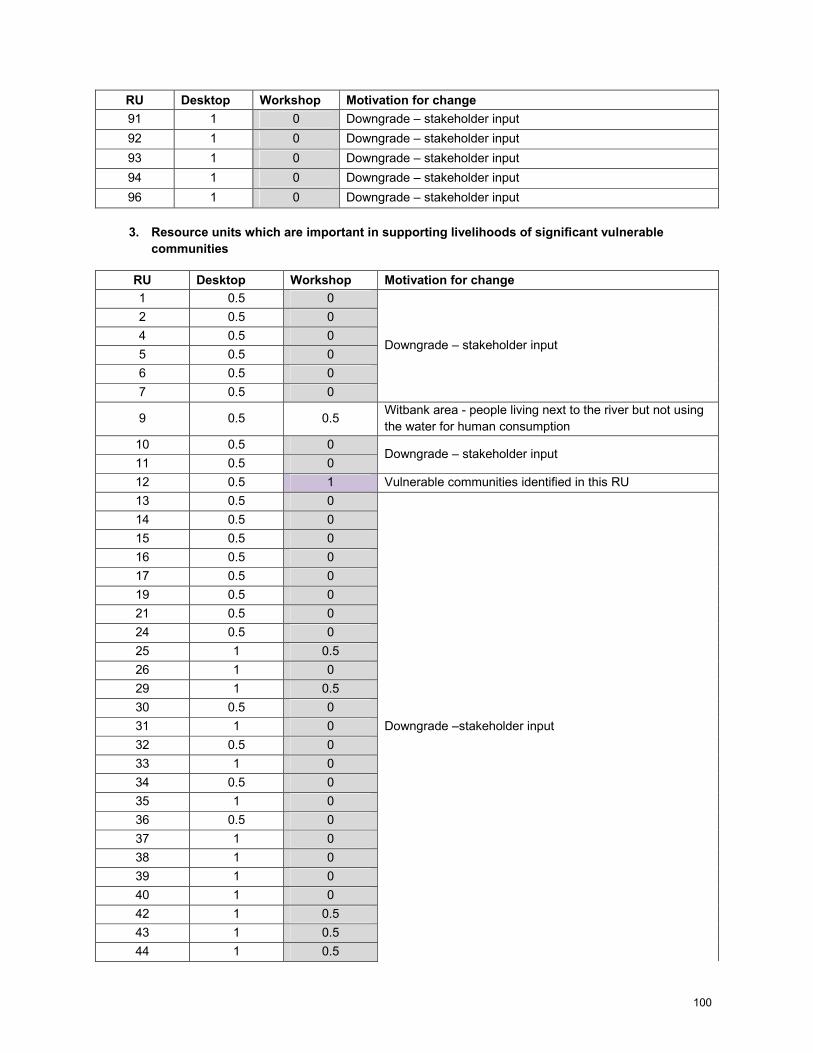
100
RU Desktop Workshop Motivation for change
91 1 0 Downgrade – stakeholder input
92 1 0 Downgrade – stakeholder input
93 1 0 Downgrade – stakeholder input
94 1 0 Downgrade – stakeholder input
96 1 0 Downgrade – stakeholder input
3. Resource units which are important in supporting livelihoods of significant vulnerable
communities
RU Desktop Workshop Motivation for change
1 0.5 0
Downgrade – stakeholder input
2 0.5 0
4 0.5 0
5 0.5 0
6 0.5 0
7 0.5 0
9 0.5 0.5 Witbank area - people living next to the river but not using
the water for human consumption
10 0.5 0 Downgrade – stakeholder input
11 0.5 0
12 0.5 1 Vulnerable communities identified in this RU
13 0.5 0
Downgrade –stakeholder input
14 0.5 0
15 0.5 0
16 0.5 0
17 0.5 0
19 0.5 0
21 0.5 0
24 0.5 0
25 1 0.5
26 1 0
29 1 0.5
30 0.5 0
31 1 0
32 0.5 0
33 1 0
34 0.5 0
35 1 0
36 0.5 0
37 1 0
38 1 0
39 1 0
40 1 0
42 1 0.5
43 1 0.5
44 1 0.5
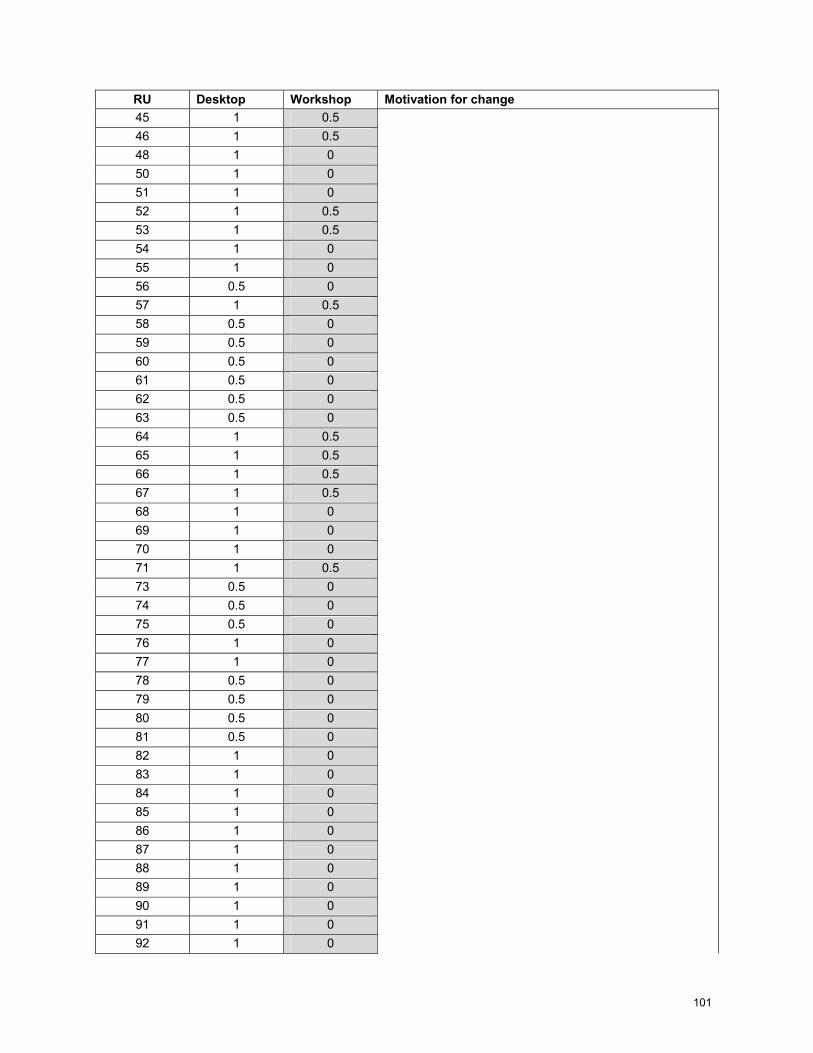
101
RU Desktop Workshop Motivation for change
45 1 0.5
46 1 0.5
48 1 0
50 1 0
51 1 0
52 1 0.5
53 1 0.5
54 1 0
55 1 0
56 0.5 0
57 1 0.5
58 0.5 0
59 0.5 0
60 0.5 0
61 0.5 0
62 0.5 0
63 0.5 0
64 1 0.5
65 1 0.5
66 1 0.5
67 1 0.5
68 1 0
69 1 0
70 1 0
71 1 0.5
73 0.5 0
74 0.5 0
75 0.5 0
76 1 0
77 1 0
78 0.5 0
79 0.5 0
80 0.5 0
81 0.5 0
82 1 0
83 1 0
84 1 0
85 1 0
86 1 0
87 1 0
88 1 0
89 1 0
90 1 0
91 1 0
92 1 0
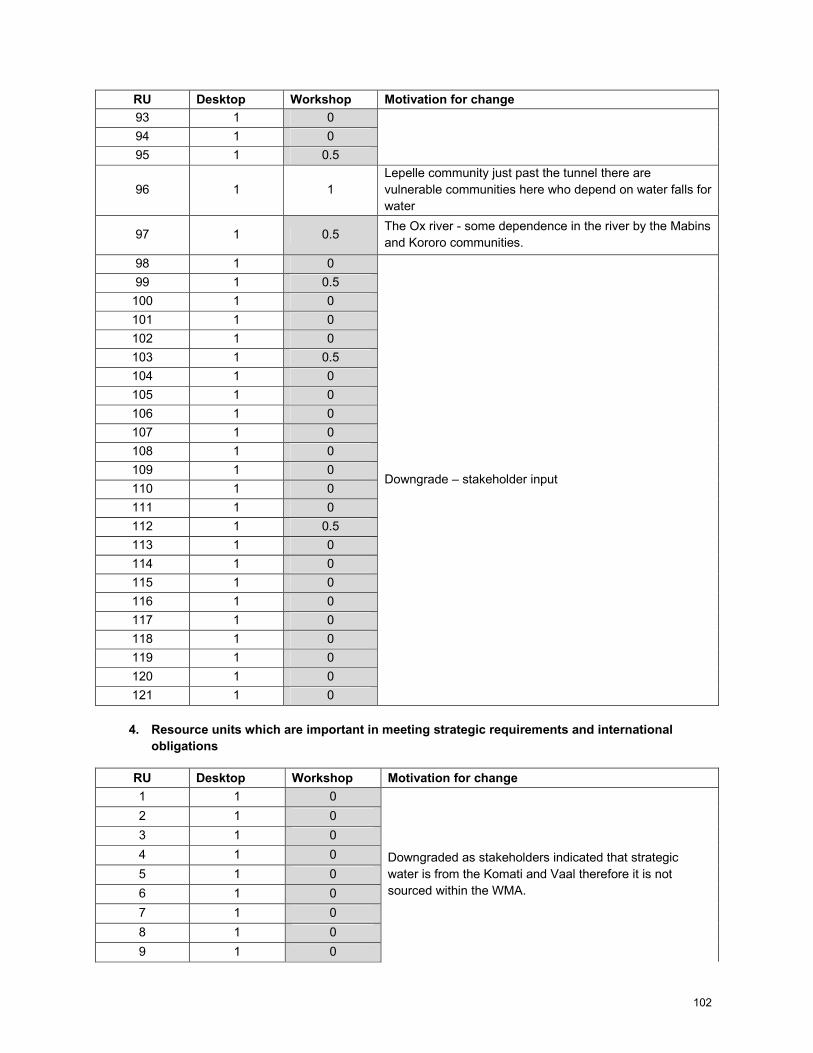
102
RU Desktop Workshop Motivation for change
93 1 0
94 1 0
95 1 0.5
96 1 1
Lepelle community just past the tunnel there are
vulnerable communities here who depend on water falls for
water
97 1 0.5 The Ox river - some dependence in the river by the Mabins
and Kororo communities.
98 1 0
Downgrade – stakeholder input
99 1 0.5
100 1 0
101 1 0
102 1 0
103 1 0.5
104 1 0
105 1 0
106 1 0
107 1 0
108 1 0
109 1 0
110 1 0
111 1 0
112 1 0.5
113 1 0
114 1 0
115 1 0
116 1 0
117 1 0
118 1 0
119 1 0
120 1 0
121 1 0
4. Resource units which are important in meeting strategic requirements and international
obligations
RU Desktop Workshop Motivation for change
1 1 0
Downgraded as stakeholders indicated that strategic
water is from the Komati and Vaal therefore it is not
sourced within the WMA.
2 1 0
3 1 0
4 1 0
5 1 0
6 1 0
7 1 0
8 1 0
9 1 0
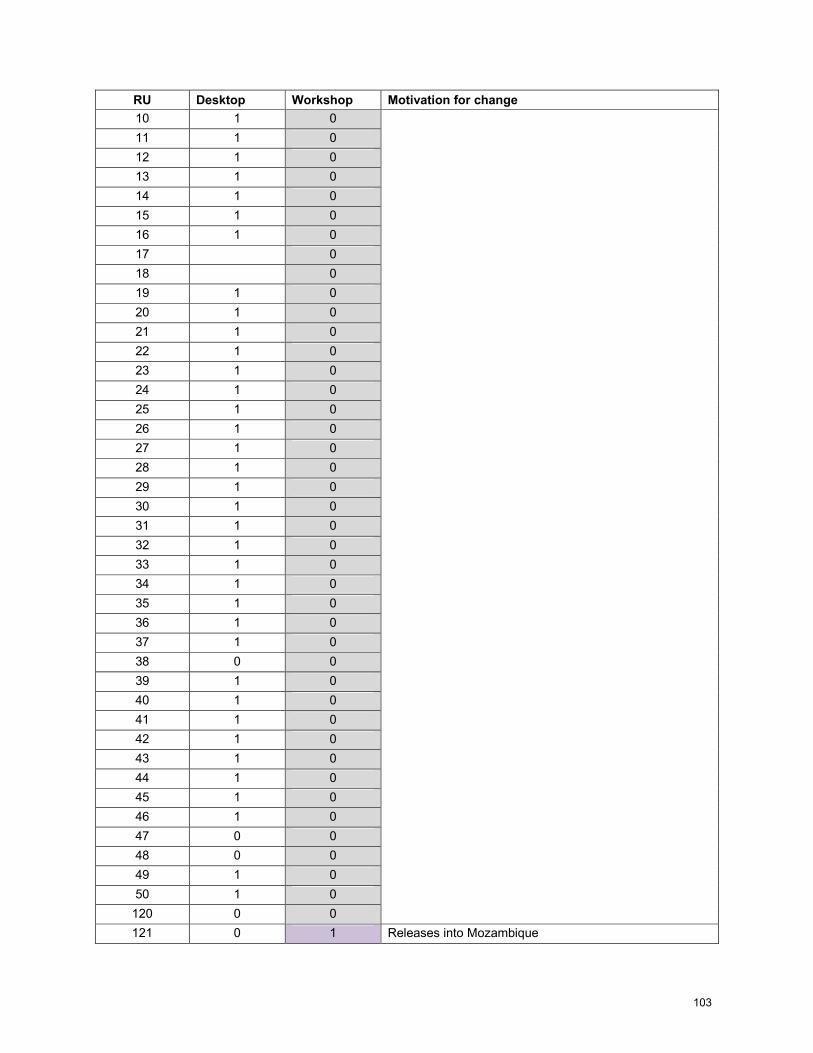
103
RU Desktop Workshop Motivation for change
10 1 0
11 1 0
12 1 0
13 1 0
14 1 0
15 1 0
16 1 0
17
0
18
0
19 1 0
20 1 0
21 1 0
22 1 0
23 1 0
24 1 0
25 1 0
26 1 0
27 1 0
28 1 0
29 1 0
30 1 0
31 1 0
32 1 0
33 1 0
34 1 0
35 1 0
36 1 0
37 1 0
38 0 0
39 1 0
40 1 0
41 1 0
42 1 0
43 1 0
44 1 0
45 1 0
46 1 0
47 0 0
48 0 0
49 1 0
50 1 0
120 0 0
121 0 1 Releases into Mozambique
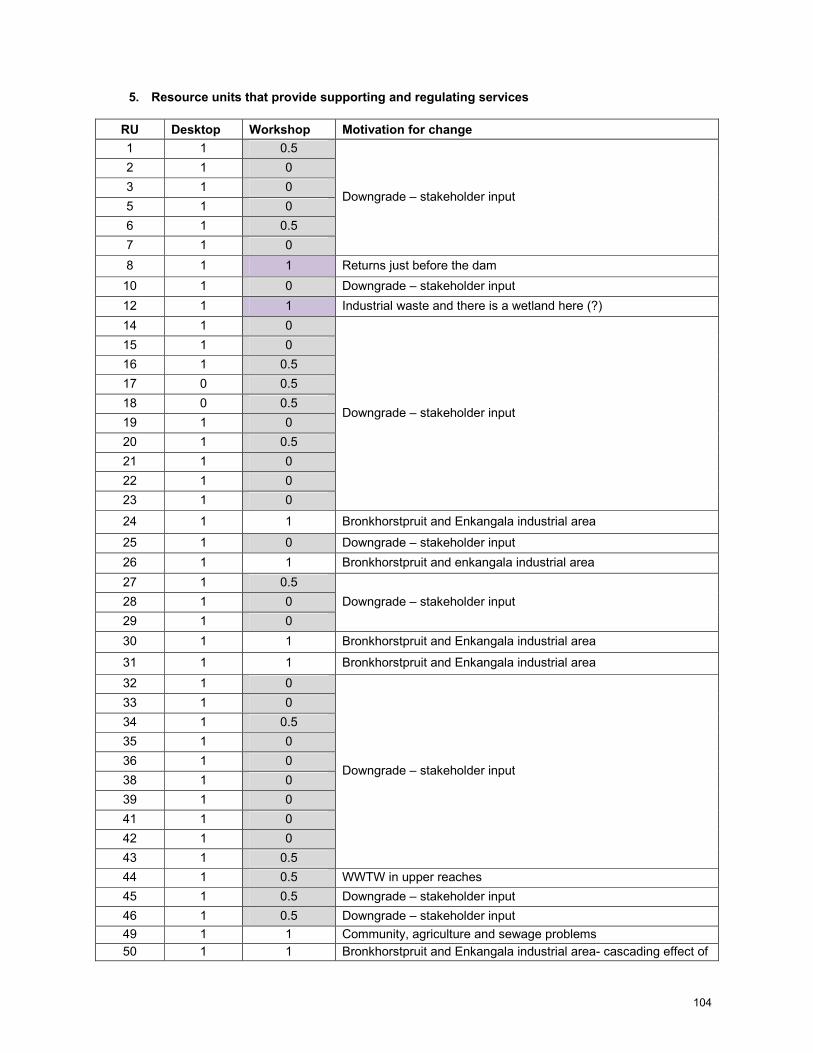
104
5. Resource units that provide supporting and regulating services
RU Desktop Workshop Motivation for change
1 1 0.5
Downgrade – stakeholder input
2 1 0
3 1 0
5 1 0
6 1 0.5
7 1 0
8 1 1 Returns just before the dam
10 1 0 Downgrade – stakeholder input
12 1 1 Industrial waste and there is a wetland here (?)
14 1 0
Downgrade – stakeholder input
15 1 0
16 1 0.5
17 0 0.5
18 0 0.5
19 1 0
20 1 0.5
21 1 0
22 1 0
23 1 0
24 1 1 Bronkhorstpruit and Enkangala industrial area
25 1 0 Downgrade – stakeholder input
26 1 1 Bronkhorstpruit and enkangala industrial area
27 1 0.5
Downgrade – stakeholder input 28 1 0
29 1 0
30 1 1 Bronkhorstpruit and Enkangala industrial area
31 1 1 Bronkhorstpruit and Enkangala industrial area
32 1 0
Downgrade – stakeholder input
33 1 0
34 1 0.5
35 1 0
36 1 0
38 1 0
39 1 0
41 1 0
42 1 0
43 1 0.5
44 1 0.5 WWTW in upper reaches
45 1 0.5 Downgrade – stakeholder input
46 1 0.5 Downgrade – stakeholder input
49 1 1 Community, agriculture and sewage problems
50 1 1 Bronkhorstpruit and Enkangala industrial area- cascading effect of
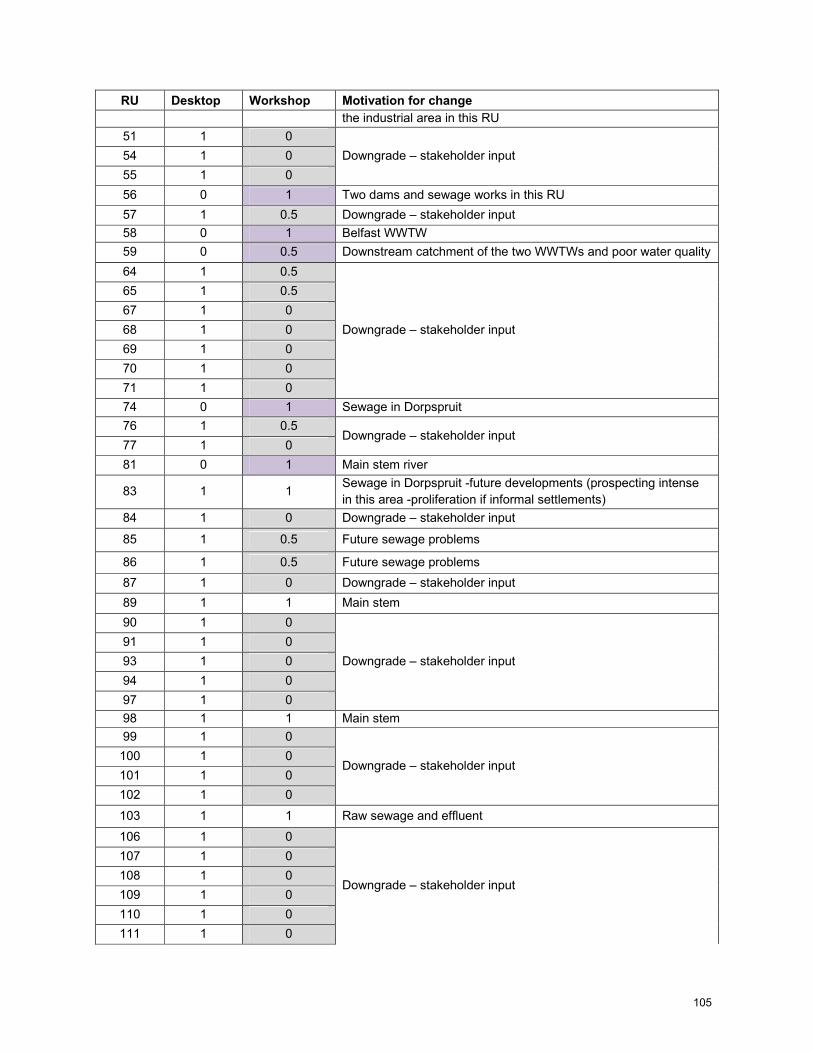
105
RU Desktop Workshop Motivation for change
the industrial area in this RU
51 1 0
Downgrade – stakeholder input 54 1 0
55 1 0
56 0 1 Two dams and sewage works in this RU
57 1 0.5 Downgrade – stakeholder input
58 0 1 Belfast WWTW
59 0 0.5 Downstream catchment of the two WWTWs and poor water quality
64 1 0.5
Downgrade – stakeholder input
65 1 0.5
67 1 0
68 1 0
69 1 0
70 1 0
71 1 0
74 0 1 Sewage in Dorpspruit
76 1 0.5 Downgrade – stakeholder input
77 1 0
81 0 1 Main stem river
83 1 1 Sewage in Dorpspruit -future developments (prospecting intense
in this area -proliferation if informal settlements)
84 1 0 Downgrade – stakeholder input
85 1 0.5 Future sewage problems
86 1 0.5 Future sewage problems
87 1 0 Downgrade – stakeholder input
89 1 1 Main stem
90 1 0
Downgrade – stakeholder input
91 1 0
93 1 0
94 1 0
97 1 0
98 1 1 Main stem
99 1 0
Downgrade – stakeholder input 100 1 0
101 1 0
102 1 0
103 1 1 Raw sewage and effluent
106 1 0
Downgrade – stakeholder input
107 1 0
108 1 0
109 1 0
110 1 0
111 1 0
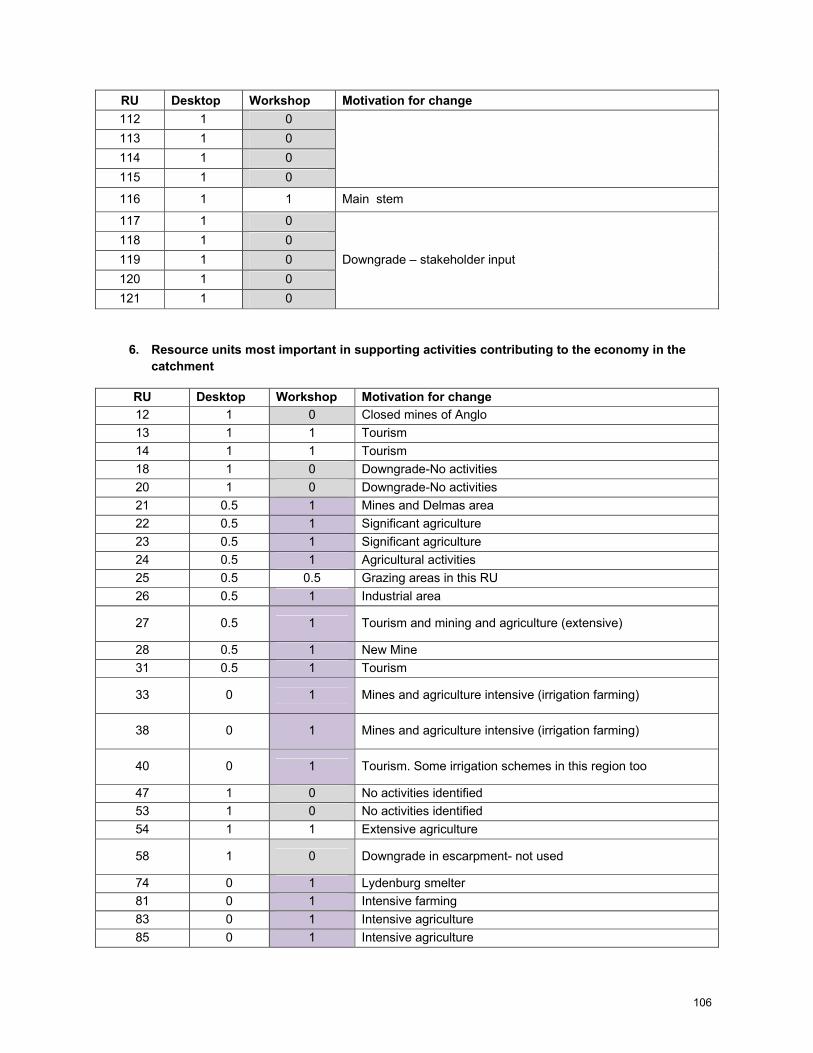
106
RU Desktop Workshop Motivation for change
112 1 0
113 1 0
114 1 0
115 1 0
116 1 1 Main stem
117 1 0
Downgrade – stakeholder input
118 1 0
119 1 0
120 1 0
121 1 0
6. Resource units most important in supporting activities contributing to the economy in the
catchment
RU Desktop Workshop Motivation for change
12 1 0 Closed mines of Anglo
13 1 1 Tourism
14 1 1 Tourism
18 1 0 Downgrade-No activities
20 1 0 Downgrade-No activities
21 0.5 1 Mines and Delmas area
22 0.5 1 Significant agriculture
23 0.5 1 Significant agriculture
24 0.5 1 Agricultural activities
25 0.5 0.5 Grazing areas in this RU
26 0.5 1 Industrial area
27 0.5 1 Tourism and mining and agriculture (extensive)
28 0.5 1 New Mine
31 0.5 1 Tourism
33 0 1 Mines and agriculture intensive (irrigation farming)
38 0 1 Mines and agriculture intensive (irrigation farming)
40 0 1 Tourism. Some irrigation schemes in this region too
47 1 0 No activities identified
53 1 0 No activities identified
54 1 1 Extensive agriculture
58 1 0 Downgrade in escarpment- not used
74 0 1 Lydenburg smelter
81 0 1 Intensive farming
83 0 1 Intensive agriculture
85 0 1 Intensive agriculture
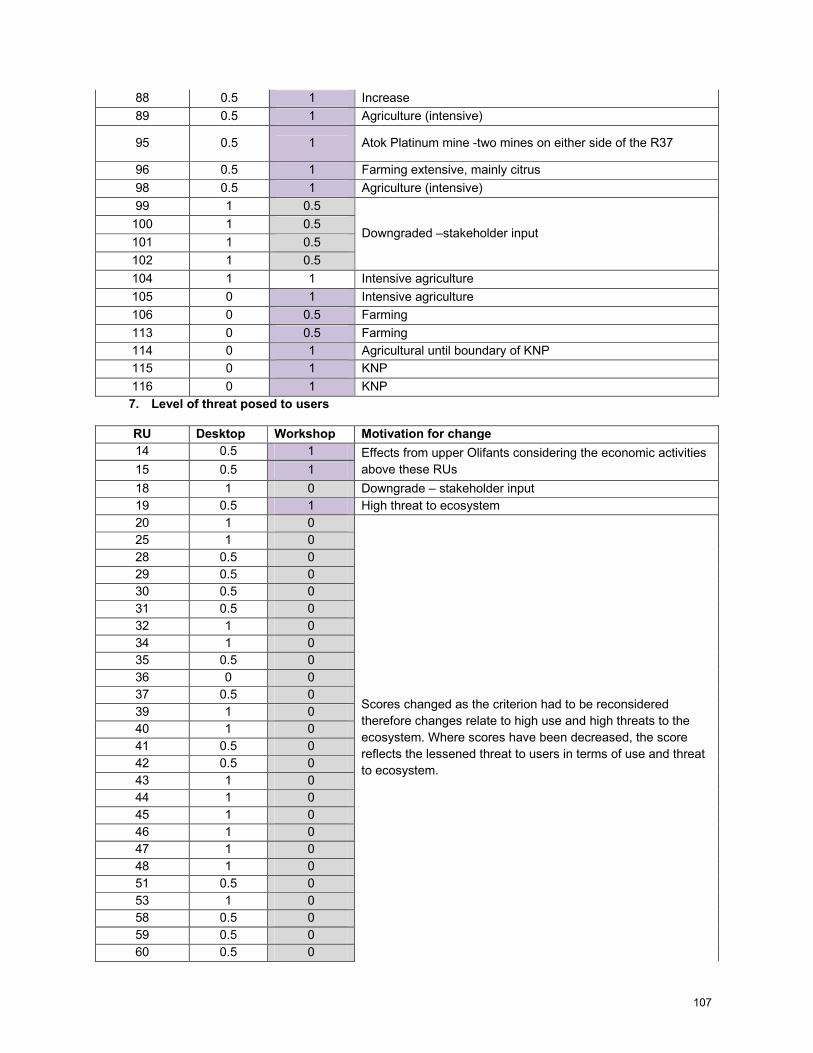
107
88 0.5 1 Increase
89 0.5 1 Agriculture (intensive)
95 0.5 1 Atok Platinum mine -two mines on either side of the R37
96 0.5 1 Farming extensive, mainly citrus
98 0.5 1 Agriculture (intensive)
99 1 0.5
Downgraded –stakeholder input 100 1 0.5
101 1 0.5
102 1 0.5
104 1 1 Intensive agriculture
105 0 1 Intensive agriculture
106 0 0.5 Farming
113 0 0.5 Farming
114 0 1 Agricultural until boundary of KNP
115 0 1 KNP
116 0 1 KNP
7. Level of threat posed to users
RU Desktop Workshop Motivation for change
14 0.5 1 Effects from upper Olifants considering the economic activities
above these RUs 15 0.5 1
18 1 0 Downgrade – stakeholder input
19 0.5 1 High threat to ecosystem
20 1 0
Scores changed as the criterion had to be reconsidered
therefore changes relate to high use and high threats to the
ecosystem. Where scores have been decreased, the score
reflects the lessened threat to users in terms of use and threat
to ecosystem.
25 1 0
28 0.5 0
29 0.5 0
30 0.5 0
31 0.5 0
32 1 0
34 1 0
35 0.5 0
36 0 0
37 0.5 0
39 1 0
40 1 0
41 0.5 0
42 0.5 0
43 1 0
44 1 0
45 1 0
46 1 0
47 1 0
48 1 0
51 0.5 0
53 1 0
58 0.5 0
59 0.5 0
60 0.5 0
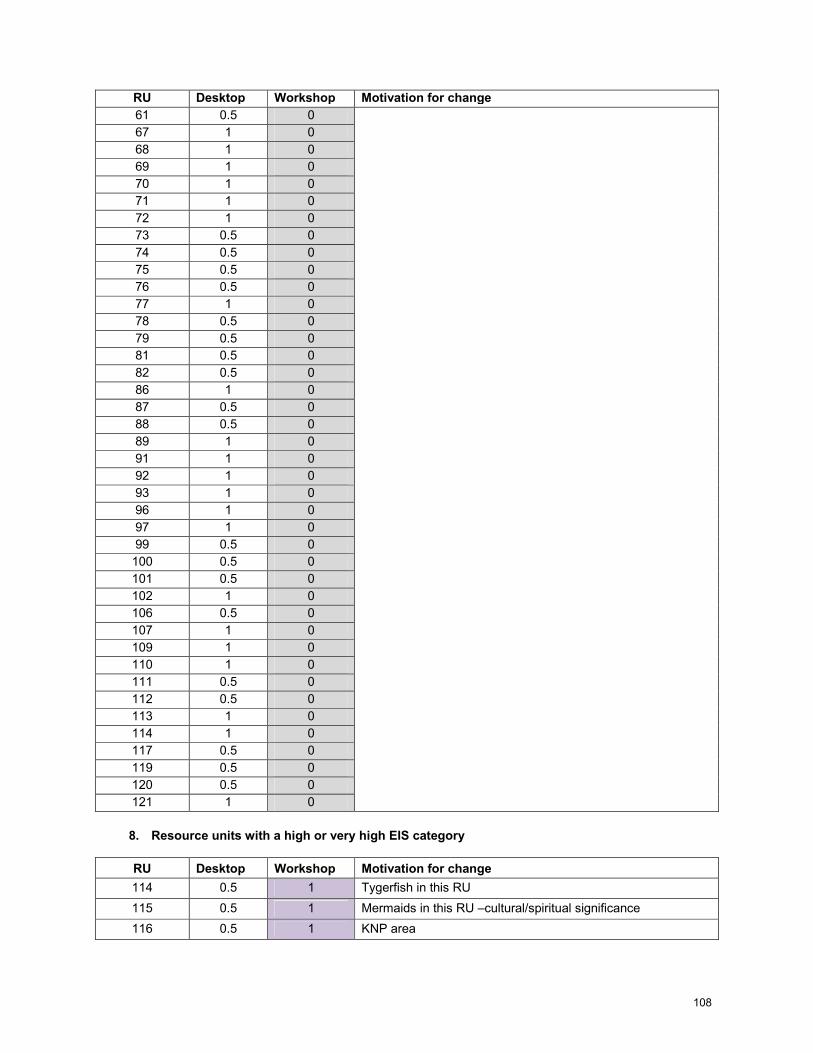
108
RU Desktop Workshop Motivation for change
61 0.5 0
67 1 0
68 1 0
69 1 0
70 1 0
71 1 0
72 1 0
73 0.5 0
74 0.5 0
75 0.5 0
76 0.5 0
77 1 0
78 0.5 0
79 0.5 0
81 0.5 0
82 0.5 0
86 1 0
87 0.5 0
88 0.5 0
89 1 0
91 1 0
92 1 0
93 1 0
96 1 0
97 1 0
99 0.5 0
100 0.5 0
101 0.5 0
102 1 0
106 0.5 0
107 1 0
109 1 0
110 1 0
111 0.5 0
112 0.5 0
113 1 0
114 1 0
117 0.5 0
119 0.5 0
120 0.5 0
121 1 0
8. Resource units with a high or very high EIS category
RU Desktop Workshop Motivation for change
114 0.5 1 Tygerfish in this RU
115 0.5 1 Mermaids in this RU –cultural/spiritual significance
116 0.5 1 KNP area
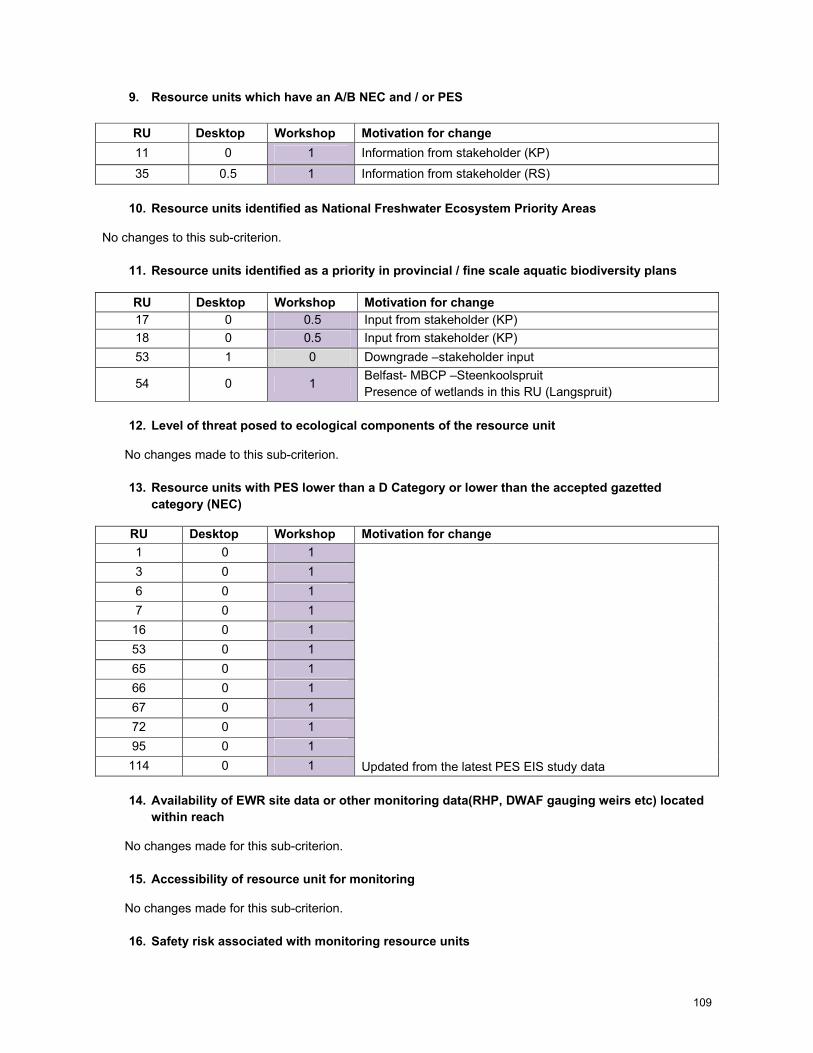
109
9. Resource units which have an A/B NEC and / or PES
RU Desktop Workshop Motivation for change
11 0 1 Information from stakeholder (KP)
35 0.5 1 Information from stakeholder (RS)
10. Resource units identified as National Freshwater Ecosystem Priority Areas
No changes to this sub-criterion.
11. Resource units identified as a priority in provincial / fine scale aquatic biodiversity plans
RU Desktop Workshop Motivation for change
17 0 0.5 Input from stakeholder (KP)
18 0 0.5 Input from stakeholder (KP)
53 1 0 Downgrade –stakeholder input
54 0 1 Belfast- MBCP –Steenkoolspruit
Presence of wetlands in this RU (Langspruit)
12. Level of threat posed to ecological components of the resource unit
No changes made to this sub-criterion.
13. Resource units with PES lower than a D Category or lower than the accepted gazetted
category (NEC)
RU Desktop Workshop Motivation for change
1 0 1
Updated from the latest PES EIS study data
3 0 1
6 0 1
7 0 1
16 0 1
53 0 1
65 0 1
66 0 1
67 0 1
72 0 1
95 0 1
114 0 1
14. Availability of EWR site data or other monitoring data(RHP, DWAF gauging weirs etc) located
within reach
No changes made for this sub-criterion.
15. Accessibility of resource unit for monitoring
No changes made for this sub-criterion.
16. Safety risk associated with monitoring resource units

110
No changes made for this sub-criterion.
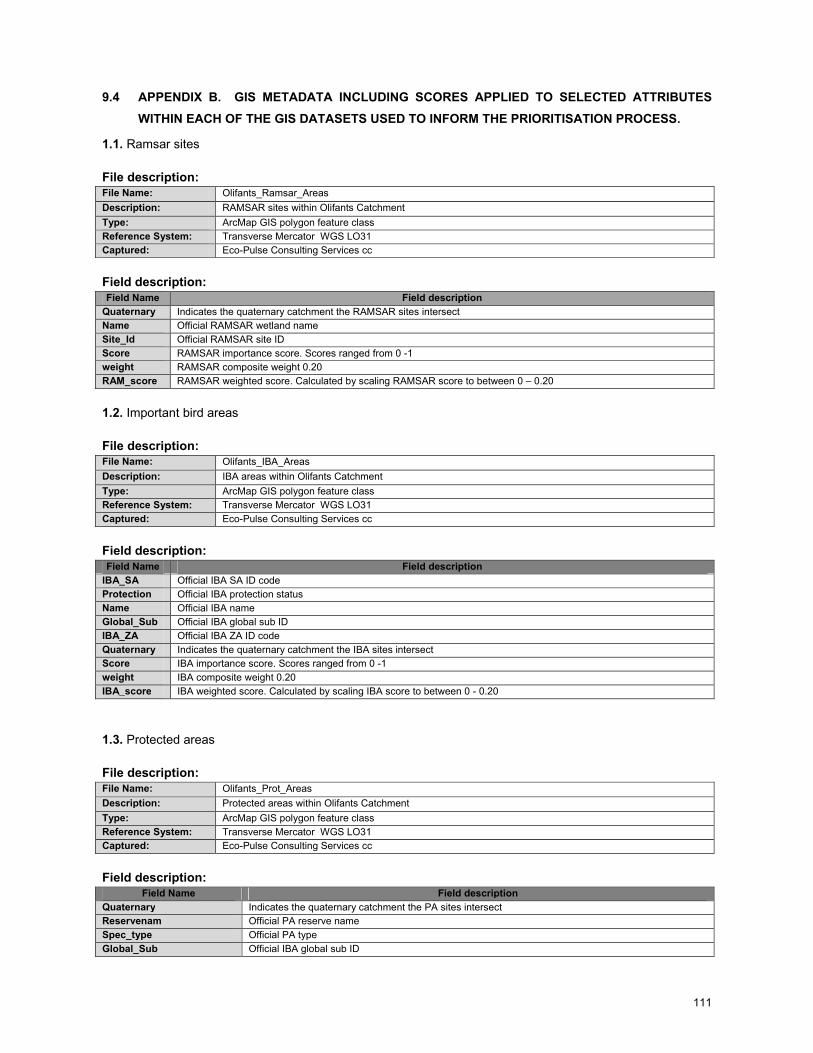
111
9.4 APPENDIX B. GIS METADATA INCLUDING SCORES APPLIED TO SELECTED ATTRIBUTES
WITHIN EACH OF THE GIS DATASETS USED TO INFORM THE PRIORITISATION PROCESS.
1.1. Ramsar sites
File description:
File Name: Olifants_Ramsar_Areas
Description: RAMSAR sites within Olifants Catchment
Type: ArcMap GIS polygon feature class
Reference System: Transverse Mercator WGS LO31
Captured: Eco-Pulse Consulting Services cc
Field description:
Field Name Field description
Quaternary Indicates the quaternary catchment the RAMSAR sites intersect
Name Official RAMSAR wetland name
Site_Id Official RAMSAR site ID
Score RAMSAR importance score. Scores ranged from 0 -1
weight RAMSAR composite weight 0.20
RAM_score RAMSAR weighted score. Calculated by scaling RAMSAR score to between 0 – 0.20
1.2. Important bird areas
File description:
File Name: Olifants_IBA_Areas
Description: IBA areas within Olifants Catchment
Type: ArcMap GIS polygon feature class
Reference System: Transverse Mercator WGS LO31
Captured: Eco-Pulse Consulting Services cc
Field description:
Field Name Field description
IBA_SA Official IBA SA ID code
Protection Official IBA protection status
Name Official IBA name
Global_Sub Official IBA global sub ID
IBA_ZA Official IBA ZA ID code
Quaternary Indicates the quaternary catchment the IBA sites intersect
Score IBA importance score. Scores ranged from 0 -1
weight IBA composite weight 0.20
IBA_score IBA weighted score. Calculated by scaling IBA score to between 0 - 0.20
1.3. Protected areas
File description:
File Name: Olifants_Prot_Areas
Description: Protected areas within Olifants Catchment
Type: ArcMap GIS polygon feature class
Reference System: Transverse Mercator WGS LO31
Captured: Eco-Pulse Consulting Services cc
Field description:
Field Name Field description
Quaternary Indicates the quaternary catchment the PA sites intersect
Reservenam Official PA reserve name
Spec_type Official PA type
Global_Sub Official IBA global sub ID
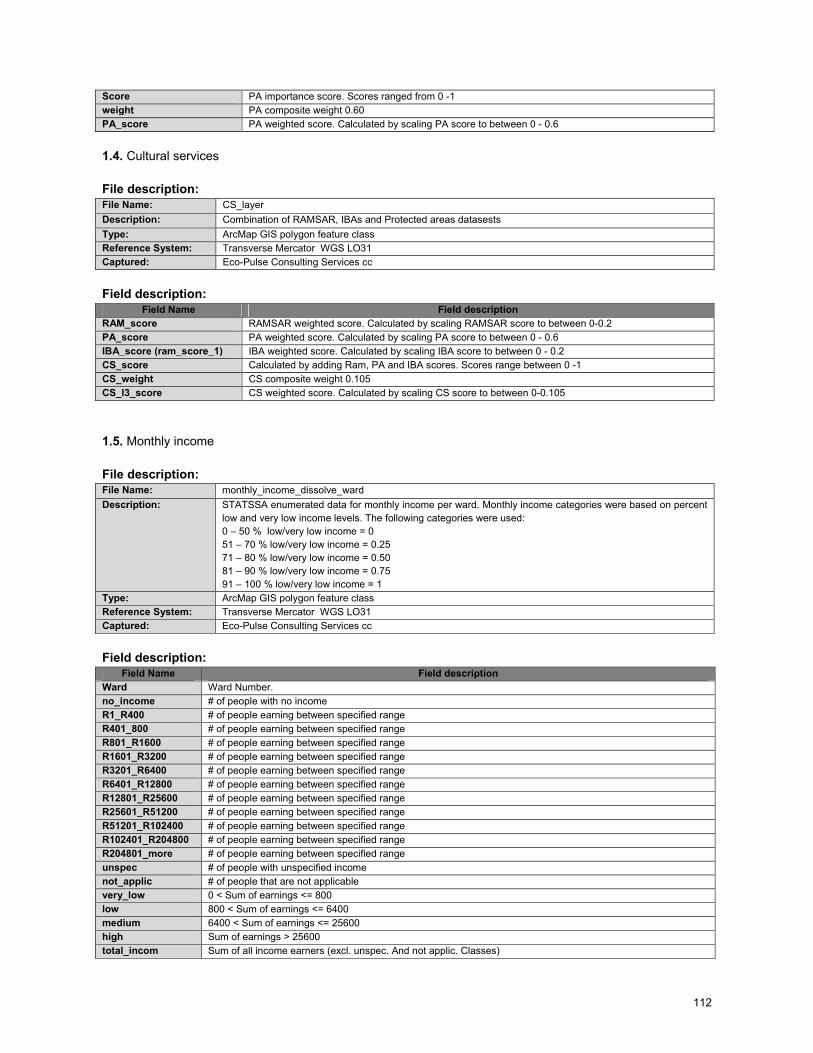
112
Score PA importance score. Scores ranged from 0 -1
weight PA composite weight 0.60
PA_score PA weighted score. Calculated by scaling PA score to between 0 - 0.6
1.4. Cultural services
File description:
File Name: CS_layer
Description: Combination of RAMSAR, IBAs and Protected areas datasests
Type: ArcMap GIS polygon feature class
Reference System: Transverse Mercator WGS LO31
Captured: Eco-Pulse Consulting Services cc
Field description:
Field Name Field description
RAM_score RAMSAR weighted score. Calculated by scaling RAMSAR score to between 0-0.2
PA_score PA weighted score. Calculated by scaling PA score to between 0 - 0.6
IBA_score (ram_score_1) IBA weighted score. Calculated by scaling IBA score to between 0 - 0.2
CS_score Calculated by adding Ram, PA and IBA scores. Scores range between 0 -1
CS_weight CS composite weight 0.105
CS_l3_score CS weighted score. Calculated by scaling CS score to between 0-0.105
1.5. Monthly income
File description:
File Name: monthly_income_dissolve_ward
Description: STATSSA enumerated data for monthly income per ward. Monthly income categories were based on percent
low and very low income levels. The following categories were used:
0 – 50 % low/very low income = 0
51 – 70 % low/very low income = 0.25
71 – 80 % low/very low income = 0.50
81 – 90 % low/very low income = 0.75
91 – 100 % low/very low income = 1
Type: ArcMap GIS polygon feature class
Reference System: Transverse Mercator WGS LO31
Captured: Eco-Pulse Consulting Services cc
Field description:
Field Name Field description
Ward Ward Number.
no_income # of people with no income
R1_R400 # of people earning between specified range
R401_800 # of people earning between specified range R801_R1600 # of people earning between specified range R1601_R3200 # of people earning between specified range R3201_R6400 # of people earning between specified range R6401_R12800 # of people earning between specified range R12801_R25600 # of people earning between specified range R25601_R51200 # of people earning between specified range R51201_R102400 # of people earning between specified range R102401_R204800 # of people earning between specified range R204801_more # of people earning between specified range unspec # of people with unspecified income
not_applic # of people that are not applicable
very_low 0 < Sum of earnings <= 800
low 800 < Sum of earnings <= 6400
medium 6400 < Sum of earnings <= 25600
high Sum of earnings > 25600
total_incom Sum of all income earners (excl. unspec. And not applic. Classes)
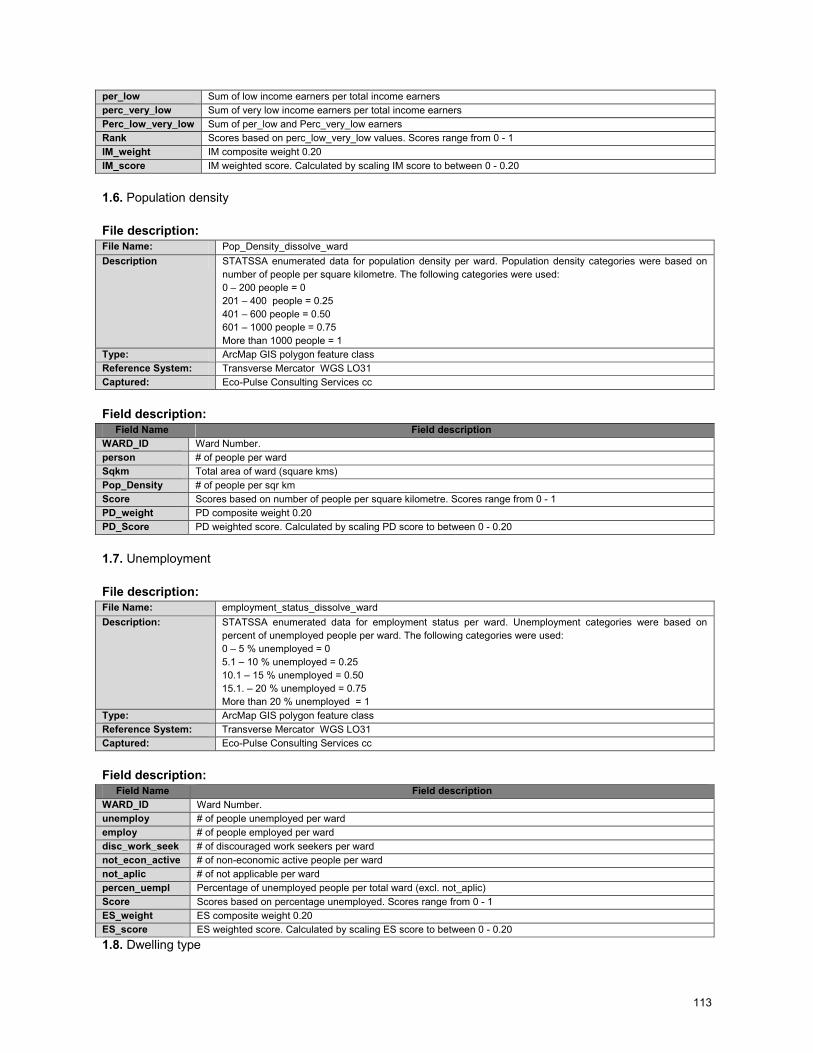
113
per_low Sum of low income earners per total income earners
perc_very_low Sum of very low income earners per total income earners
Perc_low_very_low Sum of per_low and Perc_very_low earners
Rank Scores based on perc_low_very_low values. Scores range from 0 - 1
IM_weight IM composite weight 0.20
IM_score IM weighted score. Calculated by scaling IM score to between 0 - 0.20
1.6. Population density
File description:
File Name: Pop_Density_dissolve_ward
Description STATSSA enumerated data for population density per ward. Population density categories were based on
number of people per square kilometre. The following categories were used:
0 – 200 people = 0
201 – 400 people = 0.25
401 – 600 people = 0.50
601 – 1000 people = 0.75
More than 1000 people = 1
Type: ArcMap GIS polygon feature class
Reference System: Transverse Mercator WGS LO31
Captured: Eco-Pulse Consulting Services cc
Field description:
Field Name Field description
WARD_ID Ward Number.
person # of people per ward
Sqkm Total area of ward (square kms)
Pop_Density # of people per sqr km
Score Scores based on number of people per square kilometre. Scores range from 0 - 1
PD_weight PD composite weight 0.20
PD_Score PD weighted score. Calculated by scaling PD score to between 0 - 0.20
1.7. Unemployment
File description:
File Name: employment_status_dissolve_ward
Description: STATSSA enumerated data for employment status per ward. Unemployment categories were based on
percent of unemployed people per ward. The following categories were used:
0 – 5 % unemployed = 0
5.1 – 10 % unemployed = 0.25
10.1 – 15 % unemployed = 0.50
15.1. – 20 % unemployed = 0.75
More than 20 % unemployed = 1
Type: ArcMap GIS polygon feature class
Reference System: Transverse Mercator WGS LO31
Captured: Eco-Pulse Consulting Services cc
Field description:
Field Name Field description
WARD_ID Ward Number.
unemploy # of people unemployed per ward
employ # of people employed per ward
disc_work_seek # of discouraged work seekers per ward
not_econ_active # of non-economic active people per ward
not_aplic # of not applicable per ward
percen_uempl Percentage of unemployed people per total ward (excl. not_aplic)
Score Scores based on percentage unemployed. Scores range from 0 - 1
ES_weight ES composite weight 0.20
ES_score ES weighted score. Calculated by scaling ES score to between 0 - 0.20
1.8. Dwelling type
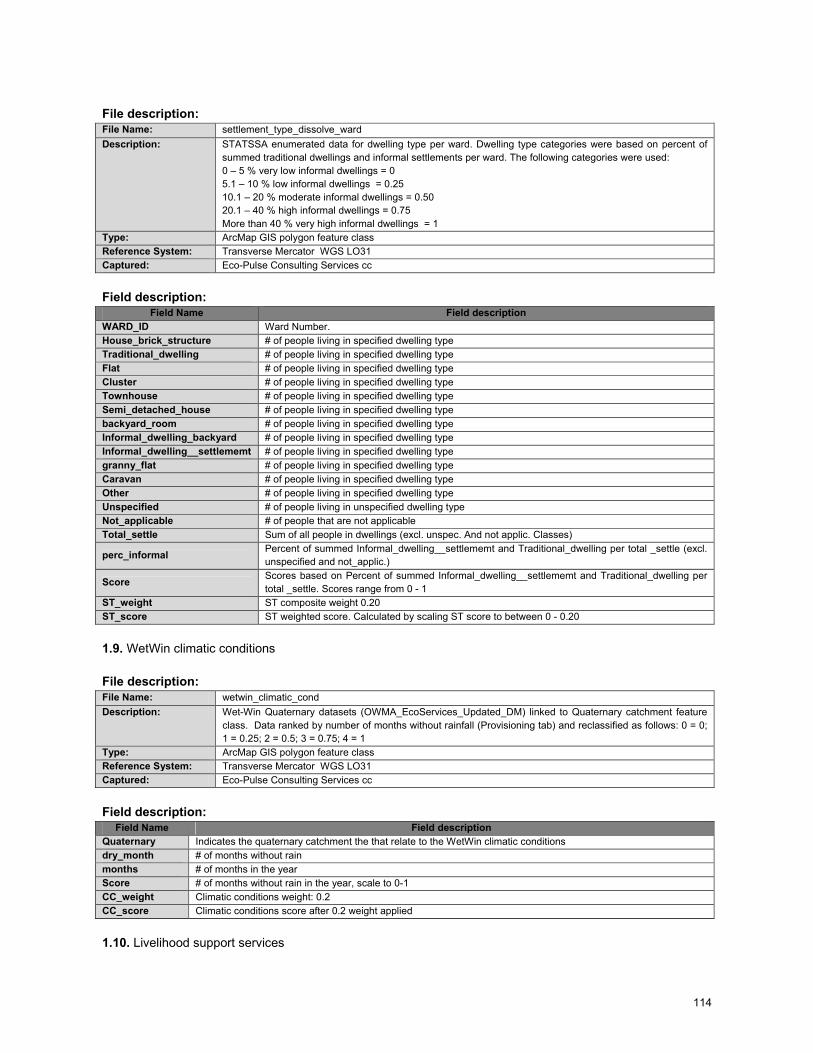
114
File description:
File Name: settlement_type_dissolve_ward
Description: STATSSA enumerated data for dwelling type per ward. Dwelling type categories were based on percent of
summed traditional dwellings and informal settlements per ward. The following categories were used:
0 – 5 % very low informal dwellings = 0
5.1 – 10 % low informal dwellings = 0.25
10.1 – 20 % moderate informal dwellings = 0.50
20.1 – 40 % high informal dwellings = 0.75
More than 40 % very high informal dwellings = 1
Type: ArcMap GIS polygon feature class
Reference System: Transverse Mercator WGS LO31
Captured: Eco-Pulse Consulting Services cc
Field description:
Field Name Field description
WARD_ID Ward Number.
House_brick_structure # of people living in specified dwelling type Traditional_dwelling # of people living in specified dwelling type Flat # of people living in specified dwelling type Cluster # of people living in specified dwelling type Townhouse # of people living in specified dwelling type Semi_detached_house # of people living in specified dwelling type backyard_room # of people living in specified dwelling type Informal_dwelling_backyard # of people living in specified dwelling type Informal_dwelling__settlememt # of people living in specified dwelling type granny_flat # of people living in specified dwelling type Caravan # of people living in specified dwelling type Other # of people living in specified dwelling type Unspecified # of people living in unspecified dwelling type Not_applicable # of people that are not applicable Total_settle Sum of all people in dwellings (excl. unspec. And not applic. Classes)
perc_informal Percent of summed Informal_dwelling__settlememt and Traditional_dwelling per total _settle (excl.
unspecified and not_applic.)
Score Scores based on Percent of summed Informal_dwelling__settlememt and Traditional_dwelling per
total _settle. Scores range from 0 - 1
ST_weight ST composite weight 0.20
ST_score ST weighted score. Calculated by scaling ST score to between 0 - 0.20
1.9. WetWin climatic conditions
File description:
File Name: wetwin_climatic_cond
Description: Wet-Win Quaternary datasets (OWMA_EcoServices_Updated_DM) linked to Quaternary catchment feature
class. Data ranked by number of months without rainfall (Provisioning tab) and reclassified as follows: 0 = 0;
1 = 0.25; 2 = 0.5; 3 = 0.75; 4 = 1
Type: ArcMap GIS polygon feature class
Reference System: Transverse Mercator WGS LO31
Captured: Eco-Pulse Consulting Services cc
Field description:
Field Name Field description
Quaternary Indicates the quaternary catchment the that relate to the WetWin climatic conditions
dry_month # of months without rain
months # of months in the year
Score # of months without rain in the year, scale to 0-1
CC_weight Climatic conditions weight: 0.2
CC_score Climatic conditions score after 0.2 weight applied
1.10. Livelihood support services
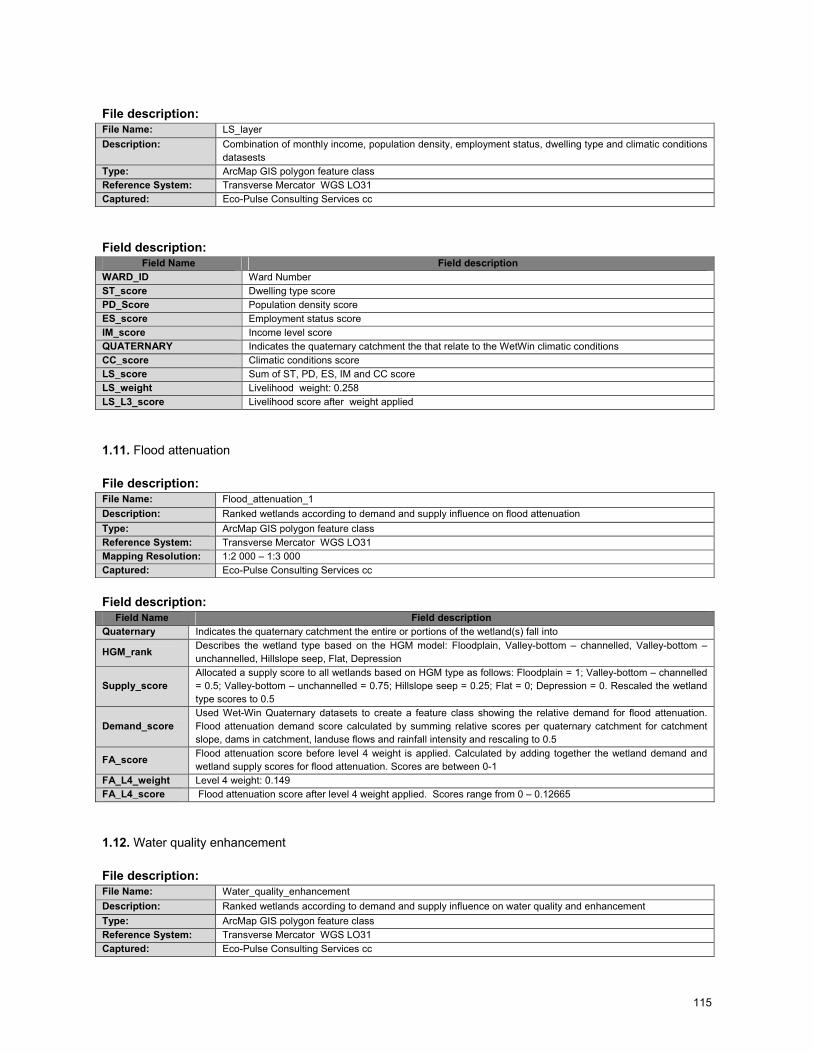
115
File description:
File Name: LS_layer
Description: Combination of monthly income, population density, employment status, dwelling type and climatic conditions
datasests
Type: ArcMap GIS polygon feature class
Reference System: Transverse Mercator WGS LO31
Captured: Eco-Pulse Consulting Services cc
Field description:
Field Name Field description
WARD_ID Ward Number
ST_score Dwelling type score
PD_Score Population density score
ES_score Employment status score
IM_score Income level score
QUATERNARY Indicates the quaternary catchment the that relate to the WetWin climatic conditions
CC_score Climatic conditions score
LS_score Sum of ST, PD, ES, IM and CC score
LS_weight Livelihood weight: 0.258
LS_L3_score Livelihood score after weight applied
1.11. Flood attenuation
File description:
File Name: Flood_attenuation_1
Description: Ranked wetlands according to demand and supply influence on flood attenuation
Type: ArcMap GIS polygon feature class
Reference System: Transverse Mercator WGS LO31
Mapping Resolution: 1:2 000 – 1:3 000
Captured: Eco-Pulse Consulting Services cc
Field description:
Field Name Field description
Quaternary Indicates the quaternary catchment the entire or portions of the wetland(s) fall into
HGM_rank Describes the wetland type based on the HGM model: Floodplain, Valley-bottom – channelled, Valley-bottom –
unchannelled, Hillslope seep, Flat, Depression
Supply_score
Allocated a supply score to all wetlands based on HGM type as follows: Floodplain = 1; Valley-bottom – channelled
= 0.5; Valley-bottom – unchannelled = 0.75; Hillslope seep = 0.25; Flat = 0; Depression = 0. Rescaled the wetland
type scores to 0.5
Demand_score
Used Wet-Win Quaternary datasets to create a feature class showing the relative demand for flood attenuation.
Flood attenuation demand score calculated by summing relative scores per quaternary catchment for catchment
slope, dams in catchment, landuse flows and rainfall intensity and rescaling to 0.5
FA_score Flood attenuation score before level 4 weight is applied. Calculated by adding together the wetland demand and
wetland supply scores for flood attenuation. Scores are between 0-1
FA_L4_weight Level 4 weight: 0.149
FA_L4_score Flood attenuation score after level 4 weight applied. Scores range from 0 – 0.12665
1.12. Water quality enhancement
File description:
File Name: Water_quality_enhancement
Description: Ranked wetlands according to demand and supply influence on water quality and enhancement
Type: ArcMap GIS polygon feature class
Reference System: Transverse Mercator WGS LO31
Captured: Eco-Pulse Consulting Services cc
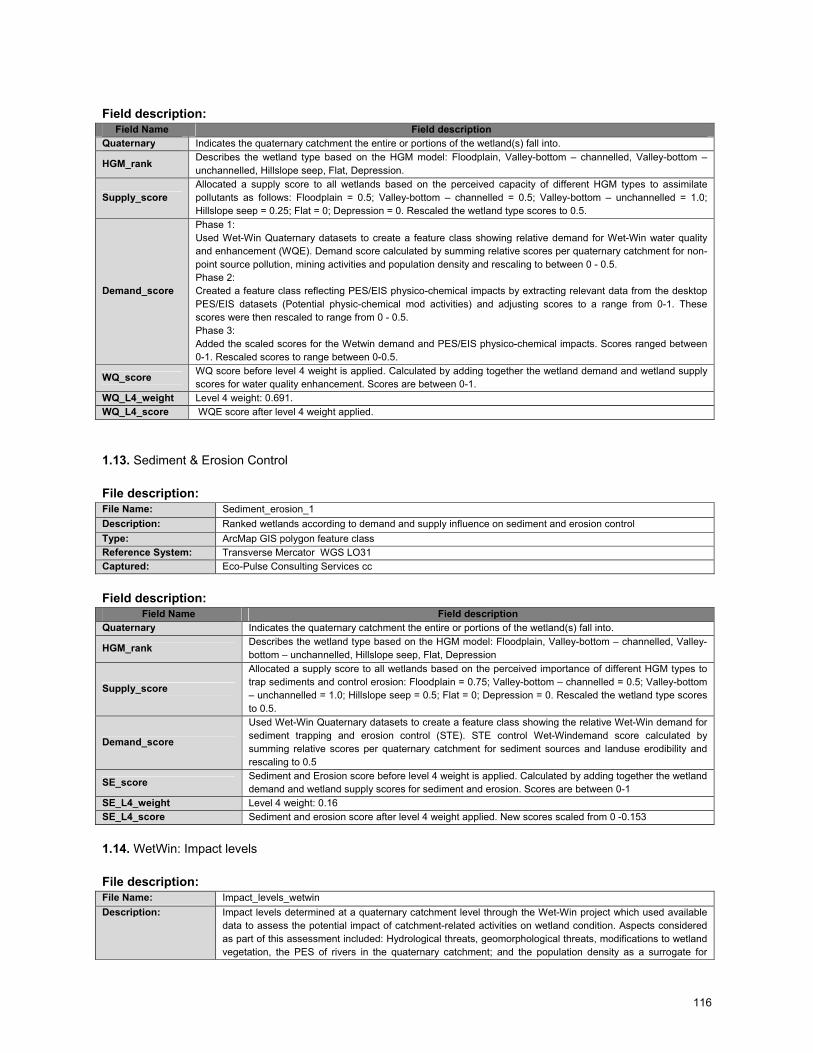
116
Field description:
Field Name Field description
Quaternary Indicates the quaternary catchment the entire or portions of the wetland(s) fall into.
HGM_rank Describes the wetland type based on the HGM model: Floodplain, Valley-bottom – channelled, Valley-bottom –
unchannelled, Hillslope seep, Flat, Depression.
Supply_score
Allocated a supply score to all wetlands based on the perceived capacity of different HGM types to assimilate
pollutants as follows: Floodplain = 0.5; Valley-bottom – channelled = 0.5; Valley-bottom – unchannelled = 1.0;
Hillslope seep = 0.25; Flat = 0; Depression = 0. Rescaled the wetland type scores to 0.5.
Demand_score
Phase 1:
Used Wet-Win Quaternary datasets to create a feature class showing relative demand for Wet-Win water quality
and enhancement (WQE). Demand score calculated by summing relative scores per quaternary catchment for non-
point source pollution, mining activities and population density and rescaling to between 0 - 0.5.
Phase 2:
Created a feature class reflecting PES/EIS physico-chemical impacts by extracting relevant data from the desktop
PES/EIS datasets (Potential physic-chemical mod activities) and adjusting scores to a range from 0-1. These
scores were then rescaled to range from 0 - 0.5.
Phase 3:
Added the scaled scores for the Wetwin demand and PES/EIS physico-chemical impacts. Scores ranged between
0-1. Rescaled scores to range between 0-0.5.
WQ_score WQ score before level 4 weight is applied. Calculated by adding together the wetland demand and wetland supply
scores for water quality enhancement. Scores are between 0-1.
WQ_L4_weight Level 4 weight: 0.691.
WQ_L4_score WQE score after level 4 weight applied.
1.13. Sediment & Erosion Control
File description:
File Name: Sediment_erosion_1
Description: Ranked wetlands according to demand and supply influence on sediment and erosion control
Type: ArcMap GIS polygon feature class
Reference System: Transverse Mercator WGS LO31
Captured: Eco-Pulse Consulting Services cc
Field description:
Field Name Field description
Quaternary Indicates the quaternary catchment the entire or portions of the wetland(s) fall into.
HGM_rank Describes the wetland type based on the HGM model: Floodplain, Valley-bottom – channelled, Valley-
bottom – unchannelled, Hillslope seep, Flat, Depression
Supply_score
Allocated a supply score to all wetlands based on the perceived importance of different HGM types to
trap sediments and control erosion: Floodplain = 0.75; Valley-bottom – channelled = 0.5; Valley-bottom
– unchannelled = 1.0; Hillslope seep = 0.5; Flat = 0; Depression = 0. Rescaled the wetland type scores
to 0.5.
Demand_score
Used Wet-Win Quaternary datasets to create a feature class showing the relative Wet-Win demand for
sediment trapping and erosion control (STE). STE control Wet-Windemand score calculated by
summing relative scores per quaternary catchment for sediment sources and landuse erodibility and
rescaling to 0.5
SE_score Sediment and Erosion score before level 4 weight is applied. Calculated by adding together the wetland
demand and wetland supply scores for sediment and erosion. Scores are between 0-1
SE_L4_weight Level 4 weight: 0.16
SE_L4_score Sediment and erosion score after level 4 weight applied. New scores scaled from 0 -0.153
1.14. WetWin: Impact levels
File description:
File Name: Impact_levels_wetwin
Description: Impact levels determined at a quaternary catchment level through the Wet-Win project which used available
data to assess the potential impact of catchment-related activities on wetland condition. Aspects considered
as part of this assessment included: Hydrological threats, geomorphological threats, modifications to wetland
vegetation, the PES of rivers in the quaternary catchment; and the population density as a surrogate for
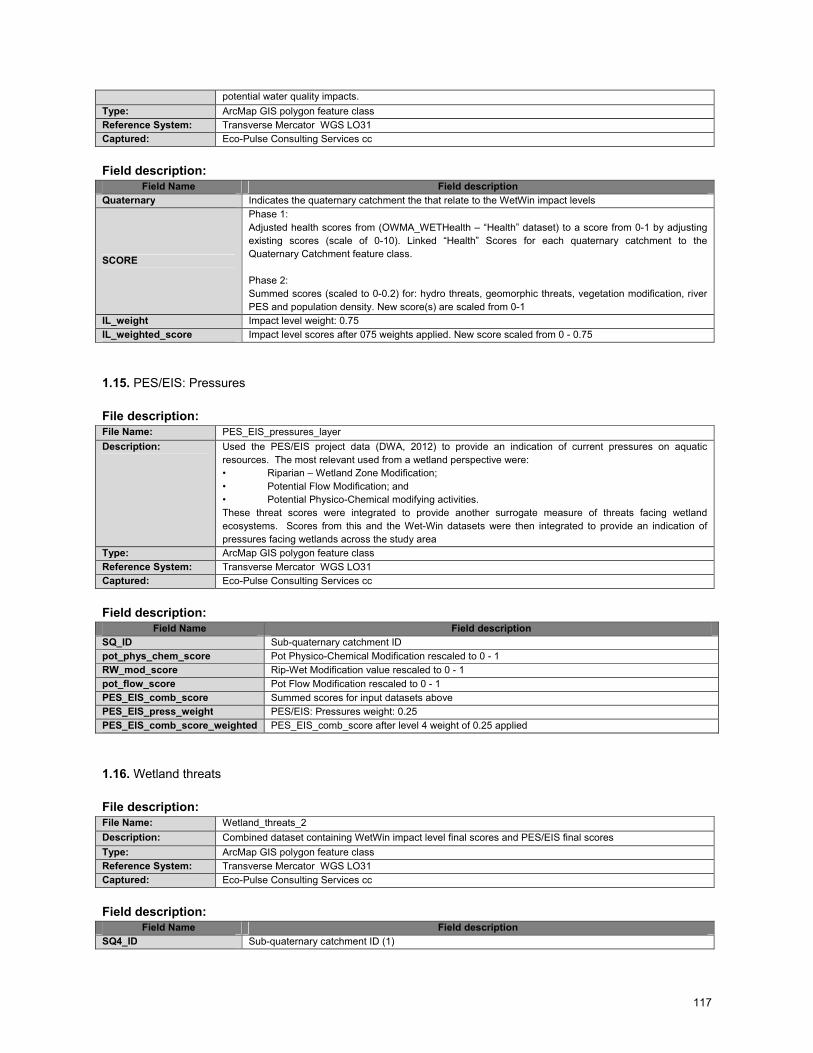
117
potential water quality impacts.
Type: ArcMap GIS polygon feature class
Reference System: Transverse Mercator WGS LO31
Captured: Eco-Pulse Consulting Services cc
Field description:
Field Name Field description
Quaternary Indicates the quaternary catchment the that relate to the WetWin impact levels
SCORE
Phase 1:
Adjusted health scores from (OWMA_WETHealth – “Health” dataset) to a score from 0-1 by adjusting
existing scores (scale of 0-10). Linked “Health” Scores for each quaternary catchment to the
Quaternary Catchment feature class.
Phase 2:
Summed scores (scaled to 0-0.2) for: hydro threats, geomorphic threats, vegetation modification, river
PES and population density. New score(s) are scaled from 0-1
IL_weight Impact level weight: 0.75
IL_weighted_score Impact level scores after 075 weights applied. New score scaled from 0 - 0.75
1.15. PES/EIS: Pressures
File description:
File Name: PES_EIS_pressures_layer
Description: Used the PES/EIS project data (DWA, 2012) to provide an indication of current pressures on aquatic resources. The most relevant used from a wetland perspective were:
• Riparian – Wetland Zone Modification;
• Potential Flow Modification; and
• Potential Physico-Chemical modifying activities.
These threat scores were integrated to provide another surrogate measure of threats facing wetland
ecosystems. Scores from this and the Wet-Win datasets were then integrated to provide an indication of
pressures facing wetlands across the study area
Type: ArcMap GIS polygon feature class
Reference System: Transverse Mercator WGS LO31
Captured: Eco-Pulse Consulting Services cc
Field description:
Field Name Field description
SQ_ID Sub-quaternary catchment ID
pot_phys_chem_score Pot Physico-Chemical Modification rescaled to 0 - 1
RW_mod_score Rip-Wet Modification value rescaled to 0 - 1
pot_flow_score Pot Flow Modification rescaled to 0 - 1
PES_EIS_comb_score Summed scores for input datasets above
PES_EIS_press_weight PES/EIS: Pressures weight: 0.25
PES_EIS_comb_score_weighted PES_EIS_comb_score after level 4 weight of 0.25 applied
1.16. Wetland threats
File description:
File Name: Wetland_threats_2
Description: Combined dataset containing WetWin impact level final scores and PES/EIS final scores
Type: ArcMap GIS polygon feature class
Reference System: Transverse Mercator WGS LO31
Captured: Eco-Pulse Consulting Services cc
Field description:
Field Name Field description
SQ4_ID Sub-quaternary catchment ID (1)
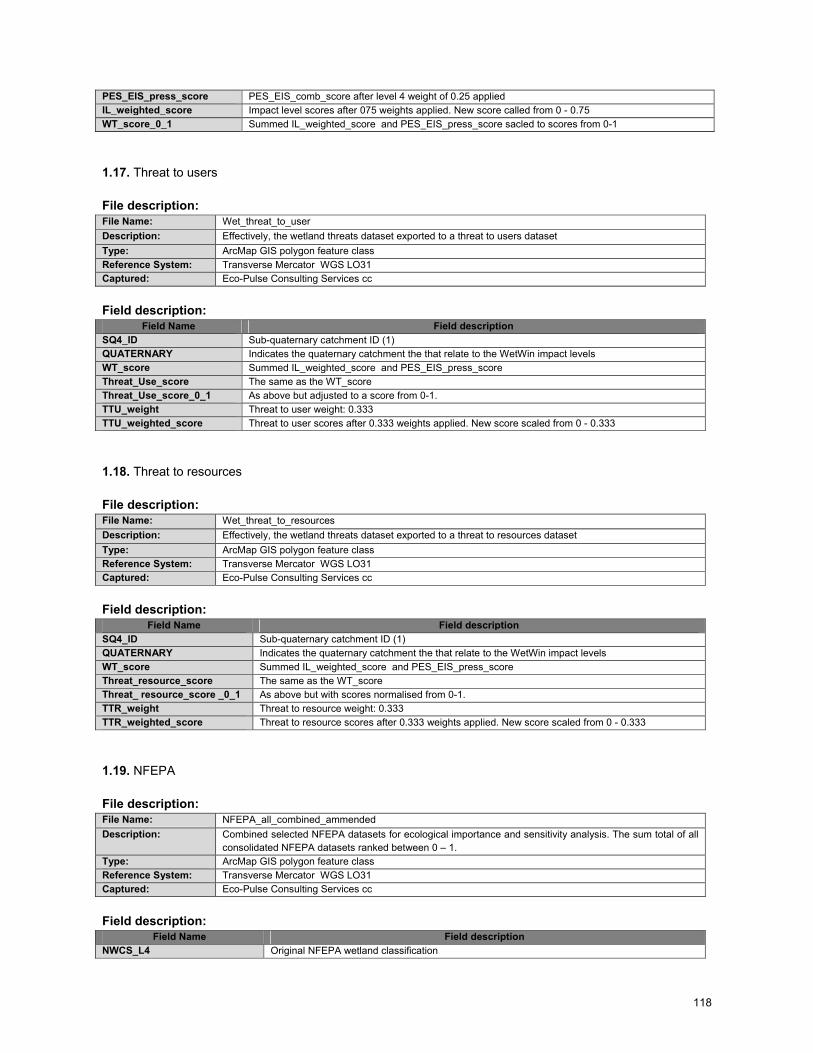
118
PES_EIS_press_score PES_EIS_comb_score after level 4 weight of 0.25 applied
IL_weighted_score Impact level scores after 075 weights applied. New score called from 0 - 0.75
WT_score_0_1 Summed IL_weighted_score and PES_EIS_press_score sacled to scores from 0-1
1.17. Threat to users
File description:
File Name: Wet_threat_to_user
Description: Effectively, the wetland threats dataset exported to a threat to users dataset
Type: ArcMap GIS polygon feature class
Reference System: Transverse Mercator WGS LO31
Captured: Eco-Pulse Consulting Services cc
Field description:
Field Name Field description
SQ4_ID Sub-quaternary catchment ID (1)
QUATERNARY Indicates the quaternary catchment the that relate to the WetWin impact levels
WT_score Summed IL_weighted_score and PES_EIS_press_score
Threat_Use_score The same as the WT_score
Threat_Use_score_0_1 As above but adjusted to a score from 0-1.
TTU_weight Threat to user weight: 0.333
TTU_weighted_score Threat to user scores after 0.333 weights applied. New score scaled from 0 - 0.333
1.18. Threat to resources
File description:
File Name: Wet_threat_to_resources
Description: Effectively, the wetland threats dataset exported to a threat to resources dataset
Type: ArcMap GIS polygon feature class
Reference System: Transverse Mercator WGS LO31
Captured: Eco-Pulse Consulting Services cc
Field description:
Field Name Field description
SQ4_ID Sub-quaternary catchment ID (1)
QUATERNARY Indicates the quaternary catchment the that relate to the WetWin impact levels
WT_score Summed IL_weighted_score and PES_EIS_press_score
Threat_resource_score The same as the WT_score
Threat_ resource_score _0_1 As above but with scores normalised from 0-1.
TTR_weight Threat to resource weight: 0.333
TTR_weighted_score Threat to resource scores after 0.333 weights applied. New score scaled from 0 - 0.333
1.19. NFEPA
File description:
File Name: NFEPA_all_combined_ammended
Description: Combined selected NFEPA datasets for ecological importance and sensitivity analysis. The sum total of all
consolidated NFEPA datasets ranked between 0 – 1.
Type: ArcMap GIS polygon feature class
Reference System: Transverse Mercator WGS LO31
Captured: Eco-Pulse Consulting Services cc
Field description:
Field Name Field description
NWCS_L4 Original NFEPA wetland classification
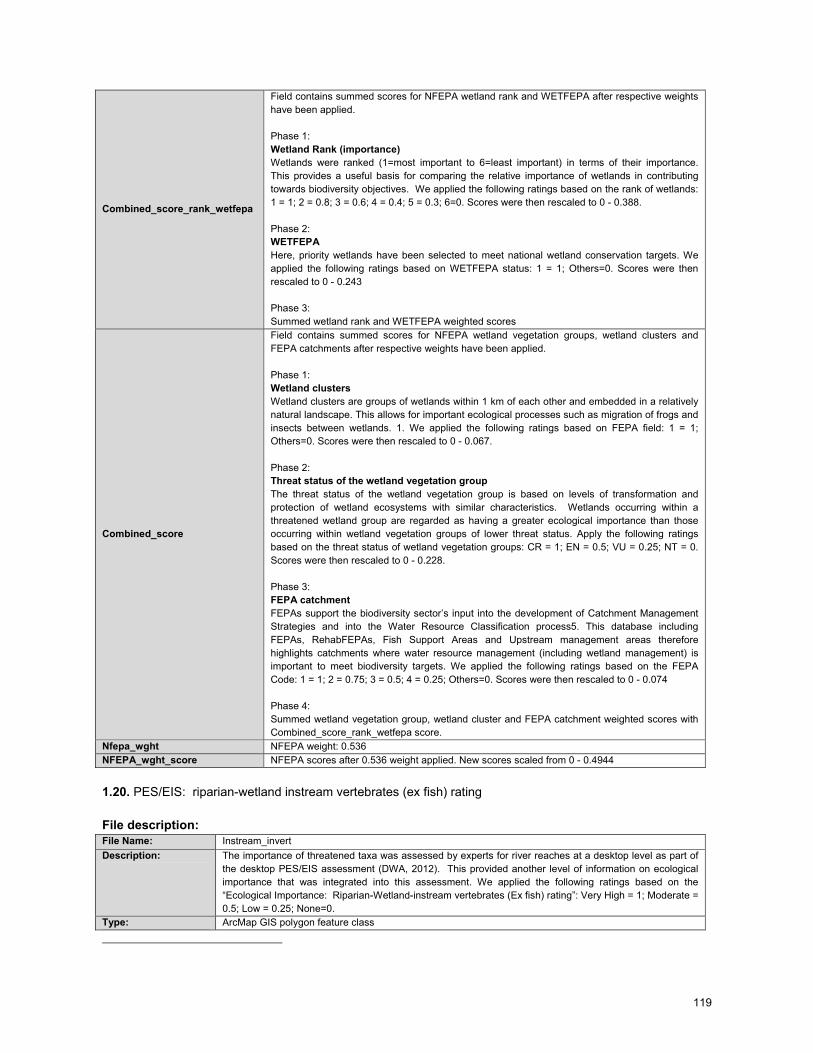
119
Combined_score_rank_wetfepa
Field contains summed scores for NFEPA wetland rank and WETFEPA after respective weights
have been applied.
Phase 1:
Wetland Rank (importance)
Wetlands were ranked (1=most important to 6=least important) in terms of their importance.
This provides a useful basis for comparing the relative importance of wetlands in contributing
towards biodiversity objectives. We applied the following ratings based on the rank of wetlands:
1 = 1; 2 = 0.8; 3 = 0.6; 4 = 0.4; 5 = 0.3; 6=0. Scores were then rescaled to 0 - 0.388.
Phase 2:
WETFEPA
Here, priority wetlands have been selected to meet national wetland conservation targets. We
applied the following ratings based on WETFEPA status: 1 = 1; Others=0. Scores were then
rescaled to 0 - 0.243
Phase 3:
Summed wetland rank and WETFEPA weighted scores
Combined_score
Field contains summed scores for NFEPA wetland vegetation groups, wetland clusters and
FEPA catchments after respective weights have been applied.
Phase 1:
Wetland clusters
Wetland clusters are groups of wetlands within 1 km of each other and embedded in a relatively
natural landscape. This allows for important ecological processes such as migration of frogs and
insects between wetlands. 1. We applied the following ratings based on FEPA field: 1 = 1;
Others=0. Scores were then rescaled to 0 - 0.067.
Phase 2:
Threat status of the wetland vegetation group
The threat status of the wetland vegetation group is based on levels of transformation and
protection of wetland ecosystems with similar characteristics. Wetlands occurring within a
threatened wetland group are regarded as having a greater ecological importance than those
occurring within wetland vegetation groups of lower threat status. Apply the following ratings
based on the threat status of wetland vegetation groups: CR = 1; EN = 0.5; VU = 0.25; NT = 0.
Scores were then rescaled to 0 - 0.228.
Phase 3:
FEPA catchment
FEPAs support the biodiversity sector’s input into the development of Catchment Management
Strategies and into the Water Resource Classification process5. This database including
FEPAs, RehabFEPAs, Fish Support Areas and Upstream management areas therefore
highlights catchments where water resource management (including wetland management) is
important to meet biodiversity targets. We applied the following ratings based on the FEPA
Code: 1 = 1; 2 = 0.75; 3 = 0.5; 4 = 0.25; Others=0. Scores were then rescaled to 0 - 0.074
Phase 4:
Summed wetland vegetation group, wetland cluster and FEPA catchment weighted scores with
Combined_score_rank_wetfepa score.
Nfepa_wght NFEPA weight: 0.536
NFEPA_wght_score NFEPA scores after 0.536 weight applied. New scores scaled from 0 - 0.4944
1.20. PES/EIS: riparian-wetland instream vertebrates (ex fish) rating
File description:
File Name: Instream_invert
Description: The importance of threatened taxa was assessed by experts for river reaches at a desktop level as part of
the desktop PES/EIS assessment (DWA, 2012). This provided another level of information on ecological
importance that was integrated into this assessment. We applied the following ratings based on the
“Ecological Importance: Riparian-Wetland-instream vertebrates (Ex fish) rating”: Very High = 1; Moderate =
0.5; Low = 0.25; None=0.
Type: ArcMap GIS polygon feature class
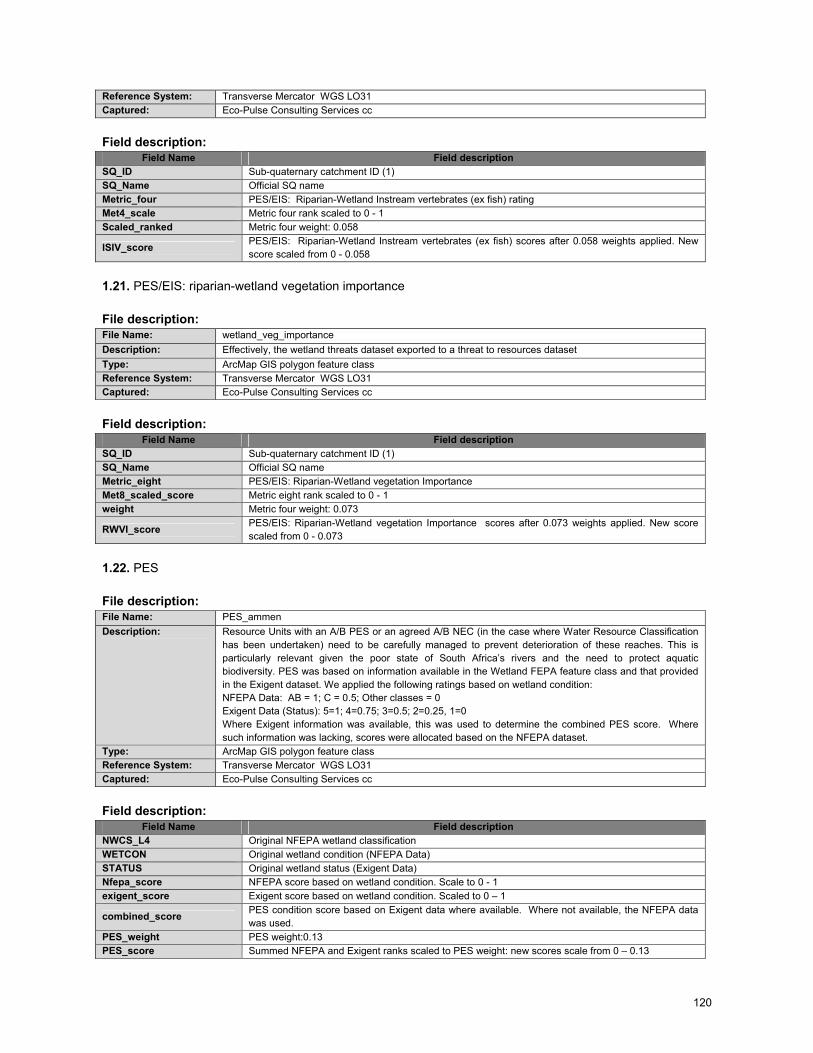
120
Reference System: Transverse Mercator WGS LO31
Captured: Eco-Pulse Consulting Services cc
Field description:
Field Name Field description
SQ_ID Sub-quaternary catchment ID (1)
SQ_Name Official SQ name
Metric_four PES/EIS: Riparian-Wetland Instream vertebrates (ex fish) rating
Met4_scale Metric four rank scaled to 0 - 1
Scaled_ranked Metric four weight: 0.058
ISIV_score PES/EIS: Riparian-Wetland Instream vertebrates (ex fish) scores after 0.058 weights applied. New
score scaled from 0 - 0.058
1.21. PES/EIS: riparian-wetland vegetation importance
File description:
File Name: wetland_veg_importance
Description: Effectively, the wetland threats dataset exported to a threat to resources dataset
Type: ArcMap GIS polygon feature class
Reference System: Transverse Mercator WGS LO31
Captured: Eco-Pulse Consulting Services cc
Field description:
Field Name Field description
SQ_ID Sub-quaternary catchment ID (1)
SQ_Name Official SQ name
Metric_eight PES/EIS: Riparian-Wetland vegetation Importance
Met8_scaled_score Metric eight rank scaled to 0 - 1
weight Metric four weight: 0.073
RWVI_score PES/EIS: Riparian-Wetland vegetation Importance scores after 0.073 weights applied. New score
scaled from 0 - 0.073
1.22. PES
File description:
File Name: PES_ammen
Description: Resource Units with an A/B PES or an agreed A/B NEC (in the case where Water Resource Classification
has been undertaken) need to be carefully managed to prevent deterioration of these reaches. This is
particularly relevant given the poor state of South Africa’s rivers and the need to protect aquatic
biodiversity. PES was based on information available in the Wetland FEPA feature class and that provided
in the Exigent dataset. We applied the following ratings based on wetland condition:
NFEPA Data: AB = 1; C = 0.5; Other classes = 0
Exigent Data (Status): 5=1; 4=0.75; 3=0.5; 2=0.25, 1=0
Where Exigent information was available, this was used to determine the combined PES score. Where
such information was lacking, scores were allocated based on the NFEPA dataset.
Type: ArcMap GIS polygon feature class
Reference System: Transverse Mercator WGS LO31
Captured: Eco-Pulse Consulting Services cc
Field description:
Field Name Field description
NWCS_L4 Original NFEPA wetland classification
WETCON Original wetland condition (NFEPA Data)
STATUS Original wetland status (Exigent Data)
Nfepa_score NFEPA score based on wetland condition. Scale to 0 - 1
exigent_score Exigent score based on wetland condition. Scaled to 0 – 1
combined_score PES condition score based on Exigent data where available. Where not available, the NFEPA data
was used.
PES_weight PES weight:0.13
PES_score Summed NFEPA and Exigent ranks scaled to PES weight: new scores scale from 0 – 0.13
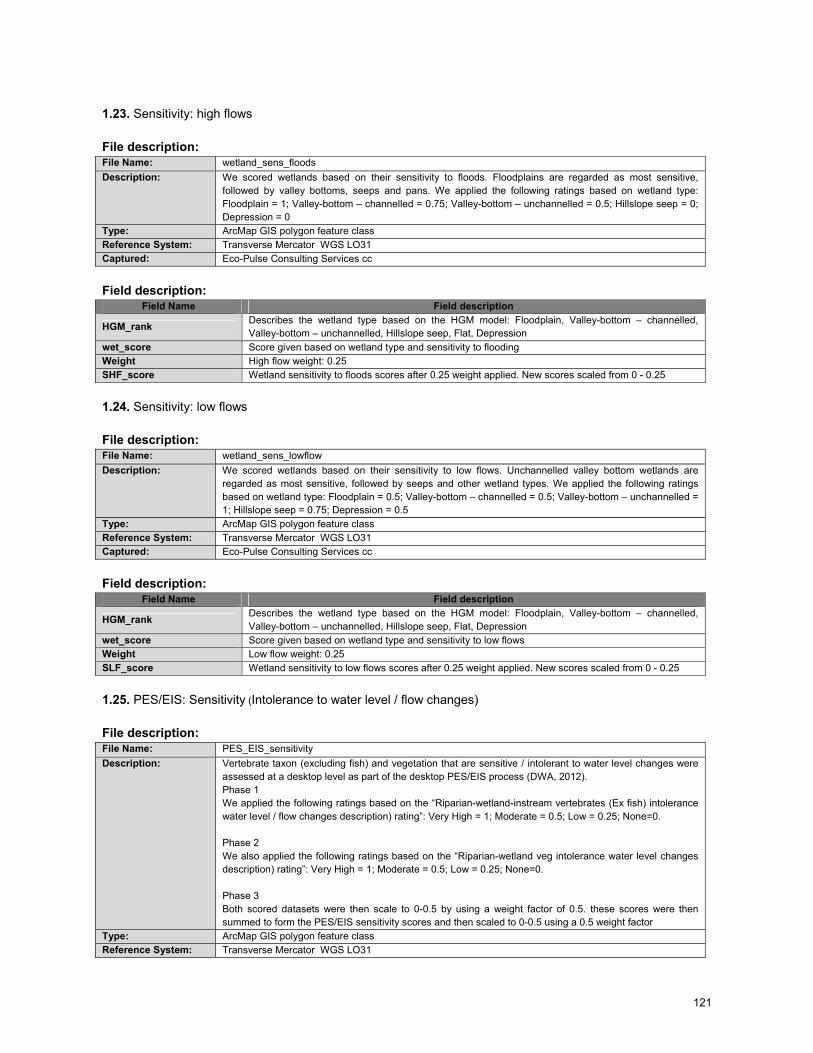
121
1.23. Sensitivity: high flows
File description:
File Name: wetland_sens_floods
Description: We scored wetlands based on their sensitivity to floods. Floodplains are regarded as most sensitive,
followed by valley bottoms, seeps and pans. We applied the following ratings based on wetland type:
Floodplain = 1; Valley-bottom – channelled = 0.75; Valley-bottom – unchannelled = 0.5; Hillslope seep = 0;
Depression = 0
Type: ArcMap GIS polygon feature class
Reference System: Transverse Mercator WGS LO31
Captured: Eco-Pulse Consulting Services cc
Field description:
Field Name Field description
HGM_rank Describes the wetland type based on the HGM model: Floodplain, Valley-bottom – channelled,
Valley-bottom – unchannelled, Hillslope seep, Flat, Depression
wet_score Score given based on wetland type and sensitivity to flooding
Weight High flow weight: 0.25
SHF_score Wetland sensitivity to floods scores after 0.25 weight applied. New scores scaled from 0 - 0.25
1.24. Sensitivity: low flows
File description:
File Name: wetland_sens_lowflow
Description: We scored wetlands based on their sensitivity to low flows. Unchannelled valley bottom wetlands are
regarded as most sensitive, followed by seeps and other wetland types. We applied the following ratings
based on wetland type: Floodplain = 0.5; Valley-bottom – channelled = 0.5; Valley-bottom – unchannelled =
1; Hillslope seep = 0.75; Depression = 0.5
Type: ArcMap GIS polygon feature class
Reference System: Transverse Mercator WGS LO31
Captured: Eco-Pulse Consulting Services cc
Field description:
Field Name Field description
HGM_rank Describes the wetland type based on the HGM model: Floodplain, Valley-bottom – channelled,
Valley-bottom – unchannelled, Hillslope seep, Flat, Depression
wet_score Score given based on wetland type and sensitivity to low flows
Weight Low flow weight: 0.25
SLF_score Wetland sensitivity to low flows scores after 0.25 weight applied. New scores scaled from 0 - 0.25
1.25. PES/EIS: Sensitivity (Intolerance to water level / flow changes)
File description:
File Name: PES_EIS_sensitivity
Description: Vertebrate taxon (excluding fish) and vegetation that are sensitive / intolerant to water level changes were
assessed at a desktop level as part of the desktop PES/EIS process (DWA, 2012).
Phase 1
We applied the following ratings based on the “Riparian-wetland-instream vertebrates (Ex fish) intolerance
water level / flow changes description) rating”: Very High = 1; Moderate = 0.5; Low = 0.25; None=0.
Phase 2
We also applied the following ratings based on the “Riparian-wetland veg intolerance water level changes
description) rating”: Very High = 1; Moderate = 0.5; Low = 0.25; None=0.
Phase 3
Both scored datasets were then scale to 0-0.5 by using a weight factor of 0.5. these scores were then
summed to form the PES/EIS sensitivity scores and then scaled to 0-0.5 using a 0.5 weight factor
Type: ArcMap GIS polygon feature class
Reference System: Transverse Mercator WGS LO31
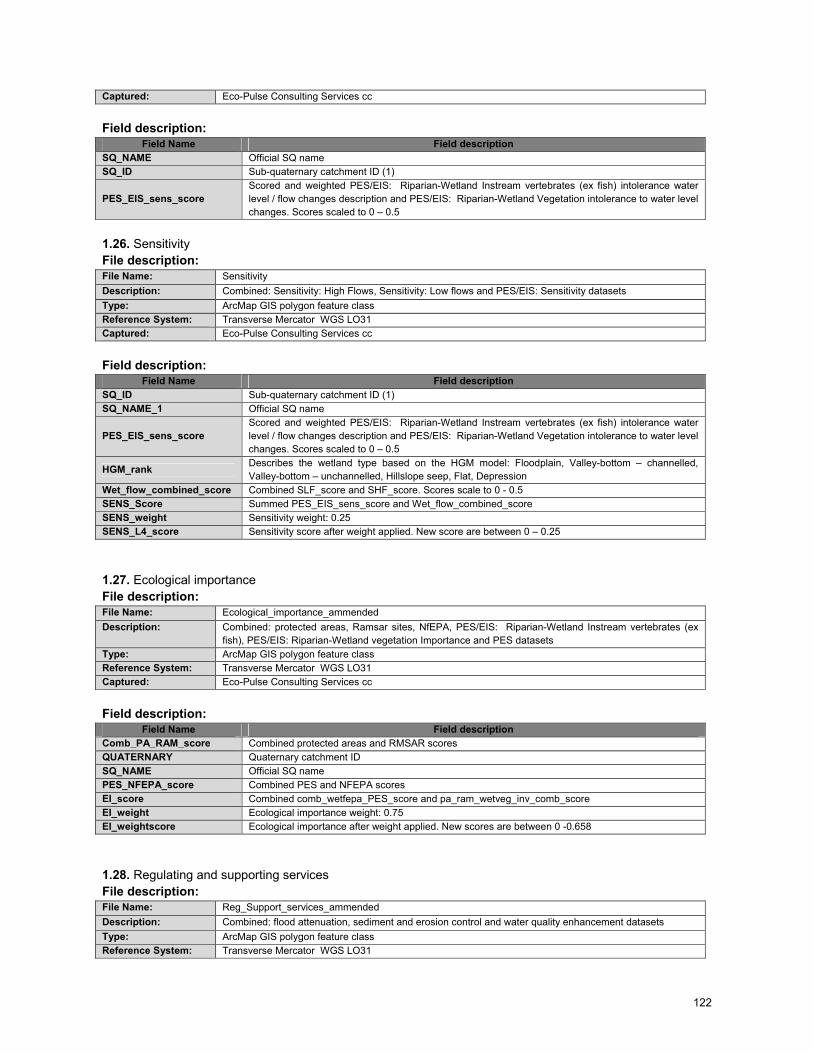
122
Captured: Eco-Pulse Consulting Services cc
Field description:
Field Name Field description
SQ_NAME Official SQ name
SQ_ID Sub-quaternary catchment ID (1)
PES_EIS_sens_score
Scored and weighted PES/EIS: Riparian-Wetland Instream vertebrates (ex fish) intolerance water
level / flow changes description and PES/EIS: Riparian-Wetland Vegetation intolerance to water level
changes. Scores scaled to 0 – 0.5
1.26. Sensitivity
File description:
File Name: Sensitivity
Description: Combined: Sensitivity: High Flows, Sensitivity: Low flows and PES/EIS: Sensitivity datasets
Type: ArcMap GIS polygon feature class
Reference System: Transverse Mercator WGS LO31
Captured: Eco-Pulse Consulting Services cc
Field description:
Field Name Field description
SQ_ID Sub-quaternary catchment ID (1)
SQ_NAME_1 Official SQ name
PES_EIS_sens_score
Scored and weighted PES/EIS: Riparian-Wetland Instream vertebrates (ex fish) intolerance water
level / flow changes description and PES/EIS: Riparian-Wetland Vegetation intolerance to water level
changes. Scores scaled to 0 – 0.5
HGM_rank Describes the wetland type based on the HGM model: Floodplain, Valley-bottom – channelled,
Valley-bottom – unchannelled, Hillslope seep, Flat, Depression
Wet_flow_combined_score Combined SLF_score and SHF_score. Scores scale to 0 - 0.5
SENS_Score Summed PES_EIS_sens_score and Wet_flow_combined_score
SENS_weight Sensitivity weight: 0.25
SENS_L4_score Sensitivity score after weight applied. New score are between 0 – 0.25
1.27. Ecological importance
File description:
File Name: Ecological_importance_ammended
Description: Combined: protected areas, Ramsar sites, NfEPA, PES/EIS: Riparian-Wetland Instream vertebrates (ex
fish), PES/EIS: Riparian-Wetland vegetation Importance and PES datasets
Type: ArcMap GIS polygon feature class
Reference System: Transverse Mercator WGS LO31
Captured: Eco-Pulse Consulting Services cc
Field description:
Field Name Field description
Comb_PA_RAM_score Combined protected areas and RMSAR scores
QUATERNARY Quaternary catchment ID
SQ_NAME Official SQ name
PES_NFEPA_score Combined PES and NFEPA scores
EI_score Combined comb_wetfepa_PES_score and pa_ram_wetveg_inv_comb_score
EI_weight Ecological importance weight: 0.75
EI_weightscore Ecological importance after weight applied. New scores are between 0 -0.658
1.28. Regulating and supporting services
File description:
File Name: Reg_Support_services_ammended
Description: Combined: flood attenuation, sediment and erosion control and water quality enhancement datasets
Type: ArcMap GIS polygon feature class
Reference System: Transverse Mercator WGS LO31
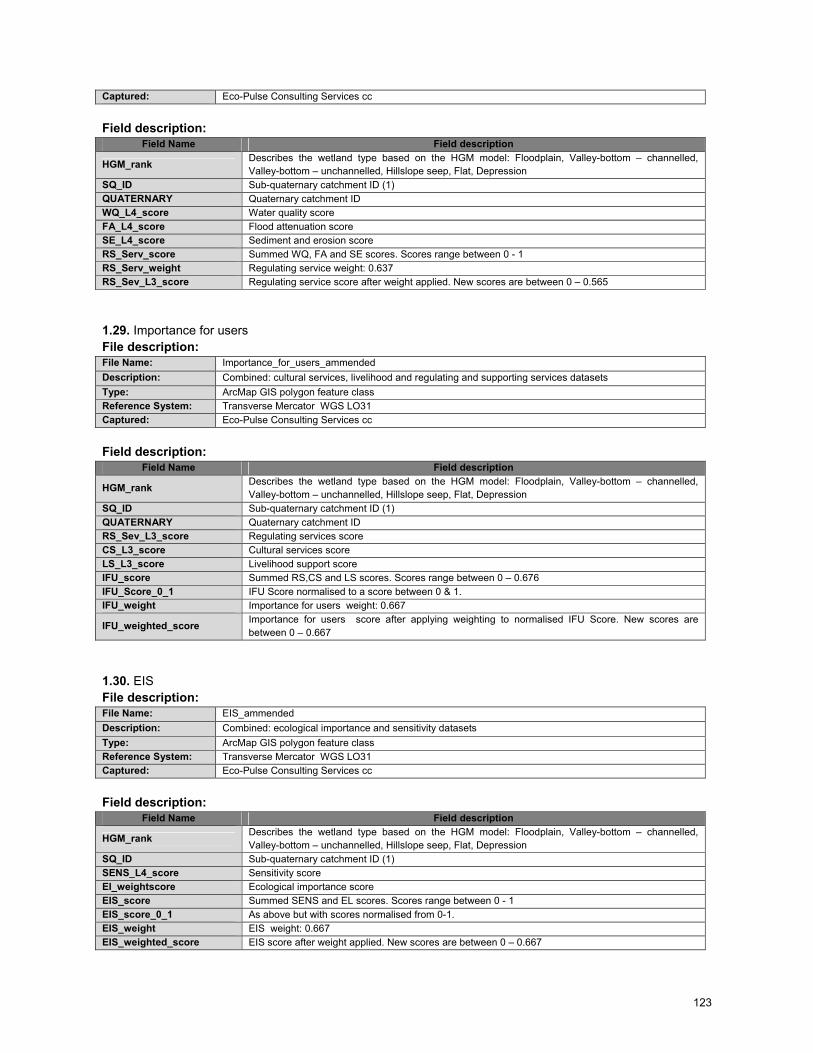
123
Captured: Eco-Pulse Consulting Services cc
Field description:
Field Name Field description
HGM_rank Describes the wetland type based on the HGM model: Floodplain, Valley-bottom – channelled,
Valley-bottom – unchannelled, Hillslope seep, Flat, Depression
SQ_ID Sub-quaternary catchment ID (1)
QUATERNARY Quaternary catchment ID
WQ_L4_score Water quality score
FA_L4_score Flood attenuation score
SE_L4_score Sediment and erosion score
RS_Serv_score Summed WQ, FA and SE scores. Scores range between 0 - 1
RS_Serv_weight Regulating service weight: 0.637
RS_Sev_L3_score Regulating service score after weight applied. New scores are between 0 – 0.565
1.29. Importance for users
File description:
File Name: Importance_for_users_ammended
Description: Combined: cultural services, livelihood and regulating and supporting services datasets
Type: ArcMap GIS polygon feature class
Reference System: Transverse Mercator WGS LO31
Captured: Eco-Pulse Consulting Services cc
Field description:
Field Name Field description
HGM_rank Describes the wetland type based on the HGM model: Floodplain, Valley-bottom – channelled,
Valley-bottom – unchannelled, Hillslope seep, Flat, Depression
SQ_ID Sub-quaternary catchment ID (1)
QUATERNARY Quaternary catchment ID
RS_Sev_L3_score Regulating services score
CS_L3_score Cultural services score
LS_L3_score Livelihood support score
IFU_score Summed RS,CS and LS scores. Scores range between 0 – 0.676
IFU_Score_0_1 IFU Score normalised to a score between 0 & 1.
IFU_weight Importance for users weight: 0.667
IFU_weighted_score Importance for users score after applying weighting to normalised IFU Score. New scores are
between 0 – 0.667
1.30. EIS
File description:
File Name: EIS_ammended
Description: Combined: ecological importance and sensitivity datasets
Type: ArcMap GIS polygon feature class
Reference System: Transverse Mercator WGS LO31
Captured: Eco-Pulse Consulting Services cc
Field description:
Field Name Field description
HGM_rank Describes the wetland type based on the HGM model: Floodplain, Valley-bottom – channelled,
Valley-bottom – unchannelled, Hillslope seep, Flat, Depression
SQ_ID Sub-quaternary catchment ID (1)
SENS_L4_score Sensitivity score
EI_weightscore Ecological importance score
EIS_score Summed SENS and EL scores. Scores range between 0 - 1
EIS_score_0_1 As above but with scores normalised from 0-1.
EIS_weight EIS weight: 0.667
EIS_weighted_score EIS score after weight applied. New scores are between 0 – 0.667
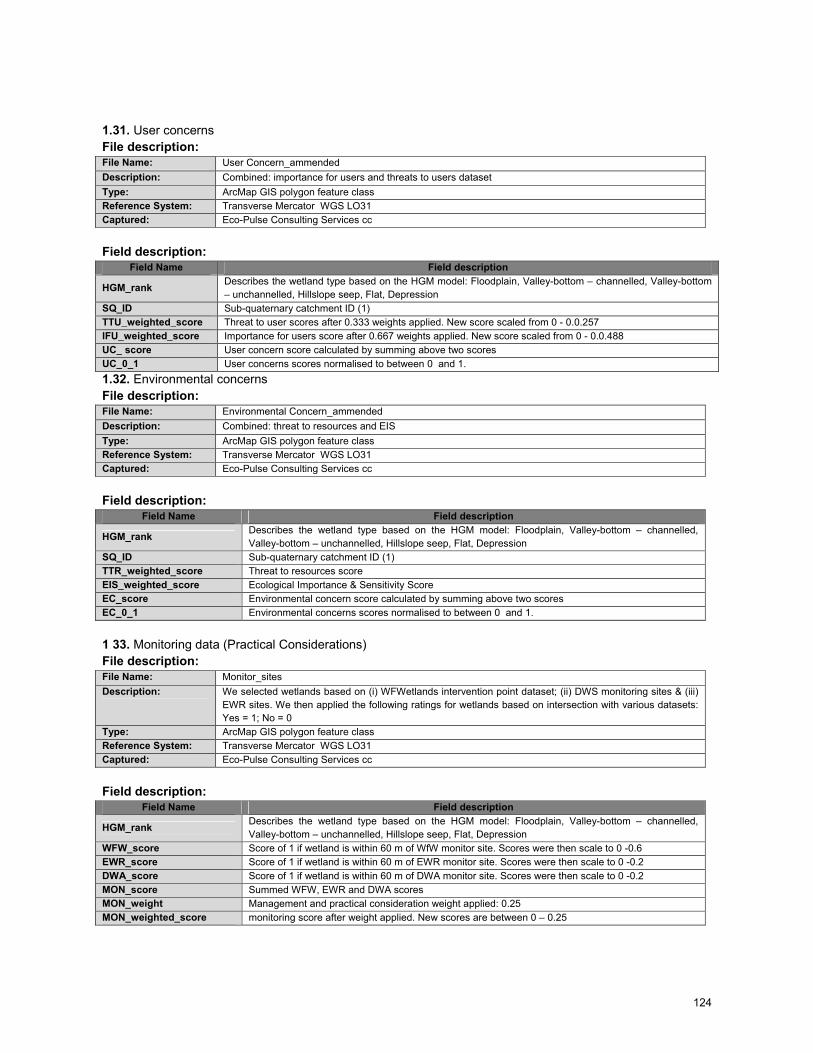
124
1.31. User concerns
File description:
File Name: User Concern_ammended
Description: Combined: importance for users and threats to users dataset
Type: ArcMap GIS polygon feature class
Reference System: Transverse Mercator WGS LO31
Captured: Eco-Pulse Consulting Services cc
Field description:
Field Name Field description
HGM_rank Describes the wetland type based on the HGM model: Floodplain, Valley-bottom – channelled, Valley-bottom
– unchannelled, Hillslope seep, Flat, Depression
SQ_ID Sub-quaternary catchment ID (1)
TTU_weighted_score Threat to user scores after 0.333 weights applied. New score scaled from 0 - 0.0.257
IFU_weighted_score Importance for users score after 0.667 weights applied. New score scaled from 0 - 0.0.488
UC_ score User concern score calculated by summing above two scores
UC_0_1 User concerns scores normalised to between 0 and 1.
1.32. Environmental concerns
File description:
File Name: Environmental Concern_ammended
Description: Combined: threat to resources and EIS
Type: ArcMap GIS polygon feature class
Reference System: Transverse Mercator WGS LO31
Captured: Eco-Pulse Consulting Services cc
Field description:
Field Name Field description
HGM_rank Describes the wetland type based on the HGM model: Floodplain, Valley-bottom – channelled,
Valley-bottom – unchannelled, Hillslope seep, Flat, Depression
SQ_ID Sub-quaternary catchment ID (1)
TTR_weighted_score Threat to resources score
EIS_weighted_score Ecological Importance & Sensitivity Score
EC_score Environmental concern score calculated by summing above two scores
EC_0_1 Environmental concerns scores normalised to between 0 and 1.
1 33. Monitoring data (Practical Considerations)
File description:
File Name: Monitor_sites
Description: We selected wetlands based on (i) WFWetlands intervention point dataset; (ii) DWS monitoring sites & (iii)
EWR sites. We then applied the following ratings for wetlands based on intersection with various datasets:
Yes = 1; No = 0
Type: ArcMap GIS polygon feature class
Reference System: Transverse Mercator WGS LO31
Captured: Eco-Pulse Consulting Services cc
Field description:
Field Name Field description
HGM_rank Describes the wetland type based on the HGM model: Floodplain, Valley-bottom – channelled,
Valley-bottom – unchannelled, Hillslope seep, Flat, Depression
WFW_score Score of 1 if wetland is within 60 m of WfW monitor site. Scores were then scale to 0 -0.6
EWR_score Score of 1 if wetland is within 60 m of EWR monitor site. Scores were then scale to 0 -0.2
DWA_score Score of 1 if wetland is within 60 m of DWA monitor site. Scores were then scale to 0 -0.2
MON_score Summed WFW, EWR and DWA scores
MON_weight Management and practical consideration weight applied: 0.25
MON_weighted_score monitoring score after weight applied. New scores are between 0 – 0.25
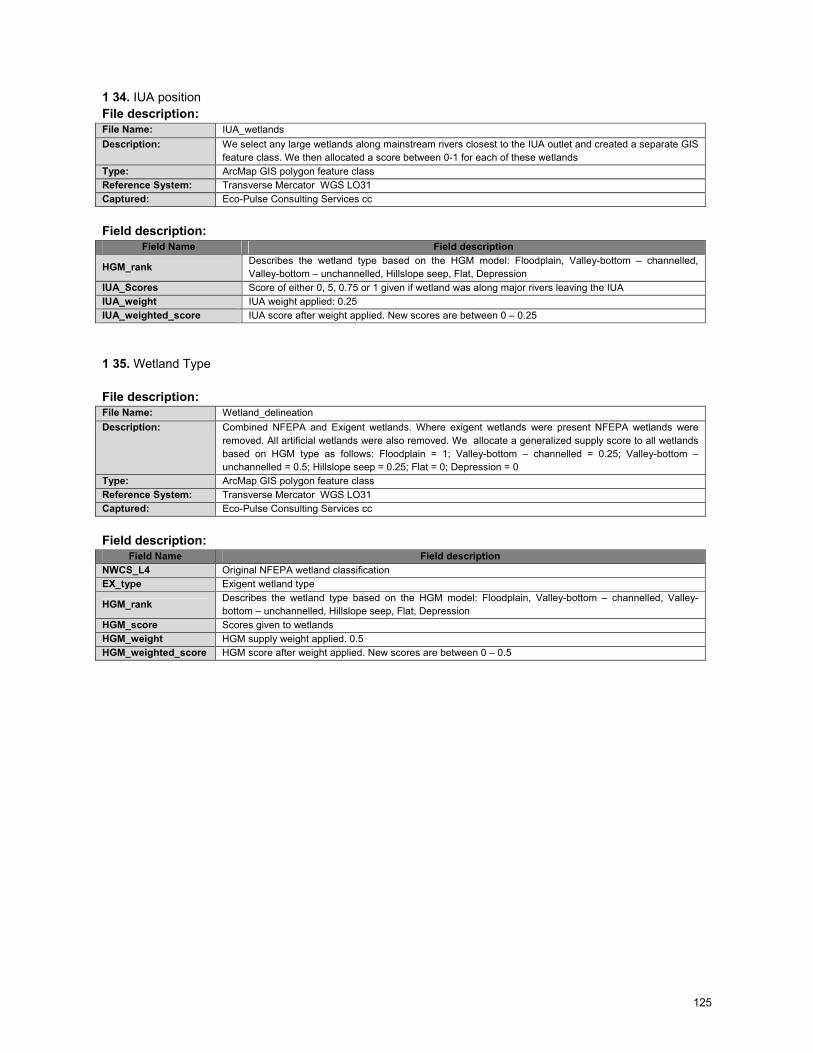
125
1 34. IUA position
File description:
File Name: IUA_wetlands
Description: We select any large wetlands along mainstream rivers closest to the IUA outlet and created a separate GIS
feature class. We then allocated a score between 0-1 for each of these wetlands
Type: ArcMap GIS polygon feature class
Reference System: Transverse Mercator WGS LO31
Captured: Eco-Pulse Consulting Services cc
Field description:
Field Name Field description
HGM_rank Describes the wetland type based on the HGM model: Floodplain, Valley-bottom – channelled,
Valley-bottom – unchannelled, Hillslope seep, Flat, Depression
IUA_Scores Score of either 0, 5, 0.75 or 1 given if wetland was along major rivers leaving the IUA
IUA_weight IUA weight applied: 0.25
IUA_weighted_score IUA score after weight applied. New scores are between 0 – 0.25
1 35. Wetland Type
File description:
File Name: Wetland_delineation
Description: Combined NFEPA and Exigent wetlands. Where exigent wetlands were present NFEPA wetlands were
removed. All artificial wetlands were also removed. We allocate a generalized supply score to all wetlands
based on HGM type as follows: Floodplain = 1; Valley-bottom – channelled = 0.25; Valley-bottom –
unchannelled = 0.5; Hillslope seep = 0.25; Flat = 0; Depression = 0
Type: ArcMap GIS polygon feature class
Reference System: Transverse Mercator WGS LO31
Captured: Eco-Pulse Consulting Services cc
Field description:
Field Name Field description
NWCS_L4 Original NFEPA wetland classification
EX_type Exigent wetland type
HGM_rank Describes the wetland type based on the HGM model: Floodplain, Valley-bottom – channelled, Valley-
bottom – unchannelled, Hillslope seep, Flat, Depression
HGM_score Scores given to wetlands
HGM_weight HGM supply weight applied. 0.5
HGM_weighted_score HGM score after weight applied. New scores are between 0 – 0.5
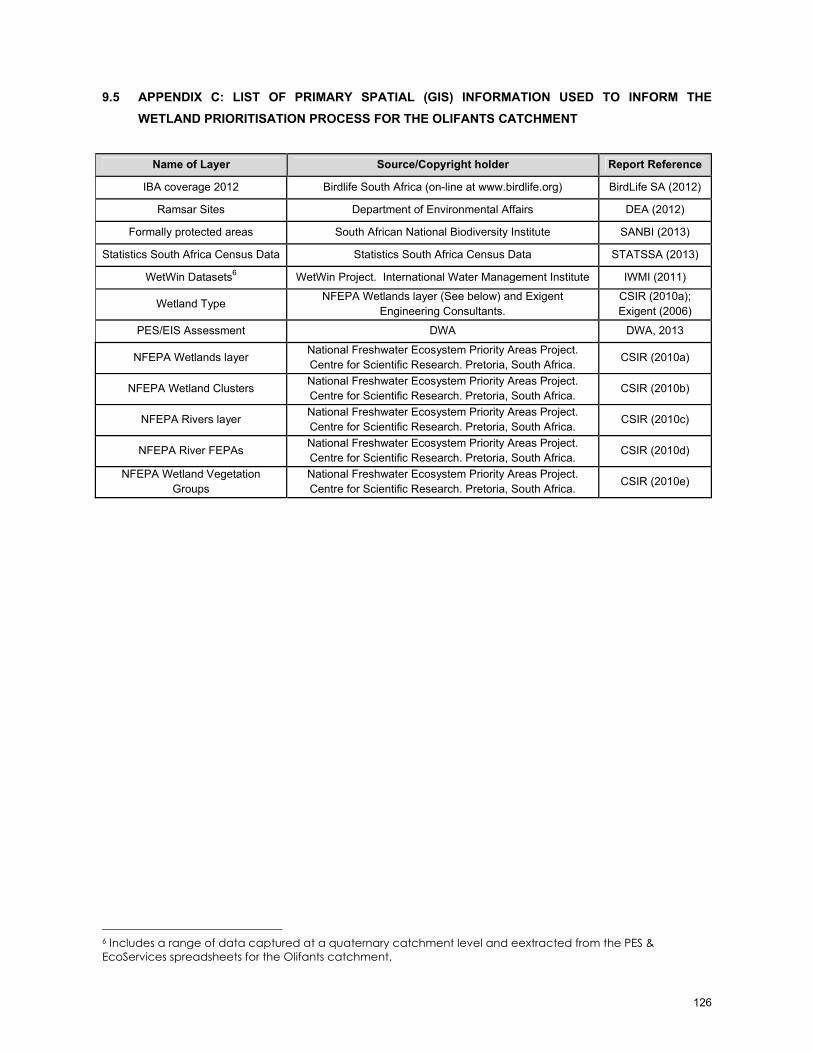
126
9.5 APPENDIX C: LIST OF PRIMARY SPATIAL (GIS) INFORMATION USED TO INFORM THE
WETLAND PRIORITISATION PROCESS FOR THE OLIFANTS CATCHMENT
Name of Layer Source/Copyright holder Report Reference
IBA coverage 2012 Birdlife South Africa (on-line at www.birdlife.org) BirdLife SA (2012)
Ramsar Sites Department of Environmental Affairs DEA (2012)
Formally protected areas South African National Biodiversity Institute SANBI (2013)
Statistics South Africa Census Data Statistics South Africa Census Data STATSSA (2013)
WetWin Datasets6 WetWin Project. International Water Management Institute IWMI (2011)
Wetland Type NFEPA Wetlands layer (See below) and Exigent
Engineering Consultants.
CSIR (2010a);
Exigent (2006)
PES/EIS Assessment DWA DWA, 2013
NFEPA Wetlands layer National Freshwater Ecosystem Priority Areas Project.
Centre for Scientific Research. Pretoria, South Africa. CSIR (2010a)
NFEPA Wetland Clusters National Freshwater Ecosystem Priority Areas Project.
Centre for Scientific Research. Pretoria, South Africa. CSIR (2010b)
NFEPA Rivers layer National Freshwater Ecosystem Priority Areas Project.
Centre for Scientific Research. Pretoria, South Africa. CSIR (2010c)
NFEPA River FEPAs National Freshwater Ecosystem Priority Areas Project.
Centre for Scientific Research. Pretoria, South Africa. CSIR (2010d)
NFEPA Wetland Vegetation
Groups
National Freshwater Ecosystem Priority Areas Project.
Centre for Scientific Research. Pretoria, South Africa. CSIR (2010e)
6 Includes a range of data captured at a quaternary catchment level and eextracted from the PES &
EcoServices spreadsheets for the Olifants catchment.
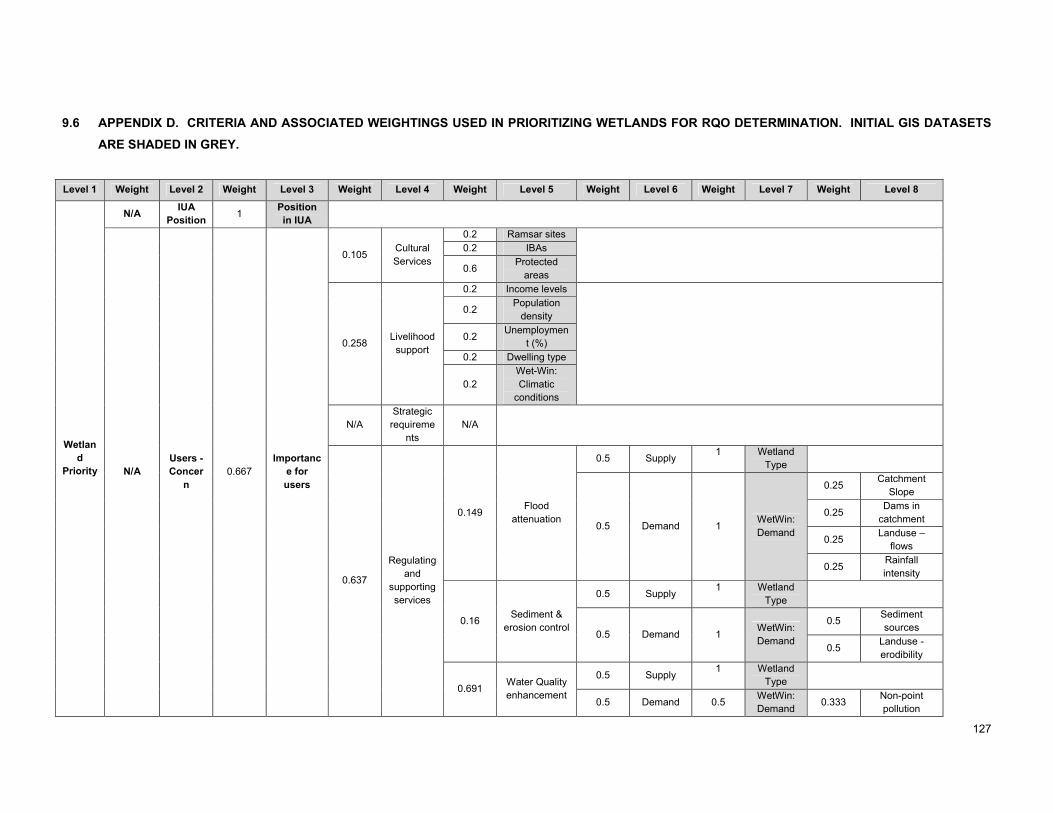
127
9.6 APPENDIX D. CRITERIA AND ASSOCIATED WEIGHTINGS USED IN PRIORITIZING WETLANDS FOR RQO DETERMINATION. INITIAL GIS DATASETS
ARE SHADED IN GREY.
Level 1 Weight Level 2 Weight Level 3 Weight Level 4 Weight Level 5 Weight Level 6 Weight Level 7 Weight Level 8
Wetlan
d
Priority
N/A IUA
Position 1
Position
in IUA
N/A
Users -
Concer
n
0.667
Importanc
e for
users
0.105 Cultural
Services
0.2 Ramsar sites
0.2 IBAs
0.6 Protected
areas
0.258 Livelihood
support
0.2 Income levels
0.2 Population
density
0.2 Unemploymen
t (%)
0.2 Dwelling type
0.2
Wet-Win:
Climatic
conditions
N/A
Strategic
requireme
nts
N/A
0.637
Regulating
and
supporting
services
0.149 Flood
attenuation
0.5 Supply 1
Wetland
Type
0.5 Demand 1 WetWin:
Demand
0.25 Catchment
Slope
0.25 Dams in
catchment
0.25 Landuse –
flows
0.25 Rainfall
intensity
0.16 Sediment &
erosion control
0.5 Supply 1
Wetland
Type
0.5 Demand 1 WetWin:
Demand
0.5 Sediment
sources
0.5 Landuse -
erodibility
0.691 Water Quality
enhancement
0.5 Supply 1
Wetland
Type
0.5 Demand 0.5 WetWin:
Demand 0.333
Non-point
pollution
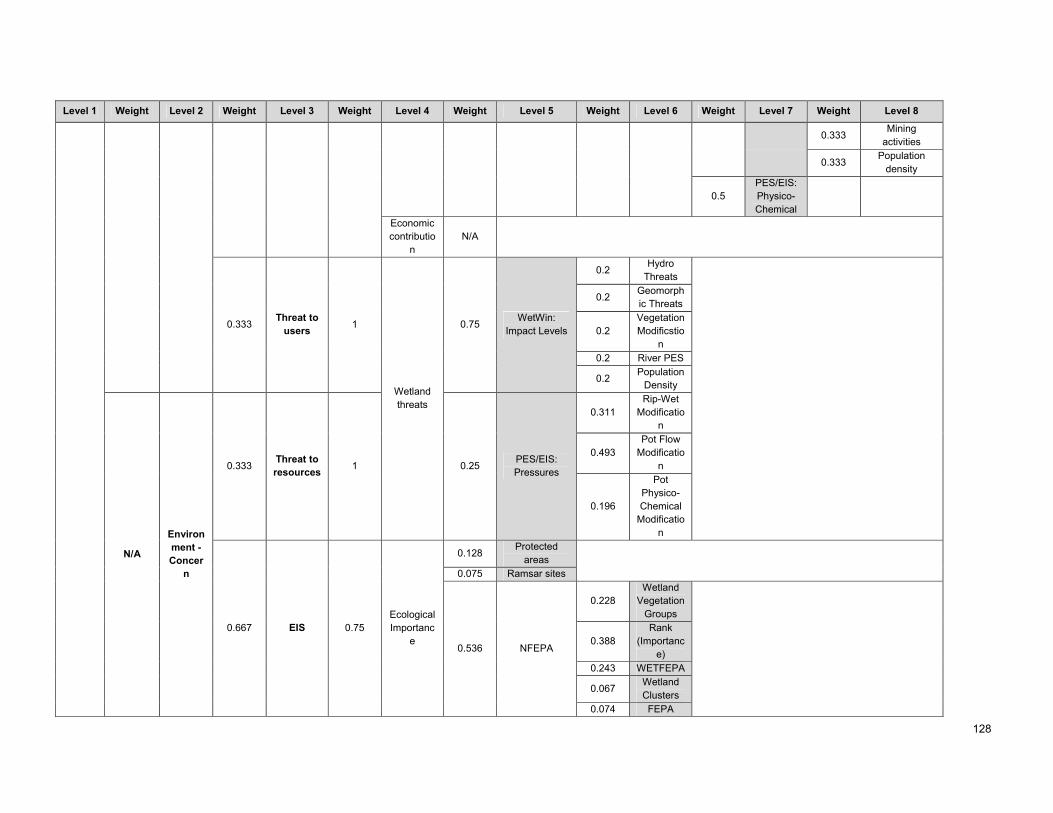
128
Level 1 Weight Level 2 Weight Level 3 Weight Level 4 Weight Level 5 Weight Level 6 Weight Level 7 Weight Level 8
0.333 Mining
activities
0.333 Population
density
0.5
PES/EIS:
Physico-
Chemical
Economic
contributio
n
N/A
0.333 Threat to
users 1
Wetland
threats
0.75 WetWin:
Impact Levels
0.2 Hydro
Threats
0.2 Geomorph
ic Threats
0.2
Vegetation
Modificstio
n
0.2 River PES
0.2 Population
Density
N/A
Environ
ment -
Concer
n
0.333 Threat to
resources 1 0.25
PES/EIS:
Pressures
0.311
Rip-Wet
Modificatio
n
0.493
Pot Flow
Modificatio
n
0.196
Pot
Physico-
Chemical
Modificatio
n
0.667 EIS 0.75
Ecological
Importanc
e
0.128 Protected
areas
0.075 Ramsar sites
0.536 NFEPA
0.228
Wetland
Vegetation
Groups
0.388
Rank
(Importanc
e)
0.243 WETFEPA
0.067 Wetland
Clusters
0.074 FEPA

129
Level 1 Weight Level 2 Weight Level 3 Weight Level 4 Weight Level 5 Weight Level 6 Weight Level 7 Weight Level 8
Catchment
s
0.058
PES/EIS:
Riparian-
Wetland
Instream
vertebrates
(ex fish) rating
0.073
PES/EIS:
Riparian-
Wetland
vegetation
Importance
0.13 PES
0.25 Sensitivity
0.25 Sensitivity:
High Flows 1
Wetland
Type
0.25 Sensitivity:
Low flows 1
Wetland
Type
0.5 PES/EIS:
Sensitivity
0.5
PES/EIS:
Riparian-
Wetland
Instream
vertebrate
s (ex fish)
intoleranc
e water
level / flow
changes
description
0.5
PES/EIS:
Riparian-
Wetland
Vegetation
intoleranc
e to water
level
changes
Not
consider
ed
Manage
ment &
practica
l
conside
rations
1 Monitorin
g data
0.6 WFWetlan
d Sites
0.2
DWA
Monitoring
Sites
0.2 EWR Sites

130
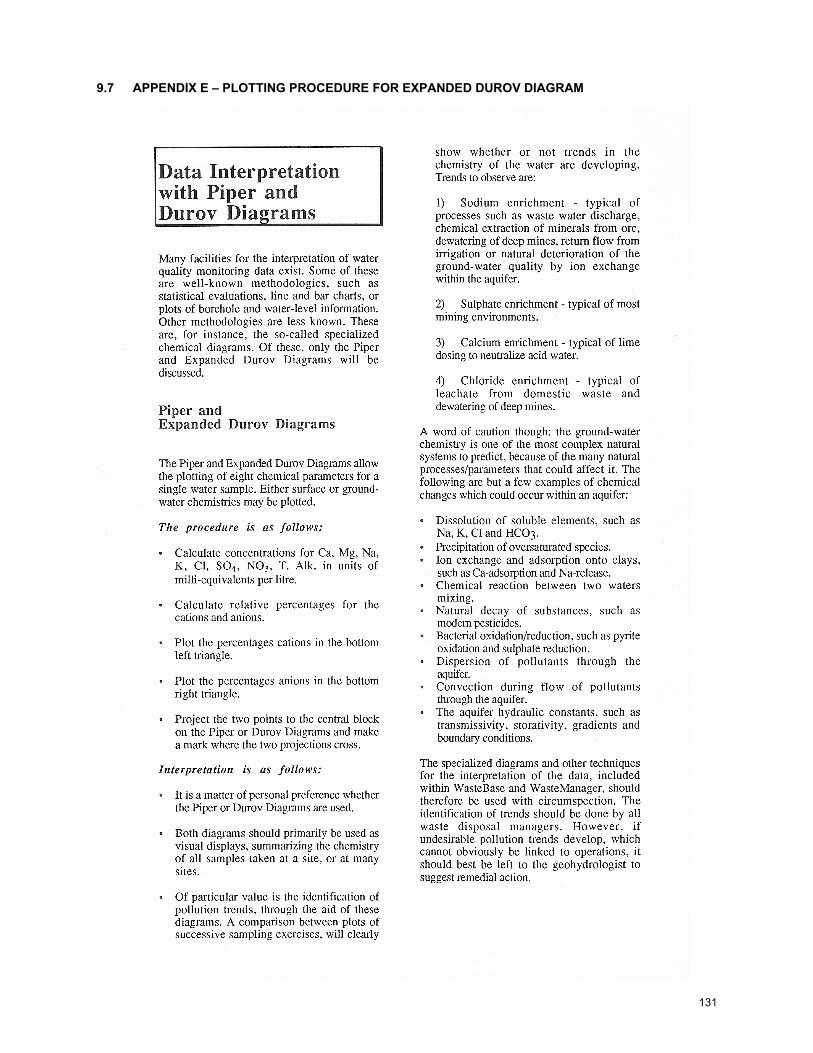
131
9.7 APPENDIX E – PLOTTING PROCEDURE FOR EXPANDED DUROV DIAGRAM
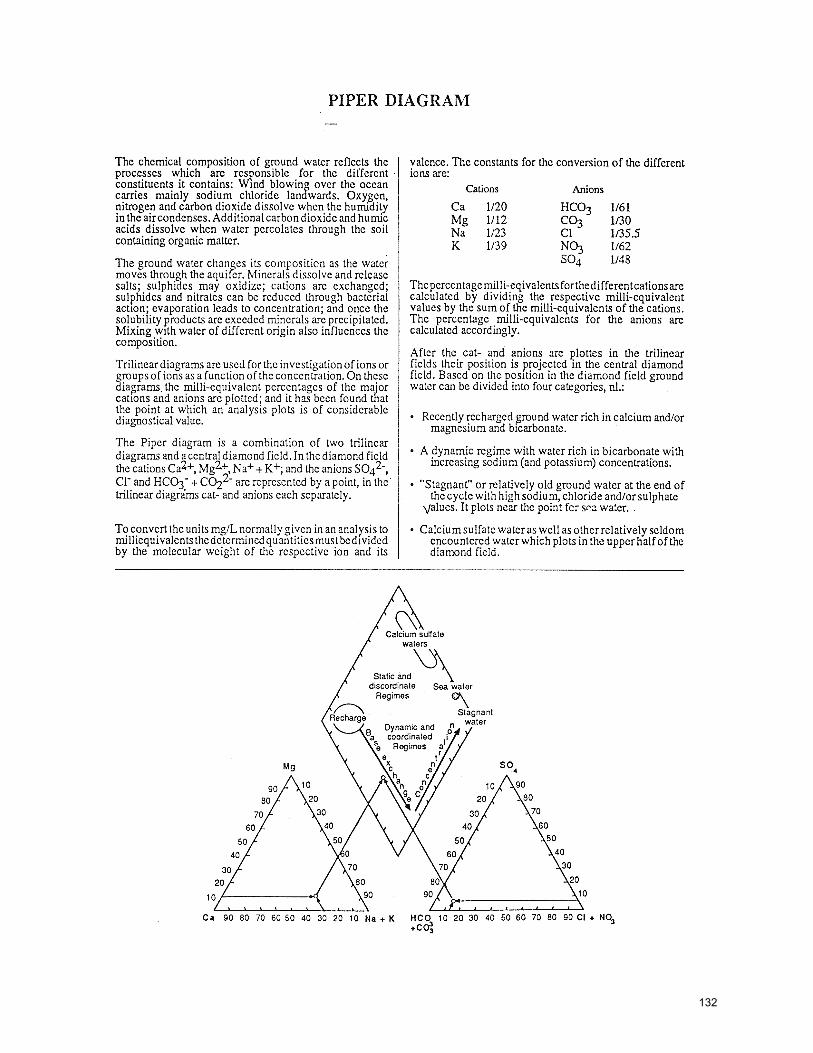
132
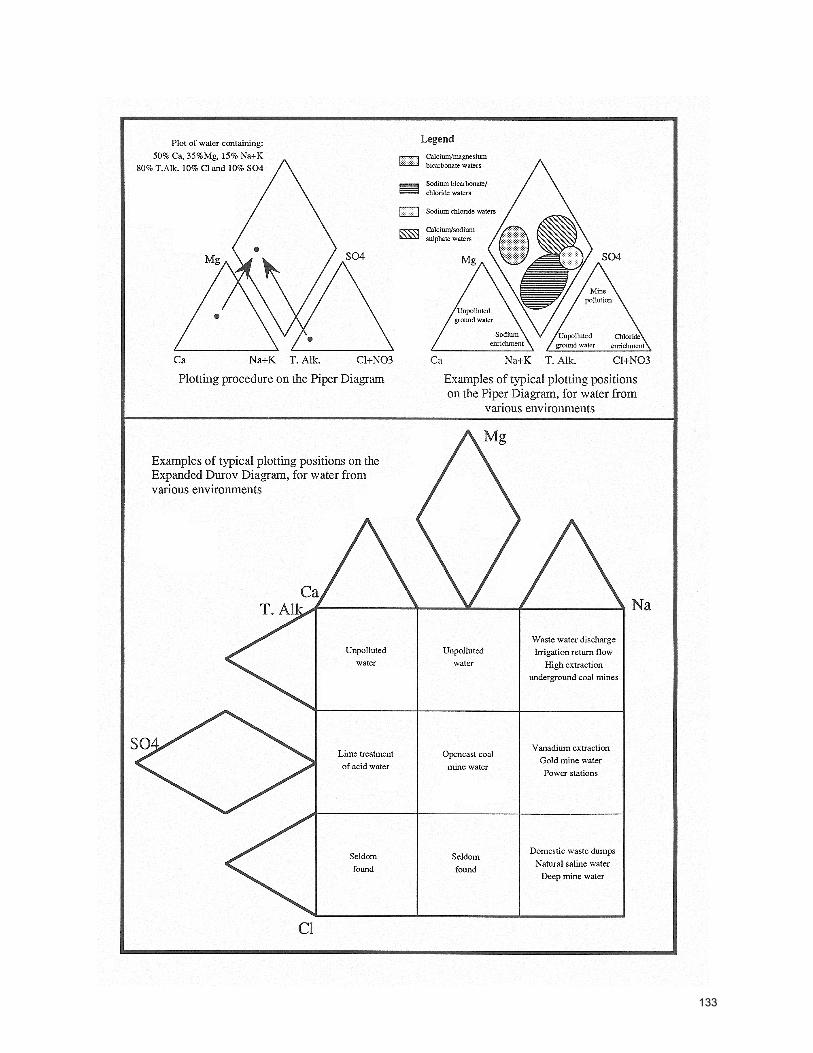
133
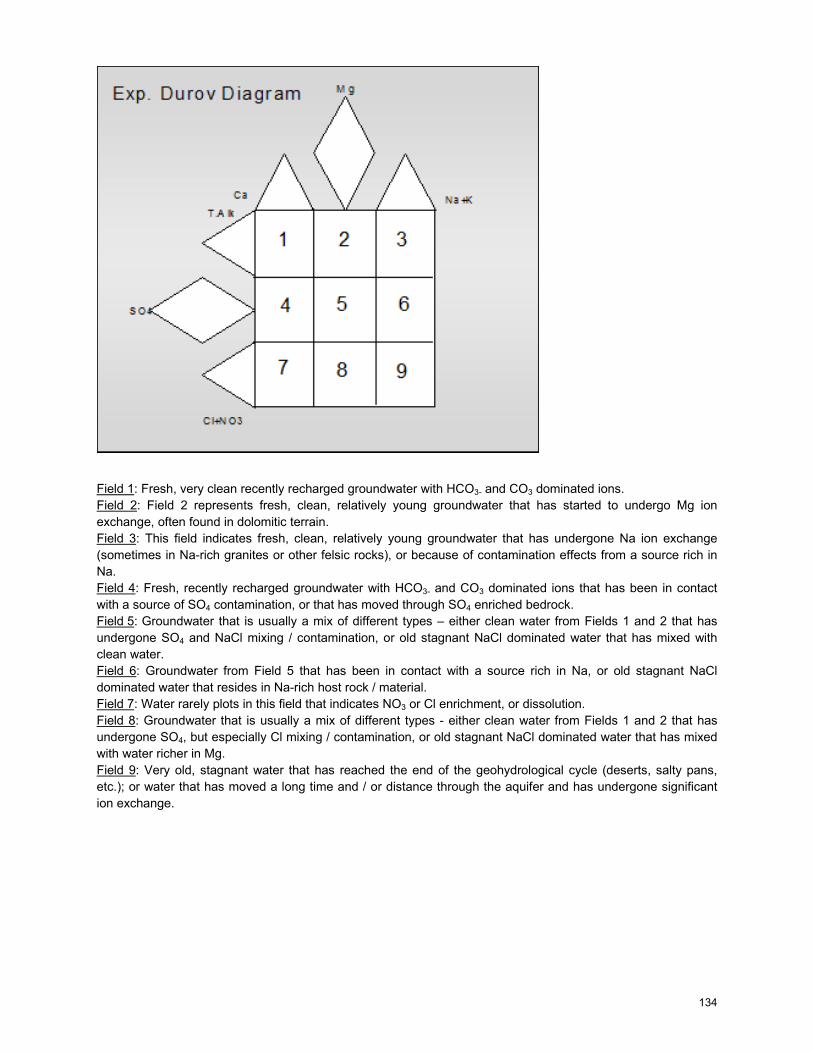
134
Field 1: Fresh, very clean recently recharged groundwater with HCO3- and CO3 dominated ions.
Field 2: Field 2 represents fresh, clean, relatively young groundwater that has started to undergo Mg ion
exchange, often found in dolomitic terrain.
Field 3: This field indicates fresh, clean, relatively young groundwater that has undergone Na ion exchange
(sometimes in Na-rich granites or other felsic rocks), or because of contamination effects from a source rich in
Na.
Field 4: Fresh, recently recharged groundwater with HCO3- and CO3 dominated ions that has been in contact
with a source of SO4 contamination, or that has moved through SO4 enriched bedrock.
Field 5: Groundwater that is usually a mix of different types – either clean water from Fields 1 and 2 that has
undergone SO4 and NaCl mixing / contamination, or old stagnant NaCl dominated water that has mixed with
clean water.
Field 6: Groundwater from Field 5 that has been in contact with a source rich in Na, or old stagnant NaCl
dominated water that resides in Na-rich host rock / material.
Field 7: Water rarely plots in this field that indicates NO3 or Cl enrichment, or dissolution.
Field 8: Groundwater that is usually a mix of different types - either clean water from Fields 1 and 2 that has
undergone SO4, but especially Cl mixing / contamination, or old stagnant NaCl dominated water that has mixed
with water richer in Mg.
Field 9: Very old, stagnant water that has reached the end of the geohydrological cycle (deserts, salty pans,
etc.); or water that has moved a long time and / or distance through the aquifer and has undergone significant
ion exchange.
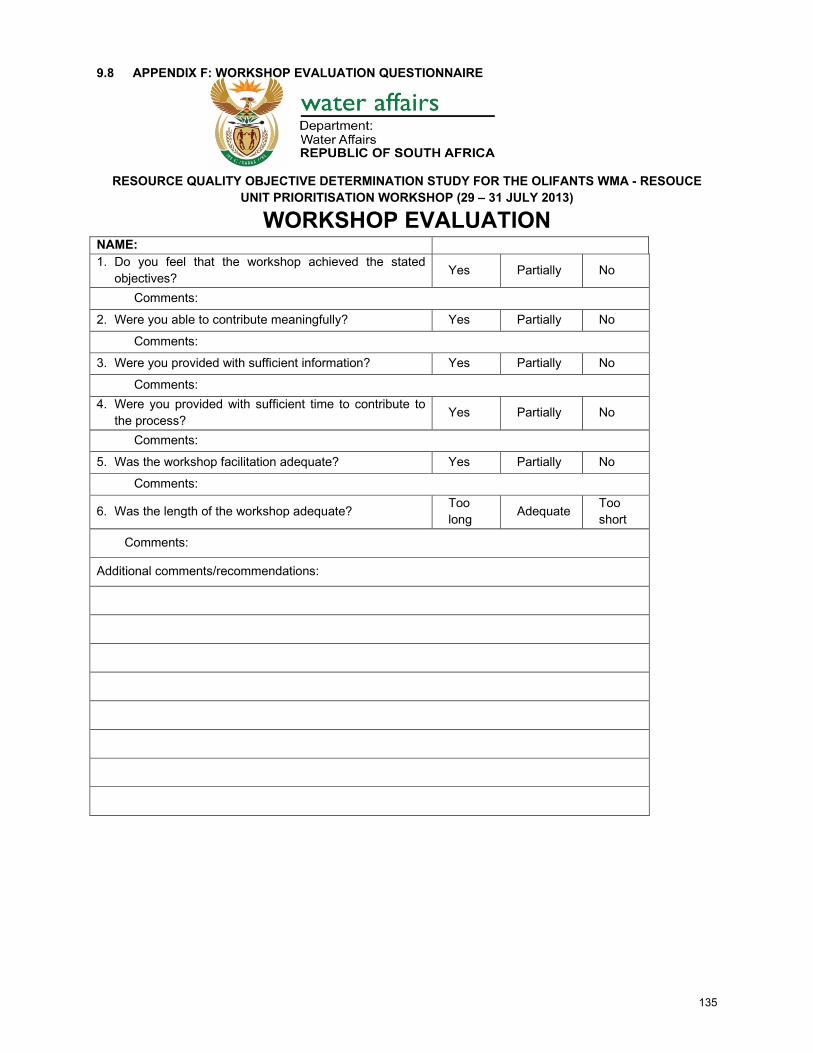
135
9.8 APPENDIX F: WORKSHOP EVALUATION QUESTIONNAIRE
RESOURCE QUALITY OBJECTIVE DETERMINATION STUDY FOR THE OLIFANTS WMA - RESOUCE
UNIT PRIORITISATION WORKSHOP (29 – 31 JULY 2013)
WORKSHOP EVALUATION NAME:
1. Do you feel that the workshop achieved the stated
objectives? Yes Partially No
Comments:
2. Were you able to contribute meaningfully? Yes Partially No
Comments:
3. Were you provided with sufficient information? Yes Partially No
Comments:
4. Were you provided with sufficient time to contribute to
the process? Yes Partially No
Comments:
5. Was the workshop facilitation adequate? Yes Partially No
Comments:
6. Was the length of the workshop adequate? Too
long Adequate
Too
short
Comments:
Additional comments/recommendations: