Conservation and non-conservation of genetic pathways in ...
ORI GIN AL PA PER
Determination of national conservation responsibilitiesfor species conservation in regions with multiple politicaljurisdictions
Dirk S. Schmeller Æ Bernd Gruber Æ Bianca Bauch Æ Kaire Lanno ÆEduardas Budrys Æ Valerija Babij Æ Rimvydas Juskaitis Æ Marek Sammul ÆZoltan Varga Æ Klaus Henle
Received: 31 October 2007 / Accepted: 26 June 2008 / Published online: 16 July 2008� Springer Science+Business Media B.V. 2008
Abstract The Convention on Biodiversity (CBD) commits its signatories to the identi-
fication and monitoring of biodiversity. The European Union has implemented this
commitment into its legislation. Despite the legal requirement resources are scarce,
requiring a prioritization of conservation actions, including e.g. monitoring. Red lists are
currently the most prominent tool for priority setting in applied conservation, despite the
fact that they were not developed for that purpose. Therefore, it is hardly surprising that
they do not always reflect actual conservation needs. As a response, the concept of national
responsibility as a complementary tool was developed during the last two decades. The
existing methods are country specific and mainly incomparable on an international scale.
Here, we present a newly developed method, which is applicable to any taxonomic group,
D. S. Schmeller (&) � B. Gruber � B. Bauch � K. HenleDepartment of Conservation Biology, UFZ—Helmholtz Centre for Environmental Research,Permoserstr. 15, 04318 Leipzig, Germanye-mail: [email protected]
D. S. SchmellerStation d’Ecologie Experimentale du CNRS a Moulis, 09200 Saint Girons, France
B. GruberDepartment of Computational Landscape Ecology, UFZ—Helmholtz Centre for EnvironmentalResearch, Permoserstr. 15, 04318 Leipzig, Germany
K. Lanno � M. SammulInstitute of Agricultural and Environmental Sciences, Estonian University of Life Sciences,Kreutzwaldi 1, Tartu 51014, Estonia
E. Budrys � R. JuskaitisInstitute of Ecology of Vilnius University, Akademijos 2, 08412 Vilnius, Lithuania
V. BabijInstitute of Biology, ZRC SAZU—Scientific Research Centre of the Slovenian Academy of Sciencesand Arts, Novi trg 2, SI-1000 Ljubljana, Slovenia
Z. VargaDepartment of Zoology and Evolution, Kossut Lajos University of Debrecen, 4010 Debrecen, Hungary
123
Biodivers Conserv (2008) 17:3607–3622DOI 10.1007/s10531-008-9439-8
adjustable to different geographic scales, with little data requirements and clear catego-
rizations. We apply the new method to over 1,000 species in several countries of different
size and report on the applicability of our method and discuss problems that derive from
the currently available data. Our method has several major advantages compared to cur-
rently available methods. It is applicable to any geographic range, allows automatization,
given database availability, and is readily adjustable to future data improvements. It further
has comparably low data demands by exploiting one of the most commonly available
information on biodiversity, i.e. distribution maps. We believe that our method allows the
allocation of the limited resources in nature conservation in the most sensible way, e.g. the
sharing of monitoring duties, effectively selecting networks of protected areas, improving
knowledge on biodiversity, and closing information gaps in many species groups.
Keywords Species conservation � National responsibility � Europe �Evaluation methods � International importance � Distribution range
Introduction
In applied conservation, red lists are the most commonly used tool for conservation
assessment as they explain the complex phenomenon ‘‘endangerment’’ in a simple way
(The Nature Conservancy 1988; IUCN 1996, 2001), granting high public acceptance
(Schnittler and Gunther 1999). Usually, the resulting threat status for a particular species is
also taken as a measurement for conservation priorities, even though red lists were not
designed for that purpose. However, red lists may at best be a suboptimal tool for setting
conservation priorities in a country or region as the threat status does not always reflect
actual conservation needs (Gardenfors 2000, 2001; Mehlman et al. 2004; Eaton et al.
2005). That is especially true from an international point of view, from which it is clearly
more desirable to focus national conservation efforts on the near-endemics centred in the
respective country (Schnittler and Gunther 1999). Ideally, a population viability analysis
for the global population would be the best method to set conservation priorities, but this
will be impossible for routine assessments of a range of species in the foreseeable future
due to limited data availability. As a response, the concept of national responsibility as a
complementary tool was developed (Schnittler et al. 1994; Schnittler and Gunther 1999;
Schnittler 2004).
The assessment of national responsibilities captures the fact that different parts of a
species’ distribution range contribute differently to the overall survival of a species (e.g.
Hanski 1982, 2001; Hanski et al. 1995). Hence, national responsibility assessment covers
the notion of importance of a region for the conservation of biodiversity in respect to its
irreplaceability (Brooks et al. 2006). The assessment of national responsibilities will allow
to focus conservation efforts on populations, which are important for the global survival of
a species, and thus will increase the efficiency of biodiversity conservation. International
importance as such is included in several methods of conservation prioritization in many
countries, e.g. South Africa (Freitag and Jaarsveld 1997), Australia (Coates and Atkins
2001), the United States of America (Beissinger et al. 2000; Carter et al. 2000), and
Canada (Couturier 1999), but is particularly well elaborated in Europe. A recent review
(Schmeller et al. 2008), however, shows shortcomings of the existing methods, e.g. not
allowing for comparisons between countries, being not freely scalable and mixing the
concepts of red lists and national responsibilities.
3608 Biodivers Conserv (2008) 17:3607–3622
123
As there is an urgent need of developing a measure and guidance for how to invest the
limited financial and human resources in monitoring and conserving biodiversity, we
describe a newly developed method for determining national responsibilities in species
conservation that is freely scalable, avoids the confounding with red list status, and is
comparable among countries. We apply the new method to species in several countries of
different size and discuss our results in light of current data availability and future needs of
data gathering through biodiversity monitoring.
Improved national responsibility method
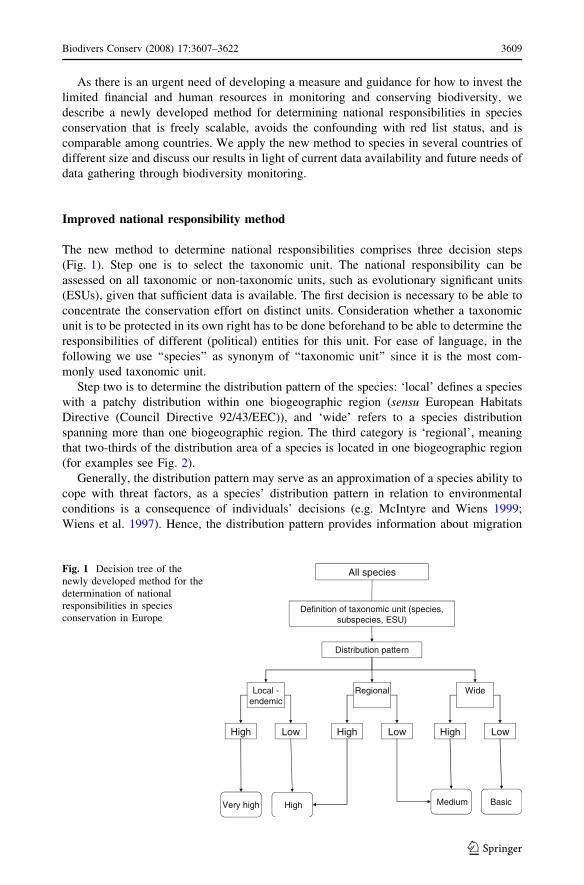
The new method to determine national responsibilities comprises three decision steps
(Fig. 1). Step one is to select the taxonomic unit. The national responsibility can be
assessed on all taxonomic or non-taxonomic units, such as evolutionary significant units
(ESUs), given that sufficient data is available. The first decision is necessary to be able to
concentrate the conservation effort on distinct units. Consideration whether a taxonomic
unit is to be protected in its own right has to be done beforehand to be able to determine the
responsibilities of different (political) entities for this unit. For ease of language, in the
following we use ‘‘species’’ as synonym of ‘‘taxonomic unit’’ since it is the most com-
monly used taxonomic unit.
Step two is to determine the distribution pattern of the species: ‘local’ defines a species
with a patchy distribution within one biogeographic region (sensu European Habitats
Directive (Council Directive 92/43/EEC)), and ‘wide’ refers to a species distribution
spanning more than one biogeographic region. The third category is ‘regional’, meaning
that two-thirds of the distribution area of a species is located in one biogeographic region
(for examples see Fig. 2).
Generally, the distribution pattern may serve as an approximation of a species ability to
cope with threat factors, as a species’ distribution pattern in relation to environmental
conditions is a consequence of individuals’ decisions (e.g. McIntyre and Wiens 1999;
Wiens et al. 1997). Hence, the distribution pattern provides information about migration
All species
Definition of taxonomic unit (species, subspecies, ESU)
Distribution pattern
Very high
Local -endemic
Wide
High Low High Low
High Medium Basic
Regional
High Low
Fig. 1 Decision tree of thenewly developed method for thedetermination of nationalresponsibilities in speciesconservation in Europe
Biodivers Conserv (2008) 17:3607–3622 3609
123
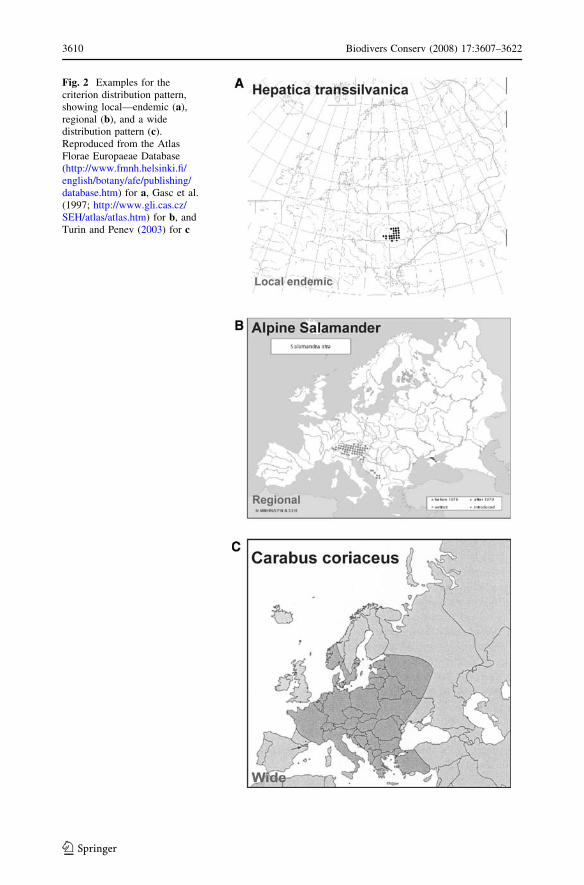
Fig. 2 Examples for thecriterion distribution pattern,showing local—endemic (a),regional (b), and a widedistribution pattern (c).Reproduced from the AtlasFlorae Europaeae Database(http://www.fmnh.helsinki.fi/english/botany/afe/publishing/database.htm) for a, Gasc et al.(1997; http://www.gli.cas.cz/SEH/atlas/atlas.htm) for b, andTurin and Penev (2003) for c
3610 Biodivers Conserv (2008) 17:3607–3622
123
options of species, and the degree of isolation between populations. Further, species with
wide distributions tend to be locally more abundant than species with narrow distributions
(Hanski and Gyllenberg 1997). This relationship was named the distribution-abundance
curve and is explained by the fact that generalist species, or species using ubiquitous
resources (Hanski 1991), are both locally common and widely distributed, whereas spe-
cialists are constrained to have narrow distribution and tend to be locally uncommon
according to Brown’s hypothesis (Brown 1984). Moreover, distribution is a suitable pre-
dictor of the differential extinction proneness of species in the face of habitat loss and
fragmentation (Henle et al. 2004).
The final step in our method is the calculation of proportional distribution in the focal
area. Here, we follow the suggestion of Keller and Bollmann (2001, 2004) and calculate
the expected distribution probability (DPexp) as the ratio of the distribution area of the
species in the reference area and the size of the reference area according to Eq. 1. This
expected value is compared to the ratio of the distribution range of the species in a focal
region to the total size of the focal region (observed distribution probability; DPobs, Eq. 1).
If the latter value is twice as high as the expected value, the probability of the occurrence
of a species in the focal area is high, otherwise it is classified as low. We followed the
rationale that if a species occurs in a country across a
DPexp ¼distributionreference area
reference areatotal
DPobs ¼distributionfocal area
focal areatotal
ð1Þ
larger area than expected based on its European distribution, the living conditions in that
country should be particularly suitable for the species. Hence, the loss of populations of
that species in that particular area would be a substantial loss for the global population.
National responsibility assessments
In order to test the applicability of the method, we made extensive national responsibility
assessments for several species groups in different countries of different size. Altogether
we assessed the national responsibility for about 1000 species from Slovenia (354),
Hungary (388), Germany (285), and the Baltics with a focus on Lithuania (200). About 50
species were shared between countries (Table 1). In addition, we analysed about 40 sub-
species in the genus Carabus and in the families Orchidaceae and Ranunculaceae.
To demonstrate the complementarity of the national responsibilities to the red list
approach we tested for a relationship between national responsibilities and red list status
using a Kruskal–Wallis ANOVA (Procedure NPAR1WAY; SAS Institute, Cary, NC, USA,
1999). For that analysis, we ranked each red list category numerically, starting from the
lowest (‘‘basic’’ in national responsibility, ‘‘least concern’’ in the red list status) to the
highest category (‘‘very high’’/‘‘extinct in the wild’’).
Results
The new method led to an assignment of 3% of the total sample to the highest national
responsibilities category ‘‘very high’’; over 50% of the species were assigned to the category
Biodivers Conserv (2008) 17:3607–3622 3611
123
‘‘basic’’; the distribution of the classes follows a Poisson-distribution (Fig. 3). The distri-
bution, however, varies among countries, with Slovenia showing the highest proportion of
very high (7%) and high national responsibilities (11%). In Germany and the Baltics, the
proportion of both categories combined was only 2% (Fig. 4). Generally, we observed a
significant shift toward higher responsibility categories in Hungary (v12 = 27.78; a\ 0.001)
and Slovenia (v12 = 37.17; a\ 0.001) as compared to Germany (Fig. 4).
In the case of species shared between different countries the new approach results in
one-category-differences in national responsibilities among countries. The size of a
country, however, seems not to be related to the national responsibility category assigned
to shared species (Table 2).
We did not detect a significant relationship between the national responsibilities and the
conservation status as given in the IUCN Red List (v32 = 3.97; a = 0.265) or national red
lists (v52 = 2.24; a = 0.814). Comparing the median of each red list rank in a national
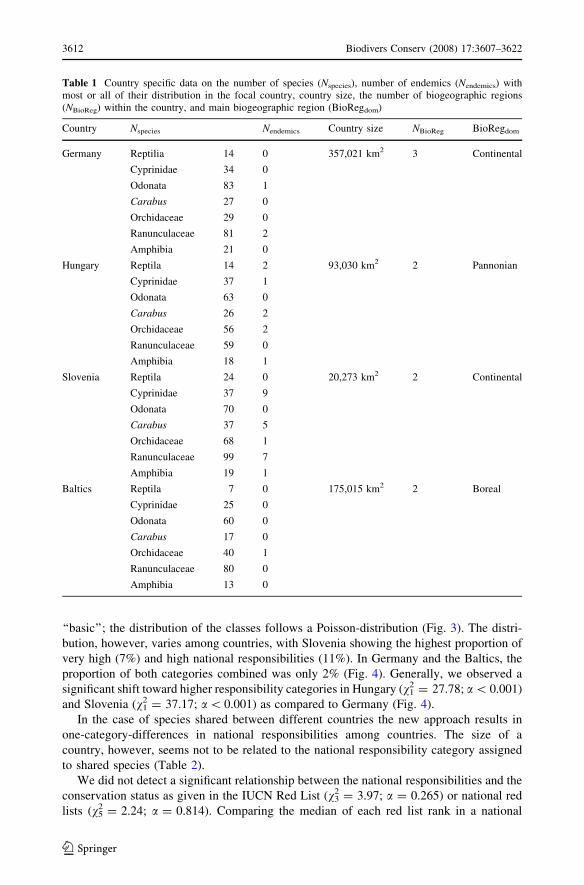
Table 1 Country specific data on the number of species (Nspecies), number of endemics (Nendemics) withmost or all of their distribution in the focal country, country size, the number of biogeographic regions(NBioReg) within the country, and main biogeographic region (BioRegdom)
Country Nspecies Nendemics Country size NBioReg BioRegdom
Germany Reptilia 14 0 357,021 km2 3 Continental
Cyprinidae 34 0
Odonata 83 1
Carabus 27 0
Orchidaceae 29 0
Ranunculaceae 81 2
Amphibia 21 0
Hungary Reptila 14 2 93,030 km2 2 Pannonian
Cyprinidae 37 1
Odonata 63 0
Carabus 26 2
Orchidaceae 56 2
Ranunculaceae 59 0
Amphibia 18 1
Slovenia Reptila 24 0 20,273 km2 2 Continental
Cyprinidae 37 9
Odonata 70 0
Carabus 37 5
Orchidaceae 68 1
Ranunculaceae 99 7
Amphibia 19 1
Baltics Reptila 7 0 175,015 km2 2 Boreal
Cyprinidae 25 0
Odonata 60 0
Carabus 17 0
Orchidaceae 40 1
Ranunculaceae 80 0
Amphibia 13 0
3612 Biodivers Conserv (2008) 17:3607–3622
123
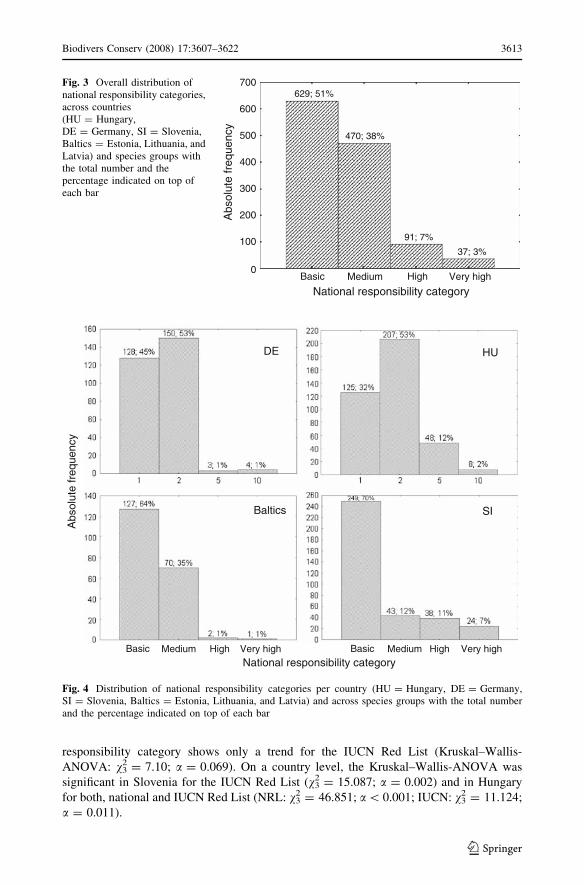
responsibility category shows only a trend for the IUCN Red List (Kruskal–Wallis-
ANOVA: v32 = 7.10; a = 0.069). On a country level, the Kruskal–Wallis-ANOVA was
significant in Slovenia for the IUCN Red List (v32 = 15.087; a = 0.002) and in Hungary
for both, national and IUCN Red List (NRL: v32 = 46.851; a\ 0.001; IUCN: v3
2 = 11.124;
a = 0.011).
Abs
olut
e fr
eque
ncy
Basic0
100
200
300
400
500
600
700629; 51%
470; 38%
91; 7%
37; 3%
Medium High Very high
National responsibility category
Fig. 3 Overall distribution ofnational responsibility categories,across countries(HU = Hungary,DE = Germany, SI = Slovenia,Baltics = Estonia, Lithuania, andLatvia) and species groups withthe total number and thepercentage indicated on top ofeach bar
DE HU
SIBaltics
Abs
olut
e fr
eque
ncy
Basic Medium High Very high Basic Medium High Very high
National responsibility category
Fig. 4 Distribution of national responsibility categories per country (HU = Hungary, DE = Germany,SI = Slovenia, Baltics = Estonia, Lithuania, and Latvia) and across species groups with the total numberand the percentage indicated on top of each bar
Biodivers Conserv (2008) 17:3607–3622 3613
123
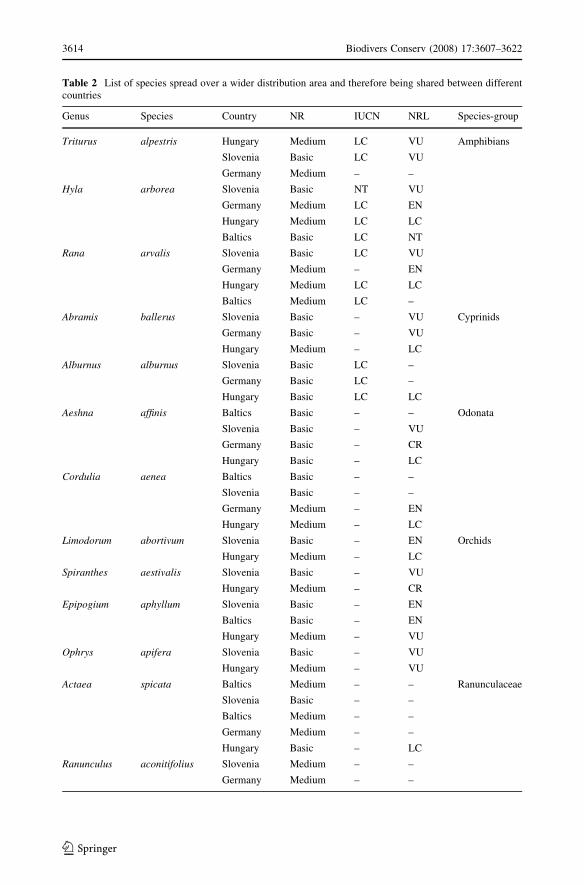
Table 2 List of species spread over a wider distribution area and therefore being shared between differentcountries
Genus Species Country NR IUCN NRL Species-group
Triturus alpestris Hungary Medium LC VU Amphibians
Slovenia Basic LC VU
Germany Medium – –
Hyla arborea Slovenia Basic NT VU
Germany Medium LC EN
Hungary Medium LC LC
Baltics Basic LC NT
Rana arvalis Slovenia Basic LC VU
Germany Medium – EN
Hungary Medium LC LC
Baltics Medium LC –
Abramis ballerus Slovenia Basic – VU Cyprinids
Germany Basic – VU
Hungary Medium – LC
Alburnus alburnus Slovenia Basic LC –
Germany Basic LC –
Hungary Basic LC LC
Aeshna affinis Baltics Basic – – Odonata
Slovenia Basic – VU
Germany Basic – CR
Hungary Basic – LC
Cordulia aenea Baltics Basic – –
Slovenia Basic – –
Germany Medium – EN
Hungary Medium – LC
Limodorum abortivum Slovenia Basic – EN Orchids
Hungary Medium – LC
Spiranthes aestivalis Slovenia Basic – VU
Hungary Medium – CR
Epipogium aphyllum Slovenia Basic – EN
Baltics Basic – EN
Hungary Medium – VU
Ophrys apifera Slovenia Basic – VU
Hungary Medium – VU
Actaea spicata Baltics Medium – – Ranunculaceae
Slovenia Basic – –
Baltics Medium – –
Germany Medium – –
Hungary Basic – LC
Ranunculus aconitifolius Slovenia Medium – –
Germany Medium – –
3614 Biodivers Conserv (2008) 17:3607–3622
123
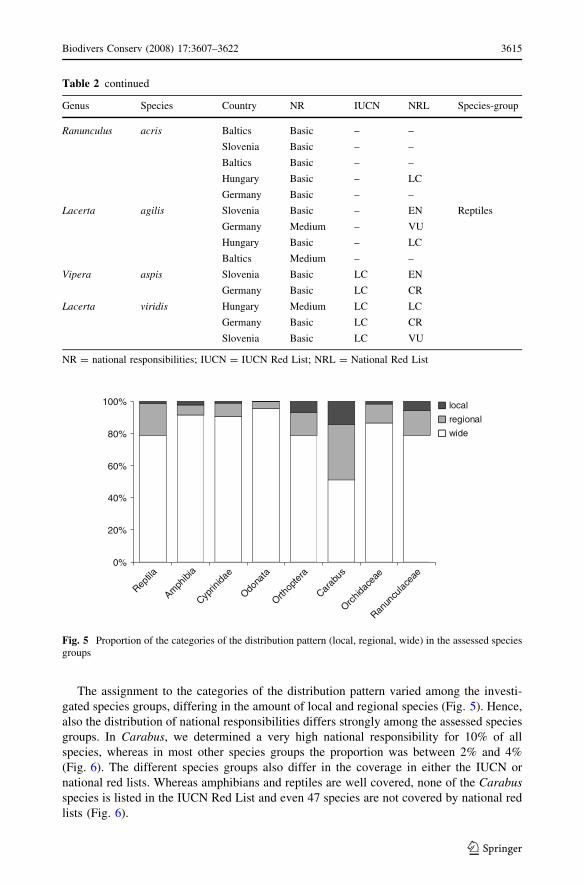
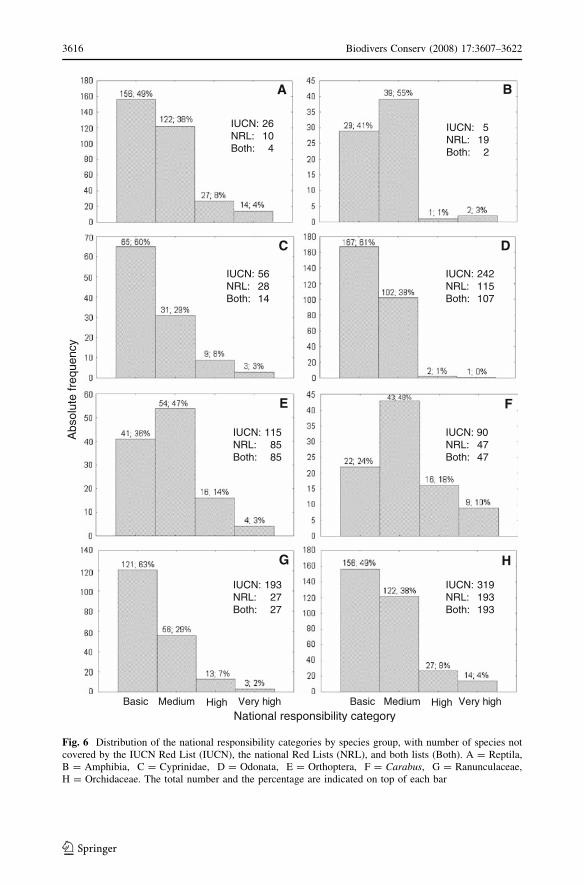
The assignment to the categories of the distribution pattern varied among the investi-
gated species groups, differing in the amount of local and regional species (Fig. 5). Hence,
also the distribution of national responsibilities differs strongly among the assessed species
groups. In Carabus, we determined a very high national responsibility for 10% of all
species, whereas in most other species groups the proportion was between 2% and 4%
(Fig. 6). The different species groups also differ in the coverage in either the IUCN or
national red lists. Whereas amphibians and reptiles are well covered, none of the Carabusspecies is listed in the IUCN Red List and even 47 species are not covered by national red
lists (Fig. 6).
0%
20%
40%
60%
80%
100%
Reptila
Amph
ibia
Cyprin
idae
Odona
ta
Orthop
tera
Carab
us
Orchid
acea
e
Ranun
culac
eae
local
regional
wide
Fig. 5 Proportion of the categories of the distribution pattern (local, regional, wide) in the assessed speciesgroups
Table 2 continued
Genus Species Country NR IUCN NRL Species-group
Ranunculus acris Baltics Basic – –
Slovenia Basic – –
Baltics Basic – –
Hungary Basic – LC
Germany Basic – –
Lacerta agilis Slovenia Basic – EN Reptiles
Germany Medium – VU
Hungary Basic – LC
Baltics Medium – –
Vipera aspis Slovenia Basic LC EN
Germany Basic LC CR
Lacerta viridis Hungary Medium LC LC
Germany Basic LC CR
Slovenia Basic LC VU
NR = national responsibilities; IUCN = IUCN Red List; NRL = National Red List
Biodivers Conserv (2008) 17:3607–3622 3615
123
A
E
C D
B
G H
F
IUCN: 26NRL: 10Both: 4
IUCN: 5NRL: 19Both: 2
IUCN: 56NRL: 28Both: 14
IUCN: 242NRL: 115Both: 107
IUCN: 115NRL: 85Both: 85
IUCN: 193NRL: 27Both: 27
IUCN: 90NRL: 47Both: 47
IUCN: 319NRL: 193Both: 193
Basic Medium High Very high Basic Medium High Very high
National responsibility category
Abs
olut
e fr
eque
ncy
Fig. 6 Distribution of the national responsibility categories by species group, with number of species notcovered by the IUCN Red List (IUCN), the national Red Lists (NRL), and both lists (Both). A = Reptila,B = Amphibia, C = Cyprinidae, D = Odonata, E = Orthoptera, F = Carabus, G = Ranunculaceae,H = Orchidaceae. The total number and the percentage are indicated on top of each bar
3616 Biodivers Conserv (2008) 17:3607–3622
123
Discussion
National responsibility concepts and conservation priority methods are increasingly
developed and applied but usually do not allow comparisons among different countries due
to missing standardization (Schmeller et al. 2008) and therefore are not widely accepted
(e.g. Fitzpatrick et al. 2007). Here, we present a new method, applicable to different
taxonomic groups, adjustable to different geographic scales, with little data requirements,
clear categorizations and allowing the development of automatic routines, once a suitable
database is created. As such, our method can be used for large-scale assessment of national
responsibilities and is highly interesting for parts of the world with multiple political
jurisdictions, like state unions, and nations with regional governmental structures.
Therefore, we believe our method could become a standard method, allowing to base
conservation decisions not only on the conservation status or rarity of a species, but also on
the responsibility of a geographic or administrative entity for the survival of a species. Our
method is limited by the availability and quality of data, but these requirements are less
than for other existing methods and may even trigger the accumulation of more data from
so far neglected species groups. In the following, we will discuss the advantages and
difficulties of our approach in more detail.
The assessment of species from several species groups in European countries of dif-
ferent size resulted in qualitatively similar distributions of species to national responsibility
categories for the compared countries and taxonomic groups indicating the applicability of
the new method to different scales and taxa. Only a small proportion of a country’s species
was assigned to the high or very high responsibility categories (2–18%), which will
facilitate allocating national conservation resources to species of high international
importance. The missing relationship between the IUCN Red List categories and the
national responsibility categories indicates that the two concepts are assessing different
aspects of a species and shows that national responsibility is an important additional and
widely independent dimension for the conservation of species.
Our approach further considers endemism well, as shown by the shifts towards higher
responsibilities with higher degrees of endemism, most clearly visible in the case of the
assessed Carabus genus. Many of these species have very local or regional distributions
(Turin and Penev 2003), leading to higher responsibility classification. With our method, it
is also possible to consider ESUs (Moritz 1994), but ESUs are lively debated (Fraser and
Bernatchez 2001; Mace and Purvis 2008) and are expensive and difficult to assess in most
cases. With our method, we leave the decision whether the data available is sufficient for an
assessment of ESU to the user. However, we strongly encourage research on the importance
of ESUs and marginal populations for processes creating and maintaining diversity.
We found a geographical component of the assessment of national responsibilities.
Slovenia and Hungary had a higher proportion of species in the high and very high respon-
sibility classes than Germany and the Baltics. The shift to higher responsibilities in Slovenia
and Hungary very likely resulted from their biogeographic location within European biodi-
versity hotspots (Hobohm 2003), while the other countries assessed have a much lower
amount of endemics (Table 3). The Pannonian region, which is almost fully covered by
Hungary alone, is the biogeographic region in Europe with the highest number of endemic
invertebrate species (Griffiths et al. 2004, Table 3). Hence, many of these species have a
small distribution range, covering only one biogeographic region and the loss of the species in
Hungary would mean the extinction of the species on a global scale. Mediterranean countries
also have a large amount of endemic species and may therefore receive also a high national
responsibility for a higher number of species, as compared to e.g. Germany or the United
Biodivers Conserv (2008) 17:3607–3622 3617
123
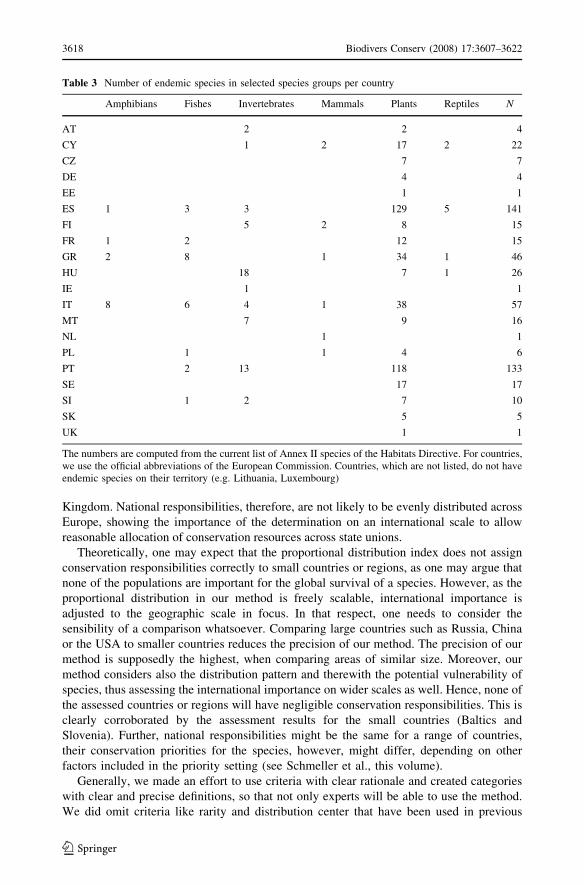
Kingdom. National responsibilities, therefore, are not likely to be evenly distributed across
Europe, showing the importance of the determination on an international scale to allow
reasonable allocation of conservation resources across state unions.
Theoretically, one may expect that the proportional distribution index does not assign
conservation responsibilities correctly to small countries or regions, as one may argue that
none of the populations are important for the global survival of a species. However, as the
proportional distribution in our method is freely scalable, international importance is
adjusted to the geographic scale in focus. In that respect, one needs to consider the
sensibility of a comparison whatsoever. Comparing large countries such as Russia, China
or the USA to smaller countries reduces the precision of our method. The precision of our
method is supposedly the highest, when comparing areas of similar size. Moreover, our
method considers also the distribution pattern and therewith the potential vulnerability of
species, thus assessing the international importance on wider scales as well. Hence, none of
the assessed countries or regions will have negligible conservation responsibilities. This is
clearly corroborated by the assessment results for the small countries (Baltics and
Slovenia). Further, national responsibilities might be the same for a range of countries,
their conservation priorities for the species, however, might differ, depending on other
factors included in the priority setting (see Schmeller et al., this volume).
Generally, we made an effort to use criteria with clear rationale and created categories
with clear and precise definitions, so that not only experts will be able to use the method.
We did omit criteria like rarity and distribution center that have been used in previous
Table 3 Number of endemic species in selected species groups per country
Amphibians Fishes Invertebrates Mammals Plants Reptiles N
AT 2 2 4
CY 1 2 17 2 22
CZ 7 7
DE 4 4
EE 1 1
ES 1 3 3 129 5 141
FI 5 2 8 15
FR 1 2 12 15
GR 2 8 1 34 1 46
HU 18 7 1 26
IE 1 1
IT 8 6 4 1 38 57
MT 7 9 16
NL 1 1
PL 1 1 4 6
PT 2 13 118 133
SE 17 17
SI 1 2 7 10
SK 5 5
UK 1 1
The numbers are computed from the current list of Annex II species of the Habitats Directive. For countries,we use the official abbreviations of the European Commission. Countries, which are not listed, do not haveendemic species on their territory (e.g. Lithuania, Luxembourg)
3618 Biodivers Conserv (2008) 17:3607–3622
123
methods (Schmeller et al., accepted) as their use is limited. Rarity for example has various
meanings (Rabinowitz 1981), the importance of the distribution centre relative to the
margins of the distribution area is controversial and not all species have a clear distribution
centre. For distribution centre even operational definitions are lacking (e.g. Brown 1984;
Sagarin et al. 2006).
Despite the low data requirements and clear categorization, data availability may be a
problem in the assessment of national responsibilities (see also Schmeller et al. 2008).
Whereas birds, amphibians, and reptiles are characterized by a large amount of available
data on the global and regional distribution range (e.g. Gasc et al. 1997; Burfield et al.
2004) the synthesized information for plants is considerably less. For example, the pub-
lished maps in the Atlas Florae Europaeae cover mainly the families Lycopodiaceae to
Rosaceae, which include only little more than 20% of the vascular plants of European flora
(e.g. Jalas et al. 1999 and are already very dated with the first volume published in 1972. For
less well known species groups, such as Lycosidae and Vespidae and many other inverte-
brates, distribution data is even scarcer and usually not accessible. In these cases, the
expected value of proportional distribution cannot be calculated and even our robust method
fails. Such species should be marked as data deficient (as in red lists). Countries then have
the responsibility to improve knowledge and availability of data, especially if some species
of those groups are threatened according to the IUCN Red List or are listed in the Annexes
of the Habitats Directive (e.g. Aspius aspius; Adenophora liliifolia; Rutilus pigus).
Another difficulty linked to data availability is the scale of the data available. An
unbiased determination of the expected value of proportional distribution within a focal
area requires that distribution units are studied with comparable methods both in the focal
country and in the reference area. This means that (i) species not reported from a certain
area are lacking in that area with high probability or at least with equal probability in the
reference and the focal area, (ii) units of the focal and the reference areas have the same or
similar size or can be converted into each other, and (iii) all units are representatively
distributed throughout both the focal and the reference areas. Maps with very detailed
presence/absence data (site dots, 10 910 km squares, 60 9 100 trapezoids) tend to
underestimate distribution due to information gaps. In contrast, generalizations toward too
large distribution units tend to overestimate real distribution. Therefore, the distribution
area should be estimated at the most detailed level available across the reference area. The
estimation of the distribution area in the focal area may need generalisation of the available
distribution data to larger units (i) to make the units equal to those of the reference area and
(ii) to cover the information gaps, unavoidable in the detailed local presence/absence data.
We are aware that the geographic distribution of species is determined by a large
number of processes on multiple scales (Maurer and Taper 2002). Thus, areas with a high
abundance of a species are small and rare, which results in parts of a species distribution
range being more important for conservation than others (Rodriguez 2002). Our approx-
imation of abundance with proportional distribution may therefore not be a valid
assumption in some species, due to variations in density, habitat quality, and movement
patterns. However, the distribution-abundance curve (Brown 1984; Hanski and Gyllenberg
1997) suggests a general pattern with more widely distributed species being also more
abundant locally than local and regionally distributed species. Hence, the number of
species for which our approximation may not be valid may be negligible and a special
consideration of such species in our method was not implemented to keep the method
generally applicable. If the real conservation responsibilities in a certain area might not be
assessed adequately, the use of abundance data instead of proportional distribution would
be the sole solution. For the rare cases, in which abundance data are available across the
Biodivers Conserv (2008) 17:3607–3622 3619
123
range of a species, our method can be easily applied by exchanging distribution for
abundance in Eq. 1. Such data would allow more easily assessing the relative importance
of distribution centers versus range margins of species. It would partly open up the
metapopulation level approach (Hanski 1994) to national responsibility assessment.
A further difficulty for the assessment of national responsibilities with our method arises
from the definition of biogeographic regions. Since the number of biogeographic regions in
which a species is present, is a criterion for classification of its distribution pattern, the
definition of biogeographic region must be precise. The biogeographical regions as used by
the Habitats Directive and the Berne Convention for its Emerald Network are a result of
simplifying maps of potential natural vegetation to create a map more convenient from an
administrative point of view (Roekaerts 2002). For implementation reasons, we follow the
latest definition of the biogeographic regions (http://dataservice.eea.europa.eu/atlas/
viewdata/viewpub.asp?id=2671), even so they do not fully correspond to the real floral
distribution defining a biogeographic region. We stress that the increase of the number of
biogeographic regions covered by a species distribution may inadequately decrease the
national responsibility for the species in all countries where it is present. To counteract
such problems, we decided to implement the cut-off value of two-thirds in a region for the
definition of the regional category, more likely reflecting the real biological situation.
Another solution could be the use of maps, such as the Environmental Classification of
Europe (Metzger et al. 2005), which are not adjusted to political or administrative
boundaries. Our method is readily adjustable to the usage of other maps. However, while
there is a general consensus on the biogeographic region map, other maps may not be
readily accepted by decision makers in conservation, making an implementation less
attractive.
Conclusions
Our method has several major advantages compared to currently available methods. It is
applicable to any geographic range, allows automatization, given database availability, and
is readily adjustable to future data improvements. We did not try to develop a method
overly complex, as suggested earlier (Miller et al. 2007), but rather focused on a meth-
odology readily applicable and comprehensible by decision makers. The applicability
outside of Europe needs assessments, as data availability might differ and reference areas
may be more difficult to identify. However, we believe that our method could become an
important international conservation and policy tool, applicable to a wide range of different
political and conservational situation across the globe. It will allow the allocation of the
limited resources in nature conservation in the most sensible way and it will allow sharing
monitoring duties, improving knowledge on biodiversity, and closing information gaps in
many species groups to improve national and international conservation actions.
Acknowledgements This article is a result of the EU-project EuMon (http://eumon.ckff.si), financed bythe EU Commission (contract number 6463). We would like to thank other EuMon-colleagues for fruitfuldiscussions.
References
Beissinger SR, Reed JM, Wunderle JM Jr et al (2000) Report of the AOU conservation committee on thepartners in flight species prioritization plan. Auk 117(2):549–561
3620 Biodivers Conserv (2008) 17:3607–3622
123
Brooks TM, Mittermeier RA, da Fonseca GAB et al (2006) Global biodiversity conservation priorities.Science 313(5783):58–61
Brown JH (1984) On the relationship between abundance and distribution of species. Am Nat 124(2):255–279Burfield I, van Bommel F, Gallo-Orsi U et al (2004) Birds in Europe: population estimates, trends and
conservation status. BirdLife International, Cambridge, UKCarter MF, Hunter WC, Pashley DN et al (2000) Setting conservation priorities for landbirds in the United
States: the partners in flight approach. Auk 117(2):541–548Coates DJ, Atkins KA (2001) Priority setting and the conservation of Western Australia’s diverse and highly
endemic flora. Biol Conserv 97(2):251–263Couturier A (1999) Conservation priorities for the birds of Southern Ontario. Technical appendices, and
priority species lists 15. Bird studies Canada, Port Rowan, OntarioEaton MA, Gregory RD, Noble DG et al (2005) Regional IUCN red listing: the process as applied to birds in
the United Kingdom. Conserv Biol 19(5):1557–1570Fitzpatrick UNA, Murray TE, Paxton RJ et al (2007) Building on IUCN regional red lists to produce lists of
species of conservation priority: a model with Irish bees. Conserv Biol 21(5):1324–1332Fraser DJ, Bernatchez L (2001) Adaptive evolutionary conservation: towards a unified concept for defining
conservation units. Mol Ecol 10(12):2741–2752Freitag S, Jaarsveld ASV (1997) Relative occupancy, endemism, taxonomic distinctiveness and vulnera-
bility: prioritizing regional conservation actions. Biodivers Conserv 6(2):211–232Gardenfors U (2000) Population viability analysis in the classification of threatened species: problems and
potentials. Ecol Bull 48:181–190Gardenfors U (2001) Classifying threatened species at national versus global levels. Trends Ecol Evol
16(9):511–516Gasc JP, Cabela A, Crnobrnja-Isailovic J et al (1997) Atlas of amphibians and reptiles in Europe. Societas
Europaea Herpetologica and Museum National d’Histoire Naturelle (IEGB/SPN), Paris, FranceGriffiths HI, Krystufek B, Reed JM (2004) Balkan biodiversity: pattern and process in the European hotspot.
Kluwer Academic, The NetherlandsHanski I (1982) On patterns of temporal and spatial variation in animal populations. Annales Zoologici
Fennici 19(1):21–37Hanski I (1991) Single-species metapopulation dynamics: concepts, models and observation. In: Gilpin M,
Hanski I (eds) Metapopulation dynamics. Academic Press, London, pp 17–38Hanski I (1994) A practical model of metapopulation dynamics. J Anim Ecol 63:151–162Hanski I (2001) Spatially realistic theory of metapopulation ecology. Naturwissenschaften 88:372–381Hanski I, Gyllenberg M (1997) Uniting two general patterns in the distribution of species. Science
275(5298):397–400Hanski I, Poyry J, Pakkala T et al (1995) Multiple equilibria in metapopulation dynamics. Nature 377:618–621Henle K, Davies KF, Kleyer M, Margules C, Settele J (2004) Predictors of species sensitivity to frag-
mentation. Biodiv Conserv 13:207–251Hobohm C (2003) Characterization and ranking of biodiversity hotspots: centres of species richness and
endemism. Biodivers Conserv 12(2):279–287IUCN (1996) In: Baille JEM, Groombridge B (eds) IUCN Red List of threatened animals. IUCN, Gland,
SwitzerlandIUCN (2001) IUCN Red List Categories and Criteria: version 3.1. IUCN Species Survival Commission.
IUCN, Gland, Switzerland and Cambridge, UKJalas J, Suominen J, Lampinen R et al (1999) Distribution of vascular plants in Europe. Atlas Florae
Europaeae 12. The Committee for Mapping the Flora of Europe and Societas Biologica FennicaVanamo, Helsinki, Finland
Keller V, Bollmann K (2001) For which bird species does Switzerland have a particular responsibility? Furwelche Vogelarten tragt die Schweiz eine besondere Verantwortung? Ornithologische Beobachter98(4):323–340
Keller V, Bollmann K (2004) From red lists to species of conservation concern. Conserv Biol 18(6):1636–1644Mace GM, Purvis A (2008) Evolutionary biology and practical conservation: bridging a widening gap. Mol
Ecol 17:9–19Maurer BA, Taper ML (2002) Connecting geographical distributions with population processes. Ecol Lett
5(2):223–231McIntyre NE, Wiens JA (1999) Interactions between landscape structure and animal behavior: the roles of
heterogeneously distributed resources and food deprivation on movement patterns. Landscape Ecol14(5):437–447
Mehlman DW, Rosenberg KV, Wells JV et al (2004) A comparison of North American avian conservationpriority ranking systems. Biol Conserv 120(3):383–390
Biodivers Conserv (2008) 17:3607–3622 3621
123
Metzger MJ, Bunce RGH, Jongman RHG et al (2005) A climatic stratification of the environment of Europe.Glob Ecol Biogeogr 14(6):549–563
Miller RM, Rodriguez JP, Aniskowicz-Fowler T et al (2007) National threatened species listing based on IUCNcriteria and regional guidelines: current status and future perspectives. Conserv Biol 21(3):684–696
Moritz C (1994) Defining ‘‘evolutionary significant units’’ for conservation. Trends Ecol Evol 9:373–375Rabinowitz A (1981) Seven forms of rarity. The biological aspects of rare plant conservation. Wiley,
Chichester, UK, pp 205–235Rodriguez JP (2002) Range contraction in declining North American bird populations. Ecol Appl
12(1):238–248Roekaerts M (2002) The biogeographical regions map of Europe. Basic principles of its creation and
overview of its development. European Environmental Agency, Copenhagen (http://dataservice.eea.europa.eu/download.asp?id=5234andfiletype=.pdf)
Sagarin RD, Gaines SD, Gaylord B (2006) Moving beyond assumptions to understand abundance distri-butions across the ranges of species. Trends Ecol Evol 21(9):524–530
Schmeller DS, Gruber B, Budrys E et al (2008) National responsibilities in European species conservation: amethodological review. Conserv Biol 22(3):593–601
Schnittler M (2004) Verantwortlichkeitsanalyse: Wie lassen sich Theorie und Naturschutzpraxis vereinen.Naturschutz und Biologische Vielfalt 8:39–52
Schnittler M, Gunther KF (1999) Central European vascular plants requiring priority conservation measures:an analysis from national Red Lists and distribution maps. Biodivers Conserv 8(7):891–925
Schnittler M, Ludwig G, Pretscher P et al (1994) Konzeption der Roten Listen der in Deutschland ge-fahrdeten Tier- und Pflanzenarten—unter Berucksichtigung der neuen internationalen Kategorien.Natur und Landschaft 69(10):451–459
The Nature Conservancy (1988) The Natural heritage program operations manual, Arlington, Virginia, USATurin H, Penev L (2003) The genus Carabus in Europe. A synthesis. Fauna Europaea Evertebrata 2. Pensoft
Publishers, Sofia, BulgariaWiens JA, Schooley RL, Weeks RD (1997) Patchy landscapes and animal movements: do beetles percolate?
Oikos 78(2):257–264
3622 Biodivers Conserv (2008) 17:3607–3622
123
Copyright © 2022 FDOKUMEN