Determination of Mycotoxins in Bee Pollen by Gas Chromatography–Tandem Mass Spectrometry
7
Determination of Mycotoxins in Bee Pollen by Gas Chromatography−Tandem Mass Spectrometry Yelko Rodríguez-Carrasco, Guillermina Font, Jordi Mañ es, and Houda Berrada* Department of Food Science, University of Valencia, Avenida Vicent Andre ́ s Estelle ́ s s/n, 46100 Burjassot, Spain ABSTRACT: Bee pollen, promoted as a natural food supplement, is consumed increasingly by people to maintain a healthy diet. Depending on environmental conditions, pollen can also be an optimum medium for growth of molds such as Fusarium and Penicillium. A quick, easy, cheap, rapid, and safe (QuEChERS) extraction procedure followed by a gas chromatography−tandem mass spectrometry (GC-MS/MS) determination of eight selected Fusarium toxins in bee pollen was developed and optimized. Recovery studies at 20, 80, and 1000 μg/kg showed values between 73 and 95% with relative standard deviations (RSDs) of <15% for all studied mycotoxins. Limits of quantitation (LOQ) ranged from 1 to 4 μg/kg. The proposed method was applied to the analysis of 15 commercial samples. Two of 15 samples showed quantifiable values for neosolaniol and nivalenol. KEYWORDS: bee pollen, mycotoxins, QuEChERS, GC-MS/MS, triple quadrupole ■ INTRODUCTION Shifts of structure of global food consumption affect directly eating habits, and people are increasingly looking for healthy and nutritious foods. These diets include natural products such as hive products including honey, bee pollen, and royal jelly. 1 Bee pollen contains, in perfect balance, all essential amino acids that humans require to achieve and maintain optimum vitality. Moreover, it is a storehouse of vitamins, minerals, fats and oils, carbohydrates, and other healthy compounds such as antioxidants. 2,3 For these reasons, its use in the human diet is very highly appreciated, even becoming recognized officially as a medicine by the German Federal Board of Health. 1 In this regard, several papers have appeared in the literature regarding its digestive, antioxidant, and immunostimulation activities. 4−6 These and other properties of bee pollen converted this commodity to a nutrient-rich health food for many centuries, and its benefits have been widely lauded. It is also important, however, to verify the presence of contaminants that are harmful to health. 7 Mycotoxins are secondary metabolites produced by a wide variety of fungal species such as Fusarium, Aspergillus, Alternaria, Claviceps, and Penicillium. 8 The ability of molds to produce mycotoxins is influenced by environmental factors, the most important being temperature and relative humidity. 9 There is an increasing concern of mycotoxin contamination in foods and feeds because they can be found in a wide range of commodities including cereals, spices, dried fruits, apple products, wine, and coffee. Human exposure occurs mainly by ingestion of mycotoxin-contaminated products and can lead to serious health problems, including immunosuppression and even carcinogenesis. 10,11 Maximum levels of mycotoxins in foodstuffs and feedstuffs have been established in many countries. 12 For instance, maximum limits for deoxynivalenol in food matrices such as processed cereal-based foods and baby foods for infants and young children have been set at 200 μg/ kg. Nevertheless, there is a lack of current legislation with regard to maximum limits of mycotoxins in bee pollen. Bee pollen is also an adequate substrate for mycotoxin growth when no prompt and adequate drying is performed by the beekeeper after collection by bees. 13,14 The quality of bee pollen is strongly dependent on its preservation. 4,7 Therefore, the water content of the product determines microbiological and organoleptic qualities and also its shelf life. The initial water content of the fresh pollen is 14−18 g/100 g, and pollens should be dried to reduce the moisture content to 6% to keep their nutritional value for a long time. 9,15,16 Pollen can be infected by different toxigenic molds, which potentially results in the co-occurrence of several mycotoxins. Interactions between concomitantly occurring mycotoxins can be antagonistic, additive, or synergistic. 17,18 In this context, there is a clear need for fast and efficient analytical methods to support the feed and food industry in the management of mycotoxin residues. Multiclass or multiresidue analytical methodologies are becoming the required tools to provide reliable and wider knowledge about the occurrence of mycotoxins. However, the complex sample matrix may contain components that can interfere with good sample analysis. No data for the determination of mycotoxins in bee pollen are found in the scientific literature, with the exception of a screening ELISA test reported for the sum of aflatoxins 9 and a simultaneous chromatographic determination of ochratoxin A and aflatoxins retained by an immunoaffinity column. 19 For the determination of trichothecenes, nonfluorescent analytes, GC has largely been the method of choice, providing sensitive and accurate results after analyte derivatization, generally based on trimethylsilylation and fluoroacylation. 20 Analytical performance characteristics comparable with those of GC methods can be achieved by application of HPLC methods with pre- or postcolumn derivatization. 21 MS/MS is a highly reliable analyte tool and has become a routine technique in Received: October 17, 2012 Revised: February 5, 2013 Accepted: February 5, 2013 Published: February 5, 2013 Article pubs.acs.org/JAFC © 2013 American Chemical Society 1999 dx.doi.org/10.1021/jf400256f | J. Agric. Food Chem. 2013, 61, 1999−2005
Transcript of Determination of Mycotoxins in Bee Pollen by Gas Chromatography–Tandem Mass Spectrometry

Determination of Mycotoxins in Bee Pollen by GasChromatography−Tandem Mass SpectrometryYelko Rodríguez-Carrasco, Guillermina Font, Jordi Manes, and Houda Berrada*
Department of Food Science, University of Valencia, Avenida Vicent Andres Estelles s/n, 46100 Burjassot, Spain
ABSTRACT: Bee pollen, promoted as a natural food supplement, is consumed increasingly by people to maintain a healthy diet.Depending on environmental conditions, pollen can also be an optimum medium for growth of molds such as Fusarium andPenicillium. A quick, easy, cheap, rapid, and safe (QuEChERS) extraction procedure followed by a gas chromatography−tandemmass spectrometry (GC-MS/MS) determination of eight selected Fusarium toxins in bee pollen was developed and optimized.Recovery studies at 20, 80, and 1000 μg/kg showed values between 73 and 95% with relative standard deviations (RSDs) of<15% for all studied mycotoxins. Limits of quantitation (LOQ) ranged from 1 to 4 μg/kg. The proposed method was applied tothe analysis of 15 commercial samples. Two of 15 samples showed quantifiable values for neosolaniol and nivalenol.
KEYWORDS: bee pollen, mycotoxins, QuEChERS, GC-MS/MS, triple quadrupole
■ INTRODUCTION
Shifts of structure of global food consumption affect directlyeating habits, and people are increasingly looking for healthyand nutritious foods. These diets include natural products suchas hive products including honey, bee pollen, and royal jelly.1
Bee pollen contains, in perfect balance, all essential amino acidsthat humans require to achieve and maintain optimum vitality.Moreover, it is a storehouse of vitamins, minerals, fats and oils,carbohydrates, and other healthy compounds such asantioxidants.2,3 For these reasons, its use in the human diet isvery highly appreciated, even becoming recognized officially asa medicine by the German Federal Board of Health.1 In thisregard, several papers have appeared in the literature regardingits digestive, antioxidant, and immunostimulation activities.4−6
These and other properties of bee pollen converted thiscommodity to a nutrient-rich health food for many centuries,and its benefits have been widely lauded. It is also important,however, to verify the presence of contaminants that areharmful to health.7
Mycotoxins are secondary metabolites produced by a widevariety of fungal species such as Fusarium, Aspergillus,Alternaria, Claviceps, and Penicillium.8 The ability of molds toproduce mycotoxins is influenced by environmental factors, themost important being temperature and relative humidity.9
There is an increasing concern of mycotoxin contamination infoods and feeds because they can be found in a wide range ofcommodities including cereals, spices, dried fruits, appleproducts, wine, and coffee. Human exposure occurs mainlyby ingestion of mycotoxin-contaminated products and can leadto serious health problems, including immunosuppression andeven carcinogenesis.10,11 Maximum levels of mycotoxins infoodstuffs and feedstuffs have been established in manycountries.12 For instance, maximum limits for deoxynivalenolin food matrices such as processed cereal-based foods and babyfoods for infants and young children have been set at 200 μg/kg. Nevertheless, there is a lack of current legislation withregard to maximum limits of mycotoxins in bee pollen.
Bee pollen is also an adequate substrate for mycotoxingrowth when no prompt and adequate drying is performed bythe beekeeper after collection by bees.13,14 The quality of beepollen is strongly dependent on its preservation.4,7 Therefore,the water content of the product determines microbiologicaland organoleptic qualities and also its shelf life. The initialwater content of the fresh pollen is 14−18 g/100 g, and pollensshould be dried to reduce the moisture content to 6% to keeptheir nutritional value for a long time.9,15,16
Pollen can be infected by different toxigenic molds, whichpotentially results in the co-occurrence of several mycotoxins.Interactions between concomitantly occurring mycotoxins canbe antagonistic, additive, or synergistic.17,18 In this context,there is a clear need for fast and efficient analytical methods tosupport the feed and food industry in the management ofmycotoxin residues. Multiclass or multiresidue analyticalmethodologies are becoming the required tools to providereliable and wider knowledge about the occurrence ofmycotoxins. However, the complex sample matrix may containcomponents that can interfere with good sample analysis. Nodata for the determination of mycotoxins in bee pollen arefound in the scientific literature, with the exception of ascreening ELISA test reported for the sum of aflatoxins9 and asimultaneous chromatographic determination of ochratoxin Aand aflatoxins retained by an immunoaffinity column.19
For the determination of trichothecenes, nonfluorescentanalytes, GC has largely been the method of choice, providingsensitive and accurate results after analyte derivatization,generally based on trimethylsilylation and fluoroacylation.20
Analytical performance characteristics comparable with those ofGC methods can be achieved by application of HPLC methodswith pre- or postcolumn derivatization.21 MS/MS is a highlyreliable analyte tool and has become a routine technique in
Received: October 17, 2012Revised: February 5, 2013Accepted: February 5, 2013Published: February 5, 2013
Article
pubs.acs.org/JAFC
© 2013 American Chemical Society 1999 dx.doi.org/10.1021/jf400256f | J. Agric. Food Chem. 2013, 61, 1999−2005
food analysis with high impact on the field of mycotoxinanalysis, particularly in the development of multimycotoxinmethods. GC-QqQ-MS/MS detection remains a powerfultechnique for the quantitative determination of lower levelsof mycotoxins in complex matrices even in the era of liquidchromatography−tandem mass spectrometry.22,23
In this study a multiresidue method for the determination ofeight trichothecenes, including type A and type B (deoxy-nivalenol, 3-acetyldeoxynivalenol, fusarenon-X, diacetoxyscirpe-nol, nivalenol, neosolaniol, HT-2, and T-2), in bee pollen usingGC-MS/MS was performed. Mycotoxins were extracted frompollen samples using a QuEChERS-based extraction procedurecarefully optimized for this food matrix. The method was in-house validated and applied to 15 bee pollen samplescommercialized in Spain to evaluate the occurrence of thestudied mycotoxins.
■ MATERIALS AND METHODSChemical and Reagents. Solvents (acetonitrile, hexane, and
methanol) were purchased from Merck KGaA (Darmstadt, Germany).Anhydrous magnesium sulfate (MgSO4) was obtained from Alfa AesarGmbH & Co. (Karlsruhe, Germany); sodium chloride was purchasedfrom Merck, and C18-E (50 μm, 65 A) was purchased fromPhenomenex (Torrance, CA, USA). Bondesil primary−secondaryamine (PSA) was acquired from Analisis Vınicos (Tomelloso, Spain).The derivatization reagent composed of BSA (N,O-bis-
(trimethylsilyl)acetamide) + trimethylchlorosilane (TMCS) + N-trimethylsilyimidazole (TMSI) (3:2:3) was purchased from Supelco(Bellefonte, PA, USA). Sodium dihydrogen phosphate and disodiumhydrogen phosphate, used to prepare phosphate buffer, were acquiredfrom Panreac Quimica S.L.U. (Barcelona, Spain).Standards of the type A and type B trichothecenes, deoxynivalenol
(1), 3-acetyldeoxynivalenol (2), fusarenon-X (3), diacetoxyscirpenol(4), nivalenol (5), neosolaniol (6), HT-2 (7), and T-2 (8) (Figure 1),were obtained from Sigma-Aldrich (St. Louis, MO, USA). All stocksolutions were prepared by dissolving 1.00 mg of the mycotoxin in1.00 mL of pure methanol, obtaining a 1 mg/mL solution. The stocksolutions were diluted with acetonitrile to obtain the appropriatemulticompound working standard solutions (50 mg/L). All standardswere kept at −20 °C.
GC-QqQ-MS/MS Conditions. One microliter of the extract ofmycotoxins was injected in splitless mode at 250 °C in programmabletemperature vaporization (PTV) using an Agilent 7890A GC systemcoupled with an Agilent 7000A triple-quadrupole mass spectrometerwith an inert electron-impact ion source and an Agilent 7693autosampler (Agilent Technologies, Palo Alto, CA, USA). The massspectrometer was operated in electron impact ionization (EI, 70 eV).The transfer line and source temperatures were 280 and 230 °C,respectively. The collision gas for MS/MS experiments was nitrogen,and helium was used as carrier gas at fixed pressure of 20.3 psi, both at99.999% purity supplied by Carburos Metalicos S.L. (Barcelona,Spain). Data were acquired and processed using Agilent MassHunterversion B.04.00 software.
Analytes were separated on an HP-5MS 30 m × 0.25 mm × 0.25μm capillary column. The oven temperature program was initially 80°C for 2 min, and the temperature was increased to 245 °C at 80 °C/min. After a 5 min hold time, the temperature was increased to 250 °Cat 5 °C/min and finally to 270 °C at 10 °C/min and then held for 3min.
Sampling. A total of 15 pollen samples (100 g) were randomlypurchased in supermarkets located in the Valencia metropolitan area(Spain). All samples were homogenized using a laboratory mill andstored in a dark and a dry place in specific plastic food containers andanalyzed within 3 days of sampling.
Sample Preparation. Extraction and Cleanup. Five grams ofmilled bee pollen sample, weighed into a 50 mL centrifuge tube, wasmixed with 10 mL of distilled water and sonicated for 15 min. Toinduce phase separation and mycotoxin partitioning, 7.5 mL ofacetonitrile, 4 g of MgSO4, and 1 g of NaCl were added to the tube,which was vortexed and centrifuged for 10 min at 4000 rpm. Then theupper layer was submitted to a dispersive solid phase extraction (d-SPE) with a mixture of 900 mg of MgSO4, 300 mg of C18, and 300 mgof PSA. The tube was vortexed for 30 s and centrifuged for 10 min at4000 rpm. The extract (2 mL) was then evaporated to dryness undernitrogen flow for derivatization.
Derivatization. The dry extract was treated with 50 μL of BSA +TMCS + TMSI (3:2:3), and the sample was left for 30 min at roomtemperature. The derivatized sample was diluted to 250 μL withhexane and mixed thoroughly on a vortex for 30 s. Then the hexanewas washed with 1 mL of phosphate buffer (60 mM, pH 7) and mixeduntil the upper layer was clear. Finally, the hexane layer was transferredto an autosampler vial for the chromatographic analysis.
Figure 1. Structures of the trichothecenes studied.
Journal of Agricultural and Food Chemistry Article
dx.doi.org/10.1021/jf400256f | J. Agric. Food Chem. 2013, 61, 1999−20052000
Method Validation. The developed method was validated followingthe SANCO 12495/2011 document.24 Linearity was first evaluated bya triplicate of standard calibration curves at seven concentration levels(5, 20, 80, 150, 500, 750, and 1000 μg/kg). Matrix-matched calibrationcurves were built by spiking blank sample extracts with selectedmycotoxins at the same concentration levels as the standard calibrationcurves. The accuracy was verified by measuring the recoveries fromspiked blank samples at three concentration levels (20, 80, and 1000μg/kg), six replicates at each fortification level.Precision (expressed as %RSD) of the method was determined by
repeatability (intraday precision) and reproducibility (interdayprecision). Intraday variation was evaluated in six determinations perconcentration in a single day, whereas interday variation was tested onsix different working days within 20 days. Sensitivity was evaluated byLOD and LOQ values. LOD was determined as the analyteconcentration that produced a peak signal of 3 times the background
noise from the chromatogram regarding SRM2, confirmationtransition. LOQ was determined as the analyte concentration thatproduced a peak signal of 10 times the background noise from thechromatogram regarding SRM1, quantitation transition. Matrix effectis used to describe the analyte ionization efficiency. Recovery describesthe efficiency of separating analyte from the sample. Process efficiency(PE) summarizes the efficiency of sample preparation (recovery) andanalyte ionization (matrix effect). Therefore, process efficiency issuitable for assessing the overall performance of an analysis method.To assess PE the peak areas of pre-extraction addition extracts (A)with peak areas of calibration solutions prepared in solvent (B) werecompared. Thus, the ratio (A/B × 100) was defined as the PE (%) asdescribed Kruve et al.25
Two MS/MS transitions were acquired for each mycotoxin, givingfour identification points with a defined SRM transitions ratio for thedeveloped method as indicated in the requirements for mass
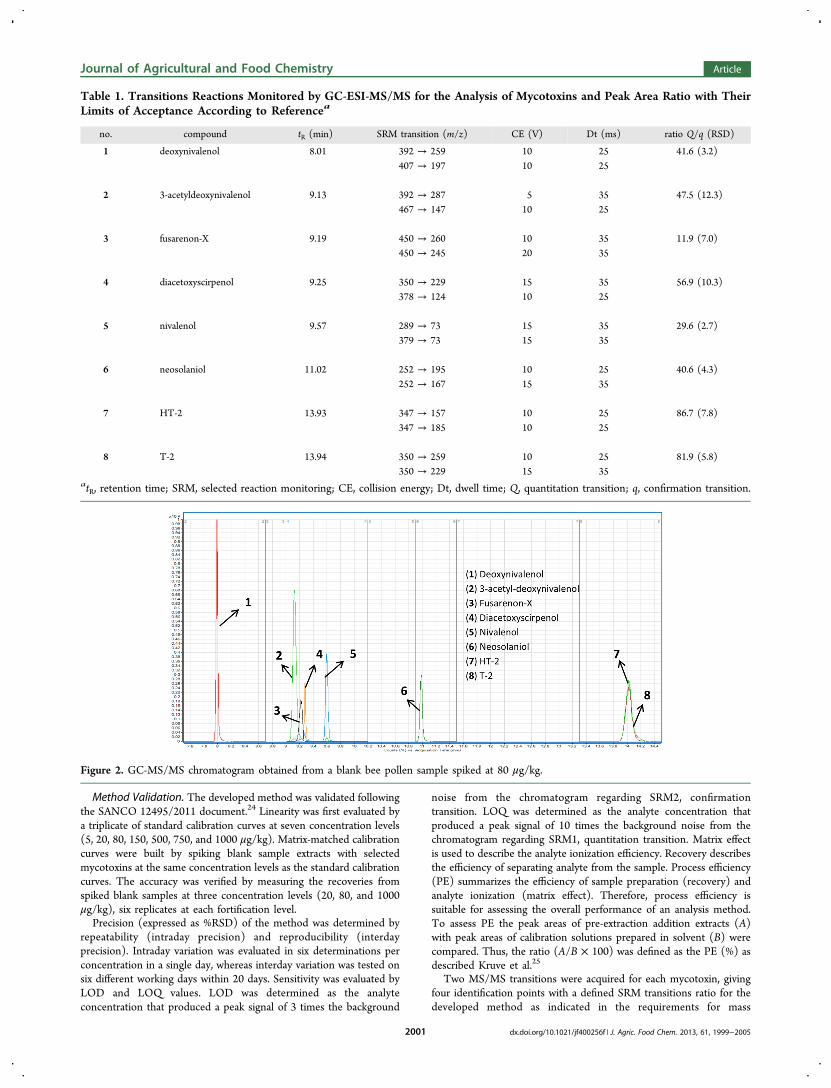
Table 1. Transitions Reactions Monitored by GC-ESI-MS/MS for the Analysis of Mycotoxins and Peak Area Ratio with TheirLimits of Acceptance According to Referencea
no. compound tR (min) SRM transition (m/z) CE (V) Dt (ms) ratio Q/q (RSD)
1 deoxynivalenol 8.01 392 → 259 10 25 41.6 (3.2)407 → 197 10 25
2 3-acetyldeoxynivalenol 9.13 392 → 287 5 35 47.5 (12.3)467 → 147 10 25
3 fusarenon-X 9.19 450 → 260 10 35 11.9 (7.0)450 → 245 20 35
4 diacetoxyscirpenol 9.25 350 → 229 15 35 56.9 (10.3)378 → 124 10 25
5 nivalenol 9.57 289 → 73 15 35 29.6 (2.7)379 → 73 15 35
6 neosolaniol 11.02 252 → 195 10 25 40.6 (4.3)252 → 167 15 35
7 HT-2 13.93 347 → 157 10 25 86.7 (7.8)347 → 185 10 25
8 T-2 13.94 350 → 259 10 25 81.9 (5.8)350 → 229 15 35
atR, retention time; SRM, selected reaction monitoring; CE, collision energy; Dt, dwell time; Q, quantitation transition; q, confirmation transition.
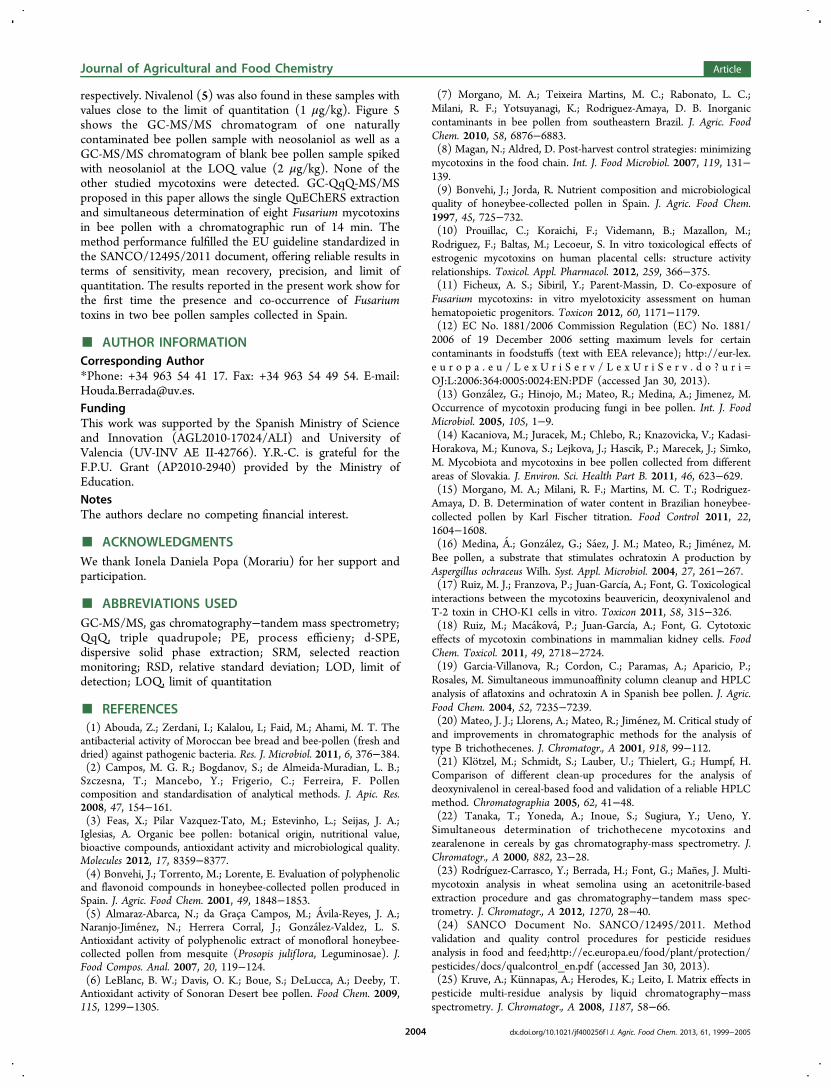
Figure 2. GC-MS/MS chromatogram obtained from a blank bee pollen sample spiked at 80 μg/kg.
Journal of Agricultural and Food Chemistry Article
dx.doi.org/10.1021/jf400256f | J. Agric. Food Chem. 2013, 61, 1999−20052001

spectrometry.24,26 The most abundant SRM transition was used forquntitation (Q) and the second one for confirmation (q). In addition,the intensities ratio of the different transitions monitored was used as aconfirmatory parameter. The ion ratio was calculated as the quotientbetween Q/q areas. Relevant MS/MS data are reported in Table 1. AGC-MS/MS chromatogram obtained from a blank bee pollen samplespiked at 80 μg/kg is also provided in Figure 2.
■ RESULTS AND DISCUSSION
The extraction of the selected mycotoxins in bee pollen wascarried out according to the modified QuEChERS methodpreviously developed for the determination of severalmycotoxins in wheat semolina as a starting point.23 In thisprevious study, the effect of the pH on extraction medium, theeffect of solvent volume, and the influence of the cleanup stepwere carefully evaluated. Nonetheless, due to the complexity ofthe bee pollen as food matrix, some critical parameters such asvolume of solvent and cleanup strategy required reappraisal.Optimization of the d-SPE. QuEChERS involves mainly
acetonitrile extraction and extract purification using d-SPE.Sorbent type is an important parameter in the QuEChERSmethod. MgSO4 is employed to separate water from theorganic solvent. C18 is the most popular hydrophobic silica-based sorbent with high affinity for nonpolar compounds. Onthe other hand, PSA, originally employed in the QuEChERSanalytical methodology developed by Anasstasiades et al.,27 iscommonly used to remove sugars and fatty and organic acids aswell as some pigments. When PSA is used in combination withC18, additional lipids and sterols can be removed, offering thebest performance in terms of cleanup efficiency, removing thegreatest amount of interfering substances.28 Therefore, differentcombinations of d-SPE were tested to check the best sorbentcombinations regarding recovery results in spiked pollensamples at 80 μg/kg. Specifically, (a) 900 mg of MgSO4 +300 mg of C18, (b) 900 mg of MgSO4 + 300 mg of C18 + 150mg of activated carbon, and (c) 900 mg of MgSO4 + 300 mg ofC18 + 300 mg of PSA were employed to purify the extracts. Theselection of the sorbents was carried out according to theQuEChERS application review.29 The chromatograms of aspiked sample analyzed using MgSO4 + C18 + PSA providedbetter cleanup than the other sorbents tried. Activated carbonretained apolar compounds; however, a thin fatty acid film wasformed, leading to poor recoveries (<30%) (Figure 3). Similarresults were previously reported for pesticide and veterinarydrug extraction from honey and pollen.30 Recoveries between
40 and 80% were obtained with a single use of C18 (Figure 3).The combination of PSA and C18 provided better cleanup thansingle-use of C18. With PSA, the solution after cleanup wascolorless and transparent, whereas the color of the solutioncleaned without PSA was light yellow. Indeed, results showedthat MgSO4 in combination with PSA + C18 assured recoveries>70% for all of the mycotoxins studied (Figure 3).
Optimization of the Volume of Solvent. The mainobjective of this step was to minimize the use of solventemployedm ensuring acceptable recovery results. Threedifferent volumes were assayed (5, 7.5, and 10 mL). Statisticalanalysis (Student’s t test) of repeated measures (n = 6) wasapplied to analyze the results. No significant statisticaldifferences for a confidence interval of 95% were found interms of recovery results when 7.5 and 10 mL of acetonitrilewere employed, obtaining with both volumes tested recoveriesup to 70% in all analytes evaluated (Figure 4). However, 5 mL
of solvent was not enough to create an upper layer aftercentrifugation to be submitted to d-SPE. Finally, 7.5 mL ofacetonitrile was chosen due to its being less time-consumingwhen the subsequent extract was dried.
Analytical Performance. The linear ranges of determi-nation were from LOQ to 1000 μg/L with coefficients ofdetermination >0.990. LODs were from 0.3 to 1.2 μg/kg, andLOQs obtained were in a range from 1 to 4 μg/kg (Table 2).Matrix-matched calibration standards were used to compensatematrix effects. The recoveries obtained ranged from 78 to 95%for the 20 μg/kg spiking level, from 73 to 88% for the 80 μg/kgspiking level, and from 83 to 90% for the 1000 μg/kg spikinglevel. In all spiking levels the values of intraday precision (n =6) were <15% (Table 2), whereas those for interday precisionwere <20%. Following the EU guideline24 (recovery of 70−110%, RSD ≤ 20%), the proposed method was found to beaccurate, with satisfactory recoveries at three fortification levels.Process efficiency is the overall performance characteristic ofthe method. Percent PE values near 100% generally indicatethat both the percentage of matrix effect and the percentage ofrecovery are near 100%. Table 2 shows the PE results obtainedfor the selected mycotoxins in bee pollen samples analyzed. Forthe majority of compounds, PE values of <100% were obtained.Ion suppression may be due to matrix effects and compoundlosses during the sample preparation process. A fewcompounds showed PE > 100%, which was probably due tomatrix effects resulting in ionization enhancement.
Figure 3. Effect of different mixtures of d-SPE sorbents on cleanup offortified bee pollen samples (error bars are ± SD; n = 6) at a level of80 μg/kg of studied mycotoxins.
Figure 4. Effect of different acetonitrile volumes on extraction offortified bee pollen samples (error bars are ± SD; n = 6) at a level of80 μg/kg of studied mycotoxins.
Journal of Agricultural and Food Chemistry Article
dx.doi.org/10.1021/jf400256f | J. Agric. Food Chem. 2013, 61, 1999−20052002

Analysis of Samples. Very little literature is reportedregarding mycotoxin-producing fungi in bee pollen and theircapability to produce mycotoxins under some circumstances. Asurvey carried out by Gonzalez et al.13 highlighted theoccurrence of fungi in bee pollen and reported the isolationof Penicilium spp. Aspergillus spp., and Fusarium spp., which areproducers of ochratoxin A, aflatoxins, and trichothecenes.
Nevertheless, neither aflatoxins nor ochratoxin A was detectedin the 20 bee pollen samples analyzed by Garcia-Villanova etal.19 In the present work, 15 bee pollen samples were analyzedwith the previously described methodology. Two of 15 beepollen samples presented mycotoxin contamination. Neo-solaniol (6) was detected in both naturally contaminatedsamples at 30 ± 5 and 22 ± 3 μg/kg (mean ± SD; n = 3),
Table 2. Performance Characteristics of the Proposed Method for Determining Mycotoxins in Bee Pollena
recovery (RSD) (%)
no. mycotoxin LOD (μg/kg) LOQ (μg/kg) coefficient of determination (R2) 20 μg/kg 80 μg/kg 1000 μg/kg PE (%)
1 deoxynivalenol 0.3 1 0.998 78 (7) 86 (2) 83 (7) 682 3-acetyldeoxynivalenol 0.3 1 0.992 81 (8) 88 (11) 88 (10) 703 fusarenon-X 1.2 4 0.990 93 (11) 83 (14) 87 (13) 634 diacetoxyscirpenol 1.2 4 0.991 79 (5) 85 (1) 83 (7) 865 nivalenol 0.3 1 0.997 87 (9) 77 (4) 83 (10) 306 neosolaniol 0.7 2 0.995 87 (12) 77 (7) 90 (15) 1417 HT-2 0.3 1 0.999 95 (10) 73 (6) 87 (7) 1158 T-2 1.2 4 0.991 92 (12) 78 (1) 86 (4) 122
aPE, process efficiency.
Figure 5. GC-MS/MS chromatograms for (A) blank bee pollen sample spiked at LOQ (2 μg/kg) of neosolaniol and (B) bee pollen sample naturallycontaminated with neosolaniol at 29 μg/kg.
Journal of Agricultural and Food Chemistry Article
dx.doi.org/10.1021/jf400256f | J. Agric. Food Chem. 2013, 61, 1999−20052003
respectively. Nivalenol (5) was also found in these samples withvalues close to the limit of quantitation (1 μg/kg). Figure 5shows the GC-MS/MS chromatogram of one naturallycontaminated bee pollen sample with neosolaniol as well as aGC-MS/MS chromatogram of blank bee pollen sample spikedwith neosolaniol at the LOQ value (2 μg/kg). None of theother studied mycotoxins were detected. GC-QqQ-MS/MSproposed in this paper allows the single QuEChERS extractionand simultaneous determination of eight Fusarium mycotoxinsin bee pollen with a chromatographic run of 14 min. Themethod performance fulfilled the EU guideline standardized inthe SANCO/12495/2011 document, offering reliable results interms of sensitivity, mean recovery, precision, and limit ofquantitation. The results reported in the present work show forthe first time the presence and co-occurrence of Fusariumtoxins in two bee pollen samples collected in Spain.
■ AUTHOR INFORMATIONCorresponding Author*Phone: +34 963 54 41 17. Fax: +34 963 54 49 54. E-mail:[email protected] work was supported by the Spanish Ministry of Scienceand Innovation (AGL2010-17024/ALI) and University ofValencia (UV-INV AE II-42766). Y.R.-C. is grateful for theF.P.U. Grant (AP2010-2940) provided by the Ministry ofEducation.NotesThe authors declare no competing financial interest.
■ ACKNOWLEDGMENTSWe thank Ionela Daniela Popa (Morariu) for her support andparticipation.
■ ABBREVIATIONS USEDGC-MS/MS, gas chromatography−tandem mass spectrometry;QqQ, triple quadrupole; PE, process efficieny; d-SPE,dispersive solid phase extraction; SRM, selected reactionmonitoring; RSD, relative standard deviation; LOD, limit ofdetection; LOQ, limit of quantitation
■ REFERENCES(1) Abouda, Z.; Zerdani, I.; Kalalou, I.; Faid, M.; Ahami, M. T. Theantibacterial activity of Moroccan bee bread and bee-pollen (fresh anddried) against pathogenic bacteria. Res. J. Microbiol. 2011, 6, 376−384.(2) Campos, M. G. R.; Bogdanov, S.; de Almeida-Muradian, L. B.;Szczesna, T.; Mancebo, Y.; Frigerio, C.; Ferreira, F. Pollencomposition and standardisation of analytical methods. J. Apic. Res.2008, 47, 154−161.(3) Feas, X.; Pilar Vazquez-Tato, M.; Estevinho, L.; Seijas, J. A.;Iglesias, A. Organic bee pollen: botanical origin, nutritional value,bioactive compounds, antioxidant activity and microbiological quality.Molecules 2012, 17, 8359−8377.(4) Bonvehi, J.; Torrento, M.; Lorente, E. Evaluation of polyphenolicand flavonoid compounds in honeybee-collected pollen produced inSpain. J. Agric. Food Chem. 2001, 49, 1848−1853.(5) Almaraz-Abarca, N.; da Graca Campos, M.; Avila-Reyes, J. A.;Naranjo-Jimenez, N.; Herrera Corral, J.; Gonzalez-Valdez, L. S.Antioxidant activity of polyphenolic extract of monofloral honeybee-collected pollen from mesquite (Prosopis julif lora, Leguminosae). J.Food Compos. Anal. 2007, 20, 119−124.(6) LeBlanc, B. W.; Davis, O. K.; Boue, S.; DeLucca, A.; Deeby, T.Antioxidant activity of Sonoran Desert bee pollen. Food Chem. 2009,115, 1299−1305.
(7) Morgano, M. A.; Teixeira Martins, M. C.; Rabonato, L. C.;Milani, R. F.; Yotsuyanagi, K.; Rodriguez-Amaya, D. B. Inorganiccontaminants in bee pollen from southeastern Brazil. J. Agric. FoodChem. 2010, 58, 6876−6883.(8) Magan, N.; Aldred, D. Post-harvest control strategies: minimizingmycotoxins in the food chain. Int. J. Food Microbiol. 2007, 119, 131−139.(9) Bonvehi, J.; Jorda, R. Nutrient composition and microbiologicalquality of honeybee-collected pollen in Spain. J. Agric. Food Chem.1997, 45, 725−732.(10) Prouillac, C.; Koraichi, F.; Videmann, B.; Mazallon, M.;Rodriguez, F.; Baltas, M.; Lecoeur, S. In vitro toxicological effects ofestrogenic mycotoxins on human placental cells: structure activityrelationships. Toxicol. Appl. Pharmacol. 2012, 259, 366−375.(11) Ficheux, A. S.; Sibiril, Y.; Parent-Massin, D. Co-exposure ofFusarium mycotoxins: in vitro myelotoxicity assessment on humanhematopoietic progenitors. Toxicon 2012, 60, 1171−1179.(12) EC No. 1881/2006 Commission Regulation (EC) No. 1881/2006 of 19 December 2006 setting maximum levels for certaincontaminants in foodstuffs (text with EEA relevance); http://eur-lex.e u r o p a . e u / L e x U r i S e r v / L e x U r i S e r v . d o ? u r i =OJ:L:2006:364:0005:0024:EN:PDF (accessed Jan 30, 2013).(13) Gonzalez, G.; Hinojo, M.; Mateo, R.; Medina, A.; Jimenez, M.Occurrence of mycotoxin producing fungi in bee pollen. Int. J. FoodMicrobiol. 2005, 105, 1−9.(14) Kacaniova, M.; Juracek, M.; Chlebo, R.; Knazovicka, V.; Kadasi-Horakova, M.; Kunova, S.; Lejkova, J.; Hascik, P.; Marecek, J.; Simko,M. Mycobiota and mycotoxins in bee pollen collected from differentareas of Slovakia. J. Environ. Sci. Health Part B. 2011, 46, 623−629.(15) Morgano, M. A.; Milani, R. F.; Martins, M. C. T.; Rodriguez-Amaya, D. B. Determination of water content in Brazilian honeybee-collected pollen by Karl Fischer titration. Food Control 2011, 22,1604−1608.(16) Medina, A.; Gonzalez, G.; Saez, J. M.; Mateo, R.; Jimenez, M.Bee pollen, a substrate that stimulates ochratoxin A production byAspergillus ochraceus Wilh. Syst. Appl. Microbiol. 2004, 27, 261−267.(17) Ruiz, M. J.; Franzova, P.; Juan-García, A.; Font, G. Toxicologicalinteractions between the mycotoxins beauvericin, deoxynivalenol andT-2 toxin in CHO-K1 cells in vitro. Toxicon 2011, 58, 315−326.(18) Ruiz, M.; Macakova, P.; Juan-García, A.; Font, G. Cytotoxiceffects of mycotoxin combinations in mammalian kidney cells. FoodChem. Toxicol. 2011, 49, 2718−2724.(19) Garcia-Villanova, R.; Cordon, C.; Paramas, A.; Aparicio, P.;Rosales, M. Simultaneous immunoaffinity column cleanup and HPLCanalysis of aflatoxins and ochratoxin A in Spanish bee pollen. J. Agric.Food Chem. 2004, 52, 7235−7239.(20) Mateo, J. J.; Llorens, A.; Mateo, R.; Jimenez, M. Critical study ofand improvements in chromatographic methods for the analysis oftype B trichothecenes. J. Chromatogr., A 2001, 918, 99−112.(21) Klotzel, M.; Schmidt, S.; Lauber, U.; Thielert, G.; Humpf, H.Comparison of different clean-up procedures for the analysis ofdeoxynivalenol in cereal-based food and validation of a reliable HPLCmethod. Chromatographia 2005, 62, 41−48.(22) Tanaka, T.; Yoneda, A.; Inoue, S.; Sugiura, Y.; Ueno, Y.Simultaneous determination of trichothecene mycotoxins andzearalenone in cereals by gas chromatography-mass spectrometry. J.Chromatogr., A 2000, 882, 23−28.(23) Rodríguez-Carrasco, Y.; Berrada, H.; Font, G.; Manes, J. Multi-mycotoxin analysis in wheat semolina using an acetonitrile-basedextraction procedure and gas chromatography−tandem mass spec-trometry. J. Chromatogr., A 2012, 1270, 28−40.(24) SANCO Document No. SANCO/12495/2011. Methodvalidation and quality control procedures for pesticide residuesanalysis in food and feed;http://ec.europa.eu/food/plant/protection/pesticides/docs/qualcontrol_en.pdf (accessed Jan 30, 2013).(25) Kruve, A.; Kunnapas, A.; Herodes, K.; Leito, I. Matrix effects inpesticide multi-residue analysis by liquid chromatography−massspectrometry. J. Chromatogr., A 2008, 1187, 58−66.
Journal of Agricultural and Food Chemistry Article
dx.doi.org/10.1021/jf400256f | J. Agric. Food Chem. 2013, 61, 1999−20052004

(26) Commission Decision 2002/657/EC Commission Decision of12 August 2002 implementing Council Directive 96/23/ECconcerning the performance of analytical methods and theinterpretation of results (text with EEA relevance); http://eur-lex.e u r o p a . e u / L e x U r i S e r v / L e x U r i S e r v . d o ? u r i =OJ:L:2002:221:0008:0036:EN:PDF (accessed Jan 30, 2013).(27) Anastassiades, M.; Lehotay, S.; Stajnbaher, D.; Schenck, F. Fastand easy multiresidue method employing acetonitrile extraction/partitioning and “dispersive solid-phase extraction” for the determi-nation of pesticide residues in produce. J. AOAC Int. 2003, 86, 412−431.(28) Leandro, C. C.; Fussell, R. J.; Keely, B. J. Determination ofpriority pesticides in baby foods by gas chromatography tandemquadrupole mass spectrometry. J. Chromatogr., A 2005, 1085, 207−212.(29) Wilkowska, A.; Biziuk, M. Determination of pesticide residues infood matrices using the QuEChERS methodology. Food Chem. 2011,125, 803−812.(30) Wiest, L.; Bulete, A.; Giroud, B.; Fratta, C.; Amic, S.; Lambert,O.; Pouliquen, H.; Arnaudguilhem, C. Multi-residue analysis of 80environmental contaminants in honeys, honeybees and pollens by oneextraction procedure followed by liquid and gas chromatographycoupled with mass spectrometric detection. J. Chromatogr., A 2011,1218, 5743−5756.
Journal of Agricultural and Food Chemistry Article
dx.doi.org/10.1021/jf400256f | J. Agric. Food Chem. 2013, 61, 1999−20052005