Determination of fuel ethers in water by membrane extraction ion mobility spectrometry
6
Determination of fuel ethers in water by membrane extraction ion mobility spectrometry Sanna Holopainen n , Marjaana Nousiainen, Mika Sillanp ¨ a¨ a Lappeenranta University of Technology, Faculty of Technology, Department of Energy and Environmental Technology, Laboratory of Green Chemistry, Sammonkatu 12, 50130 Mikkeli, Finland article info Article history: Received 15 October 2012 Received in revised form 8 January 2013 Accepted 12 January 2013 Available online 21 January 2013 Keywords: Fuel oxygenates Ion mobility spectrometry Membrane extraction Pervaporation Water quality abstract Fuel oxygenates are environmentally detrimental compounds due to their rapid migration to ground- water. Fuel oxygenates have been reported to cause taste and odour problems in drinking water, and they also have long-term health effects. Feasible analytical methods are required to observe the presence of fuel oxygenates in drinking and natural water. The authors studied ion mobility spectro- metry (IMS) to determinate isomeric fuel ether oxygenates; ethyl tert-butyl ether (ETBE), diisopropyl ether (DIPE), and tert-amyl methyl ether (TAME), separated from aqueous matrices with a pervapora- tion membrane module. Methyl tert-butyl ether (MTBE) was also membrane extracted and detected with IMS. The authors demonstrated that fuel ethers (MTBE, ETBE, DIPE, and TAME) can be quantified at mg/L level with membrane extraction IMS. A membrane extraction module coupled to IMS is a time and cost effective analysis method because sampling can be performed in a single procedure and from different natural water matrices within a few minutes. Consequently, IMS combined with membrane extraction is suitable not only for waterworks and other online applications but also in the field monitoring the quality of drinking and natural water. & 2013 Elsevier B.V. All rights reserved. 1. Introduction Gaseous emissions from motor fuels can be reduced by improving fuel burning through adding 2–15% fuel oxygenates to petrol. However, fuel oxygenates can enter natural water and soil from accidental spills during transport and from leaking petrol containers. Methyl tert-butyl ether (MTBE) is the most used fuel oxygenate and has been detected in concentrations of up to 830 mg/L in groundwater near refinery sites in Germany and the USA. In surface and wastewater worldwide, fuel oxyge- nates are found in the higher level of mg/L [1,2]. Fuel oxygenates are oxygen containing compounds viz. ethers and alcohols, including MTBE, ethyl tert-butyl ether (ETBE), tert- amyl methyl ether (TAME), diisopropylether (DIPE), tert-amyl ethyl ether (TAEE), dimethyl ether (DME), methanol (MeOH), ethanol (EtOH), and tert-butanol (TBA) [2–4]. The production of fuel oxygenates in Europe was approximately 6 million tons in 2009 [5]. The United States produced 12 billion litres of MTBE alone in 1998, though production has declined since 2000 [2,3]. The use of MTBE was banned in the USA in 2006 [3]. Alternative fuel ether oxygenates are replacing MTBE because it has been found to be mutagenic to animals [6]. Nevertheless, the Interna- tional Agency for Research on Cancer (IARC) has categorized MTBE in Group 3 (‘‘not classifiable as to its carcinogenicity to humans’’) [7]. ETBE has received increased interest as an alter- native due to its potential as a biofuel component, although the preliminary results of its environmental impact are similar to those of MTBE [1]. Fuel ethers have adversely affected the quality of the environ- ment, mainly because of their physico-chemical properties (Table 1). For example, they have higher water solubilities and lower octanol–water partition coefficients in comparison to the other major organic compounds in petrol [2]. Fuel ethers have low Henry’s law constants, and thus a relatively low tendency to volatilize from water. Fuel ethers migrate readily to groundwater because of their low sorption to soil, and in water, they are relatively resistant to biodegradation [1]. Contents lists available at SciVerse ScienceDirect journal homepage: www.elsevier.com/locate/talanta Talanta 0039-9140/$ - see front matter & 2013 Elsevier B.V. All rights reserved. http://dx.doi.org/10.1016/j.talanta.2013.01.026 Abbreviations: ASTM, American Society for Testing and Materials; BTEX, Benzene, toluene, ethyl benzene, xylene; CD, Corona discharge; CSIA, Compound- specific isotope analysis; DIPE, Diisopropyl ether; DME, Dimethyl ether; 2,6-DtBP, 2, 6-Di-tert-butyl pyridine; ETBE, Ethyl tert-butyl ether; EU, European Union; FID, Flame ionisation detector; FT-IR, Fourier-transform infrared spectroscopy; GC, Gas chromatography; IARC, International Agency for Research on Cancer; IMS, Ion mobility spectrometer; LOD, Limit of detection; LOQ, Limit of quantification; MCC, Multicapillary column; MS, Mass spectrometry; MTBE, Methyl tert-butyl ether; PCE, Tetrachloroethylene; PDMS, Polydimethylsiloxane; PID, Photoionisation detector; SBSE, Stir-bar sorptive extraction; SPME, Solid phase microextraction; TAEE, tert-amyl ethyl ether; TAME, tert-amyl methyl ether; TBA, tert-butanol; TCE, Trichloroethylene; (US) EPA, (United States) Environmental Protection Agency; WHO, World Health Organization n Corresponding author. Tel.: þ35 8406 8297 70. E-mail address: sanna.holopainen@lut.fi (S. Holopainen). Talanta 106 (2013) 448–453
Transcript of Determination of fuel ethers in water by membrane extraction ion mobility spectrometry

Talanta 106 (2013) 448–453
Contents lists available at SciVerse ScienceDirect
Talanta
0039-91
http://d
Abbre
Benzene
specific
2, 6-Di-
Flame i
Gas chr
mobility
Multica
PCE, Te
detecto
TAEE, te
Trichlor
WHO, Wn Corr
E-m
journal homepage: www.elsevier.com/locate/talanta
Determination of fuel ethers in water by membrane extraction ionmobility spectrometry
Sanna Holopainen n, Marjaana Nousiainen, Mika Sillanpaa
Lappeenranta University of Technology, Faculty of Technology, Department of Energy and Environmental Technology, Laboratory of Green Chemistry,
Sammonkatu 12, 50130 Mikkeli, Finland
a r t i c l e i n f o
Article history:
Received 15 October 2012
Received in revised form
8 January 2013
Accepted 12 January 2013Available online 21 January 2013
Keywords:
Fuel oxygenates
Ion mobility spectrometry
Membrane extraction
Pervaporation
Water quality
40/$ - see front matter & 2013 Elsevier B.V. A
x.doi.org/10.1016/j.talanta.2013.01.026
viations: ASTM, American Society for Testing
, toluene, ethyl benzene, xylene; CD, Corona
isotope analysis; DIPE, Diisopropyl ether; DM
tert-butyl pyridine; ETBE, Ethyl tert-butyl eth
onisation detector; FT-IR, Fourier-transform i
omatography; IARC, International Agency for
spectrometer; LOD, Limit of detection; LOQ,
pillary column; MS, Mass spectrometry; MTB
trachloroethylene; PDMS, Polydimethylsiloxa
r; SBSE, Stir-bar sorptive extraction; SPME, So
rt-amyl ethyl ether; TAME, tert-amyl methyl
oethylene; (US) EPA, (United States) Environ
orld Health Organization
esponding author. Tel.: þ35 8406 8297 70.
ail address: [email protected] (S. Holop
a b s t r a c t
Fuel oxygenates are environmentally detrimental compounds due to their rapid migration to ground-
water. Fuel oxygenates have been reported to cause taste and odour problems in drinking water, and
they also have long-term health effects. Feasible analytical methods are required to observe the
presence of fuel oxygenates in drinking and natural water. The authors studied ion mobility spectro-
metry (IMS) to determinate isomeric fuel ether oxygenates; ethyl tert-butyl ether (ETBE), diisopropyl
ether (DIPE), and tert-amyl methyl ether (TAME), separated from aqueous matrices with a pervapora-
tion membrane module. Methyl tert-butyl ether (MTBE) was also membrane extracted and detected
with IMS. The authors demonstrated that fuel ethers (MTBE, ETBE, DIPE, and TAME) can be quantified at
mg/L level with membrane extraction IMS. A membrane extraction module coupled to IMS is a time and
cost effective analysis method because sampling can be performed in a single procedure and from
different natural water matrices within a few minutes. Consequently, IMS combined with membrane
extraction is suitable not only for waterworks and other online applications but also in the field
monitoring the quality of drinking and natural water.
& 2013 Elsevier B.V. All rights reserved.
1. Introduction
Gaseous emissions from motor fuels can be reduced byimproving fuel burning through adding 2–15% fuel oxygenatesto petrol. However, fuel oxygenates can enter natural water andsoil from accidental spills during transport and from leakingpetrol containers. Methyl tert-butyl ether (MTBE) is the mostused fuel oxygenate and has been detected in concentrations ofup to 830 mg/L in groundwater near refinery sites in Germanyand the USA. In surface and wastewater worldwide, fuel oxyge-nates are found in the higher level of mg/L [1,2].
ll rights reserved.
and Materials; BTEX,
discharge; CSIA, Compound-
E, Dimethyl ether; 2,6-DtBP,
er; EU, European Union; FID,
nfrared spectroscopy; GC,
Research on Cancer; IMS, Ion
Limit of quantification; MCC,
E, Methyl tert-butyl ether;
ne; PID, Photoionisation
lid phase microextraction;
ether; TBA, tert-butanol; TCE,
mental Protection Agency;
ainen).
Fuel oxygenates are oxygen containing compounds viz. ethersand alcohols, including MTBE, ethyl tert-butyl ether (ETBE), tert-amyl methyl ether (TAME), diisopropylether (DIPE), tert-amylethyl ether (TAEE), dimethyl ether (DME), methanol (MeOH),ethanol (EtOH), and tert-butanol (TBA) [2–4]. The production offuel oxygenates in Europe was approximately 6 million tons in2009 [5]. The United States produced 12 billion litres of MTBEalone in 1998, though production has declined since 2000 [2,3].The use of MTBE was banned in the USA in 2006 [3]. Alternativefuel ether oxygenates are replacing MTBE because it has beenfound to be mutagenic to animals [6]. Nevertheless, the Interna-tional Agency for Research on Cancer (IARC) has categorizedMTBE in Group 3 (‘‘not classifiable as to its carcinogenicity tohumans’’) [7]. ETBE has received increased interest as an alter-native due to its potential as a biofuel component, although thepreliminary results of its environmental impact are similar tothose of MTBE [1].
Fuel ethers have adversely affected the quality of the environ-ment, mainly because of their physico-chemical properties(Table 1). For example, they have higher water solubilities andlower octanol–water partition coefficients in comparison to theother major organic compounds in petrol [2]. Fuel ethers have lowHenry’s law constants, and thus a relatively low tendency tovolatilize from water. Fuel ethers migrate readily to groundwaterbecause of their low sorption to soil, and in water, they arerelatively resistant to biodegradation [1].
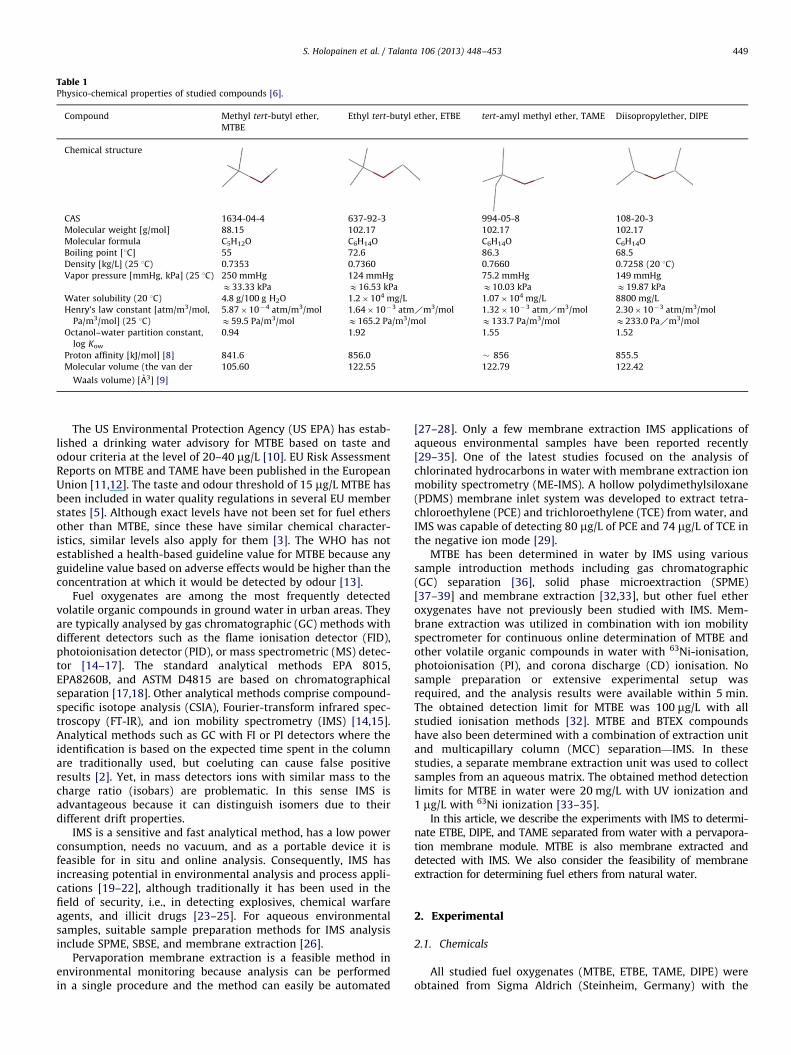
Table 1Physico-chemical properties of studied compounds [6].
Compound Methyl tert-butyl ether,
MTBE
Ethyl tert-butyl ether, ETBE tert-amyl methyl ether, TAME Diisopropylether, DIPE
Chemical structure
CAS 1634-04-4 637-92-3 994-05-8 108-20-3
Molecular weight [g/mol] 88.15 102.17 102.17 102.17
Molecular formula C5H12O C6H14O C6H14O C6H14O
Boiling point [1C] 55 72.6 86.3 68.5
Density [kg/L] (25 1C) 0.7353 0.7360 0.7660 0.7258 (20 1C)
Vapor pressure [mmHg, kPa] (25 1C) 250 mmHg 124 mmHg 75.2 mmHg 149 mmHg
E33.33 kPa E16.53 kPa E10.03 kPa E19.87 kPa
Water solubility (20 1C) 4.8 g/100 g H2O 1.2�104 mg/L 1.07�104 mg/L 8800 mg/L
Henry’s law constant [atm/m3/mol,
Pa/m3/mol] (25 1C)
5.87�10�4 atm/m3/mol
E59.5 Pa/m3/mol
1.64�10�3 atmXm3/mol
E165.2 Pa/m3/mol
1.32�10�3 atmXm3/mol
E133.7 Pa/m3/mol
2.30�10�3 atm/m3/mol
E233.0 PaXm3/mol
Octanol–water partition constant,
log Kow
0.94 1.92 1.55 1.52
Proton affinity [kJ/mol] [8] 841.6 856.0 � 856 855.5
Molecular volume (the van der
Waals volume) [A3] [9]
105.60 122.55 122.79 122.42
S. Holopainen et al. / Talanta 106 (2013) 448–453 449
The US Environmental Protection Agency (US EPA) has estab-lished a drinking water advisory for MTBE based on taste andodour criteria at the level of 20–40 mg/L [10]. EU Risk AssessmentReports on MTBE and TAME have been published in the EuropeanUnion [11,12]. The taste and odour threshold of 15 mg/L MTBE hasbeen included in water quality regulations in several EU memberstates [5]. Although exact levels have not been set for fuel ethersother than MTBE, since these have similar chemical character-istics, similar levels also apply for them [3]. The WHO has notestablished a health-based guideline value for MTBE because anyguideline value based on adverse effects would be higher than theconcentration at which it would be detected by odour [13].
Fuel oxygenates are among the most frequently detectedvolatile organic compounds in ground water in urban areas. Theyare typically analysed by gas chromatographic (GC) methods withdifferent detectors such as the flame ionisation detector (FID),photoionisation detector (PID), or mass spectrometric (MS) detec-tor [14–17]. The standard analytical methods EPA 8015,EPA8260B, and ASTM D4815 are based on chromatographicalseparation [17,18]. Other analytical methods comprise compound-specific isotope analysis (CSIA), Fourier-transform infrared spec-troscopy (FT-IR), and ion mobility spectrometry (IMS) [14,15].Analytical methods such as GC with FI or PI detectors where theidentification is based on the expected time spent in the columnare traditionally used, but coeluting can cause false positiveresults [2]. Yet, in mass detectors ions with similar mass to thecharge ratio (isobars) are problematic. In this sense IMS isadvantageous because it can distinguish isomers due to theirdifferent drift properties.
IMS is a sensitive and fast analytical method, has a low powerconsumption, needs no vacuum, and as a portable device it isfeasible for in situ and online analysis. Consequently, IMS hasincreasing potential in environmental analysis and process appli-cations [19–22], although traditionally it has been used in thefield of security, i.e., in detecting explosives, chemical warfareagents, and illicit drugs [23–25]. For aqueous environmentalsamples, suitable sample preparation methods for IMS analysisinclude SPME, SBSE, and membrane extraction [26].
Pervaporation membrane extraction is a feasible method inenvironmental monitoring because analysis can be performedin a single procedure and the method can easily be automated
[27–28]. Only a few membrane extraction IMS applications ofaqueous environmental samples have been reported recently[29–35]. One of the latest studies focused on the analysis ofchlorinated hydrocarbons in water with membrane extraction ionmobility spectrometry (ME-IMS). A hollow polydimethylsiloxane(PDMS) membrane inlet system was developed to extract tetra-chloroethylene (PCE) and trichloroethylene (TCE) from water, andIMS was capable of detecting 80 mg/L of PCE and 74 mg/L of TCE inthe negative ion mode [29].
MTBE has been determined in water by IMS using varioussample introduction methods including gas chromatographic(GC) separation [36], solid phase microextraction (SPME)[37–39] and membrane extraction [32,33], but other fuel etheroxygenates have not previously been studied with IMS. Mem-brane extraction was utilized in combination with ion mobilityspectrometer for continuous online determination of MTBE andother volatile organic compounds in water with 63Ni-ionisation,photoionisation (PI), and corona discharge (CD) ionisation. Nosample preparation or extensive experimental setup wasrequired, and the analysis results were available within 5 min.The obtained detection limit for MTBE was 100 mg/L with allstudied ionisation methods [32]. MTBE and BTEX compoundshave also been determined with a combination of extraction unitand multicapillary column (MCC) separation—IMS. In thesestudies, a separate membrane extraction unit was used to collectsamples from an aqueous matrix. The obtained method detectionlimits for MTBE in water were 20 mg/L with UV ionization and1 mg/L with 63Ni ionization [33–35].
In this article, we describe the experiments with IMS to determi-nate ETBE, DIPE, and TAME separated from water with a pervapora-tion membrane module. MTBE is also membrane extracted anddetected with IMS. We also consider the feasibility of membraneextraction for determining fuel ethers from natural water.
2. Experimental
2.1. Chemicals
All studied fuel oxygenates (MTBE, ETBE, TAME, DIPE) wereobtained from Sigma Aldrich (Steinheim, Germany) with the

Fig. 1. The experimental setup for pervaporation ion mobility analysis.
S. Holopainen et al. / Talanta 106 (2013) 448–453450
highest available purity and used without extra purification. Aqueoussolutions were prepared in ultrapure water. Surface and groundwater from the Mikkeli area were also used in the determiningthe matrix effect. Surface water was filtered before use to removedisturbing organic particles. 2,6-Di-tert-butyl pyridine (2,6-DtBP)(497%, purchased from Sigma-Aldrich, Steinheim, Germany) wasused as a calibration reference in ion mobility calculations.
2.2. Membrane module
The measurement setup is presented in Fig. 1. The PermSelect2500 pervaporation membrane module used was purchased fromMedArray Inc. (Ann Arbor, MI, USA). The membrane moduleconsisted of a bundle of polydimethylsilicone (PDMS) hollowfibres, and the module contained 3200 fibres with a totalmembrane area of 2500 cm2. The inner diameter of PDMS fibrewas 190 mm with a fibre wall thickness of 55 mm. Before use, themodule was conditioned in an oven (heated at 80 1C for severalhours) and flushed with pressured air. The purity of the mem-brane was checked with IMS before measurements. In this studythe PermSelect 2500 module was used in tube side configuration,i.e., liquid flowed inside the hollow fibres. Feed flow was circu-lated with a Watson Marlow (Wilmington, MA, USA) peristalticpump Sci-Q 323 and the pump speed was set to 90 1/min. Thesample concentrations used were 50–5000 mg/L, and the samplevolume was 70 mL. All studies were performed at room tempera-ture (20 1C). Permeated analytes were subjected to an IMSdetector with air as a sweep gas at the speed of 190 mL/min.The air was dried with molecular sieves before use, and air flowwas controlled by mass flow controllers (Bronkhorst, High-TechBV, Ruurlo, The Netherlands). Sample spectra were collected after5 min of sample/membrane stabilization.
2.3. Membrane calculations
Flux through a membrane can be expressed by Fick’s first law:
J¼�Ddc
dx, ð1Þ
where J is the rate transfer (or flux) (g cm�2 s�1), D is the diffusioncoefficient (cm2/s) and dc/dx is the concentration gradient [28].
According to solution-diffusion theory permeation flux canalso be defined experimentally:
J¼Q
ADt, ð2Þ
where J is the permeation flux of a species through the mem-brane, Q is the quantity of permeate (in grams or moles) collectedin a time interval Dt, and A is the effective membrane area [40].
The separation capability of a pervaporation membrane ismeasured by the separation factor, a, defined as:
a¼xp,i=xp,j
xf ,i=xf ,j, ð3Þ
where xp,i and xp,j are the mole fractions of the permeants i and j
in the permeate, and xf,i and xf,j are the corresponding molefractions in the feed [27].
The separation factor can also be expressed in terms of fluxes:
a¼Jixf ,j
Jjxf ,i, ð4Þ
where Ji and Jj are the fluxes of the preferential and secondarycomponents [27].
2.4. Ion mobility spectrometry
Ion mobility spectrometry is based on determining the gener-ated ions’ drift mobilities in an electric field at atmosphericpressure. Analyte molecules are transported with carrier gas tothe ionization region of the detector where they undergo chemi-cal ionization. In positive mode, IMS reactant ions are hydratedhydronium ions Hþ(H2O)n. Product ions, monomer (MHþ(H2O)x)and dimer (M2Hþ(H2O)y) ions are formed through ion-moleculereactions with reactant ions. The intensity of formed product ionsis concentration dependent, and the generated ions are separatedin the electric field according to their size, shape and electricalproperties. Ions are identified according to their drift velocities,i.e., average velocities of the ion species. Because ion separationoccurs in milliseconds, the total analysis time for one sample canbe a few minutes, including sampling, data acquisition, andrecognition of the analyte.
The IMS detector used in this study was a Ni-IMS (G.A.S.GmbH, Dortmund, Germany) with an a-ionization source (63Ni).The Ni-IMS detector operates with unidirectional gas flows, usingnitrogen (99.999%) as a drift gas and filtered dry air as a carriergas. Gas flows were controlled with mass flow controllers (Bron-khorst, High-Tech BV, Ruurlo, The Netherlands). The detector wasoperated at 60 1C with 3.5 kV of drift voltage. The positive modespectra were collected in a drift time range from 3 to 23 ms with ashutter grid open at 120 ms, and with a 50 Hz sampling frequency.Ion signals were processed with digital averaging (128 scans perspectrum). The instrument�s operation and data acquisition werecontrolled by GASpector software (version 3.99.035 DSP).
2.5. Data processing and calculations
The mobilities, K, of analyte ions can be calculated withformula (5) [23,41,42]:
K ¼vd
E¼
ldE� tdðcorr:Þ
, ð5Þ
where vd is the average velocity of ions in the drift section, ld isthe drift length, E is the electric field intensity, and td (corr.) is thecorrected drift time. In our experiments, ld¼6 cm, E¼313.4 V/cm,and td (corr.)¼td�0.5 Dtshutter [43], where td is the observed drifttime in milliseconds. Mobilities are usually normalized to 273 Kand 760 Torr and reported as reduced mobilities, K0:
K0 ¼ K273
T
p
760, ð6Þ
where K0 is reduced mobility [cm2 V�1 s�1], T is operatingtemperature [K], and p is pressure in Torr [41,42]. The reduced

Fig. 2. The mass mobility comparison of studied fuel ethers.
S. Holopainen et al. / Talanta 106 (2013) 448–453 451
mobility values can also be determined using 2,6-Di-tert-butylpyridine (2,6-DtBP) as a standard reference compound:
K0 ¼K0ðrefÞ
KðrefÞK , ð7Þ
where K is the measured mobility, K0 (ref) is the known reducedmobility value of 2,6-DtBP (1.42 cm2 V�1 s�1), and K (ref) is theexperimental reduced mobility value for 2,6-DtBP [44,45].
Data for quantitative evaluation processed for the reactant ion,monomer, and dimer ions of each compound. Integration wasdone using a laboratory made Integrator01- programme thatallows the calculation of peak integrals from drift time spectrum[46]. The obtained peak information was further processed andanalysed with Microsoft Excel. The results are the averages ofquadruple experiments in each concentration. Limits of detectionwere calculated from the linear range of calibration curve byformula:
½Ci�D ¼3sS
, ð8Þ
where [Ci]D is minimum detectable concentration, s is the rootmean square noise (i.e., the noise above the background spec-trum), and S is sensitivity [nA/ppm]. Furthermore, S¼R/Ci where R
is response [nA], and Ci is the concentration at which detectionlimit is determined [47,48].
Recoveries of analyte extraction from different water matricescan be calculated by the formula:
RA %ð Þ ¼QAðyieldÞ
QAðorig:Þ� 100, ð9Þ
where RA is recovery (%), QA (orig.) is the known original and QA
(yield) is the recovery quantity of the analyte A [48,49].
Fig. 3. Concentration dependence of TAME signals extracted with PermSelectmembrane.
Table 2Validation results (N¼4).
R2 Sensitivity
[signal/ppb]
Repeatability [%] LOD
[mg/L]
LOQ
[mg/L]
MTBE 0.9576 0.0006 10.6 33 109
ETBE 0.9622 0.0009 8.9 24 79
TAME 0.9940 0.0004 16.7 44 145
DIPE 0.9909 0.0004 23.3 44 148
Fig. 4. Concentration dependence of MTBE signals.
3. Results and discussion
Membrane module purity was confirmed before the measure-ments. For qualitative measurements, each of the studied fuelethers was measured separately, and the results are the averagesof quadruple experiments. The reactant ion peak was observed atK0¼2.0170.02 cm2V�1 s�1, MTBE monomer K0¼1.7870.02cm2V�1 s�1 and MTBE dimer 1.4970.02 cm2 V�1 s�1. Thereduced mobilities of DIPE, ETBE, and TAME monomer ions wereK0¼1.7370.02, 1.7270.02, 1.7070.02 cm2V�1 s�1, and fordimer ions K0¼1.4270.02, 1.4170.02, 1.3970.02 cm2V�1 s�1,respectively. The reduced mobility values of these structuralisomers are different due to their different collision cross sections[23], and thus molecular volumes. Because the (reduced) mobi-lities are inversely proportional to the molecular sizes, DIPE as asymmetric molecule is the fastest isomer, and it also has thesmallest van der Waals volume. In contrast, TAME has the largestside chains and the biggest molecular volume of these isomers,and thus the slowest mobility. The mass mobility comparison ofthe studied fuel ethers is presented in Fig. 2. Although reducedmobilities of structural isomers overlap slightly, the selectivity ofmixture analysis could be enhanced by additional chromato-graphic separation, for example with GC-IMS combination.
To obtain quantitative information, i.e., the calibration curvesof fuel ethers, each compound was measured separately fourtimes within a concentration range from 0 to 5000 mg/L. Theresults were averaged from these quadruple measurements. Thecalibration curves for TAME, MTBE, ETBE and DIPE are presentedin the Figs. 3–6. As an example, the calibration curve for TAME ispresented in Fig. 3. Because the linearity range of IMS is known tobe relatively short [23], only part of the obtained exponentialcalibration curves were used to determine LODs. Data collected inthe range of 0–250 mg/L for each of the studied ethers in water
was fitted. The resulting minimum detectable concentrations(LOD), minimum quantifiable concentrations (limit of quantifica-tion, LOQ¼10�s/S), and other validation parameters are pre-sented in Table 2. All validation parameters have been calculated

Fig. 5. Concentration dependence of ETBE signals.
Fig. 6. Concentration dependence of DIPE signals.
Fig. 7. Matrix effect for membrane module studied with MTBE.
S. Holopainen et al. / Talanta 106 (2013) 448–453452
for each analyte at a concentration of 250 mg/L. Repeatabilities ofeach ether measurement were calculated from the average ofquadruple measurements and sensitivities were determined atthe first derivative of the calibration curve.
For all studied chemicals, reactant ions and monomer ionswere the most abundant ions at low concentrations, but for MTBEand TAME, the formation of proton bound dimer ions wasfavourable at higher concentrations. Yet DIPE and ETBE did notform abundant dimer ions even at the highest studied concentra-tions. The observed trend of dimer formation, MTBE4TAME4ETBE4DIPE, cannot be explained by the differences inproton affinity values or molecule sizes. Instead it is probable thatformation of proton bound dimer is not so favourable for DIPE andETBE because the location of the oxygen atom, a hydrogen bondacceptor, is more sterically hindered between carbon side chainsin DIPE and ETBE molecules than in MTBE and TAME. Thus, theformed DIPE and ETBE dimer ions were less stable and the rateconstants for dimer ion formation are lower.
The observed reduced mobilities (K0¼1.7870.02 cm2 V�1 s�1,1.4970.02 cm2 V�1 s�1) for MTBE are comparable to those in earlierstudies. For instance, reduced mobilities values for MTBE 1.8270.01 cm2 V�1 s�1 and 1.4970.01 cm2 V�1 s�1 [32], and 1.6970.03cm2 V�1 s�1 and 1.4270.03 cm2 V�1 s�1 [33] have been obtainedwith 63Ni ionization IMS. In our current study, the obtained LOD forMTBE (33 mg/L) is within the drinking water guideline values advisedby the US EPA (20–40 mg/L), and the obtained LODs for other fuelethers (24–44 mg/L) are at the same level. Limits of detection are alsoat the same level as earlier results obtained with membrane extrac-tion IMS. For instance, Borsdorf et al. obtained a LOD for MTBE100 mg/L in water both with 63Ni and corona discharge ionisation
with dimethylsilicone membrane inlet IMS configuration [32]. Baum-bach et al. have detected 20 mg/L of MTBE in water with UVionization and 1 mg/L with 63Ni ionization coupled to multicapillarycolumn IMS. A membrane extraction unit made from silicon tubingwas utilized in the study [33].
The parameters optimized in our membrane extraction studieswere feed concentration and feed pressure. Selectivity of mem-brane extraction, i.e., separation factors, were calculated at theanalyte concentration of 500 mg/L in water with Formula (4), andthe results for MTBE, ETBE, TAME and DIPE are 4.0, 6.6, 3.9,7.2 g cm�2s�1, respectively. The extraction strength orderDIPE4ETBE4TAME correlates with vapour pressures andHenry’s law constants of isomeric ethers. Analyte structure couldalso affect solubility to PDMS material: DIPE as the most linearmolecule has the greatest solubility to PDMS and TAME as themost bulky molecule passes most slowly through membranematerial. To obtain better results and optimize membrane extrac-tion procedure one could also consider the possibility of increas-ing the flow rate and heating the membrane module to enhancethe permeation of analytes [27]. Membrane performance couldalso be enhanced by adding heated sweep gas to supply theevaporation enthalpy on the permeate side and by adding acondenser on the permeate side [50,51].
The matrix effect for membrane extraction was studied forMTBE concentrations of 0–5000 mg/L in tab, surface, and groundwaters collected in the Mikkeli area (Fig. 7). Reactant ion peakresponses have been excluded from this figure for sake of clarity.The biggest organic particles were filtered from surface waterbefore use. Tab water and ground water were used neat, althoughthe ground water sample was muddy looking and obviouslycontained some clayish minerals. Some differences were observeddue to these impurities which could affect membrane perfor-mance and/or IMS response during the measurement. MTBE gavea lower response for dimer ion in ground water matrix than insurface or tab water, which could be caused by the absorptioneffect of clay minerals. Recoveries from different matrices werecalculated also for monomer ions with Formula (9) at a concen-tration of 2500 mg/L. Results for MTBE were 90% from surfacewater and 95% from ground water.
4. Conclusions
Ion mobility spectrometry is a fast and sensitive analyticalmethod suitable for evaluating the quality of drinking waterwhen combined with appropriate sample extraction methods.IMS is also feasible to monitor the safety of online processes. Forthe first time we have shown that fuel ether oxygenates otherthan MTBE can be quantified at mg/L level from aqueous matrices

S. Holopainen et al. / Talanta 106 (2013) 448–453 453
with the combination of pervaporation membrane module andion mobility spectrometry. For MTBE, the obtained limits ofdetection were within the drinking water guideline valuesadvised by the US EPA (20–40 mg/L), and for other studied fuelethers the LODs were at the same level. Furthermore, a PDMSmembrane module was able to extract fuel ethers in the selectiv-ity order DIPE4ETBE4MTBE4TAME, due to ether solubilities inthe membrane material. The pervaporation membrane extractionmodule coupled to IMS was a time and cost effective analysismethod because sampling could be performed in a single proce-dure and from different natural water matrices within a fewminutes. Consequently, IMS combined with a membrane extrac-tion is suitable not only for waterworks and other online applica-tions in water but also to monitor the quality of drinking andnatural water in the field.
Acknowledgements
This work was financially supported by the Academy of Finland(Decision No. 218692) and Tekes—the Finnish Funding Agency forTechnology and Innovation. Authors also thank Mr. Tatu Hiltunenfor his technical assistance and Dr. Kate Sotejeff-Wilson for languagerevision.
References
[1] M. Rosell, S. Lacorte, D. Barcelo, in: D. Barcelo (Ed.), Fuel Oxygenates,Springer, Berlin, Heidelberg, Germany, 2007, pp. 31–55.
[2] U.S. Environmental Protection Agency (US EPA), Oxygenates in Water:Critical Information and Research Needs, Washington, USA, 1998.
[3] D. Barcelo, Fuel Oxygenates, Springer, Berlin, Heidelberg, Germany, 2007.[4] R.A. Deeb, K. Chu, T. Shih, S. Linder, I. Suffet, M.C. Kavanaugh, L. Alvarez-
Cohen, Environ. Eng. Sci. 20 (2003) 433–447.[5] The European Fuel Oxygenates Association (EFOA), /http://www.efoa.euS.[6] United States National Library of Medicine, TOXNET, Toxicology Data
Network, Hazardous Substances Data Bank (HSDB), /http://toxnet.nlm.nih.gov/S.[7] World Health Organization International Agency for Research on Cancer,
IARC Monographs. 73 (1999).[8] E.P.L. Hunter, S.G. Lias, J. Phys. Chem. Ref. Data 27 (1998) 413–656.[9] MTBE: CSID:14672, /http://www.chemspider.com/Chemical-Structure.14672.
htmlS (accessed 13:04, Jul 30, 2012), ETBE: CSID:11996, /http://www.chemspider.com/Chemical-Structure.11996.htmlS (accessed 13:39, Jul 30, 2012), TAME:CSID:55188, /http://www.chemspider.com/Chemical-Structure.55188.htmlS(accessed 13:37, Jul 30, 2012), DIPE: CSID:7626, /http://www.chemspider.com/Chemical-Structure.7626.htmlS (accessed 13:40, Jul 30, 2012).
[10] US Environmental Protection Agency (US EPA), /http://www.epa.govS.[11] ECETOC European Center for Ecotoxicology and Toxicity of Chemicals, Risk
Assessment Report for Existing Substances Methyl tertiary-Butyl Ether,Brussels, Belgium, 2003.
[12] European Commission, European Union Risk Assessment Report 2-methoxy-2-methylbutane (TAME), European Chemicals Bureau, Luxembourg, 2006.
[13] World Health Organization (WHO), Guidelines for Drinking-water Quality,Geneva, Switzerland, 2011.
[14] M.A. Jochmann, T.C. Schmidt, in: D. Barcelo (Ed.), Fuel Oxygenates, Springer,Berlin, Heidelberg, 2007, pp. 1–30.
[15] T.C. Schmidt, H. Duong, M. Berg, S.B. Haderlein, Analyst 126 (2001) 405–413.[16] T.C. Schmidt, Trends Anal. Chem. 22 (2003) 776–784.[17] JJ. Atienza, P. Aragon, M.A. Herrero, R. Puchades, A. Maquieira, Crit. Rev. Anal.
Chem. 35 (2005) 317–337.[18] R.U. Halden, A.M. Happel, S.R. Schoen, Environ. Sci. Technol. 35 (2001)
1469–1474.[19] I. Marquez-Sillero, E. Aguilera-Herrador, S. Cardenas, M. Valcarcel, Trends
Anal. Chem. 30 (2011) 677–690.[20] S. Armenta, M. Alcala, M. Blanco, Anal. Chim. Acta 703 (2011) 114–123.[21] H. Borsdorf, T. Mayer, M. Zarejousheghani, G.A. Eiceman, Appl. Spectrosc. Rev.
46 (2011) 472–521.[22] J.I. Baumbach, Anal. Bioanal. Chem. 384 (2006) 1059–1070.[23] G.A. Eiceman, Z. Karpas, Ion Mobility Spectrometry, second ed., CRC Taylor &
Francis Group, 2005.[24] M.A. Makinen, O.A. Anttalainen, M.E.T. Sillanpaa, Anal. Chem. 82 (2010)
9594–9600.[25] M. Makinen, M. Nousiainen, M. Sillanpaa, Mass Spectrom. Rev. 30 (2011)
940–973.[26] S. Holopainen, M. Nousiainen, O. Anttalainen, M.E.T. Sillanpaa, Trends Anal.
Chem. 37 (2012) 124–134.[27] B. Smitha, D. Suhanya, S. Sridhar, M. Ramakrishna, J. Membr. Sci. 241 (2004)
1–21.[28] K. Hylton, S. Mitra, J. Chromatogr., A 1152 (2007) 199–214.[29] Y. Du, W. Zhang, W. Whitten, H. Li, D.B. Watson, J. Xu, Anal. Chem. 82 (2010)
4089–4096.[30] W. Zhang, Y. Du, Z. Feng, J. Xu, J. Int., Ion Mobility Spectrom. 13 (2010) 65–71.[31] A.B. Kanu, C.L.P. Thomas, Analyst 131 (2006) 990–999.[32] H. Borsdorf, A. Rammler, J. Chromatogr., A. 1072 (2005) 45–54.[33] J.I. Baumbach, S. Sielemann, Z. Xie, H. Schmidt, Int. J. Ion Mobil. Spectrom. 75
(2003) 1483–1490.[34] S. Sielemann, Z. Xie, H. Schmidt, J.I. Baumbach, J. Int., Ion Mobility Spectrom.
4 (2001) 69–73.[35] Z. Xie, S. Sielemann, H. Schmidt, J.I. Baumbach, J. Int., Ion Mobility Spectrom.
4 (2000) 77–83.[36] F. Liang, K. Kerpen, A. Kuklya, U. Telgheder, J. Int., Ion Mobil. Spectrom.
15 (2012) 169–177.[37] M. Nousiainen, S. Holopainen, J. Puton, M. Sillanpaa, Talanta 84 (2011)
738–744.[38] N. Alizadeh, M. Jafari, A. Mohammadi, J. Hazard. Mater. 169 (2009) 861–867.[39] R. Pozzi, F. Pinelli, P. Bocchini, G.C. Galletti, Anal. Chim. Acta 504 (2004)
313–317.[40] P. Shao, R.Y.M. Huang, J. Membr. Sci. 287 (2007) 162–179.[41] H. Borsdorf, G.A. Eiceman, Appl. Spectrosc. Rev. 41 (2006) 323–375.[42] J. Stach, J.I. Baumbach, J. Int., Ion Mobility Spectrom. 5 (2002) 1–21.[43] G.E. Spangler, Anal. Chem. 65 (1993) 3010–3014.[44] A.-K. Viitanen, T. Mauriala, T. Mattila, A. Adamov, C.S. Pedersen, J.M. Makela,
M. Marjamaki, A. Sysoev, J. Keskinen, T. Kotiaho, Talanta 76 (2008) 1218–1223.[45] G.A. Eiceman, E.G. Nazarov, J.A. Stone, Anal. Chim. Acta 493 (2003) 185–194.[46] W. Dziewiecki, S. Holopainen, A. Knap, M. Nousiainen, B. Siod"owski,
M. Sillanpaa, J. Puton, Anal. Sci. 26 (2010) 983–988.[47] A.B. Kanu, H.H. Hill Jr, M.M. Gribb, R.N. Walters, J. Environ. Monit. 9 (2007)
51–60.[48] D. MacDougall, W.B. Crummett, Anal. Chem. 52 (1980) 2242–2249.[49] D.T. Burns, K. Danzer, A. Townshend, Pure Appl. Chem. 74 (2002) 2201–2205.[50] X. Feng, R.Y.M. Huang, Ind. Eng. Chem. Res. 36 (1997) 1048–1066.[51] F. Lipnizki, S. Hausmanns, P. Ten, R.W. Field, G. Laufenberg, Chem. Eng. J.
73 (1999) 113–129.