Determination of clinical and demographic predictors of laboratory-confirmed influenza with subtype...
11
RESEARCH ARTICLE Open Access Determination of clinical and demographic predictors of laboratory-confirmed influenza with subtype analysis Tabitha Woolpert 1* , Stephanie Brodine 2 , Hector Lemus 2 , Jill Waalen 3 , Patrick Blair 1 and Dennis Faix 1 Abstract Background: Rapid influenza diagnosis is important for early identification of outbreaks, effective management of high-risk contacts, appropriate antiviral use, decreased inappropriate antibiotic use and avoidance of unnecessary laboratory testing. Given the inconsistent performance of many rapid influenza tests, clinical diagnosis remains integral for optimizing influenza management. However, reliable clinical diagnostic methods are not well- established. This study assesses predictors of influenza, and its various subtypes, in a broad population at the point of care, across age groups, then evaluates the performance of clinical case definitions composed of identified predictors. Methods: Respiratory specimens and demographic and clinical data were obtained from 3- to 80-year-old US military family members presenting for care with influenza-like illness (ILI) from November 2007 to April 2008. Molecular and virus isolation techniques were used to detect and subtype influenza viruses. Associations between influenza diagnosis and demographic/clinical parameters were assessed by logistic regression, including influenza type and subtype analyses. The predictive values of multiple combinations of identified clinical predictors (case definitions), and the Centers for Disease Control and Prevention (CDC) ILI case definition, were estimated. Results: Of 789 subjects, 220 (28%) had laboratory-confirmed influenza (51 A(H1), 46 A(H3), 19 A(unsubtypeable), 67 B, 1 AB coinfection), with the proportion of influenza A to B cases highest among 6- to 17-year-olds (p = 0.019). Independent predictors of influenza included fever, cough, acute onset, body aches, and vaccination status among 6- to 49-year-olds, only vaccination among 3- to 5-year-olds, and only fever among 50- to 80-year-olds. Among 6- to 49-year-olds, some clinical case definitions were highly sensitive (100.0%) or specific (98.6%), but none had both parameters over 60%, though many performed better than the CDC ILI case definition (sensitivity 37.7%, 95% confidence interval 33.6–41.9% in total study population). Conclusions: Patterns of influenza predictors differed across age groups, with most predictors identified among 6- to 49-year-olds. No combination of clinical and demographic predictors served as a reliable diagnostic case definition in the population and influenza season studied. A standardized clinical case definition combined with a point-of-care laboratory test may be the optimal rapid diagnostic strategy available. Keywords: Influenza, Influenzavirus A, Influenzavirus B, Influenza A Virus, H1N1 Subtype, Diagnosis * Correspondence: [email protected] 1 Naval Health Research Center, 140 Sylvester Rd, San Diego, CA 92106, USA Full list of author information is available at the end of the article © 2012 Woolpert et al.; licensee BioMed Central Ltd. This is an Open Access article distributed under the terms of the Creative Commons Attribution License (http://creativecommons.org/licenses/by/2.0), which permits unrestricted use, distribution, and reproduction in any medium, provided the original work is properly cited. Woolpert et al. BMC Infectious Diseases 2012, 12:129 http://www.biomedcentral.com/1471-2334/12/129
Transcript of Determination of clinical and demographic predictors of laboratory-confirmed influenza with subtype...

Woolpert et al. BMC Infectious Diseases 2012, 12:129http://www.biomedcentral.com/1471-2334/12/129
RESEARCH ARTICLE Open Access
Determination of clinical and demographicpredictors of laboratory-confirmed influenza withsubtype analysisTabitha Woolpert1*, Stephanie Brodine2, Hector Lemus2, Jill Waalen3, Patrick Blair1 and Dennis Faix1
Abstract
Background: Rapid influenza diagnosis is important for early identification of outbreaks, effective management ofhigh-risk contacts, appropriate antiviral use, decreased inappropriate antibiotic use and avoidance of unnecessarylaboratory testing. Given the inconsistent performance of many rapid influenza tests, clinical diagnosis remainsintegral for optimizing influenza management. However, reliable clinical diagnostic methods are not well-established. This study assesses predictors of influenza, and its various subtypes, in a broad population at the pointof care, across age groups, then evaluates the performance of clinical case definitions composed of identifiedpredictors.
Methods: Respiratory specimens and demographic and clinical data were obtained from 3- to 80-year-old USmilitary family members presenting for care with influenza-like illness (ILI) from November 2007 to April 2008.Molecular and virus isolation techniques were used to detect and subtype influenza viruses. Associations betweeninfluenza diagnosis and demographic/clinical parameters were assessed by logistic regression, including influenzatype and subtype analyses. The predictive values of multiple combinations of identified clinical predictors (casedefinitions), and the Centers for Disease Control and Prevention (CDC) ILI case definition, were estimated.
Results: Of 789 subjects, 220 (28%) had laboratory-confirmed influenza (51 A(H1), 46 A(H3), 19 A(unsubtypeable),67 B, 1 AB coinfection), with the proportion of influenza A to B cases highest among 6- to 17-year-olds (p= 0.019).Independent predictors of influenza included fever, cough, acute onset, body aches, and vaccination status among6- to 49-year-olds, only vaccination among 3- to 5-year-olds, and only fever among 50- to 80-year-olds. Among6- to 49-year-olds, some clinical case definitions were highly sensitive (100.0%) or specific (98.6%), but none hadboth parameters over 60%, though many performed better than the CDC ILI case definition (sensitivity 37.7%, 95%confidence interval 33.6–41.9% in total study population).
Conclusions: Patterns of influenza predictors differed across age groups, with most predictors identified among6- to 49-year-olds. No combination of clinical and demographic predictors served as a reliable diagnostic casedefinition in the population and influenza season studied. A standardized clinical case definition combined with apoint-of-care laboratory test may be the optimal rapid diagnostic strategy available.
Keywords: Influenza, Influenzavirus A, Influenzavirus B, Influenza A Virus, H1N1 Subtype, Diagnosis
* Correspondence: [email protected] Health Research Center, 140 Sylvester Rd, San Diego, CA 92106, USAFull list of author information is available at the end of the article
© 2012 Woolpert et al.; licensee BioMed Central Ltd. This is an Open Access article distributed under the terms of the CreativeCommons Attribution License (http://creativecommons.org/licenses/by/2.0), which permits unrestricted use, distribution, andreproduction in any medium, provided the original work is properly cited.
Woolpert et al. BMC Infectious Diseases 2012, 12:129 Page 2 of 11http://www.biomedcentral.com/1471-2334/12/129
BackgroundInfluenza infections result in 3–5 million illnessesand 500,000 deaths each year worldwide [1]. The USrecords an average of 226,000 hospitalizations and36,000 deaths annually [2]. Because of high mutabil-ity, cross-species transfer, and reservoir diversity, in-fluenza is not considered eradicable [3–5]; effectiveprevention and treatment are needed to mitigate itsimpact. Prompt and accurate diagnosis facilitates earlyidentification of outbreaks, timely intervention, effectivemanagement of high-risk contacts, appropriate antimicro-bial use, and avoidance of unnecessary laboratory testing[6]. Recent experience with pandemic H1N1 influenza(pH1N1) [7,8] highlights the need to reevaluate currentdiagnostic capabilities and seasonal influenza’s clinicalpresentation.Polymerase chain reaction (PCR) assays discriminate be-
tween influenza types and subtypes and are more sensitive(83%–96%) than culture (44%–57%) [9–11]; PCR typicallyrequires up to 24 hours for results; culture can require10 days. Rapid influenza detection tests (RIDTs) are avail-able with high specificities (96%–100%) but poor sensitiv-ities (27%–69%) [12–15]. Lacking rapid assays that areconsistently sensitive, a reliable model for predicting influ-enza infection based on clinical and demographic para-meters would be valuable.Multiple studies have evaluated clinical case defini-
tions (clinical and demographic parameter combina-tions) as diagnostic tools [16–30]. Interpretation andapplication of these findings is hampered by differingmethodologies, disparate clinical settings, varying inclu-sion criteria, a wide range of influenza prevalence,multiple outcome measures, and virus evolution. Ap-proximately half of these studies found clinical modelsto predict influenza [17,18,21,23,26,27,29–31], suggest-ing the presence of fever, cough, and acute onsetmight accurately identify influenza during a local epi-demic. Few prior studies analyzed the effect of age onclinical predictors, although two studies suggested pre-dictor models are age dependent [27,30]. A 2005meta-analysis highlighted the non-standardizationproblem when it found only ten of 915 studies onsymptom-based influenza diagnosis from 1966 to 2004to meet the following criteria: (1) prospective design orrandomized trial, (2) inclusion of primary assessment ofclinical predictors of influenza, (3) use of standardlaboratory-based outcome, and (4) high study qualitybased on a previously published scheme [18]. A 2011 sys-tematic review covering a similar time frame identified 12studies meeting similar criteria; authors found fever pluscough and fever/cough/acute onset heuristics to haveareas under the receiver operating characteristic curves of0.70 and 0.79, respectively. Authors additionally observethat none of the more robust studies have conducted a
split-sample validation nor prospectively validated a clin-ical decision rule [31].We present findings that (1) identify influenza predic-
tors in different age groups, (2) assess the diagnosticvalue of clinical case definitions based on these predic-tors, and (3) compare clinical presentation across influ-enza type and subtype in a local population during oneinfluenza season.
MethodsSubjectsFrom November 2007 to May 2008 study personnelrecruited eligible clinic patients with subjective fever and/or temperature >38.0 °C and either a cough or sorethroat into an ongoing laboratory-based respiratory dis-ease surveillance study. This surveillance study was estab-lished to track rates and etiologies of respiratory diseasein the local military dependent population, as well as toprovide an infrastructure for the evaluation of novelinfluenza diagnostics. Recruitment occurred in twocommunity-based outpatient clinics and the emergencydepartment and pediatric clinic at Naval Medical CenterSan Diego, all part of the regional military treatment areaserving half a million Department of Defense (DoD) cli-ents. Eligible subjects were DoD dependents or retireesages 3–80 years who provided, or whose legal guardiansprovided, informed consent. Though non-participationrates could not be tracked precisely, and demographics ofnon-participants are not known, it is estimated thatgreater than 90% of those solicited were enrolled.
Data collectedAssociates interviewed each subject/guardian to deter-mine age, sex, presence of subjective fevers, number ofdays since symptom onset, smoking history (pack-years),vaccine history, and presence of eight symptoms duringthe current illness (see Table 1). Subject temperature(oral) was obtained from the medical record.
Specimen processingSpecimen collection and processing proceeded accordingto three schemes varying by number and type of speci-mens tested and whether they were frozen or processedfresh. This variation resulted from concomitant evalu-ation of two novel influenza diagnostics occurring in thesame population, the evaluations requiring different spe-cimen combinations. Up to two mucosal respiratory spe-cimens (throat and/or nasal swabs) were collected fortesting using Dacron swabs (Remel, Inc., MicroTestViral Transport Media [VTM] Female Kit, Reference#12550) immediately placed into the VTM. When botha nasal and throat specimen were requested, specimenswere maintained at 2–8 °C or on ice and all testing wasinitiated within 72 hours of collection. All other

Table 1 Descriptive statistics for laboratory-confirmed influenza outcomes and demographic and clinical variables
Subjects ages Subjects ages Subjects ages Subjects ages
Total study population 3–5 years 6–17 years 18–49 years 50–80 years
Variable (n=789) (n=65) (n=197) (n=326) (n=201)
Outcome variables n (%) n (%) n (%) n (%) n (%)
Influenza diagnosis
Positive 220 (27.9) 12 (18.5) 65 (33.0) 92 (28.2) 51 (25.4)
Negative 569 (72.1) 53 (81.5) 132 (67.0) 234 (71.8) 150 (74.6)
Influenza type
A 152 (69.1) 7 (58.3) 53 (81.5) 63 (68.5) 29 (56.9)
B 67 (30.5) 5 (41.7) 11 (16.9) 29 (31.5) 22 (43.1)
AB 1 (0.5) 0 (0.0) 1 (1.5) 0 (0.0) 0 (0.0)
Influenza A subtypea
H1 51 (44.0) 3 (42.9) 19 (44.2) 18 (38.3) 11 (57.9)
H3 46 (39.7) 1 (14.3) 21 (48.8) 17 (36.2) 7 (36.8)
Unsubtypeable 19 (16.4) 3 (42.9) 3 (7.0) 12 (25.5) 1 (5.3)
Continuous variables Value (error)b Value (error)b Value (error)b Value (error)b Value (error)b
Age (years) 31.2 (19.4) 4.0 (0.8) 11.5 (3.6) 32.0 (9.9) 56.8 (5.3)
Symptom duration (days) 4.0 (1–90) 4.0 (1–30) 3.0 (1–60) 5.0 (1–60) 5.0 (1–90)
Temperature (°C) 36.9 (35.6–40.3) 36.8 (35.9–39.5) 37.1 (35.6–40.3) 36.9 (35.9–39.6) 36.8 (35.6–39.3)
Smoking history (pack-years) 0.0 (0–117.5)c ––d ––d 0.0 (0–51)c 0.0 (0–117.5)
Vaccine to Onset Time (Days)e 80 (0–365) 57 (0–198) 74 (6–348) 89 (3–342) 85.4 (8–365)
Categorical variables n (%) n (%) n (%) n (%) n (%)
Enrollment site
Outpatient clinic 1 284 (36.0) 6 (9.2) 61 (31.0) 137 (42.0) 80 (39.8)
Outpatient clinic 2 203 (25.7) 15 (23.1) 55 (27.9) 63 (19.3) 70 (34.8)
Emergency room 246 (31.2) 24 (36.9) 47 (23.9) 124 (38.0) 51 (25.4)
Pediatric clinic 56 (7.1) 20 (30.8) 34 (17.3) 2 (0.6) 0 (0.0)
Sex
Female 494 (62.6) 30 (46.2) 87 (44.2) 270 (82.8) 107 (53.2)
Male 295 (37.4) 35 (53.8) 110 (55.8) 56 (17.2) 94 (46.8)
Acute onset
≤3 days 273 (34.6) 30 (46.2) 99 (50.3) 100 (30.7) 44 (21.9)
>3 days 516 (65.4) 35 (53.8) 98 (49.8) 226 (69.3) 157 (78.1)
Fever
>38.0°C 126 (16.0) 11 (16.9) 48 (24.4) 43 (13.2) 24 (11.9)
≤38.0°C 663 (84.0) 54 (83.1) 149 (75.6) 283 (86.8) 177 (88.1)
Cough
Yes 736 (93.3) 63 (96.9) 176 (89.3) 299 (91.7) 198 (98.5)
No 53 (6.7) 2 (3.1) 21 (10.7) 27 (8.3) 3 (1.5)
Sore throat
Yes 630 (79.8) 33 (50.8) 170 (86.3) 278 (85.3) 149 (74.1)
No 159 (20.2) 32 (49.2) 27 (13.7) 48 (14.7) 52 (25.9)
Shortness of breathe
Yes 346 (43.9) 20 (30.8) 73 (37.2) 166 (50.9) 87 (43.3)
No 442 (56.0) 45 (69.2) 123 (62.8) 160 (49.1) 114 (56.7)
Woolpert et al. BMC Infectious Diseases 2012, 12:129 Page 3 of 11http://www.biomedcentral.com/1471-2334/12/129

Table 1 Descriptive statistics for laboratory-confirmed influenza outcomes and demographic and clinical variables(Continued)
Nasal congestion
Yes 650 (82.4) 51 (78.5) 155 (78.7) 271 (83.1) 173 (86.1)
No 139 (17.6) 14 (21.5) 42 (21.3) 55 (16.9) 28 (13.9)
Headache
Yes 619 (78.5) 31 (47.7) 134 (68.0) 286 (87.7) 168 (83.6)
No 170 (21.5) 34 (52.3) 63 (32.8) 40 (12.3) 33 (16.4)
Conjunctivitise
Yes 44 (5.6) 6 (9.2) 4 (2.0) 16 (4.9) 18 (9.0)
No 744 (94.3) 59 (90.8) 193 (98.0) 309 (94.8) 183 (91.0)
Body achese
Yes 581 (73.6) 27 (41.5) 99 (50.2) 289 (88.7) 166 (82.6)
No 207 (26.2) 37 (56.9) 98 (49.8) 37 (11.4) 35 (17.4)
Nausea/vomiting
Yes 347 (44.0) 19 (29.2) 107 (54.3) 155 (47.5) 66 (32.8)
No 442 (56.0) 46 (70.8) 90 (45.7) 171 (52.5) 135 (67.2)
Smoker
Yes 157 (19.9) 0 (0.0) 0 (0.0) 88 (27.0) 69 (34.3)
No 632 (80.1) 65 (100.0) 197 (100. 0) 238 (73.0) 132 (65.7)
Vaccinated
Yes 217 (27.5) 17 (26.2) 27 (13.7) 85 (26.1) 88 (43.8)
No 572 (72.5) 48 (73.9) 170 (86.3) 241 (73.9) 113 (56.2)
NOTE. Percentages are rounded, thus may not add up to 100%. aDenominator is subjects with at least one specimen positive by culture for influenza A.bContinuous variable values reported as “mean (standard deviation)” if symmetric variable, or “median (low end–high end of range)” if nonsymmetric. cTwosubjects in age group reported history of smoking but datum for number of pack-years is missing. dIn this age group no subjects reported pack-years >0.eMedian (range) reported for subset of subjects who reported any influenza vaccine within the 12 months prior to presentation. fDatum missing for 1 subject instudy population.
Woolpert et al. BMC Infectious Diseases 2012, 12:129 Page 4 of 11http://www.biomedcentral.com/1471-2334/12/129
specimens were refrigerated for ≤10 hours after collec-tion then stored at ≤−70 °C until testing.Each specimen was tested for influenza A by end-point
reverse transcriptase PCR (RT-PCR) as previouslydescribed using primer sets 2 and 2.5 [32]. Each was alsoinoculated on rhesus monkey kidney cells for virus isola-tion [33]; cultures exhibiting cytopathic effect within14 days were tested using an indirect immunofluorescenceassay with type-specific monoclonal antibodies for viralidentification. Isolates were subtyped by hemagglutinationinhibition (HAI) using the World Health Organization In-fluenza Reagent Kit for Identification of Influenza Isolates2007–2008 (WHO, Geneva, Switzerland). A portion ofunsubtypeable specimens were tested with the T5000 PCR/electrospray ionization mass spectrometer (ESI-MS) (IbisPharmaceuticals, Carlsbad, CA) as previously described[34] to identify influenza subtype.
Statistical analysisLaboratory-confirmed influenza was defined as havingany specimen positive for influenza by RT-PCR or virusisolation from cell culture. Influenza A status was
determined by RT-PCR and virus isolation and influenzaB status by virus isolation. An influenza A(H1) or A(H3)case was a subject with any specimen positive for thatinfluenza subtype by HAI.The study population was grouped into age categories:
3–5 years, 6–17 years, 18–49 years, and 50–80 years,chosen based on standard clinical groupings according toprobable influenza exposure/risk environments. Age wastreated as a continuous variable within each group. Di-chotomous variables were constructed from all clinicalparameters. Acute onset was defined as symptom onset≤3 days before presentation. Fever was defined astemperature >38.0 °C. Since inclusion criteria requiredcough or sore throat, these two variables were not con-sidered independent of each other; sore throat wasexcluded from the multivariate model. History of ad-equate vaccination was defined as receipt >14 and≤365 days prior to symptom onset.Rates of influenza across age groups were compared
using Pearson’s chi-square test. Bivariate exact condi-tional regression was performed in each age group tomodel the probability of laboratory-confirmed influenza

Woolpert et al. BMC Infectious Diseases 2012, 12:129 Page 5 of 11http://www.biomedcentral.com/1471-2334/12/129
against age, sex, acute onset, fever, cough, sore throat,shortness of breath, nasal congestion, headache, con-junctivitis, body aches, nausea/vomiting, smoking his-tory, and vaccination status. Age groups demonstratingsimilar predictor patterns were combined and bivariateanalyses repeated. Backward stepwise logistic regressionusing all above variables except sore throat wasemployed to create a reduced multivariate model. Ageand sex remained in the reduced model regardless ofany association. The associations between influenza andboth enrollment site and number/type of specimenswere assessed in bivariate and multivariate models in thewhole population. Both were then removed from themodel because they did not alter predictor variable asso-ciations. The same clinical and demographic variablesused in the primary multivariate model were evaluatedfor associations with laboratory-confirmed influenza Aversus B and influenza A(H1) versus A(H3) in bivariateand multivariate logistic regression models in the com-bined age group.Variables demonstrating associations with laboratory-
confirmed influenza (ie, the predictors of influenza) inthe combined age group reduced model were incorpo-rated into various clinical case definitions classified by atleast n criteria or by particular combinations of clinicalcriteria. Modeling these case definitions as diagnostictests, four test performance parameters—sensitivity, spe-cificity, and positive and negative predictive values (PPV,NPV)—were calculated. Performance of the Centers forDisease Control and Prevention (CDC) influenza-like ill-ness (ILI) case definition (temperature ≥37.8 °C and ei-ther cough or sore throat) [35] was assessed forcomparison. Confidence intervals (CIs) for performanceparameters were calculated for binomial proportions.
40
45
es
A(H1)
25
30
35
nflu
enza
Cas
e
A(H3)
A(unsubtyped)
AB
5
10
15
20
Num
ber
of I
n
0
5
/11/
2007
/18/
2007
/25/
2007
2/2/
2007
2/9/
2007
/16/
2007
/23/
2007
/30/
2007
1/6/
2008
/13/
2008
/20/
2008
N
11/
11/
11/ 12 12 12/
12/
12/ 1 1/ 1/
Week
B
% Positive
Figure 1 Distribution of laboratory-confirmed influenza cases and ovHistogram depicts all laboratory-confirmed influenza cases in the study popalong with the percentage of subjects who were positive for any influenza
All statistical analyses utilized SAS software, version9.1 (SAS Institute, Inc., Cary, NC); p values< .05 wereconsidered significant. This study was approved by theNaval Health Research Center Institutional ReviewBoard and followed the human subject research guide-lines of that institution.
ResultsBetween November 14, 2007 and April 8, 2008, spanningthe local influenza season, 796 subjects were enrolled.Six subjects withdrew before specimen collection; onewas excluded due to specimen mislabeling. Theremaining 789 subjects were analyzed; 199 provided athroat specimen, 145 provided a nasal specimen, and445 provided both.Subject characteristics and outcomes are reported in
Table 1. The overall influenza prevalence was 27.9%.Cases included 19.3% influenza A (44.0% A(H1), 39.7%A(H3), 16.4% unsubtypeable), 8.5% influenza B, and 1influenza A/B co-infection. Of the 19 subjects with ini-tially unsubtypeable influenza A infections, five subjectshad sufficient remaining sample for further testing; allfive subjects were positive for influenza A(H3) by PCR/ESI-MS (results not included in subsequent analyses).Distribution of cases throughout the season is illustratedin the Figure 1.During the 2007–2008 season, laboratory-confirmed
influenza rates were highest (33.0%) among 6- to 17-year-olds and lowest (18.5%) among 3- to 5-year-olds, thoughthese differences were not significant (p= .110 across allage groups). The proportion of influenza A(H3) to A(H1) cases did not significantly differ across age groups(p= .623), but the proportion of influenza A to B dif-fered (p= .019). No subjects reporting symptom
40%
45%
Perce
25%
30%
35%
ent of Subject
5%
10%
15%
20%
ts Influenza P
0%
5%
/27/
2008
2/3/
2008
/10/
2008
/17/
2008
/24/
2008
3/2/
2008
3/9/
2008
/16/
2008
/23/
2008
/30/
2008
4/6/
2008
Positive
1/ 2 2/ 2/ 2/ 3 3 3/ 3/ 3/ 4
erall influenza rate, during the 2007–2008 influenza season. NOTE.ulation, by type and subtype, throughout the duration of the study,type by week.

Woolpert et al. BMC Infectious Diseases 2012, 12:129 Page 6 of 11http://www.biomedcentral.com/1471-2334/12/129
duration ≥30 days (n=14) had laboratory-confirmed in-fluenza; 14 of 66 (21.2%) subjects reporting symptomduration of 14–29 days had influenza. Two subjects(0.3%), one influenza positive, denied a subjective feverand were eligible based solely on their recorded tem-peratures >38.0 °C; 577 subjects (73.1%) had both acough and sore throat.Laboratory-confirmed influenza rates varied from
21.2% at outpatient clinic 2 to 38.2% in the emergencyroom (p= .043 in multivariate model). Subjects contrib-uting only one nasal specimen had a significantly lowerrate of laboratory-confirmed influenza (17.9%) comparedwith those contributing one throat specimen only(29.7%) and one of each (30.3%) (p= .011 in multivariatemodel).Bivariate regression revealed significant associations
between laboratory-confirmed influenza and acute onset,fever, cough, body aches, and unvaccinated status in thewhole population, 6- to 17-year-olds and 18- to 49-year-olds. These latter two age groups were subsequentlycombined due to these similarities (Table 2). Among50- to 80-year-olds, only fever was predictive; in 3- to5-year-olds, only unvaccinated status was predictive.Multiple logistic regression in 6- to 49-year-olds
showed the same pattern of associations with laboratory-confirmed influenza as bivariate analyses (Table 3). Nei-ther enrollment site nor number and type of specimenstested altered the association between clinical predictorsof interest and laboratory-confirmed influenza.Table 4 displays the performance of 15 clinical case
definitions as diagnostic tests constructed from combi-nations of acute onset, fever, cough, and body aches in6- to 49-year-olds. Vaccination was not included givenits variable clinical significance over influenza seasons.The highest specificity (98.6%) was noted with the all-4-criteria test; however, the sensitivity was 14.6%. Theat-least-2-criteria test had a sensitivity of 94.9%, but aspecificity of 20.2% and PPV of 33.8%. The CDC ILI casedefinition was most sensitive (50.8%, not shown) withthe highest PPV (57.9%) among 6- to 17-year-olds andleast sensitive among 3- to 5-year-olds (25.0%).Bivariate logistic regression modeling of influenza B
versus A in 6- to 49-year-olds (n = 156) revealed signifi-cant or borderline associations with age, smoking, acuteonset, fever, and vaccination. In multiple logistic regres-sion modeling positive smoking history was associatedwith increased odds of influenza A versus B (adjustedodds ratio [OR], 8.95; 95% CI, 1.99–40.24). Age in1-year units (OR, 1.07; 95% CI, 1.03–1.11) and vacci-nated status (OR, 4.51; 95% CI, 1.19–17.09) were asso-ciated with influenza B versus A. Bivariate modeling ofinfluenza A(H3) versus A(H1) in the same age group(n = 75) demonstrated no significant differences. How-ever, the multivariate model demonstrated an association
between positive smoking history and influenza A(H3)(OR, 10.47; 95% CI, 1.28–85.46) and fever associatedwith influenza A(H1) (OR, 4.48; 95% CI, 1.11–18.12).
DiscussionThis study compared the predictive values of demo-graphic and clinical factors for laboratory-confirmed in-fluenza during the 2007–2008 influenza season inSouthern California among different age groups andevaluated the performance of resulting case definitions.Marked variations across age groups were found withrobust predictors among 6- to 49-year-olds and few pre-dictors among younger children and older adults. Nosingle case definition was found to have both a sensitiv-ity and specificity of clinical utility, even in an age groupexhibiting the strongest predictors; the CDC ILI casedefinition would have excluded 62% of influenza cases inthis study population. With no evidence for a diagnostic-ally useful case definition (used alone) and the potentialunreliability of RIDTs [12,36], new diagnostic strategiesare urgently needed.In our study population, 6- to 49-year-olds had the high-
est influenza rate (differences not statistically significant),with strong associations found between laboratory-confirmed influenza and acute onset, fever, cough, bodyaches, and unvaccinated status, consistent with prior stud-ies [16,17,21,23,25,37]. Cough had the strongest associ-ation with influenza. Influenza positive 6- to 49-year-oldshad approximately three times the odds of being unvac-cinated (n=141, 89.8%) compared to negative subjects(n=270, 73.8%) (p= .001), suggesting a moderate protect-ive effect of the vaccine for this season in this age group.No demographic or clinical predictors of influenza werefound among 3- to 5-year-olds, consistent with findings insimilar studies [27]. The difficulty of eliciting a symptom-atic history when the subject has limited language skillsmay contribute to this phenomenon [38]. Vaccinationappeared strongly protective in this age group. A (non-significant) lower rate of influenza in this group conflictswith the common belief that young children exhibit ahigher incidence of influenza, higher viral loads andhigher persistence of the virus. However, CDC data fromoutpatients with ILI in 12 states during the 2010–2011 in-fluenza season suggests that the rate of laboratory-confirmed influenza was lower among children< 5 yearsold compared to 5- to 17-year-olds [39]. Among 50- to80-year-olds, only fever was associated with influenza,consistent with prior studies failing to identify reliableclinical predictors among older adults [20,24]. No protect-ive effect from vaccination was apparent in this group, asmight be expected with age-related waning immunity[40], although denominators were small.Together, these findings substantiate previous observa-
tions that during a community influenza epidemic, acute

Table 2 Bivariate regression analysis of laboratory-confirmed influenza versus seven demographic and clinical variables of interest
Variable Laboratory-confirmed influenza diagnosis
Total study population Subjects ages 3–5 years Subjects ages 6–49 years Subjects ages 50–80 years
(n=789) (n=65) (n=523) (n=201)
n/total (%)a OR (95% CI) n/total (%)a OR (95% CI) n/total (%)a OR (95% CI) n/total (%)a OR (95% CI)
Continuous variable
Age (years) 1.00 (0.99–1.01) 0.47 (0.17–1.10) 0.99 (0.98–1.01) 1.01 (0.95–1.07)
Categorical variables
Sex
Female 141/494 (28.5) 1.09 (0.78–1.53) 5/30 (16.7) 0.80 (0.18–3.38) 109/357 (30.5) 1.08 (0.71–1.66) 27/107 (25.2) 0.98 (0.50–1.96)
Maleb 79/295 (26.8) 1.0 7/35 (20.0) 1.0 48/166 (28.9) 1.0 24/94 (25.5) 1.0
Acute onset
≤3 days 110/273 (40.3) 2.49 (1.78–3.48) 8/30 (26.7) 2.77 (0.65–14.21) 86/199 (43.2) 2.71 (1.81–4.06) 16/44 (36.4) 1.98 (0.90–4.31)
>3 daysb 110/516 (21.3) 1.0 4/35 (11.4) 1.0 71/324 (21.9) 1.0 35/157 (22.3) 1.0
Fever
> 38.0°C 65/126 (51.6) 3.49 (2.31–5.27) 1/11 (9.1) 0.40 (0.01–3.37) 51/91 (56.0) 3.91 (2.39–6.44) 13/24 (54.2) 4.28 (1.63–11.51)
≤ 38.0°Cb 155/663 (23.4) 1.0 11/54 (20.4) 1.0 106/432 (24.5) 1.0 38/177 (21.5) 1.0
Cough
Yes 219/736 (29.8) 22.99 (3.72–890.52) 12/63 (19.0) 0.55 (≥0.04) c 156/475 (32.8) 22.92 (3.84–932.74) 51/198 (25.8) 1.32 (≥0.14) c
Nob 1/53 (1.9) 1.0 0/2 (0.0) 1.0 1/48 (2.1) 1.0 0/3 (0.0) 1.0
Body achesd
Yes 177/581 (30.5) 1.67 (1.13–2.50) 8/27 (29.6) 3.40 (0.79–17.59) 127/388 (32.7) 1.70 (1.06–2.79) 42/166 (25.3) 0.98 (0.40–2.57)
Nob 43/207 (20.8) 1.0 4/37 (10.8) 1.0 30/135 (22.2) 1.0 9/35 (25.7) 1.0
Vaccinated
Yes 39/217 (18.0) 0.47 (0.31–0.71) 0/17 (0.0) 0.13 (≤0.89) c 16/112 (14.3) 0.32 (0.17–0.57) 23/88 (26.1) 1.07 (0.54–2.13)
Nob 181/572 (31.6) 1.0 12/48 (25.0) 1.0 141/411 (34.3) 1.0 28/113 (24.8) 1.0
NOTE. Bivariate exact conditional logistic regression was performed in each age group. Bivariate results (OR, odds ratio; CI, confidence interval) are displayed here for all variables of interest (those that were retained inthe final multivariate regression model in any age group) modeled against laboratory-confirmed influenza. aNumber of subjects meeting criteria at left who have laboratory-confirmed influenza/all subjects meetingcriteria at left (percent). bReference category in regression model. cOR is a median unbiased estimate; one limit of CI is infinite or crosses zero due to cell size of zero. dData missing for 1 subject age 3–5 years.
Woolpert
etal.BM
CInfectious
Diseases
2012,12:129Page
7of
11http://w
ww.biom
edcentral.com/1471-2334/12/129

Table 3 Multivariate regression of laboratory-confirmedinfluenza versus demographic and clinical variables forsubjects 6–49 years
Variable β estimate OR (95% CI) p value
Intercept term −5.85 <.001
Age (years) −0.00 1.00 (0.98–1.02) .713
Sex 0.13 .606
Female 1.14 (0.70–1.84)
Malea 1.0
Acute onset 1.18 <.001
≤3 days 3.26 (2.09–5.10)
>3 daysa 1.0
Fever 1.35 <.001
>38.0°C 3.84 (2.23–6.61)
≤38.0°Ca 1.0
Cough 3.87 <.001
Yes 47.99 (6.29–366.13)
Noa 1.0
Body aches 0.95 .001
Yes 2.59 (1.47–4.54)
Noa 1.0
Vaccinated −1.10 .001
Yes 0.33 (0.18–0.62)
Noa 1.0
NOTE. CI, confidence interval; OR, odds ratio. Multivariate stepwise logisticregression was performed in the combined age group (n= 521). The reducedmodel is presented here (n= 523). Age and sex were retained in the finalmodel despite not being statistically associated with the outcome. aReferencecategory in regression model.
Woolpert et al. BMC Infectious Diseases 2012, 12:129 Page 8 of 11http://www.biomedcentral.com/1471-2334/12/129
onset of fever and cough in young to middle-aged adultsare the best individual clinical predictors for laboratory-confirmed influenza [17,21], with young children dem-onstrating the fewest predictors [27]. Differing influenzadetection rates according to specimen type collectedwarrants further study.The all-4-criteria clinical case definition (requiring
acute onset, fever, cough, and body aches) had a strongspecificity among 6- to 49-year-olds (98.6%), but missed85% of influenza cases. The at-least-2-criteria test (sub-ject must have at least two of the four criteria) captured94.9% of cases, but only excluded influenza in 20.2% ofnoncases; 33.8% of test positives had influenza in thisgroup (overall prevalence similar to that of a typical in-fluenza epidemic). The clinical tests defined by exactlytwo or three criteria likewise performed poorly, thoughroughly half had higher sensitivity than the CDC ILIcase definition (40.1%) in this age group. The CDC ILIdefinition’s sensitivity varied significantly across agegroups, with the poorest performance among 3- to 5-year-olds and the highest among 6- to 49-year-olds.
Across the whole population the CDC ILI definitionmissed >60% of cases and had a PPV <60% in each agegroup. NPVs ranged from 73-100%, indicating that theabsence of most of the symptoms modeled effectivelypredicted the absence of influenza infection; the at-least-1-criterion test, at-least-2-criteria test, and “cough+ anyof other 3 criteria” test could all be utilized to excludeinfluenza (NPV >90%), eliminating the need for afollow-up rapid or laboratory-based test.All case definitions in Table 4 performed inferiorly to
the typically cited sensitivities (50%–70%) or specificities(90%–95%) or both of RIDTs [36]. However, a commonRIDT was found to have a sensitivity as low as of 27%(95% CI, 19%–32%) for influenza during 2007–2008[12]; recent studies of that same and other RIDTs reportsensitivities 38%–69% in detection of pH1N1 [13–15]and 31%–63% against other strains [14]. If RIDTs areless sensitive than previously cited, their optimal diag-nostic utility might be among groups with higher influ-enza prevalence (eg, patients meeting a sensitive clinicalcase definition like the at-least-2-criteria clinical testduring a local epidemic) with confirmatory testing fol-lowing negative RIDT results [36].Vaccination status was excluded in this diagnostic
modeling since the effect of vaccination is likely tochange annually with variable strain matching. Cliniciansshould take vaccination status into account when mak-ing a clinical diagnosis only once the performance of thevaccine has been established for that region and season.Influenza type/subtype analysis yielded unexpected
results. The meaning of the associations of influenza Awith history of smoking and influenza B with increasingage is not clear. Researchers previously reported the twoinfluenza types might infect different age groups at dif-ferent rates, but may cause a similar clinical syndromeacross age groups [22]. Differences in rates across agegroups may be related to previous circulation of similarstrains. Smoking increases with age among 6- to49-year-olds; thus confounding is unlikely. Fever wasassociated with influenza A(H1) infection compared withA(H3). If fever correlates with a higher viral titer, it is notsurprising that the initially unsubtypeable specimenswere A(H3)-positive. However, if fever reflects more se-vere or systemic disease, this finding contradicts previousreports suggesting influenza A(H3) was associated withsuch illness [16,41]. We are unaware of a physiologicmechanism through which smoking would increasethe risk of influenza A(H3), or decrease the risk ofA(H1), which our results suggest, but this merits furtherinvestigation.This study’s major strengths include a methodology fa-
cilitating comparison to similar studies and inclusion inmeta-analyses and an analysis of age group and influenzatype/subtype effects. The surveillance population studied
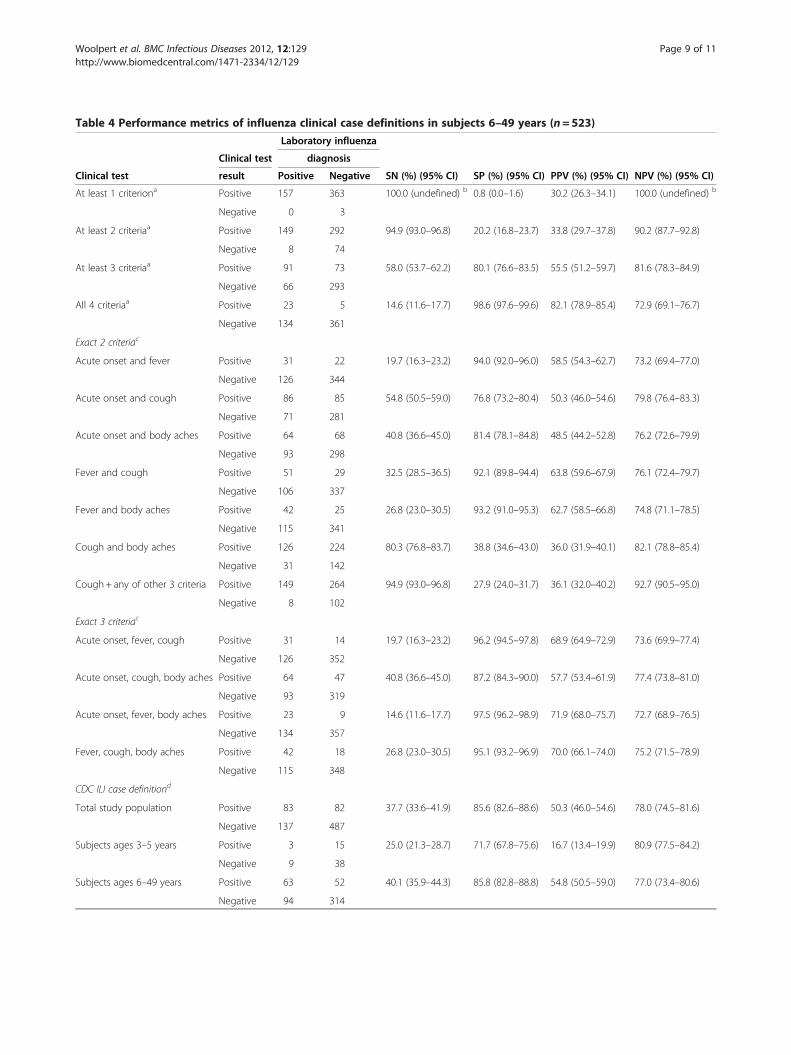
Table 4 Performance metrics of influenza clinical case definitions in subjects 6–49 years (n=523)
Laboratory influenza
Clinical test diagnosis
Clinical test result Positive Negative SN (%) (95% CI) SP (%) (95% CI) PPV (%) (95% CI) NPV (%) (95% CI)
At least 1 criteriona Positive 157 363 100.0 (undefined) b 0.8 (0.0–1.6) 30.2 (26.3–34.1) 100.0 (undefined) b
Negative 0 3
At least 2 criteriaa Positive 149 292 94.9 (93.0–96.8) 20.2 (16.8–23.7) 33.8 (29.7–37.8) 90.2 (87.7–92.8)
Negative 8 74
At least 3 criteriaa Positive 91 73 58.0 (53.7–62.2) 80.1 (76.6–83.5) 55.5 (51.2–59.7) 81.6 (78.3–84.9)
Negative 66 293
All 4 criteriaa Positive 23 5 14.6 (11.6–17.7) 98.6 (97.6–99.6) 82.1 (78.9–85.4) 72.9 (69.1–76.7)
Negative 134 361
Exact 2 criteriac
Acute onset and fever Positive 31 22 19.7 (16.3–23.2) 94.0 (92.0–96.0) 58.5 (54.3–62.7) 73.2 (69.4–77.0)
Negative 126 344
Acute onset and cough Positive 86 85 54.8 (50.5–59.0) 76.8 (73.2–80.4) 50.3 (46.0–54.6) 79.8 (76.4–83.3)
Negative 71 281
Acute onset and body aches Positive 64 68 40.8 (36.6–45.0) 81.4 (78.1–84.8) 48.5 (44.2–52.8) 76.2 (72.6–79.9)
Negative 93 298
Fever and cough Positive 51 29 32.5 (28.5–36.5) 92.1 (89.8–94.4) 63.8 (59.6–67.9) 76.1 (72.4–79.7)
Negative 106 337
Fever and body aches Positive 42 25 26.8 (23.0–30.5) 93.2 (91.0–95.3) 62.7 (58.5–66.8) 74.8 (71.1–78.5)
Negative 115 341
Cough and body aches Positive 126 224 80.3 (76.8–83.7) 38.8 (34.6–43.0) 36.0 (31.9–40.1) 82.1 (78.8–85.4)
Negative 31 142
Cough+ any of other 3 criteria Positive 149 264 94.9 (93.0–96.8) 27.9 (24.0–31.7) 36.1 (32.0–40.2) 92.7 (90.5–95.0)
Negative 8 102
Exact 3 criteriac
Acute onset, fever, cough Positive 31 14 19.7 (16.3–23.2) 96.2 (94.5–97.8) 68.9 (64.9–72.9) 73.6 (69.9–77.4)
Negative 126 352
Acute onset, cough, body aches Positive 64 47 40.8 (36.6–45.0) 87.2 (84.3–90.0) 57.7 (53.4–61.9) 77.4 (73.8–81.0)
Negative 93 319
Acute onset, fever, body aches Positive 23 9 14.6 (11.6–17.7) 97.5 (96.2–98.9) 71.9 (68.0–75.7) 72.7 (68.9–76.5)
Negative 134 357
Fever, cough, body aches Positive 42 18 26.8 (23.0–30.5) 95.1 (93.2–96.9) 70.0 (66.1–74.0) 75.2 (71.5–78.9)
Negative 115 348
CDC ILI case definitiond
Total study population Positive 83 82 37.7 (33.6–41.9) 85.6 (82.6–88.6) 50.3 (46.0–54.6) 78.0 (74.5–81.6)
Negative 137 487
Subjects ages 3–5 years Positive 3 15 25.0 (21.3–28.7) 71.7 (67.8–75.6) 16.7 (13.4–19.9) 80.9 (77.5–84.2)
Negative 9 38
Subjects ages 6–49 years Positive 63 52 40.1 (35.9–44.3) 85.8 (82.8–88.8) 54.8 (50.5–59.0) 77.0 (73.4–80.6)
Negative 94 314
Woolpert et al. BMC Infectious Diseases 2012, 12:129 Page 9 of 11http://www.biomedcentral.com/1471-2334/12/129

Table 4 Performance metrics of influenza clinical case definitions in subjects 6–49 years (n=523) (Continued)
Subjects ages 50–80 years Positive 17 15 33.3 (29.3–37.4) 90.0 (87.4–92.6) 53.1 (48.8–57.4) 79.9 (76.4–83.3)
Negative 34 135
NOTE. CDC, Centers for Disease Control and Prevention; CI, confidence interval; ILI, influenza-like illness; NPV, negative predictive value; PPV, positive predictivevalue; SN, sensitivity; SP, specificity. The first 15 clinical tests displayed are defined according to combinations of 4 influenza predictors (“criteria”) present in asubject: acute onset, fever, cough, and body aches. CI calculated for a proportion estimate as follows: (estimate) ± 1.96 x √(estimate x (1 – estimate)/n). aPositivetest defined by at least n of the 4 criteria of interest being met. bCI undefined; cannot be calculated for a proportion of 1.0. cThe exact criteria listed are met,regardless of whether the other unlisted criteria are met. dCDC ILI definition = temperature ≥37.8 °C and either cough or sore throat in absence of another knowncause. Presence of another known cause is not assessable in this study. This case definition’s performance was evaluated in and is reported for all age groupsincluded in the study.
Woolpert et al. BMC Infectious Diseases 2012, 12:129 Page 10 of 11http://www.biomedcentral.com/1471-2334/12/129
provides an ideal setting for this analysis: a large out-patient population at the point of care, wide age rangeand socioeconomic spectrum, broad and uniform inclu-sion criteria (resulting in symptomatic diversity), androbust laboratory influenza diagnosis with type and sub-type. Type distributions were similar to national (71% in-fluenza A and 29% influenza B) [35] and local [42] ratesin the same season. The military dependent populationstudied is similar to the general US population, thoughdependents may be healthier due to universal access tomedical care.Study limitations include omission of subjects ages
<3 years and incomplete data on prior vaccination his-tory in children—potential receipt of two doses in indivi-duals ages ≤8 years was not documented. Otherlimitations include use of self-reported vaccination data,lack of antiviral or antipyretic use history, lack of infor-mation regarding comorbid conditions that increase riskof influenza or adverse outcomes from influenza, andasymmetry between influenza A and B testing methods.Subjects in this study may not be considered high riskfor influenza complications, thus may not represent thepopulation for whom antiviral therapy is clearly indi-cated for treatment of influenza infection. Clinical pre-dictors of influenza and the performance of clinical casedefinitions may differ in a high risk population. AnRT-PCR assay for influenza B was not utilized, thus trueinfluenza B and overall influenza rates may be underes-timated. We believe underdiagnosis of influenza B ismore likely to create a type II error. As the clinical casedefinitions modeled here were created utilizing our en-tire data set, sensitivities and specificities could be over-estimates of the true values; these models should beevaluated and validated in other populations and duringother time periods. Last, we report on only one influ-enza season and cannot assess clinical disease variationsover time resulting from antigenic drift.
ConclusionsThis study demonstrates that clinical parametersstrongly predict influenza in a diverse local populationand are age-dependent; but clinical case definitions usedalone, including the CDC ILI case definition, may not
sufficiently distinguish influenza from non-influenzaduring an epidemic. Case definitions could still augmentdiagnosis and management for 6- to 49-year-old patientsduring an influenza season: (1) screening with a sensitivecase definition followed by RIDT or definitive testingwhen positive or (2) screening otherwise healthy outpati-ents with a specific case definition. These strategiescould enhance appropriate antimicrobial use. As always,the effect of varying seasonal and geographic rates ondiagnostic predictive values should be considered. The2009 emergence of pH1N1 highlights the urgent needfor reevaluation of RIDTs and further investigation intothe changing clinical disease spectrum of seasonal andnovel influenza strains. An evaluation of clinical casedefinitions in high-risk groups, more likely to benefitfrom antiviral therapy, is needed. Standardization of clin-ical case definitions and clinical sampling techniqueswould facilitate better comparisons between studies andmore effective evaluation of influenza diagnostics.
Competing interestsThe authors declare that they have no competing interests.
Author details1Naval Health Research Center, 140 Sylvester Rd, San Diego, CA 92106, USA.2San Diego State University, Hardy Tower 119, 5500 Campanile Dr, SanDiego, CA 92182-4162, USA. 3UCSD School of Medicine, 9500 Gilman Drive#0811, La Jolla, CA 92093-0811, USA.
Authors’ contributionsTW participated in the design of the study, coordinated study activities,supervised enrollment and data collection, conducted data analysis, anddrafted the manuscript. DF conceived of the study and participated in itsdesign, supervised laboratory reference testing, and participated inmanuscript revision. SB participated in the design of the study andparticipated in manuscript revision. HL participated in the design of thestudy and assisted with data analysis. PB and JW participated in manuscriptrevision. All authors read and approved the final manuscript. TW is a seniormedical epidemiologist at the Naval Health Research Center (NHRC). SB is aresearcher at NHRC and a professor and Epidemiology Division Head at SanDiego State University (SDSU) Graduate School of Public Health (GSPH). HL isan assistant professor at SDSU GSPH. JW is a faculty member of theUCSD/SDSU Joint General Preventive Medicine Residency Program. PB isdepartment head for the NHRC Department of Operational InfectiousDiseases (OID). DF was assistant department head for NHRC OID at the timeof manuscript submission. All authors read and approved the finalmanuscript.
AcknowledgmentsWe are grateful to research associates Meghan McClure, Chasity Greer, andKorinna David, and laboratory staff at the Naval Health Research Center who

Woolpert et al. BMC Infectious Diseases 2012, 12:129 Page 11 of 11http://www.biomedcentral.com/1471-2334/12/129
performed all subject enrollments and testing, without whose support suchstudies could not be conducted. Thanks also to the Naval Medical CenterSan Diego for supporting and facilitating the establishment of an ongoinginfluenza surveillance network in its health care system and to the staff insubordinate clinics for their cooperation with this work.This work represents reports 11–16 supported by the Armed Forces HealthSurveillance Center, Global Emerging Infections Surveillance and ResponseSystem (GEIS) operations [work unit number 60501]. The funding body wasnot involved in study design, data collection, analysis, interpretation ofresults or manuscript writing.
Received: 24 January 2012 Accepted: 7 June 2012Published: 7 June 2012
References1. Influenza. [http://www.who.int/mediacentre/factsheets/fs211/en/index.
html].2. Fiore AE, Shay DK, Broder K, Iskander JK, Uyeki TM, Mootrey G, Bresee JS,
Cox NJ: Prevention and control of influenza: recommendations of theAdvisory Committee on Immunization Practicies (ACIP). vol. 57th edition.Atlanta, GA: MMWR; 2008:1–59.
3. Cox NJ, Subbarao K: Influenza. Lancet 1999, 354:1277–1282.4. Nicholson KG, Wood JM, Zambon M: Influenza. Lancet 2003, 362
(9397):1733–1745.5. Webster RG, Bean WJ, Gorman OT, Chambers TM, Kawaoka Y: Evolution
and ecology of influenza A viruses. Microbiol Rev 1992, 56(1):152–179.6. Bonner A, Monroe K, Talley L, Klasner A, Kimberlin D: Impact of the rapid
diagnosis of influenza on physician decision-making and patientmanagement in the pediatric emergency department: results of arandomized, prospective, controlled trial. Pediatrics 2003, 112(2):363–367.
7. Bautista E, Chotpitayasunondh T, Gao Z, Harper SA, Shaw M, Uyeki TM, ZakiSR, Hayden FG, Hui DS, Kettner JD, et al: Clinical aspects of pandemic 2009influenza A (H1N1) virus infection. N Engl J Med 2010, 362(18):1708–1719.
8. Perez-Padilla R, de La Rosa-Zamboni D, Ponce de Leon S, Hernandez M,Quinones-Falconi F, Bautista E, Ramirez-Venegas A, Rojas-Serrano J, OrmsbyCE, Corrales A, et al: Pneumonia and respiratory failure from swine-origininfluenza A (H1N1) in Mexico. N Engl J Med 2009, 361(7):680–689.
9. Ward CL, Dempsey MH, Ring CJ, Kempson RE, Zhang L, Gor D, SnowdenBW, Tisdale M: Design and performance testing of quantitative real timePCR assays for influenza A and B viral load measurement. J Clin Virol2004, 29(3):179–188.
10. Weinberg GA, Erdman DD, Edwards KM, Hall CB, Walker FJ, Griffin MR,Schwartz B: Superiority of reverse-transcription polymerase chainreaction to conventional viral culture in the diagnosis of acuterespiratory tract infections in children. J Infect Dis 2004, 189(4):706–710.
11. van Elden LJ, Nijhuis M, Schipper P, Schuurman R, van Loon AM:Simultaneous detection of influenza viruses A and B using real-timequantitative PCR. J Clin Microbiol 2001, 39(1):196–200.
12. Uyeki T, Prasad R, Vukotich C, Stebbins S, Rinaldo C, Ferng Y, Morse S,Larson E, Aiello A, Davis B, et al: Low sensitivity of rapid diagnostic test forinfluenza. Clinical Infectious Dieseases 2009, 48(9):e89–e92.
13. Evaluation of rapid influenza diagnostic tests for detection of novelinfluenza A (H1N1) Virus - United States. MMWR Morbidity and mortalityweekly report 2009 2009, 58(30):826–829.
14. Faix DJ, Sherman SS, Waterman SH: Rapid-Test Sensitivity for Novel Swine-Origin Influenza A (H1N1) Virus in Humans. N Engl J Med 2009, 361:728–729.
15. Vasoo S, Stevens J, Singh K: Rapid antigen tests for diagnosis of pandemic(Swine) influenza A/H1N1. Clin Infect Dis 2009, 49(7):1090–1093.
16. Carrat F, Tachet A, Rouzioux C, Housset B, Valleron A: Evaluation of clinicalcase definitions of influenza: detailed investigation of patients duringthe 1995–1996 epidemic in France. Clin Infect Dis 1999, 28(2):283–290.
17. Boivin G, Hardy I, Tellier G, Maziade J: Predicting influenza infectionsduring epidemics with use of a clinical case definition. Clin Infect Dis2000, 31(5):1166–1169.
18. Call S, Vollenweider M, Hornung C, Simel D, McKinney W: Does this patienthave influenza? JAMA 2005, 293(8):987–997.
19. Govaert T, Dinant G, Aretz K, Knottnerus J: The predictive value ofinfluenza symptomatology in elderly people. Fam Pract 1998, 15(1):16–22.
20. Nicholson KG, Kent J, Hammersley V, Cancio E: Acute viral infections ofupper respiratory tract in elderly people living in the community:
comparative, prospective, population based study of disease burden.BMJ 1997, 315(7115):1060–1064.
21. Monto A, Gravenstein S, Elliot M, Colopy M, Schweinle J: Clinical signsand symptoms predicting influenza infection. Arch Intern Med 2000,160:3243–3247.
22. Hulson TD, Mold JW, Scheid D, Aaron M, Aspy CB, Ballard NL, Boren N,Gregory ME, Truong TC: Diagnosing influenza: the value of clinical cluesand laboratory tests. J Fam Pract 2001, 50(12):1051–1056.
23. van Elden LJ, van Essen GA, Boucher CA, van Loon AM, Nijhuis M,Schipper P, Verheij TJ, Hoepelman IM: Clinical diagnosis of influenzavirus infection: evaluation of diagnostic tools in general practice. Br JGen Pract 2001, 51(469):630–634.
24. Walsh E, Cox C, Falsey A: Clinical features of influenza A virus infection inolder hospitalized persons. J Am Geriatr Soc 2002, 50(9):1498–1503.
25. Neuzil K, O'Connor T, Gorse G, Nichol K: Recognizing influenza in olderpatients with chronic obstructive pulmonary disease who have receivedinfluenza vaccine. Clin Infect Dis 2003, 36(2):169–174.
26. Friedman MJ, Attia MW: Clinical predictors of influenza in children. ArchPediatr Adolesc Med 2004, 158(4):391–394.
27. Ohmit S, Monto A: Symptomatic predictors of influenza virus positivityin children during the influenza season. Clinical Infectious Dieseases2006, 43(5):564–568.
28. V d Hoeven A, Hoeven A, Scholing M, Wever P, Fijnheer R, Hermans M,Schneeberger P: Lack of discrimination signs and symptoms in clinicaldiagnosis of influenza of patients admitted to the hospital. Infection 2006,2:65–68.
29. Lee VJ, Yap J, Cook AR, Tan CH, Loh JP, Koh WH, Lim EA, Liaw JC, Chew JS,Hossain I, et al: A Clinical Diagnostic Model for Predicting Influenzaamong Young Adult Military Personnel with Febrile Respiratory Illness inSingapore. PLoS One 2011, 6(3):e17468.
30. Kasper M, Wierzba T, Sovann L, Blair P, Putnam S: Evaluation of an influenza-like illness case definition in the diagnosis of influenza among patients withacute febrile illness in Cambodia. BMC Infect Dis 2010, 10:320.
31. Ebell M, Afonso A: A systematic review of clinical decision rules for thediagnosis of influenza. Annals of Family Medicine 2011, 9(1):69–77.
32. Freed N, Myers C, Russell K, Walter E, Irvine M, Coon R, Metzgar D:Diagnostic discrimination of live attenuated influenza vaccine strainsand community-acquired pathogenic strains in clinical samples.Molecular and Cellular Probes 2007, 21:103–110.
33. Owens AB, Canas LC, Russell KL, Neville JS, Pavlin JA, MacIntosh VH, GrayGC, Gaydos JC: Department of Defense Global Laboratory-BasedInfluenza Surveillance: 1998–2005. Am J Prev Med 2009, 37(3):235–241.
34. Sampath R, Russell KL, Massire C, Eshoo MW, Harpin V, Blyn LB, Melton R, IvyC, Pennella T, Li F, et al: Global surveillance of emerging Influenza virusgenotypes by mass spectrometry. PLoS One 2007, 2(5):e489.
35. Centers for Disease Control and Prevention: Influenza activity: UnitedStates and worldwide, 2007–08 season. In: Morbidity and Mortality WeeklyReport. vol. 2008, 57:692–697.
36. Rapid diagnostic testing for influenza. 2009. [http://www.cdc.gov/flu/professionals/diagnosis/rapidlab.htm.
37. Thursky K, Cordova SP, Smith D, Kelly H: Working towards a simple casedefinition for influenza surveillance. J Clin Virol 2003, 27(2):170–179.
38. Riley AW: Evidence that school-age children can self-report on theirhealth. Ambul Pediatr 2004, 4(4 Suppl):371–376.
39. Fowlkes A, Davidson H, Ferland L, Goodin K, Sun Y, Norng S, Martin K, FeistJ, Di Lonardo S, McHugh L, et al: The incidence of medically-attendedinflurnza-like illness and influenza virus infection across the age span: newinsights in the epeidemiology of laboratory-confirmed influenza. In: InfectiousDisease Society of America Annual Meeting. Boston; 2011.
40. Goodwin K, Viboud C, Simonsen L: Antibody response to influenza vaccinationin the elderly: a quantitative review. Vaccine 2006, 24(8):1159–1169.
41. Frank A, Taber L, Wells J: Comparison of infection rates and severityof illness for influenza A subtypes H1N1 and H3N2. J Infect Dis1985, 151(1):73–80.
42. FRI Surveillance Summary 2007–2008. [http://www.med.navy.mil/sites/nhrc/geis/Pages/ArchivedUpdates.aspx].
doi:10.1186/1471-2334-12-129Cite this article as: Woolpert et al.: Determination of clinical anddemographic predictors of laboratory-confirmed influenza with subtypeanalysis. BMC Infectious Diseases 2012 12:129.