Determination of bilayer thickness and lipid surface area in unilamellar...
7
ARTICLE Determination of bilayer thickness and lipid surface area in unilamellar dimyristoylphosphatidylcholine vesicles from small-angle neutron scattering curves: a comparison of evaluation methods Received: 28 October 2002 / Revised: 19 July 2003 / Accepted: 19 July 2003 / Published online: 3 September 2003 ȑ EBSA 2003 Abstract Small-angle neutron scattering (SANS) experiments were performed on unilamellar 1,2-dim- yristoylphosphatidylcholine (DMPC) vesicles prepared in heavy water by extrusion through polycarbonate fil- ters with 500 A ˚ pores. The data obtained at 30±0.1 ŶC were evaluated using a five-strip function model of the bilayer coherent neutron scattering length density, three different approximate form factors describing scattering from vesicles, and different methods of evaluation of the experimental data. It is shown that the results obtained from the SANS data in the range of scattering vector values 0.0316 A ˚ )1 <q<0.0775 A ˚ )1 are not sensitive to the vesicle form factor, nor to the evaluation method. Using the hollow sphere model of vesicles convo- luted with the Gaussian distribution of their sizes, a constrained bilayer polar region thickness of 9 A ˚ and a DMPC headgroup volume of 325.5 A ˚ 3 , it was possi- ble to obtain from the experimental data the DMPC surface area as 58.9±0.8 A ˚ 2 , the bilayer thick- ness as 44.5±0.3 A ˚ and the number of water molecules as 6.8±0.2 per DMPC located in the bilayer polar region. Keywords Bilayer thickness 1,2-Dimyristoyl- phosphatidylcholine Lipid surface area Small-angle neutron scattering Unilamellar vesicles Introduction Two major components of biological membranes are lipids and proteins. Integral membrane proteins, which span the lipid bilayer, mediate the transport of matter and signals. It is well known that the function and properties of many of these proteins depend on the lipid bilayer thickness. Therefore, to have a clear under- standing of the factors responsible for various mem- brane properties, an investigation of lipid bilayer thickness is necessary. The bilayer thickness is studied in model membrane systems (lamellar phospholipid pha- ses, multilamellar and unilamellar phospholipid vesicles) using mainly small-angle X-ray diffraction and scatter- ing methods (see Nagle and Tristram-Nagle 2000; Kiselev et al. 2003 for recent references). Small-angle neutron scattering (SANS) on unilamellar vesicles has not been used in this field so frequently until recently. In the present paper we study the bilayer thickness, d L , and the lipid surface area, A L , at the bilayer/ aqueous phase interface in unilamellar 1,2-dim- yristoylphosphatidylcholine (DMPC) vesicles using SANS. Although the scattering problem is solved and the scattering theory very well known (Glatter and Kratky 1982; Feigin and Svergun 1987), it is necessary to assume different approximations and models in the evaluation of experimental SANS data. The most fre- quently used constraint is the homogenous coherent neutron scattering length density, q, within the bilayer: the ‘‘top-hat’’ model (see Knoll et al. 1981; Komura et al. 1982; Nawroth et al. 1989; Gordeliy et al. 1993; Balgavy´ et al. 1998; Gilbert et al. 1999; Mason et al. 1999; Pencer and Hallett 2000; Uhrı´kova´ et al. 2000 and references therein). However, fully hydrated lipid bilayers include some amount of water inside the lipid polar headgroup region of the bilayer and q is not homogeneous within Eur Biophys J (2004) 33: 328–334 DOI 10.1007/s00249-003-0349-0 Norbert Kucˇ erka Mikhail A. Kiselev Pavol Balgavy´ N. Kucˇerka (&) Department of Chemical Theory of Drugs, Faculty of Pharmacy, Comenius University, Kalincˇiakova 8, 832 32 Bratislava, Slovakia E-mail: [email protected] M. A. Kiselev Frank Laboratory of Neutron Physics, Joint Institute for Nuclear Research, 141980 Dubna, Moscow Region, Russia P. Balgavy´ Department of Physical Chemistry, Faculty of Pharmacy, Comenius University, Odboja´rov 10, 832 32 Bratislava, Slovakia
-
Upload
independent -
Category
Documents
-
view
0 -
download
0
Transcript of Determination of bilayer thickness and lipid surface area in unilamellar...
ARTICLE
Determination of bilayer thickness and lipid surface areain unilamellar dimyristoylphosphatidylcholine vesiclesfrom small-angle neutron scattering curves: a comparisonof evaluation methods
Received: 28 October 2002 / Revised: 19 July 2003 /Accepted: 19 July 2003 / Published online: 3 September 2003� EBSA 2003
Abstract Small-angle neutron scattering (SANS)experiments were performed on unilamellar 1,2-dim-yristoylphosphatidylcholine (DMPC) vesicles preparedin heavy water by extrusion through polycarbonate fil-ters with 500 A pores. The data obtained at 30±0.1 �Cwere evaluated using a five-strip function model of thebilayer coherent neutron scattering length density, threedifferent approximate form factors describing scatteringfrom vesicles, and different methods of evaluation of theexperimental data. It is shown that the results obtainedfrom the SANS data in the range of scattering vectorvalues 0.0316 A)1<q<0.0775 A)1 are not sensitive tothe vesicle form factor, nor to the evaluation method.Using the hollow sphere model of vesicles convo-luted with the Gaussian distribution of their sizes,a constrained bilayer polar region thickness of 9 A anda DMPC headgroup volume of 325.5 A3, it was possi-ble to obtain from the experimental data theDMPC surface area as 58.9±0.8 A2, the bilayer thick-ness as 44.5±0.3 A and the number of water moleculesas 6.8±0.2 per DMPC located in the bilayer polarregion.
Keywords Bilayer thickness Æ 1,2-Dimyristoyl-phosphatidylcholine Æ Lipid surface area Æ Small-angleneutron scattering Æ Unilamellar vesicles
Introduction
Two major components of biological membranes arelipids and proteins. Integral membrane proteins, whichspan the lipid bilayer, mediate the transport of matterand signals. It is well known that the function andproperties of many of these proteins depend on the lipidbilayer thickness. Therefore, to have a clear under-standing of the factors responsible for various mem-brane properties, an investigation of lipid bilayerthickness is necessary. The bilayer thickness is studied inmodel membrane systems (lamellar phospholipid pha-ses, multilamellar and unilamellar phospholipid vesicles)using mainly small-angle X-ray diffraction and scatter-ing methods (see Nagle and Tristram-Nagle 2000;Kiselev et al. 2003 for recent references). Small-angleneutron scattering (SANS) on unilamellar vesicles hasnot been used in this field so frequently until recently.
In the present paper we study the bilayer thickness,dL, and the lipid surface area, AL, at the bilayer/aqueous phase interface in unilamellar 1,2-dim-yristoylphosphatidylcholine (DMPC) vesicles usingSANS. Although the scattering problem is solved andthe scattering theory very well known (Glatter andKratky 1982; Feigin and Svergun 1987), it is necessary toassume different approximations and models in theevaluation of experimental SANS data. The most fre-quently used constraint is the homogenous coherentneutron scattering length density, q, within the bilayer:the ‘‘top-hat’’ model (see Knoll et al. 1981; Komura et al.1982; Nawroth et al. 1989; Gordeliy et al. 1993; Balgavyet al. 1998; Gilbert et al. 1999; Mason et al. 1999; Pencerand Hallett 2000; Uhrıkova et al. 2000 and referencestherein). However, fully hydrated lipid bilayers includesome amount of water inside the lipid polar headgroupregion of the bilayer and q is not homogeneous within
Eur Biophys J (2004) 33: 328–334DOI 10.1007/s00249-003-0349-0
Norbert Kucerka Æ Mikhail A. Kiselev Æ Pavol Balgavy
N. Kucerka (&)Department of Chemical Theory of Drugs,Faculty of Pharmacy,Comenius University, Kalinciakova 8, 832 32Bratislava, SlovakiaE-mail: [email protected]
M. A. KiselevFrank Laboratory of Neutron Physics,Joint Institute for Nuclear Research,141980 Dubna, Moscow Region, Russia
P. BalgavyDepartment of Physical Chemistry,Faculty of Pharmacy,Comenius University,Odbojarov 10, 832 32Bratislava, Slovakia
the bilayer. These facts have been taken into account instrip function models of the bilayer q in recent publi-cations (Balgavy et al. 2001a, 2001b; Schmiedel et al.2001). In these models, the bilayer was divided into twopolar region strips containing a limited number of watermolecules besides the lipid headgroup and the hydro-phobic region strip (‘‘3’’-strip model). Within each strip,q was supposed to be homogeneous. Introduction of astrip containing terminal methyl groups of the lipidhydrocarbon chains in the bilayer center and theassumption of a homogeneous q within each strip resultsin the ‘‘5’’-strip model. The primary aim of the presentpaper is to obtain the bilayer thickness dL and the lipidsurface area AL using this ‘‘5’’-strip model, three differ-ent approximate forms of the vesicle form factor, andthree different forms for the vesicle size distribution, aswell as different methods of fitting the experimentaldata.
Materials and methods
Sample preparation
Synthetic DMPC was purchased from Sigma (Paris, France).Heavy water (99.98% 2H2O) was obtained from Isotop (Moscow,Russia). The heavy water and DMPC were mixed in a plastic tubeand the tube was sealed. The DMPC concentration in the samplewas 1 wt%. The tube content was heated to a temperature abovethe main phase transition temperature and then cooled down toabout 10 �C. The cooling–heating cycle accompanied by sampleshaking was repeated five times. From the dispersion of multila-mellar vesicles thus obtained, extruded unilamellar vesicles wereprepared in a single-step procedure according to MacDonald et al.(1991) using the LiposoFast Basic extruder (Avestin, Ottawa,Canada). The multilamellar vesicles were extruded through onepolycarbonate filter (Nucleopore, Plesanton, USA) with pores ofdiameter 500 A, mounted in the extruder fitted with two gas-tightHamilton syringes (Hamilton, Reno, USA). The sample was sub-jected to 25 passes through the filter at a temperature above themain phase transition temperature of the lipid dispersion. An oddnumber of passes was performed to avoid contamination of thesample by large and multilamellar vesicles, which might not havepassed through the filter. The sample was filled into a quartz cell(Hellma, Mullheim, Germany) with a 2 mm sample thickness. ThepD of this preparation was about 5. The period between the samplepreparation and its measurement was 3–4 h.
SANS measurements
The SANS measurements were performed at the small-angle time-of-flight axially symmetric neutron scattering spectrometer MURN(now named YuMO in honor of the deceased Yu. M. Ostanevich)at the IBR-2 fast pulsed reactor of the Frank Laboratory ofNeutron Physics, Joint Institute for Nuclear Research in Dubna(Vagov et al. 1983; Ostanevich 1988). The spectrometer is equippedwith circular multiwire proportional 3He detectors (Ananyev et al.1978; Ostanevich 1988). The sample temperature was set to 30 �Cand controlled electronically with a precision of ±0.1 �C. The cellwith the sample was equilibrated for 1 h at the given temperature inthe sample holder before measurement. The neutron scatteringcross-section was obtained by using a vanadium standard scattereras described (Ostanevich 1988). The coherent macroscopic cross-section was calculated from the normalized cross-section accordingto procedure described by Schmiedel at al. (2001).
Evaluation of SANS data
Scattering theory
The experimentally observed coherent scattering intensity is due tothe scattering of neutrons from sample nuclei and the interferenceof scattered waves. For the monodisperse system it is given by:
I qð Þ ¼ NP qð ÞS qð Þ ð1Þ
where q is the scattering vector, N is the number of particles,P qð Þ is the particle structure factor and S qð Þ is the interparticlestructure factor (Glatter and Kratky 1982; Feigin and Svergun1987). The particle structure factor P qð Þ is equal to the squareof the form factor F qð Þ. In the case of statistically isotropiccentrosymmetric particles, one can average through the solidangle (Glatter and Kratky 1982; Feigin and Svergun 1987) toobtain:
F qð Þ ¼ 4pZ1
0
r2q rð Þsin qrð Þqr
dr ð2Þ
This equation can be solved analytically or by using some simpli-fying assumptions. The analytical solution of the form factor isreferred to as the Rayleigh–Gans–Debye formula (RGD). For the qrange used in the present paper, the interparticle structure factorS qð Þ is approximately equal to 1 for dilute and weakly interactingspherical particles, such as the aqueous dispersion of unchargedunilamellar vesicles at a phospholipid concentration of £ 1 wt%(Nawroth et al. 1989; Kiselev et al. 2001b).
Vesicle models
Hollow spheres Let us suppose that the unilamellar vesicles arehollow spheres (HS) with the aqueous phase inside and outside thebilayer. In the present paper we suppose that each of the twomonolayers in the bilayer consists of three shells. The inner radiusof the bilayer is R0, and then the radii of the individual shells followuntil the outer bilayer radius R6. The polar headgroup shell ischaracterized by the thickness dP=R1)R0=R6)R5 and the non-polar methylene and methyl groups shells are characterized bythicknesses dN=R2)R1=R5)R4 and dS=R3)R2=R4)R3, respec-tively. The bilayer thickness is then dL=2dP+2dN+2dS. The ves-icle structure factor without the background is given by theequations:
PHS qð Þ ¼ 4pq3
!2 X6i¼1
Dqi A Rið Þ � A Ri�1ð Þð Þ( )2
ð3Þ
A Rið Þ ¼ qRi cos qRið Þ � sin qRið Þ ð4Þ
where Dqi=qw)qi are the contrast values of individual stripsagainst the aqueous phase. The polar region strips can containsome amount of water per lipid molecule, NL, besides the ‘‘dry’’polar headgroup.
Equations (3) and (4) above are valid for size monodispersevesicles. The experimentally studied unilamellar vesicles have somedegree of radius polydispersity at constant values of the thicknessparameters dP, dN and dS. This polydispersity may be described bya Gaussian distribution function of the form:
fG Rð Þ ¼ 1ffiffiffiffiffiffi2pp
rRexp �ðR� RmeanÞ2
2r2R
" #ð5Þ
where R is the outer radius of the vesicles, Rmean the mean outerradius of the vesicles, and rR the standard deviation of R charac-terizing the size distribution (Komura et al. 1982). Size polydis-persity can also be successfully described by a Schulz distributionfunction (S) (Hallet et al. 1991; Pedersen et al. 1995), which has theform:
329
fS Rð Þ ¼
t þ 1
Rmean
!tþ1Rt
C t þ 1ð Þ exp"� t þ 1
Rmean
#ð6Þ
where:
t ¼ Rmean
rR
� �2
�1 ð7Þ
and where G(t) is the gamma function and t>0. The structurefactor of the polydisperse spherical vesicles is obtained by convo-luting the single particle P(q) function with the distribution func-tion f(R).
An approximate form of P(q), which includes the effects ofvesicle polydispersity, was developed by Moody (1975); we haveextended it for the ‘‘5’’-strip HS model and refer to it as M.
Planar thin sheets
In the case when the radius of the unilamellar liposomes is largerrelative to the membrane thickness, the vesicle form factor can bewritten as a product of the form factor of an infinitively thin sphereand the bilayer form factor (Kiselev et al. 2002). In our case, theform factor of a sphere describes the scattering curve in the range ofq<0.03 A)1 and the form factor of a bilayer describes the scat-tering curve for q>0.03 A)1. Thus, to analyze our scattering curvethe model of planar thin sheets (PTS) randomly distributed in theaqueous phase can be used. The structure factor without thebackground of such particles is obtained from the Fourier trans-formation of the scattering length density of randomly orientedthin sheets. For the ‘‘5’’-strip model of bilayer, it has the form:
PPTS qð Þ ¼ 4
q4X3i¼1
Dqi sin qaið Þ � sin qai�1ð Þð Þ" #2
ð8Þ
where the summation goes through one monolayer of bilayer and aidenote the borders of each monolayer shell.
Contrasts
The values of qi used in the evaluation of the experimental datawere calculated using the published neutron scattering lengths forelements (Sears 1986; Munter 1999) and the DMPC componentvolumes. The molecular volume of DMPC was obtained from theabsolute specific volume, vL=0.978 mL/g at 30 �C, measured by aneutral buoyancy method (Petrache et al. 1998) as:
VL ¼ vLMw=NA ð9Þ
where Mw is the DMPC molecular weight and NA is the Avogadronumber. To obtain the hydrocarbon region volume, the componentvolume of the headgroup, VH, was subtracted from the DMPCmolecular volume. It was then supposed that the component volumeof the methylene group, VCH2
, is independent of its position in theacyl chain and equals half of the component volume of the methylgroup, VCH3
(Nagle and Wilkinson 1978; Nagle et al. 1996; Petracheet al. 1997; Armen et al. 1998). Finally, it was supposed that thevolume of the water molecule located in the headgroup region is thesame as in the bulk aqueous phase (Wiener et al. 1988; Balgavy et al.1998) and the data collected in Weast (1969) were used. For thevolume of the ‘‘dry’’ headgroup we supposed VD=VH. The values
of VH in the literature range from 319 A3 to 360 A3 (see Balgavyet al. 2001b for references). The component volumes calculatedusing these two extreme VH values are collected in Table 1.
Resolution function
The instrumental resolution can be introduced into the calculationaccording to Ostanevich (1988) or by convolution of the intrinsic
intensity Ii with a distribution function (Pedersen 1993) whichcharacterizes the deviation in the q value:
Iexp qð Þ ¼Z
G q0ð ÞIi q0ð Þ dq0 ð10Þ
To simplify the evaluation of the experimental data, we approxi-mated the resolution function by a Gaussian function:
G q0ð Þ ¼ 1ffiffiffiffiffiffi2pp
rexp � q0 � qð Þ2
2r2
#"ð11Þ
where r is the variance of the variable q and depends on q. Thevalue of the second moment of the distribution function, r(q), wascalculated for the experimental data as the weighted average overall detector circles. Its value is available for each point of theexperimental scattering curve. In the q range used, the mean valueof r(q)/q was between 0.05 and 0.07.
Fitting of the experimental data
KP method This method was described and discussed extensively inour recent papers (Balgavy et al. 2001a, 2001b). It is supposed thatthe scattering curve can be exponentially approximated in theselected range of small q values by:
I qð Þ ¼ I 0ð Þq�2 exp �R2t q2
� �; Rtq \ 1 ð12Þ
where I(0) and Rt are constants. Recall that this approximation isgenerally referred to as the Guinier approximation. In the presentpaper, we use the range q22(0.001; 0.006) A)2. In this range, theexperimental value of Rt, Rt(exp), is obtained from the Kratky–Porod (KP) plot (ln[I(q)q2] versus q2) of the experimental SANScurve by a linear fitting procedure (see Fig. 1, Table 2). Then acomputer simulated SANS curve is calculated using the HS or PTSmodel of the vesicles and of the ‘‘5’’-strip model of the coherentscattering length density distribution in the bilayer. In the calcu-lation, the input values are the volumes Vi of different parts of thebilayer and the values of their coherent scattering amplitudes, bi. Inthe first step, the number of water molecules per one DMPCmolecule located in the bilayer polar region, NL, is fixed to onevalue from the interval NL2(0; 10) and the lipid surface area AL to
some starting values AL0 and AL
1 from the interval AL2(40; 80) A2.Then the contrasts are calculated as described above. In the caseof the HS model, the polydispersity of vesicle sizes is takeninto account either by convoluting the single particlescattering function, P(q), with one of the distribution functions,f(R), or using the approximate form of P(q) developed by Moody(1975). When convoluting with the Gaussian function, the values ofRmean=300 A and rR=91 A were used. They were calculated fromexperimental data in Balgavy et al. (1998). For convolution withthe Schulzian function, the values of Rmean=260 A and t=8 ob-tained for extruded DMPC vesicles in Kiselev et al. (2001a) wereadopted. For both models (HS and PTS), the calculated SANScurves are convoluted by the resolution function of Eqn. (11). Fi-nally, the values of Rt
2, Rt2(AL
0) and Rt2(AL
1) are obtained fromthe simulated SANS curves by the linear fitting procedure andcompared with Rt
2(exp). The starting values of AL are chosen to
fulfill the condition Rt2(AL
1)<Rt2(exp)<Rt
2(AL0). Then this
procedure is cycled by changing ALi)1 and AL
i pairs fulfillingthe condition Rt
2(ALi)<Rt
2(exp)<Rt2(AL
i)1) for the givenNL until |AL(i))AL(i)1)| £ 0.001 A2. In the following steps, NL is
Table 1 Component volumes of DMPC bilayers at 30 �C
VL (A3) 1101 1101VH (A3) 319 360VCH2
(A3) 27.929 26.464VCH3
(A3) 55.858 52.929VH2O (A3) 30.031 30.031VD2O (A3) 30.131 30.131
330
fixed to other values from the interval NL2(0; 10) and for eachvalue of NL the cycle described above is repeated. The result is a setof AL values as a function of NL. Since the volumetric data areknown, the bilayer thickness dL is calculated from AL as well.
MKP method Pencer and Hallet (2000) proposed a modifiedKratky–Porod (MKP) method based on finding the position of thefirst local maximum in the I(q)q4 versus q plot, qmax. This methodfollows the theoretical law of asymptotic behavior of a scatteringcurve. From the value of qmax they have obtained the bilayerthickness in unilamellar liposomes, supposing a homogeneousdistribution of coherent neutron scattering length density withinthe bilayer. We have extended their approach using the ‘‘5’’-stripmodel of the bilayer and the HS and PTS models of the vesicles.The experimental I(q)q4 versus q data were fitted with a polynomialin the range q2(0.035; 0.102) A)1 to obtain the position qmax(exp)of the I(q)q4 maximum. Then the simulated curves were calculatedas described above for pairs of AL(i) and AL(i)1) and the valuesof qmax(AL
i) and qmax(ALi)1) were obtained from the simulated
curves. The conditions qmax(ALi)<qmax(exp)<qmax(AL
i)1) and|AL(i))AL(i)1)| £ 0.001 A2 are used to obtain the value of AL forthe given NL. The result is a set of paired AL and NL values asabove.
Results and discussion
The experimental SANS data are shown in Figs. 1 and 2using the KP andMKP plots, respectively. The scatter of
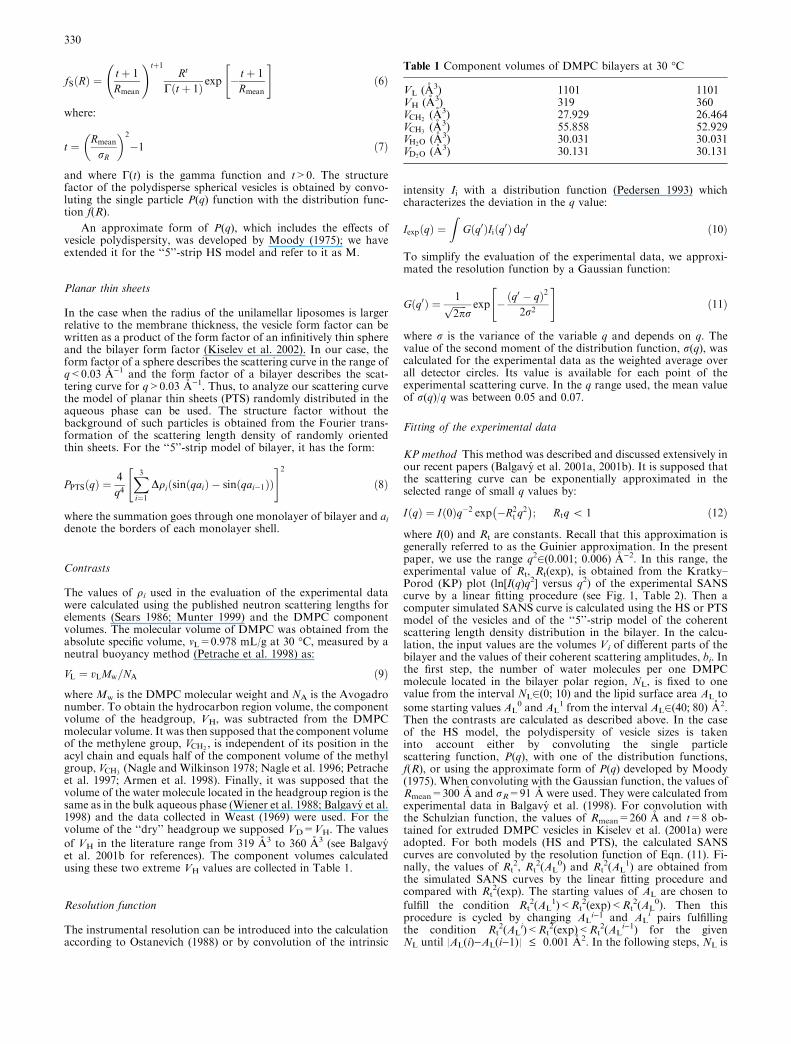
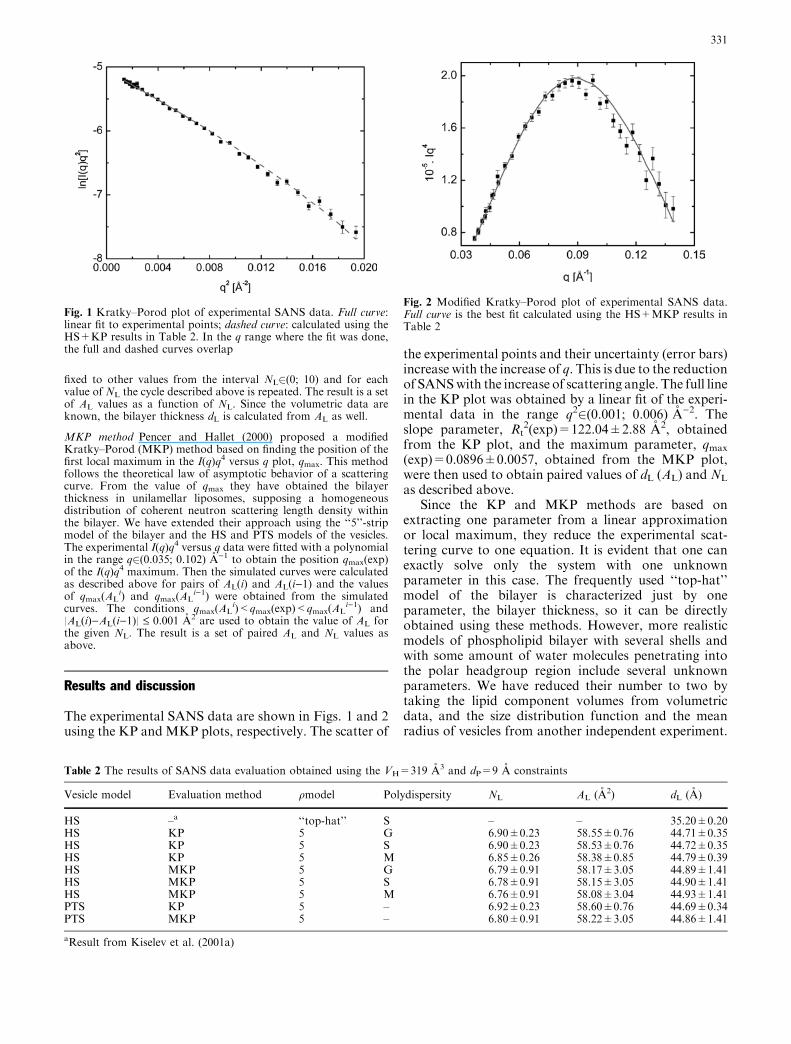
the experimental points and their uncertainty (error bars)increase with the increase of q. This is due to the reductionof SANSwith the increase of scattering angle. The full linein the KP plot was obtained by a linear fit of the experi-mental data in the range q22(0.001; 0.006) A)2. Theslope parameter, Rt
2(exp)=122.04±2.88 A2, obtainedfrom the KP plot, and the maximum parameter, qmax
(exp)=0.0896±0.0057, obtained from the MKP plot,were then used to obtain paired values of dL (AL) and NL
as described above.Since the KP and MKP methods are based on
extracting one parameter from a linear approximationor local maximum, they reduce the experimental scat-tering curve to one equation. It is evident that one canexactly solve only the system with one unknownparameter in this case. The frequently used ‘‘top-hat’’model of the bilayer is characterized just by oneparameter, the bilayer thickness, so it can be directlyobtained using these methods. However, more realisticmodels of phospholipid bilayer with several shells andwith some amount of water molecules penetrating intothe polar headgroup region include several unknownparameters. We have reduced their number to two bytaking the lipid component volumes from volumetricdata, and the size distribution function and the meanradius of vesicles from another independent experiment.
Table 2 The results of SANS data evaluation obtained using the VH=319 A3 and dP=9 A constraints
Vesicle model Evaluation method qmodel Polydispersity NL AL (A2) dL (A)
HS –a ‘‘top-hat’’ S – – 35.20±0.20HS KP 5 G 6.90±0.23 58.55±0.76 44.71±0.35HS KP 5 S 6.90±0.23 58.53±0.76 44.72±0.35HS KP 5 M 6.85±0.26 58.38±0.85 44.79±0.39HS MKP 5 G 6.79±0.91 58.17±3.05 44.89±1.41HS MKP 5 S 6.78±0.91 58.15±3.05 44.90±1.41HS MKP 5 M 6.76±0.91 58.08±3.04 44.93±1.41PTS KP 5 – 6.92±0.23 58.60±0.76 44.69±0.34PTS MKP 5 – 6.80±0.91 58.22±3.05 44.86±1.41
aResult from Kiselev et al. (2001a)
Fig. 1 Kratky–Porod plot of experimental SANS data. Full curve:linear fit to experimental points; dashed curve: calculated using theHS+KP results in Table 2. In the q range where the fit was done,the full and dashed curves overlap
Fig. 2 Modified Kratky–Porod plot of experimental SANS data.Full curve is the best fit calculated using the HS+MKP results inTable 2
331
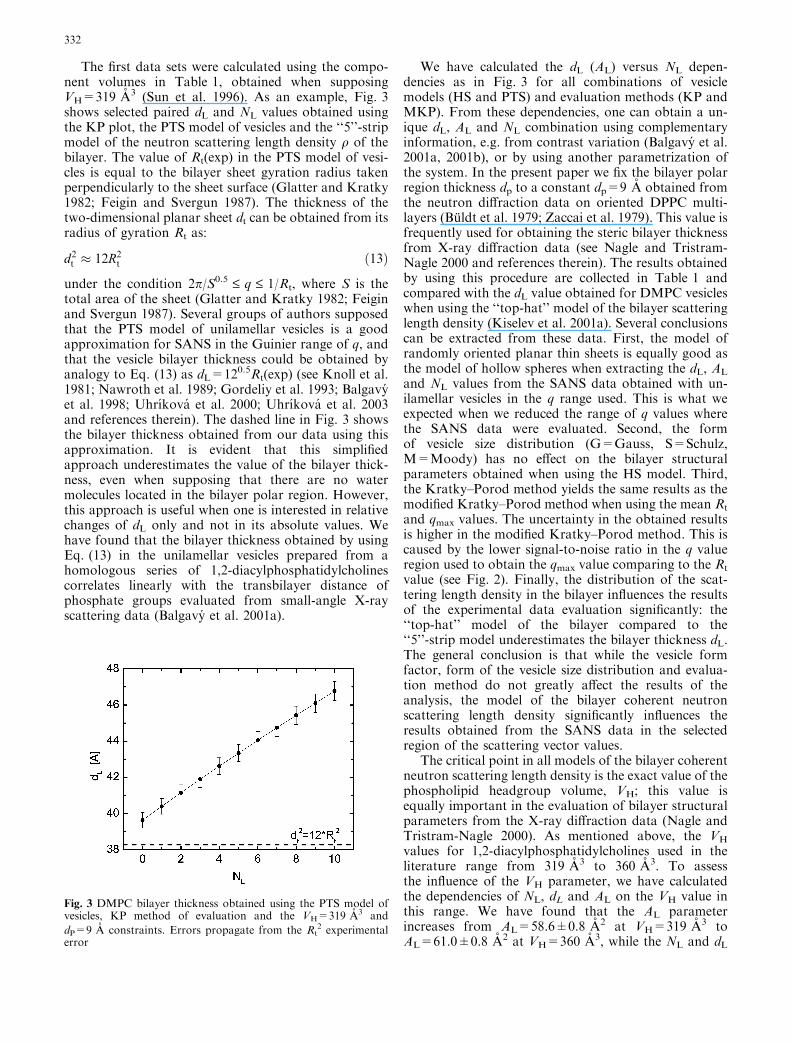
The first data sets were calculated using the compo-nent volumes in Table 1, obtained when supposingVH=319 A3 (Sun et al. 1996). As an example, Fig. 3shows selected paired dL and NL values obtained usingthe KP plot, the PTS model of vesicles and the ‘‘5’’-stripmodel of the neutron scattering length density q of thebilayer. The value of Rt(exp) in the PTS model of vesi-cles is equal to the bilayer sheet gyration radius takenperpendicularly to the sheet surface (Glatter and Kratky1982; Feigin and Svergun 1987). The thickness of thetwo-dimensional planar sheet dt can be obtained from itsradius of gyration Rt as:
d2t � 12R2
t ð13Þ
under the condition 2p/S0.5 £ q £ 1/Rt, where S is thetotal area of the sheet (Glatter and Kratky 1982; Feiginand Svergun 1987). Several groups of authors supposedthat the PTS model of unilamellar vesicles is a goodapproximation for SANS in the Guinier range of q, andthat the vesicle bilayer thickness could be obtained byanalogy to Eq. (13) as dL=120.5Rt(exp) (see Knoll et al.1981; Nawroth et al. 1989; Gordeliy et al. 1993; Balgavyet al. 1998; Uhrıkova et al. 2000; Uhrıkova et al. 2003and references therein). The dashed line in Fig. 3 showsthe bilayer thickness obtained from our data using thisapproximation. It is evident that this simplifiedapproach underestimates the value of the bilayer thick-ness, even when supposing that there are no watermolecules located in the bilayer polar region. However,this approach is useful when one is interested in relativechanges of dL only and not in its absolute values. Wehave found that the bilayer thickness obtained by usingEq. (13) in the unilamellar vesicles prepared from ahomologous series of 1,2-diacylphosphatidylcholinescorrelates linearly with the transbilayer distance ofphosphate groups evaluated from small-angle X-rayscattering data (Balgavy et al. 2001a).
We have calculated the dL (AL) versus NL depen-dencies as in Fig. 3 for all combinations of vesiclemodels (HS and PTS) and evaluation methods (KP andMKP). From these dependencies, one can obtain a un-ique dL, AL and NL combination using complementaryinformation, e.g. from contrast variation (Balgavy et al.2001a, 2001b), or by using another parametrization ofthe system. In the present paper we fix the bilayer polarregion thickness dp to a constant dp=9 A obtained fromthe neutron diffraction data on oriented DPPC multi-layers (Buldt et al. 1979; Zaccai et al. 1979). This value isfrequently used for obtaining the steric bilayer thicknessfrom X-ray diffraction data (see Nagle and Tristram-Nagle 2000 and references therein). The results obtainedby using this procedure are collected in Table 1 andcompared with the dL value obtained for DMPC vesicleswhen using the ‘‘top-hat’’ model of the bilayer scatteringlength density (Kiselev et al. 2001a). Several conclusionscan be extracted from these data. First, the model ofrandomly oriented planar thin sheets is equally good asthe model of hollow spheres when extracting the dL, AL
and NL values from the SANS data obtained with un-ilamellar vesicles in the q range used. This is what weexpected when we reduced the range of q values wherethe SANS data were evaluated. Second, the formof vesicle size distribution (G=Gauss, S=Schulz,M=Moody) has no effect on the bilayer structuralparameters obtained when using the HS model. Third,the Kratky–Porod method yields the same results as themodified Kratky–Porod method when using the mean Rt
and qmax values. The uncertainty in the obtained resultsis higher in the modified Kratky–Porod method. This iscaused by the lower signal-to-noise ratio in the q valueregion used to obtain the qmax value comparing to the Rt
value (see Fig. 2). Finally, the distribution of the scat-tering length density in the bilayer influences the resultsof the experimental data evaluation significantly: the‘‘top-hat’’ model of the bilayer compared to the‘‘5’’-strip model underestimates the bilayer thickness dL.The general conclusion is that while the vesicle formfactor, form of the vesicle size distribution and evalua-tion method do not greatly affect the results of theanalysis, the model of the bilayer coherent neutronscattering length density significantly influences theresults obtained from the SANS data in the selectedregion of the scattering vector values.
The critical point in all models of the bilayer coherentneutron scattering length density is the exact value of thephospholipid headgroup volume, VH; this value isequally important in the evaluation of bilayer structuralparameters from the X-ray diffraction data (Nagle andTristram-Nagle 2000). As mentioned above, the VH
values for 1,2-diacylphosphatidylcholines used in theliterature range from 319 A3 to 360 A3. To assessthe influence of the VH parameter, we have calculatedthe dependencies of NL, dL and AL on the VH value inthis range. We have found that the AL parameterincreases from AL=58.6±0.8 A2 at VH=319 A3 toAL=61.0±0.8 A2 at VH=360 A3, while the NL and dL
Fig. 3 DMPC bilayer thickness obtained using the PTS model ofvesicles, KP method of evaluation and the VH=319 A3 and
dP=9 A constraints. Errors propagate from the Rt2 experimental
error
332
parameters are rather insensitive to the VH change,moving from NL=6.9±0.2 and dL=44.7±0.4 A atVH=319 A3 to NL=6.3±0.2 and dL=43.6±0.3 A atVH=360 A3. Petrache et al. (1998) used the modifiedCaille theory for the interpretation of synchrotron X-raydiffraction on multilamellar DMPC vesicles and theVH=319 A3 value as we used above. They incubatedDMPC in aqueous solutions containing various amountsof polyvinylpyrrolidone, varying the osmotic pressureand, consequently, the bilayer hydration. They obtained
the DMPC surface area as AL=59.7±0.2 A2 for thefully hydrated DMPC at 30 �C by extrapolating the AL
value to zero osmotic pressure using the elastic areacompressibility modulus of DMPC and VH=319 A3.Taking into account the experimental errors, one couldconclude that the surface areas of DMPC obtained inunilamellar and multilamellar vesicles at full hydrationby SANS and by diffraction, respectively, are very close.The value of VH=319 A3 used above has been the mostreliable experimental value until recently. It was calcu-lated from the simultaneous evaluation of small- andwide-angle X-ray diffraction data obtained with the fullyhydrated lamellar Lb¢ gel phase of DPPC (Sun et al.1994). It has been suggested to be the same in the fullyhydrated fluid lamellar DPPC phase, as well as in bi-layers from lipids having the same phosphatidylcholineheadgroup (Nagle and Tristram-Nagle 2000). However,a significantly higher value of VH=331 A3 was obtainedby simultaneous evaluation of the small- and wide-anglediffraction data obtained with the DMPC lamellar gelphase (Tristram-Nagle et al. 2002). Using this latternumber of VH instead of the former changes the surfacearea value for the DMPC in unilamellar vesicles toAL=59.3±0.8 A2 (when using the ‘‘5’’-strip model of thebilayer, the HS model of the vesicles, the G distributionof their sizes and the KP evaluation method) and in thelamellar fluid phase of DMPC to AL=58.7±0.2 A2
(J. Nagle, personal communication). The AL valueobtained from SANS increases with VH, the AL calcu-lated from X-ray diffraction data decreases with VH, andour estimate of experimental uncertainty of VH is about±5–6 A3. All the available data for DMPC will matchthen within experimental error at VH=325–326 A3, i.e.at a VH value estimated for egg yolk phosphatidylcholinefrom the crystallographic data of lipid polar headgroupfragments (Small 1967).
Though the primary aim of our paper was thecomparison of different models and evaluation meth-ods used in SANS on unilamellar vesicles, a compari-son of our results with the results obtained by otherauthors has narrowed the VH interval used for theevaluation of SANS and X-ray diffraction data. Wehave shown that when using an appropriate bilayermodel, structural information could be extracted fromthe low-resolution SANS data. An obvious drawbackof the data analysis in the present paper is the useof the polar region thickness dP constraint. Thisconstraint can be avoided, e.g. by the simultaneous
evaluation of the data from SANS and from small-angle X-ray scattering on unilamellar vesicles (Balgavyet al. 2001a) and/or by using the SANS data obtainedat different contrasts (Balgavy et al. 2001b). The sec-ond type of improvement in the SANS data evaluationcould be a modification of the strip function models ofthe coherent neutron scattering density with diffusestrip borders. Finally, the distribution of the scatteringlength density in the bilayer could be modeled by, forexample, several Gaussian functions like the electrondensity in recent X-ray diffraction studies (see Nagleand Tristram-Nagle 2000; Pabst et al. 2000 for refer-ences). We plan to test these SANS data evaluationimprovements in future.
Acknowledgements N.K. and P.B. thank the staff of the CondensedMatter Division, Frank Laboratory of Neutron Physics, JointInstitute for Nuclear Research in Dubna, Russia for hospitality,M.K. thanks the Laboratory of Biophysics, Department of Physi-cal Chemistry, Faculty of Pharmacy, Comenius University inBratislava, Slovakia, for financial support and hospitality. Theauthors thank Prof. John F. Nagle for discussions at several stagesof this work, Dr. Jeremy Pencer for critical reading of the manu-script of this paper and for helpful comments, and Prof. StanislavDubnicka for generous support and encouragement. This studywas supported by the Slovak Ministry of Education VEGA grants1/7704/2000 and 1/0123/2003 to P.B. and by the ComeniusUniversity grants UK/2/2001 and UK/13/2002 to N.K. Theexperiments in Dubna were supported within the JINR project07-4-1031-99/03 ‘‘Investigation of the structure and dynamics ofcondensed matter with neutrons’’.
References
Ananyev BN, Kunchenko AB, Lazin VI, Pikelner EYa (1978) Anannular multiwire detector of slow neutrons with helium-3.JINR Commun 3-11502
Armen RS, Uitto OD, Feller SE (1998) Phospholipid componentvolumes: determination and application to bilayer structurecalculations. Biophys J 75:734–744
Balgavy P, Dubnickova M, Uhrıkova D, Yaradaikin S, Kiselev M,Gordeliy V (1998) Bilayer thickness in unilamellar extruded eggyolk phosphatidylcholine liposomes: a small-angle neutronscattering study. Acta Phys Slovaca 48:509–533
Balgavy P, Dubnickova M, Kucerka N, Kiselev MA (2001a) Bi-layer thickness and lipid interface area in unilamellar extruded1,2-diacylphosphatidylcholine liposomes: a small-angle neutronscattering study. Biochim Biophys Acta 1512:40–52
Balgavy P, Kucerka N, Gordeliy VI, Cherezov VG (2001b) Eval-uation of small-angle neutron scattering curves of unilamellarphosphatidylcholine liposomes using a multishell model of bi-layer neutron scattering length density. Acta Phys Slovaca51:53–68
Buldt G, Gally HU, Seelig J, Zaccai G (1979) Neutron diffractionstudies on phosphatidylcholine model membranes. I. Headgroup conformation. J Mol Biol 134:673–691
Feigin LA, Svergun DI (1987) Structure analysis by small-angleX-ray and neutron scattering. Plenum, New York
Gilbert RJ, Heenan RK, Timmins PA, Gingles NA, Mitchell TJ,Rowe AJ, Rossjohn J, Parker MW, Andrew PW, Byron O(1999) Studies on the structure and mechanism of a bacteria lprotein toxin by analytical ultracentrifugation and small-angleneutron scattering. J Mol Biol 293:1145–1160
Glatter O, Kratky O (1982) Small angle X-ray scattering. AcademicPress, New York
333
Gordeliy VI, Golubchikova LV, Kuklin A, Syrykh AG, Watts A(1993) The study of single biological and model membranes viasmall angle neutron scattering. Prog Colloid Polym Sci 93:252–257
Hallet FR, Nickel B, Samuels C, Krygsman PH (1991) Determi-nation of vesicle size distributions by freeze-fracture electronmicroscopy. J Electron Microsc Techn 17:459–465
Kiselev MA, Lesieur P, Kisselev AM, Lombardo D, Killany M,Lesieur S (2001a) Sucrose solutions as perspective medium tostudy the vesicle structure: SAXS and SANS study. J AlloysCompd 328:71–76
Kiselev MA, Lombardo D, Kisselev AM, Lesieur P (2001b)Structure factor of DMPC unilamellar vesicles: SAXS study atsynchrotron. FLNP Annual Report 2000, JINR, Dubna, pp136–138
Kiselev MA, Lesieur P, Kisselev AM, Lombardo D, Aksenov VL(2002) Model of separated form factors for unilamellar vesicles.Appl Phys A 74: S1654–S1656
Kiselev MA, Wartewig S, Janich M, Lesieur P, Kisselev AM,Ollivon M, Neubert R (2003) Does sucrose influence theproperties of DMPC vesicles? Chem Phys Lipids 123:31–44
KnollW, Haas J, StuhrmannHB, Fuldner HH, Vogel H, SackmannE (1981) Small-angle neutron scattering of aqueous dispersions oflipids and lipid mixtures. J Appl Crystallogr 14:191–202
Komura S, Toyoshima Y, Takeda T (1982) Neutron small-anglescattering from single walled liposomes of egg phosphatidyl-choline. Jpn J Appl Phys 21:1370–1372
MacDonald RC, MacDonald RI, Menco BP, Takeshita K, Sub-barao NK, Hu LR (1991) Small-volume extrusion apparatusfor preparation of large, unilamellar vesicles. Biochim BiophysActa 1061:297–303
Mason PC, Gaulin BD, Epand RM, Wignall GD, Lin JS (1999)Small angle neutron scattering and calorimetric studies oflarge unilamellar vesicles of the phospholipid dipal-mitoylphosphatidylcholine. Phys Rev E 59:3361–3366
Moody MF (1975) Diffraction by dispersions of spherical mem-brane vesicles. I. The basic equations. Acta Crystallogr A31:8–15
Munter A (2002) Neutron scattering lengths and cross sections.http://www.ncnr.nist.gov/resources/n-lengths/list.html
Nagle JF, Tristram-Nagle S (2000) Structure of lipid bilayers.Biochim Biophys Acta 1469:159–195
Nagle JF, Wilkinson DA (1978) Lecithin bilayers. Density mea-surement and molecular interactions. Biophys J 23:159–175
Nagle JF, Zhang R, Tristram-Nagle S, Sun W, Petrache HI, SuterRM (1996) X-ray structure determination of fully hydrated Lalpha phase dipalmitoylphosphatidylcholine bilayers. Biophys J70:1419–1431
Nawroth T, Conrad H, Dose K (1989) Neutron small angle scat-tering of liposomes in the presence of detergents. Physica B156–157:477–480
Ostanevich YuM (1988) Time-of-flight small-angle scatteringspectrometers on pulsed neutron sources. Makromol ChemMacromol Symp 15:91–103
Pabst G, Rappolt M, Amenitsch H, Laggner P (2000) Structuralinformation from multilamellar liposomes at full hydration: fullq-range fitting with high quality x-ray data. Phys Rev E62:4000–4009
Pedersen JS (1993) Resolution effects and analysis of small-angleneutron-scattering data. J Phys IV 3:491–498
Pedersen JS, Egelhaaf SU, Schurtenberger P (1995) Formation ofpolymer-like mixed micelles and vesicles in lecithin–bile saltsolutions: a small-angle neutron-scattering study. J Phys Chem99:1299–1305
Pencer J, Hallett FR (2000) Small-angle neutron scattering fromlarge unilamellar vesicles: an improved method for membranethickness determination. Phys Rev E 61:3003–3008
Petrache HI, Feller SE, Nagle JF (1997) Determination of com-ponent volumes of lipid bilayers from simulations. Biophys J72:2237–2242
Petrache HI, Tristram-Nagle S, Nagle JF (1998) Fluid phasestructure of EPC and DMPC bilayers. Chem Phys Lipids95:83–94
Schmiedel H, Jorchel P, Kiselev M, Klose G (2001) Determinationof structural parameters and hydration of unilamellar POPC/C12E4 vesicles at high water excess from neutron scatteringcurves using a novel method of evaluation. J Phys Chem B105:111–117
Sears VF (1986) Neutron scattering lengths and cross-sections. In:Skold K, Price DL (eds) Methods in experimental physics, vol23. Academic Press, New York, pp 521–550
Small DM (1967) Phase equilibria and structure of dry and hy-drated egg lecithin. J Lipid Res 8:551–557
Sun WJ, Suter RM, Knewtson MA, Worthington CR, Nagle ST,Zhang R, Nagle JF (1994) Order and disorder in fully hydratedunoriented bilayers of gel phase DPPC. Phys Rev E 49:4665–4676
Sun WJ, Tristram-Nagle S, Suter RM, Nagle JF (1996) Structure ofgel phase saturated lecithin bilayers: temperature and chainlength dependence. Biophys J 71:885–891
Tristram-Nagle S, Liu Y, Legleiter J, Nagle JF (2002) Structure ofgel phase DMPC determined by X-ray diffraction. Biophys J83:3324–3335
Uhrıkova D, Balgavy P, Kucerka N, Islamov A, Gordeliy V,Kuklin A (2000) Small-angle neutron scattering study of then-decane effect on extruded unilamellar diol-eoylphosphatidylcholine liposomes. Biophys Chem 88:165–170
Uhrıkova D, Kucerka N, Islamov A, Kuklin A, Gordeliy V,Balgavy P (2003) Small-angle neutron scattering study of thelipid bilayer thickness in unilamellar dioleoylphosphatidylcho-line vesicles prepared by the cholate dilution method: n-decaneeffect. Biochim Biophys Acta 1611:31–34
Vagov VA, Kunchenko AB, Ostanevich YuM, Salamatin IM(1983) Time-of-flight small-angle neutron scattering spectrom-eter at pulsed reactor IBR-2. JINR Commun P14-83-898
Weast RC (ed) (1969) Handbook of chemistry and physics.Chemical Rubber Co., Cleveland, pp F-4, F-5
Wiener MC, Tristram-Nagle S, Wilkinson DA, Campbell LE,Nagle JF (1988) Specific volumes of lipids in fully hydratedbilayer dispersions. Biochim Biophys Acta 938:135–142
Zaccai G, Buldt G, Seelig A, Seelig J (1979) Neutron diffractionstudies on phosphatidylcholine model membranes. II. Chainconformation and segmental disorder. J Mol Biol 134:693–706
334