Determinants of systemic hypertension in older adults in Africa
24
RESEARCH ARTICLE Open Access Determinants of systemic hypertension in older adults in Africa: a systematic review William Kofi Bosu 1,2* , Justice Moses Kwaku Aheto 3 , Eugenio Zucchelli 2,4 and Siobhan Theresa Reilly 2 Abstract Background: An estimated 55% of older adults in Africa have systemic hypertension, a major risk factor for stroke, heart failure and dementia in the region. The risk factors associated with hypertension in this population group in Africa have not been systematically evaluated. We, therefore, undertook a systematic review to identify these risk factors. Methods: We searched for population-based studies of adults aged ≥50 years living in Africa and reporting an estimate of hypertension and associated risk factors. We included articles published in any language between January 1980 and May 2018 using a comprehensive search strategy. We extracted data including the sample characteristics, prevalence of hypertension and risk factors with their effect sizes. Results: From an initial 10,719 records, we retained 63 eligible full text articles for review out of which we analyzed 23 studies made up of 19 primary and four multiple publications which had data on risk factors from bivariate or multivariable analysis. The primary studies, published from 2010 to 2018, involved a total of 30,500 participants in 12 different countries with mean ages ranging from 62.7 ± 9 years to 76.9 ± 8.4 years. Through narrative synthesis, we found consistent determinants of hypertension (overweight/obesity and history of stroke), less consistent but frequent determinants (including older age group, female sex and urban residence), inconsistent determinants (including education, wealth index, alcohol intake and physical activity) and nonsignificant covariates (marital status and having health insurance). Overall, the highest adjusted odds ratios were those associated with obesity and history of stroke. Conclusion: The key determinants of systemic hypertension in older adults in Africa are older age group, overweight/obesity, history of stroke and female sex. Health programmes should promote weight reduction throughout the life course, including during the middle and older age of African adults. Keywords: Hypertension, Determinants, Risk factors, Older adults, Systematic review, Multivariate analysis, Africa Background Africa experiences a significant burden of cardiovascular diseases, although this is often obscured by the greater priority to and interest in infectious diseases. According to the Global Burden of Disease Study, cardiovascular diseases were the leading cause of death in Africa in 2017, being responsible for 1.42 million deaths in that year or 16.4% of the total deaths in all ages compared with 11.3% of total deaths in 1990 [1]. The mortality represents a 61.0% increase over the estimated number of cardiovascular deaths in 1990. High systolic blood pressure (SBP) accounted for nearly two-thirds of the cardiovascular deaths in Africa in 2017. The region has the highest prevalence of raised blood pressure (27%) in the world [2]. The increasing burden is attributed to ageing, increasing population and adoption of unhealthy lifestyles. The weak health systems, low literacy levels, infrequent medical check-ups and prevailing poverty contribute to frequent misconceptions about hyper- tension, low detection and poor control of the disease. Africa, therefore, has an onerous task in meeting the global target of 25% relative reduction in the prevalence of hypertension by the year 2025. National responses to noncommunicable diseases (NCDs) have been slow, with many countries lacking diet and physical activity policies © The Author(s). 2019 Open Access This article is distributed under the terms of the Creative Commons Attribution 4.0 International License (http://creativecommons.org/licenses/by/4.0/), which permits unrestricted use, distribution, and reproduction in any medium, provided you give appropriate credit to the original author(s) and the source, provide a link to the Creative Commons license, and indicate if changes were made. The Creative Commons Public Domain Dedication waiver (http://creativecommons.org/publicdomain/zero/1.0/) applies to the data made available in this article, unless otherwise stated. * Correspondence: [email protected] 1 Department of Public Health and Research, West African Health Organisation, Bobo-Dioulasso 01 BP 153, Burkina Faso 2 Division of Health Research, Faculty of Health & Medicine, Furness Building, Lancaster University, Lancaster LA1 4YG, UK Full list of author information is available at the end of the article Bosu et al. BMC Cardiovascular Disorders (2019) 19:173 https://doi.org/10.1186/s12872-019-1147-7
-
Upload
khangminh22 -
Category
Documents
-
view
1 -
download
0
Transcript of Determinants of systemic hypertension in older adults in Africa
RESEARCH ARTICLE Open Access
Determinants of systemic hypertension inolder adults in Africa: a systematic reviewWilliam Kofi Bosu1,2* , Justice Moses Kwaku Aheto3, Eugenio Zucchelli2,4 and Siobhan Theresa Reilly2
Abstract
Background: An estimated 55% of older adults in Africa have systemic hypertension, a major risk factor for stroke,heart failure and dementia in the region. The risk factors associated with hypertension in this population group inAfrica have not been systematically evaluated. We, therefore, undertook a systematic review to identify these risk factors.
Methods: We searched for population-based studies of adults aged ≥50 years living in Africa and reporting an estimateof hypertension and associated risk factors. We included articles published in any language between January 1980 andMay 2018 using a comprehensive search strategy. We extracted data including the sample characteristics, prevalence ofhypertension and risk factors with their effect sizes.
Results: From an initial 10,719 records, we retained 63 eligible full text articles for review out of which we analyzed 23studies made up of 19 primary and four multiple publications which had data on risk factors from bivariate ormultivariable analysis. The primary studies, published from 2010 to 2018, involved a total of 30,500 participants in12 different countries with mean ages ranging from 62.7 ± 9 years to 76.9 ± 8.4 years. Through narrative synthesis,we found consistent determinants of hypertension (overweight/obesity and history of stroke), less consistent butfrequent determinants (including older age group, female sex and urban residence), inconsistent determinants(including education, wealth index, alcohol intake and physical activity) and nonsignificant covariates (maritalstatus and having health insurance). Overall, the highest adjusted odds ratios were those associated with obesityand history of stroke.
Conclusion: The key determinants of systemic hypertension in older adults in Africa are older age group,overweight/obesity, history of stroke and female sex. Health programmes should promote weight reductionthroughout the life course, including during the middle and older age of African adults.
Keywords: Hypertension, Determinants, Risk factors, Older adults, Systematic review, Multivariate analysis, Africa
BackgroundAfrica experiences a significant burden of cardiovasculardiseases, although this is often obscured by the greaterpriority to and interest in infectious diseases. Accordingto the Global Burden of Disease Study, cardiovasculardiseases were the leading cause of death in Africa in2017, being responsible for 1.42 million deaths in thatyear or 16.4% of the total deaths in all ages comparedwith 11.3% of total deaths in 1990 [1]. The mortalityrepresents a 61.0% increase over the estimated number
of cardiovascular deaths in 1990. High systolic bloodpressure (SBP) accounted for nearly two-thirds of thecardiovascular deaths in Africa in 2017. The region hasthe highest prevalence of raised blood pressure (27%) inthe world [2]. The increasing burden is attributed toageing, increasing population and adoption of unhealthylifestyles. The weak health systems, low literacy levels,infrequent medical check-ups and prevailing povertycontribute to frequent misconceptions about hyper-tension, low detection and poor control of the disease.Africa, therefore, has an onerous task in meeting the
global target of 25% relative reduction in the prevalenceof hypertension by the year 2025. National responses tononcommunicable diseases (NCDs) have been slow, withmany countries lacking diet and physical activity policies
© The Author(s). 2019 Open Access This article is distributed under the terms of the Creative Commons Attribution 4.0International License (http://creativecommons.org/licenses/by/4.0/), which permits unrestricted use, distribution, andreproduction in any medium, provided you give appropriate credit to the original author(s) and the source, provide a link tothe Creative Commons license, and indicate if changes were made. The Creative Commons Public Domain Dedication waiver(http://creativecommons.org/publicdomain/zero/1.0/) applies to the data made available in this article, unless otherwise stated.
* Correspondence: [email protected] of Public Health and Research, West African HealthOrganisation, Bobo-Dioulasso 01 BP 153, Burkina Faso2Division of Health Research, Faculty of Health & Medicine, Furness Building,Lancaster University, Lancaster LA1 4YG, UKFull list of author information is available at the end of the article
Bosu et al. BMC Cardiovascular Disorders (2019) 19:173 https://doi.org/10.1186/s12872-019-1147-7
[3]. In 2015, only 25.8% of African countries had deve-loped or adopted clinical practice guidelines for themanagement of hypertension [4]. On the other hand, thenumber of African countries that have conducted thechronic disease risk factor STEPS surveillance has dou-bled from 20 in 2009. There is a renewed political com-mitment to tackle NCDs following the third high-levelmeeting of the United Nations General Assembly inOctober 2018 during which Heads of State and Govern-ments committed to reorienting health systems to re-spond to the needs of the rapidly ageing population inrelation to NCDs [5].Individual studies observe that older age, high body
mass index (BMI), alcohol use, female sex and urbanresidence are among the main factors associated withhypertension in adults [6–9]. However, there have beenfew systematic reviews of the determinants of hyperten-sion in Africa [10]. Our systematic review amongworkers in West Africa found that the determinants in-cluded male sex, older age group, higher socioeconomicstatus, obesity, alcohol consumption, plasma glucose,and sodium excretion [11]. There is currently no pub-lished report of a systematic review of the determinantsof hypertension among older adults in Africa. It is in thiscontext that, we systematically reviewed the literature toidentify factors associated with hypertension in olderadults in Africa.
MethodsThis study was undertaken as part of a systematic reviewwhose protocol has been published earlier [12]. The studypopulation, search terms and the meta-analysis have beendescribed elsewhere [13]. The reporting of our findingsfollows the Preferred Reporting Items for SystematicReviews and Meta-Analyses (PRISMA) guidelines [14].The methods described here focus on the risk factorsassociated with hypertension.
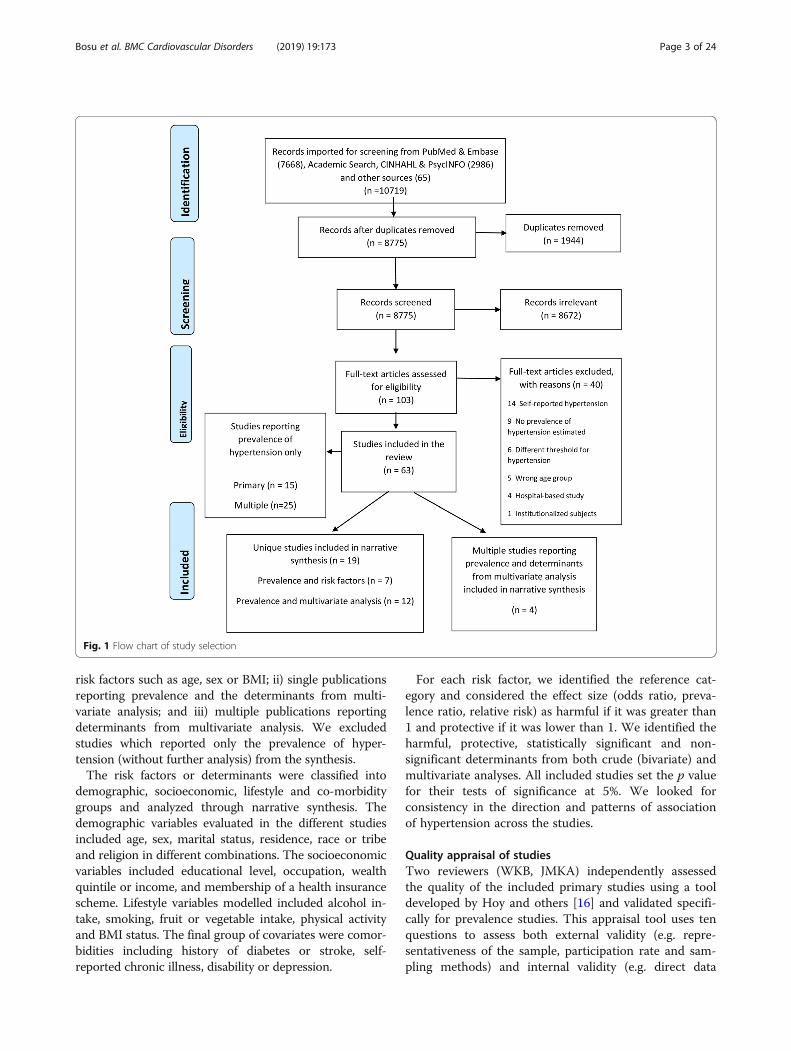
Data sources and search strategyWe searched major electronic databases, Medline andEmbase through Ovid, PsychInfo and CINAHL as well asthe African Journals Online repository for articles pub-lished between 1 January 1980 to 28 May 2018. We alsosearched grey literature via ProQuest and Google scholar.Guided by the Population, Intervention, Comparison, andOutcome (PICO)-strategy, we used search terms designedto comprehensively identify potential studies in which theprevalence of hypertension had been reported. The searchterms included those related to hypertension or bloodpressure combined with the names of each of the 58 Afri-can countries (See Additional file 1 Table S1). The identi-fied articles were screened at the title, abstract and full-text levels (Fig. 1). The bibliographies of included studieswere also searched to identify additional studies.
The included studies were limited to those on humansubjects but there was no language restriction. We tookaccount of multiple publications on the same study sam-ple and retained the one that was most informative in theanalysis (in order to avoid multiple counts). Where neces-sary, we sought supplementary information from the othermultiple publications. Longitudinal studies which reportedthe prevalence of hypertension with associated risk factorsat baseline and at the end of follow-up were considered asone study which contributed two data points. Similarly, ifa study conducted in more than one African country, sayin country A and country B, reported the prevalence ofhypertension in each country along with associated riskfactors, then it was considered as one study contributingtwo data points.
Study selection and data extractionThe included studies were population-based cross-sectional or follow-up designs conducted among subjectsaged 50 years or older living in Africa. We included stu-dies that reported the prevalence or incidence of systemichypertension along with associated risk factors or corre-lates. We excluded studies conducted among patients inhospital, residents of restricted institutions or migrantsliving outside Africa or studies reporting self-reported ornon-systemic hypertension.We used the Covidence software to manage the selec-
tion of studies [15]. This programme removed identicalstudies from different databases and also guided the in-dependent evaluation of potential studies on their con-formity with the inclusion criteria by two reviewers(WKB, JMKA). Any discrepancies between the two re-viewers were resolved through consensus.After assigning each included study a unique identifi-
cation number, we extracted data on the publicationcharacteristics, sociodemographic characteristics of thesubjects, main objectives, sampling technique, samplesize, anthropometric measurements, method of bloodpressure measurements, and the prevalence or incidenceof hypertension on to a pre-designed form in Excel. Wealso extracted age- and sex-specific prevalence of hyper-tension (where reported) as well as the crude and ad-justed effect sizes from multivariable analysis, includingthe 95% confidence intervals (CI). The latter data on in-dependent correlates of hypertension from multivariableanalysis were obtained not only from primary studies,but also, from multiple publications. These multiplepublications, which could be single- or multi-countrystudies, were all studies that had been published as andcaptured in the included primary studies.
Data synthesisWe classified included studies into three groups: i) singlepublications reporting the prevalence and some associated
Bosu et al. BMC Cardiovascular Disorders (2019) 19:173 Page 2 of 24
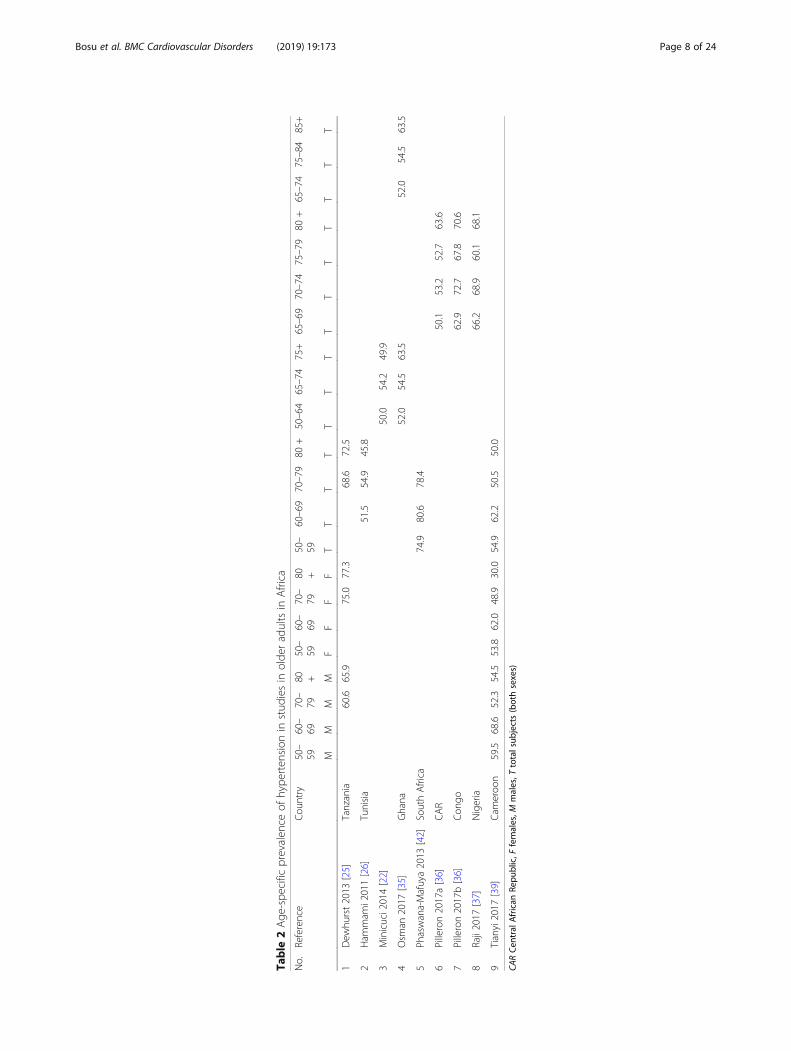
risk factors such as age, sex or BMI; ii) single publicationsreporting prevalence and the determinants from multi-variate analysis; and iii) multiple publications reportingdeterminants from multivariate analysis. We excludedstudies which reported only the prevalence of hyper-tension (without further analysis) from the synthesis.The risk factors or determinants were classified into
demographic, socioeconomic, lifestyle and co-morbiditygroups and analyzed through narrative synthesis. Thedemographic variables evaluated in the different studiesincluded age, sex, marital status, residence, race or tribeand religion in different combinations. The socioeconomicvariables included educational level, occupation, wealthquintile or income, and membership of a health insurancescheme. Lifestyle variables modelled included alcohol in-take, smoking, fruit or vegetable intake, physical activityand BMI status. The final group of covariates were comor-bidities including history of diabetes or stroke, self-reported chronic illness, disability or depression.
For each risk factor, we identified the reference cat-egory and considered the effect size (odds ratio, preva-lence ratio, relative risk) as harmful if it was greater than1 and protective if it was lower than 1. We identified theharmful, protective, statistically significant and non-significant determinants from both crude (bivariate) andmultivariate analyses. All included studies set the p valuefor their tests of significance at 5%. We looked forconsistency in the direction and patterns of associationof hypertension across the studies.
Quality appraisal of studiesTwo reviewers (WKB, JMKA) independently assessedthe quality of the included primary studies using a tooldeveloped by Hoy and others [16] and validated specifi-cally for prevalence studies. This appraisal tool uses tenquestions to assess both external validity (e.g. repre-sentativeness of the sample, participation rate and sam-pling methods) and internal validity (e.g. direct data
Fig. 1 Flow chart of study selection
Bosu et al. BMC Cardiovascular Disorders (2019) 19:173 Page 3 of 24
collection from subjects or from proxy, suitability of casedefinition, reliability of study instrument, application ofsame measurement methods for all subjects and appro-priateness of exposure period) in each study. Based onan overall judgement from these criteria, we classifiedeach study as having a low, moderate and high risk ofbias. Our decision to include studies rated as high riskof bias our narrative synthesis of risk factors was guidedby the results of a sensitivity analysis conducted toevaluate the effect of their exclusion on a pooled esti-mate of the prevalence of hypertension [13].
ResultsDescription of selected studiesWe screened 8,775 citations after removing duplicatesout of which we retrieved 103 full-text versions to assesstheir eligibility for inclusion (Fig. 1). Of the latter, 63studies, made up of 34 primary studies and 29 multiplepublications, met the inclusion criteria for review. How-ever, 40 of them reported information on only the preva-lence of hypertension and so were excluded from furtheranalysis. Of the remaining 23 studies, seven provided in-formation on risk factors associated with the prevalencewhile 16 made up of 12 primary and four multiple publi-cations provided data on the determinants of hyper-tension from multivariate analyses.One of the seven primary publications reported sex-
specific prevalence of hypertension in cities in two Afri-can countries (Bangui and Brazzaville) and so providedtwo data contributions relating to hypertension and itsassociated risk factors in two countries [17]. Of the fourmultiple publications, three were multi-country publi-cations based on the Study on Global Ageing and AdultHealth (SAGE) in Ghana and South Africa, and sothese provided a combined total of six data contri-butions [18–20]. The fourth multiple paper, based onSAGE Ghana, reported determinants separately for sys-tolic hypertension (SHTN) and diastolic hypertension(DHTN) [21]. The two respective primary publicationsfor the SAGE Ghana and South African studies wereincluded in the 12 unique studies providing data ondeterminants of hypertension [22, 23]. Thus, there were19 primary (providing 21 data points) and four multiple(non-primary) publications (providing eight data points)[18–21] of relevance that were analyzed.Based on the Hoy et al. tool, we judged that 16
(84.2%) of the 19 included primary studies had either alow (63.2%) or moderate risk (21.0%) of bias (Table 1;Additional file 2 Table S2). Three (15.8%) studies wereconsidered to have a high risk of bias, usually becauseof use of non-representative samples or low participa-tion rate. We retained these studies in the narrativesynthesis because we found in a sensitivity analysis con-ducted as part of a meta-analysis that, excluding them
did not have any significant influence on the estimatedprevalence of hypertension [13].
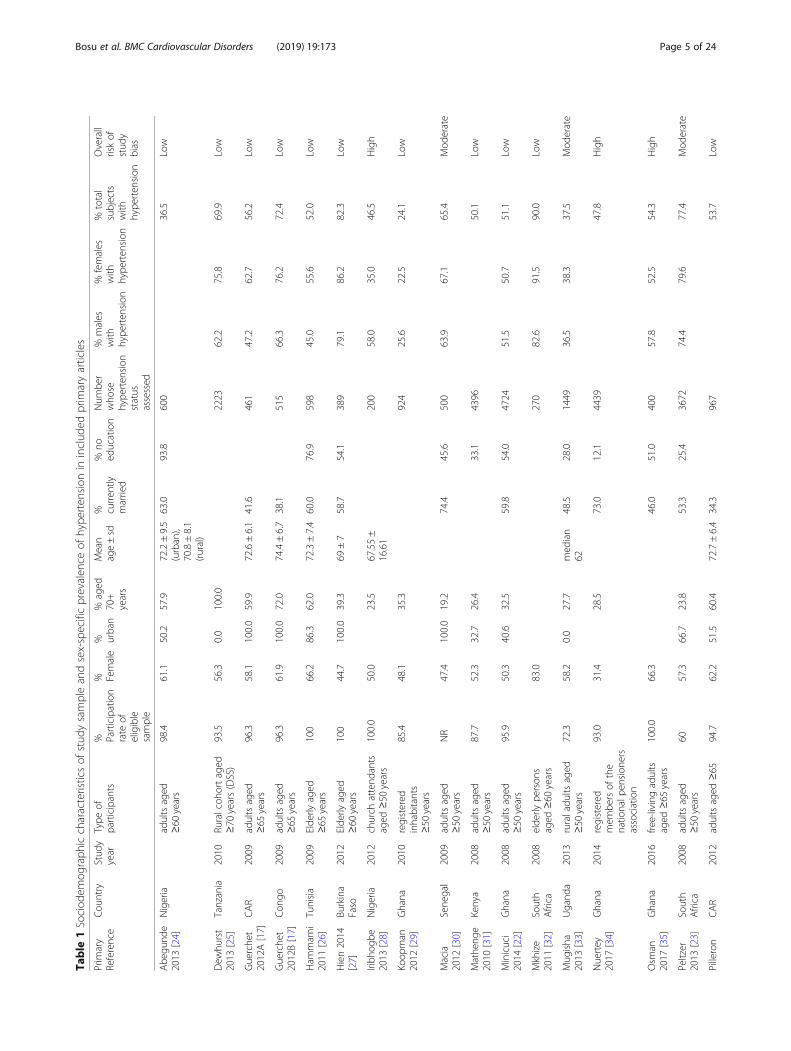
Description of sample characteristicsThe 19 primary studies / publications covered 12 differ-ent countries with four from Ghana [22, 29, 34, 35];three from Nigeria [24, 28, 37]; two each from CentralAfrican Republic/Congo [17, 36], South Africa [23, 32]and Uganda [33, 38]; and one each from Burkina Faso[27], Cameroon [39], Kenya [31], Senegal [30], Tanzania[40] and Tunisia [26] (Table 1). They involved a total of30,500 participants out of whom 30,230 had their bloodpressure measured. The prevalence of hypertensionranged from 24.1% in a rural community in northernGhana [29] to 90.0% in a South African township [32].The crude prevalence across all the subjects in the 21data contributions was 55.9%.The study participants were diverse and included
older adults living generally in the community, thoseenrolled in cohort studies or a demographic surveil-lance site, church attendees or registered members ofpensions associations (Table 1). Their ages ranged from50 to 110 years. Their mean ages, reported from tendata points(nine studies) ranged from 62.7 ± 9 years inCameroon [39] to 76.9 ± 8.4 years in Nigeria [37].Across 19 data points (18 studies), the proportion ofsubjects aged ≥70 years varied from 19.2% in Dakar,Senegal [30] to 100.0% in the rural Hai district ofTanzania [25].Overall, 51.9% of the enrolled subjects across the stu-
dies were female. In individual studies, the percentagefemale ranged from 31.4% [34] to 83.0% [41] (Table 1).Only four studies enrolled predominantly male subjects[27, 29, 30, 34]. The proportion of enrolled subjects whowere currently married ranged from 32.4% [38] to 89.4%[39] (Table 1). In the Central African Republic, 38–42%of enrolled subjects with a mean age of about 73–47years were currently married [17, 36]. In contrast, inTunisia and Nigeria where the participants were slightlyyounger with a mean age of 72 years, 60–63% of themwere currently married [24, 26]. The proportion of sub-jects with no formal education ranged from 12.1%among registered pensioners in Ghana [34] to 93.8%among elderly subjects in Nigeria [24] in 13 studies (13data points) in which it was reported (Table 1). Exceptfor one cohort study in Nigeria [37], all the studies werecross-sectional in design.The study setting was rural in four studies (four data
contributions), urban in six studies (seven data contri-butions) and mixed in nine studies (ten data contribu-tions). The mixed settings were predominantly rural[22, 31, 36, 37] or urban [23, 24, 36]. Enrolled subjectswere under demographic surveillance in Ghana [29],Tanzania [40] and Uganda [33, 38]. The proportion of
Bosu et al. BMC Cardiovascular Disorders (2019) 19:173 Page 4 of 24
Table
1Sociod
emog
raph
iccharacteristicsof
stud
ysampleandsex-specificprevalen
ceof
hype
rten
sion
ininclud
edprim
aryarticles
Prim
ary
Reference
Cou
ntry
Stud
yyear
Type
ofparticipants
% Participation
rate
ofeligible
sample
% Female
% urban
%aged
70+
years
Mean
age±sd
% curren
tlymarried
%no
education
Num
ber
who
sehype
rten
sion
status
assessed
%males
with
hype
rten
sion
%females
with
hype
rten
sion
%total
subjects
with
hype
rten
sion
Overall
riskof
stud
ybias
Abe
gund
e2013
[24]
Nigeria
adultsaged
≥60
years
98.4
61.1
50.2
57.9
72.2±9.5
(urban),
70.8±8.1
(rural)
63.0
93.8
600
36.5
Low
Dew
hurst
2013
[25]
Tanzania
2010
Ruralcoh
ortaged
≥70
years(DSS)
93.5
56.3
0.0
100.0
2223
62.2
75.8
69.9
Low
Guerche
t2012A[17]
CAR
2009
adultsaged
≥65
years
96.3
58.1
100.0
59.9
72.6±6.1
41.6
461
47.2
62.7
56.2
Low
Guerche
t2012B[17]
Con
go2009
adultsaged
≥65
years
96.3
61.9
100.0
72.0
74.4±6.7
38.1
515
66.3
76.2
72.4
Low
Ham
mam
i2011
[26]
Tunisia
2009
Elde
rlyaged
≥65
years
100
66.2
86.3
62.0
72.3±7.4
60.0
76.9
598
45.0
55.6
52.0
Low
Hien2014
[27]
Burkina
Faso
2012
Elde
rlyaged
≥60
years
100
44.7
100.0
39.3
69±7
58.7
54.1
389
79.1
86.2
82.3
Low
Iribh
ogbe
2013
[28]
Nigeria
2012
church
attend
ants
aged
≥50
years
100.0
50.0
23.5
67.55±
16.61
200
58.0
35.0
46.5
High
Koop
man
2012
[29]
Ghana
2010
registered
inhabitants
≥50
years
85.4
48.1
35.3
924
25.6
22.5
24.1
Low
Macia
2012
[30]
Sene
gal
2009
adultsaged
≥50
years
NR
47.4
100.0
19.2
74.4
45.6
500
63.9
67.1
65.4
Mod
erate
Mathe
nge
2010
[31]
Kenya
2008
adultsaged
≥50
years
87.7
52.3
32.7
26.4
33.1
4396
50.1
Low
Minicuci
2014
[22]
Ghana
2008
adultsaged
≥50
years
95.9
50.3
40.6
32.5
59.8
54.0
4724
51.5
50.7
51.1
Low
Mkhize
2011
[32]
South
Africa
2008
elde
rlype
rson
saged
≥60
years
83.0
270
82.6
91.5
90.0
Low
Mug
isha
2013
[33]
Ugand
a2013
ruraladu
ltsaged
≥50
years
72.3
58.2
0.0
27.7
med
ian
6248.5
28.0
1449
36.5
38.3
37.5
Mod
erate
Nuertey
2017
[34]
Ghana
2014
registered
mem
bersof
the
natio
nalp
ension
ers
association
93.0
31.4
28.5
73.0
12.1
4439
47.8
High
Osm
an2017
[35]
Ghana
2016
free-livingadults
aged
≥65
years
100.0
66.3
46.0
51.0
400
57.8
52.5
54.3
High
Peltzer
2013
[23]
South
Africa
2008
adultsaged
≥50
years
6057.3
66.7
23.8
53.3
25.4
3672
74.4
79.6
77.4
Mod
erate
Pilleron
CAR
2012
adultsaged
≥65
94.7
62.2
51.5
60.4
72.7±6.4
34.3
967
53.7
Low
Bosu et al. BMC Cardiovascular Disorders (2019) 19:173 Page 5 of 24

Table
1Sociod
emog
raph
iccharacteristicsof
stud
ysampleandsex-specificprevalen
ceof
hype
rten
sion
ininclud
edprim
aryarticles(Con
tinued)
Prim
ary
Reference
Cou
ntry
Stud
yyear
Type
ofparticipants
% Participation
rate
ofeligible
sample
% Female
% urban
%aged
70+
years
Mean
age±sd
% curren
tlymarried
%no
education
Num
ber
who
sehype
rten
sion
status
assessed
%males
with
hype
rten
sion
%females
with
hype
rten
sion
%total
subjects
with
hype
rten
sion
Overall
riskof
stud
ybias
2017A[36]
years
Pilleron
2017B[36]
Con
go2012
adultsaged
≥65
years
94.7
60.9
48.7
66.8
73.5±6.7
38.8
1023
68.0
Low
Raji2017
[37]
Nigeria
2007
elde
rlycoho
rtaged
≥65
years
76.8
55.1
37.4
79.0
76.9±8.4
55.7
44.8
1469
62.0
70.7
66.8
Mod
erate
Scho
lten
2011
[38]
Ugand
a2010
adultsaged
≥50
years
>99%
61.2
34.9
32.4
24.0
510
30.3
34.6
32.9
Low
Tianyi
2017
[39]
Cam
eroo
n2013
ruraladu
ltsaged
≥50
years
68.9
0.0
24.2
62.7±9
89.4
82.0
501
60.9
55.7
57.3
Low
CARCen
tral
African
Repu
blic
Bosu et al. BMC Cardiovascular Disorders (2019) 19:173 Page 6 of 24
participants who were overweight or obese, based onnine studies (11 data points), varied 100-fold from 0.8%of subjects in rural Ghana [29] to 80.0% of subjects inurban Tunisia [26]. The included studies were pub-lished from 2010 to 2018 with 2013 as the median yearof publication.
Risk factors for hypertensionExcept for one study which used a multilevel multi-nomial logit model [21], all the 16 studies providing 20data points which investigated the determinants ofhypertension did so using standard logistic regressions.The studies were conducted between 2007 and 2016 andpublished between 2010 and 2017. The number ofcovariates evaluated for their association with the bino-mial outcome of hypertension in the models rangedfrom five [19, 30] to thirteen [20]. One study providedseparate estimates for the prevalence of hypertension intwo countries, Central African Republic (CAR) and theCongo [36]. However, in the evaluation of factors asso-ciated with hypertension, the two countries were in-cluded in the same models.
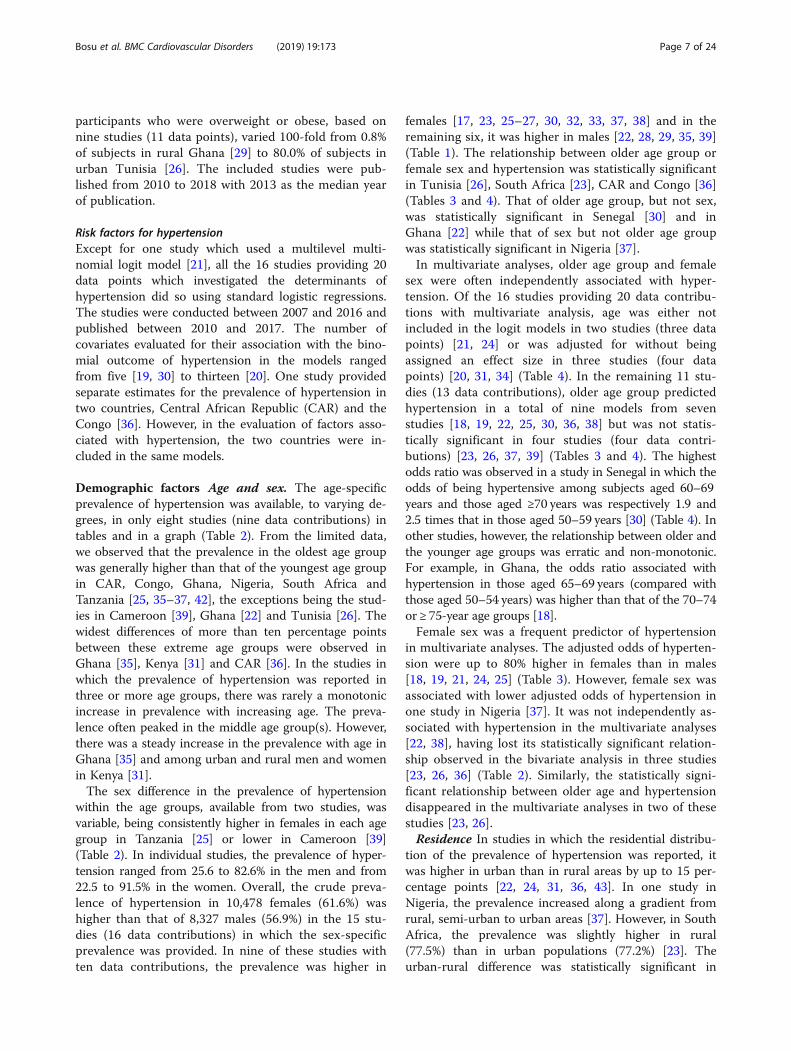
Demographic factors Age and sex. The age-specificprevalence of hypertension was available, to varying de-grees, in only eight studies (nine data contributions) intables and in a graph (Table 2). From the limited data,we observed that the prevalence in the oldest age groupwas generally higher than that of the youngest age groupin CAR, Congo, Ghana, Nigeria, South Africa andTanzania [25, 35–37, 42], the exceptions being the stud-ies in Cameroon [39], Ghana [22] and Tunisia [26]. Thewidest differences of more than ten percentage pointsbetween these extreme age groups were observed inGhana [35], Kenya [31] and CAR [36]. In the studies inwhich the prevalence of hypertension was reported inthree or more age groups, there was rarely a monotonicincrease in prevalence with increasing age. The preva-lence often peaked in the middle age group(s). However,there was a steady increase in the prevalence with age inGhana [35] and among urban and rural men and womenin Kenya [31].The sex difference in the prevalence of hypertension
within the age groups, available from two studies, wasvariable, being consistently higher in females in each agegroup in Tanzania [25] or lower in Cameroon [39](Table 2). In individual studies, the prevalence of hyper-tension ranged from 25.6 to 82.6% in the men and from22.5 to 91.5% in the women. Overall, the crude preva-lence of hypertension in 10,478 females (61.6%) washigher than that of 8,327 males (56.9%) in the 15 stu-dies (16 data contributions) in which the sex-specificprevalence was provided. In nine of these studies withten data contributions, the prevalence was higher in
females [17, 23, 25–27, 30, 32, 33, 37, 38] and in theremaining six, it was higher in males [22, 28, 29, 35, 39](Table 1). The relationship between older age group orfemale sex and hypertension was statistically significantin Tunisia [26], South Africa [23], CAR and Congo [36](Tables 3 and 4). That of older age group, but not sex,was statistically significant in Senegal [30] and inGhana [22] while that of sex but not older age groupwas statistically significant in Nigeria [37].In multivariate analyses, older age group and female
sex were often independently associated with hyper-tension. Of the 16 studies providing 20 data contribu-tions with multivariate analysis, age was either notincluded in the logit models in two studies (three datapoints) [21, 24] or was adjusted for without beingassigned an effect size in three studies (four datapoints) [20, 31, 34] (Table 4). In the remaining 11 stu-dies (13 data contributions), older age group predictedhypertension in a total of nine models from sevenstudies [18, 19, 22, 25, 30, 36, 38] but was not statis-tically significant in four studies (four data contri-butions) [23, 26, 37, 39] (Tables 3 and 4). The highestodds ratio was observed in a study in Senegal in which theodds of being hypertensive among subjects aged 60–69years and those aged ≥70 years was respectively 1.9 and2.5 times that in those aged 50–59 years [30] (Table 4). Inother studies, however, the relationship between older andthe younger age groups was erratic and non-monotonic.For example, in Ghana, the odds ratio associated withhypertension in those aged 65–69 years (compared withthose aged 50–54 years) was higher than that of the 70–74or ≥ 75-year age groups [18].Female sex was a frequent predictor of hypertension
in multivariate analyses. The adjusted odds of hyperten-sion were up to 80% higher in females than in males[18, 19, 21, 24, 25] (Table 3). However, female sex wasassociated with lower adjusted odds of hypertension inone study in Nigeria [37]. It was not independently as-sociated with hypertension in the multivariate analyses[22, 38], having lost its statistically significant relation-ship observed in the bivariate analysis in three studies[23, 26, 36] (Table 2). Similarly, the statistically signi-ficant relationship between older age and hypertensiondisappeared in the multivariate analyses in two of thesestudies [23, 26].Residence In studies in which the residential distribu-
tion of the prevalence of hypertension was reported, itwas higher in urban than in rural areas by up to 15 per-centage points [22, 24, 31, 36, 43]. In one study inNigeria, the prevalence increased along a gradient fromrural, semi-urban to urban areas [37]. However, in SouthAfrica, the prevalence was slightly higher in rural(77.5%) than in urban populations (77.2%) [23]. Theurban-rural difference was statistically significant in
Bosu et al. BMC Cardiovascular Disorders (2019) 19:173 Page 7 of 24
Table
2Age
-spe
cific
prevalen
ceof
hype
rten
sion
instud
iesin
olde
radultsin
Africa
No.
Reference
Cou
ntry
50–
5960–
6970–
7980 +
50–
5960–
6970–
7980 +
50–
5960–69
70–79
80+
50–64
65–74
75+
65–69
70–74
75–79
80+
65–74
75–84
85+
MM
MM
FF
FF
TT
TT
TT
TT
TT
TT
TT
1Dew
hurst2013
[25]
Tanzania
60.6
65.9
75.0
77.3
68.6
72.5
2Ham
mam
i2011[26]
Tunisia
51.5
54.9
45.8
3Minicuci2014[22]
50.0
54.2
49.9
4Osm
an2017
[35]
Ghana
52.0
54.5
63.5
52.0
54.5
63.5
5Ph
aswana-Mafuya2013
[42]
SouthAfrica
74.9
80.6
78.4
6Pilleron2017a[36]
CAR
50.1
53.2
52.7
63.6
7Pilleron2017b[36]
Con
go62.9
72.7
67.8
70.6
8Raji2017
[37]
Nigeria
66.2
68.9
60.1
68.1
9Tianyi2017
[39]
Cam
eroo
n59.5
68.6
52.3
54.5
53.8
62.0
48.9
30.0
54.9
62.2
50.5
50.0
CARCen
tral
African
Repu
blic,F
females,M
males,T
totalsub
jects(bothsexes)
Bosu et al. BMC Cardiovascular Disorders (2019) 19:173 Page 8 of 24

Table 3 Overview of risk factors associated with hypertension among older adults in Africa
No. Country Reference Significant harmful(higher HTN)variables in crudeanalysis
Significantprotective(lower HTN)variables incrudeanalysis
NS variables incrude analysis
HarmfulDeterminants of(higher) HTN
Determinantsof lower HTN
NS variables inmultivariate model
1 Nigeria Abegunde2013 [24]
Female gender,decreasingmonthly income,increasing BMI
alcohol intake
2 Ghana Boateng2017 [21]
For systolic stage 1or 2 HTN:increasing BMIcategory, alcoholintake, higherwealth index,female sex
traditionalreligion,
Place of residence,depression orethnicity for stage 1or 2 SHTN; religionnot significantlyassociated withstage 1 SHTN.
3 Ghana Boateng2017 [21]
For diastolic stage1 or 2 HTN:increasing BMIcategory, higherwealth index
traditionalreligion, otherreligion
Place of residence,depression orethnicity for stage 1or 2 DHTN; religionexcept traditional orother religion notsignificantlyassociated withstage of DHTN.
4 Tanzania Dewhurst2013 [25]
BMI (continuousvariable), femalesex, older agegroup ≥85 years,Chagga tribalorigin, uplandvillage dwelling
Presence of(moderate orsevere) disability (byBarthel Index Score);age groups 75–79and 80–84 years
5 Tunisia Hammami2011 [26]
Females, Older agegroup, dependency,self-reported diabetes,overweight,abdominal obesity
Education, urban-rural residence,depression, maritalstatus, physicalactivity
Diabetes, BMI,Dependency(disability)
age, sex, maritalstatus, region,educational level,physical activity,depression
6 Ghana Lloyd-Sherlock2014 [18]
older age group,female sex,increasing BMI,smoker
no education,alcoholconsumption,ruralresidence
physical activity,wealth quintile,health insurance
7 SouthAfrica
Lloyd-Sherlock2014 [18]
older age group,female sex,increasing BMI
tertiaryeducationallevel, alcoholconsumption
smoking, residence,wealth quintile,health insurance
8 Ghana Lloyd-Sherlock2017 [19]
older age group(65–69 years),female sex, richerquintiles
no education,ruralresidence
Nil
9 SouthAfrica
Lloyd-Sherlock2017 [19]
older age group(75+ years), femalesex, richest quintile
Higher(tertiary)educationallevel
urban-ruralresidence
10 Senegal Macia2012 [30]
Older age, higher BMI Sex, educationallevel, marital status,doctor visits in theprevious years
Older age group;overweight (BMI≥25 kg/m2)
Sex, educationallevel, marital status
11 Kenya Mathenge2010 [31]
Urban residence,Kikuyu tribe
Urban residence,Kikuyu tribe
Adjusted for age,sex, SES quartile,BMI, WHR, smokingstatus, alcohol use,diabetes (by
Bosu et al. BMC Cardiovascular Disorders (2019) 19:173 Page 9 of 24
Table 3 Overview of risk factors associated with hypertension among older adults in Africa (Continued)
No. Country Reference Significant harmful(higher HTN)variables in crudeanalysis
Significantprotective(lower HTN)variables incrudeanalysis
NS variables incrude analysis
HarmfulDeterminants of(higher) HTN
Determinantsof lower HTN
NS variables inmultivariate model
measurement),cholesterol
12 Ghana Minicuci2014 [22]
Older age, maritalstatus, ethnicity,residence, wealthquintile
sex older age, urbanresidence,overweight/obesity
underweightBMI < 18.5;Upper Eastand UpperWest regions
sex, educationallevel, administrativeregions exceptUpper East andUpper West
13 Ghana Nuertey2017 [34]
overweight/obesity overweight/obesity Model adjusted forsex, religion, regionof residence,ethnicity, maritalstatus, education,social class, use ofeye glasses,diabetes, arthritis,previous surgeries,mean arterialpressure, smokingstatus, hearing loss,total cholesterol,triglycerides, lowdensity lipoprotein,coronary risk ratio
14 SouthAfrica
Peltzer2013 [23]
Females, Older age(60–69-year group),coloured race; self-reported conditions(diabetes, stroke, arthritis), overall self-reported health status(moderate), beingoverweight (BMI ≥25kg/m2); having had≥5 outpatient visits inpast 12 months; overweight, severedependency
alcohol usein pastmonth;underweight(BMI < 18.5kg/m2)
marital status,educational level,wealth, urban-ruralresidence, physicalactivity, daily tobacco use, fruit andvegetable intake, social cohesion index
Coloured race, self-reported history ofstroke, frequentoutpatient visits inthe past 12 months
alcohol use inpast month
Age, sex, maritalstatus, past medicalhistory of diabetes,subject healthstatus, activitylimitation(dependency)
15 CAR,Congo
Pilleron2017 [36]
Female sex,increasing age, livingin Republic of Congo,urban residence,previous occupationas craftsman/storekeeper or beingjobless, increasingBMI, high cholesterol,eating 3 or moremeals daily
currentsmoker, highphysicalactivity ≥150min/wk
marital status,primary education,diabetes bymeasurement,alcohol intake
increasing age,living in Congo,previousoccupation ascraftsman/storekeeper orbeing jobless,increasing BMI,eating 3 or moremeals daily
current or ex-smoker, highphysical activity ≥150min/wk
sex, rural-urban residence, primary education, cholesterollevel, diabetes, alcohol consumption
16 Nigeria Raji 2017[37]
female sex,unmarried, urbanresidence, neversmoked, never drankalcohol, overweight/obesity
older age,educational level,socioeconomic class,self-reported diabetes, history oftransient ischaemicattack, diagnosis oflifetime depression
high educationallevel, urban orsemi-urban residence, overweight/obesity
female sex,currentlyunmarried
older age, high SES,current smoking,current alcoholconsumption,absence of self-reported diabetes
17 Uganda Scholten2011 [38]
Older age, urbanresidence
HIV infection(on or not onART)
sex, marital status,education
Bosu et al. BMC Cardiovascular Disorders (2019) 19:173 Page 10 of 24
studies in Ghana [22], Kenya [31] and Uganda [38] butnot in studies in Tunisia [26] or South Africa [23] (Ta-bles 3 and 4). In multivariate analyses, urban residencewas often significantly associated with hypertension, asin Ghana, Nigeria and Kenya with adjusted odds ratiosabout 30–40% higher than in the rural areas [22, 31, 37,38]. It was not significantly associated with hypertensionin other studies in Ghana and CAR/Congo [21, 36]. Inthe multi-country SAGE study in older adults, urbanresidence predicted hypertension in Ghana in two differ-ent models but not in South Africa [18, 19] (Table 4).The adjusted odds ratio associated with hypertension
among elderly subjects living in Congo was 68% higherthan that of those living in the CAR [36]. In Tanzania,hypertension in elderly aged ≥70 years was more fre-quently associated with residence in upland than in low-land villages [25]. Compared with those residing in theGreater Accra Region, older adults in two of the poorestregions in Ghana, the Upper East and Upper West re-gions had 63–76% lower odds of having hypertensionafter controlling for other factors [22]. Otherwise, resi-dence in the other administrative regions of Ghana wasnot independently associated with hypertension.Other demographic factors Marital status did not
make a statistically significant difference to the preva-lence of hypertension in bivariate analyses [26, 30, 36,39]. For example, in Senegal, 66.1% of married subjectscompared with 63.3% of unmarried subjects had hyper-tension [30]. In multivariate analyses, marital status wasnot independently associated with hypertension in thestudies in which this relationship was assessed [23, 26,
30, 38, 39] except in Nigeria where being unmarried hada protective effect [37] (Table 4).Only two studies evaluated ethnicity and found that it
was independently associated with hypertension in therural Hai district of Tanzania [25] and in the Nakurudistrict of Kenya [31] (Tables 3 and 4). The adjusted oddsratios associated with hypertension comparing the Chaggatribe to the non-Chagga tribes and comparing Kikuyus tothe Kalenjins were 1.65 (95% CI 1.18–2.30) [25] and 1.4(95% CI 1.2–1.7) [31] in the two respective studies(Table 4). The odds of having hypertension amongcoloured South African older adults was 89% greater thanthat among black Africans [23]. Practitioners of traditionalreligion faith in Ghana had 0.35–0.38 times the adjustedodds of having stage 2 SHTN or DHTN as those with noreligion [21].
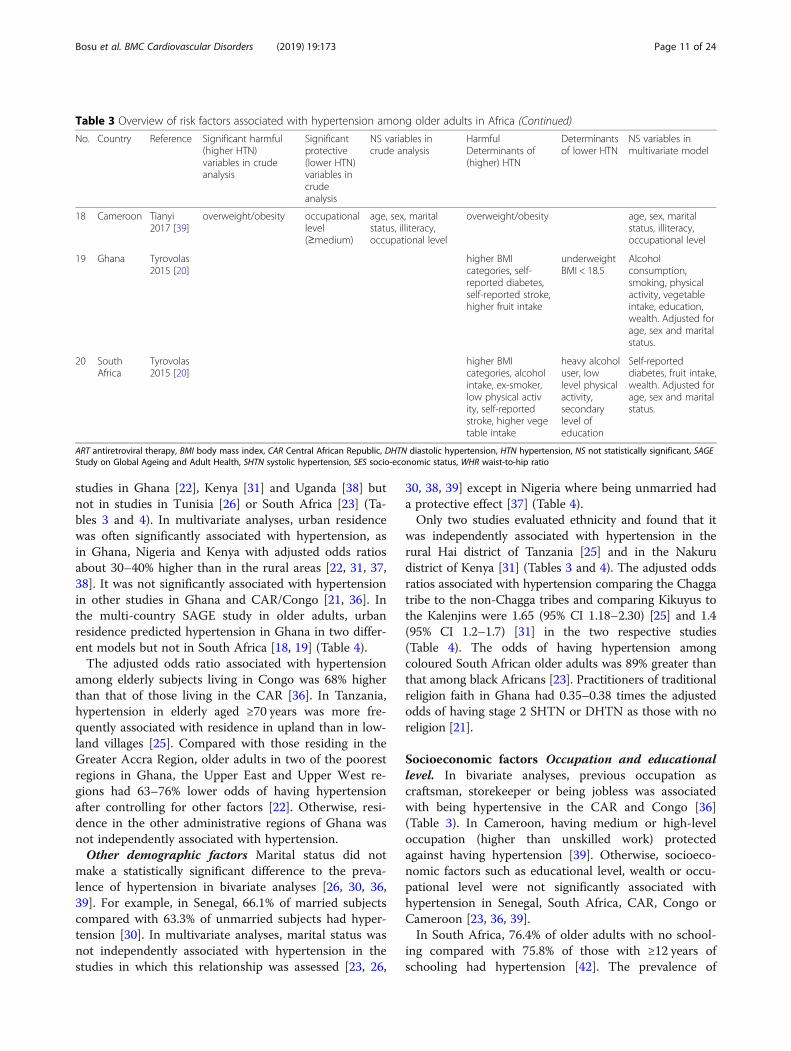
Socioeconomic factors Occupation and educationallevel. In bivariate analyses, previous occupation ascraftsman, storekeeper or being jobless was associatedwith being hypertensive in the CAR and Congo [36](Table 3). In Cameroon, having medium or high-leveloccupation (higher than unskilled work) protectedagainst having hypertension [39]. Otherwise, socioeco-nomic factors such as educational level, wealth or occu-pational level were not significantly associated withhypertension in Senegal, South Africa, CAR, Congo orCameroon [23, 36, 39].In South Africa, 76.4% of older adults with no school-
ing compared with 75.8% of those with ≥12 years ofschooling had hypertension [42]. The prevalence of
Table 3 Overview of risk factors associated with hypertension among older adults in Africa (Continued)
No. Country Reference Significant harmful(higher HTN)variables in crudeanalysis
Significantprotective(lower HTN)variables incrudeanalysis
NS variables incrude analysis
HarmfulDeterminants of(higher) HTN
Determinantsof lower HTN
NS variables inmultivariate model
18 Cameroon Tianyi2017 [39]
overweight/obesity occupationallevel(≥medium)
age, sex, maritalstatus, illiteracy,occupational level
overweight/obesity age, sex, maritalstatus, illiteracy,occupational level
19 Ghana Tyrovolas2015 [20]
higher BMIcategories, self-reported diabetes,self-reported stroke,higher fruit intake
underweightBMI < 18.5
Alcoholconsumption,smoking, physicalactivity, vegetableintake, education,wealth. Adjusted forage, sex and maritalstatus.
20 SouthAfrica
Tyrovolas2015 [20]
higher BMIcategories, alcoholintake, ex-smoker,low physical activity, self-reportedstroke, higher vegetable intake
heavy alcoholuser, lowlevel physicalactivity,secondarylevel ofeducation
Self-reporteddiabetes, fruit intake,wealth. Adjusted forage, sex and maritalstatus.
ART antiretroviral therapy, BMI body mass index, CAR Central African Republic, DHTN diastolic hypertension, HTN hypertension, NS not statistically significant, SAGEStudy on Global Ageing and Adult Health, SHTN systolic hypertension, SES socio-economic status, WHR waist-to-hip ratio
Bosu et al. BMC Cardiovascular Disorders (2019) 19:173 Page 11 of 24
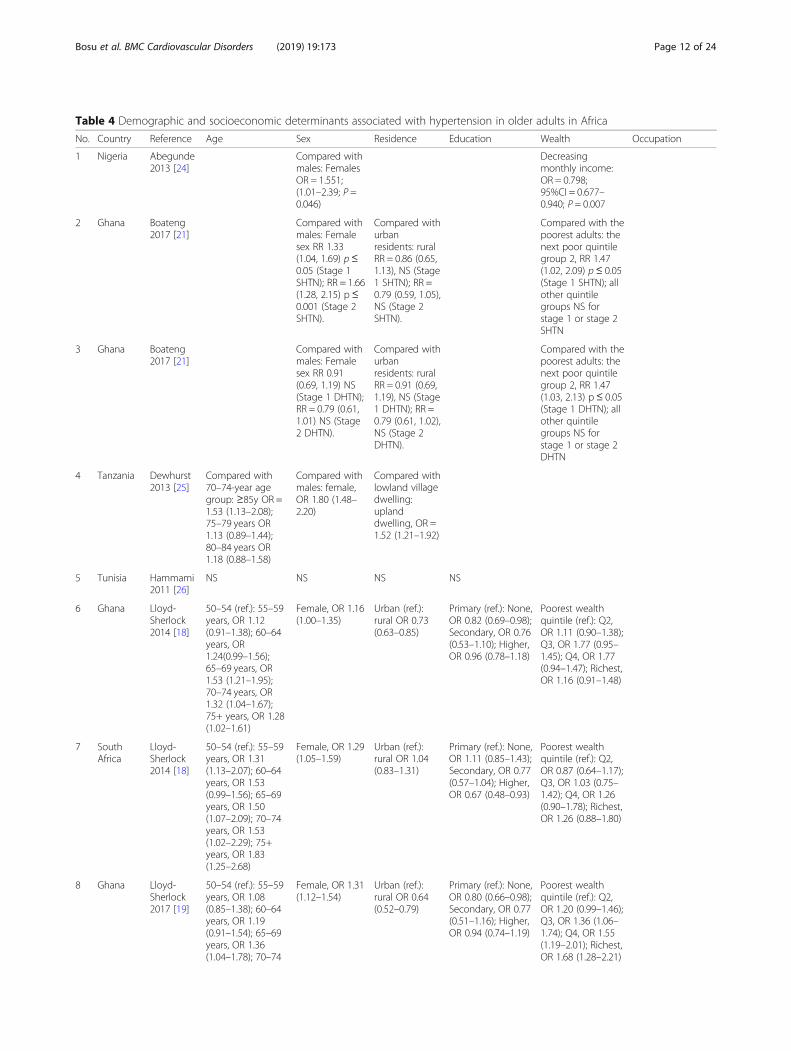
Table 4 Demographic and socioeconomic determinants associated with hypertension in older adults in Africa
No. Country Reference Age Sex Residence Education Wealth Occupation
1 Nigeria Abegunde2013 [24]
Compared withmales: FemalesOR = 1.551;(1.01–2.39; P =0.046)
Decreasingmonthly income:OR = 0.798;95%CI = 0.677–0.940; P = 0.007
2 Ghana Boateng2017 [21]
Compared withmales: Femalesex RR 1.33(1.04, 1.69) p≤0.05 (Stage 1SHTN); RR = 1.66(1.28, 2.15) p ≤0.001 (Stage 2SHTN).
Compared withurbanresidents: ruralRR = 0.86 (0.65,1.13), NS (Stage1 SHTN); RR =0.79 (0.59, 1.05),NS (Stage 2SHTN).
Compared with thepoorest adults: thenext poor quintilegroup 2, RR 1.47(1.02, 2.09) p≤ 0.05(Stage 1 SHTN); allother quintilegroups NS forstage 1 or stage 2SHTN
3 Ghana Boateng2017 [21]
Compared withmales: Femalesex RR 0.91(0.69, 1.19) NS(Stage 1 DHTN);RR = 0.79 (0.61,1.01) NS (Stage2 DHTN).
Compared withurbanresidents: ruralRR = 0.91 (0.69,1.19), NS (Stage1 DHTN); RR =0.79 (0.61, 1.02),NS (Stage 2DHTN).
Compared with thepoorest adults: thenext poor quintilegroup 2, RR 1.47(1.03, 2.13) p ≤ 0.05(Stage 1 DHTN); allother quintilegroups NS forstage 1 or stage 2DHTN
4 Tanzania Dewhurst2013 [25]
Compared with70–74-year agegroup: ≥85y OR =1.53 (1.13–2.08);75–79 years OR1.13 (0.89–1.44);80–84 years OR1.18 (0.88–1.58)
Compared withmales: female,OR 1.80 (1.48–2.20)
Compared withlowland villagedwelling:uplanddwelling, OR =1.52 (1.21–1.92)
5 Tunisia Hammami2011 [26]
NS NS NS NS
6 Ghana Lloyd-Sherlock2014 [18]
50–54 (ref.): 55–59years, OR 1.12(0.91–1.38); 60–64years, OR1.24(0.99–1.56);65–69 years, OR1.53 (1.21–1.95);70–74 years, OR1.32 (1.04–1.67);75+ years, OR 1.28(1.02–1.61)
Female, OR 1.16(1.00–1.35)
Urban (ref.):rural OR 0.73(0.63–0.85)
Primary (ref.): None,OR 0.82 (0.69–0.98);Secondary, OR 0.76(0.53–1.10); Higher,OR 0.96 (0.78–1.18)
Poorest wealthquintile (ref.): Q2,OR 1.11 (0.90–1.38);Q3, OR 1.77 (0.95–1.45); Q4, OR 1.77(0.94–1.47); Richest,OR 1.16 (0.91–1.48)
7 SouthAfrica
Lloyd-Sherlock2014 [18]
50–54 (ref.): 55–59years, OR 1.31(1.13–2.07); 60–64years, OR 1.53(0.99–1.56); 65–69years, OR 1.50(1.07–2.09); 70–74years, OR 1.53(1.02–2.29); 75+years, OR 1.83(1.25–2.68)
Female, OR 1.29(1.05–1.59)
Urban (ref.):rural OR 1.04(0.83–1.31)
Primary (ref.): None,OR 1.11 (0.85–1.43);Secondary, OR 0.77(0.57–1.04); Higher,OR 0.67 (0.48–0.93)
Poorest wealthquintile (ref.): Q2,OR 0.87 (0.64–1.17);Q3, OR 1.03 (0.75–1.42); Q4, OR 1.26(0.90–1.78); Richest,OR 1.26 (0.88–1.80)
8 Ghana Lloyd-Sherlock2017 [19]
50–54 (ref.): 55–59years, OR 1.08(0.85–1.38); 60–64years, OR 1.19(0.91–1.54); 65–69years, OR 1.36(1.04–1.78); 70–74
Female, OR 1.31(1.12–1.54)
Urban (ref.):rural OR 0.64(0.52–0.79)
Primary (ref.): None,OR 0.80 (0.66–0.98);Secondary, OR 0.77(0.51–1.16); Higher,OR 0.94 (0.74–1.19)
Poorest wealthquintile (ref.): Q2,OR 1.20 (0.99–1.46);Q3, OR 1.36 (1.06–1.74); Q4, OR 1.55(1.19–2.01); Richest,OR 1.68 (1.28–2.21)
Bosu et al. BMC Cardiovascular Disorders (2019) 19:173 Page 12 of 24
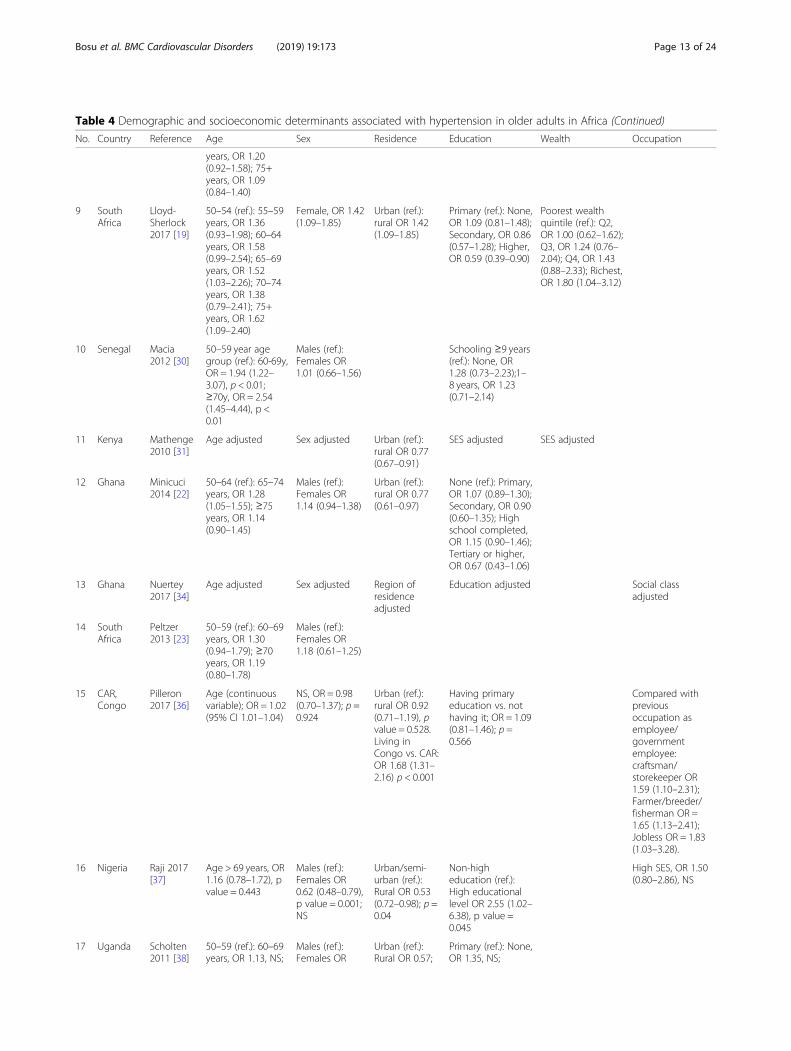
Table 4 Demographic and socioeconomic determinants associated with hypertension in older adults in Africa (Continued)
No. Country Reference Age Sex Residence Education Wealth Occupation
years, OR 1.20(0.92–1.58); 75+years, OR 1.09(0.84–1.40)
9 SouthAfrica
Lloyd-Sherlock2017 [19]
50–54 (ref.): 55–59years, OR 1.36(0.93–1.98); 60–64years, OR 1.58(0.99–2.54); 65–69years, OR 1.52(1.03–2.26); 70–74years, OR 1.38(0.79–2.41); 75+years, OR 1.62(1.09–2.40)
Female, OR 1.42(1.09–1.85)
Urban (ref.):rural OR 1.42(1.09–1.85)
Primary (ref.): None,OR 1.09 (0.81–1.48);Secondary, OR 0.86(0.57–1.28); Higher,OR 0.59 (0.39–0.90)
Poorest wealthquintile (ref.): Q2,OR 1.00 (0.62–1.62);Q3, OR 1.24 (0.76–2.04); Q4, OR 1.43(0.88–2.33); Richest,OR 1.80 (1.04–3.12)
10 Senegal Macia2012 [30]
50–59 year agegroup (ref.): 60-69y,OR = 1.94 (1.22–3.07), p < 0.01;≥70y, OR = 2.54(1.45–4.44), p <0.01
Males (ref.):Females OR1.01 (0.66–1.56)
Schooling ≥9 years(ref.): None, OR1.28 (0.73–2.23);1–8 years, OR 1.23(0.71–2.14)
11 Kenya Mathenge2010 [31]
Age adjusted Sex adjusted Urban (ref.):rural OR 0.77(0.67–0.91)
SES adjusted SES adjusted
12 Ghana Minicuci2014 [22]
50–64 (ref.): 65–74years, OR 1.28(1.05–1.55); ≥75years, OR 1.14(0.90–1.45)
Males (ref.):Females OR1.14 (0.94–1.38)
Urban (ref.):rural OR 0.77(0.61–0.97)
None (ref.): Primary,OR 1.07 (0.89–1.30);Secondary, OR 0.90(0.60–1.35); Highschool completed,OR 1.15 (0.90–1.46);Tertiary or higher,OR 0.67 (0.43–1.06)
13 Ghana Nuertey2017 [34]
Age adjusted Sex adjusted Region ofresidenceadjusted
Education adjusted Social classadjusted
14 SouthAfrica
Peltzer2013 [23]
50–59 (ref.): 60–69years, OR 1.30(0.94–1.79); ≥70years, OR 1.19(0.80–1.78)
Males (ref.):Females OR1.18 (0.61–1.25)
15 CAR,Congo
Pilleron2017 [36]
Age (continuousvariable); OR = 1.02(95% CI 1.01–1.04)
NS, OR = 0.98(0.70–1.37); p =0.924
Urban (ref.):rural OR 0.92(0.71–1.19), pvalue = 0.528.Living inCongo vs. CAR:OR 1.68 (1.31–2.16) p < 0.001
Having primaryeducation vs. nothaving it; OR = 1.09(0.81–1.46); p =0.566
Compared withpreviousoccupation asemployee/governmentemployee:craftsman/storekeeper OR1.59 (1.10–2.31);Farmer/breeder/fisherman OR =1.65 (1.13–2.41);Jobless OR = 1.83(1.03–3.28).
16 Nigeria Raji 2017[37]
Age > 69 years, OR1.16 (0.78–1.72), pvalue = 0.443
Males (ref.):Females OR0.62 (0.48–0.79),p value = 0.001;NS
Urban/semi-urban (ref.):Rural OR 0.53(0.72–0.98); p =0.04
Non-higheducation (ref.):High educationallevel OR 2.55 (1.02–6.38), p value =0.045
High SES, OR 1.50(0.80–2.86), NS
17 Uganda Scholten2011 [38]
50–59 (ref.): 60–69years, OR 1.13, NS;
Males (ref.):Females OR
Urban (ref.):Rural OR 0.57;
Primary (ref.): None,OR 1.35, NS;
Bosu et al. BMC Cardiovascular Disorders (2019) 19:173 Page 13 of 24
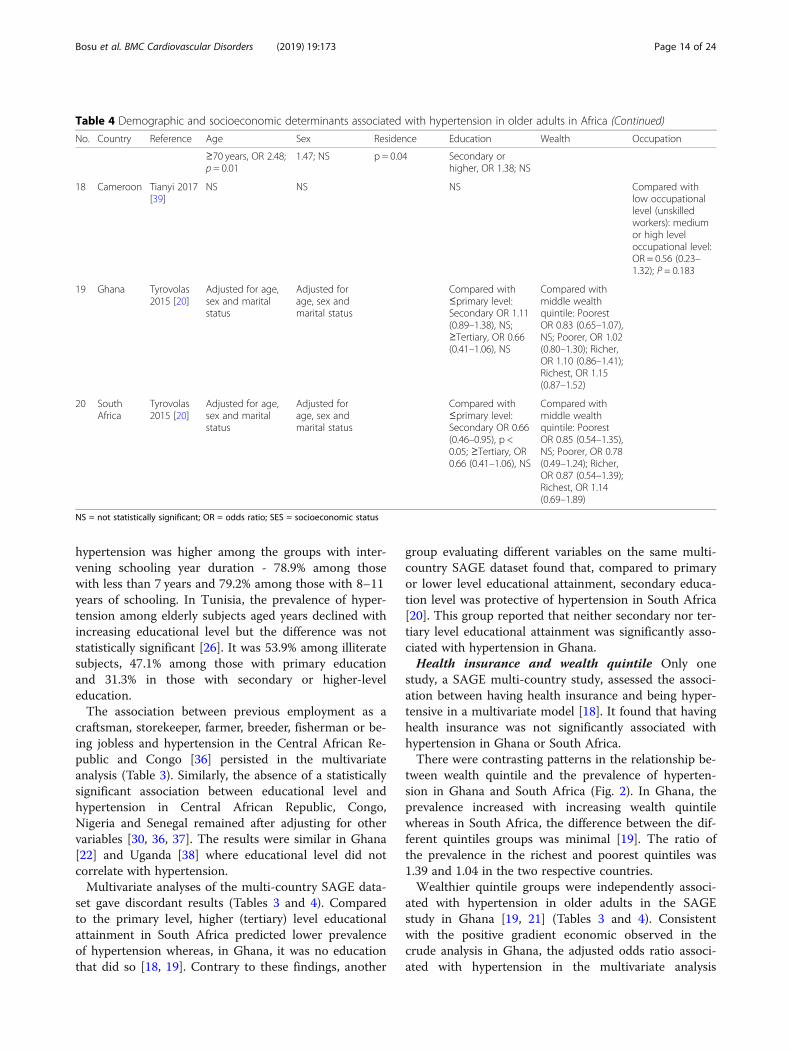
hypertension was higher among the groups with inter-vening schooling year duration - 78.9% among thosewith less than 7 years and 79.2% among those with 8–11years of schooling. In Tunisia, the prevalence of hyper-tension among elderly subjects aged years declined withincreasing educational level but the difference was notstatistically significant [26]. It was 53.9% among illiteratesubjects, 47.1% among those with primary educationand 31.3% in those with secondary or higher-leveleducation.The association between previous employment as a
craftsman, storekeeper, farmer, breeder, fisherman or be-ing jobless and hypertension in the Central African Re-public and Congo [36] persisted in the multivariateanalysis (Table 3). Similarly, the absence of a statisticallysignificant association between educational level andhypertension in Central African Republic, Congo,Nigeria and Senegal remained after adjusting for othervariables [30, 36, 37]. The results were similar in Ghana[22] and Uganda [38] where educational level did notcorrelate with hypertension.Multivariate analyses of the multi-country SAGE data-
set gave discordant results (Tables 3 and 4). Comparedto the primary level, higher (tertiary) level educationalattainment in South Africa predicted lower prevalenceof hypertension whereas, in Ghana, it was no educationthat did so [18, 19]. Contrary to these findings, another
group evaluating different variables on the same multi-country SAGE dataset found that, compared to primaryor lower level educational attainment, secondary educa-tion level was protective of hypertension in South Africa[20]. This group reported that neither secondary nor ter-tiary level educational attainment was significantly asso-ciated with hypertension in Ghana.Health insurance and wealth quintile Only one
study, a SAGE multi-country study, assessed the associ-ation between having health insurance and being hyper-tensive in a multivariate model [18]. It found that havinghealth insurance was not significantly associated withhypertension in Ghana or South Africa.There were contrasting patterns in the relationship be-
tween wealth quintile and the prevalence of hyperten-sion in Ghana and South Africa (Fig. 2). In Ghana, theprevalence increased with increasing wealth quintilewhereas in South Africa, the difference between the dif-ferent quintiles groups was minimal [19]. The ratio ofthe prevalence in the richest and poorest quintiles was1.39 and 1.04 in the two respective countries.Wealthier quintile groups were independently associ-
ated with hypertension in older adults in the SAGEstudy in Ghana [19, 21] (Tables 3 and 4). Consistentwith the positive gradient economic observed in thecrude analysis in Ghana, the adjusted odds ratio associ-ated with hypertension in the multivariate analysis
Table 4 Demographic and socioeconomic determinants associated with hypertension in older adults in Africa (Continued)
No. Country Reference Age Sex Residence Education Wealth Occupation
≥70 years, OR 2.48;p = 0.01
1.47; NS p = 0.04 Secondary orhigher, OR 1.38; NS
18 Cameroon Tianyi 2017[39]
NS NS NS Compared withlow occupationallevel (unskilledworkers): mediumor high leveloccupational level:OR = 0.56 (0.23–1.32); P = 0.183
19 Ghana Tyrovolas2015 [20]
Adjusted for age,sex and maritalstatus
Adjusted forage, sex andmarital status
Compared with≤primary level:Secondary OR 1.11(0.89–1.38), NS;≥Tertiary, OR 0.66(0.41–1.06), NS
Compared withmiddle wealthquintile: PoorestOR 0.83 (0.65–1.07),NS; Poorer, OR 1.02(0.80–1.30); Richer,OR 1.10 (0.86–1.41);Richest, OR 1.15(0.87–1.52)
20 SouthAfrica
Tyrovolas2015 [20]
Adjusted for age,sex and maritalstatus
Adjusted forage, sex andmarital status
Compared with≤primary level:Secondary OR 0.66(0.46–0.95), p <0.05; ≥Tertiary, OR0.66 (0.41–1.06), NS
Compared withmiddle wealthquintile: PoorestOR 0.85 (0.54–1.35),NS; Poorer, OR 0.78(0.49–1.24); Richer,OR 0.87 (0.54–1.39);Richest, OR 1.14(0.69–1.89)
NS = not statistically significant; OR = odds ratio; SES = socioeconomic status
Bosu et al. BMC Cardiovascular Disorders (2019) 19:173 Page 14 of 24
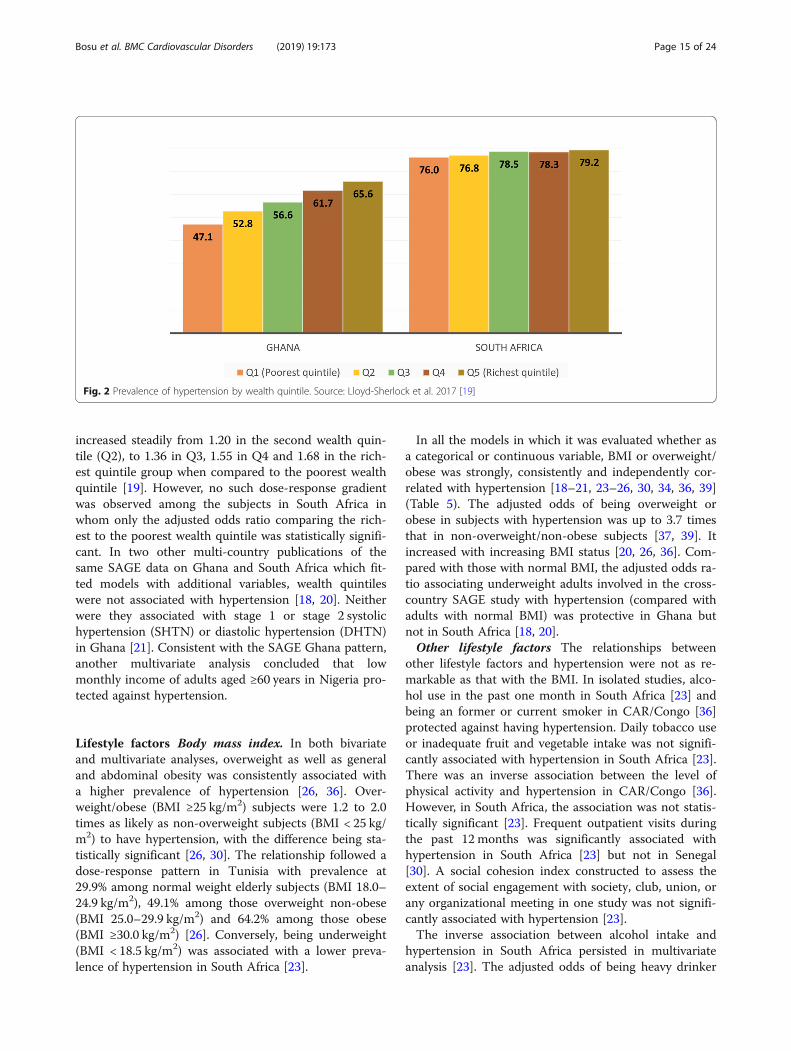
increased steadily from 1.20 in the second wealth quin-tile (Q2), to 1.36 in Q3, 1.55 in Q4 and 1.68 in the rich-est quintile group when compared to the poorest wealthquintile [19]. However, no such dose-response gradientwas observed among the subjects in South Africa inwhom only the adjusted odds ratio comparing the rich-est to the poorest wealth quintile was statistically signifi-cant. In two other multi-country publications of thesame SAGE data on Ghana and South Africa which fit-ted models with additional variables, wealth quintileswere not associated with hypertension [18, 20]. Neitherwere they associated with stage 1 or stage 2 systolichypertension (SHTN) or diastolic hypertension (DHTN)in Ghana [21]. Consistent with the SAGE Ghana pattern,another multivariate analysis concluded that lowmonthly income of adults aged ≥60 years in Nigeria pro-tected against hypertension.
Lifestyle factors Body mass index. In both bivariateand multivariate analyses, overweight as well as generaland abdominal obesity was consistently associated witha higher prevalence of hypertension [26, 36]. Over-weight/obese (BMI ≥25 kg/m2) subjects were 1.2 to 2.0times as likely as non-overweight subjects (BMI < 25 kg/m2) to have hypertension, with the difference being sta-tistically significant [26, 30]. The relationship followed adose-response pattern in Tunisia with prevalence at29.9% among normal weight elderly subjects (BMI 18.0–24.9 kg/m2), 49.1% among those overweight non-obese(BMI 25.0–29.9 kg/m2) and 64.2% among those obese(BMI ≥30.0 kg/m2) [26]. Conversely, being underweight(BMI < 18.5 kg/m2) was associated with a lower preva-lence of hypertension in South Africa [23].
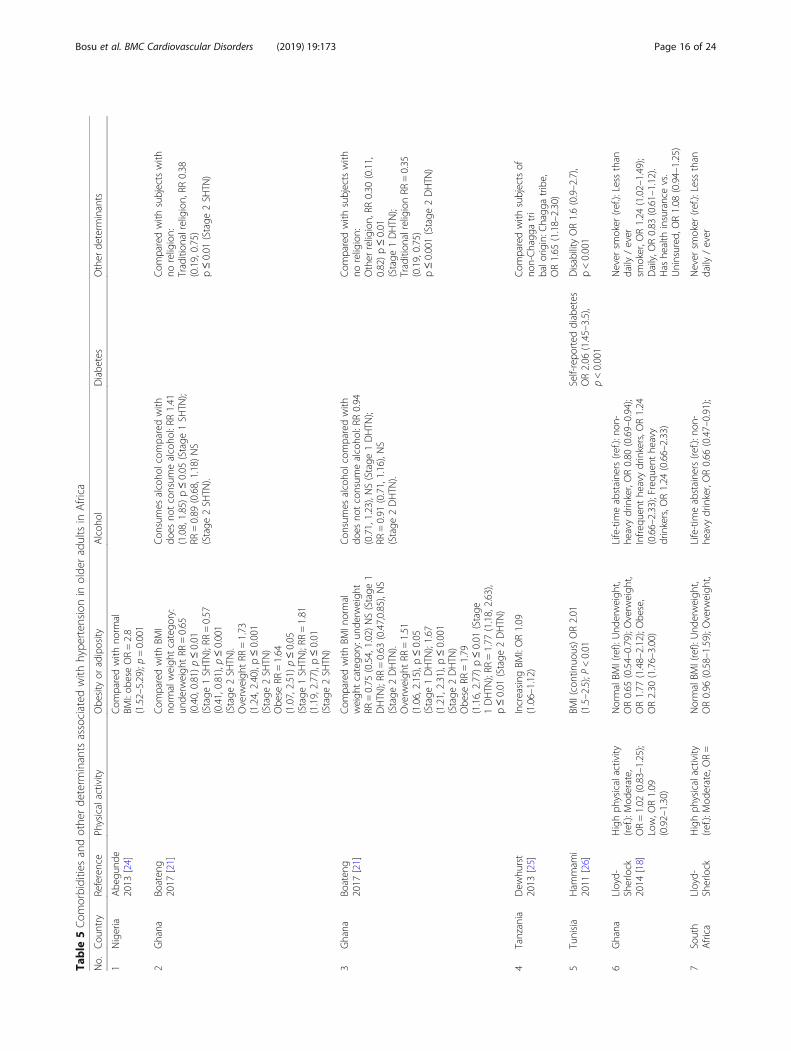
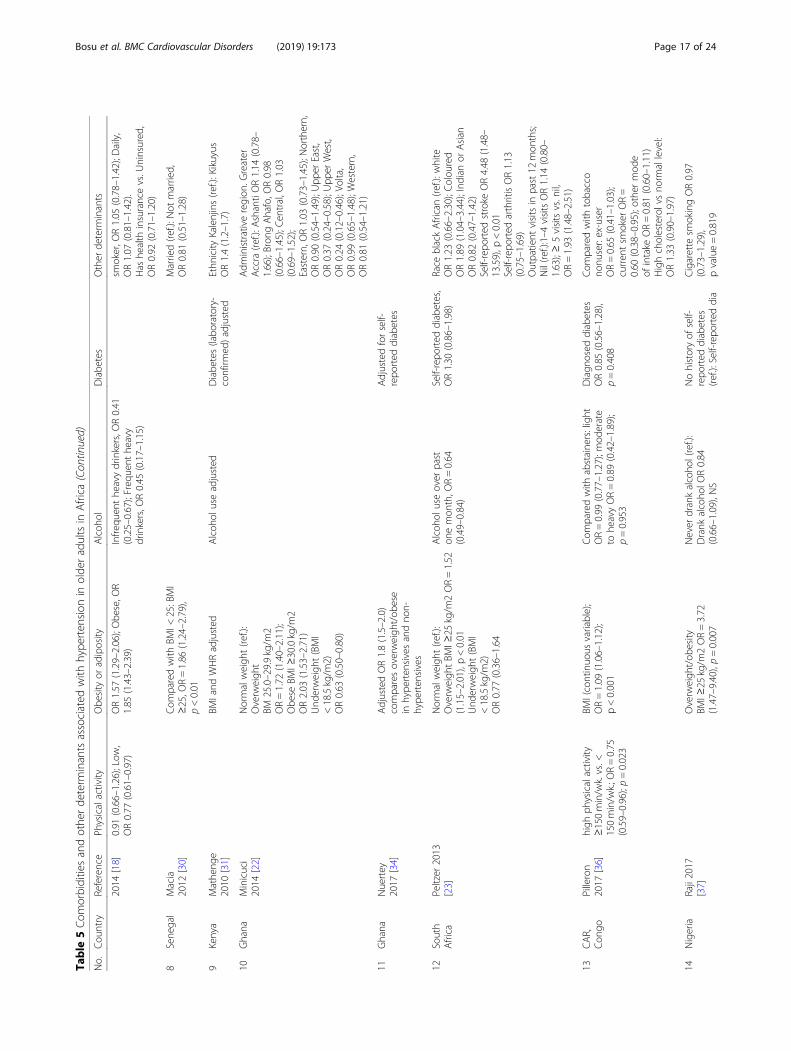
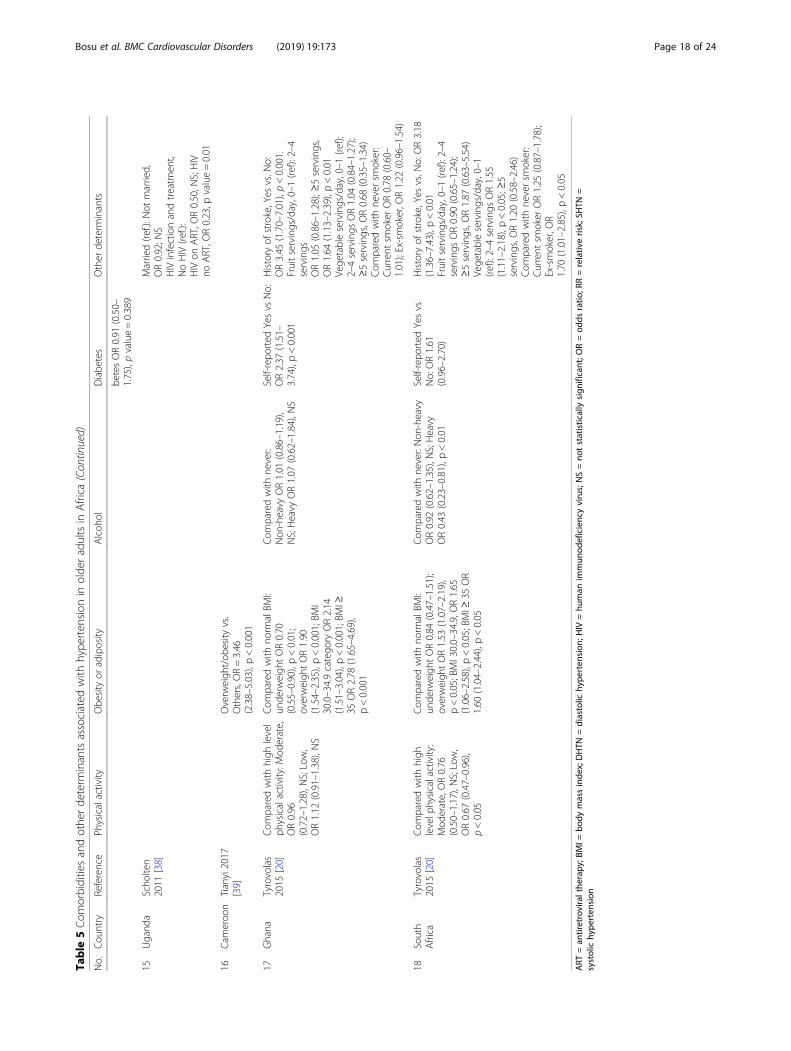
In all the models in which it was evaluated whether asa categorical or continuous variable, BMI or overweight/obese was strongly, consistently and independently cor-related with hypertension [18–21, 23–26, 30, 34, 36, 39](Table 5). The adjusted odds of being overweight orobese in subjects with hypertension was up to 3.7 timesthat in non-overweight/non-obese subjects [37, 39]. Itincreased with increasing BMI status [20, 26, 36]. Com-pared with those with normal BMI, the adjusted odds ra-tio associating underweight adults involved in the cross-country SAGE study with hypertension (compared withadults with normal BMI) was protective in Ghana butnot in South Africa [18, 20].Other lifestyle factors The relationships between
other lifestyle factors and hypertension were not as re-markable as that with the BMI. In isolated studies, alco-hol use in the past one month in South Africa [23] andbeing an former or current smoker in CAR/Congo [36]protected against having hypertension. Daily tobacco useor inadequate fruit and vegetable intake was not signifi-cantly associated with hypertension in South Africa [23].There was an inverse association between the level ofphysical activity and hypertension in CAR/Congo [36].However, in South Africa, the association was not statis-tically significant [23]. Frequent outpatient visits duringthe past 12 months was significantly associated withhypertension in South Africa [23] but not in Senegal[30]. A social cohesion index constructed to assess theextent of social engagement with society, club, union, orany organizational meeting in one study was not signifi-cantly associated with hypertension [23].The inverse association between alcohol intake and
hypertension in South Africa persisted in multivariateanalysis [23]. The adjusted odds of being heavy drinker
Fig. 2 Prevalence of hypertension by wealth quintile. Source: Lloyd-Sherlock et al. 2017 [19]
Bosu et al. BMC Cardiovascular Disorders (2019) 19:173 Page 15 of 24
Table
5Com
orbiditiesandothe
rde
term
inantsassociated
with
hype
rten
sion
inolde
radultsin
Africa
No.
Cou
ntry
Reference
Physicalactivity
Obe
sity
oradiposity
Alcoh
olDiabe
tes
Other
determ
inants
1Nigeria
Abe
gund
e2013
[24]
Com
paredwith
norm
alBM
I:ob
eseOR=2.8
(1.52–5.29);p=0.001
2Ghana
Boaten
g2017
[21]
Com
paredwith
BMI
norm
alweigh
tcatego
ry:
unde
rweigh
tRR
=0.65
(0.40,0.81)p≤0.01
(Stage
1SH
TN);RR
=0.57
(0.41,0.81),p≤0.001
(Stage
2SH
TN).
Overw
eigh
tRR
=1.73
(1.24,2.40),p≤0.001
(Stage
2SH
TN)
Obe
seRR
=1.64
(1.07,2.51)p≤0.05
(Stage
1SH
TN);RR
=1.81
(1.19,2.77),p≤0.01
(Stage
2SH
TN)
Con
sumes
alcoho
lcom
paredwith
does
notconsum
ealcoho
l:RR
1.41
(1.08,1.85)p≤0.05
(Stage
1SH
TN);
RR=0.89
(0.68,1.18)NS
(Stage
2SH
TN).
Com
paredwith
subjectswith
noreligion:
Tradition
alreligion,RR
0.38
(0.19,0.75)
p≤0.01
(Stage
2SH
TN)
3Ghana
Boaten
g2017
[21]
Com
paredwith
BMIn
ormal
weigh
tcatego
ry:und
erweigh
tRR
=0.75
(0.54,1.02)N
S(Stage
1DHTN
);RR
=0.63
(0.47,0.85),NS
(Stage
2DHTN
).Overw
eigh
tRR
=1.51
(1.06,2.15),p≤0.05
(Stage
1DHTN
);1.67
(1.21,2.31),p≤0.001
(Stage
2DHTN
)Obe
seRR
=1.79
(1.16,2.77)p≤0.01
(Stage
1DHTN
);RR
=1.77
(1.18,2.63),
p≤0.01
(Stage
2DHTN
)
Con
sumes
alcoho
lcom
paredwith
does
notconsum
ealcoho
l:RR
0.94
(0.71,1.23),NS(Stage
1DHTN
);RR
=0.91
(0.71,1.16),NS
(Stage
2DHTN
).
Com
paredwith
subjectswith
noreligion:
Other
religion,RR
0.30
(0.11,
0.82)p≤0.01
(Stage
1DHTN
);Tradition
alreligionRR
=0.35
(0.19,0.75)
p≤0.001(Stage
2DHTN
)
4Tanzania
Dew
hurst
2013
[25]
Increasing
BMI:OR1.09
(1.06–1.12)
Com
paredwith
subjectsof
non-Chagg
atri
balo
rigin:C
hagg
atribe,
OR1.65
(1.18–2.30)
5Tunisia
Ham
mam
i2011
[26]
BMI(continuo
us)OR2.01
(1.5–2.5);P<0.01
Self-repo
rted
diabetes
OR2.06
(1.45–3.5),
p<0.001
Disability
OR1.6(0.9–2.7),
p<0.001
6Ghana
Lloyd-
Sherlock
2014
[18]
Highph
ysicalactivity
(ref.):M
oderate,
OR=1.02
(0.83–1.25);
Low,O
R1.09
(0.92–1.30)
NormalBM
I(ref):Und
erweigh
t,OR0.65
(0.54–0.79);Overw
eigh
t,OR1.77
(1.48–2.12);Obe
se,
OR2.30
(1.76–3.00)
Life-tim
eabstaine
rs(re
f.):non
-he
avydrinker,OR0.80
(0.69–0.94);
Infre
quen
the
avydrinkers,O
R1.24
(0.66–2.33);Freq
uent
heavy
drinkers,O
R1.24
(0.66–2.33)
Never
smoker
(ref.):Lessthan
daily
/ever
smoker,O
R1.24
(1.02–1.49);
Daily,O
R0.83
(0.61–1.12).
Has
health
insurancevs.
Uninsured
,OR1.08
(0.94–1.25)
7South
Africa
Lloyd-
Sherlock
Highph
ysicalactivity
(ref.):M
oderate,OR=
NormalBM
I(ref):Und
erweigh
t,OR0.96
(0.58–1.59);Overw
eigh
t,Life-tim
eabstaine
rs(re
f.):non
-he
avydrinker,OR0.66
(0.47–0.91);
Never
smoker
(ref.):Lessthan
daily
/ever
Bosu et al. BMC Cardiovascular Disorders (2019) 19:173 Page 16 of 24
Table
5Com
orbiditiesandothe
rde
term
inantsassociated
with
hype
rten
sion
inolde
radultsin
Africa
(Con
tinued)
No.
Cou
ntry
Reference
Physicalactivity
Obe
sity
oradiposity
Alcoh
olDiabe
tes
Other
determ
inants
2014
[18]
0.91
(0.66–1.26);Low,
OR0.77
(0.61–0.97)
OR1.57
(1.29–2.06);Obe
se,O
R1.85
(1.43–2.39)
Infre
quen
the
avydrinkers,O
R0.41
(0.25–0.67);Freq
uent
heavy
drinkers,O
R0.45
(0.17–1.15)
smoker,O
R1.05
(0.78–1.42);Daily,
OR1.07
(0.81–1.42).
Has
health
insurancevs.U
ninsured
,OR0.92
(0.71–1.20)
8Sene
gal
Macia
2012
[30]
Com
paredwith
BMI<
25:BMI
≥25,O
R=1.86
(1.24–2.79),
p<0.01
Married(re
f.):N
otmarried,
OR0.81
(0.51–1.28)
9Kenya
Mathe
nge
2010
[31]
BMIand
WHRadjusted
Alcoh
oluseadjusted
Diabe
tes(labo
ratory-
confirm
ed)a
djusted
Ethn
icity
Kalenjins(re
f.):Kikuyus
OR1.4(1.2–1.7)
10Ghana
Minicuci
2014
[22]
Normalweigh
t(re
f.):
Overw
eigh
tBM
25.0–29.9kg/m
2OR=1.72
(1.40–2.11);
Obe
seBM
I≥30.0kg/m
2OR2.03
(1.53–2.71)
Und
erweigh
t(BMI
<18.5kg/m
2)OR0.63
(0.50–0.80)
Adm
inistrativeregion
.Greater
Accra
(ref.):A
shantiOR1.14
(0.78–
1.66);Bron
gAhafo,O
R0.98
(0.66–1.45);Cen
tral,O
R1.03
(0.69–1.52);
Eastern,OR1.03
(0.73–1.45);Northern,
OR0.90
(0.54–1.49);Upp
erEast,
OR0.37
(0.24–0.58);Upp
erWest,
OR0.24
(0.12–0.46);Vo
lta,
OR0.99
(0.65–1.48);Western,
OR0.81
(0.54–1.21)
11Ghana
Nuertey
2017
[34]
AdjustedOR1.8(1.5–2.0)
comparesoverweigh
t/ob
ese
inhype
rten
sivesandno
n-hype
rten
sives
Adjustedforself-
repo
rted
diabetes
12South
Africa
Peltzer
2013
[23]
Normalweigh
t(re
f.):
Overw
eigh
tBM
I≥25
kg/m
2OR=1.52
(1.15–2.01),p<0.01
Und
erweigh
t(BMI
<18.5kg/m
2)OR0.77
(0.36–1.64
Alcoh
oluseover
past
onemon
th,O
R=0.64
(0.49–0.84)
Self-repo
rted
diabetes,
OR1.30
(0.86–1.98)
Race
blackAfrican(re
f.):w
hite
OR1.23
(0.66–2.30);Colou
red
OR1.89
(1.04–3.44);Indian
orAsian
OR0.82
(0.47–1.42)
Self-repo
rted
stroke
OR4.48
(1.48–
13.59),p
<0.01
Self-repo
rted
arthritisOR1.13
(0.75–1.69)
Outpatient
visitsin
past12
mon
ths;
Nil(re
f.):1–4
visitsOR1.14
(0.80–
1.63);≥5visitsvs.nil,
OR=1.93
(1.48–2.51)
13CAR,
Con
goPilleron
2017
[36]
high
physicalactivity
≥150min/w
k.vs.<
150min/w
k.;O
R=0.75
(0.59–0.96);p=0.023
BMI(continuo
usvariable);
OR=1.09
(1.06–1.12);
p<0.001
Com
paredwith
abstaine
rs:light
OR=0.99
(0.77–1.27);mod
erate
tohe
avyOR=0.89
(0.42–1.89);
p=0.953
Diagn
osed
diabetes
OR0.85
(0.56–1.28),
p=0.408
Com
paredwith
tobacco
nonu
ser:ex-user
OR=0.65
(0.41–1.03);
curren
tsm
oker
OR=
0.60
(0.38–0.95);othe
rmod
eof
intake
OR=0.81
(0.60–1.11)
Highcholesterolvsno
rmallevel:
OR1.33
(0.90–1.97)
14Nigeria
Raji2017
[37]
Overw
eigh
t/ob
esity
BMI≥
25kg/m
2OR=3.72
(1.47–9.40),p=0.007
Never
drankalcoho
l(ref.):
Drank
alcoho
lOR0.84
(0.66–1.09),NS
Nohistoryof
self-
repo
rted
diabetes
(ref.):Self-rep
orteddia
Cigarette
smokingOR0.97
(0.73–1.29),
pvalue=0.819
Bosu et al. BMC Cardiovascular Disorders (2019) 19:173 Page 17 of 24
Table
5Com
orbiditiesandothe
rde
term
inantsassociated
with
hype
rten
sion
inolde
radultsin
Africa
(Con
tinued)
No.
Cou
ntry
Reference
Physicalactivity
Obe
sity
oradiposity
Alcoh
olDiabe
tes
Other
determ
inants
betesOR0.91
(0.50–
1.75),pvalue=0.389
15Ugand
aScho
lten
2011
[38]
Married(re
f.):N
otmarried,
OR0.92;N
SHIV
infectionandtreatm
ent,
NoHIV
(ref.):
HIV
onART,O
R0.50,N
S;HIV
noART,O
R0.23,p
value=0.01
16Cam
eroo
nTianyi2017
[39]
Overw
eigh
t/ob
esity
vs.
Others,OR=3.46
(2.38–5.03),p<0.001
17Ghana
Tyrovolas
2015
[20]
Com
paredwith
high
level
physicalactivity:M
oderate,
OR0.96
(0.72–1.28),NS;Low,
OR1.12
(0.91–1.38),NS
Com
paredwith
norm
alBM
I:un
derw
eigh
tOR0.70
(0.55–0.90),p<0.01;
overweigh
tOR1.90
(1.54–2.35),p<0.001;BM
I30.0–34.9catego
ryOR2.14
(1.51–3.04),p<0.001;BM
I≥35
OR2.78
(1.65–4.69),
p<0.001
Com
paredwith
never:
Non
-heavy
OR1.01
(0.86–1.19),
NS;Heavy
OR1.07
(0.62–1.84),NS
Self-repo
rted
Yesvs
No:
OR2.37
(1.51–
3.74),p<0.001
History
ofstroke,Yes
vs.N
o:OR3.45
(1.70–7.01),p<0.001.
Fruitservings/day,0–1
(ref):2–4
servings
OR1.05
(0.86–1.28);≥5servings,
OR1.64
(1.13–2.39),p<0.01
Vege
tableservings/day,0–1
(ref):
2–4servings
OR1.04
(0.84–1.27);
≥5servings,O
R0.68
(0.35–1.34)
Com
paredwith
neversm
oker:
Current
smoker
OR0.78
(0.60–
1.01);Ex-smoker,O
R1.22
(0.96–1.54)
18South
Africa
Tyrovolas
2015
[20]
Com
paredwith
high
levelp
hysicalactivity:
Mod
erate,OR0.76
(0.50–1.17),NS;Low,
OR0.67
(0.47–0.96),
p<0.05
Com
paredwith
norm
alBM
I:un
derw
eigh
tOR0.84
(0.47–1.51);
overweigh
tOR1.53
(1.07–2.19),
p<0.05;BMI30.0–34.9,O
R1.65
(1.06–2.58),p<0.05;BMI≥
35OR
1.60
(1.04–2.44),p<0.05
Com
paredwith
never:Non
-heavy
OR0.92
(0.62–1.35),NS;Heavy
OR0.43
(0.23–0.81),p<0.01
Self-repo
rted
Yesvs
No:OR1.61
(0.96–2.70)
History
ofstroke,Yes
vs.N
o:OR3.18
(1.36–7.43),p<0.01
Fruitservings/day,0–1
(ref):2–4
servings
OR0.90
(0.65–1.24);
≥5servings,O
R1.87
(0.63–5.54)
Vege
tableservings/day,0–1
(ref):2–4servings
OR1.55
(1.11–2.18),p<0.05;≥
5servings,O
R1.20
(0.58–2.46)
Com
paredwith
neversm
oker:
Current
smoker
OR1.25
(0.87–1.78);
Ex-smoker,O
R1.70
(1.01–2.85),p<0.05
ART
=an
tiretroviralthe
rapy
;BMI=
body
massinde
x;DHTN
=diastolic
hype
rten
sion
;HIV
=hu
man
immun
odeficiencyvirus;NS=no
tstatistically
sign
ificant;O
R=od
dsratio
;RR=relativ
erisk;SH
TN=
systolichy
perten
sion
Bosu et al. BMC Cardiovascular Disorders (2019) 19:173 Page 18 of 24
in hypertensives was 57% lower than that of being a life-time abstainer [20]. In contrast, alcohol intake was asso-ciated with a 41% greater prevalence of stage 1 SHTN inGhana [21]. Overall, it was not significantly associatedwith stage 1 or 2 DHTN or any hypertension in Ghana[20, 21], Congo or Central African Republic [36] orNigeria [37].The association between smoking and hypertension
was inconsistent between consumption habits or coun-tries. Current non-daily or former smoking was inde-pendently associated with hypertension as a harmfulpredictor in the same multi-country analyses of theSAGE study in Ghana but not in South Africa [18]. Insimilar analyses, former smoking was independently as-sociated with higher prevalence of hypertension in SouthAfrica but not in Ghana [20]. Contrary to these findings,in CAR/Congo, current smoking was associated with alower prevalence of hypertension [36] while in Nigeria,having ever smoked tobacco was not independently as-sociated with hypertension [37].Concerning dietary factors, participants who ate three
or more meals daily had 85% higher adjusted odds of hav-ing hypertension than those who ate one meal daily [36].From the multi-country SAGE data analyses, higher fruitintake of ≥5 daily servings was independently associatedwith hypertension in Ghana but not in South Africa [20](Table 5). Conversely, 2–4 daily vegetable servings wasindependently associated with hypertension in South Af-rica but not in Ghana [20]. In a separate model, examinedand self-reported hypertension was not associated with in-sufficient fruit and vegetable intake in South Africa [44].3w?>As with alcohol intake and current or former
smoking, the relationship between physical activity andhypertension was erratic and somewhat contradictory.High level of physical activity was associated with alower prevalence of hypertension in Congo and CAR[36] and a higher prevalence of hypertension in SouthAfrica [18, 20] (Tables 4 and 5). In Ghana and Tunisia,physical activity was not significantly associated withhypertension [18, 20, 26].The positive relationship observed between frequent
outpatient visits in the preceding 12 months and hy-pertension in South Africa remained in the multivariateanalysis with adjusted odds ratio 1.93 (95% CI 1.48–2.51) (Table 5) [23].
Comorbidity Having a history of self-reported dia-betes, stroke or arthritis was associated with hyper-tension in Tunisia or South Africa [23, 26] but not inNigeria [37]. Similarly, dependency, disability or activitylimitation was associated with hypertension [23, 26]. Thepresence of laboratory-confirmed diabetes was, however,not associated with hypertension in CAR/Congo [36]. A
subjective self-appraisal of being moderately well was asso-ciated with hypertension in South Africa but not havingbad or very bad health [23]. A diagnosis of lifetime depres-sion was not associated with hypertension in elderly sub-jects in Nigeria [37].In the multivariate analyses, a medical history of dia-
betes and a subjective status of moderate health amongolder adults in South Africa lost their statistically signifi-cant association with hypertension [23]. Self-reporteddiabetes remained significantly associated with hyper-tension in Tunisia [26] and Ghana [20] (Tables 4 and 5).As in the crude analyses, it was not independently asso-ciated with hypertension in CAR/Congo [36], Nigeria[37] or South Africa [20, 23]. On the other hand, historyof a stroke was a very strong predictor of hypertensionin both Ghana and South Africa with adjusted oddsratios of 3.45 and 3.18 respectively [20].High cholesterol among elderly subjects in Congo and
CAR [36] was associated with hypertension in the crudeanalysis but this association disappeared in the adjustedanalysis (Table 3). In the multivariate analyses, depen-dency, activity limitation or disability was significantlyassociated with hypertension in Tunisia [26] but not inSouth Africa [23] or Tanzania [25]. Hypertension andself-reported arthritis were not associated with eachother both in the crude and adjusted analyses in SouthAfrica [23, 45].Compared with those who were not infected, older
adults in Uganda who infected with the human im-munodeficiency virus (HIV) and were on antiretroviraltherapy had 77% lower odds of having hypertension afteradjusting for sociodemographic variables [38].
Summary of determinants From the bivariate analyses,the positive risk factors frequently associated with hyper-tension in older adults included older age group, femalesex, urban residence, ethnicity, self-reported diabetes orstroke, and overweight/obesity. There were no consistentprotective factors. The relationship between socioeco-nomic factors such as occupation, education and wealthquintile with hypertension was variable as was doctorvisits in the past year. Smoking and alcohol intake didnot emerge as harmful risk factors for hypertension.Marital status and religion were of no import to thepresence of hypertension in older adults.The strongest and most robust predictors of hyperten-
sion were overweight/obesity or increasing BMI and ahistory of stroke. Older age and female sex were fre-quent predictors in the multivariate analyses. Maritalstatus, educational attainment and not having a healthinsurance were mostly not associated with hypertension.The association between lifestyle variables (such as alco-hol intake, current or former smoking, fruit and
Bosu et al. BMC Cardiovascular Disorders (2019) 19:173 Page 19 of 24
vegetable intake and physical activity) and most comor-bid factors with hypertension was inconsistent.
DiscussionTo our knowledge, this is the first reported comprehensivesystematic review of the literature on the determinants ofhypertension in older adults in Africa. The majorstrengths of this review are the inclusion of a wide scopeof studies published in multiple languages and havingvaried study designs. We assessed the relationship be-tween a wide range of demographic, socioeconomic, life-style and comorbid covariates with hypertension fromboth bivariate and multivariate analyses. Most of the stu-dies were deemed to have low or moderate risk of bias.The review highlights the dearth of studies on determi-nants of hypertension in this age group in Africa withcoverage of only twelve African countries.Consistent with other reviews in Africa, our review
showed that older age group and overweight/obesitywere independently associated with hypertension [7, 11,46, 47]. These same variables are also positive predictorsof diabetes among older adults in Africa [48]. Our fin-dings contrast with those of a recent meta-analysis ofhypertension in older people in Africa which did notfind any significant difference in the prevalence acrossage groups [49]. There is a biological basis for the in-crease in hypertension with age that is related tochanges in the arterial structure and function, notablyarterial stiffening with adverse consequences on cardiacstructure and function [50, 51]. There is also a decline inplasma renin activity, impaired renal function andhomeostatic mechanisms associated with an ageing kid-ney. It is ironic that the older age group which suffersthe highest relative burden of hypertension is oftenneglected in the public health agenda in Africa [52, 53].This situation is unacceptable considering the estab-lished evidence that cardiovascular diseases in old agecan be prevented or well managed to promote a goodquality of life [50, 54, 55].As in the current review, we found in a previous sys-
tematic review that obesity or adiposity measures werestrong predictors of hypertension among different cadresof workers in West Africa [11] with, for example,adjusted odds ratio of about 3.4 among health workersin a teaching hospital in Nigeria [56]. In a recent analysisof demographic and health survey results in five sub-Saharan countries, the adjusted odds ratios for hyper-tension was 2.44 (95% CI 2.19–2.72) and 5.34 (95% CI4.75–5.99) among overweight and obese women respec-tively compared with women of normal BMI [57].A meta-analysis of prospective studies published up to
January 2017 estimated that the risk of hypertensionincreased by 49% for every five-unit increment in BMI,by 27% per 10 cm increase in waist circumference, and
by 37 and 74% per 0.1-unit increment in waist-to-hipratio and waist-to-height ratio respectively [58]. Anothermeta-analysis of published articles up to January 2016estimated that losing excess weight may reduce the riskof hypertension by 24 to 40% in people who are over-weight and by 40 to 54% in people who are obese [59].As with older age, the close epidemiological and possiblycausal link between obesity and hypertension is biologi-cally plausible [60].Urbanization appears to provide the catalyst for the
obesity epidemic in Africa. In West Africa, a meta-analysisrevealed that the prevalence of obesity increased by 114%over a 15-year period from 1990 to 2014 whereas themuch lower prevalence remained stable in the ruralpopulations [61]. There has been a rapid growth of thefast food industry in urban areas as incomes of the middleclass along with increased opportunities and preferencesfor eating outside of home [62]. It is likely that the obe-sogenic environment engendered by urbanization, tradeliberalization, growing food and beverage food industryand changing lifestyles contribute to the development andprogression of obesity from younger ages [63]. Fortu-nately, there is now growing awareness of healthy foodpractices although these practices may be influenced byindividual finances, physical, psychological and commu-nity factors [64].The sex-differences in the prevalence of hypertension
in Africa have been inconsistent. Some reviews havefound minimal non-statistically significant differences [7,46, 47, 49] while others have found greater prevalenceamong men [65, 66]. Unlike our previous review inwhich we identified male sex as one of the determinantsof hypertension among workers in West Africa [11], wefound in the current review that female sex was inde-pendently associated with hypertension in most studiesamong older adults in Africa. A global review found ahigher mean blood pressure and age-standardized preva-lence of hypertension among men [67]. The pattern oflower prevalence of hypertension in premenopausalwomen than men and the subsequent higher prevalencein postmenopausal women may be typical [68, 69]. Mul-tiple mechanisms such as androgen-mediated increase inangiotensinogen leading to increase in endothelin-mediated vasoconstriction; oxidative stress; sympatheticnervous system activation; and increased anxiety or de-pression have been proposed as possible explanation forthe higher prevalence in postmenopausal women [69]. Be-sides their higher odds for hypertension, older women arealso at a significantly higher risk of having multiple riskfactors for NCDs [42].In the bivariate analysis, the prevalence of hypertension
in older adults was almost always higher in urban than inrural populations in our review. In multivariate analysis,however, the greater odds of hypertension associated
Bosu et al. BMC Cardiovascular Disorders (2019) 19:173 Page 20 of 24
with urban residence was less consistent. Other system-atic reviews in Africa have made similar observations[46, 47, 65, 70]. It appears the gap in the prevalencebetween urban and rural areas has been narrowing[71–73]. In a recent study in Zambia, the prevalence inrural populations was twice that in urban population [74].Except in Nigeria where not being married was pro-
tective, marital status was not independently associatedwith hypertension. The reason for the protective effectof unmarried status of older adults for hypertension inNigeria is not clear from the primary study included inthe review. In a meta-analysis involving studies fromwestern countries, being married was independentlyassociated with a greater adjusted odds of having noctur-nal dipping and lower mean night-time SBPs amongsubjects participating in a controlled dietary intervention[75]. This may be because married people have a bettersatisfaction with life [76] or may be due to social-cognitive factors, neuroendocrine processes, biologicalmediators and health behaviours [75].Among the socioeconomic factors, we found that the
association between education and wealth index withhypertension in older adults in Africa was inconsistent. Weobserved similar inconsistent results with education in thesystematic review of hypertension among workers in WestAfrica [11]. The direction of the association between edu-cation and hypertension among older adults in the twoSAGE countries, Ghana and South Africa was discordant[18]. In the analysis involving all the six low- and middle-income SAGE countries (China, Ghana, India, Mexico,Russia, and South Africa), education was not independentlyassociated with hypertension in participants aged ≥18 years[77]. The prevalence of hypertension has been shown toincrease with increasing illiteracy in some reviews [47] andmulti-country analyses [57]. Since in low-income countries,those with higher education tend to be overweight or obese[78, 79], it may have been expected that higher educationwould predict hypertension if the relationships were linearor unconfounded. Longitudinal studies could help definehow the relationship between education and obesity differover the life course [78].As with education, we observed a somewhat discor-
dant relationship between wealth and hypertensionamong older adults in the SAGE studies in Ghanaand South Africa [19]. In South Africa, as in Russia,with high average prevalence of hypertension, the so-cioeconomic gradient by wealth quintiles was almostflat [19]. In contrast, in Ghana and India, the socio-economic gradient relating wealth quintile with hyper-tension in older adults was positive with the ratio ofthe prevalence between the richest and poorest wealthquintile groups being in the order of 1.4–1.6. In thetwo other SAGE countries, China and Mexico, whichhad a similar average prevalence of hypertension,
there was less clear pattern and the socioeconomicgradient appeared negative.As we found for older adults involved in SAGE Ghana
[19], a recent analysis of studies among women aged15–49 years in five sub-Saharan African countries alsofound that increasing wealth index was independentlyassociated with hypertension along a dose-response gra-dient [57]. Clearly, the relationship between wealth andhypertension is context-specific. Further studies are re-quired to more clearly define the socioeconomic predic-tors of hypertension and its complications, particularlyin poor households who tend to be less aware of theirdisease and achieving worse outcomes [19].With regards to lifestyle factors, we found an inconsist-
ent relationship between physical activity and alcoholintake with hypertension in the current review. The cross-country analysis of the SAGE data of participants aged≥18 years in the six SAGE countries did not find any inde-pendent association between exercise and hypertension[77]. Nevertheless, the role of physical activity in impro-ving cardiovascular outcomes in older adults is well-recognized [80–82]. The inconsistent findings may berelated to methodological issues such as the study design,study population and sample size.As with physical activity, we found an inconsistent
relationship between alcohol intake and hypertension inolder adults in our review. This contrasts with the findingin our previous review among workers in West Africa inwhich we found that alcohol intake was generally associatedwith hypertension [11]. The protective effect of moderatedrinking against cardiovascular disease has been widelypublicized for many years [83, 84]. Recent evidence is emer-ging from cohort studies that alcohol at any level increasesthe risk of incident hypertension [85]. A meta-analysisfound that, compared with abstainers, light drinking (1 to 2drinks/day) in men increased the risk of hypertension by19%, with the risk increasing in a dose-response manner to74% in those drinking ≥5 drinks daily [85]. In women, theincreased risk was observed in those taking two or morestandard drinks daily. No level of alcohol consumption wasprotective in men or women. Consistent with this finding, ameta-analysis found that a reduction in alcohol intake inpeople who drank more than two drinks per day in the UKwas associated with increased blood pressure reduction[86]. Existing recommendations to reduce alcohol intakeamong older adults and to discourage middle-aged adultsfrom taking up regular alcohol intake may, therefore, bepertinent [50, 87, 88]. In the current review, the inverse as-sociation of alcohol intake and hypertension in South Af-rica among older adults is inconsistent with recentfindings and may be due to methodological differences instudy design, study population, exposure to alcohol, andlength of follow-up. Similarly, our finding of an inconsist-ent relationship between self-reported history of diabetes
Bosu et al. BMC Cardiovascular Disorders (2019) 19:173 Page 21 of 24
and hypertension in older adults in Africa in the currentreview contrasts with that in our previous review in whichit was a consistent determinant of hypertension in WestAfrican workers [11].Some limitations of this review should be noted. A major
limitation was the limited number of covariates, particularlylifestyle and comorbid factors, investigated in individualstudies for their relationship with hypertension. It is there-fore likely that some important confounders were not in-cluded in the models. Even in those where several covariateswere included in the models presented, there are likely tostill be unmeasured confounders. The effect sizes from thefew studies which enrolled non-representative samples maybe biased. The study populations were diverse and so thestudy findings may not be generalizable to specific groups.The differences in ability of participants to recall history ofpast illness or behaviour could explain differences in the re-lationships observed between studies. The definition ofsome lifestyle covariates such as alcohol consumption andphysical activity differed between studies making compari-sons difficult. The statistical determinants identified in thisreview do not imply causality, especially because most of theincluded studies were cross-sectional. For example, the con-sistent association between a history of stroke and havinghypertension should not be interpreted to mean that strokeis a biological risk factor for hypertension.
ConclusionsWe identified older age, overweight/obesity, female sex,urban residence, history of stroke as the frequent or con-sistent determinants of systemic hypertension in olderadults in Africa. Socioeconomic and lifestyle factors gener-ally had variable relationships with hypertension. Furtherresearch with longitudinal studies is needed to betterdefine the determinants of incident hypertension in thisgroup. Future reviews could perform meta-analysis toobtain pooled estimates of the risk factors as well as ex-plore what strategies such as weight reduction throughoutthe life course, including the middle and older age groups,improve cardiovascular health so that public healthauthorities can implement the most appropriate policies.
Additional files
Additional file 1: Table S1. Search strategy. (DOCX 14 kb)
Additional file 2: Table S2. Evaluation of risk of bias from primarystudies on hypertension in older adults in Africa. (DOCX 16 kb)
AbbreviationsBMI: Body mass index; CAR: Central African Republic;; DHTN: DiastolicHypertensio; HTN: Hypertension; NCD: Noncommunicable diseases;PRISMA: Preferred reporting items for systematic reviews and meta-analyses;SAGE: Study on global ageing and adult health; STHN: Systolic hypertension
AcknowledgementsWe thank our respective institutions for their general support for this review.Lancaster University kindly provided us access to some full-text articles. Wethank the Covidence team for providing the software to manage the studyselection.
Authors’ contributionsWKB conceived, designed, analyzed the review and wrote the manuscriptunder the supervision of STR and EZ. JMKA was involved with studyselection and quality appraisal. All authors read and approved the finalversion of the manuscript and to the order of authorship for this manuscript.
FundingThis research did not receive any funding. Our respective institutions havenot influenced the design, data collection, analysis or content of this study.
Availability of data and materialsThe datasets generated and/or analyzed during the current study areavailable in the repository: https://doi.org/10.17635/lancaster/researchdata/267.
Ethics approval and consent to participateNot applicable.
Consent for publicationNot applicable.
Competing interestsThe authors declare that they have no competing interests.
Author details1Department of Public Health and Research, West African HealthOrganisation, Bobo-Dioulasso 01 BP 153, Burkina Faso. 2Division of HealthResearch, Faculty of Health & Medicine, Furness Building, LancasterUniversity, Lancaster LA1 4YG, UK. 3Department of Biostatistics, School ofPublic Health, University of Ghana, PO Box LG 13, Legon, Accra, Ghana.4Madrid Institute for Advanced Study (MIAS), Universidad Autonoma deMadrid, C/ Einstein, 13 Pabellón C 1a planta, E-28049 Madrid, Spain.
Received: 27 March 2019 Accepted: 4 July 2019
References1. Institute for Health Metrics and Evaluation (IHME). Global Burden of Disease:
GBD Compare Data Visualization. Seattle, WA: IHME, University ofWashington; 2018. [https://vizhub.healthdata.org/gbd-compare/]. Accessed28 Dec 2018.
2. Zhou B, Bentham J, Di Cesare M, Bixby H, Danaei G, Cowan MJ,Paciorek CJ, Singh G, Hajifathalian K, Bennett JE. Worldwide trends inblood pressure from 1975 to 2015: a pooled analysis of 1479population-based measurement studies with 19· 1 million participants.Lancet. 2017;389(10064):37–55.
3. Lachat C, Otchere S, Roberfroid D, Abdulai A, Seret FM, Milesevic J, XuerebG, Candeias V, Kolsteren P. Diet and physical activity for the prevention ofnoncommunicable diseases in low- and middle-income countries: asystematic policy review. PLoS Med. 2013;10(6):e1001465.
4. Dzudie A, Rayner B, Ojji D, Schutte AE, Twagirumukiza M, Damasceno A, BaSA, Kane A, Kramoh E, Kacou JB, et al. Roadmap to achieve 25%hypertension control in Africa by 2025. Cardiovasc J Afr. 2017;28(4):262–72.
5. United Nations General Assembly. Political declaration of the third high-levelmeeting of the General Assembly on the prevention and control of non-communicable diseases. In: Resolution adopted by the General Assembly on10 October 2018: 73rd Session, Agenda Item 119. New York: UN; 2018.
6. Dramé ML, Houehanou C, Sogbohossou P, Paré R, Ekambi A, Mizéhoun-Adissoda C, Houinato D, Gyselinck K, Marx M, Martins MRO, et al.Determinants of high blood pressure and quality of Management in ThreeRegions of Benin. Open J Epidemiol. 2018;8(01):14.
7. Bosu WK. Epidemic of hypertension in Ghana: a systematic review. BMCPublic Health. 2010;10:418.
8. Joseph-Shehu EM, Ncama BP. Evaluation of health status and its predictoramong university staff in Nigeria. BMC Cardiovasc Disord. 2018;18(1):183.
Bosu et al. BMC Cardiovascular Disorders (2019) 19:173 Page 22 of 24
9. Mohamed SF, Mutua MK, Wamai R, Wekesah F, Haregu T, Juma P, NyanjauL, Kyobutungi C, Ogola E. Prevalence, awareness, treatment and control ofhypertension and their determinants: results from a national survey inKenya. BMC Public Health. 2018;18(3):1219.
10. Nguyen KA, Peer N, Mills EJ, Kengne AP. Burden, determinants, andpharmacological Management of Hypertension in HIV-positive patients andpopulations: a systematic narrative review. AIDS Rev. 2015;17(2):83–95.
11. Bosu WK. Determinants of mean blood pressure and hypertension amongWorkers in West Africa. Int J Hypertens. 2016;2016:3192149.
12. Bosu WK, Aheto JMK, Zucchelli E, Reilly S. Prevalence, awareness, andassociated risk factors of hypertension in older adults in Africa: a systematicreview and meta-analysis protocol.(Report). Syst Rev. 2017;6(1):192.
13. Bosu WK, Reilly ST, Aheto JMK, Zucchelli E. Hypertension in older adults inAfrica: a systematic review and meta-analysis. PLoS One. 2019;14(4):e0214934.
14. Moher D, Liberati A, Tetzlaff J, Altman DG. Preferred reporting items forsystematic reviews and meta-analyses: the PRISMA statement. PLoSMed. 2009;6(7):e1000097.
15. Veritas Health Innovation. Covidence systematic review software.Melbourne, Australia; 2018. [https://www.covidence.org/home]. Accessed 14June 2018.
16. Hoy D, Brooks P, Woolf A, Blyth F, March L, Bain C, Baker P, Smith E,Buchbinder R. Assessing risk of bias in prevalence studies: modificationof an existing tool and evidence of interrater agreement. J ClinEpidemiol. 2012;65(9):934–9.
17. Guerchet M, Aboyans V, Mbelesso P, Mouanga AM, Salazar J, Bandzouzi B,Tabo A, Clément J-P, Preux P-M, Lacroix P. Epidemiology of peripheral arterydisease in elder general population of two cities of Central Africa: Banguiand Brazzaville. Eur J Vasc Endovasc Surg. 2012;44:164–9.
18. Lloyd-Sherlock P, Beard J, Minicuci N, Ebrahim S, Chatterji S. Hypertensionamong older adults in low and middle-income countries: prevalence,awareness and control. Int J Epidemiol. 2014;43(1):116–28.
19. Lloyd-Sherlock P, Minicuci N, Corso B, Beard J, Chatterji S, Ebrahim S.Diseases of the rich? The social patterning of hypertension in six low- andmiddle-income countries. Eur J Dev Res. 2017;29(4):827–42.
20. Tyrovolas S, Koyanagi A, Garin N, Olaya B, Ayuso-Mateos JL, Miret M,Chatterji S, Tobiasz-Adamczyk B, Koskinen S, Leonardi M, et al.Determinants of the components of arterial pressure among olderadults – the role of anthropometric and clinical factors: a multi-continent study. Atherosclerosis. 2015;238(2):240–9.
21. Boateng GO, Adams EA, Odei Boateng M, Luginaah IN, Taabazuing M-M.Obesity and the burden of health risks among the elderly in Ghana: apopulation study. PLoS One. 2017;12(11):1–25.
22. Minicuci N, Biritwum RB, Mensah G, Yawson AE, Naidoo N, Chatterji S, KowalP. Sociodemographic and socioeconomic patterns of chronic non-communicable disease among the older adult population in Ghana. GlobHealth Action. 2014;7:21292.
23. Peltzer K, Phaswana-Mafuya N. Hypertension and associated factors in olderadults in South Africa. Cardiovasc J Afr. 2013;24(3):66–71.
24. Abegunde KA, Owoaje ET. Health problems and associated risk factors inselected urban and rural elderly population groups of south-West Nigeria.Ann Afr Med. 2013;12(2):90–7.
25. Dewhurst MJ, Dewhurst F, Gray WK, Chaote P, Orega GP, Walker RW. Thehigh prevalence of hypertension in rural-dwelling Tanzanian older adultsand the disparity between detection, treatment and control: a rule ofsixths? J Hum Hypertens. 2013;27(6):374–80.
26. Hammami S, Mehri S, Hajem S, Koubaa N, Frih MA, Kammoun S,Hammami M, Betbout F. Awareness, treatment and control ofhypertension among the elderly living in their home in Tunisia. BMCCardiovasc Disord. 2011;11:65.
27. Hien H, Berthe A, Drabo MK, Meda N, Konate B, Tou F, Badini-Kinda F, MacqJ. Prevalence and patterns of multimorbidity among the elderly in BurkinaFaso: cross-sectional study. Tropical Med Int Health. 2014;19(11):1328–33.
28. Iribhogbe I. A community based interventional study on health status ofaged people in a semi-Urban Community in south-South Nigeria. Int JCommunity Res. 2013;2(2):22–7.
29. Koopman JJE, van Bodegom D, Jukema JW, Westendorp RGJ. Risk ofcardiovascular disease in a traditional African population with a highinfectious load: a population-based study. PLoS One. 2012;7(10):1–8.
30. Macia E, Duboz P, Gueye L. Prevalence, awareness, treatment and control ofhypertension among adults 50 years and older in Dakar, Senegal.Cardiovasc J Afr. 2012;23(5):265–9.
31. Mathenge W, Foster A, Kuper H. Urbanization, ethnicity and cardiovascularrisk in a population in transition in Nakuru, Kenya: a population-basedsurvey. BMC Public Health. 2010;10(1):569–80.
32. Mkhize XN. Situation analysis of free-living elderly in Umlazi township.Durban: Durban University of Technology; 2011.
33. Mugisha JO, Baisley K, Asiki G, Seeley J, Kuper H. Prevalence, types, riskfactors and clinical correlates of Anaemia in older people in a ruralUgandan population. PLoS One. 2013;8(10):1–1.
34. Nuertey BD, Alhassan AI, Nuertey AD, Mensah IA, Adongo V, Kabutey C,Addai J, Biritwum RB. Prevalence of obesity and overweight and itsassociated factors among registered pensioners in Ghana; a cross sectionalstudies. BMC Obes. 2017;4:1–12.
35. Osman A-Q. Nutrition & Health Status, Quality of Life, and AssociatedFactors among Non-Institutionalized Older Ghanaians. In: MPhil inHuman Nutrition and Dietetics. Kumasi: Kwame Nkrumah University ofScience and Technology; 2017.
36. Pilleron S, Aboyans V, Mbelesso P, Ndamba-Bandzouzi B, Desormais I,Lacroix P, Preux P-M, Guerchet M, EPIDEMCA group. Prevalence, awareness,treatment, and control of hypertension in older people in Central Africa: theEPIDEMCA study. J Am Soc Hypertens. 2017;11(7):449–60.
37. Raji YR, Abiona T, Gureje O. Awareness of hypertension and its impact onblood pressure control among elderly Nigerians: report from the Ibadanstudy of aging. Pan Afr Med J. 2017;27:190.
38. Scholten F, Mugisha J, Seeley J, Kinyanda E, Nakubukwa S, Kowal P, NaidooN, Boerma T, Chatterji S, Grosskurth H. Health and functional status amongolder people with HIV/AIDS in Uganda. BMC Public Health. 2011;11:886.
39. Tianyi FL, Agbor VN, Njamnshi AKJHSR. Prevalence, awareness, treatment,and control of hypertension in Cameroonians aged 50 years and older: acommunity-based study. Health Sci Rep. 2018;1(5):e44.
40. Dewhurst MJ. The prevalence and clinical correlates of atrial fibrillation inthose aged 70 and over in the Hai District of northern Tanzania. Newcastle:University of Newcastle upon Tyne; 2013.
41. Mkhize X, Napier C, Oldewage-Theron W. The nutrition situation of free-livingelderly in Umlazi township, South Africa. Health SA Gesondheid. 2013;18(1):1–8.
42. Phaswana-Mafuya N, Peltzer K, Chirinda W, Musekiwa A, Kose Z.Sociodemographic predictors of multiple non-communicable disease risk factorsamong older adults in South Africa. Glob Health Action. 2013;6(1):20680.
43. Duboz P, Touré M, Hane F, Macia E, Coume M, Bâ A, Boetsch G, Gueye L,Chapuis-Lucciani N. Vieillissement et pathologies chroniques au Sénégal.Comparaison entre des populations vivant en milieu rural (Ferlo) et urbain(Dakar) Ageing and chronic diseases in Senegal. A comparison between rural(Ferlo) and urban (Dakar) populations. Bull Soc Pathol Exot. 2015;108(1):25–31.
44. Peltzer K, Phaswana-Mafuya N. Fruit and vegetable intake andassociated factors in older adults in South Africa. Glob Health Action.2012;5(1):18668.
45. Peltzer K, Phaswana-Mafuya N. Arthritis and associated factors in olderadults in South Africa. Turk J Geriatr. 2013;16(4):389–94.
46. Ataklte F, Erqou S, Kaptoge S, Taye B, Echouffo-Tcheugui JB, Kengne AP.Burden of undiagnosed hypertension in sub-Saharan Africa: a systematicreview and meta-analysis. Hypertension. 2015;65(2):291–8.
47. Sarki AM, Nduka CU, Stranges S, Kandala N-B, Uthman OA. Prevalence ofhypertension in low-and middle-income countries: a systematic review andmeta-analysis. Medicine. 2015;94(50):e1959.
48. Gatimu SM, Milimo BW, Sebastian MS. Prevalence and determinants ofdiabetes among older adults in Ghana. BMC Public Health. 2016;16(1):1174.
49. Kaze AD, Schutte AE, Erqou S, Kengne AP, Echouffo-Tcheugui JB. Prevalenceof hypertension in older people in Africa: a systematic review and meta-analysis. J Hypertens. 2017;35(7):1345–52.
50. Aronow WS, Fleg JL, Pepine CJ, Artinian NT, Bakris G, Brown AS, FerdinandKC, Ann Forciea M, Frishman WH, Jaigobin C, et al. ACCF/AHA 2011 expertconsensus document on hypertension in the elderly: a report of theAmerican College of Cardiology Foundation Task Force on Clinical ExpertConsensus documents developed in collaboration with the AmericanAcademy of Neurology, American Geriatrics Society, American Society forPreventive Cardiology, American Society of Hypertension, American Societyof Nephrology, Association of Black Cardiologists, and European Society ofHypertension. J Am Coll Cardiol. 2011;57(20):2037–114.
51. Williams B. Vascular ageing and interventions: lessons and learnings. TherAdv Cardiovasc Dis. 2016;10(3):126–32.
52. Kimokoti RW, Hamer DH. Nutrition, health, and aging in sub-Saharan Africa.Nutr Rev. 2008;66(11):611–23.
Bosu et al. BMC Cardiovascular Disorders (2019) 19:173 Page 23 of 24
53. World Health Organization. Active ageing: A policy framework. Geneva:WHO; 2002.
54. World Health Organization. Prevention of cardiovascular disease: guidelinesfor assessment and management of cardiovascular risk. Geneva: WHO; 2007.
55. Barry AR, O'Neill DE, Graham MM. Primary prevention of cardiovasculardisease in older adults. Can J Cardiol. 2016;32(9):1074–81.
56. Funke O, Ibrahim KS. Blood pressure and body mass index among Jos Universityteaching hospital staff. Transnational J Sci Technol. 2013;3(9):73–83.
57. Yaya S, Ekholuenetale M, Bishwajit G. Differentials in prevalence andcorrelates of metabolic risk factors of non-communicable diseases amongwomen in sub-Saharan Africa: evidence from 33 countries. BMC PublicHealth. 2018;18(1):1168.
58. Jayedi A, Rashidy-Pour A, Khorshidi M, Shab-Bidar S. Body mass index,abdominal adiposity, weight gain and risk of developing hypertension: asystematic review and dose-response meta-analysis of more than 2.3 millionparticipants. Obes Rev. 2018;19(5):654–67.
59. Poorolajal J, Hooshmand E, Bahrami M, Ameri P. How much excess weightloss can reduce the risk of hypertension? J Public Health (Oxf). 2016;39(3):e95–e102.
60. DeMarco VG, Aroor AR, Sowers JR. The pathophysiology of hypertension inpatients with obesity. Nat Rev Endocrinol. 2014;10(6):364–76.
61. Abubakari AR, Lauder W, Agyemang C, Jones M, Kirk A, Bhopal RS.Prevalence and time trends in obesity among adult west Africanpopulations: a meta-analysis. Obes Rev. 2008;9(4):297–311.
62. Veselinovic M. How Africa is giving fast food a new spin. CNN; 2015.[https://edition.cnn.com/2015/12/11/africa/fast-food-in-africa/]. Accessed 19Dec 2018.
63. Agyemang C, Boatemaa S, Agyemang Frempong G, de-Graft Aikins A. Obesity inSub-Saharan Africa. In: Ahima RS, editor. Metabolic Syndrome: A ComprehensiveTextbook. Cham: Springer International Publishing; 2016. p. 41–53.
64. Boatemaa S, Badasu DM, de-Graft Aikins A. Food beliefs and practices inurban poor communities in Accra: implications for health interventions.BMC Public Health. 2018;18(1):434.
65. Adeloye D, Basquill C. Estimating the prevalence and awareness rates ofhypertension in Africa: a systematic analysis. PLoS One. 2014;9(8):e104300.
66. Akinlua JT, Meakin R, Umar AM, Freemantle N. Current prevalence pattern ofhypertension in Nigeria: a systematic review. PLoS One. 2015;10(10):e0140021.
67. NCD Risk Factor Collaboration (NCD-RisC). Worldwide trends in blood pressurefrom 1975 to 2015: a pooled analysis of 1479 population-based measurementstudies with 19.1 million participants. Lancet. 2017;389(10064):37–55.
68. Maranon R, Reckelhoff JF. Sex and gender differences in control of bloodpressure. Clin Sci (Lond). 2013;125(7):311–8.
69. Lima R, Wofford M, Reckelhoff JF. Hypertension in postmenopausal women.Curr Hypertens Rep. 2012;14(3):254–60.
70. Bosu WK. The prevalence, awareness, and control of hypertension amongworkers in West Africa: a systematic review. Glob Health Action. 2015;8:26227.
71. Fezeu L, Kengne AP, Balkau B, Awah PK, Mbanya JC. Ten-year change inblood pressure levels and prevalence of hypertension in urban and ruralCameroon. J Epidemiol Community Health. 2010;64(4):360–5.
72. Okpechi IG, Chukwuonye II, Tiffin N, Madukwe OO, Onyeonoro UU,Umeizudike TI, Ogah OS. Blood pressure gradients and cardiovascular riskfactors in urban and rural populations in Abia state south eastern Nigeriausing the WHO STEPwise approach. PLoS One. 2013;8(9):e73403.
73. Solomon I, Adjuik M, Takramah W, Axame WK, Owusu R, AttaParbey P, Takase M,Tarkang E, Kweku MJJ. Prevalence and awareness of hypertension among urbanand rural adults in Hohoe municipality. Ghana. 2017;3(3):136–45.
74. Rush KL, Goma FM, Barker JA, Ollivier RA, Ferrier MS, Singini D. Hypertensionprevalence and risk factors in rural and urban Zambian adults in westernprovince: a cross-sectional study. Pan Afr Med J. 2018;30:97.
75. Robles TF, Slatcher RB, Trombello JM, McGinn MM. Marital quality andhealth: a meta-analytic review. Psychol Bull. 2014;140(1):140.
76. Holt-Lunstad J, Birmingham W, Jones BQ. Is there something unique aboutmarriage? The relative impact of marital status, relationship quality, andnetwork social support on ambulatory blood pressure and mental health.Ann Behav Med. 2008;35(2):239–44.
77. Basu S, Millett C. Social epidemiology of hypertension in middle-incomecountries: determinants of prevalence, diagnosis, treatment, and control inthe WHO SAGE study. Hypertension. 2013;62(1):18–26.
78. Cohen AK, Rai M, Rehkopf DH, Abrams B. Educational attainment andobesity: a systematic review. Obes Rev. 2013;14(12):989–1005.
79. Dinsa GD, Goryakin Y, Fumagalli E, Suhrcke M. Obesity andsocioeconomic status in developing countries: a systematic review.Obes Rev. 2012;13(11):1067–79.
80. Hupin D, Roche F, Gremeaux V, Chatard JC, Oriol M, Gaspoz JM, BarthelemyJC, Edouard P. Even a low-dose of moderate-to-vigorous physical activityreduces mortality by 22% in adults aged >/=60 years: a systematic reviewand meta-analysis. Br J Sports Med. 2015;49(19):1262–7.
81. Jefferis BJ, Parsons TJ, Sartini C, Ash S, Lennon LT, Papacosta O, Morris RW,Wannamethee SG, Lee IM, Whincup PH. Objectively measured physicalactivity, sedentary behaviour and all-cause mortality in older men: doesvolume of activity matter more than pattern of accumulation? Br J SportsMed. 2018. https://doi.org/10.1136/bjsports-2017-098733.
82. Cheng S-J, Yu H-K, Chen Y-C, Chen C-Y, Lien W-C, Yang P-Y, Hu G-C.Physical activity and risk of cardiovascular disease among older adults.Int J Gerontol. 2013;7(3):133–6.
83. Klatsky AL. Alcohol and cardiovascular diseases: a historical overview. Ann NY Acad Sci. 2002;957(1):7–15.
84. Brien SE, Ronksley PE, Turner BJ, Mukamal KJ, Ghali WA. Effect ofalcohol consumption on biological markers associated with risk ofcoronary heart disease: systematic review and meta-analysis ofinterventional studies. BMJ. 2011;342:d636.
85. Roerecke M, Tobe SW, Kaczorowski J, Bacon SL, Vafaei A, Hasan OSM,Krishnan RJ, Raifu AO, Rehm J. Sex-specific associations between alcoholconsumption and incidence of hypertension: a systematic review and meta-analysis of cohort studies. J Am Heart Assoc. 2018;7(13):e008202.
86. Roerecke M, Kaczorowski J, Tobe SW, Gmel G, Hasan OSM, Rehm J. The effect ofa reduction in alcohol consumption on blood pressure: a systematic review andmeta-analysis. Lancet Public Health. 2017;2(2):e108–20.
87. Wannamethee SG, Shaper AG. Taking up regular drinking in middle age: effecton major coronary heart disease events and mortality. Heart. 2002;87(1):32–6.
88. Hajat C, Selwyn A, Harris M, Yach D. Preventive interventions for the secondhalf of life: a systematic review. Am J Health Promot. 2018;32(4):1122–39.
Publisher’s NoteSpringer Nature remains neutral with regard to jurisdictional claims inpublished maps and institutional affiliations.
Bosu et al. BMC Cardiovascular Disorders (2019) 19:173 Page 24 of 24