determinants of sme growth: an empirical perspective of smes ...
31
DETERMINANTS OF SME GROWTH: AN EMPIRICAL PERSPECTIVE OF SMES IN THE CAPE COAST METROPOLIS, GHANA Moses Ahomka Yeboah, Cape Coast Polytechnic, Ghana The high failure rate of small and medium enterprises (SMEs) in Ghana is alarming, despite copious government policy and stimulus schemes directed at SMEs. Hence, this study attempts to find out the consequences of the entrepreneur and firm characteristics on SME growth. The research framework was adapted from Storey (1994). Data were gathered from administering questionnaires to 121 SMEs in the Cape Coast Metropolis. Descriptive statistics and the Cramer’s V statistical test were the analytical tools. The findings show that the educational qualification of the entrepreneur and size of the enterprise had the most significant influence on SME growth. This study concluded that owner/managers of SMEs must be educated, even if not by formal schooling; they must periodically attend seminars and workshops to obtain the requisite knowledge and skills to advance their business growth. Entrepreneurs must not be driven solely by financial motives and must also avoid inertia that comes with operating a business enterprise for a very long time. Finally, entrepreneurs must involve very competent people, be it employees or outsiders, to advance the growth of their enterprises. Keywords: Small and medium enterprises (SME) and SMEs growth (sales).
-
Upload
khangminh22 -
Category
Documents
-
view
5 -
download
0
Transcript of determinants of sme growth: an empirical perspective of smes ...

DETERMINANTS OF SME GROWTH:
AN EMPIRICAL PERSPECTIVE OF SMES
IN THE CAPE COAST METROPOLIS,
GHANA
Moses Ahomka Yeboah,
Cape Coast Polytechnic, Ghana
The high failure rate of small and medium enterprises (SMEs) in
Ghana is alarming, despite copious government policy and
stimulus schemes directed at SMEs. Hence, this study attempts to
find out the consequences of the entrepreneur and firm
characteristics on SME growth. The research framework was
adapted from Storey (1994). Data were gathered from
administering questionnaires to 121 SMEs in the Cape Coast
Metropolis. Descriptive statistics and the Cramer’s V statistical
test were the analytical tools. The findings show that the
educational qualification of the entrepreneur and size of the
enterprise had the most significant influence on SME growth. This
study concluded that owner/managers of SMEs must be educated,
even if not by formal schooling; they must periodically attend
seminars and workshops to obtain the requisite knowledge and
skills to advance their business growth. Entrepreneurs must not be
driven solely by financial motives and must also avoid inertia that
comes with operating a business enterprise for a very long time.
Finally, entrepreneurs must involve very competent people, be it
employees or outsiders, to advance the growth of their enterprises.
Keywords: Small and medium enterprises (SME) and SMEs
growth (sales).

Volume 14 (2015) Determinants of SME Growth 2
Introduction
The benefits that small and medium enterprises (SMEs)
provide for economic growth have long been recognised and are
well documented. Consequently, the performance of the SME
sector is closely associated with the economic performance of the
nation. SMEs are increasingly seen as playing an important role in
the economies of many countries. SMEs are considered the engines
of economic growth in developing countries. Along the same lines
as this assertion, Muritala, Awolaja and Bako (2012) concluded
there is the greater likelihood that SMEs will utilize labour-
intensive technologies, thereby reducing unemployment,
particularly in developing countries. In developed countries, SMEs
have traditionally championed job creation, stimulating
innovations and creating new products and services. This
realisation of the enormous contribution of SMEs to economic
growth has propelled governments throughout the world to put
priority on the development of the SME sector to promote
economic growth of their respect countries.
In Africa, Okpara (2011) argued that SMEs play a
momentous role in the macro economy. There has been an obvious
rise in the widespread emergence of SMEs in Sub-Saharan Africa.
The Global Entrepreneurship Monitor (GEM) in 2010 on Angola,
Ghana, South Africa, Uganda and Zambia indicates that the
number of small established businesses is high. Also, the GEM
(2010) revealed that Ghana recorded the highest (40%) established
owned businesses in Africa, followed by Uganda (27%), which are
both significantly higher than China and Brazil (under 15%).
Conversely, South Africa and Angola registered below 10%. These
results show that the increase in established business ownership in
Africa is unevenly spread and this outcome confirms Sacerdoti’s

3
(2002) assertion that SMEs in Africa have generally shown
asymmetrical development.
In considering the SMEs’ economic contribution in some
selected Africa countries, the Department of Trade and Industry
(DTI) (2012) of South Africa indicates that there are more than
800,000 SMEs and has estimated that total economic output of
SMEs in South Africa to be 50% of GDP. It is also estimated that
they provide employment to about 60% of the labour force.
According to Mwarari and Ngugi (2013), SMEs in Kenya are
responsible for about 80% of employment and contribute about
40% to GDP. They argued that these statistics demonstrate that
SMEs are an integral part of the economy, critical in spurring
socioeconomic development in Kenya. In Nigeria, SMEs are
extremely imperative and contribute significantly to economic
growth, principally in the manufacturing sector. SMEs constitute
about 70% to 90% of the business establishment in the
manufacturing sector (Eniola & Ektebang, 2014). The Global
Competitiveness Index (GCI) for 2013 in the Global
Competitiveness Report (2013-2014) placed Nigeria in 127th
position, a further downfall of seven places from 120th
position in
2013. An earlier research by Tsokar (2011) put micro, small and
medium businesses across Nigeria in the region of 17.3 million
with total employment in the sector put at about 32 million (25%
of total employment), contributing about 45% to the GDP.
Similarly, the Ghana banking survey (2013) reveals that the bulk
of SMEs in Ghana are within the services sector, particularly
hotels, restaurants, transport and storage, business and real estate.
The services sector contributed 49.3% to GDP in 2012, having
grown at an annual rate of 8.8% over its 2011 contribution.
In spite of the apparent significant consequences, SMEs
have on very country’s economy and the copious policy schemes
introduced by African governments during the past decade to

Volume 14 (2015) Determinants of SME Growth 4
hasten the development, survival and growth of SMEs in the
African region, the performance of SMEs in Africa has been
substandard. Government policy towards SMEs is one imperative
factor to take into thoughtfulness when looking at the opportunities
SMEs have for growth. The mortality rate of SMEs in Africa
remains very high; it is posited that five out of seven new SMEs
fail within the first year of operation (Adcorp, 2014).
Tushabomwe-kazooba and Kemeza (2006) reported that one-third
of the business startups in Uganda do not exist beyond one year
and further posited that analytical and practical case studies on
appropriate strategies for the competitiveness of SMEs in
developing countries such as Uganda are also limited A recent
study by Fatoki (2012) revealed that the SMEs sector in South
Africa is characterised by high failure rates, as the creation rate of
new SMEs in South African is one of the lowest in the world. In
South Africa, the number of SME failures in the first five year
ranges between 50% and 95% (Willemse, 2010) and about 75% of
new SMEs do not become established businesses, which has been
identified as one of the highest failure rates in the world.
The World Bank Doing Business Report (2012) named
Chad as the most difficult Sub-Saharan Africa country in which to
conduct business, with a high rate of 65% and particularly
bankruptcy regulations that require 60% of the estate value and
lengthy processing time. Business laws in Chad make it difficult
for SMEs to operate and to make a profit. Along this same line,
Chu, Kara and Benzing (2010) opined the most serious and
damaging problem threatening the state of entrepreneurship in
Nigeria is a lack of government interest and support for micro and
small enterprises. Within the Ghanaian context, notwithstanding
the extensive economic reforms instituted in the country to
encourage SME development and growth, SMEs still face a variety
of constraints (UNECA, 2010). According to Kayanula and

5
Quartey (2000), SMEs in Ghana are predominantly owned by one
person with limited formal education. Access to and use of new
technologies and market information and access to credit from the
banking sector is relentlessly restricted. Also, Mensah (2004)
indicated that the management skills of owner/managers are weak,
thus stalling the development of a strategic plan for sustainable
growth of SMEs in Ghana. This alarming rate of business failure
or, better still, the stagnation of SMEs growth gives the Ghanaian
economy reason for concern; there is therefore urgent need for
research on the determinants that may be responsible for
influencing SME growth in Ghana. The SMEs in the Cape Coast
Metropolis share almost the same characteristics with their
counterparts in the other regions of Ghana and therefore the
outcome and recommendation of this study can be extended to
cover other SMEs. Unfortunately, the scanty research on SMEs in
Ghana is focused primarily on the major three cities: Accra,
Kumasi and Takoradi. Hence, this research aims at filling this
research void by considering the determinants influencing SMEs
growth in the Cape Coast Metropolis.
Literature
Measuring SMEs’ Growth
Generally, the term “business growth” is used to refer to
various things, such as increase in total sales volume, increase in
production capacity, increase in employment, increase in
production volume, increase in the use of raw material and power.
These factors indicate growth, but do not provide a specific
meaning of growth. Business growth is typically defined and
measured using absolute or relative changes in sales, assets,
employment, productivity, profits and profit margins. Delmar,
Davidson and Gartner (2003) posited that various scholars use
growth indicators such as assets, market share, physical output and

Volume 14 (2015) Determinants of SME Growth 6
profits to measure business performance. Yet they argued these
indicators are usually not used as sales and employment, because
their applicability is limited; thus, market share and physical output
vary within different industries and are therefore difficult to
compare; total assets value depends on industrial capital intensity
and is sensitive to change over time; and, lastly, profits are simply
appropriate in measuring size over a long period of time.
Furthermore, Delmar et al. (2003) claimed sales and
employment are two important indicators when measuring firm
growth. Employment is often used, because it is comparatively
easy to access and measure as well as because it lies within interest
for policy makers (Barkham et al., 1996). Sales are also commonly
used to measure firm growth, though sales are susceptible to
inflation and exchange rates. Besides, it can be difficult to compare
sales figures in unlike industries. Therefore, Delmar et al. (2003)
concluded that researcher should use multiple growth indicators
when studying firm growth.
In the last decade or so, different authors argue that SMEs
differ from larger enterprises, because they do have dissimilar
growth possibilities. They intimated that large firms witness
expansion during recessions/recoveries, whilst SMEs often seems
to grow in booms. According to Huynh and Petrunia (2010), firms
with a growth objective tend to have higher debt levels than firms
that have lower growth inclination. The desire for business growth
is the only medium through which SMEs can become larger
organisations; business growth is closely linked to employment
creation (Davidsson, Achtenhagen & Naldi, 2010). With regards to
the factors influencing SME growth, Levratto, Tessier and Zouikri
(2010) identified factors such as the firm’s resources, human
capital (age, experience), environmental and market characteristics
as key influences on SME growth.

7
Howard (2006) in a study intimated that organisations go
through seven stages of growth and concluded the initial three
stages are of significant importance and influence on SMEs. The
first stage is when a small business is just beginning with markets
and products that are being developed. The second stage is
expansion, with the focus on increased sales, revenues, market
share and employees. Stage three is professionalization and the
desire to formalize the operations of the organization; this stage is
closely linked to expansion. The fourth stage consolidates the
Table 1: Management role and style
in the five stages of small business growth
Stage Top
management
role
Management
style
Organization
structure
1.Inception Direct
supervision
Entrepreneurial,
Individualistic
Unstructured
2. Survival Supervised
Supervision
Entrepreneurial,
administrative
Simple
3.Growth Delegation/ co-
ordination
Entrepreneurial,
co-ordinate
Functional,
centralized
4.
Expansion
Decentralization Professional,
administrative
Functional,
decentralized
5.Maturity Decentralization Watchdog Decentralized
functional/
product
Source: Scott and Bruce (1987).
activities of the organisation and attempts to solve problems faced
by the firm. Diversification is the fifth stage, with the focus on
developing new products for exiting markets. Stage six is
integration, attention on building an infrastructure to sustain

Volume 14 (2015) Determinants of SME Growth 8
multiple business units. The last stage is decline and revitalization;
this stage focuses on rebuilding the entire organization at all levels
to guarantee continued survival.
As illustrated in Table 1, Scott and Bruce (1987) posited
that a small firm moves from stage 1 (inception) through to stage 5
(maturity). At each of the stages, it is assumed that the role played
by top management, the management style and the organization of
structure change.
Figure 1: Three components influencing SMEs growth
Source: Storey (1994)
The theory propounded by Storey (1994), as depicted in
Figure 1, considers three components influencing SMEs growth.
These components are the starting resources of the entrepreneur(s),
the firm and the strategy. Storey (1994) argued that these three

9
components may be considered as overlapping or intersecting
circles. They cannot be considered wholly independent influences.
The conceptual framework for this study
The conceptual framework of this study is based on the
pioneering works of Storey (1994). However, given the nature and
the environment within which SMEs in the Cape Coast Metropolis
operate, it was imperative that this study adopt the theory of Storey
(1994), in order to achieve the purpose of this study. Therefore,
this study employed the entrepreneur and the firm characteristics
as the determinants of SMEs growth. Also, sales were used to
measure SMEs growth, because this form of growth measurement
is mostly used by SME owner/managers themselves (Carter &
Jones-Evans, 2000). Figure 2 depicts the diagram explaining the
conceptual framework.
Hypotheses
Several earlier studies established that demographic
characteristics of the entrepreneur such, as gender, age, work
experience, education and motivation, had an impact on
entrepreneurial intent and SME growth (Storey, 1994; Kolvereid,
1996). Also, the characteristics of the firm, including age, size,
legal form, industry type and location, are of paramount
importance to the survival and growth of SMEs (Storey, 1994;
Cooper, Gimeno-Gascon & Woo, 1994; Indarti & Langenberg,
2004). Based on the aforementioned arguments, the study stated
the following eight hypotheses to achieve the objective of this
research paper.

Volume 14 (2015) Determinants of SME Growth 10
H1: Male-owned/managed SMEs exhibit higher growth
than female-owned/managed SMEs.
H2: SMEs run by younger owner/managers tend to have a
higher growth.
H3: SMEs owned/managed by entrepreneurs with higher
formal education experience higher growth.
H4: SME growth is influenced by the owner/managers’
motivation for going into business, particularly with regard to
finance.
H5: SME growth decreases with firm age.
H6: SME growth increases with firm size.
H7: Incorporated SMEs have higher growth rate than
unincorporated SMEs.
H8: SMEs industry sector significantly influences their
growth.
Methodology
The target population for this study was SMEs that have
continuously operated business activities for at least 3 years and
also have at least one employee. A list of 201 registered SMEs was
obtained from the Cape Coast Metropolitan Assembly. However,
25 of the SMEs were located outside the Cape Coast Metropolis
and therefore these SMEs were excluded, making the population
size of 176 SMEs used for this study. A sample size of 123 SMEs
out of the population size was obtained using the formula
developed by Krejcie and Morgan (1970).

11
Figure 2: The Framework of the influence of entrepreneurs
and firm characteristics on SME growth
Entrepreneur characteristics
Firm characteristics SME growth
Adapted from: Storey (1994)
This study used a self-administered questionnaire. The
questionnaire was structured with eight items, which made it easy
for the respondents to indicate their responses. Also, SME
owner/managers were asked to indicate their sales in the last three
Gender
Age
Education
Motivation
Sales
Firm age Size Legal form Industry sector

Volume 14 (2015) Determinants of SME Growth 12
years in three categories, specifically: increased, remained the
same and decreased. Descriptive statistics, mainly on frequency
distribution and percentage value, were used to analyse the data. In
testing the hypotheses, Cramer’s V statistical test was used to
examine the influence of the characteristics of owner/managers and
the firm on SMEs growth.
Results
Data collection
A total of 121 questionnaires was used for the study out of
the 123 questionnaires self-administered, because two of the
questionnaires were incompletely filled and so were excluded.
Hence, the response rate generated was 98.37%.
Descriptive Analysis
Most of the respondents, specifically 92%, doubled as
owners and managers of their business enterprises. The female
respondents constituted 51%, putting them marginally ahead of
their male counterparts. The age profile indicated that 73% of the
respondents were below 45 years, suggesting an arguably not very
old adult population of SMEs operators in the Cape Coast
Metropolis. Regarding education, 64.4% of the respondents,
representing the majority, had their highest educational
qualification at the senior high school level. But 2.9% revealed that
they have never been to school or had any formal education. In
terms of their motivation for starting their business venture(s),
36.5% and 33.8% of the respondents indicated they desired
self-fulfillment and financial reward, respectively. Also, 24.2%
claimed they wanted independence and 5.4% opined they wanted
to create jobs.
The characteristics of the respondent’s firms indicated an
overwhelming preference for the sole proprietor form of business
ownership. In particular, 86.5% operated as sole proprietors,

13
10.6% operated as partnerships and fewer than 2.9% ran their
business enterprises as limited liability companies. Furthermore,
65.3% of the respondents had operated their businesses between 2
years and 10 years. The inference is that most of the SMEs in the
Cape Coast Metropolis had existed at most for 10 years. The
nagging question about this outcome is: does it suggest SMEs in
the Cape Coast Metropolis discontinue to exist after 10 years?
With respect to the type of industry, 43.3% were wholesalers and
retailers, 17.3% were manufacturers, 16.3% were into arts,
entertainment and recreation, 12.5% engaged in accommodation
and food services, while 10.6% were into transportation
businesses. The majority of the SMEs, 78%, employ between 1 to
5 people and 22% employ 6 to 9 people. This result indicates that
there are more micro enterprises than small enterprises in the Cape
Coast Metropolis.
Hypothesis testing
The first hypothesis posited that “Male-owned/managed
SMEs exhibit higher growth than female-owned/managed SMEs.”
The results from the cross tabulation in Table 2 depict that the
male-owned/managed SMEs experience not only a lesser decrease
in sales, but also a significant increase in sales growth compared
with their female counterparts. However, more female-
owned/managed SMEs had stability in their sales growth than the
males. This result agrees with the opinion expressed by Kantor
(2001) and Chell (2001) that failure rates for female-owned firms
are higher than those for male.

Volume 14 (2015) Determinants of SME Growth 14
Hypothesis two stated that “SMEs run by younger
owner/managers tend to have a higher growth.” The results from
Table 3 show that SMEs owned/managed by people between the
ages of 30 to 39 experienced the highest increase in sales, with
35.4%, followed by 40 to 49, with 20% sales increase. Also,
owner/managers between the ages of 40 to 49 had the most
decrease in sales despite placing second in terms of sales growth.
The age bracket with the greatest decrease in sales was 60 years
and above. The concluding pattern of these results indicates that
owner/managers of SMEs that fall between the ages of 30 to 39
experience significant sales growth. This confirms the assertion by
Sinha (1996) that younger entrepreneurs tend to be more
successful than the older entrepreneurs.
Table 2: Gender of owner/manager
and its influence on SME growth
Sales
Gender
Decreased
Remained the
same Increased Total
Male 10 11 39 60
40.0% 35.5% 60.0% 49.6%
Female 15 20 26 61
60.0% 64.5% 40.0% 50.4%
Total 25 31 65 121
100.0% 100.0% 100.0% 100.0%

15
Table 3: Age of the owner/manager
and its influence on SME growth
Sales
Age
Decreased
Remained the
same Increased Total
20-29 7 6 15 28
28.0% 19.4% 23.1% 23.1%
30-39 3 10 23 36
12.0% 32.3% 35.4% 29.7%
40-49 11 9 13 33
44.0% 29.0% 20% 27.2%
50-59 4 6 11 21
16.0% 19.4% 16.9% 17.3%
60 and above 0 0 3 3
.0% .0% 4.6% 2.5%
Total 25 31 65 121
100.0% 100.0% 100.0% 100.0%

Volume 14 (2015) Determinants of SME Growth 16
Table 4: Owner/managers’ education
and its influence on SME growth
Owner/managers’ level
of education
Sales
Decreased
Remained
the same Increased Total
never been to school 0 1 2 3
.0% 3.2% 3.1% 2.5%
primary school 0 0 4 4
.0% 0% 6.2% 3.3%
JHS/middle school 10 7 18 35
40.0% 22.6% 27.7% 28.9%
senior high school 7 14 19 40
28.0% 45.2% 29.2% 33.1%
commercial/vocational/
technical
3 7 6 16
12.0% 22.6% 9.2% 13.2%
post secondary diploma 4 0 0 4
16.0% .0% .0% 3.3%
bachelor degree 1 2 9 12
4.0% 6.5% 13.8% 9.9%
post graduate 0 0 7 7
.0% .0% 10.8% 5.8%
Total 25 31 65 121
100.0% 100.0% 100.0% 100.0%

17
The third hypotheses posited that “SMEs owned/managed
by entrepreneurs with higher formal education experience higher
growth.” Table 4 reveals that owner/managers with senior high
school education experience high sales growth, but at the same
time recorded the highest decrease in sales. However, SMEs
operated by owner/managers with university degrees and post-
graduate degrees recorded sales increases with no or minimal
decrease in sales figures. This suggests that owner/managers with
university education experience less decrease in sales (see Carter
& Jones-Evans, 2000).
Hypothesis four stated that “SME growth is influenced by
the owner/managers’ motivation for going into business,
particularly with regard to finance.” As the results in Table 5
indicate, owner/managers with the motivation for self-fulfillment
witnessed the most sales increase. Financial/money motivation
placed second. However, people running SMEs with the
motivation for job creation experienced the least increase in sales.
This outcome corroborates the position of Robichaud, McGraw &
Roger (2001) that SMEs owner/managers are primarily motivated
by self-fulfillment and financial rewards.
The fifth hypothesis stated that “SMEs growth decreases
with firm age.” The results in Table 6 show that SMEs experience
sales increases from 2 years to 10 years of existence. Specifically,
sales soar between 6 and 10 years of SMEs in operation. After 10
years, as depicted in Table 6, sales begin to fall. This outcome
confirms extant research arguing that firm sales is a function of age
(see Hannan & Freeman, 1989; Kristiansen, Furuholt & Wahid,
2003).

Volume 14 (2015) Determinants of SME Growth 18
Hypothesis six stated that “SME growth increases with firm
size.” Table 7 indicates that small enterprises grow faster in sales
than the micro enterprises and also small enterprises enjoy sales
stability. However, the contrasting observation is that micro
enterprises have less sales decrease. Nonetheless, the general
conclusion based on this outcome is that enterprises with more
employees are likely to experience rapid sales growth. (See
Honhyan, 2009; Dun & Girma, 2012).
Table 5: Motivation of the owner/manager
and its influence on SME growth
Sales
Motivation
to start
business
Decreased
Remained
the same Increased Total
Independence 5 6 12 23
20.0% 19.4% 18.5% 19.0%
self
fulfillment
8 14 26 48
32.0% 45.2% 40.0% 39.7%
financial/
money
6 11 17 34
24.0% 35.5% 26.2% 28.1%
job creation 6 0 10% 16
24.0% 0% 15.4% 13.2%
Total 25 31 65 121
100.0% 100.0% 100.0% 100.0%

19
Table 6: Firm age and its influence on SME growth
Sales
Firm
age
Decreased
Remained the
same Increased Total
2years 0 3 6 9
0.0% 9.7% 9.2% 7.4%
3-5years 10 6 17 33
40.0% 19.4% 26.2% 27.3%
6-10years 5 11 21 37
20.0% 35.5% 32.3% 30.6%
11-16 5 9 8 22
20.0% 29.0% 20.0% 16.5%
17 years and
above
5 9 8 22
20.0% 29.0% 12.3% 18.2%
Total 25 31 65 121
100.0% 100.0% 100.0% 100.0%

Volume 14 (2015) Determinants of SME Growth 20
Table 7: Firm size and its influence on SMEs growth.
Employee
Size
Sales
Decreased
Remained
the same Increased Total
1-5 5 2 22 29
20.0% 6.5% 33.8% 24.0%
6-9 20 29 43 92
80.0% 93.5% 66.2% 76.0%
Total 25 31 65 121
100.0% 100.0% 100.0% 100.0%
The seventh hypothesis stated that “Incorporated SMEs
have higher growth rate than unincorporated SMEs.” Conversely,
the results from Table 8 reveal that owner/managers that ran their
SMEs as sole proprietors experienced significant sales increases,
despite also having the highest decrease in sales. However, SMEs
that operated as limited liability companies had the least decrease
in sales. This outcome could be due to the fact that majority of
SMEs in the Cape Coast Metropolis are solely owned and
managed. The descriptive statistics corroborate this assertion, by
revealing that just 2.5% of these SMEs operate as limited liability
companies. But other researchers have contended that limited
liability companies rather experience rapid sales growth (Stiglitz &
Weiss, 1981; Reynolds & Miller, 1988).

21
The eighth hypothesis stated that “SMEs industry sector
significantly influences their growth.” The results in Table 9
indicate that owner/managers of SMEs operating as wholesalers
and retailers had the highest association with sales increase. This
revelation is not odd, because the majority of SMEs in the
Metropolis are predominantly into wholesale and retail businesses.
The manufacturing sector witnessed the next largest sales increase.
However, the transport sector had the lowest sales increase; this
could be partly explained by the frequent hikes in fuel prices,
which cause transportation charges to soar. And since the Cape
Coast Metropolis occupies a small land space, residents nowadays
prefer to commute walking to boarding a commercial vehicle.
Table 8: Firm legal form and its influence on SMEs growth.
Legal form
of business
Sales
decreased
remained
the same increased Total
sole trader 22 30 50 102
88.0% 96.8% 76.9% 84.3%
Partnership 2 0 1 3
8.0% .0% 1.5% 2.5%
limited
liability
company
1 1 14 16
4.0% 3.2% 21.5% 13.2%
Total 25 31 65 121
100.0% 100.0% 100.0% 100.0%

Volume 14 (2015) Determinants of SME Growth 22
Table 9: Industry sector and its influence on SME growth
Type of
industry
Sales
Decreased
Remained
the same Increased Total
Manufacturing 4 3 13 20
16.0% 9.7% 20.0% 16.5%
Accommodation
and food
services
activities
3 3 9 15
12.0% 9.7% 13.8% 12.4%
Arts,
entertainment
and recreation
6 6 7 19
24.0% 19.4% 10.8% 15.7%
Wholesalers and
retailers
6 18 31 55
24.0% 58.1% 47.7% 45.5%
Transport 6 1 5 12
24.0% 3.2% 7.7% 9.9%
Total 25 31 65 121
100.0% 100.0% 100.0% 100.0%

23
Discussion
The study found that those SMEs owned/managed by males
experienced greater increases in sales growth than their female
counterparts. Nevertheless, the female-owned/managed SMEs had
a relatively steady sales growth. This outcome supports the
previous argument by Kantor (2001) and Chell (2001) that the
mortality rate for female-owned/managed SMEs is comparatively
high. Also, this study maintains the proposition that SMEs
owned/managed by younger people have a higher sales growth
propensity than those SMEs operated by older people. This finding
confirms an earlier conclusion made by Storey (1994). Although
the SMEs operated by persons with a university degree did not
experienced the most sales increase, this study showed that such
SMEs experience very low decrease in sales. In other words, these
SMEs enjoy relatively stable sales growth. Owner/mangers of
SMEs with the motivation of self-fulfillment recorded the most
significant increase in sales. Several authors, including Robichaud,
McGraw and Roger (2001), have concluded that financial drive is
not the top-most motivation for most SMEs owners/managers
going into business.
Regarding the firm characteristics, this study revealed that
SMEs experience sales growth at most for 10 years of existence
and afterwards their sales begin to have a nosedive. The majority
of these SMEs witnessed significant sales growth between the ages
of 6 to 10 years in business operation. This revelation falls in line
with the views of Kristiansen, Furuholt & Wahid (2003), who
argued that SMEs that have existed relatively for longer years are
more successful than those SMEs that are nascent. Also, this study
supports the assertion by Dun and Girma (2012) that SMEs with
more employees do better in business than their counterparts with
fewer employees. Contrarily to previous research works, which
affirmed that SMEs running as limited liability companies
Volume 14 (2015) Determinants of SME Growth 24
experienced significant sales increases, this study posited that
SMEs operating as sole proprietorships had the most sales
increases. In effect, this outcome does not corroborate earlier
findings. The association between industry type and sales growth
indicated a strong relationship, with the wholesale and retail
sectors witnessing the highest sales growth.
Table 10: The entrepreneur characteristics
and their influence on SME growth
Characteristics Chi
square
d.f. Cramer’s V P
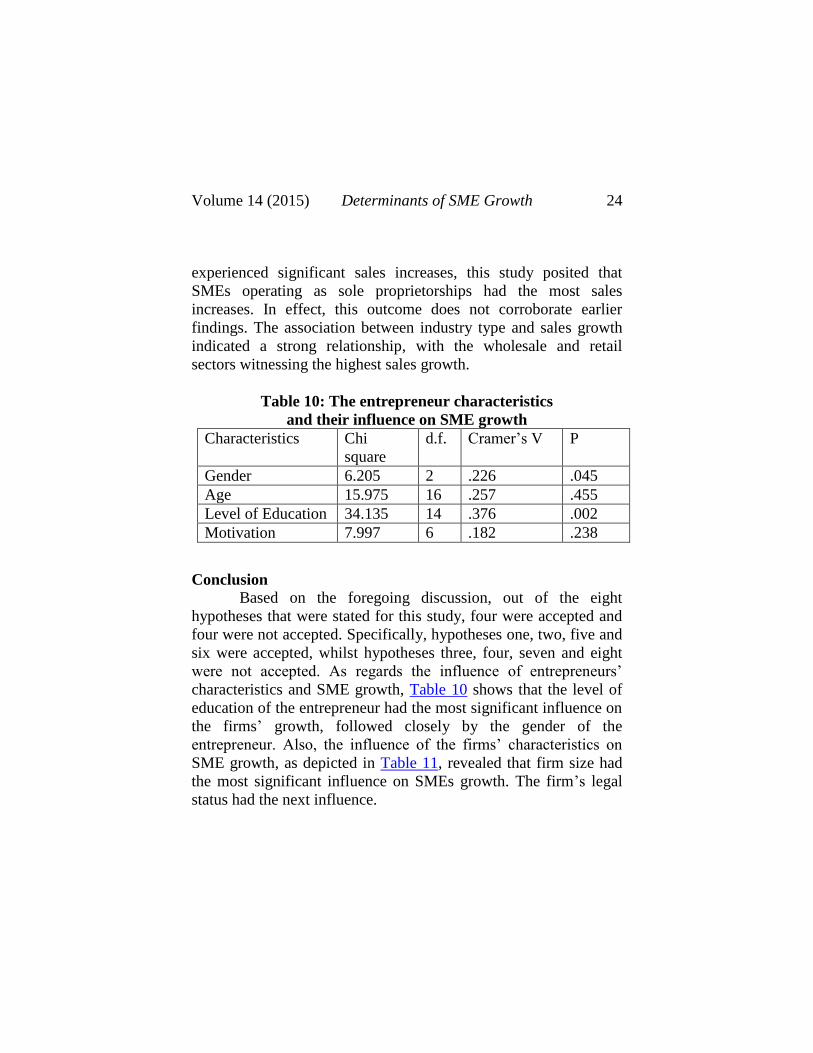
Gender 6.205 2 .226 .045
Age 15.975 16 .257 .455
Level of Education 34.135 14 .376 .002
Motivation 7.997 6 .182 .238
Conclusion
Based on the foregoing discussion, out of the eight
hypotheses that were stated for this study, four were accepted and
four were not accepted. Specifically, hypotheses one, two, five and
six were accepted, whilst hypotheses three, four, seven and eight
were not accepted. As regards the influence of entrepreneurs’
characteristics and SME growth, Table 10 shows that the level of
education of the entrepreneur had the most significant influence on
the firms’ growth, followed closely by the gender of the
entrepreneur. Also, the influence of the firms’ characteristics on
SME growth, as depicted in Table 11, revealed that firm size had
the most significant influence on SMEs growth. The firm’s legal
status had the next influence.

25
Table 11: The firm characteristics
and their influence on SME growth
Characteristics Chi
square
d.f. Cramer’s’ V P
Firm age 11.646 8 .219 .168
Firm size 8.916 2 .271 .012
Firm legal status 12.457 4 .227 .014
Industry sector 14.435 8 .244 .071
Source: Storey (1994)
In a nutshell, this study finds that male and female
entrepreneurs have almost equal business acumen to increase their
sales growth. Furthermore, owner/managers of SMEs must desire
to be educated; even if it is not formal education, they must
endeavour to attend seminars and workshops to acquire the needed
knowledge and skills to boost their business performance. SME
operators must not be too money conscious in their business
activities. This study confirms this stance, by revealing that the
motivation for self–fulfillment can increase sales growth
significantly. Additionally, owner/managers of SMEs must strive
to avoid inertia that comes with business enterprise ageing and also
bring more competent people onboard to assist in growing the
business enterprises.

Volume 14 (2015) Determinants of SME Growth 26
References
Adcorp (2012). New Business Start-ups Slump to Alltime Low.
[Online] Available:
http://www.adcorp.co.za/NEws/Pages/Newbusinessstart-
upsslumptoall-timelow.aspx. Accessed: Mar. 22, 2012.
Barkham R., G. Gudgin, M. Hart & E. Hanvey (1996). The
Determinants of Small Firm Growth: An Inter-regional Study in
the United Kingdom 1986–1990. Jessica Kingsley, London.
Carter, S. & D. Jones-Evans (2000). Enterprise and Small Business
– Principles, Practice and Policy. Harlow: FT Prentice Hall.
Chell, E. (2001). Entrepreneurship: Globalisation, Innovation and
Development, Stamford, CT: Thomson learning.
Chu, M., O. Kara & C. Benzing (2010). An Empirical Study of
Nigerian Entrepreneur: Success, Motivation, Problems and Stress.
International Journal of Business Research, 16.
Cooper, A., F. Gimeno-Gascon & C. Woo (1994). Initial Human
and Financial Capital as Predictors of New Venture Performance.
Journal of Business Venturing, 9(5), 371-95.
Davidsson P., L. Achtenhagen, & L. Naldi (2010). Small Firm
Growth. Foundations and Trends in Entrepreneurship, 6(2), 69-
166.
Davidsson, P. (1989). Entrepreneurship and After? A Study of
Growth Willingness in Small Firms. Journal of Business
Venturing, 4, 211-26.
Delmar, F., P. Davidsson & W. Gartner (2003). Arriving at the
High-growth Firm. Journal of Business Venturing. 18(2), 189.
Department of Trade and Industry (2012). South Africa’s
Economic Transformation: A Strategy for Broad-based Black

27
Economic Empowerment, viewed 25 April 2014,
from http://www.dti.gov.za/economic_empowerment/bee-
strategy.pdf
Dun, J. & S. Girma (2012). Firm Size, Source of Finance, and
Growth: Evidence from China. International Journal of Economics
of Business. 19(3), 397- 419.
Eniola, A.A., & H. Ektebang (2014). SME Firms Performance in
Nigeria: Comparative Advantage and Its Impact. International
Journal of Research Studies in Management, 3(2), 75-86.
Fatoki, O. (2012). The Impact of Entrepreneurial Orientation on
Access to Debt Finance and Performance of Small and Medium
Enterprises in South Africa. Journal of Social Science, 32(2), 121-
31.
FinMark Trust (2006). FinScope Small Business Survey Report
[online]. Available: http://www.finmarktrust.org.za Accessed: 15
November, 2009.
GEM (2010). Global Entrepreneurship Monitor. Retrieved July 27,
2010, from http://www.gemconsortium.org/
Ghana Banking Survey (2013). Available at
http://www.pwc.com/en_GH/gh/pdf/ghana-banking-survey-2013-
pwc.pdf. Accessed: 1/11/13
Global Competitiveness Report (2013-2014).
http://reports.weforum.org/the-global-competitiveness-report-
2013-2014/#.
Hannan, M. T., & J. Freeman (1989). Organizational Ecology.
Harvard University Press, Cambridge, MA.

Volume 14 (2015) Determinants of SME Growth 28
Honhyan, Y., (2009). The Determinants of Capital Structure of the
SMEs: An Empirical Study of Chinese Listed Manufacturing
Companies. [Online] Available:
www.seiofbluemountain.com/search/detail.php?id=4414 (Dec. 22,
2011).
Howard, J. L. (2006). Small Business Growth: Development
Indicators. Academy of Entrepreneurship Journal, 12 (1).
Huynh, K. & R. Petrunia (2010). Age, Leverage and Firm growth.
Journal of Economic Dynamics and Control, 34, 5.
Indarti, N., & M. Langenberg (2004). Factors Affecting Business
Success among SMEs: Empirical Evidences from Indonesia. The
Second Bi-annual European Summer University 2004, University
of Twente, Enschede, Netherlands.
Kantor, P. (2001). Promoting Women's Entrepreneurship
Development Based on Good Practice Programmes: Same
Experiences from the North to the South. IFP/SEED-WEDGE
Working Paper No. 9. ILO, Geneva.
Kauffmann, C. (2005). Financing SMEs in Africa. Policy Insights
No. 7. African Economic Outlook 2004/2005. African
Development Bank and OECD Development Centre.
Kayanula, D., & P. Quartey (2000). The Policy Environment for
Promoting Small and Medium-Sized Enterprises in Ghana and
Malawi. Manchester, UK: Institute for Development Policy and
Management, University of Manchester.
Kolvereid, L. (1996). Prediction of Employment Status Choice
Intentions. Entrepreneurship Theory and Practice, Fall, 47-57.
Krejcie, R.V. & D.W. Morgan (1970). Determining Sample Size
for Research Activities. Educational and Psychological
Measurement, 30, 607-10.

29
Kristiansen, S., B. Furuholt, B., & F. Wahid (2003). Internet Cafe
Entrepreneurs: Pioneers in Information Dissemination in
Indonesia. International Journal of Entrepreneurship and
Innovation, 4(4), 251-63.
Levratto, N., L. Tessier & M. Zouikri (2010). The Determinants of
Growth for SMEs. A Longitudinal Study of French Manufacturing
Firms. [Online] Available: http://ssrn.com/abstract=1780466 or
http://dx.doi.org/10.2139/ssrn.1780466 (Feb. 15th, 2014).
McGraw, E, & Y. Robichaud (1998). Comparative Study of
Female and Male Entrepreneurs Outside Quebec. Journal of Small
Business and Entrepreneurship, 15(2), 69-87.
Mensah, S. (2004). A Review of SME Financing Schemes in
Ghana. Paper Presented at the UNIDO Regional Workshop of
Financing Small and Medium Scale Enterprises, Accra, Ghana, 15
– 16 March 2004.
Muritala, T. A., A. M. Awolaja & Y. A. Bako (2012). Impact of
Small and Medium Enterprises on Economic Growth and
Development. American Journal of Business and Management,
1(1), 18–22.
Mwarari, M. M. & P. K. Ngugi (2013). Factors Influencing Listing
of Kenyan SMEs in the Securities Market for Capital Raising
Opportunities, European Journal of Management Sciences and
Economics, 1(2), 99-115.
Nwaka, G.I. (2005). The Urban Informal Sector in Nigeria:
Towards Economies Development, Environmental Health, and
Social Harmony. Global Urban Development, 1(1), 1-11.
Okpara, J. (2011). Factors Constraining the Growth and Survival
of SMEs in Nigeria: Implications for Poverty Alleviation.
Management Research Review, 34(2), 156–71.

Volume 14 (2015) Determinants of SME Growth 30
Reynolds, P. & B. Miller (1988). Minnesota New Firm Study: An
Exploration of New Firms and Their Economic Contributions.
Minneapolis, Minnesota: Center for Urban and Regional Affairs.
Robichaud, Y., E. McGraw, & A. Roger (2001). Towards
the Development of a Measuring Instrument for Entrepreneurial
Motivations. Journal of Developmental Motivation, 6(1), 189-202.
Sacerdoti, E. (2005). Access to Bank Credit in Sub-Saharan Africa:
Key Issues and Reform Strategies. International Monetary Fund
(IMF) Working Paper WP/05/166, August.
Scott, M. & R. Bruce (1987). Five Stages of Growth in Small
Business. Long Range Planning, 20(3), 45-52.
Sinha, T. N. (1996). Human Factors in Entrepreneurship
Effectiveness. Journal of Entrepreneurship, 5(1), 23-39.
Statistics South Africa (2009). Quarterly Labour Force Survey:
Second Quarter, April to June 2009. [On-line] Available:
http://www.info.gov.za/speeches/2009/09072911151001.htm.
Stiglitz, J. & A. Weiss (1981). Credit Rationing in Markets with
Imperfect Information. American Economic Review 81, 393-410.
Storey, D. (1994). Understanding the Small Business Sector.
International Thompson Business Press, London.
Tsokar, K. (2011). SMEDAN to Re-position Sub-sector for
Economic Development. The Guardian, 6, 24.
Tushabomwe-Kazooba, C. & Kemeza, I. (2006). Uganda’s
Drought and Power Blackout – a Systematic Crisis. Disaster
Recovery Journal, winter 2007, 76-78.
UNECA (2010). A Technological Resurgence? Africa in the
Global Flows of Technology, UNECA Series on Technology

31
Transfer for Africa’s Development. New York and Geneva: United
Nations.
Willemse, J. (2010). The Forum SA. SME Failure Statistics.
[Online] Available at:
http://www.theforumsa.co.za/forums/showthread.php?t=7808.
Accessed: 21 Sept, 2010.
World Bank (2012). Doing Business 2013. The World Bank: New
York.