SME Bank.pdf
61
31-Dec 31-Dec 1-Jan 2011 2010 2010 Note ASSETS Restated Restated Cash and balances with treasury banks 8 214,655 228,062 213,861 Balances with other banks 9 9,865 20,912 79,660 Lendings to financial institutions 10 800,000 - 33,445 Investments 11 3,027,667 2,680,334 2,701,816 Advances 12 3,349,078 3,307,599 3,957,897 Operating fixed assets 13 135,321 132,586 122,462 Deferred tax assets 14 - - - Other assets 15 220,602 262,976 449,480 7,757,188 6,632,469 7,558,621 LIABILITIES Bills payable 16 183,863 40,505 54,542 Borrowings 17 2,171,669 1,437,604 1,728,922 Deposits and other accounts 18 2,999,192 2,651,948 2,934,403 Sub-ordinated loans - - - Liability against assets subject to finance lease 19 16,013 15,369 2,023 Deferred tax liabilities - - - Other liabilities 20 388,127 363,395 439,630 5,758,864 4,508,821 5,159,520 NET ASSETS 1,998,324 2,123,648 2,399,101 REPRESENTED BY Share capital 21 2,392,507 2,392,507 2,392,507 Reserves 22 234,660 234,660 234,660 Unappropriated loss 22 (650,596) (442,362) (158,082) 1,976,571 2,184,805 2,469,085 Non-controlling interest 69,693 87,470 100,255 2,046,264 2,272,275 2,569,340 Deficit on revaluation of assets 23 (47,940) (148,627) (170,239) 1,998,324 2,123,648 2,399,101 CONTINGENCIES AND COMMITMENTS 24 The annexed notes 1 to 43 and Annexure-I form an integral part of these unconsolidated financial statements. ________________________ Chief Financial Officer ________________________ ______________ President/Chief Executive Director Director Director ______________ ________________ (Rupees in '000) SME Bank Limited Consolidated Statement of Financial Position As at December 31, 2011
-
Upload
khangminh22 -
Category
Documents
-
view
2 -
download
0
Transcript of SME Bank.pdf

31-Dec 31-Dec 1-Jan
2011 2010 2010
Note
ASSETS Restated Restated
Cash and balances with treasury banks 8 214,655 228,062 213,861
Balances with other banks 9 9,865 20,912 79,660
Lendings to financial institutions 10 800,000 - 33,445
Investments 11 3,027,667 2,680,334 2,701,816
Advances 12 3,349,078 3,307,599 3,957,897
Operating fixed assets 13 135,321 132,586 122,462
Deferred tax assets 14 - - -
Other assets 15 220,602 262,976 449,480 f
7,757,188 6,632,469 7,558,621
LIABILITIES
Bills payable 16 183,863 40,505 54,542
Borrowings 17 2,171,669 1,437,604 1,728,922
Deposits and other accounts 18 2,999,192 2,651,948 2,934,403
Sub-ordinated loans - - -
Liability against assets subject to finance lease 19 16,013 15,369 2,023
Deferred tax liabilities - - -
Other liabilities 20 388,127 363,395 439,630
5,758,864 4,508,821 5,159,520
NET ASSETS 1,998,324 2,123,648 2,399,101
REPRESENTED BY
Share capital 21 2,392,507 2,392,507 2,392,507
Reserves 22 234,660 234,660 234,660
Unappropriated loss 22 (650,596) (442,362) (158,082)
1,976,571 2,184,805 2,469,085
Non-controlling interest 69,693 87,470 100,255
2,046,264 2,272,275 2,569,340
Deficit on revaluation of assets 23 (47,940) (148,627) (170,239)
1,998,324 2,123,648 2,399,101
CONTINGENCIES AND COMMITMENTS 24
The annexed notes 1 to 43 and Annexure-I form an integral part of these unconsolidated financial statements.
________________________
Chief Financial Officer
________________________ ______________
President/Chief Executive Director Director Director
______________ ________________
(Rupees in '000)
SME Bank Limited
Consolidated Statement of Financial Position
As at December 31, 2011

Consolidated Profit and Loss Account
For the year ended December 31, 2011
2010
Note
Mark-up/ return/ interest earned 25 728,192 647,521
Mark-up/ return/ interest expensed 26 432,919 350,732
Net mark-up/ interest income 295,273 296,789
(Reversal of provision) / provision against non-performing
advances-net of reversal 12.5 (75,329) 165,535
Provision for diminution in the value of investments - 306
Bad debts written off directly 653 939
(74,676) 166,780
Net mark-up/ interest income after provisions 369,949 130,009
NON MARK-UP/ INTEREST INCOME
Fee, commission and brokerage income 12,488 13,505
Dividend income 3,431 3,339
Income from dealing in foreign currency - -
Gain on sale of securities 27 5,957 12,298
Unrealized gain on revaluation of investments classified as held
for trading - -
Other income 28 4,862 33,145
Total non-markup/ interest income 26,738 62,287
396,687 192,296
NON MARK-UP/ INTEREST EXPENSE
Administrative expenses 29 608,610 517,111
Other provisions/ write offs 15.4 4,599 7,970
Other charges 30 48 4,267
Total non-markup/ interest expenses 613,257 529,348
LOSS BEFORE TAXATION (216,570) (337,052)
Taxation - Current 31 8,461 10,111
- Prior - (49,511)
- Deferred - -
8,461 (39,400)
LOSS AFTER TAXATION (225,031) (297,652)
Attributable to :
Equity holders of the Bank (208,234) (284,280)
Non-controlling interest (16,797) (13,372)
(225,031) (297,652)
The annexed notes 1 to 43 and Annexure-I form an integral part of these unconsolidated financial statements.
________________________
Chief Financial Officer
__________________________ _______________
President/Chief Executive Director Director Director
SME Bank Limited
2011
_____________________________
(Rupees in '000)

For the year ended December 31, 2011
Net loss after taxation (transferred to equity) (225,031) (297,652)
99,707 22,198
Total comprehensive income for the year (125,324) (275,454)
Attributable to :
Equity holders of the Bank (107,547) (262,669)
Non-controlling interest (17,777) (12,785) (125,324) (275,454)
The annexed notes 1 to 43 and Annexure-I form an integral part of these unconsolidated financial statements.
________________________
Chief Financial Officer
______________________ _____________ _____________
President/Chief Executive Director Director Director
2010
_____________
SME Bank Limited
Consolidated Statement of Comprehensive Income
Net change on remeasurement of available for sale investment
to fair value
Other comprehensive income (not transferred to equity
except share of non-controlling interest)
(Rupees in '000)
2011

Consolidated Cash Flow Statement
For the year ended December 31, 2011
2011
Note
Restated
CASH FLOW FROM OPERATING ACTIVITIES
Loss before taxation (216,570) (337,052)
Less: Dividend income (3,431) (3,339)
(220,001) (340,391)
Adjustments for non-cash/ other items
Depreciation 16,366 15,873
Amortization 1,694 1,700
Provision against non-performing loans and advances (75,329) 165,535
Provision for impairment in value of investments - 306
Net profit on sale of fixed asset (474) (14,959)
Finance charges on leased assets 898 28
Other provisions 4,599 7,970
653 939
(51,593) 177,392
(271,594) (162,999)
(Increase)/ decrease in operating assets
Lendings to financial institutions (550,000) 33,445
Advances 33,197 483,824
Other assets (excluding advance taxation) 37,775 178,538 (479,028) 695,807
Increase/ (decrease) in operating liabilities Bills payable 143,358 (14,037) Borrowings from financial institutions 734,065 (204,579) Deposits 347,244 (282,455) Other liabilities (excluding current taxation) 32,054 (30,214)
1,256,721 (531,285) 506,099 1,522
Income tax paid (15,783) (5,908) Net cash flow generated from / (used in) operating activities 490,316 (4,386)
CASH FLOW FROM INVESTING ACTIVITIESNet (investments)/de-investment in available-for-sale securities (447,626) 190,014 Net de-investments/(investment) in held-to-maturity securities 200,000 (146,640) Dividend income 3,431 3,339 Investments in operating fixed assets (21,524) (29,006) Sale proceeds of property and equipment disposed-off 1,203 15,553 Net cash flow (used in)/generated from investing activities (264,516) 33,260
CASH FLOW FROM FINANCING ACTIVITIESPayment of lease obligations (254) (2,636) Financing for leased vehicles - 15,954 Net cash flow (used in)/generated from financing activities (254) 13,318
Increase in cash and cash equivalents 225,546 42,192 Cash and cash equivalents at beginning of the year 248,974 206,782 Cash and cash equivalents at end of the year 32 474,520 248,974
The annexed notes 1 to 43 and Annexure-I form an integral part of these unconsolidated financial statements.
________________________
Chief Financial Officer
______________________ _____________ _____________ ____________
President/Chief Executive Director Director Director
SME Bank Limited
Bad debts written off directly
(Rupees in '000)
2010

Consolidated Statement of Changes in Equity
For the year ended December 31, 2011
Share Capital Share
Premium
Statutory
reserve
Reserve
against future
losses
Unappropriated
loss Sub total
Non-controlling
interestTotal
(Rupees in '000)
Balance as at January 1, 2010 as previously
reported 2,392,507 5,909 227,434 8,202 (201,608) 2,432,444 94,346 2,526,790
Payable to Industrial Credit for Rural Women
transferred to unapproprated loss (refer note 20.2) - - - -
30,851 30,851 - 30,851
Receivable from M/S Ravi Securities (Pvt.) Ltd. and
M/S Tass Securities (Pvt.) Ltd. (refer note 15.3) - - - -
11,699 11,699 - 11,699
Share premium transferred to non-controlling
interest (refer note 22.3) - (5,909) - - (5,909) 5,909 -
Adjustments - - (415) (561) 976 - - -
Balance as at January 1, 2010 - Restated 2,392,507 - 227,019 7,641 (158,082) 2,469,085 100,255 2,569,340
Total comprehensive income
Net loss for the year - - - - (284,280) (284,280) (13,372) (297,652)
Surplus on revaluation of investments - - - - - - 587 587
Balance as at December 31, 2010 - Restated 2,392,507 - 227,019 7,641 (442,362) 2,184,805 87,470 2,272,275
Balance as at December 31, 2010 as previously
reported2,392,507 5,909 227,434 8,202 (485,887) 2,148,165 81,561 2,229,726
Balance as at December 31, 2010 - Restated 2,392,507 - 227,019 7,641 (442,362) 2,184,805 87,470 2,272,275
Total comprehensive income
Net loss for the year - - - - (208,234) (208,234) (16,797) (225,031)
Deficit on revaluation of investment - - - - - - (980) (980)
Balance as at December 31, 2011 2,392,507 - 227,019 7,641 (650,596) 1,976,571 69,693 2,046,264
The annexed notes 1 to 43 and Annexure-I form an integral part of these unconsolidated financial statements.
________________________
Chief Financial Officer
______________________ _______________ _____________ ____________
President/Chief Executive Director Director Director
SME Bank Limited
Attributable to shareholders of the Group

Notes to the Consolidated Financial Statements
For the year ended December 31, 2011
1. THE GROUP AND ITS OPERATIONS
1.1
SME Bank Limited - Holding Company:
SME Leasing Limited - Subsidiary Company:
SME Bank Limited
SME Bank Limited (the Bank) is a public limited company incorporated in Pakistan on October 30, 2001
under the Companies Ordinance, 1984 having its registered office at 40-Jang Building, A.K. Fazal ul Haq
Road, Blue Area, Islamabad. The Bank obtained its business commencement certificate on April 16,
2005 which became effective from the date of its issue. The Bank is a Scheduled Commercial Bank
engaged in the business of banking with the primary objective to support and develop Small and
Medium Enterprise (SME) sector in Pakistan by providing necessary financial assistance and business
support services on sustainable basis. The Bank is operating through a network of 13 Commercial
banking branches. Based on the latest credit rating report dated June 30, 2011 issued by JCR-VIS Credit
Rating Company Limited, credit rating of the Bank was BBB (triple B) in the long term and A-3 (A
three) in the short term.
In terms of the provisions of the State Bank of Pakistan BSD circular No. 7 of 2009, the Bank was
required to increase its paid up capital (net of losses) as at December 31, 2011 up to Rs. 8 billion. The
State Bank of Pakistan (SBP) has granted exemption from meeting the enhanced Minimum Capital
Requirement and the Bank is allowed to operate with minimum paid up capital (net of losses) of Rs. 2
billion till privatization of the Bank.
The Group consists of the holding company - SME Bank Limited (the Bank) and its subsidiary company
- SME Leasing Limited (SMEL). The Bank and SMEL are collectively referred to as "the Group".
SME Leasing Limited (SMEL) was incorporated in Pakistan as a public limited company on July 12,
2002 and acquired the status of a listed company on December 13, 2006. At the time of incorporation,
SMEL was a wholly owned subsidiary of the Bank, whereby under an arrangement the assets and
liabilities of the leasing division of the Bank were transferred to SMEL on January 28, 2003. The
registered office of SMEL is situated in Islamabad. SMEL is registered with the Securities and Exchange
Commission of Pakistan (SECP) as a leasing company under the Non-Banking Finance Companies
(Establishment and Regulation) Rules, 2003. The core objective of SMEL is to extend lease and working
capital financing facilities to small and medium enterprises of the country. Based on the latest credit
rating report dated February 08, 2011 issued by JCR-VIS Credit Rating Company Limited, credit rating
of the SME Leasing Limited was BBB (Triple B) in long term and A - 3 (A three) in short term.
During the year 2006, SMEL made an Initial Public Offer of 10 million ordinary shares of Rs 10 each at
an offer price of Rs. 11 per share inclusive of a premium of Rs. 1 per share thereby increasing the issued,
subscribed and paid-up capital to Rs 320 million represented by 32 million ordinary shares of Rs. 10
each. Consequently, the holding of the Bank in SMEL has reduced to 73.14%.

1.2 Amalgamation of defunct RDFC and SBFC
2. BASIS OF CONSOLIDATION
Material intra-group balances and transactions have been eliminated.
3. BASIS OF PRESENTATION
3.1
3.2
4. STATEMENT OF COMPLIANCE
4.1
The Federal Government promulgated the Regional Development Finance Corporation (RDFC) and
Small Business Finance Corporation (SBFC) Amalgamation and Conversion Ordinance, 2001 (the
Ordinance 2001) setting forth the mechanism of amalgamation of defunct RDFC and SBFC. Both these
entities were Development Financial Institutions (DFIs). In pursuance of the Ordinance 2001, Finance
Division, Ministry of Finance issued an Order (SRO (1) 2001) dated December 29, 2001 setting forth
the scheme of amalgamation of RDFC and SBFC with the Bank effective January 1, 2002. Pursuant to
this scheme entire assets and liabilities of defunct RDFC and SBFC as at December 31, 2001 were
transferred to the Bank at fair value. These two institutions stand dissolved and ceased to exist effective
January 1, 2002. The Bank allotted its shares to the share holders of defunct RDFC and SBFC in
proportion to their shareholding therein based on the fair value of net assets of defunct RDFC and
SBFC on December 31, 2001.
These consolidated financial statements include the financial statements of the Bank and SMEL.
The assets and liabilities of the subsidiary company have been consolidated on a line by line basis and the
carrying value of investment held by the Bank is eliminated against the subsidiary's shareholder's equity
in the consolidated financial statements.
Non- controlling interest are that part of the net results of operations and of net assets of the subsidiary
company attributable to the interest which are not owned by the Bank. Non controlling interests are
presented as separate item in these consolidated financial statements.
These consolidated financial statements have been presented in accordance with the requirements of
format prescribed by the State Bank of Pakistan's BSD Circular No. 4 dated February 17, 2006.
These consolidated financial statements have been prepared in accordance with approved accounting
standards as applicable in Pakistan. Approved accounting standards comprise of such International
Financial Reporting Standards issued by the International Accounting Standards Board as are notified
under the Companies Ordinance, 1984, provisions of and directives issued under the Companies
Ordinance, 1984 and Banking Companies Ordinance, 1962 and the directives issued by State Bank of
Pakistan (SBP) and Securities and Exchange Commission of Pakistan (SECP). In case the requirements
of provisions and directives issued under the Companies Ordinance, 1984 and Banking Companies
Ordinance, 1962 and the directives issued by SBP differ, the provisions of and directives issued under
the Companies Ordinance, 1984 and Banking Companies Ordinance, 1962 and the directives issued by
SBP shall prevail.
Items included in the consolidated financial statements are measured using the currency of the primary
economic environment in which the Group operates. The consolidated financial statements are
presented in Pak. Rupee, which is the Group's functional currency.

4.2
-
-
-
-
IAS 19 Employee Benefits (amended 2011) - (effective for annual periods beginning on or after 1
January 2013). The amended IAS 19 includes the amendments that require actuarial gains and losses to
be recognised immediately in other comprehensive income; this change will remove the corridor method
and eliminate the ability for entities to recognise all changes in the defined benefit obligation and in plan
assets in profit or loss, which currently is allowed under IAS 19; and that the expected return on plan
assets recognised in profit or loss is calculated based on the rate used to discount the defined benefit
obligation. The Group does not plan to adopt this change early and the extent of the impact has not
been determined.
The following standards, amendments and interpretations of approved accounting standards will be
effective for accounting periods beginning on or after 01 January 2012:
International Accounting Standard 39, "Financial Instruments: Recognition and Measurement",
International Accounting Standard 40, "Investment Property" and International Financial Reporting
Standard 7,"Financial Instruments: Disclosure" are not applicable to banking companies in Pakistan.
Accordingly, the requirements of these Standards have not been considered in the preparation of these
consolidated financial statements. However, investments have been classified and valued in accordance
with the requirements prescribed by the State Bank of Pakistan through various circulars.
Standards, interpretations and amendments to approved accounting standards that are not yet
effective
IAS 27 Separate Financial Statements (2011) - (effective for annual periods beginning on or after 1
January 2013). IAS 27 (2011) supersedes IAS 27 (2008). Three new standards IFRS 10 - Consolidated
Financial Statements, IFRS 11- Joint Arrangements and IFRS 12- Disclosure of Interest in Other
Entities dealing with IAS 27 would be applicable effective 1 January 2013. IAS 27 (2011) carries forward
the existing accounting and disclosure requirements for separate financial statements, with some minor
clarifications. The amendments are not expected to impact the current transactions of the Group.
IAS 28 Investments in Associates and Joint Ventures (2011) - (effective for annual periods beginning on
or after 1 January 2013). IAS 28 (2011) supersedes IAS 28 (2008). IAS 28 (2011) makes the amendments
to apply IFRS 5 to an investment, or a portion of an investment, in an associate or a joint venture that
meets the criteria to be classified as held for sale; and on cessation of significant influence or joint
control, even if an investment in an associate becomes an investment in a joint venture. The
amendments are not expected to impact the current transactions of the Group.
Presentation of Items of Other Comprehensive Income (Amendments to IAS 1) - (effective for annual
periods beginning on or after 1 July 2012). The amendments require that an entity present separately the
items of other comprehensive income that would be reclassified to profit or loss in the future if certain
conditions are met from those that would never be reclassified to profit or loss. The amendments do not
address which items are presented in other comprehensive income or which items need to be
reclassified. The requirements of other approved accounting standards continue to apply in this regard.
The amendments are not expected to impact the current transactions of the Group.

-
-
5. BASIS OF MEASUREMENT
5.1
5.2 Use of critical accounting estimates and judgments
i) Classification of investments (note 6.2)
ii)
iii) Useful life of operating fixed assets and intangibles (note 6.6)
iv) Income taxes (note 6.8)
v) Staff retirements and other benefits (note 6.9); and
vi) Impairment (note 6.7)
6. SUMMARY OF SIGNIFICANT ACCOUNTING POLICIES AND ESTIMATES
6.1 Cash and cash equivalents
These consolidated financial statements have been prepared under the historical cost convention as
modified for certain investments which are carried at fair value, and defined benefit pension and gratuity
plan, defined benefit unfunded gratuity scheme, unfunded compensated absences and benevolent fund
which are carried at present value of defined benefit obligations net of fair value of plan assets and
unrecognised actuarial losses.
Cash and cash equivalents comprise of cash and balances with treasury banks, balances with other banks
and call money lendings.
Provision against investments (note 6.2) and advances, classification and provision of net
investment in finance lease (note 6.4).
Offsetting Financial Assets and Financial Liabilities (Amendments to IAS 32) – (effective for annual
periods beginning on or after 1 January 2014). The amendments address inconsistencies in current
practice when applying the offsetting criteria in IAS 32 Financial Instruments: Presentation. The
amendments clarify the meaning of „currently has a legally enforceable right of set-off‟; and that some
gross settlement systems may be considered equivalent to net settlement. The amendments are not
expected to impact the current transactions of the Group.
The preparation of consolidated financial statements in conformity with approved accounting standards
as applicable in Pakistan requires the use of certain critical accounting estimates. It also requires
management to exercise its judgment in the process of applying the Group's accounting policies. The
Group uses estimates and assumptions concerning the future. The resulting accounting estimates will,
by definition, seldom equal the related actual results. Estimates and judgments are continually evaluated
and are based on historical experience and other factors, including expectations of future events that are
believed to be reasonable under the circumstances. The areas where assumptions and estimates are
significant to the Group's financial statements or where judgment was exercised in application of
accounting policies are as follows:
IFRIC 20 - Stripping cost in the production phase of a surface mining (effective for annual periods
beginning on or after 1 January 2013). The interpretation requires production stripping cost in a surface
mine to be capitalized if certain criteria are met. The amendments have no impact on the consolidated
financial statements of the Group.

6.2 Investments
Held for trading
Held to maturity
Available for sale
These represent investments which do not fall under held for trading or held to maturity securities.
Gain/ (loss) on sale of investments is recognized in the year of sale.
6.3 Agreements for sale and purchase of securities (repo and reverse repo)
These represent investments acquired by the Group with the intention and ability to hold them upto
maturity. These are carried at amortized cost less impairment if any. Impairment in debt securities is
determined in accordance with the requirements of Prudential Regulations issued by SBP.
Unquoted equity securities are valued at lower of cost and break-up value. If the Break-up value is less
than cost, the difference is recognised in consolidated profit and loss account.
Securities for which ready quotations are available on Reuters page (PKRV) or Stock Exchange are
valued at quoted price and resulting surplus/ (deficit) is kept in a separate account and is shown below
the shareholders' equity in the consolidated statement of financial position.
All purchases and sales of investment that require delivery within the timeframe established by regulation
or market convention are recognized at the date which the Group commits to purchase or sell the
investment.
Securities sold under repurchase agreement (repo) are retained in the consolidated financial statements as
investments and a liability for consideration received is included in borrowings. The difference between
sale and repurchase price is treated as mark-up expense and recognized over the period of contract.
Securities purchased under agreement to resell (reverse repo) are included in lendings to financial
institutions. The difference between purchase and resale price is treated as mark-up income and
recognized over the period of the contract.
Investments are classified into following categories:
These represent investments acquired by the Group with the intention to trade by taking advantage of
short-term market/ interest rate movements. These are marked to market and surplus/ (deficit) arising
on revaluation is taken to consolidated profit and loss account.
Provision for diminution in values of securities (other than term finance certificates) is made after
considering impairment if any in their values, where the decline in prices of available for sale equity
securities is significant or prolonged, it is considered impaired and included in consolidated profit and
loss account. Provision for diminution in the value of term finance certificates is made as per Prudential
Regulations issued by State Bank of Pakistan.

6.4 Advances and investment in finance lease
Advances
Net investment in finance lease
Provision for potential lease losses and provision against non performing loans
6.5 Long term loans and redeemable capital
6.6 Capital work-in progress, operating fixed assets, intangibles, depreciation and amortization
Capital work-in-progress
Capital work-in-progress is stated at cost less impairment (if any).
Operating fixed assets-owned
Assets subject to finance lease
Leases where the Group transfers substantially all the risks and rewards incidental to the ownership of an
asset to the lessees are classified as finance leases. Net investment in finance lease is recognised at an
amount equal to the aggregate of minimum lease payment including guaranteed residual value and
excluding unearned finance income, if any.
Provisions for potential lease losses and non performing loans are determined on the basis of regulatory
requirement and are charged to consolidated profit and loss account.
Long term finances and loans are initially recognized at cost being the fair value of consideration
received together with the associated transaction cost. Subsequently, these are carried at amortized cost
using effective interest rate method. Transaction cost relating to the long term finance is being amortized
over the period of agreement using the effective interest rate method.
Advances are stated net of provision for non-performing advances. Provision for non-performing
advances is determined and charged to profit and loss account in accordance with the regulatory
requirements.
Advances are written off when there is no realistic prospect of recovery.
Assets subject to finance lease are stated at cost less accumulated depreciation at the rates similar to the
Group's owned assets and impairment loss (if any). The outstanding obligation under finance lease less
financial charges allocated to future periods is shown as liability. Finance charges are calculated at interest
rates implicit in the lease and are charged to consolidated profit and loss account in the period in which
these are incurred.
Operating fixed assets are stated at cost/ value on their acquisition less accumulated depreciation and
impairment losses (if any) except for land which is stated at cost less impairment, if any. Depreciation is
charged on straight line method at the rates given in note 13.1, commencing from the month in which
the asset is acquired. No depreciation is charged in the month of disposal of the asset. Gains or losses on
disposal of property and equipment are taken to the consolidated profit and loss account.
Maintenance and normal repairs are charged to consolidated profit and loss account as and when
incurred. Major renewals and improvements are capitalized.

Intangible assets
6.7 Impairment
6.8 Taxation
All intangible assets that meet the recognition criteria are initially measured at cost and are amortized on
a straight line basis at the rate given in note 13.2 commencing from the month when these assets are
available for use. Intangible assets are stated at cost less accumulated amortization and impairment
losses, if any. The residual value, useful life and amortization method is reviewed and adjusted, if
appropriate, at each balance sheet date.
The Group also recognizes deferred tax asset/ liability on deficit/ surplus on revaluation of investments
which is adjusted against the related deficit/ surplus in accordance with the requirements of
International Accounting Standard on 'Income Taxes' (IAS 12). However, keeping in view the future
operation and uncertain status of privatization of the Group; deferred tax assets has only been
recognized to the extent of deferred tax liability as at balance sheet date.
In making estimates of the depreciation / amortization, the management uses useful life and residual
value which reflects the pattern in which economic benefits are expected to be consumed by the Group.
The useful life and the residual value are reviewed at each financial year end and any change in these
estimates in future years might effect the carrying amounts of the respective item of operating fixed
assets with the corresponding effect on depreciation / amortization charge.
The carrying amount of assets are reviewed at each balance sheet date for impairment, whenever events
or changes in circumstances indicate that the carrying amounts of the assets may not be recoverable. If
such indication exists, and where the carrying value exceeds the estimated recoverable amount, assets
are written down to their recoverable amount. The resulting impairment loss is taken to the consolidated
profit and loss account. An impairment loss is reversed only to the extent that the assets carrying amount
does not exceed the carrying value that would have been determined net of depreciation/amortization, if
no impairment loss had been recognized.
The available for sale equity investments are impaired when there has been a significant or prolonged
decline in the value below its cost. Impairment loss is recognized in consolidated profit and loss account.
Deferred tax is accounted for using the balance sheet liability method in respect of all major temporary
differences between the carrying amount of assets and liabilities in the financial statements and the
corresponding tax bases used in the computation of taxable profit at the rates that are expected to apply
to the period when the differences reverse based on the tax rates that have been enacted. Deferred tax
assets are recognized to the extent that it is probable that taxable profits will be available against which
the deductible temporary differences, unused tax losses and tax credits can be utilized. Deferred tax asset
is reduced to the extent it is no longer probable that the related tax benefits will be realized.
Provision for current taxation represents expected tax payable on the taxable income for the year using
applicable tax rates after taking into account tax credits and tax rebates, if any.
An intangible asset is recognized only if it is identifiable, the Group has control over the asset, it is
probable that economic benefits will flow to the enterprise and the cost of the asset can be measured
reliably.

6.9 Staff retirement and other benefits
The Group operates following staff retirement and other benefit schemes for its employees:
Defined benefit plan- Pension and gratuity scheme
Defined benefit unfunded gratuity scheme
Benevolent fund
Compensated absences
Defined contribution plan - Provident fund
The Bank operates a contributory benevolent fund for all its eligible employees (defined benefit scheme).
Contributions to this fund were made equally by the Bank and employees till March 2002. Thereafter it
is wholly contributed by the Bank at the rate of 2% of basic salary with a ceiling of Rs. 200 per month
per employee. Annual contribution towards the defined benefit scheme are made on the basis of
actuarial advice using the Projected Unit Credit Method.
Fully funded defined benefit pension and gratuity scheme for permanent employees. Contributions are
made in accordance with the actuarial valuation which is carried out periodically using 'Projected Unit
Credit Method'. The actuarial gain/ (loss) in excess of corridor (10% of higher of fair value of plan
assets or present value of obligation) is recognized over the expected average remaining working lives of
employees participating in the plan.
The Group operates a defined benefit unfunded gratuity scheme for its contractual employees. The
obligation under the defined benefit unfunded gratuity scheme is recognized on the basis of actuarial
valuation using the 'Projected Unit Credit Method'. The amount recognized in consolidated statement of
financial position represents present value of defined benefit obligation.
Defined benefit plans are provided to employees of the Group. Calculations in this respect require
assumptions to be made of future outcomes, the principal ones being in respect of increase in
remuneration, the expected long-term return on plan assets and the discount rate used to convert future
cash flows to current values. Calculations are sensitive to changes in the underlying assumptions.
The Group provides compensated absences, an unfunded scheme, as per entitlement to all its permanent
and contractual employees. Related provision is made in accordance with actuarial valuation. Provision
for the year is charged to consolidated profit and loss account. The amount recognized in consolidated
statement of financial position represents the present value of defined benefit obligation.
A recognised contributory provident fund is provided by SMEL for all permanent employees. Equal
monthly contribution are made by SMEL and its employees to the fund at the rate of 8 percent of basic
salary.
The Group takes into account the current income tax law and decisions taken by the taxation authorities.
Instances where the Group's views differ from the views taken by the income tax department at the
assessment stage and where the Group considers that its view on items of material nature is in
accordance with law, the amounts are shown as contingent liabilities.

6.10 Revenue recognition
6.10.1 Advances
6.10.2 Return on investments
6.10.3 Dividend income
6.10.4 Interest, fee, brokerage and commission
6.11 Off setting
6.12 Related party transactions
6.13 Borrowing costs
6.14 Provisions
Provisions are recorded when the Group has a present legal or constructive obligation as a result of past
events, it is probable that an outflow of resources embodying economic benefits will be required to settle
the obligation and a reliable estimate can be made of the amount of obligation.
Interest, fee, brokerage and commission, profit on other investments, bank deposits and staff loans is
recognized on accrual basis. Income on non-funded facilities (fee, commission, documentation charges
etc.) is recognized on receipt basis except commission on bank guarantees which is recognized on
accrual basis.
Markup/ interest on performing advances is recognized on a time proportion basis over the term of loan
and advances. Mark up on non performing loans are suspended.
Markup/ interest/ penal markup recoverable on non performing advances is recognized on receipt basis.
Financial assets and liabilities are off set and the net amount is reported in the consolidated statement of
financial position when there is a legally enforceable right to set off the recognized amounts and there is
an intention either to settle on a net basis or realize the asset and settle the liability simultaneously.
Borrowing costs that are directly attributable to the acquisition, construction or production of a
qualifying asset as part of the cost of that asset are capitalized. Other borrowing costs are recognized as
an expense in the period in which it incurs.
Return on investments is recognized on a time proportion basis except on classified investment which is
recognized on receipt basis. Any premium paid or discount received on purchase of securities is
amortized through consolidated profit and loss account over the remaining period of maturity on time
apportionment basis.
Dividend income is recognized when the Group's right to receive the dividend is established.
Transactions between the Group and its related parties are carried out on arm's length basis determined
in accordance with the generally accepted methods.
The Group follows the finance lease method in accounting for the recognition of lease income. Under
this method, the unearned lease income i.e. the excess of gross lease rentals and the estimated residual
value over the cost of the leased assets is deferred and taken to income over the term of the lease
contract, so as to produce a systematic return on the net investment in finance lease. Unrealised lease
income is held in suspense account, where necessary, in accordance with the regulatory requirements.
Front-end fees and documentation charges are taken to income when realised.

6.15 Segment reporting
6.15.1 Business segments
Trading and sales
Commercial banking
Other leasing operations
It includes extension of lease and working capital financing facilities to small and medium enterprises.
6.15.2 Geographical segments
6.16 Dividend and appropriation to reserves
7. FINANCIAL RESTRUCTURING AND GOING CONCERN ASSUMPTION
7.1
i)
ii)
iii)
The Government of Pakistan (GoP) assisted by Asian Development Bank (ADB) is working on SME
Sector Development Programme (SME SDP). Loan agreement for this programme between GoP and
ADB and project agreement between ADB, SBP, Small and Medium Enterprise Development Authority
(SMEDA) and the Bank have been signed on February 10, 2004. This programme, apart from other
aspects on policy matrix relating to SME sector of Pakistan, also envisages restructuring of SME Bank
Limited. Salient features of the restructuring of the Group are given below:
the Group operates only in Pakistan.
Adjustment of accumulated balances due from SBP on account of its share in profits and
losses of the Group against credit lines provided by SBP;
Payment of Rs 3 billion to SBP before January 1, 2004 against outstanding credit lines and
conversion of balance of remaining credit lines into a loan repayable in full by June 30, 2006;
Raising the paid-up capital to Rs 1,100 million by issuing additional shares to GoP;
Dividend and appropriation to reserves (except appropriation required by law) after the balance sheet
date are recognized as liability in the Group's financial statement in the year in which these are approved.
A segment is the distinguishable component of the Group that is subject to risks and rewards that are
different from those of other segments. A business segment is one that is engaged either in providing
certain products or services, whereas a geographical segment is one engaged in providing products and
services within a particular economic environment. Segment information is presented as per the Group's
functional structure and the guidance of the State Bank of Pakistan. The Group's primary format of
reporting is based on business segments:
This segment undertakes the Group's treasury, money market and capital market activities.
It includes loans, deposits and other transactions with individuals, small and medium enterprises and
corporate customers.

iv)
v)
vi)
vii) Reimbursement by GoP of costs related to VSS launched for all regular employees;
viii)
ix) Privatization of the Bank by June 2006.
7.2 Current status of the above referred financial restructuring is given below:
i)
ii)
iii)
iv)
v)
vi)
Paid-up capital has been increased to Rs. 2,393 million by issue of 73,502,453 additional
shares of Rs 10 each to GoP without right issue in 2004, issue of 40,000,000 additional shares
of Rs 10 each to GoP without right issue in 2005, issue of 50,000,000 additional bonus shares
of Rs 10 each to GoP without right issue in 2006 and issue of 39,250,700 additional shares of
Rs. 10 each to GoP without right issue in 2007. Proceeds against issue of additional shares in
2004 were paid by GoP to SBP against the Bank's loan balance due to SBP;
Provision of Rs 1,283.196 million against non performing financial assistance extended by the
defunct RDFC and SBFC was adjusted against credit lines of SBP in 2003;
SBP to issue a banking license to the Bank on compliance with all conditions of restructuring
and applicable SBP regulations. The commercial banking operations will be separate from the
recovery operations of the defunct RDFC and SBFC portfolio and the two operations will be
run as independent units within the Bank; and
Accumulated balances of Rs 3,275.752 million due from SBP on account of its share in
profits and losses of the Bank have been adjusted against credit lines provided by SBP;
Rs. 7,393 million has been paid to SBP since 2003, to fully adjust the loan liability.
VSS was approved by the Board of Directors of the Bank on November 7, 2003. 707
employees were relieved under the scheme upto December 31, 2005 and the aggregate
reported cost for 707 employees was Rs. 1,764.268 million, which has been received by the
Bank by March 31, 2007;
Human resource technical audit has been completed and report has been submitted to the
Bank;
Reduction in the number of recovery branches, staff rationalization through Voluntary
Separation Scheme (VSS), human resource audit and hiring of new professional staff on merit;
The Ministry of Finance (MoF) shall ensure that SBP's shareholding in the Group is
terminated through the purchase of SBP held shares at nominal value by shareholders or
otherwise;
100% provision to be made against non performing financial assistance extended by the
defunct RDFC and SBFC prior to January 1, 2002 which provision to be adjusted against SBP
credit lines. SBP will recover this amount from proceeds of ADB loan to GoP;

vii)
viii)
ix)
7.3 Further restructuring of the Bank:
i)
ii)
iii)
7.4 Going concern assumption and minimum capital requirement
In compliance to the decisions taken during meeting at Ministry of Finance dated September 14, 2009
following actions have been undertaken.
Banking license was issued by SBP on September 13, 2004 and the Bank has started banking
operations after the issue of certificate for commencement of banking business by SBP on
April 16, 2005;
Privatization Commission (PC) has constituted a transaction committee which is represented
by members from the Privatization Commission, State Bank of Pakistan, Ministry of Finance
and the Bank. Privatization Commission has approved M/s BMA Capital as Financial
Advisors for the Bank and due diligence exercise for the privatization of the Bank has been
carried out in the year 2008;
No further progress has been made on the privatization of the Bank.
VSS offered to the regular employees of the Bank in November 2009, wherein 138 employees
opted for VSS offered vide Circular No. HO/HR&SD/2009/5385 dated October 15, 2009.
These employees have been relieved at a total cost of Rs. 653 million with effect from
November 14, 2009;
The Old portfolio of defunct RDFC & defunct SBFC has been transferred to National Bank
of Pakistan with effect from 1st July 2010. Consequently all the recovery offices and recovery
booths have been closed. However, staff of the recovery offices have been advised to
continue to maintain and keep the safe custody of records and assets including loan files,
security documents, books of accounts, vehicles, furniture/fixture and other assets till
handing over of all the relevant records to the concerned institution; and
Government of Pakistan have allocated an amount of Rs. 2 billion in the annual budget 2011-
12 for equity injection into the Bank.
During the year, the Group has incurred a net loss after tax of Rs. 225 million resulting in accumulated
losses of Rs. 651 million (December 31, 2010: Rs. 442 million) as of balance sheet date. The
Government of Pakistan (GoP), hold 94% shares of the Bank through Ministry of Finance (MoF) and
has made a budget allocation of Rs. 2 billion to provide further equity contribution to the Bank. The
management therefore believes that GoP will provide further equity contribution to the Bank and
therefore the going concern assumption is an appropriate basis to prepare these consolidated financial
statements. Further the Bank, on a standalone basis, had a shortfall of Rs. 182 million as on December
31, 2011 in meeting the minimum capital requirement of Rs. 2 billion (net of losses) as prescribed by the
State Bank of Pakistan and SME Leasing Limited had a shortfall of Rs. 112.711 million. The
management is confident that the realization of budgeted amount will enable the Group to meet
minimum capital requirement. However the management will soon apply to regulatory authorities for
extension to meet minimum capital requirement.

Notes to the Consolidated Financial Statements
For the year ended December 31, 2011
Note 2011 2010
8. (Rupees in '000)
In hand - local currency 52,162 70,247
In transit - local currency - 12
National Prize Bonds 129 138
With State Bank of Pakistan (SBP) in :
Local currency current accounts 8.1 123,090 115,246
With National Bank of Pakistan in :
Local currency current accounts 39,274 42,419
214,655 228,062
8.1
Note 2011 2010
9. BALANCES WITH OTHER BANKS (Rupees in '000)
In Pakistan:
On current accounts 1,526 11,448
On deposit accounts 9.1 18,339 19,464
Provision for doubtful balance with a bank 9.2 (10,000) (10,000)
9,865 20,912
9.1
9.2
Note 2011 2010
10. LENDINGS TO FINANCIAL INSTITUTIONS (Rupees in '000)
Call money lendings 10.1 250,000 -
Letter of placement 10.1 550,000
800,000 -
10.1 PARTICULARS OF LENDING
In local currency 800,000 -
In foreign currencies - -
800,000 -
10.1.1
SME Bank Limited
CASH AND BALANCES WITH TREASURY BANKS
Deposits with the State Bank of Pakistan are maintained to comply with the statutory requirements issued from time
to time.
These carry interest rate ranging from 1.50% to 5.0% (2010: 1.50 % to 6.50%) per annum.
Provision for doubtful balance is in respect of deposit of Rs. 10 million with Indus Bank Limited which is under
liquidation.
These lendings carry markup rate ranging between 12.4% to 12.6% per annum and have maturity period upto 3
months.

SME Bank Limited
Notes to the Consolidated Financial Statements
For the year ended December 31, 2011
11 INVESTMENTS
Note
11.1 INVESTMENTS BY TYPES:
Available-for-sale securities
Market Treasury Bills (MTBs) 619,118 900,070 1,519,188 295,681 - 295,681
Pakistan Investment Bonds (PIBs) 304,525 1,227,465 1,531,990 751,223 1,470,578 2,221,801
Special Savings Certificates (SSCs) 2,500 - 2,500 2,500 - 2,500
Fully paid ordinary shares/mutual fund 47,607 - 47,607 124,522 - 124,522
Term Finance Certificates (TFCs) 16,232 - 16,232 25,387 - 25,387
989,982 2,127,535 3,117,517 1,199,313 1,470,578 2,669,891
Held-to-maturity securities
Term Deposit Receipts (TDRs) - - - 200,000 - 200,000
Certificates of Investments (COIs) 762 - 762 762 - 762
762 - 762 200,762 - 200,762
Less: Provision for diminution
in value of investments (42,721) - (42,721) (42,721) - (42,721)
Investments net of impairment 948,023 2,127,535 3,075,558 1,357,354 1,470,578 2,827,932
Net deficit on revaluation of
available-for-sale-securities (71) (47,820) (47,891) (37,973) (109,625) (147,598)
Total investments 947,952 2,079,715 3,027,667 1,319,381 1,360,953 2,680,334
Held by the
bank
Given as
collateral Total
(Rupees in '000)
Held by the
bank
Given as
collateral Total
(Rupees in '000)
20102011

SME Bank Limited
Notes to the Consolidated Financial Statements
For the year ended December 31, 2011
Note 2011 2010
11.2 INVESTMENTS BY SEGMENTS :
Federal Government Securities:
- Market Treasury Bills (MTBs) 11.3 1,519,188 295,681
- Pakistan Investment Bonds (PIBs) 11.3 1,531,990 2,221,801
- Special Savings Certificates (SSCs) 11.3 2,500 2,500
3,053,678 2,519,982
Fully paid up ordinary shares:
- Listed companies/mutual fund 11.6 26,604 103,519
- Unlisted companies 11.7 21,003 21,003
47,607 124,522
Term Finance Certificates
- Listed TFCs 11.8 16,232 25,387
Other investments:
- Certificates of Investment (COIs) 762 762
- Term Deposit Receipts (TDRs) - 200,000
762 200,762
Total investments at cost 3,118,279 2,870,653
Provision for diminution in value of investments 11.4 (42,721) (42,721)
Investment (net of provision) 3,075,558 2,827,932
Less: Deficit on revaluation of available for sale securities - net 23 (47,891) (147,598)
Total investments 3,027,667 2,680,334
(Rupees in '000)

SME Bank Limited
Notes to the Consolidated Financial Statements
For the year ended December 31, 2011
11.3 Principal terms of investments in Federal Government securities
Name of investment
Market Treasury Bills On maturity
Pakistan Investment Bonds On maturity
Special Savings Certificates On maturity
Note 2011 2010
11.4 Particulars of provision for diminution in value of investments
Opening balance 42,721 58,544
Charge for the year - 306
Reversal on disposal - (16,129)
Closing balance 42,721 42,721
11.4.1 Particulars of provision in respect of type and segment
Available-for-sale securities
-Fully paid up ordinary shares
- Quoted Companies 11.6.1 20,956 20,956
- Unlisted Shares 11.7.1 20,000 20,000
- Delisted Companies 11.7.2 1,003 1,003
Held-to-maturity securities
- Certificates of Investment 762 762
42,721 42,721
Note
Market value Rating Market value Rating
11.5 Quality of Available-for-sale securities (Rupees '000) (Rupees '000)
Market Treasury Bill 11.5.1 1,521,322 unrated 295,598 unrated
Pakistan Investment Bonds 11.5.1 1,476,631 unrated 2,064,934 unrated
Special Saving Certificate 11.5.1 2,500 unrated 2,500 unrated
Fully paid up ordinary shares/ mutual funds 11.5.2
National Refinery Limited 3,640 AAA/A1+ 4,107 AAA/A1+
PICIC Investment Fund Limited 750 3-Star 883 3-Star
Hub Power Company Limited 3,659 AA+/A1+ 4,003 AA+/A1+
Lotte Pakistan PTA Limited 740 unrated 1,093 unrated
Dewan Salman Fibre Limited 22 unrated 55 unrated
Pakistan Telecommunication Company Limited 89 unrated 167 unrated
D.G. Khan Cement Company Limited 108 unrated 171 unrated
Faisal Spinning Mills Limited 176 unrated 130 unrated
Treet Corporation Pakistan Limited 195 AA-/A-1 300 AA-
NAFA Cash Fund - - 54,209 A+(f)
NAFA Stock Fund - - 1,463 unrated
UBL PPF-1 - - 4,494 AA+(cpf)
Pakistan Stock Fund - - 2,069 4-star/4-star
AMZ Stock Plus Fund - - 1,631 2-star/2-star
United Stock Fund - - 1,920 unrated
Crosby Dragon Fund - - 1,607 AM4+
Meezan CPF-1 - - 6,003 AM2
Alfalah GHP PPF - - 2,611 AA
NAMCO Income Fund - - 3,330 A(f)
NAMCO Balanced Fund (Closed End) 1,364 3-Star 1,032 AM3-
Nishat Mills Limited 6 AA-/A1+ 7 A+/A1
Crescent Textile Mills Limited 1 unrated 1 unrated
Services Industries Limited 14 unrated 17 unrated
Invest Capital Investment Bank Limited 224 D 872 D
10,988 92,175
Term Finance Certificates
Financial Receivables Securitisation Company Limited 6,215 A+ 8,598 A+
Pakistan Mobile Communications Limited 10,011 A+ 16,529 A+
16,226 25,127
3,027,667 2,480,334
Maturity
January 2012 to December 2012
February 2012 to June 2013
11.73% to 13.86%
9% to 11%
Rate per annum
Market Treasury Bills and Pakistan Investment Bonds are securities eligible for re-discounting with the State Bank of Pakistan.
(Rupees in '000)
Coupon/Mark up
payment
Principal
payment
2011 2010
11.6% to 14.2%
at maturity
semi-annually
June 2014 to December 2015 at maturity

SME Bank Limited
Notes to the Consolidated Financial Statements
For the year ended December 31, 2011
11.5.1 These are Government of Pakistan guaranteed securities.
11.5.2 Rating of these equity securities represent 'Entity/Funds Rating'.
11.5.3
11.6 Investments in listed companies/mutual fund
2011 2010
2011 2010 Name of company/mutual fund Note
15,000 15,000 354.17 National Refinery Limited 5,312 5,312
137,668 137,668 18.12 PICIC Investment Fund Limited 2,494 2,494
107,000 107,000 18.95 Hub Power Company Limited 2,028 2,028
79,775 79,775 10.15 Pakistan PTA Limited 810 810
18,449 18,449 18.24 Dewan Salman Fibre Limited 337 337
8,600 8,600 68.20 Pakistan Telecommunication Company Limited 586 586
5,672 5,672 49.38 D.G. Khan Cement Company Limited 280 280
4,000 4,000 40.41 Faisal Spinning Mills Limited 162 162
5,000 5,000 29.50 Treet Corporation Pakistan Limited 147 147
319 319 93.52 Nishat Mills Limited 30 30
18 18 34.84 Crescent Textile Mills Limited 1 1
72 72 25.30 Services Industries Limited 2 2
1,117,876 1,117,876 11.84 Invest Capital Investment Bank Limited 13,236 13,236
Mutual Fund
- 5,321,308 - NAFA Cash fund - 55,768
- 192,475 - NAFA Stock Fund - 1,208
- 44,849 - UBL PPF-1 - 4,145
- 35,068 - Pakistan Stock Fund - 1,804
- 24,718 - AMZ Stock Plus Fund - 1,467
- 46,108 - United Stock Fund - 1,581
- 16,725 - Crosby Dragon Fund - 1,440
- 109,415 - Meezan CPF-1 - 5,000
- 46,939 - Alfalah GHP PPF - 2,000
- 31,729 - NAMCO Income Fund - 2,500
270,000 250,000 4.37 NAMCO Balanced Fund (Closed End) 1,180 1,181
26,604 103,519
Impairment in available for sale listed shares 11.6.1 (20,956) (20,956)
Investment in listed shares (net of impairment) 5,648 82,563
Surplus on revaluation of listed shares/ mutual fund - (net) 5,339 9,612
Market value as on December 31 10,987 92,175
11.6.1 Impairment in available for sale listed shares
National Refinery Limited 3,885 3,885
PICIC Investment Fund Limited 2,215 2,215
Lotte Pak PTA Limited 683 683
Dewan Salman Fibre Limited 310 310
Pakistan Telecommunication Company Limited 441 441
D.G. Khan Cement Company Limited 159 159
Nishat Mills Limited 27 27
Invest Capital Investment Bank Limited 13,236 13,236
20,956 20,956
11.7 Particulars of investments held in unlisted fund and delisted companies
AKD Venture Fund 11.7.1 20,000 20,000
Companies delisted from stock exchange 11.7.2 1,003 1,003
21,003 21,003
Securities have either been rated by 'The Pakistan Credit Rating Agency Limited' (PACRA) or 'JCR-VIS Credit Rating Company
Limited' (JCR-VIS). These ratings reflect independent credit risk assessment by respective credit rating entities.
No. of ordinary
shares/units
(Rupees in '000)
Paid-up
value per
share/
average
price per
unit (Rs)

SME Bank Limited
Notes to the Consolidated Financial Statements
For the year ended December 31, 2011
(Rupees) (Rupees in '000)
11.7.1 8% 2,000,000 10.00 20,000 - Kashif Shamim
11.7.1.1
11.7.2 Particulars of investments in shares of companies delisted from stock exchange and are currently under liquidation.
(Rupees)
Mohib Exports Company Limited 4,600 23.81 109
Sunflow Citrus Limited 100,000 4.22 422
Tawakal Garments Company Limited 4,000 38.38 154
Tristar Shipping Lines Limited 5,000 23.56 118
Zahoor Textile Mills Limited 15,200 13.16 200
1,003
11.8 Investment in Term Finance Certificates
Investment in Listed Term Finance Certificates
2011 2010
2011 2010 Company's name (Rupees)
4,000 4,000 Pakistan Mobile Communications Limited 2,496 9,984 16,640
3,000 3,000 Financial Receivables Securitisation Company Limited 2,083 6,248 8,747
16,232 25,387
Net deficit on revaluation of TFCs (6) (260)
Market value as on December 31 16,226 25,127
Name of
Chief
executive
Total paid
up value
Cost/Paid-
up value
per unit
held
% ageBreak up
value
Management has fully provided this investment as irrecoverable and impaired.
Nominal
value per
certificate
Number of
units held
AKD Venture Fund
(Rupees in
'000)
Cost/Paid-
up value
per share
These carry rate of return ranging from 14.76% to 15.76% (2010: 13.74% to 14.16%) per annum and having maturity periods of upto 7
years (2010: 7 years).
Total paid
up value
(Rupees in '000)
Number of
shares held
No. of certificates

SME Bank Limited
Notes to the Consolidated Financial Statements
For the year ended December 31, 2011
Note 2011 2010
12. ADVANCES
Loans, cash credits, running finances, etc- In Pakistan
Extended by:
Defunct SBFC 12.2 4,392,342 4,406,468
Defunct RDFC 12.2 509,185 540,039
The Group 2,749,336 2,649,077
Due from ex-employees 12.2 20,993 21,153
Due from employees 173,942 187,646
7,845,798 7,804,383
Net investment in finance lease - In Pakistan 12.3 809,973 940,213
Advances - gross 8,655,771 8,744,596
Provision for non-performing advances - specific 12.5 (5,306,693) (5,436,997)
Advances - net of provision 3,349,078 3,307,599
12.1 Particulars of Advances (Gross)
12.1.1 In local currency 8,655,771 8,744,596
In foreign currencies - -
8,655,771 8,744,596
12.1.2 Short term (upto one year) 2,258,859 2,130,554
Long term (over one year) 6,396,912 6,614,042
8,655,771 8,744,596
12.2
a) the non-performing loans, collateral and the debtors;
The agreed transfer price is an amount equal to 50% of the net recoveries or 25% of the gross recoveries which ever is
higher in first two anniversaries and 50% of the net recovery from 2nd anniversary.
(Rupees in '000)
The Board through its resolution by circular No.10/circ/33 dated March 08, 2010 duly endorsed by the members in
their meeting dated May 20, 2010 has approved the transfer and assignment of non- performing loan portfolios of
defunct RDFC, SBFC and due from ex-employees to NBP on the basis of deferred transfer price. Subsequently transfer
and assignment agreement was executed between the Bank and National Bank of Pakistan at Karachi on July 01, 2010
(Effective date). According to the agreement, the transferor (Bank) and the acquirer (NBP) acknowledge, declare and
confirm the transfer, assignment and vesting of all rights, interests, privileges, title, powers and remedies in favour of the
acquiree with respect to:
Since certain clauses of portfolio transfer agreement have not been implemented including issuance of notices to the
borrowers of defunct RDFC, SBFC and due from ex-employees etc, the outstanding portfolio relating to defunct
RDFC, SBFC and due from ex-employees stands recognized in the financial statements of the Bank.
Although the Board through its resolution by circular No.10/circ/33 dated March 08, 2010 duly endorsed by the
members in their meeting dated May 20, 2010 had approved the transfer and assignment of non performing portfolio of
defunct SBFC, RDFC and due from ex-employees to NBP on the basis of deferred transfer price however on
assumption of charge, the new management of the Bank has re-visited and re-analyzed the whole transaction and
observed that clauses of agreement signed with NBP are detrimental to the Bank‟s interests and causing financial loss to
the Bank. The management therefore recommended the cancellation of transfer and assignment agreement to the Board
of Directors in its 64th meeting dated May 16, 2011. The Board has in principle agreed with the management
recommendation and advised the management to convey its views along with legal opinion, NBP recovery performance
and Board‟s pronouncement for revocation of agreement to Ministry of Finance to arrange retrieval/restoration of old
portfolio to the Bank in the interest of recovery of public funds.
The management is accordingly taking suitable steps for cancellation of transfer and assignment agreement with NBP.
However since the portfolio transfer agreement dated 1st July 2010 with NBP has not formally been cancelled, the
amount recovered by the Bank from the borrowers of defunct RDFC, SBFC and due from ex-employees has been
recognized as liability to NBP on a prudent basis (refer note 20).
Assignment of Non-Performing Loan (NPL) portfolios of defunct SBFC, RDFC & due from ex-employees to
National Bank of Pakistan (NBP)
b) all agreements, deeds, instruments and other documents relating to the non-performing loans, debtors and collateral
and to which the transferor is, or legally deemed to be, a party or a beneficiary;
c) all legal proceedings by and against the transferor with respect to the non-performing loans, the debtors and collateral,
which may be pending before any court, tribunal, arbitrator or authority, without being subject to any liabilities of the
transferor to any person.

SME Bank Limited
Notes to the Consolidated Financial Statements
For the year ended December 31, 2011
12.3 NET INVESTMENT
IN FINANCE LEASE
(Rupees in '000)
Lease rentals receivable 458,197 98,667 - 556,863 516,063 108,643 - 624,706
Residual value 285,541 72,497 - 358,038 153,100 280,353 - 433,453
Minimum lease payments 743,738 171,163 - 914,901 669,163 388,996 - 1,058,159
Financial charges for future
periods 92,054 12,874 - 104,928 100,330 17,616 - 117,946
Present value of minimum lease payments 651,684 158,289 - 809,973 769,493 406,612 - 940,213
12.4
Provision Provision
Category of Classification Domestic Overseas Total Required Held
(Rupees in '000)
Substandard 112,681 - 112,681 162 162
Doubtful 123,721 - 123,721 1,999 1,999
Loss 5,701,420 - 5,701,420 5,304,532 5,304,532 5,937,822 - 5,937,822 5,306,693 5,306,693
Provision Provision
Category of Classification Domestic Overseas Total Required Held
(Rupees in '000)
Substandard 171,398 - 171,398 4,930 4,930
Doubtful 144,507 - 144,507 32,619 32,619
Loss 5,679,236 - 5,679,236 5,399,448 5,399,448 5,995,141 - 5,995,141 5,436,997 5,436,997
12.5 Particulars of provision against non-performing advances
Specific General Total Specific General Total
(Rupees in '000)
Opening balance 5,436,997 - 5,436,997 5,285,573 - 5,285,573
Amounts written off (54,517) - (54,517) (13,399) - (13,399)
Provision of transferred portfolio (458) - (458) (712) - (712)
Charge/(Reversals)
Charge for the year 60,204 - 60,204 209,032 - 209,032
Reversals (135,533) - (135,533) (43,497) - (43,497)
(75,329) - (75,329) 165,535 - 165,535
Closing balance 5,306,693 - 5,306,693 5,436,997 - 5,436,997
12.5.1
12.5.2 Specific General Total Specific General Total
(Rupees in '000)`
In local currency 5,306,693 - 5,306,693 5,436,997 - 5,436,997
In foreign currencies - - - - - - 5,306,693 - 5,306,693 5,436,997 - 5,436,997
Later than
one and less
than five
years
The State Bank of Pakistan (SBP) amended the Prudential Regulation vide BSD Circular No. 1 of 2011 dated October 21, 2011 in
relation to provision for loans and advances, thereby allowing further benefit of Forced Sale Value (FSV) of pledged stocks,
mortgaged residential, commercial and industrial properties (land and building) and plant and machinery under charge held as
collateral against non-performing advances. The FSV benefit has resulted in reduced charge for specific provision for the year by Rs.
148,561 thousand. The FSV benefit recognised in these consolidated financial statements is not available for payment of cash or stock
dividend. Had the FSV benefit not recognized, before and after tax loss for the year would have been higher by Rs. 148,561 thousand
(December 31, 2010: Rs. 77,540 thousand). FSV benefit availed by the Bank includes Rs. 108,835 thousand on before and after tax
loss for the year by consirding percentage changes only of FSV benefit under circular No. 1 of 2011 dated October 21, 2011.
Not later
than one
year
2010
Total
(Rupees in '000)
Over five
years
2011
2011
Classified Advances
Particulars of provisions against non-
performing advances
2011 2010
2011 2010
Advances include Rs. 5,937,822 thousands (2010: Rs. 5,995,141 thousands) which have been placed under non-performing
status as detailed below:
Not later
than one
year
Later
than one
and less
than five
years
2010
Classified Advances
TotalOver five
years

SME Bank Limited
Notes to the Consolidated Financial Statements
For the year ended December 31, 2011
Note 2011 2010
12.6 PARTICULARS OF WRITE OFF:
12.6.1 Against provisions 12.5 54,517 13,399
Directly charged to Profit & Loss account 653 939
55,170 14,338
12.6.2 Write Offs of Rs. 500,000 and above 12.7 40,026 2,177
Write Offs of below Rs. 500,000 15,144 12,161
55,170 14,338
12.7 DETAILS OF LOAN WRITE OFF OF Rs. 500,000 AND ABOVE
12.8 Note 2011 2010
Balance at the beginning of the year 91,522 51,906
Loans granted during the year 19,218 58,604
Repayments (21,247) (18,988)
Balance at the end of the year 89,493 91,522
13. OPERATING FIXED ASSETS
Property and equipment 13.1 132,490 131,049
Intangible assets 13.2 2,831 1,537
135,321 132,586
(Rupees in '000)
In terms of sub-section 3 of Section 33-A of the Banking Companies Ordinance, 1962 the Statement in respect of written-off
loans or any other financial relief of five hundred thousand rupees or above allowed to a person(s) during the year ended
December 31, 2011 is given at Annexure-1.
Debts due by directors, executives or officers of the Group or any of
them either severally or jointly with any other persons:
PARTICULARS OF LOANS AND ADVANCES TO
DIRECTORS, ASSOCIATED COMPANIES, ETC. (Rupees in '000)

SME Bank Limited
Notes to the Consolidated Financial Statements
For the year ended December 31, 2011
13.1 PROPERTY AND EQUIPMENT
Note
Lease hold land 13.5 64,087 - - 64,087 - - - - 64,087 -
Lease hold improvements 30,286 - 132 30,314 19,201 - 100 (104) 19,197 11,117 33 1/3
(104)
Buildings 26,298 - - 26,298 5,418 - 1,893 7,311 18,987 5
Office furniture and fixtures 14,959 - 93 11,629 14,383 - 362 (461) 11,324 305 20
(463) (2,960) 2,960
Library 19 - - (9) 10 19 - - 9 10 - 20
Office equipment 28,778 - 382 28,697 16,503 - 3,544 (95) 19,595 9,102 15
(106) (357) 357
Computer equipment 75,219 - 15,015 88,725 73,102 - 3,558 (42) 75,151 13,574 33 1/3
(42) (1,467) 1,467
Vehicles 29,110 4,868 73 30,523 27,884 3,584 1,562 (3,320) 29,698 825 20
(3,516) (12) - 12
268,756 4,868 15,695 - 280,283 156,510 3,584 11,019 (4,022) 162,286 117,997
(4,231) (4,805) - 4,805
Assets held under finance lease
Vehicles 29,732 (4,868) 2,841 (88) 25,978 10,929 (3,584) 5,347 (1,119) 11,485 14,493 20
(1,639) 88
2011 298,488 - 18,536 (4,893) 306,261 167,439 - 16,366 (5,141) 173,771 132,490 (5,870) 4,893
13.2 INTANGIBLE ASSETS
COST
Adjustment
Computer software 24,439 2,988 (198) 27,229 22,902 1,694 198 24,398 2,831 33 1/3
2011 24,439 2,988 (198) 27,229 22,902 1,694 198 24,398 2,831 -
COST
Transfer
As at
Dec 31,
2011
AMORTISATION
As at
January 01,
2011
As at
January 01,
2011
Additions
TransferAs at
Dec 31, 2011
Depreciation
rate per
annum %
Net book
value as at
Dec 31, 2011
Amortization
rate per
annum %
As at
January 01,
2011
Additions/
(disposals)
Net book
value as at
Dec 31, 2011
As at
Dec 31, 2011
Adjustments
Adjustment
(Rupees '000)
DEPRECIATION
Amortisation
Charge for the
year
As at
January 01,
2011
(Rupees '000)
As at
Dec 31,
2011
Deletion /
adjustment

SME Bank Limited
Notes to the Financial Statements
For the year ended December 31, 2011
PROPERTY AND EQUIPMENT
Note
Lease hold land 12.6 64,087 - - 64,087 - - - - 64,087 -
Lease hold improvements 18,728 - 11,560 30,286 18,501 - 702 19,201 11,085 33 1/3
(2) (2)
Buildings 26,298 - - 26,298 4,531 - 887 5,419 20,880 5
Office furniture and fixtures 15,072 - 81 14,959 13,644 - 923 14,383 576 20
(194) (184)
Library 19 - - 19 19 - - 19 - 20
Office equipment 24,747 - 5,172 28,778 13,972 - 3,270 16,503 12,275 15
(1,141) (739)
Computer equipment 74,963 - 256 75,219 69,306 - 3,796 73,102 2,117 33 1/3
Vehicles 47,955 3,832 88 29,110 45,462 2,911 2,095 27,884 1,226 20
(22,765) (22,584)
271,869 3,832 17,157 268,756 165,435 2,911 11,673 156,510 112,246
(24,102) (23,509)
Assets held under finance lease
Vehicles 21,022 (3,832) 12,541 29,732 9,640 (2,911) 4,200 10,929 18,803 20
2010 292,891 - 29,698 298,488 175,075 - 15,873 167,439 131,049 (24,102) (23,509)
INTANGIBLE ASSETS
COST
Computer software 24,439 - - 24,439 21,202 - 1,700 22,902 1,537 33 1/32010 24,439 - - 24,439 21,202 - 1,700 22,902 1,537
Amortization
rate per
annum %
(Rupees '000)
AMORTISATION
As at
January 01,
2010
Transfer
from
leased
assets
Amortisation
As at
Dec 31,
2010
Net book
value as at
Dec 31,
2010
As at
January 01,
2010
Transfer
from
leased
assets
Additions/D
isposals
As at
Dec 31,
2010
(Rupees '000)
COST DEPRECIATION
As at
January 01,
2010
Transfer
(from)/ to
leased
assets
As at
Dec 31,
2010
Depreciation
rate per
annum %
As at
January 01,
2010
Transfer
(from)/ to
leased
assets
Charge for
the year/
(disposals)
Additions/
(Disposals)
As at
Dec 31,
2010
Net book
value as at
Dec 31,
2010

SME Bank Limited
Notes to the Consolidated Financial Statements
For the year ended December 31, 2011
13.3
Vehicles
Toyota GLI 1,065 810 255 255 As Per Bank Policy
Suzuki Cultus 569 569 - 57 As Per Bank Policy
Honda City 801 801 - 80 As Per Bank Policy
Suzuki Baleno 764 764 - 76 As Per Bank Policy
Suzuki Baleno 753 753 - 75 As Per Bank Policy
Honda CG 125 71 60 11 55
Cultus-VXL 663 398 265 196 As Per Leasing Policy
Suzuki Alto 556 371 185 161 As Per Leasing Policy
5,242 4,526 716 956
628 615 13 247
2011 5,870 5,141 729 1,203
2010 24,102 23,509 593 15,553
13.4
13.5
2011 2010
14. DEFERRED TAX ASSETS
Taxable temporary differences on:
Accelerated tax depreciation and amortization (29,441) (28,502)
Net investment in lease (239) (12,124)
Liabilities against assets subject to finance lease (103) (297)
(29,783) (40,923)
Deductible temporary differences on:
Unused tax losses 29,783 40,923
29,783 40,923
- -
14.1 183,085 220,625
Particulars of buyers
Mr. Amjad Ali
Syed Akbar Shah
M/S Askari General Insurance
Other assets
having book value
of less than Rs.
250,000 or cost
less than of
Rs.1,000,000
Details of disposal of fixed assets :
Book
value
Particulars of
assetsCost
Accumulated
depreciation
Mode of
disposal
Insurance claim
for theft
(Rupees in '000)
This represent cost of land measuring 500 square yards in sector G-7 and 4666.66 square yards situated in sector G-5/2 was
originally allotted to SBFC and RDFC respectively. CDA required payment of Rs. 3.367 million for transferring the plot in the
name of the Bank from SBFC and RDFC. However, on receiving draft of the required amount, CDA returned the same
requiring payment of market value in view of proposed privatization of the Bank. The matter is still pending, however based on
the fact that the land is under possession of the Bank and the title is in the name of SBFC and RDFC which are now SME, the
management believes that the Bank is not required to pay the market value of the plot and accordingly the Bank has ownership
rights over this land.
Temporary differences for which no deferred tax is recognized due
to uncertain taxable profits
----------------------(Rupees '000)--------------------
Sale
proceeds
Gross carrying amount of fully depreciated assets that are still in use was Rs. 144,644 thousands (2010: Rs. 136,133 thousand).
Mr. R.A. Chughtai
Mr. Najam Akhtar
Mr. Ihsan Ul Haq

SME Bank Limited
Notes to the Consolidated Financial Statements
For the year ended December 31, 2011
Note 2011 2010
Restated
15. OTHER ASSETS
Income/ mark-up accrued in local currency 15.1 113,749 116,361
Advances, deposits, advance rent and other prepayments 50,153 37,308
Refund due from benevolent fund 1,279 54,630
Receivable from SBP 15.2 7,380 7,277
Stock Exchange membership 15.3 48,000 48,000
Receivable from Speedway Fondmetall Pakistan Limited 19,640 19,640
Receivable against factorized portfolio 8,248 8,248
Others 45,920 41,303
294,369 332,767
Less: Provision held against other assets 15.4 73,767 69,791
Other assets (net of provision) 220,602 262,976
15.1
15.2
15.3
Note 2011 2010
Restated
15.4 Provision against other assets
Opening balance 69,791 62,380
Charge for the year 4,627 8,300
Reversals (28) (330)
4,599 7,970
Amount written off (623) (559)
Closing balance 73,767 69,791
Provision balance is in respect of:
Income/ mark-up accrued in local currency:
Universal Leasing Limited 22 22
Receivable from Speedway Fondmetall Pakistan Limited 19,640 19,640
Receivable against factorized portfolio 8,248 8,248
Other receivables- SME Portfolio 20,021 15,449
Legal charges recoverable from borrowers- SBFC & RDFC 22,112 22,373
Others 3,724 4,059
73,767 69,791
This balance has been arrived at after adjusting interest in suspense of Rs. 4,007,862 thousand (2010: Rs. 4,031,723
thousand).
This amount represents receivable from SBP under circular SMEFD 11, dated July 01, 2010 related to relief provided to
borrowers of flood affected areas of Khyber Pakhtun Khwa, FATA and PATA.
This includes membership of Lahore Stock Exchange of Rs. 30 million and Islamabad Stock Exchange Rs. 18 million as
settlement with Ravi Securities (Pvt) Limited and Taas Securities (Pvt) Limited. The cost reflected here is based on best
management estimate of the fair value of membership of Lahore Stock Exchange and Islamabad Stock Exchange at
settlement date. The settlement with M/S Ravi Securities (Pvt.) Ltd. and M/S Taas Securities (Pvt.) Ltd. against
membership of Lahore Stock Exchange was reached in 2009 however full amount of receivable was not adjusted against
the value of membership. Based on the outcome of discussion with the Ministry of Finance, the management has adjusted
the remaining amount of receivable of 10 million against the value of membership and Rs. 1.699 million against creditors
by restating the comparative figures. This has resulted in increase in other assets by Rs. 10 million and decrease in
creditors by Rs. 1.699 million at December 31, 2009 with corresponding decrease in accumulated loss at December 31,
2009 by Rs. 11.699 million.
(Rupees in '000)
(Rupees in '000)

SME Bank Limited
Notes to the Consolidated Financial Statements
For the year ended December 31, 2011
Note 2011 2010
16. BILLS PAYABLE (Rupees in '000)
In Pakistan 183,863 40,505
Outside Pakistan - -
183,863 40,505
17. BORROWINGS FROM FINANCIAL INSTITUTIONS
In Pakistan 2,171,669 1,437,604
Outside Pakistan - -
2,171,669 1,437,604
17.1 Particulars of borrowings with respect to currencies
In local currency 2,171,669 1,437,604
In foreign currencies - -
2,171,669 1,437,604
17.2 Details of borrowings secured/unsecured
Borrowings from State Bank of Pakistan - unsecured 17.2.1 48,026 -
Repurchase agreement borrowings - secured 17.2.2 2,077,421 1,360,622
Privately placed term finance certificates - secured - 62,073
Certificate of investments - un secured 17.2.3 6,757 13,244
Long term finance - secured 17.2.4 39,465 1,665
2,171,669 1,437,604
17.2.1
17.2.2
17.2.3 These certificates of investments were issued under permission granted by the Securities and Exchange Commission of
Pakistan .These are repayable between January, 2012 to July 2013 and carries return at the rate ranging from 11.50 % to
14.00 % per annum (2010: 9 % to 13 % per annum).
This represents financing facility obtained from State Bank of Pakistan under the scheme "Financing Facility For Storage
of Agri Produce (FFSAP)" vide SMEFD circular No. 08 dated June 04, 2010. This carry mark up rate of 6.5 % and is
repayable in quarterly installments.
These represent transactions with financial institutions for sale of Government Securities under re-purchase agreement
(REPO) in the inter bank money market at mark-up rates ranging from 11.7% to 12% (2010: 9.65% to 14%) per annum
for period upto three months (2010: upto four months). REPO transactions are secured against investment of the Bank in
Government securities.

SME Bank Limited
Notes to the Consolidated Financial Statements
For the year ended December 31, 2011
17.2.4
2011 2010
18. DEPOSITS AND OTHER ACCOUNTS Note (Rupees in '000)
Customers
Fixed deposits 1,271,968 826,798
Savings deposits 624,354 689,481
Current accounts - non-remunerative 358,201 410,796
Margin accounts 410,446 454,990
2,664,969 2,382,065
Financial Institutions
Remunerative deposits 18.2 327,671 259,877
Non-remunerative deposits 6,552 10,006
2,999,192 2,651,948
18.1 Particulars of deposits
In local currency 2,999,192 2,651,948
In foreign currencies - -
2,999,192 2,651,948
18.2 Remunerative deposits include Rs. 277.667 million (2010: Rs. 259.873 million) related to Equity Participation Fund.
This represents financing facilities obtained by SMEL from United Bank limited (UBL) and Energy Conservative Fund
(Enercon). The facility with UBL amounting to Rs. 50 million is secured against first charge by way of hypothecation over
un-encumbered lease assets and related receivables and it carries mark-up at the rate of 3 months Kibor plus 1.50% per
annum (31 December 2010: Nil) with no floor and cap. Tenure of the loan is 2 years and is repayable in quarterly
installments.
The facility with Enercon is under an agreement whereby they have agreed to provide funds to SMEL for granting lease /
finance facility to its customers for procuring and using energy efficient equipments. The facility carries mark-up at the
rate of 5% per annum (31 December 2010: Nil) payable on quarterly basis subject to the condition that SMEL will
provide lease / finance facility to its customers at a preferential mark-up rate.

SME Bank Limited
Notes to the Consolidated Financial Statements
For the year ended December 31, 2011
19. LIABILITIES AGAINST ASSETS SUBJECT TO FINANCE LEASE
(Rupees in '000)
Not later than one year 3,377 1,030 2,347 2,799 1,005 1,794
14,457 791 13,666 14,904 1,329 13,575
Over five years - - - - - -
17,834 1,821 16,013 17,703 2,334 15,369
Note 2011 2010
Restated
20. OTHER LIABILITIES (Rupees in '000)
Mark-up/ return/ interest payable in local currency 53,844 44,517
Unearned commission on guarantees 2,111 2,885
Accrued expenses 20,102 18,313
Income tax payable 23,045 30,367
Accounts payable 419 4,845
Sundry creditors 20.1 121,028 109,063
Payable to NBP 12.2 2,236 1,350
Branch adjustment account 856 186
Industrial Credit for Rural Women - Promotional Fund 20.2 - -
Payable against employees' benefit plans
Defined benefit pension
The Bank 2,660 1,377
Defined benefit unfunded gratuity scheme
The Bank 34,442 31,362
SMEL 4,109 3,364
Unfunded compensated absences
The Bank 73,599 70,561
SMEL 1,267 922
Payable on termination/maturity of lease 663 456
Security deposits against lease 280 280
Employees' VSS payments withheld 20.3 18,086 18,410
Payable to Equity Participation Fund - unsecured 3,263 4,196
Income tax withheld payable 17,640 17,452
Others 8,477 3,489 388,127 363,395
20.1
20.2
20.3
This includes amount of Rs. 90.6 million payable either to SBP or FBR on VSS payments on finalization of tax audit
of financial year 2009 which is currently in progress.
December 31, 2011
Minimum
lease
payments
Financial
charges for
future
periods
Principal
outstanding
Employees VSS payments of Rs. 18.023 million has been withheld due to legal cases pending in the courts against
employees filed by the Bank and customers.
Later than one year and not
later than five years
This represents liability against vehicle lease agreements with leasing companies. Monthly lease rentals are payable
including financial charges at rates ranging between 13.50% and 23.00% (2010: 13.50% and 16.70%) per annum,
which have been used as discounting factor to determine present value of minimum lease payments. The purchase
option is available with the Bank at the time of payment of the last installment or surrender of deposit money under
the lease agreements.
At the time of amalgamation of RDFC and SBFC with the Bank, an amount of Rs. 30.851 million was included in
other liabilities. Pursuant to the Board of Directors decision dated March 05, 2011, this amount being not a liability of
the Bank, has been taken to equity restating the comparative figures. This has resulted in decrease in other liabilities of
the Group as at December 31, 2009 by Rs. 30.851 million with corresponding decrease in accumulated loss at
December 31, 2009 by the same amount.
Minimum
lease
payments
December 31, 2010
Principal
outstanding
Financial
charges for
future
periods
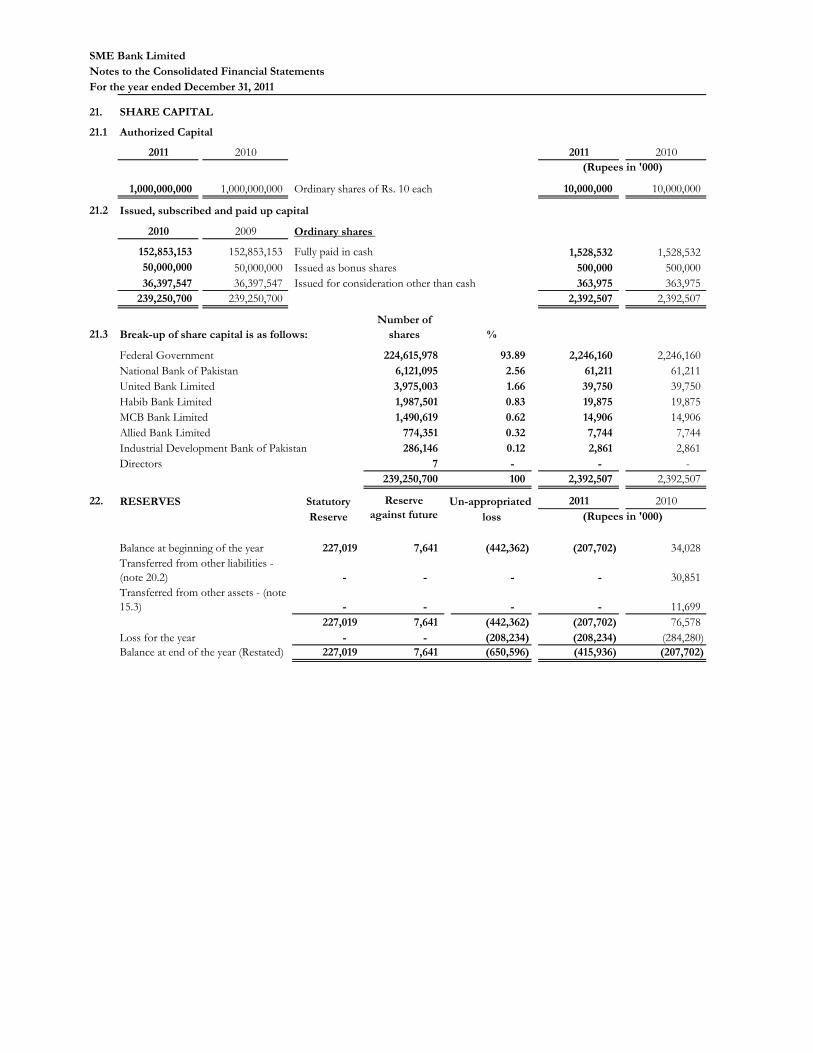
SME Bank Limited
Notes to the Consolidated Financial Statements
For the year ended December 31, 2011
21. SHARE CAPITAL
21.1 Authorized Capital
2011 2010 2011 2010
(Rupees in '000)
1,000,000,000 1,000,000,000 Ordinary shares of Rs. 10 each 10,000,000 10,000,000
21.2 Issued, subscribed and paid up capital
2010 2009 Ordinary shares
152,853,153 152,853,153 Fully paid in cash 1,528,532 1,528,532
50,000,000 50,000,000 Issued as bonus shares 500,000 500,000
36,397,547 36,397,547 Issued for consideration other than cash 363,975 363,975
239,250,700 239,250,700 2,392,507 2,392,507
Number of
21.3 Break-up of share capital is as follows: shares %
Federal Government 224,615,978 93.89 2,246,160 2,246,160
National Bank of Pakistan 6,121,095 2.56 61,211 61,211
United Bank Limited 3,975,003 1.66 39,750 39,750
Habib Bank Limited 1,987,501 0.83 19,875 19,875
MCB Bank Limited 1,490,619 0.62 14,906 14,906
Allied Bank Limited 774,351 0.32 7,744 7,744
Industrial Development Bank of Pakistan 286,146 0.12 2,861 2,861
Directors 7 - - -
239,250,700 100 2,392,507 2,392,507
22. RESERVES Statutory Un-appropriated 2011 2010
Reserve loss (Rupees in '000)
Balance at beginning of the year 227,019 7,641 (442,362) (207,702) 34,028
- - - - 30,851
- - - - 11,699
227,019 7,641 (442,362) (207,702) 76,578
Loss for the year - - (208,234) (208,234) (284,280)
Balance at end of the year (Restated) 227,019 7,641 (650,596) (415,936) (207,702)
Reserve
against future
losses
Transferred from other liabilities -
(note 20.2)
Transferred from other assets - (note
15.3)

SME Bank Limited
Notes to the Consolidated Financial Statements
For the year ended December 31, 2011
22.1
22.2
22.3
23. DEFICIT ON REVALUATION OF ASSETS 2011 2010
(Rupees in '000)
(Deficit)/Surplus on revaluation of available-for-sale securities
Federal Government securities
- Market Treasury Bills (MTBs) 2,134 (83)
- Pakistan Investment Bonds (PIBs) (55,359) (156,867)
(53,225) (156,950)
Fully paid up ordinary shares/units
- Listed companies/mutual funds 5,339 9,612
Term Finance Certificates, Debentures, Bonds and
Participation Term Certificates
- Listed TFCs (6) (260)
(47,891) (147,598)
Non-controlling interest (49) (1,029)
(47,940) (148,627)
Reserves as at December 31, 2011 include Rs. 374,873 thousand (December 31, 2010: Rs. 226,312 thousand) in respect of Forced
Sale Value (FSV) of mortgaged residential, commercial, industrial properties (land and building only) held as collateral against non-
performing advances allowed under BSD circular No 1 of 2011 dated October 21, 2011 and referred in note 12.5.1 above.
Reserves to that extent are not available for payment of cash or stock dividend.
The share premium represented non-controlling interest and has therefore been reclassified to non-controlling interest under
reserves. This change has been made retrospectively and accordingly comparative figures have been restated. This change has no
impact on the consolidated unappropriated loss.
Reserve against future losses represents amounts set aside in view of the risks associated with the economic cyclical nature of the
business and is recognised as an appropriation of retained earnings. Any credits resulting from the reduction of such amounts
result in an increase in unappropriated profit and are not included in the determination of profit or loss for the period. The
amount to be set aside against future losses is determined at the rate of 0.5 percent of the outstanding balance of the regular
portfolio of leases and loans and receivables as at each period end.

SME Bank Limited
Notes to the Consolidated Financial Statements
For the year ended December 31, 2011
2011 2010
24. CONTINGENCIES AND COMMITMENTS (Rupees in '000)
24.1 Transaction-related contingent liabilities
Guarantees in favour of:
Government 151,051 71,156
Others 96,231 90,411
24.2 Other Contingencies
a)
24,972 24,972
b)
49,800 49,800
c)
15,000 23,800
d)
612,707 612,707
.e)
- 9,939
f) 85,570 90,800
24.3 Commitments in respect of forward lending
Commitments to extend credit 206,275 243,700
Commitments for lease disbursement 19,418 3,100
24.4 Commitments for the acquisition of operating fixed assets 2,213 680
24.5 Commitments against repo/reverse repo transactions
Purchase and resale agreements - 33,445
Sale and repurchase agreements 2,127,535 1,371,750
24.6 Other commitments
Undrawn facilities 266,798 201,747
24.7 Bills for collection
Payable in Pakistan 1,249 2,076
Back benefits and claims of staff/employees under litigation.
Adjustment of loan guarantee against borrowing from IDBP repaid in prior
years, disputed by IDBP.
Claims not acknowledged as debt from various borrowers for loss sustained
due to non-disbursement.
Damages claimed by an ex-employee of the than RDFC involved in Ravi
Securities (Pvt) Limited and Taas Securities (Pvt) Limited affairs and a
director of Ravi Securities (Pvt) Limited and Taas Securities (Pvt) Limited
not acknowledged as debt
Damages claim by borrower for delay in recording repayments received
from borrower, not acknowledged as debt.
Tax demands of Rs. 612.707 million raised by the Income Tax Authorities
related to VSS staff cost (tax year-2005) has been decided in favour of the
Bank. However tax authorities has filed appeal before ATIR against the
decision of the Income Tax Commissioner. Management strongly believes
and expects favourable outcome and therefore no provision has been made
for this effect in the financial statements.

SME Bank Limited
Notes to the Consolidated Financial Statements
For the year ended December 31, 2011
2011 2010
25. MARK-UP/ RETURN/ INTEREST EARNED Note (Rupees in '000)
On loans and advances to
Customers
Extended by:
Defunct RDFC - 5,219
Defunct SBFC - 4,548
The Group 333,756 319,515
Mark up on investment in finance lease 44,179 72,973
377,935 402,255
Employees 6,337 6,515
384,272 408,770
On investments in
Available for sale securities 271,882 233,993
Held to maturity securities 45,537 590
317,419 234,583
On deposits with financial institutions 361 1,252
On securities purchased under resale agreements 1,520 248
On call money lending 24,620 2,668
728,192 647,521
26. MARK-UP/ RETURN/ INTEREST EXPENSED
Deposits 225,135 173,129
Borrowings 202,971 174,843
SBP Refinance Scheme 2,224 -
Lease finance charges 370 190
Brokerage and commission 787 487
Bank charges 1,432 2,083
432,919 350,732
27. GAIN ON SALE OF SECURITIES
Mutual funds 5,957 12,298
28. OTHER INCOME
Gain on sale of property and equipment 474 14,959
Fee on fund managed by the Bank 875 13,956
Gain on termination of lease 185 145
Others 3,328 4,085
4,862 33,145

SME Bank Limited
Notes to the Consolidated Financial Statements
For the year ended December 31, 2011
2011 2010
29. ADMINISTRATIVE EXPENSES Note (Rupees in '000)
Salaries, allowances, etc. 340,872 331,145
Charge for defined benefit plans
- pension fund 60,992 27,619
- unfunded gratuity scheme 14,418 11,328
- unfunded compensated absences 17,320 27,439
Reversal of charge on benevolent fund (861) (54,199)
Non-executive directors' fees, allowances and other expenses 1,188 918
Rent, taxes, insurance, electricity, etc. 80,788 76,839
Legal and professional charges 14,409 18,192
Communications 7,288 6,812
Repairs and maintenance 13,571 13,735
Finance charges on leased assets 898 28
Stationery and printing 4,413 4,352
Advertisement and publicity 1,652 1,679
Auditors' remuneration 29.1 2,475 2,688
Depreciation 13.1 16,366 15,873
Amortization 13.2 1,694 1,700
Staff recovery costs - 2,533
Recruitment expenses 341 536
Travel and transport 5,935 5,327
Vehicle running and maintenance expenses 5,861 4,673
Entertainment 2,130 1,793
Training 754 646
Books, subscription and newspapers 3,795 3,815
Other expenses 29.2 12,311 11,640
608,610 517,111
29.1 Auditors' remuneration
Audit fee 1,350 1,350
650 717
Out-of-pocket expenses 475 621
2,475 2,688
29.2
2011 2010
30. OTHER CHARGES (Rupees in '000)
Penalties imposed by the State Bank of Pakistan 48 4,267
Special certifications, half yearly review and audit of consolidated
financial statements
This includes Security charges of Rs. 6,228,092 (2010: Rs. 5,986,143), NIFT charges of Rs. 1,356,180 (2010: Rs.
1,140,669) and SWIFT & TELEX charges of Rs. 361,411 (2010: Rs. 1,732,540).

SME Bank Limited
Notes to the Consolidated Financial Statements
For the year ended December 31, 2011
2011 2010
31. TAXATION
Current 31.2 8,461 10,111
Prior years 31.3 - (49,511)
Deferred - -
8,461 (39,400)
31.1 Relationship between tax expense and accounting loss
2011 2010
Loss before tax (216,570) (337,052)
Applicable tax rate 35% 35%
Tax on loss (Rupees) 75,800 117,968
Deferred tax asset not recognised (Rupees) (77,068) (122,123)
Tax effect of income taxed at lower rate (Rupees) 1,268 4,155
Minimum tax (Rupees) (8,461) (10,111)
Prior year adjustment (Rupees) - 49,511
(8,461) 39,400
31.2
31.3
2011 2010
32. CASH AND CASH EQUIVALENTS
Cash and balances with treasury banks 214,655 228,062
Balances with other banks 9,865 20,912
Call money lendings 250,000 -
474,520 248,974
33. STAFF STRENGTH
Permanent 205 199
Temporary/ on contractual basis 248 254
Daily wagers 1 2
Bank's own staff strength at the end of the year 454 455
Outsourced 78 68
Total staff strength 532 523
(Rupees in '000)
Provision for current year expenses is charged on minimum tax rate of 1% of the turnover due to tax losses of
the Group for the year ended December 31, 2011.
(Rupees in '000)
Numbers
(Rupees in '000)
This represents balance amount after providing for all tax liabilities including additional tax demand for the
prior years.

SME Bank Limited
Notes to the Consolidated Financial Statements
For the year ended December 31, 2011
34. EMPLOYEE BENEFIT PLANS
34.1 Defined benefit pension and gratuity plan
34.1.1 General description
The scheme entitles the members to:
-
-
34.1.2 The amounts recognised in the balance sheet are as follows:
Present value of defined benefit obligation 471,902 392,450
Fair value of plan assets (355,551) (259,279)
Deficit 116,351 133,171
Unrecognized actuarial loss (110,428) (127,443)
Unrecognized past service cost (3,263) (4,351)
Net liability 2,660 1,377
34.1.3 Movement in net asset recognised in the balance sheet
Opening balance 1,377 (182,064)
Expense for the year 60,992 27,619
Transfer to SME Bank Limited against VSS 2009 optees - 170,993
Contribution to the fund (59,709) (15,171)
Closing balance 2,660 1,377
34.1.4 The amounts recognised in the profit and loss account are as follows:
Current service cost 27,861 17,045
Interest cost 54,771 34,129
Expected return on plan assets (37,428) (24,643)
Actuarial loss recognized 14,700 -
Past service cost recognized 1,088 1,088
Expense for the year 60,992 27,619
The expense has been recognized in administrative expenses in consolidated profit and loss account.
34.1.5 Actual return on plan assets 39,022 9,473
2011 2010
34.1.6 Changes in present value of defined benefit obligation
Present value of obligation at the beginning of the year 392,450 245,555
Current service cost 27,861 17,045
Interest cost 54,771 34,129
Benefits paid (existing pensioners) (2,459) (3,555)
Actuarial (gain) / loss (720) 99,276
Present value of obligation at the end of the year 471,902 392,450
34.1.7 Changes in fair value of plan assets
Fair value of opening plan assets 259,279 409,184
Expected return on plan assets 37,428 24,643
Contributions 59,709 15,171
Transfer to SME Bank Limited against VSS 2009 optees - (170,993)
Benefits paid (2,459) (3,555)
Actuarial gain/ (loss) 1,595 (15,171)
Fair value of closing plan assets 355,551 259,279
Bank operates an approved defined benefit pension and gratuity fund for all its permanent and regular employees. Contributions are made in
accordance with the actuarial recommendations.
Gratuity payable to members who have completed a minimum of 5 years of service and total service on retirement or cessation of service
or death is less than 10 years.
Pension payable to members who have completed a minimum of 10 years of service with the Bank on retirement at age of sixty years or
on completion of 25 years of service with the Bank or on permanent disability or on death during service.
(Rupees '000)
The expected return on plan assets is based on the market expectations and depends upon the asset portfolio of the Bank, at the beginning of
the period, for returns over the entire life of the related obligation.
(Rupees '000)

SME Bank Limited
Notes to the Consolidated Financial Statements
For the year ended December 31, 2011
34.1.8 Break-up of category of assets
(Rupees '000) % age (Rupees '000) % age
Market Treasury Bills (MTBs) 302,657 85% 57,825 22%
Term Deposits Receipts (TDRs) 52,852 15% 194,202 75%
Bank deposit accounts 42 0% 7,252 3%
355,551 100% 259,279 100%
34.1.9 Principal actuarial assumptions
2011 2010
Valuation discount rate - per annum 12.5% 14.0%
Expected return on plan assets - per annum 12.0% 13.0%
Salaries increase rate - per annum 12.5% 14.0%
Pension indexation rate 10.0% 10.0%
Mortality rate EFU 61-66 EFU 61-66
Average expected remaining working lives in years 6 7
34.1.10 Disclosure for current and previous four annual years
2011 2010 2009 2008 2007
Present value of obligation 471,902 392,450 342,592 342,592 293,103
Fair value of plan assets (355,551) (259,279) (345,070) (345,070) (286,310)
Deficit/ (surplus) 116,351 133,171 (2,478) (2,478) 6,793
Experience adjustments
on plan liabilities-loss/ (gain) (720) 99,276 27,348 1,702 (5,953)
Experience adjustments
on plan assets-gain/ (loss) 1,595 (15,171) 2,622 9,680 (2,655)
2011 2010
34.2 Defined benefit unfunded gratuity scheme 34,442 31,362
34.2.1 General description
34.2.2 The amounts recognised in the balance sheet are as follows:
2011 2010
Present value of defined benefit obligation 42,517 41,326
Unrecognized actuarial loss (8,075) (9,964)
Net liability 34,442 31,362
34.2.3 Movement in net liability recognised in the balance sheet
Opening balance of net liability 31,362 24,475
Expense for the year 13,254 9,264
Benefits paid during the year (10,174) (2,377)
Closing balance of net liability 34,442 31,362
34.2.4 The amounts recognised in the profit and loss account are as follows:
Current service cost 7,650 5,377
Interest cost 5,074 3,859
Actuarial loss recognised 530 28
13,254 9,264
The expense has been recognized in administrative expenses in consolidated profit and loss account.
2010
The Bank operates a defined benefit unfunded gratuity scheme for its contractual employees.
2011
Actuarial valuation is carried out annually. Latest actuarial valuation was carried out as at December 31, 2011 using Projected Unit Credit
Method. Significant actuarial assumptions used are as follows:
(Rupees '000)
(Rupees '000)
(Rupees '000)

SME Bank Limited
Notes to the Consolidated Financial Statements
For the year ended December 31, 2011
2011 2010
34.2.5 Movement in payable to defined benefit unfunded gratuity scheme
Present value of obligation at the beginning of the year 41,326 27,562
Current service cost 7,650 5,377
Interest cost 5,074 3,859
Benefits paid (10,174) (2,377)
Actuarial (gain) / loss (1,359) 6,904
Present value of obligation at the end of the year 42,517 41,326
34.2.6 Significant actuarial assumptions are as follows: 2011 2010
Discount factor - per annum 12.5% 14.0%
Salary increase rate - per annum 12.5% 14.0%
Average expected remaining working lives in years 11 12
Mortality rate EFU 61-66 EFU 61-66
34.2.7 Disclosure for current and previous four annual periods
2011 2010 2009 2008 2007
Present value of obligation 42,517 41,326 27,562 24,284 16,972
Unrecognized actuarial gain (8,075) (9,964) (3,087) (3,609) (634)
34,442 31,362 24,475 20,675 16,338
34.3 Unfunded compensated absences
34.3.1 General description
34.3.2 Principal actuarial assumptions
2011 2010
Discount factor - per annum 12.5% 14.0%
Salaries increase rate - per annum 11.5% 13.0%
Average expected remaining working lives in years 6 7
Mortality rate EFU 61-66 EFU 61-66
2011 2010
34.3.3 The amounts recognised in the balance sheet are as follows:
Present value of defined benefit obligation 73,599 70,561
34.3.4 Movement in liability recognized in the balance sheet
Balance at beginning of the year 70,561 54,793
Expense for the year 16,115 26,491
Benefits paid during the year (13,077) (10,723)
Balance at end of the year 73,599 70,561
34.3.5 The amounts recognised in the profit and loss account are as follows:
Current service cost 3,895 3,308
Interest cost 8,963 7,671
Actuarial loss recognised 3,257 15,512
Expense for the year 16,115 26,491
The expense has been recognized in administrative expenses in profit and loss account.
2011 2010
34.3.6 Movement in payable to defined benefit unfunded Compensated absences
Present value of obligation at the beginning of the year 70,561 54,793
Current service cost 3,895 3,308
Interest cost 8,963 7,671
Benefits paid (13,077) (10,723)
Actuarial loss 3,257 15,512
Present value of obligation at the end of the year 73,599 70,561
(Rupees '000)
The Bank provides compensated absences, an unfunded scheme, as per entitlement to all its permanent and contractual employees.
Actuarial valuation was carried out as at December 31, 2011 using Projected Unit Credit Method. Significant actuarial assumptions used were
as follows:
(Rupees '000)
(Rupees '000)
(Rupees '000)

SME Bank Limited
Notes to the Consolidated Financial Statements
For the year ended December 31, 2011
34.3.7 Disclosure for current and previous four annual periods
2011 2010 2009 2008 2007
Present value of obligation 73,599 70,561 54,793 91,670 83,764
34.4 Benevolent fund
34.4.1 General description
34.4.2 Actuarial liability for active employees 6,347 2,143 8,490 4,746 1,499 6,245
Actuarial liability for beneficiaries 314 189 503 430 225 655
Total actuarial liability 6,661 2,332 8,993 5,176 1,724 6,900
Fair value of plan assets (7,557) (2,715) (10,272) (41,018) (20,512) (61,530)
Funding surplus (896) (383) (1,279) (35,842) (18,788) (54,630)
Asset to be recognized in balance sheet (896) (383) (1,279) (35,842) (18,788) (54,630)
Current service cost 123 299 423 286 116 403
Interest cost 291 833 1,124 725 241 966
Expected return on plan assets (339) (945) (1,285) (5,743) (2,872) (8,616)
75 187 262 (4,732) (2,515) (7,247)
34.4.3
Expense for the year 140 278 418 151 280 431
Funding surplus (896) (383) (1,279) (18,788) (35,842) (54,630)
(756) (105) (861) (18,637) (35,562) (54,199)
34.4.4 This is second year of valuation of benevolent fund, therefore the comparative figures for prior years are not applicable.
34.5
34.5.1 Principal actuarial assumptions
2011 2010
Discount rate - per annum 13.0% 14.5%
Salaries increase rate - per annum 13.0% 14.5%
Average expected remaining working lives in years 6 7
2011 2010
34.5.2 Reconciliation of provision for gratuity scheme
Present value of defined benefit obligation 4,409 3,688
Unrecognised actuarial loss (300) (324)
4,109 3,364
Officers
Benevolent
Fund
Officers
Benevolent
Fund
Staff
Benevolent
Fund
2011 2010
The Bank also operates a contributory benevolent fund for all its eligible employees (defined benefit scheme).
Staff
Benevolent
Fund
(Rupees '000)
(Rupees '000)
TotalTotal
(Rupees '000)
SMEL operates an unapproved and unfunded gratuity scheme for all its permanent employees. The latest actuarial valuation of the gratuity
scheme was carried out as at December 31, 2011 using the Projected Unit Credit Method. The following significant assumptions were used
for valuation of the scheme:
Expected benevolent expense/ (income) for
the next one year commencing 01 January, 2012
The amount recognized in the profit and loss
account is as follows:
(Rupees '000)
(Rupees '000)
(Rupees '000)

SME Bank Limited
Notes to the Consolidated Financial Statements
For the year ended December 31, 2011
2011 2010
34.5.3 Movement in the statement of financial position liability
Balance at beginning of the year 3,364 2,408
Expense recognised during the year 1,164 1,032
Contribution made during the year (419) (76)
Balance at end of the year 4,109 3,364
34.5.4 Gratuity scheme expenses
Current services cost 599 583
Interest cost 565 422
Actuarial gain recognized during the year - 27
1,164 1,032
34.5.5 Disclosure for current and previous four annual periods
2011 2010 2009 2008 2007
Present value of defined benefit obligation 4,409 3,688 3,098 2,519 2,439
Fair value of plan assets - - - - -
Deficit 4,409 3,688 3,098 2,519 2,439
Experience adjustments on obligation 24 340 230 125 (1,038)
34.5.6 Expected actual expenses in respect of defined benefit scheme in the next financial year is Rs. 1.227 million.
(Rupees '000)
(Rupees '000)

SME Bank Limited
Notes to the Consolidated Financial Statements
For the year ended December 31, 2011
35. COMPENSATION OF DIRECTORS AND EXECUTIVES
2011 2010 2011 2010 2011 2010
Fees - - 596 556 - -
Managerial remuneration 2,209 4,680 - - 106,059 100,707
Charge for defined benefit plan 268 920 - - 16,137 12,899
Rent and house maintenance 889 840 - - 21,803 20,854
Utilities 133 72 - - 10,133 11,555
Medical 343 - - - 11,094 10,041
Conveyance - - - - 3,514 2,990
Leave fare assistance 207 250 - - 5,538 5,549
Bonus/ex-gratia - - - - - -
Others 1,062 880 592 362 27,179 21,453 5,110 7,642 1,188 918 201,456 186,048
Number of persons 2 1 8 7 123 117
35.1
36. FAIR VALUE OF FINANCIAL INSTRUMENTS
Fair value of the remaining financial assets and liabilities except fixed term loans, staff loans, non-performing
advances and fixed term deposits is not significantly different from the carrying amounts since such assets and
liabilities are short term in nature.
The fair value of fixed term loans, staff loans and fixed term deposits cannot be calculated with sufficient reliability
due to absence of current and active market for such assets / liabilities and reliable data regarding market rates for
similar instruments. The provision for non-performing advances has been calculated in accordance with the Bank's
accounting policy as stated in note 6.4. The maturity profile and effective rates are stated in note 40.2.3.
Directors Executives
(Rupees in '000)
The fair value of investments is based on quoted market prices and rates quoted at Reuters Pages (PKRV) with the
exception of unlisted securities.
Executives mean employees, other than the chief executive and directors, whose basic salary exceeds five hundred
thousand rupees in a financial year.
The remuneration of executives includes Rs. 39,573 thousand (December 2010: Rs. 29,584 thousand) relating to key
management personnel of the Group.
Group President

SME Bank Limited
Notes to the Consolidated Financial Statements
For the year ended December 31, 2011
37. SEGMENT DETAILS WITH RESPECT TO BUSINESS ACTIVITIES
The segment analysis with respect to business activity is as follows:
Trading & Commercial Other leasing Total
Sales Banking operations
Total income 346,884 466,725 15,997 829,606
Total expenses 197,741 789,674 58,761 1,046,176
Net income/ (loss) 149,143 (322,949) (42,764) (216,570)
Segment assets (gross) 4,018,480 8,238,704 933,185 13,190,369
Segment non performing loans - 5,580,338 357,484 5,937,822
Segment provision required 207,749 5,076,007 149,425 5,433,181
Segment liabilities 2,208,859 3,116,005 434,000 5,758,864
Segment Return on net Assets (ROA) (%) 3.91% -10.21% -5.46%
Segment cost of funds (%) 9.28% 7.46% 5.91%
Total income 291,831 301,834 43,793 637,458
Total expenses 195,218 705,943 73,349 974,510
Net income 96,613 (404,109) (29,556) (337,052)
Segment assets (gross) 2,741,249 8,223,077 1,080,054 12,044,380
Segment non performing loans - 5,623,404 371,737 5,995,141
Segment provision required 172,490 5,137,288 102,133 5,411,911
Segment liabilities 1,492,627 2,487,575 528,619 4,508,821
Segment Return on net Assets (ROA) (%) 3.43% -14.27% -3.02%
Segment cost of funds (%) 10.29% 6.53% 6.91%
Assumptions used:
-
-
- Unallocatable liabilities representing 5.39% (2010: 8.03%) of the total liabilities have been allocated to segments based on their
respective incomes.
December 31, 2010 (Restated)
December 31, 2011 (Rupees in '000)
Unallocatable administrative expenses have been allocated to segments based on their respective incomes except for the
depreciation expense which has been allocated on the annual basis of net book value of segment operating fixed assets.
Unallocatable assets representing 0.78% (2010: 0.77%) of the total assets have been allocated to segments based on their
respective incomes.

SME Bank Limited
Notes to the Consolidated Financial Statements
For the year ended December 31, 2011
38. RELATED PARTY TRANSACTIONS
The Group has related party relationship with its directors, executive officers and employees funds.
Details of balances outstanding at year end and transactions with related parties are as follows:
2011 2010
Balances outstanding 5,723 10,006
Equity Participation Fund
Amount payable to fund 3,263 4,196
Executive officers:
Loan to executives 89,493 91,522
Advances to executives of SMEL 242 183
Transactions during the year
Payment/ contribution to employees' funds 90,773 29,613
Charge for the year relating to employees' funds 92,327 66,212
Fee on Equity Participation Fund managed by the Bank 875 13,956
Payments made on behalf of Equity Participation Fund 58 46
(Rupees in '000)
Remuneration of chief executive officer and executives and fee paid to directors is disclosed in note 35 to the financial
statements.

SME Bank Limited
Notes to the Consolidated Financial Statements
For the year ended December 31, 2011
39. CAPITAL ADEQUACY
2011 2010
Regulatory capital base (Rupees in '000)
Tier I capital
Shareholders capital/assigned capital 2,392,507 2,392,507
Reserves 234,660 235,636
Non-controlling interest. 69,693 87,470
Unappropriated/unremitted profits (net of losses) (650,596) (442,362)
2,046,264 2,273,251
Less: Adjustments
Deficit on revaluation of available for sale investments (55,898) (159,399)
Total tier I capital 1,990,366 2,113,852
Tier II capital 2,670 3,685
Eligible tier III capital - -
Total regulatory capital (a) 1,993,036 2,117,537
Risk-weighted exposures
Book Value Risk Adjusted Book Value Risk Adjusted
Value Value
Credit risk
Balance sheet items:
Cash and other liquid assets 224,520 1,973 248,974 4,184
Investments 3,827,667 627,214 2,680,334 317,302
Loans and advances 3,349,078 1,840,230 3,307,599 1,779,440
Fixed assets 135,321 135,321 132,586 133,302
Deferred tax assets - - - -
Other assets 220,602 184,625 262,976 189,936
7,757,188 2,789,363 6,632,469 2,424,164
Off balance sheet items
Loan repayment guarantees 247,282 96,231 233,187 110,716
247,282 96,231 233,187 110,716
Credit risk-weighted exposures 8,004,470 2,885,594 6,865,656 2,534,880
Market risk
Market risk-weighted exposures - - - -
Total risk-weighted exposures (b) 2,885,594 2,534,880
Capital adequacy ratio [ (a) / (b) x 100 ] 69.07% 83.54%
State Bank of Pakistan (SBP) has granted exemption to the Bank vide letter No. BSD/SU-21/220/1624/2007 dated
June 08, 2007 from computing capital adequacy ratio under BASEL II till restructuring/privatization. Accordingly,
the Bank computes capital adequacy ratio under BASEL I.
(Rupees '000)
The risk weighted assets to capital ratio, calculated in accordance with the State Bank's guidelines on capital
adequacy is as follows:
2011 2010

SME Bank Limited
Notes to the Consolidated Financial Statements
For the year ended December 31, 2011
40. RISK MANAGEMENT
40.1 Credit risk
40.1.1 Segment by class of business
Contingencies and
Commitments
(Rupees Percent (Rupees Percent (Rupees Percent
in '000) in '000) in '000)
Chemical and pharmaceuticals 110,824 1% 5,465 0% - -
Agriculture, forestry, -
hunting and fishing 262,944 3% - - - -
Mining & quarrying 9,053 0% - - - -
Textile 544,249 6% 75,390 3% - -
Cement 21,280 0% 33,186 1% - -
96,048 1% 1,895 0% - -
220,143 3% 21,051 1% - -
Financial - - 328,500 11% 2,127,535 64%
Insurance - - 620 0% - -
73,125 1% 325 0% - -
228,990 3% 41,369 1% - -
215,958 2% 48,668 2% - -
Wholesale and trade 1,859,180 21% - - - -
169,582 2% 40,817 1% - -
Individuals 2,133,388 25% 1,401,277 47% 558,643 20%
Services 170,101 2% 2,907 0% 15,000 1%
Government - - - - 763,758 7%
Others 2,540,906 29% 997,722 33% 193,883 9%
8,655,771 100% 2,999,192 100% 3,658,819 100%
40.1.2 Segment by sector
Public/ Government - - 819,207 27% 763,758 21%
Private 8,655,771 100% 2,179,985 73% 2,895,061 79%
8,655,771 100% 2,999,192 100% 3,658,819 100%
Transport, storage, and
communication
Construction
Footwear and leather garments
Credit risk represents the accounting loss that would be recognised at the reporting date if counter parties failed
completely to perform as contracted. The Bank is not exposed to major concentration of credit risk. Written
procedures for credit and risk management functions have been developed and implemented. Credit evaluation
system comprise of well designed loan approval and review responsibilities and it is ensured that Bank's credit-
granting activities conform to the established strategy, prudential regulations and SBP instructions are strictly
followed. To ensure that credit granting activities are adequately diversified, besides fixing limits on individual
credit, it is ascertained that there is no concentration in a particular industry or economic sector, geographical
region and specific product. Special attention is placed on such non-performing loans and a Special Recovery
Division follows up and recovers all such loans. Recovery against certain specific non-performing loans has been
outsourced to independent Recovery Service Providers.
Automobile and transportation
equipment
Electronics and electrical
appliances
Power (electricity), gas, water
and sanitary
2011
Deposits Advances (Gross)

SME Bank Limited
Notes to the Consolidated Financial Statements
For the year ended December 31, 2011
Segment by class of business
(Rupees Percent (Rupees Percent (Rupees Percent
in '000) in '000) in '000)
Chemical and pharmaceuticals 133,273 2% 12,800 0% - -
Agriculture, forestry,
hunting and fishing 246,832 3% 2 0% - -
Mining & quarrying 9,053 0% - - - -
Textile 452,017 5% 69,366 3% 650 0%
Cement 21,284 0% 11,670 0% - -
Sugar - - - - - -
120,247 1% 21,799 1% - -
285,568 3% 48,598 2% - -
Financial - 0% 269,883 10% 1,370,561 49%
Insurance - - 194 0% - -
72,798 1% 6,902 0% - -
239,579 3% 42,849 2% - -
290,321 3% 80,910 3% - -
Wholesale and trade 1,867,336 21% - - - -
Exports/ Imports - - - - - -
114,787 1% 28,960 1% 500 0%
Individuals 2,176,712 25% 1,191,505 45% 449,051 16%
Services 145,814 2% 2,732 0% 25,750 1%
Government - - - - 735,178 27%
Others 2,568,975 29% 863,778 33% 189,803 7%
8,744,596 100% 2,651,948 100% 2,771,493 100%
Segment by sector
Public/ Government - - 728,262 27% 735,178 27%
Private 8,744,596 100% 1,923,686 73% 2,036,315 73%
8,744,596 100% 2,651,948 100% 2,771,493 100%
2010
Advances (Gross) DepositsContingencies and
Commitments
Transport, storage and
communication
Footwear and leather garments
Automobile and transportation
equipment
Electronics and electrical
appliances
Construction
Power (electricity), gas, water
and sanitary

SME Bank Limited
Notes to the Consolidated Financial Statements
For the year ended December 31, 2011
40.1.3 Details of non-performing advances and specific provisions by class of business segment
Specific Specific
Provisions Provisions
Held Held
Chemical and pharmaceuticals 80,848 71,858 85,621 72,863
Agriculture, forestry, hunting
and fishing 236,921 236,865 237,235 237,772
Mining & quarrying 9,053 9,053 9,053 9,053
Textile 404,927 351,969 303,487 265,147
Cement 21,280 21,280 21,284 21,284
Sugar - - - -
Footwear and leather garments 91,544 83,858 107,778 88,630
Automobile and transportation equipment 162,061 140,110 201,856 179,538
Electronics and electrical appliances 68,818 64,782 68,908 65,320
Construction 58,731 41,607 48,551 41,341
Wholesale and trade 1,521,302 1,492,252 1,560,646 1,532,244
Transport, storage and communication 67,358 52,632 7,510 3,566
Individuals 1,782,098 1,676,126 1,769,187 1,696,741
Services 81,445 73,632 83,604 74,322
Others 1,307,290 986,593 1,460,409 1,136,227
5,937,822 5,306,693 5,995,141 5,436,997
40.1.4 Details of non-performing advances (0.5098) -
and specific provisions by sector
Public/ Government - - - -
Private 5,937,822 5,306,693 5,995,141 5,436,997
5,937,822 5,306,693 5,995,141 5,436,997
2011 2010
(Rupees in '000)
Classified
Advances
Classified
Advances
30,012 12,949
Power (electricity), gas, water and
sanitary 44,146 4,076

SME Bank Limited
Notes to the Consolidated Financial Statements
For the year ended December 31, 2011
40.1.5 GEOGRAPHICAL SEGMENT ANALYSIS
Contingencies
and
commitments
Pakistan (216,570) 7,757,188 1,998,324 3,658,819
Asia Pacific (including South Asia) - - - -
Europe - - - -
United States of America and Canada - - - -
Middle East - - - -
Others - - - -
(216,570) 7,757,188 1,998,324 3,658,819
Contingencies
and
commitments
Pakistan (337,052) 6,632,469 2,123,648 2,771,493
Asia Pacific (including South Asia) - - - -
Europe - - - -
United States of America and Canada - - - -
Middle East - - - -
Others - - - -
(337,052) 6,632,469 2,123,648 2,771,493
40.2 Market risk
Total assets
employees
Loss before
taxation
Total assets
employed
Market risk is the risk that the value of on and off-balance sheet positions of the Bank will be adversely affected
by movements in interest rates, foreign exchange rates and equity prices resulting in a loss to earnings and
capital. The Bank's interest rates exposure comprises those originating from investing and lending activities. The
Asset and Liability Committee of the Bank monitors and manages the interest rate risk with the objective of
limiting the potential adverse effect on the profitability of the Bank.
Net assets
employed
(Rupees in '000)
Loss before
taxation
2010
2011
(Rupees in '000)
Net assets
employed

SME Bank Limited
Notes to the Consolidated Financial Statements
For the year ended December 31, 2011
40.2.1 Foreign exchange risk
Presently the Bank does not deal in foreign exchange.
Net foreign
currency
exposure
(Rupees in '000)
Pakistan rupee 7,757,188 5,758,864 - -
United States dollar - - - -
Great Britain pound - - - -
Deutsche mark - - - -
Japanese yen - - - -
Euro - - - -
Other currencies
7,757,188 5,758,864 - -
Net foreign
currency
exposure
(Rupees in '000)
Pakistan rupee 6,632,469 4,508,821 - -
United States dollar - - - -
Great Britain pound - - - -
Deutsche mark - - - -
Japanese yen - - - -
Euro - - - -
Other currencies
6,632,469 4,508,821 - -
40.2.2 Equity position risk
AssetsOff-balance
sheet items
Assets LiabilitiesOff-balance
sheet items
The Bank's exposure in equity market is classified in available for sale category with the intent to earn profit
based on fundamentals.
2010
Liabilities
2011

SME Bank Limited
Notes to the Consolidated Financial Statements
For the year ended December 31, 2011
40.2.3 Mismatch of interest rate sensitive assets and liabilities
Effective Non-interest Yield/ bearing
Interest Total financialrate instruments
On-balance sheet financial instruments
AssetsCash and balances with treasury banks 214,655 - - - - - - - - - 214,655 Balances with other banks 1.61% 9,865 6,025 979 428 180 206 - - - - 1,526 Lending to financial institutions 13.46% 800,000 400,000 400,000 - - - - - - - - Investments 11.74% 3,027,667 153,051 509,112 759,300 1,203,638 393,811 6,215 - 2,540 - - Advances 13.19% 3,349,078 936,796 226,773 698,761 674,215 412,593 198,025 119,484 67,277 15,154 - Other assets 191,779 - - - - - - - - - 191,779
7,593,044 1,495,872 1,136,864 1,458,489 1,878,033 806,610 204,240 119,484 69,817 15,154 407,960 LiabilitiesBills payable 183,863 - - - - - - - - - 183,863 Borrowings 12.90% 2,171,669 1,394,613 692,407 8,971 21,845 33,829 8,054 11,950 - - - Deposits and other accounts 9.04% 2,999,192 587,240 296,882 485,157 338,509 163,998 43,200 2,150 632,389 - 449,667 Sub-ordinated loans - - - - - - - - - - - Loan from the State Bank of Pakistan - - - - - - - - - - - Liabilities against assets subject to finance lease 15.86% 16,013 194 388 13,170 291 985 985 - - - - Other liabilities 228,118 - - - - - - - - - 228,118
5,598,855 1,982,047 989,677 507,298 360,645 198,812 52,239 14,100 632,389 - 861,648 On-balance sheet gap 1,994,189 (486,175) 147,187 951,191 1,517,388 607,798 152,001 105,384 (562,572) 15,154 (453,688)
Off-balance sheet financial instruments
Commitments to extend credit 206,275 206,275 - - - - - - - - - Commitments against reverse repo lending - Commitments against repo borrowing 2,127,535 1,406,621 720,914 - - - - - - - -
Off-balance sheet gap 2,333,810 1,612,896 720,914 - - - - - - - -
Total Yield/ Interest Risk Sensitivity Gap (2,099,071) (573,727) 951,191 1,517,388 607,798 152,001 105,384 (562,572) 15,154 -
Cumulative Yield/ Interest Risk Sensitivity Gap (2,099,071) (2,672,797) (1,721,606) (204,218) 403,580 555,581 660,965 98,393 113,547 -
40.2.3.1 Reconciliation of assets and liabilities exposed to yield/ interest rate risk with total assets and liabilities
(Rupees '000) (Rupees '000)
Total financial assets as per note 40.2.3 7,593,044 Total financial liabilities as per note 40.2.3 5,598,855 Add non-financial assets: Add non-financial liabilities: Operating fixed assets 135,321 Other liabilities 160,009 Deferred tax assets - Other assets 28,823 Balance as per Balance Sheet 7,757,188 Balance as per Balance Sheet 5,758,864
40.2.3.2 Yield risk is the risk of decline in earnings due to adverse movement of the yield curve.
40.2.3.3 Interest rate risk
Over 2 to 3
years
Over 3 to 5
years
Over 5 to 10
years
Above 10
years
2011Exposed to Yield/Interest risk
(Rupees in '000)
Interest rate risk is the risk that the value of financial instrument will fluctuate due to changes in the market interest rates. Out of total financial assets of Rs. 7,593,044 thousand (2010: Rs. 6,408,523 thousand), the financial assets which
were subject to interest rate risk amounted to Rs. 7,185,084 thousand (2010: Rs. 5,997,398 thousand). Investments and other assets amounting to Rs. 3,007,833 thousand (2010: Rs. 2,370,309 thousand) respectively are guaranteed by the
Government of Pakistan. An Assets Liability Committee of the Bank meets periodically and ensures that the investments are made in an appropriate manner to mitigate any interest rate and liquidity risk.
Over 1 to 3
months
Over 3 to 6
months
Over 6
months to 1
year
Over 1 to 2
years
Upto 1
month

SME Bank Limited
Notes to the Financial Statements
For the year ended December 31, 2011
Mismatch of interest rate sensitive assets and liabilities
Effective Non-interest Yield/ bearingInterest Total financial
rate instrumentsOn-balance sheet financial instruments
AssetsCash and balances with treasury banks 228,062 - - - - - - - - - 228,062 Balances with other banks 3.45% 20,912 9,465 - - - - - - - - 11,447 Lending to financial institutions - - - - - - - - - - - Investments 11.53% 2,680,334 423,490 208,470 - 607,360 1,056,805 375,611 8,598 - - - Advances 12.50% 3,307,599 722,622 240,670 481,003 664,997 628,509 408,124 77,297 66,537 17,840 - Other assets 171,616 - - - - - - - - - 171,616
6,408,523 1,155,577 449,140 481,003 1,272,357 1,685,314 783,735 85,895 66,537 17,840 411,125 LiabilitiesBills payable 40,505 - - - - - - - - - 40,505 Borrowings 12.41% 1,437,604 582,628 808,175 20,824 20,393 5,584 - - - - - Deposits and other accounts 2,651,948 1,028,497 291,897 253,285 189,854 11,564 1,058 - - - 875,793 Sub-ordinated loans - - - - - - - - - - - Loan from the State Bank of Pakistan - - - - - - - - - - - Liabilities against assets subject to finance lease 14.52% 15,369 255 678 276 1,284 1,318 1,543 10,015 - - - Other liabilities 204,639 - - - - - - - - - 204,639
4,350,065 1,611,380 1,100,750 274,385 211,531 18,466 2,601 10,015 - - 1,120,937
On-balance sheet gap 2,058,458 (455,803) (651,610) 206,618 1,060,826 1,666,848 781,134 75,880 66,537 17,840 (709,812)
Off-balance sheet financial instruments
Commitments to extend credit 145,050 145,050 - - - - - - - - -
Off-balance sheet gap 145,050 145,050 - - - - - - - - -
Total Yield/ Interest Risk Sensitivity Gap (600,853) (651,610) 206,618 1,060,826 1,666,848 781,134 75,880 66,537 17,840 -
Cumulative Yield/ Interest Risk Sensitivity Gap (600,853) (1,252,462) (1,045,843) 14,983 1,681,831 2,462,965 2,538,845 2,605,382 2,623,222 -
Reconciliation of assets and liabilities exposed to yield/ interest rate risk with total assets and liabilities
(Rupees '000) (Rupees '000)
Total financial assets as per note 41.2.3 6,408,523 Total financial liabilities as per note 41.2.3 4,350,065 Add non-financial assets: Add non-financial liabilities: Operating fixed assets 132,586 Other liabilities 158,756 Deferred tax assets - Other assets 91,360 Balance as per Balance Sheet 6,632,469 Balance as per Balance Sheet 4,508,821
Yield risk is the risk of decline in earnings due to adverse movement of the yield curve.
Interest rate risk
Over 2 to 3
years
Over 3 to 5
years
Over 5 to 10
years
Above 10
years
(Rupees in '000)
Interest rate risk is the risk that the value of financial instrument will fluctuate due to changes in the market interest rates. Out of total financial assets of Rs. 6,408,523 thousand (2009: Rs. 5,889,940 thousand), the financial assets which
were subject to interest rate risk amounted to Rs. 5,997,398 thousand (2009: Rs. 5,521,523 thousand). Investments and other assets amounting to Rs. 2,370,309 thousand (2009: Rs. 2,411,238 thousand) respectively are guaranteed by the
Government of Pakistan. An Assets Liability Committee of the Bank meets periodically and ensures that the investments are made in an appropriate manner to mitigate any interest rate and liquidity risk.
2010Exposed to Yield/Interest risk
Upto 1
month
Over 1 to 3
months
Over 3 to 6
months
Over 6
months to 1
year
Over 1 to 2
years

SME Bank LimitedNotes to the Consolidated Financial StatementsFor the year ended December 31, 2011
40.3 Liquidity Risk
40.3.1 Maturities of Assets and Liabilities
Over 1 Over 3 Over 6 Over 1 Over 2 Over 3 Over 5Upto 1 to 3 to 6 months to 1 to 2 to 3 to 5 to 10 Above
Total month months months year years years years years 10 years (Rupees in '000)
Assets Cash and balances with treasury banks 214,655 188,879 4,675 - - - - - 21,101 - Balances with other banks 9,865 7,551 979 428 180 206 - - 521 - Lending to financial institutions 800,000 400,000 400,000 - - - - - - - Investments 3,027,667 153,051 509,112 759,300 1,203,638 393,811 6,215 - 2,540 - Advances 3,349,078 936,796 226,773 698,761 674,215 412,593 198,025 119,484 67,277 15,154 Operating fixed assets 135,321 1,404 2,611 3,755 6,632 11,356 9,324 6,039 4,156 90,044 Deferred tax assets - - - - - - - - - - Other assets 220,602 65,720 7,066 2,801 914 54 8,470 180 135,397 -
7,757,188 1,753,401 1,151,216 1,465,045 1,885,579 818,020 222,034 125,703 230,992 105,198
Liabilities Bills payable 183,863 183,863 - - - - - - - -
Borrowings 2,171,669 1,394,613 692,407 8,971 21,845 33,829 8,054 11,950 - -
Deposits and other accounts 2,999,192 1,036,907 296,882 485,157 338,509 163,998 43,200 2,150 632,389 -
Sub-ordinated loans - - - - - - - - - -
Liabilities against assets subject to finance lease 16,013 296 596 613 975 2,529 11,004 - - - Deferred tax liabilities - - - - - - - - - - Other liabilities 388,127 237,570 1,593 2,709 2,261 52 - - 143,942 -
5,758,864 2,853,249 991,478 497,450 363,590 200,408 62,258 14,100 776,331 -
Net assets 1,998,324 (1,099,848) 159,738 967,595 1,521,989 617,612 159,776 111,603 (545,339) 105,198
Share capital 2,392,507 Reserves 234,660 Unappropriated profit (650,596) Non-controlling interest 69,693 Deficit on revaluation of assets (47,940)
1,998,324
40.4 Operational Risk
Operational risk is the risk of loss resulting from inadequate or failed internal processes, people and system or from external events.
Liquidity risk reflects an enterprise's inability in raising funds to meet commitments. In order to avoid liquidity risk, the Bank has a policy to maintain sufficient liquidity. To closely
watch liquidity position, the Assets Liability Committee meets periodically to ensure that adequate liquidity is maintained to meet any future financial obligation.
Operational risks are managed through Bank-wide or line of business specific policies and procedures, controls and monitoring tools. Examples of these include personnel
management practices, data reconciliation processes, fraud management units, transaction processing monitoring and analysis and business continuity planning.
2011

SME Bank LimitedNotes to the Financial StatementsFor the year ended December 31, 2011
Over 1 Over 3 Over 6 Over 1 Over 2 Over 3 Over 5Upto 1 to 3 to 6 months to 1 to 2 to 3 to 5 to 10 Above
Total month months months year years years years years 10 years (Rupees in '000)
Assets Cash and balances with treasury banks 228,062 203,035 4,539 - - - - - 20,488 - Balances with other banks 20,912 16,884 1,704 745 313 359 - - 907 - Lending to financial institutions - - - - - - - - - - Investments 2,680,334 423,490 208,470 - 607,360 1,056,805 375,611 8,598 - Advances 3,307,599 722,622 240,670 481,003 664,997 628,509 408,124 77,297 66,537 17,840 Operating fixed assets 132,586 1,378 2,558 3,679 6,497 11,126 9,135 5,917 4,072 88,224 Deferred tax assets - - - - - - - - - - Other assets 262,976 54,983 8,188 4,487 183 - 818 1,133 193,184 -
6,632,469 1,422,392 466,129 489,914 1,279,350 1,696,799 793,688 92,945 285,188 106,064
Liabilities Bills payable 40,505 40,505 - - - - - - - -
Borrowings 1,437,604 582,628 808,175 20,824 20,393 5,584 - - - -
Deposits and other accounts 2,651,948 1,494,162 305,969 344,898 214,746 120,713 171,460 - - -
Sub-ordinated loans - - - - - - - - - -
Liabilities against assets subject - to finance lease 15,369 255 678 276 1,284 1,318 1,543 10,015 - - Deferred tax liabilities - - - - - - - - - - Other liabilities 363,395 218,816 1,362 3,947 2,247 56 - - 136,967 -
4,508,821 2,336,366 1,116,184 369,945 238,670 127,671 173,003 10,015 136,967 -
Net assets 2,123,648 (913,974) (650,055) 119,969 1,040,680 1,569,128 620,685 82,930 148,221 106,064
Share capital 2,392,507 Share premium - Reserves 234,660 Unappropriated profit (442,362) Non-controlling interest 87,470 Deficit on revaluation of assets (148,627)
2,123,648
2010

SME Bank Limited
Notes to the Consolidated Financial Statements
For the year ended December 31, 2011
41. SMEBL Employees Empowerment Trust
The Scheme, developed in compliance with the stated GoP policy of empowerment of employees of
State Owned Enterprises need to be accounted for by the covered entities, including the Bank, under the
provisions of amended International Financial Reporting Standards 2 Share Based Payments (IFRS 2).
However, keeping in view the difficulties that may be faced by the entities covered under the Scheme, the
Securities & Exchange Commission of Pakistan on receiving representations from some of entities
covered under the Scheme and after having consulted the Institute of Chartered Accountants of Pakistan
vide their letter Ref: CAIDTS/PS&TAC/2011-2036 dated February 02, 2011 has granted exemption to
such entities from the application of IFRS 2 to the Scheme. However, had the exemption not been
granted, the staff costs of the Bank for the year would have been higher by Rs. 32.745 million (December
31, 2010: 32.745 million), net loss for the year before and after taxation would have been higher by Rs.
32.745 million (December 31, 2010: Rs. 32.745 million), unappropriated loss at the year end would have
been higher by Rs. 77.932 million (December 31, 2010: Rs. 45.188 million) and reserves would have been
higher by Rs. 77.93 million (December 31, 2010: Rs. 45.188 million), hence, there would have been no
impact on net equity. Further, loss per share would have been higher by Rs. 0.137 per share (December
31, 2010: Rs 0.137).
On August 14, 2009, the Government of Pakistan (GoP) launched Benazir Employees' Stock Option
Scheme ("the Scheme") for employees of certain State Owned Enterprises (SOEs) and non-State Owned
Enterprises where GoP holds significant investment (non-SOEs). The scheme is applicable to permanent
and contractual employees who were in employment of these entities on the date of launch of the
Scheme, subject to completion of five years vesting period by all contractual employees and by permanent
employees in certain instances.
The Scheme provides for a cash payment to employees on retirement or termination based on the price of
shares of respective entities. To administer this scheme, GoP shall transfer 12% of its investment in such
SOEs and non-SOEs to a Trust Fund to be created for the purpose by each of such entities. The eligible
employees would be allotted units by each Trust Fund in proportion to their respective length of service
and on retirement or termination such employees would be entitled to receive such amounts from Trust
Funds in exchange for the surrendered units as would be determined based on market price for listed
entities or breakup value for non-listed entities. The shares relating to the surrendered units would be
transferred back to GoP.
The scheme also provides that 50% of dividend related to shares transferred to the respective Trust Fund
would be distributed amongst the unit holder employees. The balance 50% dividend would be transferred
by the respective Trust Fund to the Central Revolving Fund managed by the Privatisation Commission of
Pakistan for payment to employees against surrendered units. The deficit, if any, in Trust Funds to meet
the re-purchase commitment would be met GoP.
Ministry of Finance (MOF) Government of Pakistan (GoP) executed a “Deed of Trust” on 10th day of
June 2010 for creating and regulating a trust known as the SMEBL Employees Empowerment Trust (the
trust) and vest the same in a Board of Trustees. According to Para 2 sub para (1b) of the Deed of Trust,
12% shares of the Bank out of the total shareholding of GoP are to be transferred by MOF to the trust.
Management has requested MOF for transfer of 12% shares out of the GoP shareholding in the Bank and
forward Share Transfer Deed duly signed by the competent authority. The Ministry of Finance (GoP) has
however not yet transferred its investment to the trust.

SME Bank Limited
Notes to the Consolidated Financial Statements
For the year ended December 31, 2011
42 DATE OF AUTHORIZATION
43 Figures have been rounded to the nearest thousand rupees unless otherwise stated.
_________________________
Chief Financial Officer
_________________________ ______________ _______________ ______________
President/ Chief Executive Director Director Director
These financial statements were authorized for issue by the Board of Directors of the Bank on___________,
2012.

Annex-I referred to Note 12.7 to these financial statements, Rs. In thousands
in terms of sub section 3 of section 33-A of the Banking Companies Ordinance 1962 the statement in respect of written off loans or any other financial relief of Rs. 500,000 or above allowed to:
1 M/s Shikarpuri Achar House Liaquat Ali Memon Haji Maula Bux Memon - 990 - 990 - 990 - 990
54400-1521093-3
2 Aftab Keryana Store Aftab Alam Muhammd Umar 4,495 1,154 64 5,713 - 1,352 - 1,352
34601-0830199-9
3 Mullah Kaithar Indsuties Muhammad Waris Abdul Majid 34,761 1,537 41 36,339 - 920 - 920
Noor Road, Badami Bagh, Lahore 35202-2927393-7
4 ANN&N Enterprises Nadira Sabah Ud Din Mian Sabah ud Din 2,998 814 68 3,880 837 837
1-Main Harbanspura, Mian Ameer ud Din Park, Tajpura, Lahore 35202-1746584-6
5 M/s Unique Paper Mart Ijaz Mehmood Sultan Mehmood Bhatti 2,499 959 62 3,520 - 860 953 1,813
5 Press Market, Amin Pur Bazar, Faisalabad. 33100-8946886-7
6 M/s Citi Electronics Ghulam Mustafa Khan Muhammad Idrees 856 150 472 1,478 149 427 576
Yakta Market, Haji Abad, Sheikhurpura Road, Faisalabad 33100-4535409-5
7 M/S CNS Enterprises Aziz Nawaz Khan Murad Wali Taj 292 310 - 602 292 303 - 595
Chinar Pasum Mastoj, Chitral 15202-0823012-9
8 M/S Chitral Tea Store Mujeeb Ullah Zeera Khan 270 349 - 619 270 342 - 612
Shahi Randa Shangoor, Chitral 15201-2501761-7
9 M/S Prince Photo Studio Aziz-ul-Mulk Izat-ul-Mulk 246 265 - 511 246 259 - 505
Zani Nafor Murkao, Chitral 15202-5735009-1
10 M/s Land Mark (Pvt) Ltd Amir Rehman Hidayat ur Rehman 3,843 520 6 4,369 3,843 535 31 4,409
Mohallah Malakhel, Barikot, Tesil & District Swat 15602-0358512-1
Inayat ur Rehman Amir Rehman
15602-0358511-5
Anees ur Rehman Amir Rehman
15602-0464959-3
Hidayat Sultana Rehman Amir Rehman
15602-0301249-0
Sultania Rehman Amir Rehman
15602-0301249-6
11 M/s Lala Zar Hotel Syed Abdul Haq Shah Haji Ghulam Hussain 5,841 935 141 6,916 1,971 628 - 2,599
Shah Hawili, Village Paral Geran, PO Kagan, Balakot, District 13101-8355469-3
Syed Moeenul Haq Shah Syed Abdul Haq Shah
13101-8451514-3
Syed Ibrahim Ahmed Shah Syed Abdul Haq Shah
13101-0512849-1
12 M/S Yousafzai CNG Arshad Khan Saadullah Khan 3,380 675 - 4,055 424 593 - 1,016
Zamen Abad, Mardan 16101-3206523-1
Amjid Ali Safdar Khan
16101-5954802-7
Mrs,Shaheen Zahoor Zahoor Muhammad
16101-8697490-8
13 Malik Jalil Ahmed Awan Malik Jalil Ahmed Awan Malik Nazar Hussain 732 886 - 1,618 - 891 - 891
House No O-672 E/1, Kartarpura, Rawaplinid 37405-0160118-1
14 Malik Amjad Nawaz Malik Amjad Nawaz Malik Rub Nawaz 3,500 812 55 4,367 - 934 - 934
H. No. 175, Moh Pir Bukhari Talagang Chakwal 37203-3785411-7
15 M/S Raka Poshi Sarfaraz Khan Muhammad Rafique 500 569 116 1,186 500 569 116 1,186
Mian Dum Swat 139-56-510660
16 Hazrat Malik Spare Parts Hazrat Malik Gul Pacha 264 292 - 556 264 292 - 556
Dinin Bazar Chitral 103-88-198687
17 Ali Rehman Jewelars Shop Ali Rehman Sherin Rehman 306 257 - 563 306 257 - 563
Sr.
No Father's/Husband's Name Name and Address of Borrower
Name of Individual/ Partner/Directors
(with NIC No.) Principal
Interest/
Mark-up
Outstanding Liabilities at beginning of year
Total Others
TOTAL Principal
written-off
Interest/ Mark-
up
written-off
Other
financial relief
provided

Annex-I referred to Note 12.7 to these financial statements, Rs. In thousands
in terms of sub section 3 of section 33-A of the Banking Companies Ordinance 1962 the statement in respect of written off loans or any other financial relief of Rs. 500,000 or above allowed to:
Sr.
No Father's/Husband's Name Name and Address of Borrower
Name of Individual/ Partner/Directors
(with NIC No.) Principal
Interest/
Mark-up
Outstanding Liabilities at beginning of year
Total Others
TOTAL Principal
written-off
Interest/ Mark-
up
written-off
Other
financial relief
provided
Sarafa Bazar mingora Swat 114-62-032257
18 Behram khan Cloth House Behram Khan Neroz Khan 400 300 - 700 400 300 - 700
Taj Chowk Mingora Swat 114-88-006501
19 Naseeb jan Karyana store Naseeb Jan Toorai 300 359 - 659 300 359 - 659
Bazar behrain Swat 116-90-213621
20 ALI General Store Muhammad Ali Falas 400 458 - 858 400 458 - 858
Pacha Bazar Bunir 115-74-276598
21 M/S Eagle Motel (Pvt) Ltd Naseem Mohammad Khan Fida Muhammad Khan 7,500 11,086 - 18,586 7,500 11,086 - 18,586
Village & Post Office Lund Khaur, Distt Mardan. 129-61-012570
Nadeem Mohammad Khan Fida Muhammad Khan
129-91-012572
Ms. Anila Naseem Fida Muhammad Khan
129-90-731572
Amir Mohammad Khan Nasim Muhammad Khan
129-87-012571
22 M/S Hotel Speed Bird (Pvt) Ltd Parveen Ara Salahuddin 1,202 209 9 1,420 1,202 209 9 1,420
Village & Post Office, Chamkani, Mohalla Yaseen Khal, 137-90-070965
23 M/S Istambol Silk Mills (Pvt) Ltd Haji Yaqoob Khan Haji Sultan Zareen 1,451 3,371 - 4,822 1,451 3,371 - 4,822
Mohalla Kutta, P.O. Saudu Sharif, Swat 114-48-107251
24 M/S Mangaltan Silk Mills (Pvt) Ltd Painda Mand Khan habib Khan 7,000 10,579 5 17,584 7,000 10,579 5 17,584
165-H, Phase II, Hayatabad Peshawar. 114-88-297044
Seraj Noor Khan Awal Noor Khan
139-88-345615
25 M/S Meyva Fruit Processing (Pvt) Ltd Nowsherwan Haji Anbar Khan 838 1,373 21 2,232 838 1,373 21 2,232
P.O. KHWAZA KHELA, DISTT. SWAT. NWFP. 116-55-047119
Iftikhar Ahmed Sardar Bahadar Khan
136-52-040224
26 M/S Golden Textile Mills (Pvt) Ltd Muhammad Ashraf ShabB Din Ch. 4,319 3,871 122 8,312 4,319 3,871 122 8,312
G.T. ROAD QAMBER, MINGORA-SWAT. 271-58-033868
habib-Ur-Rehman Muhammad Ismail
271-55-133293
27 M/S Malakand Food Industries (Pvt) Ltd. Shahnza Miftah Jamal-Ud-Din 8,500 8,024 - 16,524 8,500 8,024 - 16,524
College Road Village Thana, Malakand Agency 138-89-581902
Jamaluddin Miftah Mian Miftahuddin
516-87-347106
Ulfat Hisham Mian Hashamuddin
117-52-279915
Total 96,693 51,104 1,183 148,980 40,026 50,341 1,685 92,052