
Detection of synovitis in the hands of patients with rheumatologic disorders: Diagnostic performance...
10
ARTHRITIS & RHEUMATISM Vol. 64, No. 8, August 2012, pp 2489–2498 DOI 10.1002/art.34467 © 2012, American College of Rheumatology Detection of Synovitis in the Hands of Patients With Rheumatologic Disorders Diagnostic Performance of Optical Imaging in Comparison With Magnetic Resonance Imaging Reinhard Meier, 1 Klaus Thu ¨rmel, 1 Philipp Moog, 1 Peter B. Noe ¨l, 1 Carmen Ahari, 1 Matti Sievert, 1 Franziska Dorn, 2 Simone Waldt, 1 Christoph Schaeffeler, 1 Daniel Golovko, 3 Bernhard Haller, 1 Carl Ganter, 1 Sabine Weckbach, 4 Klaus Woertler, 1 and Ernst J. Rummeny 1 Objective. To prospectively compare an indocya- nine green (ICG)–enhanced optical imaging system with contrast-enhanced magnetic resonance imaging (MRI) for the detection of synovitis in the hands of patients with rheumatologic disorders. Methods. Forty-five patients (30 women [67%], mean SD age 52.6 13.4 years) in whom there was a clinical suspicion of an inflammatory arthropathy were examined with a commercially available device for ICG- enhanced optical imaging as well as by contrast- enhanced 3T MRI as the standard of reference. Three independent readers graded the degree of synovitis in the carpal, metacarpophalangeal, proximal interpha- langeal, and distal interphalangeal joints of both hands (1,350 joints), using a 4-point ordinate scale (0 no synovitis, 1 mild, 2 moderate, 3 severe). Statis- tical analyses were performed using a logistic general- ized estimating equation approach. Agreement of opti- cal imaging ratings made by the different readers was estimated with a weighted kappa coefficient. Results. When MRI was used as the standard of reference, optical imaging showed a sensitivity of 39.6% (95% confidence interval [95% CI] 31.1–48.7%), a spec- ificity of 85.2% (95% CI 79.5–89.5%), and accuracy of 67.0% (95% CI 61.4–72.1%) for the detection of synovitis in patients with arthritis. Diagnostic accuracy was es- pecially limited in the setting of mild synovitis, while it was substantially better in patients with severely in- flamed joints. Moderate interreader and intrareader agreement was observed. Conclusion. The evaluated ICG-enhanced optical imaging system showed limitations for the detection of inflamed joints of the hand in comparison with MRI. Rheumatologic disorders are a heterogeneous group of diseases with a high prevalence of 22% (1). Even with the advent of remarkable novel therapeutics, inflammatory arthritis continues to be a common cause of disability and is still associated with substantial activ- ity limitation, reduced quality of life, and high health care costs (1). Rheumatoid arthritis (RA) is the most common chronic inflammatory joint disease, with a prevalence of 0.5–1.0% (2,3). The present strategy of early and aggressive treatment is based on recognition of a “window of opportunity” in early disease, during which initiation of effective therapy may substantially improve short-term and long-term outcomes (4–6). This knowl- edge has led to a growing need and search for sensitive and specific tools for the early diagnosis of inflammatory arthritides such as RA (4–6). Conventional radiography is still widely used for detecting bone damage and monitoring disease progres- sion (7). The marked disadvantage of this method is its 1 Reinhard Meier, MD, Klaus Thu ¨rmel, MD, Philipp Moog, MD, Peter B. Noe ¨l, PhD, Carmen Ahari, Matti Sievert, Simone Waldt, MD, Christoph Schaeffeler, MD, Bernhard Haller, Dipl Stat (Master of Science), Carl Ganter, PhD, Klaus Woertler, MD, Ernst J. Rum- meny, MD: Technische Universita ¨t Mu ¨nchen, Munich, Germany; 2 Franziska Dorn, MD: Technische Universita ¨t Mu ¨nchen, Munich, Germany, and University Hospital of Cologne, Cologne, Germany; 3 Daniel Golovko, MD: University of Colorado, Denver; 4 Sabine Weckbach, MD: Ludwig-Maximilians University, Munich, Germany. Drs. Meier and Thu ¨rmel contributed equally to this work. Address correspondence to Reinhard Meier, MD, Depart- ment of Radiology, Klinikum rechts der Isar, Technische Universita ¨t Mu ¨nchen, Ismaningerstrasse 22, 81675 Munich, Germany. E-mail: [email protected]. Submitted for publication December 28, 2011; accepted in revised form March 6, 2012. 2489
-
Upload
independent -
Category
Documents
-
view
0 -
download
0
Transcript of Detection of synovitis in the hands of patients with rheumatologic disorders: Diagnostic performance...

ARTHRITIS & RHEUMATISMVol. 64, No. 8, August 2012, pp 2489–2498DOI 10.1002/art.34467© 2012, American College of Rheumatology
Detection of Synovitis in the Hands of Patients WithRheumatologic Disorders
Diagnostic Performance of Optical Imaging in Comparison WithMagnetic Resonance Imaging
Reinhard Meier,1 Klaus Thurmel,1 Philipp Moog,1 Peter B. Noel,1 Carmen Ahari,1
Matti Sievert,1 Franziska Dorn,2 Simone Waldt,1 Christoph Schaeffeler,1 Daniel Golovko,3
Bernhard Haller,1 Carl Ganter,1 Sabine Weckbach,4 Klaus Woertler,1 and Ernst J. Rummeny1
Objective. To prospectively compare an indocya-nine green (ICG)–enhanced optical imaging system withcontrast-enhanced magnetic resonance imaging (MRI)for the detection of synovitis in the hands of patientswith rheumatologic disorders.
Methods. Forty-five patients (30 women [67%],mean � SD age 52.6 � 13.4 years) in whom there was aclinical suspicion of an inflammatory arthropathy wereexamined with a commercially available device for ICG-enhanced optical imaging as well as by contrast-enhanced 3T MRI as the standard of reference. Threeindependent readers graded the degree of synovitis inthe carpal, metacarpophalangeal, proximal interpha-langeal, and distal interphalangeal joints of both hands(1,350 joints), using a 4-point ordinate scale (0 � nosynovitis, 1 � mild, 2 � moderate, 3 � severe). Statis-tical analyses were performed using a logistic general-ized estimating equation approach. Agreement of opti-cal imaging ratings made by the different readers wasestimated with a weighted kappa coefficient.
Results. When MRI was used as the standard ofreference, optical imaging showed a sensitivity of 39.6%(95% confidence interval [95% CI] 31.1–48.7%), a spec-ificity of 85.2% (95% CI 79.5–89.5%), and accuracy of67.0% (95% CI 61.4–72.1%) for the detection of synovitisin patients with arthritis. Diagnostic accuracy was es-pecially limited in the setting of mild synovitis, while itwas substantially better in patients with severely in-flamed joints. Moderate interreader and intrareaderagreement was observed.
Conclusion. The evaluated ICG-enhanced opticalimaging system showed limitations for the detection ofinflamed joints of the hand in comparison with MRI.
Rheumatologic disorders are a heterogeneousgroup of diseases with a high prevalence of �22% (1).Even with the advent of remarkable novel therapeutics,inflammatory arthritis continues to be a common causeof disability and is still associated with substantial activ-ity limitation, reduced quality of life, and high healthcare costs (1). Rheumatoid arthritis (RA) is the mostcommon chronic inflammatory joint disease, with aprevalence of 0.5–1.0% (2,3). The present strategy ofearly and aggressive treatment is based on recognition ofa “window of opportunity” in early disease, during whichinitiation of effective therapy may substantially improveshort-term and long-term outcomes (4–6). This knowl-edge has led to a growing need and search for sensitiveand specific tools for the early diagnosis of inflammatoryarthritides such as RA (4–6).
Conventional radiography is still widely used fordetecting bone damage and monitoring disease progres-sion (7). The marked disadvantage of this method is its
1Reinhard Meier, MD, Klaus Thurmel, MD, Philipp Moog,MD, Peter B. Noel, PhD, Carmen Ahari, Matti Sievert, Simone Waldt,MD, Christoph Schaeffeler, MD, Bernhard Haller, Dipl Stat (Masterof Science), Carl Ganter, PhD, Klaus Woertler, MD, Ernst J. Rum-meny, MD: Technische Universitat Munchen, Munich, Germany;2Franziska Dorn, MD: Technische Universitat Munchen, Munich,Germany, and University Hospital of Cologne, Cologne, Germany;3Daniel Golovko, MD: University of Colorado, Denver; 4SabineWeckbach, MD: Ludwig-Maximilians University, Munich, Germany.
Drs. Meier and Thurmel contributed equally to this work.Address correspondence to Reinhard Meier, MD, Depart-
ment of Radiology, Klinikum rechts der Isar, Technische UniversitatMunchen, Ismaningerstrasse 22, 81675 Munich, Germany. E-mail:[email protected].
Submitted for publication December 28, 2011; accepted inrevised form March 6, 2012.
2489

lack of sensitivity for detecting early erosive changes (7).Ultrasonography and magnetic resonance imaging (MRI)are both very sensitive and specific methods for thedetection of early changes in inflammatory arthritis(8,9). However, ultrasonography is time-consuming,operator dependent, and may not detect early arthritis(8–10). MRI provides high sensitivity for the diagnosisof early synovitis and joint effusions but is limited bylong examination times and high costs (11).
Optical imaging is a relatively new, noninvasive,and nonionizing imaging modality with fast image acqui-sition times (12,13). The major drawback of opticalimaging is the limited tissue penetration of light; how-ever, because inflammatory arthropathies typically af-fect the small joints of the hands and feet, this is notnecessarily a significant limitation for our application.
Various approaches for detecting experimentalarthritis using optical imaging have proven to be suitable(12–19). Early hyperemia of inflamed joints could bediagnosed by recording scattering and absorption pat-terns of light transmitted through inflamed finger joints.In a clinical study, this laser-based technique was shownto provide information about the inflammation status offinger joints with sensitivity and specificity of 80% and89%, respectively (20); however, imaging was limited toa single finger, and image processing times were long.Among fluorescent dyes, the nonspecific, small molecu-lar fluorescent substance indocyanine green (ICG) ap-pears to be the most promising for this application,because it has been shown to enhance imaging of inflamedjoints (14,15), and, more importantly, it is approved bythe US Food and Drug Administration (FDA).
The results of previous studies showed that opti-cal imaging allows, in principle, the detection of in-flamed tissue in animal models as well as in humans(12–19). The purpose of this study was to prospectivelycompare an ICG-enhanced optical imaging system withcontrast-enhanced 3T MRI for the detection of synovitisin the hands of patients with rheumatologic disorders.To the best of our knowledge, this is the first larger-scaleinvestigation of the performance of a clinical ICG-enhanced optical imaging system for imaging of synovitisin arthritic hands in comparison with 3T MRI.
PATIENTS AND METHODS
This study was approved by the local ethics committeeat our institution (Technische Universitat Munchen, Germany)prior to commencement of the study and was conductedaccording to the principles of the Declaration of Helsinki, suchthat all patients provided written informed consent beforeparticipating.
Patients. A total of 45 patients in whom there was aclinical suspicion of an inflammatory joint disease were in-cluded in this prospective study. The patients were recruitedfrom January 2010 to October 2010 through the Departmentof Rheumatology at our hospital. Inclusion criteria for thestudy population were �1 tender and/or swollen joint amongthe carpal, metacarpophalangeal (MCP), proximal interpha-langeal (PIP), and distal interphalangeal (DIP) joints of bothhands, symptom duration between 6 weeks and 24 months, andwillingness to participate. Exclusion criteria were pregnancy;renal failure; known allergy against iodine, ICG, or gadolin-ium; and other contraindications to MRI such as the presenceof metallic fragments in the body, the presence of magneticallyactivated implanted devices, or claustrophobia. Physical exam-ination, optical imaging, and MRI were performed within 1week of inclusion in the study.
Clinical examination. The demographic and clinicalcharacteristics of the patients were recorded; these includedsex, age, height, weight, disease duration, duration of morningstiffness, joint deformities of any kind, and ongoing systemicinfectious disease. Physical examination of each joint wasperformed by bimanual palpation, by 2 rheumatologists (KTand PM) with longstanding clinical experience in rheumatol-ogy. The numbers of swollen and tender joints were recorded.Additionally, all joints were clinically scored for synovitis (0 �no synovitis, as defined by the absence of both tenderness andswelling or the absence of either tenderness or swelling in thejoint, and 1 � synovitis, as defined by swelling and tendernessin the joint) by 2 rheumatologists (KT and PM) in consensusand the results were compared with MRI as the standard ofreference. The serum C-reactive protein (CRP) level anderythrocyte sedimentation rate (ESR) were measured in allpatients. At the end of the clinical examination, the followingclinical diagnoses were made by the rheumatologists (KT andPM): RA, undifferentiated arthritis, osteoarthritis (OA), pso-riatic arthritis (PsA), spondylarthritis (SpA), and connectivetissue disorder.
Optical imaging contrast media. ICG is a nontargetedhydrophilic anionic near-infrared fluorescent dye that has beenapproved for a variety of clinical applications (21–23). It hasbeen used for bedside measurement of blood volume (24),tumor detection (25–28), and, more recently, to visualize jointinflammation in preclinical (14,15) and clinical settings (16).The absorption and emission maximum wavelengths for ICGare �805 nm and �830 nm, respectively (29). Within secondsafter intravenous injection, ICG reversibly binds to up to 98%of all plasma proteins without extravasating. The protein-bound compound is taken up by hepatocytes and excreted viabile fluids without entering the enterohepatic circle (30). ICG(Pulsion) dissolved in sterile water (total volume 1–2 ml) wasinjected as an intravenous bolus at a dose of 0.1 mg/kg bodyweight (time to inject 3 seconds).
Optical imaging system. We used a commerciallyavailable, near-infrared fluorescence imaging system (XiraliteX4; Mivenion). This optical imaging system allows for quicksequential capture of the fluorescence intensity signal from thehuman hand after excitation by light emitting diode (LED).Patients are positioned with their hands placed inside thedevice behind a screen, to prevent the entrance of ambientlight. Data acquisition with the optical imaging system wasperformed as follows: continuous illumination with LEDs at a
2490 MEIER ET AL
wavelength of 740 nm situated overhead was started. ICG wasinjected 10 seconds after the start of imaging; simultaneously,a cooled CCD camera behind optical filters of �800 nmcaptured images at 1 frame per second for a total time of 6minutes.
Magnetic resonance imaging. MRI was performedwith a Verio 3T MR scanner (Siemens) using a Flex Largeflexible surface coil (Siemens). Patients underwent scanningwhile in the prone position, with the hands outstretched inpraying position in order to scan both hands at once. Thefollowing MRI protocol was used.
1. Coronal fat-saturated intermediate-weighted turbo spin-echo (TSE) (repetition time [TR]/echo time [TE]4,880/38 msec, echo train length [ETL] 7, resolution0.49 � 0.49 � 2.5 mm3, field of view [FOV] 220 � 220mm2, slice 34 mm, gap 0.25 mm, scan time 3 minutes and56 seconds).
2. Coronal T1-weighted TSE (TR/TE 790/12 msec, ETL 3,resolution 0.43 � 0.43 � 2.5 mm3, FOV 220 � 220 mm2,slice 34 mm, gap 0.25 mm, scan time 3 minutes and 19seconds).
3. Consecutive dynamic scans (n � 139) with a coronalT1-weighted 3-dimensional (3-D) radio frequency–spoiled gradient echo (TR/TE 3.83/1.34 msec, flip angle25°, resolution 1.0 � 0.86 � 2.5 mm3, FOV 185 � 220 �45 mm3, scan time 5 minutes and 39 seconds). For bettertemporal resolution (2.4 seconds), sparse sampling ofouter K-space regions was applied (TWIST [time-resolved angiography with stochastic trajectories]; fullysampled central region 33%, sampling of outer region50%). Automated injection of 0.02 ml/kg gadopentetatedimeglumine (Magnograf; Schering) was started after thethird acquisition, at 2 ml/second. At the end of the MRprotocol after the TWIST sequence, postcontrast imageswere acquired.
4. Transverse T1-weighted fat-saturated TSE (TR/TE1,160/13 msec, ETL 3, resolution 0.39 � 0.39 � 3 mm3,FOV 139 � 150 mm2, slice 36 mm, gap 0.6 mm, scan time4 minutes and 42 seconds).
5. Coronal T1-weighted fat-saturated TSE (TR/TE 1,070/12msec, ETL 3, resolution 0.43 � 0.43 � 2.5 mm3, FOV220 � 220 mm2, slice 34 mm, gap 0.25 mm, scan time 4minutes and 29 seconds).
All sequences were acquired with parallel imaging(GRAPPA [generalized autocalibrating partially parallel ac-quisitions], acceleration factor 2).
Image evaluation. Thirty joints in both hands (carpal,MCP, PIP, and DIP joints) of 45 patients (1,350 evaluationsper reader) were scored. For optical imaging, joints werescored independently by 3 radiologists (FD, CS, and SiW, eachof whom had 6–9 months of optical imaging experience andadditional optical imaging evaluation training by the manufac-turer). For MRI, joints were scored by 3 radiologists inconsensus (RM [4 years of MRI experience], SaW [9 years ofMRI experience], and KW [16 years of MRI experience]). Arepeated reading of the optical images 4 weeks after the firstreading was performed by one reader (CS), with rearrange-ment of the image sets for intrareader agreement estimation.The readers performed scoring of optical imaging and MRI
without knowledge of the clinical assessment and were blindedto the patient name and the results of MRI or optical imaging.
Images obtained by optical imaging and MRI wereevaluated in random order using the semiquantitative assess-ment system suggested by the OMERACT (Outcome Mea-sures in Rheumatology) MRI group (31). Using this method,synovitis is scored on a scale of 0–3 in each joint (0 � nosynovitis, 1 � mild arthritis, 2 � moderate arthritis, 3 � severearthritis). On MRI, synovitis was defined based on the OMER-ACT RAMRIS (Rheumatoid Arthritis Magnetic ResonanceImaging Scoring) definition (31). On optical imaging, synovitiswas defined as an area of focal hyperperfusion related to ajoint. For the evaluation of optical imaging, the softwareprovided by the supplier was used (XiraView Software, version3.5c; Mivenion). For image demonstration (Figures 1–3), wepresent maximum-intensity projections of the stack of 360optical images, which were obtained using the software ImageJAVersion 1.43h (National Institutes of Health). Bone erosions,bone edema, and tenosynovitis identified by MRI were addi-tionally scored using the OMERACT RAMRIS and PsAMRIS(psoriatic arthritis magnetic resonance imaging scoring) sys-tems (31,32). Using this method, bone edema was scored on ascale of 0–3 according to the volume of edema compared withthe assessed bone volume, and bone erosion was scored on ascale of 0–10 based on the proportion of eroded bone com-pared with the assessed bone volume in each individual bone(31). Tenosynovitis was scored on a scale of 0–3 in 10 differentcompartments of the extensor and flexor tendon areas (32).
Statistical analysis. True-positive, true-negative, false-positive, and false-negative values for detection of synovitiswere determined for all optical images as well as for clinicalexaminations, using MRI as the diagnostic standard of refer-ence. Diagnostic measures were estimated using a logisticgeneralized estimating equation (GEE) approach (33) to ac-count for correlated observations caused by investigation ofseveral joints in the same patients and by repeated assessmentof the same images by multiple readers. In the GEE models,the patient was used as the subject variable, and joints, hand(left/right), and readers were used as within-subject variables.An exchangeable correlation structure was assumed for allmodels. For the estimation of sensitivity and specificity, binaryratings (0 � negative/1–3 � positive) were considered as thedependent variable, and the value of the gold standard (notdiseased/diseased) was considered as the independent variable(34). For assessment of the predictive values, the variableswere used vice versa. Accuracy was estimated in a modelwithout covariates, using the variable “agreement betweenrating and gold standard” as the dependent binary variable.The 95% confidence intervals (95% CIs) for relevant measuresconsidering the estimated correlation structure are presented.The method was used analogously for a separate estimation ofthe diagnostic measures for each joint. Due to the smallersample size, separate estimations of sensitivity and specificityfor each joint assessed by each reader were conducted, usingthe method proposed by Drake and Levine (35), consideringthe correlation between the left and right hands in eachpatient.
To evaluate agreement of optical imaging ratings madeby different readers, a weighted kappa coefficient (36) basedon the ordinal ratings (scale 0–3) was estimated for each pairof readers. The mean, minimum, and maximum of the pairwise
OPTICAL IMAGING OF SYNOVITIS 2491
kappa coefficients and the proportions of concordant dichot-omized ratings (not diseased � 0/diseased �1) were presented.Intrareader agreement was estimated analogously using re-peated ratings made by the same investigator (CS). Kappavalues were estimated as a measure of agreement between theoptical imaging findings for each reader and clinical investiga-tion, accounting for the amount of agreement expected bychance. Statistical analyses were performed using R programstatistical software (R Foundation) with the additional libraries“vcd” (37) and “gee” (38).
RESULTS
Patients and clinical examination. We examineda total of 1,350 individual joints in 45 patients (30women [67%], mean � SD age 52.6 � 13.4 years). Noadverse events were observed in these 45 patients afterinjection of ICG or gadopentetate dimeglumine. Onaverage, patients had 3.3 (95% CI 2.2–4.5) swollen and7.5 (95% CI 5.5–9.5) tender joints. Among the patients,25 (56%) had RA, 9 (20%) had undifferentiated arthri-tis, 4 (9%) had OA, 3 (7%) had PsA, 3 (7%) had SpA,and 1 (2%) had a connective tissue disorder. The meanserum CRP level was 2.4 mg/dl (95% CI 1.5–3.2 mg/dl),
and the mean ESR (1 hour/2 hours) was 20/34 mm (95%CI 14/27–26/42).
When compared with MRI as the gold standard,clinical examination displayed a sensitivity of 27.4%(95% CI 20.4–35.7%), a specificity of 93.5% (95% CI87.4–96.8%), a positive predictive value of 79.2% (95%CI 64.2–89.1%), a negative predictive value of 61.5%(95% CI 55.9–66.8%), and accuracy of 63.3% (95% CI58.2–68.1%) for the detection of joint inflammation.The probability of concordant findings by optical imag-ing and clinical examination was estimated to be 71.5%(95% CI 66.8–75.7%). Kappa values of 0.12, 0.15, and0.19 were observed, indicating low agreement betweenoptical imaging findings and clinical examination.
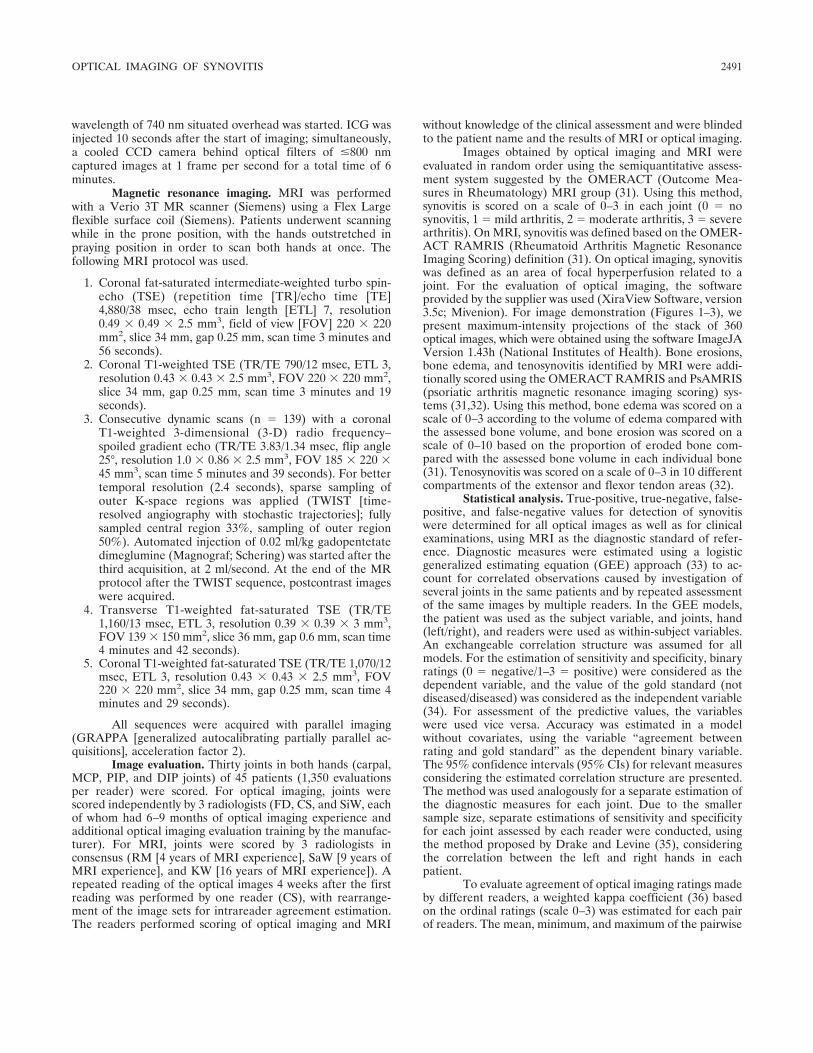
Qualitative optical imaging results. After injec-tion of ICG, an almost immediate increase in signalintensity was observed, which peaked �60 secondspostinjection and then slowly declined. After a 6-minuteobservation period, the signal intensity was �30% of themaximum intensity. Inflamed joints appeared with a10–100-fold greater signal intensity compared with thesurrounding, normal joints (Figures 1–3). Consistent
Figure 1. Indocyanin green–enhanced optical image (maximum-intensity projection) (a) and magnetic resonance images (d–f) of the right hand ofa 34-year-old woman who had pain in the metacarpophalangeal (MCP) and proximal interphalangeal (PIP) joints of both hands for 4 weeks and aclinical picture of seropositive polyarthritis (rheumatoid factor positive, anti–citrullinated protein antibody negative). The patient’s C-reactiveprotein level was 7.3 mg/dl, and the erythrocyte sedimentation rate (1 hour/2 hours) was 51/91 mm. The wrists, MCP joints, and PIP joints of bothhands were tender. Contrast-enhanced coronal (b) and transverse (d–f) T1-weighted fat-saturated turbo spin-echo images and coronalmaximum-intensity projection of dynamic TWIST (time-resolved angiography with stochastic trajectories) sequence (c) images are shown. Opticalimaging shows focal hyperperfusion, indicating synovitis, in the second and third distal MCP joints, the first interphalangeal (IP) joint, and the secondthrough fifth PIP and distal interphalangeal (DIP) joints. Magnetic resonance imaging (MRI) confirmed moderate-to-severe synovitis in the MCP(e), IP/PIP (d), and DIP (b and c) joints. In addition, MRI detected moderate synovitis in the carpal joints (f) that was not seen using optical imaging.
2492 MEIER ET AL

Figure 2. Indocyanin green–enhanced optical image (maximum-intensity projection) (a) and magnetic resonance images (d–f) of the left hand ofa 47-year-old woman with seropositive rheumatoid arthritis (rheumatoid factor positive and anti–citrullinated protein antibody positive). Thepatient’s C-reactive protein level was 0.3 mg/dl, and the erythrocyte sedimentation rate (1 hour/2 hours) was 21/41 mm. The most involved joint wasthe wrist of the left hand. Contrast-enhanced coronal (b) and transverse (d–f) T1-weighted fat-saturated turbo spin-echo images and coronalmaximum-intensity projection of the dynamic TWIST sequence (c) images are shown. Optical imaging shows mild hyperperfusion in the carpus andin the second through fourth PIP joints. MRI revealed severe erosive synovitis in the carpus (b, c, and f) and mild synovitis in the MCP (b and e)and first through fifth IP/PIP (d) joints. See Figure 1 for definitions.
Figure 3. Indocyanin green–enhanced optical image (maximum-intensity projection) (a) and magnetic resonance images (d–f) of the left hand ofa 46-year-old woman who had longstanding seronegative monarthritis of the third distal MCP joint of the left hand; she was not receiving systemictherapy. The patient’s C-reactive protein level was 0.2 mg/dl, and the erythrocyte sedimentation rate (1 hour/2 hours) was 11/30 mm. She reportedtenderness and swelling in the third distal MCP joint of her left hand. Contrast-enhanced coronal (b) and transverse (d–f) T1-weighted fat-saturatedturbo spin-echo and coronal maximum-intensity projection of the dynamic TWIST sequence (c) images are shown. Optical imaging shows focalhyperperfusion in the third distal MCP joint and mild hyperperfusion in the second through fourth PIP joints. MRI confirmed the presence of severesynovitis in the third distal MCP joint; additionally, mild synovitis could be detected in the carpal (f) and second through fourth MCP and PIP joints.See Figure 1 for definitions.
OPTICAL IMAGING OF SYNOVITIS 2493
hyperintensity was visualized in the distal phalanxaround the area of the nailbed as well as in the first DIPjoint.
Interreader and intrareader agreement. The pro-portions of concordant optical imaging ratings in apairwise comparison between readers were 79.0%,80.8%, and 83.0%. The mean weighted kappa coefficientfor pairwise assessment of interreader agreement was0.473. The minimum and maximum estimated kappavalues between pairs of readers were 0.411 and 0.554,respectively. For the carpal and MCP joints, agreementwas better (mean kappa values 0.332–0.656) than thatfor the PIP and DIP joints (mean kappa values 0.096–0.537). For intrareader agreement of repeated measure-ment by one reader (CS), a kappa coefficient of 0.507was estimated, and concordance was observed in 86.4%of the ratings. Thus, according to kappa values (39) andproportions of concordant ratings (40), interreader andintrareader agreement was moderate.
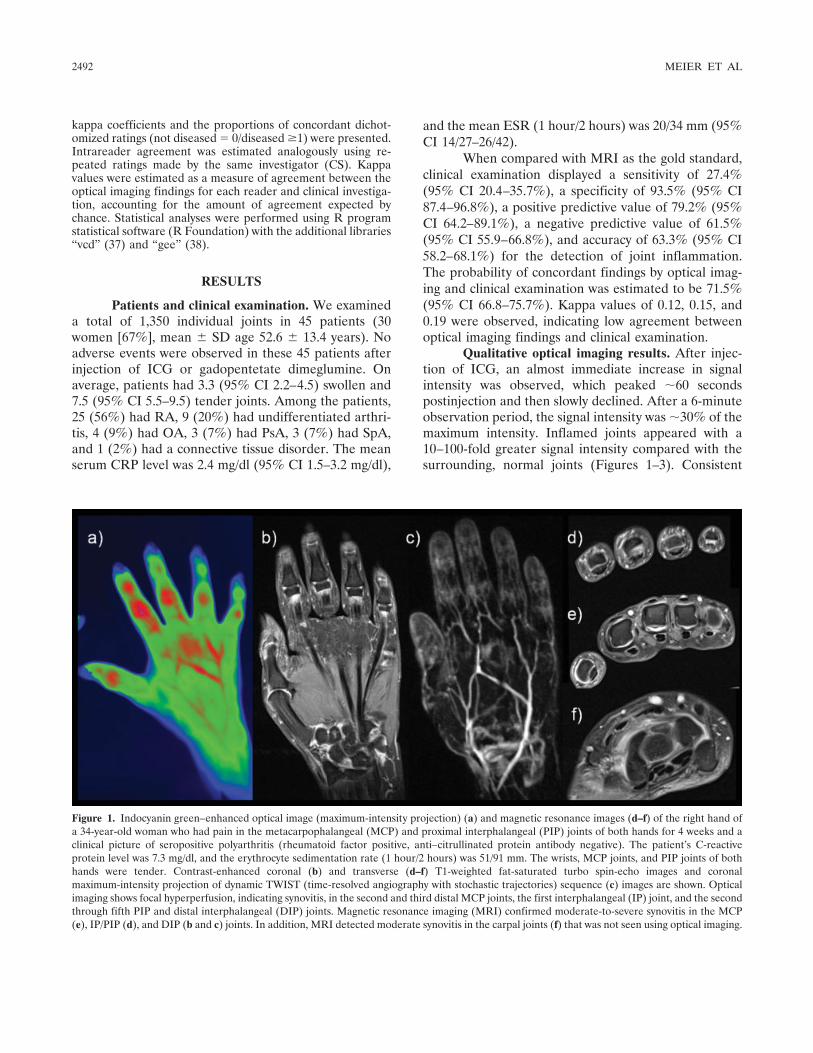
Optical imaging versus MRI. Of the 1,350 jointsof 45 patients evaluated, MRI showed 608 inflamedjoints (45.0%), among which 83.8% were mildly in-flamed, 14.1% were moderately inflamed, and 2.1%were severely inflamed. With optical imaging, an aver-age of 356 joints (23.3%) with synovitis were observed,among which 59.6% were mildly inflamed, 24.0% weremoderately inflamed, and 16.3% were severely inflamed.Using MRI as the standard of reference, optical imaginghad a sensitivity of 39.6% (95% CI 31.1–48.7%), aspecificity of 85.2% (95% CI 79.5–89.5%), a positivepredictive value of 68.7% (95% CI 57.7–77.9%), a
negative predictive value of 63.4% (95% CI 56.8–69.4%), and accuracy of 67.0% (95% CI 61.4–72.1%) forthe detection of synovitis in the hands of patients witharthritis (Table 1 and Figure 4). For optical imaging intotal, there were 777 true-positive, 1,936 true-negative,290 false-positive, and 1,047 false-negative ratingsamong 4,050 evaluations by 3 readers, using MRI as thestandard of reference.
Figure 4. Sensitivity and specificity of optical imaging for the detec-tion of joint inflammation, using magnetic resonance imaging as thestandard of reference. Each panel shows the data obtained by anindividual reader. Sensitivity and specificity values are presented onlyfor joints for which sufficient data were available (for sensitivity, �10diseased joints; for specificity, 10 healthy joints). C � carpal; MCP1 �first metacarpophalangeal joint; IP1 � first interphalangeal joint;PIP2 � second proximal interphalangeal joint; DIP2 � second distalinterphalangeal joint; 95% CI � 95% confidence interval.
Table 1. Sensitivity, specificity, predictive values, and accuracy of optical imaging compared with MRI*
JointNo. pos./no. neg.†
Sensitivity(95% CI)
Specificity(95% CI)
PPV(95% CI)
NPV(95% CI)
Accuracy(95% CI)
Carpal 85/5 40.8 (29.9–52.6) 60.3 (40.2–77.4) 94.3 (85.0–97.9) 5.5 (1.8–15.2) 44.8 (34.0–56.2)MCP1 84/6 25.1 (15.9–37.2) 59.0 (35.9–78.7) 89.2 (73.9–96.0) 5.9 (1.9–16.6) 31.1 (21.2–43.0)MCP2 82/8 38.0 (27.5–49.7) 72.8 (29.9–94.4) 92.3 (75.7–97.9) 9.5 (3.7–22.2) 41.5 (31.3–52.5)MCP3 78/12 41.8 (30.6–54.0) 97.6 (29.0–100) 95.6 (76.8–99.3) 18.0 (9.2–32.1) 45.2 (34.2–56.7)MCP4 71/19 25.5 (15.7–38.7) 96.2 (76.1–99.5) 95.8 (72.0–99.5) 24.9 (15.2–38.1) 41.9 (31.0–53.5)MCP5 70/20 33.4 (23.2–45.5) 92.6 (70.9–98.5) 92.3 (76.2–97.8) 27.2 (17.1–40.4) 47.0 (36.3–58.0)IP1 26/64 48.5 (33.1–64.2) 91.8 (86.4–95.2) 32.3 (19.0–51.0) 72.4 (58.9–82.8) 80.0 (71.2–86.6)PIP2 29/61 71.7 (54.5–84.3) 81.2 (72.2–87.7) 36.5 (23.8–51.4) 71.2 (57.6–81.8) 79.3 (71.2–85.5)PIP3 29/61 61.2 (42.7–77.0) 81.5 (73.1–87.8) 41.0 (27.2–56.4) 73.2 (60.6–83.0) 78.1 (70.0–84.6)PIP4 23/67 76.5 (57.8–88.6) 83.0 (73.5–89.7) 35.8 (21.9–52.7) 81.8 (69.1–90.0) 82.2 (74.6–87.9)PIP5 19/71 79.2 (54.4–92.4) 82.8 (72.9–89.6) 21.7 (12.1–35.8) 79.5 (65.9–88.6) 84.1 (75.8–89.9)DIP2 3/87 40.7 (29.1–53.5) 82.1 (73.5–88.4) 6.8 (2.2–18.8) 98.2 (94.5–99.5) 83.0 (75.0–88.8)DIP3 2/88 53.6 (46.3–60.7) 88.2 (81.1–92.9) 8.2 (2.0–28.5) 99.3 (96.4–99.9) 88.5 (81.8–93.0)DIP4 4/86 52.0 (20.7–81.8) 89.9 (83.3–93.9) 13.9 (3.4–42.4) 97.7 (92.3–99.3) 89.3 (82.9–93.4)DIP5 3/87 54.7 (18.8–86.3) 89.4 (83.3–93.4) 9.3 (1.6–38.9) 98.2 (93.2–99.5) 88.9 (82.6–93.1)
* Optical imaging was used to detect joint inflammation in both hands of 45 patients (1,350 joints). 95% CI � 95% confidence interval; PPV �positive predictive value; NPV � negative predictive value; MCP1 � first metacarpophalangeal joint; IP1 � first interphalangeal joint; PIP2 �second proximal interphalangeal joint; DIP2 � second distal interphalangeal joint.† Number of joints scored as inflamed (positive) or as not inflamed (negative) by magnetic resonance imaging (MRI).
2494 MEIER ET AL
Subgroup analysis. Carpal/MCP versus PIP/DIPjoints. When the carpal and MCP joints and the PIP andDIP joints were analyzed separately, the sensitivity andspecificity of optical imaging were 35.3% and 93.3%,respectively, for the carpal and MCP joints and 60.4%and 85.2%, respectively, for the PIP and DIP joints.
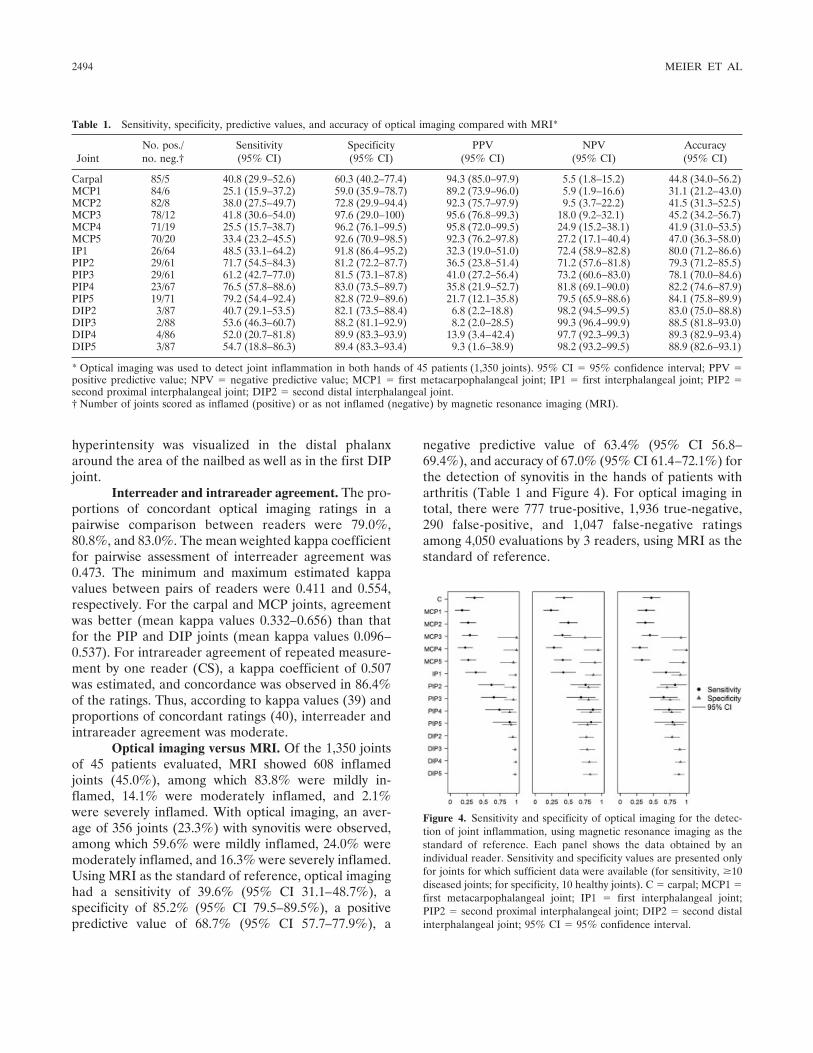
Diagnostic ability of optical imaging for the detec-tion of moderate-to-severe lesions. In order to determinethe diagnostic ability of the optical imaging system forthe detection of moderate-to-severe lesions as scored onMRI, 2 subgroups were established according to thefollowing disease classification: joints with an MRIsynovitis score of �2 (n � 98) or an MRI synovitis scoreof 3 (n � 11) were classified as inflamed. When com-paring the subgroup “MRI synovitis score �2” (n � 98)with the group with optical imaging scores of �2,sensitivity decreased slightly to 31.4% (95% CI 15.0–54.4%), while specificity and accuracy improved to91.3% (95% CI 86.8–94.4%) and 88.1% (95% CI 82.9–91.9%), respectively (Table 2). When comparing thesubgroup “MRI synovitis score � 3” (n � 11) with thegroup with optical imaging scores of 3, the sensitivity,specificity, and accuracy improved to 67.0% (95% CI25.1–92.5%), 96.2% (95% CI 93.8–97.7%), and 95.9%(95% CI 93.5–97.5%), respectively (Table 2).
Patients with RA. In the 750 joints of 25 patientswith a diagnosis of RA, optical imaging had a sensitivityof 42.5% (95% CI 30.6–55.3%), a specificity of 83.1%(95% CI 73.2–89.8%), a positive predictive value of69.6% (95% CI 53.3–82.2%), a negative predictive valueof 61.7% (95% CI 52.4–70.3%), and accuracy of 67.1%(95% CI 59.4–74.0%) for the detection of synovitis.
MRI of bone erosions, bone edema, and tenosyn-ovitis. The mean bone erosion score (possible total score300) was 8.78 (95% CI 6.0–11.5) and ranged from aminimum score of 0 to a maximum score of 35. Themean bone edema score (possible total score 90) was0.96 (95% CI 0.36–1.55) and ranged from a minimumscore of 0 to a maximum score of 10. The meantenosynovitis score (possible total score 30) was 4.5(95% CI 3.2–5.9) and ranged from a minimum score of0 to a maximum score of 19.
DISCUSSION
In this study, we demonstrated that the opticalimaging system detected synovitis in the hands of pa-tients with rheumatologic disorders with a sensitivity of39.6% (95% CI 31.1–48.7%) and a specificity of 85.2%(95% CI 79.5–89.5%) compared with MRI. When ana-lyzing only severe synovitis, optical imaging detectedsynovitis with an improved sensitivity of 67.0% (95% CI25.1–92.5%) and specificity of 96.2% (95% CI 93.8–97.7%). Thus, although optical imaging was able todetect severe synovitis in a limited number of joints, itwas unable to reliably detect joints with mild-to-moderate synovitis. This is certainly a limitation of thistechnique, which might be overcome in the future byfurther technical development. Furthermore, we areaware that by using MRI as the standard, we arecomparing optical imaging with an established imagingmodality associated with decades of clinical use andoptimization of imaging techniques and contrast agents.Increasing experience with optical imaging may lead toimprovements in interpretation and thus sensitivity.Adding optical imaging would appear to increase thevery low sensitivity of physical examination (27.4% [95%CI 20.4–35.7%) for the detection of inflamed joints; thelow accuracy of clinical evaluation was most probablyattributable to the available study population, with itsmany mildly inflamed joints.
The results for interreader and intrareader agree-ment suggest that the basic interpretation of opticalimages is moderately consistent among readers withdifferent medical experience. Further training and stan-dardization of grading schemes might improve inter-group reproducibility for assessing synovitis, e.g., formulticenter studies using optical imaging.
Our results are in contrast with those observed byWerner et al in a study comparing the diagnostic abilityof the Xiralite X4 optical imaging system to detectsynovitis with that of clinical examination, articularultrasonography, and 1.5T MRI (41). That study showed
Table 2. Sensitivity and specificity of OI for detecting inflammationcompared with MRI, according to synovitis scores*
No. pos./no. neg.†
Sensitivity(95% CI)
Specificity(95% CI)
MRI score �1 608/42OI score �1 39.6 (31.1–48.7) 85.2 (79.5–89.5)OI score �2 13.8 (10.8–17.6) 92.5 (87.6–95.5)OI score �3 5.6 (3.6–8.5) 97.0 (94.0–98.5)
MRI score �2 98/1,252OI score �1 50.0 (34.7–65.4) 75.6 (70.1–80.4)OI score �2 31.4 (15.0–54.4) 91.3 (86.8–94.4)OI score �3 13.4 (4.5–33.5) 96.7 (93.9–98.2)
MRI score � 3 11/1,339OI score �1 89.6 (57.9–98.2) 74.2 (68.7–79.0)OI score �2 83.1 (44.9–96.7) 90.0 (86.0–92.9)OI score �3 67.0 (25.1–92.5) 96.2 (93.8–97.7)
* 95% CI � 95% confidence interval; OI � optical imaging.† Number of joints scored as inflamed (positive) or as not inflamed(negative) by magnetic resonance imaging (MRI).
OPTICAL IMAGING OF SYNOVITIS 2495
high agreement rates for optical imaging and clinicalexamination, MRI, and ultrasonography. With MRIused as the standard of reference, the optical imagingsystem showed a sensitivity of 76% and a specificity of54% using different analysis parameters (41). Our re-sults do not support such a high correlation. It isconceivable that our use of high-field MRI (3T versus1.5T in the study by Werner et al) resulted in improveddetection of less severe joint inflammation not visible on1.5T MRI. However, when our findings for severedisease were compared with those reported by Werneret al, the results were consistent.
For this study, we used ICG as a contrast agentfor optical imaging. It is among the few fluorescent dyeswith FDA approval, albeit for nonimaging applications,and thus is currently the only choice for use in humantrials. Nevertheless, the nonspecific dye has numerouslimitations, because it is fluorescent only in its free andunbound state, but �98% of it is bound to plasmaproteins within seconds after injection. Other nonap-proved dyes have been used for the detection of arthritisin preclinical models (42). In particular, SIDAG is acarbocyanine dye similar to ICG but with highly hydro-philic properties. Only �10% of the dye binds to plasmaproteins, while the remaining 90% potentially is able toextravasate into tissue. SIDAG is eliminated via thekidneys and was shown to provide improved enhance-ment of arthritic joints in an animal model when com-pared with ICG (15). Additionally, targeted contrastagents may provide more specific enhancement of dis-eased joints. In a mouse model of preclinical arthritis, anear-infrared fluorescence-labeled folate probe wasshown to preferentially accumulate in activated macro-phages in arthritic joints (12). These contrast agents arenot FDA approved; however, the use of more special-ized contrast agents may aid in improving detection ofearly joint inflammation.
In addition to optimization of the contrast agent,improvement of sensitivity will be facilitated by enhanc-ing the design of imaging devices and using novelimaging methods. The optical imaging device we usedobtained images of the hands from above and thus didnot include information for the lateral or palmar aspectsof inflamed joints. A commercially available 3-D opticaltomography system has shown the response to disease-modifying antirheumatic drug treatment in an animalmodel of arthritis (43), and it would seem promising thatthe use of data sets obtained by 3-D imaging wouldincrease sensitivity in the clinical setting as well. Novelfluorescence imaging techniques such as fluorescencelifetime imaging and spectral imaging, if applied in the
macroscopic setting, may assist in better detecting fluo-rescent contrast agent and thus inflammation (44,45).
Optical imaging maintains several advantageswhen compared with other standard imaging modalities.MRI can provide highly detailed anatomic imaging butrequires long examination times and is costly. Ourdata-acquisition protocol obtained optical imaging dataover the course of 6 minutes, using a small-sized ma-chine. Ultrasonography has shown accuracy similar tothat of MRI in detecting synovitis, tendon pathologies,and bony erosions in finger joints and can be performedin the office setting (10). However, ultrasonographytypically displays interoperator variability, and, if manyjoints are to be assessed, examination times becomelengthy (46). Like MRI and ultrasonography, opticalimaging does not use ionizing radiation and displaysdevice acquisition and maintenance costs comparablewith those of lower-tier ultrasonography devices.
We acknowledge the limitations of our study,which assessed the sensitivity and specificity of theoptical imaging system at one time point. However, thesignificance of imaging in RA involves not only diagnosisbut also the monitoring of disease progression andtherapy. Although our results are still suboptimal in thecase of mild-to-moderate joint inflammation, the diag-nostic accuracy for assessing severe lesions is acceptablecompared with MRI. Because these lesions would prob-ably be chosen as marker lesions for response evalua-tions, optical imaging could be helpful for serial exami-nations to assess the response to targeted treatment withantirheumatic drugs. Thus, future studies will need toassess the value of the optical imaging system forlong-term monitoring of therapy. Another limitation,which is a fundamental difficulty in the design andinterpretation of imaging studies, is the absence of a“true” gold standard such as biopsy and histology for thedefinitive diagnosis of synovitis. The concern with usingMRI as the standard of reference might be the potentialfor false-positive or false-negative interpretations. How-ever, MRI is an established imaging method, and, if theimages are evaluated by experienced readers, it offershigh sensitivity and specificity for the detection ofsynovitis (8,9). Nevertheless, future studies will have tobe undertaken in healthy volunteers in order to excludefalse-positive or false-negative interpretations of resultsobtained by both MRI and optical imaging. Finally, thestudy was limited by the inhomogeneous distribution ofmany mildly inflamed joints and comparably low num-bers of moderately and severely inflamed joints.
In summary, our data demonstrated that theevaluated optical imaging system had limitations in
2496 MEIER ET AL

terms of the ability to detect synovitis in patients witharthritis of the hands in comparison with 3T MRI as thestandard of reference. Further optimizations will berequired before this imaging modality can be recom-mended as a diagnostic test for arthritis of the joints ofthe hand.
AUTHOR CONTRIBUTIONS
All authors were involved in drafting the article or revising itcritically for important intellectual content, and all authors approvedthe final version to be published. Dr. Meier had full access to all of thedata in the study and takes responsibility for the integrity of the dataand the accuracy of the data analysis.Study conception and design. Meier, Thurmel, Moog, Noel, Ahari,Sievert, Dorn, Waldt, Haller, Woertler, Rummeny.Acquisition of data. Meier, Thurmel, Moog, Noel, Ahari, Sievert,Dorn, Ganter.Analysis and interpretation of data. Meier, Thurmel, Moog, Noel,Ahari, Sievert, Dorn, Waldt, Schaeffeler, Golovko, Haller, Weckbach,Woertler.
REFERENCES
1. Prevalence of doctor-diagnosed arthritis and arthritis-attributableactivity limitation: United States, 2007-2009. MMWR Morb Mor-tal Wkly Rep 2010;59:1261–5.
2. Gabriel SE. The epidemiology of rheumatoid arthritis. Rheum DisClin North Am 2001;27:269–81.
3. Silman AJ, Pearson JE. Epidemiology and genetics of rheumatoidarthritis. Arthritis Res 2002;4 Suppl 3:S265–72.
4. Kim JM, Weisman MH. When does rheumatoid arthritis beginand why do we need to know? [review]. Arthritis Rheum 2000;43:473–84.
5. Quinn MA, Emery P. Window of opportunity in early rheumatoidarthritis: possibility of altering the disease process with earlyintervention. Clin Exp Rheumatol 2003;21:S154–7.
6. Wilke WS, Sweeney TJ, Calabrese LH. Early, aggressive therapyfor rheumatoid arthritis: concerns, descriptions, and estimate ofoutcome. Semin Arthritis Rheum 1993;23:26–41.
7. Backhaus M, Kamradt T, Sandrock D, Loreck D, Fritz J, Wolf KJ,et al. Arthritis of the finger joints: a comprehensive approachcomparing conventional radiography, scintigraphy, ultrasound,and contrast-enhanced magnetic resonance imaging. ArthritisRheum 1999;42:1232–45.
8. Terslev L, Torp-Pedersen S, Savnik A, von der Recke P, Qvist-gaard E, Danneskiold-Samsoe B, et al. Doppler ultrasound andmagnetic resonance imaging of synovial inflammation of the handin rheumatoid arthritis: a comparative study. Arthritis Rheum2003;48:2434–41.
9. Szkudlarek M, Klarlund M, Narvestad E, Court-Payen M, Strand-berg C, Jensen KE, et al. Ultrasonography of the metacarpophal-angeal and proximal interphalangeal joints in rheumatoid arthritis:a comparison with magnetic resonance imaging, conventionalradiography and clinical examination. Arthritis Res Ther 2006;8:R52.
10. Brown AK. Using ultrasonography to facilitate best practice indiagnosis and management of RA. Nat Rev Rheumatol 2009;5:698–706.
11. Wakefield RJ, O’Connor PJ, Conaghan PG, McGonagle D, Hen-sor EM, Gibbon WW, et al. Finger tendon disease in untreatedearly rheumatoid arthritis: a comparison of ultrasound and mag-netic resonance imaging. Arthritis Rheum 2007;57:1158–64.
12. Chen WT, Mahmood U, Weissleder R, Tung CH. Arthritis
imaging using a near-infrared fluorescence folate-targeted probe.Arthritis Res Ther 2005;7:R310–7.
13. Wunder A, Tung CH, Muller-Ladner U, Weissleder R, MahmoodU. In vivo imaging of protease activity in arthritis: a novelapproach for monitoring treatment response. Arthritis Rheum2004;50:2459–65.
14. Meier R, Krug C, Golovko D, Boddington S, Piontek G, RudeliusM, et al. Indocyanine green–enhanced imaging of antigen-inducedarthritis with an integrated optical imaging/radiography system.Arthritis Rheum 2010;62:2322–7.
15. Fischer T, Gemeinhardt I, Wagner S, Stieglitz DV, Schnorr J,Hermann KG, et al. Assessment of unspecific near-infrared dyes inlaser-induced fluorescence imaging of experimental arthritis. AcadRadiol 2006;13:4–13.
16. Fischer T, Ebert B, Voigt J, Macdonald R, Schneider U, ThomasA, et al. Detection of rheumatoid arthritis using non-specificcontrast enhanced fluorescence imaging. Acad Radiol 2010;17:375–81.
17. Hansch A, Frey O, Hilger I, Sauner D, Haas M, Schmidt D, et al.Diagnosis of arthritis using near-infrared fluorochrome Cy5.5.Invest Radiol 2004;39:626–32.
18. Hansch A, Frey O, Sauner D, Hilger I, Haas M, Malich A, et al. Invivo imaging of experimental arthritis with near-infrared fluores-cence. Arthritis Rheum 2004;50:961–7.
19. Simon GH, Daldrup-Link HE, Kau J, Metz S, Schlegel J, PiontekG, et al. Optical imaging of experimental arthritis using allogeneicleukocytes labeled with a near-infrared fluorescent probe. EurJ Nucl Med Mol Imaging 2006;33:998–1006.
20. Scheel AK, Krause A, Mesecke-von Rheinbaben I, Metzger G,Rost H, Tresp V, et al. Assessment of proximal finger jointinflammation in patients with rheumatoid arthritis, using a novellaser-based imaging technique. Arthritis Rheum 2002;46:1177–84.
21. Ando F, Sasano K, Ohba N, Hirose H, Yasui O. Anatomic andvisual outcomes after indocyanine green-assisted peeling of theretinal internal limiting membrane in idiopathic macular holesurgery. Am J Ophthalmol 2004;137:609–14.
22. Brancato R, Trabucchi G. Fluorescein and indocyanine greenangiography in vascular chorioretinal diseases. Semin Ophthalmol1998;13:189–98.
23. El Desoky A, Seifalian AM, Cope M, Delpy DT, Davidson BR.Experimental study of liver dysfunction evaluated by direct indo-cyanine green clearance using near infrared spectroscopy. Br JSurg 1999;86:1005–11.
24. Haruna M, Kumon K, Yahagi N, Watanabe Y, Ishida Y, Ko-bayashi N, et al. Blood volume measurement at the bedside usingICG pulse spectrophotometry. Anesthesiology 1998;89:1322–8.
25. Gurfinkel M, Thompson AB, Ralston W, Troy TL, Moore AL,Moore TA, et al. Pharmacokinetics of ICG and HPPH-car for thedetection of normal and tumor tissue using fluorescence, near-infrared reflectance imaging: a case study. Photochem Photobiol2000;72:94–102.
26. Haglund MM, Berger MS, Hochman DW. Enhanced opticalimaging of human gliomas and tumor margins. Neurosurgery1996;38:308–17.
27. Ntziachristos V, Yodh AG, Schnall M, Chance B. ConcurrentMRI and diffuse optical tomography of breast after indocyaninegreen enhancement. Proc Natl Acad Sci U S A 2000;97:2767–72.
28. Reynolds JS, Troy TL, Mayer RH, Thompson AB, Waters DJ,Cornell KK, et al. Imaging of spontaneous canine mammarytumors using fluorescent contrast agents. Photochem Photobiol1999;70:87–94.
29. Mordon S, Devoisselle JM, Soulie-Begu S, Desmettre T. Indocya-nine green: physicochemical factors affecting its fluorescence invivo. Microvasc Res 1998;55:146–52.
30. Meijer DK, Weert B, Vermeer GA. Pharmacokinetics of biliaryexcretion in man. VI. Indocyanine green. Eur J Clin Pharmacol1988;35:295–303.
OPTICAL IMAGING OF SYNOVITIS 2497

31. Ostergaard M, Peterfy C, Conaghan P, McQueen F, Bird P,Ejbjerg B, et al. OMERACT Rheumatoid Arthritis MagneticResonance Imaging Studies: core set of MRI acquisitions, jointpathology definitions, and the OMERACT RA-MRI scoringsystem. J Rheumatol 2003;30:1385–6.
32. Ostergaard M, McQueen F, Wiell C, Bird P, Boyesen P, Ejbjerg B,et al. The OMERACT psoriatic arthritis magnetic resonanceimaging scoring system (PsAMRIS): definitions of key patholo-gies, suggested MRI sequences, and preliminary scoring system forPsA hands. J Rheumatol 2009;36:1816–24.
33. Liang KY, Zeger SL. Longitudinal data analysis using generalizedlinear models. Biometrika 1986;73:13–22.
34. Smith P, Hadgu A. Sensitivity and specificity for correlatedobservations. Stat Med 1992;11:1503–9.
35. Drake C, Levine RA. Sensitivity, specificity and other diagnosticmeasures with multiple sites per unit. Contemp Clin Trials 2005;26:252–9.
36. Fleiss JL, Levin B, Paik MC. Statistical methods for rates andproportions. 3rd ed. New York: John Wiley & Sons; 2003.
37. Meyer D, Zeileis A, Hornik K. vcd: Visualizing categorical data.R package version 1.2-9; 2010.
38. Carey VJ. Ported to R by Ripley B. gee: Generalized estimationequation solver. R package version 4.13-16, 2010.
39. Byrt T, Bishop J, Carlin JB. Bias, prevalence and kappa. J ClinEpidemiol 1993;46:423–9.
40. Landis JR, Koch GG. The measurement of observer agreementfor categorical data. Biometrics 1977;33:159–74.
41. Werner SG, Langer HE, Ohrndorf S, Bahner M, Schott P,Schwenke C, et al. Inflammation assessment in patients witharthritis using a novel in vivo fluorescence optical imaging tech-nology. Ann Rheum Dis 2012;71:504–10.
42. Golovko D, Meier R, Rummeny E, Daldrup-Link H. Opticalimaging of rheumatoid arthritis. Int J Clin Rheumatol 2011;6:67–75.
43. Peterson JD, Labranche TP, Vasquez KO, Kossodo S, Melton M,Rader R, et al. Optical tomographic imaging discriminates be-tween disease-modifying anti-rheumatic drug (DMARD) and non-DMARD efficacy in collagen antibody-induced arthritis. ArthritisRes Ther 2010;12:R105.
44. Berezin MY, Achilefu S. Fluorescence lifetime measurements andbiological imaging. Chem Rev 2010;110:2641–84.
45. Levenson RM. Spectral imaging and pathology: seeing more. LabMed 2004;35:244—51.
46. Delle SA, Riente L, Bombardieri S. Limits and perspectives ofultrasound in the diagnosis and management of rheumatic dis-eases. Mod Rheumatol 2008;18:125–31.
2498 MEIER ET AL