Detection of Liver Dysfunction Using a Wearable Electronic ...
15
Citation: Voss, A.; Schroeder, R.; Schulz, S.; Haueisen, J.; Vogler, S.; Horn, P.; Stallmach, A.; Reuken, P. Detection of Liver Dysfunction Using a Wearable Electronic Nose System Based on Semiconductor Metal Oxide Sensors. Biosensors 2022, 12, 70. https://doi.org/10.3390/ bios12020070 Received: 29 December 2021 Accepted: 24 January 2022 Published: 26 January 2022 Publisher’s Note: MDPI stays neutral with regard to jurisdictional claims in published maps and institutional affil- iations. Copyright: © 2022 by the authors. Licensee MDPI, Basel, Switzerland. This article is an open access article distributed under the terms and conditions of the Creative Commons Attribution (CC BY) license (https:// creativecommons.org/licenses/by/ 4.0/). biosensors Article Detection of Liver Dysfunction Using a Wearable Electronic Nose System Based on Semiconductor Metal Oxide Sensors Andreas Voss 1,2, *, Rico Schroeder 1,3 , Steffen Schulz 1 , Jens Haueisen 2 , Stefanie Vogler 4 , Paul Horn 4 , Andreas Stallmach 4 and Philipp Reuken 4 1 Institute of Innovative Health Technologies IGHT, Ernst-Abbe-Hochschule Jena, 07745 Jena, Germany; [email protected] (R.S.); [email protected] (S.S.) 2 Institute of Biomedical Engineering and Informatics (BMTI), Technische Universität Ilmenau, 98693 Ilmenau, Germany; [email protected] 3 UST Umweltsensortechnik GmbH, 99331 Geratal, Germany 4 Clinic for Internal Medicine IV, University Hospital Jena, 07747 Jena, Germany; [email protected] (S.V.); [email protected] (P.H.); [email protected] (A.S.); [email protected] (P.R.) * Correspondence: [email protected]; Tel.: +49-3677-69-2861 Abstract: The purpose of this exploratory study was to determine whether liver dysfunction can be generally classified using a wearable electronic nose based on semiconductor metal oxide (MOx) gas sensors, and whether the extent of this dysfunction can be quantified. MOx gas sensors are attractive because of their simplicity, high sensitivity, low cost, and stability. A total of 30 participants were enrolled, 10 of them being healthy controls, 10 with compensated cirrhosis, and 10 with decompensated cirrhosis. We used three sensor modules with a total of nine different MOx layers to detect reducible, easily oxidizable, and highly oxidizable gases. The complex data analysis in the time and non-linear dynamics domains is based on the extraction of 10 features from the sensor time series of the extracted breathing gas measurement cycles. The sensitivity, specificity, and accuracy for distinguishing compensated and decompensated cirrhosis patients from healthy controls was 1.00. Patients with compensated and decompensated cirrhosis could be separated with a sensitivity of 0.90 (correctly classified decompensated cirrhosis), a specificity of 1.00 (correctly classified compensated cirrhosis), and an accuracy of 0.95. Our wearable, non-invasive system provides a promising tool to detect liver dysfunctions on a functional basis. Therefore, it could provide valuable support in preoperative examinations or for initial diagnosis by the general practitioner, as it provides non- invasive, rapid, and cost-effective analysis results. Keywords: electronic nose; liver dysfunction; cirrhosis; semiconductor metal oxide gas sensor 1. Introduction Metabolic disorders are sometimes connected with typical odors which can be mea- sured on breath, sweat, or other excreta from humans. Examples are ammonia odor, which is related to renal diseases, and acetone odor, which is related to diabetes. The beginnings of the use of electronic noses (e-noses) date back to pioneering work by a few research groups, such as Hartman, Wilkens, Dodd, and Moncrieff [1–4]. Here, the foundation was laid for specific odors to be detectable and, thus, evaluable with suitable electronics and analysis technology. The concept of sampling breath for health monitoring was initially conceived in the 20th century. In 1952, Henderson [5] reported on the increased acetone content of breath samples from young diabetics, promoting an interest in the content of breath [6]. In recent decades, improvements in materials, sensors, electronics, and signal pro- cessing technologies have led to a rapid increase in the development and application of e-noses [7–9]. E-noses are used, among other things, to analyze, detect, discriminate, clas- sify, and monitor gas components or odors in many fields of science and industry, and are Biosensors 2022, 12, 70. https://doi.org/10.3390/bios12020070 https://www.mdpi.com/journal/biosensors
-
Upload
khangminh22 -
Category
Documents
-
view
2 -
download
0
Transcript of Detection of Liver Dysfunction Using a Wearable Electronic ...

Citation: Voss, A.; Schroeder, R.;
Schulz, S.; Haueisen, J.; Vogler, S.;
Horn, P.; Stallmach, A.; Reuken, P.
Detection of Liver Dysfunction Using
a Wearable Electronic Nose System
Based on Semiconductor Metal Oxide
Sensors. Biosensors 2022, 12, 70.
https://doi.org/10.3390/
bios12020070
Received: 29 December 2021
Accepted: 24 January 2022
Published: 26 January 2022
Publisher’s Note: MDPI stays neutral
with regard to jurisdictional claims in
published maps and institutional affil-
iations.
Copyright: © 2022 by the authors.
Licensee MDPI, Basel, Switzerland.
This article is an open access article
distributed under the terms and
conditions of the Creative Commons
Attribution (CC BY) license (https://
creativecommons.org/licenses/by/
4.0/).
biosensors
Article
Detection of Liver Dysfunction Using a Wearable ElectronicNose System Based on Semiconductor Metal Oxide SensorsAndreas Voss 1,2,*, Rico Schroeder 1,3 , Steffen Schulz 1, Jens Haueisen 2 , Stefanie Vogler 4, Paul Horn 4 ,Andreas Stallmach 4 and Philipp Reuken 4
1 Institute of Innovative Health Technologies IGHT, Ernst-Abbe-Hochschule Jena, 07745 Jena, Germany;[email protected] (R.S.); [email protected] (S.S.)
2 Institute of Biomedical Engineering and Informatics (BMTI), Technische Universität Ilmenau,98693 Ilmenau, Germany; [email protected]
3 UST Umweltsensortechnik GmbH, 99331 Geratal, Germany4 Clinic for Internal Medicine IV, University Hospital Jena, 07747 Jena, Germany; [email protected] (S.V.);
[email protected] (P.H.); [email protected] (A.S.); [email protected] (P.R.)* Correspondence: [email protected]; Tel.: +49-3677-69-2861
Abstract: The purpose of this exploratory study was to determine whether liver dysfunction canbe generally classified using a wearable electronic nose based on semiconductor metal oxide (MOx)gas sensors, and whether the extent of this dysfunction can be quantified. MOx gas sensors areattractive because of their simplicity, high sensitivity, low cost, and stability. A total of 30 participantswere enrolled, 10 of them being healthy controls, 10 with compensated cirrhosis, and 10 withdecompensated cirrhosis. We used three sensor modules with a total of nine different MOx layers todetect reducible, easily oxidizable, and highly oxidizable gases. The complex data analysis in thetime and non-linear dynamics domains is based on the extraction of 10 features from the sensor timeseries of the extracted breathing gas measurement cycles. The sensitivity, specificity, and accuracy fordistinguishing compensated and decompensated cirrhosis patients from healthy controls was 1.00.Patients with compensated and decompensated cirrhosis could be separated with a sensitivity of 0.90(correctly classified decompensated cirrhosis), a specificity of 1.00 (correctly classified compensatedcirrhosis), and an accuracy of 0.95. Our wearable, non-invasive system provides a promising toolto detect liver dysfunctions on a functional basis. Therefore, it could provide valuable support inpreoperative examinations or for initial diagnosis by the general practitioner, as it provides non-invasive, rapid, and cost-effective analysis results.
Keywords: electronic nose; liver dysfunction; cirrhosis; semiconductor metal oxide gas sensor
1. Introduction
Metabolic disorders are sometimes connected with typical odors which can be mea-sured on breath, sweat, or other excreta from humans. Examples are ammonia odor, whichis related to renal diseases, and acetone odor, which is related to diabetes.
The beginnings of the use of electronic noses (e-noses) date back to pioneering workby a few research groups, such as Hartman, Wilkens, Dodd, and Moncrieff [1–4]. Here,the foundation was laid for specific odors to be detectable and, thus, evaluable withsuitable electronics and analysis technology. The concept of sampling breath for healthmonitoring was initially conceived in the 20th century. In 1952, Henderson [5] reportedon the increased acetone content of breath samples from young diabetics, promoting aninterest in the content of breath [6].
In recent decades, improvements in materials, sensors, electronics, and signal pro-cessing technologies have led to a rapid increase in the development and application ofe-noses [7–9]. E-noses are used, among other things, to analyze, detect, discriminate, clas-sify, and monitor gas components or odors in many fields of science and industry, and are
Biosensors 2022, 12, 70. https://doi.org/10.3390/bios12020070 https://www.mdpi.com/journal/biosensors

Biosensors 2022, 12, 70 2 of 15
of interest for numerous applications. For example, e-noses are used in the food and bever-age industry to monitor processing and determine the quality of the final product [10,11],in pharmaceutical science for formulation development and quality assurance [8], andfor air quality monitoring [12]. In addition, e-noses are also used in agriculture, watermanagement, medicine, security systems, and many other fields [13].
In the following, we will only deal with the e-noses that meet Gardner’s definition [14].He stated that an e-nose is an instrument, which comprises an array of electronic chemicalsensors with partial specificity and an appropriate pattern-recognition system, capableof recognizing simple or complex odors. However, unlike other analytical methods, ane-nose does not detect directly specific volatile organic components (VOCs); rather, it buildschemical patterns to form an identity. The sensor array produces output patterns thatrepresent VOCs in the breath (or different substances), and the data processing extractsa set of mathematical descriptors that represent the signature of the breath sample as apattern [15]. The detection of the input signal occurs depending on the operating principleimplemented in the sensor arrays. There are a variety of sensor types used in e-nosetechnology. These include the following in particular [13,16]:
• Metal oxide,• Conducting polymer,• Quartz crystal microbalance,• Acoustic wave,• Electro-chemical,• Catalytic bead,• Optical.
Among these available gas sensing methods, semiconducting metal oxide gas (MOx)sensor devices have several unique advantages, such as low cost, small size, easy measure-ment, durability, ease of fabrication, and low detection limits (low ppm level). In addition,most MOx-based sensors are relatively resistant to poisoning. For these reasons, they havequickly gained popularity and have become the most widely used gas sensors today [13].
E-noses have also been developed for medical applications. Here, e-noses can dis-tinguish between different types of diseases and their severity by analyzing body odor.This includes disease-related metabolic changes especially [17], but any kind of drugconsumption [18] can also be detected on the skin surface and/or exhaled breath.
One can show that such e-noses can be successfully used to improve the diagnosis ofvarious diseases, ranging from kidney disease [19] and diabetes [20], to various types ofrespiratory diseases [21] and carcinoma [22,23], up to heart diseases [24]. These and otherstudies provide evidence that, after a necessary validation, a cost-effective, portable, andfast working e-nose system could be useful for improved diagnostics and health protection.
The diagnosis of chronic liver disease is usually based on a combination of clinicalsigns, laboratory parameters, and imaging results [25]. However, this approach has severalimportant weaknesses. First, the prognosis of cirrhosis depends on the structure andfunction of the liver, but even more important is the occurrence of complications, such asvariceal bleeding or infections [26,27]. Second, laboratory values can be influenced by otherconditions that present in the same way as cirrhosis, which may lead to misinterpretation.Third, some imaging techniques, such as transient elastography, are influenced by “non-liver” factors, such as central venous pressure [28]. Fourth, there is a great need for anexact measurement of the current patient’s situation to choose the optimal treatment, e.g., iftransplantation is needed or a non-hepatic or hepatic surgery must be performed. In currentscoring systems, such as the Model for End-stage Liver Disease (MELD) [29], patients withportal hypertension as a decompensating event (ascites, variceal bleeding) are poorlyrepresented due to the nature of the score.
Based on a proof-of-concept study, De Vicentis et al. [30] showed that an e-nose basedon piezoelectric gas sensors could be a valid non-invasive instrument for characterizingchronic liver disease and monitoring hepatic function over time.
Biosensors 2022, 12, 70 3 of 15
The advantages of piezoelectric gas sensors are high sensitivity, small size, fast re-sponse time, low power consumption, and robustness [31]. However, these piezoelectricsensors have a poor signal-to-noise ratio, as they operate at very high frequencies andrequire complex electronic circuits to delineate the signal response, making it difficult forthem to act as a supportive element for an efficient e-nose system.
Therefore, the objective of this study was to determine, within the framework of anexplorative study, whether liver dysfunction is generally recognizable and whether thelevel of this dysfunction can be classified utilizing a wearable semiconducting MOx gassensor-based e-nose.
2. Materials and Methods2.1. Electronic Nose and Signal Processing
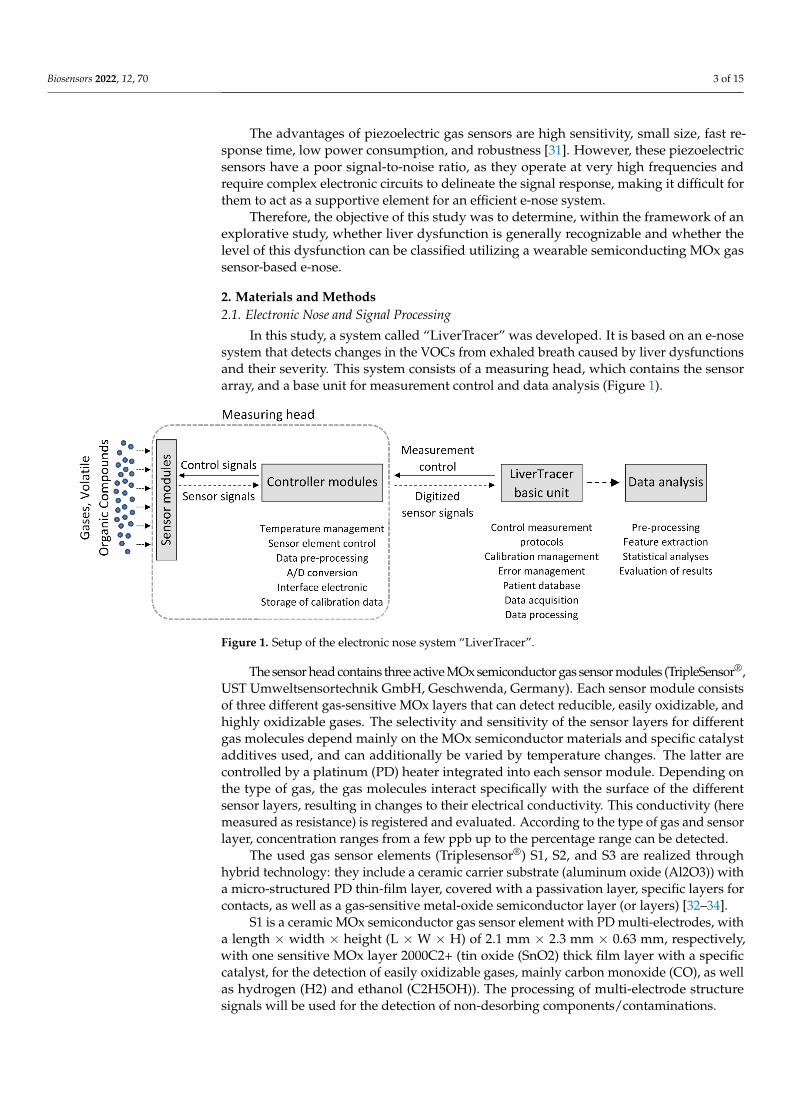
In this study, a system called “LiverTracer” was developed. It is based on an e-nosesystem that detects changes in the VOCs from exhaled breath caused by liver dysfunctionsand their severity. This system consists of a measuring head, which contains the sensorarray, and a base unit for measurement control and data analysis (Figure 1).
Biosensors 2022, 12, 70 3 of 15
Disease (MELD) [29], patients with portal hypertension as a decompensating event (ascites, variceal bleeding) are poorly represented due to the nature of the score.
Based on a proof-of-concept study, De Vicentis et al. [30] showed that an e-nose based on piezoelectric gas sensors could be a valid non-invasive instrument for characterizing chronic liver disease and monitoring hepatic function over time.
The advantages of piezoelectric gas sensors are high sensitivity, small size, fast response time, low power consumption, and robustness [31]. However, these piezoelectric sensors have a poor signal-to-noise ratio, as they operate at very high frequencies and require complex electronic circuits to delineate the signal response, making it difficult for them to act as a supportive element for an efficient e-nose system.
Therefore, the objective of this study was to determine, within the framework of an explorative study, whether liver dysfunction is generally recognizable and whether the level of this dysfunction can be classified utilizing a wearable semiconducting MOx gas sensor-based e-nose.
2. Materials and Methods 2.1. Electronic Nose and Signal Processing
In this study, a system called “LiverTracer” was developed. It is based on an e-nose system that detects changes in the VOCs from exhaled breath caused by liver dysfunctions and their severity. This system consists of a measuring head, which contains the sensor array, and a base unit for measurement control and data analysis (Figure 1).
Figure 1. Setup of the electronic nose system “LiverTracer”.
The sensor head contains three active MOx semiconductor gas sensor modules (TripleSensor®, UST Umweltsensortechnik GmbH, Geschwenda, Germany). Each sensor module consists of three different gas-sensitive MOx layers that can detect reducible, easily oxidizable, and highly oxidizable gases. The selectivity and sensitivity of the sensor layers for different gas molecules depend mainly on the MOx semiconductor materials and specific catalyst additives used, and can additionally be varied by temperature changes. The latter are controlled by a platinum (PD) heater integrated into each sensor module. Depending on the type of gas, the gas molecules interact specifically with the surface of the different sensor layers, resulting in changes to their electrical conductivity. This conductivity (here measured as resistance) is registered and evaluated. According to the type of gas and sensor layer, concentration ranges from a few ppb up to the percentage range can be detected.
The used gas sensor elements (Triplesensor®) S1, S2, and S3 are realized through hybrid technology: they include a ceramic carrier substrate (aluminum oxide (Al2O3)) with a micro-structured PD thin-film layer, covered with a passivation layer, specific
Figure 1. Setup of the electronic nose system “LiverTracer”.
The sensor head contains three active MOx semiconductor gas sensor modules (TripleSensor®,UST Umweltsensortechnik GmbH, Geschwenda, Germany). Each sensor module consistsof three different gas-sensitive MOx layers that can detect reducible, easily oxidizable, andhighly oxidizable gases. The selectivity and sensitivity of the sensor layers for differentgas molecules depend mainly on the MOx semiconductor materials and specific catalystadditives used, and can additionally be varied by temperature changes. The latter arecontrolled by a platinum (PD) heater integrated into each sensor module. Depending onthe type of gas, the gas molecules interact specifically with the surface of the differentsensor layers, resulting in changes to their electrical conductivity. This conductivity (heremeasured as resistance) is registered and evaluated. According to the type of gas and sensorlayer, concentration ranges from a few ppb up to the percentage range can be detected.
The used gas sensor elements (Triplesensor®) S1, S2, and S3 are realized throughhybrid technology: they include a ceramic carrier substrate (aluminum oxide (Al2O3)) witha micro-structured PD thin-film layer, covered with a passivation layer, specific layers forcontacts, as well as a gas-sensitive metal-oxide semiconductor layer (or layers) [32–34].
S1 is a ceramic MOx semiconductor gas sensor element with PD multi-electrodes, witha length × width × height (L × W × H) of 2.1 mm × 2.3 mm × 0.63 mm, respectively,with one sensitive MOx layer 2000C2+ (tin oxide (SnO2) thick film layer with a specificcatalyst, for the detection of easily oxidizable gases, mainly carbon monoxide (CO), as wellas hydrogen (H2) and ethanol (C2H5OH)). The processing of multi-electrode structuresignals will be used for the detection of non-desorbing components/contaminations.

Biosensors 2022, 12, 70 4 of 15
S2 is a ceramic MOx semiconductor gas sensor element UST Triplesensor® (type3A4P10), with an L × W × H of 2.1 mm × 2.3 mm × 0.63 mm, with three sensitive MOxlayers: 2000C2+ (specific SnO2 compound with a specific catalyst and a thick film, for thedetection of easily oxidizable gases, mainly CO, as well as H2 and C2H5OH), 3000C2+ (aspecific SnO2 compound with a specific Pd catalyst and a thick film, for the detection ofheavily oxidizable gases, mainly hydrocarbons (CxHy), and which is optimal especiallyfor a number of carbon atoms (C1 to C8)), and 5000C2+ (a specific tungsten trioxide(WO3) compound with a thick film, for the detection of reducible gases, e.g., nitrogendioxide (NO2)).
S3 is a ceramic MOx semiconductor gas sensor element UST Triplesensor® (type3A4P10), with a L × W × H of 2.1 mm × 2.4 mm × 0.63 mm, with three sensitive metal-oxide layers: 1000C2+ (a specific SnO2 compound with a catalyst and a thick film), 2000C2+(a specific SnO2 compound with a specific catalyst and a thick film, for the detection of easilyoxidizable gases, mainly CO, as well as H2 and C2H5OH), and 9000C2+ (a specific SnO2compound with a catalyst and a thick-film, for the detection of long chain hydrocarbons).
The electronic microcontroller modules installed in the measuring head, with ananalog-to-digital converter for each sensor element, control the heating temperature, thepreprocessing of the sensor signals, the storage of the calibration data and the communica-tion with the basic unit.
A spirometer “SPIROSTIK COMPLETE” (Geratherm Respiratory GmbH, Bad Kis-singen, Germany) was used as the basic unit. It contains a Windows 10 computer system.This device was modified according to our requirements. In particular, the sensor control,data storage, operator guidance (semi-automatic patient measurement), and data analysiswere developed and integrated on the software side, as were the pump system for flushingand calibrating the measuring head on the hardware side. The principle of the measurementregime is shown in Figure 2.
After starting the system, it is checked whether a scheduled calibration of the e-nose is necessary to verify the correctness of the reference resistance values of the sensorlayers to avoid measurement errors. For this purpose, a commercially available test gas(consisting of the components carbon monoxide, oxygen, and nitrogen) is used. Strongdeviations of the measurement results from the resistance pattern typical for the appliedcalibration gas indicate the contamination or aging of the sensor layers. In this case, suitablecountermeasures (cleaning, sensor replacement . . . ) must be carried out.
If calibration is not required, or after successful calibration, preparation for the actualpatient measurement begins. For this purpose, the operator selects an existing patient fromthe patient database (in case of repetition) or enters the required data for a new patient intothe patient database and starts the patient data acquisition.
The processing of the patient measurement protocol (based on a predefined temper-ature control of the sensor heater optimized in preliminary studies [35]; see Figure 3a)is started with a cyclic thermal cleaning of the sensors until the sensor layers reach theiroriginal reference resistances (time-variable process). This is followed by the recordingof the room air composition and the actual two patient measurements. By controlling thesensor heating temperature, it is possible to influence the sensitivity of the sensors fordifferent VOCs (extension of the detection range). Burn-off cleaning phases serve to burn orevaporate impurities that may have adhered to the sensor surface. The measurement proto-col has a duration of about 16 min. The temperature profile and the associated resistancedata curves of all sensor layers are stored for subsequent analysis.
Data analyses were performed using MATLAB R2019a (The MathWorks, Inc., Natick,MA, USA). The 9 raw resistance waveforms were evaluated for outliers, technical problems,artifacts, and measurement errors. No measurement had to be discarded. For the analysisof the respective breathing air segments, the relevant 30 s segments were extracted fromthe measurement (Figure 3b, marked by vertical dashed lines). This was performedautomatically based on the specified temperature measurement protocol, which clearlydefines where the breath measurement starts and ends (Figure 3a, “bc1” and “bc2”).

Biosensors 2022, 12, 70 5 of 15
The data analysis is based on the extraction of 10 features (time domain and non-linear dynamics domain) from the resistance time series of the extracted breathing gasmeasurement cycles for each sensor layer.
Biosensors 2022, 12, 70 5 of 15
measurement protocol has a duration of about 16 min. The temperature profile and the associated resistance data curves of all sensor layers are stored for subsequent analysis.
Figure 2. Flow chart of the LiverTracer measurement regime.
Data analyses were performed using MATLAB R2019a (The MathWorks, Inc., Natick, MA, USA). The 9 raw resistance waveforms were evaluated for outliers, technical problems, artifacts, and measurement errors. No measurement had to be discarded. For the analysis of the respective breathing air segments, the relevant 30 s segments were extracted from the measurement (Figure 3b, marked by vertical dashed lines). This was
Figure 2. Flow chart of the LiverTracer measurement regime.

Biosensors 2022, 12, 70 6 of 15
Biosensors 2022, 12, 70 6 of 15
performed automatically based on the specified temperature measurement protocol, which clearly defines where the breath measurement starts and ends (Figure 3a, “bc1” and “bc2”).
Figure 3. (a) Schematic representation of the measurement protocol based on a predefined temperature control of the sensor heater. It contains time-variable cyclic thermal cleaning cycles “tc”, burn-off cleaning phases “bf” (rectangle functions), subsequent flushing phases “fp” (horizontal lines), one ambient air measurement cycle “ac”, and two breathing gas measurement cycles “bc1” and “bc2”. The arrows mark the exhalation cycles (patient breathing: PB); (b) example of a recording of 9 sensor layer resistance curves. Vertical dashed lines mark the two breathing gas measurements.
The data analysis is based on the extraction of 10 features (time domain and nonlinear dynamics domain) from the resistance time series of the extracted breathing gas measurement cycles for each sensor layer.
In the time domain, the following features (Figure 4) were calculated: • slope_startmax (Ω/s): slope from cycle start (Start) to absolute maximum (Max); • s_slope_startmax (Ω/s): steepest slope of 1s duration from cycle start to Max; • s_slope_startmax_pos (s): corresponding position of s_slope_startmax; • s_slope_maxmin (Ω/s): steepest slope of 1s duration from Max to minimum (Min); • area1 (Ω·s): area under the curve from cycle start to Max; • area2 (Ω·s): area under the curve from cycle Max to midpoint; • area3 (Ω·s): area under the curve from cycle midpoint to Min; • area4 (Ω·s): area under the curve from cycle Min to cycle end; • area3sec_9 (Ω·s): ninth subarea (24 s to 27 s); area under the curve is evaluated
incrementally in 3 s subareas beginning from cycle start.
Figure 3. (a) Schematic representation of the measurement protocol based on a predefined tempera-ture control of the sensor heater. It contains time-variable cyclic thermal cleaning cycles “tc”, burn-offcleaning phases “bf” (rectangle functions), subsequent flushing phases “fp” (horizontal lines), oneambient air measurement cycle “ac”, and two breathing gas measurement cycles “bc1” and “bc2”.The arrows mark the exhalation cycles (patient breathing: PB); (b) example of a recording of 9 sensorlayer resistance curves. Vertical dashed lines mark the two breathing gas measurements.
In the time domain, the following features (Figure 4) were calculated:
• slope_startmax (Ω/s): slope from cycle start (Start) to absolute maximum (Max);• s_slope_startmax (Ω/s): steepest slope of 1s duration from cycle start to Max;• s_slope_startmax_pos (s): corresponding position of s_slope_startmax;• s_slope_maxmin (Ω/s): steepest slope of 1s duration from Max to minimum (Min);• area1 (Ω·s): area under the curve from cycle start to Max;• area2 (Ω·s): area under the curve from cycle Max to midpoint;• area3 (Ω·s): area under the curve from cycle midpoint to Min;• area4 (Ω·s): area under the curve from cycle Min to cycle end;• area3sec_9 (Ω·s): ninth subarea (24 s to 27 s); area under the curve is evaluated
incrementally in 3 s subareas beginning from cycle start.
From the nonlinear dynamics domain, a feature of classical symbolic dynamics andone entropy measure were used. By employing symbolic dynamics [36,37], the originaltime series is transformed into a symbolic sequence and, thus, presented in a coarser form.Detailed information is lost, which allows the quantification of the dynamics contained inthe time series. In the present study, for the quantification of symbolic dynamics of theresistance time series R of the breathing gas measuring cycles, the symbols 0 and 1 wereassigned according to the following transformation rules:
0 : Rn+1 − Rn ≤ 0,1 : Rn+1 − Rn > 0.
(1)
Here, Rn and Rn+1 are the resistance values at the time points n and n + 1. Whilesymbol 0 indicates decreasing resistance values, symbol 1 reflects increasing resistancevalues. Based on the transformed symbol string, words were formed consisting of two

Biosensors 2022, 12, 70 7 of 15
successive symbols. The frequency distribution of the word type 00 was determined (thiswas less dependent on minor fluctuations):
• p00—probability for the occurrence of the word type 00 within the resistance valuetime series.
The entropy measure, Renyi entropy, was calculated [37]. The density distribution(histogram) of resistance values in the resistance time series required for entropy calcula-tions was determined using six classes. The optimal number of classes k was calculatedusing Sturges’ criterion [38]:
k = 1 + 3.32 ∗ log(N), N . . . number o f resistance values. (2)
Based on the density distributions, the individual class probabilities pi were calculated(with i = 1 to k), followed by the estimation of the following Renyi entropy measures:
Renyi−α [bit] =1
1 − α∗ log2
k
∑i=1
piα (3)
Renyi entropy was estimated considering the coefficient value α = 4, which influences theweighting of the probabilities pi (weights larger fluctuations stronger than smaller ones).
Biosensors 2022, 12, 70 7 of 15
Figure 4. Time domain features extracted from the resistance curve of an exhalation cycle.
From the nonlinear dynamics domain, a feature of classical symbolic dynamics and one entropy measure were used. By employing symbolic dynamics [36,37], the original time series is transformed into a symbolic sequence and, thus, presented in a coarser form. Detailed information is lost, which allows the quantification of the dynamics contained in the time series. In the present study, for the quantification of symbolic dynamics of the resistance time series R of the breathing gas measuring cycles, the symbols 0 and 1 were assigned according to the following transformation rules: 0: 𝑅 𝑅 0, 1: 𝑅 𝑅 0. (1)
Here, Rn and Rn+1 are the resistance values at the time points n and n + 1. While symbol 0 indicates decreasing resistance values, symbol 1 reflects increasing resistance values. Based on the transformed symbol string, words were formed consisting of two successive symbols. The frequency distribution of the word type 00 was determined (this was less dependent on minor fluctuations): • p00—probability for the occurrence of the word type 00 within the resistance value
time series. The entropy measure, Renyi entropy, was calculated [37]. The density distribution
(histogram) of resistance values in the resistance time series required for entropy calculations was determined using six classes. The optimal number of classes k was calculated using Sturges’ criterion [38]: 𝑘 1 3.32 ∗ log 𝑁 , 𝑁 … 𝑛𝑢𝑚𝑏𝑒𝑟 𝑜𝑓 𝑟𝑒𝑠𝑖𝑠𝑡𝑎𝑛𝑐𝑒 𝑣𝑎𝑙𝑢𝑒𝑠. (2)
Based on the density distributions, the individual class probabilities pi were calculated (with i = 1 to k), followed by the estimation of the following Renyi entropy measures:
Renyi α 𝑏𝑖𝑡 11 𝛼 ∗ log 𝑝 (3)
Renyi entropy was estimated considering the coefficient value α = 4, which influences the weighting of the probabilities pi (weights larger fluctuations stronger than smaller ones).
2.2. Patients A total of 30 participants were enrolled, 10 of them being healthy controls, 10 with
compensated cirrhosis, and 10 with decompensated cirrhosis, between October 2019 and March 2020. Participating patients were randomly recruited consecutively according to
Figure 4. Time domain features extracted from the resistance curve of an exhalation cycle.
2.2. Patients
A total of 30 participants were enrolled, 10 of them being healthy controls, 10 withcompensated cirrhosis, and 10 with decompensated cirrhosis, between October 2019 andMarch 2020. Participating patients were randomly recruited consecutively according toavailability in the normal care unit. Patients with ongoing acute-on-chronic liver failure,mechanical cholestasis, acute renal failure, malignant disease, severe cardiopulmonarydisease (New York Heart Association classification severity level of heart failure NYHAIII/IV (severe heart failure) [39] and/or chronic obstructive pulmonary disease (accordingto Global Initiative for Chronic Obstructive Lung Disease (GOLD) categories C (highrisk/less symptoms) and D (high risk/more symptoms)) [40], and uncontrolled diabetesmellitus were excluded from the study. Control patients were either admitted to the hospitalfor elective hospitalization for non-liver disease (n = 8) or healthy medical staff (n = 2).Controls were matched for age, sex, and bodyweight. Decompensation was classifiedaccording to the Child–Pugh classification score (CPS) [41]. Patients that were classified asCPS B (significant functional compromise) or C (decompensated disease) were allocated tothe decompensated group. In addition, patients with variceal hemorrhage were classifiedas decompensated.

Biosensors 2022, 12, 70 8 of 15
The patients with compensated cirrhosis were male in 7 cases, had a median bodyweight of 94 kg and a median age of 57 years. Four of them were smokers. The etiology ofcirrhosis was ethanol in 6 of these patients and four had other reasons for cirrhosis (2 viralhepatitis, 2 cholestatic liver disease). Patients with decompensated cirrhosis were male in8 cases, had a median bodyweight of 80 kg and a median age of 62 years. Three of themwere smokers and, again, the main etiology of cirrhosis was ethanol consumption in 8 ofthe patients (the others were 1 autoimmune hepatitis and 1 nonalcoholic steatohepatitis).
Control participants were male in 5 cases and had a median bodyweight of 81 kg.They had a median age of 58 years and one of them was a smoker. They had no history ofknown liver disease. None of the demographic parameters showed significant differencesbetween the three groups. Vital parameters at inclusion between these groups did not differas well (Table 1).
Table 1. Patient data (values in parentheses represent the respective minimum and maximum valuesor describe percentages).
Control (n = 10) CompensatedCirrhosis (n = 10)
DecompensatedCirrhosis (n = 10) p-Value
Sex (f/m) 5/5 3/7 2/8 0.500Age (years) 58 (51; 65) 57 (52; 64) 62 (56; 67) 0.543
Bodyweight (kg) 81 (68; 96) 94 (79; 101) 80 (68; 97) 0.136Height (cm) 175 (167; 178) 176 (167; 178) 176 (169; 181) 0.712
Smoker (n,%) 1 (10%) 4 (40%) 3 (30%) 0.450
Vital signsRR systolic (mmHg) 135 (118; 161) 126 (107; 155) 122 (103; 136) 0.266RR diastolic (mmHg) 81 (76; 104) 76 (61; 92) 72 (63; 79) 0.146
Heart rate (pbm) 78 (67; 102) 85 (71; 88) 92 (81; 104) 0.212Temperature (C) 36.8 (3.4; 37.0) 36.6 (36.1; 37.0) 36.7 (36.4; 37.1) 0.523
Etiology of cirrhosis (n,%)Ethanol N/A 6 (60%) 8 (80%) 0.628Other N/A 4 (40%) 2 (20%)
Co-medication (n,%)Lactulose 1 (10%) 3 (30%) 8 (80%) 0.009
Proton pump inhibitors 5 (50%) 7 (70%) 9 (90%) 0.262B-Blocker 5 (50%) 4 (40%) 5 (50%) 0.897
Antibiotics 1 (10%) 3 (30%) 7 (70%) 0.016Rifaximin 0 1 (10%) 6 (60%)
other 1 (10%) 2 (20%) 1 (10%)
f—females; m—males; n—number of patients; p—significance.
Relevant co-medication with known influence on intestinal flora and, therefore, on theresults of the LiverTracer was analyzed. Lactulose was taken by 1 control patient, 3 patientswith compensated cirrhosis, and 8 patients with decompensated cirrhosis (p = 0.009).Antibiotics were taken by 1 control patient, 3 patients with compensated cirrhosis, and 8patients with decompensated cirrhosis (p = 0.016); however, the difference in antibioticswere caused by rifaxmin, which was taken by 1 patient with compensated and 6 withdecompensated cirrhosis. Protone pump inhibitors (p = 0.262) and betablockers (p = 0.897)did not show differences between both groups (Table 1).
All procedures performed in the study involving human participants were approvedby the Institutional Ethics Commission of the University Hospital Jena (5359-11/17), andwere performed in accordance with the 1964 Helsinki declaration and its later amendments.Written informed consent was obtained from all individual participants prior to inclusionin the study.

Biosensors 2022, 12, 70 9 of 15
2.3. Statistics
Statistical analyses were performed using IBM SPSS 21.0 (IBM Corp. Released 2012.IBM SPSS Statistics for Windows, version 21.0. Armonk, NY, USA: IBM Corp). Descriptivestatistics were used to calculate means, standard deviations, medians, and interquartileranges for all features calculated from the resistance time series separately for all ninesensor layers for respiratory gas measurement. The Kolmogorov–Smirnov test was appliedto check the normal distribution of the features. The presence of statistical differencesbetween the respiratory gas analysis characteristics of the control group (CON) and thetwo groups of patients with compensated (COMP) and decompensated (DECOMP) cir-rhosis was tested with Welch’s t-test for normally distributed characteristics and withthe nonparametric exact two-sided Mann–Whitney U test for non-normally distributedcharacteristics. A significance level of p < 0.05 was considered to be the criterion for sta-tistical differences. Consistent with most of the published work on this topic, this paperpresents only means and standard deviations for the identified features, regardless ofthe distribution or significance test applied, which improves the comparability of studyresults. Forward stepwise linear discriminant analyses combined with the leave-one-outcross-validation procedure were performed, and receiver operator characteristic (ROC)curves were calculated to assess the classification strength of the feature sets. Sensitivity(SENS), specificity (SPEC), area under the ROC curve (AUC), and accuracy (ACC) weredetermined for significant features and feature sets, each consisting of 2 or 3 uncorrelated(Pearson correlation coefficient) significant features. The resulting discriminant functionanalysis was then determined to be the classifier for automatic classification.
3. Results
We report below only the results of the first breathing gas cycle, as we did not findsignificant differences between the first and second breathing gas cycles. Let us firstconsider the classification results of the LiverTracer e-nose (Tables 2 and 3). The separationof the patient groups (Table 2) from the controls was 100% successful in each case. Betweenthe patient groups, a correct classification of 95% was achieved, where 90% of the patientsfrom the DECOMP group and 100% of patients from the COMP group were correctlyclassified. Interestingly, these remarkable classification results were reached using onlythe features of sensors 1 and 3. Sensor 3 mainly contributed to the result. Sensor 2 didnot make any significant contribution. Table 3 shows the descriptive statistics of thosefeatures that were automatically selected by the discriminant analysis to obtain the optimalseparation results.
Table 2. Percentage classification rate of e-nose features. The optimal parameter set (consisting ofeither double or triple sets) is shown for each group comparison.
Group Features SENS SPEC ACC AUC
CON—COMPRS11_s_slope_maxmin (Ohm/s)
RS32_area3sec_9 (Ohm·s)RS32_p00
1.00 1.00 1.00 1.00
CON—DECOMPRS31_slope_startmax (Ohm/s)RS32_s_slope_startmax_pos (s)
RS33_p001.00 1.00 1.00 1.00
COMP—DECOMP RS32_Renyi4_entropy (bit)RS33_area2 (Ohm·s) 0.90 1.00 0.95 0.97
CON—control group; COMP—patients with compensated cirrhosis; DECOMP—patients with decompensatedcirrhosis; RSxy—R denotes resistance measurement values of sensor layer y of sensor Sx (e.g., RS12 describesthe resistance readings of sensor layer 2 of sensor S1); SENS—sensitivity; SPEC—specificity; ACC—Accuracy;AUC—area under the receiver operator characteristic curve.
Biosensors 2022, 12, 70 10 of 15
Table 3. Classification results of features automatically selected by discriminant analysis (mv—meanvalue, sd—standard deviation).
Group CON COMP DECOMP
Test Features p mv ± sd mv ± sd mv ± sd
CON vs. COMPRS11_s_slope_maxmin (Ohm/s) 0.046 −86,258 ± 5225 −81,023 ± 5676
RS32_area3sec_9 (Ohm·s) 0.038 1,807,616 ± 207,540 2,071,884 ± 309,151RS32_p00 0.017 0.336 ± 0.050 0.276 ± 0.045
CON vs. DECOMPRS31_slope_startmax (Ohm/s) 0.029 8901 ± 3207 6956 ± 1845RS32_s_slope_startmax_pos (s) 0.019 6.250 ± 1.161 6.900 ± 0.211
RS33_p00 0.041 0.369 ± 0.045 0.319 ± 0.056
COMP vs. DECOMPRS32_Renyi4_entropy (bit) 0.028 1.843 ± 0.386 2.179 ± 0.185
RS33_area2 (Ohm·s) 0.131 48,252 ± 23,296 34,507 ± 14,547
CON—control group; COMP—patients with compensated cirrhosis; DECOMP—patients with decompensatedcirrhosis; RSxy—R denotes the resistance measurement values of sensor layer y of sensor Sx (e.g., RS12 de-scribes the resistance readings of sensor layer 2 of sensor S1); p—significance value; mv ± sd—mean value ±standard deviation.
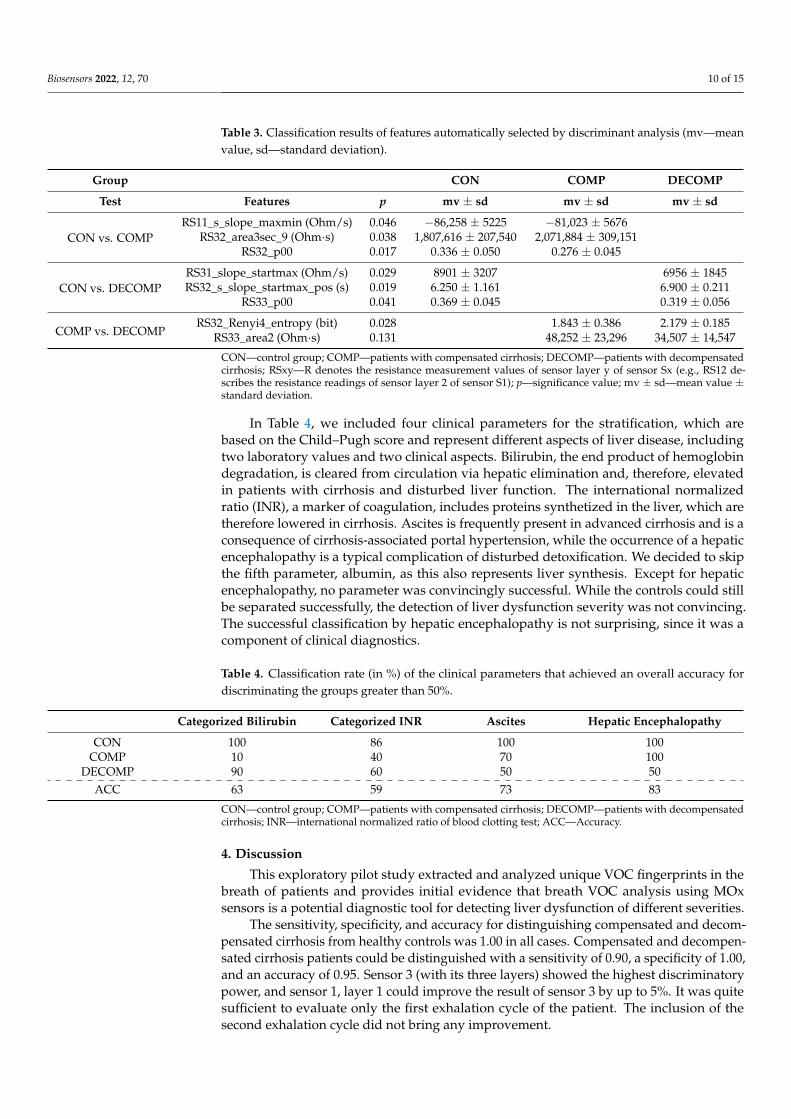
In Table 4, we included four clinical parameters for the stratification, which arebased on the Child–Pugh score and represent different aspects of liver disease, includingtwo laboratory values and two clinical aspects. Bilirubin, the end product of hemoglobindegradation, is cleared from circulation via hepatic elimination and, therefore, elevatedin patients with cirrhosis and disturbed liver function. The international normalizedratio (INR), a marker of coagulation, includes proteins synthetized in the liver, which aretherefore lowered in cirrhosis. Ascites is frequently present in advanced cirrhosis and is aconsequence of cirrhosis-associated portal hypertension, while the occurrence of a hepaticencephalopathy is a typical complication of disturbed detoxification. We decided to skipthe fifth parameter, albumin, as this also represents liver synthesis. Except for hepaticencephalopathy, no parameter was convincingly successful. While the controls could stillbe separated successfully, the detection of liver dysfunction severity was not convincing.The successful classification by hepatic encephalopathy is not surprising, since it was acomponent of clinical diagnostics.
Table 4. Classification rate (in %) of the clinical parameters that achieved an overall accuracy fordiscriminating the groups greater than 50%.
Categorized Bilirubin Categorized INR Ascites Hepatic Encephalopathy
CON 100 86 100 100COMP 10 40 70 100
DECOMP 90 60 50 50ACC 63 59 73 83
CON—control group; COMP—patients with compensated cirrhosis; DECOMP—patients with decompensatedcirrhosis; INR—international normalized ratio of blood clotting test; ACC—Accuracy.
4. Discussion
This exploratory pilot study extracted and analyzed unique VOC fingerprints in thebreath of patients and provides initial evidence that breath VOC analysis using MOxsensors is a potential diagnostic tool for detecting liver dysfunction of different severities.
The sensitivity, specificity, and accuracy for distinguishing compensated and decom-pensated cirrhosis from healthy controls was 1.00 in all cases. Compensated and decompen-sated cirrhosis patients could be distinguished with a sensitivity of 0.90, a specificity of 1.00,and an accuracy of 0.95. Sensor 3 (with its three layers) showed the highest discriminatorypower, and sensor 1, layer 1 could improve the result of sensor 3 by up to 5%. It was quitesufficient to evaluate only the first exhalation cycle of the patient. The inclusion of thesecond exhalation cycle did not bring any improvement.
Biosensors 2022, 12, 70 11 of 15
In this study, we included patients with different stages of liver cirrhosis. Differen-tiation between patients with and without early stages of cirrhosis is challenging, but ofgreat clinical importance. It is usually based on a combination of clinical, imaging, andlaboratory parameters, but all of these can be influenced by non-liver related factors as well.Despite these weaknesses, the differentiation between cirrhosis and non-cirrhosis is of greatclinical relevance, as the rate of postoperative complications and the mortality are higherin patients with cirrhosis [42]. However, the main predictor of these complications is thehepatic portal venous pressure gradient [43], which is not routinely measured. Using singlelaboratory parameters or clinical features does not result in the satisfying identification ofpatients with especially compensated cirrhosis in our study.
A study by Germanese et al. [44] that attempted to discriminate the severity of liverdisease, particularly based on detected breath ammonia with MOx sensors, showed thatthe accuracy of discriminating between non-cirrhotic patients with chronic liver diseaseand cirrhotic ones was only 0.63, while that of discriminating between liver diseases andhealthy controls was 0.81.
The generation of specific VOCs within the body can be the result of metabolic derange-ment, toxin or teratogen exposure, and finally microbiological processes [45]. Breath tests,which provide an indirect, non-invasive, and relatively low-input evaluation of variousdiseases, are used as diagnostic tools for quantifying the presence of one or more metabo-lites of a particular substrate in exhaled breath. Qin et al. [46] analyzed breath samples inhepatocellular carcinoma patients and controls by means of gas chromatography–massspectrometry (GC/MS) combined with solid phase microextraction. Three potential VOCs,3-hydroxy-2-butanone, styrene, and decane, were selected as promising biomarkers. Asurvey of other potential biomarkers in various liver diseases can be found in the publica-tion by De Vincentis et al. [47]. Interestingly, alkanes (decanes) are precisely the group ofmarkers that are particularly favorably detected by the sensors used in our study.
Even though these preliminary results are very promising, several limitations of thisexplorative pilot study are worth noting. First, it must be noted that the number of patientsincluded is relatively small. However, it should be noted that this is a proof-of-conceptstudy with a new sensor technology compared to previous studies [48]. It should alsobe noted that, in general, e-noses allow only indirect gas compound detection. In futurestudies, we intend to combine them with classical laboratory methods (e.g., GC/MS)to enable a direct assignment of biomarkers to the sensors. This would also have theadvantage whereby the sensors could be optimally adapted to the pathology via theappropriate doping of the sensor layers. Another limitation of this study is that only asingle measurement was performed per patient. Therefore, the system should be validatedin a long-term and repeatability study. Additionally, we must mention that the influenceof acute events, such as infections, was not studied in detail. This should be addressedin a subsequent study. Finally, MOx sensors also have drawbacks that are mainly relatedto the lack of sensor stability and the production of sensors with nearly identical sensorcharacteristics [13,49,50]. Among other factors, contamination and aging of the sensorsmay lead to short- and long-term drift of the sensors, causing differences in the measuredsensor values compared to the originally measured values of new sensors, and reducing theaccuracy of pattern recognition based on a trained pattern. Time-consuming recalibrationsare often required to compensate for the drift [51]. Replacing a nearly identical sensor isusually difficult. Our approach to significantly reduce the drift and aging problems of theMOx sensors we use is to automatically assess the quality of the sensors before each breathmeasurement based on the resistance values of the individual sensor layers. In doing so,we compare these with stored threshold values of the original resistances (values of thesensor when it was newly installed). If there are deviations from the original resistancethresholds beyond a certain threshold, cyclic thermal cleaning is automatically performeduntil the sensor reaches the stored thresholds. If the thresholds are not reached within aspecified cycle frequency, the sensor is recalibrated with a test gas. If all these measures fail,the sensor should be replaced with an adequate sensor with as close to identical resistance

Biosensors 2022, 12, 70 12 of 15
values as possible, and the e-nose may need to be recalibrated. However, throughout thestudy period, the values of our applied sensor array remained within the approved qualitylevel. We therefore assume that the drift problem can be largely compensated for by sensormonitoring and calibration, but there remains some residual risk (especially in the case ofsensor failure), the impact of which is currently being investigated in a validation study.
The results from this pilot study are very promising and suggest the principal suitabil-ity (especially by using the complex feature extraction method) of the MOx multisensorysignals for the analysis of breath changes and, thus, for the identification of liver dysfunc-tions. Among the sensors used in e-noses for medical diagnostics, MOx semiconductorsensors are by far the most popular. They have high sensitivity, are durable, and, probablymost importantly, are relatively inexpensive. Price is an important factor when consideringlarge-scale commercial deployment, especially in developing countries. In addition, be-cause they can operate in a wide range of relative humidity, they are particularly suitablefor outdoor use [13,31].
In medicine and biology, e-noses are intelligent biosensor-based systems for the rapiddetection, analysis, and classification of complex gaseous odors (usually as VOC mixturesof compound metabolite profiles). These instruments are innovative diagnostic tools withgreat potential for the non-invasive early detection of many types of diseases based onthe analysis of VOC metabolites in the form of gaseous clinical samples [52]. They areinexpensive, have low operating and maintenance costs, and provide real-time analysis.Due to the growing demand for improved healthcare devices and procedures, the needfor simpler and wearable e-nose systems that can provide fast and accurate diagnosticresults and replace traditional, complex, often expensive and time-consuming clinical andlaboratory methods has permanently increased. Such systems should non-invasively detectVOCs and accelerate on-site testing, allowing earlier diagnosis, faster treatment of disease,better prognosis, shorter hospital stays, faster recovery, and ultimately lower healthcarecosts. Further development and point-of-care testing of new e-nose technologies and thedevelopment of standardized diagnostic methods will help bring these e-noses into routineclinical practice.
In summary, the multisensory analyses performed in this study based on a wearableMOx sensor array showed high separation accuracies of 95% to 100% between the studiedgroups. It was not only possible to distinguish liver dysfunctions of different severityfrom controls at 100%, but also to discriminate between the severities of liver dysfunctionat 95% with a correct identification of 100% of all COMP cirrhosis and of 90% of allDECOMP cirrhosis).
Based on a semiconductor MOx sensor array, the wearable e-nose system for detectingdisease—in this case liver dysfunction—offers significant advantages over conventionallaboratory analysis and the use of other sensor systems when combined with the nonlinearprocessing of sensor signals. Our system thus represents a promising tool for distinguishingbetween patients with compensated and decompensated cirrhosis on a functional basis, andcan thus make an important contribution, e.g., in preoperative workup or at the level of thegeneral practitioner for the initial diagnosis and, thus, early detection of liver dysfunction.
Author Contributions: Conceptualization, A.V. and A.S.; methodology, A.V., A.S., P.R., P.H., R.S.and S.S.; software, R.S. and S.S.; validation, A.V., A.S. and P.R.; formal analysis, A.V., R.S. andS.S.; investigation, S.V., P.H., A.S. and P.R.; resources, A.V. and A.S.; data curation, S.V.; writing—original draft preparation, A.V., P.R. and R.S.; writing—review and editing, A.V., P.R., J.H., A.S. andR.S.; visualization, R.S. and S.S.; supervision, A.V.; project administration, A.V. and A.S.; fundingacquisition, A.V. and A.S. All authors have read and agreed to the published version of the manuscript.
Funding: These studies were supported by grants from the Thuringian Ministry of Economy, Laborand Technology (TMBWAT/TAB 20018), the Federal Ministry for Economic Affairs and Energy(ZF4485201SB7), and the ERDF—European Regional Development Fund.

Biosensors 2022, 12, 70 13 of 15
Institutional Review Board Statement: All procedures performed in the study involving humanparticipants were approved by the Institutional Ethics Commission of the University HospitalJena (5359-11/17) and were performed in accordance with the 1964 Helsinki declaration and itslater amendments.
Informed Consent Statement: Written informed consent was obtained from all individual partici-pants prior to inclusion in the study.
Data Availability Statement: The data of this study are not publicly available due to the fact that thestudy has not yet been completed, and further evaluations are currently in progress. However, thedata are available on request from the corresponding author.
Acknowledgments: We would like to thank the companies UST Umweltsensortechnik GmbH,Geschwenda, Germany and Geratherm Respiratory GmbH, Bad Kissingen, Germany for their supportin the use of their technical components. We acknowledge support for the publication costs by theOpen Access Publication Fund of the Technische Universität Ilmenau.
Conflicts of Interest: The authors declare no conflict of interest.
References1. Hartman, J. A possible objective method for the rapid estimation of flavors in vegetables. Proc. Amer. Soc. Hort. Sci 1954, 64,
335–342.2. Wilkens, W.F.; Hartman, J.D. An Electronic Analog for the Olfactory Processes. Ann. N. Y. Acad. Sci. 1964, 116, 608–612. [CrossRef]3. Dodd, G.H.; Bartlett, P.N.; Gardner, J.W. Odours—The stimulus for an electronic nose. In Proceedings of the NATO Advanced
Research Workshop on Sensors and Sensory Systems for an Electronic Nose, Reykjavik, Iceland, 5–8 August 1991; pp. 1–11.4. Moncrieff, R.W. An instrument for measuring and classifying odors. J. Appl. Physiol. 1961, 16, 742–749. [CrossRef]5. Henderson, M.J.; Karger, B.A.; Wren Shall, G.A. Acetone in the breath: A study of acetone exhalation in diabetic and nondiabetic
human subjects. Diabetes 1952, 1, 188–193. [CrossRef]6. Gardner, J.W.; Vincent, T.A. Electronic Noses for Well-Being: Breath Analysis and Energy Expenditure. Sensors 2016, 16, 947.
[CrossRef]7. Farraia, M.V.; Cavaleiro Rufo, J.; Paciencia, I.; Mendes, F.; Delgado, L.; Moreira, A. The electronic nose technology in clinical
diagnosis: A systematic review. Porto Biomed. J. 2019, 4, e42. [CrossRef]8. Wasilewski, T.; Migon, D.; Gebicki, J.; Kamysz, W. Critical review of electronic nose and tongue instruments prospects in
pharmaceutical analysis. Anal. Chim. Acta 2019, 1077, 14–29. [CrossRef]9. Wilson, A.D.; Baietto, M. Advances in electronic-nose technologies developed for biomedical applications. Sensors 2011, 11,
1105–1176. [CrossRef]10. Majchrzak, T.; Wojnowski, W.; Dymerski, T.; Gebicki, J.; Namiesnik, J. Electronic noses in classification and quality control of
edible oils: A review. Food Chem. 2018, 246, 192–201. [CrossRef]11. Tan, J.; Xu, J. Applications of electronic nose (e-nose) and electronic tongue (e-tongue) in food quality-related properties
determination: A review. Artif. Intell. Agric. 2020, 4, 104–115. [CrossRef]12. He, J.; Xu, L.; Wang, P.; Wang, Q. A high precise E-nose for daily indoor air quality monitoring in living environment. Integration
2017, 58, 286–294. [CrossRef]13. Karakaya, D.; Ulucan, O.; Turkan, M. Electronic Nose and Its Applications: A Survey. Int. J. Autom. Comput. 2020, 17, 179–209.
[CrossRef]14. Gardner, J.W.; Bartlett, P.N. A brief history of electronic noses. Sens. Actuators B 1994, 18, 211–220. [CrossRef]15. Gupta, A.; Singh, T.S.; Yadava, R.D.S. MEMS sensor array-based electronic nose for breath analysis-a simulation study. J. Breath
Res. 2018, 13, 016003. [CrossRef]16. Wojnowski, W.; Dymerski, T.; Gebicki, J.; Namiesnik, J. Electronic Noses in Medical Diagnostics. Curr. Med. Chem. 2019, 26,
197–215. [CrossRef]17. Wilson, A.D. Advances in electronic-nose technologies for the detection of volatile biomarker metabolites in the human breath.
Metabolites 2015, 5, 140–163. [CrossRef]18. Voss, A.; Witt, K.; Kaschowitz, T.; Poitz, W.; Ebert, A.; Roser, P.; Bar, K.J. Detecting cannabis use on the human skin surface via an
electronic nose system. Sensors 2014, 14, 13256–13272. [CrossRef]19. Voss, A.; Baier, V.; Reisch, R.; von Roda, K.; Elsner, P.; Ahlers, H.; Stein, G. Smelling renal dysfunction via electronic nose. Ann.
Biomed. Eng. 2005, 33, 656–660. [CrossRef]20. Wang, P.; Tan, Y.; Xie, H.; Shen, F. A novel method for diabetes diagnosis based on electronic nose. Biosens. Bioelectron. 1997, 12,
1031–1036. [CrossRef]21. Dragonieri, S.; Pennazza, G.; Carratu, P.; Resta, O. Electronic Nose Technology in Respiratory Diseases. Lung 2017, 195, 157–165.
[CrossRef]22. Baldini, C.; Billeci, L.; Sansone, F.; Conte, R.; Domenici, C.; Tonacci, A. Electronic Nose as a Novel Method for Diagnosing Cancer:
A Systematic Review. Biosensors 2020, 10, 84. [CrossRef] [PubMed]

Biosensors 2022, 12, 70 14 of 15
23. Capelli, L.; Taverna, G.; Bellini, A.; Eusebio, L.; Buffi, N.; Lazzeri, M.; Guazzoni, G.; Bozzini, G.; Seveso, M.; Mandressi, A.; et al.Application and Uses of Electronic Noses for Clinical Diagnosis on Urine Samples: A Review. Sensors 2016, 16, 1708. [CrossRef][PubMed]
24. Voss, A.; Witt, K.; Fischer, C.; Reulecke, S.; Poitz, W.; Kechagias, V.; Surber, R.; Figulla, H.R. Smelling heart failure from humanskin odor with an electronic nose. In Proceedings of the 2012 Annual International Conference of the IEEE Engineering inMedicine and Biology Society, San Diego, CA, USA , 28 August–1 September 2012; pp. 4034–4037. [CrossRef] [PubMed]
25. European Association for the Study of the Liver. EASL Clinical Practice Guidelines for the management of patients withdecompensated cirrhosis. J. Hepatol. 2018, 69, 406–460. [CrossRef]
26. Moreau, R.; Jalan, R.; Gines, P.; Pavesi, M.; Angeli, P.; Cordoba, J.; Durand, F.; Gustot, T.; Saliba, F.; Domenicali, M.; et al. Acute-on-chronic liver failure is a distinct syndrome that develops in patients with acute decompensation of cirrhosis. Gastroenterology2013, 144, 1426–1437. [CrossRef]
27. Trebicka, J.; Fernandez, J.; Papp, M.; Caraceni, P.; Laleman, W.; Gambino, C.; Giovo, I.; Uschner, F.E.; Jimenez, C.;Mookerjee, R.; et al. The PREDICT study uncovers three clinical courses of acutely decompensated cirrhosis that have distinctpathophysiology. J. Hepatol. 2020, 73, 842–854. [CrossRef]
28. Millonig, G.; Friedrich, S.; Adolf, S.; Fonouni, H.; Golriz, M.; Mehrabi, A.; Stiefel, P.; Pöschl, G.; Büchler, M.W.; Seitz, H.K.; et al.Liver stiffness is directly influenced by central venous pressure. J. Hepatol. 2010, 52, 206–210. [CrossRef]
29. Kamath, P.S.; Wiesner, R.H.; Malinchoc, M.; Kremers, W.; Therneau, T.M.; Kosberg, C.L.; D’Amico, G.; Dickson, E.R.; Kim, W.R. Amodel to predict survival in patients with end-stage liver disease. Hepatology 2001, 33, 464–470. [CrossRef]
30. De Vincentis, A.; Pennazza, G.; Santonico, M.; Vespasiani-Gentilucci, U.; Galati, G.; Gallo, P.; Zompanti, A.; Pedone, C.; AntonelliIncalzi, R.; Picardi, A. Breath-print analysis by e-nose may refine risk stratification for adverse outcomes in cirrhotic patients.Liver Int. 2017, 37, 242–250. [CrossRef]
31. Behera, B.; Joshi, R.; Anil Vishnu, G.K.; Bhalerao, S.; Pandya, H.J. Electronic nose: A non-invasive technology for breath analysisof diabetes and lung cancer patients. J. Breath Res. 2019, 13, 024001. [CrossRef]
32. Kiesewetter, O.; Ewert, A.; Melchert, V.; Kittelmann, S. Arrangement for the Detection of Air Constituents and Method forOperating the Arrangement. DE102004060101 B4, 13 December 2004.
33. Kiesewetter, O.; Ewert, A.; Melchert, V.; Kittelmann, S. Assembly for Detecting Air Components. EP 1602924 B1, 2 June 2005.34. Kittelmann, S.; Ewert, A.; Kiesewetter, O. Air Content Detection Arrangement for Use in e.g., Building, HAS EVALUating Unit
with Evaluating Resistance That Is Connected in Parallel with Individual or Combinations of Effective Resistances of Set ofOperating Layers Connected with Unit. DE 102006033528 B3, 20 July 2006.
35. Witt, K.; Fischer, C.; Reulecke, S.; Kechagias, V.; Surber, R.; Figulla, H.R.; Voss, A. Electronic nose detects heart failure fromexhaled breath. Biomed. Tech. 2013, 58 (Suppl. S1). [CrossRef] [PubMed]
36. Kurths, J.; Voss, A.; Saparin, P.; Witt, A.; Kleiner, H.J.; Wessel, N. Quantitative analysis of heart rate variability. Chaos 1995, 5,88–94. [CrossRef] [PubMed]
37. Voss, A.; Kurths, J.; Kleiner, H.J.; Witt, A.; Wessel, N.; Saparin, P.; Osterziel, K.J.; Schurath, R.; Dietz, R. The application of methodsof non-linear dynamics for the improved and predictive recognition of patients threatened by sudden cardiac death. Cardiovasc.Res. 1996, 31, 419–433. [CrossRef]
38. Sturges, H.A. The Choice of a Class Interval. J. Am. Stat. Assoc. 1926, 21, 65–66. [CrossRef]39. Hunt, S.A. ACC/AHA 2005 guideline update for the diagnosis and management of chronic heart failure in the adult: A report
of the American College of Cardiology/American Heart Association Task Force on Practice Guidelines (Writing Committeeto Update the 2001 Guidelines for the Evaluation and Management of Heart Failure). J. Am. Coll. Cardiol. 2005, 46, e1–e82.[CrossRef]
40. Patel, A.R.; Patel, A.R.; Singh, S.; Singh, S.; Khawaja, I. Global Initiative for Chronic Obstructive Lung Disease: The ChangesMade. Cureus 2019, 11, e4985. [CrossRef]
41. Child, C.G.; Turcotte, J.G. Surgery and portal hypertension. Major Probl. Clin. Surg. 1964, 1, 1–85.42. Parikh, N.D.; Chang, Y.H.; Tapper, E.B.; Mathur, A.K. Outcomes of Patients With Cirrhosis Undergoing Orthopedic Procedures:
An Analysis of the Nationwide Inpatient Sample. J. Clin. Gastroenterol. 2019, 53, e356–e361. [CrossRef]43. Wong, M.; Busuttil, R.W. Surgery in Patients with Portal Hypertension. Clin. Liver Dis. 2019, 23, 755–780. [CrossRef]44. Germanese, D.; Colantonio, S.; D’Acunto, M.; Romagnoli, V.; Salvati, A.; Brunetto, M. An E-Nose for the Monitoring of Severe
Liver Impairment: A Preliminary Study. Sensors 2019, 19, 3656. [CrossRef]45. Arasaradnam, R.P.; McFarlane, M.; Ling, K.; Wurie, S.; O’Connell, N.; Nwokolo, C.U.; Bardhan, K.D.; Skinner, J.; Savage, R.S.;
Covington, J.A. Breathomics–exhaled volatile organic compound analysis to detect hepatic encephalopathy: A pilot study.J. Breath Res. 2016, 10, 016012. [CrossRef] [PubMed]
46. Qin, T.; Liu, H.; Song, Q.; Song, G.; Wang, H.Z.; Pan, Y.Y.; Xiong, F.X.; Gu, K.S.; Sun, G.P.; Chen, Z.D. The screening of volatilemarkers for hepatocellular carcinoma. Cancer Epidemiol. Biomark. Prev. 2010, 19, 2247–2253. [CrossRef] [PubMed]
47. De Vincentis, A.; Vespasiani-Gentilucci, U.; Sabatini, A.; Antonelli-Incalzi, R.; Picardi, A. Exhaled breath analysis in hepatology:State-of-the-art and perspectives. World J. Gastroenterol. 2019, 25, 4043–4050. [CrossRef] [PubMed]
48. De Vincentis, A.; Pennazza, G.; Santonico, M.; Vespasiani-Gentilucci, U.; Galati, G.; Gallo, P.; Vernile, C.; Pedone, C.;Antonelli Incalzi, R.; Picardi, A. Breath-print analysis by e-nose for classifying and monitoring chronic liver disease: Aproof-of-concept study. Sci. Rep. 2016, 6, 25337. [CrossRef]

Biosensors 2022, 12, 70 15 of 15
49. Esfahani, S.; Tiele, A.; Agbroko, S.O.; Covington, J.A. Development of a Tuneable NDIR Optical Electronic Nose. Sensors 2020,20, 6875. [CrossRef]
50. Ruffer, D.; Hoehne, F.; Buhler, J. New Digital Metal-Oxide (MOx) Sensor Platform. Sensors 2018, 18, 1052. [CrossRef]51. Padilla, M.; Perera, A.; Montoliu, I.; Chaudry, A.; Persaud, K.; Marco, S. Drift compensation of gas sensor array data by Orthogonal
Signal Correction. Chemom. Intell. Lab. Syst. 2010, 100, 28–35. [CrossRef]52. Wilson, A.D. Application of Electronic-Nose Technologies and VOC-Biomarkers for the Noninvasive Early Diagnosis of Gastroin-
testinal Diseases (dagger). Sensors 2018, 18, 2613. [CrossRef]