Detection of Hard X-Ray Pulsations and a Strong Iron Kbeta Emission Line during an Extended Low...
18
arXiv:astro-ph/0409587v1 24 Sep 2004 Accepted for publication in The Astrophysical Journal Detection of hard X-ray pulsations and a strong iron K β emission line during an extended low state of GX 1+4 S. Naik 1 , B. Paul 2 and P. J. Callanan 1 ABSTRACT We present here results obtained from a detailed timing and spectral analysis of three BeppoSAX observations of the binary X-ray pulsar GX 1+4 carried out in August 1996, March 1997, and August 2000. In the middle of the August 2000 observation, the source was in a rare low intensity state that lasted for about 30 hours. Though the source does not show pulsations in the soft X-ray band (1.0–5.5 keV) during the extended low state, pulsations are detected in 5.5–10.0 keV energy band of the MECS detector and in hard X-ray energy bands (15–150 keV) of the PDS instrument. Comparing the 2–10 keV flux during this low state with the previously reported low states in GX 1+4, we suggest that the propeller regime in GX 1+4 occurs at a lower mass accretion rate than reported earlier. Broad-band (1.0–150 keV) pulse averaged spectroscopy reveals that the best-fit model comprises of a Comptonized continuum along with an iron K α emission line. A strong iron K β emission line is detected for the first time in GX 1+4 during the extended low state of 2000 observation with equivalent width of ∼ 550 eV. The optical depth and temperature of the Comptonizing plasma are found to be identical during the high and low intensity states whereas the hydrogen column density and the temperature of the seed photons are higher during the low state. We also present results from pulse phase resolved spectroscopy during the high and low flux episodes. Subject headings: stars : neutron — Pulsars : individual (GX 1+4) — X-rays : stars 1 Department of Physics, University College Cork, Cork, Ireland, [email protected], [email protected] 2 Tata Institute of Fundamental Research, Homi Bhabha Road, Mumbai 400 005, India, [email protected]
-
Upload
independent -
Category
Documents
-
view
0 -
download
0
Transcript of Detection of Hard X-Ray Pulsations and a Strong Iron Kbeta Emission Line during an Extended Low...
arX
iv:a
stro
-ph/
0409
587v
1 2
4 Se
p 20
04
Accepted for publication in The Astrophysical Journal
Detection of hard X-ray pulsations and a strong iron Kβ emission
line during an extended low state of GX 1+4
S. Naik1, B. Paul2 and P. J. Callanan1
ABSTRACT
We present here results obtained from a detailed timing and spectral analysis
of three BeppoSAX observations of the binary X-ray pulsar GX 1+4 carried out
in August 1996, March 1997, and August 2000. In the middle of the August
2000 observation, the source was in a rare low intensity state that lasted for
about 30 hours. Though the source does not show pulsations in the soft X-ray
band (1.0–5.5 keV) during the extended low state, pulsations are detected in
5.5–10.0 keV energy band of the MECS detector and in hard X-ray energy bands
(15–150 keV) of the PDS instrument. Comparing the 2–10 keV flux during
this low state with the previously reported low states in GX 1+4, we suggest
that the propeller regime in GX 1+4 occurs at a lower mass accretion rate
than reported earlier. Broad-band (1.0–150 keV) pulse averaged spectroscopy
reveals that the best-fit model comprises of a Comptonized continuum along
with an iron Kα emission line. A strong iron Kβ emission line is detected for
the first time in GX 1+4 during the extended low state of 2000 observation
with equivalent width of ∼ 550 eV. The optical depth and temperature of the
Comptonizing plasma are found to be identical during the high and low intensity
states whereas the hydrogen column density and the temperature of the seed
photons are higher during the low state. We also present results from pulse
phase resolved spectroscopy during the high and low flux episodes.
Subject headings: stars : neutron — Pulsars : individual (GX 1+4) — X-rays :
stars
1Department of Physics, University College Cork, Cork, Ireland, [email protected], [email protected]
2Tata Institute of Fundamental Research, Homi Bhabha Road, Mumbai 400 005, India, [email protected]
– 2 –
1. Introduction
The luminous accretion-powered X-ray pulsar GX 1+4 has several unique characteristics
which make it an ideal source for a detailed study in a wide X-ray energy band. The optical
counterpart is a M5 III giant star in a rare type of symbiotic system (Chakrabarty & Roche
1997). The neutron star in the binary system is a slow pulsar with a spin period of about 2
minutes. It is one of the brightest and hardest X-ray sources in the sky with a large rate
of change of pulse period. In 1970s, the pulsar exhibited spin-up behavior and after an
extended low intensity state in early 1980s, it showed spin-down activity (Makishima et al.
1988). BATSE monitoring of the source, since 1991, confirmed the spin down trend with
occasional torque reversal events (Chakrabarty et al. 1997). Though the spin-up torque
is expected to be correlated with the X-ray luminosity (Ghosh & Lamb 1979), they have
been found instead to be anticorrelated for GX 1+4 (Chakrabarty et al. 1997, Paul et al.
1997a). The pulsed X-ray luminosity of GX 1+4 monitored with BATSE, and the total
X-ray luminosity monitored with RXTE-ASM, shows strong variability over days to years
time scale, but without any periodic nature.
The pulse profile of GX 1+4 has a characteristic dip, which has been attributed due
to accretion column eclipses (Galloway et al. 2001). The dip is broad when the source is
bright and it becomes narrow with decreasing intensity. In the hard X-rays, a change in
pulse profile, from a single peak to a double peak with associated flux change was noted
in GX 1+4 with balloon borne observations (Rao et al. 1994, Paul et al. 1997b). It
occasionally shows a low state of a few hours duration (∼ 40 ks in July 1996) during which
the pulsations are absent (Cui 1997, Cui and Smith 2004). This has been interpreted as
due to centrifugal prohibition of accretion, also known as the ‘propeller effect’. As GX 1+4
is spinning down in spite of a large accretion rate (the persistent X-ray luminosity is a few
times 1037 erg s−1), the magnetic field strength of the neutron star is expected to be high,
1013−14 G (Makishima et al. 1989) although this is yet to be confirmed from spectroscopic
measurements. Based on the fluctuation of the spin-up rate, Pereira et al. (1999) suggested
a binary period of 304 days.
The continuum energy spectrum of accreting pulsars is generally described by a model
consisting of a power-law, which is known to be a signature of unsaturated Comptonization
and a Gaussian function for the Iron Kα emission line feature. Iron K shell emission
lines in X-ray pulsars are believed to be produced by illumination of neutral or partially
ionized material in the accretion disk, stellar wind of the high mass companion, material
in the line of sight, or in the accretion column. The spectral fitting to the phase averaged
RXTE data, however, shows that the GX 1+4 energy spectrum is best fitted by a model
consisting of an analytic approximation to a Comptonization continuum component and
– 3 –
a Gaussian component, attenuated by the neutral absorption column density (Galloway
2000). Pulse-phase resolved spectroscopy shows a significant increase in the value of optical
depth τ during the dips. This reveals that the dip features in the pulse profiles are due to
the eclipses of the emitting region by the accretion column (Galloway et al. 2000).
In this paper, we present the results obtained from a detailed timing and spectral
analysis of three observations of GX 1+4, made in August 1996, March 1997, and
August 2000, with the Low Energy Concentrator Spectrometer (LECS), Medium Energy
Concentrator Spectrometers (MECS), and the hard X-ray Phoswich Detector System
(PDS) instruments of BeppoSAX in 1.0–150.0 keV energy band. During a major part of
the August 2000 observation, the X-ray flux was at a very low level, similar to a state
previously seen with RXTE in 1996 July, but for a longer duration of about 30 hr. The
BeppoSAX observation provides us with an opportunity to investigate the temporal and
spectral properties of GX 1+4 during this extended low state over a much wider energy
band and better energy resolution than before. In subsequent sections we give details of the
three BeppoSAX observations, the results obtained from the timing and spectral analysis,
followed by a discussion of the results.
2. Observations
The observations of GX 1+4, used for the present study, were carried out with LECS,
MECS, and PDS instruments of the BeppoSAX satellite in 1996 August, 1997 March,
and 2000 August. The details of the observations with useful exposure times are given
in Table 1. The MECS consists of three grazing incidence telescopes with imaging gas
scintillation proportional counters in their focal planes. The LECS uses an identical
concentrator system as the MECS, but utilizes an ultra-thin entrance window and a driftless
configuration to extend the low-energy response to 0.1 keV. The PDS detector system
is composed of 4 actively shielded NaI(Tl)/CsI(Na) phoswich scintillators with a total
geometric area of 795 cm2 and a field of view of 1.3o (FWHM). The LECS, MECS and
PDS are sensitive in the energy bands of 0.1-5.0, 1.0-10.0 and 15–300 keV respectively. The
energy resolutions of LECS, MECS, and PDS are 25% at 0.6 keV, 8% at 6 keV and ≤ 15%
at 60 keV respectively. Time resolution of the instruments during these observations was
15.25 µs. For a detailed description of the BeppoSAX mission, refer to Boella et al. (1997)
and Frontera et al. (1997).
– 4 –
3. Timing Analysis
GX 1+4 suffers heavily from absorption at soft X-ray energy bands by the intervening
cold material. We have, therefore, used data from MECS and PDS detectors for the timing
analysis. A barycentric correction was applied to the arrival times of the photons. It
is not possible to correct the arrival times for the the binary motion as the key orbital
parameters are not known yet. A circular region of radius 4′ around the source was selected
to extract light curves from MECS event data. Light curves in the energy bands of 1–10
keV and 15–150 keV were extracted from the MECS and PDS data respectively with a
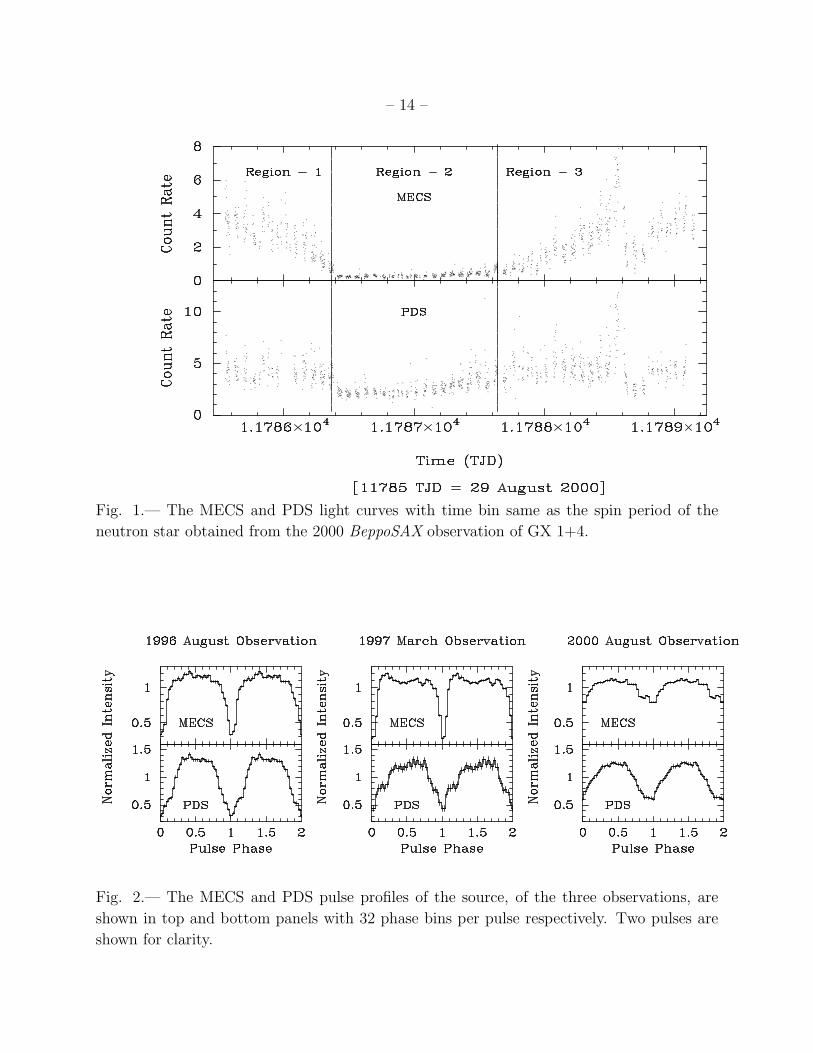
time resolution of 1 s. During the 2000 observation, light curves from which are shown in
Figure 1, high count rates were detected at the beginning and at the end, separated by an
extended low intensity state of duration ∼30 hr. Near the end of this observation, there
was a flare followed by a shallow dip.
The two minute pulses of GX 1+4 were visible in the raw light curves. For accurate
measurement of the pulse period, pulse folding and a χ2 maximization method was applied
to all the light curves and pulse period was determined to be 124.404(3) s, 126.018(8) s and
134.9256(10) s during the 1996 August 18, 1997 March 25, and 2000 August 29 observations
respectively. The quoted uncertainties (1σ confidence level) in the pulse periods represent
the trial periods at which the χ2 decreases from the peak value by one standard deviation
of the chi-sq values over a wide period range far from the peak. The pulse profiles, obtained
from the MECS and PDS data of the three observations are shown in Figure 2. The pulse
phases were adjusted so as to obtain the minimum in the pulse profile at phase zero. The
characteristic narrow dips are clearly seen in the MECS pulse profiles of the 1996 and 1997
observations. The pulse fraction (defined as the ratio of the difference of maximum and
minimum flux to the maximum flux in the pulse profile) in 1–10 keV energy band (MECS
data), during these two observations is in the range of 70–75%. However, the MECS pulse
profile of the 2000 observation is different. The dip seems to be absent and the pulse
fraction is reduced to about 30%. Though the PDS pulse profiles of all three BeppoSAX
observations look alike, the pulse fraction during the 2000 observation is less (∼ 50%)
compared to the 1996 and 1997 observations (70–80%).
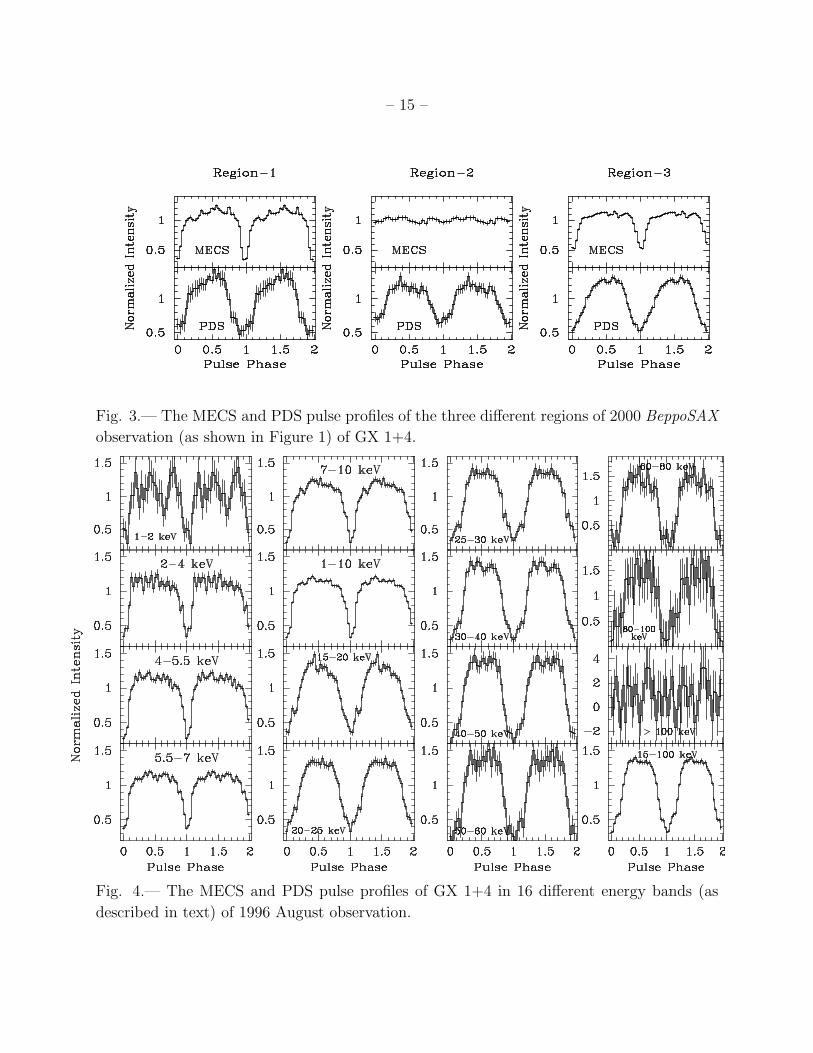
To get a detailed picture of the pulsation properties in this extended low state during
the 2000 observation, we divided the light curve into three different regions as shown in
Figure 1. Pulsations with profiles similar to those seen in the 1996 and 1997 observations
were detected in the MECS light curves of regions 1 and 3, whereas in region 2, the 3σ
upper limit of soft X-ray pulse fraction is 10%. However, pulsations are detected in all
three regions in hard X-ray light curve of the PDS. The MECS and PDS pulse profiles of
the three different regions are shown in Figure 3.

– 5 –
Figures 2 and 3 show a clear difference in the shape of pulse profiles of GX 1+4 in the
soft and hard X-ray energy bands. The dip is narrow in soft X-rays and gradually becomes
broader with increasing energy. To investigate the change in the shape of pulse profiles, we
generated light curves in 16 different energy bands from MECS and PDS event files of the
1996 observation. The corresponding pulse profiles are shown in Figure 4. An increase in
the width of the dips in the pulse profiles with energy range is apparent from the figure. It
is found that the light curve above 100 keV is mainly background dominated and pulsations
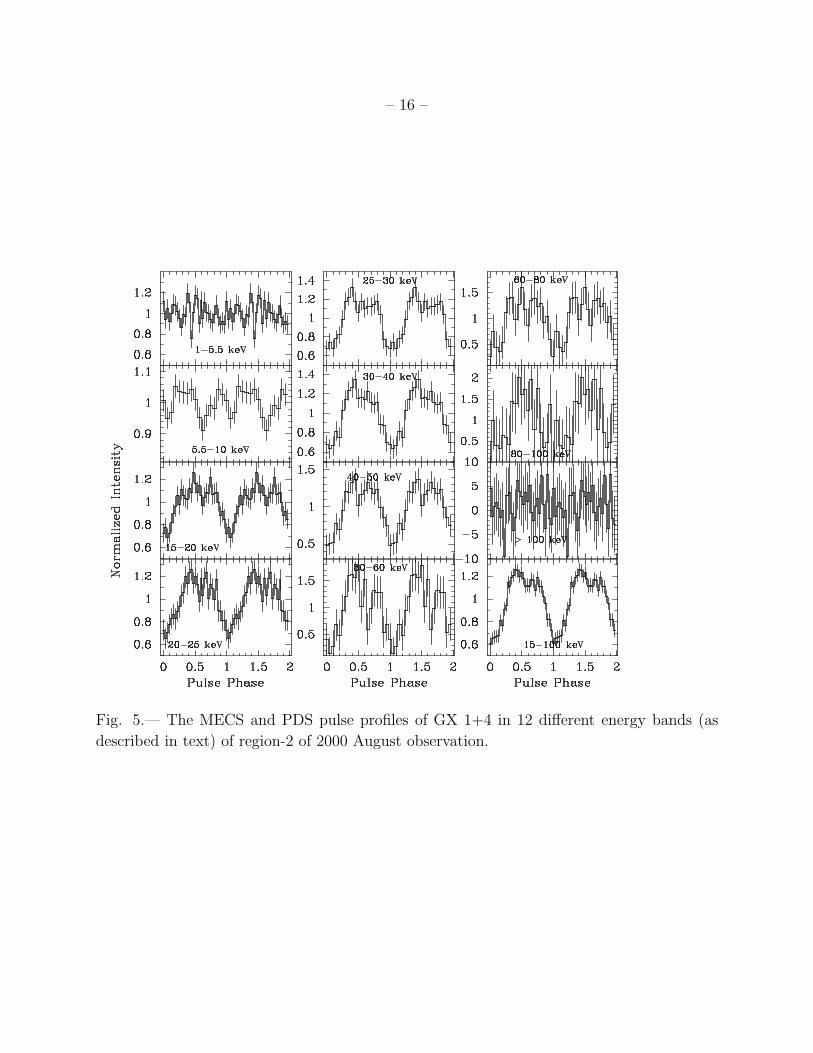
were not detected above 100 keV. Energy resolved pulse profiles from region 2 of the 2000
observation are shown in Figure 5. The pulse profiles in different energy bands of region 1
and 3 of 2000 August observation are similar to those seen in 1996 and 1997 observations.
But, as mentioned previously, pulsations are absent or much reduced in 1–5.5 keV energy
band of region 2 of 2000 observation (Figure 5). A change in pulse shape is also noticed
between the pulse profiles in 5.5–10 keV (a double peaked profile with a pulse fraction of a
mere ∼ 13%) and the same in the higher energy bands.
4. Pulse phase averaged spectroscopy
For spectral analysis, we have extracted LECS spectra from regions of radius 6′
centered on the object for the 1997 and 2000 observations. The combined MECS source
photons (MECS 1 was not operational in 2000) were extracted from circular regions with a
4′ radius. Background spectra for both LECS and MECS instruments were extracted from
appropriate source-free regions of the field of view by selecting annular regions around the
source. The software package named SAX Data Analysis System (SAXDAS) was used to
extract background subtracted PDS spectra from the event files of all the three BeppoSAX
observations. For spectral fitting, response matrices released by SDC in 1998 November,
were used. A rebinning scheme (ftp://heasarc.gsfc.nasa.gov/sax/cal/responses/grouping)
suggested in the SAX data analysis guide was used to rebin the LECS spectra to allow
use of the χ2 statistics. Events were selected in the energy ranges 1.0–4.0 keV for LECS,
1.65–10.0 keV for MECS and 15.0–150 keV for PDS where the instrument responses are well
determined. Combined spectra from the LECS, MECS and PDS detectors, after appropriate
background subtraction, were fitted simultaneously. All the spectral parameters, other than
the relative normalization, were tied to be the same for all the detectors.
The spectra were first fitted to a model consisting of a power law continuum with
a Gaussian for the iron line emission and absorption by matter along the line of sight,
which yielded poor values of reduced χ2. Following this, we fitted the spectra with a model
consisting of a Comptonized continuum along with a Gaussian function and interstellar
– 6 –
absorption and obtained better values for the reduced χ2. Addition of an absorption edge
at ∼ 30 keV further improved the spectral fitting with a decrease in reduced χ2 from 1.1
to 1.0 for region-1 and 1.50 to 1.41 for region-3, whereas the region-2 did not show any
improvement in spectral fitting with a reduced χ2 of 2.63. The edge energies and the
absorption depth at the threshold are found to be consistent (within errors) for all three
BeppoSAX observations. The residual around 35 keV can be fitted with either a cyclotron
absorption feature or an absorption edge. However, as the magnetic field strength of the
neutron star is estimated to be of the order of 1013−14 G, the cyclotron absorption line is
expected at higher energies (> 100 keV). As there is no physical reason for the absorption
feature at ∼ 35 keV, the absorption edge detected here is possibly an instrumental effect.
But we note that with a similar analysis of the PDS spectrum of Crab, we did not detect
any such feature.
The equivalent width of the 6.4 keV iron Kα line was found to be in the range of
180–320 eV during the 1996, 1997 and regions 1 and 3 of the 2000 observation. In the
region 2, the equivalent width of the iron line was very high (∼ 2.9 keV) with significant
line like residuals just above 7 keV. The region 2 spectrum, when fitted with the addition
of another single Gaussian function gives a much smaller reduced χ2 of 1.72. We have
considered if the second line detected most clearly in the region 2 spectrum of 2000 can
be emission from hydrogen like iron as was found in an observation of GX 1+4 with the
Chandra HETG (Paul et al. 2004). The 90% confidence limit for the centre energy of the
second line detected in the MECS spectrum of 2000 region 2 is 7.10±0.05 keV. If we fix the
center energy of the second line at 6.95 keV, (at which the second line is detected with a
3σ confidence level in the Chandra spectrum) for 65 degrees of freedom the χ2 increases
by 10 compared to a line at 7.10 keV. We therefore conclude that the second emission
line detected in the MECS spectrum is indeed Kβ line of lowly ionized or neutral iron.
Following this, we have added the second line feature in the model for all the spectrum. The
emission line at ∼ 7.1 keV, with an equivalent width in the range of 25–80 eV is present in
all BeppoSAX spectra of GX 1+4 except region 2 of the 2000 observation where it is very
strong with an equivalent width of about ∼ 0.55 keV.
A soft X-ray excess was detected in the residuals of the spectra from the 1996 and region
2 of the 2000 data. We tried various model components such as blackbody, disk-blackbody,
and bremsstrahlung to fit this soft excess. However, addition of a bremsstrahlung component
to the spectral model gives a better fit compared to the other two models for the soft excess
with an improved reduced χ2 of 1.11 and 1.27 for 1996 and the region-2 of 2000 observation
respectively. The integrated flux of the soft component in 1.0–5.0 keV energy band for 1996
and region-2 of 2000 observations is estimated to be 1.12 × 10⁻¹² ergs cm−2 s−1 and 4.7 ×
10−13 ergs cm−2 s−1 which is ∼ 4% and 18% of the total model flux in above energy band

– 7 –
respectively. The 3σ lower limit of above two observations are 2.2 × 10⁻¹³ ergs cm−2 s−1
and 4.2 × 10⁻¹³ ergs cm−2 s−1 respectively whereas the 3σ upper limit of the soft X-ray
flux during 1997, region-1 and region-3 of 2000 observations are 6.3 × 10⁻¹³, 4.1 × 10⁻¹³
and 1.6 × 10⁻¹³ ergs cm−2 s−1 respectively. We did not try the non-solar abundance for the
soft component as it is seen only in 1996 and region-2 of 2000 observations and not in the
others. Therefore, the detected soft excess in GX 1+4 is unlikely to be due to abundance
anomaly. The spectral parameters with 3σ error estimates and the reduced χ2 obtained
are given in Table 2. The region-2 spectrum along with the best fit model components and
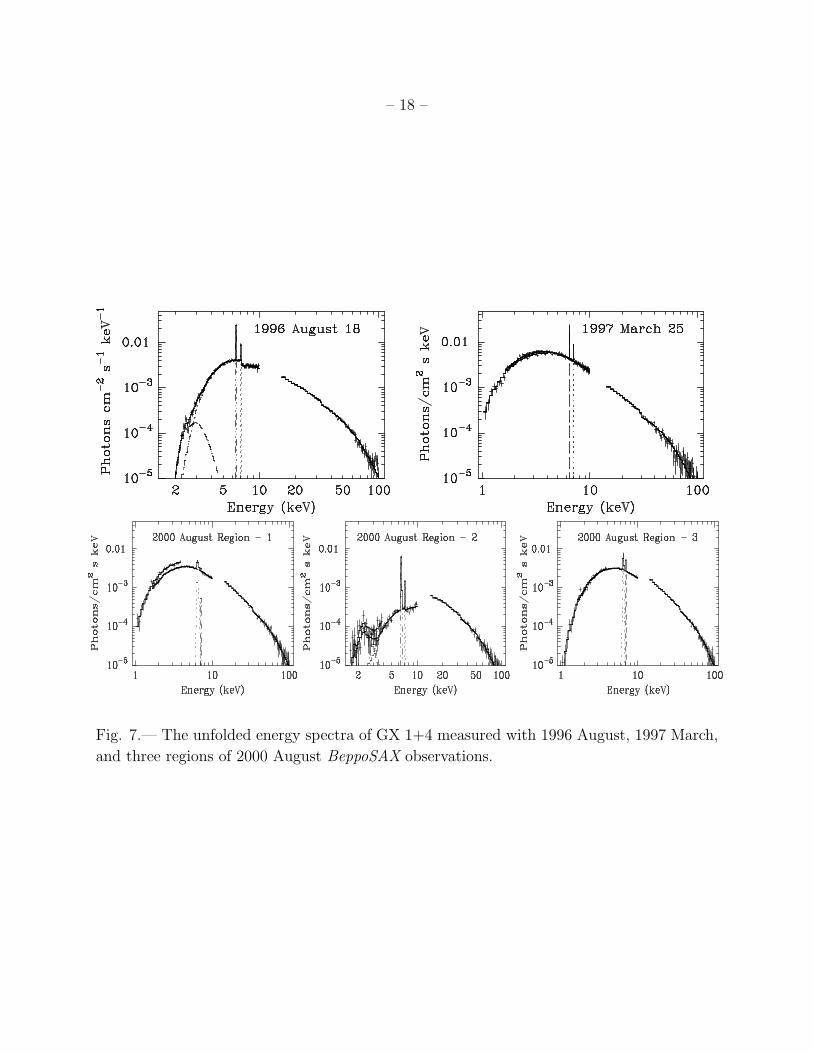
residuals without and with the iron Kβ line are shown in Figure 6. The unfolded spectra
measured during 1996, 1997 and 2000 BeppoSAX observations are shown in Figure 7.
5. Pulse phase resolved spectroscopy
Since the dip in the pulse profile of GX 1+4 shows significant energy dependence,
pulse phase resolved spectroscopy may hold a clue to the origin of the dip. To estimate the
change in spectral parameters during the dips, we have carried out pulse phase resolved
spectroscopy during all the observations. The LECS and MECS spectra were accumulated
into 10 pulse phase bins by applying phase filtering in the FTOOLS task XSELECT and
SAXDAS software package was used to extract PDS spectra at the same pulse phases. As
in the case of phase-averaged spectroscopy, the background spectra were extracted from
source free regions in the event files and appropriate response files were used for the spectral
fitting. The LECS, MECS and PDS spectra of region 1 of 2000 observation were added
with the corresponding spectra of region 3 to improve the statistics.
For the phase resolved spectral analysis, initially all the spectral parameters were
allowed to vary. However, we did not find any systematic variation in the value of NH
and iron emission line parameters with the pulse phase. We tried to fit the phase resolved
spectra of all three BeppoSAX observations by freezing NH , the absorption edge and iron
line parameters, which did not show any variation over pulse phase, to the phase averaged
values. We included the Bremsstrahlung component to the spectral fitting for the 1996 and
2000 region-2 phase resolved spectra as it was present in the phase averaged spectra. It
was found that the change in continuum flux with pulse phase in 2–10 keV and 10–100
keV energy ranges is consistent with that of the MECS and PDS pulse profiles respectively.
We found a marginal change in the values of the input spectrum temperature kT0, plasma
temperature kT and the scattering optical depth τ over pulse phase in three BeppoSAX
observations. The results of 1996, 1997 and combined regions of 1 & 3 of 2000 observations
are found to be similar. It is found that the results obtained from the phase resolved

– 8 –
spectroscopy of region-2 of 2000 observation are similar to that obtained by Galloway et al.
(2001) e.g. an increase in the optical depth at the pulse minimum.
6. Discussion
6.1. Pulsations during the extended low state
On several occasions, the accretion powered X-ray pulsar GX 1+4 was found to show
a decrease in X-ray luminosity by an order of magnitude compared to the flux before and
after such a state. The low state lasts for at least a few hours and can have rapid ingress
to and egress from the low state within only about 4-6 hours (Giles et al. 2000; present
work). Many short exposures with RXTE-PCA also found the source at a very low flux
level, about an order of magnitude lower than usual, (Cui 1997, Cui & Smith 2003). During
these low flux episodes, the pulsations were either absent, or the pulse fraction was reduced
significantly from the usual 50-80%, often below the detection limit of RXTE-PCA. This
has been interpreted as due to onset of centrifugal barrier or the propeller effect. With
decrease in the mass accretion rate, when the inner radius of the accretion disk recedes
beyond the co-rotation radius of the neutron star, this effect may set in. To compare the
2–10 keV flux during the low-state reported here with the same during earlier reported low
intensity episodes with the RXTE-PCA, when the pulsations became undetectable, we have
reanalyzed the RXTE-PCA data of those observations. The 2–10 keV flux measured from
these observations are shown in Table 2.
During the low state reported here, the absorbed X-ray flux in 2–10 keV band was
2.9× 10⁻¹¹ ergs cm−2 s−1 and is comparable to the earlier episodes when pulsations were
below the detection level of the RXTE. However, we found that as the X-ray spectrum
of GX 1+4 is very hard, the total X-ray luminosity in 10–100 keV energy band during
this state is more than an order of magnitude higher than that in the 2-10 keV band and
pulsations are clearly detected in the hard X-rays. The spectral analysis of the BeppoSAX
data showed that in the low state, the medium energy (2–10 keV) X-ray flux is reduced by
an order of magnitude, mostly due to an increase in the absorption. In comparison, the
hard X-ray flux is reduced by a factor of two only. It was also pointed out by Cui (1997)
from RXTE-PCA data that the X-ray spectrum is harder in the low state. Therefore, there
can be significant flux in the hard X-ray band, where the effective area of the RXTE-PCA
detectors fall rapidly. It is possible that the low states reported by Cui (1997) and Cui and
Smith (2004) are similar to the one presented here. Only short exposures and decreasing
hard X-ray effective area of the RXTE-PCA did not allow detection of the hard X-ray
pulses in RXTE-PCA observations during the low states. In such a scenario, the propeller

– 9 –
regime for GX 1+4 may occur at a still lower mass accretion rate than that reported earlier.
6.2. Broad band X-ray spectrum and its changes during the extended
low-state
From the three BeppoSAX observations reported here, the pulse-phase-averaged broad
band X-ray spectrum in both high and low states of GX 1+4 is found to agree well with a
Comptonization model with additional components for absorption, line emissions, and in
some cases, a soft excess. During the extended low state in 2000, the continuum flux in
the 2–10 keV decreased by a factor of ∼10 whereas the 10–100 keV flux decreased only by
about 50%. An intense iron emission line at 6.4 keV is clearly seen in the phase averaged
spectra in both the high and low intensity states. In addition, a strong emission line at
7.1 keV was also detected in the low state spectrum, which was very weak during the high
intensity states. The Kα line flux was about 3–5 times larger than the Kβ line flux in all
the observations and is consistent with the ratio expected for fluorescence emission from
neutral iron. With a moderate energy resolution of MECS it is not possible to determine
the exact ionization state of the reprocessing material.
We have also examined changes of the two hardness ratios (1.0–4.0/7.0–10.0 keV and
4.0-7.0/7.0–10.0) in the MECS energy bands during the BeppoSAX observation in 2000.
The hardness ratios clearly show increased absorption during the low state. There was
no significant spectral change associated with the intensity variations near the end of this
observation.
Although a similar low state of GX 1+4 was observed earlier, the event lasted for only
about 6 hours and detailed spectroscopy was not feasible due to poorer photon statistics
and lower energy resolution of the RXTE-PCA (Galloway et al. 2000). In this paper, we
present the first detailed spectroscopy of GX 1+4 in this state. Though both the soft and
hard X-ray flux decreased during the low state, the optical depth and temperature of the
Comptonizing plasma are comparable (within errors) with those during the high intensity
states just before and after the low intensity episode. The absorption column density is
an order of magnitude higher during the low state. An increase in absorption may not
be sole reason for the low state as the hard X-ray flux also decreased by about 50%, and
the temperature of the seed photons increased during the low state by a factor of about
two. However, the decrease in the hard X-ray flux may arise due to Thompson scattering
from the line of sight if the absorbing material is partially ionized and the actual material
in the line of sight is more than that measured with the simple absorber model. In the
Comptonization model for X-ray pulsar spectra, the seed photons are likely to be produced
– 10 –
from a heated surface of the neutron star. If there is a spherical component of accretion, it
may cause heating of the surface and these seed photons undergo Compton upscattering in
the accretion column. An increase in the temperature of the seed photons during the low
state also indicates that the low state is not only due to an increased absorption along the
line of sight. There must have been some additional change in the accretion process, for
example, and enhancement in the spherical component of mass accretion.
Fluorescence emission lines with very high equivalent width similar to those found in
GX 1+4 in the low state are seen in some persistent X-ray binary pulsars like Her X-1,
LMC X-4 and SMC X-1 during their low-intensity phases of the super orbital period (Naik
& Paul 2003; Naik & Paul 2004, Vrtilek et al. 2001). In these systems, the low-states arise
due to increased absorption of the X-ray continuum by precessing warped inner accretion
disk, resulting in a very large equivalent width. However, unlike these systems, in GX 1+4
the extended low state is observed intermittently, without any hint of a periodicity. The
RXTE/ASM light curve of GX 1+4 does not show any periodic or quasi-periodic long
term intensity variation as seen in Her X-1, LMC X-4 and SMC X-1. The difference in the
duration and absence of periodicity in the occurrence of the low states of GX 1+4 rules out
a similar mechanism for this source.
6.3. Spectral features of the absorption dip in pulse profiles of GX 1+4
Energy resolved pulse profiles of GX 1+4 obtained from BeppoSAX observations
provide useful information towards understanding the accretion geometry of the binary
system. The characteristic absorption dips are detected in wide energy range (1–100
keV). The pulse profiles in narrow energy bands as presented here in this paper, show a
gradual change with energy. An increase in width of the absorption dip with energy is
clearly seen in all three BeppoSAX observations. These narrow and sharp dips have been
attributed to the interaction between the accretion column and the emission region of the
neutron star (Galloway et al. 2001). Partial eclipses of the emission region by the accretion
column occurring during the spinning of the neutron star are reflected as dips in the pulse
profile. The closest approach of the accretion column to the line of sight corresponds to
the minimum intensity in the pulse profile. Similar sharp and narrow dips are observed
in the pulse profiles of two other X-ray pulsars RX J0812.4–3114 (Reig & Roche 1999)
and A 0535+262 (Cemeljic & Bulik 1998). However, a gradual increase in the width of
the absorption dip with energy is seen only in GX 1+4. A widening of the dip at higher
energies may result from changes in the beam pattern with energy. Outside the dip, the
high energy photons are typically those which have undergone many scatterings. Except
– 11 –
along the accretion column, where both the low and high energy photons are strongly
suppressed, the high energy photons escape from the column preferentially at large angles,
whereas low-energy photons are more isotropic. The emission geometry may change from a
pencil beam at low energy to a fan beam at high energy.
We have detected marginal evidence of spectral changes during the pulse phase in
the form of a varying optical depth, plasma temperature and temperature of the soft seed
photons. The pulse phase dependence of these parameters is not identical during different
observations and the implication of the pattern of these variations is not clear.
Acknowledgments
We thank an anonymous referee for suggestions which helped us to improved the
content of this paper. The Beppo-SAX satellite is a joint Italian and Dutch program. We
thank the staff members of Beppo-SAX Science Data Center and RXTE/ASM group for
making the data public. SN is supported by IRCSET through EMBARK postdoctoral
fellowship.
REFERENCES
Boella, G., Butler, R. C., Perola, G. C., et al. 1997, A&AS, 122, 299
Cemeljic, M., & Bulik, T. 1998, Acta Astron., 48, 65
Chakrabarty, D., Bildsten, L., Finger, M. H., et al. 1997, ApJ, 481, L101
Chakrabarty, D. & Roche P. 1997, ApJ, 489, 254
Table 1. BeppoSAX observations of GX 1+4
Year of Start Time End Time LECS Exp. MECS Exp. PDS Exp.
Observation (Date, UT) (Date, UT) (ks) (ks) (ks)
1996 August 18, 06:11 August 19, 03:38 —– 38.6 17.6
1997 March 25, 22:43 March 26, 16:08 13 31.5 13.5
2000 August 29, 12:36 September 02, 03:38 56.5 132 58.5
– 12 –
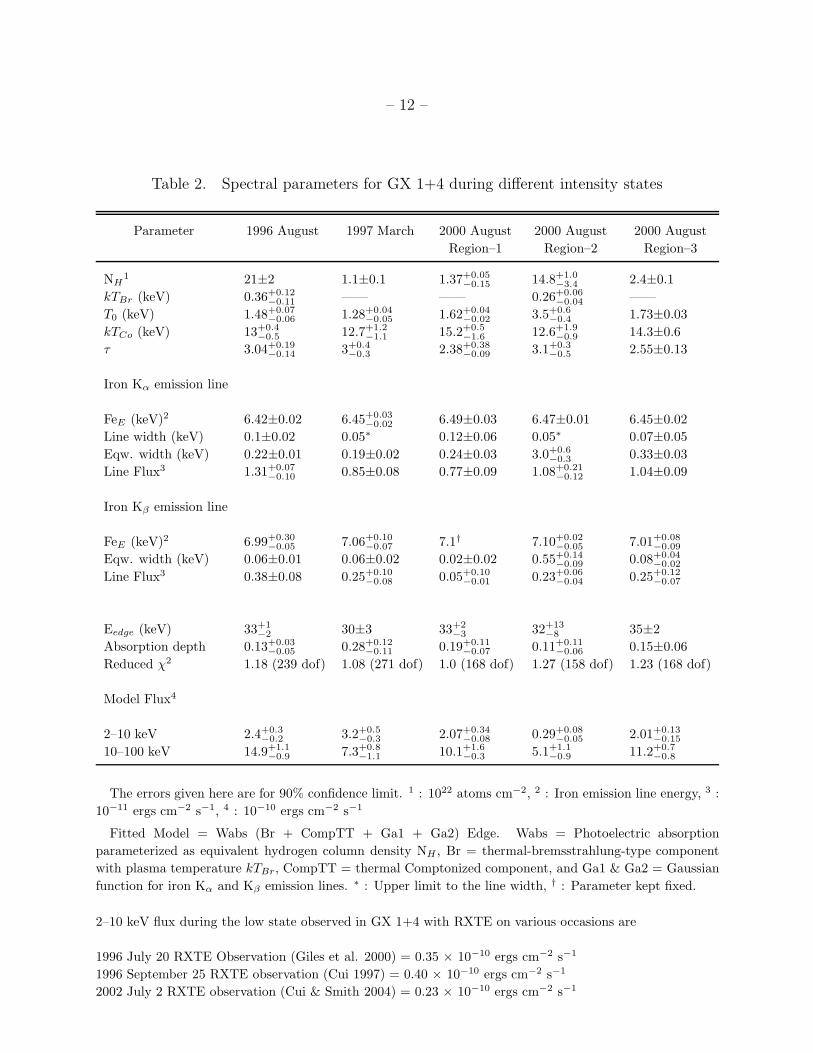
Table 2. Spectral parameters for GX 1+4 during different intensity states
Parameter 1996 August 1997 March 2000 August 2000 August 2000 August
Region–1 Region–2 Region–3
NH1 21±2 1.1±0.1 1.37+0.05
−0.15 14.8+1.0−3.4 2.4±0.1
kTBr (keV) 0.36+0.12−0.11 —— —— 0.26+0.06
−0.04 ——
T0 (keV) 1.48+0.07−0.06 1.28+0.04
−0.05 1.62+0.04−0.02 3.5+0.6
−0.4 1.73±0.03
kTCo (keV) 13+0.4−0.5 12.7+1.2
−1.1 15.2+0.5−1.6 12.6+1.9
−0.9 14.3±0.6
τ 3.04+0.19−0.14 3+0.4
−0.3 2.38+0.38−0.09 3.1+0.3
−0.5 2.55±0.13
Iron Kα emission line
FeE (keV)2 6.42±0.02 6.45+0.03−0.02 6.49±0.03 6.47±0.01 6.45±0.02
Line width (keV) 0.1±0.02 0.05∗ 0.12±0.06 0.05∗ 0.07±0.05
Eqw. width (keV) 0.22±0.01 0.19±0.02 0.24±0.03 3.0+0.6−0.3 0.33±0.03
Line Flux3 1.31+0.07−0.10 0.85±0.08 0.77±0.09 1.08+0.21
−0.12 1.04±0.09
Iron Kβ emission line
FeE (keV)2 6.99+0.30−0.05 7.06+0.10
−0.07 7.1† 7.10+0.02−0.05 7.01+0.08
−0.09
Eqw. width (keV) 0.06±0.01 0.06±0.02 0.02±0.02 0.55+0.14−0.09 0.08+0.04
−0.02
Line Flux3 0.38±0.08 0.25+0.10−0.08 0.05+0.10
−0.01 0.23+0.06−0.04 0.25+0.12
−0.07
Eedge (keV) 33+1−2 30±3 33+2
−3 32+13−8 35±2
Absorption depth 0.13+0.03−0.05 0.28+0.12
−0.11 0.19+0.11−0.07 0.11+0.11
−0.06 0.15±0.06
Reduced χ2 1.18 (239 dof) 1.08 (271 dof) 1.0 (168 dof) 1.27 (158 dof) 1.23 (168 dof)
Model Flux4
2–10 keV 2.4+0.3−0.2 3.2+0.5
−0.3 2.07+0.34−0.08 0.29+0.08
−0.05 2.01+0.13−0.15
10–100 keV 14.9+1.1−0.9 7.3+0.8
−1.1 10.1+1.6−0.3 5.1+1.1
−0.9 11.2+0.7−0.8
The errors given here are for 90% confidence limit. 1 : 1022 atoms cm−2, 2 : Iron emission line energy, 3 :
10−11 ergs cm−2 s−1, 4 : 10−10 ergs cm−2 s−1
Fitted Model = Wabs (Br + CompTT + Ga1 + Ga2) Edge. Wabs = Photoelectric absorption
parameterized as equivalent hydrogen column density NH , Br = thermal-bremsstrahlung-type component
with plasma temperature kTBr, CompTT = thermal Comptonized component, and Ga1 & Ga2 = Gaussian
function for iron Kα and Kβ emission lines. ∗ : Upper limit to the line width, † : Parameter kept fixed.
2–10 keV flux during the low state observed in GX 1+4 with RXTE on various occasions are
1996 July 20 RXTE Observation (Giles et al. 2000) = 0.35 × 10⁻¹⁰ ergs cm−2 s−1
1996 September 25 RXTE observation (Cui 1997) = 0.40 × 10⁻¹⁰ ergs cm−2 s−1
2002 July 2 RXTE observation (Cui & Smith 2004) = 0.23 × 10⁻¹⁰ ergs cm−2 s−1
– 13 –
Cui, W. 1997, ApJ, 482, L163
Cui, W. & Smith, B. 2004, ApJ, 602, 320
Dotani, T, Kii, T., Nagase, F., et al. 1989, PASJ, 41, 427
Frontera, F., Costa, E., Dal Fiume, D., et al. 1997, A&AS, 122, 357
Galloway, D. K. 2000, ApJ, 543, L137
Galloway, D. K., Giles, A. B., Greenhill, J. G., & Storey, M. C. 2000, MNRAS, 311, 755
Galloway, D. K., Giles, A. B., Wu, K., & Greenhill, J. G. 2001, MNRAS, 325, 419
Ghosh, P., & Lamb, F. K. 1979, ApJ, 234, 296
Giles, A. B., Galloway, D. K., Greenhill, J. G., et al. 2000, ApJ, 529, 447
Greenhill, J. G., Sharma, D. P., Dieters, S. W. B. et al. 1993, MNRAS, 260, 21
Makishima, K., Ohashi, T., Sakao, T., et al. 1988, Nature, 33, 746
Naik, S., & Paul, B. 2003, A&A, 401, 265
Naik, S., & Paul, B. 2004, ApJ, 600, 351
Paul, B., Rao, A. R., & Singh, K. P. 1997a, A&A, 320, L9
Paul, B., Agrawal, P. C., Rao, A. R., & Manchanda, R. K. 1997b, A&A, 319, 507
Paul, B., Dotani, T., Nagase, F., Mukherjee, U., & Naik, S. 2004, ApJ (submitted)
Pereira, M. G., Braga, J., & Jablonski, F. 1999, ApJ, 526, L105
Rao, A. R., Paul, B., Chitnis, V. R., Agrawal, P. C., & Manchanda, R. K. 1994, A&A, 289,
L43
Reig, P., & Roche, P. 1999, MNRAS, 306, 95
Vrtilek, S. D., Raymond, J. C., Boroson, B., Kallman, T., Quaintrell, H., & McCray, R.
2001, ApJ, 563, L139
This preprint was prepared with the AAS LATEX macros v4.0.
– 14 –
Fig. 1.— The MECS and PDS light curves with time bin same as the spin period of the
neutron star obtained from the 2000 BeppoSAX observation of GX 1+4.
Fig. 2.— The MECS and PDS pulse profiles of the source, of the three observations, are
shown in top and bottom panels with 32 phase bins per pulse respectively. Two pulses are
shown for clarity.
– 15 –
Fig. 3.— The MECS and PDS pulse profiles of the three different regions of 2000 BeppoSAX
observation (as shown in Figure 1) of GX 1+4.
Fig. 4.— The MECS and PDS pulse profiles of GX 1+4 in 16 different energy bands (as
described in text) of 1996 August observation.
– 16 –
Fig. 5.— The MECS and PDS pulse profiles of GX 1+4 in 12 different energy bands (as
described in text) of region-2 of 2000 August observation.

– 17 –
Fig. 6.— Energy spectra of GX 1+4 measured with BeppoSAX during the region 2 of 2000
August observation along with the fitted model (without iron Kβ emission line) and the
residuals (middle panel). The presence of iron Kβ line is evident from the line like structure
at ∼ 7.1 keV in the residual. Residuals obtained after including a Gaussian function at 7.1
keV in the model are shown in the bottom panel.
– 18 –
Fig. 7.— The unfolded energy spectra of GX 1+4 measured with 1996 August, 1997 March,
and three regions of 2000 August BeppoSAX observations.