Detection and impacts of leakage from sub-seafloor deep geological carbon dioxide storage
6
LETTERS PUBLISHED ONLINE: 28 SEPTEMBER 2014 | DOI: 10.1038/NCLIMATE2381 Detection and impacts of leakage from sub-seafloor deep geological carbon dioxide storage Jerry Blackford, Henrik Stahl, Jonathan M. Bull et al. † Fossil fuel power generation and other industrial emissions of carbon dioxide are a threat to global climate 1 , yet many economies will remain reliant on these technologies for several decades 2 . Carbon dioxide capture and storage (CCS) in deep geological formations provides an eective option to remove these emissions from the climate system 3 . In many regions storage reservoirs are located oshore 4,5 , over a kilometre or more below societally important shelf seas 6 . Therefore, concerns about the possibility of leakage 7,8 and potential environmental impacts, along with economics, have contributed to delaying development of operational CCS. Here we investigate the detectability and environmental impact of leakage from a controlled sub-seabed release of CO 2 . We show that the biological impact and footprint of this small leak analogue (<1 tonne CO 2 d -1 ) is confined to a few tens of metres. Migration of CO 2 through the shallow seabed is influenced by near-surface sediment structure, and by dissolution and re-precipitation of calcium carbonate naturally present in sediments. Results reported here advance the understanding of environmental sensitivity to leakage and identify appropriate monitoring strategies for full-scale carbon storage operations. Geological CO 2 storage is proposed in deep, porous, sedimentary formations, 1–2 km below the sea floor, such as depleted oil and gas reservoirs or saline aquifers 3,4 . Storage integrity is provided by impermeable layers of cap-rock 3 . Although debated, a number of mechanisms potentially facilitating leakage have been proposed, including abandoned exploratory boreholes, geological discontinuities (for example, fractures) and operational malfunction (blowout scenario) 9 . Here we do not address storage integrity, but focus on the likely environmental consequence of leakage, and how best to detect leakage if it were to reach the marine environment. Research on excess CO 2 in marine systems is frequently based on laboratory experiments and studies of natural CO 2 seeps 10,11 . How- ever, laboratory studies omit physical, ecological and behavioural complexity, which are key in understanding and regulating impacts. Further, volcanic CO 2 seeps are compromised by impurities and atypical thermal, topographical and sedimentological properties 12 , and the initial evolution of CO 2 flow is not known. Early detection of leakage that has reached the seabed from deep CCS storage formations is crucial for assurance, and monitoring must be viable in complex hydrodynamic environments. Consequently, we conducted a shallow controlled sub-seabed CO 2 release to replicate small-scale, but realistic, leakage that has migrated into the near-seabed environ- ment. A borehole was drilled from shore, to a depth of 11 m beneath the sea floor, in 12 m of water and 350 m offshore (Supplementary Fig. 1). A total of 4.2 tonnes of CO 2 was injected into the overlying unconsolidated sediments, over a 37 day period, during which flow was increased from 10 to 210 kg d -1 . The temporal and spatial migration and impact of this CO 2 release were assessed using a va- riety of acoustic, chemical and biological techniques, before, during and after release at both control and exposed sites (see Methods and Supplementary Table 1). The experimental results are directly applicable to most global offshore storage sites 3 , which are planned for shelf seas with water depths up to 200 m. CO 2 phase chemistry and benthic biogeochemical processes are consistent across this depth interval. The physical movement of the injected CO 2 through the seabed was clearly imaged (Fig. 1). Within hours of commencing CO 2 injection, small gas bubble plumes were observed at the sea floor. Seismic imaging of the sediments revealed a layered structure consisting of 8 m of fine laminated mud, overlain by 2 m of fine silty sand with 1–2 m of coarse-grained sand and gravel forming the seabed (Fig. 1a, inset). Repeated seismic reflection surveys showed that during the first 13 days of release, with CO 2 injection between 10 and 80 kg d -1 , most CO 2 was confined to a vertical gas ‘chimney’ in the lower laminated mud (Fig. 1a). Within these muds, fracture propagation, or reactivation of pre-existing fractures is inevitable and rapid once a critical pressure is exceeded. This is dependent on sediment cohesiveness, injection rate and cumulative gas flux 13–15 . Thus, chimneys are interpreted to represent a laterally restricted (that is, 5–10 m wide) network of interconnected fractures (Fig. 1c). The change in grain size from mud to overlying silt and sand caused a step-change from a fracture-dominated flow regime to one dominated by capillary invasion 15 and fluidization with lower permeability. This is evidenced by the observed accumulation and lateral spread of gas at the top of the laminated mud layer (Fig. 1c, green outline). The absence of reflectance signals in the upper layers during early stages of the release is consistent with slow diffusion of gas. The initial flow of CO 2 into the water column is restricted and thought to occur through pre-existent micro fractures, beyond the resolution of seismic imaging. The increased injection rate (210 kg d -1 ) applied during the second half of the experiment permits gas to fracture the silty sand layer (Fig. 1b), and permeate through the seabed’s coarse-grained sand and gravels, consistent with chimneys extending from the injection point to the sea floor. Consequently sub-surface flow becomes more spatially focused with time as the flow rate increases (Fig. 1c, pink outline). Rapid dissolution of gaseous CO 2 into sea water significantly increases bottom-water CO 2 partial pressure close to the injection site, with values varying between 380 and 1,500 μatm, depending on the state of the tide and injection rate, compared with background values of 360–370 μatm (Fig. 2b). The flux of gaseous CO 2 across † A full list of authors and aliations appears at the end of the paper. NATURE CLIMATE CHANGE | ADVANCE ONLINE PUBLICATION | www.nature.com/natureclimatechange 1 © 2014 Macmillan Publishers Limited. All rights reserved.
Transcript of Detection and impacts of leakage from sub-seafloor deep geological carbon dioxide storage
LETTERSPUBLISHED ONLINE: 28 SEPTEMBER 2014 | DOI: 10.1038/NCLIMATE2381
Detection and impacts of leakage fromsub-seafloor deep geological carbondioxide storageJerry Blackford, Henrik Stahl, Jonathan M. Bull et al.†
Fossil fuel power generation and other industrial emissionsof carbon dioxide are a threat to global climate1, yet manyeconomies will remain reliant on these technologies forseveral decades2. Carbon dioxide capture and storage (CCS)in deep geological formations provides an e�ective optionto remove these emissions from the climate system3. Inmany regions storage reservoirs are located o�shore4,5, overa kilometre or more below societally important shelf seas6.Therefore, concerns about the possibility of leakage7,8 andpotential environmental impacts, along with economics, havecontributed to delaying development of operational CCS. Herewe investigate the detectability and environmental impact ofleakage from a controlled sub-seabed release of CO2. We showthat the biological impact and footprint of this small leakanalogue(<1 tonneCO2 d−1) is confinedtoa fewtensofmetres.Migration of CO2 through the shallow seabed is influencedby near-surface sediment structure, and by dissolution andre-precipitation of calcium carbonate naturally present insediments.Results reportedhereadvance theunderstandingofenvironmental sensitivity to leakage and identify appropriatemonitoring strategies for full-scale carbon storage operations.
Geological CO2 storage is proposed in deep, porous, sedimentaryformations, 1–2 km below the sea floor, such as depleted oiland gas reservoirs or saline aquifers3,4. Storage integrity isprovided by impermeable layers of cap-rock3. Although debated, anumber of mechanisms potentially facilitating leakage have beenproposed, including abandoned exploratory boreholes, geologicaldiscontinuities (for example, fractures) and operationalmalfunction(blowout scenario)9. Here we do not address storage integrity, butfocus on the likely environmental consequence of leakage, and howbest to detect leakage if it were to reach the marine environment.
Research on excess CO2 in marine systems is frequently based onlaboratory experiments and studies of natural CO2 seeps10,11. How-ever, laboratory studies omit physical, ecological and behaviouralcomplexity, which are key in understanding and regulating impacts.Further, volcanic CO2 seeps are compromised by impurities andatypical thermal, topographical and sedimentological properties12,and the initial evolution of CO2 flow is not known. Early detectionof leakage that has reached the seabed from deep CCS storageformations is crucial for assurance, andmonitoringmust be viable incomplex hydrodynamic environments. Consequently, we conducteda shallow controlled sub-seabed CO2 release to replicate small-scale,but realistic, leakage that hasmigrated into the near-seabed environ-ment. A borehole was drilled from shore, to a depth of 11m beneaththe sea floor, in 12m of water and 350m offshore (SupplementaryFig. 1). A total of 4.2 tonnes of CO2 was injected into the overlying
unconsolidated sediments, over a 37 day period, during which flowwas increased from 10 to 210 kg d−1. The temporal and spatialmigration and impact of this CO2 release were assessed using a va-riety of acoustic, chemical and biological techniques, before, duringand after release at both control and exposed sites (see Methodsand Supplementary Table 1). The experimental results are directlyapplicable to most global offshore storage sites3, which are plannedfor shelf seas with water depths up to 200m. CO2 phase chemistryand benthic biogeochemical processes are consistent across thisdepth interval.
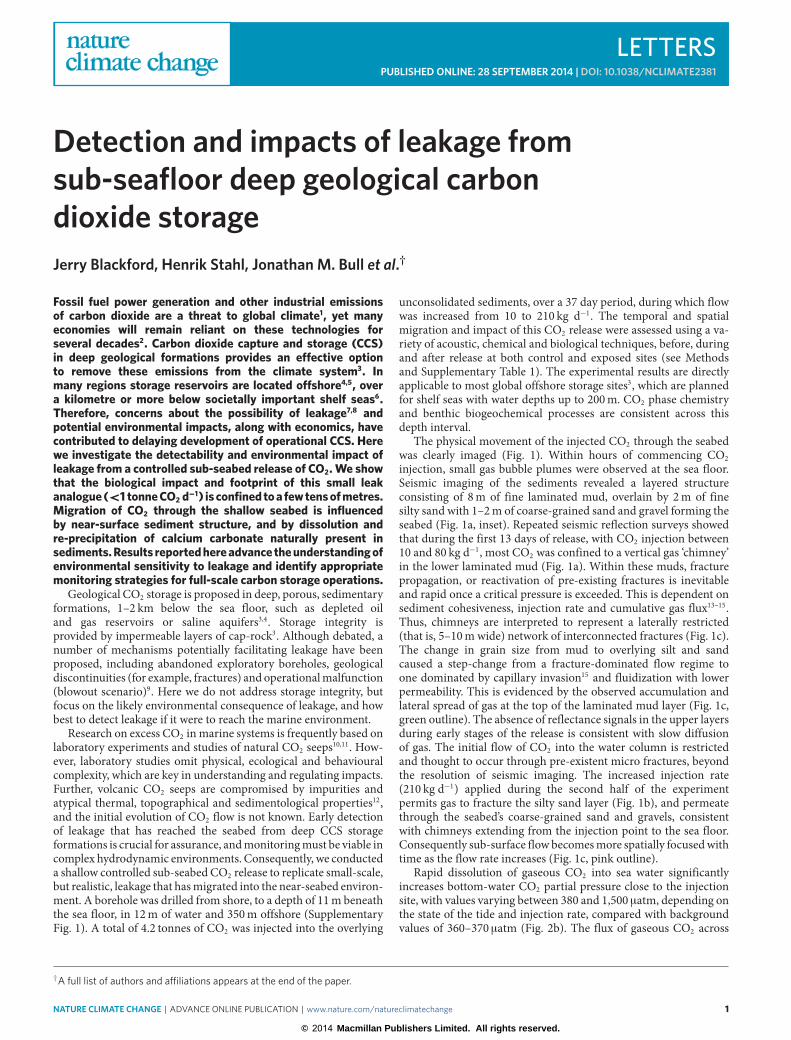
The physical movement of the injected CO2 through the seabedwas clearly imaged (Fig. 1). Within hours of commencing CO2injection, small gas bubble plumes were observed at the sea floor.Seismic imaging of the sediments revealed a layered structureconsisting of 8m of fine laminated mud, overlain by 2m of finesilty sand with 1–2m of coarse-grained sand and gravel forming theseabed (Fig. 1a, inset). Repeated seismic reflection surveys showedthat during the first 13 days of release, with CO2 injection between10 and 80 kg d−1, most CO2 was confined to a vertical gas ‘chimney’in the lower laminated mud (Fig. 1a). Within these muds, fracturepropagation, or reactivation of pre-existing fractures is inevitableand rapid once a critical pressure is exceeded. This is dependent onsediment cohesiveness, injection rate and cumulative gas flux13–15.Thus, chimneys are interpreted to represent a laterally restricted(that is, 5–10m wide) network of interconnected fractures (Fig. 1c).The change in grain size from mud to overlying silt and sandcaused a step-change from a fracture-dominated flow regime toone dominated by capillary invasion15 and fluidization with lowerpermeability. This is evidenced by the observed accumulation andlateral spread of gas at the top of the laminated mud layer (Fig. 1c,green outline). The absence of reflectance signals in the upper layersduring early stages of the release is consistent with slow diffusionof gas. The initial flow of CO2 into the water column is restrictedand thought to occur through pre-existent micro fractures, beyondthe resolution of seismic imaging. The increased injection rate(210 kg d−1) applied during the second half of the experimentpermits gas to fracture the silty sand layer (Fig. 1b), and permeatethrough the seabed’s coarse-grained sand and gravels, consistentwith chimneys extending from the injection point to the sea floor.Consequently sub-surface flow becomesmore spatially focusedwithtime as the flow rate increases (Fig. 1c, pink outline).
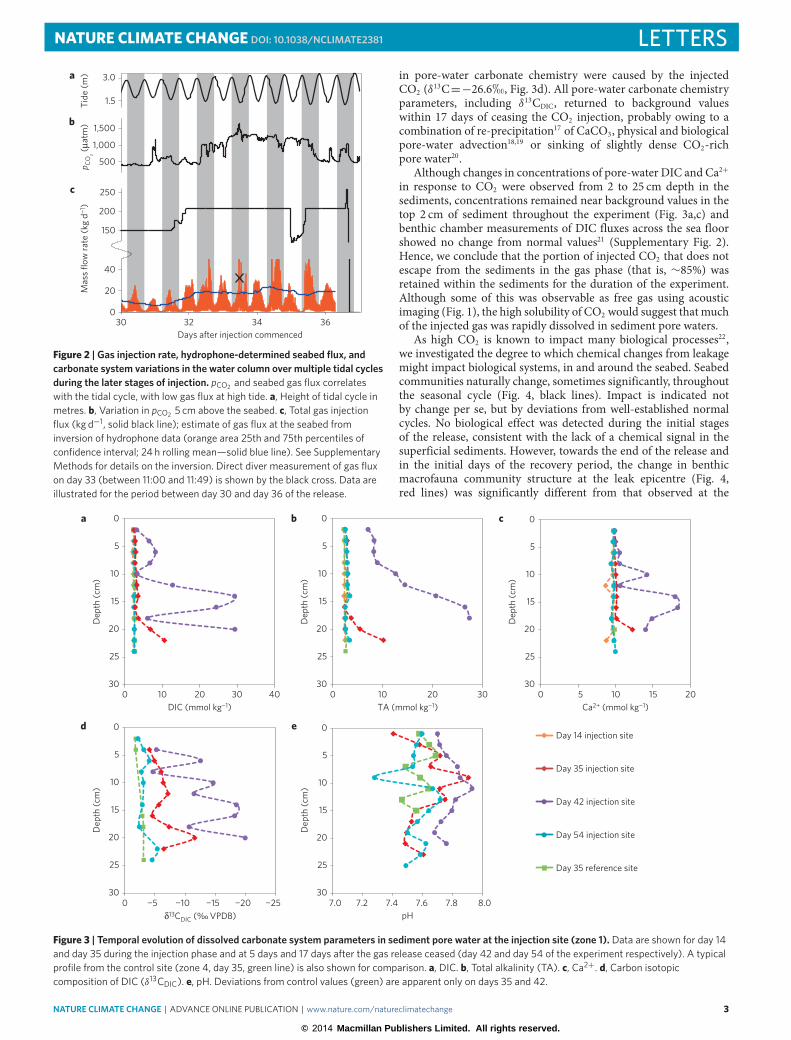
Rapid dissolution of gaseous CO2 into sea water significantlyincreases bottom-water CO2 partial pressure close to the injectionsite, with values varying between 380 and 1,500 µatm, depending onthe state of the tide and injection rate, compared with backgroundvalues of 360–370 µatm (Fig. 2b). The flux of gaseous CO2 across
†A full list of authors and a�liations appears at the end of the paper.
NATURE CLIMATE CHANGE | ADVANCE ONLINE PUBLICATION | www.nature.com/natureclimatechange 1
© 2014 Macmillan Publishers Limited. All rights reserved.

LETTERS NATURE CLIMATE CHANGE DOI: 10.1038/NCLIMATE2381
DiffuserHydrophonepCO2
sensorSeismic line detailed in aSeismic line detailed in bPockmarks/position of gas streamsSeismic chimney outline on day 13Seismic chimney outline on day 34
10 m
20151050m
a b
c
Distance (m)
SBM
10
15
20
25
30
35
40
450 30 60 90 120
Distance (m)0 30 60 90 120
Two-
way
tim
e (m
s)
10
15
20
25
30
35
40
45
Two-
way
tim
e (m
s)
Bedrock
Seabed
Laminatedmud
Laminatedmud
Fine sand
Coarse sandand gravel
SBM
Bedrock
Seabed
25
20
15
10
Depth (m
)
25
20
15
10
Depth (m
)
UU U
U
Seabed
Coarse sandand gravel
Fine sand
11 m
Figure 1 | Seismic reflection profiles and seabed mapping illustrating gas pathways above the CO2 di�user. The position of the di�user 11 m beneath theseabed is indicated by the red dots and red line. Insets show line drawing interpretations. The seabed multiple (SBM) is an artefact. a, Day 13. The dataimage a bright spot beneath the fine sand layer. This is interpreted as free gas being trapped beneath the unconformity (U), and no gas is imaged in thewater column. b, Day 34. Enhanced reflectivity above the di�user, and acoustic turbidity from the di�user to the seabed and into the water column areinterpreted as free gas. c, Plan-view multibeam image of CO2 leakage at the seabed on day 34. Gas-emitting pockmarks sit within the area of the chimneysimaged by seismic reflection data on day 13 and day 34. The sub-surface flow became more spatially focused with time as the flow rates were increased.The locations of the hydrophone and pCO2 instruments (data shown in Fig. 2) are indicated. (Supplementary Fig. 1).
the sea floor was determined directly by divers collecting bubblesfrom each bubble stream, and estimated by acoustic inversion ofhydrophone data16. On day 33, direct measurements yielded anestimated total CO2 flow of 31.8 kg d−1 (Fig. 2c). At this time theinput into the system was 210 kg d−1; hence, only ∼15% of totalCO2 was being emitted in a gaseous phase across the sediment–water interface. Gaseous CO2 flow rates estimated from acousticinversion (Fig. 2c) varied significantly with tidally induced changesin hydrostatic pressure (Fig. 2a), agreeing well with observationsfrom time-lapse photography and pCO2 data (Fig. 2b), and withflow determined by diver measurement. The 24 h rolling-averageacoustically inferred gas flux responds consistently to the increasedinjection rate on day 31 (Fig. 2c) and suggests that outgassingof 15% of the total injected CO2 was representative of the entirerelease phase.
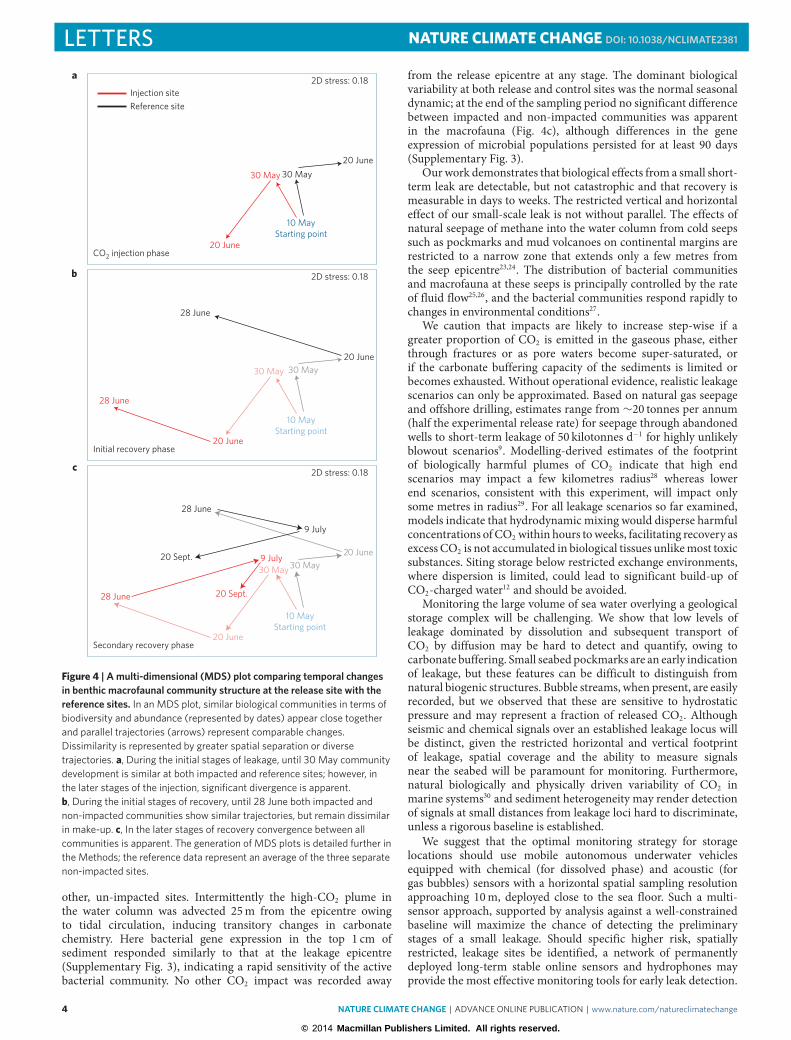
The chemical response in the sediment pore waters wascomplex. CO2-induced chemical changes in the biotic upper
25 cm of pore waters were not observed until the last weekof the CO2 injection period, and persisted for a maximum oftwo weeks after the release was stopped. During this period,dissolved inorganic carbon (DIC, dissolved CO2 and associatedinorganic carbon species) increased by a factor of ten fromtypical values of 2.6mmol kg−1 to 29.3mmol kg−1 approximately20 cm below the sediment surface (Fig. 3a). Coincident increasedconcentrations of pore-water alkalinity and calcium ions (Ca2+;Fig. 3b,c) indicate that the injected CO2 that dissolves promotesrapid dissolution of calcium carbonate (CaCO3), naturally presentin the sediments. In corroboration of this, pore-water acidity(pH) initially drops slightly from 7.7 to 7.5, and then increasesto 7.8 just after the injection was stopped (Fig. 3e), indicatingthat the rise in DIC was buffered by the carbonate dissolution.Carbon isotopic composition of pore-water DIC at the releaseepicentre (δ13CDIC = ∼−20h) was significantly lower thanbackground pore water (∼−2h), which confirms that changes
2 NATURE CLIMATE CHANGE | ADVANCE ONLINE PUBLICATION | www.nature.com/natureclimatechange
© 2014 Macmillan Publishers Limited. All rights reserved.
NATURE CLIMATE CHANGE DOI: 10.1038/NCLIMATE2381 LETTERS
0
20
40
150
200
250
500
1,000
1,500
1.5
3.0M
ass
flow
rate
(kg
d−1)
p CO
2 (µat
m)
Tide
(m)
30 32 34 36Days after injection commenced
a
b
c
Figure 2 | Gas injection rate, hydrophone-determined seabed flux, andcarbonate system variations in the water column over multiple tidal cyclesduring the later stages of injection. pCO2 and seabed gas flux correlateswith the tidal cycle, with low gas flux at high tide. a, Height of tidal cycle inmetres. b, Variation in pCO2 5 cm above the seabed. c, Total gas injectionflux (kg d−1, solid black line); estimate of gas flux at the seabed frominversion of hydrophone data (orange area 25th and 75th percentiles ofconfidence interval; 24 h rolling mean—solid blue line). See SupplementaryMethods for details on the inversion. Direct diver measurement of gas fluxon day 33 (between 11:00 and 11:49) is shown by the black cross. Data areillustrated for the period between day 30 and day 36 of the release.
in pore-water carbonate chemistry were caused by the injectedCO2 (δ13C=−26.6h, Fig. 3d). All pore-water carbonate chemistryparameters, including δ13CDIC, returned to background valueswithin 17 days of ceasing the CO2 injection, probably owing to acombination of re-precipitation17 of CaCO3, physical and biologicalpore-water advection18,19 or sinking of slightly dense CO2-richpore water20.
Although changes in concentrations of pore-water DIC and Ca2+in response to CO2 were observed from 2 to 25 cm depth in thesediments, concentrations remained near background values in thetop 2 cm of sediment throughout the experiment (Fig. 3a,c) andbenthic chamber measurements of DIC fluxes across the sea floorshowed no change from normal values21 (Supplementary Fig. 2).Hence, we conclude that the portion of injected CO2 that does notescape from the sediments in the gas phase (that is, ∼85%) wasretained within the sediments for the duration of the experiment.Although some of this was observable as free gas using acousticimaging (Fig. 1), the high solubility of CO2 would suggest that muchof the injected gas was rapidly dissolved in sediment pore waters.
As high CO2 is known to impact many biological processes22,we investigated the degree to which chemical changes from leakagemight impact biological systems, in and around the seabed. Seabedcommunities naturally change, sometimes significantly, throughoutthe seasonal cycle (Fig. 4, black lines). Impact is indicated notby change per se, but by deviations from well-established normalcycles. No biological effect was detected during the initial stagesof the release, consistent with the lack of a chemical signal in thesuperficial sediments. However, towards the end of the release andin the initial days of the recovery period, the change in benthicmacrofauna community structure at the leak epicentre (Fig. 4,red lines) was significantly different from that observed at the
30
25
20
15
10
5
0
0 10 20 30 40
Dep
th (c
m)
30
25
20
15
10
5
0
Dep
th (c
m)
30
25
20
15
10
5
0
Dep
th (c
m)
30
25
20
15
10
5
0
Dep
th (c
m)
30
25
20
15
10
5
0D
epth
(cm
)
DIC (mmol kg−1) TA (mmol kg−1) Ca2+ (mmol kg−1)0 10 20 30 0 5 10 15 20
−25−20−15−10−50 7.0 7.2 7.4 7.6 7.8 8.0pH
Day 14 injection site
Day 35 injection site
Day 42 injection site
Day 54 injection site
Day 35 reference site
a b
d e
c
δ13CDIC ( VPDB)%%
Figure 3 | Temporal evolution of dissolved carbonate system parameters in sediment pore water at the injection site (zone 1). Data are shown for day 14and day 35 during the injection phase and at 5 days and 17 days after the gas release ceased (day 42 and day 54 of the experiment respectively). A typicalprofile from the control site (zone 4, day 35, green line) is also shown for comparison. a, DIC. b, Total alkalinity (TA). c, Ca2+. d, Carbon isotopiccomposition of DIC (δ13CDIC). e, pH. Deviations from control values (green) are apparent only on days 35 and 42.
NATURE CLIMATE CHANGE | ADVANCE ONLINE PUBLICATION | www.nature.com/natureclimatechange 3
© 2014 Macmillan Publishers Limited. All rights reserved.
LETTERS NATURE CLIMATE CHANGE DOI: 10.1038/NCLIMATE2381
2D stress: 0.18
30 May
28 June
20 June
30 May
10 MayStarting point
20 June
28 June
Initial recovery phase
b
2D stress: 0.18
30 May
28 June
20 June
9 July
20 Sept.
30 May
9 July
20 Sept.
10 MayStarting point
20 June
28 June
Secondary recovery phase
c
2D stress: 0.18
30 May
20 June
30 May
10 MayStarting point
20 June
Injection siteReference site
CO2 injection phase
a
Figure 4 | A multi-dimensional (MDS) plot comparing temporal changesin benthic macrofaunal community structure at the release site with thereference sites. In an MDS plot, similar biological communities in terms ofbiodiversity and abundance (represented by dates) appear close togetherand parallel trajectories (arrows) represent comparable changes.Dissimilarity is represented by greater spatial separation or diversetrajectories. a, During the initial stages of leakage, until 30 May communitydevelopment is similar at both impacted and reference sites; however, inthe later stages of the injection, significant divergence is apparent.b, During the initial stages of recovery, until 28 June both impacted andnon-impacted communities show similar trajectories, but remain dissimilarin make-up. c, In the later stages of recovery convergence between allcommunities is apparent. The generation of MDS plots is detailed further inthe Methods; the reference data represent an average of the three separatenon-impacted sites.
other, un-impacted sites. Intermittently the high-CO2 plume inthe water column was advected 25m from the epicentre owingto tidal circulation, inducing transitory changes in carbonatechemistry. Here bacterial gene expression in the top 1 cm ofsediment responded similarly to that at the leakage epicentre(Supplementary Fig. 3), indicating a rapid sensitivity of the activebacterial community. No other CO2 impact was recorded away
from the release epicentre at any stage. The dominant biologicalvariability at both release and control sites was the normal seasonaldynamic; at the end of the sampling period no significant differencebetween impacted and non-impacted communities was apparentin the macrofauna (Fig. 4c), although differences in the geneexpression of microbial populations persisted for at least 90 days(Supplementary Fig. 3).
Ourwork demonstrates that biological effects from a small short-term leak are detectable, but not catastrophic and that recovery ismeasurable in days to weeks. The restricted vertical and horizontaleffect of our small-scale leak is not without parallel. The effects ofnatural seepage of methane into the water column from cold seepssuch as pockmarks and mud volcanoes on continental margins arerestricted to a narrow zone that extends only a few metres fromthe seep epicentre23,24. The distribution of bacterial communitiesand macrofauna at these seeps is principally controlled by the rateof fluid flow25,26, and the bacterial communities respond rapidly tochanges in environmental conditions27.
We caution that impacts are likely to increase step-wise if agreater proportion of CO2 is emitted in the gaseous phase, eitherthrough fractures or as pore waters become super-saturated, orif the carbonate buffering capacity of the sediments is limited orbecomes exhausted. Without operational evidence, realistic leakagescenarios can only be approximated. Based on natural gas seepageand offshore drilling, estimates range from ∼20 tonnes per annum(half the experimental release rate) for seepage through abandonedwells to short-term leakage of 50 kilotonnes d−1 for highly unlikelyblowout scenarios9. Modelling-derived estimates of the footprintof biologically harmful plumes of CO2 indicate that high endscenarios may impact a few kilometres radius28 whereas lowerend scenarios, consistent with this experiment, will impact onlysome metres in radius29. For all leakage scenarios so far examined,models indicate that hydrodynamic mixing would disperse harmfulconcentrations of CO2 within hours toweeks, facilitating recovery asexcess CO2 is not accumulated in biological tissues unlikemost toxicsubstances. Siting storage below restricted exchange environments,where dispersion is limited, could lead to significant build-up ofCO2-charged water12 and should be avoided.
Monitoring the large volume of sea water overlying a geologicalstorage complex will be challenging. We show that low levels ofleakage dominated by dissolution and subsequent transport ofCO2 by diffusion may be hard to detect and quantify, owing tocarbonate buffering. Small seabed pockmarks are an early indicationof leakage, but these features can be difficult to distinguish fromnatural biogenic structures. Bubble streams, when present, are easilyrecorded, but we observed that these are sensitive to hydrostaticpressure and may represent a fraction of released CO2. Althoughseismic and chemical signals over an established leakage locus willbe distinct, given the restricted horizontal and vertical footprintof leakage, spatial coverage and the ability to measure signalsnear the seabed will be paramount for monitoring. Furthermore,natural biologically and physically driven variability of CO2 inmarine systems30 and sediment heterogeneity may render detectionof signals at small distances from leakage loci hard to discriminate,unless a rigorous baseline is established.
We suggest that the optimal monitoring strategy for storagelocations should use mobile autonomous underwater vehiclesequipped with chemical (for dissolved phase) and acoustic (forgas bubbles) sensors with a horizontal spatial sampling resolutionapproaching 10m, deployed close to the sea floor. Such a multi-sensor approach, supported by analysis against a well-constrainedbaseline will maximize the chance of detecting the preliminarystages of a small leakage. Should specific higher risk, spatiallyrestricted, leakage sites be identified, a network of permanentlydeployed long-term stable online sensors and hydrophones mayprovide the most effective monitoring tools for early leak detection.
4 NATURE CLIMATE CHANGE | ADVANCE ONLINE PUBLICATION | www.nature.com/natureclimatechange
© 2014 Macmillan Publishers Limited. All rights reserved.

NATURE CLIMATE CHANGE DOI: 10.1038/NCLIMATE2381 LETTERSOnce a suspected leak is detected, alternative techniques should beimplemented to corroborate the source (for example, by sensorsand isotopic signature); to quantify fluxes of CO2 (for example, byacoustic inversion for gas and sediment-pore-water incubations fordissolved phase); and to assess associated impacts (for example, bybiological sampling). Baseline studies therefore need to encompasssediment structure and carbonate content, natural seeps, theacoustic background, CO2 chemistry and biological communitystructure within the context of seasonal and spatial heterogeneity.
We do not address the robustness of deep geological storage inthis work, but provide an insight into the processes that occur ifleaked CO2 were to reach the shallow unconsolidated sedimentsimmediately underlying the seabed. This emerging understandingsynthesizing dispersion, impact and recovery suggests that small-scale leakage from CCS, should it reach the sea floor, is highlyunlikely to have a regionally significant environmental impact.Although monitoring may be challenging, it is tractable given amultivariate approach, supported by appropriate baseline studies.
MethodsThe experiment site, located on the west coast of Scotland (Supplementary Fig. 1,inset), fulfilled multiple criteria including access and logistics, regulatory releasepermissions, local approval, suitable seabed geology and sediments with diversefauna typical of regional shelf seas. Extensive high-resolution seismic reflectionprofiling and sediment core sampling were instrumental in site selection andsubsequently fully characterized the site for drilling operations. A 350-m-longborehole, subsequently lined with stainless-steel pipe was drilled throughquartzite bedrock using a directional drilling rig, avoiding glacial till deposits andnatural accumulations of biogenic gas, with the final 10m terminatinghorizontally into unconsolidated sediments (Supplementary Fig. 1). The boreholeterminated in a 5-m-long diffuser with multiple perforations of 0.5mm diameter,to ensure diffuse flow of gas into the surrounding sediments. The diffuser waspositioned 11m below the seabed and beneath a further 10–12m of water,dependent on tide height. The land-based facilities comprised CO2 cylinders;connected by manifolds, regulated by a high-precision mass-flow controller,logging at 12 s periodicity. Initial injection was commenced at 10 kg CO2 d−1 toavoid hydraulic fracturing, increasing to 210 kg CO2 d−1 to achieve a realistic fluxand biogeochemically significant signal at the seabed. The total injectionamounted to 4.2 tonnes over a 37 day period.
Surveying used a combination of boat-towed instrumentation,diver-mediated sampling and semi-permanently deployed instrumentation on thesea floor. Sampling was undertaken at four bathymetrically and ecologicallysimilar zones (zone 1: epicentre, zone 2: 25m distant, zone 3: 75m distant, zone4: 450m distant acting as a control, Supplementary Fig. 1). The sites wereinvestigated immediately before the start of CO2 release; during the 37 dayrelease period; and over one year after termination of the release(Supplementary Table 1).
High-resolution seismic reflection data comprised 194 Boomer and Chirpprofiles, covering an area of 600 by 400m centred above the diffuser location,with a 5–10m line separation. A calibrated hydrophone was deployed close to thediffuser to record the acoustic signature of gas bubbles emitted from the seabedwithin the water column.
CO2 fluxes across the sediment–water interface were quantified by directdiver collection, a passive acoustic inversion technique16 based on hydrophonedata and benthic chambers for quantifying DIC flux. The partial pressure of CO2
in the water column was monitored by a calibrated pCO2 ion-sensitive field-effecttransistor electrode31 moored at 5 cm height above the seabed at the centre of therelease site.
Sediment samples for pore-water biogeochemistry analysis, including DIC,total alkalinity, pH, isotopic composition (δ13CDIC), Ca2+ and biological samples,were manually collected in shallow cores by divers. At each zone and time pointfive replicate cores were analysed for microbial and macrofaunal populations.Fauna were analysed to the lowest taxonomic level possible. Microbial RNA wasextracted and analysed using terminal restriction fragment length polymorphism;a molecular biology technique commonly used to profile microbial communities,based on the position of a restriction site closest to a labelled end of the 16Sribosomal RNA gene.
This study uses a non-parametric multivariate approach, MDS, whichcharacterizes and compares faunal samples on the basis of the identity andabundance of macrofaunal species (Fig. 4) or microbial 16S rRNA gene T-RF(terminal restriction fragment) relative abundances (Supplementary Fig. 3).Ordinations are derived from Bray–Curtis similarity matrices using an MDStechnique32,33. The Bray–Curtis measure ignores joint absences and focuses on
presences and is the most commonly used similarity matrix for biologicalcommunity analyses. An MDS ordination is essentially a map of samples in whichthe distance between any two samples is a reflection of their relative similarity toeach other based on the whole community composition. Thus, samplespositioned closely to each other are very similar in community composition, andpoints that are further apart are less similar in their composition. The goodnessof fit of the ordination (given that a multi-dimensional distribution is compressedto a two-dimensional one) is indicated by a stress value. Values below 0.2 implythat the ordinations may be sensibly interpreted. As this technique is based onthe rank order in the similarity matrix, it is only the relative distance apart of thesymbols that matters, the scale and axis being arbitrary.
An animation of the experimental procedure and video footage of seafloorbubble streams and instrumentation can be seen at www.qics.co.uk.Supplementary Table 1 summarizes the sampling regime and further details aregiven in the Supplementary Information.
Received 10 June 2014; accepted 22 August 2014;published online 28 September 2014
References1. IPCC Third Assessment Report of the Intergovernmental Panel on Climate
Change (IPCC)(Cambridge Univ. Press, 2001).2. Raupach, M. R. et al. Global and regional drivers of accelerating CO2
emissions. Proc. Natl Acad. Sci. USA 104, 10288–10293 (2007).3. IPCC in IPCC Special Report on Carbon Dioxide Capture and Storage
(eds Metz, B., Davidson, O., de Coninck, H. C., Loos, M. & Meyer, L. A.) 442(Cambridge Univ. Press, 2005).
4. Senior, B. CO2 Storage in the UK—Industry Potential, DECC,URN 10D/512, 2010.
5. Nakanishi, S. et al.Methodology of CO2 aquifer storage capacity assessment inJapan and overview of the project. Energy Procedia 1, 2639–2646 (2009).
6. Austen, M. C. et al. The UK National Ecosystem Assessment Technical Report(UNEP-WCMC, 2011).
7. Van Noorden, R. Carbon sequestration: Buried trouble. Nature 463,871–873 (2010).
8. Monastersky, R. Seabed scars raise questions over carbon-storage plan. Nature504, 339–340 (2013).
9. IEA Greenhouse Gas R&D Programme (IEA GHG) Assessment of sub-seaecosystem impacts (2008).
10. Widdicombe, S., Blackford, J. C. & Spicer, J. I. Assessing the environmentalconsequences of CO2 leakage from geological CCS: Generating evidence tosupport environmental risk assessment.Mar. Pollut. Bull. 73, 399–401 (2013).
11. Caramanna, G., Voltattorni, N. & Maroto-Valer, M. Is Panarea Island (Italy) avalid and cost-effective natural laboratory for the development of detection andmonitoring techniques for submarine CO2 seepage? Greenhouse Gases: Sci.Technol. 1, 200–210 (2011).
12. Carey, S. et al. CO2 degassing from hydrothermal vents at Kolumbo submarinevolcano, Greece, and the accumulation of acidic crater water. Geology 41,1035–1038 (2013).
13. Boudreau, B. P. et al. Bubble growth and rise in soft sediments. Geology 33,517–520 (2005).
14. Algar, C. K., Boudreau, B. P. & Barry, M. A. Initial rise of bubbles in cohesivesediments by a process of viscoelastic fracture. J. Geophys. Res. 116,B04207 (2011).
15. Jain, A. K. & Juanes, R. Preferential mode of gas invasion in sediments:Grain-scale mechanistic model of coupled multiphase fluid flow and sedimentmechanics. J. Geophys. Res. 114, B08101 (2009).
16. Leighton, T. G. &White, P. R. Quantification of undersea gas leaks from carboncapture and storage facilities, from pipelines and from methane seeps, by theiracoustic emissions. Proc. R. Soc. A 468, 485–510 (2012).
17. Mucci, A. et al. Fate of carbon in continental shelf sediments of eastern Canada:A case study. Deep-Sea Res. II 47, 733–760 (2000).
18. Aller, R. C. & Aller, J. Y. The effect of biogenic irrigation intensity and soluteexchange on diagenetic reaction rates in marine sediments. J. Mar. Res. 56,905–936 (1998).
19. Janssen, F., Huettel, M. &Witte, U. Pore-water advection and solute fluxes inpermeable marine sediments (II): Benthic respiration at three sandy sites withdifferent permeabilities (German Bight, North Sea). Limnol. Oceanogr. 50,779–792 (2005).
20. Duan, Z., Hu, J., Li, D. & Mao, S. Densities of the CO2–H2O andCO2–H2O–NaCl systems up to 647K and 100MPa. Energ. Fuel. 22,1666–1674 (2008).
21. Anderson, L. G. et al. Benthic respiration measured by total carbonateproduction. Limnol. Oceanogr. 31, 319–329 (1986).
22. Gattuso, J. P. & Hansson, L. (eds) Ocean Acidification 326 (Oxford Univ.Press, 2011).
NATURE CLIMATE CHANGE | ADVANCE ONLINE PUBLICATION | www.nature.com/natureclimatechange 5
© 2014 Macmillan Publishers Limited. All rights reserved.

LETTERS NATURE CLIMATE CHANGE DOI: 10.1038/NCLIMATE2381
23. DeBeer, D. et al. In situ fluxes and zonation of microbial activity in surfacesediments of the Håkon Mosby mud volcano. Limnol. Oceanogr. 51,1315–1331 (2006).
24. Lichtschlag, A. et al.Methane and sulfide fluxes in permanent anoxia: In situstudies at the Dvurechenskii mud volcano (Sorokin Trough, Black Sea).Geochim. Cosmochim. Acta. 74, 5002–5018 (2010).
25. Decker, C. et al.Habitat heterogeneity influences cold-seep macrofaunalcommunities within and among seeps along the Norwegian margin. Part 1:Macrofaunal community structure.Mar. Ecol. 33, 205–230 (2012).
26. Gruenke, S. et al. Niche differentiation among mat-forming, sulfide-oxidizingbacteria at cold seeps of the Nile Deep Sea Fan (Eastern Mediterranean Sea).Geobiology 9, 330–348 (2011).
27. Felden, J. et al. Limitations of microbial hydrocarbon degradation at the Amonmud volcano (Nile deep-sea fan). Biogeosciences 10, 3269–3283 (2013).
28. Blackford, J. C., Jones, N., Proctor, R. & Holt, J. Regional scale impacts ofdistinct CO2 additions in the North Sea.Mar. Pollut. Bull. 56,1461–1468 (2008).
29. Dewar, M., Wei, W., McNeil, D. & Chen, B. Small scale modelling of thephysiochemical impacts of CO2 leaked from sub-seabed reservoirs or pipelineswithin the North Sea and surrounding waters.Mar. Prod. Bull. 73,504–515 (2013).
30. Thomas, H. et al. Controls of the surface water partial pressure of CO2 in theNorth Sea. Biogeosciences 2, 323–334 (2005).
31. Shitashima, K., Kyo, M., Koike, Y. & Henmi, H. Proceedings of the 2002International Symposium on Underwater Technology 106–108 (IEEE, 2002).
32. Clarke, K. R. Non-parametric multivariate analyses of changes in communitystructure. Aust. J. Ecol. 18, 117–143 (1993).
33. Kruskal, J. B. & Wish, M.Multidimensional Scaling (Sage Publications, 1978).
AcknowledgementsFunding was provided by NERC (NE/H013962/1), the Scottish Government andMETI/MEXT of Japan. We thank the Tralee Bay Holiday Park, Lochnell Estates and the
inhabitants of Benderloch for hosting the experiment. We acknowledge Marine Scotlandand The Crown Estate for permissions to carry out the research. The NERC NationalFacility for Scientific Diving, the crew of the RV Seol Mara and J. Montgomery based atSAMS provided operational support. We thank A. Skinner of ACS coring services foradvice on the drilling, and the design of the well screen; J. Davis for support ofgeophysical data acquisition; C. Wallace of Kongsberg Ltd for provision and processing ofthe multibeam bathymetry data; J. Gafiera (BGS) for interpretation of site survey seismicprofiles and A. Monaghan (BGS) for construction of 3D geological models.
Author contributionsR.H.J., D.C., H.S., S.W., K.S., A.L., P.T., J.K., C.H., K.T., M.S. and M.H. designed andundertook biogeochemical measurements and analysed data; M.C., M.E.V., I.W., D.L.,D.S., J.M.B. and M.A. planned, acquired and interpreted seismic reflection data; T.G.L.,P.R.W. and B.J.P.B. designed and undertook passive acoustic measurements, analyseddata and completed gas flux inversion; T.M.G. analysed and interpreted core data; B.C.analysed bubble dynamics from bottom photographs; M.D.J.S. led the diving deploymentand sampling strategy; B.C., H.K. and T.S. developed models to constrain theexperimental deployment; D.L., D.S. and M.A. developed the concept, design andimplementation of the borehole and gas delivery mechanism; H.S., P.T. and M.N.designed and built the CO2 injection facility; H.S. led and coordinated the release andsampling strategy; J.B., H.S., I.W., R.H.J., J. K., B.C., C.H., S.W. and M.N. conceived thestudy; J.B. led the project; D.S., B.J.P.B., M.C. and A.L. produced figures within themanuscript; J.B., H.S. and J.M.B. developed and co-wrote the manuscript. All authorsdiscussed results and commented on the manuscript.
Additional informationSupplementary information is available in the online version of the paper. Reprints andpermissions information is available online at www.nature.com/reprints.Correspondence and requests for materials should be addressed to J.B.
Competing financial interestsThe authors declare no competing financial interests.
Jerry Blackford1*‡, Henrik Stahl2‡, Jonathan M. Bull3‡, Benoît J. P. Bergès4, Melis Cevatoglu3, Anna Lichtschlag5,Douglas Connelly5, Rachael H. James3, Jun Kita6, Dave Long7, Mark Naylor8, Kiminori Shitashima9, Dave Smith7,Peter Taylor2, Ian Wright5, Maxine Akhurst7, Baixin Chen10, Tom M. Gernon3, Chris Hauton3, Masatoshi Hayashi11,Hideshi Kaieda12, Timothy G. Leighton4, Toru Sato13, Martin D. J. Sayer2,14, Masahiro Suzumura15, Karen Tait1, Mark E. Vardy3,Paul R. White4 and Steve Widdicombe1
1Plymouth Marine Laboratory, Prospect Place, Plymouth PL1 3DH, UK, 2Scottish Association for Marine Science, Oban PA37 1QA, UK, 3Ocean and EarthScience, University of Southampton, National Oceanography Centre Southampton, Southampton SO14 3ZH, UK, 4Institute of Sound and VibrationResearch, Engineering and the Environment, University of Southampton, Highfield, Southampton SO17 1BJ, UK, 5National Oceanography Centre, Universityof Southampton Waterfront Campus, Southampton SO14 3ZH, UK, 6Research Institute of Innovative Technology for the Earth, 9-2, Kizugawadai,Kizugawa-Shi, Kyoto 619-0292, Japan, 7British Geological Survey, Murchison House, West Mains Road, Edinburgh EH9 3LA, UK, 8School of GeoSciences,Grant Institute, University of Edinburgh, Edinburgh EH9 3JW, UK, 9International Institute for Carbon-Neutral Energy Research, Kyushu University, 744Motooka, Nishi-ku, Fukuoka 819-0395, Japan, 10School of Engineering & Physical Sciences, Heriot-Watt University, Edinburgh EH14 4AS, UK, 11The GeneralEnvironmental Technos Co., Ltd., 1-3-5 Azuchimachi, Chuo-ku, Osaka 541-0052, Japan, 12CRIEPI, 1646 Abiko, Abiko-shi, Chiba 270-1194, Japan,13Department of Ocean Technology, Policy and Environment, University of Tokyo, 5-1-5, Kashiwanoha, Kashiwa-shi, Chiba 277-8561, Japan, 14NERCNational Facility for Scientific Diving, Scottish Association for Marine Science, Oban PA37 1QA, UK, 15National Institute of Advanced Industrial Science andTechnology, 16-1 Onogawa, Tsukuba, Ibaraki 305-8569, Japan. ‡These authors contributed equally to this work. *e-mail: [email protected]
6 NATURE CLIMATE CHANGE | ADVANCE ONLINE PUBLICATION | www.nature.com/natureclimatechange
© 2014 Macmillan Publishers Limited. All rights reserved.