Detecting Verbal and Non-Verbal Gestures Using Earables
46
EarComp 2021 2nd International Workshop on Earable Computing In conjunction with UbiComp 2021 September 25th, 2021, All Over the World
-
Upload
khangminh22 -
Category
Documents
-
view
0 -
download
0
Transcript of Detecting Verbal and Non-Verbal Gestures Using Earables

EarComp 2021
2nd International Workshop on Earable ComputingIn conjunction with UbiComp 2021
September 25th, 2021, All Over the World
Detecting Verbal and Non-Verbal Gestures Using EarablesMatias Laporte
[email protected]à della Svizzera italiana (USI)
Switzerland
Preety [email protected]
Università della Svizzera italiana (USI)Lugano, Switzerland
Shkurta [email protected]
Università della Svizzera italiana (USI)Lugano, Switzerland
Martin [email protected]
Università della Svizzera italiana (USI)Lugano, Switzerland
Silvia [email protected]
Università della Svizzera italiana (USI)Lugano, Switzerland
Marc [email protected]
Università della Svizzera italiana (USI)Lugano, Switzerland
ABSTRACTVerbal and non-verbal activities convey insightful informationabout people’s aect, empathy, and engagement during social inter-actions. In this paper, we investigate the usage of inertial sensorsto recognize verbal (e.g., speaking), non-verbal (e.g., head nodding,shaking) and other activities (e.g., eating, no movement). We im-plement an end-to-end deep neural network to distinguish amongthese activities.We then explore the generalizability of the approachin three scenarios: (1) using new data to detect a known activityfrom a known user, (2) detecting a novel activity of a known userand (3) detecting the activity of an unknown user. Results show thatusing accelerometer and gyroscope sensors, the model achieves abalanced accuracy of 55% when tested on data from a new user,41% on a new activity of an existing user, and 80% on new data of aknown activity from an existing user. The results are between 7-47percentage points higher than baseline classiers.
CCS CONCEPTS•Human-centered computing!Ubiquitous andmobile com-puting systems and tools.
KEYWORDSDatasets; Earable Computing; Head Gestures Recognition; MemoryRecall
ACM Reference Format:Matias Laporte, Preety Baglat, Shkurta Gashi, Martin Gjoreski, Silvia Santini,and Marc Langheinrich. 2021. Detecting Verbal and Non-Verbal GesturesUsing Earables. In Adjunct Proceedings of the 2021 ACM International JointConference on Pervasive and Ubiquitous Computing and Proceedings of the2021 ACM International Symposium on Wearable Computers (UbiComp-ISWC’21 Adjunct), September 21–26, 2021, Virtual, USA. ACM, New York, NY, USA,6 pages. https://doi.org/10.1145/3460418.3479322
Permission to make digital or hard copies of all or part of this work for personal orclassroom use is granted without fee provided that copies are not made or distributedfor prot or commercial advantage and that copies bear this notice and the full citationon the rst page. Copyrights for components of this work owned by others than ACMmust be honored. Abstracting with credit is permitted. To copy otherwise, or republish,to post on servers or to redistribute to lists, requires prior specic permission and/or afee. Request permissions from [email protected] ’21 Adjunct, September 21–26, 2021, Virtual, USA© 2021 Association for Computing Machinery.ACM ISBN 978-1-4503-8461-2/21/09. . . $15.00https://doi.org/10.1145/3460418.3479322
1 INTRODUCTIONOur motivation for detecting verbal and non-verbal activities isrooted in our work on building human memory augmentation sys-tems. Using earable computing, we attempt to recognize dierenttypes of human activities, in particular head gestures, with the pur-pose of detecting when a social interaction is taking place. This isbecause the presence of others and our interactions with them playimportant roles in our memories, both during the formation of mem-ory [32] and at retrieval time [6]: moments of social interactionsmight be easier to remember (formation time), and rememberinga particular interaction might also help to remind us of particulardetails (retrieval time).
The importance of human memory for our daily lives cannotbe overstated. It gives us an identity, lets us remember future in-tentions, carry quotidian tasks, and obtain new knowledge. It alsoallows us to share experiences and maintain and nurture relation-ships [20]. Therefore, civilization has applied increasingly com-plex methods to preserve its memories and overcome their failures.Today, capture technology such as cameras, voice recorders, andtness trackers are coming close to making total capture (and, con-sequently, total recall [2]) a possibility, if not already a reality [13].However, even if every part of our lives is captured and recorded, itis far from trivial to then use this information to aid our memory.
Memory augmentation systems will only succeed as long as theyare able to appropriately select the relevant memories for the user[30]. In fact, instead of presenting the user a fully recorded memory,these systems should take advantage of the power of memory cues– objects or events that help us remember our original memory orintent. By prompting the user with such a (small) cue, they willbe able to recall the original experience in great detail. One keychallenge here is to identify appropriate cues among the recordeddata that, when played back to the user, will trigger such recall.Social interaction might mark important moments that may makeuseful memory cues.
Social interaction can be easily detected using audio sensing:detecting a conversation is a sure sign of interpersonal activity.Similarly, closely tracking the movements and orientation of peo-ple could allow us to identify social interaction. Alternatively, awearable camera may pick up faces of others and identify socialinteraction. All three options rely on highly sensitive personal data.Instead, we seek to identify head gestures to detect both verbal andnonverbal social interaction from inertial signals.
To summarize, this paper presents the following contributions:

UbiComp-ISWC ’21 Adjunct, September 21–26, 2021, Virtual, USA Laporte et al.
• We present a new dataset comprised of accelerometer andgyroscope data collected using ear-worn devices. The datasetwas collected from 10 participants performing 5 scripted ac-tivities: nodding, speaking, eating, staying, and head shaking.
• We investigate the feasibility of using a deep ConvolutionalNeural Network (CNN) to recognize activities related tosocial interactions such as verbal (e.g., speaking) and non-verbal (e.g., nodding) gestures, as well as gestures unrelatedto interactions (e.g., eating).
2 RELATEDWORKThe continuous development of unobtrusive wearable sensors hasmade possible the recording of new types of data in uncontrolledsettings. Of particular interest to our work is the use of earablesensors, i.e., head-mounted in-ear/behind-the-ear sensors, to detectspeech and head gestures, as cues for human interaction. As previ-ously mentioned, other approaches (e.g., cameras and microphones)require an involved setup with additional privacy issues to consider.
Current earable devices can accommodate several sensors (e.g.accelerometers, gyroscopes, microphones or biometric sensors) andactuators (e.g., speaker) in a comfortable size with decent batteryautonomy, allowing not only sound and head movement measure-ments, but also of head rotation and bio-signals, among others.
2.1 Earable SystemsEarable sensors have been proposed as a tool with "enormous po-tential in accelerating our understanding of a wide range of humanactivities in a nonintrusive manner", with applications rangingfrom "health tracking" to "contextual notication management" ,including "cognitive assistance" and "lifelogging" [22].
Among the applications to deepen our understanding of humanbehaviour, Frohn et al. [11] have used an earable sensor to charac-terize the emotional intent of study participants performing a seriesof scripted scenes. Although the results were limited due to thereduced sample size and the use of non-actors, they showed thatparticipants act more energetically and in sync when the sceneshave a positive intent, than otherwise.
Röddiger et al. [29] instead used in-ear accelerometer and gy-roscope sensors for health tracking, by measuring the respirationrate of the participants.
Other applications include: EarDynamic [33], a biometric-basedauthentication method which models users’ ear canal deformationthrough the emission of inaudible audio signals and their reections;and EarBuddy [34], a gesture recognition system which uses themicrophones on the earbuds to detect dierent types of ngertouches in the face.
Although these approaches have done novel applications withthe available earable technology, none of them have focused onrecognizing verbal and non-verbal activities from inertial signals.
2.2 Human Behaviour DetectionEarable sensors benet particularly from the proximity and contactwith the face to be able to distinguish themovements of the jawboneand the activation of the dierent muscles.
EarBit [1], for example, was a prototype with multimodal (acous-tic, motion) sensors to detect chewing episodes. It used an optical
proximity sensor to measure the deformation of the ear canal pro-duced by the movement activity of the mandibular bone, and a9-axis Inertial Measurement Unit (IMU) to capture the movementof the temporalis muscle, used when chewing. EarBit also includeda microphone located around the neck to detect swallowing events.A chest-mounted GoPro was used as ground truth collector. Aur-acle [3] is another example of eating detection, but with the useof a contact microphone instead, and an unobtrusive ground truthcollector embedded into a cap.
In STEAR [28], ear mounted IMU sensors have been proposedas a new approach for step counting, with the benet of not beingaected by random motions of leg and hand, like it would happenwith a smartphone or a smartwatch, respectively.
Only a few researchers focused on the recognition of head ges-tures and human activities, even in social interaction settings, withthe use of earables.
Gjoreski et al. [16] used a 9-axis IMU to detect 8 individual dailylife activities from a dataset of 4 subjects. Ferlini et al. [10] used anear-worn device to track head rotations while performing activitieslike chewing and speaking. Min et al. [26] used an IMU sensorand a microphone for monitoring conversational well-being, usingmodels that recognize speaking activities, altogether with stressand emotion detection. Tan et al. [31] used earable devices to detectthe head orientation of interacting groups and used it as a cuefor directed social attention. Lee et al. [24] focused instead on therecognition of smile and frowns gestures, while Islam et al. [21]proposed an activity recognition framework dierentiating betweenhead andmouth related activities (e.g. head shaking, nodding, eatingand speaking), and normal activities (e.g. staying, walking andspeaking while walking).
Our work further expands on Islam et al.’s by considering thedetection of verbal and non-verbal gestures in the context of socialinteractions, with the intent of marking part of those moments asimportant for the use of memory cues.
2.3 Human Memory AugmentationThe idea of a system that stores one’s digital records (e.g., docu-ments, images, multimedia etc.) for a lifetime goes back to the 1945vision of the Memex by Vannevar Bush [7]. While Bush did not de-tail the exact technology for implementing his vision, he predictedan era when storage will be virtually unlimited. Some 60 years later,the MyLifeBits project attempted to fulll the promise of Bush’svision [14]. MyLifeBits started as a platform that could log all per-sonal information generated and accessed on a PC, but its memoryenhancing aspects quickly emerged [13]. More recently, Davies etal. [9] described the vision and core architectural building blocks ofa future pervasive memory augmentation ecosystem, while Harveyet al. described the role of lifelogging technology in this vision [19].
3 DATA COLLECTIONWe provide below details about the participants, the type of data wecollected, the tools used to do it and the data collection procedure.
3.1 Collected Data and ToolsFor each participant, we recorded data from accelerometer and gy-roscope sensors. To collect sensor data, we used the eSense earbuds

Detecting Verbal and Non-Verbal Gestures Using Earables UbiComp-ISWC ’21 Adjunct, September 21–26, 2021, Virtual, USA
Figure 1: Experimental Protocol. Participants performedeach activity for 3 minutes, with no particular order.
developed by Kawsar et al. [23] at Nokia Bell Labs. The eSenseearbuds are equipped with 6-axis Inertial Measurement Unit (IMU)sensors, comprised of 3-axis accelerometer and 3-axis gyroscopesensors [5]. Being worn on the ear, the eSense is suited for gath-ering sensor data for detecting human gestures in an unobtrusiveand continuous manner.
The acccelerometer sensor measures the acceleration of the de-vice in G-force [5]. The gyroscope sensor measures the rotationof the device in degrees per second (deg/sec) [5]. Acceleration andgyroscope data measured from ear-worn devices have been shownto reect the movements of the head and facial muscles [1, 22, 24].Thereby, they seem suitable to detect whether a person is interact-ing with another individual or not. The eSense device also containsa microphone sensor, which could be used to detect verbal activitiesduring social interactions such as e.g., speaking. However, micro-phone use raises privacy concerns for users [25, 26] and is notsuitable to detect non-verbal types of interactions (e.g., nodding).
To collect the sensor data, we use the eSense app1. The eSenseapp is a smartphone application developed for the Android operat-ing system. The application was initially implemented by Islam etal. [21] and then extended by Frohn et al. [11]. The app connectsvia Bluetooth Low Energy (BLE) to the eSense earbuds and obtainsthe sensor data. We set the sampling rate of the sensors to 25 Hz.
3.2 Participants and ProcedureWe recruited 10 participants (6 females and 4 males). The majorityof the participants were between 18 - 34 years old, and one wasover 55 years old. Participants had dierent occupations such ase.g., worker (3), postdoctoral researcher (1), Ph.D. student (1), andUniversity student (5).
Before meeting each participant, we charged the eSense and themobile phone. Previous to the experiment, the researcher respon-sible for running the data collection explained the study goal andthe data collection procedure to the participant. All participantssigned an informed consent form. The experimenter provided theleft earbud to the participant and instructed how to wear it. Theleft eSense earbud was then connected to the Android application.The participant was then instructed to rst select the activity theywished to perform, and then to select the start button on the appto record the sensor data. At the end of recording an activity, theparticipants stopped the data recording and repeated the sameprocedure for another activity.
The participants performed ve scripted activities, namely, nod-ding, speaking, eating, standing still, and head shaking. We choosethese activities to investigate whether verbal and non-verbal in-teraction activities (e.g., speaking and nodding) are distinguishable
1https://github.com/SabrinaFrohn/Esense
from other head andmouth-related activities (e.g., eating, head shak-ing) as well as no activity at all (e.g., standing still). The participantsperformed each activity for 3 minutes, one after the other, and theywere free to pick the order in which the activities were performed.A simple diagram of this procedure can be seen in Figure 1.
4 DATA ANALYSISThe main goal of our work is to develop a method to recognizehuman verbal, non-verbal interactions or no interactions usinginertial signals. In this section, we describe the end-to-end deeplearning pipeline we developed as well as the evaluation procedures,metrics and baselines used.
4.1 Data Pre-processingTo pre-process the signals, we follow common pre-processing stepsused in the literature for human activity recognition from inertialsignals [5]. In particular, after dividing the dataset into train andtest splits, we segment the sensor data for each split into 4 secondswindowswith 75% overlap. After the segmentation, our nal datasetcontains 1210 speaking samples, 1162 nodding, 1272 eating, 1179head shaking and 1127 standing still. The measurement unit ofacceleration data is converted to ± 4g and gyroscope data to ± 500deg/s directly in the application used to collect the data.
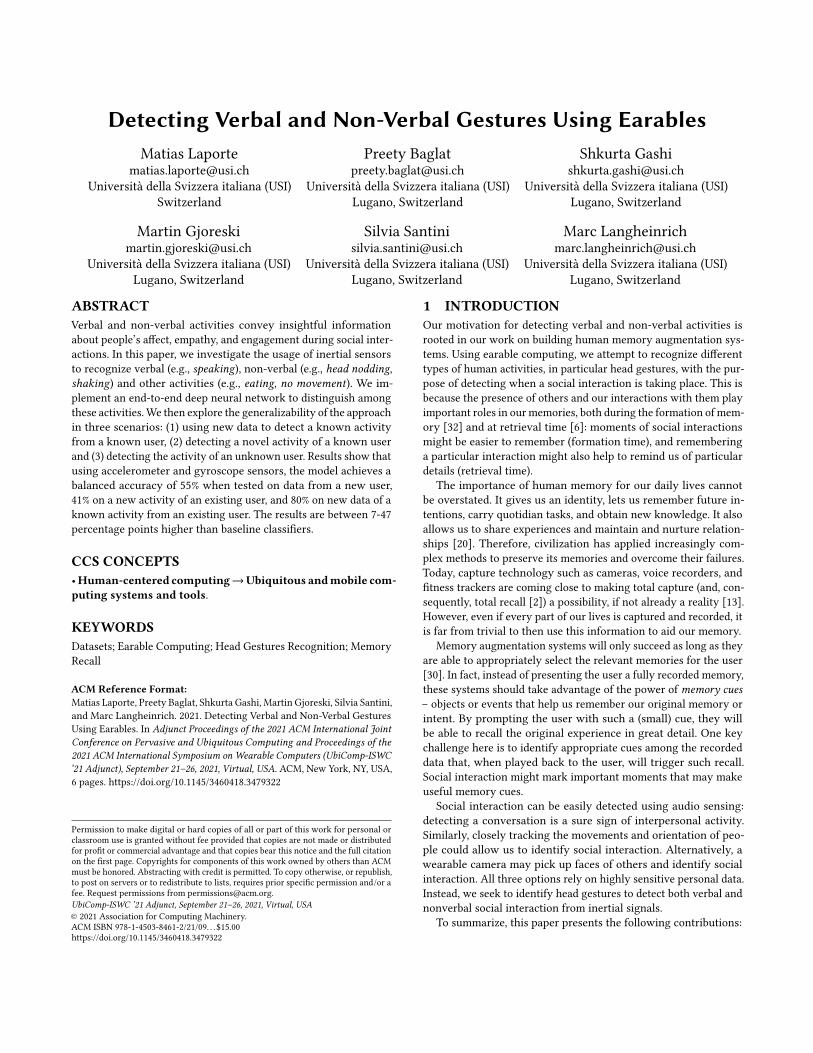
4.2 Convolutional Neural Network (CNN)We developed an end-to-end CNN, which takes as input the 4-second windows of raw 3-axis accelerometer and gyroscope signals(see Figure 2). The accelerometer and gyroscope sensor data is rstprocessed by three convolutional layers, each with a kernel sizeof 7, 128 feature maps and ReLU activation function. These layerslearn feature representation from the raw sensor data. The outputof the last convolutional layer is then attened and provided asinput to a max pooling layer. To avoid over-tting, we employeddropout regularization with a dropout rate of 0.5. The output of thelast layer of the model is provided as input to a sigmoid function,which returns a k dimensional output with estimated probabilitybetween 0 and 1, where k is the number of activity classes, whichis 3 (non-verbal, verbal, or other).
4.3 Evaluation ProceduresTo evaluate the performance of the CNN classier, we follow com-mon procedures in machine learning [15, 27]. In particular, weinvestigate three validation procedures described as following.Leave-one-part-out (LOPO) validation procedure uses the data of allparticipants, except one, and the rst 80% of the data of each activityfrom the left-out user in the training set. The remaining 20% of eachactivity of the left-out user is used in the test set. The procedure isrepeated for all participants and the results are reported as averageof all iterations. This approach veries the ability of the modelto generalize to unseen data of a known user. It also avoids thetemporal leak issue, discussed in [8], which refers to situations whena model is trained on data from the future. With this approach, weensure that the test set is posterior to the data in the training set.Leave-one-activity-out (LOAO) evaluation approach uses all thedata of all users, except one activity of one user, in the training set.The left-out activity of the user is kept as the test set. The same

UbiComp-ISWC ’21 Adjunct, September 21–26, 2021, Virtual, USA Laporte et al.
1 X
7 - C
onv
- 128
- R
eLU
Max
Poo
ling
- 2
1 X
7 - C
onv
- 128
- R
eLU
1 X
7 - C
onv
- 128
- R
eLU
FC -
150
- ReL
u
Dro
pout
FC -
100
- ReL
u
Dro
pout
Dro
pout
FC -
3 - S
oftm
ax
Accelerometer
Gyroscope
Figure 2: Overview of the end-to-end deep learning pipeline. The raw acceleremeter and gyroscope data collected from eSenseearbuds is provided as input the CNN. The model classies each data sample as a verbal, non-verbal or other activity.
procedure is repeated for all activities of the left-out user and thenfor all the users. We report the classication results as the averageof all iterations. The main goal of this technique is to avoid havingsegments from a same trace (e.g., activity) collected from one userin both training and testing sets. This is because adjacent segmentsare not statistically independent, as discussed in [18]. This approachveries the ability of the model to recognize new activities froma known user by learning from the presence of an activity in thetraining set from other users.Leave-one-subject-out (LOSO) validation scheme uses the data of allusers except one in the training set and the left-out user as the testset, as used in [24, 25]. This procedure is repeated for all the users.We report the classication results as the mean metrics for all users.This validation procedure ensures that the training set does notcontain all of the activities from one user. With this technique, weaim to investigate the generalization of the model to new users.
4.4 Evaluation MetricsTo evaluate the performance of the model, we use accuracy, bal-anced accuracy and F1. Accuracy quanties the number of samplescorrectly classied by the model [27]. Balanced accuracy score isdened as the average of recall score obtained in each class [4].This score is suitable to compare the performance of imbalanceddatasets because it also takes into consideration the minority class.To further explore the performance of the classier in all the classes,we also report the weighted F1metric. The F1 score is the harmonicmean of precision and recall [27].
4.5 Baseline ClassiersWe compare the performance of the CNN with Random Guess (RG)and Biased Random Guess (BRG) baselines. RG provides a classi-cation uniformly at random. BRG takes into consideration thedistribution of the classes in the training set and generates a biasedprediction. In particular, BRG always predicts the most frequentlabel in the training set, as used in [12].
5 RESULTSIn what follows, we present and discuss the evaluation results.We rst report the performance of the CNN using the dierentevaluation procedures and baseline classiers described in Section4. We then investigate the performance of each sensor separately(unimodal) and their combination (multimodal).
5.1 Evaluation Procedures ComparisonWe rst compare the performance of the CNN model using LOPO,LOAO and LOSO validation techniques. Figure 3 shows the balancedaccuracy of CNN and baseline classiers for each evaluation tech-nique. In all cases, the results are higher than baseline classiers.These results imply that it is feasible to use ear-worn devices to dis-tinguish between verbal, non-verbal and other activities performedduring social interactions. Overall the classication results usingLOPO are signicantly higher than using LOAO or LOSO. In particu-lar, the CNN has a balanced accuracy of 80%, which is 25 and 39percentage points increment from LOSO and LOAO validation tech-niques. As expected, the presence of annotated data from the testuser allows the model to achieve a higher performance. Therefore,future systems that aim to distinguish between verbal, nonverbaland other activities using earbuds, should rst train the model withdata from the user to avoid the cold start problem. The performancedrop of the CNN when using the LOSO or LOAO techniques, suggeststhat such systems are dicult to generalize to the data of a new useror a new activity of a user. Given that LOPO validation procedureprovides the best results, in the next experiments we present moredetailed results for this validation procedure.
5.2 Comparison to Baseline ClassiersFigure 4 shows dierent classication metrics for RG, BRG andCNN classiers, using the best validation procedure explored inthis work, LOPO. In particular, balanced accuracy for the CNN is 80%,36% for the RG and 33% for the BRG. Our model shows 44 and 47percentage points increment compared to RG and BRG classiers.
Figure 5 shows the balanced accuracy for each participant usingthe LOPO validation approach and the CNN, as the best modelavailable among those tested. We observe that the performance ofthe CNN for the majority of the users is higher than 60%, with theexception being users P01 and P03.
5.3 Unimodal vs MultimodalIn this set of results, we investigate the performance of trainingwith single (unimodal) and multiple sensors (multimodal). Uni-modal refers to experiments where only one sensor’s data (e.g., ac-celerometer) is used as input to the CNN model. Multimodal refersto experiments using both accelerometer and gyroscope data. Fig-ure 6 presents the balanced accuracy scores obtained for unimodaland multimodal approaches using LOPO validation. The balancedaccuracy for the accelerometer data is 75%, for the gyroscope data

Detecting Verbal and Non-Verbal Gestures Using Earables UbiComp-ISWC ’21 Adjunct, September 21–26, 2021, Virtual, USA
Figure 3: Results of CNN model using leave-one-part-out (LOPO), leave-one-activity-out (LOAO) and leave-one-subject-out (LOSO).
0.380.35 0.36
0.41
0.24
0.33
0.840.82 0.8
Accuracy F1 AccuracyB0
0.2
0.4
0.6
0.8
1
RG BRG Our model
Perfo
rm
ance
Figure 4: Accuracy, F1, and balanced accuracy(AccuracyB) for CNN, RG, and BRG classiers usingall signals as input and LOPO validation accuracy.
0.56
0.84
0.48
0.84
0.65
0.85
0.81
0.83
0.76
P01 P02 P03 P04 P05 P06 P07 P08 P09 P100
0.2
0.4
0.6
0.8
1
Participant
Bal
ance
d Acc
urac
y
Figure 5: Balanced accuracy of CNN model for eachparticipant using all signals as input and LOPO valida-tion procedure.
0.750.69
0.8
Accelerometer Gyroscope Combined0
0.2
0.4
0.6
0.8
1
Performance
Figure 6: Comparison of the performance of the CNNmodel using only accelerometer, only gyroscope orboth as input.
is 69%, and for their combination is 80%. We observe that the perfor-mance of the multimodal classier is higher than the performanceof unimodal classiers by 5 and 11 percentage points respectively.These results imply that combining data from several sensors al-lows recognizing user’s interactions better than using only onesensor. This outcome highlights the importance of considering notonly the movements but also the rotation angle of the device duringthese activities, which is in line with other end-to-end deep learningstudies on activity recognition [17].
6 LIMITATIONS AND FUTUREWORKA limitation of our study is the data collected in a controlled setting.This might not reect the challenges of collecting such data in real-world scenarios. In future work, we plan to run a larger study innaturalistic settings and verify the generalizability of our approachto new settings where users’ movements are not constrained. In
addition, we plan to investigate the relationship between the fre-quency of such activities and participants’ memory recall.
While end-to-end deep learning oers the possibility to buildactivity recognition models without feature engineering, it alsorequires larger training datasets. As the dataset used in this studyis relatively small, in the future we plan on implementing shallow,feature-based classiers, and on increasing the size of the datasetto implement other end-to-end deep learning architectures.
In this work, we segmented accelerometer and gyroscope sensordata using a sliding window of 4 seconds. We plan on comparing dif-ferent segmentation strategies (e.g., overlapping, non-overlapping)and window sizes, as in [25].
7 CONCLUSIONSSocial interaction presents an interesting feature for identifyingmoments that lend themselves to memory cue generation. Insteadof using video, audio, or location tracking technology, we envision

UbiComp-ISWC ’21 Adjunct, September 21–26, 2021, Virtual, USA Laporte et al.
the use of unobtrusive inertial sensors to identify moments of socialinteraction – both verbal and non-verbal. This study showed thatsuch sensors are useful for recognising a variety of headmovements,which could be used as context information for future human mem-ory augmentation systems.
ACKNOWLEDGMENTSWe thank Nokia Bell Labs for donating the eSense devices, andstudy participants for volunteering to be part of the experiment.
REFERENCES[1] Abdelkareem Bedri, Richard Li, Malcolm Haynes, Raj Prateek Kosaraju, Ishaan
Grover, Temiloluwa Prioleau, Min Yan Beh, Mayank Goel, Thad Starner, andGregory Abowd. 2017. EarBit: Using Wearable Sensors to Detect Eating Episodesin Unconstrained Environments. Proceedings of the ACM on Interactive, Mobile,Wearable and Ubiquitous Technologies (PACM IMWUT) 1, 3 (2017), 1–20.
[2] Gordon Bell and Jim Gemmell. 2009. Total Recall: How the e-Memory RevolutionWill Change Everything. In Total Recall: How the e-Memory Revolution WillChange Everything. Penguin Books, London, United Kingdom.
[3] Shengjie Bi, Tao Wang, Nicole Tobias, Josephine Nordrum, Shang Wang, GeorgeHalvorsen, Sougata Sen, Ronald Peterson, Ko Odame, Kelly Caine, et al. 2018.Auracle: Detecting Eating Episodes With an Ear-mounted Sensor. Proceedingsof the ACM on Interactive, Mobile, Wearable and Ubiquitous Technologies (PACMIMWUT) 2, 3 (2018), 1–27.
[4] Kay Henning Brodersen, Cheng Soon Ong, Klaas Enno Stephan, and Joachim M.Buhmann. 2010. The Balanced Accuracy and Its Posterior Distribution. In 201020th International Conference on Pattern Recognition. IEEE, IEEE, Piscataway, NJ,United States, 3121–3124. https://doi.org/10.1109/ICPR.2010.764
[5] Andreas Bulling, Ulf Blanke, and Bernt Schiele. 2014. A Tutorial on HumanActivity Recognition Using Body-Worn Inertial Sensors. ACM Computing Surveys(CSUR) 46, 3 (2014), 1–33.
[6] C. Burri. 1931. The Inuence of an Audience upon Recall. Journal of EducationalPsychology 22, 9 (1931), 683–690. https://doi.org/10.1037/h0070961
[7] Vannevar Bush et al. 1945. As we may think. The atlantic monthly 176, 1 (1945),101–108.
[8] Francois Chollet. 2017. Deep learning with Python. Simon and Schuster, NewYork, NY, United States.
[9] Nigel Davies, Adrian Friday, Sarah Clinch, Corina Sas, Marc Langheinrich, GeoWard, and Albrecht Schmidt. 2015. Security and Privacy Implications of PervasiveMemory Augmentation. IEEE Pervasive Computing 14, 1 (2015), 44–53.
[10] Andrea Ferlini, Alessandro Montanari, Cecilia Mascolo, and Robert Harle.2019. Head Motion Tracking through In-Ear Wearables. In Proceedings of the1st International Workshop on Earable Computing (New York, NY, USA, 2019)(EarComp’19). Association for Computing Machinery, New York, NY, USA, 8–13.https://doi.org/10.1145/3345615.3361131
[11] Sabrina A. L. Frohn, Jeevan S. Matharu, and Jamie A. Ward. 2020. Towards aCharacterisation of Emotional Intent during Scripted Scenes Using In-Ear Move-ment Sensors. In Proceedings of the 2020 International Symposium on WearableComputers (New York, NY, USA, 2020) (ISWC ’20). Association for ComputingMachinery, New York, NY, USA, 37–39. https://doi.org/10.1145/3410531.3414292
[12] Shkurta Gashi, Elena Di Lascio, Bianca Stancu, Vedant Das Swain, Varun Mishra,Martin Gjoreski, and Silvia Santini. 2020. Detection of Artifacts in AmbulatoryElectrodermal Activity Data. Proceedings of the ACM on Interactive, Mobile,Wearable and Ubiquitous Technologies 4, 2 (2020), 1–31.
[13] Jim Gemmell, Gordon Bell, and Roger Lueder. 2006. MyLifeBits: A PersonalDatabase for Everything. Commun. ACM 49, 1 (Jan. 2006), 88–95. https://doi.org/10.1145/1107458.1107460
[14] Jim Gemmell, Gordon Bell, Roger Lueder, Steven Drucker, and Curtis Wong.2002. MyLifeBits: Fullling the Memex Vision. In Proceedings of the Tenth ACMInternational Conference on Multimedia (Juan-les-Pins, France) (MULTIMEDIA’02). Association for Computing Machinery, New York, NY, USA, 235–238. https://doi.org/10.1145/641007.641053
[15] Aurélien Géron. 2019. Hands-on machine learning with Scikit-Learn, Keras, andTensorFlow: Concepts, tools, and techniques to build intelligent systems. O’ReillyMedia, Newton, MS, United States.
[16] Hristijan Gjoreski, Ivana Kiprijanovska, Simon Stankoski, Stefan Kalabakov, JohnBroulidakis, Charles Nduka, and Martin Gjoreski. 2021. Head-Ar: Human ActivityRecognition with Head-Mounted IMU Using Weighted Ensemble Learning. InActivity and Behavior Computing, Md Atiqur Rahman Ahad, Sozo Inoue, DanielRoggen, and Kaori Fujinami (Eds.). Springer Singapore, Singapore, 153–167.https://doi.org/10.1007/978-981-15-8944-7_10
[17] Martin Gjoreski, Vito Janko, Gašper Slapničar, Miha Mlakar, Nina Reščič, JaniBizjak, Vid Drobnič, Matej Marinko, Nejc Mlakar, Mitja Luštrek, et al. 2020.
Classical and deep learning methods for recognizing human activities and modesof transportation with smartphone sensors. Information Fusion 62 (2020), 47–62.
[18] Nils Y. Hammerla and Thomas Plötz. 2015. Let’s (Not) Stick Together: PairwiseSimilarity Biases Cross-Validation in Activity Recognition. In Proceedings of the2015 ACM International Joint Conference on Pervasive and Ubiquitous Computing(New York, NY, USA, 2015) (UbiComp ’15). Association for Computing Machinery,New York, NY, USA, 1041–1051. https://doi.org/10.1145/2750858.2807551
[19] Morgan Harvey, Marc Langheinrich, and Geo Ward. 2016. Rememberingthrough Lifelogging: A Survey of Human Memory Augmentation. Pervasive andMobile Computing 27 (2016), 14–26. https://doi.org/10.1016/j.pmcj.2015.12.002
[20] Steve Hodges, Lyndsay Williams, Emma Berry, Shahram Izadi, James Srinivasan,Alex Butler, Gavin Smyth, Narinder Kapur, and Ken Wood. 2006. SenseCam:A Retrospective Memory Aid. In UbiComp 2006: Ubiquitous Computing, PaulDourish and Adrian Friday (Eds.). Vol. 4206. Springer Berlin Heidelberg, Berlin,Heidelberg, 177–193. https://doi.org/10.1007/11853565_11
[21] Md Shaqul Islam, Tahera Hossain, Md Atiqur Rahman Ahad, and Sozo Inoue.2021. Exploring Human Activities Using eSense Earable Device. In Activity andBehavior Computing, Md Atiqur Rahman Ahad, Sozo Inoue, Daniel Roggen, andKaori Fujinami (Eds.). Springer Singapore, Singapore, 169–185. https://doi.org/10.1007/978-981-15-8944-7_11
[22] Fahim Kawsar, Chulhong Min, Akhil Mathur, and Allesandro Montanari. 2018.Earables For Personal-Scale Behavior Analytics. IEEE Pervasive Computing 17, 3(2018), 83–89.
[23] Fahim Kawsar, Chulhong Min, Akhil Mathur, Alessandro Montanari, Utku GünayAcer, and Marc Van den Broeck. 2018. ESense: Open Earable Platform for HumanSensing. In Proceedings of the 16th ACMConference on Embedded Networked SensorSystems (New York, NY, USA, 2018) (SenSys ’18). Association for Computing Ma-chinery, New York, NY, USA, 371–372. https://doi.org/10.1145/3274783.3275188
[24] Seungchul Lee, Chulhong Min, Alessandro Montanari, Akhil Mathur, YoungjaeChang, Junehwa Song, and Fahim Kawsar. 2019. Automatic Smile and FrownRecognition with Kinetic Earables. In Proceedings of the 10th Augmented HumanInternational Conference 2019 (New York, NY, USA, 2019) (AH2019). Associationfor Computing Machinery, New York, NY, USA, Article 25, 4 pages. https://doi.org/10.1145/3311823.3311869
[25] Roya Lot, George Tzanetakis, Rasit Eskicioglu, and Pourang Irani. 2020. AComparison between Audio and IMU Data to Detect Chewing Events Based onan Earable Device. In Proceedings of the 11th Augmented Human InternationalConference (New York, NY, USA, 2020) (AH ’20). Association for ComputingMachinery, New York, NY, USA, Article 11, 8 pages. https://doi.org/10.1145/3396339.3396362
[26] Chulhong Min, Alessandro Montanari, Akhil Mathur, Seungchul Lee, and FahimKawsar. 2018. Cross-Modal Approach for Conversational Well-Being Monitor-ing with Multi-Sensory Earables. In Proceedings of the 2018 ACM InternationalJoint Conference and 2018 International Symposium on Pervasive and UbiquitousComputing and Wearable Computers (Singapore Singapore, 2018-10-08). ACM,Singapore Singapore, 706–709. https://doi.org/10.1145/3267305.3267695
[27] Andreas C. Müller and Sarah Guido. 2016. Introduction to Machine Learningwith Python: A Guide for Data Scientists (rst edition ed.). O’Reilly Media, Inc,Sebastopol, CA, United States.
[28] Jay Prakash, Zhijian Yang, Yu-Lin Wei, and Romit Roy Choudhury. 2019. STEAR:Robust Step Counting from Earables. In Proceedings of the 1st International Work-shop on Earable Computing (London, United Kingdom, 2019-09-09). ACM, London,United Kingdom, 36–41. https://doi.org/10.1145/3345615.3361133
[29] Tobias Röddiger, Daniel Wolram, David Laubenstein, Matthias Budde, andMichael Beigl. 2019. Towards Respiration Rate Monitoring Using an In-EarHeadphone Inertial Measurement Unit. In Proceedings of the 1st InternationalWorkshop on Earable Computing (London, United Kingdom, 2019-09-09). ACM,London, United Kingdom, 48–53. https://doi.org/10.1145/3345615.3361130
[30] Abigail J. Sellen and SteveWhittaker. 2010. Beyond Total Capture: A ConstructiveCritique of Lifelogging. Commun. ACM 53, 5 (May 2010), 70–77. https://doi.org/10.1145/1735223.1735243
[31] Stephanie Tan, David MJ Tax, and Hayley Hung. 2021. Multimodal Joint HeadOrientation Estimation in Interacting Groups via Proxemics and InteractionDynamics. Proceedings of the ACM on Interactive, Mobile, Wearable and UbiquitousTechnologies (PACM IMWUT) 5, 1 (2021), 1–22.
[32] Minda Tessler and Katherine Nelson. 1994. Making memories: The inuence ofjoint encoding on later recall by young children. Consciousness and cognition 3,3-4 (1994), 307–326.
[33] Zi Wang, Sheng Tan, Linghan Zhang, Yili Ren, Zhi Wang, and Jie Yang. 2021.EarDynamic: An Ear Canal Deformation Based Continuous User AuthenticationUsing In-Ear Wearables. Proceedings of the ACM on Interactive, Mobile, Wearableand Ubiquitous Technologies 5, 1 (2021), 1–27.
[34] Xuhai Xu, Haitian Shi, Xin Yi, WenJia Liu, Yukang Yan, Yuanchun Shi, AlexMariakakis, Jennifer Manko, and Anind K. Dey. 2020. EarBuddy: Enabling On-Face Interaction via Wireless Earbuds. In Proceedings of the 2020 CHI Conferenceon Human Factors in Computing Systems (Honolulu, HI, USA, 2020-04-21). ACM,Honolulu, HI, USA, 1–14. https://doi.org/10.1145/3313831.3376836

Designing Memory Aids for Dementia Patients using EarablesMatija Franklin
University College LondonLondon, UK
David LagnadoUniversity College London
London, [email protected]
Chulhong MinNokia Bell LabsCambridge, UK
Akhil MathurNokia Bell LabsCambridge, UK
Fahim KawsarNokia Bell LabsCambridge, UK
ABSTRACTGlobally around 50 million people are currently living with demen-tia, and there are nearly 10million new cases every year. The declineof memory and, with it, lack of self-condence and continuous con-fusion have a devastating eect on people living with this disease.Dementia patients even struggle to accomplish mundane choresand require assistance for daily living and social connectedness.Over the past decade, we have seen remarkable growth in wearabletechnologies to manage our health and wellbeing and improve ourawareness and social connectedness. However, we have to ask whywearables are not addressing this fundamental challenge of mem-ory augmentation that threatens our society? Some limited existingwork on cognitive wearables for dementia has focused on usingimages via camera-based life-logging technology. Instead, in thispaper, we argue that earable - by virtue of its unique placement, richsensing modalities, and acoustic feedback capabilities, uncoversnew opportunities to augment human cognition to address thispressing need to assist dementia patients. To this end, we delve intofundamental principles of cognitive neuroscience to understandwhat constitutes memory disorder and its symptoms concerning er-rors in everyday activities. Building on this, we discuss the benetsof earables (in conjunction with smart objects) in modelling activ-ity and intention of dementia patients and providing contextualmemory cues. We put forward a guidance system to assist dementiapatients with daily living and social connectedness.
CCS CONCEPTS• Computer systems organization! Embedded systems.
KEYWORDSearables, dementia, cognitive impairment, memory aids
ACM Reference Format:Matija Franklin, David Lagnado, Chulhong Min, Akhil Mathur, and FahimKawsar. 2021. DesigningMemory Aids for Dementia Patients using Earables.
Permission to make digital or hard copies of all or part of this work for personal orclassroom use is granted without fee provided that copies are not made or distributedfor prot or commercial advantage and that copies bear this notice and the full citationon the rst page. Copyrights for components of this work owned by others than ACMmust be honored. Abstracting with credit is permitted. To copy otherwise, or republish,to post on servers or to redistribute to lists, requires prior specic permission and/or afee. Request permissions from [email protected] ’21 Adjunct, September 21–26, 2021, Virtual, USA© 2021 Association for Computing Machinery.ACM ISBN 978-1-4503-8461-2/21/09. . . $15.00https://doi.org/10.1145/3460418.3479324
In Adjunct Proceedings of the 2021 ACM International Joint Conference onPervasive and Ubiquitous Computing and Proceedings of the 2021 ACM Inter-national Symposium on Wearable Computers (UbiComp-ISWC ’21 Adjunct),September 21–26, 2021, Virtual, USA. ACM, New York, NY, USA, 6 pages.https://doi.org/10.1145/3460418.3479324
1 INTRODUCTION50 million people worldwide live with dementia, and nearly 10 mil-lion new cases are reported every year [1]. The loss of memory and,with it, a sense of identity are the most distressing aspects of thisdisease. Dementia patients even struggle to accomplish mundanechores and require assistance for daily living and social connected-ness [1].
Various memory aids have been proposed to help people withdementia and mild cognitive impairments (MCI). The most commonexamples of traditional methods are post-it notes, calendars, anddiaries [2]. Memory assistive technologies with electronic devicesare also widely used, such as note-taking on digital devices and in-telligent digital assistants (Siri, Cortana, Google Assistant). Recentwearable technologies enabled context-aware, automated interven-tion by leveraging a variety of sensors. The wearable remembranceagent [25] is a rst-kind-of wearable system for augmentedmemory.It continuously monitors information retrieved from computerssuch as note les and emails, and provides just-in-time one-linesummaries of information relevant to the user’s location and time.Hodges et al. presented SenseCam [11], a wearable camera for a ret-rospective memory aid, which automatically records surroundingevents and helps wearers review the recordings and stimulate theirmemory. DejaView [4] is a healthcare system that infers a user’ssurrounding contexts with a combination of sensors, including anaccelerometer, a microphone, and a camera, and aids recall of dailyactivities and plans by unobtrusively cueing the user with relevantinformation. However, the existing work on cognitive wearableshas been still limited to be practically used in daily life. The camera-based solutions for memory support require users to carry a bulkydevice and to make additional attention to the real-time interaction,e.g., with the smartphone or a computer display.
Here, we ask how wearables can help dementia patients live abetter and more independent life. To answer the questions, we focuson the everyday tasks of dementia patients, such as tea-making,getting dressed, and pill-taking, which adults with dementia areknown to struggle with. This inability to carry out activities ofdaily living is associated with a diminished quality of life, poorself-esteem, anxiety, and social isolation [3].

UbiComp-ISWC ’21 Adjunct, September 21–26, 2021, Virtual, USA Franklin et al.
In this paper, we argue that earable - by virtue of its uniqueplacement, rich sensing modalities, and acoustic feedback capabili-ties uncovers new opportunities to augment human cognition toaddress this pressing need to assist dementia patients. To this end,we delve into fundamental principles of cognitive neuroscience tounderstand what constitutes this memory disorder and its symp-toms concerning errors in everyday activities. We rst give a primeron dementia, along with a taxonomy of cognitive issues relatedto dementia as well as the characteristics of patient errors thatresult from memory impairments. Then, building on these ndingsand their implications, we discuss the benets of earables (in con-junction with smart objects) in modelling activity and intention ofdementia patients and providing practical and contextual memorycues. We also put forward a guidance system to assist dementiapatients for their daily living, and social connectedness.
2 COGNITION AND DEMENTIA: A PRIMERWe begin by delving into principles of human cognition, cognitivedecline, and its relationship with dementia.
Cognitive decline: Age-associated cognitive decline is the in-evitable process of normal, non-pathological neurological ageing [16].From early adulthood, processing (‘thinking’) speed, working mem-ory, reasoning and executive function all start to decline [5]. Therate of ‘normal’ brain ageing and the associated cognitive declinedepend onmany factors, including genetics, general health, lifestyle(e.g., diet), medical disorders, and biological processes such as in-ammation. Dementia and mild cognitive impairment (MCI), onthe other hand, are relatively rare in that most older people do notdevelop dementia; with current estimates suggesting that less thanone in ve people over the age of 80 have dementia [24].
Dementia and cognitive decline: Dementia is a syndrome thatis associated with a deterioration of memory and thinking, and anoverall decline of cognitive abilities at a greater pace [20]. Symp-toms include problems with planning and doing tasks in the rightorder, memory loss, mood and personality changes, and confu-sion. Dementia is diagnosed when these symptoms cause problemswith activities of daily living (ADLs) to the point that a personcannot live independently. Dementia is not a singular disease butassociated with multiple symptoms of memory loss, thinking andcommunication issues. Alzheimer’s disease is the most commontype of dementia, making up 60-75% of the total patients [24].
Dementia and MCI are not a part of normal brain ageing, butrather, diagnosable conditions. MCI aects 5-20% of the populationaged 65 and over [24]. It disrupts the same cognitive functionsaected by ‘normal’ brain ageing - processing speed, working mem-ory, reasoning and executive function - but to a greater extent.Common functional memory problems reported by people withMCI include forgetting names, numbers and passwords, misplacingthings, issues with remembering what was said or decided upon,and keeping track of commitments and intended activities. Thus,MCI does not fully prevent independent living and some cases aretreatable. One in 6 cases of MCI progress to dementia within a year.
Dementia and cognitive functions: To understand the cogni-tive functions aected by dementia, we oer a short overview ofcognitive domains and their implications associated with dementia.
Figure 1: Cognitive domains and corresponding functionsassociated with dementia and mild cognitive impairment
The Diagnostic and Statistical Manual of Mental Disorders, FifthEdition (American Psychiatric Association, 2013) - the taxonomicand diagnostic tool used by the American Psychiatric Associationfor psychiatric diagnoses - identies six cognitive domains associ-ated with dementia [12] as illustrated in Figure 1.• Complex attention: This domain covers the maintenance ofattention, selective attention, divided attention and processingspeed. Disruptions to this ability mean that normal tasks takelonger, especially in the presence of competing stimuli.
• Executive functioning: This domain reects the functions con-cerning planning, decision-making, working memory, feedbackutilisation, inhibition and cognitive exibility. Disruptions to thisability include diculties with multi-stage tasks, multi-tasking,following directions, organising, planning and keeping up withshifting situations and conversations.
• Learning and memory: This domain covers functions of imme-diate memory (e.g., repeating a list of digits), semantic memory(e.g., remembering facts), autobiographical memory (e.g.., remem-bering personal events), and procedural memory (e.g., recallingskills required to carry out procedures), as well as recent memory,which includes free recall (e.g., recalling as many things as possi-ble), cued recall (e.g., recalling as many things as possible froma specic category) and recognition. Disruptions to this abilityinclude diculties recalling recent events, losing track of one’sown actions, misplacing objects and repeating oneself.
• Language: This domain represents expressive language (i.e., u-ency in speech), grammar and syntax, and receptive language (i.e.,comprehension). Disruptions to this ability include use of wrongwords, grammatical error, word-nding diculty and dicultieswith comprehension of spoken or written language.
• Perceptual-motor and visuospatial function: This domaincovers visuoconstructional abilities (e.g., draw, assemble furniture),perceptuomotor (e.g., insert puzzle piece into appropriate slots),praxis (e.g., ability to mime gestures) and gnosis (e.g., recognisesfaces and colors). Disruptions in this ability can lead to patientsgetting lost in familiar places, and nding it dicult to use famil-iar tools and appliances.
• Social cognition: This domain represents the ability to recogniseemotions and to have a theory of mind (e.g., considering anotherperson’s thoughts and intentions). Disruption to this ability can
Designing Memory Aids for Dementia Patients using Earables UbiComp-ISWC ’21 Adjunct, September 21–26, 2021, Virtual, USA
lead to a loss of empathy, loss of judgement and inappropriatebehaviour.
Dementia patients experience disruptions to these cognitivefunctions at varying degrees depending on the stage of the disease.However, the common symptoms, irrespective of the decline of spe-cic cognitive functions in dementia patients, are errors in everydayfunctioning. Naturally, understanding and designing interventionsaimed at addressing these symptoms are active research areas. Weconsider this aspect of understanding and designing interventionsfor the symptoms is where wearables, and in particular earable,can play a critical role. To this end, in the next section, we delveinto error patterns typically demonstrated by dementia patients asa structured and systematic understanding of these patterns willprovide us with the proper foundation for applying earable-basedassistive solutions.
3 UNDERSTANDING ERROR PATTERNS OFDEMENTIA PATIENTS
Areas of cognition that are disrupted by dementia produce well-known patterns of errors. These include calculation, memory of pastevents, prospective memory (e.g., remembering to attend an upcom-ing appointment) and the sequencing of complex behaviour [15].In this section, we reect on several past studies to systematicallyidentify a set of error patterns associated with dementia patients.
Action coding for error identication: To understand and sys-tematically categorise the dierent errors produced by dementiapatients, researchers have used the action coding system - a methodfor coding the actions of patients [28]. Here, A1 transcripts providelow-level descriptions of a patient’s interaction with the environ-ment that allowed the errors to be identied. There are four dierenttypes of actions: move, alter, take, and give. A2 transcripts are pro-cedures within the A1 actions, which can be used to identify errorswithin the transition between A1 sub-goals. In other words, theow between dierent actions can be analysed as well as the degreeof overlap between dierent actions.
A review of research using the action coding system identiedeight common dementia patient errors that occur during activitiesof daily living (ADL), for instance, making a hot drink. The errors -six types of error and two types of incoherent action [28] included:
(1) Place substitution (e.g., putting tea in cereal)(2) Object substitution (e.g., apple juice added to the cup of tea)(3) Drinking anticipation (e.g., drinking tea before it is prepared)(4) Omission errors (e.g., pouring in water from the kettle before it
boiled)(5) Instrumental substitutions (e.g., stirring the tea with a knife)(6) Faulty execution (e.g., not fully opening a sugar packet)
The incoherent actions were:
(1) Independent acts (e.g., picking up a random item and thenputting it down again)
(2) Toying behaviour (e.g., making random gestures with objectswith no apparent aim to the action).
A point of note here is that these actions and their transitionscan be modelled with activity recognition capabilities aorded bywearables today. We reect on this in the latter part of this paper.
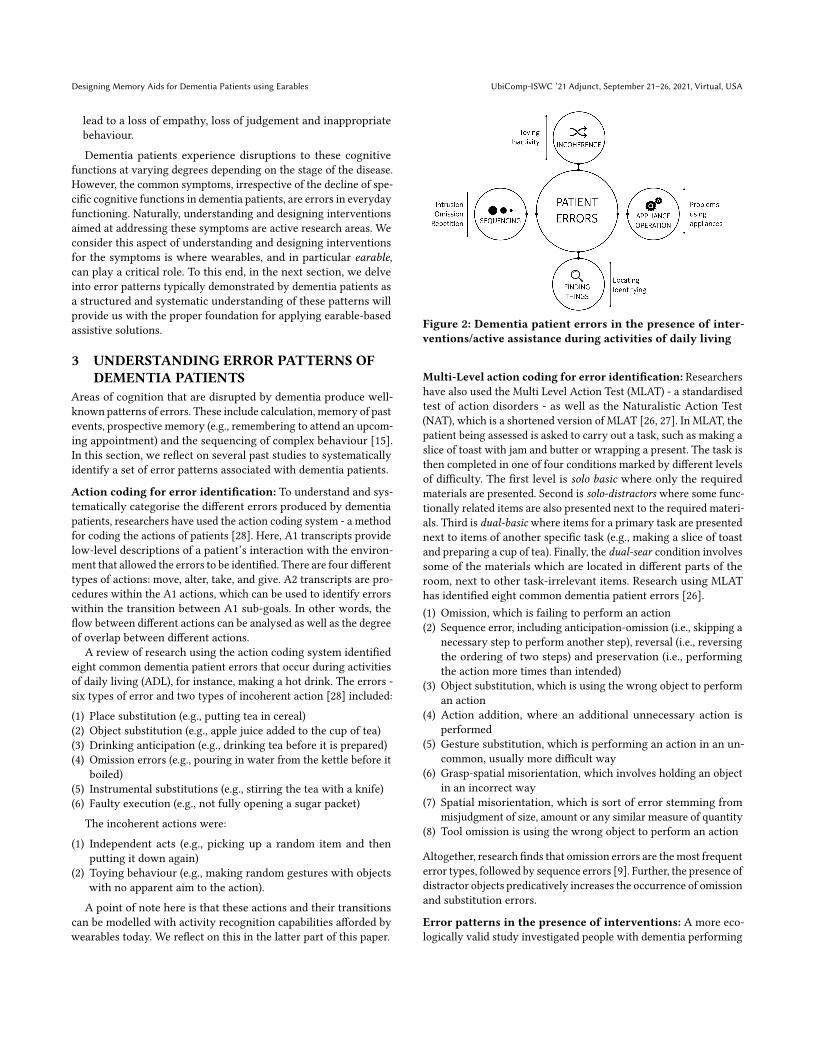
Figure 2: Dementia patient errors in the presence of inter-ventions/active assistance during activities of daily living
Multi-Level action coding for error identication: Researchershave also used the Multi Level Action Test (MLAT) - a standardisedtest of action disorders - as well as the Naturalistic Action Test(NAT), which is a shortened version of MLAT [26, 27]. In MLAT, thepatient being assessed is asked to carry out a task, such as making aslice of toast with jam and butter or wrapping a present. The task isthen completed in one of four conditions marked by dierent levelsof diculty. The rst level is solo basic where only the requiredmaterials are presented. Second is solo-distractors where some func-tionally related items are also presented next to the required materi-als. Third is dual-basic where items for a primary task are presentednext to items of another specic task (e.g., making a slice of toastand preparing a cup of tea). Finally, the dual-sear condition involvessome of the materials which are located in dierent parts of theroom, next to other task-irrelevant items. Research using MLAThas identied eight common dementia patient errors [26].(1) Omission, which is failing to perform an action(2) Sequence error, including anticipation-omission (i.e., skipping a
necessary step to perform another step), reversal (i.e., reversingthe ordering of two steps) and preservation (i.e., performingthe action more times than intended)
(3) Object substitution, which is using the wrong object to performan action
(4) Action addition, where an additional unnecessary action isperformed
(5) Gesture substitution, which is performing an action in an un-common, usually more dicult way
(6) Grasp-spatial misorientation, which involves holding an objectin an incorrect way
(7) Spatial misorientation, which is sort of error stemming frommisjudgment of size, amount or any similar measure of quantity
(8) Tool omission is using the wrong object to perform an action
Altogether, research nds that omission errors are themost frequenterror types, followed by sequence errors [9]. Further, the presence ofdistractor objects predicatively increases the occurrence of omissionand substitution errors.
Error patterns in the presence of interventions: A more eco-logically valid study investigated people with dementia performing

UbiComp-ISWC ’21 Adjunct, September 21–26, 2021, Virtual, USA Franklin et al.
ADLs that they themselves identied as important in their ownkitchens, including making a cup of tea or coee [28]. The studytried to assist patients using ve levels of prompting: 1) a verbalprompt of the end goal, 2) a verbal prompt of the sub-goal, 3) a ver-bal prompt of the action, 4) a verbal prompt of action and pointing,5) performing the action for them. Based on the results, the studyconcluded four broader areas of error: sequencing, nding things,operation of appliances, incoherence [28] as depicted in Figure 2.
• Sequencing errors included intrusion, whereby an inappropriateaction is performed from a dierent activity that prevents thecompletion of the current activity; omission, whereby a patientmisses an action that is required for completing the activityand accomplishing the end goal; repetition, whereby a patientunnecessarily repeats an action that prevents the completion ofthe activity.
• Finding things errors included locating - errors in nding itemsthat are out of view - and identifying - selecting items that are inview.
• Operation of appliances errors were problems of using dier-ent appliances such as the kettle or toaster.
• Incoherence errors included toying - performing random ges-tures with items with no apparent goal - and inactivity - notperforming any action at all.
This systematic analysis of error patterns exhibited by dementiapatients provides the foundation for designing intervention solu-tions with wearables. However, it also expose the requirement forintervention beyond on-body augmentations, i.e., instrumentationof patient environments to oer situated assistance.
Intention-action Gap: The uniformity of results across patientshas led researchers to argue that the dierent types of error allresult from a disruption to a cognitive process responsible for goal-directed behaviour [28]. To this end, Norman et al. proposed thecontention scheduling model - a model of action error - that explainshow this disruption would occur [22]. The model proposes that thepathological weakening of top-down activation from a supervisoryattentional system means that the contention scheduling systemresponsible for choosing action schemas is disrupted and does notwork the way it should. Bottom-up activation externally from envi-ronmental triggers and internally from associated action schemasresult in actions that do not follow the intended goal. This producesan intention-action gap in dementia patients.
Implications: We can draw several important implications thatemerged from these studies in the design of memory aid apply-ing pervasive technologies to support dementia patients. The con-tention scheduling model essentially exposes the critical challenge,i.e., to reduce the gap between patient’s intention and correspond-ing action by modelling patient’s activity and interaction with thephysical world and situational context. This understanding thenfurther be utilised to design interventions applying implicit or ex-plicit memory cues. The error patterns highlight the scope of thesechallenges quite appropriately.
On activity modelling, it is imperative to understand: 1) pa-tients’ motion-induced physical activity and gesture, 2) the stateand identity of the physical object that a patient interacts with to
accomplish the intended task, 3) the exact interaction dynamicsconcerning the physical object in context.
On intention modelling, it is critical to understand the pa-tient’s overall objective to derive a plan applying causal reason-ing grounded on predictive modelling of a patient’s past actionsfor the same purpose. This aspect uncovers interesting modellingchallenges and demands thoughtful mitigation strategy both fordirective and corrective guidance.
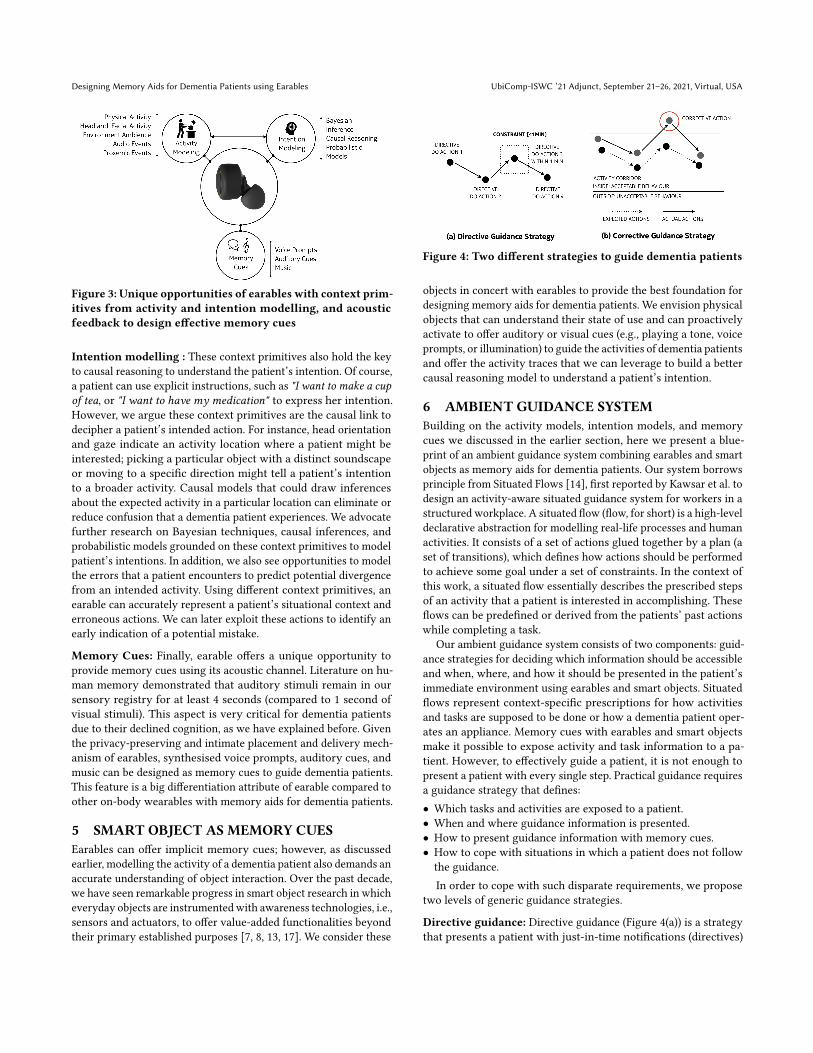
On designing memory cues, we see opportunities in two dif-ferent dimensions. First, it is imperative to create implicit memorycues, e.g., voice prompts, just-in-time visuals, to direct and correctpatients’ actions. Second, we also see opportunities to augmentphysical objects with awareness technologies (sensors and actu-ators) to augment their functional capabilities to participate in apatient activity in a proactive way.
In the next section, we discuss how we can apply these implica-tions to design memory aids for dementia patients.
4 EARABLE AS MEMORY AIDIn the previous sections, we oered a concise overview of cognitiondecline, its relationship with dementia, and its implications on de-mentia patients concerning errors in ADLs. We also identied threeprimary challenges in designing memory aids to support demen-tia patients in mitigating these errors. In this section, we want toposit that earables, together with smart objects, provide the properfoundation for designing assistive guidance for dementia patients.Grounded on contention scheduling model, we learned that reducingthe gap between intended objective and corresponding actions isone of the critical facets to assist dementia patients. Taking a deeperview of this facet, we have identied three key dimensions: activitymodelling, intention modelling, and eective memory cues thatcan collectively mitigate erroneous actions. Earables today comewith rich sensors, including inertial measurement unit (IMU), mi-crophones, Bluetooth Low Energy (BLE), and in some instances,optical sensor (PPG), core body temperature sensor, and electroder-mal activity (EDA) sensor. These sensors and their placement inthe ear collectively oer us unique opportunities to observe andunderstand internal (biomarkers) and external contexts around ahuman body and oer us privacy-preserving, intimate, and sub-tle feedback capabilities through synthesised speech, music, andacoustic cues. These capabilities are critical to all three dimensionswe listed before.
Activity modeling: We can recognise upper body movements,such as head and neck activities [6, 21], facial activities and ex-pression [18], and whole-body movements, i.e., walking, standing,falling, etc. [21]. These motion primitives are vital artefacts to un-derstand a patient’s motion-induced physical activities and gestures.Note that modelling all these context primitives, especially aroundthe head, is not possible with other wearables. The acoustic channelof an earable enables us to understand environment ambience andaudio events [19, 23], thereby modelling a patient’s proxemic, so-cial context as well patient’s interaction with physical objects [10].Combining these primitives and their thoughtful synthesis is key inmodelling patient activities and creating digital memories throughencoding for future recall.
Designing Memory Aids for Dementia Patients using Earables UbiComp-ISWC ’21 Adjunct, September 21–26, 2021, Virtual, USA
Figure 3: Unique opportunities of earables with context prim-itives from activity and intention modelling, and acousticfeedback to design eective memory cues
Intention modelling : These context primitives also hold the keyto causal reasoning to understand the patient’s intention. Of course,a patient can use explicit instructions, such as "I want to make a cupof tea, or "I want to have my medication" to express her intention.However, we argue these context primitives are the causal link todecipher a patient’s intended action. For instance, head orientationand gaze indicate an activity location where a patient might beinterested; picking a particular object with a distinct soundscapeor moving to a specic direction might tell a patient’s intentionto a broader activity. Causal models that could draw inferencesabout the expected activity in a particular location can eliminate orreduce confusion that a dementia patient experiences. We advocatefurther research on Bayesian techniques, causal inferences, andprobabilistic models grounded on these context primitives to modelpatient’s intentions. In addition, we also see opportunities to modelthe errors that a patient encounters to predict potential divergencefrom an intended activity. Using dierent context primitives, anearable can accurately represent a patient’s situational context anderroneous actions. We can later exploit these actions to identify anearly indication of a potential mistake.
Memory Cues: Finally, earable oers a unique opportunity toprovide memory cues using its acoustic channel. Literature on hu-man memory demonstrated that auditory stimuli remain in oursensory registry for at least 4 seconds (compared to 1 second ofvisual stimuli). This aspect is very critical for dementia patientsdue to their declined cognition, as we have explained before. Giventhe privacy-preserving and intimate placement and delivery mech-anism of earables, synthesised voice prompts, auditory cues, andmusic can be designed as memory cues to guide dementia patients.This feature is a big dierentiation attribute of earable compared toother on-body wearables with memory aids for dementia patients.
5 SMART OBJECT AS MEMORY CUESEarables can oer implicit memory cues; however, as discussedearlier, modelling the activity of a dementia patient also demands anaccurate understanding of object interaction. Over the past decade,we have seen remarkable progress in smart object research in whicheveryday objects are instrumentedwith awareness technologies, i.e.,sensors and actuators, to oer value-added functionalities beyondtheir primary established purposes [7, 8, 13, 17]. We consider these
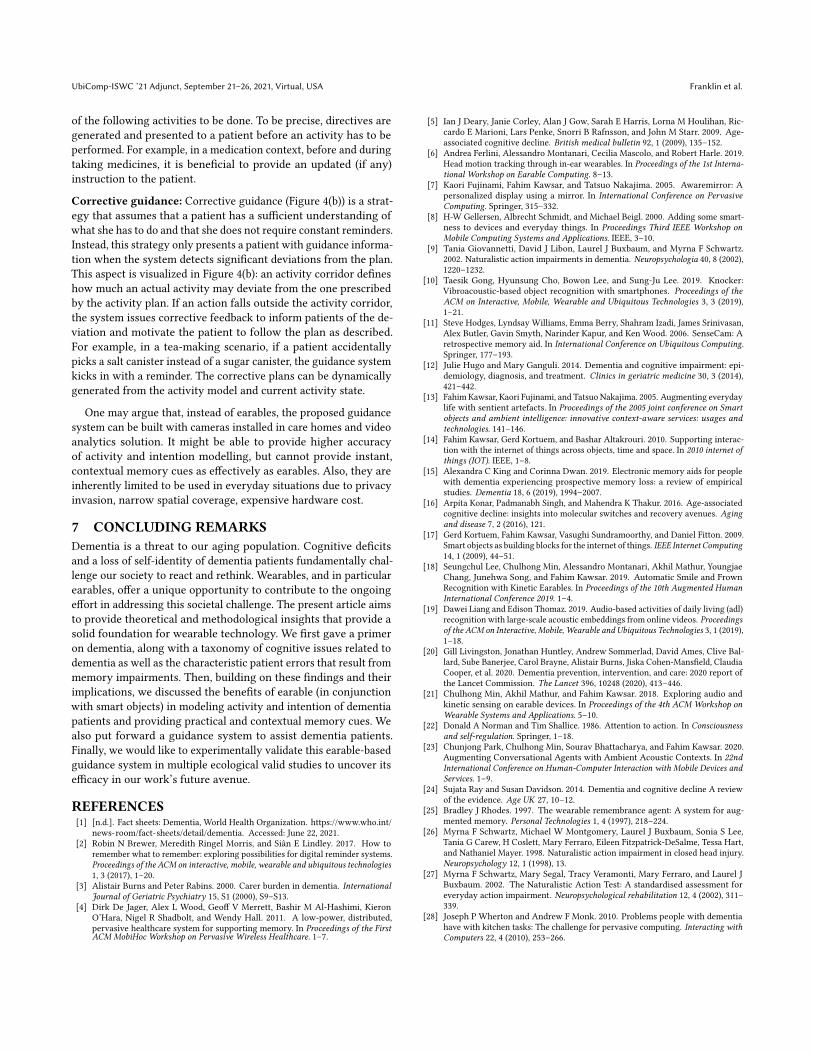
Figure 4: Two dierent strategies to guide dementia patients
objects in concert with earables to provide the best foundation fordesigning memory aids for dementia patients. We envision physicalobjects that can understand their state of use and can proactivelyactivate to oer auditory or visual cues (e.g., playing a tone, voiceprompts, or illumination) to guide the activities of dementia patientsand oer the activity traces that we can leverage to build a bettercausal reasoning model to understand a patient’s intention.
6 AMBIENT GUIDANCE SYSTEMBuilding on the activity models, intention models, and memorycues we discussed in the earlier section, here we present a blue-print of an ambient guidance system combining earables and smartobjects as memory aids for dementia patients. Our system borrowsprinciple from Situated Flows [14], rst reported by Kawsar et al. todesign an activity-aware situated guidance system for workers in astructured workplace. A situated ow (ow, for short) is a high-leveldeclarative abstraction for modelling real-life processes and humanactivities. It consists of a set of actions glued together by a plan (aset of transitions), which denes how actions should be performedto achieve some goal under a set of constraints. In the context ofthis work, a situated ow essentially describes the prescribed stepsof an activity that a patient is interested in accomplishing. Theseows can be predened or derived from the patients’ past actionswhile completing a task.
Our ambient guidance system consists of two components: guid-ance strategies for deciding which information should be accessibleand when, where, and how it should be presented in the patient’simmediate environment using earables and smart objects. Situatedows represent context-specic prescriptions for how activitiesand tasks are supposed to be done or how a dementia patient oper-ates an appliance. Memory cues with earables and smart objectsmake it possible to expose activity and task information to a pa-tient. However, to eectively guide a patient, it is not enough topresent a patient with every single step. Practical guidance requiresa guidance strategy that denes:• Which tasks and activities are exposed to a patient.• When and where guidance information is presented.• How to present guidance information with memory cues.• How to cope with situations in which a patient does not followthe guidance.In order to cope with such disparate requirements, we propose
two levels of generic guidance strategies.
Directive guidance: Directive guidance (Figure 4(a)) is a strategythat presents a patient with just-in-time notications (directives)
UbiComp-ISWC ’21 Adjunct, September 21–26, 2021, Virtual, USA Franklin et al.
of the following activities to be done. To be precise, directives aregenerated and presented to a patient before an activity has to beperformed. For example, in a medication context, before and duringtaking medicines, it is benecial to provide an updated (if any)instruction to the patient.
Corrective guidance: Corrective guidance (Figure 4(b)) is a strat-egy that assumes that a patient has a sucient understanding ofwhat she has to do and that she does not require constant reminders.Instead, this strategy only presents a patient with guidance informa-tion when the system detects signicant deviations from the plan.This aspect is visualized in Figure 4(b): an activity corridor deneshow much an actual activity may deviate from the one prescribedby the activity plan. If an action falls outside the activity corridor,the system issues corrective feedback to inform patients of the de-viation and motivate the patient to follow the plan as described.For example, in a tea-making scenario, if a patient accidentallypicks a salt canister instead of a sugar canister, the guidance systemkicks in with a reminder. The corrective plans can be dynamicallygenerated from the activity model and current activity state.
One may argue that, instead of earables, the proposed guidancesystem can be built with cameras installed in care homes and videoanalytics solution. It might be able to provide higher accuracyof activity and intention modelling, but cannot provide instant,contextual memory cues as eectively as earables. Also, they areinherently limited to be used in everyday situations due to privacyinvasion, narrow spatial coverage, expensive hardware cost.
7 CONCLUDING REMARKSDementia is a threat to our aging population. Cognitive decitsand a loss of self-identity of dementia patients fundamentally chal-lenge our society to react and rethink. Wearables, and in particularearables, oer a unique opportunity to contribute to the ongoingeort in addressing this societal challenge. The present article aimsto provide theoretical and methodological insights that provide asolid foundation for wearable technology. We rst gave a primeron dementia, along with a taxonomy of cognitive issues related todementia as well as the characteristic patient errors that result frommemory impairments. Then, building on these ndings and theirimplications, we discussed the benets of earable (in conjunctionwith smart objects) in modeling activity and intention of dementiapatients and providing practical and contextual memory cues. Wealso put forward a guidance system to assist dementia patients.Finally, we would like to experimentally validate this earable-basedguidance system in multiple ecological valid studies to uncover itsecacy in our work’s future avenue.
REFERENCES[1] [n.d.]. Fact sheets: Dementia, World Health Organization. https://www.who.int/
news-room/fact-sheets/detail/dementia. Accessed: June 22, 2021.[2] Robin N Brewer, Meredith Ringel Morris, and Siân E Lindley. 2017. How to
remember what to remember: exploring possibilities for digital reminder systems.Proceedings of the ACM on interactive, mobile, wearable and ubiquitous technologies1, 3 (2017), 1–20.
[3] Alistair Burns and Peter Rabins. 2000. Carer burden in dementia. InternationalJournal of Geriatric Psychiatry 15, S1 (2000), S9–S13.
[4] Dirk De Jager, Alex L Wood, Geo V Merrett, Bashir M Al-Hashimi, KieronO’Hara, Nigel R Shadbolt, and Wendy Hall. 2011. A low-power, distributed,pervasive healthcare system for supporting memory. In Proceedings of the FirstACM MobiHoc Workshop on Pervasive Wireless Healthcare. 1–7.
[5] Ian J Deary, Janie Corley, Alan J Gow, Sarah E Harris, Lorna M Houlihan, Ric-cardo E Marioni, Lars Penke, Snorri B Rafnsson, and John M Starr. 2009. Age-associated cognitive decline. British medical bulletin 92, 1 (2009), 135–152.
[6] Andrea Ferlini, Alessandro Montanari, Cecilia Mascolo, and Robert Harle. 2019.Head motion tracking through in-ear wearables. In Proceedings of the 1st Interna-tional Workshop on Earable Computing. 8–13.
[7] Kaori Fujinami, Fahim Kawsar, and Tatsuo Nakajima. 2005. Awaremirror: Apersonalized display using a mirror. In International Conference on PervasiveComputing. Springer, 315–332.
[8] H-W Gellersen, Albrecht Schmidt, and Michael Beigl. 2000. Adding some smart-ness to devices and everyday things. In Proceedings Third IEEE Workshop onMobile Computing Systems and Applications. IEEE, 3–10.
[9] Tania Giovannetti, David J Libon, Laurel J Buxbaum, and Myrna F Schwartz.2002. Naturalistic action impairments in dementia. Neuropsychologia 40, 8 (2002),1220–1232.
[10] Taesik Gong, Hyunsung Cho, Bowon Lee, and Sung-Ju Lee. 2019. Knocker:Vibroacoustic-based object recognition with smartphones. Proceedings of theACM on Interactive, Mobile, Wearable and Ubiquitous Technologies 3, 3 (2019),1–21.
[11] Steve Hodges, Lyndsay Williams, Emma Berry, Shahram Izadi, James Srinivasan,Alex Butler, Gavin Smyth, Narinder Kapur, and Ken Wood. 2006. SenseCam: Aretrospective memory aid. In International Conference on Ubiquitous Computing.Springer, 177–193.
[12] Julie Hugo and Mary Ganguli. 2014. Dementia and cognitive impairment: epi-demiology, diagnosis, and treatment. Clinics in geriatric medicine 30, 3 (2014),421–442.
[13] Fahim Kawsar, Kaori Fujinami, and Tatsuo Nakajima. 2005. Augmenting everydaylife with sentient artefacts. In Proceedings of the 2005 joint conference on Smartobjects and ambient intelligence: innovative context-aware services: usages andtechnologies. 141–146.
[14] Fahim Kawsar, Gerd Kortuem, and Bashar Altakrouri. 2010. Supporting interac-tion with the internet of things across objects, time and space. In 2010 internet ofthings (IOT). IEEE, 1–8.
[15] Alexandra C King and Corinna Dwan. 2019. Electronic memory aids for peoplewith dementia experiencing prospective memory loss: a review of empiricalstudies. Dementia 18, 6 (2019), 1994–2007.
[16] Arpita Konar, Padmanabh Singh, and Mahendra K Thakur. 2016. Age-associatedcognitive decline: insights into molecular switches and recovery avenues. Agingand disease 7, 2 (2016), 121.
[17] Gerd Kortuem, Fahim Kawsar, Vasughi Sundramoorthy, and Daniel Fitton. 2009.Smart objects as building blocks for the internet of things. IEEE Internet Computing14, 1 (2009), 44–51.
[18] Seungchul Lee, Chulhong Min, Alessandro Montanari, Akhil Mathur, YoungjaeChang, Junehwa Song, and Fahim Kawsar. 2019. Automatic Smile and FrownRecognition with Kinetic Earables. In Proceedings of the 10th Augmented HumanInternational Conference 2019. 1–4.
[19] Dawei Liang and Edison Thomaz. 2019. Audio-based activities of daily living (adl)recognition with large-scale acoustic embeddings from online videos. Proceedingsof the ACM on Interactive, Mobile, Wearable and Ubiquitous Technologies 3, 1 (2019),1–18.
[20] Gill Livingston, Jonathan Huntley, Andrew Sommerlad, David Ames, Clive Bal-lard, Sube Banerjee, Carol Brayne, Alistair Burns, Jiska Cohen-Manseld, ClaudiaCooper, et al. 2020. Dementia prevention, intervention, and care: 2020 report ofthe Lancet Commission. The Lancet 396, 10248 (2020), 413–446.
[21] Chulhong Min, Akhil Mathur, and Fahim Kawsar. 2018. Exploring audio andkinetic sensing on earable devices. In Proceedings of the 4th ACM Workshop onWearable Systems and Applications. 5–10.
[22] Donald A Norman and Tim Shallice. 1986. Attention to action. In Consciousnessand self-regulation. Springer, 1–18.
[23] Chunjong Park, Chulhong Min, Sourav Bhattacharya, and Fahim Kawsar. 2020.Augmenting Conversational Agents with Ambient Acoustic Contexts. In 22ndInternational Conference on Human-Computer Interaction with Mobile Devices andServices. 1–9.
[24] Sujata Ray and Susan Davidson. 2014. Dementia and cognitive decline A reviewof the evidence. Age UK 27, 10–12.
[25] Bradley J Rhodes. 1997. The wearable remembrance agent: A system for aug-mented memory. Personal Technologies 1, 4 (1997), 218–224.
[26] Myrna F Schwartz, Michael W Montgomery, Laurel J Buxbaum, Sonia S Lee,Tania G Carew, H Coslett, Mary Ferraro, Eileen Fitzpatrick-DeSalme, Tessa Hart,and Nathaniel Mayer. 1998. Naturalistic action impairment in closed head injury.Neuropsychology 12, 1 (1998), 13.
[27] Myrna F Schwartz, Mary Segal, Tracy Veramonti, Mary Ferraro, and Laurel JBuxbaum. 2002. The Naturalistic Action Test: A standardised assessment foreveryday action impairment. Neuropsychological rehabilitation 12, 4 (2002), 311–339.
[28] Joseph P Wherton and Andrew F Monk. 2010. Problems people with dementiahave with kitchen tasks: The challenge for pervasive computing. Interacting withComputers 22, 4 (2010), 253–266.

Towards Automatic Recognition of Perceived Level ofUnderstanding on Online Lectures using Earables
Dongwoo Kim∗
NAVERSeongnam, Republic of [email protected]
Chulhong Min†Nokia Bell LabsCambridge, UK
Seungwoo KangKOREATECH
Cheonan, Republic of [email protected]
ABSTRACTThe COVID-19 pandemic has seriously impacted education andforced the whole education system to shift to online learning. Sucha transition has been readily made by virtue of today’s Internettechnology and infrastructure, but online learning also has limi-tations compared to traditional face-to-face lectures. One of thebiggest hurdles is that it is challenging for teachers to instantlykeep track of students’ learning status. In this paper, we envisionearables as an opportunity to automatically estimate learner’s un-derstanding of learning material for eective learning and teaching,e.g., to pinpoint the part for which learners need to put more eortto understand. To this end, we conduct a small-scale exploratorystudy with 8 participants for 24 lectures in total and investigatelearner’s behavioral characteristics that indicate the level of under-standing. We demonstrate that those behaviors can be capturedfrom a motion signal on earables. We discuss challenges that needto be further addressed to realize our vision.
CCS CONCEPTS•Human-centered computing!Ubiquitous andmobile com-puting systems and tools; • Applied computing! E-learning.
KEYWORDSOnline Learning, Understanding Level, Earable, Automatic Recog-nition
ACM Reference Format:Dongwoo Kim, Chulhong Min, and Seungwoo Kang. 2021. Towards Auto-matic Recognition of Perceived Level of Understanding on Online Lecturesusing Earables. In Adjunct Proceedings of the 2021 ACM International JointConference on Pervasive and Ubiquitous Computing and Proceedings of the2021 ACM International Symposium on Wearable Computers (UbiComp-ISWC’21 Adjunct), September 21–26, 2021, Virtual, USA. ACM, New York, NY, USA,6 pages. https://doi.org/10.1145/3460418.3479323
∗This work was done while the rst author was with KOREATECH.†Corresponding author.
Permission to make digital or hard copies of all or part of this work for personal orclassroom use is granted without fee provided that copies are not made or distributedfor prot or commercial advantage and that copies bear this notice and the full citationon the rst page. Copyrights for components of this work owned by others than ACMmust be honored. Abstracting with credit is permitted. To copy otherwise, or republish,to post on servers or to redistribute to lists, requires prior specic permission and/or afee. Request permissions from [email protected] ’21 Adjunct, September 21–26, 2021, Virtual, USA© 2021 Association for Computing Machinery.ACM ISBN 978-1-4503-8461-2/21/09. . . $15.00https://doi.org/10.1145/3460418.3479323
1 INTRODUCTIONThe COVID-19 pandemic has impacted every aspect of our lives.Among others, education has been seriously aected. Schools ina lot of countries had to close or reduce their face-to-face classes.According to some reports [1, 2], more than 1 billion studentsworldwide could not use their classrooms at the peak of the crisis.Alternatively, schools are providing access to education using onlinelearning technology and numerous students are currently educatedremotely all over the world. The pandemic would accelerate theeducational innovation far beyond the advance of online learningwitnessed over the last decade, e.g., Coursera and Udacity.
While the transition to online learning has been readily madeby virtue of today’s Internet technology and infrastructure, onlinelearning also has limitations compared to traditional face-to-facelectures. One of the biggest hurdles is that teachers could not in-stantly keep track of students’ learning status. In pre-recorded videolectures such as Coursera, teachers can neither observe how stu-dents engage in lectures, e.g., nonverbal and behavioral cues, norinteract with them. In live lectures using online conferencing toolssuch as Zoom, such observation and interaction can be possible ifstudents have a camera and a microphone, but it imposes signicantburdens on teachers, especially when there are a number of stu-dents in a lecture. These limitations hinder teachers from adaptingtheir lecture materials or teaching methods when necessary. Onetypical method is to give a quiz after/during a lecture, but it is alsoburdensome to teachers due to the time and eort required.
In this paper, we envision earables (also known as smart earbuds)as an opportunity to automatically estimate learner’s understandingstatus of learning materials. Such functionality would enable eec-tive learning and teaching even in online lectures, e.g., to pinpointthe part for which learners need to put more eort to understand.From an explorative study, we uncover that a learner’s posturesand head motions can be a clue to represent their understandingof lectures. We present the capability and feasibility of identifyinglearners’ understanding levels based on such behavioral patterns.Then, we discuss opportunities and challenges for realizing theautomatic estimation of understanding in the wild.
2 RELATEDWORKPrevious studies have demonstrated the capability of detecting on-line learners’ diverse status (e.g., inattention, engagement, frustra-tion, mind wandering) based on their behavioral patterns [3, 7, 13–15]. For example, Mota et al. presented a technique to recognizenaturally occurring postures of learners and detect their interestlevel based on pressure sensors mounted on a chair [13]. Phamet al. proposed a multimodal approach to infer learners’ aectiveand cognitive states such as boredom, confusion, and frustration

UbiComp-ISWC ’21 Adjunct, September 21–26, 2021, Virtual, USA Kim, Min and Kang
Figure 1: Bloom’s Taxonomy (the image by the VanderbiltUniversity Center for Teaching / CC-BY 1)
by analyzing facial expressions and PPG signals captured from thefront and back cameras of a smartphone [14]. Robal et al. presentedan IntelliEye system that tracks face and mouth use of online learn-ers to detect in-attention state [15]. It also provides alerts to themwhen they are in-attentive to return learners’ attention to a lecturevideo. Grafsgaard et al. proposed to predict the engagement andfrustration of students during computer-mediated tutoring basedon ned-grained facial movements [7]. Bosch et al. proposed anautomatic mind wandering detector by analyzing a set of facialfeatures from face videos of students [3].
These works commonly imply that online learners’ behaviorsduring the lecture carry meaningful information about their learn-ing status. However, they mostly rely on physiological sensorsand/or computer vision, thereby signicantly limiting their practi-cality in real-life situations, due to the need for using additional,dedicated devices and privacy concerns. We investigate how learn-ers’ behaviors, more specically postures and motion gestures, canbe interpreted to represent their understanding while taking anonline lecture. For example, a student might often tilt her head orlook at a monitor vacantly when she does not understand what shelistens to. Similarly, some students might nod their head when theywell follow what is taught. Our initial idea and preliminary studywas presented in [9].
3 APPROACH TO UNDERSTANDINGESTIMATION
3.1 Modelling UnderstandingMeasuring howwell students learn and understand lectures is essen-tial for teachers to provide eective teaching. Bloom’s Taxonomyis a widely-adopted educational framework, which was developedto assist teachers to plan classes and design valid assessment strate-gies [4, 10]. The revised version of Bloom’s Taxonomy introducessix levels of cognitive learning; remembering, understanding, apply-ing, analyzing, evaluating, and creating [10]. As shown in Figure 1,each level represents dierent cognitive skills and learning behav-iors from the most basic to the more complex levels. For example,remembering is related to retrieving, recalling, and recognizingfactual information and relevant knowledge, and understanding is1https://www.ickr.com/photos/vandycft/29428436431
Table 1: Questionnaire for the level of understanding.1 I could tell the important keywords/concept of the lecture2 I could briey explain the important keywords/concept of the
lecture3 I could tell what I newly learned4 I could explain the summary of the lecture content5 I could explain the lecture content so that others can understand it
related to interpreting, summarizing, and explaining main ideas andconcepts of learning material. Moving up the levels, they refer tohigher cognitive thoughts and skills. In this study, we adopt the rsttwo levels of Bloom’s Taxonomy, remembering and understanding+,to model online student’s understanding of learning material 2.
3.2 Quantifying Understanding LevelTo quantify the level of learner’s understanding, we design a ques-tionnaire by adopting Bloom’s Taxonomy. We note that teachersare often encouraged to use dierent types of questions in class andon assignments and tests based on Bloom’s Taxonomy to stimulateand assess students’ cognitive thinking. Example questions thatcan be used are as follows.
• How would you dene ... ?• What was the main idea ... ?• Can you write a brief outline ... ?• Can you provide an example of ... ?
Inspired by these, we design the questionnaire with ve statementsas shown in Table 1. We construct the rst two statements in thetable for the concept of remembering and the rest three for theconcept of understanding+. For each statement, respondents areasked to rate how much they agree with the statement using a5-point Likert scale (1 to 5) (5 - “strongly agree”, 4 – “agree”, 3 –“neutral”, 2 – “disagree”, 1 – “strongly disagree”).
We use Likert scale answers that can be easily collected andquantied regardless of lecture types and contents. Asking detailedanswers specic to the lecture content might be better to assessrespondent’s understanding level more accurately, but it imposesmuch burden on respondents to answer and assessors. Investigatingthe eect of dierent types of questions will be our future work.
As a granularity of understanding level estimation, we target alecture slide as a unit, i.e., estimating the student’s understandinglevel for each lecture slide. A slide often conveys a single topic andcontent, and thus it is naturally expected by teachers to be mappedthe level of learner’s understanding. Other lecture units, e.g., anexplanation of a specic term in the slide or a whole lecture, canalso be considered for dierent purposes. We leave it future work.
3.3 Why Motion Sensing on Earables?A key decision to be made for the design of a sensing solution isto determine devices and sensors to be used. Many existing meth-ods often rely on computer vision using a user-facing camera todetect learner’s behaviors, thereby signicantly limiting their appli-cability in real-life situations and raising privacy concerns. Unlikethem, we focus on motion signals (accelerometer and gyroscope)
2Understanding+ refers to the specic level of Bloom’s Taxonomy. We useunderstanding as the term representing both remembering and understanding ofthe taxonomy. In the rest of the paper, understanding refers to understanding , unlessotherwise noted.

Towards Automatic Recognition of Perceived Level of Understanding on Online Lectures using Earables UbiComp-ISWC ’21 Adjunct, September 21–26, 2021, Virtual, USA
on earable devices. Our choice oers several benets. First, accord-ing to our study in the following section, postures and gesturesrelevant to understanding are mostly made around the head andupper body, which could be captured by earable devices. Second,processing motion signal is computationally ecient and privacypreserving compared to other methods, especially computer vi-sion. Last but not least, earables are widely used when studentstake online lectures and inertial measurement unit (IMU) for mo-tion signal is already employed on most smart earbuds. Thus, anearbud-integrated motion-sensing solution would be easily adoptedwithout requiring additional devices.
4 BEHAVIORAL CUES FOR UNDERSTANDINGESTIMATION
4.1 DATA COLLECTIONFor an in-depth study, we exploit a dataset including 8 participantsand 24 online lectures in total. The participants (4 males and 4females) were recruited from a university campus, and they weregraduate and undergraduate students in Computer Science andEngineering. Their ages were between 23-26 (mean: 24.13, SD: 3.75).Each participant was compensated with a gift card equivalent toUSD 18. The study was approved by the Institutional Review Boardof KOREATECH (No. 20022502).
Table 2 shows the online lectures we used for the study. Wechoose four lectures on the course of Articial Intelligence Basic,provided by K-MOOC, a Korean MOOC established in 2015. All theparticipants have a general interest in the topic of AI, but did nottake lectures with the same content as the lectures in our study.
Each participant was invited to the lab for data collection. Weexplained the purpose and procedure of the study and obtainedinformed consent. Based on each participant’s prior knowledge andlevel on AI and ML, we chose three dierent lectures that cover arange of diculty levels. During the lecture, the participants wereasked to wear the eSense earbuds [8, 12] for sensor data collection.They were also provided with printed lecture materials and a pento make them feel that they take lectures as usual.
During the lecture, we collected three types of data from theparticipants: (1) 3-axis accelerometer and 3-axis gyroscope datasampled at 32 Hz from eSense to analyze their behaviors whiletaking online lectures, (2) a video stream using a participant-facingwebcam as ground truth of their behaviors, and (3) questionnaire(Table 1) answers on every slide as ground truth of their understand-ing. The participants completed the questionnaire after nishingeach lecture. Between lectures, they took a break of 5 minutes. Fromthe responses to the questionnaire, we obtain a nal understand-ing score between 5 and 25 for a lecture slide, by summing all thescores from ve answers, with 25 indicating the highest possibleunderstanding score.
4.2 Natural Behaviors during Online LecturesWe extract a set of behaviors that learners naturally make duringonline lectures. For the analysis, the researchers transcribed andcoded the recorded videos with observable, repetitive behaviors thatthe participants performed while they were watching the lectures.
Figure 2 shows the list of behaviors we observed in the videos(See the left side of the gure); we excluded infrequently observed
behaviors. We group them into three categories; posture, body/headmotion, and facial motion. As expected, learners’ macroscopic, whole-body movements were quite limited during online lectures, mostlysitting and watching the video. However, interestingly, a varietyof their microscopic movements were observed, especially aroundthe head and upper body. From this behavioral characteristic, webelieve that our choice of earbuds as a sensing device has a greatpotential to capture learners’ behaviors on online lectures.
4.3 Understanding-relevant BehaviorsAs a next step, we identify key behaviors that can be used as cluesto estimate understanding level. To understand the impact of ourobserved behaviors, we assess the statistical association betweena) the statistic of observed behaviors and b) the reported scores ofunderstanding in the questionnaire. For the statistic of the observedbehaviors, we annotate the start and end time of behavior eventsand compute the statistical features on every slide. For the behav-iors that last for a certain time duration, we measure the durationof every segments of behaviors and normalize it by dividing bythe slide duration. Note that we additionally compute the total,average and standard deviation for the posture behaviors that lastlonger than 1 second. For the behaviors involving a brief motion,we count the number of events in every slide and also normalizeit with the slide duration. We use Spearman’s rank correlation forthe correlation analysis, which is used to assess the relationshipbetween two variables measured on at least an ordinal scale [11].
Figure 2 shows the correlation coecients of the behavior sta-tistics and the reported understanding scores (See the right side).The results show two important ndings. First, there are severalbehavioral patterns that imply a moderate relationship to the levelof understanding, e.g., over 0.3 or under -0.3. This implies the po-tential of estimating a learner’s understanding from the observationof behavioral patterns. Interestingly, after the survey, we heardfrom our participants some comments that support our analysis.For example, P7 reported that he frequently looked at the lecturematerial when he could not understand well. Accordingly, he fre-quently lowered and raised the head. Such patterns are observedthrough the coecient analysis, e.g., the negative correlation of thecount of briey gazing at a monitor, lowering the head, and raisingthe head. P6 mentioned that he often did neck rolls and changed hissitting posture when he could not understand well. These behav-ioral patterns are revealed in the negative correlation of the countof moving the neck and briey moving the body.
Second, the relationship between behavioral patterns and thelevel of understanding diers depending on the individual, showingthe need for personalized estimation. For example, ve behaviors,i.e., keeping looking down a desk, keeping gazing at a monitor, brieygazing at a monitor, lowering the head, and nodding, show corre-lation coecients larger than 0.3 or smaller than –0.3 for P7, butthey do not for P4. P4 has only one behavior, moving the neck, thatshows a correlation coecient larger than 0.3.
4.4 Feasibility of Understanding EstimationTo study the feasibility of understanding level estimation, we buildregression models to predict the understanding score using theaforementioned behavioral features. Since the impact of behavioral

UbiComp-ISWC ’21 Adjunct, September 21–26, 2021, Virtual, USA Kim, Min and Kang
Table 2: Online lectures used in data collection.Course Topics Duration # of slides # of participants
Articial Intelligence Basic
Introduction to Reinforcement Learning 34 min. 13 8Markov Process 22 min. 10 8
Markov Decision Process 39 min. 13 7Heuristic Search 22 min. 17 1
Figure 2: Behavior list and correlation coecients of behavior features and understanding score (* indicates p-value < 0.05)
Figure 3: Prediction error for overall understanding scores
patterns is dierent depending on the individual, we train a separateregression model for each participant. We adopt linear regression.To train the model, we use the features with top-3 correlationcoecient values for each participant. We apply leave-one-slide-out cross validation.
Figure 3 shows the prediction errors with two metrics, MeanAbsolute Error (MAE) and Root Mean Square Error (RMSE). Ourestimation model achieves 3.04 of the average MAE and 3.77 ofthe average RMSE across the participants; the target value is thetotal understanding level score and its range is from 5 to 25. Forcomparison, we use a baseline that takes an average understandingscore as a prediction. The average MAE and RMSE of the baselineare 3.35 and 3.96, respectively. Our model shows the better estima-tion results for both metrics. We additionally compare the resultsof SVM regression with dierent types of kernels, i.e., linear andRBF, using top-3 features. They show slightly larger errors for bothmetrics, around 3.2 and 4 of MAE and RMSE, respectively.
We can also observe the variation of prediction errors dependingon the participant. For example, P1, P3 and P7 show around 2 of
MAE while P2 and P8 show 3.9 and 6.2 of MAE, respectively. Wend that those who show relatively high errors have the smallernumber of features with larger coecient values. Also, their rangeof understanding scores is relatively larger across the lecture slidesthan others. We discuss this issue in the following section.
5 OPPORTUNITIES AND CHALLENGESOur explorative study shows that the automatic estimation oflearner’s understanding is promising from identifying understanding-relevant behaviors and mapping them to the understanding score.In this section, we discuss opportunities and challenges for realizingthe automatic estimation of understanding in the wild.
5.1 Behavior Detection using EarablesA key for the automatic estimation of understanding is to detectunderstanding-relevant behaviors at runtime. Here, we exploredetection techniques for these behaviors using earable devices andtheir performance.
As an initial attempt, we choose ve behaviors as primitivecontexts for automatic estimation of learner’s understanding level:two postures (looking down a desk and gazing at a monitor) andthree motion gestures (lowering the head, raising the head, andnodding). These behaviors show a meaningful relationship with theunderstanding score, i.e., correlation coecients larger than 0.3 orsmaller than -0.3 in many participants and also observed relativelymore frequently than other behaviors throughout the lectures. Notethat, by detecting two postures, we can derive all of the posturecategory features in Figure 2.
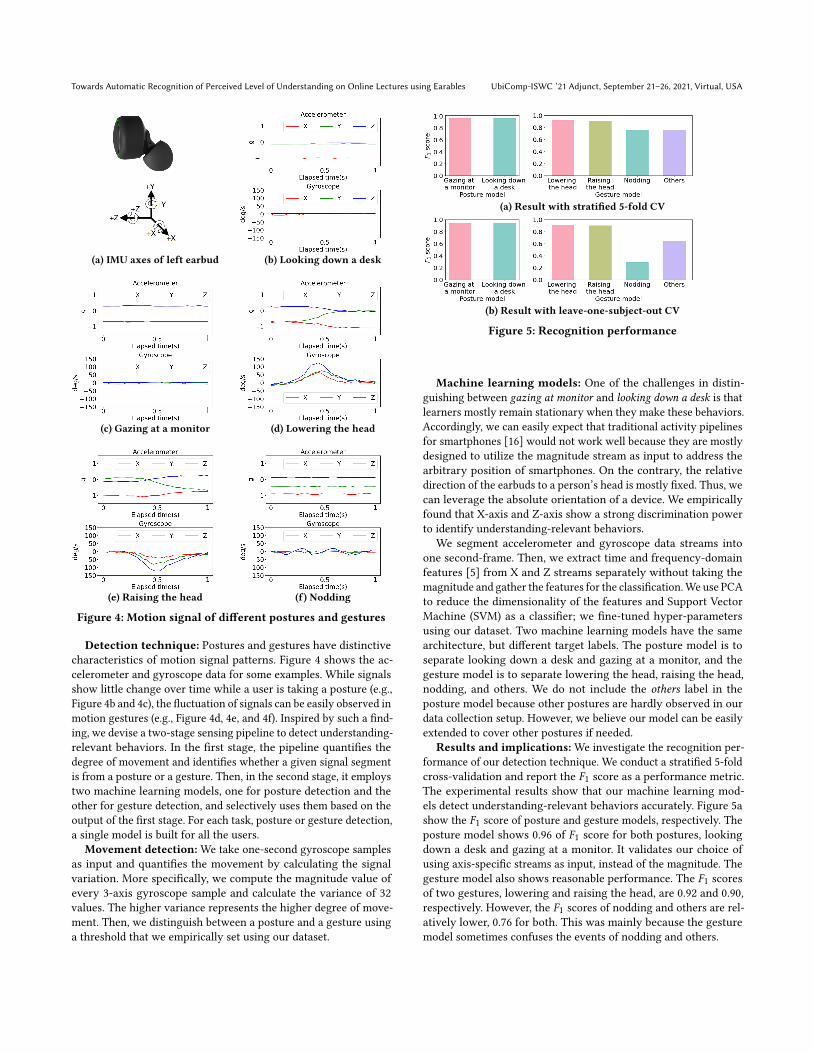
Towards Automatic Recognition of Perceived Level of Understanding on Online Lectures using Earables UbiComp-ISWC ’21 Adjunct, September 21–26, 2021, Virtual, USA
(a) IMU axes of left earbud (b) Looking down a desk
(c) Gazing at a monitor (d) Lowering the head
(e) Raising the head (f) Nodding
Figure 4: Motion signal of dierent postures and gestures
Detection technique: Postures and gestures have distinctivecharacteristics of motion signal patterns. Figure 4 shows the ac-celerometer and gyroscope data for some examples. While signalsshow little change over time while a user is taking a posture (e.g.,Figure 4b and 4c), the uctuation of signals can be easily observed inmotion gestures (e.g., Figure 4d, 4e, and 4f). Inspired by such a nd-ing, we devise a two-stage sensing pipeline to detect understanding-relevant behaviors. In the rst stage, the pipeline quanties thedegree of movement and identies whether a given signal segmentis from a posture or a gesture. Then, in the second stage, it employstwo machine learning models, one for posture detection and theother for gesture detection, and selectively uses them based on theoutput of the rst stage. For each task, posture or gesture detection,a single model is built for all the users.
Movement detection: We take one-second gyroscope samplesas input and quanties the movement by calculating the signalvariation. More specically, we compute the magnitude value ofevery 3-axis gyroscope sample and calculate the variance of 32values. The higher variance represents the higher degree of move-ment. Then, we distinguish between a posture and a gesture usinga threshold that we empirically set using our dataset.
(a) Result with stratied 5-fold CV
(b) Result with leave-one-subject-out CV
Figure 5: Recognition performance
Machine learning models: One of the challenges in distin-guishing between gazing at monitor and looking down a desk is thatlearners mostly remain stationary when they make these behaviors.Accordingly, we can easily expect that traditional activity pipelinesfor smartphones [16] would not work well because they are mostlydesigned to utilize the magnitude stream as input to address thearbitrary position of smartphones. On the contrary, the relativedirection of the earbuds to a person’s head is mostly xed. Thus, wecan leverage the absolute orientation of a device. We empiricallyfound that X-axis and Z-axis show a strong discrimination powerto identify understanding-relevant behaviors.
We segment accelerometer and gyroscope data streams intoone second-frame. Then, we extract time and frequency-domainfeatures [5] from X and Z streams separately without taking themagnitude and gather the features for the classication.We use PCAto reduce the dimensionality of the features and Support VectorMachine (SVM) as a classier; we ne-tuned hyper-parametersusing our dataset. Two machine learning models have the samearchitecture, but dierent target labels. The posture model is toseparate looking down a desk and gazing at a monitor, and thegesture model is to separate lowering the head, raising the head,nodding, and others. We do not include the others label in theposture model because other postures are hardly observed in ourdata collection setup. However, we believe our model can be easilyextended to cover other postures if needed.
Results and implications: We investigate the recognition per-formance of our detection technique. We conduct a stratied 5-foldcross-validation and report the 1 score as a performance metric.The experimental results show that our machine learning mod-els detect understanding-relevant behaviors accurately. Figure 5ashow the 1 score of posture and gesture models, respectively. Theposture model shows 0.96 of 1 score for both postures, lookingdown a desk and gazing at a monitor. It validates our choice ofusing axis-specic streams as input, instead of the magnitude. Thegesture model also shows reasonable performance. The 1 scoresof two gestures, lowering and raising the head, are 0.92 and 0.90,respectively. However, the 1 scores of nodding and others are rel-atively lower, 0.76 for both. This was mainly because the gesturemodel sometimes confuses the events of nodding and others.

UbiComp-ISWC ’21 Adjunct, September 21–26, 2021, Virtual, USA Kim, Min and Kang
5.2 Variation of Behavioral PatternsOne of the challenges for deploying the automatic estimation ofunderstanding to end-users is the variety of behavioral patterns.First, our participants have a dierent set of behaviors that showa meaningful relationship with their understanding. For example,while the average duration of the looking down a desk posture showsa high correlation for P5, P6, and P7, but has little relationship forP1, P2, and P4.
Second, the signal patterns of behaviors are also dierent depend-ing on the participant. To investigate how our posture and gesturemodels work on a new user, we measure their performance witha leave-one-subject-out validation (Figure 5b). The results showthat the posture model still achieves high accuracy, i.e., 0.95 of 1score. The gesture model also shows the reasonable performancefor lowering and raising the head, i.e., 0.91 and 0.90, respectively,which are expected to have little variation across the participants.However, the performance of nodding and others largely decreases,i.e., 0.29 and 0.65 of 1 score. Observing the collected data, we couldsee that the participants often did nodding and other behaviorsdierently, e.g., in terms of direction, count, and strength.
These two ndings imply the need for personalized models, i.e.,detection model for behavior recognition and regression model forestimating the understanding score. We believe we can developpersonalized models using a small amount of the end-user’s datawith online learning techniques. We leave it as future work.
5.3 Incorporating Additional SensorsThis study currently explores the feasibility of using behavioralfeatures from earables’ IMU to estimate students’ understanding.It would be possible to incorporate additional sensors for moreaccurate and robust estimation. Some previous works utilize phys-iological sensors such as PPG and EDA to detect engagement orattention state of students [6]. While they are dierent from ourtarget, understanding level, these might be related to each other,considering that engagement in lectures might positively aectthe understanding of the lectures. We will further investigate thepotential of adopting sensor fusion techniques to use physiologicalfeatures from PPG and EDA sensors. A further in-depth study willalso be necessary to analyze the relationship between the under-standing level and the engagement or attention state.
5.4 Application LandscapeWe envision that the automatic estimation of learner’s understand-ing will provide signicant benets in online lectures.
Our proposed technique could be used to assist teachers byproviding student’s understanding status. In many online lectures,especially the pre-recorded video lectures, it is almost infeasiblefor teachers to have detailed real-time feedback from students,thereby making it dicult to modify and enhance their lectures;even possible, the feedback is often at a high, coarse-grained level.We envision that our solution can monitor student’s understandingstatus, gather this information, and automatically spot parts inonline lectures which student perceive dicult to understand.
Our solution could also help students by calling their attentionwhen they do not understand the lecture content well. When oursolution detects such moments, it could send a notication message
to the students, e.g., “how about watching this part again if youdo not understand well?”. It might also be possible to provide thestudents with a summary of dicult parts after the lecture in orderto help the student reect on the lecture.
6 CONCLUSIONThis work is our initial step towards a vision to utilize earables as anopportunity to automatically estimate learner’s understanding ononline lectures. In this explorative study, we observe some behaviorsthat could be used as clues to estimate the understanding level, andinvestigate the feasibility of understanding estimation using thesebehaviors. To realize the automatic estimation of understanding inthe wild, we have a range of challenges to address, which will befuture avenues of our work.
ACKNOWLEDGMENTSThis research was supported in part by the Ministry of Science andICT, Korea, under the ITRC support program (IITP-2020-0-01778)supervised by the IITP.
REFERENCES[1] [n.d.]. The COVID-19 pandemic has changed education forever. This is
how. Retrieved June 14, 2021 from https://www.weforum.org/agenda/2020/04/coronavirus-education-global-covid19-online-digital-learning/
[2] [n.d.]. Education during COVID-19; moving towards e-learning. Retrieved June14, 2021 from https://www.europeandataportal.eu/en/impact-studies/covid-19/education-during-covid-19-moving-towards-e-learning
[3] Nigel Bosch and Sidney D’Mello. 2019. Automatic detection of mind wanderingfrom video in the lab and in the classroom. IEEE Transactions on AectiveComputing (2019).
[4] Patricia A Eber and Trent S Parker. 2007. Assessing Student Learning: ApplyingBloom’s Taxonomy. Human Service Education 27, 1 (2007).
[5] Davide Figo, Pedro C Diniz, Diogo R Ferreira, and Joao MP Cardoso. 2010. Pre-processing techniques for context recognition from accelerometer data. Personaland Ubiquitous Computing 14, 7 (2010), 645–662.
[6] Nan Gao, Wei Shao, Mohammad Saiedur Rahaman, and Flora D Salim. 2020. n-Gage: Predicting in-class Emotional, Behavioural and Cognitive Engagement inthe Wild. Proceedings of the ACM on Interactive, Mobile, Wearable and UbiquitousTechnologies 4, 3 (2020), 1–26.
[7] Joseph Grafsgaard, Joseph B Wiggins, Kristy Elizabeth Boyer, Eric N Wiebe,and James Lester. 2013. Automatically recognizing facial expression: Predictingengagement and frustration. In Educational Data Mining 2013.
[8] Fahim Kawsar, Chulhong Min, Akhil Mathur, and Alesandro Montanari. 2018.Earables for personal-scale behavior analytics. IEEE Pervasive Computing 17, 3(2018), 83–89.
[9] Dongwoo Kim, Chulhong Min, and Seungwoo Kang. 2020. Towards recognizingperceived level of understanding for online lectures using earables. In Proceedingsof the 18th Conference on Embedded Networked Sensor Systems. 739–740.
[10] David R Krathwohl. 2002. A revision of Bloom’s taxonomy: An overview. Theoryinto practice 41, 4 (2002), 212–218.
[11] Ann Lehman. 2005. JMP for basic univariate and multivariate statistics: a step-by-step guide. SAS Institute.
[12] Chulhong Min, Akhil Mathur, and Fahim Kawsar. 2018. Exploring audio andkinetic sensing on earable devices. In Proceedings of the 4th ACM Workshop onWearable Systems and Applications. ACM, 5–10.
[13] Selene Mota and Rosalind W Picard. 2003. Automated posture analysis fordetecting learner’s interest level. In 2003 Conference on Computer Vision andPattern Recognition Workshop, Vol. 5. IEEE, 49–49.
[14] Phuong Pham and Jingtao Wang. 2017. AttentiveLearner 2: a multimodal ap-proach for improving MOOC learning on mobile devices. In International Confer-ence on Articial Intelligence in Education. Springer, 561–564.
[15] Tarmo Robal, Yue Zhao, Christoph Lo, and Claudia Hau. 2018. IntelliEye:Enhancing MOOC Learners’ Video Watching Experience through Real-TimeAttention Tracking. In Proceedings of the 29th on Hypertext and Social Media.ACM, 106–114.
[16] Aras Yurtman. 2019. Activity recognition invariant to position and orientation ofwearable motion sensor units. Ph.D. Dissertation. bilkent university.
https://www.weforum.org/agenda/2020/04/coronavirus-education-global-covid19-online-digital-learning/

AirCase: Earable Charging Case with Air ality Monitoring andSoundscape Sonification
Haibin [email protected]
Karlsruhe Institute of TechnologyKarlsruhe, Germany
Tobias Rö[email protected]
Karlsruhe Institute of TechnologyKarlsruhe, Germany
Michael [email protected]
Karlsruhe Institute of TechnologyKarlsruhe, Germany
ABSTRACTBad air quality and insucient ventilation can have severe impactson personal health. We present AirCase, a smart earable chargingcase that measures CO2, volatile organic compounds, humidity,air pressure, temperature, and light intensity. The case powersboth the air quality system and the earables. We also propose amodel-driven air quality soundscape sonication strategy based onthe audio capabilities of the earables. AirCase detects conditionsunsuitable for measuring air quality (e.g., in pocket) in an oceenvironment at 98.2 % accuracy with a simple classier based on asingle feature. We identied light intensity as the primary indicatorto recognize occlusion. In contrast, the speed of the micro ventilatorused to increase airow inside the case did not oer any predictivevalue. In the future, we hope to see more researchers explore thehidden potential of the new platform.
CCS CONCEPTS• Human-centered computing ! Ubiquitous and mobile de-vices.
KEYWORDSearables; hearables; earphones; charging case; air quality monitor-ing; pollution
ACM Reference Format:Haibin Zhao, Tobias Röddiger, and Michael Beigl. 2021. AirCase: EarableCharging Case with Air Quality Monitoring and Soundscape Sonication.In Adjunct Proceedings of the 2021 ACM International Joint Conference onPervasive and Ubiquitous Computing and Proceedings of the 2021 ACM Inter-national Symposium on Wearable Computers (UbiComp-ISWC ’21 Adjunct),September 21–26, 2021, Virtual, USA. ACM, New York, NY, USA, 5 pages.https://doi.org/10.1145/3460418.3479329
1 INTRODUCTIONEarables have been heavily explored as a novel, ear-worn platformwith personal tracking capabilities. Some examples are monitoringhealth-related parameters such as respiration [18] or brain activity[9]; or activity recognition to detect daytime activities [14] or eatingepisodes [4]. The platform also serves as the foundation of new
Permission to make digital or hard copies of all or part of this work for personal orclassroom use is granted without fee provided that copies are not made or distributedfor prot or commercial advantage and that copies bear this notice and the full citationon the rst page. Copyrights for components of this work owned by others than theauthor(s) must be honored. Abstracting with credit is permitted. To copy otherwise, orrepublish, to post on servers or to redistribute to lists, requires prior specic permissionand/or a fee. Request permissions from [email protected] ’21 Adjunct, September 21–26, 2021, Virtual, USA© 2021 Copyright held by the owner/author(s). Publication rights licensed to ACM.ACM ISBN 978-1-4503-8461-2/21/09. . . $15.00https://doi.org/10.1145/3460418.3479329
interaction paradigms [25, 28]. In research, the focus, therefore,is on the device worn on the ear itself. State-of-the-art market-available earables are usually wireless and sold together with acharging case that contains much larger batteries compared tothe earbuds1. Today, these charging cases are solely intended toprovide power to the earables when the user is not wearing them,so they are recharged for the next use. However, as the user alwayscarries the case with them, it creates an opportunity to implementadditional sensors for mobile sensing. As the charging case maybe placed, e.g., next to a person on the table, it seems particularlysuitable for mobile environmental sensing scenarios.
To initially make the earable community aware of the hiddenpotential of the earable charging case and to spark novel ideas, webuilt a rst prototype that follows the new paradigm. The chargingcase measures air quality and shares it back to the user by a sound-scape sonication strategy. We conducted a data collection studyin three dierent conditions (non-occluded + bright, non-occluded+ dark, and occluded + dark) to gather 150 minutes of air qualitydata (30 x 5 minutes). Based on the collected data, we trained a sim-ple classier and performed 5-fold-cross-validation yielding 98.2 %overall accuracy.
In sum, our three main contributions are:• an o-the-shelf charging cases with custom electronics tomeasure CO2, volatile organic compounds (VOC), humidity,air pressure, temperature, and the light intensity, and whichincludes a micro ventilator for improved airow in AirCase
• a model-based soundscape sonication strategy of air qualityon earables
• an occlusion detection classier to avoid measuring air qual-ity when the device is, e.g., in the pocket
2 BACKGROUND AND RELATEDWORKAir quality and human life are closely coupled. For example, highhumidity and temperature aect the level of human comfort [23]and high concentrations of VOC and CO2 in the air even harmhuman health [10, 15]. Consequently, insucient room ventilationrates in oces have severe adversarial eects such as higher ratesof respiratory infections and overall more short-term sick leaves[22]. Therefore, personal mobile air quality measurement devicesare expected to help the individual live a healthier life.
There have already been some mobile air quality monitoringdevices in the eld of ubiquitous computing. For example, WearAir[12] installed a VOC sensor and light-emitting diodes (LEDs) to aT-shirt. The LEDs indicate the air quality around the user measuredby the VOC sensor, which informs people about the air quality
1https://www.apple.com/airpods-pro/

UbiComp-ISWC ’21 Adjunct, September 21–26, 2021, Virtual, USA Zhao, et al.
[a] [b] [c] [d]
Figure 1: Dierent views of AirCase. [a] front side of the device showing the light sensor (left) and micro-ventilator (right);[b] open lid showing the earables placed inside the case for charging; [c] opened case showing the charging circuit (left) andcustom PCB connected to sensors (right); [d] schematic drawing of the sensing tier.
straightforward. Jiang et al. [11] proposed a device equipped withCO2, humidity, temperature, and light sensors, which can be at-tached on the backpack or clothes of the user. It performs indoorlocalization based on WiFi signals and can project the air qualityonto the correct room. In addition to carrying sensor nodes directlyon the human, there is also research focusing on vehicle-mountedair quality sensor nodes [3, 24]. The abundant space on vehiclesgenerally leaves room for a larger number of more accurate sensorsto be integrated than with wearables.
Related work in earable computing embedded environmentalsensors directly inside the ear-worn device, but not for the primarypurpose of air quality monitoring. E.g., to prevent heat strokes,temperature and humidity sensors inside earables can measure thebody temperature, and evaporation of the wearer [7, 13]. Thoughair pressure sensors have been embedded inside earables, theirsole purpose was to serve as an underlying sensing principle forinteraction such as face gestures [1] or input by the muscles insidethe ear directly [17].
To the best of our knowledge, no air quality sensors were embed-ded into earables or their related devices. Therefore, we proposedAirCase (Figure 1), an unobtrusive, augmented earphone chargingcase with air quality sensing for daily life.
3 AIRCASEAirCase builds upon an o-the-shelf earbud charging case that wemodied by adding custom electronics. Air quality sonication ispresented to the user by the respective earables of the case. Oc-clusion detection relies on a simple machine learning classier.Figure 2 gives an overview of the system components: in termsof information ow, multiple sensors are mounted to the MCUthat runs an occlusion classier. Measurements are then emittedvia BLE to the mobile phone for recording and further processing,including sonication. From the aspect of energy ow, the batteryof the charging case serves not only the earbuds but also the MCUand its sensors as well as the ventilation.
3.1 HardwareFigure 1 shows the structure of AirCase. The foundation is theHolyHighr earphones charging case (regular wireless Bluetoothearbuds with microphones and a push-button on each side, see
Figure 1 [b]). A light sensor (SHARPr GA1A1S202WP) is installedon the front side of AirCase, aiming to detect the light intensityfor the occlusion recognition. In addition, a ventilator (SUNONrUB393-500) is equipped next to the light sensor, which serves notonly the occlusion recognition (measuring its rotation speed) butalso the ventilation of AirCase, as the sensors located inside it mustreect the air quality of the surroundings. To improve ventilation,we have also designed holes on the back and sides of AirCase. Tomeasure air quality, we placed an air quality sensor (BOSCHrBME680) to sense humidity, air pressure, temperature, and volatileorganic compounds (VOC). As the BME680 only returns VOC asresistance, we obtain the indexed air quality (IAQ) using the BoschSensortec Environmental Cluster (BSEC) library based on VOC andtakes temperature and humidity into account. This allows us toassign VOC air quality based on the reference IAQ values providedby Bosch. In addition, we added a CO2 sensor (WINSENr MH-Z19B). We utilized the battery of the charging case as the powersupply of the aforementioned sensors and the micro-controller unit(MCU), an ESP32. The rmware is written in Arduino. For easierassembly, we designed a custom ESP32-based printed circuit board(PCB) that sits tightly in the case and simplies cable management(see Figure 1 [c], right). The rough overhead of AirCase is listedin Table 1. We remove the screws from the case and 3D-print anew bottom lid which is slightly thicker to account for the spacerequired for the sensors. To emit, record, and analyze the acquiredsignals, we developed an Android application to communicate with
CO! sensor
Ventilator
Air quality sensor
Light sensor
Mobilephone
VentilationBattery
Earbud
MCU
Classifier
BLESensing tierAirCase
I!C
Sonification
Figure 2: Frame of AirCase system. Red parts present theenergy ow and green parts indicate the information ow.
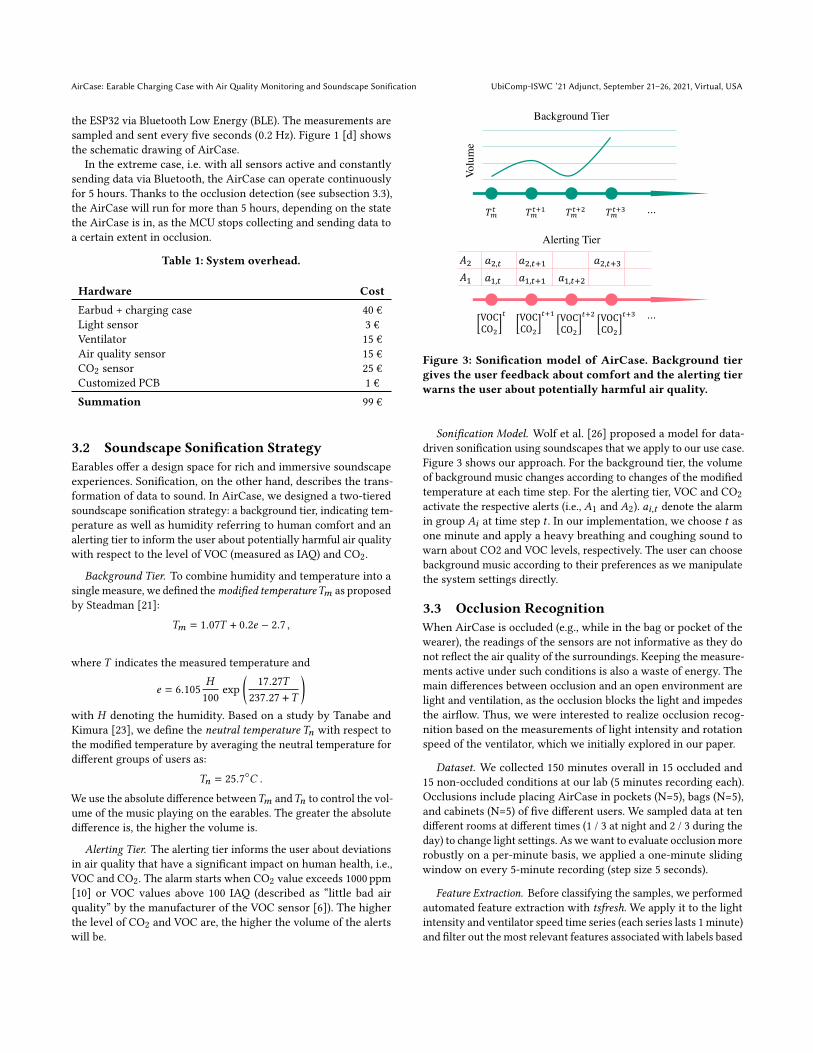
AirCase: Earable Charging Case with Airality Monitoring and Soundscape Sonification UbiComp-ISWC ’21 Adjunct, September 21–26, 2021, Virtual, USA
the ESP32 via Bluetooth Low Energy (BLE). The measurements aresampled and sent every ve seconds (0.2 Hz). Figure 1 [d] showsthe schematic drawing of AirCase.
In the extreme case, i.e. with all sensors active and constantlysending data via Bluetooth, the AirCase can operate continuouslyfor 5 hours. Thanks to the occlusion detection (see subsection 3.3),the AirCase will run for more than 5 hours, depending on the statethe AirCase is in, as the MCU stops collecting and sending data toa certain extent in occlusion.
Table 1: System overhead.
Hardware CostEarbud + charging case 40 €Light sensor 3 €Ventilator 15 €Air quality sensor 15 €CO2 sensor 25 €Customized PCB 1 €Summation 99 €
3.2 Soundscape Sonication StrategyEarables oer a design space for rich and immersive soundscapeexperiences. Sonication, on the other hand, describes the trans-formation of data to sound. In AirCase, we designed a two-tieredsoundscape sonication strategy: a background tier, indicating tem-perature as well as humidity referring to human comfort and analerting tier to inform the user about potentially harmful air qualitywith respect to the level of VOC (measured as IAQ) and CO2.
Background Tier. To combine humidity and temperature into asingle measure, we dened themodied temperature)< as proposedby Steadman [21]:
)< = 1.07) + 0.24 2.7 ,
where ) indicates the measured temperature and
4 = 6.105
100exp
17.27)
237.27 +)
with denoting the humidity. Based on a study by Tanabe andKimura [23], we dene the neutral temperature )= with respect tothe modied temperature by averaging the neutral temperature fordierent groups of users as:
)= = 25.7 .
We use the absolute dierence between)< and)= to control the vol-ume of the music playing on the earables. The greater the absolutedierence is, the higher the volume is.
Alerting Tier. The alerting tier informs the user about deviationsin air quality that have a signicant impact on human health, i.e.,VOC and CO2. The alarm starts when CO2 value exceeds 1000 ppm[10] or VOC values above 100 IAQ (described as “little bad airquality” by the manufacturer of the VOC sensor [6]). The higherthe level of CO2 and VOC are, the higher the volume of the alertswill be.
$"# $"#$% $"#$! $"#$& ⋯
VOCCO!
# ⋯VOCCO!
#$% VOCCO!
#$! VOCCO!
#$&
Background Tier
Volume
Alerting Tier
!!!"
"!,$"",$%!
"!,$%""",$
"!,$%!"",$%&
Figure 3: Sonication model of AirCase. Background tiergives the user feedback about comfort and the alerting tierwarns the user about potentially harmful air quality.
Sonication Model. Wolf et al. [26] proposed a model for data-driven sonication using soundscapes that we apply to our use case.Figure 3 shows our approach. For the background tier, the volumeof background music changes according to changes of the modiedtemperature at each time step. For the alerting tier, VOC and CO2activate the respective alerts (i.e., 1 and 2). 08,C denote the alarmin group 8 at time step C . In our implementation, we choose C asone minute and apply a heavy breathing and coughing sound towarn about CO2 and VOC levels, respectively. The user can choosebackground music according to their preferences as we manipulatethe system settings directly.
3.3 Occlusion RecognitionWhen AirCase is occluded (e.g., while in the bag or pocket of thewearer), the readings of the sensors are not informative as they donot reect the air quality of the surroundings. Keeping the measure-ments active under such conditions is also a waste of energy. Themain dierences between occlusion and an open environment arelight and ventilation, as the occlusion blocks the light and impedesthe airow. Thus, we were interested to realize occlusion recog-nition based on the measurements of light intensity and rotationspeed of the ventilator, which we initially explored in our paper.
Dataset. We collected 150 minutes overall in 15 occluded and15 non-occluded conditions at our lab (5 minutes recording each).Occlusions include placing AirCase in pockets (N=5), bags (N=5),and cabinets (N=5) of ve dierent users. We sampled data at tendierent rooms at dierent times (1 / 3 at night and 2 / 3 during theday) to change light settings. As wewant to evaluate occlusionmorerobustly on a per-minute basis, we applied a one-minute slidingwindow on every 5-minute recording (step size 5 seconds).
Feature Extraction. Before classifying the samples, we performedautomated feature extraction with tsfresh. We apply it to the lightintensity and ventilator speed time series (each series lasts 1 minute)and lter out the most relevant features associated with labels based

UbiComp-ISWC ’21 Adjunct, September 21–26, 2021, Virtual, USA Zhao, et al.
on the false discovery rate [5]. This resulted in no relevant featuresbased on the speed of the ventilator. This was also conrmed bytraining classiers on the features of the ventilator that did noperform better than random (see Table 2). Looking at the remaining
Table 2: Occlusion detection using ventilator speed.
Classier Precision Recall F1 AccuracySVM 71.7% 99.6% 83.4% 81.2%Neural Network 69.0% 89.0% 78.0% 75.0%Random Forest 69.0% 7.4% 13.4% 51.5%
features quickly revealed that the absolute light intensity is the solepredictor of occlusion in our dataset. The feature that representedthis best was the absolute sum of light intensity of the sample.Figure 4 [a] shows the logarithmic of B; denoting the sum of lightintensity in sliding windows of all recordings, while [b] showsthe logarithmic of BE , the sum values of ventilator speed in slidingwindows. It can be well observed that the light is distinctive topredict the occluded and non-occluded conditions, whereas theventilator speed does not change consistently across them.
Threshold Classier. To avoid having to select the optimal thresh-old by hand, we t a support vector machine classier (SVM) usingsklearn. We perform 5-fold-cross-validation and avoid that samplesfrom the same recording are in the training and validation set at thesame time using three dierent classiers i.e. SVM, neural network,and random forest. After training and validation, we acquire theresult described in Table 3.
Results. From Table 3 we nd that a SVM achieves an acceptableclassication accuracy in our oce environment for occlusion de-tection using the light sensor measurements solely. Therefore, wecan turn o the sensors to save energy when the device is occluded.As the ventilator’s speed does not improve occlusion recognition,we can also shut it down.
Table 3: Performance of the AirCase occlusion detection.
Classier Precision Recall F1 AccuracySVM 96.8% 100% 98.4% 98.2%Neural Network 91.0% 100% 95.3% 95.0%Random Forest 98.5% 69.2% 81.3% 84.4%
4 DISCUSSIONWe have demonstrated how an earable charging case can beequipped with air quality sensing, introduced a soundscape soni-cation strategy, and preliminary showed the possibility to detectocclusions.
4.1 LimitationsCurrently, we only evaluated the occlusion detection of AirCaseon a limited set of data samples acquired from the same building. Itremains to be investigated how well AirCase works under real-lifesettings. For example, additional sensors such as a light spectrum
sensor may be required. Possibly, the user could dene this thresh-old for occlusion detection based on personal preference, or AirCasecould activate depending on the current activity of the user (e.g.,detecting where the device is carried [2]).
Our sonication strategy remains to be evaluated with the users.Also, we would like to emphasize that AirCase is currently much
larger than necessary. The BME680 and GA1A1S202WP sensorsboth only have a footprint of 3 3 1<<3 (l w h). Therefore,they could be well integrated directly onto the charging case’sprinted circuit board.
4.2 Air Quality FeedbackAt the moment, information about air quality is presented as rawvalues inside the app or based on our sonication strategy thatremains to be evaluated with the user. Another feedback mecha-nism could present air quality through light directly on the earablethat makes the surrounding people in public spaces aware of theinformation obtained by the case [8]. Of course, the case could alsoshow the air quality directly.
4.3 Smart Charging CasesBeyond the smart earable charging case with air quality monitoringpresented in our paper, we share three other possible research andapplication paths.
Health Tracking. Compared to a phone, an earable charging casemay be kept inside the pocket during usage. Therefore, it could serveas a better sensing platform for continuous health-related parametertracking. For example, it could predict the energy expenditure andcount the steps of the user, as the hip location proved to be mostreliable in past work [19]. Also, the surface area of the charging casepresents opportunities for sensors. A handheld Electrocardiographymeasuring device could place its conductive metal electrodes onthe outside of the case (e.g., similar to AliveCor Kardia Mobile).
Subtle Gestures. Subtle interaction that requires low eort andcan be hidden from others continues to receive attention in HCIresearch and was recently systematically investigated [16]. Weimagine that a smart charging case carried in the pocket couldbe an enabler of such hidden interactions. For example, Saponaset al. [20] and Wu et al. [27] presented pocket-based input basedon textile sensors. Capacitive sensors embedded on the outside of acharging case could allow similar interactions.
Item Tracking. Wu et al. [27] introduced a method to recognizeobjects placed inside the pocket of the user (e.g., earbuds chargingcase). Similarly, the charging case itself could be equipped withsensors to make it aware of other items inside the pocket. The casecould then remind the user about forgotten objects.
5 CONCLUSIONEarable charging cases oer space and large amounts of powerfor new types of use cases. We explored the potential of the newplatform as an unobtrusive mobile air quality sensor station fordaily usage. AirCase builds upon a simple threshold-based approachby measuring light intensity to detect occlusions of the case. Thespeed of the micro-ventilator as an indirect measure of airowdid not have any predictive value. Additionally, AirCase uses the

AirCase: Earable Charging Case with Airality Monitoring and Soundscape Sonification UbiComp-ISWC ’21 Adjunct, September 21–26, 2021, Virtual, USA
[a] [b]
non-occluded + brightnon-occluded + darkoccluded + dark
Figure 4: Logarithmic sum of values in sliding windows. [a] logarithmic sum values of light intensity, [b] logarithmic sumvalues of ventilator speed.
earables’ audio capabilities to inform the wearer about air qualitybased on a model-driven soundscape sonication strategy.
Future Work. We are interested in looking at other strategies forocclusion detection. Moreover, we are looking forward to otherwork that makes use of the earable charging case as a sensoryplatform.
REFERENCES[1] Toshiyuki Ando, Yuki Kubo, Buntarou Shizuki, and Shin Takahashi. 2017.
Canalsense: Face-related movement recognition system based on sensing airpressure in ear canals. In Proceedings of the 30th Annual ACM Symposium on UserInterface Software and Technology. 679–689.
[2] Stephen A Antos, Mark V Albert, and Konrad P Kording. 2014. Hand, belt, pocketor bag: Practical activity tracking with mobile phones. Journal of neurosciencemethods 231 (2014), 22–30.
[3] Paul M Aoki, RJ Honicky, Alan Mainwaring, Chris Myers, Eric Paulos, Sush-mita Subramanian, and Allison Woodru. 2009. A vehicle for research: usingstreet sweepers to explore the landscape of environmental community action. InProceedings of the SIGCHI Conference on Human Factors in Computing Systems.375–384.
[4] Abdelkareem Bedri, Richard Li, Malcolm Haynes, Raj Prateek Kosaraju, IshaanGrover, Temiloluwa Prioleau, Min Yan Beh, Mayank Goel, Thad Starner, andGregory Abowd. 2017. EarBit: using wearable sensors to detect eating episodesin unconstrained environments. Proceedings of the ACM on interactive, mobile,wearable and ubiquitous technologies 1, 3 (2017), 1–20.
[5] Yoav Benjamini and Daniel Yekutieli. 2001. The control of the false discoveryrate in multiple testing under dependency. Annals of statistics (2001), 1165–1188.
[6] Bosch. 2017.[7] Jorge S Chaglla E, Numan Celik, Wamadeva Balachandran, et al. 2018. Measure-
ment of core body temperature using graphene-inked infrared thermopile sensor.Sensors 18, 10 (2018), 3315.
[8] Inkyung Choi and Dain Kim. 2020. Toning: New Experience of Sharing MusicPreference with Interactive Earphone in Public Space. In Proceedings of the Four-teenth International Conference on Tangible, Embedded, and Embodied Interaction.533–538.
[9] Valentin Goverdovsky, Wilhelm Von Rosenberg, Takashi Nakamura, DavidLooney, David J Sharp, Christos Papavassiliou, Mary J Morrell, and Danilo PMandic. 2017. Hearables: Multimodal physiological in-ear sensing. Scienticreports 7, 1 (2017), 1–10.
[10] Tyler A Jacobson, Jasdeep S Kler, Michael T Hernke, Rudolf K Braun, Keith CMeyer, and William E Funk. 2019. Direct human health risks of increased atmo-spheric carbon dioxide. Nature Sustainability 2, 8 (2019), 691–701.
[11] Yifei Jiang, Kun Li, Lei Tian, Ricardo Piedrahita, Xiang Yun, Omkar Mansata, QinLv, Robert P Dick, Michael Hannigan, and Li Shang. 2011. MAQS: a personalizedmobile sensing system for indoor air quality monitoring. In Proceedings of the13th international conference on Ubiquitous computing. 271–280.
[12] Sunyoung Kim, Eric Paulos, and Mark D Gross. 2010. WearAir: expressive t-shirtsfor air quality sensing. In Proceedings of the fourth international conference onTangible, embedded, and embodied interaction. 295–296.
[13] Keiji Matsumoto, Yuksel Temiz, Hamidreza Taghavi, Elrick L Cornelius, HiroyukiMori, and Bruno Michel. 2019. An earbud-type wearable (A hearable) with vital
parameter sensors for early detection and prevention of heat-stroke. In 2019 41stAnnual International Conference of the IEEE Engineering in Medicine and BiologySociety (EMBC). IEEE, 7049–7055.
[14] Chulhong Min, Akhil Mathur, and Fahim Kawsar. 2018. Exploring audio andkinetic sensing on earable devices. In Proceedings of the 4th ACM Workshop onWearable Systems and Applications. 5–10.
[15] Lars Mølhave. 1991. Volatile organic compounds, indoor air quality and health.Indoor Air 1, 4 (1991), 357–376.
[16] Henning Pohl, Andreea Muresan, and Kasper Hornbæk. 2019. Charting subtleinteraction in the hci literature. In Proceedings of the 2019 CHI Conference onHuman Factors in Computing Systems. 1–15.
[17] Tobias Röddiger, Christopher Clarke, Daniel Wolram, Matthias Budde, andMichael Beigl. 2021. EarRumble: Discreet Hands-and Eyes-Free Input by Vol-untary Tensor Tympani Muscle Contraction. In Proceedings of the 2021 CHIConference on Human Factors in Computing Systems. 1–14.
[18] Tobias Röddiger, Daniel Wolram, David Laubenstein, Matthias Budde, andMichael Beigl. 2019. Towards Respiration Rate Monitoring Using an In-EarHeadphone Inertial Measurement Unit. In Proceedings of the 1st InternationalWorkshop on Earable Computing. 48–53.
[19] Ramyar Saeedi, Navid Amini, and Hassan Ghasemzadeh. 2014. Patient-centric on-body sensor localization in smart health systems. In 2014 48th Asilomar Conferenceon Signals, Systems and Computers. IEEE, 2081–2085.
[20] T Scott Saponas, Chris Harrison, and Hrvoje Benko. 2011. PocketTouch: through-fabric capacitive touch input. In Proceedings of the 24th annual ACM symposiumon User interface software and technology. 303–308.
[21] Robert G Steadman. 1984. A universal scale of apparent temperature. Journal ofApplied Meteorology and Climatology 23, 12 (1984), 1674–1687.
[22] Jan Sundell, Hal Levin, William W Nazaro, William S Cain, William J Fisk,David T Grimsrud, F Gyntelberg, Y Li, AK Persily, AC Pickering, et al. 2011.Ventilation rates and health: multidisciplinary review of the scientic literature.Indoor air 21, 3 (2011), 191–204.
[23] Shinichi Tanabe and Kenichi Kimura. 1994. Eects of air temperature, humidity,and air movement on thermal comfort under hot and humid conditions. Techni-cal Report. American Society of Heating, Refrigerating and Air-ConditioningEngineers . . . .
[24] Péter Völgyesi, András Nádas, Xenofon Koutsoukos, and Ákos Lédeczi. 2008.Air quality monitoring with sensormap. In 2008 International Conference onInformation Processing in Sensor Networks (ipsn 2008). IEEE, 529–530.
[25] Yu-Te Wang, Masaki Nakanishi, Simon Lind Kappel, Preben Kidmose, Danilo PMandic, Yijun Wang, Chung-Kuan Cheng, and Tzyy-Ping Jung. 2015. Developingan online steady-state visual evoked potential-based brain-computer interfacesystem using EarEEG. In 2015 37th Annual International Conference of the IEEEEngineering in Medicine and Biology Society (EMBC). IEEE, 2271–2274.
[26] KatieAnna E Wolf, Genna Gliner, and Rebecca Fiebrink. 2015. A model for data-driven sonication using soundscapes. In Proceedings of the 20th InternationalConference on Intelligent User Interfaces Companion. 97–100.
[27] Te-Yen Wu, Zheer Xu, Xing-Dong Yang, Steve Hodges, and Teddy Seyed. 2021.Project Tasca: Enabling Touch and Contextual Interactions with a Pocket-basedTextile Sensor. In Proceedings of the 2021 CHI Conference on Human Factors inComputing Systems. 1–13.
[28] Xuhai Xu, Haitian Shi, Xin Yi, Wenjia Liu, Yukang Yan, Yuanchun Shi, AlexMariakakis, Jennifer Manko, and Anind K Dey. 2020. EarBuddy: Enabling On-Face Interaction via Wireless Earbuds. In Proceedings of the 2020 CHI Conferenceon Human Factors in Computing Systems. 1–14.

Earables for Detection of Bruxism: a Feasibility StudyErika Bondareva∗
University of CambridgeUnited [email protected]
Elín Rós Hauksdóttir∗University of Cambridge
United [email protected]
Cecilia MascoloUniversity of Cambridge
United [email protected]
ABSTRACTBruxism is a disorder characterised by teeth grinding and clenching,and many bruxism suerers are not aware of this disorder untiltheir dental health professional notices permanent teethwear. Stressand anxiety are often listed among contributing factors impactingbruxism exacerbation, which may explain why the COVID-19 pan-demic gave rise to a bruxism epidemic. It is essential to developtools allowing for the early diagnosis of bruxism in an unobtrusivemanner. This work explores the feasibility of detecting bruxism-related events using earables in a mimicked in-the-wild setting.Using inertial measurement unit for data collection, we utilise tradi-tional machine learning for teeth grinding and clenching detection.We observe superior performance of models based on gyroscopedata, achieving an 88% and 66% accuracy on grinding and clench-ing activities, respectively, in a controlled environment, and 76%and 73% on grinding and clenching, respectively, in an in-the-wildenvironment.
CCS CONCEPTS•Applied computing!Consumerhealth; •Computingmethod-ologies ! Classication and regression trees.
KEYWORDSearables; teeth grinding; bruxism; machine learning
ACM Reference Format:Erika Bondareva, Elín Rós Hauksdóttir, and Cecilia Mascolo. 2021. Earablesfor Detection of Bruxism: a Feasibility Study. In EarComp ’21: 2nd Interna-tional Workshop on Earable Computing, Sep 25, 2021, online. ACM, New York,NY, USA, 6 pages. https://doi.org/10.1145/1122445.1122456
1 INTRODUCTIONIn the recent years, wireless earphones with built-in sensors, a.k.a.earables, have been gaining popularity — earphones are a com-modity item providing established functionality, with support forprivacy-preserving interaction by allowing the users to access in-formation hands-free in a socially acceptable way, and, most impor-tantly, have unique placement, allowing for numerous applicationsbeyond playing music [10]. Comparing to other common areas of a
∗Both authors contributed equally to this research.
Permission to make digital or hard copies of all or part of this work for personal orclassroom use is granted without fee provided that copies are not made or distributedfor prot or commercial advantage and that copies bear this notice and the full citationon the rst page. Copyrights for components of this work owned by others than ACMmust be honored. Abstracting with credit is permitted. To copy otherwise, or republish,to post on servers or to redistribute to lists, requires prior specic permission and/or afee. Request permissions from [email protected] ’21, Sep 25, 2021, Online© 2021 Association for Computing Machinery.ACM ISBN 978-1-4503-XXXX-X/21/09. . . $15.00https://doi.org/10.1145/1122445.1122456
human body for wearables placement (e.g. wrist), the ear is signif-icantly more stationary, meaning that the collected signal is lesssusceptible to the external noise and motion artifacts, while alsoallowing to capture head and jaw movements, in addition to theactivity in the rest of the body [10]. Due to these unique advantagesoered by earable platforms, they are widely explored for healthapplications.
Drawing on the ability of wearables to capture jaw movements,we were interested in exploring the feasibility of using earables fordetection of a movement disorder, characterised by teeth grindingand clenching, called bruxism. Bruxism aects around 8–13% of theadult population [2], and can cause numerous problems, aectingpatient’s teeth’ health, causing headaches and disorders of thetemporomandibular joint (TMJ). However, people suering frombruxism often are unaware of the disorder until it becomes soadvanced that the dentist is able to infer the diagnosis from thepatient’s worn down teeth. The exact cause of bruxism is unknown,but it is believed there is a genetic component to it [2], and it isusually linked to the levels of stress and anxiety that the patientis experiencing. With the COVID-19 pandemic having lasted forover a year and having had a major impact on the lives of nearlyevery individual, dentists are warning of another, accompanying,bruxism epidemic [7], prompting the issue of tooth wear and otherside eects of bruxism.
Existing methods for diagnosing bruxism tend to be unreliableor invasive [18]. Most cases that are detected in earlier stages arebased on self-reporting: for example, when a sleep partner noticesgrinding sounds, or when the patient reports TMJ pain. However,previous research indicates that the validity of the self-reportedassessment of bruxism is low to modest and therefore is usuallynot sucient for diagnosis of bruxism [21]. The golden standardfor denitive diagnosis of bruxism is electromyogram (EMG) ofthe masticatory muscles by polysomnography audio-visual (PSG-AV) recording [4, 16, 19]. This method is performed in a controlledenvironment, and due to its complexity and high cost PSG-AV isnot used for the assessment of bruxism in daily clinical practice.
To address the necessity of detecting bruxism in a non-invasiveand low-cost way, this research presents a methodology to detectteeth clenching and grinding through an earable device by usingtraditional machine learning approaches. We collected accelerome-ter and gyroscope data from 17 participants using eSense wirelessearbuds with a built-in inertial measurement unit (IMU), using thedata from 13 participants for machine learning. The data comprisedof participants grinding and clenching their teeth in a controlledenvironment, as well as performing bruxism-mimicking actionswhile engaging in routine activities that would simulate in-the-wild deployment. Namely, these activities included head movement,listening to music, walking, talking, chewing, and drinking.

EarComp ’21, Sep 25, 2021, Online Erika Bondareva, Elín Rós Hauksdóir, and Cecilia Mascolo
To increase the inference accuracy, we collected the signals fromboth ears of each participant, and we extracted both time and fre-quency domain features. After preprocessing the collected data, weused traditional machine learning methods to develop a bruxismdetection algorithm, using random forest (RF) and support vectormachine (SVM). The detection algorithms were evaluated usingboth clean data and the more realistic signals collected with partic-ipants engaging in routine behaviours that could potentially aectthe classication of teeth grinding events.
We show that by utilising traditional machine learning methodswe can detect teeth grinding in a controlled environment withaccuracy up to 88%. Additionally, we can detect teeth grinding withup to 76% accuracy for datasets mimicking real-world scenarios.The performance on clenching detection task is poorer, althoughstill shows promise, with us achieving up to 73% accuracy on in-the-wild setting.
The main contributions of this work are as follows:
• We present a novel dataset compiled as a part of this study,which contains teeth grinding and clenching data collectedthrough earables from 13 participants, in both noise-freeenvironments and while performing routine activities tomimic in-the-wild data.
• We evaluate traditional signal processing and machine learn-ing techniques for development of teeth grinding and clench-ing detection algorithms.
• We show the potential of detecting bruxism through earablesby achieving 76% accuracy on in-the-wild teeth grinding and73% accuracy on in-the-wild teeth clenching, and provideideas for future directions.
2 RELATEDWORKEMG is a technology commonly utilised for a non-trivial task ofbruxism diagnosis, capable of detecting mastication muscle move-ment. However, according to [9] EMGmay detect muscle movementthat is not necessarily related to bruxism, limiting the accuracy ofmethods relying solely on EMG. In addition, accuracy of portableEMG recorders for bruxism detection was reported as being un-satisfactory. [5] EMG can also be seen as obtrusive, relying onelectrodes placed on the face for data collection. Therefore, it isimportant to explore alternative sensing modalities for detection ofbruxism-related events.
There have been numerous eorts in the earables eld exploringthe potential of in-ear wearables for detection of activities relatedto the mouth.
A number of studies looked at detecting jaw and mouth move-ments by using earables. CanalSense presented a jaw, face, andhead movement recognition system based on detecting changesin the air pressure inside the ear canal, using barometers embed-ded in earphones [1]. Another system, EarSense, sensed teeth ges-tures by detecting vibrations in the jaw that propagate through theskull to the ear, creating oscillations in the earphone speaker’s di-aphragm [17]. Other works looked at developing a separate system,rather than utilising earbuds, for detection of jaw movements. Onesuch example would be the Outer Ear Interface that measured thedeformation in the ear canal using proximity sensors caused by thelower jaw movements [3].
There have also been successful attempts at forming a human-computer interaction system based on unvoiced jaw movementtracking. JawSense considered the neurological and anatomicalstructure of the human jaw and cheek upon system design, andachieved successful classication of nine phonemes based on themuscle deformation and vibrations caused by unvoiced speak-ing [11].
[18] looked at using gyroscope data from an in-ear wearablefor jaw clenching, which is an important part of what we set outto achieve in this feasibility study. The reported results had anerror rate of 1% when the participant was seated and 4% when theparticipant moved, but the work was based on a single participant,and did not explore the detection of grinding.
Multiple works explored detection of bruxism using wearabledevices, however, most of them are not as inconspicuous as a pairof earbuds. [13] introduced comfortable around the ear sensors(cEEGrids) for detecting awake bruxism, analysing bruxism-relatedevents in contrast to the other facial activity events, such as chewingand speaking. [12] developed a wearable mouthguard with a forcesensor to analyse teeth clenching during exercise. [6] proposedto detect sleep bruxism by using electromyography (EMG) andelectrocardiogram (ECG) signals in combination, which producedsubstantially better results than using only EMG. [8] developed asystem consisting of an interrogator/reader and a passive sensorthat could be used to record bruxism-related events by placingthe system in a dental splint. Finally, [20] developed a bite guarddesigned to analyse bruxism, with the monitoring achieved througha novel pressure-sensitive polymer.
To the best of our knowledge, this is the rst work that looks atusing wireless earbuds with built-in IMUs for detection of grindingand clenching with the goal of diagnosing and tracking bruxism.
3 STUDY DESIGNAn in-ear multisensory stereo device eSense was used for datacollection. Specically, we collected three-axis accelerometer andthree-axis gyroscope data from the built-in IMU.
To collect the aforementioned data a mobile application, calledeSense Client, was used for connecting via Bluetooth to the eSenseearbuds and collecting raw IMU data. Due to the COVID-19 pan-demic, all of the experiments were carried out remotely. Therefore,for annotating the data collected from the earables, a timestampedvideo was recorded using Zoom [22]. The collected eSense datawas labelled by matching it with the video recording’s timestamp.
Worth noting, that the eSense earbuds [10, 15] contain IMU onlyin the left earbud. Therefore, we used two left earbuds from twopairs of eSense for data collection, to explore the variation in ac-curacy for two sides, as well as potentially use the data gatheredfrom both right and left ears together. Indeed, we discovered thatparticipants typically had a dominant chewing side, which resultedin mastication muscles on one side of the face being greater devel-oped. This resulted in data from one of the ears being more valuablefor correct classication of bruxism-related activities, but since thedominant chewing side varies for dierent people, we had to usedata from both right and left ear together.
The study was approved by the ethics committee in the Depart-ment of Computer Science and Technology at the University of

Earables for Detection of Bruxism: a Feasibility Study EarComp ’21, Sep 25, 2021, Online
Cambridge. Informed consent was collected from the study partici-pants. We ensured that no identiable information was collected,and deleted the videos after the IMU data was labelled. Upon con-sulting a dental health professional, we also excluded any partici-pants who suer from bruxism to avoid any further damage to theirteeth, as well as compiled a short questionnaire aimed at identifyingpotential participants who might be unknowingly suering frombruxism. The questionnaire was based on Shetty’s et al. research[19], but amended in collaboration with a certicated dentist to suitthe needs of our study. In addition to these precautions, we alsoincluded a compulsory set of simple jawmassage exercises typicallyused in TMJ physiotherapy, aimed at alleviating any tension in theTMJ that the experiment might have inadvertently caused.
For the data collection, in total 17 participants were recruited, 12females and 5 males, with the youngest participant aged 23 and theoldest aged 61. After verifying the quality of the collected data, datafrom four participants were discarded due to being compromisedduring data collection. Therefore, data from 13 participants wereused for this research.
The aim of this study was to assess the feasibility of using in-ear wearables for detection of bruxism-related events, specicallyteeth grinding and clenching. To address this goal, participantswere asked to perform the following seven human-centred sensingexperiments (with experiments 1-6 conducted with the participantin a sitting position):
1. Control experiment:(a) Grind teeth for 5 seconds, pause for 5 seconds, repeat 6 times.(b) Clench teeth for 5 seconds, pause for 5 seconds, repeat 6 times.
2. Moving head side to side:(a) Look right and left for 30 seconds.(b) Look right and left for the duration of 5 seconds while grinding,
pause the grinding for 5 seconds, and repeat 6 times.(c) Look right and left for the duration of 5 seconds while clench-
ing, pause the clenching for 5 seconds, and repeat 6 times.3. Chewing:
(a) Eat half a slice of bread.(b) Chew gum for 30 seconds.
4. Read the provided text out loud for 30 seconds.5. Drink 250 ml of water.6. Listening to music:
(a) Listen to music for 30 seconds.(b) While listening to music, grind teeth for 5 seconds, then pause
for 5 seconds, and repeat 6 times.(c) While listening to music, clench teeth for 5 seconds, then pause
for 5 seconds, and repeat 6 times.7. Walk around in a quiet room:
(a) Walk around in a quiet room for 30 seconds.(b) Walk around for the duration of 5 seconds while clenching,
pause the clenching for 5 seconds, and repeat 6 times.The experiment took around 35 minutes for each participant to
complete from start to nish.To the best of our knowledge, this is the most advanced and so-
phisticated dataset that exists for in-ear IMU data of teeth grindingand clenching.
The experiments were designed each with a specic purpose inmind. While the rst experiment was intended as control in a quiet,albeit unrealistic environment, the rest of the experiments were de-signed to either recreate activities that are known to interfere withsignals collected via earbuds, such as moving the head, walking, aswell as listening to music – an especially important task, keeping inmind that the primary purpose of earbuds is playing music. Otheractivities, such as chewing, drinking, and reading, were meant torecreate the activities in which a typical user is likely to engagedaily, which include a signicant involvement of mastication mus-cles, which might result in a signal similar to either clenching orgrinding.
4 METHODOLOGY4.1 Data collectionIMU (accelerometer and gyroscope) data was collected from bothears of the participants with a sampling rate of 5Hz. This yieldedapproximately 25 minutes of IMU data per participant, containing12 columns: X, Y, and Z axes for the acceleration and three axesfor the gyroscope data collected from one ear, and the same datacollected from the second ear. In addition to the IMU data, we alsorecorded a video of the participant performing the tasks, to use asground-truth for correlating the collected IMU data to grinding andclenching events. Specically, the videos were used to note downthe start and end times of each general activity (such as movinghead, chewing, walking, etc.), and also to note down the start andend times of grinding and clenching events during these activities.The times with no grinding or clenching events were noted downas silent periods, regardless of the general activity performed.
4.2 Segmentation and LabellingDealing with data in time domain, segmentation into shorter win-dowswas necessary.We used a slidingwindowwith 1.6 s length and50% (or 0.8 s) overlap, to minimise the risk of missing the transitionfrom one event into another.
Creating a label for each window posed a challenge due to thefact that sometimes the window would contain a transition fromone event to another, such as transitioning from silent to grind-ing, making the labelling non-trivial. We explored two labellingmethodologies:
• labelling the window as the dominant event in that window:if the larger portion of the window contains the grindingdata and smaller portion of silent data, the window wouldbe labelled as grinding. If the split is equal, then the windowis labelled as silent.
• only labelling the window as silent if all the samples withinthe window are silent, and no amount of grinding or clench-ing event present.
Based on the preliminary comparison of the methodologies, it ap-peared that labelling the window according to the dominant eventyielded superior performance, due to which this was the methodthat we chose for further analysis.

EarComp ’21, Sep 25, 2021, Online Erika Bondareva, Elín Rós Hauksdóir, and Cecilia Mascolo
4.3 Feature ExtractionAs input for the machine learning algorithms we used a number ofvarious features. Raw signal from both ears was used, resulting in 8datapoints for each axis for each ear, yielding 48 features. Then, weused a sum of vector magnitudes (SOVM), which was calculatedusing the following equation:
SOVM =qG2' + ~2' + I2' +
qG2! + ~2! + I2!,
where G , ~, and I represent a single value collected from the sensor,corresponding to one of the axes, and ! and ' representing thesignals collected from left and right ear, respectively.
The raw data collected from the three axes and the calculatedSOVM can be seen in Figure 1.
We utilised commonly-used Python libraries Librosa and Scipyto extract a few additional features: Mel Frequency Cepstral Co-ecients (MFCCs), spectral atness, spectral centroid, and polyfeatures calculated for the sum of vector magnitudes, and a meanwas calculated for each of the additional feature vectors. Then,maximum, minimum, mean, standard deviation, and absolute devi-ation of the signal amplitude was extracted from the sum of vectormagnitudes and concatenated with the rest of the features. Finally,zero-crossing rate for each of the axes was averaged and concate-nated. This yielded a total of 71 features.
4.4 ClassicationFive traditional machine learning classiers were explored: decisiontree (DT), k-nearest neighbours (k-NN), logistic regression (LR),random forest (RF), and support vector machine (SVM). In this work,the results for RF and SVM are reported, since they demonstratedthe best performance during preliminary evaluation.
For evaluating the detection algorithm, we used a leave-one-outapproach, commonly utilised in machine learning problems with
Timestamp
X-axis
Y-axis
Z-axis
Magnitude
Figure 1: Raw gyroscope data collected with the participantgrinding teeth, with the grinding events coloured in red, andperiods with no grinding coloured in grey.
limited number of participants. Then, mean and standard deviationwere calculated for each of the performance metrics across theresulting values.
To evaluate the algorithm, we compared accuracy, precision,recall, and f1-score. While low number of false positives (FP) andfalse negatives (FN) is desirable, it is important to keep in mind thatin this scenario occasional FP or FN might be acceptable due to theability to infer the overall diagnosis only if multiple bruxism-relatedevents are detected.
4.5 Experiment designThe goal of this study was to assess the feasibility of detectingbruxism-related events in a controlled and a mimicked in-the-wildenvironment through in-ear wearables using IMU signals. Thisgoal informed our experiment design. In this paper we present theperformance of two traditional machine learning algorithms, RF andSVM, on data collected from two dierent sensors, accelerometerand gyroscope, for the following tasks:
Task 1: detection of bruxism-related events in a controlled en-vironment, with minimal external noise and no other actions per-formed, participant being still:
(a) for teeth grinding (580:388 windows of grinding:silent data);(b) for teeth clenching (589:438 windows of clenching:silent
data).
Task 2: detection of bruxism-related events in a mimicked in-the-wild environment (in order to evaluate algorithm performancein a more realistic setting), with participants performing a range ofroutine activities:
(a) teeth grinding and clenching during no general activity,while moving head, and while listening to music (1658:2334grinding:silent and 1695:2334 clenching:silent windows);
(b) activities from task 2b with the addition of other routineactivities, such as chewing bread, chewing gum, readingout loud (to imitate speaking), drinking water, and walking.Worth noting, that the additional activities do not includegrinding or clenching events, and are intended for testingthe detection algorithm performance on actions that areknown to either be relatively noisy or involve signicantjaw activity that may be misclassied as teeth grinding orclenching (1658:4825 grinding:silent and 1695:4815 clench-ing:silent windows).
5 RESULTS AND DISCUSSION5.1 Bruxism Detection in Controlled
EnvironmentTask 1 was designed with the purpose of assessing the feasibilityof detecting teeth grinding and clenching using earbuds with abuilt-in IMU in a controlled environment, with the participant com-pletely still. Based on leave-one-out validation, comparing SVM toRF demonstrates that SVM performs better on both grinding andclenching detection. It is obvious that using gyroscope data yields asignicantly higher performance, achieving 89% and 60% on grind-ing and clenching events detection, respectively. For the controlledexperiment, RF achieves superior performance only on detection of

Earables for Detection of Bruxism: a Feasibility Study EarComp ’21, Sep 25, 2021, Online
grinding events using accelerometer data (70% accuracy), in com-parison to detection of grinding events using accelerometer andSVM (66% accuracy). However, both results are signicantly worsethan the detection accuracy achieved using gyroscope data. We alsocalculated precision, recall, and f-1 score, and these metrics as wellas the standard deviation for the leave-one-out cross-validation arereported in Table 1.
5.2 Bruxism Detection In-The-WildWe demonstrated that in-ear wearables show promise for detectionof bruxism-related events in a controlled environment. But, natu-rally, it is important to also analyse whether earables could oera viable solution for unobtrusive bruxism detection in-the-wild.For this purpose, Task2(a) and Task2(b) were designed to test thebruxism-related activity detection approach while the study partici-pants were performing other actions. Specically, Task2(a) focusedon teeth grinding and clenching in silence, as well as these eventswhile listening to music or moving the head. Task2(b) presented aneven more complex problem, adding other activities that involvesubstantial jaw movement.
For Task2(a), SVM model on gyroscope data showed the bestperformance, for teeth grinding detection yielding 73% accuracy,and reaching 61% accuracy for teeth clenching detection. Task2(b)proved to be a more challenging experiment, which can be observedfrom reduced performance on precision, recall, and f-1 score. How-ever, RF still performs suciently well on gyroscope data, yieldinga 68% and 61% precision on grinding and clenching, respectively.SVM was incapable of detecting clenching using accelerometerdata, predicting that all the testing data do not contain clenchinginstances. Therefore, no metrics are reported for this algorithm. Ingeneral, acceleration-based performance was insucient, provingthat gyroscope provides more valuable data for bruxism detection.Detailed results for these experiments can be seen in Tables 2 and 3.
We also evaluated which tasks have the most impact on detectionof bruxism, concluding that head movements and reading out loudhave the most impact on correct classication of grinding events,and head movements, walking, and drinking have the most impacton clenching detection.
Table 1: Detection of grinding (denoted as Gr.) and clenching(denoted as Cl.) by SVM and RF algorithms on Task 1. Thevalues reported are mean±stdev.
Gyroscope AccelerometerSVM RF SVM RF
Gr.
Accuracy 0.88±0.05 0.85±0.08 0.66±0.12 0.70±0.11Precision 0.89±0.04 0.87±0.07 0.69±0.19 0.70±0.16Recall 0.88±0.05 0.84±0.09 0.63±0.12 0.67±0.12f1-score 0.88±0.05 0.83±0.10 0.57±0.17 0.63±0.15
Cl.
Accuracy 0.60±0.06 0.57±0.06 0.58±0.05 0.55±0.06Precision 0.56±0.13 0.54±0.10 0.40±0.15 0.53±0.12Recall 0.57±0.06 0.54±0.07 0.51±0.02 0.52±0.08f1-score 0.52±0.11 0.52±0.11 0.40±0.06 0.49±0.08
Table 2: Performance on detection of teeth grinding andclenching on Task2(a).
Gyroscope AccelerometerSVM RF SVM RF
Gr.
Accuracy 0.73±0.05 0.73±0.08 0.55±0.04 0.56±0.07Precision 0.74±0.06 0.73±0.08 0.43±0.10 0.51±0.12Recall 0.70±0.05 0.71±0.08 0.49±0.03 0.52±0.07f1-score 0.70±0.06 0.71±0.09 0.42±0.06 0.48±0.09
Cl.
Accuracy 0.61±0.05 0.60±0.04 0.57±0.03 0.52±0.06Precision 0.60±0.08 0.57±0.07 0.36±0.15 0.45±0.08Recall 0.56±0.06 0.57±0.05 0.50±0.01 0.49±0.02f1-score 0.52±0.08 0.55±0.07 0.38±0.04 0.42±0.04
Table 3: Performance on detection of teeth grinding andclenching on Task2(b).
Gyroscope AccelerometerSVM RF SVM RF
Gr.
Accuracy 0.74±0.03 0.76±0.05 0.73±0.03 0.67±0.11Precision 0.53±0.18 0.68±0.07 0.46±0.14 0.48±0.10Recall 0.51±0.02 0.61±0.06 0.50±0.02 0.49±0.05f1-score 0.45±0.04 0.61±0.07 0.44±0.04 0.45±0.07
Cl.
Accuracy 0.74±0.02 0.73±0.02
N/A
0.70±0.04Precision 0.39±0.05 0.61±0.05 0.41±0.05Recall 0.50±0.00 0.54±0.02 0.49±0.02f1-score 0.43±0.01 0.52±0.03 0.44±0.03
5.3 Limitations and Future WorkAlthough this work is intended as a feasibility study to assess thecapability of in-ear wearables to detect bruxism-related events, itis nevertheless important to highlight its limitations and discusssome potential avenues worth exploring in the future.
Teeth grinding, which is the typical symptom of bruxism, usu-ally happens when the person is not fully conscious, most oftenexhibited in patients’ sleep. Our dataset consists of people who areunlikely to be actually suering from bruxism, and the data is col-lected with the participants being awake and fully conscious, whichmeans that the data which would be collected from real bruxismsuerers might be slightly dierent. However, earbuds for sleephave started to appear on the market, the sole purpose of which isto provide comfortable noise cancellation, which is very promisingfor unobtrusive detection of bruxism during sleep.
Our results show that the accuracy of clenching detection islower than that of grinding. However, it is important to note thatgrinding is an action that involves continuous movement in the jawjoint, resulting in continuously changing IMU data. Clenching, onthe other hand, only involves changes in acceleration and angularvelocity when the action is initiated, i.e. the person clasps theirteeth together, and not when the action is in progress, i.e. the teethare clasped and the jaw is not moving. This may explain the poorerperformance on detection of clenching events. Going forward, ex-ploring alternative ways of data segmentation and labelling might

EarComp ’21, Sep 25, 2021, Online Erika Bondareva, Elín Rós Hauksdóir, and Cecilia Mascolo
be useful, as well as more advanced machine learning approachesthat are capable of dealing with time-series data, such as recurrentneural networks (RNNs).
From the classication perspective, given recent advances indeep learning, it would be imperative to explore the potential ofdeep learning on raw IMU data from earables for detection ofbruxism-related events.
Other potential areas of research would include exploring sensorfusion and considering accelerometer and gyroscope data in com-bination, as well as potentially investigating the feasibility of usingaudio collected with a microphone pointing inside the ear [14].
Finally, given the complexity of collecting and labelling bruxismdata, it would be interesting to explore IMU data augmentation, aswell as potentially generating synthetic data.
6 CONCLUSIONSThis work presents a feasibility study on detection of bruxism-related events using earables. During a bruxism epidemic, whichwas potentially exacerbated by the COVID-19 pandemic, it is es-sential to devise a low-cost, unobtrusive, and socially acceptablemethod for bruxism detection, which would allow to diagnose thepatients in early stages of the disorder, before irreversible toothwear occurs. We compiled a rst extensive dataset of teeth grindingand clenching data collected via earbuds with a built-in IMU. Inaddition to collecting these data in a controlled environment, wealso collected data mimicking in-the-wild signal by asking the usersto simulate teeth grinding and clenching while performing otheractivities, or to engage in routine activities that require substantialjaw involvement.
By using traditional machine learning methods, we concludedthat SVM and RF yield the best performance. Gyroscope data ap-pears to be muchmore valuable than acceleration data for identica-tion of bruxism-related events. We achieved 88% and 66% accuracyon teeth grinding and clenching, respectively, in a controlled en-vironment. We also demonstrate the potential of this technologyin a mimicked in-the-wild environment, achieving 76% and 73%accuracy on teeth grinding and clenching, respectively.
ACKNOWLEDGMENTSThis work was supported by the UK Engineering and Physical Sci-ences Research Council (EPSRC) grant EP/L015889/1 for the Centrefor Doctoral Training in Sensor Technologies and Applications,ERC Project 833296 (EAR), and Nokia Bell Labs through their dona-tion for the Centre of Mobile, Wearable Systems and AugmentedIntelligence.
REFERENCES[1] Toshiyuki Ando, Yuki Kubo, Buntarou Shizuki, and Shin Takahashi. 2017.
CanalSense: Face-Related Movement Recognition System Based on Sensing AirPressure in Ear Canals. In Proceedings of the 30th Annual ACM Symposium on UserInterface Software and Technology (Québec City, QC, Canada) (UIST ’17). Associa-tion for ComputingMachinery, 679–689. https://doi.org/10.1145/3126594.3126649
[2] H. Beddis, M. Pemberton, and Stephen Davies. 2018. Sleep Bruxism: an Overviewfor Clinicians. British Dental Journal 225, 6 (2018), 497–501. https://doi.org/10.1038/sj.bdj.2018.757
[3] Abdelkareem Bedri, David Byrd, Peter Presti, Himanshu Sahni, Zehua Gue, andThad Starner. 2015. Stick It in Your Ear: Building an in-Ear Jaw Movement Sensor
(UbiComp/ISWC’15 Adjunct). Association for Computing Machinery, 1333–1338.https://doi.org/10.1145/2800835.2807933
[4] E. Casett, J. C. Réus, J. Stuginski-Barbosa, A. Porporatti, M. Carra, M. Peres,G. De Luca Canto, and D. Manfredini. 2017. Validity of dierent tools to assesssleep bruxism: a meta-analysis. Journal of Oral Rehabilitation 44 (2017), 722–734.
[5] T. Castroorio, A. Bargellini, G. Rossini, G. Cugliari, A. Deregibus, and D. Man-fredini. 2015. Agreement between clinical and portable EMG/ECG diagnosis ofsleep bruxism. Journal of Oral Rehabilitation 42, 10 (2015), 759–764.
[6] Tommaso Castroorio, Luca Mesin, Gianluca Martino Tartaglia, Chiarella Sforza,and Dario Farina. 2013. Use of Electromyographic and ElectrocardiographicSignals to Detect Sleep Bruxism Episodes in a Natural Environment. IEEE Journalof Biomedical and Health Informatics 17, 6 (2013), 994–1001. https://doi.org/10.1109/JBHI.2013.2274532
[7] Dadnam D., Dadnam C. Al-Saar H. 2021. Pandemic Bruxism | British DentalJournal 230, 271. https://www.nature.com/articles/s41415-021-2788-3#citeas.
[8] C. González and A Díaz Lantada. 2009. A wearable passive force sensorpowered by an active interrogator intended for intra-splint use for the detec-tion and recording of bruxism. In 2009 3rd International Conference on Perva-sive Computing Technologies for Healthcare. 1–4. https://doi.org/10.4108/ICST.PERVASIVEHEALTH2009.5884
[9] Nantawachara Jirakittayakorn and Yodchanan Wongsawat. 2014. An EMG in-strument designed for bruxism detection on masseter muscle. In The 7th 2014Biomedical Engineering International Conference. 1–5.
[10] Fahim Kawsar, Chulhong Min, Akhil Mathur, and Alessandro Montanari. 2018.Earables for Personal-Scale Behavior Analytics. IEEE Pervasive Computing 17, 3(2018), 83–89. https://doi.org/10.1109/MPRV.2018.03367740
[11] Prerna Khanna, Tanmay Srivastava, Shijia Pan, Shubham Jain, and Phuc Nguyen.2021. JawSense: Recognizing Unvoiced Sound Using a Low-Cost Ear-WornSystem. In Proceedings of the 22nd International Workshop on Mobile ComputingSystems and Applications (Virtual, United Kingdom) (HotMobile ’21). Associationfor Computing Machinery, 44–49. https://doi.org/10.1145/3446382.3448363
[12] Rio Kinjo, Takahiro Wada, Hiroshi Churei, Takehiro Ohmi, Kairi Hayashi,Kazuyoshi Yagishita, Motohiro Uo, and Toshiaki Ueno. 2021. Development of aWearable Mouth Guard Device for Monitoring Teeth Clenching during Exercise.Sensors 21, 4 (2021). https://doi.org/10.3390/s21041503
[13] Michael Knierim,Max Schemmer, andDominikWoehler. 2021. DetectingDaytimeBruxism Through Convenient and Wearable Around-the-Ear Electrodes. In 12thInternational Conference on Applied Human Factors and Ergonomics (AHFE 2021).
[14] Dong Ma, Andrea Ferlini, and Cecilia Mascolo. 2021. OESense: EmployingOcclusion Eect for in-Ear Human Sensing. In Proceedings of the 19th AnnualInternational Conference on Mobile Systems, Applications, and Services (VirtualEvent, Wisconsin) (MobiSys ’21). Association for Computing Machinery, 175–187.https://doi.org/10.1145/3458864.3467680
[15] Chulhong Min, Akhil Mathur, and Fahim Kawsar. 2018. Exploring Audio andKinetic Sensing on Earable Devices. In Proceedings of the 4th ACM Workshop onWearable Systems and Applications (Munich, Germany) (WearSys ’18). Associationfor Computing Machinery, 5–10. https://doi.org/10.1145/3211960.3211970
[16] Lucas B Pigozzi, Daniela D S Rehm, Simone C Fagondes, Eduardo P Pellizzer,and Márcio L Grossi. 2019. Current Methods of Bruxism Diagnosis: A ShortCommunication. The International journal of prosthodontics 32, 3 (2019), 263—264.https://doi.org/10.11607/ijp.6196
[17] Jay Prakash, Zhijian Yang, Yu-Lin Wei, Haitham Hassanieh, and Romit RoyChoudhury. 2020. EarSense: Earphones as a Teeth Activity Sensor. In Proceedingsof the 26th Annual International Conference on Mobile Computing and Networking(London, United Kingdom) (MobiCom ’20). Association for Computing Machinery,Article 40. https://doi.org/10.1145/3372224.3419197
[18] Siddharth Rupavatharam and Marco Gruteser. 2019. Towards In-Ear Inertial JawClenching Detection. In Proceedings of the 1st International Workshop on EarableComputing (London, United Kingdom) (EarComp’19). Association for ComputingMachinery, 54–55. https://doi.org/10.1145/3345615.3361134
[19] Shetty, S., Pitti, V., C.L., Babu, S., G.P., Kumar, S. and Deepthi, B. C. . 2010. Bruxism:A Literature Review. J Indian Prosthodont Soc 10, 141–148 (2010). https://link.springer.com/article/10.1007/s13191-011-0041-5.
[20] M. van Dijk. 1995. The binary symmetric broadcast channel with condentialmessages, with tampering. In Proceedings of 1995 IEEE International Symposiumon Information Theory. 487–. https://doi.org/10.1109/ISIT.1995.550474
[21] Wataru Yachida, Taro Arima, Eduardo E. Castrillon, Lene Baad-Hansen, NoboruOhata, and Peter Svensson. 2016. Diagnostic validity of self-reported measuresof sleep bruxism using an ambulatory single-channel EMG device. Journal ofProsthodontic Research 60, 4 (2016), 250–257. https://doi.org/10.1016/j.jpor.2016.01.001
[22] ZoomVideo Communications Inc. 2016. ZoomVideo Communications Inc . (2016).Security guide. Zoom Video Communications Inc. https://d24cgw3uvb9a9h.cloudfront.net/static/81625/doc/Zoom-Security-White-Paper.pdf.

Detecting forward leaning posture using eSense and developinga posture improvement promoting systemYushi Takayama
Aoyama Gakuin UniversityTokyo, Japan
Shun IshiiAoyama Gakuin University
Tokyo, [email protected]
Anna YokokuboAoyama Gakuin University
Tokyo, [email protected]
Guillaume LopezAoyama Gakuin University
Tokyo, [email protected]
ABSTRACTIn this study, we propose a method using eSense for detectingforward leaning posture during computer work, and verify its ef-fectiveness. We will also develop a system that prompts the userto improve posture when a forward leaning posture is detected,and verify its eectiveness. In the future, we aim to develop a sys-tem that targets not only forward leaning posture but also postureimprovement in other parts of the body by utilizing the contentsveried in this research.
CCS CONCEPTS• Computer systems organization! Embedded systems; Re-dundancy; Robotics; • Networks! Network reliability.
KEYWORDSearable device, wearable device, posture improvement, oce work
ACM Reference Format:Yushi Takayama, Shun Ishii, Anna Yokokubo, and Guillaume Lopez. 2021.Detecting forward leaning posture using eSense and developing a postureimprovement promoting system. In EarComp 2021: 2nd International Work-shop on Earable Computing in Conjunction with Ubicomp 2021, September25–26, 2021. ACM, New York, NY, USA, 2 pages. https://doi.org/10.1145/1122445.1122456
1 INTRODUCTIONOce workers, who work with a computer, often suer from unnat-ural posture while working. Working for a long time with unnaturalposture can cause not only physical fatigue, but also diseases suchas tendinitis and hunchback. In order to prevent the onset of thesediseases, it is necessary to work with correct posture continuously.However, it seems dicult to work while always being aware ofmaintaining correct posture. We think it is necessary that a system
Permission to make digital or hard copies of all or part of this work for personal orclassroom use is granted without fee provided that copies are not made or distributedfor prot or commercial advantage and that copies bear this notice and the full citationon the rst page. Copyrights for components of this work owned by others than ACMmust be honored. Abstracting with credit is permitted. To copy otherwise, or republish,to post on servers or to redistribute to lists, requires prior specic permission and/or afee. Request permissions from [email protected] 2021, September 25–26, 2021,© 2021 Association for Computing Machinery.ACM ISBN 978-1-4503-XXXX-X/18/06. . . $15.00https://doi.org/10.1145/1122445.1122456
that detects unnatural posture and notify users to encourage themto maintain correct posture. In this study, we focus on detectingforward leaning posture, and aim to verify the method of it usingeSense, which is an earable device equipped with a 6-axis acceler-ation sensor. At the same time, we aim to develop a system thatencourages posture improvement when a forward leaning postureis detected, and to verify the eectiveness of the system.
2 RELATEDWORKSeveral posture estimation methods using wearable devices havebeen proposed in previous studies. For example, this study[2] veri-ed whether posture estimation is possible using only the 3-axisaccelerometer of a cell phone, and found that the basic motions ofsitting, standing, walking, and running could be estimated. How-ever, in order to detect forward leaning posture using a cell phone,it needs to be worn on the upper body where body movementsare large. Since cell phones have been getting larger and larger onrecent years, wearing them on the upper body all the time can bea hindrance to your work. Also, not all people wear a cell phonewhile working with a computer (for example, some people put iton their desk while working).On the other hand, there is also previous study about a system thatpromote improved posture during desk work. For example, thisstudy[3] investigated the use of a very slow moving monitor forunobtrusive posture correction, and revealed its eectiveness. Wethink this system very good in that it can correct posture impercep-tibly without disturbing the user’s work with sound or vibration,but the drawback is that it requires a motorized monitor which ishardly widespread yet.The device used for posture estimation while working on a com-puter should not interfere with the work and should not causediscomfort even if it is worn for a long time. Therefore, we thinkearphones are appropriate because it is small and familiar to manypeople. Although sensor-equipped earphones are not yet widelyavailable, given the popularity of TWS over the past few years, wethink it would be useful to conduct this study using earables.
3 METHODS3.1 Detecting forward leaning postureIn this study, we use eSense, which is an earable device developed byNokia Bell Labs[1]. eSense is equipped with a 6-axis accelerometer

EarComp 2021, September 25–26, 2021, Takayama and Ishii, et al.
in the left earbud, and we propose a method to detect forward-leaning posture from these sensor data (see Fig. 1). To determinewhether the posture is forward-leaning or not, we can use therotation angle of the left earbud. As shown in Figure 2, when usersare in forward-leaning posture, there should be a change in therotation angle on the Z-axis. Therefore, we detect forward-leaningposture when the a rotation angle on the Z-axis of the left earbudexceeds a threshold value for a certain amount of time.
Figure 1: The orientation of the IMU axes and the polarityof rotation in relation to the earbud (quoted from [1]).
Figure 2: There should be a change in the rotation angle onthe Z axis when users are in forward leaning posture.
3.2 Implementing a posture improvementpromoting system
Since we can access the 6-axis accelerometer data through the BLEinterface, we created an application to acquire the sensor valuesin real-time. To improve focus on the work or studies, it is recom-mended to keep smartphones out of sight. However, it is not thecase for smartwatches, and smartwatches can also be used to collectfurther vital data that reects user’s state, such as hand motion andheart rate. Hence, we propose to collect eSense data from a BLEenable Android OS based smartwatch. Android API used to pro-vide two ways for measuring the rotation angle of android devices,but (4=B>A .).%_$'#))$# has already been deprecated,and (4=B>A"0=064A .64C$A84=C0C8>=() cannot be used with eSensebecause it requires the value of a magnetometer, which eSense isnot equipped. Therefore, we need to implement the algorithm tomeasure the rotation angle of the device by ourselves. We considerusing the following two methods to measure the rotation angle andwill verify their accuracy.
(a) Calculate the rotation angle by time integration of angularvelocity, and correct it using the acceleration data.
(b) Calculate the rotation angle by applying a Kalman lter toacceleration data and angular velocity data.
Then, we propose three kinds of feedback methods to encourageusers to improve their posture.
• The rst method is to play an audio message from the eS-ense. It is inspired by the fact that people will wear earbudswhile using this system, and it is expected to validate theeectiveness of auditory feedback while working.
• The second method is to show notications on the computerscreen. By using the OS notications that users often seewhile working, it is expected to provide feedback withoutfeeling users disturbed their work.
• The third method is to activate vibration and show notica-tion on the smartwatch.
Figure 3 show a schematic of proposed system. We plan to eval-uate the eectiveness of each method by asking the subjects toll out a questionnaire and assess whether it helped improve theirposture and whether it did not interfere with their work.
Figure 3: Schematic overview of proposed posture improve-ment system
4 FUTUREWORKBoth eSense and smartwatches do not interfere with work anddo not cause discomfort even when worn for a long time. Besidesmeasuring the forward-leaning posture from eSense, measuringthe wrist tilt angle using the smartwatch and providing feedbackto users may help prevent tendinitis caused by prolonged typing.Many smartwatches do not have a geomagnetic sensor but have anaccelerometer and gyroscope. Hence, the method of measuring therotation angle proposed in this study may be applicable.In this way, we would like to develop a posture improvement pro-moting system that combines multiple daily usage devices and leadto the verication of its eectiveness.
REFERENCES[1] Fahim Kawsar, Chulhong Min, Akhil Mathur, and Alessandro Montanari. 2018.
Earables for Personal-Scale Behavior Analytics. IEEE Pervasive Computing 17, 3(2018), 83–89. https://doi.org/10.1109/MPRV.2018.03367740
[2] Takashi Morito, Toshiki Hayashi, and Hiroyuki Morikawa. 2006. User Posture andMovement Estimation Based on 3-Axis Acceleration with a Sensor Network. InThe Special Interest Group Technical Reports of IPSJ.
[3] Joon-Gi Shin, Eiji Onchi, Maria Jose Reyes, Junbong Song, Uichin Lee, Seung-Hee Lee, and Daniel Saakes. 2019. Slow Robots for Unobtrusive Posture Correction.Association for Computing Machinery, New York, NY, USA, 1–10. https://doi.org/10.1145/3290605.3300843

Earable Design Analysis for Sleep EEG Measurements Swati
Mandekar IfB
FH Aachen Aachen, Germany
Lina Jentsch D-HEST
ETH Zurich Zurich, Switzerland
Dr. Kai Lutz
IDUN Technologies AG Zurich, Switzerland
Dr. Mehdi Behbahani
IfB FH Aachen
Aachen, Germany behbahani@fh-
aachen.de
Dr. Mark Melnykowycz
IDUN Technologies AG
Zurich, Switzerland mark@iduntechnolgie
s.ch
ABSTRACT Conventional EEG devices cannot be used in everyday life and hence, past decade research has been focused on Ear-EEG for mobile, at-home monitoring for various applications ranging from emotion detection to sleep monitoring. As the area available for electrode contact in the ear is limited, the electrode size and location play a vital role for an Ear-EEG system. In this investigation, we present a quantitative study of ear-electrodes with two electrode sizes at different locations in a wet and dry configuration. Electrode impedance scales inversely with size and ranges from 450 kΩ to 1.29 MΩ for dry and from 22 kΩ to 42 kΩ for wet contact at 10 Hz. For any size, the location in the ear canal with the lowest impedance is ELE (Left Ear Superior), presumably due to increased contact pressure caused by the outer-ear anatomy. The results can be used to optimize signal pickup and SNR for specific applications. We demonstrate this by recording sleep spindles during sleep onset with high quality (5.27 µVrms).
CCS CONCEPTS • Human-centered computing • Ubiquitous and mobile computing • Ubiquitous and mobile computing systems and tools
KEYWORDS EEG, sensors, BCI, Ear-EEG, biopotential electrodes, Sleep EEG, Impedance Spectroscopy
ACM Reference format: Swati Mandekar, Lina Jentsch, Dr. Kai Lutz, Dr. Mehdi Behbahani and Dr. Mark Melnykowycz. 2021. I Earable Design Analysis for Sleep EEG Measurements. In EarComp'21: Proceedings of the 2nd International Workshop on Earable Computing.
1 Introduction Electroencephalography (EEG) is a technique to measure electric potential differences produced by a group of neurons measured typically at the surface of the scalp. The EEG devices used in clinical settings are bulky, require trained personnel, and are time-consuming to setup and conduct measurements with. Hence, over the past decade, many research groups have investigated recording EEG from the outer ear canal (Ear-EEG) [1, 3, 4, 8, 14]. Ear-EEG has been shown to have similar features and quality to traditional scalp EEG [10]. The combination with a miniaturized and energy efficient biopotential front-end widened the scope to prospective uses outside of clinical and research areas. As a result, Ear-EEG appears to be the only viable choice for widespread consumer adoption of EEG technology. Applications for Ear-EEG range from brain-computer interfaces [11], work-related stress management solutions [7], and sleep monitoring [13] to cognitive-controlled hearing aids [2], epilepsy seizure warning devices [21], emotion monitoring [1] and neurofeedback home training systems [5]. As EEG records synchronized neuronal electrical activity, the signal needs to travel from the point of its origin i. e., clusters of neurons to the surface of the head through different tissue layers. For good signal acquisition, apart from the measurement device requirements to have a high input impedance and common mode rejection ratio (CMRR), the skin-electrode interface plays a crucial role. The skin contact impedance depends on the electrode’s properties such as the electrode’s material, size and skin conformity. Particularly for mobile applications, it is important to achieve a low-impedance contact to obtain a sufficiently high signal-to-noise ratio (SNR). Kappel et Al. [9] investigated impedance inside the ear canal to compare wet and dry ear-EEG electrodes. They observed a mean (standard deviation) low frequency impedance (<100 Hz) of the canal electrodes of 1.2 MΩ (SD =1.4 MΩ) and a high frequency impedance (>100 Hz) of 230 kΩ (SD = 220 kΩ) for rectangular silver electrodes of area 14 mm². The impedance measurements accounting for cerumen showed an 86% decrease in impedance after
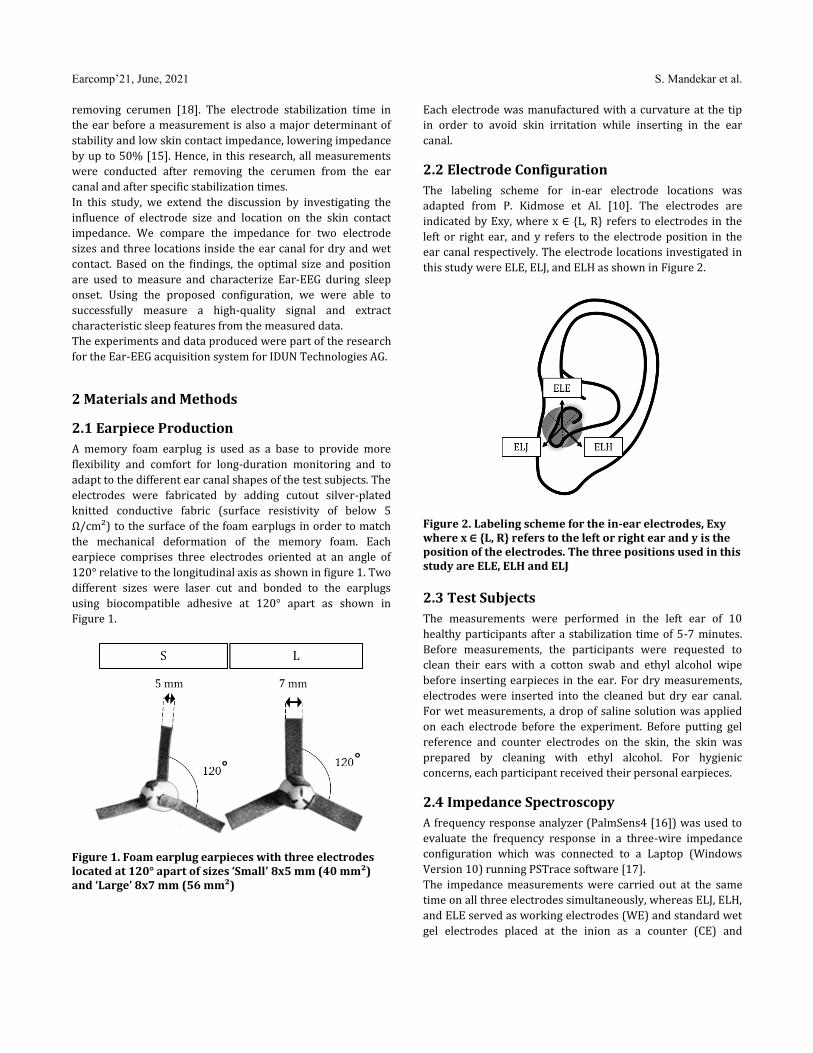
Earcomp’21, June, 2021 S. Mandekar et al.
removing cerumen [18]. The electrode stabilization time in the ear before a measurement is also a major determinant of stability and low skin contact impedance, lowering impedance by up to 50% [15]. Hence, in this research, all measurements were conducted after removing the cerumen from the ear canal and after specific stabilization times. In this study, we extend the discussion by investigating the influence of electrode size and location on the skin contact impedance. We compare the impedance for two electrode sizes and three locations inside the ear canal for dry and wet contact. Based on the findings, the optimal size and position are used to measure and characterize Ear-EEG during sleep onset. Using the proposed configuration, we were able to successfully measure a high-quality signal and extract characteristic sleep features from the measured data. The experiments and data produced were part of the research for the Ear-EEG acquisition system for IDUN Technologies AG.
2 Materials and Methods
2.1 Earpiece Production A memory foam earplug is used as a base to provide more flexibility and comfort for long-duration monitoring and to adapt to the different ear canal shapes of the test subjects. The electrodes were fabricated by adding cutout silver-plated knitted conductive fabric (surface resistivity of below 5 Ω/cm²) to the surface of the foam earplugs in order to match the mechanical deformation of the memory foam. Each earpiece comprises three electrodes oriented at an angle of 120° relative to the longitudinal axis as shown in figure 1. Two different sizes were laser cut and bonded to the earplugs using biocompatible adhesive at 120° apart as shown in Figure 1.
Figure 1. Foam earplug earpieces with three electrodes located at 120° apart of sizes ‘Small’ 8x5 mm (40 mm²) and ‘Large’ 8x7 mm (56 mm²)
Each electrode was manufactured with a curvature at the tip in order to avoid skin irritation while inserting in the ear canal.
2.2 Electrode Configuration The labeling scheme for in-ear electrode locations was adapted from P. Kidmose et Al. [10]. The electrodes are indicated by Exy, where x ∈ L, R refers to electrodes in the left or right ear, and y refers to the electrode position in the ear canal respectively. The electrode locations investigated in this study were ELE, ELJ, and ELH as shown in Figure 2.
Figure 2. Labeling scheme for the in-ear electrodes, Exy where x ∈ L, R refers to the left or right ear and y is the position of the electrodes. The three positions used in this study are ELE, ELH and ELJ
2.3 Test Subjects The measurements were performed in the left ear of 10 healthy participants after a stabilization time of 5-7 minutes. Before measurements, the participants were requested to clean their ears with a cotton swab and ethyl alcohol wipe before inserting earpieces in the ear. For dry measurements, electrodes were inserted into the cleaned but dry ear canal. For wet measurements, a drop of saline solution was applied on each electrode before the experiment. Before putting gel reference and counter electrodes on the skin, the skin was prepared by cleaning with ethyl alcohol. For hygienic concerns, each participant received their personal earpieces.
2.4 Impedance Spectroscopy A frequency response analyzer (PalmSens4 [16]) was used to evaluate the frequency response in a three-wire impedance configuration which was connected to a Laptop (Windows Version 10) running PSTrace software [17]. The impedance measurements were carried out at the same time on all three electrodes simultaneously, whereas ELJ, ELH, and ELE served as working electrodes (WE) and standard wet gel electrodes placed at the inion as a counter (CE) and

Earable Design Analysis for Sleep EEG Measurements Earcomp’21, June, 2021
between inion and ear as reference (RE) electrodes as shown in Figure 3. Wires were crimped to the electrodes using connector pins. The medical tape was used to ensure that the electrodes outside of the ear canal did not contact each other. After the stabilization time, four frequencies were swept from 1 Hz to 100 Hz. The data is analyzed using MATLAB with mean and standard deviation.
Figure 3. Electrode configuration of the ear impedance spectroscopy on the test subject for the three-electrode setup, standard wet gel electrodes are at RE and CE, WE are ear electrodes
2.5 Sleep EEG As an initial investigation into the ability of the three electrode earpieces to detect EEG features, a 30-minute sleep session was organized. An Open BCI Cyton device was used to amplify biopotential signals from the left ear of the subject and were recorded using the OpenBCI Graphical User Interface (GUI) software package. The test subject reclined on a comfortable sofa and fell asleep while being monitored with a video camera to identify large body movements and aid in the results interpretation. A stabilization time of ~10 minutes was used to allow the memory foam to stabilize in the ear. The only preparation done was cleaning ears with cotton swabs. The contra-lateral mastoid position was used for the counter and the neck was used for the reference position of the electrode setup. Standard wet gel electrodes were used as counter and reference electrodes.
3 Results and Discussion
3.1 Electrode Size The mean impedance after 5 and 7 minutes of stabilization time in the dry ear for S and L electrode sizes is shown in Figure 4 (n=3). The impedance was inversely proportional to the size of the electrodes and ranged from 1.25 MΩ for small to 450 kΩ for large electrodes after 5 min of stabilization time and from 1.29 MΩ (S) to 511 kΩ (L) after 7 mins of stabilization time at 10 Hz as shown in Figure 4. As reported previously in the literature, intra- and inter-subject variability can be significant for dry contact electrodes. For visual clarity, the standard deviation was excluded from the plot but can be seen in Table 1 in the supporting material. Depending on the used amplifier, impedances should typically be well below 1 MΩ to enable high-quality signal recordings and artifact rejection [6]. At the same time, bigger electrodes mean loss of spatial resolution and number of channels. To balance this tradeoff, we decided to use the smaller size for the further experiments but reduce the impedance by adding a drop of saline solution to the electrode surface prior to measurement. In contrast to the electrode size, the two minutes difference in stabilization time did not significantly change the impedance; hence a stabilization duration of 5 minutes was chosen for the following experiments.
Figure 4. Mean impedance magnitude of the two electrode sizes, small (S) and large (L) at 5 and 7 mins of stabilization times, Stabilization time does not affect impedance magnitude significantly whereas the effect of electrode size on impedance magnitude can be seen clearly
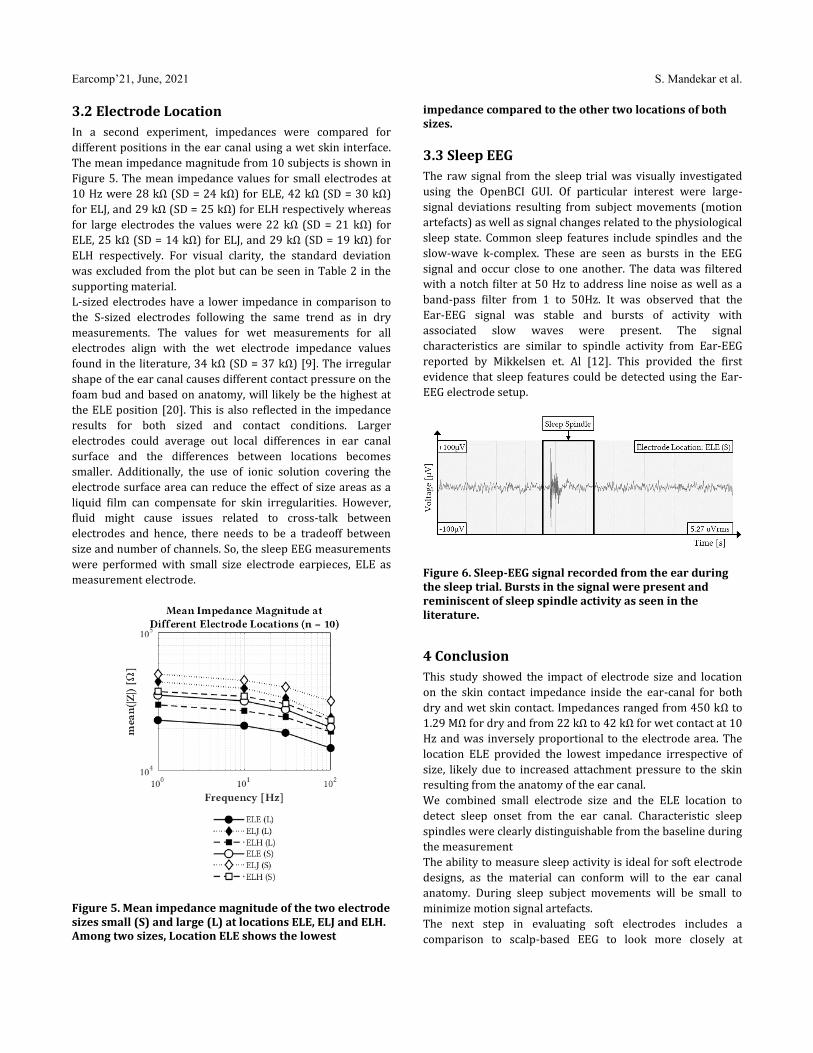
Earcomp’21, June, 2021 S. Mandekar et al.
3.2 Electrode Location In a second experiment, impedances were compared for different positions in the ear canal using a wet skin interface. The mean impedance magnitude from 10 subjects is shown in Figure 5. The mean impedance values for small electrodes at 10 Hz were 28 kΩ (SD = 24 kΩ) for ELE, 42 kΩ (SD = 30 kΩ) for ELJ, and 29 kΩ (SD = 25 kΩ) for ELH respectively whereas for large electrodes the values were 22 kΩ (SD = 21 kΩ) for ELE, 25 kΩ (SD = 14 kΩ) for ELJ, and 29 kΩ (SD = 19 kΩ) for ELH respectively. For visual clarity, the standard deviation was excluded from the plot but can be seen in Table 2 in the supporting material. L-sized electrodes have a lower impedance in comparison to the S-sized electrodes following the same trend as in dry measurements. The values for wet measurements for all electrodes align with the wet electrode impedance values found in the literature, 34 kΩ (SD = 37 kΩ) [9]. The irregular shape of the ear canal causes different contact pressure on the foam bud and based on anatomy, will likely be the highest at the ELE position [20]. This is also reflected in the impedance results for both sized and contact conditions. Larger electrodes could average out local differences in ear canal surface and the differences between locations becomes smaller. Additionally, the use of ionic solution covering the electrode surface area can reduce the effect of size areas as a liquid film can compensate for skin irregularities. However, fluid might cause issues related to cross-talk between electrodes and hence, there needs to be a tradeoff between size and number of channels. So, the sleep EEG measurements were performed with small size electrode earpieces, ELE as measurement electrode.
Figure 5. Mean impedance magnitude of the two electrode sizes small (S) and large (L) at locations ELE, ELJ and ELH. Among two sizes, Location ELE shows the lowest
impedance compared to the other two locations of both sizes.
3.3 Sleep EEG The raw signal from the sleep trial was visually investigated using the OpenBCI GUI. Of particular interest were large-signal deviations resulting from subject movements (motion artefacts) as well as signal changes related to the physiological sleep state. Common sleep features include spindles and the slow-wave k-complex. These are seen as bursts in the EEG signal and occur close to one another. The data was filtered with a notch filter at 50 Hz to address line noise as well as a band-pass filter from 1 to 50Hz. It was observed that the Ear-EEG signal was stable and bursts of activity with associated slow waves were present. The signal characteristics are similar to spindle activity from Ear-EEG reported by Mikkelsen et. Al [12]. This provided the first evidence that sleep features could be detected using the Ear- EEG electrode setup.
Figure 6. Sleep-EEG signal recorded from the ear during the sleep trial. Bursts in the signal were present and reminiscent of sleep spindle activity as seen in the literature.
4 Conclusion This study showed the impact of electrode size and location on the skin contact impedance inside the ear-canal for both dry and wet skin contact. Impedances ranged from 450 kΩ to 1.29 MΩ for dry and from 22 kΩ to 42 kΩ for wet contact at 10 Hz and was inversely proportional to the electrode area. The location ELE provided the lowest impedance irrespective of size, likely due to increased attachment pressure to the skin resulting from the anatomy of the ear canal. We combined small electrode size and the ELE location to detect sleep onset from the ear canal. Characteristic sleep spindles were clearly distinguishable from the baseline during the measurement The ability to measure sleep activity is ideal for soft electrode designs, as the material can conform will to the ear canal anatomy. During sleep subject movements will be small to minimize motion signal artefacts. The next step in evaluating soft electrodes includes a comparison to scalp-based EEG to look more closely at
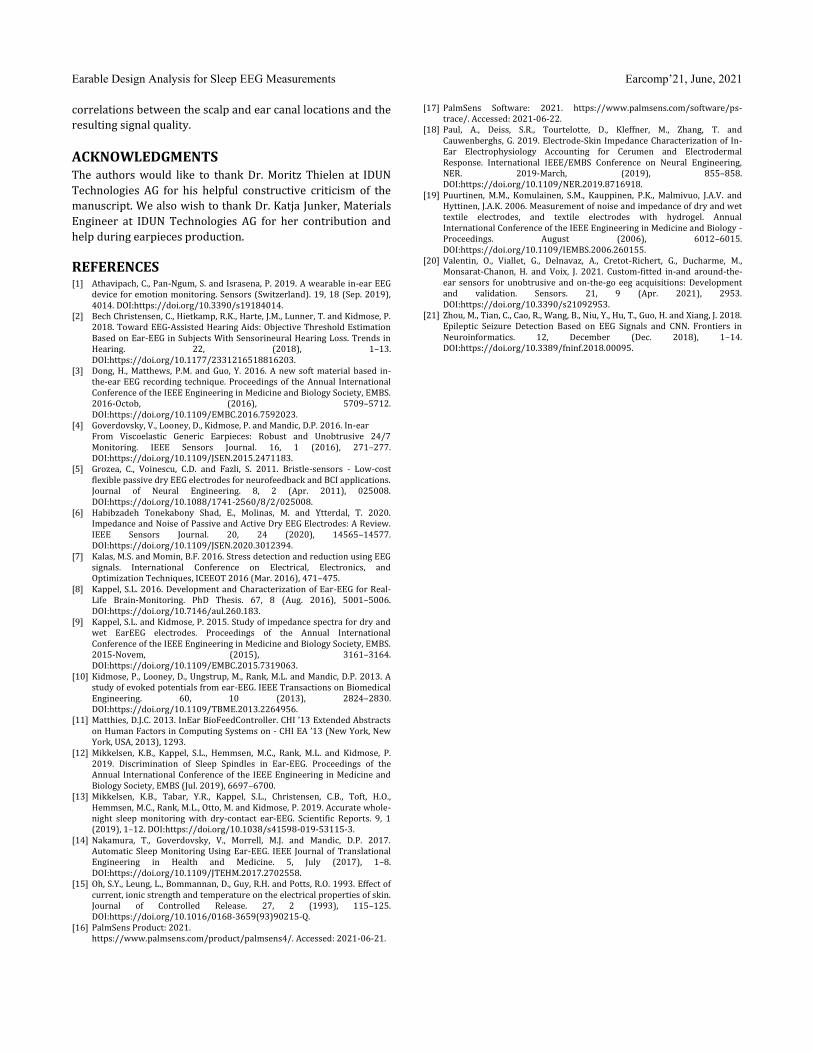
Earable Design Analysis for Sleep EEG Measurements Earcomp’21, June, 2021
correlations between the scalp and ear canal locations and the resulting signal quality.
ACKNOWLEDGMENTS The authors would like to thank Dr. Moritz Thielen at IDUN Technologies AG for his helpful constructive criticism of the manuscript. We also wish to thank Dr. Katja Junker, Materials Engineer at IDUN Technologies AG for her contribution and help during earpieces production.
REFERENCES [1] Athavipach, C., Pan-Ngum, S. and Israsena, P. 2019. A wearable in-ear EEG
device for emotion monitoring. Sensors (Switzerland). 19, 18 (Sep. 2019), 4014. DOI:https://doi.org/10.3390/s19184014.
[2] Bech Christensen, C., Hietkamp, R.K., Harte, J.M., Lunner, T. and Kidmose, P. 2018. Toward EEG-Assisted Hearing Aids: Objective Threshold Estimation Based on Ear-EEG in Subjects With Sensorineural Hearing Loss. Trends in Hearing. 22, (2018), 1–13. DOI:https://doi.org/10.1177/2331216518816203.
[3] Dong, H., Matthews, P.M. and Guo, Y. 2016. A new soft material based in-the-ear EEG recording technique. Proceedings of the Annual International Conference of the IEEE Engineering in Medicine and Biology Society, EMBS. 2016-Octob, (2016), 5709–5712. DOI:https://doi.org/10.1109/EMBC.2016.7592023.
[4] Goverdovsky, V., Looney, D., Kidmose, P. and Mandic, D.P. 2016. In-ear From Viscoelastic Generic Earpieces: Robust and Unobtrusive 24/7
Monitoring. IEEE Sensors Journal. 16, 1 (2016), 271–277. DOI:https://doi.org/10.1109/JSEN.2015.2471183.
[5] Grozea, C., Voinescu, C.D. and Fazli, S. 2011. Bristle-sensors - Low-cost flexible passive dry EEG electrodes for neurofeedback and BCI applications. Journal of Neural Engineering. 8, 2 (Apr. 2011), 025008. DOI:https://doi.org/10.1088/1741-2560/8/2/025008.
[6] Habibzadeh Tonekabony Shad, E., Molinas, M. and Ytterdal, T. 2020. Impedance and Noise of Passive and Active Dry EEG Electrodes: A Review. IEEE Sensors Journal. 20, 24 (2020), 14565–14577. DOI:https://doi.org/10.1109/JSEN.2020.3012394.
[7] Kalas, M.S. and Momin, B.F. 2016. Stress detection and reduction using EEG signals. International Conference on Electrical, Electronics, and Optimization Techniques, ICEEOT 2016 (Mar. 2016), 471–475.
[8] Kappel, S.L. 2016. Development and Characterization of Ear-EEG for Real-Life Brain-Monitoring. PhD Thesis. 67, 8 (Aug. 2016), 5001–5006. DOI:https://doi.org/10.7146/aul.260.183.
[9] Kappel, S.L. and Kidmose, P. 2015. Study of impedance spectra for dry and wet EarEEG electrodes. Proceedings of the Annual International Conference of the IEEE Engineering in Medicine and Biology Society, EMBS. 2015-Novem, (2015), 3161–3164. DOI:https://doi.org/10.1109/EMBC.2015.7319063.
[10] Kidmose, P., Looney, D., Ungstrup, M., Rank, M.L. and Mandic, D.P. 2013. A study of evoked potentials from ear-EEG. IEEE Transactions on Biomedical Engineering. 60, 10 (2013), 2824–2830. DOI:https://doi.org/10.1109/TBME.2013.2264956.
[11] Matthies, D.J.C. 2013. InEar BioFeedController. CHI ’13 Extended Abstracts on Human Factors in Computing Systems on - CHI EA ’13 (New York, New York, USA, 2013), 1293.
[12] Mikkelsen, K.B., Kappel, S.L., Hemmsen, M.C., Rank, M.L. and Kidmose, P. 2019. Discrimination of Sleep Spindles in Ear-EEG. Proceedings of the Annual International Conference of the IEEE Engineering in Medicine and Biology Society, EMBS (Jul. 2019), 6697–6700.
[13] Mikkelsen, K.B., Tabar, Y.R., Kappel, S.L., Christensen, C.B., Toft, H.O., Hemmsen, M.C., Rank, M.L., Otto, M. and Kidmose, P. 2019. Accurate whole-night sleep monitoring with dry-contact ear-EEG. Scientific Reports. 9, 1 (2019), 1–12. DOI:https://doi.org/10.1038/s41598-019-53115-3.
[14] Nakamura, T., Goverdovsky, V., Morrell, M.J. and Mandic, D.P. 2017. Automatic Sleep Monitoring Using Ear-EEG. IEEE Journal of Translational Engineering in Health and Medicine. 5, July (2017), 1–8. DOI:https://doi.org/10.1109/JTEHM.2017.2702558.
[15] Oh, S.Y., Leung, L., Bommannan, D., Guy, R.H. and Potts, R.O. 1993. Effect of current, ionic strength and temperature on the electrical properties of skin. Journal of Controlled Release. 27, 2 (1993), 115–125. DOI:https://doi.org/10.1016/0168-3659(93)90215-Q.
[16] PalmSens Product: 2021. https://www.palmsens.com/product/palmsens4/. Accessed: 2021-06-21.
[17] PalmSens Software: 2021. https://www.palmsens.com/software/ps-trace/. Accessed: 2021-06-22.
[18] Paul, A., Deiss, S.R., Tourtelotte, D., Kleffner, M., Zhang, T. and Cauwenberghs, G. 2019. Electrode-Skin Impedance Characterization of In-Ear Electrophysiology Accounting for Cerumen and Electrodermal Response. International IEEE/EMBS Conference on Neural Engineering, NER. 2019-March, (2019), 855–858. DOI:https://doi.org/10.1109/NER.2019.8716918.
[19] Puurtinen, M.M., Komulainen, S.M., Kauppinen, P.K., Malmivuo, J.A.V. and Hyttinen, J.A.K. 2006. Measurement of noise and impedance of dry and wet textile electrodes, and textile electrodes with hydrogel. Annual International Conference of the IEEE Engineering in Medicine and Biology - Proceedings. August (2006), 6012–6015. DOI:https://doi.org/10.1109/IEMBS.2006.260155.
[20] Valentin, O., Viallet, G., Delnavaz, A., Cretot-Richert, G., Ducharme, M., Monsarat-Chanon, H. and Voix, J. 2021. Custom-fitted in-and around-the-ear sensors for unobtrusive and on-the-go eeg acquisitions: Development and validation. Sensors. 21, 9 (Apr. 2021), 2953. DOI:https://doi.org/10.3390/s21092953.
[21] Zhou, M., Tian, C., Cao, R., Wang, B., Niu, Y., Hu, T., Guo, H. and Xiang, J. 2018. Epileptic Seizure Detection Based on EEG Signals and CNN. Frontiers in Neuroinformatics. 12, December (Dec. 2018), 1–14. DOI:https://doi.org/10.3389/fninf.2018.00095.

Coremoni-WE: Individual Core Training Monitoring andSupport System Using an IMU at the Waist and the EarNishiki Motokawa
Aoyama Gakuin UniversityTokyo, Japan
Ami JinnoAoyama Gakuin University
Tokyo, [email protected]
Yushi TakayamaAoyama Gakuin University
Tokyo, [email protected]
Shun IshiiAoyama Gakuin University
Tokyo, [email protected]
Anna YokokuboAoyama Gakuin University
Tokyo, [email protected]
Guillaume LopezAoyama Gakuin University
Tokyo, [email protected]
ABSTRACTDue to the inuence of the new coronavirus, many people are in-terrupting tness clubs and exercise/sports performed by multiplepeople. Under these circumstances, "core training," which can beeasily performed indoors by individuals, attracts attention as anexercise to improve health. However, it is not easy to recognizewhether the posture during the training is correct or not, whichmaysignicantly reduce the eect of the exercise. To tackle these issues,we have been developing "Coremoni-WE," a core training monitor-ing and support system that combines wearables and earables tojudge posture.
CCS CONCEPTS• Computer systems organization! Embedded systems; Re-dundancy; Robotics; • Networks! Network reliability.
KEYWORDSwearable device, sports, tness monitoringACM Reference Format:Nishiki Motokawa, Ami Jinno, Yushi Takayama, Shun Ishii, Anna Yokokubo,and Guillaume Lopez. 2021. Coremoni-WE: Individual Core Training Mon-itoring and Support System Using an IMU at the Waist and the Ear. InAdjunct Proceedings of the 2021 ACM International Joint Conference on Per-vasive and Ubiquitous Computing and Proceedings of the 2021 ACM Inter-national Symposium on Wearable Computers (UbiComp-ISWC ’21 Adjunct),September 21–26, 2021, Virtual, USA. ACM, New York, NY, USA, 2 pages.https://doi.org/10.1145/3460418.3479325
1 INTRODUCTIONIn recent years, people have been spending more and more timeat home to prevent the spread of new coronaviruses. In a surveyon health[2], more than 30% of the respondents answered thatthey became more active after the coronavirus outbreak, and "core
Permission to make digital or hard copies of all or part of this work for personal orclassroom use is granted without fee provided that copies are not made or distributedfor prot or commercial advantage and that copies bear this notice and the full citationon the rst page. Copyrights for components of this work owned by others than ACMmust be honored. Abstracting with credit is permitted. To copy otherwise, or republish,to post on servers or to redistribute to lists, requires prior specic permission and/or afee. Request permissions from [email protected] ’21 Adjunct, September 21–26, 2021, Virtual, USA© 2021 Association for Computing Machinery.ACM ISBN 978-1-4503-8461-2/21/09. . . $15.00https://doi.org/10.1145/3460418.3479325
training," which can be easily performed indoors by individuals, isattracting attention. However, there is a concern that the eects oftrunk training performed by individuals may be reduced becausethe trunk is often not used correctly compared to the activity con-ducted under an instructor.This study proposes a support system forcore training using wearable and earable IMUs to help individualsperform core training correctly.
2 RELATEDWORKSBarbado et al. studied about the reliability of smartphone accelerom-eters to quantify the intensity of core training [1]. From the vetypes of core training performed by 23 participants, they obtainedmoderate-to-high reliability scores for pelvic acceleration and con-cluded that smartphone accelerometers is useful to identify theindividuals’ core training status and to improve the training pro-grams. However, this study is not mentioned about the correctpostures and user feedbacks.
While many researchers and developers have been developingapplications based on smartphones and smartwatches, Kawsar etal. [3] proposed and developed a new wearable platform called“eSense”. The eSense platform consists of a pair of wireless earbudsaugmented with kinetic, audio, and proximity sensing [4]. The leftearbud has a six-axis IMU with an accelerometer, a gyroscope, anda Bluetooth Low Energy (BLE) interface to stream sensor data toa paired smartphone. Both earbuds are also equipped with micro-phones to record external sounds.
Prakash et al. introduced the advantages of eSense in countingthe number of steps of walking [5]. While the head movementcan still pollute this bouncing signal, they proposed a method toalleviate the noise from head movement. Results show 95% stepcount accuracy even in the most challenging test case—very slowwalk—where smartphone and wrist-band-type systems falter. Im-portantly, their system, which is named “STEAR” (STep countingfrom EARables) is robust to changes in walking patterns and scaleswell across dierent users. Additionally, they demonstrated howSTEAR also brings opportunities for practical jump analysis, oftencrucial for exercises and injury-related rehabilitation.

UbiComp-ISWC ’21 Adjunct, September 21–26, 2021, Virtual, USA Motokawa and Jinno, et al.
Figure 1: conguration of CoreMoni-WE
3 PROPOSED SYSTEM3.1 CoreMoni OverviewCoreMoni is a core training monitoring and support system thatfocuses on the user’s "posture" and "trunk blurring" in multiple coretraining exercises. It guides to improve the "posture" and "trunkblurring." In this study, we selected a method to determine "ap-propriate posture" using wearable and earable sensors (see usageimage in Fig. 1). CoreMoni collects the acceleration and angularvelocity values of the trunk and head from a wearable accelerationsensor attached to the user’s waist (movesense1) and an earableacceleration sensor attached to the head (eSense2), and transmitsthe data to a mobile information terminal (smartphone or tablet PC).The transmitted data is converted to variance and angle values andused for feedback on the mobile terminal. Two types of feedbackare provided: switching images for "posture" and sound eects for"blur of the trunk" during the trunk training.
3.2 Examination of the number ofaccelerometers installed and their positions
We conducted a requirement extraction experiment to determinethe number and position of accelerometers in the CoreMoni-WEimplementation. One university student in his 20’s was asked toperform front plank, which is the most basic core training exercise.We attached accelerometers to the subject’s head, waist, and anklesand asked him to perform front plank for one minute according tothe following procedure.
• 0 - 15 sec: correct posture• 15 - 30 sec: low back posture• 30 - 45 sec: high back posture• 45 - 60 sec: continuously changing the posture
We recorded the acceleration at each sensor position during theelapsed time of 1 minute of core training. After the experiment,the results were plotted for analysis. Acceleration of the sensorsattached to the head and the ankle does not change much along anyaxis. On the other hand, the acceleration of the sensor attached tothe waist showed some change, but the dierence was signicantonly in the y-axis. We can assume that the y-axis of accelerationat the waist is usefull to detect "trunk blur." Since two points are
1movesense, SUUNTO, https://www.movesense.com/2eSense, Nokia Bell Labs, Cambridge, https://www.esense.io/
Figure 2: CoreMoni-WE’s visual feedback for front plank
preferable to estimate trunk posture, and no dierencewas observedbetween acceleration at the ankle and the head, in addition to thewearable sensor at the waist, we selected the earable sensor at thehead, assuming it is more likely to be used than a wearable sensor atthe ankle. A feedback application based only on the waist attachedwearable sensor output as been developed, using thresholds ony-axis acceleration for evaluating "posture" (see Fig. 2).
4 FUTUREWORKSThis paper proposed supporting individual core training with asystem using accelerometers attached to the waist and ear. Ourrst application prototype can judge front plank posture usingonly waist attached wearable sensor. We are designing new algo-rithms combiningwaist attachedwearable sensor and head attachedearable sensor to discriminate and support multiple core trainingexercises. In this study, we focused only on acceleration among thedata that can be collected from wearable and earable sensors. Still,in the future, it may be possible to perform training more followingthe user’s health condition by collecting biological signals such asheart rate.
ACKNOWLEDGMENTSThis work was supported by Aoyama Gakuin University ResearchInstitute grant program for creation of innovative research.
REFERENCES[1] David Barbado, Belen Irles-Vidal, Amaya Prat-Luri, María Pilar García-Vaquero,
and Francisco J. Vera-Garcia. 2018. Training intensity quantication of corestability exercises based on a smartphone accelerometer. PLOS ONE 13, 12 (122018), 1–13. https://doi.org/10.1371/journal.pone.0208262
[2] Meiji Yasuda Life Insurance. 2020. Survey on "Health" - Change in health awarenessand behavior after the Stay Home Corona disaster! . https://www.meijiyasuda.co.jp/prole/news/release/2020/pdf/20200902_01.pdf
[3] Fahim Kawsar, Chulhong Min, Akhil Mathur, and Allesandro Montanari. 2018.Earables for personal-scale behavior analytics. IEEE Pervasive Computing 17, 3(2018), 83–89.
[4] Fahim Kawsar, Chulhong Min, Akhil Mathur, and Alessandro Montanari. 2018.Earables for Personal-Scale Behavior Analytics. IEEE Pervasive Computing 17, 3(2018), 83–89. https://doi.org/10.1109/MPRV.2018.03367740
[5] Jay Prakash, Zhijian Yang, Yu-Lin Wei, and Romit Roy Choudhury. 2019. STEAR:Robust Step Counting from Earables. In Proceedings of the 1st International Work-shop on Earable Computing (London, United Kingdom) (EarComp’19). Associationfor Computing Machinery, New York, NY, USA, 36–41. https://doi.org/10.1145/3345615.3361133

PilotEar: Enabling In-ear Inertial NavigationAshwin Ahuja
[email protected] of Cambridge
United Kingdom
Andrea [email protected]
University of CambridgeUnited Kingdom
Cecilia [email protected]
University of CambridgeUnited Kingdom
ABSTRACTNavigation systems are used daily. While dierent types of naviga-tion systems exist, inertial navigation systems (INS) have favorableproperties for some wearables which, for battery and form factorsmay not be able to use GPS. Earables (aka ear-worn wearables) areliving a momentum both as leisure devices, and sensing and com-puting platforms. The inherent high signal to noise ratio (SNR) ofear-collected inertial data, due to the vibration dumping of the mus-culoskeletal system; combined with the fact that people typicallywear a pair of earables (one per ear) could oer signicant accuracywhen tracking head movements, leading to potential improvementsfor inertial navigation. Hence, in this work, we investigate andpropose PilotEar, the rst end-to-end earable-based inertial naviga-tion system, achieving an average tracking drift of 0.15<B for oneearable and 0.11<B for two earables.
CCS CONCEPTS•Human-centered computing!Ubiquitous andmobile com-puting systems and tools.
KEYWORDSearables; inertial navigation; calibration; dataset; sensor fusion
ACM Reference Format:Ashwin Ahuja, Andrea Ferlini, and Cecilia Mascolo. 2021. PilotEar: En-abling In-ear Inertial Navigation. In Adjunct Proceedings of the 2021 ACMInternational Joint Conference on Pervasive and Ubiquitous Computing andProceedings of the 2021 ACM International Symposium on Wearable Comput-ers (UbiComp-ISWC ’21 Adjunct), September 21–26, 2021, Virtual, USA. ACM,New York, NY, USA, 7 pages. https://doi.org/10.1145/3460418.3479326
1 INTRODUCTIONNavigation systems are ubiquitous, they are in our phones, cars,sometimes even in our smartwatches. People rely on navigation sys-tems daily: commuting, while running errands, when going to meetfriends and family, driving to a restaurant, etc. Broadly speaking,it is possible to classify navigation systems as satellite-based [36],or inertial based [32]. Satellite-based navigation systems are aidedby, for example, a Global Positioning System (GPS). On the otherhand, Inertial Navigation Systems (INS) leverage inertial measure-ment units (IMUs) to maintain the location of a device without theneed for any satellite device. While GPS-based navigation systems
Permission to make digital or hard copies of part or all of this work for personal orclassroom use is granted without fee provided that copies are not made or distributedfor prot or commercial advantage and that copies bear this notice and the full citationon the rst page. Copyrights for third-party components of this work must be honored.For all other uses, contact the owner/author(s).UbiComp-ISWC ’21 Adjunct, September 21–26, 2021, Virtual, USA© 2021 Copyright held by the owner/author(s).ACM ISBN 978-1-4503-8461-2/21/09.https://doi.org/10.1145/3460418.3479326
generally have greater accuracy than INS, they have shortcomingswhen it comes to battery life, and sometimes (e.g., indoors whereGPS coverage is limited) fail to obtain the GPS lock they require tofunction. Unlike satellite-based navigation systems, INS are wellsuited to applications where either GPS coverage may be limitedor where battery life is a concern.
In this work, for the rst time, we explore the potential of anearable-based inertial navigation system. Earables (also know as ear-worn wearables) is an exploding area for wearable research. Theyallow users to combine listening to music with sensing and com-puting. Specically to this work, earables oer signicant potentialbenets for inertial tracking, a key part of an inertial navigationsystem. Concretely, earables can be used to track head movementswhich, in turn, can act as a proxy for visual attention [9]. As a resultof that, earable could be eectively used as an navigation systemby people visually impaired to navigate through audio feedback.Additionally, the stabilization eect of the human musculoskeletalpostural system ensures a natural vibration damping [14] whichleads to reduced noise in the motion sensor data fed to the INS.Furthermore, unlike other wearables, earables present the uniqueopportunity of two distinct vantage points (one from each ear),which can be leveraged to increase the overall performance of thesystem.
However, to implement an earable-based navigation system, anumber of challenges needs to be overcome. First and foremostthe lack of an existing earable platform equipped with a magne-tometer [8]: we prototype a new ear-worn sensing platform whichleverages a powerful an Arduino Nano 33 BLE Sense as microcon-troller (MCU). Our prototype earable (Figure 1) collects motiondata from the 9-axis IMU on-board the MCU, and streams it overBluetooth Low Energy (BLE). Further, it provides audio feedbackthanks to a custom-made printed circuit board (PCB) which pro-duces audible tones using pulse width modulation (PWM) and aresistor. Our prototype is designed to use minimal power and canrun for over a day of continuous use. It also contains other sensors(temperature, pressure, microphone) which we do not experimentwith in this paper. Secondly, because of the novelty of earable com-puting, there is a dataset scarcity. We therefore run a small userstudy and collect IMU data using our prototype. Thirdly, it is wellknown that inertial approaches require calibration in order to pro-vide accurate results [12]. Thus, we build upon previous work todene an eective calibration framework to calibrate the 9 IMUaxis of our prototype. Specically, we leverage the work done bySipos et al. [29] to calibrate the accelerometer, we implement thegyroscope calibration by Shen et al. [28], and nally we calibratethe magnetometer following the approach presented by Ferliniet al. [8]. Lastly, existing position tracking techniques have to beadapted to earables. We nd that a heading estimation approachwhich leverages the combination of a gyroscopic heading and a

UbiComp-ISWC ’21 Adjunct, September 21–26, 2021, Virtual, USA Ashwin Ahuja, Andrea Ferlini, and Cecilia Mascolo
Figure 1: Earable prototype
magnetometer heading fused together with a complementary lteroutperforms existing fusion algorithms. Correct heading estimationwhich successfully tracks the position of a person in a navigationapplication is predicated on displacement estimation. We performthis estimation by means of a pedestrian dead reckoning algorithmadapted over Lu et al. [17].
The contributions of this work can be summarized as follows.• We prototype an earable platform for collecting and trans-mitting accelerometer, gyroscope, and magnetometer dataover Bluetooth Low Energy (BLE) and audio feedback. Weuse such prototype to collect a new in-the-wild dataset con-sisting of 9-axis IMU data both from the earable prototypeand an iPhone. The user study has been carried out in agree-ment with the university ethics committee, and comprisesdata of six users walking both indoors and outdoors, bothin low noise and high noise situations. To the best of ourknowledge, there is not a similar publicly available dataset,and we will share ours the research community.
• We implement and evaluate the performance of PilotEar,the rst end-to-end inertial navigation system for earables,achieving an average drift of 0.15<B for one earable and0.11<B when fusing both earables.
• We experiment with a novel multi-device sensor fusion ap-proach to combine both earables and a smartphone. Theproposed approach reduces power usage for accurate track-ing by 65% by incorporating occasional GPS updates, whilstreducing tracking drift by 27% when maximizing perfor-mance.
2 INERTIAL NAVIGATION PRIMERInertial Navigation generally consists of three stages.
The rst stage is the pre-processing stage. IMU data are sam-pled and then pre-processed to remove the noise and the temporaldrift which often aect IMU readings. The rst challenge is to eec-tively calibrate each sensor. In this work, the sensors we consider,and calibrate, are accelerometer, gyroscope, and magnetometer.
Once the IMU data are successfully pre-processed and a calibra-tion framework has been applied, Secondly, the pre-processed datais used to nd the heading of the individual. This second phasegoes by the name heading estimation and, in the case of earablesconsists in estimating the orientation of the devices. The headingcan be estimated either from the gyroscope [31], from the mag-netometer [8], or fusing the both. There are many ways to fusegyroscope and magnetometer data. In this work we fuse gyroscopicand magnetic data in a similar way to what Shen et al. [28] did bymean of a complementary lter. Specically, the gyroscopic and
magnetic heading are estimated independently and then are fusedas follows:
\ = (1 U)\l + U\m (1)Where \l and \< are the gyroscopic and magnetic heading, respec-tively. The choice of U determines how much of each method isused. Shen et al. [28] suggest using a low value to fuse the gyro-scope and magnetometer heading. Other papers suggest increasingthe value of U over time, as the gyroscopic drift increases. Althoughnot featured in this paper, other well known fusion algorithms arethe Madgwick lter [19], the Mahony lter [20], and the Fouratilter [10]. We note that our preliminary results suggest the comple-mentary lter approach adapted from Shen et al. [28] outperformsour implementation of all the Madgwick, the Mahony and theFourati lters.
Finally, the third and last phase consists in nding the changein position (i.e., displacement) of the user at any given timestamp.This phase is also known as displacement estimation phase. Con-cretely, the position of the user is estimated by leveraging the theirheading and linear acceleration to nd the change in their (x, y)position at each timestamp. We do that by adapting an existingpedestrian dead reckoning model to complete the step length esti-mation eectively on earables. In pedestrian dead reckoning (PDR),the goal is to identify every step that the user makes when walking.This is used in practice to identify the distance by which the userhas moved at each time step, given the time taken to walk a knownlength stride. Our adaptation builds upon the step length estimationproposed by Lu et al. [17]:
D = ·∫
a(C)3C3C (2)
This assumes the velocity for each step starts at 0, whilst the valueof is computed experimentally for each user.
3 SYSTEM DESIGNThe lack of an existing programmable earable platform equippedwith a magnetometer compelled us to build to a new earable pro-totype platform. Our prototype features a 9-axis IMU, alongside amicrophone, a temperature sensor, and pressure sensor. The deviceis easily re-programmable using the Arduino prototyping platform.We wanted the prototype to be self-contained, thus we included abattery and power management. To be useful in real-world applica-tions, the device should also be able to output audio.
We prototyped our earable platform around an Arduino BLESense 33. This, in turn, runs on a powerful ARM Cortex M4 micro-controller, and is equipped with a BLE transceiver, 9-axis IMU, mi-crophone, temperature and pressure sensors. For battery and powermanagement we used a 520mAh lithium polymer battery (LiPo) andpower regulation module (PAM2401 as a DC-DC boost converterand MCP73831 as a charging regulator). To enable the headphonemanagement and switching circuitry (using a TS3A24159 ), notnatively supported by the Arduino BLE Sense 33, we designed andprinted a two-layer custom PCB (Figure 2). The PCB design (createdusing EagleCAD) will be released so that researchers can alter theboard for their requirements if necessary.
By using our prototype, researchers can easily collect and trans-mit data via Bluetooth to a connected device. The ubiquitous Ar-duino platform can be used to write software for this, exploiting

PilotEar: Enabling In-ear Inertial Navigation UbiComp-ISWC ’21 Adjunct, September 21–26, 2021, Virtual, USA
the signicant existing open-source code. We found that we couldtransmit 9-axis IMU from the prototype earable to a connected anApple iPhone 11, at 40Hz, with a battery life of over one day (26.3hours), and a current draw of 20.9mA.
Figure 2: Prototype schematics
As opposed to other earable platforms, like eSense [15], whichare designed as in-ear headphones using injection moulded plastic,our prototype was 3D-printed, with an around-ear design. Withthe current printing material of polylactic acid (PLA), the sizingis user specic (Figure 4). However, if the design could be printedin a more exible material such as thermoplastic polyurethane(TPU), the design could be more universal. Figure 3 shows theprototype design while Figure 1 shows the complete system whichwe designed and used to collect data.
Figure 3: Case design. Figure 4: Prototype worn.
4 EARABLE NAVIGATIONPilotEar consists of a number of elements. First, sensor calibration.The aim of this phase is to remove biases and temporal drift fromthe raw IMU data. Following this rst step, there is heading es-timation, where the calibrate IMU data are used to estimate thedirection where the user is facing. Since we were only concernedwith motion on the plane of the earth’s surface, we did not needto deal with any other orientation axis. The third aspect aims atestimating the distance moved per time step. These three phases,once combined, enable user position tracking from single earable.To improve the performance of PilotEar, we also considered sev-eral methods to fuse the data sampled by both earables. Finally,we present a method to provide audio feedback, for instance to avisually impaired user. By doing so, we believe PilotEar could helpin guiding a visually impaired person towards the correct exit at acomplicated intersection.
4.1 Sensor CalibrationWe calibrated the accelerometer using Sipos et al.’s calibrationmodel (Equation (3)) [29]. We minimized the square error for cali-bration clips with each earable in a number of static orientationsusing the Levenberg-Marquandt Algorithm.
a0 = ©≠´
1 0 0U~G 1 0UIG UI~ 1
™Æ¨©≠´
SF0G 0 00 SF0~ 00 0 SF0I
™Æ¨ ©≠´a ©≠
´10G10~10I
™Æ¨™Æ¨
(3)To calibrate the gyroscope, we used a method described by Shen
et al. [28]. Here, when the device is relatively stationary (|acc| 6),the gyroscope is calibrated using the magnetometer. To do so, we in-tegrate the gyroscopic headings over time to nd the orientation ofthe device. We then nd a rotational oset between the gyroscopicheading and the magnetometer heading.
Finally, for magnetometer calibration, we investigate the real-world tracking ecacy of Ferlini et al.’s semi-automated calibration,which uses occasional phone reference points to calibrate an earableoset [8]. This is based on the idea that when a person unlocks anduses their smartphone, the phone and earable are aligned. Hence,the reference heading from the phone (trustworthy) can be usedto correct the magnetometer of the earable. We emulate this bycollecting potential calibration points only every 15B . Through pre-liminary testing, we dene a regime to maintain a rolling window ofup-to fteen calibration points, but completing a full re-calibrationif we have encountered a full rotation (when the heading rolls overfrom 359° to 0° or vice versa).
4.2 Heading EstimationOur results suggests the best heading estimation comes from simplyusing the calibrated magnetometer:
k = arctan<~
<G(4)
To improve the accuracy, we added tilt compensation, to account forthe fact that the earth’s magnetic eld does not run perpendicularlyto the surface other than at the equator. We do this by ndingpitch and roll (q and \ , respectively) from the accelerometer, whenstationary.
q = arctan0~0I
(5)
\ = arctan0G
0~ sinq + 0I cosq(6)
\ and q are then used to rotate the magnetometer readings to theat plane, where \ = q = 0Whilst oering higher accuracy, the magnetometer-only approachsuers from a potentially lower reliability when a calibration fails.We, therefore, combined the magnetometer-only heading with thegyroscope-only heading by mean of a complementary lter. U isset to 0.8 C
400 .
k = (0.8 C
400) · heading_gyro + (0.2 + C
400) · heading_mag
(7)
Concretely, we trust the gyroscope more at the beginning. Overtime, the magnetometer calibration is likely to be more rened
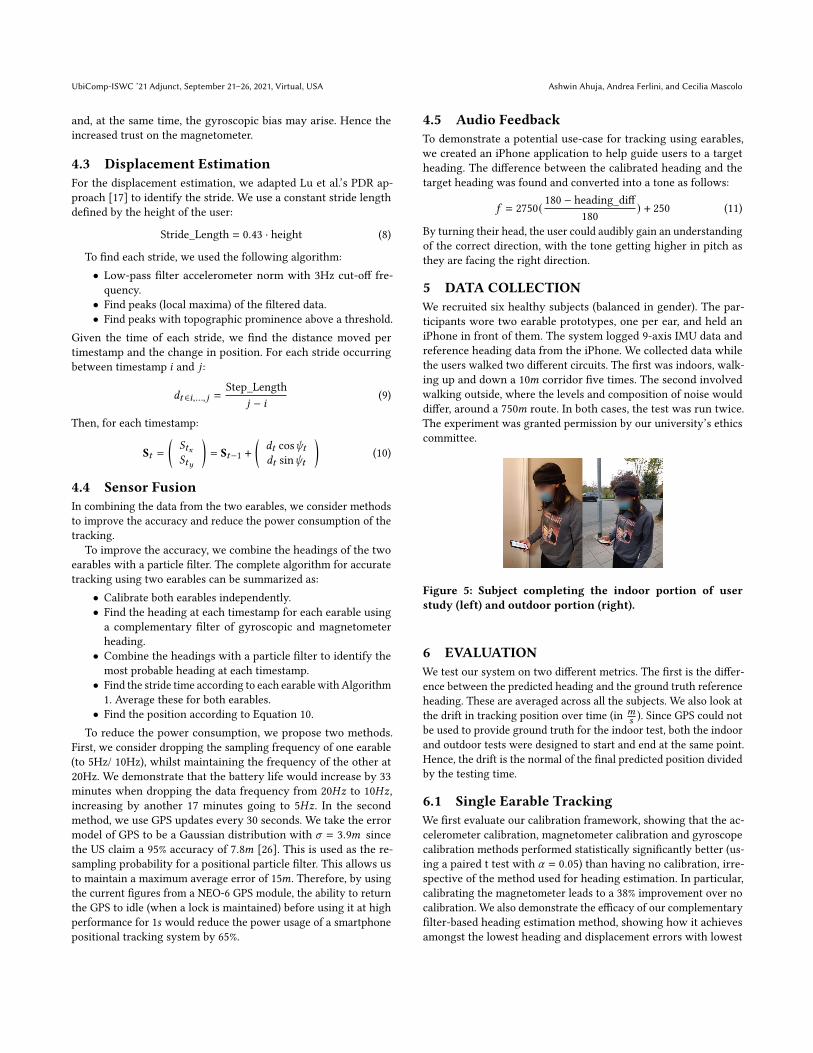
UbiComp-ISWC ’21 Adjunct, September 21–26, 2021, Virtual, USA Ashwin Ahuja, Andrea Ferlini, and Cecilia Mascolo
and, at the same time, the gyroscopic bias may arise. Hence theincreased trust on the magnetometer.
4.3 Displacement EstimationFor the displacement estimation, we adapted Lu et al.’s PDR ap-proach [17] to identify the stride. We use a constant stride lengthdened by the height of the user:
Stride_Length = 0.43 · height (8)
To nd each stride, we used the following algorithm:• Low-pass lter accelerometer norm with 3Hz cut-o fre-quency.
• Find peaks (local maxima) of the ltered data.• Find peaks with topographic prominence above a threshold.
Given the time of each stride, we nd the distance moved pertimestamp and the change in position. For each stride occurringbetween timestamp 8 and 9 :
3C 28,..., 9 =Step_Length
9 8 (9)
Then, for each timestamp:
SC =(CG(C~
= SC1 +
3C coskC3C sinkC
(10)
4.4 Sensor FusionIn combining the data from the two earables, we consider methodsto improve the accuracy and reduce the power consumption of thetracking.
To improve the accuracy, we combine the headings of the twoearables with a particle lter. The complete algorithm for accuratetracking using two earables can be summarized as:
• Calibrate both earables independently.• Find the heading at each timestamp for each earable usinga complementary lter of gyroscopic and magnetometerheading.
• Combine the headings with a particle lter to identify themost probable heading at each timestamp.
• Find the stride time according to each earable with Algorithm1. Average these for both earables.
• Find the position according to Equation 10.To reduce the power consumption, we propose two methods.
First, we consider dropping the sampling frequency of one earable(to 5Hz/ 10Hz), whilst maintaining the frequency of the other at20Hz. We demonstrate that the battery life would increase by 33minutes when dropping the data frequency from 20I to 10I,increasing by another 17 minutes going to 5I. In the secondmethod, we use GPS updates every 30 seconds. We take the errormodel of GPS to be a Gaussian distribution with f = 3.9< sincethe US claim a 95% accuracy of 7.8< [26]. This is used as the re-sampling probability for a positional particle lter. This allows usto maintain a maximum average error of 15<. Therefore, by usingthe current gures from a NEO-6 GPS module, the ability to returnthe GPS to idle (when a lock is maintained) before using it at highperformance for 1B would reduce the power usage of a smartphonepositional tracking system by 65%.
4.5 Audio FeedbackTo demonstrate a potential use-case for tracking using earables,we created an iPhone application to help guide users to a targetheading. The dierence between the calibrated heading and thetarget heading was found and converted into a tone as follows:
5 = 2750( 180 heading_di180
) + 250 (11)
By turning their head, the user could audibly gain an understandingof the correct direction, with the tone getting higher in pitch asthey are facing the right direction.
5 DATA COLLECTIONWe recruited six healthy subjects (balanced in gender). The par-ticipants wore two earable prototypes, one per ear, and held aniPhone in front of them. The system logged 9-axis IMU data andreference heading data from the iPhone. We collected data whilethe users walked two dierent circuits. The rst was indoors, walk-ing up and down a 10< corridor ve times. The second involvedwalking outside, where the levels and composition of noise woulddier, around a 750< route. In both cases, the test was run twice.The experiment was granted permission by our university’s ethicscommittee.
Figure 5: Subject completing the indoor portion of userstudy (left) and outdoor portion (right).
6 EVALUATIONWe test our system on two dierent metrics. The rst is the dier-ence between the predicted heading and the ground truth referenceheading. These are averaged across all the subjects. We also look atthe drift in tracking position over time (in <
B ). Since GPS could notbe used to provide ground truth for the indoor test, both the indoorand outdoor tests were designed to start and end at the same point.Hence, the drift is the normal of the nal predicted position dividedby the testing time.
6.1 Single Earable TrackingWe rst evaluate our calibration framework, showing that the ac-celerometer calibration, magnetometer calibration and gyroscopecalibration methods performed statistically signicantly better (us-ing a paired t test with U = 0.05) than having no calibration, irre-spective of the method used for heading estimation. In particular,calibrating the magnetometer leads to a 38% improvement over nocalibration. We also demonstrate the ecacy of our complementarylter-based heading estimation method, showing how it achievesamongst the lowest heading and displacement errors with lowest

PilotEar: Enabling In-ear Inertial Navigation UbiComp-ISWC ’21 Adjunct, September 21–26, 2021, Virtual, USA
Table 1: Results comparing heading error for dierent head-ing estimation methods.
Heading Error / ° Displacement Error /<B1
Average StandardDeviation Average Standard
DeviationMagnetometer only 15.1 15.7 0.133 0.0354Gyroscope only 21.9 15.7 0.194 0.0217Madgwick Filter 19.5 15.7 0.228 0.0423Fourati Filter 21.9 16 0.181 0.0275ComplementaryFilter 15.8 14.0 0.132 0.0214
Table 2: Results comparing displacement error for dierentdisplacement estimation methods.
Kinematics Step Length EstimationHeading Error / ° Displacement Error
/<B1Displacement Error/<B1
Average StandardDeviation Average Standard
Deviation Average StandardDeviation
Magnetometer only 15.1 15.6 2.32 0.769 0.133 0.0354Gyroscope only 21.9 15.7 2.69 1.11 0.194 0.0217Madgwick Filter 19.4 15.7 3.66 1.55 0.228 0.0423Fourati Filter 21.9 16 2.42 1.14 0.181 0.0275Complementary Filter 15.8 14.0 2.63 0.538 0.132 0.0214
standard deviations (Table 1). This denotes the intuition of weight-ing the accuracy of magnetometer methods, with better reliabilityworked well. In particular, it statistically signicantly outperformsexisting sensor fusion algorithms such as Madgwick and Fouratilters. Further, we compare our displacement estimation methodagainst a simple kinematics approach where the velocity is main-tained over time, not exhibiting a velocity drift that was shown bythe kinematics method. Table 2 shows how the proposed methodoutperforms the kinematics one.
Figure 6: Example of outdoor tracking path.
Figure 6 reports an example path found by tracking a singleearable on the outdoor test, showing how our method for singleearable tracking performed very well, with a minimum averagetracking drift of around 0.15<B .
6.2 Two Earable TrackingTable 3 demonstrates how combining the data from both earablesstatistically signicantly outperforms using one earable. This dif-ference is more notable outside, likely due to the additional noise.Our results (Table 4 and Figure 7) suggest that dropping the datafrequency of one earable generally adversely impacted the displace-ment error. For indoor tests, there was a statistically signicantdierence going from 20I to 10I and 10I to 5I, however,
Table 3: Results for combining both earables when particleltering the heading.
Indoors OutdoorsFinal DisplacementError /<B1
Final DisplacementError /<B1
Average StandardDeviation Average Standard
DeviationLeft Earable 0.173 0.096 0.181 0.025Right Earable 0.135 0.081 0.170 0.082Reference Heading 0.077 0.038 0.104 0.061Both Earables 0.119 0.089 0.021 0.039
Table 4: Results for mixing timings for earables.
Indoors OutdoorsFinal DisplacementError /<B1
Final DisplacementError /<B1
Average StandardDeviation Average Standard
DeviationLeft Earable 0.173 0.096 0.226 0.025Right Earable 0.135 0.081 0.139 0.082Reference Heading 0.077 0.038 0.168 0.061Both 20Hz 0.119 0.089 0.106 0.039One 20Hz, one 10Hz 0.128 0.094 0.227 0.102One 20Hz, one 5Hz 0.156 0.081 0.204 0.049One 20Hz, one 2.5Hz 0.185 0.119 0.242 0.119
there was no dierence going from 5I to 2.5I. Additionally, theresults for 10I and 5I still performed better than one earable in-dividually. For the outdoor tests, the changes in data frequency hada less obvious eect. There was no clear trend with the reducing thesecond earable’s frequency. However, for all frequency reductions,there was a signicant negative impact. We suspect that this arosefrom an increased background noise that came from the outdoorenvironment. This noise meant that additional measurements wereimportant for tracking accuracy.
Figure 7: Tracking drift when mixing timings of earables.
7 RELATEDWORKEarable research is living a momentum [6]. In the literature earableshave been used for a number of applications ranging form head mo-tion tracking [8, 9], to inertial sensing for activity recognition [15]and step counting [24], acoustic sensing [18], and a number of mo-bile health applications. A few (non comprehensive list of) examplesare dietary habits monitoring [1–3], teeth grinding (Bruxism)/jawclenching [27] detection, body-core temperature and blood pressuremonitoring [4], in-ear photoplethysmography (PPG) [22, 23], andsleep monitoring [21]. In this work, for the rst time, we leverageearables to build an end-to-end navigation system.
There is a signicant body of related work for inertial navigation.This includes papers by Shen et al. [28], Woodman et al. [34], and

UbiComp-ISWC ’21 Adjunct, September 21–26, 2021, Virtual, USA Ashwin Ahuja, Andrea Ferlini, and Cecilia Mascolo
Kok et al. [16] who create full INS using 9-axis IMUs. There arealso signicant works which focus on specic components of theprocess, some for wearable devices. Won et al. [33], Frosio et al. [11]and Skog et al. [30] look at accelerometer calibration. For gyroscopecalibration, there is signicant work on calibration methods thatrequire precise turntables, including work by Yang et al. [35] andChen et al. [5]. Finally, for magnetometer calibration, there is workby Renaudin et al. [25]. We instead use the method dened forearables by Ferlini et al. [8]. For heading estimation, there arenumerous approaches, some of which are considered in this paper.These include methods by Madgwick et al. [19] and Fourati et al.[10]. Other prominently used methods include Mahony et al. [20]and QUEST [7]. For displacement estimation, there is previous workon methods which work well for wearables, using features of handmovement [28], and foot movement [13] to improve performance.However, to the best of our knowledge, there is no existing workwhich carries out any inertial navigation on earables.
8 FINAL REMARKSIn this work we introduce PilotEar, a novel framework for earable-based inertial navigation. PilotEar is capable of achieving a driftof as little as 0.11<B , when fusing the data coming from both ears.Our work denes an eective calibration schema, as well as pre-cise heading and displacement estimation methods. Ultimately, webelieve that PilotEar, providing acoustic feedback, could oer sig-nicant benets for navigation, particularly for visually impairedpeople.
ACKNOWLEDGMENTSThis work is supported by Nokia Bell Labs through their dona-tion for the Centre of Mobile, Wearable Systems and AugmentedIntelligence.
REFERENCES[1] Oliver Amft, Mathias Stäger, Paul Lukowicz, and Gerhard Tröster. 2005. Anal-
ysis of chewing sounds for dietary monitoring. In International Conference onUbiquitous Computing. Springer, 56–72.
[2] Abdelkareem Bedri, Richard Li, Malcolm Haynes, Raj Prateek Kosaraju, IshaanGrover, Temiloluwa Prioleau, Min Yan Beh, Mayank Goel, Thad Starner, andGregory Abowd. 2017. EarBit: using wearable sensors to detect eating episodesin unconstrained environments. Proceedings of the ACM on interactive, mobile,wearable and ubiquitous technologies 1, 3 (2017), 1–20.
[3] Shengjie Bi, Tao Wang, Nicole Tobias, Josephine Nordrum, Shang Wang, GeorgeHalvorsen, Sougata Sen, Ronald Peterson, Ko Odame, Kelly Caine, Ryan Halter,Jacob Sorber, and David Kotz. 2018. Auracle: Detecting Eating Episodes with anEar-mounted Sensor. Proceedings of the ACM on Interactive, Mobile, Wearable andUbiquitous Technologies 2, 3 (2018), 1–27. https://doi.org/10.1145/3264902
[4] Nam Bui, Nhat Pham, Jessica Jacqueline Barnitz, Zhanan Zou, Phuc Nguyen,Hoang Truong, Taeho Kim, Nicholas Farrow, Anh Nguyen, Jianliang Xiao, et al.2019. eBP: A wearable system for frequent and comfortable blood pressuremonitoring from user’s ear. In The 25th Annual International Conference on MobileComputing and Networking. 1–17.
[5] Yi Chen, Ethem Erkan Aktakka, Jong-KwanWoo, Khalil Naja, and Kenn RichardOldham. 2018. On-chip capacitive sensing and tilting motion estimation of amicro-stage for in situ MEMS gyroscope calibration. Mechatronics 56 (2018),242–253.
[6] Romit Roy Choudhury. 2021. Earable Computing: A New Area to Think About.In Proceedings of the 22nd International Workshop on Mobile Computing Systemsand Applications. 147–153.
[7] John L Crassidis, F Landis Markley, and Yang Cheng. 2007. Survey of nonlinearattitude estimation methods. Journal of guidance, control, and dynamics 30, 1(2007), 12–28.
[8] Andrea Ferlini, Alessandro Montanari, Andreas Grammenos, Robert Harle, andCecilia Mascolo. 2021. Enabling In-Ear Magnetic Sensing: Automatic and User
Transparent Magnetometer Calibration. In 2021 IEEE International Conference onPervasive Computing and Communications (PerCom). IEEE, 1–8.
[9] Andrea Ferlini, Alessandro Montanari, Cecilia Mascolo, and Robert Harle. 2019.Head motion tracking through in-ear wearables. In Proceedings of the 1st Interna-tional Workshop on Earable Computing. 8–13.
[10] Hassen Fourati. 2014. Heterogeneous data fusion algorithm for pedestrian nav-igation via foot-mounted inertial measurement unit and complementary lter.IEEE Transactions on Instrumentation and Measurement 64, 1 (2014), 221–229.
[11] Iuri Frosio, Federico Pedersini, and N Alberto Borghese. 2012. Autocalibrationof triaxial MEMS accelerometers with automatic sensor model selection. IEEESensors Journal 12, 6 (2012), 2100–2108.
[12] Andreas Grammenos, Cecilia Mascolo, and Jon Crowcroft. 2018. You are sens-ing, but are you biased? a user unaided sensor calibration approach for mobilesensing. Proceedings of the ACM on Interactive, Mobile, Wearable and UbiquitousTechnologies 2, 1 (2018), 1–26.
[13] Antonio R Jimenez, Fernando Seco, Carlos Prieto, and Jorge Guevara. 2009. Acomparison of pedestrian dead-reckoning algorithms using a low-cost MEMSIMU. In 2009 IEEE International Symposium on Intelligent Signal Processing. IEEE,37–42.
[14] Justin Kavanagh, Rod Barrett, and StevenMorrison. 2006. The role of the neck andtrunk in facilitating head stability during walking. Experimental brain research172, 4 (2006), 454.
[15] Fahim Kawsar, Chulhong Min, Akhil Mathur, and Allesandro Montanari. 2018.Earables for personal-scale behavior analytics. IEEE Pervasive Computing 17, 3(2018), 83–89.
[16] Manon Kok, Jeroen D Hol, and Thomas B Schön. 2017. Using inertial sensors forposition and orientation estimation. arXiv preprint arXiv:1704.06053 (2017).
[17] Chuanhua Lu, Hideaki Uchiyama, Diego Thomas, Atsushi Shimada, and Rin-ichiro Taniguchi. 2019. Indoor positioning system based on chest-mounted IMU.Sensors 19, 2 (2019), 420.
[18] Dong Ma, Andrea Ferlini, and Cecilia Mascolo. 2021. OESense: EmployingOcclusion Eect for In-ear Human Sensing. arXiv preprint arXiv:2106.08607(2021).
[19] Sebastian Madgwick. 2010. An ecient orientation lter for inertial and iner-tial/magnetic sensor arrays. Report x-io and University of Bristol (UK) 25 (2010),113–118.
[20] Robert Mahony, Tarek Hamel, and J-M Pimlin. 2005. Complementary lterdesign on the special orthogonal group SO (3). In Proceedings of the 44th IEEEConference on Decision and Control. IEEE, 1477–1484.
[21] Anh Nguyen, Raghda Alqurashi, Zohreh Raghebi, Farnoush Banaei-Kashani,Ann C Halbower, and Tam Vu. 2016. A lightweight and inexpensive in-earsensing system for automatic whole-night sleep stage monitoring. In Proceedingsof the 14th ACM Conference on Embedded Network Sensor Systems CD-ROM. 230–244.
[22] Stefanie Passler, Niklas Müller, and Veit Senner. 2019. In-ear pulse rate measure-ment: a valid alternative to heart rate derived from electrocardiography? Sensors19, 17 (2019), 3641.
[23] James AC Patterson, Douglas C McIlwraith, and Guang-Zhong Yang. 2009. Aexible, low noise reective PPG sensor platform for ear-worn heart rate mon-itoring. In 2009 sixth international workshop on wearable and implantable bodysensor networks. IEEE, 286–291.
[24] Jay Prakash, Zhijian Yang, Yu-LinWei, and Romit Roy Choudhury. 2019. Stear: Ro-bust step counting from earables. In Proceedings of the 1st International Workshopon Earable Computing. 36–41.
[25] Valérie Renaudin, Muhammad Haris Afzal, and Gérard Lachapelle. 2010. Com-plete triaxis magnetometer calibration in the magnetic domain. Journal of sensors2010 (2010).
[26] Brent A Renfro, Miquela Stein, Nicholas Boeker, and Audric Terry. 2018. Ananalysis of global positioning system (GPS) standard positioning service (SPS)performance for 2017. See https://www. gps. gov/systems/gps/performance/2014-GPS-SPS-performance-analysis. pdf (2018).
[27] Siddharth Rupavatharam and Marco Gruteser. 2019. Towards in-ear inertial jawclenching detection. In Proceedings of the 1st International Workshop on EarableComputing. 54–55.
[28] Sheng Shen, Mahanth Gowda, and Romit Roy Choudhury. 2018. Closing thegaps in inertial motion tracking. In Proceedings of the 24th Annual InternationalConference on Mobile Computing and Networking. 429–444.
[29] Martin Sipos, Pavel Paces, Jan Rohac, and Petr Novacek. 2011. Analyses oftriaxial accelerometer calibration algorithms. IEEE Sensors Journal 12, 5 (2011),1157–1165.
[30] Isaac Skog and Peter Händel. 2006. Calibration of a MEMS inertial measurementunit. In XVII IMEKO world congress. Citeseer, 1–6.
[31] Joan Sola. 2017. Quaternion kinematics for the error-state Kalman lter. arXivpreprint arXiv:1711.02508 (2017).
[32] JL Weston and DH Titterton. 2000. Modern inertial navigation technology andits application. Electronics & Communication Engineering Journal 12, 2 (2000),49–64.

PilotEar: Enabling In-ear Inertial Navigation UbiComp-ISWC ’21 Adjunct, September 21–26, 2021, Virtual, USA
[33] Seong-hoon Peter Won and Farid Golnaraghi. 2009. A triaxial accelerometer cali-bration method using a mathematical model. IEEE transactions on instrumentationand measurement 59, 8 (2009), 2144–2153.
[34] Oliver J Woodman. 2007. An introduction to inertial navigation. Technical Report.University of Cambridge, Computer Laboratory.
[35] Haotian Yang, Bin Zhou, Lixin Wang, Haifeng Xing, and Rong Zhang. 2018. Anovel tri-axial MEMS gyroscope calibration method over a full temperature range.Sensors 18, 9 (2018), 3004.
[36] AS Zaidi and MR Suddle. 2006. Global navigation satellite systems: a survey. In2006 international conference on advances in space technologies. IEEE, 84–87.