detail project report of micro watershed project under
409
DETAIL PROJECT REPORT OF MICRO WATERSHED PROJECT UNDER INTEGRATED WATERSHED MANAGEMENT PROGRAMME (IWMP BULANDSHAHAR – II) BLOCK – PAHASU, DISTT – BULANDSHAHAR (U.P.) LAND DEVELOPMENT AND WATER RESOURCES DEPTT. (U.P.) Prepared by : PIA – Bhoomi Sanrakshan Adhikari LDWR – Khurja (Bulandshahar) U.P.
-
Upload
khangminh22 -
Category
Documents
-
view
5 -
download
0
Transcript of detail project report of micro watershed project under
DETAIL PROJECT REPORT OF MICRO WATERSHED PROJECT
UNDER
INTEGRATED WATERSHED MANAGEMENT
PROGRAMME
(IWMP BULANDSHAHAR – II)
BLOCK – PAHASU, DISTT – BULANDSHAHAR (U.P.)
LAND DEVELOPMENT AND WATER RESOURCES DEPTT. (U.P.)
Prepared by :
PIA – Bhoomi Sanrakshan Adhikari LDWR – Khurja (Bulandshahar) U.P.

2
CERTIFICATE
This is to be certified that the proposed all micro-watersheds of IWMP-II distt.
Bulandshahar, Uttar Pradesh has been selected for its sustainable development on watershed
basis under Integrated Watershed Management Programme. The land is physically available for
proposed interventions and is not overlapping with any other schemes. It will be developed as
per Common Guidelines for Watershed Development Project-2008, GOI, New Delhi.
The significant results will be achieved through proposed interventions on soil and water
conservation, ground water recharge, availability of drinking and irrigation water, agricultural
production systems, live stock, fodder availability, livelihoods of asset less, capacity building,
etc. The proposed Detailed Project Report of all micro-watershed of IWMP-II, Khurja,
Bulandshahar is approved for its implementation.
Soil Conservation Officer Dept. of LDWR, Khurja, Bulandshahar
Deputy Director LDWR, Meerut, UP
Project Director
DRDA, Bulandshahar, UP
Chief Development Officer
Distt.- Bulandshahar, UP

3
TABLE OF CONTENT
CHAPTER CONTENT PAGE NO.
1 EXECUTIVE SUMMARY 5
2 INTRODUCTION AND
BACKGROUND
6-7
3 YEAR WISE PHYSICAL AND
FINANCIAL PHASING
8
4 PROJECT AT A GLANCE 10
5 MICROWATER SHED WISE BASELINE
SURVEY & DETAIL PROJECT REPORT
11-405
6 MAPS & PHOTOGRAPHS 406-416
7 DETAIL ESTIMATE 417-433
8 EXPECTED OUTCOME 434

4
PROJECT AT A GLANCE
IWMP-II (Bulandshahar)
1 State Uttar Pradesh
2 Distt. Bulandshahar
3 Block Pahasu
4 M.W.S. Code 2B3E3c3f, 2B3E4d3e,
2B3E4d3d, 2B3E3c3e,
2B3E3c3d, 2B3E4d3c,
2B3E3c3c, 2B3E3c3b,
2B3E3c2e
5 Name of M.W.S. Project Dalpatpur, Utrawali, N.
Amarpur, Khandar, Urdami,
Surjawali, Pahasu, Nagalia
Laxmanpur, Vedrampur
6 Involved Village 33
7 Geographical Area of M.W.S. 5900 Ha.
8 Rainfed Area 5550
9 Treatable Area 5275
10 Weightage 77.50
11 Cost of Project 633.00
12 For the year 2010-11
Budget Components
S. No. Components Area
(Ha.)
Cost
(in Lacs)
1 2 3 4
1 Management Cost 12% - 75.96
2 Preparatory Phase 10% - 63.30
3 Watershed Work Phase -
A- Watershed Development Works 50% 5275 316.50
B- Livelihood Programme (Community Base) 10% - 63.30
C- Production System & Micro Enterprises13% - 82.29
4 Consolidation Phase 5% - 31.65
Total 575 633.00

5
Executive Summary of the Project
Identified selected micro watershed project Dalpatpur, Utrawali, N. Amarpur,
Khandar, Urdami, Surjawali, Pahasu, Nagalia Laxmanpur, Vedrampur is coded as 2B3E3c3f,
2B3E4d3e, 2B3E4d3d, 2B3E3c3e, 2B3E3c3d, 2B3E4d3c, 2B3E3c3c, 2B3E3c3b, 2B3E3c2e has
been proposed from cluster of I.W.M.P. Bulandshahar – II project in Pahasu Block district
Bulandshahar in the micro watershed which is located in the east of district Bulandshahar on the
east bank of River Kali Nadi and upper kali border. It lies between 280 -15’ and 15
0 E Latitudes
and 780 -E and 78
0 -5 N Longitudes Covering area. Its altitudes ranges from 187 meter to 190
meter above the mean sea level. Khurja Railway Station 184.11 m, Bulandshahar Railway
station is 201.18 m above mean sea level is displayed. Project area of I.W.M.P. BSR-II is lied in
the Pahasu Block of Bulandshahar District which is come in the western plan zone under semi
arid area. The annual average rainfall is near to 397 mm which an average of 35 rainy days. Out
of which about 85% is received during the mansoon season from July to September and very
less rainfall is received in the winter season.
Temperature ranges from as high as 420C in the May-June to as 3
0-4
0C during December
– January. The Trend of rain fall is highly eratic and maximum water goes as runoff.
Main occupation of the dwellers is agriculture in the watershed. Some part of the lands
are shown during the Kharif season. Cane sugar are preferred crops in the project area. The main
Crops raised are Wheat, Pea & Mustered and maze.
The topmost portion of the watershed is sloppy flat land. Other than topmost portion of
the watershed is under soil erotic portion and depreciative. The soil of the land are sandy loam
Soil. The middle agricultural position of watershed relatively smooth sloppy flat land with sandy
loam soil texture. These soil is yellow in colour and are inherently good in fertility status.
Natural vegetation of the watershed is very poor. Somewhere forest vegetation is seen
which are predominant with Vilayati Babool (Prosopis Juliflora), followed by Babool (Accasia
nilotica), somewhere Neem Plants (Azadirachta Indica), Shisham (Dolbergia Sisson) and Karanj
(Pongamia Glabra) are seen in occasional occurrence. There is no grass land in the watershed.
Somewhere grass patches are seen only on the bunds, road sides and other such places.
Coverage of massive green belt is in poor percentage for environment which is envisaged. That
watershed is very poor climate area.
There is normal condition of animal physics and for their fodder arrangement is the
watershed and creative possibility would be expected by the implementations of the project.
6
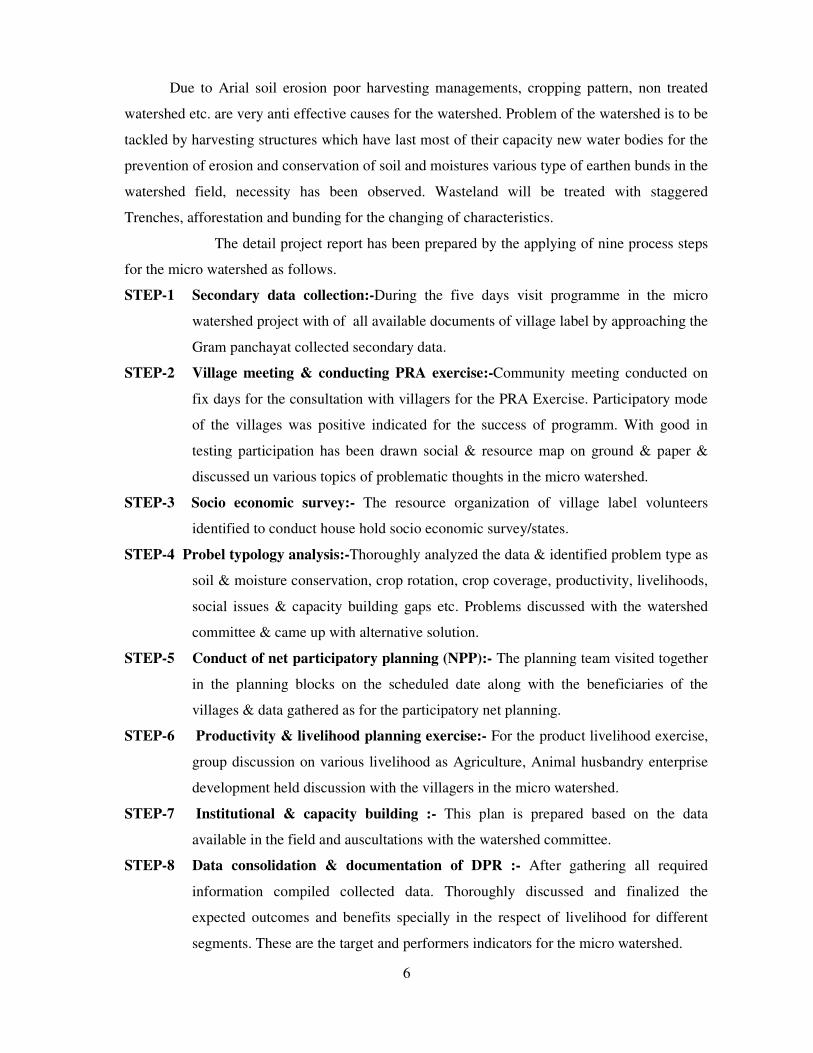
Due to Arial soil erosion poor harvesting managements, cropping pattern, non treated
watershed etc. are very anti effective causes for the watershed. Problem of the watershed is to be
tackled by harvesting structures which have last most of their capacity new water bodies for the
prevention of erosion and conservation of soil and moistures various type of earthen bunds in the
watershed field, necessity has been observed. Wasteland will be treated with staggered
Trenches, afforestation and bunding for the changing of characteristics.
The detail project report has been prepared by the applying of nine process steps
for the micro watershed as follows.
STEP-1 Secondary data collection:-During the five days visit programme in the micro
watershed project with of all available documents of village label by approaching the
Gram panchayat collected secondary data.
STEP-2 Village meeting & conducting PRA exercise:-Community meeting conducted on
fix days for the consultation with villagers for the PRA Exercise. Participatory mode
of the villages was positive indicated for the success of programm. With good in
testing participation has been drawn social & resource map on ground & paper &
discussed un various topics of problematic thoughts in the micro watershed.
STEP-3 Socio economic survey:- The resource organization of village label volunteers
identified to conduct house hold socio economic survey/states.
STEP-4 Probel typology analysis:-Thoroughly analyzed the data & identified problem type as
soil & moisture conservation, crop rotation, crop coverage, productivity, livelihoods,
social issues & capacity building gaps etc. Problems discussed with the watershed
committee & came up with alternative solution.
STEP-5 Conduct of net participatory planning (NPP):- The planning team visited together
in the planning blocks on the scheduled date along with the beneficiaries of the
villages & data gathered as for the participatory net planning.
STEP-6 Productivity & livelihood planning exercise:- For the product livelihood exercise,
group discussion on various livelihood as Agriculture, Animal husbandry enterprise
development held discussion with the villagers in the micro watershed.
STEP-7 Institutional & capacity building :- This plan is prepared based on the data
available in the field and auscultations with the watershed committee.
STEP-8 Data consolidation & documentation of DPR :- After gathering all required
information compiled collected data. Thoroughly discussed and finalized the
expected outcomes and benefits specially in the respect of livelihood for different
segments. These are the target and performers indicators for the micro watershed.

7
STEP-9 Conduct of Gram Sabha obtaining approvals submissions of DPR.:-After
preparation of the draft DPR convened to Gram sabha and activities proposed
expected outcomes benefits of implementing the programm are explained in case of
any changes are proposed in the Gram sabha approval obtained by the Gram sabha
and already singed of Mau paper.
STEP-9A Attachment of detail estimate, cost and design:-Estimating, Costing and design
prepared technically According to plan in the micro watershed project. And attached
with the DPR.
STEP-9B Various type of mapping :- DPR prepared in the support of micro watershed project
using various type of maps is as follows :
1.Index Map of Watershed 2. Watershed Map
3. Relief/ Drainage Map 4. Slop Map
5.Soil and Land Capability class map 6. Land use/ Land Cover Map
7. Cadastral map 8. Proposed Action Plan map
9. Social Map

8
Consolidation of Components : for the Nine Micro watershed Phasing IWMP- II (2010-11) DISTRICT- BULANDSHAHAR
YEAR WISE PHASING OF IWMP WORKS
Area – Ha & Rs.in Lac
Sl. No
Particulars
1st year
(2010-11) 2
st year
(2011-12) 3
st year
(2012-13) 4
st year
(2013-14) 5
st year
(2014-15) Total
Fin. Phy
. Fin.
Phy.
Fin. Phy
. Fin. Phy. Fin.
Phy.
Fin. Phy
.
1 Administrative cost 10% 12.66 - 12.66 - 12.66 - 12.66 -
12.66
- 63.30 -
2 Monitoring 1%
1.90 - 1.90 - 2.53 - - - - - 6.33 -
3 Evaluation 1%
- - 3.165 - - - 3.165 - - - 6.33 -
4 Entry point activity 4%
25.32 - - - - - - - - - 25.32 -
5 Institution & capacity building 5%
12.66 - 12.66 - 6.33 - - - - - 31.65 -
6 DPR 1% 6.33 - - - - - - - - - 6.33 -
7 Watershed Dev.Works 50%
23.7375
396 79.12
5 131
9 110.77
5 184
6 102.862
5 `171
4 - -
316.50
5275
8 Livelihood activities 10%
6.33 - 12.66 - 18.99 - 25.32 - - - 63.30 -
9 Production System & micro Enterprises 13%
6.33 - 12.66 - 25.32 - 25.32 - 12.6
6 - 82.29 -
10 Consolidation phase 5% - - - - - - - -
31.65
- 31.65 -
11 TOTAL 100%
95.2675
396 134.8
3 131
9 176.60
5 184
6 169.327
5 1714
56.97
- 633.0
0 5275

9
MICROWATER SHED WISE
BASELINE SURVEY & DETAIL
PROJECT REPORT

10
PROJECT AT A GLANCE
IWMP-II (Bulandshahar)
1 State Uttar Pradesh
2 Distt. Bulandshahar
3 Block Pahasu
4 M.W.S. Code 2B3E3c3f
5 Name of M.W.S. Project Dalpatpur
6 Involved Village 04
7 Geographical Area of M.W.S. 574
8 Rainfed Area 487.00
9 Treatable Area 510
10 Weightage
11 Cost of Project 61.200
12 For the year 2010-11
Budget Components
S. No. Components Area
(Ha.)
Cost
(in Lacs)
1 2 3 4
1 Management Cost 12% - 7.344
2 Preparatory Phase 10% - 6.120
3 Watershed Work Phase - -
A- Watershed Development Works 50% 510 30.600
B- Livelihood Programme (Community Base) 10% - 6.120
C- Production System & Micro Enterprises13% - 7.956
4 Consolidation Phase 5% - 3.060
Total 510 61.200

11
Executive Summary of the Project
Identified selected micro watershed project Nagla Dalpatpur is coded as 2B3E3c3f
has been proposed from cluster of I.W.M.P. Bulandshahar – I project in Pahasu Block district
Bulandshahar four villages namely Ranayach Narendrapur, Nagla Dalpatpur, Rampur and Kado is
comprised in the micro watershed which is located in the east of district Bulandshahar on the east
bank of River Kali Nadi and upper kali border. It lies between 280 -15’ and 15
0 E Latitudes and
780 -E and 78
0 -5 N Longitudes Covering area. Its altitudes ranges from 187 meter to 190 meter
above the mean sea level. Khurja Railway Station 184.11 m, Bulandshahar Railway station is
201.18 m above mean sea level is displayed. Project area of I.W.M.P. BSR-II is lied in the Pahasu
Block of Bulandshahar District which is come in the western plan zone under semi arid area. The
annual average rainfall is near to 397 mm which an average of 35 rainy days. Out of which about
85% is received during the mansoon season from July to September and very less rainfall is
received in the winter season.
Temperature ranges from as high as 420C in the May-June to as 3
0-4
0C during December –
January. The Trend of rain fall is highly eratic and maximum water goes as runoff.
Main occupation of the dwellers is agriculture in the watershed. Some part of the lands are
shown during the Kharif season. Cane sugar are preferred crops in the project area. The main
Crops raised are Wheat, Pea & Mustered and maze.
The topmost portion of the watershed is sloppy flat land. Other than topmost portion of the
watershed is under soil erotic portion and depreciative. The soil of the land are sandy loam Soil.
The middle agricultural position of watershed relatively smooth sloppy flat land with sandy loam
soil texture. These soil is yellow in colour and are inherently good in fertility status.
Natural vegetation of the watershed is very poor. Somewhere forest vegetation is seen
which are predominant with Vilayati Babool (Prosopis Juliflora), followed by Babool (Accasia
nilotica), somewhere Neem Plants (Azadirachta Indica), Shisham (Dolbergia Sisson) and Karanj
(Pongamia Glabra) are seen in occasional occurrence. There is no grass land in the watershed.
Somewhere grass patches are seen only on the bunds, road sides and other such places. Coverage
of massive green belt is in poor percentage for environment which is envisaged. That watershed is
very poor climate area.
There is normal condition of animal physics and for their fodder arrangement is the
watershed and creative possibility would be expected by the implementations of the project.
Due to Arial soil erosion poor harvesting managements, cropping pattern, non treated
watershed etc. are very anti effective causes for the watershed. Problem of the watershed is to be

12
tackled by harvesting structures which have last most of their capacity new water bodies for the
prevention of erosion and conservation of soil and moistures various type of earthen bunds in the
watershed field, necessity has been observed. Wasteland will be treated with staggered Trenches,
afforestation and bunding for the changing of characteristics.
The detail project report has been prepared by the applying of nine process steps
for the micro watershed code no. 2B3E3c3f brief is as follows.
STEP-1 Secondory data collection:-During the five days visit programme in the micro
watershed project with of all available documents of village label by approaching the
Gram panchayat collected secondary data.
STEP-2 Village meeting & conducting PRA exercise:-Community meeting conducted on fix
days for the consultation with villagers for the PRA Exercise. Participatory mode of
the villages was positive indicated for the success of programm. With good in testing
participation has been drawn social & resource map on ground & paper & discussed
un various topics of problematic thoughts in the micro watershed.
STEP-3 Socio economic survey:- The resource organization of village label volunteers
identified to conduct house hold socio economic survey/states.
STEP-4 Probel typology analysis:-Thoroughly analyzed the data & identified problem type as
soil & moisture conservation, crop rotation, crop coverage, productivity, livelihoods,
social issues & capacity building gaps etc. Problems discussed with the watershed
committee & came up with alternative solution.
STEP-5 Conduct of net participatory planning (NPP):- The planning team visited together
in the planning blocks on the scheduled date along with the beneficiaries of the
villages & data gathered as for the participatory net planning.
STEP-6 Productivity & livelihood planning exercise:- For the product livelihood exercise,
group discussion on various livelihood as Agriculture, Animal husbandry enterprise
development held discussion with the villagers in the micro watershed.
STEP-7 Institutional & capacity building :- This plan is prepared based on the data
available in the field and auscultations with the watershed committee.
STEP-8 Data consolidation & documentation of DPR :- After gathering all required
information compiled collected data. Thoroughly discussed and finalized the expected
outcomes and benefits specially in the respect of livelihood for different segments.
These are the target and performers indicators for the micro watershed.
STEP-9 Conduct of Gram Sabha obtaining approvals submissions of DPR.:-After
preparation of the draft DPR convened to Gram sabha and activities proposed expected

13
outcomes benefits of implementing the programm are explained in case of any changes
are proposed in the Gram sabha approval obtained by the Gram sabha and already
singed of Mau paper.
STEP-9A Attachment of detail estimate, cost and design:-Estimating, Costing and design
prepared technically According to plan in the micro watershed project. And attached
with the DPR.
STEP-9B Various type of mapping :- DPR prepared in the support of micro watershed
project using various type of maps is as follows :
1.Index Map of Watershed 2. Watershed Map
3. Relief/ Drainage Map 4. Slop Map
5.Soil and Land Capability class map 6. Land use/ Land Cover Map
7. Cadastral map 8. Proposed Action Plan map
9. Social Map

14
Project Report
Table – 1 : Micro watershed project brief : -
1 State U.P.
2 District Bulandshahar
3 Block Pahasu
4 Comprised Villages (Nos.) 04
5 Name of Watershed Nagla Dalpatpur
6 Name of MWS Project Nagla Dalpatpur
7 MWS Code No. 2B3E3c3f
8 Geographical Area of MWS 574.00
9 Treatable Area 510
1- Project Objectives :- The aim and objectives of the Project are :
a- Conservation, development and sustainable management of natural resources including
their users.
b- Enhancement of agriculture production and productivity in a sustainable manner.
c- Restoration of ecological balance in the degraded and fragile rain fed ecosystem.
d- Reduction in regional disparity between rains fed and irrigated area.
e- Creation of sustainable employment opportunities for the rural community for
livelihood security.
f- Generation of massive employment.
g- Reduce migration from rural employment.
2- Mazor Problem of Project Area :
a- Actual shortage of drinking water.
b- Near to nil activated water bodies and water harvesting structures.
c- Low depth of ground water table.
d- Undulated and generally sloppy rainfed area.
e- Large number of Small, Marginal and S.C. farmer land holding.
f- Lower wages of agriculture lobour and also migration of lobour due to shortage of
employment in the watershed.

15
3- General Description :
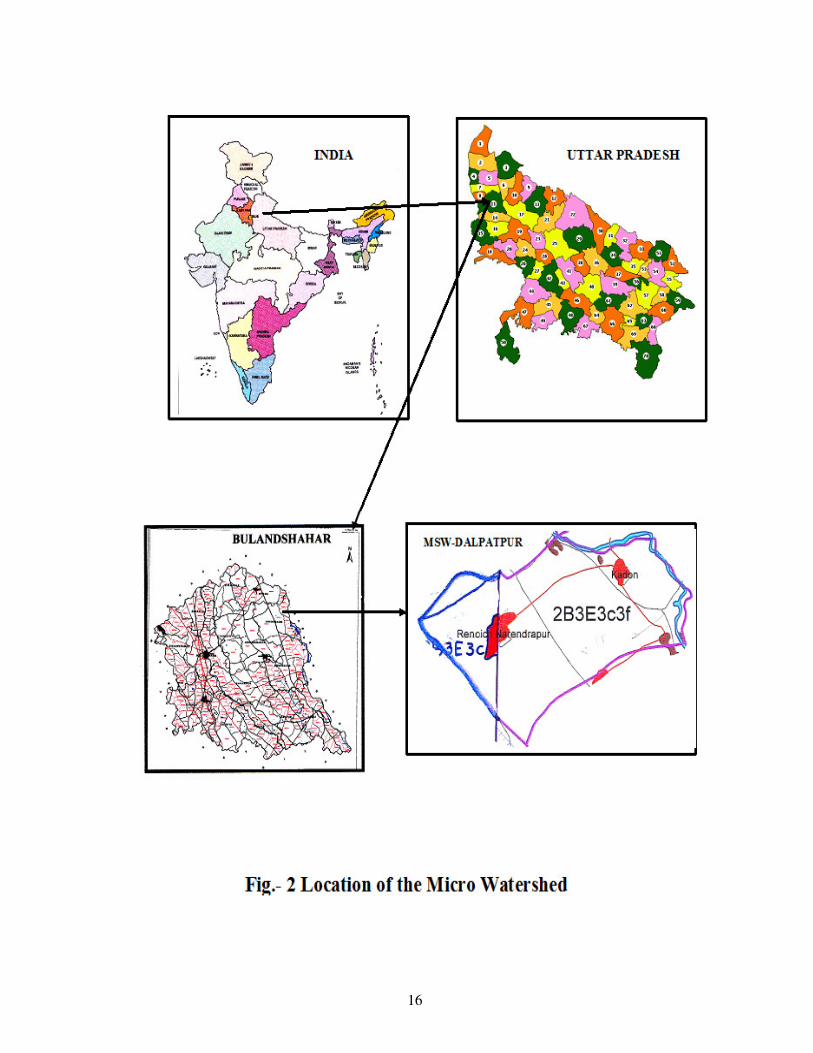
(3.1) Location :-
Nagla Dalpatpur Watershed has been taken with MWS Code No. 2B3E3c3f
in Pahasu Block of Distt. Bulandshahar is located on Bulandshahar via Khurja to
Shikarpur Via Pahasu road about 30 Km. between 28015’ and 28
0 E Latitudes and
7800’ and 78
05’ N Longitudes. Location and delineation of watershed has been
located on watershed map Fig. 2 and on top sheet Fig. 3.
(3.2) Area and Elevation :
Elevation ranges from 181 to 208 mtr. above the mean sea level(MSL)
altogether comprised villages and their’s area is described as follows. (Comprises
village map Fig. 3)
Table – 2 : Area and Elevation
Sl.
No.
MWS
Code
Block Name of
Village
Geographical
Area
Treatable
Area
1 2 3 4 5 6
1 2B3E3c3f Pahasu Nagla Dalpatpur 95.00 58.00
Ranayach
Narendrapur 241.85 235.00
Kado 210.15 208.00
Rampur 27.00 9.00
574 510
(3.3) Shape of the Micro Watershed:
The shape of watershed is Elongated and as Rectangular. The maximum
length and width of the watershed are 5000 Mtr. and 1814 Mtr. respectively with
the Length: Width ratio of 2.76:1.
Fig. 1 (Shape of Micro Watershed)
16

17

18
(3.4) Climate :
The Watershed falls under ………………. semi arid region of tropical climate
inclined in Western Plan Zone. The average annual precipitation is about approx. is 397
mm. spreading over 35 rainy days. Most of the rain fall (about 85%) is received during
July to September. The rain fall of moderate intensity. Nothing the area receives of
scarcity rainfall in the winter season. The temperator variation ranges from as high as 430c
in the month of May-June to as low as 40c in December-January.
(3.5) Geomorphology and Soils :
Geomorphology :
The entire watershed is topographically divided into major landforms. Accordingly
the soils of watershed can be grouped into various categories such plane land, undulated
land, sloppy land and erosic ravenous land.
Sl.
No.
Name
of
Project
Name of Village Geograph
ical Area
(in ha.)
Raifed
Area
(in ha.)
Treatable
Area
Agri. Land
1 2 3 4 5 6 7
1
Dal
pat
pu
r
Nagla Dalpatpur 95.00 80.75 58.00 80.75
2 Ranayach
Narendrapur 241.85 205.00 235.00 205.57
3 Kado 210.15 188.50 208.00 178.62
4 Rampur 27.00 12.75 9.00 22.95
Total 574.00 487.00 510 487.89

19
Soil :
(a) Fine textured soil :
The soil are the most extensive soil group found in the watershed. Some portion of
the watershed is relatively sloppy flat land with fine soil texture as sandy sandy lome. The
soils are in color and are inherently good high in fertility status. Soil texture is sandy lome
loam particularly in depressions and loam in the elevated portion. The soil characteristic
texture is dispersive and smooth. Therefore without imped the downward movement of
water productive layer of soil are easily by high runoff.
a- Coarsed Textured Soil :
These soil are lying mostly in downward portion, along with erosic gully and
drainage line upto end of watershed outlet. These soils are coarser in texture and are
relatively poor in fertility status. The soils are lomy sand in texture. Rill and gully
formation in same parts particularly near the outlet of watershed can be seen.
(3.6) Drainage and Slope:
Due to prevalence of mild steep slope and presence of a number of drainage lines
in the watershed the drainage system is adequate. The watershed from part of Ganga Basin
and watershed. Under mild to steep topographical slope of MWS as divided as follow :
(Drainage and slope map fig.-4)
Table - 4 : Drainage and Slope
S. No. Grade Slope Percent Area in Ha. Remark
1 A 0-0.5 105 -
2 B 05-1 189 -
3 C 1-2 145 -
4 D 2-3 75 -
5 E 3-4 - -
6 F 4-5 - -
7 G 5-6 - -
514 -

20
Fig-4 (Drainage & Scrub Map)
(3.7) Vegetation :
a- Natural Vegetation :
Natural vegetation is very poor in the watershed. The forest vegetation is
predominant with Vilayti Babool (Prosopis Juliflora). There are occasional occurrence of
Neem Plants (Azadirochta Indica), Shisham (Dalbergia Sissoo) and Karanj (Pangamia
Glabra) and anywhere some scrubs are seen. There are no grass land in the watershed.
Somewhere grass patches are seen only on the bunds, roadside and other such places. Poor
percentage of massive green trees has been not seen in the watershed except Horticulture
backyard.
b- Horticulture :
There is no backyards or commercial horticulture plantation in villages are been in
some part of watershed.
c- Agroforestry :
The agriculture fields of the villages have some horticulture plantation at places
isolated trees whose frequency is seen as under agroforestry and some where in where in
backyards.

21
(3.8) Human Population:
a- Human Population:
Total Population of involved villages in watershed is 8936 with average family
size of six persons as delaled as follows
Table – 5 : Human Population
S.
No.
Name of village Nos. of
families
Human Population Total
Male Female Children
1 Nagla Dalpatpur 155 662 526 238 1426
2 Ranayach
Narendrapur 92 1083 984 485 2552
3 Kado 207 599 472 271 1342
4 Rampur 304 1072 967 395 2434
758 3416 2949 1389 7754
b- Categorization of Human Population :
In the total population of watershed villages, categories are defined as below :
Table – 6 : Population Categories
S.
No.
Particulars Unit
Number of families in population
in the villages
Population Family Remark
1 2 3 4 5 6
1 Agri Farmer No. 1185 392
2 Landless No. 115 40
3 Agri. Labour No. 190 64
4 Land less Labour No. 280 52
5 BPL Family No. 297 65
6 SC Family No. 485 81
7 ST Family No. - -

22
(3.9) Land Holding :
All the categories of farmers as small, marginal, medium and large are involved in
land holding average of about 1-18 ha. Small land holding farmers are further scattered at
different places which makes cultivation very difficult. Distribution of term families
according to the size of the land holdings are given as below :
Table – 7 : Distribution of farm families according to their size of land holdings
S.
No.
Name of Village Total
Agri.
Land in
MWS
Land Holding Family (Nos.) Percentage
Marginal
(< - 1Ha.)
Small
(1–2
Ha.)
Medium
(2-4 Ha.)
Large
(4-7
Ha.)
Total
1 Nagla Dalpatpur 68 30 4 - 102
2 Ranayach
Narendrapur
181 85 23 2 291
3 Kado 78 12 5 - 95
4 Rampur 10 5 - - 15
Total 337 132 32 2 503
(3.10) Live Stock Population :
Total live stock population of the watershed is 3848 Nos. Buffalos is preferred as
mulch animal compared to Cow. But milk yield is poor. Goats are also kept for milk as
well as for meat purpose. The breakup of livestock population is as follows :

23
Table – 8 : Live Stock Position
S.
No.
Name of
Village
Unit Live Stock Position Total
Buffaloes Cows Bullocks Goats
1 Nagla Dalpatpur 540 190 46 29 805
2 Ranayach
Narendrapur
486 258 34 204 982
3 Kado 703 264 17 - 984
4 Rampur 805 209 30 80 1124
Total 2534 921 127 313 3895
(3.11) Infrastructure Social Feature :
a- Comprised villages in the micro watershed has moderate communication
facilities. Watershed linked with metaled road and approachable through
motarable road.
b- All the villages are electrified and have T.V. and Telephone connection.
c- Literacy rate in the watershed is very low all villages are having education upto
Junior High School.
d- Nearest small market is at Sayana 13 Km. Nearest big market Bulandshahar is
about 55 Km. from watershed. Religious and ritual features are almost common
as in other parts af U.P. small land holding with large family size and more
than 25% of the labour force of the total population living below poverty line
indicate poor socio economic status of the watershed community.

24
Participatory Rural Appraisal
Participatory mode of the villagers shows positive indication for the success of the
programme. Traditionally the entire village community participate in the individual works. Social
map of one of the watershed village drawn by villagers themselves, depicting various village
figures is shown in sketched map in Fig.-4 & 5. Infrastructures position of the village recorded as
follows :
Table – 9 : MW.S. Project – Dalpatpur
S.
No.
Infrastructure Unit Qty.
1 2 3 4
1 Primary School No. 1
2 Junior High School No. 1
3 Kanya Pathshala No. -
4 Public Health Center No. -
5 Vet nary Hospital No. -
6 Panchayat Ghar No. 1
7 Post Office No. -
8 Agan Bari Center No. 1
9 Electricity - Yes
10 Road - No
11 Pond No. 1
12 Hand Pump No. 41
13 Irrigation Well No. 2
14 Canal No. -
15 Temple No. 4
16 Well (Drinking Water) No. 4
17 Pumping Set No. 98
18 Toilet No. 21
19 Market No. No

25
SOCIAL MAP

26
Recorded importance of development institution
Farmers perception recorded for importance and role of different
development institution in relation to infrastructure. Importance has been depicted with
size of circle and role with distance from village circle. (Fig 8)
Fig. -8 (Venn diagram of Micro watershed)
(3.12) Communication :
Watershed can approached from Distt Headquarter Bulandshahar to Project area
35 km. by Road.
(3.13) Natural Resource Base :
Transact of watershed showed typical land use profile consisting of plain
agriculture land, erosic area and medium ravenous ridge. Main source of the irrigation are
the canal for pre showing irrigation only. The total geographical area of the watershed is
574.00 Ha. classification.
Approach roads for the micro watershed is shown for the communication is shown
on topo sheet map Fig 9 as next page.
DALPAT
PUR

27
Fig.- 7 Communication Map on Toposheet
Table – 10 : Classification of area(Hect.)
S.N
o.
Name of
Village
Unit Total
Geographical
Area
Rainfed
Area
Wasteland Village
Land
and
Road
Irrigation Resource
Water
Bodies
Borewell
1 2 3 4 5 6 7 8 9
1 Nagla
Dalpatpur Ha. 95.00 80.75 11.12 3.09 - 32.26
2 Ranayach
Narendrapur Ha. 241.85 205.00 16.24 7.26 - 48.96
3 Kado Ha. 210.15 188.50 9.06 2.21 - 16.17
Rampur 27.00 12.75 1.02 .50 - 2.15
Total 574.00 487 37.44 13.06 99.54

28
(3.14) Livelihood :
Total Population of the watershed is 8936 and out of the total population a majority
more than 80% has farming as their major source of livelihood followed by labours,
serviceman and small business class. Classified livelihood given in form as fallows :
Table – 11 : Livelihood Classification in population :
S.
No.
Name of Village Farmer Labour In Service In Local
small
business
Others
1 2 3 4 5 6 7
1. Nagla Dalpatpur 102 104 85 8
2. Ranayach
Narendrapur 240 136 29 16
3. Kado 108 105 38 14
4. Rampur 15 240 26 25
Total 465 585 178 63
(3.15) Dependency of forest fuel wood and fodder :
a. Fuel wood :- The main source of fuel is from cow dung cake, woody stem of
crops. About 70% of the climactic energy requirement is met from the agriculture
by product and cow dung cake. Rest is met out from the forest outside the village
and watershed boundary, most preferred fuel wood is Juliflora fuel wood Juliflora
obtained from standing along and between watershed.
b- Fodder :- Villages have not any sufficient signified dependency on forest based
fodder as these resource are nothing availability in the forest.

29
(3.16) Labour requirement :
Labour requirements was found to be maximum at the time of October, November
and December when the sawing of Rabi crops are done. The crucial periods are March and
April coinciding harvesting and threshing of Rabi crops and July/August is sowing Kharif
Crops take a little place. Other income generating enterprises having potential during the
remaining.
(3.17) Crop Rotation :
Present Crop rotation in the watershed comprise of :
Kharif - Bajra - Rare
Maize - Rare
Jwar - Rare
Rabi - Fallow Wheat - Major
Fallow Barly - Major
Fallow Sugarcane - Major
Fallow Mustard - Major
Zayad - Urad, Moong, Makka
The above said Rabi Crops is the most prevailing crop rotation on the agriculture
lands both in the rainfed and irrigated conditions.
Organized vegetable cultivation fruit plantation and traditional agro forestry
systems are lacking as per requirement in the watershed the limited vegetable cultivation
in the watershed is confined as kitchen gardens and field to the irrigated condition in a
scattered manner. The cultivation of cash crops other than the sugarcane, wheat and
mustard also in the watershed.
(3.18) Historical Events :
Chronological record of important events of the watershed village is prepared
through participatory rural appraisal (PRA) which is very useful in understanding of its
background and chronology is given as follows :

30
Table – 12 : Historical Events
S.
No.
Events/Activities Year Rem.
1 2 3 4
1 Established 1651
2 Opening of Primary School 1971
3 Opening of Junior School 2003
4 Opening of Kanya Pathshala -
5 Opening of PHC -
6 Opening of Vet. Hospital -
7 Panchayat Ghar 2005
8 Introduction of Tractor 1981
9 Gobar Gas Plant -
10 Thresher 1985
11 First Tube well/Pumpset 1982
12 First Motorcycle 1986
13 T.V. & D.V.D. Players 1994
14 Electricity in Village 1997
15 Bituminous Road 2003
16 First Hand Pump 1963
17 Templo Renovation 1997
18 First Land Line Telephone 2002
19 Planning for Watershed Project 2010-11
(3.19) Present Land Use in the Watershed :-
The watershed has diversified land uses. The varied present land use under
different use in the watershed. The mixed land use followed in the watershed is almost
similar in other parts of U.P. During P.R.A. Exercise prepared land has been shown in
Table No. 13, 14 & 15.
Table – 13 : (Ownership) S.
No.
Name of Village Pvt. Agri. Land Govt.
Revenu
Land
Forest
Land
Other
Land S.C./S.T. Others
1 2 3 4 5 6 7
1 Nagla Dalpatpur 17 65 - - 11.68
2 Ranayach
Narendrapur
36 204 6.366 - 26.745
3 Kado 5 26 - - 15.434
4 Rampur 2 10 - - 3.00
Total 60 305 6.366 - 56.859
31
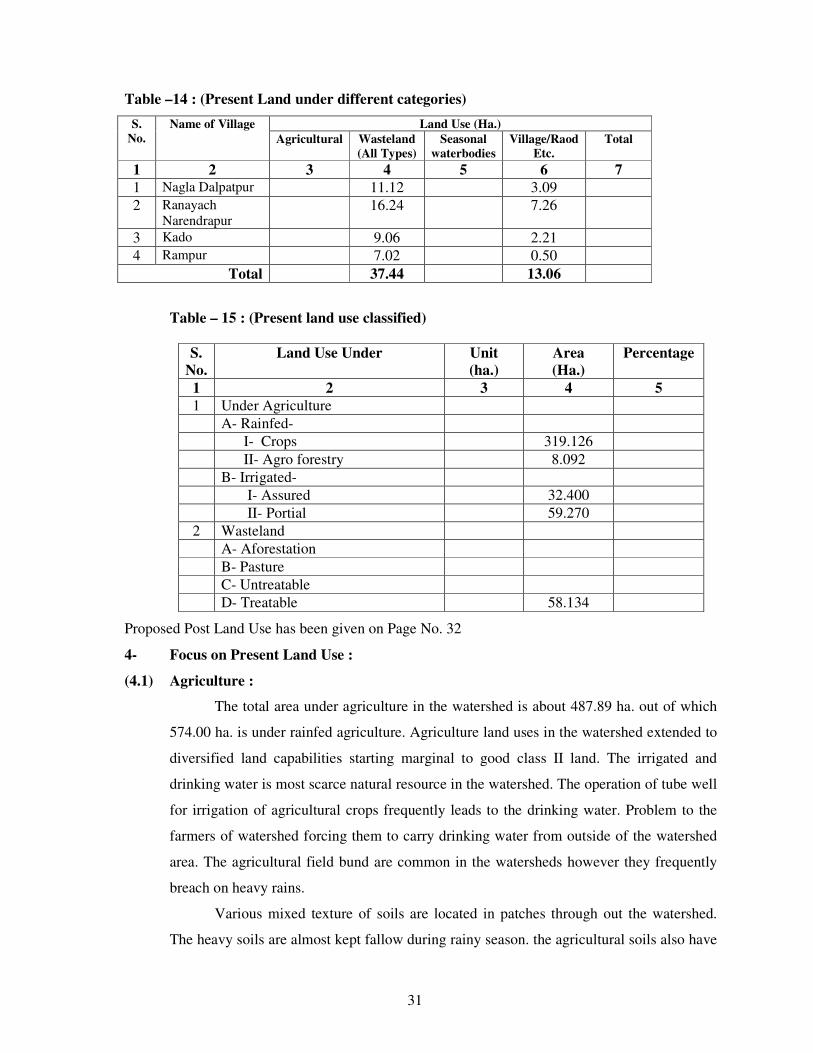
Table –14 : (Present Land under different categories)
S.
No.
Name of Village Land Use (Ha.)
Agricultural Wasteland
(All Types)
Seasonal
waterbodies
Village/Raod
Etc.
Total
1 2 3 4 5 6 7
1 Nagla Dalpatpur 11.12 3.09
2 Ranayach
Narendrapur 16.24 7.26
3 Kado 9.06 2.21
4 Rampur 7.02 0.50
Total 37.44 13.06
Table – 15 : (Present land use classified)
Proposed Post Land Use has been given on Page No. 32
4- Focus on Present Land Use :
(4.1) Agriculture :
The total area under agriculture in the watershed is about 487.89 ha. out of which
574.00 ha. is under rainfed agriculture. Agriculture land uses in the watershed extended to
diversified land capabilities starting marginal to good class II land. The irrigated and
drinking water is most scarce natural resource in the watershed. The operation of tube well
for irrigation of agricultural crops frequently leads to the drinking water. Problem to the
farmers of watershed forcing them to carry drinking water from outside of the watershed
area. The agricultural field bund are common in the watersheds however they frequently
breach on heavy rains.
Various mixed texture of soils are located in patches through out the watershed.
The heavy soils are almost kept fallow during rainy season. the agricultural soils also have
S.
No.
Land Use Under Unit
(ha.)
Area
(Ha.)
Percentage
1 2 3 4 5
1 Under Agriculture
A- Rainfed-
I- Crops 319.126
II- Agro forestry 8.092
B- Irrigated-
I- Assured 32.400
II- Portial 59.270
2 Wasteland
A- Aforestation
B- Pasture
C- Untreatable
D- Treatable 58.134

32
some as share calcium pan at variable depths. The irrigation water is conveyed by the
earthen channels. Surface irrigation methods following mainly border method of flood
method by the formers in the watershed. These factors reduce the water use efficiency of
limited and valuable irrigation water.
Drought hardy species like Juliflora suitable multi purpose trees is suitable for
rehabilitation of the wasteland. Rehabilitation of waste lands promoting agro forestry with
appropriate fruit and forest species suitable vegetative barriers on sloppy lands can be high
future value and by these adoption would be meet out many demands of fire wood and
fodder in the wasteland. Except above but also for soil and water conservation,
rehabilitation of wasteland and sustainable income generation for socio-economic
upliftment of farmers.
Crop Productivity :
The farmers also do not have suitable cropping system to deal aberrant weather.
Weeds impose considerable constraint in productivity of both Karif and Rabi crops under
irrigated as well as rainfed production system farmer undertake normally one manual
weeding in mustard and other valuable crops however, practices is energy and time
consuming. Use of we decide is rare in the watershed.
In the watershed area, limited cropping in the Kharif with mixed cropping practices
is not only irrigational but also unscientific and best for low productivity. Subsequent Rabi
crops in general. Sugarcane & Mustard crop in particular are raised on residual soil
moisture under rainfed production system during post mansoon season.
(4.2) Indigenous Technological Knowledge (ITK) :
Under process of PRA tracked out rural applying technology in various field of
local technology and some technology is very popular in village. In which the agriculture
is an old traditional practices of farmers who have improved themselves with passage of
the time according to their domestic needs and technological reforms in the nearby areas.
The villages have their traditional village ponds, practice of field bunding which typically
constitute agricultural related ITKs in the watershed. The Mustard & sugarcane being a
cash and firewood crop of the watershed and also sugarcane crop is being. Cultivated in
self designed manner by the farmers. Its carried out that the area is totally depend on rain
and under the rainfed area technology is applied by the farmers. However limited fertilizer
application specifically the DAP came in the practices since about 15-20 years.

33
(4.3) Forest and Other Vegetation :
Forest :
The watershed have a tract of wasteland area which are under uncultivable position
is liesed in the watershed. These wasteland have not any tree vegetation or very less than
real requirement for the wasteland use.
Horticulture/Agro forestry :
Horticulture and agro forestry practices were observed in the watershed.
(4.4) Agro forestry :
Agro forestry practices are lacking in the watershed. Though it has good potential
under existing disposition and may a role particularly with respect to minimization of
cropping risk, built up soil fertility and productivity, protection of soil erosion, soil
conservation partly meeting out the fire wood demand of rural community and more over
optimizing the economical return from system as whole under typical semi arid climate in
the watershed. Bund and boundary plantation also have good potential to care the fire
wood and fodder demands of the rural community in the watershed. The existing area
under agro forestry is almost negligible. Prosopis Jhliflora may be planted as block or sole
plantation specifically on marginal and degraded land in the watershed.
The agro forestry interventions comprising of ber, bail, aonla, guava, papular etc.
may be applied for benefit of the farmers under rainfed to irrigation production system on
leveled to slopping and marginal agricultural using proper planting techniques and term it
control measures.
The multipurpose trees may be also help in supplementing fire wood and fodder
demands of the rural community in the watershed and my be planted as hedge rows on
rainfed, marginal and degraded lands.

34
(4.5) Horticulture :
Fruits and vegetables practices are lacking in the watershed area. Its practices may
be sustainable very good potential for the formers of watershed. There are a limited lack
fruit trees in number like mango, guava, lime, ber, aonla and papaya fruit trees well as
vegetables like radish, okra, tomato, cabbage, garlic, onion, chilly, bringer and cucurbits
but they are found surviving well in the watershed villages. Organized orchards (vatika)
commercial vegetable cultivation horti-agri and other systems of agro forestry etc. are
lacking but have good agriculture.
5. Soil and land capability classification :
(5.1) Soil Morphology :
Watershed is located North East corner of Bulandshahr Distt. near about 55 Km.
away. The entire terrain of watershed is topographically divided into various land forms.
Accordingly the soils of watershed have been grouped major categories is given as follow
:
Hill Terrain Plane
Land
Sloppy
Undulated
Land
Rill Erosic
Land
Moderate
ravenous
- 35% 32% 18% 15%
Given categories in the blocks is located the soil morphology in the watershed
areas. Representation of soil characteristics by soil profile is represented as follows :
Soil Profile :
Fig. – 9 (Soil Profile)

35
Table – 16 : (Morphology of a Typical Soil Profile) :
Horizone Depth in
Cm.
Morphology
1 2 3
A
V & H
0-150 Silky when moist, Hard when dry quick
soluble, high elasticity, fissures, and cracks,
occasional occurrence of free calcium
carbonate granules black in colour, clay
content 29%, PH- 8 to 8.7
B
V & H
150-160 Whitish yellow in colour, very fine mixed
with free cacaos and gravels, Hard when dry
compact and indurate hard pan restricting
development of root and down ward water
transmission.
C
V & H
7600 Red and white sand stone
(5.2) Soil and Characteristic and Fertility Status :
Soil characteristic pertaining to soil fertility of various classes accruing around
villages in the watershed are given as follows :
Table – 17 : Soil Characteristic & Fertility Status :
Sl.
No.
Soil Properties LCC-II LCC-III
& IV
1 2 3 4
1 Sand % 47.04 74.04
2 Silt % 24.60 18.60
3 Clay % 28.36 3.6
4 Texture Sandy Clay Lomy Sand
5 PH (1:2) 8.41 8.67
6 Organic Carbon % 0.37 0.12
7 Available N Kg ha-1
310 173
8 Available P Kg ha-1
29 15
9 Available K Kg ha-1
129 325
10 EC (dS m-1
) 0.47 0.12
36
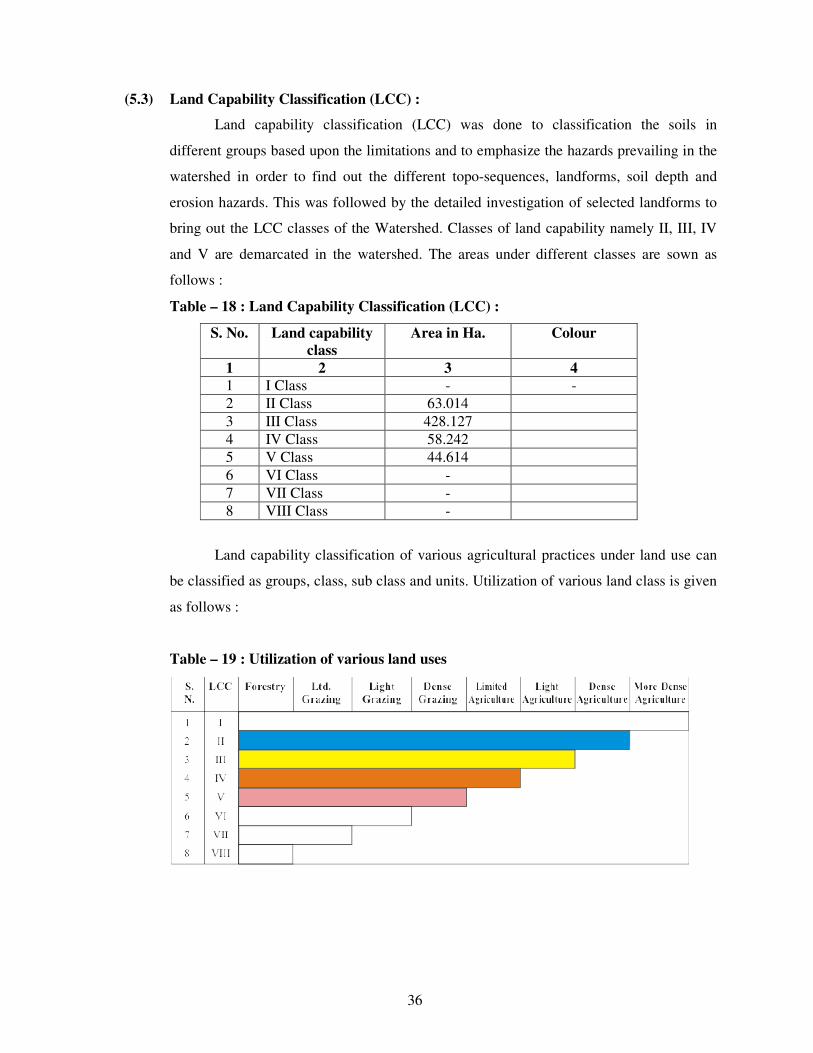
(5.3) Land Capability Classification (LCC) :
Land capability classification (LCC) was done to classification the soils in
different groups based upon the limitations and to emphasize the hazards prevailing in the
watershed in order to find out the different topo-sequences, landforms, soil depth and
erosion hazards. This was followed by the detailed investigation of selected landforms to
bring out the LCC classes of the Watershed. Classes of land capability namely II, III, IV
and V are demarcated in the watershed. The areas under different classes are sown as
follows :
Table – 18 : Land Capability Classification (LCC) :
S. No. Land capability
class
Area in Ha. Colour
1 2 3 4
1 I Class - -
2 II Class 63.014
3 III Class 428.127
4 IV Class 58.242
5 V Class 44.614
6 VI Class -
7 VII Class -
8 VIII Class -
Land capability classification of various agricultural practices under land use can
be classified as groups, class, sub class and units. Utilization of various land class is given
as follows :
Table – 19 : Utilization of various land uses

37
(5.4) Land Capability Class II & III :
This group is one of the most extensive LCC watershed. and also near to class III
for the agricultural practices. The soils are sandy & sandy loam in texture. The land under
this class is nearly level to mild sloping (1-3%). The soils are deep and erosion hazard is
slight. Most of the productive agriculture land comes under class II & III. These lands
potentially very productive but due to rainfed a single cropping pattern is in habitation.
(5.5) Land Capability Class IV :
This class is found in lower portion near the outlets of watershed. The soils are
coarser in texture, deep, erosion hazard and undulating in topography. Rill and initiation of
gully can be seen near the outlet of the watershed.
(5.6) Land Capability Class VII & VIII :
This class of land is not found in watershed. Somewhere lack of soil are found with
admixture gravels fragments in these classes of lands.
(5.7) Conclusions :
The majority of land form is coming under class II, which give an insight of good
agriculture production potential of the watershed.
The land capability classification provides reasonable good information with
regard to capability of soil, that could be used for agriculture, agrihorticulture, silviculture
and posture development.
The productivity of these lands could be further enhanced by adoption of simple
soil & water conservation measures like bunding practices.
The reasonable area is under watershed of wasteland and other wasteland including
grater potential of this watershed for forestry and pasture development. Rare places
namely water body of low portion of land area under seasonally works as water harvesting
structures and these harvested water is used or can use for some other benificial activities
during the crop season also.
6. Problems and needs of the watershed indentified during the PRA
(6.1) Problem Identification and prioritization :
a- The are has undulating topography, steep unstable slopes, gradient of excessive
branches of rills and hence highly prone to soil erosion.
b- Major issues addressed to food sufficiency economic growth and environmental
security in the watershed area.
c- Effective soil depth is limited and highly variable hampering good crop growth.

38
d- The watershed have low productive cropping due to tradition single cropping
pattern and over all average crop production percentage not sufficient against
requirement.
e- Identified that there is no assured irrigation system has been development capacity
of water bodies are reduced due to silt ration which are utilized to store of rainy
water and they are renovatable.
(6.2) Transact walk during the PRA :
Problems identified and prioritized during the transact walk and PRA exercises in
all comprised villages of watershed. There were pooled and a list of problems
representing the whole watershed was prepared. Problems were ranked as per their total
weight age in the watershed village.
Table – 20 : Ranking of Problem identification and prioritization of watershed
S.No. Problem Rank
1 2 3
1 Lack of irrigation 3
2 Lack of drinking water 3
3 Low production of field crops 4
4 Lack of fodder availability and low productivity 7
5 Lack of availability of fuel wood 4
6 Lack of market facility 3
7 Lack of quality seeds, fertilizer, pesticides etc. 5
8. Medical and Health care facilities for milching
animals and low productivity.
6
9 Lack of medical, educational and transportation
facilities
7
10 Lack of water bodies renovation 8
11 Lack of run of earthen check bunds 1
12 Lack of water harvesting structures 1
13 Lack of livelihoods opportunity 2
Prioritized ranking (Upto four Numbers) :-
1- Lack of earthen check bunds.
2- Lack of livelihood opportunities.
3- Lack of irrigation water was the greatest problem. Lack of irrigation water
problem experienced by the people followed by low crop production.
(6.3) Analysis of SWOT of the watershed :
Strength (S), Weakness (W), Opportunity (O) and Threat (T) analysis is a
useful decision support tool. A SWOT analysis of watershed is presented as
follows :

39
SWOT analysis of the watershed
Strengths (S)
i. Cooperative work culture in traditional
activities
ii. Close ethic ties
iii. Road at the top as well as outlet of the
watershed
iv. Hard working
v. Resource pool of crop genetics
diversity
vi. Awareness of farmers about watershed
management programme
vii. Well established CPR maintaining and
sharing system
viii. Stall feeding of animals
ix. Well maintained seasonal water bodies
x. Social outlook of the community
towards land less
Weakness (W)
i. Poor water management
ii. Resource poor farmers
iii. Out migration of youth
iv. Low and erratic rainfall
v. Fragile geology
vi. Fragmented land holding
vii. Heavy infestation of wild animals
viii. Problem of fuel and fodder
ix. Shallow soil depth and with high
percentage of gravel
Opportunities (O)
i. Wide range of annual and perennial crops
ii. Scope of regular employment opportunities
to check out migration
iii. Strengthening of existing irrigation system
iv. Conducive climate for rainfed crop
diversification
v. Good scope for Agro forestry and dry land
horticulture
vi. Potential for collective action and
management of CPR
Threats (T)
i. Prone to adverse climate like drought
ii. High market risk
iii. Social conflicts owing to PRI and WSM
polices and local politics
iv. Weak coordination among line departments
v. Lack of expertise of implementing agency in
different aspects of WSM
7. Proposed land use for the watershed :
Watershed management plan preparation due importance is given to topographic,
land suitability, irrigation potentially, prevailing farming systems, micro farming situation,
farming, farmers preferences and priorities along with economic and environment
securities.
Crop and tree selection and area distribution was done as per farmers priorities
revealed through PRA exercise.
The watershed management plan for watershed is prepared with specific objectives
of food sufficiency, income and employment generation with environment security.

40
Technical options were with the ITK based on the latest available experiment
findings. Due attention was given to the resource of the farmers and adjustments were
made in capital intensive resource demanding technological outputs while making them
adoptable to the resource poor farmers. Emphasis was given on maximum use of farm
yard manure. The proposed land use plan of the watershed is shown as follow as in table
Table – 21 : Present and proposed land use plan of the watershed
S.No. Land use Present
(ha)
Proposed area
(ha)
1 2 3 4
1 Agriculture
a Rainfed
I Crops 319.126 445.256
II Agro-forestry 8.092 65.190
b Irrigated
I Assured 32.400 32.400
II Partial 59.270 75.134
2 Waste land
a Aforestation
b Pasture 10.40
c Untreatable 2.50
d Treatable 58.134 24.240
3 Village land 40.840 40.810
(7.1) Status of Present Water Resources Utilization :
Watershed is having some canal system. Management and maintenance of these
canal are required. Before sowing of Rabi crops, water from these canal is issued as
supplementary irrigation for Rabi sowing ar allowed to go as waste. After releasing water
from canal, submergence area also put under cultivation.
Some where bore well irrigation applied by the farmers in the watershed.

41
(7.2) Proposed Plan for Irrigation Development :
a- Present system of irrigation and wastage of water during October–November
need to be made more efficient from water management point of view by
minimizing conveyance losses in the existing water courses.
b- Present irrigation canal capacity have to build up by the reform. Which are lack
capacity of water.
c- Construction of new water harvesting earthen structures, Pucca Check Dem, Series
Gully Plugging, etc. has been sloppy portion to increase irrigation potential and for
recharging of ground water, soil and moisture conservation maximum field
irrigation, best production and expected change of crop rotation.
d- The up gradation of the exciting system of irrigation will result in :
i- Minimization of conveyance losses.
ii- Increase in frequency of irrigation.
iii- Adoption of high yielding varieties of crops.
iv- Assured cultivation of cash crops.
v- Capacity buildup by the planning of new water harvesting structures.
(7.3) Ground Water Recharge :
For the purpose of ground water recharge, the area of the upper side of watershed
is recommended for Field Bunds, Contour Bunds, Peripheral Bunds and Submergence
Bunds and in the lower portion Contour Staggered Trenches, Gully Plugs, Earthen Check
Dem and Pacca Outlets. In the undulated sloppy portion of the watershed recommended
water harvesting structure for dual purpose as ground water storage and under ground
water recharge.
(7.4) Crop Production :
Practices proposed in the watershed is given as follows :-
a- Mulching and crop residue management.
b- Application of green manuring.
c- Vermi Composting.
d- Crop rotation and inter cropping.
e- Biofertilizers.

42
(7.5) Tillage Operation :
Deep tillage technology is proposed to apply to be demonstrated for benefit of
farmers in the watershed.
(7.6) Improved Seeds of High Yielding Verities (H.Y.V.) :
Recommendation of improved varieties is necessary for improving the productivity
and farm income. Through replacement of low yielding traditional verities of seeds in
villages of watershed.
(7.7) Balanced Fertilizer Use :-
Demonstration of use of fertilizer in various crops of watershed recommended
balance fertilizer use in different crops will be benefited of forming community.
(7.8) Control of insects and diseases :
Aphid in the mustard are the major insects in the watershed areas leading to loss in
crop productivity. Similarly white blister is also a common disease in the mustard crop.
The management strategies of these insect pest and diseased will also be
demonstrated in the watershed for benefit of the growers.
(7.9) Dry Land Horticulture :
Such portion of dry land in which proposed horticulture development planning
recommended species like Ber, Bel and Aonla will be planted at suitable spacing in the
watershed.
(7.10) Agri Horticulture :
Aonla and Sahjan would be suitable horticultural crops to the locality. Therefore, a
part of land in the farmer field shall be selected and brought under Agri-horticulture
system. The cropping system followed will be Jwar and Wheat.
43
(7.11) Plantation (Fuel wood) :
Such a portion which are under wasteland will be taken falling in the class-IV
category in the watershed. These lands will be planted with species like Vilayati Babool
(Prosopis Juliflora), Babool (Acacia Nilotica), Karanj (Pangamia Glabra).
9. Socio Economic Analysis of the of the Project :
(9.1) Sustainability and environment security :
The proposed land use plan will improve the land utilization index and crop
diversification index significantly as compared to the existing one. in the proposed
watershed management plan proper blending of the bio engineering measures will be
applied on above 80% of the total area of watershed. It is estimated that more than above
70% of the watershed area will be treated and consequently the soil loss and runoff from
the area is excepted to be reduced by 70% respectively.
It will help in maintaining ecosystem integrity on sustained basis along with
improving the livelihood security of the farming community.
(9.2) Economic Analysis :
Economic analysis of the project was carried by taking direct benefits and costs
considering 10 years for project life at 10% discount rate. Whole watershed development
plan was divided into three sector as agriculture, horticulture and forest/Fuel wood
plantation. Net Present Value (NPV) and Benefit Cost ratio criteria were applied judge the
economic efficiency of each enterprises and sector. Net present value (NPV) of the project
life is considered to be 10 years and discount rate for NPV estimation is 10% is given
NPV and benefits as follows :-

44
Table – 22 : Present productivity income analysis :
S.
No.
Name of
Sector
Name of
Crops
Produ
cti-
on/ha.
Rate/
Qtl.
Cost of
Production
Expend. of
cultivation
Net
income
B.C. Ratio
between
Col. 8 & 7
1 2 3 4 5 6 7 8 9
A Agriculture Urad 3.00 4300.00 12900.00 6450.00 6450.00 1:1
Moong 3.00 4500.00 13500.00 6075.00 7425.00 1.22:1
Jwar 4.80 600.00 2880.00 1584.00 1296.00 0.82:1
Wheat 18.50 1000.00 15725.00 8650.00 7075.00 0.82:1
Pea 7.50 2250.00 16875.00 10970.00 5905.00 0.54:1
Mustard 3.50 1850.00 6475.00 3235.00 3240.00 1:1
Total - 105105.00 54105.00 51000.00 0.94:1
Average - 13138.00 6763.00 6375.00 094:1
B Forestry Vilayati
Babool
15000.00 - Nil
C Horticulture Ber 20000.00 - Nil
Aonla 20000.00 - Nil
Bel 20000.00 - Nil
Total - 60000.00 - Nil
Average - 20000.00 - Nil
Grand Total
45
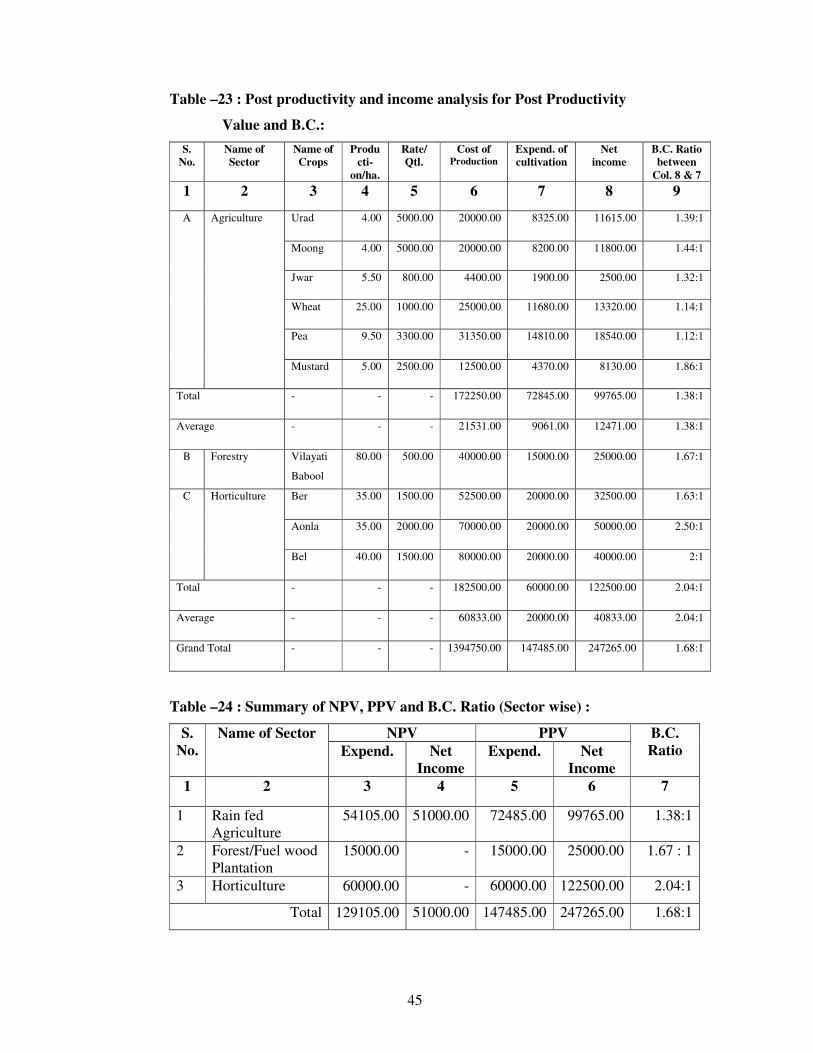
Table –23 : Post productivity and income analysis for Post Productivity
Value and B.C.:
S.
No.
Name of
Sector
Name of
Crops
Produ
cti-
on/ha.
Rate/
Qtl.
Cost of Production
Expend. of
cultivation
Net
income
B.C. Ratio
between
Col. 8 & 7
1 2 3 4 5 6 7 8 9
A Agriculture Urad 4.00 5000.00 20000.00 8325.00 11615.00 1.39:1
Moong 4.00 5000.00 20000.00 8200.00 11800.00 1.44:1
Jwar 5.50 800.00 4400.00 1900.00 2500.00 1.32:1
Wheat 25.00 1000.00 25000.00 11680.00 13320.00 1.14:1
Pea 9.50 3300.00 31350.00 14810.00 18540.00 1.12:1
Mustard 5.00 2500.00 12500.00 4370.00 8130.00 1.86:1
Total - - - 172250.00 72845.00 99765.00 1.38:1
Average - - - 21531.00 9061.00 12471.00 1.38:1
B Forestry Vilayati
Babool
80.00 500.00 40000.00 15000.00 25000.00 1.67:1
C Horticulture Ber 35.00 1500.00 52500.00 20000.00 32500.00 1.63:1
Aonla 35.00 2000.00 70000.00 20000.00 50000.00 2.50:1
Bel 40.00 1500.00 80000.00 20000.00 40000.00 2:1
Total - - - 182500.00 60000.00 122500.00 2.04:1
Average - - - 60833.00 20000.00 40833.00 2.04:1
Grand Total - - - 1394750.00 147485.00 247265.00 1.68:1
Table –24 : Summary of NPV, PPV and B.C. Ratio (Sector wise) :
S.
No.
Name of Sector NPV PPV B.C.
Ratio Expend. Net
Income
Expend. Net
Income
1 2 3 4 5 6 7
1 Rain fed
Agriculture
54105.00 51000.00 72485.00 99765.00 1.38:1
2 Forest/Fuel wood
Plantation
15000.00 - 15000.00 25000.00 1.67 : 1
3 Horticulture 60000.00 - 60000.00 122500.00 2.04:1
Total 129105.00 51000.00 147485.00 247265.00 1.68:1

46
(9.3) Economics of Agriculture Sector :
The development cost can be recovered by the adoption of plan in present rain fed
agriculture is being done on well maintained field, therefore does not require much
investment. In rain fed agriculture, investment of Rs. 44.50 lacs is proposed to made is
given as fallows :
Table – 25 : Economics of Agriculture Sector :
S.
No.
Name of
sector
Name of Activities
/ Plan
Treatble
Area
(Ha.)
NPV
(Lacs)
Post
Productivity
Value (Lacs)
Benifit /
Income
B.C.
Ratio
1 2 3 4 5 6 7 8
1. Rainfed Soil, moisture
and water cons
works
510 223.43 656.65 308.33 1.38:1
(9.4) Economics of forest fuel wood plantation :
Economic analysis of fuel wood plantation in the watershed. Project life is
considered to be 20 years and discount rate for NPV estimation is 10 % is followed and as
is given follows :
Table –26 : Economics of forest fuel wood Plantation :
S.
No.
Name of
sector
Comman Name of
Plant
Area
(Ha.)
NPV
(Lacs)
Post
Productivity
Value (Lacs)
Benifit /
Income
B.C.
Ratio
1 2 3 4 5 6 7 8
1. Forest
Fuel
wood
sector
Vilayati Babool
(Prasopis
Juliflora)
25.00 2.50 6.675 4.175 1.67 : 1
(9.5) Economics of Horticulture Sector :
Economic analysis of Horticulture Plantation in agri-horti system and on wasteland
patches of watershed project, life is considered about 15-20 years and discount factor rate
for NPV estimation is 10% is follows :

47
Table – 27 : Economics of Horticulture system :
S.
No.
Name of
Sector
Common name of Plants Area
(Ha.)
NPV
(Lacs)
Post
Productiv
e Value
(Lacs)
Benefit
Lacs
B.C.
Ratio
1 2 3 4 5 6 7 8
1 Horticulture Ber (zyziphus
mouritana)
4.00 0.80 2.104 1.304 1.63: 1
Aonla (Embelica
officianalis)
3.80 0.76 2.660 1.90 2.5 : 1
Bel (Aegle marmelos) 2.20 0.44 1.320 0.88 2 : 1
Total 10.00 2.00 6.084 4.084 2.04 : 1
(9.6) Food requirement and sufficiency :
Achieving self sufficiency in food production is one of the prime objectives of
watershed project. The status of food requirement and production before and after the
project is presented as is follows :
Table – 28 : Status of food requirement and availability of per annual :
S.
No.
Name of Foods Requirement
Q./Yr.
Present Status Expected Post Status
Availability
Q./Yr.
Deficit or
surplus
Q./Yr.
Availability
Q./Yr.
Deficit or
surplus
Q./Yr.
1 2 3 4 5 6 7
1 Cereals 110 Kg. 8529 7250 -1229 4499 5970
2 Pulses 36.50 2830 1556 -1274 5094 2264
3 Oil Seeds 29.20 2264 906 -1358 3622 1358
4 Vegetable 71 kg 7076 1415 -5661 12737 12737
(9.7) Employment generation :
One of the major problem of the labour migration in watershed project. By the
implementation of the project activities employment opportunities will be generated.
However the changes in land use pattern and adoption of other subsidiary enterprise will
generate employment opportunities in the watershed as given in table follows :

48
Table – 29 : Employment generation under proposed works :
S.
No.
Employment
activities/works
Area
under
work
Cost Mandays generation (Nos.)
Unskilled Skill Total Person
1 2 3 4 5 6 7 8
2 Graded Contour Bund 57 1.70 1710 - 1710 57
3 Gully Plug, C.D. 95 7.125 4987 366 5353 178
4 Submergence Bund 81 3.240 3240 - 3240 108
1 Peripheral Bund 80 2.80 2800 - 2800 93
5 W.H.B. 100 9.00 5400 306 5706 190
6 Renovation of Bund 62 1.860 1860 - 1860 62
7 Reno. of W.H.B. - - - - -
8 Community Pond - - - - -
9 Afforestation 25 2.865 537 - 573 19
10 Horticulture 10 2.00 400 - 400 13
Total 510 30.60 20970 672 21642 720
10. Formation of watershed committee :
Under compliance of common guideline Para (6.3) is followed and by the help of
watershed development team, watershed committee is organized in the micro watershed
village Ranayach Narendrapur with 10 members as prescribed in common guide line. List
for organization of W.C. village details given as follows :
Table – 30 : Details of comprised village W.C. organization in M.W.S. :
S.
No.
Particulars Details Block Geogra-
phical Area
1 2 3 4 5
1 Micro watershed code 3B3E3c3f Pahasu 574
2 Name of Gram Panchayat
in M.W.S.
Ranayach
Narendrapur

49
Table – 31 : List of organized W.C. for the Gram Panchyat Dalpatpur in watershed.
S.
No.
Name of selected
members
Age Representation
Members from
Post Qualification Village
1 2 3 4 5 6 7
1 Ramesh Chand 47 From – U.G President High School Nizampur
2 Than Singh 57 From – U.G Secretary Intermediate Nizampur
3 Charan Singh 35 From – U.G Member Sakhar Nizampur
4 Jay Prakash 38 From – U.G Member 8 Nizampur
5 Chandrapal 48 From – U.G Member 10th
Nizampur
6 Ranveer 35 From – S.H.G. Member Sakhar Nizampur
7 Sanjeev 38 From – S.H.G. Member 5 Nizampur
8 Rakesh Kumar 43 Landless Member Sakhar Nizampur
9 Km. Rajni Devi 19 From – Female Member Sakhar Nizampur
10 Sanjay 28 From – Landless Member 8 Nizampur
11 Hem Pal 26 From – P.L.A. Work Intermediate Khurja
(10.1) Formation of Self Help Groups in M.W.S.
By the help of watershed committee and watershed development team self help
group are formatted / organized. Families and persons are selected from poor, small and
marginal farmers families, landless poor families, agriculture labour families, women,
herdsman and shepherd and S.C. families in the formatted self help groups are given as
follow :
Table – 32 : Baghel Self help group – Dalpatpur .
S.
No.
Name of member
in formatted
SHG’s
Age From
represented
family
Name of
proposed
activities
Activation
Position
1 2 3 4 5 6
1 Sanjay 26 OBC Poultry New
2 Sahab Singh 19 OBC Livestock New
3 Than Singh 48 OBC New
4 Chatrapal 41 OBC New
5 Chandpal 48 OBC New
6 Sonpal 50 OBC New
7 Mahipal 26 OBC New
8 Malkhan 35 OBC New
9 Mahabir 35 OBC New
10 Manvir 52 OBC New

50
Table – 33 : Self help group Narendrapur
S.
No.
Name of
member in
formated
SHG’s
Age From
represe-
nted
family
Name of
proposed
activities
Activation
Position
1 2 3 4 5 6
1 Rajendra 40 Pal Kadai, Bunai New
2 Rajpal 35 Pal New
3 Cheetar 29 Lodhi New
4 Kamal Singh 36 Lodhi New
5 Veer Singh 28 Lodhi New
6 Chuttan 22 Pal New
7 Yashveer 40 Pal New
8 Munidev 42 Pal New
9 Sompal 41 Pal New
10 Rakesh 22 Pal New
Table – 34 : Self help group in Dalpatpur village of watershed.
S.
No.
Name of
member in
farmated
SHG’s
Age From
represe-
ntated
family
Name of
proposed
activities
Activation
Position
1 2 3 4 5 6
1 Prem Singh 36 Pal President
Live Stock
New
2 Kalawati 34 Pal New
3 Banti 21 Lodhi New
4 Smt. Kamlesh 20 Lodhi New
5 Chaman 28 Lodhi New
6 Km. Daya 20 Lodhi New
7 Sonu 22 Lodhi New
8 Smt. Rammuli 20 Lodhi New
9 Manoj 22 Lodhi Secretary New
10 Peetam 20 Lodhi New

51
Formation of User’s Groups :
User’s groups are farmated by the help of watershed committee and watershed
development team in the micro watershed comprised villages. Formers which have land
village are involved in the User’s groups and they will be direct benefited as expected by
the implementation of watershed project easy and convenienced condition are made to
resource use between user’s groups and they will be responsible to operate and
maintenance for the created assets in the watershed. Nos. of farmated user’s groups details
are given as follows :
Table – 35 : Village wise user’s groups
S.
No.
Name of
village
No. of
groups
No. of
farmers
Total
Agri.
Land
Area
under
treat-
ment
Cost of
essets
1 2 3 4 5 6 7
1 Dalpatpur 6 95 95 58.00
2 Narendrapur 16 240 241.85 235.00
3 Kado 7 102 210.15 208.00
4 Rampur 1 15 27.00 9.00
30 480 574.00 510
10. Estimation and Costing of Proposed activities of the watershed Project Year 2009-10.
Proposed works / activities for the Project Period (Year 2010-11) under proposed
treatable area 510.00 Ha. Out of total Geographical area 574.00 Ha.

52
(10.1) Financial and Physical Outlets :
Table – 36 : Financial and Physical Outlets for the Year 2009-10 :
Sl.
No.
Components Unit
cost
per
ha.
Physical
ha. Financial (Lacs) Man-days
Generatio
n Labour
Component
Material
Component
Total
1 2 3 4 5 6 7 8
A Management Cost 10%
1 Administrative Cost – TA & DA
Hiring of Vehicles,
Official Expenditure
Electricity & Phone bill
Computer, Stationery and office
consumable materials & contingency
1200 - - 5.304 5.304 -
2 Monitoring 120 - - 0.5304 0.5304
3 Evaluation 120 - 0.5304 0.5304
Sub Total 1440 - 6.3648 6.3648
B Preparatory Phase 10% - -
1 Entry Point Activities 4% 480 - 04243 1.6973 2.1216 424
2 Institutional & Capacity Building 5% 600 - - 2.652 2.652
3 Detailed Project Report 1% 120 - - 0.5304 0.5304
Sub Total 1200 - 0.4243 4.8797 5.304 424
C Watershed Work Phase
a Watershed Development Works
1 Graded, Contour & Field Bunds 3000 47.00 1.41 - 1.41 1410
2 Gully Plug, Earthen Checkdam /WHS 7500 80.00 4.20 1.80 6.00 4508
3 Submergence bunds 4000 70.00 2.80 - 2.80 2800
4 Peripheral Bund 3500 70.00 2.45 - 2.45 2450
5 Earthen Water Harvesting Bund 9000 88.00 4.752 3.168 7.92 5021
6 Renovation of existing Bunds 3000 52.00 1.56 - 1.56 1560
7 Renovation of existing W.H.B - - - - - -
8 Aforestation and Development of silvi
postural system 13500 25 0.476 1.904 2.38 476
9 Dry Land Horticulture 20000 10 0.40 1.60 2.00 400
10 Community Pound (Renovation) - - -
Sub Total 442 18.048 8.472 26.52 18625
B Livelihood Programme (Community Based) 7.620
Income generating activities through SHG’s for landless and marginal formers 10%
1 Live stock development activities 200 - - 0.884 0.884 -
2 Bee Keeping 100 - - 0.442 0.442 -
3 Poultry Farming 200 - - 0.884 0.884 -
4 Nursery Development 300 - - 1.326 1.326 -
5 Vegetable Production 100 - - 0.442 0.442 -
6 Milk Dairy Promotion Unit 200 - - 0.884 0.884 -
7 Establishment of Vermi compost Unit 100 - - 0.442 0.442 -
8 Sub Total 1200 - - 5.304 5.304 -
C Production System and micro Enterprises
1 Crop production, diversification of
agriculture and introduction of agro
forestry
1170 - - 5.1714 5.1714 -
2 Demonstration of improved
composting system 390 - - 1.7238 1.7238 -
Sub Total 1560 - - 6.8952 6.8952 -
D Consolidation Phase 5% Sub Total 600 - - 2.652 2.652 -
Grand Total 12000 - 18.4723 34.5677 76.20 19049

53

54
PROJECT AT A GLANCE
IWMP-II (Bulandshahar)
1 State Uttar Pradesh
2 Distt. Bulandshahar
3 Block Pahasu
4 M.W.S. Code 2B3E4d3e
5 Name of M.W.S. Project Uthravali
6 Involved Village 03
7 Geographical Area of M.W.S. 622
8 Rainfed Area
9 Treatable Area 560
10 Weightage
11 Cost of Project 67.200
12 For the year 2011-12
Budget Components
S. No. Components Area
(Ha.)
Cost
(in Lacs)
1 2 3 4
1 Management Cost 12% - 8.064
2 Preparatory Phase 10% - 6.720
3 Watershed Work Phase -
A- Watershed Development Works 50% 560.00 33.600
B- Livelihood Programme (Community Base) 10% - 6.720
C- Production System & Micro Enterprises13% - 8.736
4 Consolidation Phase 5% - 3.360
Total 560.00 67.200

55
Executive Summary of the Project
Identified selected micro watershed project Utravali is coded as 2B3E4d3e has been
proposed from cluster of I.W.M.P. Bulandshahar – I project in Pahasu Block district
Bulandshahar four villages namely Utravali, Asharauli, Nawada, Maripur and Rampur is
comprised in the micro watershed which is located in the east of district Bulandshahar on the east
bank of River Kali Nadi and border of district Badaun area is known as Khadar. It lies between
280 -15’ S and 28
0-10’ N Latitudes and 78
0 -0’ E and 78
0 -10’ W Longitudes Covering area. Its
altitudes ranges from 187 meter to 190 meter above the mean sea level. Khurja Railway Station
201.18 m, Khurja Jh. Railway station is 201.46 m above mean sea level is displayed. Project area
of I.W.M.P. BSR-III is lied in the Pahasu Block of Bulandshahar District which is come in the
western plan zone under semi arid area. The annual average rainfall is near to 397 mm which an
average of 35 rainy days. Out of which about 85% is received during the mansoon season from
July to September and very less rainfall is received in the winter season.
Temperature ranges from as high as 430C in the May-June to as 3
0-4
0C during December –
January. The Trend of rain fall is highly eratic and maximum water goes as runoff.
Main occupation of the dwellers is agriculture in the watershed. Some part of the lands are
shown during the Kharif season. Cane sugar are preferred crops in the project area. The main
Crops raised are Wheat, Pea & Mustered and maze.
The topmost portion of the watershed is sloppy flat land. Other than topmost portion of the
watershed is under soil erotic portion and depreciative. The soil of the land are sandy loam Soil.
The middle agricultural position of watershed relatively smooth sloppy flat land with sandy loam
soil texture. These soil is yellow in colour and are inherently good in fertility status.
Natural vegetation of the watershed is very poor. Somewhere forest vegetation is seen
which are predominant with Vilayati Babool (Prosopis Juliflora), followed by Babool (Accasia
nilotica), somewhere Neem Plants (Azadirachta Indica), Shisham (Dolbergia Sisson) and Karanj
(Pongamia Glabra) are seen in occasional occurrence. There is no grass land in the watershed.
Somewhere grass patches are seen only on the bunds, road sides and other such places. Coverage
of massive green belt is in poor percentage for environment which is envisaged. That watershed is
very poor climate area.
There is normal condition of animal physics and for their fodder arrangement is the
watershed and creative possibility would be expected by the implementations of the project.
Due to Arial soil erosion poor harvesting managements, cropping pattern, non treated
watershed etc. are very anti effective causes for the watershed. Problem of the watershed is to be

56
tackled by harvesting structures which have last most of their capacity new water bodies for the
prevention of erosion and conservation of soil and moistures various type of earthen bunds in the
watershed field, necessity has been observed. Wasteland will be treated with staggered Trenches,
afforestation and bunding for the changing of characteristics.
The detail project report has been prepared by the applying of nine process steps
for the micro watershed code no. 2B3E4d3e brief is as follows.
STEP-1 Secondary data collection:-During the five days visit programme in the micro
watershed project with of all available documents of village label by approaching the
Gram panchayat collected secondary data.
STEP-2 Village meeting & conducting PRA exercise:-Community meeting conducted on fix
days for the consultation with villagers for the PRA Exercise. Participatory mode of
the villages was positive indicated for the success of programm. With good in testing
participation has been drawn social & resource map on ground & paper & discussed
un various topics of problematic thoughts in the micro watershed.
STEP-3 Socio economic survey:- The resource organization of village label volunteers
identified to conduct house hold socio economic survey/states.
STEP-4 Probel typology analysis:-Thoroughly analyzed the data & identified problem type as
soil & moisture conservation, crop rotation, crop coverage, productivity, livelihoods,
social issues & capacity building gaps etc. Problems discussed with the watershed
committee & came up with alternative solution.
STEP-5 Conduct of net participatory planning (NPP):- The planning team visited together
in the planning blocks on the scheduled date along with the beneficiaries of the
villages & data gathered as for the participatory net planning.
STEP-6 Productivity & livelihood planning exercise:- For the product livelihood exercise,
group discussion on various livelihood as Agriculture, Animal husbandry enterprise
development held discussion with the villagers in the micro watershed.
STEP-7 Institutional & capacity building :- This plan is prepared based on the data
available in the field and auscultations with the watershed committee.
STEP-8 Data consolidation & documentation of DPR :- After gathering all required
information compiled collected data. Thoroughly discussed and finalized the expected
outcomes and benefits specially in the respect of livelihood for different segments.
These are the target and performers indicators for the micro watershed.
STEP-9 Conduct of Gram Sabha obtaining approvals submissions of DPR.:-After
preparation of the draft DPR convened to Gram sabha and activities proposed expected

57
outcomes benefits of implementing the programm are explained in case of any changes
are proposed in the Gram sabha approval obtained by the Gram sabha and already
singed of Mau paper.
STEP-9A Attachment of detail estimate, cost and design:-Estimating, Costing and design
prepared technically According to plan in the micro watershed project. And attached
with the DPR.
STEP-9B Various type of mapping :- DPR prepared in the support of micro watershed
project using various type of maps is as follows :
1.Index Map of Watershed 2. Watershed Map
3. Relief/ Drainage Map 4. Slop Map
5.Soil and Land Capability class map 6. Land use/ Land Cover Map
7. Cadastral map 8. Proposed Action Plan map
9. Social Map

58
Project Report
Table – 1 : Micro watershed project brief : -
1 State U.P.
2 District Bulandshahar
3 Block Pahasu
4 Comprised Villages (Nos.) 03
5 Name of Watershed Utravali
6 Name of MWS Project Utravali
7 MWS Code No. 2B3E4d3e
8 Geographical Area of MWS 622
9 Treatable Area 560
1- Project Objectives :- The aim and objectives of the Project are :
h- Conservation, development and sustainable management of natural resources including
their users.
i- Enhancement of agriculture production and productivity in a sustainable manner.
j- Restoration of ecological balance in the degraded and fragile rain fed ecosystem.
k- Reduction in regional disparity between rains fed and irrigated area.
l- Creation of sustainable employment opportunities for the rural community for
livelihood security.
m- Generation of massive employment.
n- Reduce migration from rural employment.
2- Major Problem of Project Area :
g- Actual shortage of drinking water.
h- Near to nil activated water bodies and water harvesting structures.
i- Low depth of ground water table.
j- Undulated and generally sloppy rainfed area.
k- Large number of Small, Marginal and S.C. farmer land holding.
l- Lower wages of agriculture lobour and also migration of lobour due to shortage of
employment in the watershed.

59
3- General Description :
(3.1) Location :-
Tyore Bujurg Watershed has been taken with MWS Code No. 2B3E4d3e in
Pahasu Block of Distt. Bulandshahar is located on Bulandshahar via Khurja to
Utravali Via Pahasu road about 57 Km. between 28015’ and 28
015’ N Latitudes
and 7800’ and 78
05’ N Longitudes. Location and delineation of watershed has been
located on watershed map Fig. 2 and on top sheet Fig. 3.
(3.2) Area and Elevation :
Elevation ranges from 187 to 190 mtr. above the mean sea level(MSL)
altogether comprised villages and their’s area is described as follows. (Comprises
village map Fig. 3)
Table – 2 : Area and Elevation
Sl.
No.
MWS
Code
Block Name of
Village
Geographical
Area
Treatable
Area
1 2 3 4 5 6
1 2B3E4d3e Pahasu Utravali 238.360 222.36
Asarauli 278.64 289.64
Nawada 73.00 32.00
Jalapi 32.00 16.00
Total 622.00 560.00
(3.3) Shape of the Micro Watershed:
The shape of watershed is Elongated and as Rectangular. The maximum
length and width of the watershed are 5000 Mtr. and 1814 Mtr. respectively with
the Length: Width ratio of 2.76:1.
Fig. 1 (Shape of Micro Watershed)

60

61

62
(3.4) Climate :
The Watershed falls under ………………. semi arid region of tropical climate
inclined in Western Plan Zone. The average annual precipitation is about approx. is 397
mm. spreading over 35 rainy days. Most of the rain fall (about 85%) is received during
July to September. The rain fall of moderate intensity. Nothing the area receives of
scarcity rainfall in the winter season. The temperator variation ranges from as high as 430c
in the month of May-June to as low as 40c in December-January.
(3.5) Geomorphology and Soils :
Geomorphology :
The entire watershed is topographically divided into major landforms. Accordingly
the soils of watershed can be grouped into various categories such plane land, undulated
land, sloppy land and erosic ravenous land.
Sl.
No.
Name
of
Project
Name of Village Geograph
ical Area
(in ha.)
Raifed
Area
(in ha.)
Treatable
Area
Agri. Land
1 2 3 4 5 6 7
1 U
trav
ali
Utravali 238.360 212.26 222.36 195.45
2 Asarauli 278.64 229.30 289.64 229.87
3 Nawada 73.00 62.00 32.00 59.86
Jalapi 32.00 26.00 16.00 26.24
622.00 529.56 560.00 511.42

63
Soil :
(a) Fine textured soil :
The soil are the most extensive soil group found in the watershed. Some portion of
the watershed is relatively sloppy flat land with fine soil texture as sandy sandy loam. The
soils are in color and are inherently good high in fertility status. Soil texture is sandy lome
loam particularly in depressions and loam in the elevated portion. The soil characteristic
texture is dispersive and smooth. Therefore without impede the downward movement of
water productive layer of soil are easily by high runoff.
a- Coarse Textured Soil :
These soil are lying mostly in downward portion, along with erosic gully and
drainage line upto end of watershed outlet. These soils are coarser in texture and are
relatively poor in fertility status. The soils are lomy sand in texture. Rill and gully
formation in same parts particularly near the outlet of watershed can be seen.
(3.6) Drainage and Slope:
Due to prevalence of mild steep slope and presence of a number of drainage lines
in the watershed the drainage system is adequate. The watershed from part of Ganga Basin
and watershed. Under mild to steep topographical slope of MWS as divided as follow :
(Drainage and slope map fig.-4)
Table - 4 : Drainage and Slope
S. No. Grade Slope Percent Area in Ha. Remark
1 A 0.5-1 102 -
2 B 1-2 140 -
3 C 2-3 110 -
4 D 3-4 115 -
5 E 4-5 93 -
6 F 5-6 -

64
Fig-4 (Drainage & Scrub Map)
(3.7) Vegetation :
a- Natural Vegetation :
Natural vegetation is very poor in the watershed. The forest vegetation is
predominant with Vilayti Babool (Prosopis Juliflora). There are occasional occurrence of
Neem Plants (Azadirochta Indica), Shisham (Dalbergia Sissoo) and Karanj (Pangamia
Glabra) and anywhere some scrubs are seen. There are no grass land in the watershed.
Somewhere grass patches are seen only on the bunds, roadside and other such places. Poor
percentage of massive green trees has been not seen in the watershed except Horticulture
backyard.
b- Horticulture :
There is no backyards or commercial horticulture plantation in villages are been in
some part of watershed.
c- Agroforestry :
The agriculture fields of the villages have some horticulture plantation at places
isolated trees whose frequency is seen as under agroforestry and some where in where in
backyards.

65
(3.8) Human Population:
a- Human Population:
Total Population of involved villages in watershed is 10048 with average family
size of six persons as delaled as follows
Table – 5 : Human Population
S.
No.
Name of village Nos. of
families
Human Population Total
Male Female Children
1 Utravali 551 1601 1470 768 3839
2 Asarauli 421 1273 1085 471 2829
3 Nawada 326 875 790 289 1954
Jalapi 155 662 526 238 1426
Total 1453 4409 3871 1766 10048
c- Categorization of Human Population :
In the total population of watershed villages, categories are defined as below :
Table – 6 : Population Categories
S.
No.
Particulars Unit
Number of families in population
in the villages
Population Family Remark
1 2 3 4 5 6
1 Agri Farmer No. 1740 606
2 Landless No. 356 73
3 Agri. Labour No. 304 61
4 Land less Labour No. 230 33
5 BPL Family No. 285 90
6 SC Family No. 1036 172
7 ST Family No. - -

66
(3.9) Land Holding :
All the categories of farmers as small, marginal, medium and large are involved in
land holding average of about 1-18 ha. Small land holding farmers are further scattered at
different places which makes cultivation very difficult. Distribution of term families
according to the size of the land holdings are given as below :
Table – 7 : Distribution of farm families according to their size of land holdings
S.
No.
Name of Village Total
Agri.
Land in
MWS
Land Holding Family (Nos.) Percentage
Marginal
(< - 1Ha.)
Small
(1–2
Ha.)
Medium
(2-4 Ha.)
Large
(4-7
Ha.)
Total
1 Utravali 265 136 92 37 - 265
2 Asarauli 270 138 119 12 - 270
3 Nawada 75 58 10 7 - 75
Jalapi 41 32 6 3 - 41
Total 364 227 60 - 651
(3.10) Live Stock Population :
Total live stock population of the watershed is 7016. Buffalos is preferred as mulch
animal compared to Cow. But milk yield is poor. Goats are also kept for milk as well as
for meat purpose. The breakup of livestock population is as follows :

67
Table – 8 : Live Stock Position
S.
No.
Name of
Village
Unit Live Stock Position Total
Buffaloes Cows Bullocks Goats
1 Utravali 625 289 38 76 1028
2 Nawada 648 176 36 18 878
3 Asarauli 709 395 95 51 1150
4 Rampur 540 190 46 29 805
(3.11) Infrastructure Social Feature :
a- Comprised villages in the micro watershed has moderate communication
facilities. Watershed linked with metaled road and approachable through
motarable road.
e- All the villages are electrified and have T.V. and Telephone connection.
f- Literacy rate in the watershed is very low all villages are having education upto
Junior High School.
g- Nearest small market is at Pahasu 13 Km. Nearest big market Bulandshahar is
about 60 Km. from watershed. Religious and ritual features are almost common
as in other parts af U.P. small land holding with large family size and more
than 25% of the labour force of the total population living below poverty line
indicate poor socio economic status of the watershed community.
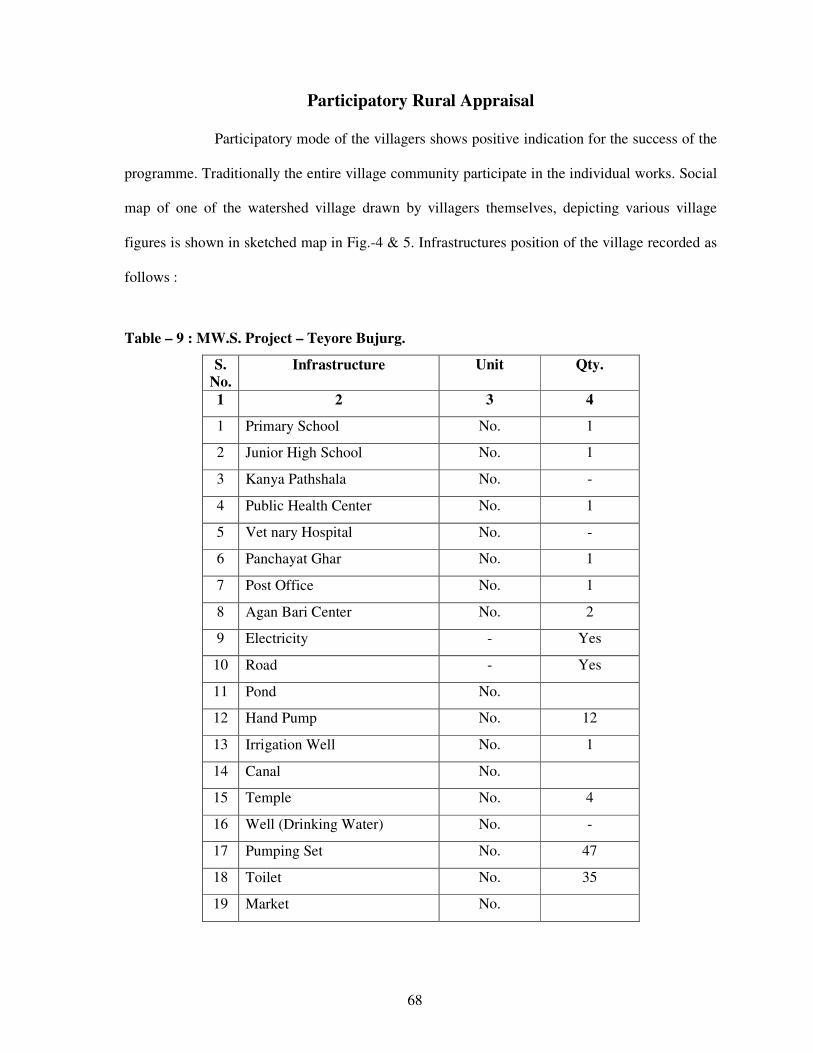
68
Participatory Rural Appraisal
Participatory mode of the villagers shows positive indication for the success of the
programme. Traditionally the entire village community participate in the individual works. Social
map of one of the watershed village drawn by villagers themselves, depicting various village
figures is shown in sketched map in Fig.-4 & 5. Infrastructures position of the village recorded as
follows :
Table – 9 : MW.S. Project – Teyore Bujurg.
S.
No.
Infrastructure Unit Qty.
1 2 3 4
1 Primary School No. 1
2 Junior High School No. 1
3 Kanya Pathshala No. -
4 Public Health Center No. 1
5 Vet nary Hospital No. -
6 Panchayat Ghar No. 1
7 Post Office No. 1
8 Agan Bari Center No. 2
9 Electricity - Yes
10 Road - Yes
11 Pond No.
12 Hand Pump No. 12
13 Irrigation Well No. 1
14 Canal No.
15 Temple No. 4
16 Well (Drinking Water) No. -
17 Pumping Set No. 47
18 Toilet No. 35
19 Market No.

69
SOCIAL MAP

70
Recorded importance of development institution
Farmers perception recorded for importance and role of different
development institution in relation to infrastructure. Importance has been depicted with
size of circle and role with distance from village circle. (Fig 8)
Fig. -8 (Venn diagram of Micro watershed)
(3.12) Communication :
Watershed can approached from Distt Headquarter Bulandshahar to Project area
57 km. by Road.
(3.13) Natural Resource Base :
Transact of watershed showed typical land use profile consisting of plain
agriculture land, erosic area and medium ravenous ridge. Main source of the irrigation are
the canal for pre showing irrigation only. The total geographical area of the watershed is
472.00 Ha. classification.
Approach roads for the micro watershed is shown for the communication is shown
on topo sheet map Fig 9 as next page.
UTRAVALI

71
Fig.- 7 Communication Map on Toposheet
Table – 10 : Classification of area(Hect.)
S.No
.
Name of
Village
Unit Total
Geographical
Area
Rainfed
Area
Wastela
nd
Village
Land
and
Road
Irrigation Resource
Water
Bodies
Borewell
1 2 3 4 5 6 7 8 9
1 Utravali Ha. 238.360 212.26 10.72 4.06 - 35.25
2 Asrauli Ha. 278.64 229.30 16.01 5.81 - 29.45
3 Nawada Ha. 73.00 62.00 3.06 3.04 - 18.26
4 Rampur Ha. 32.00 26.00 1.50 1.12 - 9.92
622.00 529.560 31.29 14.03 - 94.05

72
(3.14) Livelihood :
Total Population of the watershed is 8936 and out of the total population a majority
more than 80% has farming as their major source of livelihood followed by labours,
serviceman and small business class. Classified livelihood given in form as fallows :
Table – 11 : Livelihood Classification in population :
S.
No.
Name of Village Farmer Labour In
Service
In Local small
business
Others
1 2 3 4 5 6 7
1. Utravali 265 227 185 18
2. Asrauli 270 159 38 24
3. Nawada 75 204 38 14
4. Rampur 41 102 41 8
(3.15) Dependency of forest fuel wood and fodder :
a. Fuel wood :- The main source of fuel is from cow dung cake, woody stem of
crops. About 70% of the climactic energy requirement is met from the agriculture
by product and cow dung cake. Rest is met out from the forest outside the village
and watershed boundary, most preferred fuel wood is Juliflora fuel wood Juliflora
obtained from standing along and between watershed.
c- Fodder :- Villages have not any sufficient signified dependency on forest based
fodder as these resource are nothing availability in the forest.

73
(3.16) Labour requirement :
Labour requirements was found to be maximum at the time of October, November
and December when the sawing of Rabi crops are done. The crucial periods are March and
April coinciding harvesting and threshing of Rabi crops and July/August is sowing Kharif
Crops take a little place. Other income generating enterprises having potential during the
remaining.
(3.17) Crop Rotation :
Present Crop rotation in the watershed comprise of :
Kharif - Bajra - Rare
Maize - Rare
Jwar - Rare
Rabi - Fallow Wheat - Major
Fallow Barly - Major
Fallow Sugarcane - Major
Fallow Mustard - Major
Zayad - Urad, Moong, Makka, Arahar
The above said Rabi Crops is the most prevailing crop rotation on the agriculture
lands both in the rainfed and irrigated conditions.
Organized vegetable cultivation fruit plantation and traditional agro forestry
systems are lacking as per requirement in the watershed the limited vegetable cultivation
in the watershed is confined as kitchen gardens and field to the irrigated condition in a
scattered manner. The cultivation of cash crops other than the sugarcane, wheat and
mustard also in the watershed.
(3.18) Historical Events :
Chronological record of important events of the watershed village is prepared
through participatory rural appraisal (PRA) which is very useful in understanding of its
background and chronology is given as follows :

74
Table – 12 : Historical Events
S.
No.
Events/Activities Year Rem.
1 2 3 4
1 Established 1651
2 Opening of Primary School 1962
3 Opening of Junior School 2004
4 Opening of Kanya Pathshala -
5 Opening of PHC 2003
6 Opening of Vet. Hospital -
7 Panchayat Ghar 2001
8 Introduction of Tractor 1972
9 Gobar Gas Plant -
10 Thresher 1972
11 First Tube well/Pumpset 1976
12 First Motorcycle 1981
13 T.V. & D.V.D. Players 1994
14 Electricity in Village 2001
15 Bituminous Road 2006
16 First Hand Pump 1952
17 Templo Renovation 1999
18 First Land Line Telephone 2003
19 Planning for Watershed Project 2010-11
(3.19) Present Land Use in the Watershed :-
The watershed has diversified land uses. The varied present land use under
different use in the watershed. The mixed land use followed in the watershed is almost
similar in other parts of U.P. During P.R.A. Exercise prepared land has been shown in
Table No. 13, 14 & 15.
Table – 13 : (Ownership) S.
No.
Name of Village Pvt. Agri. Land Govt.
Revenu
Land
Forest
Land
Other
Land S.C./S.T. Others
1 2 3 4 5 6 7
1 Utravali 69.167 189.193 - - 6.640
2 Asrauli 52.240 209.433 5.137 - 3.190
3 Nawada 9.240 65.760 - - -
Rampur 8.270 31.390 - - 1.340

75
Table –14 : (Present Land under different categories)
S.
No.
Name of Village Land Use (Ha.)
Agricultural Wasteland
(All Types)
Seasonal
waterbodies
Village/Raod
Etc.
Total
1 2 3 4 5 6 7
1 Utravali
2 Asrauli
3 Nawada
Rampur
Table – 15 : (Present land use classified)
Proposed Post Land Use has been given on Page No. 32
4- Focus on Present Land Use :
(4.1) Agriculture :
The total area under agriculture in the watershed is about 487.89 ha. out of which
574.00 ha. is under rainfed agriculture. Agriculture land uses in the watershed extended to
diversified land capabilities starting marginal to good class II land. The irrigated and
drinking water is most scarce natural resource in the watershed. The operation of tube well
for irrigation of agricultural crops frequently leads to the drinking water. Problem to the
farmers of watershed forcing them to carry drinking water from outside of the watershed
area. The agricultural field bund are common in the watersheds however they frequently
breach on heavy rains.
Various mixed texture of soils are located in patches through out the watershed.
The heavy soils are almost kept fallow during rainy season. the agricultural soils also have
S.
No.
Land Use Under Unit
(ha.)
Area
(Ha.)
Percentage
1 2 3 4 5
1 Under Agriculture Ha 476
A- Rainfed- Ha 398
I- Crops Hact 371.28 78%
II- Agro forestry Hact 71.4 1.5%
B- Irrigated- - - -
I- Assured Hact 42.84 9%
II- Portial Hact 52.36 11%
2 Wasteland - - -
A- Aforestation - - -
B- Pasture - - -
C- Untreatable Hact 19.51 45%
D- Treatable Hact 23.85 55%

76
some as share calcium pan at variable depths. The irrigation water is conveyed by the
earthen channels. Surface irrigation methods following mainly border method of flood
method by the formers in the watershed. These factors reduce the water use efficiency of
limited and valuable irrigation water.
Drought hardy species like Juliflora suitable multi purpose trees is suitable for
rehabilitation of the wasteland. Rehabilitation of waste lands promoting agro forestry with
appropriate fruit and forest species suitable vegetative barriers on sloppy lands can be high
future value and by these adoption would be meet out many demands of fire wood and
fodder in the wasteland. Except above but also for soil and water conservation,
rehabilitation of wasteland and sustainable income generation for socio-economic
upliftment of farmers.
Crop Productivity :
The farmers also do not have suitable cropping system to deal aberrant weather.
Weeds impose considerable constraint in productivity of both Karif and Rabi crops under
irrigated as well as rainfed production system farmer undertake normally one manual
weeding in mustard and other valuable crops however, practices is energy and time
consuming. Use of we decide is rare in the watershed.
In the watershed area, limited cropping in the Kharif with mixed cropping practices
is not only irrigational but also unscientific and best for low productivity. Subsequent Rabi
crops in general. Sugarcane & Mustard crop in particular are raised on residual soil
moisture under rainfed production system during post mansoon season.
(4.2) Indigenous Technological Knowledge (ITK) :
Under process of PRA tracked out rural applying technology in various field of
local technology and some technology is very popular in village. In which the agriculture
is an old traditional practices of farmers who have improved themselves with passage of
the time according to their domestic needs and technological reforms in the nearby areas.
The villages have their traditional village ponds, practice of field bunding which typically
constitute agricultural related ITKs in the watershed. The Mustard & sugarcane being a
cash and firewood crop of the watershed and also sugarcane crop is being. Cultivated in
self designed manner by the farmers. Its carried out that the area is totally depend on rain
and under the rainfed area technology is applied by the farmers. However limited fertilizer
application specifically the DAP came in the practices since about 15-20 years.

77
(4.3) Forest and Other Vegetation :
Forest :
The watershed have a tract of wasteland area which are under uncultivable position
is liesed in the watershed. These wasteland have not any tree vegetation or very less than
real requirement for the wasteland use.
Horticulture/Agro forestry :
Horticulture and agro forestry practices were observed in the watershed.
(4.4) Agro forestry :
Agro forestry practices are lacking in the watershed. Though it has good potential
under existing disposition and may a role particularly with respect to minimization of
cropping risk, built up soil fertility and productivity, protection of soil erosion, soil
conservation partly meeting out the fire wood demand of rural community and more over
optimizing the economical return from system as whole under typical semi arid climate in
the watershed. Bund and boundary plantation also have good potential to care the fire
wood and fodder demands of the rural community in the watershed. The existing area
under agro forestry is almost negligible. Prosopis Jhliflora may be planted as block or sole
plantation specifically on marginal and degraded land in the watershed.
The agro forestry interventions comprising of ber, bail, aonla, guava, papular etc.
may be applied for benefit of the farmers under rainfed to irrigation production system on
leveled to slopping and marginal agricultural using proper planting techniques and term it
control measures.
The multipurpose trees may be also help in supplementing fire wood and fodder
demands of the rural community in the watershed and my be planted as hedge rows on
rainfed, marginal and degraded lands.

78
(4.5) Horticulture :
Fruits and vegetables practices are lacking in the watershed area. Its practices may
be sustainable very good potential for the formers of watershed. There are a limited lack
fruit trees in number like mango, guava, lime, ber, aonla and papaya fruit trees well as
vegetables like radish, okra, tomato, cabbage, garlic, onion, chilly, bringer and cucurbits
but they are found surviving well in the watershed villages. Organized orchards (vatika)
commercial vegetable cultivation horti-agri and other systems of agro forestry etc. are
lacking but have good agriculture.
5. Soil and land capability classification :
(5.1) Soil Morphology :
Watershed is located North East corner of Bulandshahr Distt. near about 55 Km.
away. The entire terrain of watershed is topographically divided into various land forms.
Accordingly the soils of watershed have been grouped major categories is given as follow
:
Hill Terrain Plane
Land
Sloppy
Undulated
Land
Rill Erosic
Land
Moderate
ravenous
- 25% 20% 15% 7%
Given categories in the blocks is located the soil morphology in the watershed
areas. Representation of soil characteristics by soil profile is represented as follows :
Soil Profile :
Fig. – 9 (Soil Profile)

79
Table – 16 : (Morphology of a Typical Soil Profile) :
Horizone Depth in
Cm.
Morphology
1 2 3
A
V & H
0-150 Silky when moist, Hard when dry quick
soluble, high elasticity, fissures, and cracks,
occasional occurrence of free calcium
carbonate granules black in colour, clay
content 29%, PH- 8 to 8.7
B
V & H
150-160 Whitish yellow in colour, very fine mixed
with free cacaos and gravels, Hard when dry
compact and indurate hard pan restricting
development of root and down ward water
transmission.
C
V & H
7600 Red and white sand stone
(5.2) Soil and Characteristic and Fertility Status :
Soil characteristic pertaining to soil fertility of various classes accruing around
villages in the watershed are given as follows :
Table – 17 : Soil Characteristic & Fertility Status :
Sl.
No.
Soil Properties LCC-II LCC-III
& IV
1 2 3 4
1 Sand % 47.04 75.04
2 Silt % 24.40 18.60
3 Clay % 28.36 6:4:6
4 Texture Sandy Clay Lomy Sand
5 PH (1:2) 7.05 7.55
6 Organic Carbon % 37 0.12
7 Available N Kg ha-1
316 173
8 Available P Kg ha-1
29 15
9 Available K Kg ha-1
189 326
10 EC (dS m-1
) 0.47 0.12

80
(5.3) Land Capability Classification (LCC) :
Land capability classification (LCC) was done to classification the soils in
different groups based upon the limitations and to emphasize the hazards prevailing in the
watershed in order to find out the different topo-sequences, landforms, soil depth and
erosion hazards. This was followed by the detailed investigation of selected landforms to
bring out the LCC classes of the Watershed. Classes of land capability namely II, III, IV
and V are demarcated in the watershed. The areas under different classes are sown as
follows :
Table – 18 : Land Capability Classification (LCC) :
S. No. Land capability
class
Area in Ha. Colour
1 2 3 4
1 I Class - -
2 II Class 80.240 15%
3 III Class 395.214 70%
4 IV Class 74.174 10%
5 V Class 38.074 5%
6 VI Class - -
7 VII Class - -
8 VIII Class - -
Land capability classification of various agricultural practices under land use can
be classified as groups, class, sub class and units. Utilization of various land class is given
as follows :
Table – 19 : Utilization of various land uses

81
(5.4) Land Capability Class II & III :
This group is one of the most extensive LCC watershed. and also near to class III
for the agricultural practices. The soils are sandy & sandy loam in texture. The land under
this class is nearly level to mild sloping (1-3%). The soils are deep and erosion hazard is
slight. Most of the productive agriculture land comes under class II & III. These lands
potentially very productive but due to rainfed a single cropping pattern is in habitation.
(5.5) Land Capability Class IV :
This class is found in lower portion near the outlets of watershed. The soils are
coarser in texture, deep, erosion hazard and undulating in topography. Rill and initiation of
gully can be seen near the outlet of the watershed.
(5.6) Land Capability Class VII & VIII :
This class of land is not found in watershed. Somewhere lack of soil are found with
admixture gravels fragments in these classes of lands.
(5.7) Conclusions :
The majority of land form is coming under class II, which give an insight of good
agriculture production potential of the watershed.
The land capability classification provides reasonable good information with
regard to capability of soil, that could be used for agriculture, agrihorticulture, silviculture
and posture development.
The productivity of these lands could be further enhanced by adoption of simple
soil & water conservation measures like bunding practices.
The reasonable area is under watershed of wasteland and other wasteland including
grater potential of this watershed for forestry and pasture development. Rare places
namely water body of low portion of land area under seasonally works as water harvesting
structures and these harvested water is used or can use for some other benificial activities
during the crop season also.
6. Problems and needs of the watershed indentified during the PRA
(6.1) Problem Identification and prioritization :
f- The are has undulating topography, steep unstable slopes, gradient of excessive
branches of rills and hence highly prone to soil erosion.
g- Major issues addressed to food sufficiency economic growth and environmental
security in the watershed area.
h- Effective soil depth is limited and highly variable hampering good crop growth.

82
i- The watershed have low productive cropping due to tradition single cropping
pattern and over all average crop production percentage not sufficient against
requirement.
j- Identified that there is no assured irrigation system has been development capacity
of water bodies are reduced due to silt ration which are utilized to store of rainy
water and they are renovatable.
(6.3) Transact walk during the PRA :
Problems identified and prioritized during the transact walk and PRA exercises in
all comprised villages of watershed. There were pooled and a list of problems
representing the whole watershed was prepared. Problems were ranked as per their total
weight age in the watershed village.
Table – 20 : Ranking of Problem identification and prioritization of watershed
S.No. Problem Rank
1 2 3
1 Lack of irrigation 3
2 Lack of drinking water 3
3 Low production of field crops 6
4 Lack of fodder availability and low productivity 4
5 Lack of availability of fuel wood 3
6 Lack of market facility 5
7 Lack of quality seeds, fertilizer, pesticides etc. 5
8. Medical and Health care facilities for milching
animals and low productivity.
7
9 Lack of medical, educational and transportation
facilities
7
10 Lack of water bodies renovation 9
11 Lack of run of earthen check bunds 1
12 Lack of water harvesting structures 1
13 Lack of livelihoods opportunity 2
Prioritized ranking (Upto four Numbers) :-
4- Lack of earthen check bunds.
5- Lack of livelihood opportunities.
6- Lack of irrigation water was the greatest problem. Lack of irrigation water
problem experienced by the people followed by low crop production.
(6.3) Analysis of SWOT of the watershed :
Strength (S), Weakness (W), Opportunity (O) and Threat (T) analysis is a
useful decision support tool. A SWOT analysis of watershed is presented as
follows :
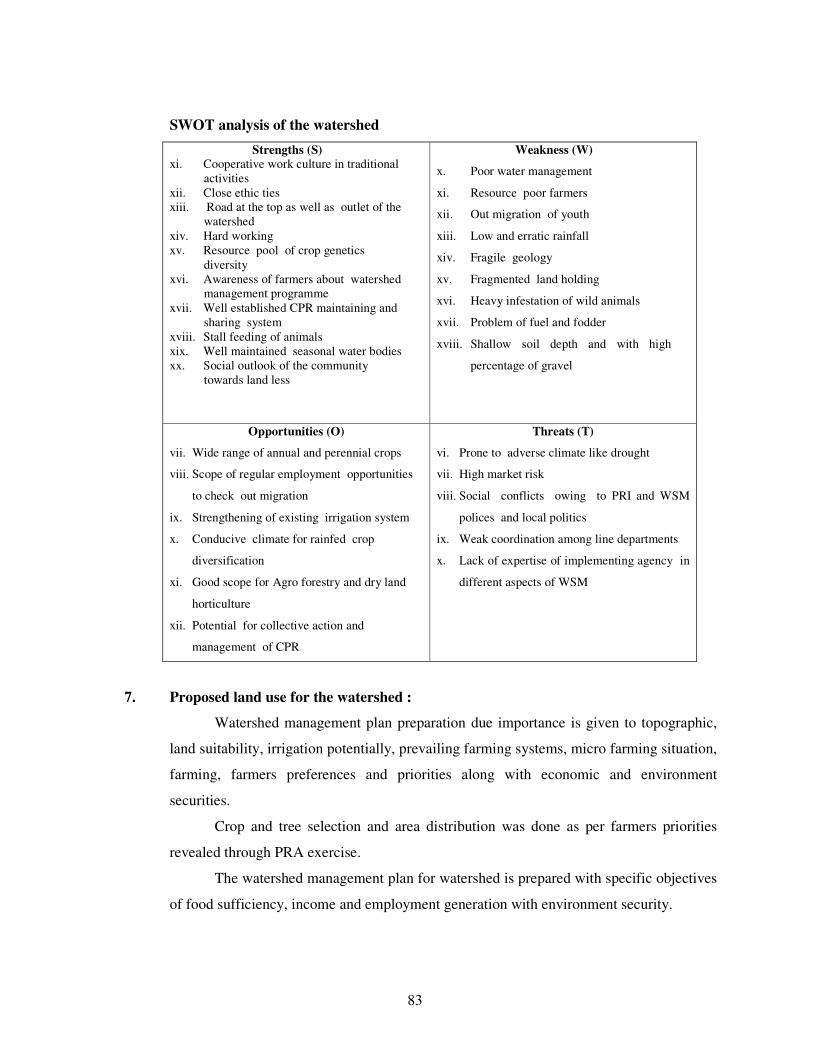
83
SWOT analysis of the watershed
Strengths (S)
xi. Cooperative work culture in traditional
activities
xii. Close ethic ties
xiii. Road at the top as well as outlet of the
watershed
xiv. Hard working
xv. Resource pool of crop genetics
diversity
xvi. Awareness of farmers about watershed
management programme
xvii. Well established CPR maintaining and
sharing system
xviii. Stall feeding of animals
xix. Well maintained seasonal water bodies
xx. Social outlook of the community
towards land less
Weakness (W)
x. Poor water management
xi. Resource poor farmers
xii. Out migration of youth
xiii. Low and erratic rainfall
xiv. Fragile geology
xv. Fragmented land holding
xvi. Heavy infestation of wild animals
xvii. Problem of fuel and fodder
xviii. Shallow soil depth and with high
percentage of gravel
Opportunities (O)
vii. Wide range of annual and perennial crops
viii. Scope of regular employment opportunities
to check out migration
ix. Strengthening of existing irrigation system
x. Conducive climate for rainfed crop
diversification
xi. Good scope for Agro forestry and dry land
horticulture
xii. Potential for collective action and
management of CPR
Threats (T)
vi. Prone to adverse climate like drought
vii. High market risk
viii. Social conflicts owing to PRI and WSM
polices and local politics
ix. Weak coordination among line departments
x. Lack of expertise of implementing agency in
different aspects of WSM
7. Proposed land use for the watershed :
Watershed management plan preparation due importance is given to topographic,
land suitability, irrigation potentially, prevailing farming systems, micro farming situation,
farming, farmers preferences and priorities along with economic and environment
securities.
Crop and tree selection and area distribution was done as per farmers priorities
revealed through PRA exercise.
The watershed management plan for watershed is prepared with specific objectives
of food sufficiency, income and employment generation with environment security.

84
Technical options were with the ITK based on the latest available experiment
findings. Due attention was given to the resource of the farmers and adjustments were
made in capital intensive resource demanding technological outputs while making them
adoptable to the resource poor farmers. Emphasis was given on maximum use of farm
yard manure. The proposed land use plan of the watershed is shown as follow as in table
Table – 21 : Present and proposed land use plan of the watershed
S.No. Land use Present
(ha)
Proposed area
(ha)
1 2 3 4
1 Agriculture
a Rainfed
I Crops 334.210 518.180
II Agro-forestry 8.340 62.172
b Irrigated
I Assured 35.58 35.58
II Partial 67.12 86.68
2 Waste land - 14.10
a Aforestation - 2.5
b Pasture - -
c Untreatable - -
d Treatable 69.51 31.23
3 Village land 52.60 52.66
(7.1) Status of Present Water Resources Utilization :
Watershed is having some canal system. Management and maintenance of these
canal are required. Before sowing of Rabi crops, water from these canal is issued as
supplementary irrigation for Rabi sowing ar allowed to go as waste. After releasing water
from canal, submergence area also put under cultivation.
Some where bore well irrigation applied by the farmers in the watershed.

85
(7.2) Proposed Plan for Irrigation Development :
a- Present system of irrigation and wastage of water during October–November
need to be made more efficient from water management point of view by
minimizing conveyance losses in the existing water courses.
b- Present irrigation canal capacity have to build up by the reform. Which are lack
capacity of water.
c- Construction of new water harvesting earthen structures, Pucca Check Dem, Series
Gully Plugging, etc. has been sloppy portion to increase irrigation potential and for
recharging of ground water, soil and moisture conservation maximum field
irrigation, best production and expected change of crop rotation.
d- The up gradation of the exciting system of irrigation will result in :
i- Minimization of conveyance losses.
ii- Increase in frequency of irrigation.
iii- Adoption of high yielding varieties of crops.
iv- Assured cultivation of cash crops.
v- Capacity buildup by the planning of new water harvesting structures.
(7.3) Ground Water Recharge :
For the purpose of ground water recharge, the area of the upper side of watershed
is recommended for Field Bunds, Contour Bunds, Peripheral Bunds and Submergence
Bunds and in the lower portion Contour Staggered Trenches, Gully Plugs, Earthen Check
Dem and Pacca Outlets. In the undulated sloppy portion of the watershed recommended
water harvesting structure for dual purpose as ground water storage and under ground
water recharge.
(7.4) Crop Production :
Practices proposed in the watershed is given as follows :-
a- Mulching and crop residue management.
b- Application of green manuring.
c- Vermi Composting.
d- Crop rotation and inter cropping.
e- Biofertilizers.
(7.5) Tillage Operation :
Deep tillage technology is proposed to apply to be demonstrated for benefit of
farmers in the watershed.

86
(7.6) Improved Seeds of High Yielding Verities (H.Y.V.) :
Recommendation of improved varieties is necessary for improving the productivity
and farm income. Through replacement of low yielding traditional verities of seeds in
villages of watershed.
(7.7) Balanced Fertilizer Use :-
Demonstration of use of fertilizer in various crops of watershed recommended
balance fertilizer use in different crops will be benefited of forming community.
(7.8) Control of insects and diseases :
Aphid in the mustard are the major insects in the watershed areas leading to loss in
crop productivity. Similarly white blister is also a common disease in the mustard crop.
The management strategies of these insect pest and diseased will also be
demonstrated in the watershed for benefit of the growers.
(7.9) Dry Land Horticulture :
Such portion of dry land in which proposed horticulture development planning
recommended species like Ber, Bel and Aonla will be planted at suitable spacing in the
watershed.
(7.10) Agri Horticulture :
Aonla and Sahjan would be suitable horticultural crops to the locality. Therefore, a
part of land in the farmer field shall be selected and brought under Agri-horticulture
system. The cropping system followed will be Jwar and Wheat.

87
(7.11) Plantation (Fuel wood) :
Such a portion which are under wasteland will be taken falling in the class-IV
category in the watershed. These lands will be planted with species like Vilayati Babool
(Prosopis Juliflora), Babool (Acacia Nilotica), Karanj (Pangamia Glabra).
9. Socio Economic Analysis of the of the Project :
(9.1) Sustainability and environment security :
The proposed land use plan will improve the land utilization index and crop
diversification index significantly as compared to the existing one. in the proposed
watershed management plan proper blending of the bio engineering measures will be
applied on above 80% of the total area of watershed. It is estimated that more than above
70% of the watershed area will be treated and consequently the soil loss and runoff from
the area is excepted to be reduced by 70% respectively.
It will help in maintaining ecosystem integrity on sustained basis along with
improving the livelihood security of the farming community.
(9.2) Economic Analysis :
Economic analysis of the project was carried by taking direct benefits and costs
considering 10 years for project life at 10% discount rate. Whole watershed development
plan was divided into three sector as agriculture, horticulture and forest/Fuel wood
plantation. Net Present Value (NPV) and Benefit Cost ratio criteria were applied judge the
economic efficiency of each enterprises and sector. Net present value (NPV) of the project
life is considered to be 10 years and discount rate for NPV estimation is 10% is given
NPV and benefits as follows :-

88
Table – 22 : Present productivity income analysis :
S.
No.
Name of
Sector
Name of
Crops
Produ
cti-
on/ha.
Rate/
Qtl.
Cost of
Production
Expend. of
cultivation
Net
income
B.C. Ratio
between
Col. 8 & 7
1 2 3 4 5 6 7 8 9
A Agriculture Urad 3.00 4500.00 13500.00 5450.00 6450.00 1:1
Moong 3.00 4600.00 13800.00 6075.00 7425.00 1.12:1
Jwar 4.80 600.00 2880.00 1584.00 1296.00 0.82:1
Wheat 18.50 1000.00 18500.00 8650.00 7075.00 0.82:1
Pea 7.50 2400.00 18000.00 10970.00 5905.00 0.54:1
Mustard 3.50 2400.00 10150.00 3235.00 3240.00 1:1
Total - 54105.00 51000.00 0.94:1
Average - 6763.00 6375.00 0.94:1
B Forestry Vilayati
Babool
15000.00 - Nil
C Horticulture Ber 20000.00 - Nil
Aonla 20000.00 - Nil
Bel 20000.00 - Nil
Total - 60000.00 - Nil
Average - 20000.00 - Nil
Grand Total -

89
Table –23 : Post productivity and income analysis for Post Productivity
Value and B.C.:
S.
No.
Name of
Sector
Name of
Crops
Produ
cti-
on/ha.
Rate/
Qtl.
Cost of Production
Expend. of
cultivation
Net
income
B.C. Ratio
between
Col. 8 & 7
1 2 3 4 5 6 7 8 9
A Agriculture Urad 4.00 5000.00 20000.00 8325.00 11615.00 1.39:1
Moong 4.00 5000.00 20000.00 8200.00 11800.00 1.44:1
Jwar 5.50 800.00 4400.00 1900.00 2500.00 1.32:1
Wheat 25.00 1000.00 25000.00 11680.00 13320.00 1.14:1
Pea 9.50 3500.00 33250.00 14810.00 18540.00 1.12:1
Mustard 5.00 3000.00 15000.00 4370.00 8130.00 1.86:1
Total - - - 172250.00 72845.00 99765.00 1.38:1
Average - - - 21531.00 9061.00 12471.00 1.38:1
B Forestry Vilayati
Babool
80.00 500.00 40000.00 15000.00 25000.00 1.67:1
C Horticulture Ber 35.00 1500.00 70000.00 20000.00 32500.00 1.63:1
Aonla 35.00 2000.00 70000.00 20000.00 50000.00 2.50:1
Bel 40.00 1500.00 80000.00 20000.00 40000.00 2:1
Total - 182500.00 7000.00 122500.00 2.04:1
Average - 60833.00 20000.00 40833.00 2.04:1
Grand Total - 1394750.00 147485.00 247265.00 1.68:1
Table –24 : Summary of NPV, PPV and B.C. Ratio (Sector wise) :
S.
No.
Name of Sector NPV PPV B.C.
Ratio Expend. Net
Income
Expend. Net
Income
1 2 3 4 5 6 7
1 Rain fed
Agriculture
54105 51000 72485.00 99765.00 1.38:1
2 Forest/Fuel wood
Plantation
15000 - 15000 25000 1.67:1
3 Horticulture 60000 - 60000 122500 2.04:1
Total 129105 51000 147485.00 247265 1.68:1

90
(9.3) Economics of Agriculture Sector :
The development cost can be recovered by the adoption of plan in present rain fed
agriculture is being done on well maintained field, therefore does not require much
investment. In rain fed agriculture, investment of Rs. 44.50 lacs is proposed to made is
given as fallows :
Table – 25 : Economics of Agriculture Sector :
S.
No.
Name of
sector
Name of Activities
/ Plan
Treatble
Area
(Ha.)
NPV
(Lacs)
Post
Productivity
Value (Lacs)
Benifit /
Income
B.C.
Ratio
1 2 3 4 5 6 7 8
1. Rainfed Soil, moisture
and water cons
works
560 29591 921.01 413.08 1:38:1
(9.4) Economics of forest fuel wood plantation :
Economic analysis of fuel wood plantation in the watershed. Project life is
considered to be 20 years and discount rate for NPV estimation is 10 % is followed and as
is given follows :
Table –26 : Economics of forest fuel wood Plantation :
S.
No.
Name of
sector
Comman Name of
Plant
Area
(Ha.)
NPV
(Lacs)
Post
Productivity
Value (Lacs)
Benifit /
Income
B.C.
Ratio
1 2 3 4 5 6 7 8
1. Forest
Fuel
wood
sector
Vilayati Babool
(Prasopis
Juliflora)
25 2.5 6.675 4.675 1.67:1
(9.5) Economics of Horticulture Sector :
Economic analysis of Horticulture Plantation in agri-horti system and on wasteland
patches of watershed project, life is considered about 15-20 years and discount factor rate
for NPV estimation is 10% is follows :

91
Table – 27 : Economics of Horticulture system :
S.
No.
Name of
Sector
Common name of Plants Area
(Ha.)
NPV
(Lacs)
Post
Productiv
e Value
(Lacs)
Benefit
Lacs
B.C.
Ratio
1 2 3 4 5 6 7 8
1 Horticulture Ber (zyziphus
mouritana)
4.00 0.80 2.104 1.304 1.63:1
Aonla (Embelica
officianalis)
3.80 0.76 2.660 1.90 2.5:1
Bel (Aegle marmelos) 2.20 0.44 1.320 0.88 2:1
Total 10.00 2.00 6.084 4.084 2.04:1
(9.6) Food requirement and sufficiency :
Achieving self sufficiency in food production is one of the prime objectives of
watershed project. The status of food requirement and production before and after the
project is presented as is follows :
Table – 28 : Status of food requirement and availability of per annual :
S.
No.
Name of Foods Requirement
Q./Yr.
Present Status Expected Post Status
Availability
Q./Yr.
Deficit or
surplus
Q./Yr.
Availability
Q./Yr.
Deficit or
surplus
Q./Yr.
1 2 3 4 5 6 7
1 Cereals 110 Kg. 11053 9395 - 1658 18790 9937
2 Pulses 36.50 3668 2017 - 1651 6602 2934
3 Oil Seeds 29.20 2934 1174 - 1760 4698 1764
4 Vegetable 71 kg 9144 1829 - 7315 16459 7315
(9.7) Employment generation :
One of the major problem of the labour migration in watershed project. By the
implementation of the project activities employment opportunities will be generated.
However the changes in land use pattern and adoption of other subsidiary enterprise will
generate employment opportunities in the watershed as given in table follows :
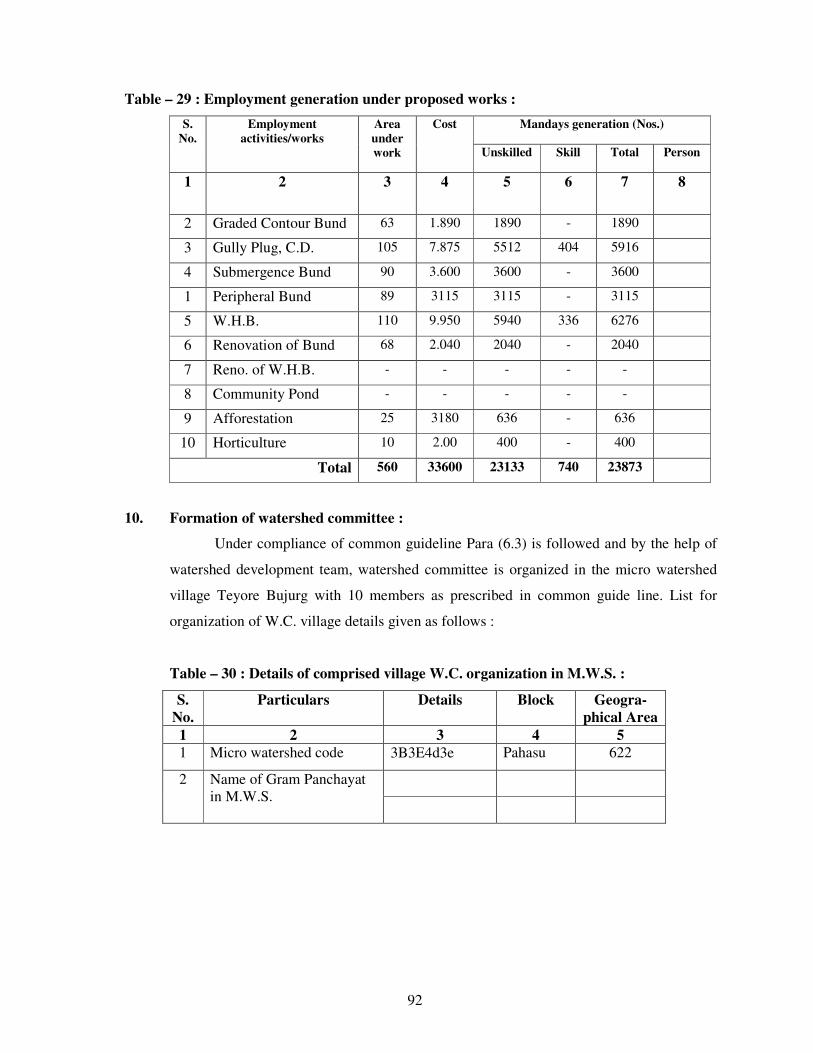
92
Table – 29 : Employment generation under proposed works :
S.
No.
Employment
activities/works
Area
under
work
Cost Mandays generation (Nos.)
Unskilled Skill Total Person
1 2 3 4 5 6 7 8
2 Graded Contour Bund 63 1.890 1890 - 1890
3 Gully Plug, C.D. 105 7.875 5512 404 5916
4 Submergence Bund 90 3.600 3600 - 3600
1 Peripheral Bund 89 3115 3115 - 3115
5 W.H.B. 110 9.950 5940 336 6276
6 Renovation of Bund 68 2.040 2040 - 2040
7 Reno. of W.H.B. - - - - -
8 Community Pond - - - - -
9 Afforestation 25 3180 636 - 636
10 Horticulture 10 2.00 400 - 400
Total 560 33600 23133 740 23873
10. Formation of watershed committee :
Under compliance of common guideline Para (6.3) is followed and by the help of
watershed development team, watershed committee is organized in the micro watershed
village Teyore Bujurg with 10 members as prescribed in common guide line. List for
organization of W.C. village details given as follows :
Table – 30 : Details of comprised village W.C. organization in M.W.S. :
S.
No.
Particulars Details Block Geogra-
phical Area
1 2 3 4 5
1 Micro watershed code 3B3E4d3e Pahasu 622
2 Name of Gram Panchayat
in M.W.S.
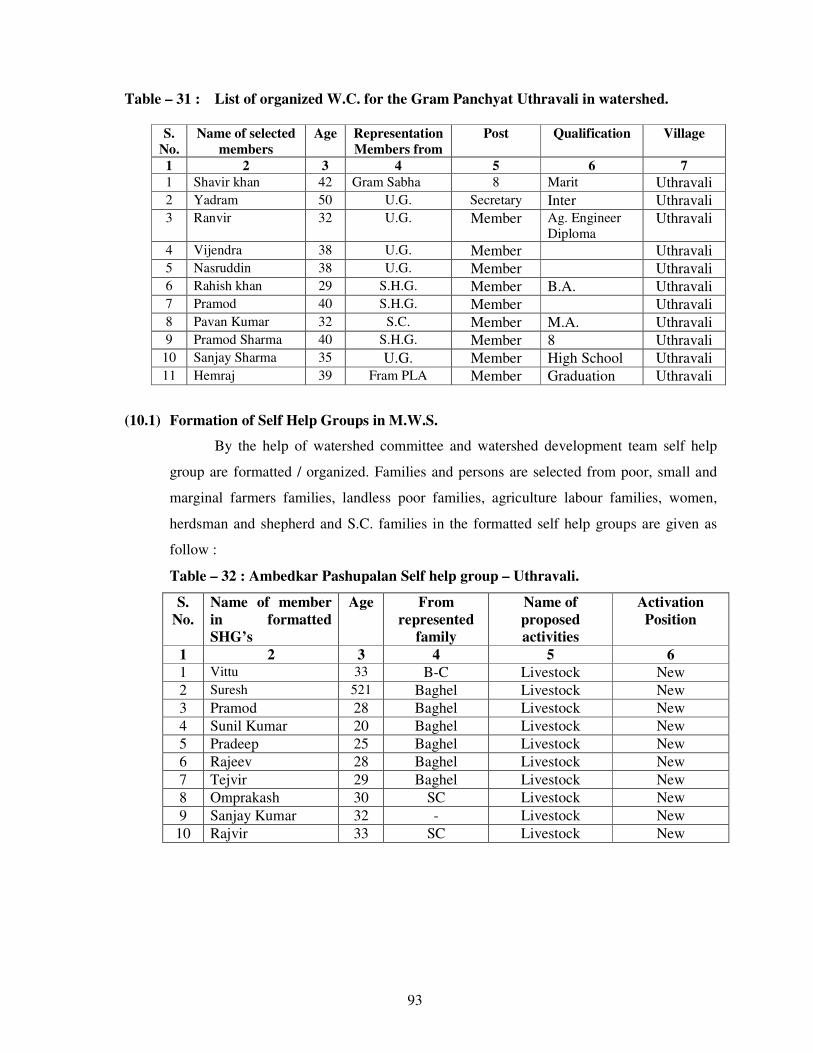
93
Table – 31 : List of organized W.C. for the Gram Panchyat Uthravali in watershed.
S.
No.
Name of selected
members
Age Representation
Members from
Post Qualification Village
1 2 3 4 5 6 7
1 Shavir khan 42 Gram Sabha 8 Marit Uthravali
2 Yadram 50 U.G. Secretary Inter Uthravali
3 Ranvir 32 U.G. Member Ag. Engineer
Diploma Uthravali
4 Vijendra 38 U.G. Member Uthravali 5 Nasruddin 38 U.G. Member Uthravali 6 Rahish khan 29 S.H.G. Member B.A. Uthravali 7 Pramod 40 S.H.G. Member Uthravali
8 Pavan Kumar 32 S.C. Member M.A. Uthravali 9 Pramod Sharma 40 S.H.G. Member 8 Uthravali
10 Sanjay Sharma 35 U.G. Member High School Uthravali
11 Hemraj 39 Fram PLA Member Graduation Uthravali
(10.1) Formation of Self Help Groups in M.W.S.
By the help of watershed committee and watershed development team self help
group are formatted / organized. Families and persons are selected from poor, small and
marginal farmers families, landless poor families, agriculture labour families, women,
herdsman and shepherd and S.C. families in the formatted self help groups are given as
follow :
Table – 32 : Ambedkar Pashupalan Self help group – Uthravali.
S.
No.
Name of member
in formatted
SHG’s
Age From
represented
family
Name of
proposed
activities
Activation
Position
1 2 3 4 5 6
1 Vittu 33 B-C Livestock New
2 Suresh 521 Baghel Livestock New
3 Pramod 28 Baghel Livestock New
4 Sunil Kumar 20 Baghel Livestock New
5 Pradeep 25 Baghel Livestock New
6 Rajeev 28 Baghel Livestock New
7 Tejvir 29 Baghel Livestock New
8 Omprakash 30 SC Livestock New
9 Sanjay Kumar 32 - Livestock New
10 Rajvir 33 SC Livestock New

94
Table – 33 : Self help group Utharavli – Buffaloes.
S.
No.
Name of
member in
formated
SHG’s
Age From
represe-
nted family
Name of
proposed
activities
Activation
Position
1 2 3 4 5 6
1 Shri Shavir khan 65 HS Dairy New
2 Shri Vasir khan 65 B.A. Dairy New
3 Shri Kalekha 25 8 Dairy New
4 Shri Rahish 26 - Dairy New
5 Shri Raju khan 65 - Dairy New
6 ShriAsmohammad 40 8 Dairy New
7 Shri Prem 50 - Dairy New
8 Shri Dinesh 40 - Dairy New
9 Shri Satish 30 8 Dairy New
10 Shri Gopal 50 5 Dairy New
Table – 34 : Self help group in Teyore Bujurg of watershed.
S.
No.
Name of
member in
farmated
SHG’s
Age From
represe-
ntated
family
Name of
proposed
activities
Activation
Position
1 2 3 4 5 6
1 Mukesh Kumar 35 Inter Livestock New
2 Jayprakash 50 HS Livestock New
3 Satish 45 Inter Livestock New
4 Tekchand 30 Inter Livestock New
5 Jagdish 40 HS Livestock New
6 Pravesh Kumar 40 Inter Livestock New
7 Annu 47 Inter Livestock New
8 Ravi 28 Inter Livestock New
9 Vedprakash 45 HS Livestock New
10 Sarvan 55 HS Livestock New

95
Formation of User’s Groups :
User’s groups are farmated by the help of watershed committee and watershed
development team in the micro watershed comprised villages. Formers which have land
village are involved in the User’s groups and they will be direct benefited as expected by
the implementation of watershed project easy and convenienced condition are made to
resource use between user’s groups and they will be responsible to operate and
maintenance for the created assets in the watershed. Nos. of farmated user’s groups details
are given as follows :
Table – 35 : Village wise user’s groups
S.
No.
Name of
village
No. of
groups
No. of
farmers
Total
Agri.
Land
Area
under
treat-
ment
Cost of
essets
1 2 3 4 5 6 7
1 Uthravali 18 265 238.360 272.36
2 Asrauli 19 270 278.64 289.64
3 Nawada 5 75 73.00 32.00
4 Rampur 3 41 32.00 16.00
10. Estimation and Costing of Proposed activities of the watershed Project Year 2009-10.
Proposed works / activities for the Project Period (Year 2010-11) under proposed
treatable area 560.00 Ha. Out of total Geographical area 622.00 Ha.

96
(10.1) Financial and Physical Outlets :
Table – 36 : Financial and Physical Outlets for the Year 2009-10 :
Sl.
No.
Components Unit
cost
per
ha.
Physical
ha. Financial (Lacs) Man-days
Generatio
n Labour
Component
Material
Component
Total
1 2 3 4 5 6 7 8
A Management Cost 10%
1 Administrative Cost – TA & DA
Hiring of Vehicles,
Official Expenditure
Electricity & Phone bill
Computer, Stationery and office
consumable materials & contingency
1200 - - 6.720 6.720 -
2 Monitoring 120 - - 0.6720 0.6720 -
3 Evaluation 120 - 0.6720 0.6720 -
Sub Total 1440 - 8.0640 8.0640 -
B Preparatory Phase 10% - - - -
1 Entry Point Activities 4% 480 - 0.5376 2.1504 2.688 538
2 Institutional & Capacity Building 5% 600 - - 3.360 3.360 -
3 Detailed Project Report 1% 120 - - 0.672 0.672 -
Sub Total 1200 - 0.5376 6.1824 6.720 538
C Watershed Work Phase
a Watershed Development Works
1 Graded, Contour & Field Bunds 3000 63 1.890 - 1.890 1890
2 Gully Plug, Earthen Checkdam /WHS 7500 105 5.5125 2.3625 7.875 5916
3 Submergence bunds 4000 90 3.600 - 3.600 3600
4 Peripheral Bund 3500 89 3.115 - 3.115 3115
5 Earthen Water Harvesting Bund 9000 110 5.940 3.960 9.900 6276
6 Renovation of existing Bunds 3000 68 2.040 - 2.04 2040
7 Renovation of existing W.H.B - - - - - -
8 Aforestation and Development of silvi
postural system 12720 25 0.636 2.544 3.18 636
9 Dry Land Horticulture 20000 10 0.400 1.600 2.00 400
10 Community Pound (Renovation) - - - - - -
Sub Total 560 23.1335 10.4665 33.600 23873
B Livelihood Programme (Community Based) 7.620
Income generating activities through SHG’s for landless and marginal formers 10%
1 Live stock development activities 200 - - 1.1202 1.1202 -
2 Bee Keeping 100 - - 0.5598 0.5598 -
3 Poultry Farming 200 - - 1.1202 1.1202 -
4 Nursery Development 300 - - 1.6800 1.6800 -
5 Vegetable Production 100 - - 0.5598 0.5598 -
6 Milk Dairy Promotion Unit 200 - - 1.1202 1.1202 -
7 Establishment of Vermi compost Unit 100 - - 0.5598 0.5598 -
8 Sub Total 1200 - - 6.7200 6.7200 -
C Production System and micro Enterprises
1 Crop production, diversification of
agriculture and introduction of agro
forestry
1170 - - 6.552 6.552 -
2 Demonstration of improved
composting system 390 - - 2.184 2.184 -
Sub Total 1560 - - 8.736 8.736 -
D Consolidation Phase 5% Sub Total 600 - - 3.360 3.360 -
Grand Total 12000 - 23.6711 43.5289 67.200 24411

97

98
PROJECT AT A GLANCE
IWMP-II (Bulandshahar)
1 State Uttar Pradesh
2 Distt. Bulandshahar
3 Block Pahasu
4 M.W.S. Code 2B3E4d3d
5 Name of M.W.S. Project Nagla Amarpur
6 Involved Village N. Amarpur, Anauna Asroti,
Jagdishpur, Surjawali
7 Geographical Area of M.W.S. 468 Ha.
8 Rainfed Area 395
9 Treatable Area 413
10 Weightage
11 Cost of Project
12 For the year 2010-11
Budget Components
S. No. Components Area
(Ha.)
Cost
(in Lacs)
1 2 3 4
1 Management Cost 12% - 5.9472
2 Preparatory Phase 10% - 4.9560
3 Watershed Work Phase - -
A- Watershed Development Works 50% 413 24.780
B- Livelihood Programme (Community Base) 10% - 4.9560
C- Production System & Micro Enterprises13% - 6.4428
4 Consolidation Phase 5% - 2.4780
Total 413 49.5627

99
Executive Summary of the Project
Identified selected micro watershed project Nagla Amarpur is coded as 2B3E4d3d
has been proposed from cluster of I.W.M.P. Bulandshahar – II project in Pahasu Block district
Bulandshahar five villages namely Nagla Amarpur, Anauna, Surjawali and Asurauti is comprised
in the micro watershed which is located in the east of district Bulandshahar on the west bank of
River Kali Nadi and border of district Badaun area is known as Khadar. It lies between 280 -5’
and 150 -5’ N Latitudes and 78
0 -E and 78
0 -15 N Longitudes Covering area. Its altitudes ranges
from 181 meter to 190 meter above the mean sea level. Khurja Railway Station 184.11 m,
Bulandshahar Railway station is 201.18 m above mean sea level is displayed. Project area of
I.W.M.P. BSR-II is lied in the Pahasu Block of Bulandshahar District which is come in the
western plan zone under semi arid area. The annual average rainfall is near to 397 mm which an
average of 35 rainy days. Out of which about 85% is received during the mansoon season from
July to September and very less rainfall is received in the winter season.
Temperature ranges from as high as 420C in the May-June to as 3
0-4
0C during December –
January. The Trend of rain fall is highly erotic and maximum water goes as runoff.
Main occupation of the dwellers is agriculture in the watershed. Some part of the lands are
shown during the Kharif season. Cane sugar are preferred crops in the project area. The main
Crops raised are Wheat, Pea & Mustered & Maize
The topmost portion of the watershed is sloppy flat land. Other than topmost portion of the
watershed is under soil erotic portion and depreciative. The soil of the land are sandy loam Soil.
The middle agricultural position of watershed relatively smooth sloppy flat land with sandy loam
soil texture. These soil is yellow in colour and are inherently good in fertility status.
Natural vegetation of the watershed is very poor. Somewhere forest vegetation is
seen which are predominant with Vilayati Babool (Prosopis Juliflora), followed by Babool
(Accasia nilotica), somewhere Neem Plants (Azadirachta Indica), Shisham (Dolbergia Sisson) and
Karanj (Pongamia Glabra) are seen in occasional occurrence. There is no grass land in the
watershed. Somewhere grass patches are seen only on the bunds, road sides and other such places.
Coverage of massive green belt is in poor percentage for environment which is envisaged. That
watershed is very poor climate area.
There is normal condition of animal physics and for their fodder arrangement is the
watershed and creative possibility would be expected by the implementations of the project.
Due to Arial soil erosion poor harvesting managements, cropping pattern, non treated
watershed etc. are very anti effective causes for the watershed. Problem of the watershed is to be

100
tackled by harvesting structures which have last most of their capacity new water bodies for the
prevention of erosion and conservation of soil and moistures various type of earthen bunds in the
watershed field, necessity has been observed. Wasteland will be treated with staggered Trenches,
afforestation and bunding for the changing of characteristics.
The detail project report has been prepared by the applying of nine process steps
for the micro watershed code no. 2B3E4d3d brief is as follows.
STEP-1 Secondary data collection:-During the five days visit programme in the micro
watershed project with of all available documents of village label by approaching the
Gram panchayat collected secondary data.
STEP-2 Village meeting & conducting PRA exercise:-Community meeting conducted on fix
days for the consultation with villagers for the PRA Exercise. Participatory mode of
the villages was positive indicated for the success of programm. With good in testing
participation has been drawn social & resource map on ground & paper & discussed
un various topics of problematic thoughts in the micro watershed.
STEP-3 Socio economic survey:- The resource organization of village label volunteers
identified to conduct house hold socio economic survey/states.
STEP-4 Probel typology analysis:-Thoroughly analyzed the data & identified problem type as
soil & moisture conservation, crop rotation, crop coverage, productivity, livelihoods,
social issues & capacity building gaps etc. Probelms discussed with the watershed
committee & came up with alternative solution.
STEP-5 Conduct of net participatory planning (NPP):- The planning team visited together
in the planning blocks on the scheduled date along with the beneficiaries of the
villages & data gathered as for the participatory net planning.
STEP-6 Productivity & livelihood planning exercise:- For the product livelihood exercise,
group discussion on various livelihood as Agriculture, Animal husbandry enterprise
development held discussion with the villagers in the micro watershed.
STEP-7 Institutional & capacity building :- This plan is prepared based on the data
available in the field and auscultations with the watershed committee.
STEP-8 Data consolidation & documentation of DPR :- After gathering all required
information compiled collected data. Thoroughly discussed and finalized the expected
outcomes and benefits specially in the respect of livelihood for different segments.
These are the target and performers indicators for the micro watershed.
STEP-9 Conduct of Gram Sabha obtaining approvals submissions of DPR.:-After
preparation of the draft DPR convened to Gram sabha and activities proposed expected

101
outcomes benefits of implementing the programm are explained in case of any changes
are proposed in the Gram sabha approval obtained by the Gram sabha and already
singed of Mau paper.
STEP-9A Attachment of detail estimate, cost and design:-Estimating, Costing and design
prepared technically According to plan in the micro watershed project. And attached
with the DPR.
STEP-9B Various type of mapping :- DPR prepared in the support of micro watershed
project using various type of maps is as follows :
1.Index Map of Watershed 2. Watershed Map
3. Relief/ Drainage Map 4. Slop Map
5.Soil and Land Capability class map 6. Land use/ Land Cover Map
7. Cadastral map 8. Proposed Action Plan map
9. Social Map

102
Project Report
Table – 1 : Micro watershed project brief : -
1 State U.P.
2 District Bulandshahar
3 Block Pahasu
4 Comprised Villages (Nos.) 04
5 Name of Watershed Nagla Amarpur
6 Name of MWS Project Nagla Amarpur
7 MWS Code No. 2B3E4d3d
8 Geographical Area of MWS 468.00
9 Treatable Area 413
1- Project Objectives :- The aim and objectives of the Project are :
o- Conservation, development and sustainable management of natural resources including
their users.
p- Enhancement of agriculture production and productivity in a sustainable manner.
q- Restoration of ecological balance in the degraded and fragile rain fed ecosystem.
r- Reduction in regional disparity between rains fed and irrigated area.
s- Creation of sustainable employment opportunities for the rural community for
livelihood security.
t- Generation of massive employment.
u- Reduce migration from rural employment.
2- Major Problem of Project Area :
m- Actual shortage of drinking water.
n- Near to nil activated water bodies and water harvesting structures.
o- Low depth of ground water table.
p- Undulated and generally sloppy rainfed area.
q- Large number of Small, Marginal and S.C. farmer land holding.
r- Lower wages of agriculture lobour and also migration of lobour due to shortage of
employment in the watershed.

103
3- General Description :
(3.1) Location :-
Farida Watershed has been taken with MWS Code No. 2B3E4d3d in
Pahasu Block of Distt. Bulandshahar is located on Khurja via Shikarpur Syana to
Pahasu road about 25 Km. between 28015’ and 28
010’ N Latitudes and 78
00’ and
7805’ N Longitudes. Location and delineation of watershed has been located on
watershed map Fig. 2 and on top sheet Fig. 3.
(3.2) Area and Elevation :
Elevation ranges from 181 to 208 mtr. above the mean sea level(MSL)
altogether comprised villages and their’s area is described as follows.
(Comprises village map Fig. 3)
Table – 2 : Area and Elevation
Sl.
No.
MWS
Code
Block Name of
Village
Geographical
Area
Treatable
Area
1 2 3 4 5 6
1 2B3E4d3d Pahasu Nagla Amarpur 185 165.00
Surjawali 71 30
Anauna 182.00 175
Ausroti 30 43
468.00 413.00
(3.3) Shape of the Micro Watershed:
The shape of watershed is Elongated and as Rectangular. The maximum
length and width of the watershed are 5000 Mtr. and 1814 Mtr. respectively with
the Length: Width ratio of 2.76:1.
Fig. 1 (Shape of Micro Watershed)

104

105

106
(3.4) Climate :
The Watershed falls under ………………. semi arid region of tropical climate
inclined in Western Plan Zone. The average annual precipitation is about approx. is 397
mm. spreading over 35 rainy days. Most of the rain fall (about 85%) is received during
July to September. The rain fall of moderate intensity. Nothing the area receives of
scarcity rainfall in the winter season. The temperator variation ranges from as high as 420c
in the month of May-June to as low as 40c in December-January.
(3.5) Geomorphology and Soils :
Geomorphology :
The entire watershed is topographically divided into major landforms. Accordingly
the soils of watershed can be grouped into various categories such plane land, undulated
land, sloppy land and erosic ravenous land.
Sl.
No.
Name of
Project
Name of
Village
Geograph
ical Area
(in ha.)
Raifed
Area
(in ha.)
Treatable
Area
Agri.
Land
1 2 3 4 5 6 7
1
Nag
la A
mar
pu
r
Nagla Amarpur 185 156.25 165 163.18
2 Surjawali 71 56.00 30.00 32.10
3 Anauna 182 162.25 175 162.26
4 Asrauti 30 20.50 43 57.48
Total 468 395.00 413 415.02

107
Soil :
(a) Fine textured soil :
The soil are the most extensive soil group found in the watershed. Some portion of
the watershed is relatively sloppy flat land with fine soil texture as sandy loam. The soils
are in color and are inherently good high in fertility status. Soil texture is sandy lome loam
particularly in depressions and loam in the elevated portion. The soil characteristic texture
is dispersive and smooth. Therefore without imped the downward movement of water
productive layer of soil are easily by high runoff.
a- Coarse Textured Soil :
These soil are lying mostly in downward portion, along with erosic gully and
drainage line upto end of watershed outlet. These soils are coarser in texture and are
relatively poor in fertility status. The soils are lomy sand in texture. Rill and gully
formation in same parts particularly near the outlet of watershed can be seen.
(3.6) Drainage and Slope:
Due to prevalence of mild steep slope and presence of a number of drainage lines
in the watershed the drainage system is adequate. The watershed from part of Ganga Basin
and watershed. Under mild to steep topographical slope of MWS as divided as follow :
(Drainage and slope map fig.-4)
Table - 4 : Drainage and Slope
S. No. Grade Slope Percent Area in Ha. Remark
1 A 0.5-1 138 -
2 B 1-2 102 -
3 C 2-3 81 -
4 D 3-4 54 -
5 E 4-5 25 -
6 F 5-6 13 -

108
Fig-4 (Drainage & Scrub Map)
(3.7) Vegetation :
a- Natural Vegetation :
Natural vegetation is very poor in the watershed. The forest vegetation is
predominant with Vilayti Babool (Prosopis Juliflora). There are occasional occurrence of
Neem Plants (Azadirochta Indica), Shisham (Dalbergia Sissoo) and Karanj (Pangamia
Glabra) and anywhere some scrubs are seen. There are no grass land in the watershed.
Somewhere grass patches are seen only on the bunds, roadside and other such places. Poor
percentage of massive green trees has been not seen in the watershed except Horticulture
backyard.
b- Horticulture :
There is no backyards or commercial horticulture plantation in villages are been in
some part of watershed.
c- Agroforestry :
The agriculture fields of the villages have some horticulture plantation at places
isolated trees whose frequency is seen as under agroforestry and some where in where in
backyards.

109
(3.8) Human Population:
a- Human Population:
Total Population of involved villages in watershed is 8936 with average family
size of six persons as delaled as follows
Table – 5 : Human Population
S.
No.
Name of village Nos. of
families
Human Population Total
Male Female Children
1 Nagla Amarpur 385 1766 1567 508 3841
2 Anauna 345 1407 1262 409 3078
3 Asrauti 307 1204 1109 207 2520
4 Surjawali 461 1778 1643 1140 4561
1498 6155 5581 2264 14000
d- Categorization of Human Population :
In the total population of watershed villages, categories are defined as below :
Table – 6 : Population Categories
S.
No.
Particulars Unit
Number of families in population
in the villages
Population Family Remark
1 2 3 4 5 6
1 Agri Farmer No. 1742 290
2 Landless No. 242 40
3 Agri. Labour No. 327 55
4 Land less Labour No. 204 34
5 BPL Family No. 39 39
6 SC Family No. 1772 295
7 ST Family No. - -
4326 753

110
(3.9) Land Holding :
All the categories of farmers as small, marginal, medium and large are involved in
land holding average of about 1-18 ha. Small land holding farmers are further scattered at
different places which makes cultivation very difficult. Distribution of term families
according to the size of the land holdings are given as below :
Table – 7 : Distribution of farm families according to their size of land holdings
S.
No.
Name of Village Total
Agri.
Land in
MWS
Land Holding Family (Nos.) Percentage
Marginal
(< - 1Ha.)
Small
(1–2
Ha.)
Medium
(2-4 Ha.)
Large
(4-7
Ha.)
Total
1 Nagla Amarpur 163.18 95 52 11 - 158
2 Anauna 32.10 22 8 2 - 32
3 Asrauti 162.26 92 36 7 - 135
4 Surjawali 57.48 31 21 3 - 62
Total 415.02 240 118 23 - 387
(3.10) Live Stock Population :
Total live stock population of the watershed is 3848 Nos. Buffalos is preferred as
mulch animal compared to Cow. But milk yield is poor. Goats are also kept for milk as
well as for meat purpose. The breakup of livestock population is as follows :

111
Table – 8 : Live Stock Position
S.
No.
Name of
Village
Unit Live Stock Position Total
Buffaloes Cows Bullocks Goats
1 Nagla Amarpur No. 622 312 48 26 1008
2 Anauna No. 683 298 36 49 1066
3 Asrauti No. 709 295 95 51 1250
4 Surjawali No. 718 177 117 231 1243
Total 2732 1182 296 357 4567
(3.11) Infrastructure Social Feature :
a- Comprised villages in the micro watershed has moderate communication
facilities. Watershed linked with metaled road and approachable through
motarable road.
h- All the villages are electrified and have T.V. and Telephone connection.
i- Literacy rate in the watershed is very low all villages are having education upto
Junior High School.
j- Nearest small market is at Sayana 13 Km. Nearest big market Bulandshahar is
about 55 Km. from watershed. Religious and ritual features are almost common
as in other parts af U.P. small land holding with large family size and more
than 25% of the labour force of the total population living below poverty line
indicate poor socio economic status of the watershed community.

112
Participatory Rural Appraisal
Participatory mode of the villagers shows positive indication for the success of the
programme. Traditionally the entire village community participate in the individual works. Social
map of one of the watershed village drawn by villagers themselves, depicting various village
figures is shown in sketched map in Fig.-4 & 5. Infrastructures position of the village recorded as
follows :
Table – 9 : MW.S. Project – Farida
S.
No.
Infrastructure Unit Qty.
1 2 3 4
1 Primary School No. 1
2 Junior High School No. 1
3 Kanya Pathshala No. -
4 Public Health Center No. -
5 Vet nary Hospital No. -
6 Panchayat Ghar No. 1
7 Post Office No. -
8 Agan Bari Center No. 3
9 Electricity - Yes
10 Road - No
11 Pond No. 2
12 Hand Pump No. 11
13 Irrigation Well No. -
14 Canal No. -
15 Temple No. 3
16 Well (Drinking Water) No. 7
17 Pumping Set No. 40
18 Toilet No. 149
19 Market No. -

113
SOCIAL MAP

114
Recorded importance of development institution
Farmers perception recorded for importance and role of different
development institution in relation to infrastructure. Importance has been depicted with
size of circle and role with distance from village circle. (Fig 8)
Fig. -8 (Venn diagram of Micro watershed)
(3.12) Communication :
Watershed can approached from Distt Headquarter Bulandshahar to Project area
35 km. by Road.
(3.13) Natural Resource Base :
Transact of watershed showed typical land use profile consisting of plain
agriculture land, erosic area and medium ravenous ridge. Main source of the irrigation are
the canal for pre showing irrigation only. The total geographical area of the watershed is
468.001 Ha. classification .
Approach roads for the micro watershed is shown for the communication is shown
on topo sheet map Fig 9 as next page.
NAGLA
AMARPUR

115
Fig.- 7 Communication Map on Toposheet
Table – 10 : Classification of area(Hect.)
S.N
o.
Name of
Village
Unit Total
Geographical
Area
Rainfed
Area
Wasteland Village
Land
and
Road
Irrigation Resource
Water
Bodies
Borewell
1 2 3 4 5 6 7 8 9
1 Nagla Amarpur Ha. 335.15 26.16 9.41 30.35 32.94
2 Anauna Ha. 120.37 19.60 15.18 8.13 12.66
3 Asrauti Ha. 79.48 16.140 9.62 9.81 6.77
4 Surjawali Ha
Total 669.24 535.00 61.90 34.21 48.29 52.37

116
(3.14) Livelihood :
Total Population of the watershed is 8936 and out of the total population a majority
more than 80% has farming as their major source of livelihood followed by labours,
serviceman and small business class. Classified livelihood given in form as fallows :
Table – 11 : Livelihood Classification in population :
S.
No.
Name of Village Farmer Labour In Service In Local
small
business
Others
1 2 3 4 5 6 7
1 Nagla Amarpur 216 248 107 17 -
2 Anauna 185 305 32 18 -
3 Asrauti 32 204 38 14 -
4 Surjawali 60 190 45 8 -
Total 493 947 222 57 -
(3.15) Dependency of forest fuel wood and fodder :
a. Fuel wood :- The main source of fuel is from cow dung cake, woody stem of
crops. About 70% of the clomestic energy requirement is met from the agriculture
by product and cow dung cake. Rest is met out from the forest outside the village
and watershed boundry, most preferred fuel wood is Juliflora fuel wood Juliflora
obtained from standing along and between watershed.
d- Fodder :- Villages have not any sufficient signified dependency on forest based
fodder as these resource are nothing availability in the forest.

117
(3.16) Labour requirement :
Labour requirements was found to be maximum at the time of October, November
and December when the sawing of Rabi crops are done. The crucial periods are March and
April coinciding harvesting and threshing of Rabi crops and July/August is sowing Kharif
Crops take a little place. Other income generating enterprises having potential during the
remaining.
(3.17) Crop Rotation :
Present Crop rotation in the watershed comprise of :
Kharif - Bajra - Rare
Maize - Rare
Jwar - Rare
Rabi - Fallow Wheat - Major
Fallow Barly - Major
Fallow Sugarcane - Major
Fallow Mustard - Major
Zayad - Urad, Moong, Makka
The above said Rabi Crops is the most prevailing crop rotation on the agriculture
lands both in the rainfed and irrigated conditions.
Organized vegetable cultivation fruit plantation and traditional agro forestry
systems are lacking as per requirement in the watershed the limited vegetable cultivation
in the watershed is confined as kitchen gardens and field to the irrigated condition in a
scattered manner. The cultivation of cash crops other than the sugarcane, wheat and
mustard also in the watershed.
(3.18) Historical Events :
Chronological record of important events of the watershed village is prepared
through participatory rural appraisal (PRA) which is very useful in understanding of its
background and chronology is given as follows :

118
Table – 12 : Historical Events
S.
No.
Events/Activities Year Rem.
1 2 3 4
1 Established 1650
2 Opening of Primary School 1971
3 Opening of Junior School 2003
4 Opening of Kanya Pathshala -
5 Opening of PHC -
6 Opening of Vet. Hospital -
7 Panchayat Ghar 2005
8 Introduction of Tractor 1982
9 Gobar Gas Plant -
10 Thresher 1984
11 First Tube well/Pumpset 1980
12 First Motorcycle 1988
13 T.V. & D.V.D. Players 1994
14 Electricity in Village 1996
15 Bituminous Road 2005
16 First Hand Pump 1962
17 Templo Renovation 1996
18 First Land Line Telephone 2001
19 Planning for Watershed Project 2010-11
(3.19) Present Land Use in the Watershed :-
The watershed has diversified land uses. The varied present land use under
different use in the watershed. The mixed land use followed in the watershed is almost
similar in other parts of U.P. During P.R.A. Exercise prepared land has been shown in
Table No. 13, 14 & 15.
Table – 13 : (Ownership) S.
No.
Name of Village Pvt. Agri. Land Govt.
Revenu
Land
Forest
Land
Other
Land S.C./S.T. Others
1 2 3 4 5 6 7
1 Nagla Amarpur 32.40 100.70 - - 51.90
2 Anauna 28.03 106.67 - - 47.30
3. Asrauti 3.06 28.94 - - -
4. Surjawali 9.14 53.86 - - -

119
Table –14 : (Present Land under different categories)
S.
No.
Name of Village Land Use (Ha.)
Agricultural Wasteland
(All Types)
Seasonal
waterbodies
Village/Raod
Etc.
Total
1 2 3 4 5 6 7
1 Nagla Amarpur 172.26 10.68 - 2.06 185.00
2 Anauna 179.62 1.34 - 1.04 182.00
3 Asrauti 18.01 9.75 - 3.24 38.00
4 Surjawali 59.55 2.25 - 1.20 63.00
Total 429.08 24.02 - 7.54 468.00
Table – 15 : (Present land use classified)
Proposed Post Land Use has been given on Page No. 32
4- Focus on Present Land Use :
(4.1) Agriculture :
The total area under agriculture in the watershed is about 415.02 ha. out of which
906.61 ha. is under rainfed agriculture. Agriculture land uses in the watershed extended to
diversified land capabilities starting marginal to good class II land. The irrigated and
drinking water is most scarce natural resource in the watershed. The operation of tube well
for irrigation of agricultural crops frequently leads to the drinking water. Problem to the
farmers of watershed forcing them to carry drinking water from outside of the watershed
area. The agricultural field bund are common in the watersheds however they frequently
breach on heavy rains.
S.
No.
Land Use Under Unit
(ha.)
Area
(Ha.)
Percentage
1 2 3 4 5
1 Under Agriculture
A- Rainfed- 10%
I- Crops 245.48
II- Agro forestry 5.35
B- Irrigated- - 20%
I- Assured 26.34
II- Portial 49.50
2 Wasteland
A- Aforestation
B- Pasture
C- Untreatable
D- Treatable 51.27

120
Various mixed texture of soils are located in patches through out the watershed.
The heavy soils are almost kept fallow during rainy season. the agricultural soils also have
some as share calcium pan at variable depths. The irrigation water is conveyed by the
earthen channels. Surface irrigation methods following mainly border method of flood
method by the formers in the watershed. These factors reduce the water use efficiency of
limited and valuable irrigation water.
Drought hardy species like Juliflora suitable multi purpose trees is suitable for
rehabilitation of the wasteland. Rehabilitation of waste lands promoting agro forestry with
appropriate fruit and forest species suitable vegetative barriers on sloppy lands can be high
future value and by these adoption would be meet out many demands of fire wood and
fodder in the wasteland. Except above but also for soil and water conservation,
rehabilitation of wasteland and sustainable income generation for socio-economic
upliftment of farmers.
Crop Productivity :
The farmers also do not have suitable cropping system to deal aberrant weather.
Weeds impose considerable constraint in productivity of both Karif and Rabi crops under
irrigated as well as rainfed production system farmer undertake normally one manual
weeding in mustard and other valuable crops however, practices is energy and time
consuming. Use of we decide is rare in the watershed.
In the watershed area, limited cropping in the Kharif with mixed cropping practices
is not only irrigational but also unscientific and best for low productivity. Subsequent Rabi
crops in general. Sugarcane & Mustard crop in particular are raised on residual soil
moisture under rainfed production system during post mansoon season.
(4.2) Indigenous Technological Knowledge (ITK) :
Under process of PRA tracked out rural applying technology in various field of
local technology and some technology is very popular in village. In which the agriculture
is an old traditional practices of farmers who have improved themselves with passage of
the time according to their domestic needs and technological reforms in the nearby areas.
The villages have their traditional village ponds, practice of field bunding which typically
constitute agricultural related ITKs in the watershed. The Mustard & sugarcane being a
cash and firewood crop of the watershed and also sugarcane crop is being. Cultivated in
self designed manner by the farmers. Its carried out that the area is totally depend on rain

121
and under the rainfed area technology is applied by the farmers. However limited fertilizer
application specifically the DAP came in the practices since about 15-20 years.
(4.3) Forest and Other Vegetation :
Forest :
The watershed have a tract of wasteland area which are under uncultivable position
is liesed in the watershed. These wasteland have not any tree vegetation or very less than
real requirement for the wasteland use.
Horticulture/Agro forestry :
Horticulture and agro forestry practices were observed in the watershed.
(4.4) Agro forestry :
Agro forestry practices are lacking in the watershed. Though it has good potential
under existing disposition and may a role particularly with respect to minimization of
cropping risk, built up soil fertility and productivity, protection of soil erosion, soil
conservation partly meeting out the fire wood demand of rural community and more over
optimizing the economical return from system as whole under typical semi arid climate in
the watershed. Bund and boundary plantation also have good potential to care the fire
wood and fodder demands of the rural community in the watershed. The existing area
under agro forestry is almost negligible. Prosopis Jhliflora may be planted as block or sole
plantation specifically on marginal and degraded land in the watershed.
The agro forestry interventions comprising of ber, bail, aonla, guava, papular etc.
may be applied for benefit of the farmers under rainfed to irrigation production system on
leveled to slopping and marginal agricultural using proper planting techniques and term it
control measures.
The multipurpose trees may be also help in supplementing fire wood and fodder
demands of the rural community in the watershed and my be planted as hedge rows on
rainfed, marginal and degraded lands.

122
(4.5) Horticulture :
Fruits and vegetables practices are lacking in the watershed area. Its practices may
be sustainable very good potential for the formers of watershed. There are a limited lack
fruit trees in number like mango, guava, lime, ber, aonla and papaya fruit trees well as
vegetables like radish, okra, tomato, cabbage, garlic, onion, chilly, bringer and cucurbits
but they are found surviving well in the watershed villages. Organized orchards (vatika)
commercial vegetable cultivation horti-agri and other systems of agro forestry etc. are
lacking but have good agriculture.
5. Soil and land capability classification :
(5.1) Soil Morphology :
Watershed is located North East corner of Bulandshahr Distt. near about 55 Km.
away. The entire terrain of watershed is topographically divided into various land forms.
Accordingly the soils of watershed have been grouped major categories is given as follow
:
Hill Terrain Plane
Land
Sloppy
Undulated
Land
Rill Erosic
Land
Moderate
ravenous
- 35% 31% 19% 15%
Given categories in the blocks is located the soil morphology in the watershed
areas. Representation of soil characteristics by soil profile is represented as follows :
Soil Profile :
Fig. – 9 (Soil Profile)

123
Table – 16 : (Morphology of a Typical Soil Profile) :
Horizone Depth in
Cm.
Morphology
1 2 3
A
V & H
0-150 Silky when moist, Hard when dry quick
soluble, high elasticity, fissures, and cracks,
occasional occurrence of free calcium
carbonate granules black in colour, clay
content 29%, PH- 8 to 8.7
B
V & H
150-160 Whitish yellow in colour, very fine mixed
with free cacaos and gravels, Hard when dry
compact and indurate hard pan restricting
development of root and down ward water
transmission.
C
V & H
7600 Red and white sand stone
(5.2) Soil and Characteristic and Fertility Status :
Soil characteristic pertaining to soil fertility of various classes accruing around
villages in the watershed are given as follows :
Table – 17 : Soil Characteristic & Fertility Status :
Sl.
No.
Soil Properties LCC-II LCC-III
& IV
1 2 3 4
1 Sand % 47.04 75.04
2 Silt % 24.60 18.60
3 Clay % 28.36 6.3.6
4 Texture Sandy Clay Lomy Sand
5 PH (1:2) 8.41 8.67
6 Organic Carbon % 0.37 0.12
7 Available N Kg ha-1
316 173
8 Available P Kg ha-1
29 15
9 Available K Kg ha-1
189 325
10 EC (dS m-1
) 0.47 0.12

124
(5.3) Land Capability Classification (LCC) :
Land capability classification (LCC) was done to classification the soils in
different groups based upon the limitations and to emphasize the hazards prevailing in the
watershed in order to find out the different topo-sequences, landforms, soil depth and
erosion hazards. This was followed by the detailed investigation of selected landforms to
bring out the LCC classes of the Watershed. Classes of land capability namely II, III, IV
and V are demarcated in the watershed. The areas under different classes are sown as
follows :
Table – 18 : Land Capability Classification (LCC) :
S. No. Land capability
class
Area in Ha. Colour
1 2 3 4
1 I Class - -
2 II Class 60.70 14
3 III Class 304.64 71
4 IV Class 42.90 10
5 V Class 21.47 5
6 VI Class - -
7 VII Class - -
8 VIII Class - -
Land capability classification of various agricultural practices under land use can
be classified as groups, class, sub class and units. Utilization of various land class is given
as follows :
Table – 19 : Utilization of various land uses

125
(5.4) Land Capability Class II & III :
This group is one of the most extensive LCC watershed. and also near to class III
for the agricultural practices. The soils are sandy & sandy loam in texture. The land under
this class is nearly level to mild sloping (1-3%). The soils are deep and erosion hazard is
slight. Most of the productive agriculture land comes under class II & III. These lands
potentially very productive but due to rainfed a single cropping pattern is in habitation.
(5.5) Land Capability Class IV :
This class is found in lower portion near the outlets of watershed. The soils are
coarser in texture, deep, erosion hazard and undulating in topography. Rill and initiation of
gully can be seen near the outlet of the watershed.
(5.6) Land Capability Class VII & VIII :
This class of land is not found in watershed. Somewhere lack of soil are found with
admixture gravels fragments in these classes of lands.
(5.7) Conclusions :
The majority of land form is coming under class II, which give an insight of good
agriculture production potential of the watershed.
The land capability classification provides reasonable good information with
regard to capability of soil, that could be used for agriculture, agrihorticulture, silviculture
and posture development.
The productivity of these lands could be further enhanced by adoption of simple
soil & water conservation measures like bunding practices.
The reasonable area is under watershed of wasteland and other wasteland including
grater potential of this watershed for forestry and pasture development. Rare places
namely water body of low portion of land area under seasonally works as water harvesting
structures and these harvested water is used or can use for some other benificial activities
during the crop season also.
6. Problems and needs of the watershed indentified during the PRA
(6.1) Problem Identification and prioritization :
k- The are has undulating topography, steep unstable slopes, gradient of excessive
branches of rills and hence highly prone to soil erosion.
l- Major issues addressed to food sufficiency economic growth and environmental
security in the watershed area.

126
m- Effective soil depth is limited and highly variable hampering good crop growth.
n- The watershed have low productive cropping due to tradition single cropping
pattern and over all average crop production percentage not sufficient against
requirement.
o- Identified that there is no assured irrigation system has been development capacity
of water bodies are reduced due to silt ration which are utilized to store of rainy
water and they are renovatable.
(6.4) Transact walk during the PRA :
Problems identified and prioritized during the transact walk and PRA exercises in
all comprised villages of watershed. There were pooled and a list of problems
representing the whole watershed was prepared. Problems were ranked as per their total
weight age in the watershed village.
Table – 20 : Ranking of Problem identification and prioritization of watershed
S.No. Problem Rank
1 2 3
1 Lack of irrigation 3
2 Lack of drinking water 3
3 Low production of field crops 6
4 Lack of fodder availability and low productivity 4
5 Lack of availability of fuel wood 5
6 Lack of market facility 5
7 Lack of quality seeds, fertilizer, pesticides etc. 7
8. Medical and Health care facilities for milching
animals and low productivity.
7
9 Lack of medical, educational and transportation
facilities
9
10 Lack of water bodies renovation 8
11 Lack of run of earthen check bunds 1
12 Lack of water harvesting structures 1
13 Lack of livelihoods opportunity 2
Prioritized ranking (Upto four Numbers) :-
7- Lack of earthen check bunds.
8- Lack of livelihood opportunities.
9- Lack of irrigation water was the greatest problem. Lack of irrigation water
problem experienced by the people followed by low crop production.

127
(6.3) Analysis of SWOT of the watershed :
Strength (S), Weakness (W), Opportunity (O) and Threat (T) analysis is a
useful decision support tool. A SWOT analysis of watershed is presented as
follows :
SWOT analysis of the watershed
Strengths (S)
xxi. Cooperative work culture in traditional
activities
xxii. Close ethic ties
xxiii. Road at the top as well as outlet of the
watershed
xxiv. Hard working
xxv. Resource pool of crop genetics
diversity
xxvi. Awareness of farmers about watershed
management programme
xxvii. Well established CPR maintaining and
sharing system
xxviii. Stall feeding of animals
xxix. Well maintained seasonal water bodies
xxx. Social outlook of the community
towards land less
Weakness (W)
xix. Poor water management
xx. Resource poor farmers
xxi. Out migration of youth
xxii. Low and erratic rainfall
xxiii. Fragile geology
xxiv. Fragmented land holding
xxv. Heavy infestation of wild animals
xxvi. Problem of fuel and fodder
xxvii. Shallow soil depth and with high
percentage of gravel
Opportunities (O)
xiii. Wide range of annual and perennial crops
xiv. Scope of regular employment opportunities
to check out migration
xv. Strengthening of existing irrigation system
xvi. Conducive climate for rainfed crop
diversification
xvii. Good scope for Agro forestry and dry
land horticulture
xviii. Potential for collective action and
management of CPR
Threats (T)
xi. Prone to adverse climate like drought
xii. High market risk
xiii. Social conflicts owing to PRI and WSM
polices and local politics
xiv. Weak coordination among line departments
xv. Lack of expertise of implementing agency in
different aspects of WSM
7. Proposed land use for the watershed :
Watershed management plan preparation due importance is given to topographic,
land suitability, irrigation potentially, prevailing farming systems, micro farming situation,
farming, farmers preferences and priorities along with economic and environment
securities.

128
Crop and tree selection and area distribution was done as per farmers priorities
revealed through PRA exercise.
The watershed management plan for watershed is prepared with specific objectives
of food sufficiency, income and employment generation with environment security.
Technical options were with the ITK based on the latest available experiment
findings. Due attention was given to the resource of the farmers and adjustments were
made in capital intensive resource demanding technological outputs while making them
adoptable to the resource poor farmers. Emphasis was given on maximum use of farm
yard manure. The proposed land use plan of the watershed is shown as follow as in table
Table – 21 : Present and proposed land use plan of the watershed
S.No. Land use Present
(ha)
Proposed area
(ha)
1 2 3 4
1 Agriculture
a Rainfed
I Crops 245.48 395.27
II Agro-forestry 5.35 53.20
b Irrigated
I Assured 26.24 26.24
II Partial 49.50 65.70
2 Waste land
a Aforestation 10.40
b Pasture 2.5
c Untreatable
d Treatable 5127 23.77
3 Village land 38.84 38.84
(7.1) Status of Present Water Resources Utilization :
Watershed is having some canal system. Management and maintenance of these
canal are required. Before sowing of Rabi crops, water from these canal is issued as
supplementary irrigation for Rabi sowing ar allowed to go as waste. After releasing water
from canal, submergence area also put under cultivation.
Some where bore well irrigation applied by the farmers in the watershed.
(7.2) Proposed Plan for Irrigation Development :
a- Present system of irrigation and wastage of water during October–November
need to be made more efficient from water management point of view by
minimizing conveyance losses in the existing water courses.
129
b- Present irrigation canal capacity have to build up by the reform. Which are lack
capacity of water.
c- Construction of new water harvesting earthen structures, Pucca Check Dem, Series
Gully Plugging, etc. has been sloppy portion to increase irrigation potential and for
recharging of ground water, soil and moisture conservation maximum field
irrigation, best production and expected change of crop rotation.
d- The up gradation of the exciting system of irrigation will result in :
i- Minimization of conveyance losses.
ii- Increase in frequency of irrigation.
iii- Adoption of high yielding varieties of crops.
iv- Assured cultivation of cash crops.
v- Capacity buildup by the planning of new water harvesting structures.
(7.3) Ground Water Recharge :
For the purpose of ground water recharge, the area of the upper side of watershed
is recommended for Field Bunds, Contour Bunds, Peripheral Bunds and Submergence
Bunds and in the lower portion Contour Staggered Trenches, Gully Plugs, Earthen Check
Dem and Pacca Outlets. In the undulated sloppy portion of the watershed recommended
water harvesting structure for dual purpose as ground water storage and under ground
water recharge.
(7.4) Crop Production :
Practices proposed in the watershed is given as follows :-
a- Mulching and crop residue management.
b- Application of green manuring.
c- Vermi Composting.
d- Crop rotation and inter cropping.
e- Biofertilizers.
(7.5) Tillage Operation :
Deep tillage technology is proposed to apply to be demonstrated for benefit of
farmers in the watershed.
(7.6) Improved Seeds of High Yielding Verities (H.Y.V.) :
Recommendation of improved varieties is necessary for improving the productivity
and farm income. Through replacement of low yielding traditional verities of seeds in
villages of watershed.

130
(7.7) Balanced Fertilizer Use :-
Demonstration of use of fertilizer in various crops of watershed recommended
balance fertilizer use in different crops will be benefited of forming community.
(7.8) Control of insects and diseases :
Aphid in the mustard are the major insects in the watershed areas leading to loss in
crop productivity. Similarly white blister is also a common disease in the mustard crop.
The management strategies of these insect pest and diseased will also be
demonstrated in the watershed for benefit of the growers.
(7.9) Dry Land Horticulture :
Such portion of dry land in which proposed horticulture development planning
recommended species like Ber, Bel and Aonla will be planted at suitable spacing in the
watershed.
(7.10) Agri Horticulture :
Aonla and Sahjan would be suitable horticultural crops to the locality. Therefore, a
part of land in the farmer field shall be selected and brought under Agri-horticulture
system. The cropping system followed will be Jwar and Wheat.

131
(7.11) Plantation (Fuel wood) :
Such a portion which are under wasteland will be taken falling in the class-IV
category in the watershed. These lands will be planted with species like Vilayati Babool
(Prosopis Juliflora), Babool (Acacia Nilotica), Karanj (Pangamia Glabra).
9. Socio Economic Analysis of the of the Project :
(9.1) Sustainability and environment security :
The proposed land use plan will improve the land utilization index and crop
diversification index significantly as compared to the existing one. in the proposed
watershed management plan proper blending of the bio engineering measures will be
applied on above 80% of the total area of watershed. It is estimated that more than above
70% of the watershed area will be treated and consequently the soil loss and runoff from
the area is excepted to be reduced by 70% respectively.
It will help in maintaining ecosystem integrity on sustained basis along with
improving the livelihood security of the farming community.
(9.2) Economic Analysis :
Economic analysis of the project was carried by taking direct benefits and costs
considering 10 years for project life at 10% discount rate. Whole watershed development
plan was divided into three sector as agriculture, horticulture and forest/Fuel wood
plantation. Net Present Value (NPV) and Benefit Cost ratio criteria were applied judge the
economic efficiency of each enterprises and sector. Net present value (NPV) of the project
life is considered to be 10 years and discount rate for NPV estimation is 10% is given
NPV and benefits as follows :-

132
Table – 22 : Present productivity income analysis :
S.
No.
Name of
Sector
Name of
Crops
Produ
cti-
on/ha.
Rate/
Qtl.
Cost of
Production
Expend. of
cultivation
Net
income
B.C. Ratio
between
Col. 8 & 7
1 2 3 4 5 6 7 8 9
A Agriculture Urad 3.00 4500.00 13500.00 6450.00 4450.00 1:1
Moong 3.00 4600.00 13800.00 6075.00 7425.00 1.22:1
Jwar 4.80 600.00 2880.00 1584.00 1296.00 0.82:1
Wheat 18.50 1000.00 18500.00 8650.00 7075.00 0.82:1
Pea 7.50 2400.00 18000.00 10970.00 5905.00 0.54:1
Mustard 3.50 2900.00 10.50 3235.00 3240.00 1:1
Total - 76830.00 54105.00 51000.00 0.94:1
Average - 13138.00 6763.00 6375.00 094:1
B Forestry Vilayati
Babool
15000.00 - Nil
C Horticulture Ber 20000.00 - Nil
Aonla 20000.00 - Nil
Bel 20000.00 - Nil
Total - 60000.00 - Nil
Average - 20000.00 - Nil
Grand Total

133
Table –23 : Post productivity and income analysis for Post Productivity
Value and B.C.:
S.
No.
Name of
Sector
Name of
Crops
Produ
cti-
on/ha.
Rate/
Qtl.
Cost of Production
Expend. of
cultivation
Net
income
B.C. Ratio
between
Col. 8 & 7
1 2 3 4 5 6 7 8 9
A Agriculture Urad 4.00 5000.00 20000.00 8325.00 11615.00 1.39:1
Moong 4.00 5000.00 20000.00 8200.00 11800.00 1.44:1
Jwar 5.50 800.00 4400.00 1900.00 2500.00 1.32:1
Wheat 25.00 1000.00 25000.00 16680.00 13320.00 1.14:1
Pea 9.50 3500.00 33250.00 14810.00 18540.00 1.12:1
Mustard 5.00 3000.00 15000.00 4370.00 8130.00 1.86:1
Total - - - 172250.00 72845.00 99765.00 1.38:1
Average - - - 21531.00 9061.00 12471.00 1.38:1
B Forestry Vilayati
Babool
80.00 500.00 40000.00 15000.00 25000.00 1.67:1
C Horticulture Ber 35.00 2000.00 52500.00 20000.00 32500.00 1.63:1
Aonla 35.00 2000.00 70000.00 20000.00 50000.00 2.50:1
Bel 40.00 1500.00 80000.00 20000.00 40000.00 2:1
Total - - - 182500.00 60000.00 122500.00 2.04:1
Average - - - 60833.00 20000.00 40833.00 2.04:1
Grand Total - - - 1394750.00 147485.00 247265.00 1.68:1
Table –24 : Summary of NPV, PPV and B.C. Ratio (Sector wise) :
S.
No.
Name of Sector NPV PPV B.C.
Ratio Expend. Net
Income
Expend. Net
Income
1 2 3 4 5 6 7
1 Rain fed
Agriculture
54105.00 51000.00 72485.00 99765.00 1.38:1
2 Forest/Fuel wood
Plantation
15000.00 - 15000.00 25000.00 1.67 : 1
3 Horticulture 60000.00 - 60000.00 122500.00 2.04:1
Total 129105.00 51000.00 147485.00 247265.00 1.68:1

134
(9.3) Economics of Agriculture Sector :
The development cost can be recovered by the adoption of plan in present rain fed
agriculture is being done on well maintained field, therefore does not require much
investment. In rain fed agriculture, investment of Rs. 44.50 lacs is proposed to made is
given as fallows :
Table – 25 : Economics of Agriculture Sector :
S.
No.
Name of
sector
Name of
Activities / Plan
Treatble
Area
(Ha.)
NPV
(Lacs)
Post
Productivity
Value (Lacs)
Benifit /
Income
B.C.
Ratio
1 2 3 4 5 6 7 8
1. Rainfed Soil, moisture
and water cons
works
413 218.234 531.75 304.648 1.38 :1
(9.4) Economics of forest fuel wood plantation :
Economic analysis of fuel wood plantation in the watershed. Project life is
considered to be 20 years and discount rate for NPV estimation is 10 % is followed and as
is given follows :
Table –26 : Economics of forest fuel wood Plantation :
S.
No.
Name of
sector
Comman Name of
Plant
Area
(Ha.)
NPV
(Lacs)
Post
Productivity
Value (Lacs)
Benifit /
Income
B.C.
Ratio
1 2 3 4 5 6 7 8
1. Forest
Fuel
wood
sector
Vilayati Babool
(Prasopis
Juliflora)
25.00 2.50 6.675 4.675 1.67 : 1
(9.5) Economics of Horticulture Sector :
Economic analysis of Horticulture Plantation in agri-horti system and on wasteland
patches of watershed project, life is considered about 15-20 years and discount factor rate
for NPV estimation is 10% is follows :

135
Table – 27 : Economics of Horticulture system :
S.
No.
Name of
Sector
Common name of Plants Area
(Ha.)
NPV
(Lacs)
Post
Productiv
e Value
(Lacs)
Benefit
Lacs
B.C.
Ratio
1 2 3 4 5 6 7 8
1 Horticulture Ber (zyziphus
mouritana)
4.00 0.80 2.104 1.304 1.63: 1
Aonla (Embelica
officianalis)
3.80 0.76 2.660 1.40 2.5 : 1
Bel (Aegle marmelos) 2.20 0.44 1.320 0.88 2 : 1
Total 10.00 2.00 2.00 4.084 2.04 : 1
(9.6) Food requirement and sufficiency :
Achieving self sufficiency in food production is one of the prime objectives of
watershed project. The status of food requirement and production before and after the
project is presented as is follows :
Table – 28 : Status of food requirement and availability of per annual :
S.
No.
Name of Foods Requirement
Q./Yr.
Present Status Expected Post Status
Availability
Q./Yr.
Deficit or
surplus
Q./Yr.
Availability
Q./Yr.
Deficit or
surplus
Q./Yr.
1 2 3 4 5 6 7
1 Cereals 110 Kg. 16281 13839 - 2442 27678 11397
2 Pulses 36.50 5402 2971 - 2431 9724 4322
3 Oil Seeds 29.20 4322 1729 - 2593 6915 2593
4 Vegetable 71 kg 13469 2694 - 10775 24244 10775
(9.7) Employment generation :
One of the major problem of the labour migration in watershed project. By the
implementation of the project activities employment opportunities will be generated.
However the changes in land use pattern and adoption of other subsidiary enterprise will
generate employment opportunities in the watershed as given in table follows :

136
Table – 29 : Employment generation under proposed works :
S.
No.
Employment
activities/works
Area
under
work
Cost Mandays generation (Nos.)
Unskilled Skill Total Person
1 2 3 4 5 6 7 8
2 Graded Contour Bund 45 1.350 1350 - 1350
3 Gully Plug, C.D. 76 5.700 3990 293 4283
4 Submergence Bund 65 2.600 2600 - 2600
1 Peripheral Bund 64 2.240 2240 - 2240
5 W.H.B. 79 7.110 4266 241 4507
6 Renovation of Bund 49 1.470 1470 - 1470
7 Reno. of W.H.B. - - - - -
8 Community Pond - - - - -
9 Afforestation 25 2.31 4620 - 4620
10 Horticulture 10 2.00 400 - 400
Total 413 24.78 20936 534 21470
10. Formation of watershed committee :
Under compliance of common guideline Para (6.3) is followed and by the help of
watershed development team, watershed committee is organized in the micro watershed
village Ghuraiya with 10 members as prescribed in common guide line. List for
organization of W.C. village details given as follows :
Table – 30 : Details of comprised village W.C. organization in M.W.S. :
S.
No.
Particulars Details Block Geogra-
phical
Area
1 2 3 4 5
1 Micro watershed code 2B3E4d3d Pahasu 468.00
2 Name of Gram Panchayat
in M.W.S.
Nagla Amarpur

137
Table – 31 : List of organized W.C. for the Gram Panchyat Amarpur in watershed.
S.
No.
Name of selected
members
Age Representation
Members from
Post Qualification Village
1 2 3 4 5 6 7
1 Sh. Ram kishan 42 Gram Sabha Secretary M.A. Amarpur
2 ‘’ Jaybhagwan 35 Gram Sabha Sachiv High School Amarpur
3 ‘’ Amar pal 45 From – U.G Member 5 Amarpur
4 ‘’ Bhikam Singh 50 From – U.G Member 8 Amarpur
5 ‘’ Mahendra Pal 40 From – U.G Member M.com Amarpur
6 ‘’ Sangeeta Devi 32 From – S.H.G. Member 8 Amarpur
7 ‘’ Chatar Singh 31 From – S.H.G. Member 5 Amarpur
8 ‘’ Ramphul Singh 40 From – S.H.G. Member 8 Amarpur
9 ‘’ Harkesh 35 From – S.C. Member High School Amarpur
10 ‘’ Jaychand 50 From – S.C. Member High School Amarpur
11 ‘’ Hemraj 24 From – PLA Work out M.Sc. (Ag.) Khurja
(10.1) Formation of Self Help Groups in M.W.S.
By the help of watershed committee and watershed development team self help
group are formatted / organized. Families and persons are selected from poor, small and
marginal farmers families, landless poor families, agriculture labour families, women,
herdsman and shepherd and S.C. families in the formatted self help groups are given as
follow :
Table – 32 : Shiv Pashupalan Self help group – Nagla Amarpur.
S.
No.
Name of member
in formatted
SHG’s
Age From
represented
family
Name of
proposed
activities
Activation
Position
1 2 3 4 5 6
1 Kumarpal Singh 47 H.S. Line Store Secretary
2 Jaychand 42 H.S. Sachiv New
3 Gorakhpal 30 H.S. Member New
4 Man Singh 50 8 Member New
5 Omveer Singh 32 H.S. Member New
6 Harkesh 35 H.S. Member New
7 Jaybhagwan 35 H.S. Member New
8 Amarpal 30 Inter Member New
9 Chandrawan 30 8 Member New
10 Harkishan 32 8 Member New

138
Table – 33 : Self help group Anona.
S.
No.
Name of
member in
formated
SHG’s
Age From
represe-
nted
family
Name of
proposed
activities
Activation
Position
1 2 3 4 5 6
1 Indal Singh 40 H.S. OBC Dairy Secretary New
2 Ajit 30 H.S. OBC Dairy Sachiv New
3 Manveer 22 H.S. OBC Dairy Member New
4 Devendra 30 Inter OBC Dairy Member New
5 Rampal 30 H.S. OBC Dairy Member New
6 Ramesh 40 H.S. OBC Dairy Member New
7 Ravi 23 Inter OBC Dairy Member New
8 Sanjay 28 8 OBC Dairy Member New
9 Vipin 18 H.S. OBC Dairy Member New
10 Arjun 19 Inter OBC Dairy Member New
Table – 34 : Geeta Self help group in Anona.
S.
No.
Name of
member in
farmated
SHG’s
Age From
represe-
ntated
family
Name of
proposed
activities
Activation
Position
1 2 3 4 5 6
1 Daya Kumari 19 H.S. OBC Kadhai Bunai Secretary New
2 Rashmi 19 Inter OBC Kadhai Bunai Sachiv New
3 Rupwati 20 H.S. OBC Kadhai Bunai Member New
4 Suman 21 H.S. OBC Kadhai Bunai Member New
5 Laxmi 22 H.S. OBC Kadhai Bunai Member New
6 Anshu 24 Inter OBC Kadhai Bunai Member New
7 Manwati 38 Inter OBC Kadhai Bunai Member New
8 Babali 35 8 OBC Kadhai Bunai Member New
9 Bhogshri 35 Inter OBC Kadhai Bunai Member New
10 Rekha 22 Inter OBC Kadhai Bunai Member New
11 Kamlesh 40 Inter OBC Kadhai Bunai Member New
12 Neetu 18 Inter OBC Kadhai Bunai Member New

139
Formation of User’s Groups :
User’s groups are farmated by the help of watershed committee and watershed
development team in the micro watershed comprised villages. Formers which have land
village are involved in the User’s groups and they will be direct benefited as expected by
the implementation of watershed project easy and convenienced condition are made to
resource use between user’s groups and they will be responsible to operate and
maintenance for the created assets in the watershed. Nos. of farmated user’s groups details
are given as follows :
Table – 35 : Village wise user’s groups
S.
No.
Name of
village
No. of
groups
No. of
farmers
Total
Agri.
Land
Area
under
treat-
ment
Cost of
essets
1 2 3 4 5 6 7
1 Nagla Amarpur 15 216 168 148.256 -
2 Anona 13 185 105 92.660 -
3 Arorali 9 135 75 66.186 -
4 Surajwali 4 60 8108 73.112 -
Total 41 596 429.08 380.214 -
10. Estimation and Costing of Proposed activities of the watershed Project Year 2009-10.
Proposed works / activities for the Project Period (Year 2009-10) under proposed
treatable area 635.00 Ha. Out of total Geographical area 906.61 Ha.

140
(10.1) Financial and Physical Outlets :
Table – 36 : Financial and Physical Outlets for the Year 2009-10 :
Sl.
No.
Components Unit
cost
per
ha.
Physical
ha. Financial (Lacs) Man-days
Generatio
n Labour
Component
Material
Component
Total
1 2 3 4 5 6 7 8
A Management Cost 10%
1 Administrative Cost – TA & DA
Hiring of Vehicles,
Official Expenditure
Electricity & Phone bill
Computer, Stationery and office
consumable materials & contingency
1200 - - 4.956 4.956 -
2 Monitoring 120 - - 0.4956 0.4956
3 Evaluation 120 - 0.4956 0.4956
Sub Total 1440 - 5.9472 5.9472
B Preparatory Phase 10% - -
1 Entry Point Activities 4% 480 - 0.3965 1.5859 1.9854 396
2 Institutional & Capacity Building 5% 600 - - 2.4780 2.4780
3 Detailed Project Report 1% 120 - - 0.4956 0.4956
Sub Total 1200 - 0.3965 4.5595 4.9560 396
C Watershed Work Phase
a Watershed Development Works
1 Graded, Contour & Field Bunds 3000 45.00 1.350 - 1.350 1350
2 Gully Plug, Earthen Checkdam /WHS 7500 76.00 3.99 1.710 5.700 4283
3 Submergence bunds 4000 65.00 2.600 - 2.600 2600
4 Peripheral Bund 3500 64.00 2.240 - 2.240 2240
5 Earthen Water Harvesting Bund 9000 79.00 4.266 2.844 7.110 4507
6 Renovation of existing Bunds 3000 49.00 1.470 - 1.470 1470
7 Renovation of existing W.H.B - - - - - -
8 Aforestation and Development of silvi
postural system 10440 25 0.462 1.848 2.31 4620
9 Dry Land Horticulture 20000 10 0.400 1.600 2.00 400
10 Community Pound (Renovation) - - - -
Sub Total 442 16.778 8.002 24.78 21470
B Livelihood Programme (Community Based) 7.620
Income generating activities through SHG’s for landless and marginal formers 10%
1 Live stock development activities 200 - - 0.8262 0.8262 -
2 Bee Keeping 100 - - 0.4128 0.4128 -
3 Poultry Farming 200 - - 0.8262 0.8262 -
4 Nursery Development 300 - - 1.2390 1.239 -
5 Vegetable Production 100 - - 0.4128 0.4128 -
6 Milk Dairy Promotion Unit 200 - - 0.8262 0.8262 -
7 Establishment of Vermi compost Unit 100 - - 0.4128 0.4128 -
8 Sub Total 1200 - - 4.9560 4.956 -
C Production System and micro Enterprises
1 Crop production, diversification of
agriculture and introduction of agro
forestry
1170 - - 4.8321 4.8321 -
2 Demonstration of improved
composting system 390 - - 1.6107 1.6107 -
Sub Total 1560 - - 6.4428 6.4428 -
D Consolidation Phase 5% Sub Total 600 - - 2.478 2.478 -
Grand Total 12000 - 17.1745 32.3855 49.560 21866

141
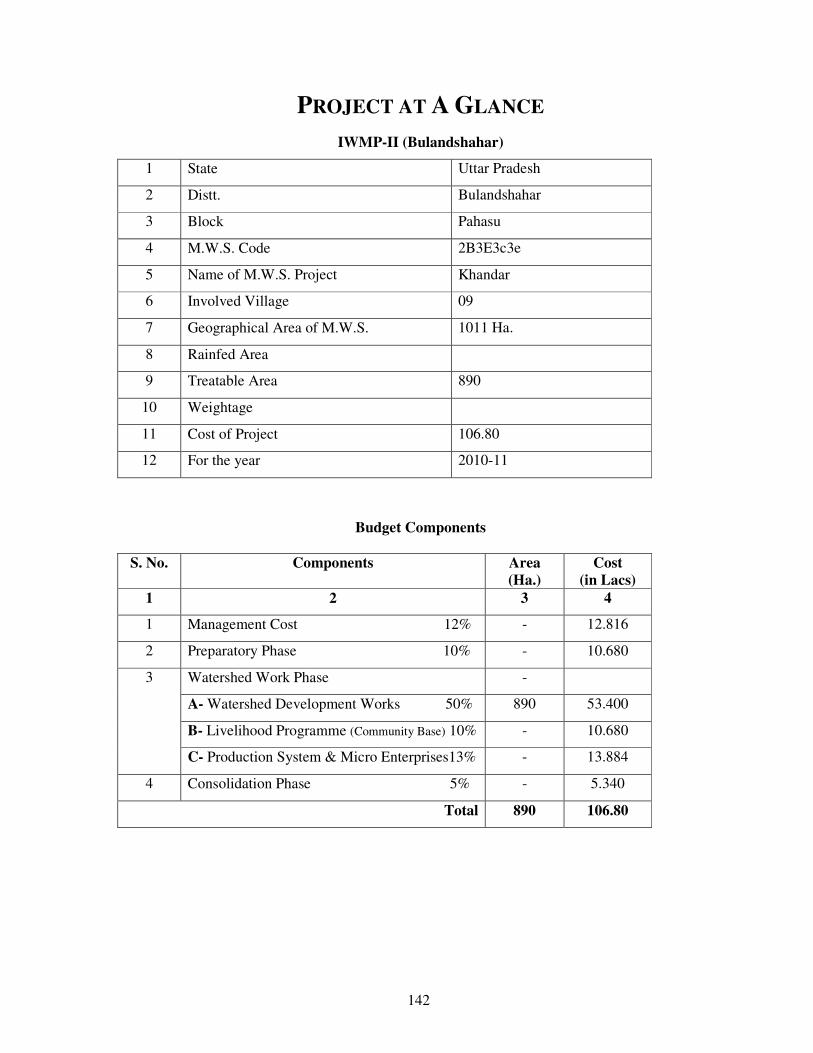
142
PROJECT AT A GLANCE
IWMP-II (Bulandshahar)
1 State Uttar Pradesh
2 Distt. Bulandshahar
3 Block Pahasu
4 M.W.S. Code 2B3E3c3e
5 Name of M.W.S. Project Khandar
6 Involved Village 09
7 Geographical Area of M.W.S. 1011 Ha.
8 Rainfed Area
9 Treatable Area 890
10 Weightage
11 Cost of Project 106.80
12 For the year 2010-11
Budget Components
S. No. Components Area
(Ha.)
Cost
(in Lacs)
1 2 3 4
1 Management Cost 12% - 12.816
2 Preparatory Phase 10% - 10.680
3 Watershed Work Phase -
A- Watershed Development Works 50% 890 53.400
B- Livelihood Programme (Community Base) 10% - 10.680
C- Production System & Micro Enterprises13% - 13.884
4 Consolidation Phase 5% - 5.340
Total 890 106.80

143
Executive Summary of the Project
Identified selected micro watershed project Khandar is coded as 2B3E3c3e has
been proposed from cluster of I.W.M.P. Bulandshahar–II project in Pahasu Block district
Bulandshahar four villages namely Khandar, Dalpatpur, Atrena, Rinayach Narendrapur, Dighi,
Udarmi, Anauna, Utrawali and N. Amarpur is comprised in the micro watershed which is located
in the east of district Bulandshahar on the west bank of River Ganga and border of district area is
known as Khadar. It lies between 280 -50’ and 28
0 -15’ N Latitudes and 78
0 -0 and 78
0 -10 W
Longitudes Covering area. Its altitudes ranges from 187 meter to 190 meter above the mean sea
level. Khurja Railway Station 184.11 m, Bulandshahar Railway station is 201.18 m above mean
sea level is displayed. Project area of I.W.M.P. BSR-II is lied in the Pahasu Block of
Bulandshahar District which is come in the western plan zone under semi arid area. The annual
average rainfall is near to 397 mm which an average of 35 rainy days. Out of which about 85% is
received during the mansoon season from July to September and very less rainfall is received in
the winter season.
Temperature ranges from as high as 430C in the May-June to as 3
0-4
0C during December –
January. The Trend of rain fall is highly erotic and maximum water goes as runoff.
Main occupation of the dwellers is agriculture in the watershed. Some part of the lands are
shown during the Kharif season. Cane sugar are preferred crops in the project area. The main
Crops raised are Wheat, Pea & Mustered & Maize
The topmost portion of the watershed is sloppy flat land. Other than topmost portion of the
watershed is under soil erotic portion and depreciative. The soil of the land are sandy loam Soil.
The middle agricultural position of watershed relatively smooth sloppy flat land with sandy loam
soil texture. These soil is yellow in colour and are inherently good in fertility status.
Natural vegetation of the watershed is very poor. Somewhere forest vegetation is
seen which are predominant with Vilayati Babool (Prosopis Juliflora), followed by Babool
(Accasia nilotica), somewhere Neem Plants (Azadirachta Indica), Shisham (Dolbergia Sisson) and
Karanj (Pongamia Glabra) are seen in occasional occurrence. There is no grass land in the
watershed. Somewhere grass patches are seen only on the bunds, road sides and other such places.
Coverage of massive green belt is in poor percentage for environment which is envisaged. That
watershed is very poor climate area.
There is normal condition of animal physics and for their fodder arrangement is the
watershed and creative possibility would be expected by the implementations of the project.

144
Due to Arial soil erosion poor harvesting managements, cropping pattern, non treated
watershed etc. are very anti effective causes for the watershed. Problem of the watershed is to be
tackled by harvesting structures which have last most of their capacity new water bodies for the
prevention of erosion and conservation of soil and moistures various type of earthen bunds in the
watershed field, necessity has been observed. Wasteland will be treated with staggered Trenches,
afforestation and bunding for the changing of characteristics.
The detail project report has been prepared by the applying of nine process steps
for the micro watershed code no. 2B3E3c3e brief is as follows.
STEP-1 Secondary data collection:-During the five days visit programme in the micro
watershed project with of all available documents of village label by approaching the
Gram panchayat collected secondary data.
STEP-2 Village meeting & conducting PRA exercise:-Community meeting conducted on fix
days for the consultation with villagers for the PRA Exercise. Participatory mode of
the villages was positive indicated for the success of programm. With good in testing
participation has been drawn social & resource map on ground & paper & discussed
un various topics of problematic thoughts in the micro watershed.
STEP-3 Socio economic survey:- The resource organization of village label volunteers
identified to conduct house hold socio economic survey/states.
STEP-4 Probel typology analysis:-Thoroughly analyzed the data & identified problem type as
soil & moisture conservation, crop rotation, crop coverage, productivity, livelihoods,
social issues & capacity building gaps etc. Probelms discussed with the watershed
committee & came up with alternative solution.
STEP-5 Conduct of net participatory planning (NPP):- The planning team visited together
in the planning blocks on the scheduled date along with the beneficiaries of the
villages & data gathered as for the participatory net planning.
STEP-6 Productivity & livelihood planning exercise:- For the product livelihood exercise,
group discussion on various livelihood as Agriculture, Animal husbandry enterprise
development held discussion with the villagers in the micro watershed.
STEP-7 Institutional & capacity building :- This plan is prepared based on the data
available in the field and auscultations with the watershed committee.
STEP-8 Data consolidation & documentation of DPR :- After gathering all required
information compiled collected data. Thoroughly discussed and finalized the expected
outcomes and benefits specially in the respect of livelihood for different segments.
These are the target and performers indicators for the micro watershed.

145
STEP-9 Conduct of Gram Sabha obtaining approvals submissions of DPR.:-After
preparation of the draft DPR convened to Gram sabha and activities proposed expected
outcomes benefits of implementing the programm are explained in case of any changes
are proposed in the Gram sabha approval obtained by the Gram sabha and already
singed of Mau paper.
STEP-9A Attachment of detail estimate, cost and design:-Estimating, Costing and design
prepared technically According to plan in the micro watershed project. And attached
with the DPR.
STEP-9B Various type of mapping :- DPR prepared in the support of micro watershed
project using various type of maps is as follows :
1.Index Map of Watershed 2. Watershed Map
3. Relief/ Drainage Map 4. Slop Map
5.Soil and Land Capability class map 6. Land use/ Land Cover Map
7. Cadastral map 8. Proposed Action Plan map
9. Social Map

146
Project Report
Table – 1 : Micro watershed project brief : -
1 State U.P.
2 District Bulandshahar
3 Block Pahasu
4 Comprised Villages (Nos.) 05
5 Name of Watershed Khandar
6 Name of MWS Project Khandar
7 MWS Code No. 2B3E3c3e
8 Geographical Area of MWS 1011
9 Treatable Area 890
1- Project Objectives :- The aim and objectives of the Project are :
v- Conservation, development and sustainable management of natural resources including
their users.
w- Enhancement of agriculture production and productivity in a sustainable manner.
x- Restoration of ecological balance in the degraded and fragile rain fed ecosystem.
y- Reduction in regional disparity between rains fed and irrigated area.
z- Creation of sustainable employment opportunities for the rural community for
livelihood security.
aa- Generation of massive employment.
bb- Reduce migration from rural employment.
2- Major Problem of Project Area :
s- Actual shortage of drinking water.
t- Near to nil activated water bodies and water harvesting structures.
u- Low depth of ground water table.
v- Undulated and generally sloppy rainfed area.
w- Large number of Small, Marginal and S.C. farmer land holding.
x- Lower wages of agriculture lobour and also migration of lobour due to shortage of
employment in the watershed.
3- General Description :
(3.1) Location :-
Farida Watershed has been taken with MWS Code No. 2B3E3c3e in
Pahasu Block of Distt. Bulandshahar is located on Khurja via Shikarpur Syana to
Pahasu road about 25 Km. between 28015’ and 28
010’ N Latitudes and 78
00’ and

147
7805’ N Longitudes. Location and delineation of watershed has been located on
watershed map Fig. 2 and on top sheet Fig. 3.
(3.2) Area and Elevation :
Elevation ranges from 181 to 208 mtr. above the mean sea level(MSL)
altogether comprised villages and their’s area is described as follows.
(Comprises village map Fig. 3)
Table – 2 : Area and Elevation
Sl.
No.
MWS
Code
Block Name of
Village
Geographical
Area
Treatable
Area
1 2 3 4 5 6
1 2B3E3c3e Pahasu Khandar 263 231.55
Dalpatpur 144 126.76
Atraina 215 189.26 R. Narendrapur 104 91.55
Dighi 8 7.04
Udarmi 30 26.41
Anauna 99 87.15
Utrawali 36 31.69
N. Amarpur 112 98.59
1011 890
(3.3) Shape of the Micro Watershed:
The shape of watershed is Elongated and as Rectangular. The maximum length and width
of the watershed are 5000 Mtr. and 1814 Mtr. respectively with the Length: Width ratio of 2.76:1.
Fig. 1 (Shape of Micro Watershed)

148

149

150
(3.4) Climate :
The Watershed falls under ………………. semi arid region of tropical climate
inclined in Western Plan Zone. The average annual precipitation is about approx. is 397
mm. spreading over 35 rainy days. Most of the rain fall (about 85%) is received during
July to September. The rain fall of moderate intensity. Nothing the area receives of
scarcity rainfall in the winter season. The temperator variation ranges from as high as 430c
in the month of May-June to as low as 40c in December-January.
(3.5) Geomorphology and Soils :
Geomorphology :
The entire watershed is topographically divided into major landforms. Accordingly
the soils of watershed can be grouped into various categories such plane land, undulated
land, sloppy land and erosic ravenous land.
Sl.
No.
Name of
Project
Name of
Village
Geograph
ical Area
(in ha.)
Raifed
Area
(in ha.)
Treatable
Area
Agri.
Land
1 2 3 4 5 6 7
1 K
han
dar
Khandar 263 223.50 231.55 236.70
2 Dalpatpur 144 122.00 127.76 131.04
3 Atraina 215 182.75 189.76 195.69
4 R. Narendrapur 104 93.60 91.55 94.64
5 Dighi 8 7.20 7.04 7.400
6 Udarmi 30 27.00 26.41 27.300
7 Anauna 99 84.15 87.15 90.09
8 Utrawali 36 30.60 31.69 34.200
9 N. Amarpur 112 95.20 98.59 106.40
Total 1011.00 866.00 890.00 923.46

151
Soil :
(a) Fine textured soil :
The soil are the most extensive soil group found in the watershed. Some portion of
the watershed is relatively sloppy flat land with fine soil texture as sandy loam. The soils
are in color and are inherently good high in fertility status. Soil texture is sandy lome loam
particularly in depressions and loam in the elevated portion. The soil characteristic texture
is dispersive and smooth. Therefore without imped the downward movement of water
productive layer of soil are easily by high runoff.
a- Coarse Textured Soil :
These soil are lying mostly in downward portion, along with erosic gully and
drainage line upto end of watershed outlet. These soils are coarser in texture and are
relatively poor in fertility status. The soils are lomy sand in texture. Rill and gully
formation in same parts particularly near the outlet of watershed can be seen.
(3.6) Drainage and Slope:
Due to prevalence of mild steep slope and presence of a number of drainage lines
in the watershed the drainage system is adequate. The watershed from part of Ganga Basin
and watershed. Under mild to steep topographical slope of MWS as divided as follow :
(Drainage and slope map fig.-4)
Table - 4 : Drainage and Slope
S. No. Grade Slope Percent Area in Ha. Remark
1 A 0.5-1 267 -
2 B 1 – 2 222 -
3 C 2 – 3 178 -
4 D 3 – 4 133 -
5 E 4 – 5 62 -
6 F 5 – 6 28 -

152
Fig-4 (Drainage & Scrub Map)
(3.7) Vegetation :
a- Natural Vegetation :
Natural vegetation is very poor in the watershed. The forest vegetation is
predominant with Vilayti Babool (Prosopis Juliflora). There are occasional occurrence of
Neem Plants (Azadirochta Indica), Shisham (Dalbergia Sissoo) and Karanj (Pangamia
Glabra) and anywhere some scrubs are seen. There are no grass land in the watershed.
Somewhere grass patches are seen only on the bunds, roadside and other such places. Poor
percentage of massive green trees has been not seen in the watershed except Horticulture
backyard.
b- Horticulture :
There is no backyards or commercial horticulture plantation in villages are been in
some part of watershed.
c- Agro forestry :
The agriculture fields of the villages have some horticulture plantation at places
isolated trees whose frequency is seen as under agroforestry and some where in where in
backyards.

153
(3.8) Human Population:
a- Human Population:
Total Population of involved villages in watershed is 8936 with average family
size of six persons as delaled as follows
Table – 5 : Human Population
S.
No.
Name of village Nos. of
families
Human Population Total
Male Female Children
1 Khandar 333 591 546 487 1624
2 Dalpatpur 153 309 286 198 793
3 Atraina 441 1385 1281 709 2375
4 R. Narendrapur 392 1083 984 485 2552
5 Dighi 1350 2632 2431 1687 6750
6 Udarmi 136 312 289 200 801
7 Anauna 345 1407 1262 409 3078
8 Utrawali 551 1601 1470 768 3839
9 N. Amarpur 385 1766 1567 508 3841
4086 26653
e- Categorization of Human Population :
In the total population of watershed villages, categories are defined as below :
Table – 6 : Population Categories
S.
No.
Particulars Unit
Number of families in population
in the villages
Population Family Remark
1 2 3 4 5 6
1 Agri Farmer No. 21322 3268
2 Landless No. 567 81
3 Agri. Labour No. 2856 408
4 Land less Labour No. 21 3
5 BPL Family No. 91 13
6 SC Family No. 1694 242
7 ST Family No. - -

154
(3.9) Land Holding :
All the categories of farmers as small, marginal, medium and large are involved in
land holding average of about 1-18 ha. Small land holding farmers are further scattered at
different places which makes cultivation very difficult. Distribution of term families
according to the size of the land holdings are given as below :
Table – 7 : Distribution of farm families according to their size of land holdings
S.
No.
Name of Village Total
Agri.
Land in
MWS
Land Holding Family (Nos.) Percentage
Marginal
(< - 1Ha.)
Small
(1–2
Ha.)
Medium
(2-4 Ha.)
Large
(4-7
Ha.)
Total
1 Khandar 236.7 165 7 5 2 175
2 Dalpatpur 131.04 91 4 3 01 95
3 Atraina 195.67 175 19 17 1 162
4 R. Narendrapur 94.64 67 11 9 1 21
5 Dighi 7.400 4 1 01 - 6
6 Udarmi 27.300 22 3 2 - 27
7 Anauna 90.09 80 5 1 1 87
8 Utrawali 34.04 25 2 1 - 28
9 N. Amarpur 106.46 85 8 5 1 99
Total 923.46
(3.10) Live Stock Population :
Total live stock population of the watershed is Nos. Buffalos is preferred as mulch
animal compared to Cow. But milk yield is poor. Goats are also kept for milk as well as
for meat purpose. The breakup of livestock population is as follows:

155
Table – 8 : Live Stock Position
S.
No.
Name of
Village
Unit Live Stock Position Total
Buffaloes Cows Bullocks Goats
1 Khandar No. 824 497 169 119 1309
2 Dalpatpur No. 1011 211 114 87 1423
3 Atraina No. 1625 249 141 219 2234
4 R. Narendrapur No. 1193 395 179 197 1964
5 Dighi No. 871 197 176 237 1481
6 Udarmi No. 627 191 137 129 1084
7 Anauna No. 493 139 69 76 777
8 Utrawali No. 923 238 139 191 1491
9 N. Amarpur No. 1037 198 132 231 1598
Total 8604 2015 1256 1486 13361
(3.11) Infrastructure Social Feature :
a- Comprised villages in the micro watershed has moderate communication
facilities. Watershed linked with metaled road and approachable through
motarable road.
k- All the villages are electrified and have T.V. and Telephone connection.
l- Literacy rate in the watershed is very low all villages are having education upto
Junior High School.
m- Nearest small market is at Pahasu 13 Km. Nearest big market Bulandshahar is
about 55 Km. from watershed. Religious and ritual features are almost common
as in other parts af U.P. small land holding with large family size and more
than 25% of the labour force of the total population living below poverty line
indicate poor socio economic status of the watershed community.

156
Participatory Rural Appraisal
Participatory mode of the villagers shows positive indication for the success of the
programme. Traditionally the entire village community participate in the individual works. Social
map of one of the watershed village drawn by villagers themselves, depicting various village
figures is shown in sketched map in Fig.-4 & 5. Infrastructures position of the village recorded as
follows :
Table – 9 : MW.S. Project – Farida
S.
No.
Infrastructure Unit Qty.
1 2 3 4
1 Primary School No. 2
2 Junior High School No. 1
3 Kanya Pathshala No. -
4 Public Health Center No. -
5 Vet nary Hospital No. -
6 Panchayat Ghar No. 2
7 Post Office No. -
8 Agan Bari Center No. 2
9 Electricity - Yes
10 Road - Yes
11 Pond No. 2
12 Hand Pump No. 23
13 Irrigation Well No. -
14 Canal No. -
15 Temple No. 8
16 Well (Drinking Water) No. -
17 Pumping Set No. 31
18 Toilet No. 13
19 Market No. No

157
SOCIAL MAP

158
Recorded importance of development institution
Farmers perception recorded for importance and role of different
development institution in relation to infrastructure. Importance has been depicted with
size of circle and role with distance from village circle. (Fig 8)
Fig. -8 (Venn diagram of Micro watershed)
(3.12) Communication :
Watershed can approached from Distt Headquarter Bulandshahar to Project area
35 km. by Road.
(3.13) Natural Resource Base :
Transact of watershed showed typical land use profile consisting of plain
agriculture land, erosic area and medium ravenous ridge. Main source of the irrigation are
the canal for pre showing irrigation only. The total geographical area of the watershed is
890.00 Ha. classification .
Approach roads for the micro watershed is shown for the communication is shown
on topo sheet map Fig 9 as next page.
KHANDAR

159
Fig.- 7 Communication Map on Toposheet

160
Table – 10 : Classification of area(Hect.)
S.N
o.
Name of
Village
Unit Total
Geographical
Area
Rainfed
Area
Wasteland Village
Land
and
Road
Irrigation Resource
Water
Bodies
Borewell
1 2 3 4 5 6 7 8 9
1 Khandar Ha. 263 194.50 10.30 5.00 - 18.35
2 Dalpatpur Ha. 144 106.47 5.76 2.00 - 5.20
3 Atraina Ha. 215 158.98 8.00 3.70 - 15.80
4 R.
Narendrapur Ha 104 75.90 4.30 - - 11.70
5 Dighi Ha 8 - - - - -
6 Udarmi Ha 30 18.00 - - - 2.00
7 Anauna Ha 99 49.00 3.10 1.80 - 11.00
8 Utrawali Ha 36 - 1.00 - - 3.70
9 N. Amarpur Ha 112 94.00 4.75 4.20 - 16.00
Total 1011 697.85 37.81 16.70 - 83.75
(3.14) Livelihood :
Total Population of the watershed is 8936 and out of the total population a majority
more than 80% has farming as their major source of livelihood followed by labours,
serviceman and small business class. Classified livelihood given in form as fallows :
Table – 11 : Livelihood Classification in population :
S.
No.
Name of Village Farmer Labour In Service In Local
small
business
Others
1 2 3 4 5 6 7
1 Khandar 175 21 8 4 -
2 Dalpatpur 95 17 13 7 -
3 Atraina 162 29 14 9 -
4 R. Narendrapur 21 7 2 2 -
5 Dighi 6 1 1 3 -
6 Udarmi 27 2 2 4 -
7 Anauna 87 11 7 5 -
8 Utrawali 28 9 5 3 -
9 N. Amarpur 99 17 10 7 -
Total 720 114 62 44 -

161
(3.15) Dependency of forest fuel wood and fodder :
a. Fuel wood :- The main source of fuel is from cow dung cake, woody stem of crops.
About 70% of the clomestic energy requirement is met from the agriculture by product
and cow dung cake. Rest is met out from the forest outside the village and watershed
boundary, most preferred fuel wood is Juliflora fuel wood Juliflora obtained from
standing along and between watershed.
e- Fodder :- Villages have not any sufficient signified dependency on forest based
fodder as these resource are nothing availability in the forest.
(3.16) Labour requirement :
Labour requirements was found to be maximum at the time of October, November
and December when the sawing of Rabi crops are done. The crucial periods are March and
April coinciding harvesting and threshing of Rabi crops and July/August is sowing Kharif
Crops take a little place. Other income generating enterprises having potential during the
remaining.
(3.17) Crop Rotation :
Present Crop rotation in the watershed comprise of :
Kharif - Bajra - Rare
Maize - Rare
Jwar - Rare
Rabi - Fallow Wheat - Major
Fallow Barly - Major
Fallow Sugarcane - Major
Fallow Mustard - Major
Zayad - Urad, Moong, Makka
The above said Rabi Crops is the most prevailing crop rotation on the agriculture
lands both in the rainfed and irrigated conditions.
Organized vegetable cultivation fruit plantation and traditional agro forestry
systems are lacking as per requirement in the watershed the limited vegetable cultivation
in the watershed is confined as kitchen gardens and field to the irrigated condition in a
scattered manner. The cultivation of cash crops other than the sugarcane, wheat and
mustard also in the watershed.
(3.18) Historical Events :
Chronological record of important events of the watershed village is prepared
through participatory rural appraisal (PRA) which is very useful in understanding of its
background and chronology is given as follows :

162
Table – 12 : Historical Events
S.
No.
Events/Activities Year Rem.
1 2 3 4
1 Established 1600
2 Opening of Primary School 1970
3 Opening of Junior School 2007-08
4 Opening of Kanya Pathshala -
5 Opening of PHC -
6 Opening of Vet. Hospital -
7 Panchayat Ghar 2008
8 Introduction of Tractor 1990
9 Gobar Gas Plant -
10 Thresher 1975-76
11 First Tube well/Pumpset 1968
12 First Motorcycle 1985
13 T.V. & D.V.D. Players 1984
14 Electricity in Village -
15 Bituminous Road 2009-10
16 First Hand Pump 1962
17 Templo Renovation 1960
18 First Land Line Telephone 1990
19 Planning for Watershed Project 2011-12
(3.19) Present Land Use in the Watershed :-
The watershed has diversified land uses. The varied present land use under
different use in the watershed. The mixed land use followed in the watershed is almost
similar in other parts of U.P. During P.R.A. Exercise prepared land has been shown in
Table No. 13, 14 & 15.
Table – 13 : (Ownership)
S.
No.
Name of Village Pvt. Agri. Land Govt.
Revenu
Land
Forest
Land
Other
Land S.C./S.T. Others
1 2 3 4 5 6 7
1 Khandar 101.500 120.80 5.00 - -
2 Dalpatpur 129.00 12.00 4.00 - -
3 Atraina 53.70 160.0 2.30 - -
4 R. Narendrapur 52.00 50.00 2.0 - -
5 Dighi - 8 -
6 Udarmi 29 - 1.00
7 Anauna 62 36 1.00
8 Utrawali 21 13.7 1.30
9 N. Amarpur 39 72.60 1.40

163
Table –14 : (Present Land under different categories)
S.
No.
Name of Village Land Use (Ha.)
Agricultural Wasteland
(All Types)
Seasonal
waterbodies
Village/Raod
Etc.
Total
1 2 3 4 5 6 7
1 Khandar 236.70 21.30 5.00
2 Dalpatpur 131.04 10.60 2.40
3 Atraina 195.69 17.01 2.30
4 R. Narendrapur 94.64 7.360 2.00
5 Dighi 7.400 1.700 1.00
6 Udarmi 27.30 9.00 1.00
7 Anauna 90.09 2.00 1.00
8 Utrawali 34.200 9.00 1.300
9 N. Amarpur 106.40 6.00 1.200
Total
Table – 15 : (Present land use classified)
Proposed Post Land Use has been given on Page No. 32
4- Focus on Present Land Use :
(4.1) Agriculture :
The total area under agriculture in the watershed is about 415.02 ha. out of which
906.61 ha. is under rainfed agriculture. Agriculture land uses in the watershed extended to
diversified land capabilities starting marginal to good class II land. The irrigated and
drinking water is most scarce natural resource in the watershed. The operation of tube well
for irrigation of agricultural crops frequently leads to the drinking water. Problem to the
S.
No.
Land Use Under Unit
(ha.)
Area
(Ha.)
Percentage
1 2 3 4 5
1 Under Agriculture
A- Rainfed-
I- Crops 506.00 70%
II- Agro forestry 32.00 7%
B- Irrigated- -
I- Assured
II- Portial 118.25 17%
2 Wasteland
A- Aforestation
B- Pasture
C- Untreatable
D- Treatable 156.44 100%

164
farmers of watershed forcing them to carry drinking water from outside of the watershed
area. The agricultural field bund are common in the watersheds however they frequently
breach on heavy rains.
Various mixed texture of soils are located in patches through out the watershed.
The heavy soils are almost kept fallow during rainy season. the agricultural soils also have
some as share calcium pan at variable depths. The irrigation water is conveyed by the
earthen channels. Surface irrigation methods following mainly border method of flood
method by the formers in the watershed. These factors reduce the water use efficiency of
limited and valuable irrigation water.
Drought hardy species like Juliflora suitable multi purpose trees is suitable for
rehabilitation of the wasteland. Rehabilitation of waste lands promoting agro forestry with
appropriate fruit and forest species suitable vegetative barriers on sloppy lands can be high
future value and by these adoption would be meet out many demands of fire wood and
fodder in the wasteland. Except above but also for soil and water conservation,
rehabilitation of wasteland and sustainable income generation for socio-economic
upliftment of farmers.
Crop Productivity :
The farmers also do not have suitable cropping system to deal aberrant weather.
Weeds impose considerable constraint in productivity of both Karif and Rabi crops under
irrigated as well as rainfed production system farmer undertake normally one manual
weeding in mustard and other valuable crops however, practices is energy and time
consuming. Use of we decide is rare in the watershed.
In the watershed area, limited cropping in the Kharif with mixed cropping practices
is not only irrigational but also unscientific and best for low productivity. Subsequent Rabi
crops in general. Sugarcane & Mustard crop in particular are raised on residual soil
moisture under rainfed production system during post mansoon season.
(4.2) Indigenous Technological Knowledge (ITK) :
Under process of PRA tracked out rural applying technology in various field of
local technology and some technology is very popular in village. In which the agriculture
is an old traditional practices of farmers who have improved themselves with passage of
the time according to their domestic needs and technological reforms in the nearby areas.
The villages have their traditional village ponds, practice of field bunding which typically
constitute agricultural related ITKs in the watershed. The Mustard & sugarcane being a
cash and firewood crop of the watershed and also sugarcane crop is being. Cultivated in
165
self designed manner by the farmers. Its carried out that the area is totally depend on rain
and under the rainfed area technology is applied by the farmers. However limited fertilizer
application specifically the DAP came in the practices since about 15-20 years.
(4.3) Forest and Other Vegetation :
Forest :
The watershed have a tract of wasteland area which are under uncultivable position
is liesed in the watershed. These wasteland have not any tree vegetation or very less than
real requirement for the wasteland use.
Horticulture/Agro forestry :
Horticulture and agro forestry practices were observed in the watershed.
(4.4) Agro forestry :
Agro forestry practices are lacking in the watershed. Though it has good potential
under existing disposition and may a role particularly with respect to minimization of
cropping risk, built up soil fertility and productivity, protection of soil erosion, soil
conservation partly meeting out the fire wood demand of rural community and more over
optimizing the economical return from system as whole under typical semi arid climate in
the watershed. Bund and boundary plantation also have good potential to care the fire
wood and fodder demands of the rural community in the watershed. The existing area
under agro forestry is almost negligible. Prosopis Jhliflora may be planted as block or sole
plantation specifically on marginal and degraded land in the watershed.
The agro forestry interventions comprising of ber, bail, aonla, guava, papular etc.
may be applied for benefit of the farmers under rainfed to irrigation production system on
leveled to slopping and marginal agricultural using proper planting techniques and term it
control measures.
The multipurpose trees may be also help in supplementing fire wood and fodder
demands of the rural community in the watershed and my be planted as hedge rows on
rainfed, marginal and degraded lands.

166
(4.5) Horticulture :
Fruits and vegetables practices are lacking in the watershed area. Its practices may
be sustainable very good potential for the formers of watershed. There are a limited lack
fruit trees in number like mango, guava, lime, ber, aonla and papaya fruit trees well as
vegetables like radish, okra, tomato, cabbage, garlic, onion, chilly, bringer and cucurbits
but they are found surviving well in the watershed villages. Organized orchards (vatika)
commercial vegetable cultivation horti-agri and other systems of agro forestry etc. are
lacking but have good agriculture.
5. Soil and land capability classification :
(5.1) Soil Morphology :
Watershed is located North East corner of Bulandshahr Distt. near about 55 Km.
away. The entire terrain of watershed is topographically divided into various land forms.
Accordingly the soils of watershed have been grouped major categories is given as follow
:
Hill Terrain Plane
Land
Sloppy
Undulated
Land
Rill Erosic
Land
Moderate
ravenous
- 25% 20% 15% 7%
Given categories in the blocks is located the soil morphology in the watershed
areas. Representation of soil characteristics by soil profile is represented as follows :
Soil Profile :
Fig. – 9 (Soil Profile)

167
Table – 16 : (Morphology of a Typical Soil Profile) :
Horizone Depth in
Cm.
Morphology
1 2 3
A
V & H
0-150 Silky when moist, Hard when dry quick
soluble, high elasticity, fissures, and cracks,
occasional occurrence of free calcium
carbonate granules black in colour, clay
content 29%, PH- 8 to 8.7
B
V & H
150-160 Whitish yellow in colour, very fine mixed
with free cacaos and gravels, Hard when dry
compact and indurate hard pan restricting
development of root and down ward water
transmission.
C
V & H
7600 Red and white sand stone
(5.2) Soil and Characteristic and Fertility Status :
Soil characteristic pertaining to soil fertility of various classes accruing around
villages in the watershed are given as follows :
Table – 17 : Soil Characteristic & Fertility Status :
Sl.
No.
Soil Properties LCC-II LCC-III
& IV
1 2 3 4
1 Sand % 45.04 72.04
2 Silt % 22.55 17.80
3 Clay % 28.35 6.4.6
4 Texture Sandy Clay Lomy Sand
5 PH (1:2) 7.05 7.55
6 Organic Carbon % 0.35 0.13
7 Available N Kg ha-1
312 171
8 Available P Kg ha-1
28 13
9 Available K Kg ha-1
185 322
10 EC (dS m-1
) 0.45 0.12

168
(5.3) Land Capability Classification (LCC) :
Land capability classification (LCC) was done to classification the soils in
different groups based upon the limitations and to emphasize the hazards prevailing in the
watershed in order to find out the different topo-sequences, landforms, soil depth and
erosion hazards. This was followed by the detailed investigation of selected landforms to
bring out the LCC classes of the Watershed. Classes of land capability namely II, III, IV
and V are demarcated in the watershed. The areas under different classes are sown as
follows :
Table – 18 : Land Capability Classification (LCC) :
S. No. Land capability
class
Area in Ha. Colour
1 2 3 4
1 I Class - -
2 II Class 108.560 -
3 III Class 325.004 -
4 IV Class 150.500 -
5 V Class 34.500 -
6 VI Class - -
7 VII Class - -
8 VIII Class - -
Land capability classification of various agricultural practices under land use can
be classified as groups, class, sub class and units. Utilization of various land class is given
as follows :
Table – 19 : Utilization of various land uses

169
(5.4) Land Capability Class II & III :
This group is one of the most extensive LCC watershed. and also near to class III
for the agricultural practices. The soils are sandy & sandy loam in texture. The land under
this class is nearly level to mild sloping (1-3%). The soils are deep and erosion hazard is
slight. Most of the productive agriculture land comes under class II & III. These lands
potentially very productive but due to rainfed a single cropping pattern is in habitation.
(5.5) Land Capability Class IV :
This class is found in lower portion near the outlets of watershed. The soils are
coarser in texture, deep, erosion hazard and undulating in topography. Rill and initiation of
gully can be seen near the outlet of the watershed.
(5.6) Land Capability Class VII & VIII :
This class of land is not found in watershed. Somewhere lack of soil are found with
admixture gravels fragments in these classes of lands.
(5.7) Conclusions :
The majority of land form is coming under class II, which give an insight of good
agriculture production potential of the watershed.
The land capability classification provides reasonable good information with
regard to capability of soil, that could be used for agriculture, agrihorticulture, silviculture
and posture development.
The productivity of these lands could be further enhanced by adoption of simple
soil & water conservation measures like bunding practices.
The reasonable area is under watershed of wasteland and other wasteland including
grater potential of this watershed for forestry and pasture development. Rare places
namely water body of low portion of land area under seasonally works as water harvesting
structures and these harvested water is used or can use for some other benificial activities
during the crop season also.
6. Problems and needs of the watershed indentified during the PRA
(6.1) Problem Identification and prioritization :
p- The are has undulating topography, steep unstable slopes, gradient of excessive
branches of rills and hence highly prone to soil erosion.
q- Major issues addressed to food sufficiency economic growth and environmental
security in the watershed area.
r- Effective soil depth is limited and highly variable hampering good crop growth.

170
s- The watershed have low productive cropping due to tradition single cropping
pattern and over all average crop production percentage not sufficient against
requirement.
t- Identified that there is no assured irrigation system has been development capacity
of water bodies are reduced due to silt ration which are utilized to store of rainy
water and they are renovatable.
(6.5) Transact walk during the PRA :
Problems identified and prioritized during the transact walk and PRA exercises in
all comprised villages of watershed. There were pooled and a list of problems
representing the whole watershed was prepared. Problems were ranked as per their total
weight age in the watershed village.
Table – 20 : Ranking of Problem identification and prioritization of watershed
S.No. Problem Rank
1 2 3
1 Lack of irrigation 3
2 Lack of drinking water 7
3 Low production of field crops 4
4 Lack of fodder availability and low productivity 3
5 Lack of availability of fuel wood 4
6 Lack of market facility 4
7 Lack of quality seeds, fertilizer, pesticides etc. 3
8. Medical and Health care facilities for milching
animals and low productivity.
6
9 Lack of medical, educational and transportation
facilities
8
10 Lack of water bodies renovation 9
11 Lack of run of earthen check bunds 1
12 Lack of water harvesting structures 1
13 Lack of livelihoods opportunity 3
Prioritized ranking (Upto four Numbers) :-
10- Lack of earthen check bunds.
11- Lack of livelihood opportunities.
12- Lack of irrigation water was the greatest problem. Lack of irrigation water
problem experienced by the people followed by low crop production.

171
(6.3) Analysis of SWOT of the watershed :
Strength (S), Weakness (W), Opportunity (O) and Threat (T) analysis is a
useful decision support tool. A SWOT analysis of watershed is presented as
follows :
SWOT analysis of the watershed
Strengths (S)
xxxi. Cooperative work culture in traditional
activities
xxxii. Close ethic ties
xxxiii. Road at the top as well as outlet of the
watershed
xxxiv. Hard working
xxxv. Resource pool of crop genetics
diversity
xxxvi. Awareness of farmers about watershed
management programme
xxxvii. Well established CPR maintaining
and sharing system
xxxviii. Stall feeding of animals
xxxix. Well maintained seasonal water bodies
xl. Social outlook of the community
towards land less
Weakness (W)
xxviii. Poor water management
xxix. Resource poor farmers
xxx. Out migration of youth
xxxi. Low and erratic rainfall
xxxii. Fragile geology
xxxiii. Fragmented land holding
xxxiv. Heavy infestation of wild animals
xxxv. Problem of fuel and fodder
xxxvi. Shallow soil depth and with high
percentage of gravel
Opportunities (O)
xix. Wide range of annual and perennial crops
xx. Scope of regular employment opportunities
to check out migration
xxi. Strengthening of existing irrigation system
xxii. Conducive climate for rainfed crop
diversification
xxiii. Good scope for Agro forestry and dry
land horticulture
xxiv. Potential for collective action and
management of CPR
Threats (T)
xvi. Prone to adverse climate like drought
xvii. High market risk
xviii. Social conflicts owing to PRI and
WSM polices and local politics
xix. Weak coordination among line departments
xx. Lack of expertise of implementing agency in
different aspects of WSM
7. Proposed land use for the watershed :
Watershed management plan preparation due importance is given to topographic,
land suitability, irrigation potentially, prevailing farming systems, micro farming situation,
farming, farmers preferences and priorities along with economic and environment
securities.

172
Crop and tree selection and area distribution was done as per farmers priorities
revealed through PRA exercise.
The watershed management plan for watershed is prepared with specific objectives
of food sufficiency, income and employment generation with environment security.
Technical options were with the ITK based on the latest available experiment
findings. Due attention was given to the resource of the farmers and adjustments were
made in capital intensive resource demanding technological outputs while making them
adoptable to the resource poor farmers. Emphasis was given on maximum use of farm
yard manure. The proposed land use plan of the watershed is shown as follow as in table
Table – 21 : Present and proposed land use plan of the watershed
S.No. Land use Present
(ha)
Proposed area
(ha)
1 2 3 4
1 Agriculture
a Rainfed
I Crops 820.00 70%
II Agro-forestry 25.00 7%
b Irrigated
I Assured
II Partial 125.00 17%
2 Waste land
a Aforestation
b Pasture
c Untreatable
d Treatable
3 Village land 256.44 100%
(7.1) Status of Present Water Resources Utilization :
Watershed is having some canal system. Management and maintenance of these
canal are required. Before sowing of Rabi crops, water from these canal is issued as
supplementary irrigation for Rabi sowing are allowed to go as waste. After releasing water
from canal, submergence area also put under cultivation.
Some where bore well irrigation applied by the farmers in the watershed.

173
(7.2) Proposed Plan for Irrigation Development :
a- Present system of irrigation and wastage of water during October–November
need to be made more efficient from water management point of view by
minimizing conveyance losses in the existing water courses.
b- Present irrigation canal capacity have to build up by the reform. Which are lack
capacity of water.
c- Construction of new water harvesting earthen structures, Pucca Check Dem, Series
Gully Plugging, etc. has been sloppy portion to increase irrigation potential and for
recharging of ground water, soil and moisture conservation maximum field
irrigation, best production and expected change of crop rotation.
d- The up gradation of the exciting system of irrigation will result in :
i- Minimization of conveyance losses.
ii- Increase in frequency of irrigation.
iii- Adoption of high yielding varieties of crops.
iv- Assured cultivation of cash crops.
v- Capacity buildup by the planning of new water harvesting structures.
(7.3) Ground Water Recharge :
For the purpose of ground water recharge, the area of the upper side of watershed
is recommended for Field Bunds, Contour Bunds, Peripheral Bunds and Submergence
Bunds and in the lower portion Contour Staggered Trenches, Gully Plugs, Earthen Check
Dem and Pacca Outlets. In the undulated sloppy portion of the watershed recommended
water harvesting structure for dual purpose as ground water storage and under ground
water recharge.
(7.4) Crop Production :
Practices proposed in the watershed is given as follows :-
a- Mulching and crop residue management.
b- Application of green manuring.
c- Vermi Composting.
d- Crop rotation and inter cropping.
e- Biofertilizers.

174
(7.5) Tillage Operation :
Deep tillage technology is proposed to apply to be demonstrated for benefit of
farmers in the watershed.
(7.6) Improved Seeds of High Yielding Verities (H.Y.V.) :
Recommendation of improved varieties is necessary for improving the productivity
and farm income. Through replacement of low yielding traditional verities of seeds in
villages of watershed.
(7.7) Balanced Fertilizer Use :-
Demonstration of use of fertilizer in various crops of watershed recommended
balance fertilizer use in different crops will be benefited of forming community.
(7.8) Control of insects and diseases :
Aphid in the mustard are the major insects in the watershed areas leading to loss in
crop productivity. Similarly white blister is also a common disease in the mustard crop.
The management strategies of these insect pest and diseased will also be
demonstrated in the watershed for benefit of the growers.
(7.9) Dry Land Horticulture :
Such portion of dry land in which proposed horticulture development planning
recommended species like Ber, Bel and Aonla will be planted at suitable spacing in the
watershed.
(7.10) Agri Horticulture :
Aonla and Sahjan would be suitable horticultural crops to the locality. Therefore, a
part of land in the farmer field shall be selected and brought under Agri-horticulture
system. The cropping system followed will be Jwar and Wheat.

175
(7.11) Plantation (Fuel wood) :
Such a portion which are under wasteland will be taken falling in the class-IV
category in the watershed. These lands will be planted with species like Vilayati Babool
(Prosopis Juliflora), Babool (Acacia Nilotica), Karanj (Pangamia Glabra).
9. Socio Economic Analysis of the of the Project :
(9.1) Sustainability and environment security :
The proposed land use plan will improve the land utilization index and crop
diversification index significantly as compared to the existing one. in the proposed
watershed management plan proper blending of the bio engineering measures will be
applied on above 80% of the total area of watershed. It is estimated that more than above
70% of the watershed area will be treated and consequently the soil loss and runoff from
the area is excepted to be reduced by 70% respectively.
It will help in maintaining ecosystem integrity on sustained basis along with
improving the livelihood security of the farming community.
(9.2) Economic Analysis :
Economic analysis of the project was carried by taking direct benefits and costs
considering 10 years for project life at 10% discount rate. Whole watershed development
plan was divided into three sector as agriculture, horticulture and forest/Fuel wood
plantation. Net Present Value (NPV) and Benefit Cost ratio criteria were applied judge the
economic efficiency of each enterprises and sector. Net present value (NPV) of the project
life is considered to be 10 years and discount rate for NPV estimation is 10% is given
NPV and benefits as follows :-

176
Table – 22 : Present productivity income analysis :
S.
No.
Name of
Sector
Name of
Crops
Produ
cti-
on/ha.
Rate/
Qtl.
Cost of
Production
Expend. of
cultivation
Net
income
B.C. Ratio
between
Col. 8 & 7
1 2 3 4 5 6 7 8 9
A Agriculture Urad 3.00 4300.00 12900.00 6450.00 6450.00 1:1
Moong 3.00 4500.00 13500.00 6075.00 7425.00 1.22:1
Jwar 4.80 600.00 2880.00 1584.00 1296.00 0.82:1
Wheat 18.50 850.00 15275.00 8650.00 7075.00 0.82:1
Pea 7.50 2250.00 16875.00 10970.00 5905.00 0.54:1
Mustard 3.50 18.500 6475.00 3235.00 3240.00 1:1
Total - 105105.00 54105.00 51000.00 0.94:1
Average - 13138.00 6763.00 6375.00 094:1
B Forestry Vilayati
Babool
15000.00 - Nil
C Horticulture Ber 20000.00 - Nil
Aonla 20000.00 - Nil
Bel 20000.00 - Nil
Total - 60000.00 - Nil
Average - 20000.00 - Nil
Grand Total

177
Table –23 : Post productivity and income analysis for Post Productivity
Value and B.C.:
S.
No.
Name of
Sector
Name of
Crops
Produ
cti-
on/ha.
Rate/
Qtl.
Cost of Production
Expend. of
cultivation
Net
income
B.C. Ratio
between
Col. 8 & 7
1 2 3 4 5 6 7 8 9
A Agriculture Urad 4.00 5000.00 20000.00 8325.00 11615.00 1.39:1
Moong 4.00 5000.00 20000.00 8200.00 11800.00 1.44:1
Jwar 5.50 800.00 4400.00 1900.00 2500.00 1.32:1
Wheat 25.00 1000.00 25000.00 16680.00 13320.00 1.14:1
Pea 9.50 3500.00 33250.00 14810.00 18540.00 1.12:1
Mustard 5.00 3000.00 15000.00 4370.00 8130.00 1.86:1
Total - - - 172250.00 72845.00 99765.00 1.38:1
Average - - - 21531.00 9061.00 12471.00 1.38:1
B Forestry Vilayati
Babool
80.00 500.00 40000.00 15000.00 25000.00 1.67:1
C Horticulture Ber 35.00 2000.00 52500.00 20000.00 32500.00 1.63:1
Aonla 35.00 2000.00 70000.00 20000.00 50000.00 2.50:1
Bel 40.00 1500.00 80000.00 20000.00 40000.00 2:1
Total - - - 182500.00 60000.00 122500.00 2.04:1
Average - - - 60833.00 20000.00 40833.00 2.04:1
Grand Total - - - 1394750.00 147485.00 247265.00 1.68:1
Table –24 : Summary of NPV, PPV and B.C. Ratio (Sector wise) :
S.
No.
Name of Sector NPV PPV B.C.
Ratio Expend. Net
Income
Expend. Net
Income
1 2 3 4 5 6 7
1 Rain fed
Agriculture
54105.00 51000.00 72485.00 99765.00 1.38:1
2 Forest/Fuel wood
Plantation
15000.00 - 15000.00 25000.00 1.67 : 1
3 Horticulture 60000.00 - 60000.00 122500.00 2.04:1
Total 129105.00 51000.00 147485.00 247265.00 1.68:1

178
(9.3) Economics of Agriculture Sector :
The development cost can be recovered by the adoption of plan in present rain fed
agriculture is being done on well maintained field, therefore does not require much
investment. In rain fed agriculture, investment of Rs. 44.50 lacs is proposed to made is
given as fallows :
Table – 25 : Economics of Agriculture Sector :
S.
No.
Name of
sector
Name of Activities
/ Plan
Treatble
Area
(Ha.)
NPV
(Lacs)
Post
Productivity
Value (Lacs)
Benifit /
Income
B.C.
Ratio
1 2 3 4 5 6 7 8
1. Rainfed Soil, moisture
and water cons
works 890.00 481.49 1195.93 664.44 1.38:1
(9.4) Economics of forest fuel wood plantation :
Economic analysis of fuel wood plantation in the watershed. Project life is
considered to be 20 years and discount rate for NPV estimation is 10 % is followed and as
is given follows :
Table –26 : Economics of forest fuel wood Plantation :
S.
No.
Name of
sector
Common Name of
Plant
Area
(Ha.)
NPV
(Lacs)
Post
Productivity
Value (Lacs)
Benifit /
Income
B.C.
Ratio
1 2 3 4 5 6 7 8
1. Forest
Fuel
wood
sector
Vilayati Babool
(Prasopis
Juliflora)
25.00 2.50 6.675 4.675 1.67 : 1
(9.5) Economics of Horticulture Sector :
Economic analysis of Horticulture Plantation in agri-horti system and on wasteland
patches of watershed project, life is considered about 15-20 years and discount factor rate
for NPV estimation is 10% is follows :

179
Table – 27 : Economics of Horticulture system :
S.
No.
Name of
Sector
Common name of Plants Area
(Ha.)
NPV
(Lacs)
Post
Productiv
e Value
(Lacs)
Benefit
Lacs
B.C.
Ratio
1 2 3 4 5 6 7 8
1 Horticulture Ber (zyziphus
mouritana)
4.00 0.80 2.104 1.304 1.63: 1
Amla (Embelica
officianalis)
3.80 0.76 2.660 1.40 2.5 : 1
Bel (Aegle marmelos) 2.20 0.44 1.320 0.88 2 : 1
Total 10.00 2.00 6.084 4.084 2.04 : 1
(9.6) Food requirement and sufficiency :
Achieving self sufficiency in food production is one of the prime objectives of
watershed project. The status of food requirement and production before and after the
project is presented as is follows :
Table – 28 : Status of food requirement and availability of per annual :
S.
No.
Name of Foods Requirement
Q./Yr.
Present Status Expected Post Status
Availability
Q./Yr.
Deficit or
surplus
Q./Yr.
Availability
Q./Yr.
Deficit or
surplus
Q./Yr.
1 2 3 4 5 6 7
1 Cereals 110 Kg. 29318 24920 (-) 4398 49841 20523
2 Pulses 36.50 9728 5350 (-) 4378 17510 7782
3 Oil Seeds 29.20 7783 3113 (-) 4670 12453 4670
4 Vegetable 71 kg 24254 4851 (-) 19403 43657 19403
(9.7) Employment generation :
One of the major problem of the labour migration in watershed project. By the
implementation of the project activities employment opportunities will be generated.
However the changes in land use pattern and adoption of other subsidiary enterprise will
generate employment opportunities in the watershed as given in table follows :

180
Table – 29 : Employment generation under proposed works :
S.
No.
Employment
activities/works
Area
under
work
Cost Mandays generation (Nos.)
Unskilled Skill Total Person
1 2 3 4 5 6 7 8
2 Graded Contour Bund 103 3.090 3090 - 3090
3 Gully Plug, C.D. 171 12.825 8978 227 9205
4 Submergence Bund 146 5.840 5840 - 5840
1 Peripheral Bund 145 5.075 5075 - 5075
5 W.H.B. 180 16.200 9720 550 10270
6 Renovation of Bund 111 3.330 3330 - 3330
7 Reno. of W.H.B. - - - - -
8 Community Pond 25 5.040 1008 - 1008
9 Afforestation 10 2.00 400 - 400
10 Horticulture - - - - -
Total 890 53.400 3744 777 38218
10. Formation of watershed committee :
Under compliance of common guideline Para (6.3) is followed and by the help of
watershed development team, watershed committee is organized in the micro watershed
village Ghuraiya with 10 members as prescribed in common guide line. List for
organization of W.C. village details given as follows :
Table – 30 : Details of comprised village W.C. organization in M.W.S. :
S.
No.
Particulars Details Block Geogra-
phical
Area
1 2 3 4 5
1 Micro watershed code 2B3E3c3e Pahasu
2 Name of Gram Panchayat
in M.W.S.
Khandar 1011

181
Table – 31 : List of organized W.C. for the Gram Panchyat Khandar in watershed.
S.
No.
Name of selected
members
Age Representation
Members from
Post Qualification Village
1 2 3 4 5 6 7
1 Indrajeet Singh 52 Gram Sabha President Sakhar Khandar 2 Jagveer Singh 34 Gram Sabha SHG Sakhar Khandar
3 Bijendra Singh 34 From – U.G Member Sakhar Khandar
4 Jaswant Singh 30 From – U.G Member Sakhar Khandar
5 Chotelal 23 From – U.G Member Sakhar Khandar
6 Prem Chand 28 From – S.H.G. Member Sakhar Khandar
7 Bhoop Singh 25 From – S.H.G. Secretary Sakhar Khandar
8 Smt. Rajkumari 29 From – S.H.G. Member Sakhar Khandar
9 Smt. Kuldeep 39 From – S.C. Member Sakhar Khandar
10 Bhimbhoo Singh 40 From – S.C. Member Sakhar Dalpatpur
11 Ram Singh 34 From – PIA Work out B.Sc. Khandar
(10.1) Formation of Self Help Groups in M.W.S.
By the help of watershed committee and watershed development team self help
group are formatted / organized. Families and persons are selected from poor, small and
marginal farmers families, landless poor families, agriculture labour families, women,
herdsman and shepherd and S.C. families in the formatted self help groups are given as
follow :
Table – 32 : Vikas Self help group – Khandar (Livelihood) .
S.
No.
Name of member
in formatted
SHG’s
Age From
represented
family
Name of
proposed
activities
Activation
Position
1 2 3 4 5 6
1 Bijendra 46 L.R. Live Stock New
2 Ajay Kumar 25 L.R. Live Stock New
3 Rakesh Kumar 23 L.R. Live Stock New
4 Chunni Lal 30 L.R. Live Stock New
5 Har Prasad 28 L.R. Live Stock New
6 Sonu Kumar 25 L.R. Live Stock New
7 Rajeshwari 27 L.R. Live Stock New
8 Raj Kumari 23 L.R. Live Stock New
9 Rani Devi 22 L.R. Live Stock New
10 Kunwar Singh 18 L.R. Live Stock New

182
Table – 33 : Jagarti Self help group Khandar i.
S.
No.
Name of
member in
formated
SHG’s
Age From
represe-
nted
family
Name of
proposed
activities
Activation
Position
1 2 3 4 5 6
1 Babu Lal 40 President Livestock New
2 Nemwati 38 Member Livestock New
3 Satyaveer 35 Member Livestock New
4 Brajrao 20 Member Livestock New
5 Sandeep Kumar 20 Member Livestock New
6 Khubiram 30 Secretary Livestock New
7 Indra Pal 40 Member Livestock New
8 Rajwati 38 Member Livestock New
9 Prem Chand 8 Member Livestock New
10 Smt Reshma 25 Member Livestock New
Table – 33 : Satyam Self help group Dalpatpur
S.
No.
Name of
member in
formated
SHG’s
Age From
represe-
nted
family
Name of
proposed
activities
Activation
Position
1 2 3 4 5 6
1 Sheeshpal 45 President Livestock New
2 Om Prakash 43 Livestock New
3 Pratap 32 Livestock New
4 Omveer 38 Livestock New
5 Jagveer 28 Secretary Livestock New
6 Prahlad 23 Livestock New
7 Sanjay 48 Livestock New
8 Meenu 22 Livestock New
9 Veerpal 41 Livestock New
10 Harendra 50 Livestock New

183
Formation of User’s Groups :
User’s groups are farmated by the help of watershed committee and watershed
development team in the micro watershed comprised villages. Formers which have land
village are involved in the User’s groups and they will be direct benefited as expected by
the implementation of watershed project easy and convenienced condition are made to
resource use between user’s groups and they will be responsible to operate and
maintenance for the created assets in the watershed. Nos. of farmated user’s groups details
are given as follows :
Table – 35 : Village wise user’s groups
S.
No.
Name of
village
No. of
groups
No. of
farmers
Total
Agri.
Land
Area
under
treat-
ment
Cost of
assets
1 2 3 4 5 6 7
1 Khandar 1 10 236.70 231.05
2 Khandar 2 10 236.70 231.05
3 Dalpatpur 3 10 131.04 127.26
10. Estimation and Costing of Proposed activities of the watershed Project Year 2010-11.
Proposed works / activities for the Project Period (Year 2010-11) under proposed
treatable area 629.00 Ha. Out of total Geographical area 677 Ha.

184
(10.1) Financial and Physical Outlets :
Table – 36 : Financial and Physical Outlets for the Year 2009-10 :
Sl.
No.
Components Unit
cost
per
ha.
Physical
ha. Financial (Lacs) Man-days
Generatio
n Labour
Component
Material
Component
Total
1 2 3 4 5 6 7 8
A Management Cost 10%
1 Administrative Cost – TA & DA
Hiring of Vehicles,
Official Expenditure
Electricity & Phone bill
Computer, Stationery and office
consumable materials & contingency
1200 - - 10.680 10.680 -
2 Monitoring 120 - - 1.068 1.068
3 Evaluation 120 - 1.068 1.068
Sub Total 1440 - 12.816 12.816
B Preparatory Phase 10% - -
1 Entry Point Activities 4% 480 - 0.8544 3.4176 4.2720 854
2 Institutional & Capacity Building 5% 600 - - 5.340 5.340
3 Detailed Project Report 1% 120 - - 1.068 1.068
Sub Total 1200 - 0.8544 9.8256 10.68 854
C Watershed Work Phase
a Watershed Development Works
1 Graded, Contour & Field Bunds 3000 103 3.090 - 3.090 3090
2 Gully Plug, Earthen Checkdam /WHS 7500 171 8.9775 3.8475 12.825 9205
3 Submergence bunds 4000 146 5.840 - 5.840 5840
4 Peripheral Bund 3500 145 5.0750 - 5.075 5075
5 Earthen Water Harvesting Bund 9000 180 9.720 6.480 16.200 10270
6 Renovation of existing Bunds 3000 111 3.330 - 3.330 3330
7 Renovation of existing W.H.B - - - - - -
8 Aforestation and Development of silvi
postural system 20160 25 1.008 4.032 5.040 1008
9 Dry Land Horticulture 20000 10 .400 1.60 2.00 400
10 Community Pound (Renovation) - - - -
Sub Total 890 37.4405 15.9595 53.400 38218
B Livelihood Programme (Community Based) 7.620
Income generating activities through SHG’s for landless and marginal formers 10%
1 Live stock development activities 200 - - 1.7803 1.7803 -
2 Bee Keeping 100 - - 0.8900 0.8900 -
3 Poultry Farming 200 - - 1.7803 1.7803 -
4 Nursery Development 300 - - 0.6700 0.6700 -
5 Vegetable Production 100 - - 0.8900 0.8900 -
6 Milk Dairy Promotion Unit 200 - - 1.7803 1.7803 -
7 Establishment of Vermi compost Unit 100 - - 0.8900 0.8900 -
8 Sub Total 1200 - - 10.6809 10.6809 -
C Production System and micro Enterprises
1 Crop production, diversification of
agriculture and introduction of agro
forestry
1170 - - 10.413 10.413 -
2 Demonstration of improved
composting system 390 - - 3.471 3.471 -
Sub Total 1560 - - 13.884 13.884
D Consolidation Phase 5% Sub Total 600 - - 5.340 5.340 -
Grand Total 12000 890 38.2949 68.5060 106.809 39072

185
ladYi i=
xzke iapk;r & [k.Mkj dksM laŒ 2B3E3c3e fodkl [k.M &igklw ftyk & cqyUn’kgj ; g fd vkÃŒM CywŒ,eŒihŒ ifj ;k stuk es a rS;k j dh x ; h fuekZ . k dh u;h l ` ftr if jlEifRr;k sa
dks x z ke iap k; r [k.Mkj ,oa ekbØks okVj’ ksM ds vUrx Z r lfEefyr x z keksa esa ;k stuk fØ; kU o;u
djkus ,oa ; k stuk m ij kUr p kyw j[ kus rFkk l ` ftr ifj lEifRr; ksa ds v uq j{k.k gsrq Ñr l adYi ,o a
bP N q d gSA
[k.Mkj x z ke iap k; r ds lHk h l z ksr L Fky tS l s rkykc] x z kelHk k x ksp j ¼p kj kx kg½ ] ty
l al k/ ku] tx y vkfn esa H kwfe f odk l ifj ;kstuk d s vUrx Z r fd;s tk; sxsaA m u dk;k sZ dk s lekt ds
detk sj ox Z tS l s vuq l wfp r tkf r@tutkf r] efgyk ox Z ,oa vY i Hkwfeghu x jhch j s[k k ds uhp s d s
ykH kkfFk; k sa dks ykHk igq ¡p kus gsrq bPN q d gk sxsA
ge ; kst uk l ap kyu g srq iz L rkfor djrs gS a ,oa lgef r nsrs gS f d H kk jr l j dkj ds leLr
ekx Z n’ kh Z f l) kUrksa ds vuq ikyu es a d k; Z lE iUu djk; sx sa ;g Hkh ? k k sf"k r dj rs gS fd p ; fur {k s=
ftldks esj s }kj k H kyhHkk ¡ fr ns[k k x ; k gS] vk S j izLrkf or ;k stuk es a iz Lrkf or leL r dk; Z 15 l kyk sa ls
ugha dj k; k x ; k gS ftldh eq> s iw.k Z :i l s tkudk jh gS v kS j vuq ek snu dj rs gSA

186
PROJECT AT A GLANCE
IWMP-II (Bulandshahar)
1 State Uttar Pradesh
2 Distt. Bulandshahar
3 Block Pahasu
4 M.W.S. Code 2B3E3c3d
5 Name of M.W.S. Project Udarmi
6 Involved Village 05
7 Geographical Area of M.W.S. 507 Ha.
8 Rainfed Area 399.26
9 Treatable Area 456
10 Weightage
11 Cost of Project 54.72
12 For the year 2010-11
Budget Components
S. No. Components Area
(Ha.)
Cost
(in Lacs)
1 2 3 4
1 Management Cost 12% - 6.5664
2 Preparatory Phase 10% - 5.4720
3 Watershed Work Phase -
A- Watershed Development Works 50% 456 27.360
B- Livelihood Programme (Community Base) 10% - 5.4720
C- Production System & Micro Enterprises13% - 7.1136
4 Consolidation Phase 5% - 2.7360
Total 456 54.720

187
Executive Summary of the Project
Identified selected micro watershed project Udarmi is coded as 2B3E3c3d has
been proposed from cluster of I.W.M.P. Bulandshahar – II project in Pahasu Block district
Bulandshahar four villages namely Madanpur, Samaspur, Chodera and Kutubpur is comprised in
the micro watershed which is located in the east of district Bulandshahar on the west bank of
River Upper Kali Nadi and border of district area is known as Khadar. It lies between 280 -5’ and
280 -15’ N Latitudes and 78
0 -0 and 78
0 -10 W Longitudes Covering area. Its altitudes ranges
from 181 meter to 190 meter above the mean sea level. Khurja Railway Station 184.11 m,
Bulandshahar Railway station is 201.18 m above mean sea level is displayed. Project area of
I.W.M.P. BSR-II is lied in the Pahasu Block of Bulandshahar District which is come in the
western plan zone under semi arid area. The annual average rainfall is near to 397 mm which an
average of 35 rainy days. Out of which about 85% is received during the mansoon season from
July to September and very less rainfall is received in the winter season.
Temperature ranges from as high as 430C in the May-June to as 3
0-4
0C during December –
January. The Trend of rain fall is highly erotic and maximum water goes as runoff.
Main occupation of the dwellers is agriculture in the watershed. Some part of the lands are
shown during the Kharif season. Cane sugar are preferred crops in the project area. The main
Crops raised are Wheat, Pea & Mustered & Maize
The topmost portion of the watershed is sloppy flat land. Other than topmost portion of the
watershed is under soil erotic portion and depreciative. The soil of the land are sandy loam Soil.
The middle agricultural position of watershed relatively smooth sloppy flat land with sandy loam
soil texture. These soil is yellow in colour and are inherently good in fertility status.
Natural vegetation of the watershed is very poor. Somewhere forest vegetation is
seen which are predominant with Vilayati Babool (Prosopis Juliflora), followed by Babool
(Accasia nilotica), somewhere Neem Plants (Azadirachta Indica), Shisham (Dolbergia Sisson) and
Karanj (Pongamia Glabra) are seen in occasional occurrence. There is no grass land in the
watershed. Somewhere grass patches are seen only on the bunds, road sides and other such places.
Coverage of massive green belt is in poor percentage for environment which is envisaged. That
watershed is very poor climate area.
There is normal condition of animal physics and for their fodder arrangement is the
watershed and creative possibility would be expected by the implementations of the project.
Due to Arial soil erosion poor harvesting managements, cropping pattern, non treated
watershed etc. are very anti effective causes for the watershed. Problem of the watershed is to be

188
tackled by harvesting structures which have last most of their capacity new water bodies for the
prevention of erosion and conservation of soil and moistures various type of earthen bunds in the
watershed field, necessity has been observed. Wasteland will be treated with staggered Trenches,
afforestation and bunding for the changing of characteristics.
The detail project report has been prepared by the applying of nine process steps
for the micro watershed code no. 2B3E3c3d brief is as follows.
STEP-1 Secondary data collection:-During the five days visit programme in the micro
watershed project with of all available documents of village label by approaching the
Gram panchayat collected secondary data.
STEP-2 Village meeting & conducting PRA exercise:-Community meeting conducted on fix
days for the consultation with villagers for the PRA Exercise. Participatory mode of
the villages was positive indicated for the success of programm. With good in testing
participation has been drawn social & resource map on ground & paper & discussed
un various topics of problematic thoughts in the micro watershed.
STEP-3 Socio economic survey:- The resource organization of village label volunteers
identified to conduct house hold socio economic survey/states.
STEP-4 Probel typology analysis:-Thoroughly analyzed the data & identified problem type as
soil & moisture conservation, crop rotation, crop coverage, productivity, livelihoods,
social issues & capacity building gaps etc. Probelms discussed with the watershed
committee & came up with alternative solution.
STEP-5 Conduct of net participatory planning (NPP):- The planning team visited together
in the planning blocks on the scheduled date along with the beneficiaries of the
villages & data gathered as for the participatory net planning.
STEP-6 Productivity & livelihood planning exercise:- For the product livelihood exercise,
group discussion on various livelihood as Agriculture, Animal husbandry enterprise
development held discussion with the villagers in the micro watershed.
STEP-7 Institutional & capacity building :- This plan is prepared based on the data
available in the field and auscultations with the watershed committee.
STEP-8 Data consolidation & documentation of DPR :- After gathering all required
information compiled collected data. Thoroughly discussed and finalized the expected
outcomes and benefits specially in the respect of livelihood for different segments.
These are the target and performers indicators for the micro watershed.
STEP-9 Conduct of Gram Sabha obtaining approvals submissions of DPR.:-After
preparation of the draft DPR convened to Gram sabha and activities proposed expected

189
outcomes benefits of implementing the programm are explained in case of any changes
are proposed in the Gram sabha approval obtained by the Gram sabha and already
singed of Mau paper.
STEP-9A Attachment of detail estimate, cost and design:-Estimating, Costing and design
prepared technically According to plan in the micro watershed project. And attached
with the DPR.
STEP-9B Various type of mapping :- DPR prepared in the support of micro watershed
project using various type of maps is as follows :
1.Index Map of Watershed 2. Watershed Map
3. Relief/ Drainage Map 4. Slop Map
5.Soil and Land Capability class map 6. Land use/ Land Cover Map
7. Cadastral map 8. Proposed Action Plan map
9. Social Map

190
Project Report
Table – 1 : Micro watershed project brief : -
1 State U.P.
2 District Bulandshahar
3 Block Pahasu
4 Comprised Villages (Nos.) 05
5 Name of Watershed Udarmi
6 Name of MWS Project Udarmi
7 MWS Code No. 2B3E3c3d
8 Geographical Area of MWS 507.000
9 Treatable Area 456
1- Project Objectives :- The aim and objectives of the Project are :
cc- Conservation, development and sustainable management of natural resources including
their users.
dd- Enhancement of agriculture production and productivity in a sustainable manner.
ee- Restoration of ecological balance in the degraded and fragile rain fed ecosystem.
ff- Reduction in regional disparity between rains fed and irrigated area.
gg- Creation of sustainable employment opportunities for the rural community for
livelihood security.
hh- Generation of massive employment.
ii- Reduce migration from rural employment.
2- Major Problem of Project Area :
y- Actual shortage of drinking water.
z- Near to nil activated water bodies and water harvesting structures.
aa- Low depth of ground water table.
bb- Undulated and generally sloppy rainfed area.
cc- Large number of Small, Marginal and S.C. farmer land holding.
dd- Lower wages of agriculture lobour and also migration of lobour due to shortage of
employment in the watershed.

191
3- General Description :
(3.1) Location :-
Udarmi Watershed has been taken with MWS Code No. 2B3E3c3d in
Pahasu Block of Distt. Bulandshahar is located on Khurja via Shikarpur Syana to
Pahasu road about 25 Km. between 28015’ and 28
010’ N Latitudes and 78
00’ and
7805’ N Longitudes. Location and delineation of watershed has been located on
watershed map Fig. 2 and on top sheet Fig. 3.
(3.2) Area and Elevation :
Elevation ranges from 181 to 208 mtr. above the mean sea level(MSL)
altogether comprised villages and their’s area is described as follows.
(Comprises village map Fig. 3)
Table – 2 : Area and Elevation
Sl.
No.
MWS
Code
Block Name of
Village
Geographical
Area
Treatable
Area
1 2 3 4 5 6
1 2B3E3c3d Pahasu Dighi 112 100.75
Pahasu 160 143.90
Udarmi 126 113.32
Surjawali 67 60.26
Pitampur 42 37.77
507.00 456.00
(3.3) Shape of the Micro Watershed:
The shape of watershed is Elongated and as Rectangular. The maximum
length and width of the watershed are 5000 Mtr. and 1814 Mtr. respectively with
the Length: Width ratio of 2.76:1.
Fig. 1 (Shape of Micro Watershed)

192

193

194
(3.4) Climate :
The Watershed falls under ………………. semi arid region of tropical climate
inclined in Western Plan Zone. The average annual precipitation is about approx. is 397
mm. spreading over 35 rainy days. Most of the rain fall (about 85%) is received during
July to September. The rain fall of moderate intensity. Nothing the area receives of
scarcity rainfall in the winter season. The temperator variation ranges from as high as 430c
in the month of May-June to as low as 40c in December-January.
(3.5) Geomorphology and Soils :
Geomorphology :
The entire watershed is topographically divided into major landforms. Accordingly
the soils of watershed can be grouped into various categories such plane land, undulated
land, sloppy land and erosic ravenous land.
Sl.
No.
Name of
Project
Name of
Village
Geograph
ical Area
(in ha.)
Raifed
Area
(in ha.)
Treatable
Area
Agri.
Land
1 2 3 4 5 6 7
1
Ud
arm
i
Dighi 112.00 81.50 100.75 124.40
2 Pahasu 160.00 127.90 143.90 177.67
3 Udarmi 126.00 100.73 113.32 139.90
4 Surjawali 67.00 53.56 60.26 74.40
5 Pitampur 42.00 35.57 37.77 46.63
Total 507.00 399.26 456.00 563.00

195
Soil :
(a) Fine textured soil :
The soil are the most extensive soil group found in the watershed. Some portion of
the watershed is relatively sloppy flat land with fine soil texture as sandy loam. The soils
are in color and are inherently good high in fertility status. Soil texture is sandy lome loam
particularly in depressions and loam in the elevated portion. The soil characteristic texture
is dispersive and smooth. Therefore without imped the downward movement of water
productive layer of soil are easily by high runoff.
a- Coarse Textured Soil :
These soil are lying mostly in downward portion, along with erosic gully and
drainage line upto end of watershed outlet. These soils are coarser in texture and are
relatively poor in fertility status. The soils are lomy sand in texture. Rill and gully
formation in same parts particularly near the outlet of watershed can be seen.
(3.6) Drainage and Slope:
Due to prevalence of mild steep slope and presence of a number of drainage lines
in the watershed the drainage system is adequate. The watershed from part of Ganga Basin
and watershed. Under mild to steep topographical slope of MWS as divided as follow :
(Drainage and slope map fig.-4)
Table - 4 : Drainage and Slope
S. No. Grade Slope Percent Area in Ha. Remark
1 A 0.5-1 136 -
2 B 1-2 114 -
3 C 2-3 91 -
4 D 3-4 68 -
5 E 4-5 31 -
6 F 5-6 16 -

196
Fig-4 (Drainage & Scrub Map)
(3.7) Vegetation :
a- Natural Vegetation :
Natural vegetation is very poor in the watershed. The forest vegetation is
predominant with Vilayti Babool (Prosopis Juliflora). There are occasional occurrence of
Neem Plants (Azadirochta Indica), Shisham (Dalbergia Sissoo) and Karanj (Pangamia
Glabra) and anywhere some scrubs are seen. There are no grass land in the watershed.
Somewhere grass patches are seen only on the bunds, roadside and other such places. Poor
percentage of massive green trees has been not seen in the watershed except Horticulture
backyard.
b- Horticulture :
There is no backyards or commercial horticulture plantation in villages are been in
some part of watershed.
c- Agro forestry :
The agriculture fields of the villages have some horticulture plantation at places
isolated trees whose frequency is seen as under agroforestry and some where in where in
backyards.

197
(3.8) Human Population:
a- Human Population:
Total Population of involved villages in watershed is 8936 with average family
size of six persons as delaled as follows
Table – 5 : Human Population
S.
No.
Name of village Nos. of
families
Human Population Total
Male Female Children
1 Dighi 577 1218 1125 1261 3604
2 Pahasu 352 762 704 977 2443
3 Udarmi 136 312 289 200 801
4 Surjawali 461 1778 1643 1140 4561
5 Pitampur 57 124 116 159 399
1583 4194 3877 3737 11808
f- Categorization of Human Population :
In the total population of watershed villages, categories are defined as below :
Table – 6 : Population Categories
S.
No.
Particulars Unit
Number of families in population
in the villages
Population Family Remark
1 2 3 4 5 6
1 Agri Farmer No. 9446 1266
2 Landless No. 259 37
3 Agri. Labour No. 1614 237
4 Land less Labour No. 273 39
5 BPL Family No. 605 121
6 SC Family No. 4345 620
7 ST Family No. - -

198
(3.9) Land Holding :
All the categories of farmers as small, marginal, medium and large are involved in
land holding average of about 1-18 ha. Small land holding farmers are further scattered at
different places which makes cultivation very difficult. Distribution of term families
according to the size of the land holdings are given as below :
Table – 7 : Distribution of farm families according to their size of land holdings
S.
No.
Name of Village Total
Agri.
Land in
MWS
Land Holding Family (Nos.) Percentage
Marginal
(< - 1Ha.)
Small
(1–2
Ha.)
Medium
(2-4 Ha.)
Large
(4-7
Ha.)
Total
1 Dighi 124.40 230 57 43 10 340
2 Pahasu 177.67 328 81 62 14 485
3 Udarmi 139.90 259 64 49 10 382
4 Surjawali 74.40 137 34 26 6 203
5. Pitampur 46.63 85 21 16 6 128
Total 563.00 1039 257 196 46 1538
(3.10) Live Stock Population :
Total live stock population of the watershed is Nos. Buffalos is preferred as mulch
animal compared to Cow. But milk yield is poor. Goats are also kept for milk as well as
for meat purpose. The breakup of livestock population is as follows :

199
Table – 8 : Live Stock Position
S.
No.
Name of
Village
Unit Live Stock Position Total
Buffaloes Cows Bullocks Goats
1 Dighi No. 871 197 176 237 1481
2 Pahasu No. 993 229 107 219 1548
3 Udarmi No. 627 191 137 129 1084
4 Surjawali No. 723 181 108 141 1153
5. Pitampur 419 113 91 79 702
Total 3633 911 619 805 5968
(3.11) Infrastructure Social Feature :
a- Comprised villages in the micro watershed has moderate communication
facilities. Watershed linked with metaled road and approachable through
motarable road.
n- All the villages are electrified and have T.V. and Telephone connection.
o- Literacy rate in the watershed is very low all villages are having education upto
Junior High School.
p- Nearest small market is at Pahasu 13 Km. Nearest big market Bulandshahar is
about 55 Km. from watershed. Religious and ritual features are almost common
as in other parts af U.P. small land holding with large family size and more
than 25% of the labour force of the total population living below poverty line
indicate poor socio economic status of the watershed community.

200
Participatory Rural Appraisal
Participatory mode of the villagers shows positive indication for the success of the
programme. Traditionally the entire village community participate in the individual works. Social
map of one of the watershed village drawn by villagers themselves, depicting various village
figures is shown in sketched map in Fig.-4 & 5. Infrastructures position of the village recorded as
follows :
Table – 9 : MW.S. Project – Udarmi
S.
No.
Infrastructure Unit Qty.
1 2 3 4
1 Primary School No. 1
2 Junior High School No. 1
3 Kanya Pathshala No. -
4 Public Health Center No. -
5 Vet nary Hospital No. -
6 Panchayat Ghar No. 1
7 Post Office No. -
8 Agan Bari Center No. 1
9 Electricity - Yes
10 Road - Yes
11 Pond No. 1
12 Hand Pump No. 11
13 Irrigation Well No. -
14 Canal No. 1
15 Temple No. 1
16 Well (Drinking Water) No. 1
17 Pumping Set No. 21
18 Toilet No. 9
19 Market No. No

201
SOCIAL MAP

202
Recorded importance of development institution
Farmers perception recorded for importance and role of different
development institution in relation to infrastructure. Importance has been depicted with
size of circle and role with distance from village circle. (Fig 8)
Fig. -8 (Venn diagram of Micro watershed)
(3.12) Communication :
Watershed can approached from Distt Headquarter Bulandshahar to Project area
35 km. by Road.
(3.13) Natural Resource Base :
Transact of watershed showed typical land use profile consisting of plain
agriculture land, erosic area and medium ravenous ridge. Main source of the irrigation are
the canal for pre showing irrigation only. The total geographical area of the watershed is
468.001 Ha. classification .
Approach roads for the micro watershed is shown for the communication is shown
on topo sheet map Fig 9 as next page.
UDARMI

203
Fig.- 7 Communication Map on Toposheet
Table – 10 : Classification of area(Hect.)
S.N
o.
Name of
Village
Unit Total
Geographical
Area
Rainfed
Area
Wasteland Village
Land
and
Road
Irrigation Resource
Water
Bodies
Borewell
1 2 3 4 5 6 7 8 9
1 Dighi Ha. 112 81.50 7.00 2.10 6.15 15.10
2 Pahasu Ha. 160 127.90 10.00 2.83 2.10 18.00
3 Udarmi Ha. 126 100.73 7.85 1.85 1.72 8.30
4 Surjawali Ha 67 53.56 4.18 2.10 0.73 5.45
5. Pitampur Ha 42 35.57 2.62 1.23 2.27 2.38
Total 507 399.26 31.65 10.11 12.97 49.23
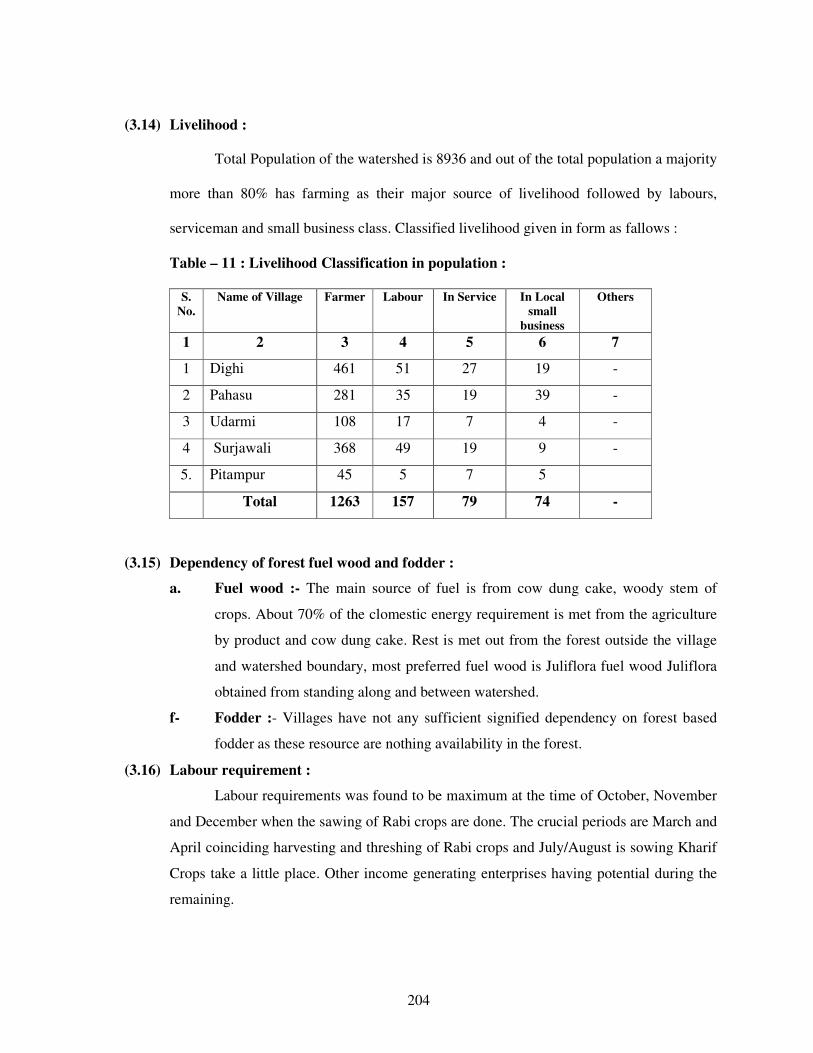
204
(3.14) Livelihood :
Total Population of the watershed is 8936 and out of the total population a majority
more than 80% has farming as their major source of livelihood followed by labours,
serviceman and small business class. Classified livelihood given in form as fallows :
Table – 11 : Livelihood Classification in population :
S.
No.
Name of Village Farmer Labour In Service In Local
small
business
Others
1 2 3 4 5 6 7
1 Dighi 461 51 27 19 -
2 Pahasu 281 35 19 39 -
3 Udarmi 108 17 7 4 -
4 Surjawali 368 49 19 9 -
5. Pitampur 45 5 7 5
Total 1263 157 79 74 -
(3.15) Dependency of forest fuel wood and fodder :
a. Fuel wood :- The main source of fuel is from cow dung cake, woody stem of
crops. About 70% of the clomestic energy requirement is met from the agriculture
by product and cow dung cake. Rest is met out from the forest outside the village
and watershed boundary, most preferred fuel wood is Juliflora fuel wood Juliflora
obtained from standing along and between watershed.
f- Fodder :- Villages have not any sufficient signified dependency on forest based
fodder as these resource are nothing availability in the forest.
(3.16) Labour requirement :
Labour requirements was found to be maximum at the time of October, November
and December when the sawing of Rabi crops are done. The crucial periods are March and
April coinciding harvesting and threshing of Rabi crops and July/August is sowing Kharif
Crops take a little place. Other income generating enterprises having potential during the
remaining.

205
(3.17) Crop Rotation :
Present Crop rotation in the watershed comprise of :
Kharif - Bajra - Rare
Maize - Rare
Jwar - Rare
Rabi - Fallow Wheat - Major
Fallow Barly - Major
Fallow Sugarcane - Major
Fallow Mustard - Major
Zayad - Urad, Moong, Makka
The above said Rabi Crops is the most prevailing crop rotation on the agriculture
lands both in the rainfed and irrigated conditions.
Organized vegetable cultivation fruit plantation and traditional agro forestry
systems are lacking as per requirement in the watershed the limited vegetable cultivation
in the watershed is confined as kitchen gardens and field to the irrigated condition in a
scattered manner. The cultivation of cash crops other than the sugarcane, wheat and
mustard also in the watershed.
(3.18) Historical Events :
Chronological record of important events of the watershed village is prepared
through participatory rural appraisal (PRA) which is very useful in understanding of its
background and chronology is given as follows :

206
Table – 12 : Historical Events
S.
No.
Events/Activities Year Rem.
1 2 3 4
1 Established 1411
2 Opening of Primary School 1962
3 Opening of Junior School 1992
4 Opening of Kanya Pathshala 1970
5 Opening of PHC -
6 Opening of Vet. Hospital -
7 Panchayat Ghar 1988
8 Introduction of Tractor 1974-75
9 Gobar Gas Plant 1977
10 Thresher 1975-76
11 First Tube well/Pumpset 1962
12 First Motorcycle 1984
13 T.V. & D.V.D. Players 1984
14 Electricity in Village 1964-65
15 Bituminous Road 1955
16 First Hand Pump 1980
17 Templo Renovation 1956
18 First Land Line Telephone 1990
19 Planning for Watershed Project 2011-12
(3.19) Present Land Use in the Watershed :-
The watershed has diversified land uses. The varied present land use under
different use in the watershed. The mixed land use followed in the watershed is almost
similar in other parts of U.P. During P.R.A. Exercise prepared land has been shown in
Table No. 13, 14 & 15.
Table – 13 : (Ownership)
S.
No.
Name of Village Pvt. Agri. Land Govt.
Revenu
Land
Forest
Land
Other
Land S.C./S.T. Others
1 2 3 4 5 6 7
1 Dighi 25.75 77.25 2.775 - -
2 Pahasu 75.5 77.50 2.181 - -
3 Udarmi 107 12.50 2.235 - -
4 Surjawali 44.50 20.00 1.810 - -
5. Pitampur 16.80 21.00 0.724

207
Table –14 : (Present Land under different categories)
S.
No.
Name of Village Land Use (Ha.)
Agricultural Wasteland
(All Types)
Seasonal
waterbodies
Village/Raod
Etc.
Total
1 2 3 4 5 6 7
1 Dighi 100.800 84.29 2.775
2 Pahasu 144.00 13.819 2.181
3 Udarmi 113.40 10.361 2.239
4 Surjawali 60.30 4.89 1.810
5. Pitampur 37.80 3.426 0.724
Total
Table – 15 : (Present land use classified)
Proposed Post Land Use has been given on Page No. 32
4- Focus on Present Land Use :
(4.1) Agriculture :
The total area under agriculture in the watershed is about 415.02 ha. out of which
906.61 ha. is under rainfed agriculture. Agriculture land uses in the watershed extended to
diversified land capabilities starting marginal to good class II land. The irrigated and
drinking water is most scarce natural resource in the watershed. The operation of tube well
for irrigation of agricultural crops frequently leads to the drinking water. Problem to the
farmers of watershed forcing them to carry drinking water from outside of the watershed
S.
No.
Land Use Under Unit
(ha.)
Area
(Ha.)
Percentage
1 2 3 4 5
1 Under Agriculture
A- Rainfed-
I- Crops 377.425 70%
II- Agro forestry 14.075 7%
B- Irrigated- -
I- Assured
II- Portial 115.025 12%
2 Wasteland
A- Aforestation
B- Pasture
C- Untreatable
D- Treatable 506.575 100%

208
area. The agricultural field bund are common in the watersheds however they frequently
breach on heavy rains.
Various mixed texture of soils are located in patches through out the watershed.
The heavy soils are almost kept fallow during rainy season. the agricultural soils also have
some as share calcium pan at variable depths. The irrigation water is conveyed by the
earthen channels. Surface irrigation methods following mainly border method of flood
method by the formers in the watershed. These factors reduce the water use efficiency of
limited and valuable irrigation water.
Drought hardy species like Juliflora suitable multi purpose trees is suitable for
rehabilitation of the wasteland. Rehabilitation of waste lands promoting agro forestry with
appropriate fruit and forest species suitable vegetative barriers on sloppy lands can be high
future value and by these adoption would be meet out many demands of fire wood and
fodder in the wasteland. Except above but also for soil and water conservation,
rehabilitation of wasteland and sustainable income generation for socio-economic
upliftment of farmers.
Crop Productivity :
The farmers also do not have suitable cropping system to deal aberrant weather.
Weeds impose considerable constraint in productivity of both Karif and Rabi crops under
irrigated as well as rainfed production system farmer undertake normally one manual
weeding in mustard and other valuable crops however, practices is energy and time
consuming. Use of we decide is rare in the watershed.
In the watershed area, limited cropping in the Kharif with mixed cropping practices
is not only irrigational but also unscientific and best for low productivity. Subsequent Rabi
crops in general. Sugarcane & Mustard crop in particular are raised on residual soil
moisture under rainfed production system during post mansoon season.
(4.2) Indigenous Technological Knowledge (ITK) :
Under process of PRA tracked out rural applying technology in various field of
local technology and some technology is very popular in village. In which the agriculture
is an old traditional practices of farmers who have improved themselves with passage of
the time according to their domestic needs and technological reforms in the nearby areas.
The villages have their traditional village ponds, practice of field bunding which typically
constitute agricultural related ITKs in the watershed. The Mustard & sugarcane being a

209
cash and firewood crop of the watershed and also sugarcane crop is being. Cultivated in
self designed manner by the farmers. Its carried out that the area is totally depend on rain
and under the rainfed area technology is applied by the farmers. However limited fertilizer
application specifically the DAP came in the practices since about 15-20 years.
(4.3) Forest and Other Vegetation :
Forest :
The watershed have a tract of wasteland area which are under uncultivable position
is liesed in the watershed. These wasteland have not any tree vegetation or very less than
real requirement for the wasteland use.
Horticulture/Agro forestry :
Horticulture and agro forestry practices were observed in the watershed.
(4.4) Agro forestry :
Agro forestry practices are lacking in the watershed. Though it has good potential
under existing disposition and may a role particularly with respect to minimization of
cropping risk, built up soil fertility and productivity, protection of soil erosion, soil
conservation partly meeting out the fire wood demand of rural community and more over
optimizing the economical return from system as whole under typical semi arid climate in
the watershed. Bund and boundary plantation also have good potential to care the fire
wood and fodder demands of the rural community in the watershed. The existing area
under agro forestry is almost negligible. Prosopis Jhliflora may be planted as block or sole
plantation specifically on marginal and degraded land in the watershed.
The agro forestry interventions comprising of ber, bail, aonla, guava, papular etc.
may be applied for benefit of the farmers under rainfed to irrigation production system on
leveled to slopping and marginal agricultural using proper planting techniques and term it
control measures.
The multipurpose trees may be also help in supplementing fire wood and fodder
demands of the rural community in the watershed and my be planted as hedge rows on
rainfed, marginal and degraded lands.
(4.5) Horticulture :
Fruits and vegetables practices are lacking in the watershed area. Its practices may
be sustainable very good potential for the formers of watershed. There are a limited lack
fruit trees in number like mango, guava, lime, ber, aonla and papaya fruit trees well as
vegetables like radish, okra, tomato, cabbage, garlic, onion, chilly, bringer and cucurbits

210
but they are found surviving well in the watershed villages. Organized orchards (vatika)
commercial vegetable cultivation horti-agri and other systems of agro forestry etc. are
lacking but have good agriculture.
5. Soil and land capability classification :
(5.1) Soil Morphology :
Watershed is located North East corner of Bulandshahr Distt. near about 55 Km.
away. The entire terrain of watershed is topographically divided into various land forms.
Accordingly the soils of watershed have been grouped major categories is given as follow
:
Hill Terrain Plane
Land
Sloppy
Undulated
Land
Rill Erosic
Land
Moderate
ravenous
- 25% 20% 15% 7%
Given categories in the blocks is located the soil morphology in the watershed
areas. Representation of soil characteristics by soil profile is represented as follows :
Soil Profile
Fig. – 9 (Soil Profile)

211
Table – 16 : (Morphology of a Typical Soil Profile) :
Horizone Depth in
Cm.
Morphology
1 2 3
A
V & H
0-150 Silky when moist, Hard when dry quick
soluble, high elasticity, fissures, and cracks,
occasional occurrence of free calcium
carbonate granules black in colour, clay
content 29%, PH- 8 to 8.7
B
V & H
150-160 Whitish yellow in colour, very fine mixed
with free cacaos and gravels, Hard when dry
compact and indurate hard pan restricting
development of root and down ward water
transmission.
C
V & H
7600 Red and white sand stone
(5.2) Soil and Characteristic and Fertility Status :
Soil characteristic pertaining to soil fertility of various classes accruing around
villages in the watershed are given as follows :
Table – 17 : Soil Characteristic & Fertility Status :
Sl.
No.
Soil Properties LCC-II LCC-III
& IV
1 2 3 4
1 Sand % 45.04 72.04
2 Silt % 22.55 17.80
3 Clay % 28.35 6.4.6
4 Texture Sandy Clay Lomy Sand
5 PH (1:2) 7.05 7.55
6 Organic Carbon % 0.35 0.13
7 Available N Kg ha-1
312 171
8 Available P Kg ha-1
28 13
9 Available K Kg ha-1
185 322
10 EC (dS m-1
) 0.45 0.12

212
(5.3) Land Capability Classification (LCC) :
Land capability classification (LCC) was done to classification the soils in
different groups based upon the limitations and to emphasize the hazards prevailing in the
watershed in order to find out the different topo-sequences, landforms, soil depth and
erosion hazards. This was followed by the detailed investigation of selected landforms to
bring out the LCC classes of the Watershed. Classes of land capability namely II, III, IV
and V are demarcated in the watershed. The areas under different classes are sown as
follows :
Table – 18 : Land Capability Classification (LCC) :
S. No. Land capability
class
Area in Ha. Colour
1 2 3 4
1 I Class - -
2 II Class 108.560 -
3 III Class 325.004 -
4 IV Class 150.500 -
5 V Class 34.500 -
6 VI Class - -
7 VII Class - -
8 VIII Class - -
Land capability classification of various agricultural practices under land use can
be classified as groups, class, sub class and units. Utilization of various land class is given
as follows :
Table – 19 : Utilization of various land uses

213
(5.4) Land Capability Class II & III :
This group is one of the most extensive LCC watershed. and also near to class III
for the agricultural practices. The soils are sandy & sandy loam in texture. The land under
this class is nearly level to mild sloping (1-3%). The soils are deep and erosion hazard is
slight. Most of the productive agriculture land comes under class II & III. These lands
potentially very productive but due to rainfed a single cropping pattern is in habitation.
(5.5) Land Capability Class IV :
This class is found in lower portion near the outlets of watershed. The soils are
coarser in texture, deep, erosion hazard and undulating in topography. Rill and initiation of
gully can be seen near the outlet of the watershed.
(5.6) Land Capability Class VII & VIII :
This class of land is not found in watershed. Somewhere lack of soil are found with
admixture gravels fragments in these classes of lands.
(5.7) Conclusions :
The majority of land form is coming under class II, which give an insight of good
agriculture production potential of the watershed.
The land capability classification provides reasonable good information with
regard to capability of soil, that could be used for agriculture, agrihorticulture, silviculture
and posture development.
The productivity of these lands could be further enhanced by adoption of simple
soil & water conservation measures like bunding practices.
The reasonable area is under watershed of wasteland and other wasteland including
grater potential of this watershed for forestry and pasture development. Rare places
namely water body of low portion of land area under seasonally works as water harvesting
structures and these harvested water is used or can use for some other benificial activities
during the crop season also.
6. Problems and needs of the watershed indentified during the PRA
(6.1) Problem Identification and prioritization :
u- The are has undulating topography, steep unstable slopes, gradient of excessive
branches of rills and hence highly prone to soil erosion.
v- Major issues addressed to food sufficiency economic growth and environmental
security in the watershed area.

214
w- Effective soil depth is limited and highly variable hampering good crop growth.
x- The watershed have low productive cropping due to tradition single cropping
pattern and over all average crop production percentage not sufficient against
requirement.
y- Identified that there is no assured irrigation system has been development capacity
of water bodies are reduced due to silt ration which are utilized to store of rainy
water and they are renovatable.
(6.6) Transact walk during the PRA :
Problems identified and prioritized during the transact walk and PRA exercises in
all comprised villages of watershed. There were pooled and a list of problems
representing the whole watershed was prepared. Problems were ranked as per their total
weight age in the watershed village.
Table – 20 : Ranking of Problem identification and prioritization of watershed
S.No. Problem Rank
1 2 3
1 Lack of irrigation 3
2 Lack of drinking water 7
3 Low production of field crops 4
4 Lack of fodder availability and low productivity 3
5 Lack of availability of fuel wood 4
6 Lack of market facility 4
7 Lack of quality seeds, fertilizer, pesticides etc. 3
8. Medical and Health care facilities for milching
animals and low productivity.
6
9 Lack of medical, educational and transportation
facilities
8
10 Lack of water bodies renovation 9
11 Lack of run of earthen check bunds 1
12 Lack of water harvesting structures 1
13 Lack of livelihoods opportunity 3
Prioritized ranking (Upto four Numbers) :-
13- Lack of earthen check bunds.
14- Lack of livelihood opportunities.
15- Lack of irrigation water was the greatest problem. Lack of irrigation water
problem experienced by the people followed by low crop production.
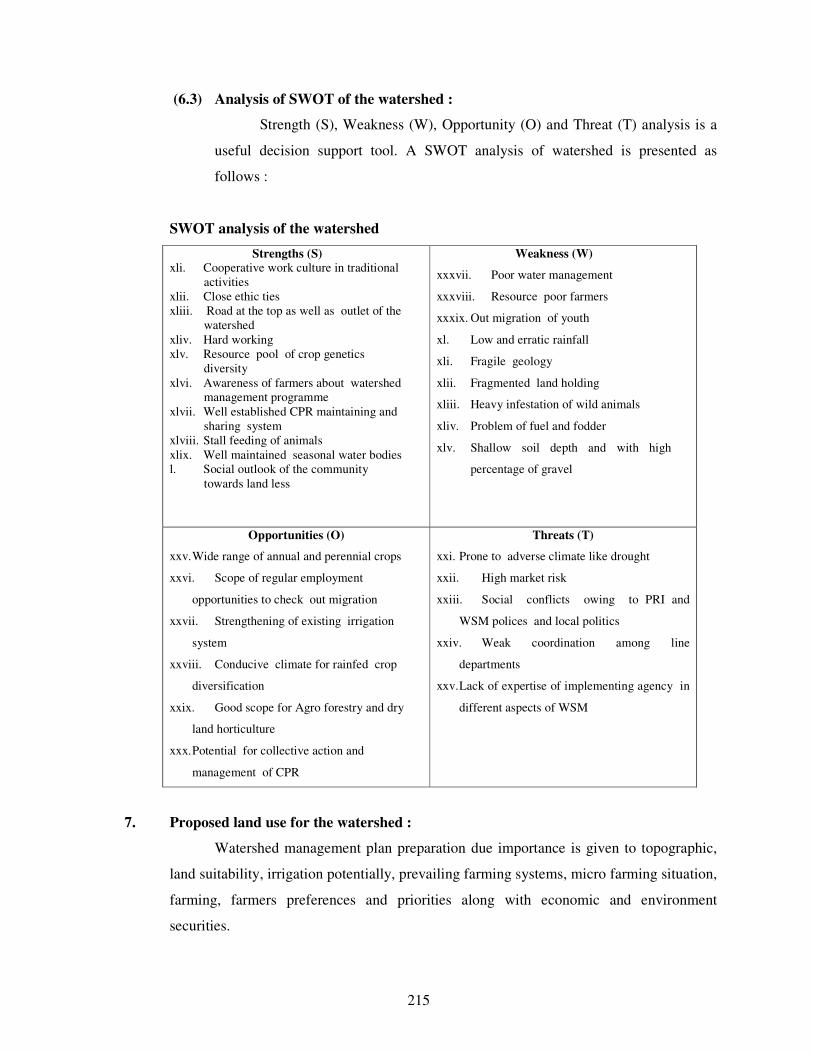
215
(6.3) Analysis of SWOT of the watershed :
Strength (S), Weakness (W), Opportunity (O) and Threat (T) analysis is a
useful decision support tool. A SWOT analysis of watershed is presented as
follows :
SWOT analysis of the watershed
Strengths (S)
xli. Cooperative work culture in traditional
activities
xlii. Close ethic ties
xliii. Road at the top as well as outlet of the
watershed
xliv. Hard working
xlv. Resource pool of crop genetics
diversity
xlvi. Awareness of farmers about watershed
management programme
xlvii. Well established CPR maintaining and
sharing system
xlviii. Stall feeding of animals
xlix. Well maintained seasonal water bodies
l. Social outlook of the community
towards land less
Weakness (W)
xxxvii. Poor water management
xxxviii. Resource poor farmers
xxxix. Out migration of youth
xl. Low and erratic rainfall
xli. Fragile geology
xlii. Fragmented land holding
xliii. Heavy infestation of wild animals
xliv. Problem of fuel and fodder
xlv. Shallow soil depth and with high
percentage of gravel
Opportunities (O)
xxv. Wide range of annual and perennial crops
xxvi. Scope of regular employment
opportunities to check out migration
xxvii. Strengthening of existing irrigation
system
xxviii. Conducive climate for rainfed crop
diversification
xxix. Good scope for Agro forestry and dry
land horticulture
xxx. Potential for collective action and
management of CPR
Threats (T)
xxi. Prone to adverse climate like drought
xxii. High market risk
xxiii. Social conflicts owing to PRI and
WSM polices and local politics
xxiv. Weak coordination among line
departments
xxv. Lack of expertise of implementing agency in
different aspects of WSM
7. Proposed land use for the watershed :
Watershed management plan preparation due importance is given to topographic,
land suitability, irrigation potentially, prevailing farming systems, micro farming situation,
farming, farmers preferences and priorities along with economic and environment
securities.

216
Crop and tree selection and area distribution was done as per farmers priorities
revealed through PRA exercise.
The watershed management plan for watershed is prepared with specific objectives
of food sufficiency, income and employment generation with environment security.
Technical options were with the ITK based on the latest available experiment
findings. Due attention was given to the resource of the farmers and adjustments were
made in capital intensive resource demanding technological outputs while making them
adoptable to the resource poor farmers. Emphasis was given on maximum use of farm
yard manure. The proposed land use plan of the watershed is shown as follow as in table
Table – 21 : Present and proposed land use plan of the watershed
S.No. Land use Present
(ha)
Proposed area
(ha)
1 2 3 4
1 Agriculture
a Rainfed
I Crops 465.00
II Agro-forestry 25.00
b Irrigated
I Assured
II Partial 115.25
2 Waste land
a Aforestation
b Pasture
c Untreatable
d Treatable
3 Village land 158.44
(7.1) Status of Present Water Resources Utilization :
Watershed is having some canal system. Management and maintenance of these
canal are required. Before sowing of Rabi crops, water from these canal is issued as
supplementary irrigation for Rabi sowing ar allowed to go as waste. After releasing water
from canal, submergence area also put under cultivation.
Some where bore well irrigation applied by the farmers in the watershed.

217
(7.2) Proposed Plan for Irrigation Development :
a- Present system of irrigation and wastage of water during October–November
need to be made more efficient from water management point of view by
minimizing conveyance losses in the existing water courses.
b- Present irrigation canal capacity have to build up by the reform. Which are lack
capacity of water.
c- Construction of new water harvesting earthen structures, Pucca Check Dem, Series
Gully Plugging, etc. has been sloppy portion to increase irrigation potential and for
recharging of ground water, soil and moisture conservation maximum field
irrigation, best production and expected change of crop rotation.
d- The up gradation of the exciting system of irrigation will result in :
i- Minimization of conveyance losses.
ii- Increase in frequency of irrigation.
iii- Adoption of high yielding varieties of crops.
iv- Assured cultivation of cash crops.
v- Capacity buildup by the planning of new water harvesting structures.
(7.3) Ground Water Recharge :
For the purpose of ground water recharge, the area of the upper side of watershed
is recommended for Field Bunds, Contour Bunds, Peripheral Bunds and Submergence
Bunds and in the lower portion Contour Staggered Trenches, Gully Plugs, Earthen Check
Dem and Pacca Outlets. In the undulated sloppy portion of the watershed recommended
water harvesting structure for dual purpose as ground water storage and under ground
water recharge.
(7.4) Crop Production :
Practices proposed in the watershed is given as follows :-
a- Mulching and crop residue management.
b- Application of green manuring.
c- Vermi Composting.
d- Crop rotation and inter cropping.
e- Biofertilizers.

218
(7.5) Tillage Operation :
Deep tillage technology is proposed to apply to be demonstrated for benefit of
farmers in the watershed.
(7.6) Improved Seeds of High Yielding Verities (H.Y.V.) :
Recommendation of improved varieties is necessary for improving the productivity
and farm income. Through replacement of low yielding traditional verities of seeds in
villages of watershed.
(7.7) Balanced Fertilizer Use :-
Demonstration of use of fertilizer in various crops of watershed recommended
balance fertilizer use in different crops will be benefited of forming community.
(7.8) Control of insects and diseases :
Aphid in the mustard are the major insects in the watershed areas leading to loss in
crop productivity. Similarly white blister is also a common disease in the mustard crop.
The management strategies of these insect pest and diseased will also be
demonstrated in the watershed for benefit of the growers.
(7.9) Dry Land Horticulture :
Such portion of dry land in which proposed horticulture development planning
recommended species like Ber, Bel and Aonla will be planted at suitable spacing in the
watershed.
(7.10) Agri Horticulture :
Aonla and Sahjan would be suitable horticultural crops to the locality. Therefore, a
part of land in the farmer field shall be selected and brought under Agri-horticulture
system. The cropping system followed will be Jwar and Wheat.

219
(7.11) Plantation (Fuel wood) :
Such a portion which are under wasteland will be taken falling in the class-IV
category in the watershed. These lands will be planted with species like Vilayati Babool
(Prosopis Juliflora), Babool (Acacia Nilotica), Karanj (Pangamia Glabra).
9. Socio Economic Analysis of the of the Project :
(9.1) Sustainability and environment security :
The proposed land use plan will improve the land utilization index and crop
diversification index significantly as compared to the existing one. in the proposed
watershed management plan proper blending of the bio engineering measures will be
applied on above 80% of the total area of watershed. It is estimated that more than above
70% of the watershed area will be treated and consequently the soil loss and runoff from
the area is excepted to be reduced by 70% respectively.
It will help in maintaining ecosystem integrity on sustained basis along with
improving the livelihood security of the farming community.
(9.2) Economic Analysis :
Economic analysis of the project was carried by taking direct benefits and costs
considering 10 years for project life at 10% discount rate. Whole watershed development
plan was divided into three sector as agriculture, horticulture and forest/Fuel wood
plantation. Net Present Value (NPV) and Benefit Cost ratio criteria were applied judge the
economic efficiency of each enterprises and sector. Net present value (NPV) of the project
life is considered to be 10 years and discount rate for NPV estimation is 10% is given
NPV and benefits as follows :-

220
Table – 22 : Present productivity income analysis :
S.
No.
Name of
Sector
Name of
Crops
Produ
cti-
on/ha.
Rate/
Qtl.
Cost of
Production
Expend. of
cultivation
Net
income
B.C. Ratio
between
Col. 8 & 7
1 2 3 4 5 6 7 8 9
A Agriculture Urad 3.00 4300.00 12900.00 6450.00 6450.00 1:1
Moong 3.00 4500.00 13500.00 6075.00 7425.00 1.22:1
Jwar 4.80 600.00 2880.00 1584.00 1296.00 0.82:1
Wheat 18.50 850.00 15275.00 8650.00 7075.00 0.82:1
Pea 7.50 2250.00 16875.00 10970.00 5905.00 0.54:1
Mustard 3.50 18.500 6475.00 3235.00 3240.00 1:1
Total - 105105.00 54105.00 51000.00 0.94:1
Average - 13138.00 6763.00 6375.00 094:1
B Forestry Vilayati
Babool
15000.00 - Nil
C Horticulture Ber 20000.00 - Nil
Aonla 20000.00 - Nil
Bel 20000.00 - Nil
Total - 60000.00 - Nil
Average - 20000.00 - Nil
Grand Total

221
Table –23 : Post productivity and income analysis for Post Productivity
Value and B.C.:
S.
No.
Name of
Sector
Name of
Crops
Produ
cti-
on/ha.
Rate/
Qtl.
Cost of Production
Expend. of
cultivation
Net
income
B.C. Ratio
between
Col. 8 & 7
1 2 3 4 5 6 7 8 9
A Agriculture Urad 4.00 5000.00 20000.00 8325.00 11615.00 1.39:1
Moong 4.00 5000.00 20000.00 8200.00 11800.00 1.44:1
Jwar 5.50 800.00 4400.00 1900.00 2500.00 1.32:1
Wheat 25.00 1000.00 25000.00 16680.00 13320.00 1.14:1
Pea 9.50 3500.00 33250.00 14810.00 18540.00 1.12:1
Mustard 5.00 3000.00 15000.00 4370.00 8130.00 1.86:1
Total - - - 172250.00 72845.00 99765.00 1.38:1
Average - - - 21531.00 9061.00 12471.00 1.38:1
B Forestry Vilayati
Babool
80.00 500.00 40000.00 15000.00 25000.00 1.67:1
C Horticulture Ber 35.00 2000.00 52500.00 20000.00 32500.00 1.63:1
Aonla 35.00 2000.00 70000.00 20000.00 50000.00 2.50:1
Bel 40.00 1500.00 80000.00 20000.00 40000.00 2:1
Total - - - 182500.00 60000.00 122500.00 2.04:1
Average - - - 60833.00 20000.00 40833.00 2.04:1
Grand Total - - - 1394750.00 147485.00 247265.00 1.68:1
Table –24 : Summary of NPV, PPV and B.C. Ratio (Sector wise) :
S.
No.
Name of Sector NPV PPV B.C.
Ratio Expend. Net
Income
Expend. Net
Income
1 2 3 4 5 6 7
1 Rain fed
Agriculture
54105.00 51000.00 72485.00 99765.00 1.38:1
2 Forest/Fuel wood
Plantation
15000.00 - 15000.00 25000.00 1.67 : 1
3 Horticulture 60000.00 - 60000.00 122500.00 2.04:1
Total 129105.00 51000.00 147485.00 247265.00 1.68:1

222
(9.3) Economics of Agriculture Sector :
The development cost can be recovered by the adoption of plan in present rain fed
agriculture is being done on well maintained field, therefore does not require much
investment. In rain fed agriculture, investment of Rs. 44.50 lacs is proposed to made is
given as fallows :
Table – 25 : Economics of Agriculture Sector :
S.
No.
Name of
sector
Name of Activities
/ Plan
Treatble
Area
(Ha.)
NPV
(Lacs)
Post
Productivity
Value (Lacs)
Benifit /
Income
B.C.
Ratio
1 2 3 4 5 6 7 8
1. Rainfed Soil, moisture
and water cons
works
456.00 24669 612.74 340.43 1.38:1
(9.4) Economics of forest fuel wood plantation :
Economic analysis of fuel wood plantation in the watershed. Project life is
considered to be 20 years and discount rate for NPV estimation is 10 % is followed and as
is given follows :
Table –26 : Economics of forest fuel wood Plantation :
S.
No.
Name of
sector
Comman Name of
Plant
Area
(Ha.)
NPV
(Lacs)
Post
Productivity
Value (Lacs)
Benifit /
Income
B.C.
Ratio
1 2 3 4 5 6 7 8
1. Forest
Fuel
wood
sector
Vilayati Babool
(Prasopis
Juliflora)
25.00 2.50 6.675 4.675 1.67 : 1
(9.5) Economics of Horticulture Sector :
Economic analysis of Horticulture Plantation in agri-horti system and on wasteland
patches of watershed project, life is considered about 15-20 years and discount factor rate
for NPV estimation is 10% is follows :

223
Table – 27 : Economics of Horticulture system :
S.
No.
Name of
Sector
Common name of Plants Area
(Ha.)
NPV
(Lacs)
Post
Productiv
e Value
(Lacs)
Benefit
Lacs
B.C.
Ratio
1 2 3 4 5 6 7 8
1 Horticulture Ber (zyziphus
mouritana)
4.00 0.80 2.104 1.304 1.63: 1
Amla (Embelica
officianalis)
3.80 0.76 2.660 1.40 2.5 : 1
Bel (Aegle marmelos) 2.20 0.44 1.320 0.88 2 : 1
Total 10.00 2.00 6.084 4.084 2.04 : 1
(9.6) Food requirement and sufficiency :
Achieving self sufficiency in food production is one of the prime objectives of
watershed project. The status of food requirement and production before and after the
project is presented as is follows :
Table – 28 : Status of food requirement and availability of per annual :
S.
No.
Name of Foods Requirement
Q./Yr.
Present Status Expected Post Status
Availability
Q./Yr.
Deficit or
surplus
Q./Yr.
Availability
Q./Yr.
Deficit or
surplus
Q./Yr.
1 2 3 4 5 6 7
1 Cereals 110 Kg. 12989 11041 -1948 22083 9094
2 Pulses 36.50 4310 2370 -1940 7758 3448
3 Oil Seeds 29.20 3448 1379 -2069 5517 2069
4 Vegetable 71 kg 10745 2149 -8596 19341 8596
(9.7) Employment generation :
One of the major problem of the labour migration in watershed project. By the
implementation of the project activities employment opportunities will be generated.
However the changes in land use pattern and adoption of other subsidiary enterprise will
generate employment opportunities in the watershed as given in table follows :

224
Table – 29 : Employment generation under proposed works :
S.
No.
Employment
activities/works
Area
under
work
Cost Mandays generation (Nos.)
Unskilled Skill Total Person
1 2 3 4 5 6 7 8
2 Graded Contour Bund 51 1.53 1530 - 1530 51
3 Gully Plug, C.D. 84 6.300 4410 323 4733 158
4 Submergence Bund 72 2.880 2880 - 2880 96
1 Peripheral Bund 71 2.485 2485 - 2485 83
5 W.H.B. 88 7.920 4752 259 5021 167
6 Renovation of Bund 55 1.650 1650 - 1650 55
7 Reno. of W.H.B. - - - - - --
8 Community Pond - - - - - -
9 Afforestation 25 2.595 519 - 519 17
10 Horticulture 10 2.00 400 - 400 13
Total 456 27.36 18626 592 19218 640
10. Formation of watershed committee :
Under compliance of common guideline Para (6.3) is followed and by the help of
watershed development team, watershed committee is organized in the micro watershed
village Ghuraiya with 10 members as prescribed in common guide line. List for
organization of W.C. village details given as follows :
Table – 30 : Details of comprised village W.C. organization in M.W.S. :
S.
No.
Particulars Details Block Geogra-
phical
Area
1 2 3 4 5
1 Micro watershed code 2B3E3c3d Pahasu
2 Name of Gram Panchayat
in M.W.S.
Khandar 507.00

225
Table – 31 : List of organized W.C. for the Gram Panchyat Udarmi in watershed.
S.
No.
Name of selected
members
Age Representation
Members from
Post Qualification Village
1 2 3 4 5 6 7
1 Indrajeet Singh 52 Gram Sabha President Sakhar Udarmi 2 Hari Singh 41 Gram Sabha SHG Sakhar Udarmi
3 Mahavir 29 From – U.G Member Sakhar Udarmi
4 Karelal 34 From – U.G Member Sakhar Udarmi
5 Tej Singh 31 From – U.G Member Sakhar Udarmi
6 Hazari Lal 35 From – S.H.G. Member Sakhar Udarmi
7 Babulal 40 From – S.H.G. Secretary Sakhar Udarmi
8 Ajay Pal Singh 27 From – S.H.G. Member Sakhar Udarmi
9 Shanti Devi 35 From – S.C. Member Sakhar Udarmi
10 Kavita Devi 32 From – S.C. Member Sakhar Udarmi
11 Dinesh 44 From – PIA Work out B.Sc. Udarmi
(10.1) Formation of Self Help Groups in M.W.S.
By the help of watershed committee and watershed development team self help
group are formatted / organized. Families and persons are selected from poor, small and
marginal farmers families, landless poor families, agriculture labour families, women,
herdsman and shepherd and S.C. families in the formatted self help groups are given as
follow :
Table – 32 : Baba Sahab Self help group – Udarmi (Livelihood) .
S.
No.
Name of member
in formatted
SHG’s
Age From
represented
family
Name of
proposed
activities
Activation
Position
1 2 3 4 5 6
1 Hari Singh 45 L.R. Live Stock New
2 Gajendra 32 L.R. Live Stock New
3 Lalit Kumar 25 L.R. Live Stock New
4 Prem Singh 50 L.R. Live Stock New
5 Jagat Singh 28 L.R. Live Stock New
6 Ashish Kumar 55 L.R. Live Stock New
7 Ajaipal Singh 25 L.R. Live Stock New
8 Arun Kumar 21 L.R. Live Stock New
9 Banti 22 L.R. Live Stock New
10 Sultan 35 L.R. Live Stock New

226
Table – 33 : Kanshiram Self help group Udarmi.
S.
No.
Name of
member in
formated
SHG’s
Age From
represe-
nted
family
Name of
proposed
activities
Activation
Position
1 2 3 4 5 6
1 Pradeep 30 Livestock New
2 Ramji Lal 55 Livestock New
3 Mahendra 30 Livestock New
4 Harish Kumar 33 Livestock New
5 Inder Singh 40 Livestock New
6 Rajpal Singh 45 Livestock New
7 Yashpal Singh 45 Livestock New
8 Naresh 30 Livestock New
9 Vikram 24 Livestock New
10 Suresh 25 Livestock New

227
Formation of User’s Groups :
User’s groups are farmated by the help of watershed committee and watershed
development team in the micro watershed comprised villages. Formers which have land
village are involved in the User’s groups and they will be direct benefited as expected by
the implementation of watershed project easy and convenienced condition are made to
resource use between user’s groups and they will be responsible to operate and
maintenance for the created assets in the watershed. Nos. of farmated user’s groups details
are given as follows :
Table – 35 : Village wise user’s groups
S.
No.
Name of
village
No. of
groups
No. of
farmers
Total
Agri.
Land
Area
under
treat-
ment
Cost of
essets
1 2 3 4 5 6 7
1 Dighi 100.75 12.09
2 Pahasu 143.90 17.27
3 Udarmi 113.32 13.60
4 Surjawali - 60.26 7.23
5. Pitampur 32.77 4.53
10. Estimation and Costing of Proposed activities of the watershed Project Year 2010-11.
Proposed works / activities for the Project Period (Year 2010-11) under proposed
treatable area 629.00 Ha. Out of total Geographical area 677 Ha.

228
(10.1) Financial and Physical Outlets :
Table – 36 : Financial and Physical Outlets for the Year 2009-10 :
Sl.
No.
Components Unit
cost
per
ha.
Physical
ha. Financial (Lacs) Man-days
Generatio
n Labour
Component
Material
Component
Total
1 2 3 4 5 6 7 8
A Management Cost 10%
1 Administrative Cost – TA & DA
Hiring of Vehicles,
Official Expenditure
Electricity & Phone bill
Computer, Stationery and office
consumable materials & contingency
1200 - - 5.4472 5.4472 -
2 Monitoring 120 - - 0.5472 0.5472
3 Evaluation 120 - 0.5472 0.5472
Sub Total 1440 - 6.5664 6.5664
B Preparatory Phase 10% - -
1 Entry Point Activities 4% 480 - 0.4378 1.7510 2.1888 438
2 Institutional & Capacity Building 5% 600 - - 2.7360 2.7360
3 Detailed Project Report 1% 120 - - 0.5472 0.5472
Sub Total 1200 - 0.4378 5.0342 5.4720 438
C Watershed Work Phase
a Watershed Development Works
1 Graded, Contour & Field Bunds 3000 57 1.530 - 1.530 1530
2 Gully Plug, Earthen Checkdam /WHS 7500 84 4.410 1.890 6.300 4733
3 Submergence bunds 4000 72 2.880 - 2.880 2880
4 Peripheral Bund 3500 71 2.485 - 2.485 2485
5 Earthen Water Harvesting Bund 9000 88 4.752 3.168 7.920 5021
6 Renovation of existing Bunds 3000 55 1.650 - 1.650 1650
7 Renovation of existing W.H.B - - - - - -
8 Aforestation and Development of silvi
postural system 10380 25 0.519 2.076 2.595 519
9 Dry Land Horticulture 20000 10 0.400 1.600 2.00 400
10 Community Pound (Renovation) - - -
Sub Total 456 18.626 8.734 27.360 19218
B Livelihood Programme (Community Based) 7.620
Income generating activities through SHG’s for landless and marginal formers 10%
1 Live stock development activities 200 - - 0.912 0.912 -
2 Bee Keeping 100 - - 0.456 0.456 -
3 Poultry Farming 200 - - 0.912 0.912 -
4 Nursery Development 300 - - 1.368 1.368 -
5 Vegetable Production 100 - - 0.456 0.456 -
6 Milk Dairy Promotion Unit 200 - - 0.912 0.912 -
7 Establishment of Vermi compost Unit 100 - - 0.456 0.456 -
8 Sub Total 1200 - - 5.472 5.472 -
C Production System and micro Enterprises
1 Crop production, diversification of
agriculture and introduction of agro
forestry
1170 - - 5.3352 5.3352 -
2 Demonstration of improved
composting system 390 - - 1.7784 1.7784 -
Sub Total 1560 - - 7.1136 7.1136
D Consolidation Phase 5% Sub Total 600 - - 2.736 2.736 -
Grand Total 12000 456 19.0638 35.6562 54.720 19656

229
ladYi i=
xzke iapk;r & mnZeh dksM laŒ 2B3E3c3d fodkl [k.M &igklw ftyk & cqyUn’kgj ;g fd vkÃŒM CywŒ,eŒihŒ if j; kstuk esa rS; kj dh x ;h fuek Z .k dh u;h l ` ftr if jlEifRr;k sa dks
x z ke iap k; r mnZeh ,oa ekbØk s okVj’ k sM ds vUrx Zr lfEefyr x z kek sa esa ;k stuk fØ; kU o;u djkus ,oa
; kstuk m ijkUr p kyw j[kus rFk k l̀ftr if jlEifRr; k sa ds vuq j{k.k gsrq Ñr ladY i ,oa bP Nq d gSA
mnZeh x z ke iap k;r ds lHk h l z ksr L Fky tS ls rkykc] xz kelH kk x ksp j ¼p kjkx kg½ ] ty lal k/ku]
tx y v kfn esa Hk wfe f odk l if j; kstuk ds vUrx Z r fd; s tk; sx saA m u dk;k sZ dk s l ekt d s de tk sj ox Z tS ls
vuq l wfp r tkfr@tutkf r] efgyk ox Z ,oa vYi Hkwf eghu x jhch js[ kk ds uhp s ds yk Hk kfFk;k s a dk s ykH k
igq ¡p kus gsrq bPN q d gk sxsA
ge ; kstuk l ap kyu gsrq iz Lrkf or dj rs gS a ,oa lgef r ns rs gS fd Hkk jr l jdk j ds leLr
ekx Z n’ kh Z fl) kUrksa ds vuqi kyu es a dk;Z lEiUu djk;sx sa ;g Hk h ? k ksf"k r djrs gS fd p ; fur {ks= ftldk s
esjs }k jk HkyhHk k ¡f r ns[ kk x ; k gS] vk S j iz L rkf or ; kstu k esa iz L rkfor leLr dk; Z 15 l kyksa l s ugha djk; k
x ; k gS ftldh eq>s iw. kZ :i ls tkudkj h gS vkS j vuqeksnu djrs gSA

230
PROJECT AT A GLANCE
IWMP-II (Bulandshahar)
1 State Uttar Pradesh
2 Distt. Bulandshahar
3 Block Pahasu
4 M.W.S. Code 2B3E4d3c
5 Name of M.W.S. Project Surjawali
6 Involved Village 05
7 Geographical Area of M.W.S. 650.00
8 Rainfed Area
9 Treatable Area 585
10 Weightage
11 Cost of Project 70.20
12 For the year 2011-12
Budget Components
S. No. Components Area
(Ha.)
Cost
(in Lacs)
1 2 3 4
1 Management Cost 12% - 8.4240
2 Preparatory Phase 10% - 7.0200
3 Watershed Work Phase - -
A- Watershed Development Works 50% 585.00 35.1000
B- Livelihood Programme (Community Base) 10% - 7.0200
C- Production System & Micro Enterprises13% - 9.1260
4 Consolidation Phase 5% - 3.5100
Total 585.00 70.2000

231
Executive Summary of the Project
Identified selected micro watershed project Surjawali is coded as 2B3E4d3c has
been proposed from cluster of I.W.M.P. Bulandshahar – II project in Pahasu Block district
Bulandshahar four villages namely Surjawali, Sarangpur, Baraula, Kunwarpur, Peetampur, is
comprised in the micro watershed which is located in the east of district Bulandshahar on the east
bank of River GANGA and border of district Badaun area is known as Khadar. It lies between 280
-30’ and 280-45’ E Latitudes and 78
0 -0’ and 78
0 -15’ N Longitudes Covering area. Its altitudes
ranges from 181 meter to 208 meter above the mean sea level. Dewai Railway Station 184.11 m,
Bulandshahar Railway station is 201.18 m above mean sea level is displayed. Project area of
I.W.M.P. BSR-II is lied in the Pahasu Block of Bulandshahar District which is come in the
western plan zone under semi arid area. The annual average rainfall is near to 397 mm which an
average of 35 rainy days. Out of which about 85% is received during the mansoon season from
July to September and very less rainfall is received in the winter season.
Temperature ranges from as high as 420C in the May-June to as 3
0-4
0C during December –
January. The Trend of rain fall is highly eratic and maximum water goes as runoff.
Main occupation of the dwellers is agriculture in the watershed. Some part of the lands are
shown during the Kharif season. Cane sugar are preferred crops in the project area. The main
Crops raised are Wheat, Pea & Mustered and maze.
The topmost portion of the watershed is sloppy flat land. Other than topmost portion of the
watershed is under soil erotic portion and depreciative. The soil of the land are sandy loam Soil.
The middle agricultural position of watershed relatively smooth sloppy flat land with sandy loam
soil texture. These soil is yellow in colour and are inherently good in fertility status.
Natural vegetation of the watershed is very poor. Somewhere forest vegetation is seen
which are predominant with Vilayati Babool (Prosopis Juliflora), followed by Babool (Accasia
nilotica), somewhere Neem Plants (Azadirachta Indica), Shisham (Dolbergia Sisson) and Karanj
(Pongamia Glabra) are seen in occasional occurrence. There is no grass land in the watershed.
Somewhere grass patches are seen only on the bunds, road sides and other such places. Coverage
of massive green belt is in poor percentage for environment which is envisaged. That watershed is
very poor climate area.
There is normal condition of animal physics and for their fodder arrangement is the
watershed and creative possibility would be expected by the implementations of the project.
Due to Arial soil erosion poor harvesting managements, cropping pattern, non treated
watershed etc. are very anti effective causes for the watershed. Problem of the watershed is to be

232
tackled by harvesting structures which have last most of their capacity new water bodies for the
prevention of erosion and conservation of soil and moistures various type of earthen bunds in the
watershed field, necessity has been observed. Wasteland will be treated with staggered Trenches,
afforestation and bunding for the changing of characteristics.
The detail project report has been prepared by the applying of nine process steps
for the micro watershed code no. 2B3E4d3c brief is as follows.
STEP-1 Secondary data collection:-During the five days visit programme in the micro
watershed project with of all available documents of village label by approaching the
Gram panchayat collected secondary data.
STEP-2 Village meeting & conducting PRA exercise:-Community meeting conducted on fix
days for the consultation with villagers for the PRA Exercise. Participatory mode of
the villages was positive indicated for the success of programm. With good in testing
participation has been drawn social & resource map on ground & paper & discussed
un various topics of problematic thoughts in the micro watershed.
STEP-3 Socio economic survey:- The resource organization of village label volunteers
identified to conduct house hold socio economic survey/states.
STEP-4 Probel typology analysis:-Thoroughly analyzed the data & identified problem type as
soil & moisture conservation, crop rotation, crop coverage, productivity, livelihoods,
social issues & capacity building gaps etc. Problems discussed with the watershed
committee & came up with alternative solution.
STEP-5 Conduct of net participatory planning (NPP):- The planning team visited together
in the planning blocks on the scheduled date along with the beneficiaries of the
villages & data gathered as for the participatory net planning.
STEP-6 Productivity & livelihood planning exercise:- For the product livelihood exercise,
group discussion on various livelihood as Agriculture, Animal husbandry enterprise
development held discussion with the villagers in the micro watershed.
STEP-7 Institutional & capacity building :- This plan is prepared based on the data
available in the field and auscultations with the watershed committee.
STEP-8 Data consolidation & documentation of DPR :- After gathering all required
information compiled collected data. Thoroughly discussed and finalized the expected
outcomes and benefits specially in the respect of livelihood for different segments.
These are the target and performers indicators for the micro watershed.
STEP-9 Conduct of Gram Sabha obtaining approvals submissions of DPR.:-After
preparation of the draft DPR convened to Gram sabha and activities proposed expected

233
outcomes benefits of implementing the programm are explained in case of any changes
are proposed in the Gram sabha approval obtained by the Gram sabha and already
singed of Mau paper.
STEP-9A Attachment of detail estimate, cost and design:-Estimating, Costing and design
prepared technically According to plan in the micro watershed project. And attached
with the DPR.
STEP-9B Various type of mapping :- DPR prepared in the support of micro watershed
project using various type of maps is as follows :
1.Index Map of Watershed 2. Watershed Map
3. Relief/ Drainage Map 4. Slop Map
5.Soil and Land Capability class map 6. Land use/ Land Cover Map
7. Cadastral map 8. Proposed Action Plan map
9. Social Map

234
Project Report
Table – 1 : Micro watershed project brief : -
1 State U.P.
2 District Bulandshahar
3 Block Pahasu
4 Comprised Villages (Nos.) 06
5 Name of Watershed Surjawali
6 Name of MWS Project Surjawali
7 MWS Code No. 2B3E4d3c
8 Geographical Area of MWS 650.00
9 Treatable Area 585.00
1- Project Objectives :- The aim and objectives of the Project are :
jj- Conservation, development and sustainable management of natural resources including
their users.
kk- Enhancement of agriculture production and productivity in a sustainable manner.
ll- Restoration of ecological balance in the degraded and fragile rain fed ecosystem.
mm- Reduction in regional disparity between rains fed and irrigated area.
nn- Creation of sustainable employment opportunities for the rural community for
livelihood security.
oo- Generation of massive employment.
pp- Reduce migration from rural employment.
2- Major Problem of Project Area :
ee- Actual shortage of drinking water.
ff- Near to nil activated water bodies and water harvesting structures.
gg- Low depth of ground water table.
hh- Undulated and generally sloppy rainfed area.
ii- Large number of Small, Marginal and S.C. farmer land holding.
jj- Lower wages of agriculture lobour and also migration of lobour due to shortage of
employment in the watershed.

235
3- General Description :
(3.1) Location :-
Surjawali Watershed has been taken with MWS Code No. 2B3E4d3c in
Pahasu Block of Distt. Bulandshahar is located on Bulandshahar via Diwai to
Narau Via Pahasu road about 30 Km. between 28015’ and 28
0 15’ N Latitudes and
7800’ and 78
0 10’ w Longitudes. Location and delineation of watershed has been
located on watershed map Fig. 2 and on top sheet Fig. 3.
(3.2) Area and Elevation :
Elevation ranges from 181 to 208 mtr. above the mean sea level(MSL)
altogether comprised villages and their’s area is described as follows. (Comprises
village map Fig. 3)
Table – 2 : Area and Elevation
Sl.
No.
MWS
Code
Block Name of
Village
Geographical
Area
Treatable
Area
1 2 3 4 5 6
1 2B3E4d3c Pahasu Surjawali 220 198.00
Sarangpur 193 173.70
Turkipur 68 61.00
Bhaiyapur 54 48.300
Baraula 16 15.00
Lalner 99 89.00
650 585
(3.3) Shape of the Micro Watershed:
The shape of watershed is Elongated and as Rectangular. The maximum
length and width of the watershed are 5000 Mtr. and 1814 Mtr. respectively with
the Length: Width ratio of 2.76:1.
Fig. 1 (Shape of Micro Watershed)

236

237

238
(3.4) Climate :
The Watershed falls under ………………. semi arid region of tropical climate
inclined in Western Plan Zone. The average annual precipitation is about approx. is 397
mm. spreading over 35 rainy days. Most of the rain fall (about 85%) is received during
July to September. The rain fall of moderate intensity. Nothing the area receives of
scarcity rainfall in the winter season. The temperator variation ranges from as high as 430c
in the month of May-June to as low as 40c in December-January.
(3.5) Geomorphology and Soils :
Geomorphology :
The entire watershed is topographically divided into major landforms. Accordingly
the soils of watershed can be grouped into various categories such plane land, undulated
land, sloppy land and erosic ravenous land.
Sl.
No.
Name
of
Project
Name of Village Geograph
ical Area
(in ha.)
Raifed
Area
(in ha.)
Treatable
Area
Agri. Land
1 2 3 4 5 6 7
1 S
urj
awali
Surjawali 220 175.87 198 187.00
2 Sarangpur 193 154.29 173.70 164.05
3 Baraula 16 12.80 15.00 57.108
4 Turkipur 68 54.400 61.00 45.90
5 Bhaiyapur 54 43.20 48.30 13.60
Lalner 99 79.20 89.00 84.15
Total 650 519.26 585 551.808

239
Soil :
(a) Fine textured soil :
The soil are the most extensive soil group found in the watershed. Some portion of
the watershed is relatively sloppy flat land with fine soil texture as sandy sandy loam. The
soils are in color and are inherently good high in fertility status. Soil texture is sandy lome
loam particularly in depressions and loam in the elevated portion. The soil characteristic
texture is dispersive and smooth. Therefore without impede the downward movement of
water productive layer of soil are easily by high runoff.
a- Coarse Textured Soil :
These soil are lying mostly in downward portion, along with erosic gully and
drainage line upto end of watershed outlet. These soils are coarser in texture and are
relatively poor in fertility status. The soils are lomy sand in texture. Rill and gully
formation in same parts particularly near the outlet of watershed can be seen.
(3.6) Drainage and Slope:
Due to prevalence of mild steep slope and presence of a number of drainage lines
in the watershed the drainage system is adequate. The watershed from part of Ganga Basin
and watershed. Under mild to steep topographical slope of MWS as divided as follow :
(Drainage and slope map fig.-4)
Table - 4 : Drainage and Slope
S. No. Grade Slope Percent Area in Ha. Remark
1 A 0.5-1 175 -
2 B 1-2 146 -
3 C 2-3 117 -
4 D 3-4 87 -
5 E 4-5 41 -
6 F 5-6 19 -

240
Fig-4 (Drainage & Scrub Map)
(3.7) Vegetation :
a- Natural Vegetation :
Natural vegetation is very poor in the watershed. The forest vegetation is
predominant with Vilayti Babool (Prosopis Juliflora). There are occasional occurrence of
Neem Plants (Azadirochta Indica), Shisham (Dalbergia Sissoo) and Karanj (Pangamia
Glabra) and anywhere some scrubs are seen. There are no grass land in the watershed.
Somewhere grass patches are seen only on the bunds, roadside and other such places. Poor
percentage of massive green trees has been not seen in the watershed except Horticulture
backyard.
b- Horticulture :
There is no backyards or commercial horticulture plantation in villages are been in
some part of watershed.
c- Agroforestry :
The agriculture fields of the villages have some horticulture plantation at places
isolated trees whose frequency is seen as under agroforestry and some where in where in
backyards.

241
(3.8) Human Population:
a- Human Population:
Total Population of involved villages in watershed is 8936 with average family
size of six persons as delaled as follows
Table – 5 : Human Population
S.
No.
Name of village Nos. of
families
Human Population Total
Male Female Children
1 Surjawali 461 1778 1643 1140 4561
2 Sarangpur 431 1057 976 871 2904
3 Baraula 258 562 607 500 1669
4 Bhaiyapur 282 736 680 606 2022
5 Turkipur 57 124 116 159 399
6 Lalner 521 1120 1078 942 3140
Total 2010 5377 5100 4218 14695
g- Categorization of Human Population :
In the total population of watershed villages, categories are defined as below :
Table – 6 : Population Categories
S.
No.
Particulars Unit
Number of families in population
in the villages
Population Family Remark
1 2 3 4 5 6
1 Agri Farmer No. 11756 1728
2 Landless No. 402 51
3 Agri. Labour No. 1470 209
4 Land less Labour No. 440 64
5 BPL Family No. 833 119
6 SC Family No. 4039 577
7 ST Family No. - -
18940 2748

242
(3.9) Land Holding :
All the categories of farmers as small, marginal, medium and large are involved in
land holding average of about 1-18 ha. Small land holding farmers are further scattered at
different places which makes cultivation very difficult. Distribution of term families
according to the size of the land holdings are given as below :
Table – 7 : Distribution of farm families according to their size of land holdings
S.
No.
Name of Village Total
Agri.
Land in
MWS
Land Holding Family (Nos.) Percentage
Marginal
(< - 1Ha.)
Small
(1–2
Ha.)
Medium
(2-4 Ha.)
Large
(4-7
Ha.)
Total
1 Surjawali 179.40 150 7 5 3 165
2 Sarangpur 157.38 140 3 2 1 146
3 Baraula 15.00 11 1 1 - -
4 Bhaiyapur 51.00 3 - - - 3
5 Turkipur 64.00 - - - - -
6 Lalner 94.00 5 - - - 5
Total
(3.10) Live Stock Population :
Total live stock population of the watershed is 2911 Nos. Buffalos is preferred as
mulch animal compared to Cow. But milk yield is poor. Goats are also kept for milk as
well as for meat purpose. The breakup of livestock population is as follows :

243
Table – 8 : Live Stock Position
S.
No.
Name of
Village
Unit Live Stock Position Total
Buffaloes Cows Bullocks Goats
1 Surjawali 723 181 108 219 1231
2 Sarangpur 1089 368 181 207 1845
3 Baraula 831 217 107 119 1274
4 Bhaiyapur 764 226 181 201 1352
5 Turkipur 419 113 87 79 698
6 Lalner 631 171 97 169 1068
Total 4457 1276 741 994 7468
(3.11) Infrastructure Social Feature :
a- Comprised villages in the micro watershed has moderate communication
facilities. Watershed linked with metaled road and approachable through
motarable road.
q- All the villages are electrified and have T.V. and Telephone connection.
r- Literacy rate in the watershed is very low all villages are having education upto
Junior High School.
s- Nearest small market is at Sayana 13 Km. Nearest big market Bulandshahar is
about 55 Km. from watershed. Religious and ritual features are almost common
as in other parts af U.P. small land holding with large family size and more
than 25% of the labour force of the total population living below poverty line
indicate poor socio economic status of the watershed community.

244
Participatory Rural Appraisal
Participatory mode of the villagers shows positive indication for the success of the
programme. Traditionally the entire village community participate in the individual works. Social
map of one of the watershed village drawn by villagers themselves, depicting various village
figures is shown in sketched map in Fig.-4 & 5. Infrastructures position of the village recorded as
follows :
Table – 9 : MW.S. Project – Surjawali.
S.
No.
Infrastructure Unit Qty.
1 2 3 4
1 Primary School No. 1
2 Junior High School No. 1
3 Kanya Pathshala No. -
4 Public Health Center No. 1
5 Vet nary Hospital No. -
6 Panchayat Ghar No. 1
7 Post Office No. -
8 Agan Bari Center No. 1
9 Electricity - Yes
10 Road - Yes
11 Pond No. 1
12 Hand Pump No. 56
13 Irrigation Well No. -
14 Canal No. -
15 Temple No. 3
16 Well (Drinking Water) No. -
17 Pumping Set No. 80
18 Toilet No. 50
19 Market No. -

245
SOCIAL MAP

246
Recorded importance of development institution
Farmers perception recorded for importance and role of different
development institution in relation to infrastructure. Importance has been depicted with
size of circle and role with distance from village circle. (Fig 8)
Fig. -8 (Venn diagram of Micro watershed)
(3.12) Communication :
Watershed can approached from Distt Headquarter Bulandshahar to Project area
35 km. by Road.
(3.13) Natural Resource Base :
Transact of watershed showed typical land use profile consisting of plain
agriculture land, erosic area and medium ravenous ridge. Main source of the irrigation are
the canal for pre showing irrigation only. The total geographical area of the watershed is
574.00 Ha. classification.
Approach roads for the micro watershed is shown for the communication is shown
on topo sheet map Fig 9 as next page.
SURJAWALI

247
Fig.- 7 Communication Map on Toposheet
Table – 10 : Classification of area(Hect.)
S.N
o.
Name of
Village
Unit Total
Geographical
Area
Rainfed
Area
Wasteland Village
Land
and
Road
Irrigation Resource
Water
Bodies
Borewell
1 2 3 4 5 6 7 8 9
1 Surjawali Ha. 220 175.87 39.45 4.600
2 Sarangpur Ha. 193 154.29 33.350 5.320
3 Baraula Ha. 16 12.80 2.969 0.231
4 Turkipur Ha. 68 54.400 12.739 0.861
5 BHaiyapur Ha. 54 43.20 9.869 0.931
6 Lalner Ha. 99 79.20 18.6 1.200
Total

248
(3.14) Livelihood :
Total Population of the watershed is 8936 and out of the total population a majority
more than 80% has farming as their major source of livelihood followed by labours,
serviceman and small business class. Classified livelihood given in form as fallows :
Table – 11 : Livelihood Classification in population :
S.
No.
Name of Village Farmer Labour In Service In Local
small
business
Others
1 2 3 4 5 6 7
1. Surjawali 171 15 20 9
2. Sarangpur 151 17 19 7
3. Baraula 11 9 3 3
4. Turkipur 50 11 7 5
5 Bhaiyapur 40 7 9 4
6 Lalner 67 19 8 7
Total
(3.15) Dependency of forest fuel wood and fodder :
a. Fuel wood :- The main source of fuel is from cow dung cake, woody stem of
crops. About 70% of the climactic energy requirement is met from the agriculture
by product and cow dung cake. Rest is met out from the forest outside the village
and watershed boundary, most preferred fuel wood is Juliflora fuel wood Juliflora
obtained from standing along and between watershed.
g- Fodder :- Villages have not any sufficient signified dependency on forest based
fodder as these resource are nothing availability in the forest.

249
(3.16) Labour requirement :
Labour requirements was found to be maximum at the time of October, November
and December when the sawing of Rabi crops are done. The crucial periods are March and
April coinciding harvesting and threshing of Rabi crops and July/August is sowing Kharif
Crops take a little place. Other income generating enterprises having potential during the
remaining.
(3.17) Crop Rotation :
Present Crop rotation in the watershed comprise of :
Kharif - Bajra - Rare
Maize - Rare
Jwar - Rare
Rabi - Fallow Wheat - Major
Fallow Barly - Major
Fallow Sugarcane - Major
Fallow Mustard - Major
Zayad - Urad, Moong, Makka
The above said Rabi Crops is the most prevailing crop rotation on the agriculture
lands both in the rainfed and irrigated conditions.
Organized vegetable cultivation fruit plantation and traditional agro forestry
systems are lacking as per requirement in the watershed the limited vegetable cultivation
in the watershed is confined as kitchen gardens and field to the irrigated condition in a
scattered manner. The cultivation of cash crops other than the sugarcane, wheat and
mustard also in the watershed.
(3.18) Historical Events :
Chronological record of important events of the watershed village is prepared
through participatory rural appraisal (PRA) which is very useful in understanding of its
background and chronology is given as follows :

250
Table – 12 : Historical Events
S.
No.
Events/Activities Year Rem.
1 2 3 4
1 Established 1511
2 Opening of Primary School 1962
3 Opening of Junior School 2006-07
4 Opening of Kanya Pathshala -
5 Opening of PHC -
6 Opening of Vet. Hospital -
7 Panchayat Ghar 2008-09
8 Introduction of Tractor 1970
9 Gobar Gas Plant 1980-81
10 Thresher 1972
11 First Tube well/Pumpset 1962
12 First Motorcycle 1980
13 T.V. & D.V.D. Players 1982
14 Electricity in Village 1965
15 Bituminous Road -
16 First Hand Pump 1960
17 Templo Renovation 1945
18 First Land Line Telephone 1982
19 Planning for Watershed Project 2011-12
(3.19) Present Land Use in the Watershed :-
The watershed has diversified land uses. The varied present land use under
different use in the watershed. The mixed land use followed in the watershed is almost
similar in other parts of U.P. During P.R.A. Exercise prepared land has been shown in
Table No. 13, 14 & 15.
Table – 13 : (Ownership) S.
No.
Name of Village Pvt. Agri. Land Govt.
Revenu
Land
Forest
Land
Other
Land S.C./S.T. Others
1 2 3 4 5 6 7
1 Surjawali 134 4.680
2 Sarangpur 119.680 5.320
3 Baraula - 15.769 0.231
4 Turkipur - 0.931
5 Lalner - 0.861
6 Bhaiyapur - 0.200
Total

251
Table –14 : (Present Land under different categories)
S.
No.
Name of Village Land Use (Ha.)
Agricultural Wasteland
(All Types)
Seasonal
waterbodies
Village/Raod
Etc.
Total
1 2 3 4 5 6 7
1 Surjawali 187.00 39.45 - 4.600 231.09
2 Sarangpur 164.05 33.300 - 5.320 202.670
3 Baraula 578.08 2.969 - 0.231 60.308
4 Turkipur 45.90 12.739 - 0.861 59.500
5 Bhaiyapur 13.60 9.869 - 0.931 24.400
6 Lalner 84.15 18.600 - 1.200 103.972
Total 551.808 116.927 13.143
Table – 15 : (Present land use classified)
Proposed Post Land Use has been given on Page No. 32
4- Focus on Present Land Use :
(4.1) Agriculture :
The total area under agriculture in the watershed is about 487.89 ha. out of which
574.00 ha. is under rainfed agriculture. Agriculture land uses in the watershed extended to
diversified land capabilities starting marginal to good class II land. The irrigated and
drinking water is most scarce natural resource in the watershed. The operation of tube well
for irrigation of agricultural crops frequently leads to the drinking water. Problem to the
S.
No.
Land Use Under Unit
(ha.)
Area
(Ha.)
Percentage
1 2 3 4 5
1 Under Agriculture
A- Rainfed-
I- Crops 321.75
II- Agro forestry 7.32
B- Irrigated-
I- Assured 39.26
II- Portial 53.70
2 Wasteland
A- Aforestation
B- Pasture
C- Untreatable
D- Treatable 54.28
252
farmers of watershed forcing them to carry drinking water from outside of the watershed
area. The agricultural field bund are common in the watersheds however they frequently
breach on heavy rains.
Various mixed texture of soils are located in patches through out the watershed.
The heavy soils are almost kept fallow during rainy season. the agricultural soils also have
some as share calcium pan at variable depths. The irrigation water is conveyed by the
earthen channels. Surface irrigation methods following mainly border method of flood
method by the formers in the watershed. These factors reduce the water use efficiency of
limited and valuable irrigation water.
Drought hardy species like Juliflora suitable multi purpose trees is suitable for
rehabilitation of the wasteland. Rehabilitation of waste lands promoting agro forestry with
appropriate fruit and forest species suitable vegetative barriers on sloppy lands can be high
future value and by these adoption would be meet out many demands of fire wood and
fodder in the wasteland. Except above but also for soil and water conservation,
rehabilitation of wasteland and sustainable income generation for socio-economic
upliftment of farmers.
Crop Productivity :
The farmers also do not have suitable cropping system to deal aberrant weather.
Weeds impose considerable constraint in productivity of both Karif and Rabi crops under
irrigated as well as rainfed production system farmer undertake normally one manual
weeding in mustard and other valuable crops however, practices is energy and time
consuming. Use of we decide is rare in the watershed.
In the watershed area, limited cropping in the Kharif with mixed cropping practices
is not only irrigational but also unscientific and best for low productivity. Subsequent Rabi
crops in general. Sugarcane & Mustard crop in particular are raised on residual soil
moisture under rainfed production system during post mansoon season.
(4.2) Indigenous Technological Knowledge (ITK) :
Under process of PRA tracked out rural applying technology in various field of
local technology and some technology is very popular in village. In which the agriculture
is an old traditional practices of farmers who have improved themselves with passage of
the time according to their domestic needs and technological reforms in the nearby areas.
The villages have their traditional village ponds, practice of field bunding which typically

253
constitute agricultural related ITKs in the watershed. The Mustard & sugarcane being a
cash and firewood crop of the watershed and also sugarcane crop is being. Cultivated in
self designed manner by the farmers. Its carried out that the area is totally depend on rain
and under the rainfed area technology is applied by the farmers. However limited fertilizer
application specifically the DAP came in the practices since about 15-20 years.
(4.3) Forest and Other Vegetation :
Forest :
The watershed have a tract of wasteland area which are under uncultivable position
is liesed in the watershed. These wasteland have not any tree vegetation or very less than
real requirement for the wasteland use.
Horticulture/Agro forestry :
Horticulture and agro forestry practices were observed in the watershed.
(4.4) Agro forestry :
Agro forestry practices are lacking in the watershed. Though it has good potential
under existing disposition and may a role particularly with respect to minimization of
cropping risk, built up soil fertility and productivity, protection of soil erosion, soil
conservation partly meeting out the fire wood demand of rural community and more over
optimizing the economical return from system as whole under typical semi arid climate in
the watershed. Bund and boundary plantation also have good potential to care the fire
wood and fodder demands of the rural community in the watershed. The existing area
under agro forestry is almost negligible. Prosopis Jhliflora may be planted as block or sole
plantation specifically on marginal and degraded land in the watershed.
The agro forestry interventions comprising of ber, bail, aonla, guava, papular etc.
may be applied for benefit of the farmers under rainfed to irrigation production system on
leveled to slopping and marginal agricultural using proper planting techniques and term it
control measures.
The multipurpose trees may be also help in supplementing fire wood and fodder
demands of the rural community in the watershed and my be planted as hedge rows on
rainfed, marginal and degraded lands.

254
(4.5) Horticulture :
Fruits and vegetables practices are lacking in the watershed area. Its practices may
be sustainable very good potential for the formers of watershed. There are a limited lack
fruit trees in number like mango, guava, lime, ber, aonla and papaya fruit trees well as
vegetables like radish, okra, tomato, cabbage, garlic, onion, chilly, bringer and cucurbits
but they are found surviving well in the watershed villages. Organized orchards (vatika)
commercial vegetable cultivation horti-agri and other systems of agro forestry etc. are
lacking but have good agriculture.
5. Soil and land capability classification :
(5.1) Soil Morphology :
Watershed is located North East corner of Bulandshahr Distt. near about 55 Km.
away. The entire terrain of watershed is topographically divided into various land forms.
Accordingly the soils of watershed have been grouped major categories is given as follow
:
Hill Terrain Plane
Land
Sloppy
Undulated
Land
Rill Erosic
Land
Moderate
ravenous
- 35% 31% 19% 15%
Given categories in the blocks is located the soil morphology in the watershed
areas. Representation of soil characteristics by soil profile is represented as follows :
Soil Profile :
Fig. – 9 (Soil Profile)

255
Table – 16 : (Morphology of a Typical Soil Profile) :
Horizone Depth in
Cm.
Morphology
1 2 3
A
V & H
0-150 Silky when moist, Hard when dry quick
soluble, high elasticity, fissures, and cracks,
occasional occurrence of free calcium
carbonate granules black in colour, clay
content 29%, PH- 8 to 8.7
B
V & H
150-160 Whitish yellow in colour, very fine mixed
with free cacaos and gravels, Hard when dry
compact and indurate hard pan restricting
development of root and down ward water
transmission.
C
V & H
7600 Red and white sand stone
(5.2) Soil and Characteristic and Fertility Status :
Soil characteristic pertaining to soil fertility of various classes accruing around
villages in the watershed are given as follows :
Table – 17 : Soil Characteristic & Fertility Status :
Sl.
No.
Soil Properties LCC-II LCC-III
& IV
1 2 3 4
1 Sand % 47.04
2 Silt % 24.60
3 Clay % 28.36
4 Texture Sandy Clay Lomy Sand
5 PH (1:2) 8.41 8.67
6 Organic Carbon % 0.31 0.12
7 Available N Kg ha-1
310 173
8 Available P Kg ha-1
39 15
9 Available K Kg ha-1
189 325
10 EC (dS m-1
) 0.47 0.10

256
(5.3) Land Capability Classification (LCC) :
Land capability classification (LCC) was done to classification the soils in
different groups based upon the limitations and to emphasize the hazards prevailing in the
watershed in order to find out the different topo-sequences, landforms, soil depth and
erosion hazards. This was followed by the detailed investigation of selected landforms to
bring out the LCC classes of the Watershed. Classes of land capability namely II, III, IV
and V are demarcated in the watershed. The areas under different classes are sown as
follows :
Table – 18 : Land Capability Classification (LCC) :
S. No. Land capability
class
Area in Ha. Colour
1 2 3 4
1 I Class
2 II Class 14
3 III Class 71
4 IV Class 10
5 V Class 5
6 VI Class
7 VII Class
8 VIII Class
Land capability classification of various agricultural practices under land use can
be classified as groups, class, sub class and units. Utilization of various land class is given
as follows :
Table – 19 : Utilization of various land uses

257
(5.4) Land Capability Class II & III :
This group is one of the most extensive LCC watershed. and also near to class III
for the agricultural practices. The soils are sandy & sandy loam in texture. The land under
this class is nearly level to mild sloping (1-3%). The soils are deep and erosion hazard is
slight. Most of the productive agriculture land comes under class II & III. These lands
potentially very productive but due to rainfed a single cropping pattern is in habitation.
(5.5) Land Capability Class IV :
This class is found in lower portion near the outlets of watershed. The soils are
coarser in texture, deep, erosion hazard and undulating in topography. Rill and initiation of
gully can be seen near the outlet of the watershed.
(5.6) Land Capability Class VII & VIII :
This class of land is not found in watershed. Somewhere lack of soil are found with
admixture gravels fragments in these classes of lands.
(5.7) Conclusions :
The majority of land form is coming under class II, which give an insight of good
agriculture production potential of the watershed.
The land capability classification provides reasonable good information with
regard to capability of soil, that could be used for agriculture, agrihorticulture, silviculture
and posture development.
The productivity of these lands could be further enhanced by adoption of simple
soil & water conservation measures like bunding practices.
The reasonable area is under watershed of wasteland and other wasteland including
grater potential of this watershed for forestry and pasture development. Rare places
namely water body of low portion of land area under seasonally works as water harvesting
structures and these harvested water is used or can use for some other benificial activities
during the crop season also.
6. Problems and needs of the watershed indentified during the PRA
(6.1) Problem Identification and prioritization :
z- The are has undulating topography, steep unstable slopes, gradient of excessive
branches of rills and hence highly prone to soil erosion.
aa- Major issues addressed to food sufficiency economic growth and environmental
security in the watershed area.
bb- Effective soil depth is limited and highly variable hampering good crop growth.

258
cc- The watershed have low productive cropping due to tradition single cropping
pattern and over all average crop production percentage not sufficient against
requirement.
dd- Identified that there is no assured irrigation system has been development capacity
of water bodies are reduced due to silt ration which are utilized to store of rainy
water and they are renovatable.
(6.7) Transact walk during the PRA :
Problems identified and prioritized during the transact walk and PRA exercises in
all comprised villages of watershed. There were pooled and a list of problems
representing the whole watershed was prepared. Problems were ranked as per their total
weight age in the watershed village.
Table – 20 : Ranking of Problem identification and prioritization of watershed
S.No. Problem Rank
1 2 3
1 Lack of irrigation
2 Lack of drinking water
3 Low production of field crops
4 Lack of fodder availability and low productivity
5 Lack of availability of fuel wood
6 Lack of market facility
7 Lack of quality seeds, fertilizer, pesticides etc.
8. Medical and Health care facilities for milching
animals and low productivity.
9 Lack of medical, educational and transportation
facilities
10 Lack of water bodies renovation
11 Lack of run of earthen check bunds
12 Lack of water harvesting structures
13 Lack of livelihoods opportunity
Prioritized ranking (Upto four Numbers) :-
16- Lack of earthen check bunds.
17- Lack of livelihood opportunities.
18- Lack of irrigation water was the greatest problem. Lack of irrigation water
problem experienced by the people followed by low crop production.

259
(6.3) Analysis of SWOT of the watershed :
Strength (S), Weakness (W), Opportunity (O) and Threat (T) analysis is a
useful decision support tool. A SWOT analysis of watershed is presented as
follows :
SWOT analysis of the watershed
Strengths (S)
li. Cooperative work culture in traditional
activities
lii. Close ethic ties
liii. Road at the top as well as outlet of the
watershed
liv. Hard working
lv. Resource pool of crop genetics
diversity
lvi. Awareness of farmers about watershed
management programme
lvii. Well established CPR maintaining and
sharing system
lviii. Stall feeding of animals
lix. Well maintained seasonal water bodies
lx. Social outlook of the community
towards land less
Weakness (W)
xlvi. Poor water management
xlvii. Resource poor farmers
xlviii. Out migration of youth
xlix. Low and erratic rainfall
l. Fragile geology
li. Fragmented land holding
lii. Heavy infestation of wild animals
liii. Problem of fuel and fodder
liv. Shallow soil depth and with high
percentage of gravel
Opportunities (O)
xxxi. Wide range of annual and perennial
crops
xxxii. Scope of regular employment
opportunities to check out migration
xxxiii. Strengthening of existing irrigation
system
xxxiv. Conducive climate for rainfed crop
diversification
xxxv. Good scope for Agro forestry and dry
land horticulture
xxxvi. Potential for collective action and
management of CPR
Threats (T)
xxvi. Prone to adverse climate like drought
xxvii. High market risk
xxviii. Social conflicts owing to PRI and
WSM polices and local politics
xxix. Weak coordination among line
departments
xxx. Lack of expertise of implementing agency in
different aspects of WSM
7. Proposed land use for the watershed :
Watershed management plan preparation due importance is given to topographic,
land suitability, irrigation potentially, prevailing farming systems, micro farming situation,
farming, farmers preferences and priorities along with economic and environment
securities.

260
Crop and tree selection and area distribution was done as per farmers priorities
revealed through PRA exercise.
The watershed management plan for watershed is prepared with specific objectives
of food sufficiency, income and employment generation with environment security.
Technical options were with the ITK based on the latest available experiment
findings. Due attention was given to the resource of the farmers and adjustments were
made in capital intensive resource demanding technological outputs while making them
adoptable to the resource poor farmers. Emphasis was given on maximum use of farm
yard manure. The proposed land use plan of the watershed is shown as follow as in table
Table – 21 : Present and proposed land use plan of the watershed
S.No. Land use Present
(ha)
Proposed area
(ha)
1 2 3 4
1 Agriculture
a Rainfed
I Crops
II Agro-forestry
b Irrigated
I Assured
II Partial
2 Waste land
a Aforestation
b Pasture
c Untreatable
d Treatable
3 Village land
(7.1) Status of Present Water Resources Utilization :
Watershed is having some canal system. Management and maintenance of these
canal are required. Before sowing of Rabi crops, water from these canal is issued as
supplementary irrigation for Rabi sowing ar allowed to go as waste. After releasing water
from canal, submergence area also put under cultivation.
Some where bore well irrigation applied by the farmers in the watershed.

261
(7.2) Proposed Plan for Irrigation Development :
a- Present system of irrigation and wastage of water during October–November
need to be made more efficient from water management point of view by
minimizing conveyance losses in the existing water courses.
b- Present irrigation canal capacity have to build up by the reform. Which are lack
capacity of water.
c- Construction of new water harvesting earthen structures, Pucca Check Dem, Series
Gully Plugging, etc. has been sloppy portion to increase irrigation potential and for
recharging of ground water, soil and moisture conservation maximum field
irrigation, best production and expected change of crop rotation.
d- The up gradation of the exciting system of irrigation will result in :
i- Minimization of conveyance losses.
ii- Increase in frequency of irrigation.
iii- Adoption of high yielding varieties of crops.
iv- Assured cultivation of cash crops.
v- Capacity buildup by the planning of new water harvesting structures.
(7.3) Ground Water Recharge :
For the purpose of ground water recharge, the area of the upper side of watershed
is recommended for Field Bunds, Contour Bunds, Peripheral Bunds and Submergence
Bunds and in the lower portion Contour Staggered Trenches, Gully Plugs, Earthen Check
Dem and Pacca Outlets. In the undulated sloppy portion of the watershed recommended
water harvesting structure for dual purpose as ground water storage and under ground
water recharge.
(7.4) Crop Production :
Practices proposed in the watershed is given as follows :-
a- Mulching and crop residue management.
b- Application of green manuring.
c- Vermi Composting.
d- Crop rotation and inter cropping.
e- Biofertilizers.
(7.5) Tillage Operation :
Deep tillage technology is proposed to apply to be demonstrated for benefit of
farmers in the watershed.

262
(7.6) Improved Seeds of High Yielding Verities (H.Y.V.) :
Recommendation of improved varieties is necessary for improving the productivity
and farm income. Through replacement of low yielding traditional verities of seeds in
villages of watershed.
(7.7) Balanced Fertilizer Use :-
Demonstration of use of fertilizer in various crops of watershed recommended
balance fertilizer use in different crops will be benefited of forming community.
(7.8) Control of insects and diseases :
Aphid in the mustard are the major insects in the watershed areas leading to loss in
crop productivity. Similarly white blister is also a common disease in the mustard crop.
The management strategies of these insect pest and diseased will also be
demonstrated in the watershed for benefit of the growers.
(7.9) Dry Land Horticulture :
Such portion of dry land in which proposed horticulture development planning
recommended species like Ber, Bel and Aonla will be planted at suitable spacing in the
watershed.
(7.10) Agri Horticulture :
Aonla and Sahjan would be suitable horticultural crops to the locality. Therefore, a
part of land in the farmer field shall be selected and brought under Agri-horticulture
system. The cropping system followed will be Jwar and Wheat.

263
(7.11) Plantation (Fuel wood) :
Such a portion which are under wasteland will be taken falling in the class-IV
category in the watershed. These lands will be planted with species like Vilayati Babool
(Prosopis Juliflora), Babool (Acacia Nilotica), Karanj (Pangamia Glabra).
9. Socio Economic Analysis of the of the Project :
(9.1) Sustainability and environment security :
The proposed land use plan will improve the land utilization index and crop
diversification index significantly as compared to the existing one. in the proposed
watershed management plan proper blending of the bio engineering measures will be
applied on above 80% of the total area of watershed. It is estimated that more than above
70% of the watershed area will be treated and consequently the soil loss and runoff from
the area is excepted to be reduced by 70% respectively.
It will help in maintaining ecosystem integrity on sustained basis along with
improving the livelihood security of the farming community.
(9.2) Economic Analysis :
Economic analysis of the project was carried by taking direct benefits and costs
considering 10 years for project life at 10% discount rate. Whole watershed development
plan was divided into three sector as agriculture, horticulture and forest/Fuel wood
plantation. Net Present Value (NPV) and Benefit Cost ratio criteria were applied judge the
economic efficiency of each enterprises and sector. Net present value (NPV) of the project
life is considered to be 10 years and discount rate for NPV estimation is 10% is given
NPV and benefits as follows :-

264
Table – 22 : Present productivity income analysis :
S.
No.
Name of
Sector
Name of
Crops
Produ
cti-
on/ha.
Rate/
Qtl.
Cost of
Production
Expend. of
cultivation
Net
income
B.C. Ratio
between
Col. 8 & 7
1 2 3 4 5 6 7 8 9
A Agriculture Urad 3.00 4500.00 13500.00 6450.00 4450.00 1:1
Moong 3.00 4600.00 6075.00 6075.00 7426.00 1.27:1
Jwar 4.80 600.00 1880.00 1584.00 1296.00 0.82:1
Wheat 18.50 1000.00 18500.00 8650.00 7075.00 0.82:1
Pea 7.50 2400.00 18000.00 10970.00 5905.00 0.54:1
Mustard 3.00 2400.00 10152.00 3235.00 3240.00 1:1
Total - 76830.00 54105.00 51000.00 0.94:1
Average - 131380.00 6763.00 6375.00 0.94:1
B Forestry Vilayati
Babool
15000.00 - Nil
C Horticulture Ber 20000.00 - Nil
Aonla 20000.00 - Nil
Bel 20000.00 - Nil
Total - 60000.00 - Nil
Average - 20000.00 - Nil
Grand Total

265
Table –23 : Post productivity and income analysis for Post Productivity
Value and B.C.:
S.
No.
Name of
Sector
Name of
Crops
Produ
cti-
on/ha.
Rate/
Qtl.
Cost of Production
Expend. of
cultivation
Net
income
B.C. Ratio
between
Col. 8 & 7
1 2 3 4 5 6 7 8 9
A Agriculture Urad 4.00 5000.00 2000.00 8325.00 1145.00 1.39:1
Moong 4.00 5000.00 2000.00 8200.00 11800.00 1.44:1
Jwar 5.50 800.00 440.00 1900.00 2500.00 1.32:1
Wheat 25.00 1000.00 25000.00 16680.00 13320.00 1.14:1
Pea 1.00 3500.00 32250.00 14810.00 18540.00 1.12:1
Mustard 5.00 3000.00 15000.00 4370.00 8130.00 1.86:1
Total - - - 172250.00 72845.00 99765.00 1.38:1
Average - - - 21531.00 9061.00 12471.00 1.38:1
B Forestry Vilayati
Babool
80.00 500.00 4000.00 15000.00 25000.00 1.67:1
C Horticulture Ber 35.00 2000.00 52500.00 20000.00 32500.00 1.63:1
Aonla 35.00 2000.00 70000.00 20000.00 5000.00 2.50:1
Bel 40.00 1500.00 8000.00 20000.00 40000.00 2:1
Total - 182500.00 60000.00 122500.00 2.01:1
Average - 60833.00 20000.00 40833.00 2.04:1
Grand Total - 1394750.00 147485.00 247265.00 1.68:1
Table –24 : Summary of NPV, PPV and B.C. Ratio (Sector wise) :
S.
No.
Name of Sector NPV PPV B.C.
Ratio Expend. Net
Income
Expend. Net
Income
1 2 3 4 5 6 7
1 Rain fed
Agriculture
54105 51000 51000 72485 99765
2 Forest/Fuel wood
Plantation
15000 - 15000 25000 1.67:1
3 Horticulture 60000 - 60000 122500 2.04:1
Total 129105 51000 147485 247265 1.68:1
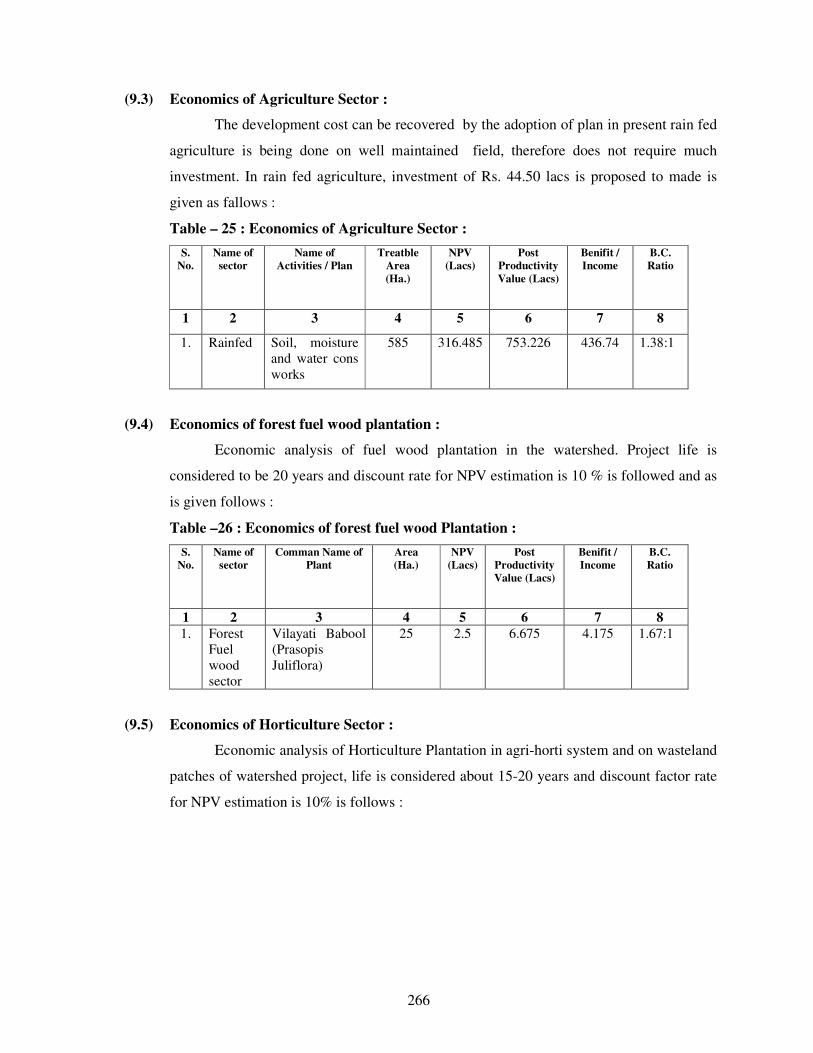
266
(9.3) Economics of Agriculture Sector :
The development cost can be recovered by the adoption of plan in present rain fed
agriculture is being done on well maintained field, therefore does not require much
investment. In rain fed agriculture, investment of Rs. 44.50 lacs is proposed to made is
given as fallows :
Table – 25 : Economics of Agriculture Sector :
S.
No.
Name of
sector
Name of
Activities / Plan
Treatble
Area
(Ha.)
NPV
(Lacs)
Post
Productivity
Value (Lacs)
Benifit /
Income
B.C.
Ratio
1 2 3 4 5 6 7 8
1. Rainfed Soil, moisture
and water cons
works
585 316.485 753.226 436.74 1.38:1
(9.4) Economics of forest fuel wood plantation :
Economic analysis of fuel wood plantation in the watershed. Project life is
considered to be 20 years and discount rate for NPV estimation is 10 % is followed and as
is given follows :
Table –26 : Economics of forest fuel wood Plantation :
S.
No.
Name of
sector
Comman Name of
Plant
Area
(Ha.)
NPV
(Lacs)
Post
Productivity
Value (Lacs)
Benifit /
Income
B.C.
Ratio
1 2 3 4 5 6 7 8
1. Forest
Fuel
wood
sector
Vilayati Babool
(Prasopis
Juliflora)
25 2.5 6.675 4.175 1.67:1
(9.5) Economics of Horticulture Sector :
Economic analysis of Horticulture Plantation in agri-horti system and on wasteland
patches of watershed project, life is considered about 15-20 years and discount factor rate
for NPV estimation is 10% is follows :

267
Table – 27 : Economics of Horticulture system :
S.
No.
Name of
Sector
Common name of Plants Area
(Ha.)
NPV
(Lacs)
Post
Productiv
e Value
(Lacs)
Benefit
Lacs
B.C.
Ratio
1 2 3 4 5 6 7 8
1 Horticulture Ber (zyziphus
mouritana)
4.00 0.80 2.104 1.304 1.63:1
Aonla (Embelica
officianalis)
3.80 0.76 2.66 1.90 2.5:1
Bel (Aegle marmelos) 2.20 0.44 1.32 0.88 2:1
Total 10 2.00 6.084 4.084 2.04:1
(9.6) Food requirement and sufficiency :
Achieving self sufficiency in food production is one of the prime objectives of
watershed project. The status of food requirement and production before and after the
project is presented as is follows :
Table – 28 : Status of food requirement and availability of per annual :
S.
No.
Name of Foods Requirement
Q./Yr.
Present Status Expected Post Status
Availability
Q./Yr.
Deficit or
surplus
Q./Yr.
Availability
Q./Yr.
Deficit or
surplus
Q./Yr.
1 2 3 4 5 6 7
1 Cereals 110 Kg. 16165 13740 - 2425 27480 11315
2 Pulses 36.50 5364 2950 - 2414 9655 4291
3 Oil Seeds 29.20 4291 1716 - 2513 6866 2575
4 Vegetable 71 kg 13372 2674 - 10698 24070 10698
(9.7) Employment generation :
One of the major problem of the labour migration in watershed project. By the
implementation of the project activities employment opportunities will be generated.
However the changes in land use pattern and adoption of other subsidiary enterprise will
generate employment opportunities in the watershed as given in table follows :

268
Table – 29 : Employment generation under proposed works :
S.
No.
Employment
activities/works
Area
under
work
Cost Mandays generation (Nos.)
Unskilled Skill Total Person
1 2 3 4 5 6 7 8
2 Graded Contour Bund 66 1.98 1980 1980 66
3 Gully Plug, C.D. 110 8.25 5775 424 6199 206
4 Submergence Bund 94 3.76 3760 3760 125
1 Peripheral Bund 93 3.255 3255 3255 108
5 W.H.B. 115 10.350 6210 352 6562 219
6 Renovation of Bund 72 2.16 2160 2160 72
7 Reno. of W.H.B. - - - - - -
8 Community Pond - - - - - -
9 Afforestation 25 3.345 669 - 669 22
10 Horticulture 10 2.00 400 - 400 13
Total 585 - 24209 776 24985 831
10. Formation of watershed committee :
Under compliance of common guideline Para (6.3) is followed and by the help of
watershed development team, watershed committee is organized in the micro watershed
village Ranayach Narendrapur with 10 members as prescribed in common guide line. List
for organization of W.C. village details given as follows :
Table – 30 : Details of comprised village W.C. organization in M.W.S. :
S.
No.
Particulars Details Block Geogra-
phical Area
1 2 3 4 5
1 Micro watershed code 3B3E4d3c Pahasu 650
2 Name of Gram Panchayat
in M.W.S.
Surjawali
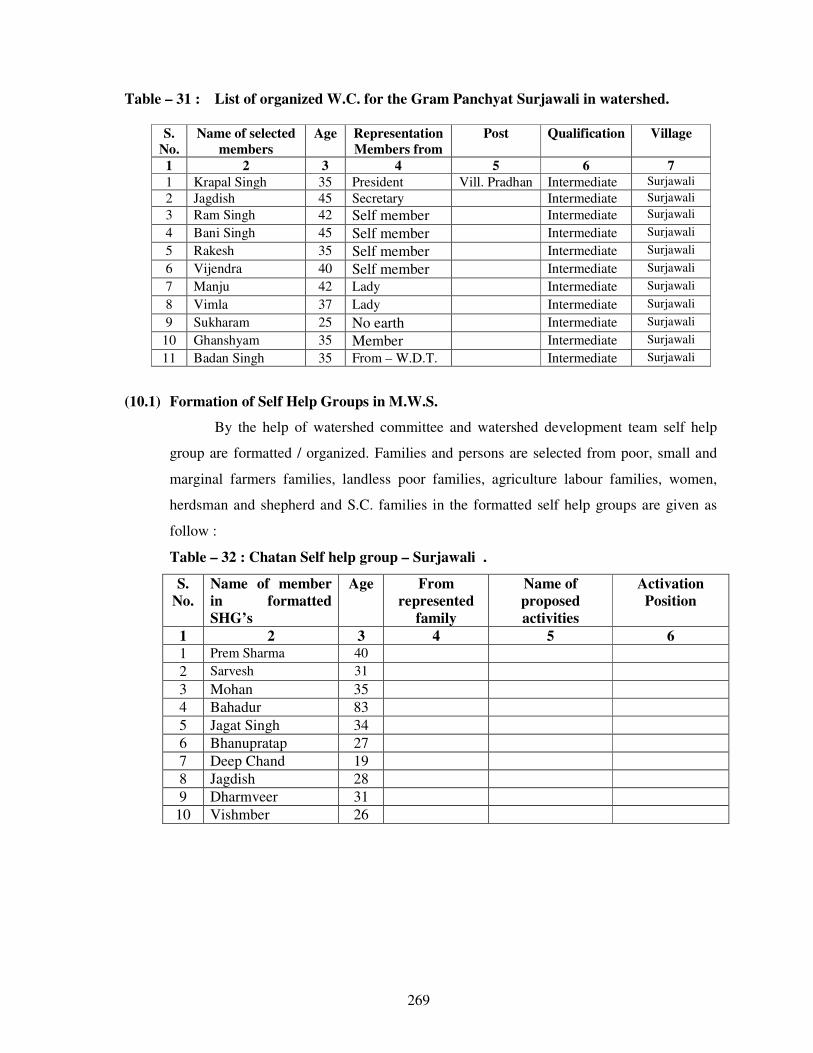
269
Table – 31 : List of organized W.C. for the Gram Panchyat Surjawali in watershed.
S.
No.
Name of selected
members
Age Representation
Members from
Post Qualification Village
1 2 3 4 5 6 7
1 Krapal Singh 35 President Vill. Pradhan Intermediate Surjawali
2 Jagdish 45 Secretary Intermediate Surjawali
3 Ram Singh 42 Self member Intermediate Surjawali
4 Bani Singh 45 Self member Intermediate Surjawali
5 Rakesh 35 Self member Intermediate Surjawali
6 Vijendra 40 Self member Intermediate Surjawali
7 Manju 42 Lady Intermediate Surjawali
8 Vimla 37 Lady Intermediate Surjawali
9 Sukharam 25 No earth Intermediate Surjawali
10 Ghanshyam 35 Member Intermediate Surjawali
11 Badan Singh 35 From – W.D.T. Intermediate Surjawali
(10.1) Formation of Self Help Groups in M.W.S.
By the help of watershed committee and watershed development team self help
group are formatted / organized. Families and persons are selected from poor, small and
marginal farmers families, landless poor families, agriculture labour families, women,
herdsman and shepherd and S.C. families in the formatted self help groups are given as
follow :
Table – 32 : Chatan Self help group – Surjawali .
S.
No.
Name of member
in formatted
SHG’s
Age From
represented
family
Name of
proposed
activities
Activation
Position
1 2 3 4 5 6
1 Prem Sharma 40
2 Sarvesh 31
3 Mohan 35
4 Bahadur 83
5 Jagat Singh 34
6 Bhanupratap 27
7 Deep Chand 19
8 Jagdish 28
9 Dharmveer 31
10 Vishmber 26

270
Table – 33 : Mahima self help group Surjawali
S.
No.
Name of
member in
formated
SHG’s
Age From
represe-
nted family
Name of
proposed
activities
Activation
Position
1 2 3 4 5 6
1 Ram Singh 24 President
2 Anand 35
3 Bani Singh 40 Secretary
4 Bheekam 25
5 Kunmarpal 28
6 Shivkumar 40
7 Peetam 35
8 Gopal 25
9 Dauliram 24
10 Gajraj 35
Table – 34 : Self help group in Surjawali of watershed.
S.
No.
Name of
member in
farmated
SHG’s
Age From
represe-
ntated
family
Name of
proposed
activities
Activation
Position
1 2 3 4 5 6
1
2
3
4
5
6
7
8
9
10
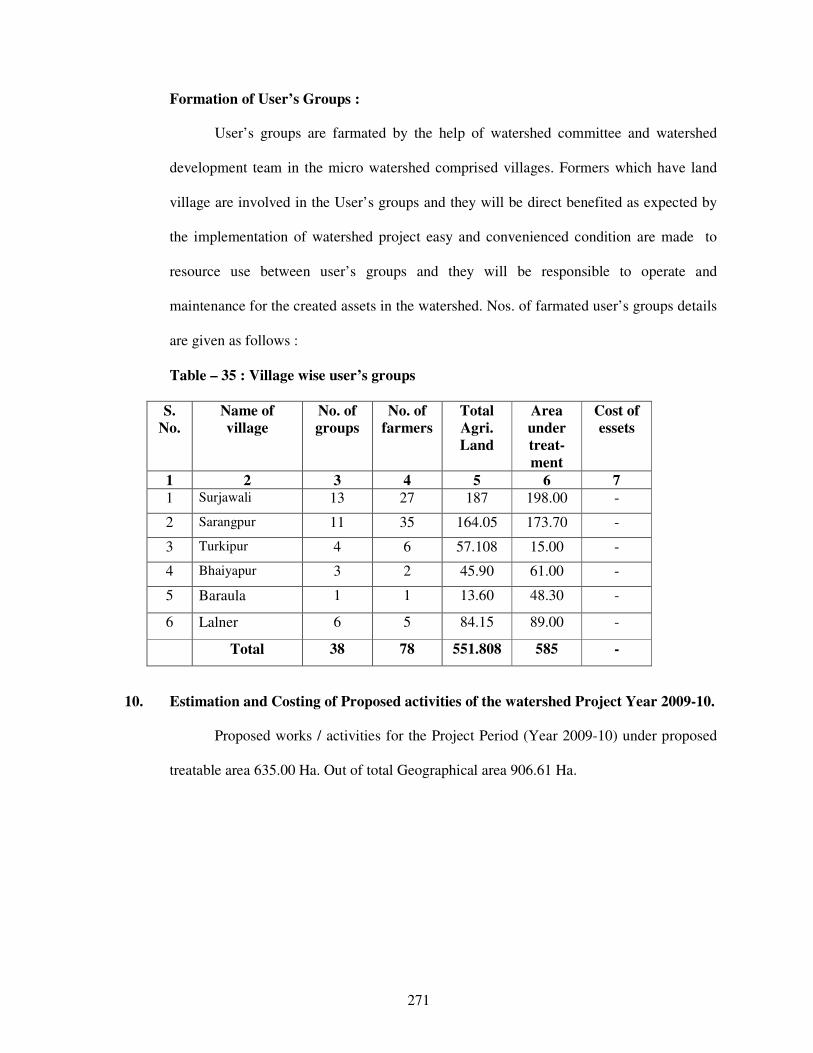
271
Formation of User’s Groups :
User’s groups are farmated by the help of watershed committee and watershed
development team in the micro watershed comprised villages. Formers which have land
village are involved in the User’s groups and they will be direct benefited as expected by
the implementation of watershed project easy and convenienced condition are made to
resource use between user’s groups and they will be responsible to operate and
maintenance for the created assets in the watershed. Nos. of farmated user’s groups details
are given as follows :
Table – 35 : Village wise user’s groups
S.
No.
Name of
village
No. of
groups
No. of
farmers
Total
Agri.
Land
Area
under
treat-
ment
Cost of
essets
1 2 3 4 5 6 7
1 Surjawali 13 27 187 198.00 -
2 Sarangpur 11 35 164.05 173.70 -
3 Turkipur 4 6 57.108 15.00 -
4 Bhaiyapur 3 2 45.90 61.00 -
5 Baraula 1 1 13.60 48.30 -
6 Lalner 6 5 84.15 89.00 -
Total 38 78 551.808 585 -
10. Estimation and Costing of Proposed activities of the watershed Project Year 2009-10.
Proposed works / activities for the Project Period (Year 2009-10) under proposed
treatable area 635.00 Ha. Out of total Geographical area 906.61 Ha.

272
(10.1) Financial and Physical Outlets :
Table – 36 : Financial and Physical Outlets for the Year 2009-10 :
Sl.
No.
Components Unit
cost
per
ha.
Physical
ha. Financial (Lacs) Man-days
Generatio
n Labour
Component
Material
Component
Total
1 2 3 4 5 6 7 8
A Management Cost 10%
1 Administrative Cost – TA & DA
Hiring of Vehicles,
Official Expenditure
Electricity & Phone bill
Computer, Stationery and office
consumable materials & contingency
1200 - - 7.020 7.020 -
2 Monitoring 120 - - 0.7020 0.7020
3 Evaluation 120 - 0.7020 0.7020
Sub Total 1440 - 8.4240 8.4240
B Preparatory Phase 10% - - -
1 Entry Point Activities 4% 480 - 0.5616 2.2464 2.8080 502
2 Institutional & Capacity Building 5% 600 - - 3.5100 3.5100
3 Detailed Project Report 1% 120 - - 0.7020 0.7020
Sub Total 1200 - 0.5616 6.4584 7.020 5616
C Watershed Work Phase
a Watershed Development Works
1 Graded, Contour & Field Bunds 3000 66 1.980 - 1.980 1980
2 Gully Plug, Earthen Checkdam /WHS 7500 110 5.775 2.475 8.250 6199
3 Submergence bunds 4000 94 3.760 - 3.760 3760
4 Peripheral Bund 3500 93 3.255 - 3.255 3255
5 Earthen Water Harvesting Bund 9000 115 6.210 4.140 10.350 6562
6 Renovation of existing Bunds 3000 72 2.160 - 2.160 2160
7 Renovation of existing W.H.B - - - - - -
8 Aforestation and Development of silvi
postural system 13380 25 0.669 2.676 3.345 669
9 Dry Land Horticulture 20000 10 0.400 1.600 2.00 400
10 Community Pound (Renovation) - - - - -
Sub Total 585 24.209 10.891 35.10 24985
B Livelihood Programme (Community Based) 7.620
Income generating activities through SHG’s for landless and marginal formers 10%
1 Live stock development activities 200 - - 1.1702 1.1702 -
2 Bee Keeping 100 - - 0.5848 0.5848 -
3 Poultry Farming 200 - - 1.1702 1.1702 -
4 Nursery Development 300 - - 1.7550 1.7550 -
5 Vegetable Production 100 - - 0.5848 0.5848 -
6 Milk Dairy Promotion Unit 200 - - 1.1702 1.1702 -
7 Establishment of Vermi compost Unit 100 - - 0.5848 0.5848 -
8 Sub Total 1200 - - 7.020 7.020 -
C Production System and micro Enterprises
1 Crop production, diversification of
agriculture and introduction of agro
forestry
1170 - - 6.8445 6.8445 -
2 Demonstration of improved
composting system 390 - - 2.2815 2.2815 -
Sub Total 1560 - - - 9.126 -
D Consolidation Phase 5% Sub Total 600 - - 3.510 3.51 -
Grand Total 12000 585 24.7706 45.4294 70.20 26109

273
ladYi i=
xzke iapk;r & lqjtkoyh dksM laŒ 2B3E4d3c fodkl [k.M &igklw ftyk & cqyUn’kgj ;g fd vkÃŒM CywŒ,eŒihŒ if j; kstuk esa rS; kj dh x ;h fuek Z .k dh u;h l ` ftr if jlEifRr;k sa dks
x z ke iap k;r lqjtkoyh ,oa ekbØk s okVj ’ k sM ds vUr x Z r lfEefyr x zkeksa esa ;k s tuk fØ;kUo; u dj ku s ,oa
; kstuk m ijkUr p kyw j[kus rFk k l̀ftr if jlEifRr; k sa ds vuq j{k.k gsrq Ñr ladY i ,oa bP Nq d gSA
lqjtkoyh x z ke iap k; r ds lHk h l zk sr L Fky tS l s rky kc] x z kelHk k x k spj ¼p kj kx kg½ ] ty l alk/ku]
tx y v kfn esa Hk wfe f odk l if j; kstuk ds vUrx Z r fd; s tk; sx saA m u dk;k sZ dk s l ekt d s de tk sj ox Z tS ls
vuq l wfp r tkfr@tutkf r] efgyk ox Z ,oa vYi Hkwf eghu x jhch js[ kk ds uhp s ds yk Hk kfFk;k s a dk s ykH k
igq ¡p kus gsrq bPN q d gk sxsA
ge ; kstuk l ap kyu gsrq iz Lrkf or dj rs gS a ,oa lgef r ns rs gS fd Hkk jr l jdk j ds leLr
ekx Z n’ kh Z fl) kUrksa ds vuqi kyu es a dk;Z lEiUu djk;sx sa ;g Hk h ? k ksf"k r djrs gS fd p ; fur {ks= ftldk s
esjs }k jk HkyhHk k ¡f r ns[ kk x ; k gS] vk S j iz L rkf or ; kstu k esa iz L rkfor leLr dk; Z 15 l kyksa l s ugha djk;k
x ; k gS ftldh eq>s iw. kZ :i ls tkudkj h gS vkS j vuqeksnu djrs gSA

274
PROJECT AT A GLANCE
IWMP-II (Bulandshahar)
1 State Uttar Pradesh
2 Distt. Bulandshahar
3 Block Pahasu
4 M.W.S. Code 2B3E3c3c
5 Name of M.W.S. Project Pahashu
6 Involved Village Pahashu Dehat, Peetampur
7 Geographical Area of M.W.S. 770.00
8 Rainfed Area 616.00
9 Treatable Area 693
10 Weightage
11 Cost of Project 83.16
12 For the year 2011-12
Budget Components
S. No. Components Area
(Ha.)
Cost
(in Lacs)
1 2 3 4
1 Management Cost 12% - 9.9792
2 Preparatory Phase 10% - 8.316
3 Watershed Work Phase -
A- Watershed Development Works 50% 693.00 41.580
B- Livelihood Programme (Community Base) 10% - 8.316
C- Production System & Micro Enterprises13% - 10.8108
4 Consolidation Phase 5% - 4.158
Total 693.00 83.16

275
Executive Summary of the Project
Identified selected micro watershed project Pahashu is coded as 2B3E3c3c has
been proposed from cluster of I.W.M.P. Bulandshahar – I project in Pahasu Block district
Bulandshahar four villages namely Pahasu dehat, Peetampur and Bannauj is comprised in the
micro watershed which is located in the east of district Bulandshahar on the east bank of River
Kali Nadi and border of district Badaun area is known as Khadar. It lies between 280 -5’ S and
280-15’ N Latitudes and 78
0 -0’ E and 78
0 -10’ W Longitudes Covering area. Its altitudes ranges
from 181 meter to 208 meter above the mean sea level. Khurja Railway Station 184.11 m, Khurja
Jh. Railway station is 201.18 m above mean sea level is displayed. Project area of I.W.M.P. BSR-
II is lied in the Pahasu Block of Bulandshahar District which is come in the western plan zone
under semi arid area. The annual average rainfall is near to 397 mm which an average of 35 rainy
days. Out of which about 85% is received during the mansoon season from July to September and
very less rainfall is received in the winter season.
Temperature ranges from as high as 430C in the May-June to as 3
0-4
0C during December –
January. The Trend of rain fall is highly eratic and maximum water goes as runoff.
Main occupation of the dwellers is agriculture in the watershed. Some part of the lands are
shown during the Kharif season. Cane sugar are preferred crops in the project area. The main
Crops raised are Wheat, Pea & Mustered and maze.
The topmost portion of the watershed is sloppy flat land. Other than topmost portion of the
watershed is under soil erotic portion and depreciative. The soil of the land are sandy loam Soil.
The middle agricultural position of watershed relatively smooth sloppy flat land with sandy loam
soil texture. These soil is yellow in colour and are inherently good in fertility status.
Natural vegetation of the watershed is very poor. Somewhere forest vegetation is seen
which are predominant with Vilayati Babool (Prosopis Juliflora), followed by Babool (Accasia
nilotica), somewhere Neem Plants (Azadirachta Indica), Shisham (Dolbergia Sisson) and Karanj
(Pongamia Glabra) are seen in occasional occurrence. There is no grass land in the watershed.
Somewhere grass patches are seen only on the bunds, road sides and other such places. Coverage
of massive green belt is in poor percentage for environment which is envisaged. That watershed is
very poor climate area.
There is normal condition of animal physics and for their fodder arrangement is the
watershed and creative possibility would be expected by the implementations of the project.

276
Due to Arial soil erosion poor harvesting managements, cropping pattern, non treated
watershed etc. are very anti effective causes for the watershed. Problem of the watershed is to be
tackled by harvesting structures which have last most of their capacity new water bodies for the
prevention of erosion and conservation of soil and moistures various type of earthen bunds in the
watershed field, necessity has been observed. Wasteland will be treated with staggered Trenches,
afforestation and bunding for the changing of characteristics.
The detail project report has been prepared by the applying of nine process steps
for the micro watershed code no. 2B3E3c3c brief is as follows.
STEP-1 Secondary data collection:-During the five days visit programme in the micro
watershed project with of all available documents of village label by approaching the
Gram panchayat collected secondary data.
STEP-2 Village meeting & conducting PRA exercise:-Community meeting conducted on fix
days for the consultation with villagers for the PRA Exercise. Participatory mode of
the villages was positive indicated for the success of programm. With good in testing
participation has been drawn social & resource map on ground & paper & discussed
un various topics of problematic thoughts in the micro watershed.
STEP-3 Socio economic survey:- The resource organization of village label volunteers
identified to conduct house hold socio economic survey/states.
STEP-4 Probel typology analysis:-Thoroughly analyzed the data & identified problem type as
soil & moisture conservation, crop rotation, crop coverage, productivity, livelihoods,
social issues & capacity building gaps etc. Problems discussed with the watershed
committee & came up with alternative solution.
STEP-5 Conduct of net participatory planning (NPP):- The planning team visited together
in the planning blocks on the scheduled date along with the beneficiaries of the
villages & data gathered as for the participatory net planning.
STEP-6 Productivity & livelihood planning exercise:- For the product livelihood exercise,
group discussion on various livelihood as Agriculture, Animal husbandry enterprise
development held discussion with the villagers in the micro watershed.
STEP-7 Institutional & capacity building :- This plan is prepared based on the data
available in the field and auscultations with the watershed committee.
STEP-8 Data consolidation & documentation of DPR :- After gathering all required
information compiled collected data. Thoroughly discussed and finalized the expected
outcomes and benefits specially in the respect of livelihood for different segments.
These are the target and performers indicators for the micro watershed.
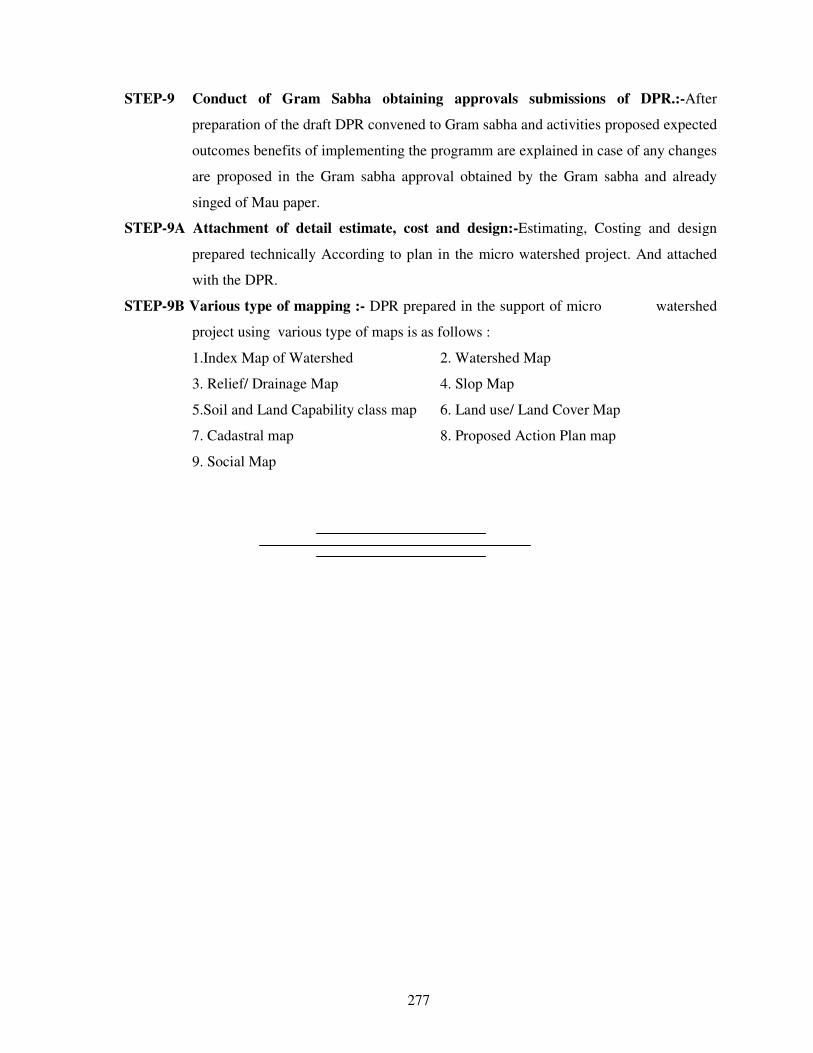
277
STEP-9 Conduct of Gram Sabha obtaining approvals submissions of DPR.:-After
preparation of the draft DPR convened to Gram sabha and activities proposed expected
outcomes benefits of implementing the programm are explained in case of any changes
are proposed in the Gram sabha approval obtained by the Gram sabha and already
singed of Mau paper.
STEP-9A Attachment of detail estimate, cost and design:-Estimating, Costing and design
prepared technically According to plan in the micro watershed project. And attached
with the DPR.
STEP-9B Various type of mapping :- DPR prepared in the support of micro watershed
project using various type of maps is as follows :
1.Index Map of Watershed 2. Watershed Map
3. Relief/ Drainage Map 4. Slop Map
5.Soil and Land Capability class map 6. Land use/ Land Cover Map
7. Cadastral map 8. Proposed Action Plan map
9. Social Map

278
Project Report
Table – 1 : Micro watershed project brief : -
1 State U.P.
2 District Bulandshahar
3 Block Pahasu
4 Comprised Villages (Nos.) 02
5 Name of Watershed Pahashu
6 Name of MWS Project Pahashu
7 MWS Code No. 2B3E3c3c
8 Geographical Area of MWS 770.00
9 Treatable Area 693.00
1- Project Objectives :- The aim and objectives of the Project are :
qq- Conservation, development and sustainable management of natural resources including
their users.
rr- Enhancement of agriculture production and productivity in a sustainable manner.
ss- Restoration of ecological balance in the degraded and fragile rain fed ecosystem.
tt- Reduction in regional disparity between rains fed and irrigated area.
uu- Creation of sustainable employment opportunities for the rural community for
livelihood security.
vv- Generation of massive employment.
ww- Reduce migration from rural employment.
2- Major Problem of Project Area :
kk- Actual shortage of drinking water.
ll- Near to nil activated water bodies and water harvesting structures.
mm- Low depth of ground water table.
nn- Undulated and generally sloppy rainfed area.
oo- Large number of Small, Marginal and S.C. farmer land holding.
pp- Lower wages of agriculture lobour and also migration of lobour due to shortage of
employment in the watershed.

279
3- General Description :
(3.1) Location :-
Pahasu Watershed has been taken with MWS Code No. 2B3E3c3c in
Pahasu Block of Distt. Bulandshahar is located on Bulandshahar via Diwai to
Tyore Bujurg Via Pahasu road about 57 Km. between 28035’ and 28
043’ N
Latitudes and 7800’ and 78
05’ N Longitudes. Location and delineation of
watershed has been located on watershed map Fig. 2 and on top sheet Fig. 3.
(3.2) Area and Elevation :
Elevation ranges from 187 to 190 mtr. above the mean sea level(MSL)
altogether comprised villages and their’s area is described as follows. (Comprises
village map Fig. 3)
Table – 2 : Area and Elevation
Sl.
No.
MWS
Code
Block Name of
Village
Geographical
Area
Treatable
Area
1 2 3 4 5 6
1 2B3E3c3c Pahasu Pahasu 623.34 561.00
Banel 146.60 132.00
770.00 693.00
(3.3) Shape of the Micro Watershed:
The shape of watershed is Elongated and as Rectangular. The maximum
length and width of the watershed are 5000 Mtr. and 1814 Mtr. respectively with
the Length: Width ratio of 2.76:1.
Fig. 1 (Shape of Micro Watershed)

280

281

282
(3.4) Climate :
The Watershed falls under ………………. semi arid region of tropical climate
inclined in Western Plan Zone. The average annual precipitation is about approx. is 397
mm. spreading over 35 rainy days. Most of the rain fall (about 85%) is received during
July to September. The rain fall of moderate intensity. Nothing the area receives of
scarcity rainfall in the winter season. The temperator variation ranges from as high as 430c
in the month of May-June to as low as 40c in December-January.
(3.5) Geomorphology and Soils :
Geomorphology :
The entire watershed is topographically divided into major landforms. Accordingly
the soils of watershed can be grouped into various categories such plane land, undulated
land, sloppy land and erosic ravenous land.
Soil :
(a) Fine textured soil :
The soil are the most extensive soil group found in the watershed. Some portion of
the watershed is relatively sloppy flat land with fine soil texture as sandy sandy loam. The
Sl.
No.
Name
of
Project
Name of Village Geograph
ical Area
(in ha.)
Raifed
Area
(in ha.)
Treatable
Area
Agri. Land
1 2 3 4 5 6 7
1 P
ahasu
Pahasu 623.34 498.67 561.00 571.50
2 Banel 146.66 117.33 132.00 135.50
Total 770.00 616.00 693.00 707.00

283
soils are in color and are inherently good high in fertility status. Soil texture is sandy lome
loam particularly in depressions and loam in the elevated portion. The soil characteristic
texture is dispersive and smooth. Therefore without impede the downward movement of
water productive layer of soil are easily by high runoff.
a- Coarse Textured Soil :
These soil are lying mostly in downward portion, along with erosic gully and
drainage line upto end of watershed outlet. These soils are coarser in texture and are
relatively poor in fertility status. The soils are lomy sand in texture. Rill and gully
formation in same parts particularly near the outlet of watershed can be seen.
(3.6) Drainage and Slope:
Due to prevalence of mild steep slope and presence of a number of drainage lines
in the watershed the drainage system is adequate. The watershed from part of Ganga Basin
and watershed. Under mild to steep topographical slope of MWS as divided as follow :
(Drainage and slope map fig.-4)
Table - 4 : Drainage and Slope
S. No. Grade Slope Percent Area in Ha. Remark
1 A 0.5-1 207.90 30%
2 B 1-2 173.25 25%
3 C 2-3 138.60 20%
4 D 3-4 103.95 15%
5 E 4-5 48.51 7%
6 F 5-6 20.79 3%

284
Fig-4 (Drainage & Scrub Map)
(3.7) Vegetation :
a- Natural Vegetation :
Natural vegetation is very poor in the watershed. The forest vegetation is
predominant with Vilayti Babool (Prosopis Juliflora). There are occasional occurrence of
Neem Plants (Azadirochta Indica), Shisham (Dalbergia Sissoo) and Karanj (Pangamia
Glabra) and anywhere some scrubs are seen. There are no grass land in the watershed.
Somewhere grass patches are seen only on the bunds, roadside and other such places. Poor
percentage of massive green trees has been not seen in the watershed except Horticulture
backyard.
b- Horticulture :
There is no backyards or commercial horticulture plantation in villages are been in
some part of watershed.
c- Agroforestry :
The agriculture fields of the villages have some horticulture plantation at places
isolated trees whose frequency is seen as under agroforestry and some where in where in
backyards.

285
(3.8) Human Population:
a- Human Population:
Total Population of involved villages in watershed is 8936 with average family
size of six persons as delaled as follows
Table – 5 : Human Population
S.
No.
Name of village Nos. of
families
Human Population Total
Male Female Children
1 Pahasu 352 762 704 977 2443
2 Banel 57 124 116 159 399
- - - - -
Total 409 886 820 1136 2842
h- Categorization of Human Population :
In the total population of watershed villages, categories are defined as below :
Table – 6 : Population Categories
S.
No.
Particulars Unit
Number of families in population
in the villages
Population Family Remark
1 2 3 4 5 6
1 Agri Farmer No. 814 266
2 Landless No. 54 16
3 Agri. Labour No. 104 37
4 Land less Labour No. 31 8
5 BPL Family No. 142 46
6 SC Family No. 107 36
7 ST Family No. - -
1252 409
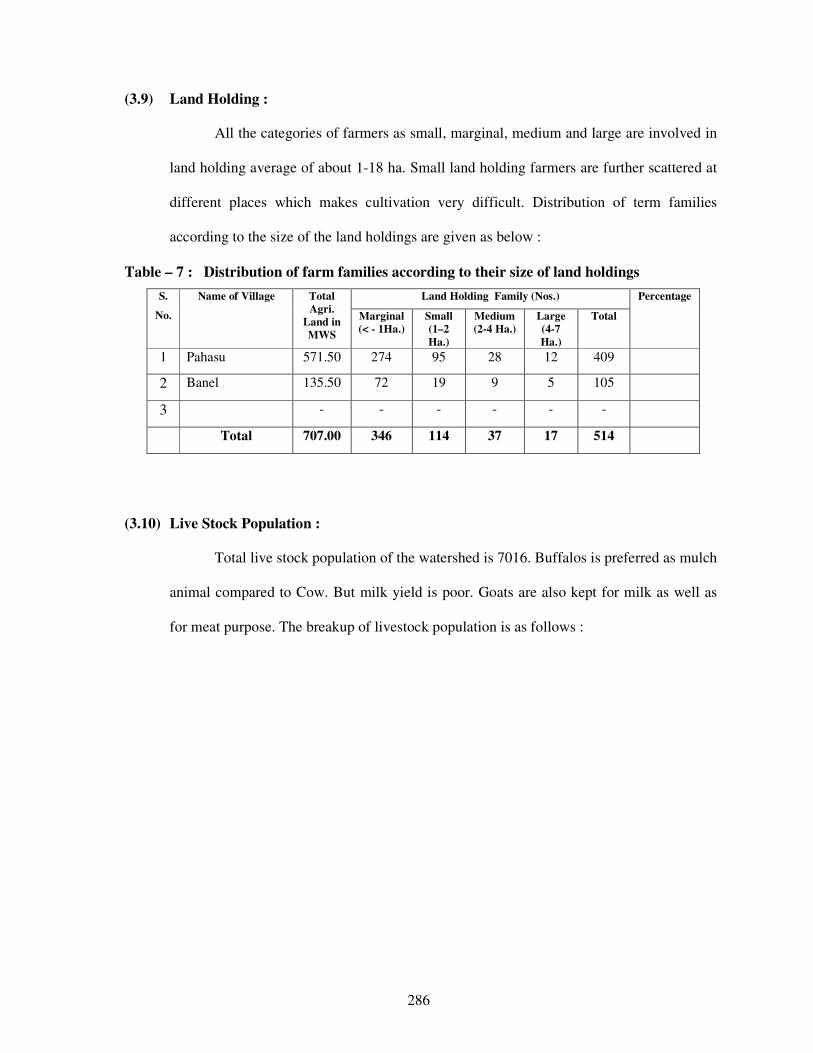
286
(3.9) Land Holding :
All the categories of farmers as small, marginal, medium and large are involved in
land holding average of about 1-18 ha. Small land holding farmers are further scattered at
different places which makes cultivation very difficult. Distribution of term families
according to the size of the land holdings are given as below :
Table – 7 : Distribution of farm families according to their size of land holdings
S.
No.
Name of Village Total
Agri.
Land in
MWS
Land Holding Family (Nos.) Percentage
Marginal
(< - 1Ha.)
Small
(1–2
Ha.)
Medium
(2-4 Ha.)
Large
(4-7
Ha.)
Total
1 Pahasu 571.50 274 95 28 12 409
2 Banel 135.50 72 19 9 5 105
3 - - - - - -
Total 707.00 346 114 37 17 514
(3.10) Live Stock Population :
Total live stock population of the watershed is 7016. Buffalos is preferred as mulch
animal compared to Cow. But milk yield is poor. Goats are also kept for milk as well as
for meat purpose. The breakup of livestock population is as follows :
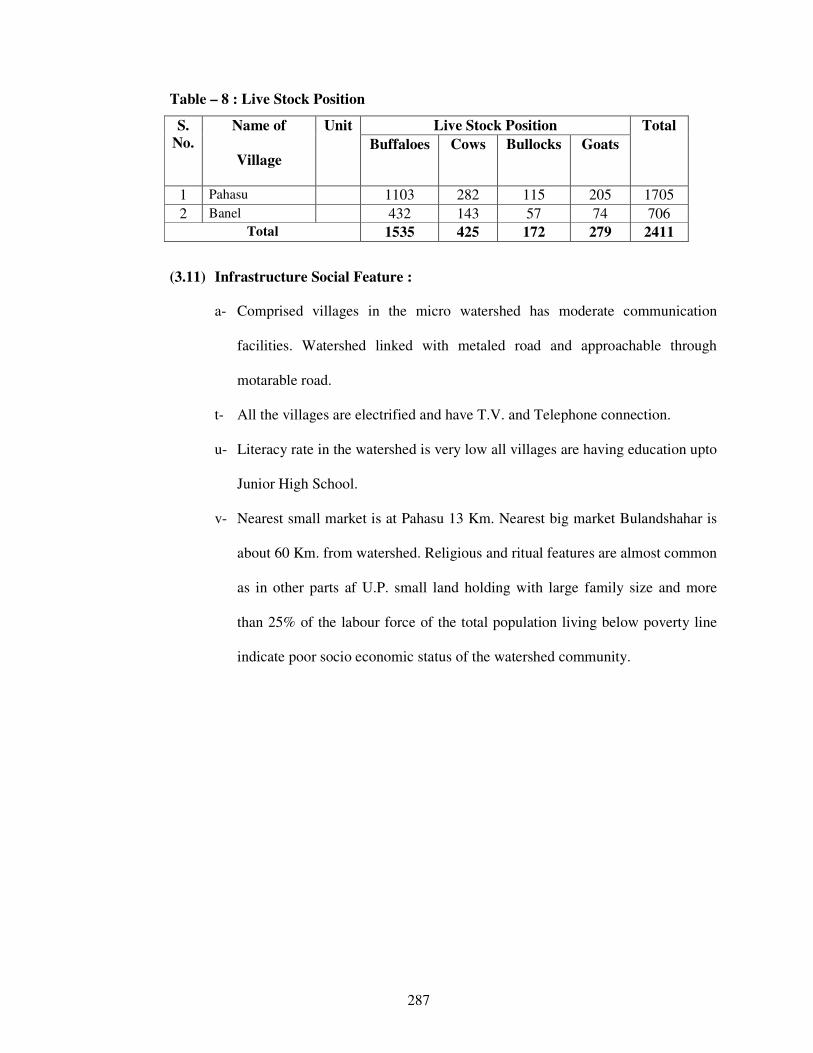
287
Table – 8 : Live Stock Position
S.
No.
Name of
Village
Unit Live Stock Position Total
Buffaloes Cows Bullocks Goats
1 Pahasu 1103 282 115 205 1705
2 Banel 432 143 57 74 706
Total 1535 425 172 279 2411
(3.11) Infrastructure Social Feature :
a- Comprised villages in the micro watershed has moderate communication
facilities. Watershed linked with metaled road and approachable through
motarable road.
t- All the villages are electrified and have T.V. and Telephone connection.
u- Literacy rate in the watershed is very low all villages are having education upto
Junior High School.
v- Nearest small market is at Pahasu 13 Km. Nearest big market Bulandshahar is
about 60 Km. from watershed. Religious and ritual features are almost common
as in other parts af U.P. small land holding with large family size and more
than 25% of the labour force of the total population living below poverty line
indicate poor socio economic status of the watershed community.

288
Participatory Rural Appraisal
Participatory mode of the villagers shows positive indication for the success of the
programme. Traditionally the entire village community participate in the individual works. Social
map of one of the watershed village drawn by villagers themselves, depicting various village
figures is shown in sketched map in Fig.-4 & 5. Infrastructures position of the village recorded as
follows :
Table – 9 : MW.S. Project – Pahasu.
S.
No.
Infrastructure Unit Qty.
1 2 3 4
1 Primary School No. 5
2 Junior High School No. 2
3 Kanya Pathshala No. 2
4 Public Health Center No. 1
5 Vet nary Hospital No. 1
6 Panchayat Ghar No. 1
7 Post Office No. 1
8 Agan Bari Center No. 5
9 Electricity - Yes
10 Road - Yes
11 Pond No. 4
12 Hand Pump No. 54
13 Irrigation Well No. -
14 Canal No. 1
15 Temple No. 10
16 Well (Drinking Water) No. -
17 Pumping Set No. 154
18 Toilet No. 110
19 Market No. Yes

289
SOCIAL MAP

290
Recorded importance of development institution
Farmers perception recorded for importance and role of different
development institution in relation to infrastructure. Importance has been depicted with
size of circle and role with distance from village circle. (Fig 8)
Fig. -8 (Venn diagram of Micro watershed)
(3.12) Communication :
Watershed can approached from Distt Headquarter Bulandshahar to Project area
57 km. by Road.
(3.13) Natural Resource Base :
Transact of watershed showed typical land use profile consisting of plain
agriculture land, erosic area and medium ravenous ridge. Main source of the irrigation are
the canal for pre showing irrigation only. The total geographical area of the watershed is
472.00 Ha. classification.
Approach roads for the micro watershed is shown for the communication is shown
on topo sheet map Fig 9 as next page.
PAHASU

291
Fig.- 7 Communication Map on Toposheet
Table – 10 : Classification of area(Hect.)
S.No
.
Name of
Village
Unit Total
Geographical
Area
Rainfed
Area
Wasteland Village
Land
and
Road
Irrigation Resource
Water
Bodies
Borewell
1 2 3 4 5 6 7 8 9
1 Pahasu Ha. 623.34 498.67 37.40 14.44 - 81.03
2 Banel Ha. 146.66 117.33 8.79 2.37 - 19.06
3 - - - - - -
Total 770.00 616.00 46.19 16.81 - 100.09

292
`
(3.14) Livelihood :
Total Population of the watershed is 8936 and out of the total population a majority
more than 80% has farming as their major source of livelihood followed by labours,
serviceman and small business class. Classified livelihood given in form as fallows :
Table – 11 : Livelihood Classification in population :
S.
No.
Name of Village Farmer Labour In
Service
In Local small
business
Others
1 2 3 4 5 6 7
1. Pahasu 246 42 31 32 9
2. Banel 40 3 5 8 6
3. - - - - -
Total 286 45 36 40 15
(3.15) Dependency of forest fuel wood and fodder :
a. Fuel wood :- The main source of fuel is from cow dung cake, woody stem of
crops. About 70% of the climactic energy requirement is met from the agriculture
by product and cow dung cake. Rest is met out from the forest outside the village
and watershed boundary, most preferred fuel wood is Juliflora fuel wood Juliflora
obtained from standing along and between watershed.
h- Fodder :- Villages have not any sufficient signified dependency on forest based
fodder as these resource are nothing availability in the forest.

293
(3.16) Labour requirement :
Labour requirements was found to be maximum at the time of October, November
and December when the sawing of Rabi crops are done. The crucial periods are March and
April coinciding harvesting and threshing of Rabi crops and July/August is sowing Kharif
Crops take a little place. Other income generating enterprises having potential during the
remaining.
(3.17) Crop Rotation :
Present Crop rotation in the watershed comprise of :
Kharif - Bajra - Rare
Maize - Rare
Jwar - Rare
Rabi - Fallow Wheat - Major
Fallow Barly - Major
Fallow Sugarcane - Major
Fallow Mustard - Major
Zayad - Urad, Moong, Makka,
The above said Rabi Crops is the most prevailing crop rotation on the agriculture
lands both in the rainfed and irrigated conditions.
Organized vegetable cultivation fruit plantation and traditional agro forestry
systems are lacking as per requirement in the watershed the limited vegetable cultivation
in the watershed is confined as kitchen gardens and field to the irrigated condition in a
scattered manner. The cultivation of cash crops other than the sugarcane, wheat and
mustard also in the watershed.
(3.18) Historical Events :
Chronological record of important events of the watershed village is prepared
through participatory rural appraisal (PRA) which is very useful in understanding of its
background and chronology is given as follows :

294
Table – 12 : Historical Events
S.
No.
Events/Activities Year Rem.
1 2 3 4
1 Established 500 year ago
2 Opening of Primary School 1990
3 Opening of Junior School 1985
4 Opening of Kanya Pathshala 1988
5 Opening of PHC 1990
6 Opening of Vet. Hospital 1982
7 Panchayat Ghar 1998
8 Introduction of Tractor 1960
9 Gobar Gas Plant 1995
10 Thresher 1985
11 First Tube well/Pumpset 1980
12 First Motorcycle 1982
13 T.V. & D.V.D. Players 1976
14 Electricity in Village 1990
15 Bituminous Road 2006
16 First Hand Pump 1985
17 Templo Renovation 2001
18 First Land Line Telephone 1996
19 Planning for Watershed Project 2010-11
(3.19) Present Land Use in the Watershed :-
The watershed has diversified land uses. The varied present land use under
different use in the watershed. The mixed land use followed in the watershed is almost
similar in other parts of U.P. During P.R.A. Exercise prepared land has been shown in
Table No. 13, 14 & 15.
Table – 13 : (Ownership)
S.
No.
Name of Village Pvt. Agri. Land Govt.
Revenu
Land
Forest
Land
Other
Land S.C./S.T. Others
1 2 3 4 5 6 7
1 Pahasu 97.15 474.35 - - 73.95
2 Banel 24.40 111.10 - - 17.77
3 - -
Total 121.55 585.45 - - 91.72

295
Table –14 : (Present Land under different categories)
S.
No.
Name of Village Land Use (Ha.)
Agricultural Wasteland
(All Types)
Seasonal
waterbodies
Village/Raod
Etc.
Total
1 2 3 4 5 6 7
1 Pahasu 571.50 37.40 - 14.44 623.34
2 Banel 135.50 8.79 - 2.37 146.66
Total 707.00 46.19 - 16.81 770.00
Table – 15 : (Present land use classified)
Propos
ed
Post
Land
Use
has
been
given
on
Page
No. 32
4- Focus on Present Land Use :
(4.1) Agriculture :
The total area under agriculture in the watershed is about 487.89 ha. out of which
574.00 ha. is under rainfed agriculture. Agriculture land uses in the watershed extended to
diversified land capabilities starting marginal to good class II land. The irrigated and
drinking water is most scarce natural resource in the watershed. The operation of tube well
for irrigation of agricultural crops frequently leads to the drinking water. Problem to the
farmers of watershed forcing them to carry drinking water from outside of the watershed
area. The agricultural field bund are common in the watersheds however they frequently
breach on heavy rains.
Various mixed texture of soils are located in patches through out the watershed.
The heavy soils are almost kept fallow during rainy season. the agricultural soils also have
some as share calcium pan at variable depths. The irrigation water is conveyed by the
S.
No.
Land Use Under Unit
(ha.)
Area
(Ha.)
Percentage
1 2 3 4 5
1 Under Agriculture Ha
A- Rainfed- Ha
I- Crops Hact 665.00 70%
II- Agro forestry Hact 35.00 7%
B- Irrigated- -
I- Assured Hact
II- Portial Hact 116.25 17%
2 Wasteland -
A- Aforestation -
B- Pasture -
C- Untreatable Hact
D- Treatable Hact 156.44 100%

296
earthen channels. Surface irrigation methods following mainly border method of flood
method by the formers in the watershed. These factors reduce the water use efficiency of
limited and valuable irrigation water.
Drought hardy species like Juliflora suitable multi purpose trees is suitable for
rehabilitation of the wasteland. Rehabilitation of waste lands promoting agro forestry with
appropriate fruit and forest species suitable vegetative barriers on sloppy lands can be high
future value and by these adoption would be meet out many demands of fire wood and
fodder in the wasteland. Except above but also for soil and water conservation,
rehabilitation of wasteland and sustainable income generation for socio-economic
upliftment of farmers.
Crop Productivity :
The farmers also do not have suitable cropping system to deal aberrant weather.
Weeds impose considerable constraint in productivity of both Karif and Rabi crops under
irrigated as well as rainfed production system farmer undertake normally one manual
weeding in mustard and other valuable crops however, practices is energy and time
consuming. Use of we decide is rare in the watershed.
In the watershed area, limited cropping in the Kharif with mixed cropping practices
is not only irrigational but also unscientific and best for low productivity. Subsequent Rabi
crops in general. Sugarcane & Mustard crop in particular are raised on residual soil
moisture under rainfed production system during post mansoon season.
(4.2) Indigenous Technological Knowledge (ITK) :
Under process of PRA tracked out rural applying technology in various field of
local technology and some technology is very popular in village. In which the agriculture
is an old traditional practices of farmers who have improved themselves with passage of
the time according to their domestic needs and technological reforms in the nearby areas.
The villages have their traditional village ponds, practice of field bunding which typically
constitute agricultural related ITKs in the watershed. The Mustard & sugarcane being a
cash and firewood crop of the watershed and also sugarcane crop is being. Cultivated in
self designed manner by the farmers. Its carried out that the area is totally depend on rain
and under the rainfed area technology is applied by the farmers. However limited fertilizer
application specifically the DAP came in the practices since about 15-20 years.

297
(4.3) Forest and Other Vegetation :
Forest :
The watershed have a tract of wasteland area which are under uncultivable position
is liesed in the watershed. These wasteland have not any tree vegetation or very less than
real requirement for the wasteland use.
Horticulture/Agro forestry :
Horticulture and agro forestry practices were observed in the watershed.
(4.4) Agro forestry :
Agro forestry practices are lacking in the watershed. Though it has good potential
under existing disposition and may a role particularly with respect to minimization of
cropping risk, built up soil fertility and productivity, protection of soil erosion, soil
conservation partly meeting out the fire wood demand of rural community and more over
optimizing the economical return from system as whole under typical semi arid climate in
the watershed. Bund and boundary plantation also have good potential to care the fire
wood and fodder demands of the rural community in the watershed. The existing area
under agro forestry is almost negligible. Prosopis Jhliflora may be planted as block or sole
plantation specifically on marginal and degraded land in the watershed.
The agro forestry interventions comprising of ber, bail, aonla, guava, papular etc.
may be applied for benefit of the farmers under rainfed to irrigation production system on
leveled to slopping and marginal agricultural using proper planting techniques and term it
control measures.
The multipurpose trees may be also help in supplementing fire wood and fodder
demands of the rural community in the watershed and my be planted as hedge rows on
rainfed, marginal and degraded lands.

298
(4.5) Horticulture :
Fruits and vegetables practices are lacking in the watershed area. Its practices may
be sustainable very good potential for the formers of watershed. There are a limited lack
fruit trees in number like mango, guava, lime, ber, aonla and papaya fruit trees well as
vegetables like radish, okra, tomato, cabbage, garlic, onion, chilly, bringer and cucurbits
but they are found surviving well in the watershed villages. Organized orchards (vatika)
commercial vegetable cultivation horti-agri and other systems of agro forestry etc. are
lacking but have good agriculture.
5. Soil and land capability classification :
(5.1) Soil Morphology :
Watershed is located North East corner of Bulandshahr Distt. near about 55 Km.
away. The entire terrain of watershed is topographically divided into various land forms.
Accordingly the soils of watershed have been grouped major categories is given as follow
:
Hill Terrain Plane
Land
Sloppy
Undulated
Land
Rill Erosic
Land
Moderate
ravenous
- 45% 28% 15% 12%
Given categories in the blocks is located the soil morphology in the watershed
areas. Representation of soil characteristics by soil profile is represented as follows :
Soil Profile :
Fig. – 9 (Soil Profile)

299
Table – 16 : (Morphology of a Typical Soil Profile) :
Horizone Depth in
Cm.
Morphology
1 2 3
A
V & H
0-150 Silky when moist, Hard when dry quick
soluble, high elasticity, fissures, and cracks,
occasional occurrence of free calcium
carbonate granules black in colour, clay
content 29%, PH- 8 to 8.7
B
V & H
150-160 Whitish yellow in colour, very fine mixed
with free cacaos and gravels, Hard when dry
compact and indurate hard pan restricting
development of root and down ward water
transmission.
C
V & H
7600 Red and white sand stone
(5.2) Soil and Characteristic and Fertility Status :
Soil characteristic pertaining to soil fertility of various classes accruing around
villages in the watershed are given as follows :
Table – 17 : Soil Characteristic & Fertility Status :
Sl.
No.
Soil Properties LCC-II LCC-III
& IV
1 2 3 4
1 Sand % 44.05 72.04
2 Silt % 23.90 17.16
3 Clay % 32.05 11.80
4 Texture Sandy Clay Lomy Sand
5 PH (1:2) 7.75 8.00
6 Organic Carbon % 0.40 0.14
7 Available N Kg ha-1
320 1.75
8 Available P Kg ha-1
27 15
9 Available K Kg ha-1
184 321
10 EC (dS m-1
) 0.47 0.13
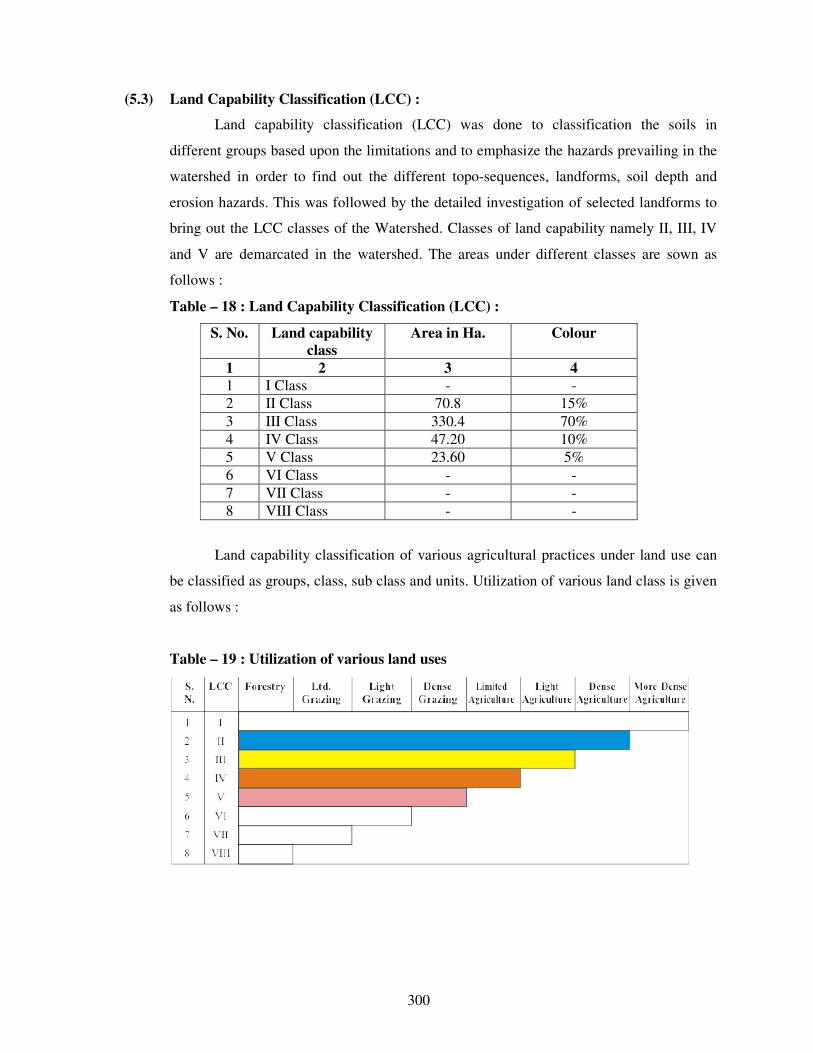
300
(5.3) Land Capability Classification (LCC) :
Land capability classification (LCC) was done to classification the soils in
different groups based upon the limitations and to emphasize the hazards prevailing in the
watershed in order to find out the different topo-sequences, landforms, soil depth and
erosion hazards. This was followed by the detailed investigation of selected landforms to
bring out the LCC classes of the Watershed. Classes of land capability namely II, III, IV
and V are demarcated in the watershed. The areas under different classes are sown as
follows :
Table – 18 : Land Capability Classification (LCC) :
S. No. Land capability
class
Area in Ha. Colour
1 2 3 4
1 I Class - -
2 II Class 70.8 15%
3 III Class 330.4 70%
4 IV Class 47.20 10%
5 V Class 23.60 5%
6 VI Class - -
7 VII Class - -
8 VIII Class - -
Land capability classification of various agricultural practices under land use can
be classified as groups, class, sub class and units. Utilization of various land class is given
as follows :
Table – 19 : Utilization of various land uses

301
(5.4) Land Capability Class II & III :
This group is one of the most extensive LCC watershed. and also near to class III
for the agricultural practices. The soils are sandy & sandy loam in texture. The land under
this class is nearly level to mild sloping (1-3%). The soils are deep and erosion hazard is
slight. Most of the productive agriculture land comes under class II & III. These lands
potentially very productive but due to rainfed a single cropping pattern is in habitation.
(5.5) Land Capability Class IV :
This class is found in lower portion near the outlets of watershed. The soils are
coarser in texture, deep, erosion hazard and undulating in topography. Rill and initiation of
gully can be seen near the outlet of the watershed.
(5.6) Land Capability Class VII & VIII :
This class of land is not found in watershed. Somewhere lack of soil are found with
admixture gravels fragments in these classes of lands.
(5.7) Conclusions :
The majority of land form is coming under class II, which give an insight of good
agriculture production potential of the watershed.
The land capability classification provides reasonable good information with
regard to capability of soil, that could be used for agriculture, agrihorticulture, silviculture
and posture development.
The productivity of these lands could be further enhanced by adoption of simple
soil & water conservation measures like bunding practices.
The reasonable area is under watershed of wasteland and other wasteland including
grater potential of this watershed for forestry and pasture development. Rare places
namely water body of low portion of land area under seasonally works as water harvesting
structures and these harvested water is used or can use for some other benificial activities
during the crop season also.
6. Problems and needs of the watershed indentified during the PRA
(6.1) Problem Identification and prioritization :
ee- The are has undulating topography, steep unstable slopes, gradient of excessive
branches of rills and hence highly prone to soil erosion.
ff- Major issues addressed to food sufficiency economic growth and environmental
security in the watershed area.
gg- Effective soil depth is limited and highly variable hampering good crop growth.

302
hh- The watershed have low productive cropping due to tradition single cropping
pattern and over all average crop production percentage not sufficient against
requirement.
ii- Identified that there is no assured irrigation system has been development capacity
of water bodies are reduced due to silt ration which are utilized to store of rainy
water and they are renovatable.
(6.8) Transact walk during the PRA :
Problems identified and prioritized during the transact walk and PRA exercises in
all comprised villages of watershed. There were pooled and a list of problems
representing the whole watershed was prepared. Problems were ranked as per their total
weight age in the watershed village.
Table – 20 : Ranking of Problem identification and prioritization of watershed
S.No. Problem Rank
1 2 3
1 Lack of irrigation 6
2 Lack of drinking water 8
3 Low production of field crops 8
4 Lack of fodder availability and low productivity 5
5 Lack of availability of fuel wood 3
6 Lack of market facility 6
7 Lack of quality seeds, fertilizer, pesticides etc. 5
8. Medical and Health care facilities for milching
animals and low productivity.
7
9 Lack of medical, educational and transportation
facilities
7
10 Lack of water bodies renovation 7
11 Lack of run of earthen check bunds 1
12 Lack of water harvesting structures 1
13 Lack of livelihoods opportunity 2
Prioritized ranking (Upto four Numbers) :-
19- Lack of earthen check bunds.
20- Lack of livelihood opportunities.
21- Lack of irrigation water was the greatest problem. Lack of irrigation water
problem experienced by the people followed by low crop production.

303
(6.3) Analysis of SWOT of the watershed :
Strength (S), Weakness (W), Opportunity (O) and Threat (T) analysis is a
useful decision support tool. A SWOT analysis of watershed is presented as
follows :
SWOT analysis of the watershed
Strengths (S)
lxi. Cooperative work culture in traditional
activities
lxii. Close ethic ties
lxiii. Road at the top as well as outlet of the
watershed
lxiv. Hard working
lxv. Resource pool of crop genetics
diversity
lxvi. Awareness of farmers about watershed
management programme
lxvii. Well established CPR maintaining and
sharing system
lxviii. Stall feeding of animals
lxix. Well maintained seasonal water bodies
lxx. Social outlook of the community
towards land less
Weakness (W)
lv. Poor water management
lvi. Resource poor farmers
lvii. Out migration of youth
lviii. Low and erratic rainfall
lix. Fragile geology
lx. Fragmented land holding
lxi. Heavy infestation of wild animals
lxii. Problem of fuel and fodder
lxiii. Shallow soil depth and with high
percentage of gravel
Opportunities (O)
xxxvii. Wide range of annual and perennial
crops
xxxviii. Scope of regular employment
opportunities to check out migration
xxxix. Strengthening of existing irrigation
system
xl. Conducive climate for rainfed crop
diversification
xli. Good scope for Agro forestry and dry land
horticulture
xlii. Potential for collective action and
management of CPR
Threats (T)
xxxi. Prone to adverse climate like drought
xxxii. High market risk
xxxiii. Social conflicts owing to PRI and
WSM polices and local politics
xxxiv. Weak coordination among line
departments
xxxv. Lack of expertise of implementing
agency in different aspects of WSM
7. Proposed land use for the watershed :
Watershed management plan preparation due importance is given to topographic,
land suitability, irrigation potentially, prevailing farming systems, micro farming situation,
farming, farmers preferences and priorities along with economic and environment
securities.

304
Crop and tree selection and area distribution was done as per farmers priorities
revealed through PRA exercise.
The watershed management plan for watershed is prepared with specific objectives
of food sufficiency, income and employment generation with environment security.
Technical options were with the ITK based on the latest available experiment
findings. Due attention was given to the resource of the farmers and adjustments were
made in capital intensive resource demanding technological outputs while making them
adoptable to the resource poor farmers. Emphasis was given on maximum use of farm
yard manure. The proposed land use plan of the watershed is shown as follow as in table
Table – 21 : Present and proposed land use plan of the watershed
S.No. Land use Present
(ha)
Proposed area
(ha)
1 2 3 4
1 Agriculture
a Rainfed
I Crops 325.00 70%
II Agro-forestry 20.00 7%
b Irrigated
I Assured
II Partial 105.00 17%
2 Waste land
a Aforestation
b Pasture
c Untreatable
d Treatable
3 Village land 155.00 100%
(7.1) Status of Present Water Resources Utilization :
Watershed is having some canal system. Management and maintenance of these
canal are required. Before sowing of Rabi crops, water from these canal is issued as
supplementary irrigation for Rabi sowing ar allowed to go as waste. After releasing water
from canal, submergence area also put under cultivation.
Some where bore well irrigation applied by the farmers in the watershed.
305
(7.2) Proposed Plan for Irrigation Development :
a- Present system of irrigation and wastage of water during October–November
need to be made more efficient from water management point of view by
minimizing conveyance losses in the existing water courses.
b- Present irrigation canal capacity have to build up by the reform. Which are lack
capacity of water.
c- Construction of new water harvesting earthen structures, Pucca Check Dem, Series
Gully Plugging, etc. has been sloppy portion to increase irrigation potential and for
recharging of ground water, soil and moisture conservation maximum field
irrigation, best production and expected change of crop rotation.
d- The up gradation of the exciting system of irrigation will result in :
i- Minimization of conveyance losses.
ii- Increase in frequency of irrigation.
iii- Adoption of high yielding varieties of crops.
iv- Assured cultivation of cash crops.
v- Capacity buildup by the planning of new water harvesting structures.
(7.3) Ground Water Recharge :
For the purpose of ground water recharge, the area of the upper side of watershed
is recommended for Field Bunds, Contour Bunds, Peripheral Bunds and Submergence
Bunds and in the lower portion Contour Staggered Trenches, Gully Plugs, Earthen Check
Dem and Pacca Outlets. In the undulated sloppy portion of the watershed recommended
water harvesting structure for dual purpose as ground water storage and under ground
water recharge.
(7.4) Crop Production :
Practices proposed in the watershed is given as follows :-
a- Mulching and crop residue management.
b- Application of green manuring.
c- Vermi Composting.
d- Crop rotation and inter cropping.
e- Biofertilizers.

306
(7.5) Tillage Operation :
Deep tillage technology is proposed to apply to be demonstrated for benefit of
farmers in the watershed.
(7.6) Improved Seeds of High Yielding Verities (H.Y.V.) :
Recommendation of improved varieties is necessary for improving the productivity
and farm income. Through replacement of low yielding traditional verities of seeds in
villages of watershed.
(7.7) Balanced Fertilizer Use :-
Demonstration of use of fertilizer in various crops of watershed recommended
balance fertilizer use in different crops will be benefited of forming community.
(7.8) Control of insects and diseases :
Aphid in the mustard are the major insects in the watershed areas leading to loss in
crop productivity. Similarly white blister is also a common disease in the mustard crop.
The management strategies of these insect pest and diseased will also be
demonstrated in the watershed for benefit of the growers.
(7.9) Dry Land Horticulture :
Such portion of dry land in which proposed horticulture development planning
recommended species like Ber, Bel and Aonla will be planted at suitable spacing in the
watershed.
(7.10) Agri Horticulture :
Aonla and Sahjan would be suitable horticultural crops to the locality. Therefore, a
part of land in the farmer field shall be selected and brought under Agri-horticulture
system. The cropping system followed will be Jwar and Wheat.

307
(7.11) Plantation (Fuel wood) :
Such a portion which are under wasteland will be taken falling in the class-IV
category in the watershed. These lands will be planted with species like Vilayati Babool
(Prosopis Juliflora), Babool (Acacia Nilotica), Karanj (Pangamia Glabra).
9. Socio Economic Analysis of the of the Project :
(9.1) Sustainability and environment security :
The proposed land use plan will improve the land utilization index and crop
diversification index significantly as compared to the existing one. in the proposed
watershed management plan proper blending of the bio engineering measures will be
applied on above 80% of the total area of watershed. It is estimated that more than above
70% of the watershed area will be treated and consequently the soil loss and runoff from
the area is excepted to be reduced by 70% respectively.
It will help in maintaining ecosystem integrity on sustained basis along with
improving the livelihood security of the farming community.
(9.2) Economic Analysis :
Economic analysis of the project was carried by taking direct benefits and costs
considering 10 years for project life at 10% discount rate. Whole watershed development
plan was divided into three sector as agriculture, horticulture and forest/Fuel wood
plantation. Net Present Value (NPV) and Benefit Cost ratio criteria were applied judge the
economic efficiency of each enterprises and sector. Net present value (NPV) of the project
life is considered to be 10 years and discount rate for NPV estimation is 10% is given
NPV and benefits as follows :-

308
Table – 22 : Present productivity income analysis :
S.
No.
Name of
Sector
Name of
Crops
Produ
cti-
on/ha.
Rate/
Qtl.
Cost of
Production
Expend. of
cultivation
Net
income
B.C. Ratio
between
Col. 8 & 7
1 2 3 4 5 6 7 8 9
A Agriculture Urad 3.00 4300.00 12900.00 6450.00 6450.00 1:1
Moong 3.00 4500.00 13500.00 6075.00 7425.00 1.12:1
Jwar 4.80 600.00 2880.00 1584.00 1296.00 0.82:1
Wheat 18.50 850.00 15725.00 8650.00 7075.00 0.82:1
Pea 7.50 2250.00 16875.00 10970.00 5905.00 0.54:1
Mustard 3.50 1850.00 6475.00 3235.00 3240.00 1:1
Total - 105105.00 54105.00 51000.00 0.94:1
Average - 13138.00 6763.00 6375.00 0.94:1
B Forestry Vilayati
Babool
15000.00 - Nil
C Horticulture Ber 20000.00 - Nil
Aonla 20000.00 - Nil
Bel 20000.00 - Nil
Total - 60000.00 - Nil
Average - 20000.00 - Nil
Grand Total -

309
Table –23 : Post productivity and income analysis for Post Productivity
Value and B.C.:
S.
No.
Name of
Sector
Name of
Crops
Produ
cti-
on/ha.
Rate/
Qtl.
Cost of Production
Expend. of
cultivation
Net
income
B.C. Ratio
between
Col. 8 & 7
1 2 3 4 5 6 7 8 9
A Agriculture Urad 2.50 4500.00 11250.00 5000.00 6250.00 1.25:1
Moong 3.00 5000.00 15000.00 6200.00 8800.00 1.41:1
Jwar 5.00 700.00 3500.00 1650.00 1850.00 1.12:1
Wheat 8.00 1000.00 20000.00 9500.00 10500.00 1.10:1
Pea 4.00 2500.00 20000.00 9250.00 10750.00 1.16:1
Mustard 2000.00 8000.00 3675.00 4325.00 1.17:1
Total - - - 77750.00 35275.00 42475.00 1.20:1
Average - - - 9718.00 4409.00 5309.00 1.20:1
B Forestry Vilayati
Babool
- - -
C Horticulture Ber 22000.00 - Nil
Aonla 22000.00 - Nil
Bel 22000.00 - Nil
Total - 66000.00 - Nil
Average - 22000.00 - Nil
Grand Total - -
Table –24 : Summary of NPV, PPV and B.C. Ratio (Sector wise) :
S.
No.
Name of Sector NPV PPV B.C.
Ratio Expend. Net
Income
Expend. Net
Income
1 2 3 4 5 6 7
1 Rain fed
Agriculture
54105 51000 72485.00 99765.00 1.38:1
2 Forest/Fuel wood
Plantation
15000 - 15000 25000 1.67:1
3 Horticulture 60000 - 60000 122500 2.04:1
Total 129105 51000 147485.00 247265 1.68:1

310
(9.3) Economics of Agriculture Sector :
The development cost can be recovered by the adoption of plan in present rain fed
agriculture is being done on well maintained field, therefore does not require much
investment. In rain fed agriculture, investment of Rs. 44.50 lacs is proposed to made is
given as fallows :
Table – 25 : Economics of Agriculture Sector :
S.
No.
Name of
sector
Name of Activities
/ Plan
Treatble
Area
(Ha.)
NPV
(Lacs)
Post
Productivity
Value (Lacs)
Benifit /
Income
B.C.
Ratio
1 2 3 4 5 6 7 8
1. Rainfed Soil, moisture
and water cons
works
472 269.34 640.87 371.69 1:38:1
(9.4) Economics of forest fuel wood plantation :
Economic analysis of fuel wood plantation in the watershed. Project life is
considered to be 20 years and discount rate for NPV estimation is 10 % is followed and as
is given follows :
Table –26 : Economics of forest fuel wood Plantation :
S.
No.
Name of
sector
Comman Name of
Plant
Area
(Ha.)
NPV
(Lacs)
Post
Productivity
Value (Lacs)
Benifit /
Income
B.C.
Ratio
1 2 3 4 5 6 7 8
1. Forest
Fuel
wood
sector
Vilayati Babool
(Prasopis
Juliflora)
25 2.50 6.675 4.175 1.67:1
(9.5) Economics of Horticulture Sector :
Economic analysis of Horticulture Plantation in agri-horti system and on wasteland
patches of watershed project, life is considered about 15-20 years and discount factor rate
for NPV estimation is 10% is follows :

311
Table – 27 : Economics of Horticulture system :
S.
No.
Name of
Sector
Common name of Plants Area
(Ha.)
NPV
(Lacs)
Post
Productiv
e Value
(Lacs)
Benefit
Lacs
B.C.
Ratio
1 2 3 4 5 6 7 8
1 Horticulture Ber (zyziphus
mouritana)
4.00 0.80 2.104 1.304 1.63:1
Aonla (Embelica
officianalis)
3.80 0.76 2.660 1.90 2.5:1
Bel (Aegle marmelos) 2.20 0.44 1.320 0.88 2:1
Total 10.00 2.00 6.084 4.084 2.04:1
(9.6) Food requirement and sufficiency :
Achieving self sufficiency in food production is one of the prime objectives of
watershed project. The status of food requirement and production before and after the
project is presented as is follows :
Table – 28 : Status of food requirement and availability of per annual :
S.
No.
Name of Foods Requirement
Q./Yr.
Present Status Expected Post Status
Availability
Q./Yr.
Deficit or
surplus
Q./Yr.
Availability
Q./Yr.
Deficit or
surplus
Q./Yr.
1 2 3 4 5 6 7
1 Cereals 110 Kg. 3126 2657 - 469 5314 2188
2 Pulses 36.50 1037 570 - 467 1867 830
3 Oil Seeds 29.20 830 332 - 498 1328 498
4 Vegetable 71 kg 2586 517 - 2069 4655 2069
(9.7) Employment generation :
One of the major problem of the labour migration in watershed project. By the
implementation of the project activities employment opportunities will be generated.
However the changes in land use pattern and adoption of other subsidiary enterprise will
generate employment opportunities in the watershed as given in table follows :

312
Table – 29 : Employment generation under proposed works :
S.
No.
Employment
activities/works
Area
under
work
Cost Mandays generation (Nos.)
Unskilled Skill Total Person
1 2 3 4 5 6 7 8
2 Graded Contour Bund 79 2.37 2370 - 2370 79
3 Gully Plug, C.D. 132 9.90 6930 508 7438 248
4 Submergence Bund 112 4.48 4480 - 4480 149
1 Peripheral Bund 111 3.885 3885 - 3885 129
5 W.H.B. 138 12.420 7452 269 7721 257
6 Renovation of Bund 86 2.58 2580 - 2580 86
7 Reno. of W.H.B. - - - - - -
8 Community Pond - - - - - -
9 Afforestation 25 3.945 789 - 789 26
10 Horticulture 10 2.00 400 - 400 13
Total 28886 777 29663 987
10. Formation of watershed committee :
Under compliance of common guideline Para (6.3) is followed and by the help of
watershed development team, watershed committee is organized in the micro watershed
village Teyore Bujurg with 10 members as prescribed in common guide line. List for
organization of W.C. village details given as follows :
Table – 30 : Details of comprised village W.C. organization in M.W.S. :
S.
No.
Particulars Details Block Geogra-
phical Area
1 2 3 4 5
1 Micro watershed code 3B3E3c3c Pahasu 770
2 Name of Gram Panchayat
in M.W.S.

313
Table – 31 : List of organized W.C. for the Gram Panchyat Pahasu Dehat in watershed.
S.
No.
Name of selected
members
Age Representation
Members from
Post Qualification Village
1 2 3 4 5 6 7
1 Smt. Shikha devi 32 President Pradhan 10 Pahasu Dehat
2 Shri Vinod Kumar 38 Secretary 12 Pahasu Dehat
3 Shri Sunil Kumar 36 S.H.G. 12 Pahasu Dehat
4 Shri Narendra Kumar 36 S.H.G. 10 Pahasu Dehat
5 Smt. Sushma Devi 37 Lady 10 Pahasu Dehat
6 Shri Hubb Lal 50 No field 5 Pahasu Dehat
7 Shri Fateh Singh 45 S.C. 8 Pahasu Dehat 8 Shri Kailash 45 U.G. 5 Pahasu Dehat 9 Shri Madan mohan 55 U.G. 10 Pahasu Dehat
10 Shri Brajkishor 48 U.G. 10 Pahasu Dehat 11 Shri V.P. Singh 52 WDT Agri Engg Pahasu Dehat
(10.1) Formation of Self Help Groups in M.W.S.
By the help of watershed committee and watershed development team self help
group are formatted / organized. Families and persons are selected from poor, small and
marginal farmers families, landless poor families, agriculture labour families, women,
herdsman and shepherd and S.C. families in the formatted self help groups are given as
follow :
Table – 32 : Ganga Ji Self help group – Pahasu Dehat.
S.
No.
Name of member
in formatted
SHG’s
Age From
represented
family
Name of
proposed
activities
Activation
Position
1 2 3 4 5 6
1 Shri Pooran Singh 32 President Buffalo Palan
2 Shri Arvind Kumar 28 Secretary
3 Shri BhoopSingh 50
4 Shri Sanjan Singh 25
5 Shri Somveer 50
6 Shri Santosh Kumar 35
7 Shri Kumwar Pal 40
8 Shri Rajesh Kumar 32
9 Shri Praveen Kumar 28
10 Shri Pradeep Kumar 24

314
Table – 33 : Self help group Teyore Bujurg – Buffaloes.
S.
No.
Name of
member in
formated
SHG’s
Age From
represe-
nted family
Name of
proposed
activities
Activation
Position
1 2 3 4 5 6
1 Shri Rajesh Kumar 30 President Buffalo Palan
2 Shri Narendra Kumar 36 Secretary
3 Shri Ashok Kumar 42
4 Shri Mahesh Chand 37
5 Shri Ravindra Kumar 32
6 Shri Bhupendra Kumar 36
7 Shri Jitendra Kumar 26
8 Devendra Kumar 38
9 Pappu Singh 38
10 Shri Satyaprakash 50
Table – 34 : Self help group in Teyore Bujurg of watershed.
S.
No.
Name of
member in
farmated
SHG’s
Age From
represe-
ntated
family
Name of
proposed
activities
Activation
Position
1 2 3 4 5 6
1 Shri Rohtash 35 SC Pashupalan New
2 Shri Ganda lal 50 SC Pashupalan New
3 Shri Bhikam 45 BC Pashupalan New
4 Shri Himmat Singh 30 BC Pashupalan New
5 Shri Bhagwandas 40 BC Pashupalan New
6 Shri Raj Kumar 40 BC Pashupalan New
7 Shri Rambabu 47 SC Pashupalan New
8 Shri Anvesh 28 SC Pashupalan New
9 Shri Gajraj 45 SC Pashupalan New
10 Shri Mahaveer Singh 55 BC Pashupalan New

315
Formation of User’s Groups :
User’s groups are farmated by the help of watershed committee and watershed
development team in the micro watershed comprised villages. Formers which have land
village are involved in the User’s groups and they will be direct benefited as expected by
the implementation of watershed project easy and convenienced condition are made to
resource use between user’s groups and they will be responsible to operate and
maintenance for the created assets in the watershed. Nos. of farmated user’s groups details
are given as follows :
Table – 35 : Village wise user’s groups
S.
No.
Name of
village
No. of
groups
No. of
farmers
Total
Agri.
Land
Area
under
treat-
ment
Cost of
essets
1 2 3 4 5 6 7
1 Pahasu 41 623 571.50 561.00 -
2 Banel 9 146 135.50 132 -
3
10. Estimation and Costing of Proposed activities of the watershed Project Year 2009-10.
Proposed works / activities for the Project Period (Year 2010-11) under proposed
treatable area 472.00 Ha. Out of total Geographical area 497.00 Ha.

316
(10.1) Financial and Physical Outlets :
Table – 36 : Financial and Physical Outlets for the Year 2009-10 :
Sl.
No.
Components Unit
cost
per
ha.
Physical
ha. Financial (Lacs) Man-days
Generatio
n Labour
Component
Material
Component
Total
1 2 3 4 5 6 7 8
A Management Cost 10%
1 Administrative Cost – TA & DA
Hiring of Vehicles,
Official Expenditure
Electricity & Phone bill
Computer, Stationery and office
consumable materials & contingency
1200 - - 8.316 8.316 -
2 Monitoring 120 - - 0.8316 0.8316 -
3 Evaluation 120 - 0.8316 0.8316 -
Sub Total 1440 - 9.9792 9.9792 -
B Preparatory Phase 10% - - - -
1 Entry Point Activities 4% 480 - 0.6653 2.6611 3.3264 665
2 Institutional & Capacity Building 5% 600 - - 4.158 4.158 -
3 Detailed Project Report 1% 120 - - 0.8316 0.8316 -
Sub Total 1200 - 0.6653 7.6507 8.316 665
C Watershed Work Phase
a Watershed Development Works
1 Graded, Contour & Field Bunds 3000 79 2.37 - 2.37 2370
2 Gully Plug, Earthen Checkdam /WHS 7500 132 6.93 2.97 9.90 7438
3 Submergence bunds 4000 112 4.48 - 4.48 4480
4 Peripheral Bund 3500 111 3.885 - 3.885 3885
5 Earthen Water Harvesting Bund 9000 138 7.452 4.9680 12.420 7721
6 Renovation of existing Bunds 3000 86 2.580 - 2.580 2580
7 Renovation of existing W.H.B - - - - - -
8 Aforestation and Development of silvi
postural system 15780 25 0.789 3.156 3.945 789
9 Dry Land Horticulture 20000 10 0.400 1.60 2.00 400
10 Community Pound (Renovation) - - - - - -
Sub Total 693 28.886 12.694 41.58 29663
B Livelihood Programme (Community Based) 7.620
Income generating activities through SHG’s for landless and marginal formers 10%
1 Live stock development activities 200 - - 1.3863 1.3863 -
2 Bee Keeping 100 - - 0.6927 0.6927 -
3 Poultry Farming 200 - - 1.3863 1.3863 -
4 Nursery Development 300 - - 2.0790 2.0790 -
5 Vegetable Production 100 - - 0.6927 0.6927 -
6 Milk Dairy Promotion Unit 200 - - 1.3863 1.3863 -
7 Establishment of Vermi compost Unit 100 - - 0.6927 0.6927 -
8 Sub Total 1200 - - 8.3160 8.316 -
C Production System and micro Enterprises
1 Crop production, diversification of
agriculture and introduction of agro
forestry
1170 - - 8.1081 8.1081 -
2 Demonstration of improved
composting system 390 - - 2.7027 2.7027 -
Sub Total 1560 - - 10.8108 10.8108 -
D Consolidation Phase 5% Sub Total 600 - - 4.158 4.158 -
Grand Total 12000 693 29.5513 53.6087 83.160 30328

317
ladYi i=
xzke iapk;r & igklw dksM laŒ 2B3E3c3c fodkl [k.M &igklw ftyk & cqyUn’kgj ;g fd vkÃŒM CywŒ,eŒihŒ if j; kstuk esa rS; kj dh x ;h fuek Z .k dh u; h l ` ftr if jlEifRr;k sa dks
x z ke iap k; r igklw ,oa ekbØks okVj’ ksM ds vUrx Zr lfEefyr x z kek sa esa ;k s tuk fØ; kU o;u dj kus ,o a
; kstuk m ijkUr p kyw j[kus rFk k l̀ftr if jlEifRr; k sa ds vuq j{k.k gsrq Ñr ladY i ,oa bP Nq d gSA
igklw x z ke iap k; r ds lHk h l z ksr L Fky tS l s rkykc] xz kelH kk x ksp j ¼p k jkx kg½ ] ty lal k/ku]
tx y v kfn esa Hk wfe f odk l if j; kstuk ds vUrx Z r fd; s tk; sx saA m u dk;k sZ dk s l ekt d s de tk sj ox Z tS ls
vuq l wfp r tkfr@tutkf r] efgyk ox Z ,oa vYi Hkwf eghu x jhch js[ kk ds uhp s ds yk Hk kfFk;k s a dk s ykH k
igq ¡p kus gsrq bPN q d gk sxsA
ge ; kstuk l ap kyu gsrq iz Lrkf or dj rs gS a ,oa lgef r ns rs gS fd Hkk jr l jdk j ds leLr
ekx Z n’ kh Z fl) kUrksa ds vuqi kyu es a dk;Z lEiUu djk;sx sa ;g Hk h ? k ksf"k r djrs gS fd p ; fur {ks= ftldk s
esjs }k jk HkyhHk k ¡f r ns[ kk x ; k gS] vk S j iz L rkf or ; kstu k esa iz L rkfor leLr dk; Z 15 l kyksa l s ugha djk; k
x ; k gS ftldh eq>s iw. kZ :i ls tkudkj h gS vkS j vuqeksnu djrs gSA

318
PROJECT AT A GLANCE
IWMP-II (Bulandshahar)
1 State Uttar Pradesh
2 Distt. Bulandshahar
3 Block Pahasu
4 M.W.S. Code 2B3E3c3b
5 Name of M.W.S. Project N. Lakshamanpur,
6 Involved Village 05
7 Geographical Area of M.W.S. 536
8 Rainfed Area 428.73
9 Treatable Area 482
10 Weightage
11 Cost of Project 57.84
12 For the year
Budget Components
S. No. Components Area
(Ha.)
Cost
(in Lacs)
1 2 3 4
1 Management Cost 12% - 6.9408
2 Preparatory Phase 10% - 5.784
3 Watershed Work Phase - -
A- Watershed Development Works 50% 482 28.92
B- Livelihood Programme (Community Base) 10% - 5.784
C- Production System & Micro Enterprises13% - 7.5192
4 Consolidation Phase 5% - 2.892
Total 482 57.84

319
Executive Summary of the Project
Identified selected micro watershed project Naglia Lakshamanpur is coded as
2B3E3c3b has been proposed from cluster of I.W.M.P. Bulandshahar –II project in Pahasu Block
district Bulandshahar four villages namely Naglia Lakshamanpur, Pahasu, Nagla khushal,
Mahoakhera, Peetampur, is comprised in the micro watershed which is located in the east of
district Bulandshahar on the east bank of River GANGA and border of district Badaun area is
known as Khadar. It lies between 280 -30’ and 28
0-45’ E Latitudes and 78
0 -0’ and 78
0 -15’ N
Longitudes Covering area. Its altitudes ranges from 181 meter to 208 meter above the mean sea
level. Dewai Railway Station 184.11 m, Bulandshahar Railway station is 201.18 m above mean
sea level is displayed. Project area of I.W.M.P. BSR-II is lied in the Pahasu Block of
Bulandshahar District which is come in the western plan zone under semi arid area. The annual
average rainfall is near to 397 mm which an average of 35 rainy days. Out of which about 85% is
received during the mansoon season from July to September and very less rainfall is received in
the winter season.
Temperature ranges from as high as 420C in the May-June to as 3
0-4
0C during December –
January. The Trend of rain fall is highly eratic and maximum water goes as runoff.
Main occupation of the dwellers is agriculture in the watershed. Some part of the lands are
shown during the Kharif season. Cane sugar are preferred crops in the project area. The main
Crops raised are Wheat, Pea & Mustered and maze.
The topmost portion of the watershed is sloppy flat land. Other than topmost portion of the
watershed is under soil erotic portion and depreciative. The soil of the land are sandy loam Soil.
The middle agricultural position of watershed relatively smooth sloppy flat land with sandy loam
soil texture. These soil is yellow in colour and are inherently good in fertility status.
Natural vegetation of the watershed is very poor. Somewhere forest vegetation is seen
which are predominant with Vilayati Babool (Prosopis Juliflora), followed by Babool (Accasia
nilotica), somewhere Neem Plants (Azadirachta Indica), Shisham (Dolbergia Sisson) and Karanj
(Pongamia Glabra) are seen in occasional occurrence. There is no grass land in the watershed.
Somewhere grass patches are seen only on the bunds, road sides and other such places. Coverage
of massive green belt is in poor percentage for environment which is envisaged. That watershed is
very poor climate area.
There is normal condition of animal physics and for their fodder arrangement is the
watershed and creative possibility would be expected by the implementations of the project.

320
Due to Arial soil erosion poor harvesting managements, cropping pattern, non treated
watershed etc. are very anti effective causes for the watershed. Problem of the watershed is to be
tackled by harvesting structures which have last most of their capacity new water bodies for the
prevention of erosion and conservation of soil and moistures various type of earthen bunds in the
watershed field, necessity has been observed. Wasteland will be treated with staggered Trenches,
afforestation and bunding for the changing of characteristics.
The detail project report has been prepared by the applying of nine process steps
for the micro watershed code no. 2B3E3c3b brief is as follows.
STEP-1 Secondary data collection:-During the five days visit programme in the micro
watershed project with of all available documents of village label by approaching the
Gram panchayat collected secondary data.
STEP-2 Village meeting & conducting PRA exercise:-Community meeting conducted on fix
days for the consultation with villagers for the PRA Exercise. Participatory mode of
the villages was positive indicated for the success of programm. With good in testing
participation has been drawn social & resource map on ground & paper & discussed
un various topics of problematic thoughts in the micro watershed.
STEP-3 Socio economic survey:- The resource organization of village label volunteers
identified to conduct house hold socio economic survey/states.
STEP-4 Probel typology analysis:-Thoroughly analyzed the data & identified problem type as
soil & moisture conservation, crop rotation, crop coverage, productivity, livelihoods,
social issues & capacity building gaps etc. Problems discussed with the watershed
committee & came up with alternative solution.
STEP-5 Conduct of net participatory planning (NPP):- The planning team visited together
in the planning blocks on the scheduled date along with the beneficiaries of the
villages & data gathered as for the participatory net planning.
STEP-6 Productivity & livelihood planning exercise:- For the product livelihood exercise,
group discussion on various livelihood as Agriculture, Animal husbandry enterprise
development held discussion with the villagers in the micro watershed.
STEP-7 Institutional & capacity building :- This plan is prepared based on the data
available in the field and auscultations with the watershed committee.
STEP-8 Data consolidation & documentation of DPR :- After gathering all required
information compiled collected data. Thoroughly discussed and finalized the expected
outcomes and benefits specially in the respect of livelihood for different segments.
These are the target and performers indicators for the micro watershed.

321
STEP-9 Conduct of Gram Sabha obtaining approvals submissions of DPR.:-After
preparation of the draft DPR convened to Gram sabha and activities proposed expected
outcomes benefits of implementing the programm are explained in case of any changes
are proposed in the Gram sabha approval obtained by the Gram sabha and already
singed of Mau paper.
STEP-9A Attachment of detail estimate, cost and design:-Estimating, Costing and design
prepared technically According to plan in the micro watershed project. And attached
with the DPR.
STEP-9B Various type of mapping :- DPR prepared in the support of micro watershed
project using various type of maps is as follows :
1.Index Map of Watershed 2. Watershed Map
3. Relief/ Drainage Map 4. Slop Map
5.Soil and Land Capability class map 6. Land use/ Land Cover Map
7. Cadastral map 8. Proposed Action Plan map
9. Social Map

322
Project Report
Table – 1 : Micro watershed project brief : -
1 State U.P.
2 District Bulandshahar
3 Block Pahasu
4 Comprised Villages (Nos.) 05
5 Name of Watershed N. Lakshamanpur
6 Name of MWS Project N. Lakshamanpur
7 MWS Code No. 2B3E3c3b
8 Geographical Area of MWS 536
9 Treatable Area 482
1- Project Objectives :- The aim and objectives of the Project are :
xx- Conservation, development and sustainable management of natural resources including
their users.
yy- Enhancement of agriculture production and productivity in a sustainable manner.
zz- Restoration of ecological balance in the degraded and fragile rain fed ecosystem.
aaa- Reduction in regional disparity between rains fed and irrigated area.
bbb- Creation of sustainable employment opportunities for the rural community for
livelihood security.
ccc- Generation of massive employment.
ddd- Reduce migration from rural employment.
2- Major Problem of Project Area :
qq- Actual shortage of drinking water.
rr- Near to nil activated water bodies and water harvesting structures.
ss- Low depth of ground water table.
tt- Undulated and generally sloppy rainfed area.
uu- Large number of Small, Marginal and S.C. farmer land holding.
vv- Lower wages of agriculture lobour and also migration of lobour due to shortage of
employment in the watershed.
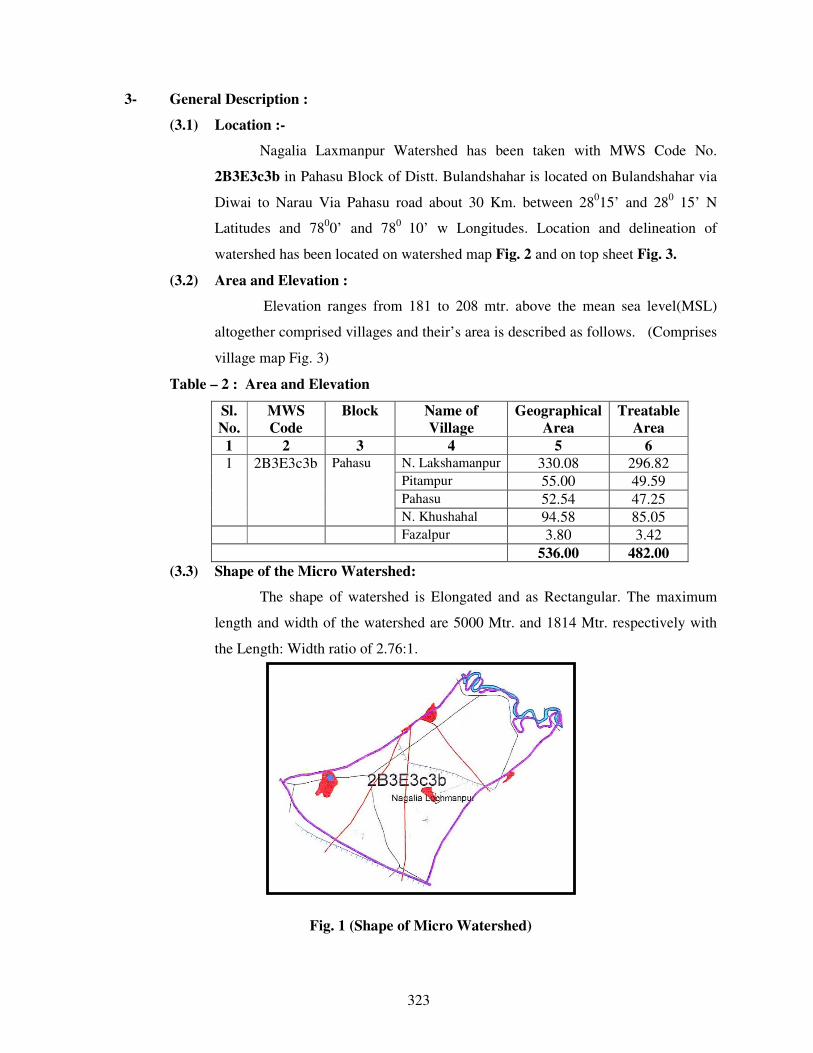
323
3- General Description :
(3.1) Location :-
Nagalia Laxmanpur Watershed has been taken with MWS Code No.
2B3E3c3b in Pahasu Block of Distt. Bulandshahar is located on Bulandshahar via
Diwai to Narau Via Pahasu road about 30 Km. between 28015’ and 28
0 15’ N
Latitudes and 7800’ and 78
0 10’ w Longitudes. Location and delineation of
watershed has been located on watershed map Fig. 2 and on top sheet Fig. 3.
(3.2) Area and Elevation :
Elevation ranges from 181 to 208 mtr. above the mean sea level(MSL)
altogether comprised villages and their’s area is described as follows. (Comprises
village map Fig. 3)
Table – 2 : Area and Elevation
Sl.
No.
MWS
Code
Block Name of
Village
Geographical
Area
Treatable
Area
1 2 3 4 5 6
1 2B3E3c3b Pahasu N. Lakshamanpur 330.08 296.82
Pitampur 55.00 49.59
Pahasu 52.54 47.25
N. Khushahal 94.58 85.05
Fazalpur 3.80 3.42
536.00 482.00
(3.3) Shape of the Micro Watershed:
The shape of watershed is Elongated and as Rectangular. The maximum
length and width of the watershed are 5000 Mtr. and 1814 Mtr. respectively with
the Length: Width ratio of 2.76:1.
Fig. 1 (Shape of Micro Watershed)

324

325

326
(3.4) Climate :
The Watershed falls under ………………. semi arid region of tropical climate
inclined in Western Plan Zone. The average annual precipitation is about approx. is 397
mm. spreading over 35 rainy days. Most of the rain fall (about 85%) is received during
July to September. The rain fall of moderate intensity. Nothing the area receives of
scarcity rainfall in the winter season. The temperator variation ranges from as high as 430c
in the month of May-June to as low as 40c in December-January.
(3.5) Geomorphology and Soils :
Geomorphology :
The entire watershed is topographically divided into major landforms. Accordingly
the soils of watershed can be grouped into various categories such plane land, undulated
land, sloppy land and erosic ravenous land.
Sl.
No.
Name
of
Project
Name of Village Geograph
ical Area
(in ha.)
Raifed
Area
(in ha.)
Treatable
Area
Agri. Land
1 2 3 4 5 6 7
1
Nag
ali
ya
Lak
sham
an
pu
r
N. Lakshamanpur 330.00 264.00 296.82 290.47
2 Pitampur 55.00 44.00 49.59 49.00
3 Pahsu 52.54 42.03 47.25 45.70
4 Nagala Khushal 94.58 75.66 85.05 83.23
Fazalpur 3.80 3.04 3.42 3.42
Total 536.00 428.73 482.00 471.82

327
Soil :
(a) Fine textured soil :
The soil are the most extensive soil group found in the watershed. Some portion of
the watershed is relatively sloppy flat land with fine soil texture as sandy sandy loam. The
soils are in color and are inherently good high in fertility status. Soil texture is sandy lome
loam particularly in depressions and loam in the elevated portion. The soil characteristic
texture is dispersive and smooth. Therefore without impede the downward movement of
water productive layer of soil are easily by high runoff.
a- Coarse Textured Soil :
These soil are lying mostly in downward portion, along with erosic gully and
drainage line upto end of watershed outlet. These soils are coarser in texture and are
relatively poor in fertility status. The soils are lomy sand in texture. Rill and gully
formation in same parts particularly near the outlet of watershed can be seen.
(3.6) Drainage and Slope:
Due to prevalence of mild steep slope and presence of a number of drainage lines
in the watershed the drainage system is adequate. The watershed from part of Ganga Basin
and watershed. Under mild to steep topographical slope of MWS as divided as follow :
(Drainage and slope map fig.-4)
Table - 4 : Drainage and Slope
S. No. Grade Slope Percent Area in Ha. Remark
1 A 0.5-1 144.60 -
2 B 1-2 120.50 -
3 C 2-3 96.40 -
4 D 3-4 72.30 -
5 E 4-5 33.74 -
6 F 5-6 14.46 -

328
Fig-4 (Drainage & Scrub Map)
(3.7) Vegetation :
a- Natural Vegetation :
Natural vegetation is very poor in the watershed. The forest vegetation is
predominant with Vilayti Babool (Prosopis Juliflora). There are occasional occurrence of
Neem Plants (Azadirochta Indica), Shisham (Dalbergia Sissoo) and Karanj (Pangamia
Glabra) and anywhere some scrubs are seen. There are no grass land in the watershed.
Somewhere grass patches are seen only on the bunds, roadside and other such places. Poor
percentage of massive green trees has been not seen in the watershed except Horticulture
backyard.
b- Horticulture :
There is no backyards or commercial horticulture plantation in villages are been in
some part of watershed.
c- Agroforestry :
The agriculture fields of the villages have some horticulture plantation at places
isolated trees whose frequency is seen as under agroforestry and some where in where in
backyards.

329
(3.8) Human Population:
a- Human Population:
Total Population of involved villages in watershed is 8936 with average family
size of six persons as delaled as follows
Table – 5 : Human Population
S.
No.
Name of village Nos. of
families
Human Population Total
Male Female Children
1 N. Lakshamanpur 142 332 298 462 1092
2 Pitampur 57 124 116 159 399
3 Pahasu 352 762 704 977 2443
4 N. Khushahal 138 311 283 414 1008
5 Fazal pur 125 295 264 403 962
Total 814 1824 1665 2415 5904
i- Categorization of Human Population :
In the total population of watershed villages, categories are defined as below :
Table – 6 : Population Categories
S.
No.
Particulars Unit
Number of families in population
in the villages
Population Family Remark
1 2 3 4 5 6
1 Agri Farmer No. 1932 610
2 Landless No. 117 32
3 Agri. Labour No. 242 73
4 Land less Labour No. 71 19
5 BPL Family No. 89 26
6 SC Family No. 205 54
7 ST Family No. - -
814

330
(3.9) Land Holding :
All the categories of farmers as small, marginal, medium and large are involved in
land holding average of about 1-18 ha. Small land holding farmers are further scattered at
different places which makes cultivation very difficult. Distribution of term families
according to the size of the land holdings are given as below :
Table – 7 : Distribution of farm families according to their size of land holdings
S.
No.
Name of Village Total
Agri.
Land in
MWS
Land Holding Family (Nos.) Percentage
Marginal
(< - 1Ha.)
Small
(1–2
Ha.)
Medium
(2-4 Ha.)
Large
(4-7
Ha.)
Total
1 N. Lakshamanpur 290.47 110 55 17 12 194
2 Pitampur 49.00 38 11 5 - 54
3 Pahasu 45.70 32 8 6 - 46
4 N. Khushahal 83.23 44 15 4 2 65
5 Fazalpur 3.42 5 - - - 5
Total 471.82 29 89 32 14 364
(3.10) Live Stock Population :
Total live stock population of the watershed is 2911 Nos. Buffalos is preferred as
mulch animal compared to Cow. But milk yield is poor. Goats are also kept for milk as
well as for meat purpose. The breakup of livestock population is as follows :

331
Table – 8 : Live Stock Position
S.
No.
Name of
Village
Unit Live Stock Position Total
Buffaloes Cows Bullocks Goats
1 N. Lakshamanpur 455 172 65 82 774
2 Pitampur 432 143 57 74 406
3 Pahasu 1103 282 115 205 1705
4 N. Khushahal 514 196 73 92 875
5 Fazalpur 629 207 90 98 1024
Total 3133 1000 400 551 5084
(3.11) Infrastructure Social Feature :
a- Comprised villages in the micro watershed has moderate communication
facilities. Watershed linked with metaled road and approachable through
motarable road.
w- All the villages are electrified and have T.V. and Telephone connection.
x- Literacy rate in the watershed is very low all villages are having education upto
Junior High School.
y- Nearest small market is at Sayana 13 Km. Nearest big market Bulandshahar is
about 55 Km. from watershed. Religious and ritual features are almost common
as in other parts af U.P. small land holding with large family size and more
than 25% of the labour force of the total population living below poverty line
indicate poor socio economic status of the watershed community.

332
Participatory Rural Appraisal
Participatory mode of the villagers shows positive indication for the success of the
programme. Traditionally the entire village community participate in the individual works. Social
map of one of the watershed village drawn by villagers themselves, depicting various village
figures is shown in sketched map in Fig.-4 & 5. Infrastructures position of the village recorded as
follows :
Table – 9 : MW.S. Project – Nagaliya Lakshamanpur.
S.
No.
Infrastructure Unit Qty.
1 2 3 4
1 Primary School No. 3
2 Junior High School No. -
3 Kanya Pathshala No. -
4 Public Health Center No. -
5 Vet nary Hospital No. -
6 Panchayat Ghar No. 1
7 Post Office No. -
8 Agan Bari Center No. -
9 Electricity - Yes
10 Road - Yes
11 Pond No. 3
12 Hand Pump No. 16
13 Irrigation Well No. -
14 Canal No. 1
15 Temple No. 5
16 Well (Drinking Water) No. -
17 Pumping Set No. 48
18 Toilet No. 22
19 Market No. -

333
SOCIAL MAP

334
Recorded importance of development institution
Farmers perception recorded for importance and role of different
development institution in relation to infrastructure. Importance has been depicted with
size of circle and role with distance from village circle. (Fig 8)
Fig. -8 (Venn diagram of Micro watershed)
(3.12) Communication :
Watershed can approached from Distt Headquarter Bulandshahar to Project area
35 km. by Road.
(3.13) Natural Resource Base :
Transact of watershed showed typical land use profile consisting of plain
agriculture land, erosic area and medium ravenous ridge. Main source of the irrigation are
the canal for pre showing irrigation only. The total geographical area of the watershed is
574.00 Ha. classification.
Approach roads for the micro watershed is shown for the communication is shown
on topo sheet map Fig 9 as next page.
N.
LAXMAN
PUR

335
Fig.- 7 Communication Map on Toposheet
Table – 10 : Classification of area(Hect.)
S.N
o.
Name of
Village
Unit Total
Geographical
Area
Rainfed
Area
Wasteland Village
Land
and
Road
Irrigation Resource
Water
Bodies
Borewell
1 2 3 4 5 6 7 8 9
1 N.
Lakshamanpur Ha. 330.08 180 19.80 19.81 - 42.90
2 Pitampur Ha. 55.00 35 3.30 2.70 - 7.15
3 Pahasu Ha. 52.54 30 3.15 3.69 - 6.83
4 N. Khushahal 94.58 62 5.67 5.68 - 12.29
5 Fazal pur 3.80 2 0.22 0.16 0.50
Total 536.00 309 32.14 32.04 69.67

336
(3.14) Livelihood :
Total Population of the watershed is 8936 and out of the total population a majority
more than 80% has farming as their major source of livelihood followed by labours,
serviceman and small business class. Classified livelihood given in form as fallows :
Table – 11 : Livelihood Classification in population :
S.
No.
Name of Village Farmer Labour In Service In Local
small
business
Others
1 2 3 4 5 6 7
1. N. Lakshamanpur 117 22 16 27 7
2. Pitampur 39 12 5 11 6
3. Pahasu 214 38 57 90 9
4. N. Khushahal 115 19 12 23 5
Fazal Pur 94 18 8 19 8
Total 579 109 98 170 35
(3.15) Dependency of forest fuel wood and fodder :
a. Fuel wood :- The main source of fuel is from cow dung cake, woody stem of
crops. About 70% of the climactic energy requirement is met from the agriculture
by product and cow dung cake. Rest is met out from the forest outside the village
and watershed boundary, most preferred fuel wood is Juliflora fuel wood Juliflora
obtained from standing along and between watershed.
i- Fodder :- Villages have not any sufficient signified dependency on forest based
fodder as these resource are nothing availability in the forest.

337
(3.16) Labour requirement :
Labour requirements was found to be maximum at the time of October, November
and December when the sawing of Rabi crops are done. The crucial periods are March and
April coinciding harvesting and threshing of Rabi crops and July/August is sowing Kharif
Crops take a little place. Other income generating enterprises having potential during the
remaining.
(3.17) Crop Rotation :
Present Crop rotation in the watershed comprise of :
Kharif - Bajra - Rare
Maize - Rare
Jwar - Rare
Rabi - Fallow Wheat - Major
Fallow Barly - Major
Fallow Sugarcane - Major
Fallow Mustard - Major
Zayad - Urad, Moong, Makka
The above said Rabi Crops is the most prevailing crop rotation on the agriculture
lands both in the rainfed and irrigated conditions.
Organized vegetable cultivation fruit plantation and traditional agro forestry
systems are lacking as per requirement in the watershed the limited vegetable cultivation
in the watershed is confined as kitchen gardens and field to the irrigated condition in a
scattered manner. The cultivation of cash crops other than the sugarcane, wheat and
mustard also in the watershed.
(3.18) Historical Events :
Chronological record of important events of the watershed village is prepared
through participatory rural appraisal (PRA) which is very useful in understanding of its
background and chronology is given as follows :

338
Table – 12 : Historical Events
S.
No.
Events/Activities Year Rem.
1 2 3 4
1 Established 1750
2 Opening of Primary School 1995
3 Opening of Junior School -
4 Opening of Kanya Pathshala -
5 Opening of PHC -
6 Opening of Vet. Hospital -
7 Panchayat Ghar 2007
8 Introduction of Tractor 1972
9 Gobar Gas Plant -
10 Thresher 1982
11 First Tube well/Pumpset 1970
12 First Motorcycle 1980
13 T.V. & D.V.D. Players 1985
14 Electricity in Village 1988
15 Bituminous Road -
16 First Hand Pump 1992
17 Templo Renovation -
18 First Land Line Telephone -
19 Planning for Watershed Project -
(3.19) Present Land Use in the Watershed :-
The watershed has diversified land uses. The varied present land use under
different use in the watershed. The mixed land use followed in the watershed is almost
similar in other parts of U.P. During P.R.A. Exercise prepared land has been shown in
Table No. 13, 14 & 15.
Table – 13 : (Ownership) S.
No.
Name of Village Pvt. Agri. Land Govt.
Revenu
Land
Forest
Land
Other
Land S.C./S.T. Others
1 2 3 4 5 6 7
1 N. Lakshamanpur 33.00 290.00 - - 7.08
2 Pitampur 6.00 46.50 - - 2.50
3 Pahasu 17.00 33.00 - - 2.54
4 N. Khushahal 14.58 72.00 - - 8.00
5 Fazal Pur - 3.80 - - -

339
Table –14 : (Present Land under different categories)
S.
No.
Name of Village Land Use (Ha.)
Agricultural Wasteland
(All Types)
Seasonal
waterbodies
Village/Raod
Etc.
Total
1 2 3 4 5 6 7
1 N. Lakshamanpur 290.47 19.80 - 19.81 330.08
2 Pitampur 49.00 3.30 - 2.70 55.00
3 Pahasu 45.70 3.15 - 3.69 52.54
4 N. Khushahal 83.23 5.67 - 5.68 94.58
5 Fazal Pur 3.42 0.22 - 0.16 3.80
Total 471.82 32.14 - 32.04 536.00
Table – 15 : (Present land use classified)
Proposed Post Land Use has been given on Page No. 32
4- Focus on Present Land Use :
(4.1) Agriculture :
The total area under agriculture in the watershed is about 487.89 ha. out of which
574.00 ha. is under rainfed agriculture. Agriculture land uses in the watershed extended to
diversified land capabilities starting marginal to good class II land. The irrigated and
drinking water is most scarce natural resource in the watershed. The operation of tube well
for irrigation of agricultural crops frequently leads to the drinking water. Problem to the
farmers of watershed forcing them to carry drinking water from outside of the watershed
area. The agricultural field bund are common in the watersheds however they frequently
breach on heavy rains.
S.
No.
Land Use Under Unit
(ha.)
Area
(Ha.)
Percentage
1 2 3 4 5
1 Under Agriculture
A- Rainfed-
I- Crops 319.126
II- Agro forestry 8.092
B- Irrigated-
I- Assured 32.400
II- Portial 59.270
2 Wasteland
A- Aforestation
B- Pasture
C- Untreatable
D- Treatable 58.134

340
Various mixed texture of soils are located in patches through out the watershed.
The heavy soils are almost kept fallow during rainy season. the agricultural soils also have
some as share calcium pan at variable depths. The irrigation water is conveyed by the
earthen channels. Surface irrigation methods following mainly border method of flood
method by the formers in the watershed. These factors reduce the water use efficiency of
limited and valuable irrigation water.
Drought hardy species like Juliflora suitable multi purpose trees is suitable for
rehabilitation of the wasteland. Rehabilitation of waste lands promoting agro forestry with
appropriate fruit and forest species suitable vegetative barriers on sloppy lands can be high
future value and by these adoption would be meet out many demands of fire wood and
fodder in the wasteland. Except above but also for soil and water conservation,
rehabilitation of wasteland and sustainable income generation for socio-economic
upliftment of farmers.
Crop Productivity :
The farmers also do not have suitable cropping system to deal aberrant weather.
Weeds impose considerable constraint in productivity of both Karif and Rabi crops under
irrigated as well as rainfed production system farmer undertake normally one manual
weeding in mustard and other valuable crops however, practices is energy and time
consuming. Use of we decide is rare in the watershed.
In the watershed area, limited cropping in the Kharif with mixed cropping practices
is not only irrigational but also unscientific and best for low productivity. Subsequent Rabi
crops in general. Sugarcane & Mustard crop in particular are raised on residual soil
moisture under rainfed production system during post mansoon season.
(4.2) Indigenous Technological Knowledge (ITK) :
Under process of PRA tracked out rural applying technology in various field of
local technology and some technology is very popular in village. In which the agriculture
is an old traditional practices of farmers who have improved themselves with passage of
the time according to their domestic needs and technological reforms in the nearby areas.
The villages have their traditional village ponds, practice of field bunding which typically
constitute agricultural related ITKs in the watershed. The Mustard & sugarcane being a
cash and firewood crop of the watershed and also sugarcane crop is being. Cultivated in
self designed manner by the farmers. Its carried out that the area is totally depend on rain

341
and under the rainfed area technology is applied by the farmers. However limited fertilizer
application specifically the DAP came in the practices since about 15-20 years.
(4.3) Forest and Other Vegetation :
Forest :
The watershed have a tract of wasteland area which are under uncultivable position
is liesed in the watershed. These wasteland have not any tree vegetation or very less than
real requirement for the wasteland use.
Horticulture/Agro forestry :
Horticulture and agro forestry practices were observed in the watershed.
(4.4) Agro forestry :
Agro forestry practices are lacking in the watershed. Though it has good potential
under existing disposition and may a role particularly with respect to minimization of
cropping risk, built up soil fertility and productivity, protection of soil erosion, soil
conservation partly meeting out the fire wood demand of rural community and more over
optimizing the economical return from system as whole under typical semi arid climate in
the watershed. Bund and boundary plantation also have good potential to care the fire
wood and fodder demands of the rural community in the watershed. The existing area
under agro forestry is almost negligible. Prosopis Jhliflora may be planted as block or sole
plantation specifically on marginal and degraded land in the watershed.
The agro forestry interventions comprising of ber, bail, aonla, guava, papular etc.
may be applied for benefit of the farmers under rainfed to irrigation production system on
leveled to slopping and marginal agricultural using proper planting techniques and term it
control measures.
The multipurpose trees may be also help in supplementing fire wood and fodder
demands of the rural community in the watershed and my be planted as hedge rows on
rainfed, marginal and degraded lands.
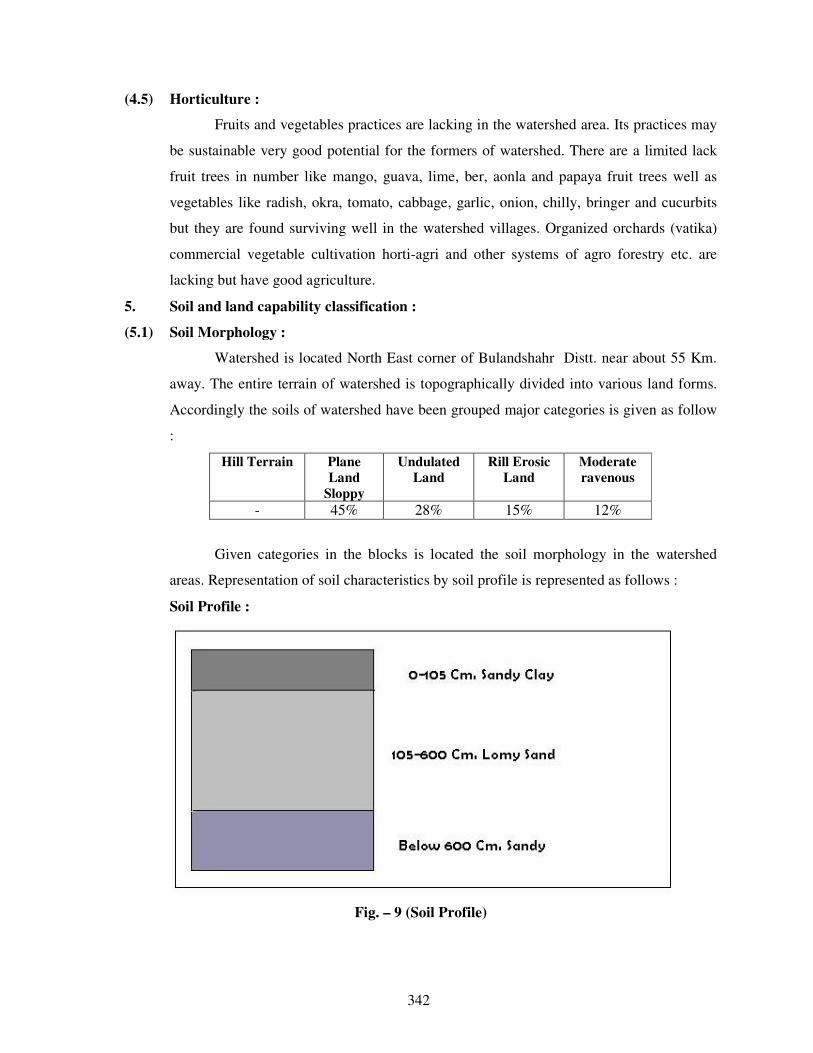
342
(4.5) Horticulture :
Fruits and vegetables practices are lacking in the watershed area. Its practices may
be sustainable very good potential for the formers of watershed. There are a limited lack
fruit trees in number like mango, guava, lime, ber, aonla and papaya fruit trees well as
vegetables like radish, okra, tomato, cabbage, garlic, onion, chilly, bringer and cucurbits
but they are found surviving well in the watershed villages. Organized orchards (vatika)
commercial vegetable cultivation horti-agri and other systems of agro forestry etc. are
lacking but have good agriculture.
5. Soil and land capability classification :
(5.1) Soil Morphology :
Watershed is located North East corner of Bulandshahr Distt. near about 55 Km.
away. The entire terrain of watershed is topographically divided into various land forms.
Accordingly the soils of watershed have been grouped major categories is given as follow
:
Hill Terrain Plane
Land
Sloppy
Undulated
Land
Rill Erosic
Land
Moderate
ravenous
- 45% 28% 15% 12%
Given categories in the blocks is located the soil morphology in the watershed
areas. Representation of soil characteristics by soil profile is represented as follows :
Soil Profile :
Fig. – 9 (Soil Profile)
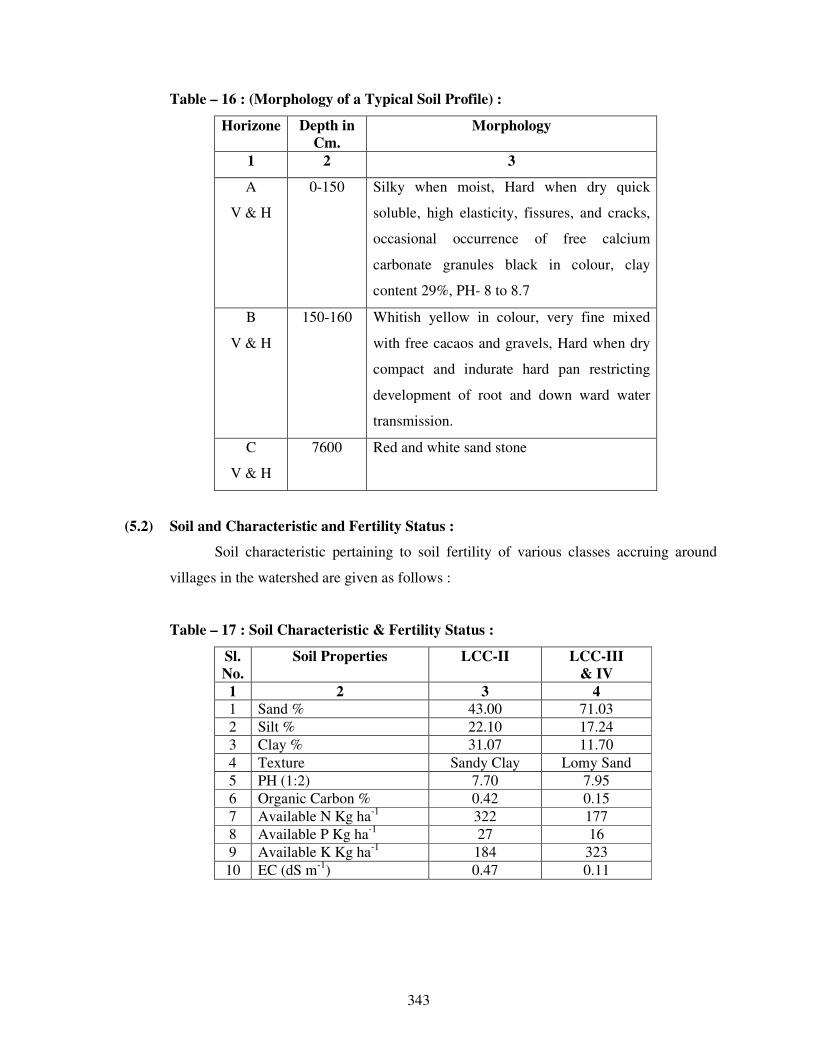
343
Table – 16 : (Morphology of a Typical Soil Profile) :
Horizone Depth in
Cm.
Morphology
1 2 3
A
V & H
0-150 Silky when moist, Hard when dry quick
soluble, high elasticity, fissures, and cracks,
occasional occurrence of free calcium
carbonate granules black in colour, clay
content 29%, PH- 8 to 8.7
B
V & H
150-160 Whitish yellow in colour, very fine mixed
with free cacaos and gravels, Hard when dry
compact and indurate hard pan restricting
development of root and down ward water
transmission.
C
V & H
7600 Red and white sand stone
(5.2) Soil and Characteristic and Fertility Status :
Soil characteristic pertaining to soil fertility of various classes accruing around
villages in the watershed are given as follows :
Table – 17 : Soil Characteristic & Fertility Status :
Sl.
No.
Soil Properties LCC-II LCC-III
& IV
1 2 3 4
1 Sand % 43.00 71.03
2 Silt % 22.10 17.24
3 Clay % 31.07 11.70
4 Texture Sandy Clay Lomy Sand
5 PH (1:2) 7.70 7.95
6 Organic Carbon % 0.42 0.15
7 Available N Kg ha-1
322 177
8 Available P Kg ha-1
27 16
9 Available K Kg ha-1
184 323
10 EC (dS m-1
) 0.47 0.11

344
(5.3) Land Capability Classification (LCC) :
Land capability classification (LCC) was done to classification the soils in
different groups based upon the limitations and to emphasize the hazards prevailing in the
watershed in order to find out the different topo-sequences, landforms, soil depth and
erosion hazards. This was followed by the detailed investigation of selected landforms to
bring out the LCC classes of the Watershed. Classes of land capability namely II, III, IV
and V are demarcated in the watershed. The areas under different classes are sown as
follows :
Table – 18 : Land Capability Classification (LCC) :
S. No. Land capability
class
Area in Ha. Colour
1 2 3 4
1 I Class
2 II Class
3 III Class
4 IV Class
5 V Class
6 VI Class
7 VII Class
8 VIII Class
Land capability classification of various agricultural practices under land use can
be classified as groups, class, sub class and units. Utilization of various land class is given
as follows :
Table – 19 : Utilization of various land uses

345
(5.4) Land Capability Class II & III :
This group is one of the most extensive LCC watershed. and also near to class III
for the agricultural practices. The soils are sandy & sandy loam in texture. The land under
this class is nearly level to mild sloping (1-3%). The soils are deep and erosion hazard is
slight. Most of the productive agriculture land comes under class II & III. These lands
potentially very productive but due to rainfed a single cropping pattern is in habitation.
(5.5) Land Capability Class IV :
This class is found in lower portion near the outlets of watershed. The soils are
coarser in texture, deep, erosion hazard and undulating in topography. Rill and initiation of
gully can be seen near the outlet of the watershed.
(5.6) Land Capability Class VII & VIII :
This class of land is not found in watershed. Somewhere lack of soil are found with
admixture gravels fragments in these classes of lands.
(5.7) Conclusions :
The majority of land form is coming under class II, which give an insight of good
agriculture production potential of the watershed.
The land capability classification provides reasonable good information with
regard to capability of soil, that could be used for agriculture, agrihorticulture, silviculture
and posture development.
The productivity of these lands could be further enhanced by adoption of simple
soil & water conservation measures like bunding practices.
The reasonable area is under watershed of wasteland and other wasteland including
grater potential of this watershed for forestry and pasture development. Rare places
namely water body of low portion of land area under seasonally works as water harvesting
structures and these harvested water is used or can use for some other benificial activities
during the crop season also.
6. Problems and needs of the watershed indentified during the PRA
(6.1) Problem Identification and prioritization :
jj- The are has undulating topography, steep unstable slopes, gradient of excessive
branches of rills and hence highly prone to soil erosion.
kk- Major issues addressed to food sufficiency economic growth and environmental
security in the watershed area.
ll- Effective soil depth is limited and highly variable hampering good crop growth.

346
mm- The watershed have low productive cropping due to tradition single cropping
pattern and over all average crop production percentage not sufficient against
requirement.
nn- Identified that there is no assured irrigation system has been development capacity
of water bodies are reduced due to silt ration which are utilized to store of rainy
water and they are renovatable.
(6.9) Transact walk during the PRA :
Problems identified and prioritized during the transact walk and PRA exercises in
all comprised villages of watershed. There were pooled and a list of problems
representing the whole watershed was prepared. Problems were ranked as per their total
weight age in the watershed village.
Table – 20 : Ranking of Problem identification and prioritization of watershed
S.No. Problem Rank
1 2 3
1 Lack of irrigation 6
2 Lack of drinking water 8
3 Low production of field crops 7
4 Lack of fodder availability and low productivity 5
5 Lack of availability of fuel wood 3
6 Lack of market facility 5
7 Lack of quality seeds, fertilizer, pesticides etc. 5
8. Medical and Health care facilities for milching
animals and low productivity.
7
9 Lack of medical, educational and transportation
facilities
6
10 Lack of water bodies renovation 7
11 Lack of run of earthen check bunds 1
12 Lack of water harvesting structures 1
13 Lack of livelihoods opportunity 1
Prioritized ranking (Upto four Numbers) :-
22- Lack of earthen check bunds.
23- Lack of livelihood opportunities.
24- Lack of irrigation water was the greatest problem. Lack of irrigation water
problem experienced by the people followed by low crop production.

347
(6.3) Analysis of SWOT of the watershed :
Strength (S), Weakness (W), Opportunity (O) and Threat (T) analysis is a
useful decision support tool. A SWOT analysis of watershed is presented as
follows :
SWOT analysis of the watershed
Strengths (S)
lxxi. Cooperative work culture in traditional
activities
lxxii. Close ethic ties
lxxiii. Road at the top as well as outlet of the
watershed
lxxiv. Hard working
lxxv. Resource pool of crop genetics
diversity
lxxvi. Awareness of farmers about watershed
management programme
lxxvii. Well established CPR maintaining and
sharing system
lxxviii. Stall feeding of animals
lxxix. Well maintained seasonal water bodies
lxxx. Social outlook of the community
towards land less
Weakness (W)
lxiv. Poor water management
lxv. Resource poor farmers
lxvi. Out migration of youth
lxvii. Low and erratic rainfall
lxviii. Fragile geology
lxix. Fragmented land holding
lxx. Heavy infestation of wild animals
lxxi. Problem of fuel and fodder
lxxii. Shallow soil depth and with high
percentage of gravel
Opportunities (O)
xliii. Wide range of annual and perennial
crops
xliv. Scope of regular employment
opportunities to check out migration
xlv. Strengthening of existing irrigation system
xlvi. Conducive climate for rainfed crop
diversification
xlvii. Good scope for Agro forestry and dry
land horticulture
xlviii. Potential for collective action and
management of CPR
Threats (T)
xxxvi. Prone to adverse climate like drought
xxxvii. High market risk
xxxviii. Social conflicts owing to PRI and
WSM polices and local politics
xxxix. Weak coordination among line
departments
xl. Lack of expertise of implementing agency in
different aspects of WSM
7. Proposed land use for the watershed :
Watershed management plan preparation due importance is given to topographic,
land suitability, irrigation potentially, prevailing farming systems, micro farming situation,
farming, farmers preferences and priorities along with economic and environment
securities.
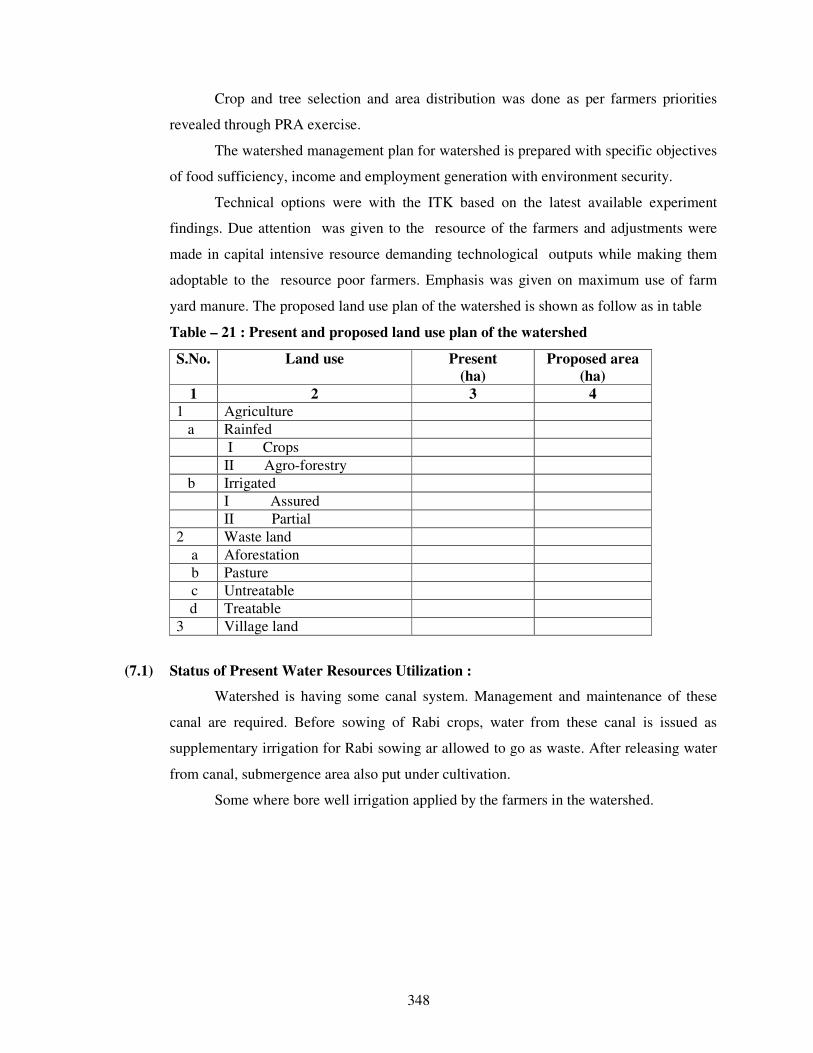
348
Crop and tree selection and area distribution was done as per farmers priorities
revealed through PRA exercise.
The watershed management plan for watershed is prepared with specific objectives
of food sufficiency, income and employment generation with environment security.
Technical options were with the ITK based on the latest available experiment
findings. Due attention was given to the resource of the farmers and adjustments were
made in capital intensive resource demanding technological outputs while making them
adoptable to the resource poor farmers. Emphasis was given on maximum use of farm
yard manure. The proposed land use plan of the watershed is shown as follow as in table
Table – 21 : Present and proposed land use plan of the watershed
S.No. Land use Present
(ha)
Proposed area
(ha)
1 2 3 4
1 Agriculture
a Rainfed
I Crops
II Agro-forestry
b Irrigated
I Assured
II Partial
2 Waste land
a Aforestation
b Pasture
c Untreatable
d Treatable
3 Village land
(7.1) Status of Present Water Resources Utilization :
Watershed is having some canal system. Management and maintenance of these
canal are required. Before sowing of Rabi crops, water from these canal is issued as
supplementary irrigation for Rabi sowing ar allowed to go as waste. After releasing water
from canal, submergence area also put under cultivation.
Some where bore well irrigation applied by the farmers in the watershed.

349
(7.2) Proposed Plan for Irrigation Development :
a- Present system of irrigation and wastage of water during October–November
need to be made more efficient from water management point of view by
minimizing conveyance losses in the existing water courses.
b- Present irrigation canal capacity have to build up by the reform. Which are lack
capacity of water.
c- Construction of new water harvesting earthen structures, Pucca Check Dem, Series
Gully Plugging, etc. has been sloppy portion to increase irrigation potential and for
recharging of ground water, soil and moisture conservation maximum field
irrigation, best production and expected change of crop rotation.
d- The up gradation of the exciting system of irrigation will result in :
i- Minimization of conveyance losses.
ii- Increase in frequency of irrigation.
iii- Adoption of high yielding varieties of crops.
iv- Assured cultivation of cash crops.
v- Capacity buildup by the planning of new water harvesting structures.
(7.3) Ground Water Recharge :
For the purpose of ground water recharge, the area of the upper side of watershed
is recommended for Field Bunds, Contour Bunds, Peripheral Bunds and Submergence
Bunds and in the lower portion Contour Staggered Trenches, Gully Plugs, Earthen Check
Dem and Pacca Outlets. In the undulated sloppy portion of the watershed recommended
water harvesting structure for dual purpose as ground water storage and under ground
water recharge.
(7.4) Crop Production :
Practices proposed in the watershed is given as follows :-
a- Mulching and crop residue management.
b- Application of green manuring.
c- Vermi Composting.
d- Crop rotation and inter cropping.
e- Biofertilizers.

350
(7.5) Tillage Operation :
Deep tillage technology is proposed to apply to be demonstrated for benefit of
farmers in the watershed.
(7.6) Improved Seeds of High Yielding Verities (H.Y.V.) :
Recommendation of improved varieties is necessary for improving the productivity
and farm income. Through replacement of low yielding traditional verities of seeds in
villages of watershed.
(7.7) Balanced Fertilizer Use :-
Demonstration of use of fertilizer in various crops of watershed recommended
balance fertilizer use in different crops will be benefited of forming community.
(7.8) Control of insects and diseases :
Aphid in the mustard are the major insects in the watershed areas leading to loss in
crop productivity. Similarly white blister is also a common disease in the mustard crop.
The management strategies of these insect pest and diseased will also be
demonstrated in the watershed for benefit of the growers.
(7.9) Dry Land Horticulture :
Such portion of dry land in which proposed horticulture development planning
recommended species like Ber, Bel and Aonla will be planted at suitable spacing in the
watershed.
(7.10) Agri Horticulture :
Aonla and Sahjan would be suitable horticultural crops to the locality. Therefore, a
part of land in the farmer field shall be selected and brought under Agri-horticulture
system. The cropping system followed will be Jwar and Wheat.

351
(7.11) Plantation (Fuel wood) :
Such a portion which are under wasteland will be taken falling in the class-IV
category in the watershed. These lands will be planted with species like Vilayati Babool
(Prosopis Juliflora), Babool (Acacia Nilotica), Karanj (Pangamia Glabra).
9. Socio Economic Analysis of the of the Project :
(9.1) Sustainability and environment security :
The proposed land use plan will improve the land utilization index and crop
diversification index significantly as compared to the existing one. in the proposed
watershed management plan proper blending of the bio engineering measures will be
applied on above 80% of the total area of watershed. It is estimated that more than above
70% of the watershed area will be treated and consequently the soil loss and runoff from
the area is excepted to be reduced by 70% respectively.
It will help in maintaining ecosystem integrity on sustained basis along with
improving the livelihood security of the farming community.
(9.2) Economic Analysis :
Economic analysis of the project was carried by taking direct benefits and costs
considering 10 years for project life at 10% discount rate. Whole watershed development
plan was divided into three sector as agriculture, horticulture and forest/Fuel wood
plantation. Net Present Value (NPV) and Benefit Cost ratio criteria were applied judge the
economic efficiency of each enterprises and sector. Net present value (NPV) of the project
life is considered to be 10 years and discount rate for NPV estimation is 10% is given
NPV and benefits as follows :-

352
Table – 22 : Present productivity income analysis :
S.
No.
Name of
Sector
Name of
Crops
Produ
cti-
on/ha.
Rate/
Qtl.
Cost of
Production
Expend. of
cultivation
Net
income
B.C. Ratio
between
Col. 8 & 7
1 2 3 4 5 6 7 8 9
A Agriculture Urad 2.50 4500.00 11250.00 5000.00 6250.00 1.25:1
Moong 3.00 5000.00 15000.00 6200.00 8800.00 1.41:1
Jwar 5.00 700.00 3500.00 1650.00 1850.00 1.12:1
Wheat 20.00 1000.00 20000.00 9500.00 10500.00 1.10:1
Pea 8.00 2500.00 20000.00 9250.00 10750.00 1.16:1
Mustard 4.00 2000.00 8000.00 3675.00 4325.00 1.17:1
Total - 77750.00 35275.00 42475.00 1.20:1
Average - 9718.00 4409.00 5309.00 1.20:1
B Forestry Vilayati
Babool
- - -
C Horticulture Ber 22000.00 - Nil
Aonla 22000.00 - Nil
Bel 22000.00 - Nil
Total - 66000.00 - Nil
Average - 22000.00 - Nil
Grand Total

353
Table –23 : Post productivity and income analysis for Post Productivity
Value and B.C.:
S.
No.
Name of
Sector
Name of
Crops
Produ
cti-
on/ha.
Rate/
Qtl.
Cost of Production
Expend. of
cultivation
Net
income
B.C. Ratio
between
Col. 8 & 7
1 2 3 4 5 6 7 8 9
A Agriculture Urad 4.00 5000.00 20000.00 8325.00 11615.00 1.39:1
Moong 4.00 5000.00 20000.00 8200.00 11800.00 1.44:1
Jwar 5.50 800.00 4400.00 1900.00 2500.00 1.32:1
Wheat 25.00 1000.00 25000.00 11680.00 13320.00 1.14:1
Pea 9.50 3500.00 33250.00 14810.00 18540.00 1.12:1
Mustard 5.00 3000.00 15000.00 4370.00 8130.00 1.86:1
Total - - - 172250.00 72845.00 99765.00 1.38:1
Average - - - 21531.00 9061.00 12471.00 1.38:1
B Forestry Vilayati
Babool
80.00 500.00 40000.00 15000.00 25000.00 1.67:1
C Horticulture Ber 35.00 1500.00 70000.00 20000.00 32500.00 1.63:1
Aonla 35.00 2000.00 70000.00 20000.00 50000.00 2.50:1
Bel 40.00 1500.00 80000.00 20000.00 40000.00 2:1
Total - 182500.00 7000.00 122500.00 2.04:1
Average - 60833.00 20000.00 40833.00 2.04:1
Grand Total - 1394750.00 147485.00 247265.00 1.68:1
Table –24 : Summary of NPV, PPV and B.C. Ratio (Sector wise) :
S.
No.
Name of Sector NPV PPV B.C.
Ratio Expend. Net
Income
Expend. Net
Income
1 2 3 4 5 6 7
1 Rain fed
Agriculture
54105 51000 72485.00 99765.00 1.38:1
2 Forest/Fuel wood
Plantation
15000 - 15000 25000 1.67:1
3 Horticulture 60000 - 60000 122500 2.04:1
Total 129105 51000 147485.00 247265 1.68:1

354
(9.3) Economics of Agriculture Sector :
The development cost can be recovered by the adoption of plan in present rain fed
agriculture is being done on well maintained field, therefore does not require much
investment. In rain fed agriculture, investment of Rs. 44.50 lacs is proposed to made is
given as fallows :
Table – 25 : Economics of Agriculture Sector :
S.
No.
Name of
sector
Name of Activities
/ Plan
Treatble
Area
(Ha.)
NPV
(Lacs)
Post
Productivity
Value (Lacs)
Benifit /
Income
B.C.
Ratio
1 2 3 4 5 6 7 8
1. Rainfed Soil, moisture
and water cons
works
560 29591 921.01 413.08 1:38:1
(9.4) Economics of forest fuel wood plantation :
Economic analysis of fuel wood plantation in the watershed. Project life is
considered to be 20 years and discount rate for NPV estimation is 10 % is followed and as
is given follows :
Table –26 : Economics of forest fuel wood Plantation :
S.
No.
Name of
sector
Comman Name of
Plant
Area
(Ha.)
NPV
(Lacs)
Post
Productivity
Value (Lacs)
Benifit /
Income
B.C.
Ratio
1 2 3 4 5 6 7 8
1. Forest
Fuel
wood
sector
Vilayati Babool
(Prasopis
Juliflora)
25 2.5 6.675 4.675 1.67:1
(9.5) Economics of Horticulture Sector :
Economic analysis of Horticulture Plantation in agri-horti system and on wasteland
patches of watershed project, life is considered about 15-20 years and discount factor rate
for NPV estimation is 10% is follows :

355
Table – 27 : Economics of Horticulture system :
S.
No.
Name of
Sector
Common name of Plants Area
(Ha.)
NPV
(Lacs)
Post
Productiv
e Value
(Lacs)
Benefit
Lacs
B.C.
Ratio
1 2 3 4 5 6 7 8
1 Horticulture Ber (zyziphus
mouritana)
4.00 0.80 2.104 1.304 1.63:1
Aonla (Embelica
officianalis)
3.80 0.76 2.660 1.90 2.5:1
Bel (Aegle marmelos) 2.20 0.44 1.320 0.88 2:1
Total 10.00 2.00 6.084 4.084 2.04:1
(9.6) Food requirement and sufficiency :
Achieving self sufficiency in food production is one of the prime objectives of
watershed project. The status of food requirement and production before and after the
project is presented as is follows :
Table – 28 : Status of food requirement and availability of per annual :
S.
No.
Name of Foods Requirement
Q./Yr.
Present Status Expected Post Status
Availability
Q./Yr.
Deficit or
surplus
Q./Yr.
Availability
Q./Yr.
Deficit or
surplus
Q./Yr.
1 2 3 4 5 6 7
1 Cereals 110 Kg. 6494 5520 -974 11040 4546
2 Pulses 36.50 2155 1185 -970 3879 1724
3 Oil Seeds 29.20 1724 690 -1034 2758 1034
4 Vegetable 71 kg 5373 1075 -4298 4298 1075
(9.7) Employment generation :
One of the major problem of the labour migration in watershed project. By the
implementation of the project activities employment opportunities will be generated.
However the changes in land use pattern and adoption of other subsidiary enterprise will
generate employment opportunities in the watershed as given in table follows :

356
Table – 29 : Employment generation under proposed works :
S.
No.
Employment
activities/works
Area
under
work
Cost Mandays generation (Nos.)
Unskilled Skill Total Person
1 2 3 4 5 6 7 8
2 Graded Contour Bund 54 1.62 1620 - 1620 54
3 Gully Plug, C.D. 89 6.675 4672 156 4828 161
4 Submergence Bund 76 3.040 3040 - 3040 101
1 Peripheral Bund 76 2.660 2660 - 2660 89
5 W.H.B. 94 8.460 5076 287 5363 179
6 Renovation of Bund 58 1.74 1740 - 1740 58
7 Reno. of W.H.B. - - - - - -
8 Community Pond - - - - - -
9 Afforestation 25 2.725 545 - 545 18
10 Horticulture 10 2.00 480 - 400 13
Total 482 28.92 19753 443 20196 673
10. Formation of watershed committee :
Under compliance of common guideline Para (6.3) is followed and by the help of
watershed development team, watershed committee is organized in the micro watershed
village Ranayach Narendrapur with 10 members as prescribed in common guide line. List
for organization of W.C. village details given as follows :
Table – 30 : Details of comprised village W.C. organization in M.W.S. :
S.
No.
Particulars Details Block Geogra-
phical Area
1 2 3 4 5
1 Micro watershed code 3B3E3c3b Pahasu 536
2 Name of Gram Panchayat
in M.W.S.
N.
Lakshamanpur

357
Table – 31 : List of organized W.C. for the Gram Panchyat Nagaliya Lakshamanpur in
watershed.
S.
No.
Name of selected
members
Age Representation
Members from
Post Qualification Village
1 2 3 4 5 6 7
1 Smt. Shanti Devi 70 Secretary Pradhan High School N. Lakshanpur
2 Shri Uma shankar
Sharma
55 Sachiv High School N. Lakshanpur
3 Shri Nepal Singh 32 From – S.H.G. M.A. N. Lakshanpur
4 Shri Rajvir 35 From – S.H.G. Inter N. Lakshanpur
5 Smt. Hemlata 32 Lady High school N. Lakshanpur
6 Shri Ashok Kumar 40 Bhumihin 8 N. Lakshanpur
7 Shri Gabber Singh 25 S.C. High School N. Lakshanpur
8 Shri Ompraksh 40 From U.G. 8 N. Lakshanpur
9 Shri Mahipal 32 From U.G. 5 N. Lakshanpur
10 Shri Narendra
Kumar
40 From U.G. 8 N. Lakshanpur
11 Shri V.P. Singh 52 From – W.D.T. Agri Engineer N. Lakshanpur
(10.1) Formation of Self Help Groups in M.W.S.
By the help of watershed committee and watershed development team self help
group are formatted / organized. Families and persons are selected from poor, small and
marginal farmers families, landless poor families, agriculture labour families, women,
herdsman and shepherd and S.C. families in the formatted self help groups are given as
follow :
Table – 32 : Jay Shri Ram Self help group – Nagaliya Lakshamanpur .
S.
No.
Name of member
in formatted
SHG’s
Age From
represented
family
Name of
proposed
activities
Activation
Position
1 2 3 4 5 6
1 Shri Nepal Singh 32 Secretary Buffalo Palan
2 Shri Ashok Kumar 40 Sachiv
3 Lokesh Kumar 26 Member
4 Hariom 34 Member
5 Prem shankar 35 Member
6 Alok 28 Member
7 Bhurelal 45 Member
8 Ratan Singh 26 Member
9 Himanshu 18 Member
10 Prem shankar 36 Member

358
Table – 33 : Gopal Ji self help group Nagaliya Lakshamanpur (Goat)
S.
No.
Name of
member in
formated
SHG’s
Age From
represe-
nted
family
Name of
proposed
activities
Activation
Position
1 2 3 4 5 6
1 Shri Kishan pal 24 Pal Buffalo Palan New
2 Shri Suresh
chand
35 Pal New
3 Shri Munna Lal 40 Lodhi New
4 Shri Sanjeev
Kumar
25 Lodhi New
5 Shri Ram Prakash 28 Lodhi New
6 Shri Bhisham pal 40 Pal New
7 Shri Resham pal 35 Pal New
8 Shri Om prakash 25 Pal New
9 Shri Pramod
kumar
24 Pal New
10 Shri Rajvir 35 Pal New
Table – 34 : Self help group in Nizampur village of watershed.
S.
No.
Name of
member in
farmated
SHG’s
Age From
represe-
ntated
family
Name of
proposed
activities
Activation
Position
1 2 3 4 5 6
1
2
3
4
5
6
7
8
9
10

359
Formation of User’s Groups :
User’s groups are farmated by the help of watershed committee and watershed
development team in the micro watershed comprised villages. Formers which have land
village are involved in the User’s groups and they will be direct benefited as expected by
the implementation of watershed project easy and convenienced condition are made to
resource use between user’s groups and they will be responsible to operate and
maintenance for the created assets in the watershed. Nos. of farmated user’s groups details
are given as follows :
Table – 35 : Village wise user’s groups
S.
No.
Name of
village
No. of
groups
No. of
farmers
Total
Agri.
Land
Area
under
treat-
ment
Cost of
essets
1 2 3 4 5 6 7
1 N. Lakshamanpur 22 330 290.47 296.82
2 Pitampur 3 55 49.00 49.59
3 Pahasu 3 52 45.70 47.25
4 N. Khushahal 6 94 83.23 85.05
5 Fazal Pur - - 3.42 3.42
10. Estimation and Costing of Proposed activities of the watershed Project Year 2009-10.
Proposed works / activities for the Project Period (Year 2009-10) under proposed
treatable area 635.00 Ha. Out of total Geographical area 906.61 Ha.

360
(10.1) Financial and Physical Outlets :
Table – 36 : Financial and Physical Outlets for the Year 2009-10 :
Sl.
No.
Components Unit
cost
per
ha.
Physical
ha. Financial (Lacs) Man-days
Generatio
n Labour
Component
Material
Component
Total
1 2 3 4 5 6 7 8
A Management Cost 10%
1 Administrative Cost – TA & DA
Hiring of Vehicles,
Official Expenditure
Electricity & Phone bill
Computer, Stationery and office
consumable materials & contingency
1200 - - 5.7840 5.784 -
2 Monitoring 120 - - 0.5784 0.5784
3 Evaluation 120 - 0.5784 0.5784
Sub Total 1440 - 6.9408 6.9408
B Preparatory Phase 10% - -
1 Entry Point Activities 4% 480 - 0.4627 1.8509 2.3136 463
2 Institutional & Capacity Building 5% 600 - - 2.8920 2.892
3 Detailed Project Report 1% 120 - - 0.5784 0.5784
Sub Total 1200 - 0.4627 5.3213 5.784 463
C Watershed Work Phase
a Watershed Development Works
1 Graded, Contour & Field Bunds 3000 54 1.62 - 1.62 1620
2 Gully Plug, Earthen Checkdam /WHS 7500 89 4.6725 2.0025 6.675 4828
3 Submergence bunds 4000 76 3.0400 - 3.04 3040
4 Peripheral Bund 3500 76 2.6600 - 2.66 2660
5 Earthen Water Harvesting Bund 9000 94 5.0760 3.384 8.46 5363
6 Renovation of existing Bunds 3000 58 1.740 - 1.74 1740
7 Renovation of existing W.H.B - - - - - -
8 Aforestation and Development of silvi
postural system 10900 25 0.545 2.180 2.725 545
9 Dry Land Horticulture 20000 10 0.400 1.600 2.00 400
10 Community Pound (Renovation) - - - -
Sub Total 482 19.7535 9.1665 28.92 20196
B Livelihood Programme (Community Based) 7.620
Income generating activities through SHG’s for landless and marginal formers 10%
1 Live stock development activities 200 - - 0.9642 0.9642 -
2 Bee Keeping 100 - - 0.4818 0.4818 -
3 Poultry Farming 200 - - 0.9642 0.9642 -
4 Nursery Development 300 - - 1.446 1.446 -
5 Vegetable Production 100 - - 0.4818 0.4818 -
6 Milk Dairy Promotion Unit 200 - - 0.9642 0.9642 -
7 Establishment of Vermi compost Unit 100 - - 0.4818 0.4818 -
8 Sub Total 1200 - - 5.784 5.784 -
C Production System and micro Enterprises
1 Crop production, diversification of
agriculture and introduction of agro
forestry
1170 - - 5.6394 5.6394 -
2 Demonstration of improved
composting system 390 - - 1.8798 1.8798 -
Sub Total 1560 - - 7.5192 7.5192 -
D Consolidation Phase 5% Sub Total 600 - - 2.892 2.892 -
Grand Total 12000 482 20.2162 37.6238 57.840

361
ladYi i=
xzke iapk;r & uxfy;k y{euiqj dksM laŒ 2B3E3c3b fodkl [k.M &igklw ftyk & cqyUn’kgj ;g fd vkÃŒM CywŒ,eŒihŒ if j; k stuk esa rS; kj dh x ;h fuek Z .k dh u; h l ` ftr if jlEifRr;k sa dks
x z ke iap k; r uxfy;k y{euiqj,oa ekbØks okVj’ ksM ds vUrx Z r lfEefyr xz kek sa esa ;k st uk fØ;kUo;u
djkus ,oa ; k stuk m ijkUr p kyw j[ kus rFk k l ` ftr if jlE ifRr;k sa ds vuq j{k. k gs rq Ñr l adY i ,oa bPN q d
gSA
uxfy;k y{euiqj x z ke iap k; r ds lH kh lz ksr L Fky tS l s rkykc] x z kelHkk x k spj ¼p kj kx kg½ ] ty
l al k/ku] tx y vkfn esa Hkwfe f odk l if j; kstuk ds vUrx Z r fd; s tk; sxsaA m u dk;k sZ dks lekt ds detk sj
ox Z tSl s vuq l wfp r tkfr@tutkf r] efgy k ox Z ,oa vY i Hkwfeghu x j hch js[ k k ds uhp s ds ykHkkfFk;k sa dks
ykH k igq ¡p kus gsrq bP Nq d gksx sA
ge ; kstuk l ap kyu gsrq iz Lrkf or dj rs gS a ,oa lgef r ns rs gS fd Hkk jr l jdk j ds leLr
ekx Z n’ kh Z fl) kUrksa ds vuqi kyu es a dk;Z lEiUu djk;sx sa ;g Hk h ? k ksf"k r djrs gS fd p ; fur {ks= ftldk s
esjs }k jk HkyhHk k ¡fr ns[ kk x ; k gS] vk S j iz L rkf or ; kstu k esa iz L rkfor leLr dk; Z 15 l kyksa l s ugha djk;k
x ; k gS ftldh eq>s iw. kZ :i ls tkudkj h gS vkS j vuqeksnu djrs gSA

362
PROJECT AT A GLANCE
IWMP-II (Bulandshahar)
1 State Uttar Pradesh
2 Distt. Bulandshahar
3 Block Pahasu
4 M.W.S. Code 2B3E3c2e
5 Name of M.W.S. Project Bedrampur
6 Involved Village 05
7 Geographical Area of M.W.S. 762.00 Ha
8 Rainfed Area
9 Treatable Area 686.00
10 Weightage
11 Cost of Project 686.00
12 For the year 2011-12
Budget Components
S. No. Components Area
(Ha.)
Cost
(in Lacs)
1 2 3 4
1 Management Cost 12% - 9.8784
2 Preparatory Phase 10% - 8.2320
3 Watershed Work Phase -
A- Watershed Development Works 50% 41.1600
B- Livelihood Programme (Community Base) 10% - 8.2320
C- Production System & Micro Enterprises13% - 10.7016
4 Consolidation Phase 5% - 4.116
Total 82.320

363
Executive Summary of the Project
Identified selected micro watershed project Vedrampur is coded as 2B3E3c2e has
been proposed from cluster of I.W.M.P. Bulandshahar – I project in Pahasu Block district
Bulandshahar four villages namely Gangagarh, Kamauna, Rasalgarh, Rishalu, and Bedrampur is
comprised in the micro watershed which is located in the east of district Bulandshahar on the east
bank of River GANGA and border of district Badaun area is known as Khadar. It lies between 280
-15’ S and 280-10’ N Latitudes and 78
0 -0’ E and 78
0 -10’ W Longitudes Covering area. Its
altitudes ranges from 187 meter to 190 meter above the mean sea level. Khurja Railway Station
201.18 m, Khurja Jh. Railway station is 201.46 m above mean sea level is displayed. Project area
of I.W.M.P. BSR-III is lied in the Pahasu Block of Bulandshahar District which is come in the
western plan zone under semi arid area. The annual average rainfall is near to 397 mm which an
average of 35 rainy days. Out of which about 85% is received during the mansoon season from
July to September and very less rainfall is received in the winter season.
Temperature ranges from as high as 430C in the May-June to as 3
0-4
0C during December –
January. The Trend of rain fall is highly eratic and maximum water goes as runoff.
Main occupation of the dwellers is agriculture in the watershed. Some part of the lands are
shown during the Kharif season. Cane sugar are preferred crops in the project area. The main
Crops raised are Wheat, Pea & Mustered and maze.
The topmost portion of the watershed is sloppy flat land. Other than topmost portion of the
watershed is under soil erotic portion and depreciative. The soil of the land are sandy loam Soil.
The middle agricultural position of watershed relatively smooth sloppy flat land with sandy loam
soil texture. These soil is yellow in colour and are inherently good in fertility status.
Natural vegetation of the watershed is very poor. Somewhere forest vegetation is seen
which are predominant with Vilayati Babool (Prosopis Juliflora), followed by Babool (Accasia
nilotica), somewhere Neem Plants (Azadirachta Indica), Shisham (Dolbergia Sisson) and Karanj
(Pongamia Glabra) are seen in occasional occurrence. There is no grass land in the watershed.
Somewhere grass patches are seen only on the bunds, road sides and other such places. Coverage
of massive green belt is in poor percentage for environment which is envisaged. That watershed is
very poor climate area.
There is normal condition of animal physics and for their fodder arrangement is the
watershed and creative possibility would be expected by the implementations of the project.

364
Due to Arial soil erosion poor harvesting managements, cropping pattern, non treated
watershed etc. are very anti effective causes for the watershed. Problem of the watershed is to be
tackled by harvesting structures which have last most of their capacity new water bodies for the
prevention of erosion and conservation of soil and moistures various type of earthen bunds in the
watershed field, necessity has been observed. Wasteland will be treated with staggered Trenches,
afforestation and bunding for the changing of characteristics.
The detail project report has been prepared by the applying of nine process steps
for the micro watershed code no. 2B3E3c2e brief is as follows.
STEP-1 Secondary data collection:-During the five days visit programme in the micro
watershed project with of all available documents of village label by approaching the
Gram panchayat collected secondary data.
STEP-2 Village meeting & conducting PRA exercise:-Community meeting conducted on fix
days for the consultation with villagers for the PRA Exercise. Participatory mode of
the villages was positive indicated for the success of programm. With good in testing
participation has been drawn social & resource map on ground & paper & discussed
un various topics of problematic thoughts in the micro watershed.
STEP-3 Socio economic survey:- The resource organization of village label volunteers
identified to conduct house hold socio economic survey/states.
STEP-4 Probel typology analysis:-Thoroughly analyzed the data & identified problem type as
soil & moisture conservation, crop rotation, crop coverage, productivity, livelihoods,
social issues & capacity building gaps etc. Problems discussed with the watershed
committee & came up with alternative solution.
STEP-5 Conduct of net participatory planning (NPP):- The planning team visited together
in the planning blocks on the scheduled date along with the beneficiaries of the
villages & data gathered as for the participatory net planning.
STEP-6 Productivity & livelihood planning exercise:- For the product livelihood exercise,
group discussion on various livelihood as Agriculture, Animal husbandry enterprise
development held discussion with the villagers in the micro watershed.
STEP-7 Institutional & capacity building :- This plan is prepared based on the data
available in the field and auscultations with the watershed committee.
STEP-8 Data consolidation & documentation of DPR :- After gathering all required
information compiled collected data. Thoroughly discussed and finalized the expected
outcomes and benefits specially in the respect of livelihood for different segments.
These are the target and performers indicators for the micro watershed.

365
STEP-9 Conduct of Gram Sabha obtaining approvals submissions of DPR.:-After
preparation of the draft DPR convened to Gram sabha and activities proposed expected
outcomes benefits of implementing the programm are explained in case of any changes
are proposed in the Gram sabha approval obtained by the Gram sabha and already
singed of Mau paper.
STEP-9A Attachment of detail estimate, cost and design:-Estimating, Costing and design
prepared technically According to plan in the micro watershed project. And attached
with the DPR.
STEP-9B Various type of mapping :- DPR prepared in the support of micro watershed
project using various type of maps is as follows :
1.Index Map of Watershed 2. Watershed Map
3. Relief/ Drainage Map 4. Slop Map
5.Soil and Land Capability class map 6. Land use/ Land Cover Map
7. Cadastral map 8. Proposed Action Plan map
9. Social Map

366
Project Report
Table – 1 : Micro watershed project brief : -
1 State U.P.
2 District Bulandshahar
3 Block Pahasu
4 Comprised Villages (Nos.) 05
5 Name of Watershed Bedrampur
6 Name of MWS Project Bedrampur
7 MWS Code No. 2B3E43c2e
8 Geographical Area of MWS 762.00
9 Treatable Area 686.00
1- Project Objectives :- The aim and objectives of the Project are :
eee- Conservation, development and sustainable management of natural resources
including their users.
fff- Enhancement of agriculture production and productivity in a sustainable manner.
ggg- Restoration of ecological balance in the degraded and fragile rain fed ecosystem.
hhh- Reduction in regional disparity between rains fed and irrigated area.
iii- Creation of sustainable employment opportunities for the rural community for
livelihood security.
jjj- Generation of massive employment.
kkk- Reduce migration from rural employment.
2- Major Problem of Project Area :
ww- Actual shortage of drinking water.
xx- Near to nil activated water bodies and water harvesting structures.
yy- Low depth of ground water table.
zz- Undulated and generally sloppy rainfed area.
aaa- Large number of Small, Marginal and S.C. farmer land holding.
bbb- Lower wages of agriculture lobour and also migration of lobour due to shortage of
employment in the watershed.

367
3- General Description :
(3.1) Location :-
Nagalia Laxmanpur Watershed has been taken with MWS Code No.
2B3E3c2e in Pahasu Block of Distt. Bulandshahar is located on Bulandshahar via
Khurja to Utravali Via Pahasu road about 57 Km. between 28015’ and 28
015’ N
Latitudes and 7800’ and 78
05’ N Longitudes. Location and delineation of
watershed has been located on watershed map Fig. 2 and on top sheet Fig. 3.
(3.2) Area and Elevation :
Elevation ranges from 187 to 190 mtr. above the mean sea level(MSL)
altogether comprised villages and their’s area is described as follows. (Comprises
village map Fig. 3)
Table – 2 : Area and Elevation
Sl.
No.
MWS
Code
Block Name of
Village
Geographical
Area
Treatable
Area
1 2 3 4 5 6
1 2B3E3c2e Pahasu Kamona 73.20 65.88
Rishalu 178.22 160.39
Bedrampur 259.60 233.64
Gangagarh 240.00 216.21
Rasoolgarh 10.98 9.88
Total 762.00 686.00
(3.3) Shape of the Micro Watershed:
The shape of watershed is Elongated and as Rectangular. The maximum
length and width of the watershed are 5000 Mtr. and 1814 Mtr. respectively with
the Length: Width ratio of 2.76:1.
Fig. 1 (Shape of Micro Watershed)

368

369

370
(3.4) Climate :
The Watershed falls under ………………. semi arid region of tropical climate
inclined in Western Plan Zone. The average annual precipitation is about approx. is 397
mm. spreading over 35 rainy days. Most of the rain fall (about 85%) is received during
July to September. The rain fall of moderate intensity. Nothing the area receives of
scarcity rainfall in the winter season. The temperator variation ranges from as high as 430c
in the month of May-June to as low as 40c in December-January.
(3.5) Geomorphology and Soils :
Geomorphology :
The entire watershed is topographically divided into major landforms. Accordingly
the soils of watershed can be grouped into various categories such plane land, undulated
land, sloppy land and erosic ravenous land.
Sl.
No.
Name
of
Project
Name of Village Geograph
ical Area
(in ha.)
Raifed
Area
(in ha.)
Treatable
Area
Agri. Land
1 2 3 4 5 6 7
1 B
edra
mp
ur
Rishalu 178.22 120 160.39 162.18
2 Bedrampur 259.60 201 233.64 238.83
3 Gangagarh 240.00 155 216.21 216.00
4 Kamona 73.20 42 65.88 62.22
Rasoolgarh 10.98 3 9.88 9.77
Total 762.00 521 686.00 689.00

371
Soil :
(a) Fine textured soil :
The soil are the most extensive soil group found in the watershed. Some portion of
the watershed is relatively sloppy flat land with fine soil texture as sandy sandy loam. The
soils are in color and are inherently good high in fertility status. Soil texture is sandy lome
loam particularly in depressions and loam in the elevated portion. The soil characteristic
texture is dispersive and smooth. Therefore without impede the downward movement of
water productive layer of soil are easily by high runoff.
a- Coarse Textured Soil :
These soil are lying mostly in downward portion, along with erosic gully and
drainage line upto end of watershed outlet. These soils are coarser in texture and are
relatively poor in fertility status. The soils are lomy sand in texture. Rill and gully
formation in same parts particularly near the outlet of watershed can be seen.
(3.6) Drainage and Slope:
Due to prevalence of mild steep slope and presence of a number of drainage lines
in the watershed the drainage system is adequate. The watershed from part of Ganga Basin
and watershed. Under mild to steep topographical slope of MWS as divided as follow :
(Drainage and slope map fig.-4)
Table - 4 : Drainage and Slope
S. No. Grade Slope Percent Area in Ha. Remark
1 A 0.5-1 205.80 -
2 B 1-2 171.50 -
3 C 2-3 137.20 -
4 D 3-4 102.90 -
5 E 4-5 48.02 -
6 F 5-6 20.58 -

372
Fig-4 (Drainage & Scrub Map)
(3.7) Vegetation :
a- Natural Vegetation :
Natural vegetation is very poor in the watershed. The forest vegetation is
predominant with Vilayti Babool (Prosopis Juliflora). There are occasional occurrence of
Neem Plants (Azadirochta Indica), Shisham (Dalbergia Sissoo) and Karanj (Pangamia
Glabra) and anywhere some scrubs are seen. There are no grass land in the watershed.
Somewhere grass patches are seen only on the bunds, roadside and other such places. Poor
percentage of massive green trees has been not seen in the watershed except Horticulture
backyard.
b- Horticulture :
There is no backyards or commercial horticulture plantation in villages are been in
some part of watershed.
c- Agroforestry :
The agriculture fields of the villages have some horticulture plantation at places
isolated trees whose frequency is seen as under agroforestry and some where in where in
backyards.
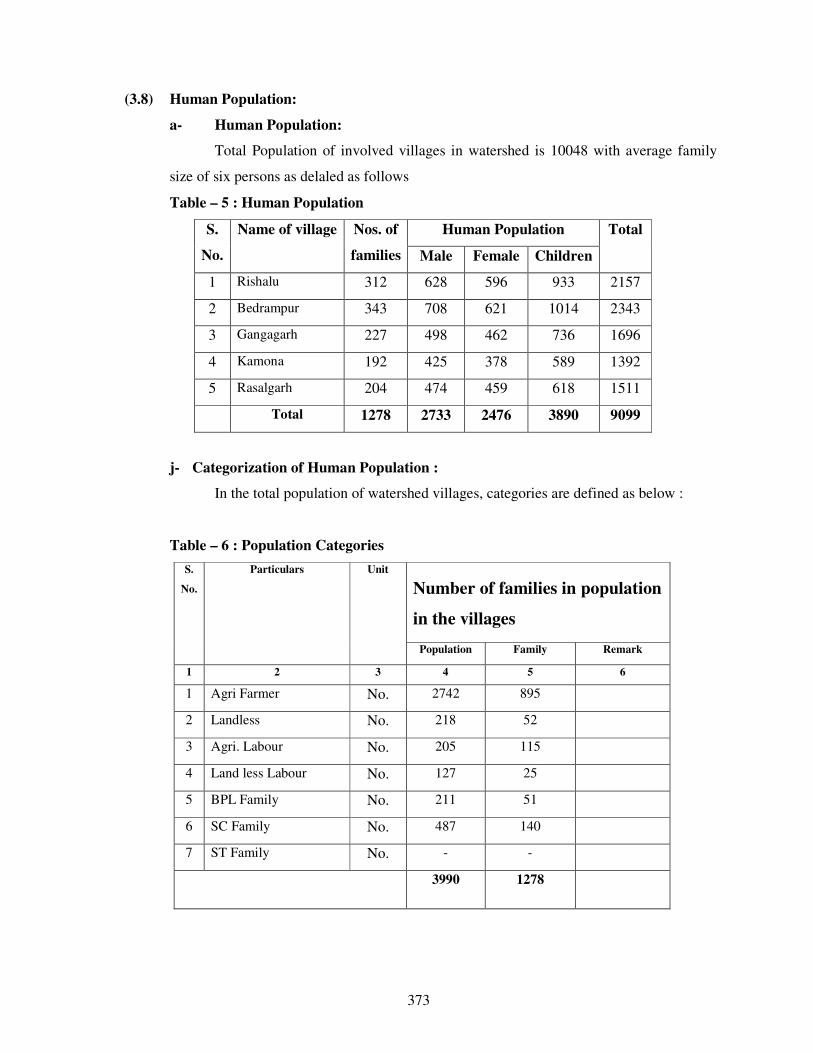
373
(3.8) Human Population:
a- Human Population:
Total Population of involved villages in watershed is 10048 with average family
size of six persons as delaled as follows
Table – 5 : Human Population
S.
No.
Name of village Nos. of
families
Human Population Total
Male Female Children
1 Rishalu 312 628 596 933 2157
2 Bedrampur 343 708 621 1014 2343
3 Gangagarh 227 498 462 736 1696
4 Kamona 192 425 378 589 1392
5 Rasalgarh 204 474 459 618 1511
Total 1278 2733 2476 3890 9099
j- Categorization of Human Population :
In the total population of watershed villages, categories are defined as below :
Table – 6 : Population Categories
S.
No.
Particulars Unit
Number of families in population
in the villages
Population Family Remark
1 2 3 4 5 6
1 Agri Farmer No. 2742 895
2 Landless No. 218 52
3 Agri. Labour No. 205 115
4 Land less Labour No. 127 25
5 BPL Family No. 211 51
6 SC Family No. 487 140
7 ST Family No. - -
3990 1278

374
(3.9) Land Holding :
All the categories of farmers as small, marginal, medium and large are involved in
land holding average of about 1-18 ha. Small land holding farmers are further scattered at
different places which makes cultivation very difficult. Distribution of term families
according to the size of the land holdings are given as below :
Table – 7 : Distribution of farm families according to their size of land holdings
S.
No.
Name of Village Total
Agri.
Land in
MWS
Land Holding Family (Nos.) Percentage
Marginal
(< - 1Ha.)
Small
(1–2
Ha.)
Medium
(2-4 Ha.)
Large
(4-7
Ha.)
Total
1 Rishalu 162.18 76 30 8 5 119
2 Bedrampur 238.83 122 42 15 11 190
3 Gangagarh 216.00 108 48 13 9 178
4 Kamona 62.22 55 11 4 2 72
5 Rasalgarh 9.77 8 4 - - 12
689.00 369 135 40 27 571
(3.10) Live Stock Population :
Total live stock population of the watershed is 7016. Buffalos is preferred as mulch
animal compared to Cow. But milk yield is poor. Goats are also kept for milk as well as
for meat purpose. The breakup of livestock population is as follows :

375
Table – 8 : Live Stock Position
S.
No.
Name of
Village
Unit Live Stock Position Total
Buffaloes Cows Bullocks Goats
1 Rishalu 1387 301 95 85 1868
2 Bedrampur 1021 291 84 64 1460
3 Gangagarh 954 234 52 43 1283
4 Kamona 1087 309 77 72 1545
5 Rasalgarh 972 263 66 58 1359
Total 5421 1398 374 322 7515
(3.11) Infrastructure Social Feature :
a- Comprised villages in the micro watershed has moderate communication
facilities. Watershed linked with metaled road and approachable through
motarable road.
z- All the villages are electrified and have T.V. and Telephone connection.
aa- Literacy rate in the watershed is very low all villages are having education upto
Junior High School.
bb- Nearest small market is at Pahasu 13 Km. Nearest big market Bulandshahar is
about 60 Km. from watershed. Religious and ritual features are almost common
as in other parts af U.P. small land holding with large family size and more
than 25% of the labour force of the total population living below poverty line
indicate poor socio economic status of the watershed community.

376
Participatory Rural Appraisal
Participatory mode of the villagers shows positive indication for the success of the
programme. Traditionally the entire village community participate in the individual works. Social
map of one of the watershed village drawn by villagers themselves, depicting various village
figures is shown in sketched map in Fig.-4 & 5. Infrastructures position of the village recorded as
follows :
Table – 9 : MW.S. Project – Teyore Bujurg.
S.
No.
Infrastructure Unit Qty.
1 2 3 4
1 Primary School No. 3
2 Junior High School No. 2
3 Kanya Pathshala No. -
4 Public Health Center No. -
5 Vet nary Hospital No. -
6 Panchayat Ghar No. 2
7 Post Office No. -
8 Agan Bari Center No. 5
9 Electricity - Yes
10 Road - Yes
11 Pond No. 2
12 Hand Pump No. 42
13 Irrigation Well No. -
14 Canal No. 1
15 Temple No. 4
16 Well (Drinking Water) No. 2
17 Pumping Set No. 37
18 Toilet No. 18
19 Market No. -

377
SOCIAL MAP

378
Recorded importance of development institution
Farmers perception recorded for importance and role of different
development institution in relation to infrastructure. Importance has been depicted with
size of circle and role with distance from village circle. (Fig 8)
Fig. -8 (Venn diagram of Micro watershed)
(3.12) Communication :
Watershed can approached from Distt Headquarter Bulandshahar to Project area
57 km. by Road.
(3.13) Natural Resource Base :
Transact of watershed showed typical land use profile consisting of plain
agriculture land, erosic area and medium ravenous ridge. Main source of the irrigation are
the canal for pre showing irrigation only. The total geographical area of the watershed is
472.00 Ha. classification.
Approach roads for the micro watershed is shown for the communication is shown
on topo sheet map Fig 9 as next page.
BEDRAMPUR

379
Fig.- 7 Communication Map on Toposheet
Table – 10 : Classification of area(Hect.)
S.No
.
Name of
Village
Unit Total
Geographical
Area
Rainfed
Area
Wastela
nd
Village
Land
and
Road
Irrigation Resource
Water
Bodies
Borewell
1 2 3 4 5 6 7 8 9
1 Rishalu Ha. 178.22 120 8.90 12.48 - 48.20
2 Bedrampur Ha. 259.60 201 15.57 18.18 - 41.25
3 Gangagarh Ha. 240.00 155 12.00 14.40 - 72.12
4 Kamona Ha. 73.20 42 4.03 3.70 - 28.20
5 Rasalgarh Ha. 10.98 3 - 1.00 - 800.00
Total 762 521 40.50 49.33 - 197.77

380
(3.14) Livelihood :
Total Population of the watershed is 8936 and out of the total population a majority
more than 80% has farming as their major source of livelihood followed by labours,
serviceman and small business class. Classified livelihood given in form as fallows :
Table – 11 : Livelihood Classification in population :
S.
No.
Name of Village Farmer Labour In
Service
In Local small
business
Others
1 2 3 4 5 6 7
1. Rishalu 194 38 33 28 12
2. Bedrampur 216 42 36 24 8
3. Gangagarh 143 32 29 30 9
4. Kamona 92 21 18 14 7
Rasalgarh 128 30 22 12 5
Total 773 201 138 94 41
(3.15) Dependency of forest fuel wood and fodder :
a. Fuel wood :- The main source of fuel is from cow dung cake, woody stem of
crops. About 70% of the climactic energy requirement is met from the agriculture
by product and cow dung cake. Rest is met out from the forest outside the village
and watershed boundary, most preferred fuel wood is Juliflora fuel wood Juliflora
obtained from standing along and between watershed.
j- Fodder :- Villages have not any sufficient signified dependency on forest based
fodder as these resource are nothing availability in the forest.

381
(3.16) Labour requirement :
Labour requirements was found to be maximum at the time of October, November
and December when the sawing of Rabi crops are done. The crucial periods are March and
April coinciding harvesting and threshing of Rabi crops and July/August is sowing Kharif
Crops take a little place. Other income generating enterprises having potential during the
remaining.
(3.17) Crop Rotation :
Present Crop rotation in the watershed comprise of :
Kharif - Bajra - Rare
Maize - Rare
Jwar - Rare
Rabi - Fallow Wheat - Major
Fallow Barly - Major
Fallow Sugarcane - Major
Fallow Mustard - Major
Zayad - Urad, Moong, Makka, Arahar
The above said Rabi Crops is the most prevailing crop rotation on the agriculture
lands both in the rainfed and irrigated conditions.
Organized vegetable cultivation fruit plantation and traditional agro forestry
systems are lacking as per requirement in the watershed the limited vegetable cultivation
in the watershed is confined as kitchen gardens and field to the irrigated condition in a
scattered manner. The cultivation of cash crops other than the sugarcane, wheat and
mustard also in the watershed.
(3.18) Historical Events :
Chronological record of important events of the watershed village is prepared
through participatory rural appraisal (PRA) which is very useful in understanding of its
background and chronology is given as follows :

382
Table – 12 : Historical Events
S.
No.
Events/Activities Year Rem.
1 2 3 4
1 Established 1560
2 Opening of Primary School 1962
3 Opening of Junior School 2006
4 Opening of Kanya Pathshala -
5 Opening of PHC -
6 Opening of Vet. Hospital -
7 Panchayat Ghar 2008
8 Introduction of Tractor 1972
9 Gobar Gas Plant -
10 Thresher 1980
11 First Tube well/Pumpset 1970
12 First Motorcycle 1981
13 T.V. & D.V.D. Players 1982
14 Electricity in Village 2000
15 Bituminous Road 2003
16 First Hand Pump 1990
17 Templo Renovation 2001
18 First Land Line Telephone -
19 Planning for Watershed Project 2010-11
(3.19) Present Land Use in the Watershed :-
The watershed has diversified land uses. The varied present land use under
different use in the watershed. The mixed land use followed in the watershed is almost
similar in other parts of U.P. During P.R.A. Exercise prepared land has been shown in
Table No. 13, 14 & 15.
Table – 13 : (Ownership) S.
No.
Name of Village Pvt. Agri. Land Govt.
Revenu
Land
Forest
Land
Other
Land S.C./S.T. Others
1 2 3 4 5 6 7
1 Rishalu 86.26 70.58 - - 21.38
2 Bedrampur 119.70 106.15 - - 33.75
3 Gangagarh 85.44 128.16 - - 26.40
4 Kamona 16.47 49.43 - - 7.30
5 Rasalgarh - 9.98 - - 1.00
Total 307.87 364.30 - - 89.83

383
Table –14 : (Present Land under different categories)
S.
No.
Name of Village Land Use (Ha.)
Agricultural Wasteland
(All Types)
Seasonal
waterbodies
Village/Raod
Etc.
Total
1 2 3 4 5 6 7
1 Rishalu 156.84 8.90 - 12.48 178.22
2 Bedrampur 225.85 15.57 - 18.18 259.60
3 Gangagarh 213.60 12.00 - 14.40 240.00
4 Kamona 65.90 4.03 - 3.27 73.20
5 Rasalgarh 9.98 - - 1.00 10.98
Total 672.17 40.50 - 49.33 762.00
Table – 15 : (Present land use classified)
Proposed Post Land Use has been given on Page No. 32
4- Focus on Present Land Use :
(4.1) Agriculture :
The total area under agriculture in the watershed is about 487.89 ha. out of which
574.00 ha. is under rainfed agriculture. Agriculture land uses in the watershed extended to
diversified land capabilities starting marginal to good class II land. The irrigated and
drinking water is most scarce natural resource in the watershed. The operation of tube well
for irrigation of agricultural crops frequently leads to the drinking water. Problem to the
farmers of watershed forcing them to carry drinking water from outside of the watershed
area. The agricultural field bund are common in the watersheds however they frequently
breach on heavy rains.
S.
No.
Land Use Under Unit
(ha.)
Area
(Ha.)
Percentage
1 2 3 4 5
1 Under Agriculture Ha
A- Rainfed- Ha
I- Crops Hact 656.87
II- Agro forestry Hact 15.30
B- Irrigated- -
I- Assured Hact 35.38
II- Portial Hact 162.39
2 Wasteland -
A- Aforestation - -
B- Pasture - -
C- Untreatable Hact 8.30
D- Treatable Hact 32.20

384
Various mixed texture of soils are located in patches through out the watershed.
The heavy soils are almost kept fallow during rainy season. the agricultural soils also have
some as share calcium pan at variable depths. The irrigation water is conveyed by the
earthen channels. Surface irrigation methods following mainly border method of flood
method by the formers in the watershed. These factors reduce the water use efficiency of
limited and valuable irrigation water.
Drought hardy species like Juliflora suitable multi purpose trees is suitable for
rehabilitation of the wasteland. Rehabilitation of waste lands promoting agro forestry with
appropriate fruit and forest species suitable vegetative barriers on sloppy lands can be high
future value and by these adoption would be meet out many demands of fire wood and
fodder in the wasteland. Except above but also for soil and water conservation,
rehabilitation of wasteland and sustainable income generation for socio-economic
upliftment of farmers.
Crop Productivity :
The farmers also do not have suitable cropping system to deal aberrant weather.
Weeds impose considerable constraint in productivity of both Karif and Rabi crops under
irrigated as well as rainfed production system farmer undertake normally one manual
weeding in mustard and other valuable crops however, practices is energy and time
consuming. Use of we decide is rare in the watershed.
In the watershed area, limited cropping in the Kharif with mixed cropping practices
is not only irrigational but also unscientific and best for low productivity. Subsequent Rabi
crops in general. Sugarcane & Mustard crop in particular are raised on residual soil
moisture under rainfed production system during post mansoon season.
(4.2) Indigenous Technological Knowledge (ITK) :
Under process of PRA tracked out rural applying technology in various field of
local technology and some technology is very popular in village. In which the agriculture
is an old traditional practices of farmers who have improved themselves with passage of
the time according to their domestic needs and technological reforms in the nearby areas.
The villages have their traditional village ponds, practice of field bunding which typically
constitute agricultural related ITKs in the watershed. The Mustard & sugarcane being a
cash and firewood crop of the watershed and also sugarcane crop is being. Cultivated in
self designed manner by the farmers. Its carried out that the area is totally depend on rain

385
and under the rainfed area technology is applied by the farmers. However limited fertilizer
application specifically the DAP came in the practices since about 15-20 years.
(4.3) Forest and Other Vegetation :
Forest :
The watershed have a tract of wasteland area which are under uncultivable position
is liesed in the watershed. These wasteland have not any tree vegetation or very less than
real requirement for the wasteland use.
Horticulture/Agro forestry :
Horticulture and agro forestry practices were observed in the watershed.
(4.4) Agro forestry :
Agro forestry practices are lacking in the watershed. Though it has good potential
under existing disposition and may a role particularly with respect to minimization of
cropping risk, built up soil fertility and productivity, protection of soil erosion, soil
conservation partly meeting out the fire wood demand of rural community and more over
optimizing the economical return from system as whole under typical semi arid climate in
the watershed. Bund and boundary plantation also have good potential to care the fire
wood and fodder demands of the rural community in the watershed. The existing area
under agro forestry is almost negligible. Prosopis Jhliflora may be planted as block or sole
plantation specifically on marginal and degraded land in the watershed.
The agro forestry interventions comprising of ber, bail, aonla, guava, papular etc.
may be applied for benefit of the farmers under rainfed to irrigation production system on
leveled to slopping and marginal agricultural using proper planting techniques and term it
control measures.
The multipurpose trees may be also help in supplementing fire wood and fodder
demands of the rural community in the watershed and my be planted as hedge rows on
rainfed, marginal and degraded lands.

386
(4.5) Horticulture :
Fruits and vegetables practices are lacking in the watershed area. Its practices may
be sustainable very good potential for the formers of watershed. There are a limited lack
fruit trees in number like mango, guava, lime, ber, aonla and papaya fruit trees well as
vegetables like radish, okra, tomato, cabbage, garlic, onion, chilly, bringer and cucurbits
but they are found surviving well in the watershed villages. Organized orchards (vatika)
commercial vegetable cultivation horti-agri and other systems of agro forestry etc. are
lacking but have good agriculture.
5. Soil and land capability classification :
(5.1) Soil Morphology :
Watershed is located North East corner of Bulandshahr Distt. near about 55 Km.
away. The entire terrain of watershed is topographically divided into various land forms.
Accordingly the soils of watershed have been grouped major categories is given as follow
:
Hill Terrain Plane
Land
Sloppy
Undulated
Land
Rill Erosic
Land
Moderate
ravenous
- 45% 28% 15% 12%
Given categories in the blocks is located the soil morphology in the watershed
areas. Representation of soil characteristics by soil profile is represented as follows :
Soil Profile :
Fig. – 9 (Soil Profile)

387
Table – 16 : (Morphology of a Typical Soil Profile) :
Horizone Depth in
Cm.
Morphology
1 2 3
A
V & H
0-150 Silky when moist, Hard when dry quick
soluble, high elasticity, fissures, and cracks,
occasional occurrence of free calcium
carbonate granules black in colour, clay
content 29%, PH- 8 to 8.7
B
V & H
150-160 Whitish yellow in colour, very fine mixed
with free cacaos and gravels, Hard when dry
compact and indurate hard pan restricting
development of root and down ward water
transmission.
C
V & H
7600 Red and white sand stone
(5.2) Soil and Characteristic and Fertility Status :
Soil characteristic pertaining to soil fertility of various classes accruing around
villages in the watershed are given as follows :
Table – 17 : Soil Characteristic & Fertility Status :
Sl.
No.
Soil Properties LCC-II LCC-III
& IV
1 2 3 4
1 Sand % 44.05 72.04
2 Silt % 23.90 17.16
3 Clay % 32.05 11.80
4 Texture Sandy Clay Lomy Sand
5 PH (1:2) 7.75 8.00
6 Organic Carbon % 0.40 0.14
7 Available N Kg ha-1
320.00 175
8 Available P Kg ha-1
28 15
9 Available K Kg ha-1
185 322
10 EC (dS m-1
) 0.46 0.12

388
(5.3) Land Capability Classification (LCC) :
Land capability classification (LCC) was done to classification the soils in
different groups based upon the limitations and to emphasize the hazards prevailing in the
watershed in order to find out the different topo-sequences, landforms, soil depth and
erosion hazards. This was followed by the detailed investigation of selected landforms to
bring out the LCC classes of the Watershed. Classes of land capability namely II, III, IV
and V are demarcated in the watershed. The areas under different classes are sown as
follows :
Table – 18 : Land Capability Classification (LCC) :
S. No. Land capability
class
Area in Ha. Colour
1 2 3 4
1 I Class - -
2 II Class 103.35 15%
3 III Class 482.3 70%
4 IV Class 68.9 10%
5 V Class 34.45 5%
6 VI Class - -
7 VII Class - -
8 VIII Class - -
Land capability classification of various agricultural practices under land use can
be classified as groups, class, sub class and units. Utilization of various land class is given
as follows :
Table – 19 : Utilization of various land uses

389
(5.4) Land Capability Class II & III :
This group is one of the most extensive LCC watershed. and also near to class III
for the agricultural practices. The soils are sandy & sandy loam in texture. The land under
this class is nearly level to mild sloping (1-3%). The soils are deep and erosion hazard is
slight. Most of the productive agriculture land comes under class II & III. These lands
potentially very productive but due to rainfed a single cropping pattern is in habitation.
(5.5) Land Capability Class IV :
This class is found in lower portion near the outlets of watershed. The soils are
coarser in texture, deep, erosion hazard and undulating in topography. Rill and initiation of
gully can be seen near the outlet of the watershed.
(5.6) Land Capability Class VII & VIII :
This class of land is not found in watershed. Somewhere lack of soil are found with
admixture gravels fragments in these classes of lands.
(5.7) Conclusions :
The majority of land form is coming under class II, which give an insight of good
agriculture production potential of the watershed.
The land capability classification provides reasonable good information with
regard to capability of soil, that could be used for agriculture, agrihorticulture, silviculture
and posture development.
The productivity of these lands could be further enhanced by adoption of simple
soil & water conservation measures like bunding practices.
The reasonable area is under watershed of wasteland and other wasteland including
grater potential of this watershed for forestry and pasture development. Rare places
namely water body of low portion of land area under seasonally works as water harvesting
structures and these harvested water is used or can use for some other benificial activities
during the crop season also.
6. Problems and needs of the watershed indentified during the PRA
(6.1) Problem Identification and prioritization :
oo- The are has undulating topography, steep unstable slopes, gradient of excessive
branches of rills and hence highly prone to soil erosion.
pp- Major issues addressed to food sufficiency economic growth and environmental
security in the watershed area.
qq- Effective soil depth is limited and highly variable hampering good crop growth.

390
rr- The watershed have low productive cropping due to tradition single cropping
pattern and over all average crop production percentage not sufficient against
requirement.
ss- Identified that there is no assured irrigation system has been development capacity
of water bodies are reduced due to silt ration which are utilized to store of rainy
water and they are renovatable.
(6.10) Transact walk during the PRA :
Problems identified and prioritized during the transact walk and PRA exercises in
all comprised villages of watershed. There were pooled and a list of problems
representing the whole watershed was prepared. Problems were ranked as per their total
weight age in the watershed village.
Table – 20 : Ranking of Problem identification and prioritization of watershed
S.No. Problem Rank
1 2 3
1 Lack of irrigation 3
2 Lack of drinking water 6
3 Low production of field crops 8
4 Lack of fodder availability and low productivity 8
5 Lack of availability of fuel wood 5
6 Lack of market facility 3
7 Lack of quality seeds, fertilizer, pesticides etc. 6
8. Medical and Health care facilities for milching
animals and low productivity.
5
9 Lack of medical, educational and transportation
facilities
6
10 Lack of water bodies renovation 6
11 Lack of run of earthen check bunds 8
12 Lack of water harvesting structures 1
13 Lack of livelihoods opportunity 1
Prioritized ranking (Upto four Numbers) :-
25- Lack of earthen check bunds.
26- Lack of livelihood opportunities.
27- Lack of irrigation water was the greatest problem. Lack of irrigation water
problem experienced by the people followed by low crop production.

391
(6.3) Analysis of SWOT of the watershed :
Strength (S), Weakness (W), Opportunity (O) and Threat (T) analysis is a
useful decision support tool. A SWOT analysis of watershed is presented as
follows :
SWOT analysis of the watershed
Strengths (S)
lxxxi. Cooperative work culture in traditional
activities
lxxxii. Close ethic ties
lxxxiii. Road at the top as well as outlet of
the watershed
lxxxiv. Hard working
lxxxv. Resource pool of crop genetics
diversity
lxxxvi. Awareness of farmers about
watershed management programme
lxxxvii. Well established CPR maintaining
and sharing system
lxxxviii. Stall feeding of animals
lxxxix. Well maintained seasonal water
bodies
xc. Social outlook of the community
towards land less
Weakness (W)
lxxiii. Poor water management
lxxiv. Resource poor farmers
lxxv. Out migration of youth
lxxvi. Low and erratic rainfall
lxxvii. Fragile geology
lxxviii. Fragmented land holding
lxxix. Heavy infestation of wild animals
lxxx. Problem of fuel and fodder
lxxxi. Shallow soil depth and with high
percentage of gravel
Opportunities (O)
xlix. Wide range of annual and perennial
crops
l. Scope of regular employment opportunities
to check out migration
li. Strengthening of existing irrigation system
lii. Conducive climate for rainfed crop
diversification
liii. Good scope for Agro forestry and dry land
horticulture
liv. Potential for collective action and
management of CPR
Threats (T)
xli. Prone to adverse climate like drought
xlii. High market risk
xliii. Social conflicts owing to PRI and
WSM polices and local politics
xliv. Weak coordination among line
departments
xlv. Lack of expertise of implementing agency in
different aspects of WSM
7. Proposed land use for the watershed :
Watershed management plan preparation due importance is given to topographic,
land suitability, irrigation potentially, prevailing farming systems, micro farming situation,
farming, farmers preferences and priorities along with economic and environment
securities.

392
Crop and tree selection and area distribution was done as per farmers priorities
revealed through PRA exercise.
The watershed management plan for watershed is prepared with specific objectives
of food sufficiency, income and employment generation with environment security.
Technical options were with the ITK based on the latest available experiment
findings. Due attention was given to the resource of the farmers and adjustments were
made in capital intensive resource demanding technological outputs while making them
adoptable to the resource poor farmers. Emphasis was given on maximum use of farm
yard manure. The proposed land use plan of the watershed is shown as follow as in table
Table – 21 : Present and proposed land use plan of the watershed
S.No. Land use Present
(ha)
Proposed area
(ha)
1 2 3 4
1 Agriculture
a Rainfed
I Crops 656.87 1050.95
II Agro-forestry 15.30 40.00
b Irrigated
I Assured 35.38 35.38
II Partial 162.39 263.00
2 Waste land -
a Aforestation - 38.00
b Pasture - -
c Untreatable 8.30 6.10
d Treatable 32.20 11.20
3 Village land 49.33 49.33
(7.1) Status of Present Water Resources Utilization :
Watershed is having some canal system. Management and maintenance of these
canal are required. Before sowing of Rabi crops, water from these canal is issued as
supplementary irrigation for Rabi sowing ar allowed to go as waste. After releasing water
from canal, submergence area also put under cultivation.
Some where bore well irrigation applied by the farmers in the watershed.

393
(7.2) Proposed Plan for Irrigation Development :
a- Present system of irrigation and wastage of water during October–November
need to be made more efficient from water management point of view by
minimizing conveyance losses in the existing water courses.
b- Present irrigation canal capacity have to build up by the reform. Which are lack
capacity of water.
c- Construction of new water harvesting earthen structures, Pucca Check Dem, Series
Gully Plugging, etc. has been sloppy portion to increase irrigation potential and for
recharging of ground water, soil and moisture conservation maximum field
irrigation, best production and expected change of crop rotation.
d- The up gradation of the exciting system of irrigation will result in :
i- Minimization of conveyance losses.
ii- Increase in frequency of irrigation.
iii- Adoption of high yielding varieties of crops.
iv- Assured cultivation of cash crops.
v- Capacity buildup by the planning of new water harvesting structures.
(7.3) Ground Water Recharge :
For the purpose of ground water recharge, the area of the upper side of watershed
is recommended for Field Bunds, Contour Bunds, Peripheral Bunds and Submergence
Bunds and in the lower portion Contour Staggered Trenches, Gully Plugs, Earthen Check
Dem and Pacca Outlets. In the undulated sloppy portion of the watershed recommended
water harvesting structure for dual purpose as ground water storage and under ground
water recharge.
(7.4) Crop Production :
Practices proposed in the watershed is given as follows :-
a- Mulching and crop residue management.
b- Application of green manuring.
c- Vermi Composting.
d- Crop rotation and inter cropping.
e- Biofertilizers.

394
(7.5) Tillage Operation :
Deep tillage technology is proposed to apply to be demonstrated for benefit of
farmers in the watershed.
(7.6) Improved Seeds of High Yielding Verities (H.Y.V.) :
Recommendation of improved varieties is necessary for improving the productivity
and farm income. Through replacement of low yielding traditional verities of seeds in
villages of watershed.
(7.7) Balanced Fertilizer Use :-
Demonstration of use of fertilizer in various crops of watershed recommended
balance fertilizer use in different crops will be benefited of forming community.
(7.8) Control of insects and diseases :
Aphid in the mustard are the major insects in the watershed areas leading to loss in
crop productivity. Similarly white blister is also a common disease in the mustard crop.
The management strategies of these insect pest and diseased will also be
demonstrated in the watershed for benefit of the growers.
(7.9) Dry Land Horticulture :
Such portion of dry land in which proposed horticulture development planning
recommended species like Ber, Bel and Aonla will be planted at suitable spacing in the
watershed.
(7.10) Agri Horticulture :
Aonla and Sahjan would be suitable horticultural crops to the locality. Therefore, a
part of land in the farmer field shall be selected and brought under Agri-horticulture
system. The cropping system followed will be Jwar and Wheat.

395
(7.11) Plantation (Fuel wood) :
Such a portion which are under wasteland will be taken falling in the class-IV
category in the watershed. These lands will be planted with species like Vilayati Babool
(Prosopis Juliflora), Babool (Acacia Nilotica), Karanj (Pangamia Glabra).
9. Socio Economic Analysis of the of the Project :
(9.1) Sustainability and environment security :
The proposed land use plan will improve the land utilization index and crop
diversification index significantly as compared to the existing one. in the proposed
watershed management plan proper blending of the bio engineering measures will be
applied on above 80% of the total area of watershed. It is estimated that more than above
70% of the watershed area will be treated and consequently the soil loss and runoff from
the area is excepted to be reduced by 70% respectively.
It will help in maintaining ecosystem integrity on sustained basis along with
improving the livelihood security of the farming community.
(9.2) Economic Analysis :
Economic analysis of the project was carried by taking direct benefits and costs
considering 10 years for project life at 10% discount rate. Whole watershed development
plan was divided into three sector as agriculture, horticulture and forest/Fuel wood
plantation. Net Present Value (NPV) and Benefit Cost ratio criteria were applied judge the
economic efficiency of each enterprises and sector. Net present value (NPV) of the project
life is considered to be 10 years and discount rate for NPV estimation is 10% is given
NPV and benefits as follows :-

396
Table – 22 : Present productivity income analysis :
S.
No.
Name of
Sector
Name of
Crops
Produ
cti-
on/ha.
Rate/
Qtl.
Cost of
Production
Expend. of
cultivation
Net
income
B.C. Ratio
between
Col. 8 & 7
1 2 3 4 5 6 7 8 9
A Agriculture Urad 2.50 4500.00 11250.00 5000.00 6250.00 1.25:1
Moong 3.00 5000.00 15000.00 6200.00 8800.00 1.41:1
Jwar 5.00 700.00 3500.00 1650.00 1850.00 1.12:1
Wheat 20.00 1000.00 20000.00 9500.00 10500.00 1.10:1
Pea 8.00 2500.00 20000.00 9250.00 10750.00 1.16:1
Mustard 4.00 2000.00 8000.00 3675.00 4325.00 1.17:1
Total - 77750.00 35275.00 42475.00 1.20:1
Average - 9718.00 4409.00 5309.00 1.20:1
B Forestry Vilayati
Babool
- - -
C Horticulture Ber 22000.00 - Nil
Aonla 22000.00 - Nil
Bel 22000.00 - Nil
Total - 66000.00 - Nil
Average - 22000.00 - Nil
Grand Total

397
Table –23 : Post productivity and income analysis for Post Productivity
Value and B.C.:
S.
No.
Name of
Sector
Name of
Crops
Produ
cti-
on/ha.
Rate/
Qtl.
Cost of Production
Expend. of
cultivation
Net
income
B.C. Ratio
between
Col. 8 & 7
1 2 3 4 5 6 7 8 9
A Agriculture Urad 4.00 5000.00 20000.00 8325.00 11615.00 1.39:1
Moong 4.00 5000.00 20000.00 8200.00 11800.00 1.44:1
Jwar 5.50 800.00 4400.00 1900.00 2500.00 1.32:1
Wheat 25.00 1000.00 25000.00 11680.00 13320.00 1.14:1
Pea 9.50 3500.00 33250.00 14810.00 18540.00 1.12:1
Mustard 5.00 3000.00 15000.00 4370.00 8130.00 1.86:1
Total - - - 172250.00 72845.00 99765.00 1.38:1
Average - - - 21531.00 9061.00 12471.00 1.38:1
B Forestry Vilayati
Babool
80.00 500.00 40000.00 15000.00 25000.00 1.67:1
C Horticulture Ber 35.00 1500.00 70000.00 20000.00 32500.00 1.63:1
Aonla 35.00 2000.00 70000.00 20000.00 50000.00 2.50:1
Bel 40.00 1500.00 80000.00 20000.00 40000.00 2:1
Total - 182500.00 7000.00 122500.00 2.04:1
Average - 60833.00 20000.00 40833.00 2.04:1
Grand Total - 1394750.00 147485.00 247265.00 1.68:1
Table –24 : Summary of NPV, PPV and B.C. Ratio (Sector wise) :
S.
No.
Name of Sector NPV PPV B.C.
Ratio Expend. Net
Income
Expend. Net
Income
1 2 3 4 5 6 7
1 Rain fed
Agriculture
54105 51000 72485.00 99765.00 1.38:1
2 Forest/Fuel wood
Plantation
15000 - 15000 25000 1.67:1
3 Horticulture 60000 - 60000 122500 2.04:1
Total 129105 51000 147485.00 247265 1.68:1

398
(9.3) Economics of Agriculture Sector :
The development cost can be recovered by the adoption of plan in present rain fed
agriculture is being done on well maintained field, therefore does not require much
investment. In rain fed agriculture, investment of Rs. 44.50 lacs is proposed to made is
given as fallows :
Table – 25 : Economics of Agriculture Sector :
S.
No.
Name of
sector
Name of Activities
/ Plan
Treatble
Area
(Ha.)
NPV
(Lacs)
Post
Productivity
Value (Lacs)
Benifit /
Income
B.C.
Ratio
1 2 3 4 5 6 7 8
1. Rainfed Soil, moisture
and water cons
works
560 29591 921.01 413.08 1:38:1
(9.4) Economics of forest fuel wood plantation :
Economic analysis of fuel wood plantation in the watershed. Project life is
considered to be 20 years and discount rate for NPV estimation is 10 % is followed and as
is given follows :
Table –26 : Economics of forest fuel wood Plantation :
S.
No.
Name of
sector
Comman Name of
Plant
Area
(Ha.)
NPV
(Lacs)
Post
Productivity
Value (Lacs)
Benifit /
Income
B.C.
Ratio
1 2 3 4 5 6 7 8
1. Forest
Fuel
wood
sector
Vilayati Babool
(Prasopis
Juliflora)
25 2.5 6.675 4.675 1.67:1
(9.5) Economics of Horticulture Sector :
Economic analysis of Horticulture Plantation in agri-horti system and on wasteland
patches of watershed project, life is considered about 15-20 years and discount factor rate
for NPV estimation is 10% is follows :

399
Table – 27 : Economics of Horticulture system :
S.
No.
Name of
Sector
Common name of Plants Area
(Ha.)
NPV
(Lacs)
Post
Productiv
e Value
(Lacs)
Benefit
Lacs
B.C.
Ratio
1 2 3 4 5 6 7 8
1 Horticulture Ber (zyziphus
mouritana)
4.00 0.80 2.104 1.304 1.63:1
Aonla (Embelica
officianalis)
3.80 0.76 2.660 1.90 2.5:1
Bel (Aegle marmelos) 2.20 0.44 1.320 0.88 2:1
Total 10.00 2.00 6.084 4.084 2.04:1
(9.6) Food requirement and sufficiency :
Achieving self sufficiency in food production is one of the prime objectives of
watershed project. The status of food requirement and production before and after the
project is presented as is follows :
Table – 28 : Status of food requirement and availability of per annual :
S.
No.
Name of Foods Requirement
Q./Yr.
Present Status Expected Post Status
Availability
Q./Yr.
Deficit or
surplus
Q./Yr.
Availability
Q./Yr.
Deficit or
surplus
Q./Yr.
1 2 3 4 5 6 7
1 Cereals 110 Kg. 10009 8508 - 1501 17015 7006
2 Pulses 36.50 3321 1827 - 1494 8497 5176
3 Oil Seeds 29.20 2657 1063 - 1594 4249 1592
4 Vegetable 71 kg 8280 1656 - 6624 14904 6624
(9.7) Employment generation :
One of the major problem of the labour migration in watershed project. By the
implementation of the project activities employment opportunities will be generated.
However the changes in land use pattern and adoption of other subsidiary enterprise will
generate employment opportunities in the watershed as given in table follows :

400
Table – 29 : Employment generation under proposed works :
S.
No.
Employment
activities/works
Area
under
work
Cost Mandays generation (Nos.)
Unskilled Skill Total Person
1 2 3 4 5 6 7 8
2 Graded Contour Bund 78 2.340 2340 - 2340 78
3 Gully Plug, C.D. 130 9.750 6825 500 7325 244
4 Submergence Bund 111 4.440 4440 - 4440 148
1 Peripheral Bund 110 3.850 3850 - 3850 128
5 W.H.B. 137 12.330 7398 419 7817 260
6 Renovation of Bund 89 2.550 2550 - 2550 849
7 Reno. of W.H.B. - - - - - -
8 Community Pond - - - - - -
9 Afforestation 25 3.900 636 - 636 26
10 Horticulture 10 2.000 400 - 400 13
Total 686 41.16 23133 919 23873 1746
10. Formation of watershed committee :
Under compliance of common guideline Para (6.3) is followed and by the help of
watershed development team, watershed committee is organized in the micro watershed
village Bedrampur with 10 members as prescribed in common guide line. List for
organization of W.C. village details given as follows :
Table – 30 : Details of comprised village W.C. organization in M.W.S. :
S.
No.
Particulars Details Block Geogra-
phical Area
1 2 3 4 5
1 Micro watershed code 3B3E3c2e Pahasu 762.00
2 Name of Gram Panchayat
in M.W.S.
Bedrampur

401
Table – 31 : List of organized W.C. for the Gram Panchyat Bedrampur in watershed.
S.
No.
Name of selected
members
Age Representation
Members from
Post Qualification Village
1 2 3 4 5 6 7
1 Chandrabhan 37 President Gram Pradhan B.A.
2 Satish 35 Secretary M.A.
3 Rajesh Kumar 38 S.H.G 10
4 Mahipal 45 S.H.G 5
5 Megh Singh 55 S.C. 5
6 Smt. Usha Devi 32 Lady 8
7 Shri Dharam Pal 36 No Field 10 8 Sardar Singh 55 U.G. 5 9 Veeri Singh 53 U.G. 5
10 Bhudev 60 U.G. 8 11 V.P. Singh 52 WDT Agri. Engg
(10.1) Formation of Self Help Groups in M.W.S.
By the help of watershed committee and watershed development team self help
group are formatted / organized. Families and persons are selected from poor, small and
marginal farmers families, landless poor families, agriculture labour families, women,
herdsman and shepherd and S.C. families in the formatted self help groups are given as
follow :
Table – 32 : Vikash Self help group – Bedrampur.
S.
No.
Name of member
in formatted
SHG’s
Age From
represented
family
Name of
proposed
activities
Activation
Position
1 2 3 4 5 6
1 Sunil Kumar 30 President Buffalo Palan
2 Ravendra Kumar 42 Secretary Buffalo Palan
3 Vinod Kumar 35 Member Buffalo Palan
4 Rajesh 38 Member Buffalo Palan
5 Aidal Singh 24 Member Buffalo Palan
6 Bheesham Pal 55 Member Buffalo Palan
7 Pooran Singh 45 Member Buffalo Palan
8 Bhawan Das 26 Member Buffalo Palan
9 Devendra Singh 34 Member Buffalo Palan
10 Tilak Sinigh 24 Member Buffalo Palan

402
Table – 33 : Self help group Bedrampur – Buffaloes.
S.
No.
Name of
member in
formated
SHG’s
Age From
represe-
nted family
Name of
proposed
activities
Activation
Position
1 2 3 4 5 6
1 Shri Ray Singh 30 President Buffalo Palan
2 Har Gyan 42 Secretary Buffalo Palan
3 Kanheya 35 Member Buffalo Palan
4 Mahipal 38 Member Buffalo Palan
5 Surendra Singh 24 Member Buffalo Palan
6 Vinod 55 Member Buffalo Palan
7 Ranveer 45 Member Buffalo Palan
8 Shripal 26 Member Buffalo Palan
9 Devraj 34 Member Buffalo Palan
10 Vishmber 24 Member Buffalo Palan
Table – 34 : Self help group in Bedrampur of watershed.
S.
No.
Name of
member in
farmated
SHG’s
Age From
represe-
ntated
family
Name of
proposed
activities
Activation
Position
1 2 3 4 5 6
1 Mukesh Kumar 35 Inter Livestock New
2 Jayprakash 50 HS Livestock New
3 Satish 45 Inter Livestock New
4 Tekchand 30 Inter Livestock New
5 Jagdish 40 HS Livestock New
6 Pravesh Kumar 40 Inter Livestock New
7 Annu 47 Inter Livestock New
8 Ravi 28 Inter Livestock New
9 Vedprakash 45 HS Livestock New
10 Sarvan 55 HS Livestock New

403
Formation of User’s Groups :
User’s groups are farmated by the help of watershed committee and watershed
development team in the micro watershed comprised villages. Formers which have land
village are involved in the User’s groups and they will be direct benefited as expected by
the implementation of watershed project easy and convenienced condition are made to
resource use between user’s groups and they will be responsible to operate and
maintenance for the created assets in the watershed. Nos. of farmated user’s groups details
are given as follows :
Table – 35 : Village wise user’s groups
S.
No.
Name of
village
No. of
groups
No. of
farmers
Total
Agri.
Land
Area
under
treat-
ment
Cost of
essets
1 2 3 4 5 6 7
1 Rishalu 4 62 62.22 65.88 7.9056
2 Bedrampur 11 170 162.18 160.39 19.2468
3 Gangagarh 17 272 238.83 233.64 28.0368
4 Kamona 16 253 216.00 216.21 25.9452
5 Rasalgarh 1 18 9.77 9.88 1.1856
Total 686 82.32
10. Estimation and Costing of Proposed activities of the watershed Project Year 2009-10.
Proposed works / activities for the Project Period (Year 2010-11) under proposed
treatable area 560.00 Ha. Out of total Geographical area 622.00 Ha.

404
(10.1) Financial and Physical Outlets :
Table – 36 : Financial and Physical Outlets for the Year 2009-10 :
Sl.
No.
Components Unit
cost
per
ha.
Physical
ha. Financial (Lacs) Man-days
Generatio
n Labour
Component
Material
Component
Total
1 2 3 4 5 6 7 8
A Management Cost 10%
1 Administrative Cost – TA & DA
Hiring of Vehicles,
Official Expenditure
Electricity & Phone bill
Computer, Stationery and office
consumable materials & contingency
1200 - - 8.232 8.232 -
2 Monitoring 120 - - 0.8232 0.8232 -
3 Evaluation 120 - 0.8232 0.8232 -
Sub Total 1440 - 9.8784 9.8784 -
B Preparatory Phase 10% - - - -
1 Entry Point Activities 4% 480 - 0.6586 2.6342 3.2928 659
2 Institutional & Capacity Building 5% 600 - - 4.1160 4.116 -
3 Detailed Project Report 1% 120 - - 0.8232 0.8232 -
Sub Total 1200 - 0.6586 7.5734 8.232 659
C Watershed Work Phase
a Watershed Development Works
1 Graded, Contour & Field Bunds 3000 78 2.340 - 2.340 2340
2 Gully Plug, Earthen Checkdam /WHS 7500 130 6.825 2.925 9.750 7325
3 Submergence bunds 4000 111 4.440 - 4.440 4440
4 Peripheral Bund 3500 110 3.850 - 3.850 3850
5 Earthen Water Harvesting Bund 9000 137 7.398 4.932 12.330 7817
6 Renovation of existing Bunds 3000 85 2.550 - 2.55 2550
7 Renovation of existing W.H.B - - - - - -
8 Aforestation and Development of silvi
postural system 15600 25 0.780 3.12 3.90 780
9 Dry Land Horticulture 20000 10 0.460 1.60 2.00 400
10 Community Pound (Renovation) - - - - - -
Sub Total 686 28.583 12.577 41.16 29502
B Livelihood Programme (Community Based) 7.620
Income generating activities through SHG’s for landless and marginal formers 10%
1 Live stock development activities 200 - - 1.3723 1.3723 -
2 Bee Keeping 100 - - 0.6857 0.6857 -
3 Poultry Farming 200 - - 1.3723 1.3723 -
4 Nursery Development 300 - - 2.0580 2.0580 -
5 Vegetable Production 100 - - 0.6857 0.6857 -
6 Milk Dairy Promotion Unit 200 - - 1.3723 1.3723 -
7 Establishment of Vermi compost Unit 100 - - 0.6857 0.6857 -
8 Sub Total 1200 - - 8.2320 8.2320 -
C Production System and micro Enterprises
1 Crop production, diversification of
agriculture and introduction of agro
forestry
1170 - - 8.0262 8.0262 -
2 Demonstration of improved
composting system 390 - - 2.6754 2.6754 -
Sub Total 1560 - - 10.7016 10.7016 -
D Consolidation Phase 5% Sub Total 600 - - 4.1160 4.116 -
Grand Total 12000 686 29.2416 53.0784 82.320 30161

405
ladYi i=
xzke iapk;r & osnjkeiqj dksM laŒ 2B3E3c2e fodkl [k.M &igklw ftyk & cqyUn’kgj ;g fd vkÃŒM CywŒ,eŒihŒ if j; kstuk esa rS; kj dh x ;h fuek Z .k dh u;h l ` ftr if jlEifRr;k sa dks
x z ke iap k;r osnjkeiqj , oa ekbØk s okVj ’ ksM ds vUr x Z r lfE efyr x z kek sa esa ;k s tuk fØ; kUo; u dj kus ,oa
; kstuk m ijkUr p kyw j[kus rFk k l̀ftr if jlEifRr; k sa ds vuq j{k.k gsrq Ñr ladY i ,oa bP Nq d gSA
osnjkeiqj x z ke iap k;r ds lHk h l z k sr LFky tS l s rky kc] x z kelHkk x ksp j ¼ p kj kx kg½ ] ty l al k/ku]
tx y v kfn esa Hk wfe f odk l if j; kstuk ds vUrx Z r fd; s tk; sx saA m u dk;k sZ dk s l ekt d s de tk sj ox Z tS ls
vuq l wfp r tkfr@tutkf r] efgyk ox Z ,oa vYi Hkwf eghu x jhch js[ kk ds uhp s ds yk Hk kfFk;k s a dk s ykH k
igq ¡p kus gsrq bPN q d gk sxsA
ge ; kstuk l ap kyu gsrq iz Lrkf or dj rs gS a ,oa lgef r ns rs gS fd Hkk jr l jdk j ds leLr
ekx Z n’ kh Z fl) kUrksa ds vuqi kyu es a dk;Z lEiUu djk;sx sa ;g Hk h ? k ksf"k r djrs gS fd p ; fur {ks= ftldk s
esjs }k jk HkyhHk k ¡f r ns[ kk x ; k gS] vk S j iz L rkf or ; kstu k esa iz L rkfor leLr dk; Z 15 l kyksa l s ugha djk;k
x ; k gS ftldh eq>s iw. kZ :i ls tkudkj h gS vkS j vuqeksnu djrs gSA

406
Index Map of the Watershed

407

408

ERROR: undefined
OFFENDING COMMAND: f‘~
STACK: