Sustainability and Visitor Management in Tourist Historic Cities

lable at ScienceDirect
Journal of Environmental Management 150 (2015) 179e195
Contents lists avai
Journal of Environmental Management
journal homepage: www.elsevier .com/locate/ jenvman
Desktop analysis of potential impacts of visitor use: A case studyfor the highest park in the Southern Hemisphere
Agustina Barros a, *, Catherine Pickering a, Ori Gudes b, c
a Environmental Futures Research Institute, Griffith School of Environment, Griffith University Gold Coast, QLD 4222, Australiab Department of Spatial Sciences, Curtin University, Perth, WA 6845, Australiac Research Centre for Community Science, Population and Social Health Research Program, Griffith Health Institute, Griffith University, Meadowbrook,QLD 4131, Australia
a r t i c l e i n f o
Article history:Received 10 October 2013Received in revised form16 October 2014Accepted 5 November 2014Available online
Keywords:Landscape analysisTourismRecreationImpactsCampsitesTrailsProtected areas
* Corresponding author. Tel.: þ61 7 55528342; fax:E-mail addresses: [email protected], a
(A. Barros).
http://dx.doi.org/10.1016/j.jenvman.2014.11.0040301-4797/© 2014 Elsevier Ltd. All rights reserved.
a b s t r a c t
Natureebased tourism and recreation activities have a range of environmental impacts, but most pro-tected area agencies have limited capacity to assess them. To prioritise where and what impacts tomonitor and manage, we conducted a desktop assessment using Geographical Information Systems (GIS)by combining recreation ecology research with data on visitor usage and key environmental features fora popular protected area used for mountaineering and trekking, Aconcagua Provincial Park (2400e6962 m a.s.l.) in the Andes of Argentina. First, we integrated visitor data from permits with environ-mental data using GIS. We then identified key impact indicators for different activities based on therecreation ecology literature. Finally, we integrated this data to identify likely ecological impacts basedon the types of activities, amount of use and altitudinal zones. Visitors only used 2% of the Park, but usewas concentrated in areas of high conservation value including in alpine meadows and glacier lakes.Impacts on water resources were likely to be concentrated in campsites from the intermediate to thenival/glacial zones of the Park while impacts on terrestrial biodiversity were likely to be more severe inthe low and intermediate alpine zones (2400e3800 m a.s.l.). These results highlight how visitor data canbe used to identify priority areas for on-ground assessment of impacts in key locations. Improvements tothe management of visitors in this Park involves more effective ways of dealing with water extractionand human waste in high altitude campsites and the impacts of hikers and pack animals in the low andintermediate alpine zones.
© 2014 Elsevier Ltd. All rights reserved.
1. Introduction
Protected areas are popular destinations for a range of nature-based tourism and recreation activities, with visitor use of pro-tected areas increasing in many regions including Australia, NewZealand and South America (Balmford et al., 2009; Buckley, 2009b).Popular activities in many protected areas include hiking, camping,mountain biking and wildlife viewing (Priskin, 2001; Pickering andBuckley, 2003; Buckley, 2004; Newsome et al., 2012). Theinvolvement of commercial companies to support recreational
þ61 7 5552 [email protected]
activities is also increasing, including providing transportation,guiding, food and lodging in protected areas (Buckley, 2009a).
Given the popularity of protected areas and the potential impactsof visitor use, protected area managers are often required to docu-ment and demonstrate if specific activities and levels of use aresustainable and if management actions are required to minimizeimpacts (Hadwen et al., 2007, 2008b; Monz et al., 2010a; Newsomeet al., 2012). In doing so, land managers can utilize the growingbodyof researchonrecreationecology,which is thescientific studyofthe impacts of tourism and recreation activities on the naturalenvironment (Liddle, 1997; Hammitt and Cole, 1998). This includesresearch on the effects of hiking and camping (e.g. Cole, 2004; Nepaland Way, 2007; Pickering and Growcock, 2009), trampling andgrazing by horses (Weaver and Dale, 1978; Cole and Spildie, 1998;Cole et al., 2004; Newsome et al., 2004) and mountain bike riding(White et al., 2006; Pickering et al., 2011), among others. This

A. Barros et al. / Journal of Environmental Management 150 (2015) 179e195180
research hasdemonstrated that the severity of impacts varies amongactivities, usage patterns and environments (Liddle, 1997; Hammittand Cole, 1998; Pickering and Hill, 2007; Monz et al., 2010a;Pickering, 2010).
Data on visitor usage is important for assessing the likely im-pacts of visitor activities including information on the location,frequency and types of visitor use (Wardell and Moore, 2005;Hadwen et al., 2007, 2008b; Newsome et al., 2012). For example,monitoring the spatial distribution of visitors is critical to identifyfocal and dispersed impacts, because visitation in protected areas isnot homogeneous but often concentrated in a few locations con-nected by trails and roads (Hadwen et al., 2007; Beeco and Brown,2013). Information about temporal patterns of use is also importantbecause the type and severity of impacts vary with events such asbreeding periods, moisture content of soils and flowering season(Monz et al., 2010a; Hadwen et al., 2012). For example, somemountain protected areas are popular for activities such as hikingand climbing in summer, which often coincides with the mainperiod of vegetation growth and the breeding season for birds(Pickering and Buckley, 2003; Geneletti and Dawa, 2009). Activitiesdiffer in their severity of impacts, so knowing howmany people areengaging in different activities is also important (Leung andMarion, 2000; Pickering et al., 2010).
Current recreation ecology research (Cole, 2004; Monz et al.,2010a; Pickering et al., 2010; Steven et al., 2011; Monz et al.,2013) can be used in conjunction with visitor information toidentify potential impacts of specific activities and appropriate in-dicators to determine likely visitor impacts. Visitor indicators canbe then combined with visitor and biophysical data usingGeographical Information Systems (GIS) to map patterns of use andpotential impact sites and where the environment is particularlyvulnerable (Bahaire and Elliott-White, 1999; Wardell and Moore,2005; Beeco and Brown, 2013).
Geographical Information Systems is already commonly usedfor the management of protected areas including the integration ofmultiple data sets from different sources (De Aranzabal et al., 2009;Brown and Weber, 2011; Beeco and Brown, 2013; D'Antonio et al.,2013; Walden-Schreiner and Leung, 2013). For example, it can be
Fig. 1. Desktop landscape based analysis framework showing the six steps followed to intseverity of likely impacts in a protected area.
used to map patterns of visitor use including the temporal andspatial distribution and movement of visitors (Arnberger andHinterberger, 2003; Wardell and Moore, 2005; Hallo et al., 2012).This information is important as visitor use is often concentrated incertain locations and/or trails. Knowledge of the biophysical fea-tures of these locations helps indicate where, and often why, im-pacts may be greater (Dixon et al., 2004; Beeco and Brown, 2013).
While many protected areas have data on biophysical features aspart of conservation planning frameworks (Groves et al., 2002;Newsome et al., 2012), few have detailed information on visitorusage patterns (Cessford and Muhar, 2003; Arnberger et al., 2005;Wardell and Moore, 2005; Hadwen et al., 2007). Protected areasoften lack the resources to collect visitor data, with few protectedareas using monitoring techniques such as on site counters, videocameras, field observations and entry registrations (Cessford andMuhar, 2003; Wardell and Moore, 2005; Eagles, 2013). Neverthe-less, many protected areas, particularly those with high visitorloads or including iconic sites, can collect visitor data from permitand booking systems (Parsons et al., 1982; Cessford and Muhar,2003; Wardell and Moore, 2005; Hadwen et al., 2007, 2008b).Permit/booking systems are used in wilderness areas in the UnitedStates and Canada (Parsons et al., 1982; Eagles, 2013), World Her-itage Sites such as the Galapagos National Park in Ecuador (Benitez,2001), and high mountain summits and trekking destinations inthe Himalayas (Salisbury and Hawley, 2007), the Andes (Barroset al., 2013), the Alaska range (Eagles, 2013) and Australia(Rundle, 2002).
The aim of this research was to demonstrate how protectedareas agencies can use landscape desktop assessments to a prioridetermine the likely ecological impacts of visitation using existingdata on visitor infrastructure and usage patterns, the recreationecology literature and the biophysical features of the protected area(Fig. 1). These datasets can be integrated using GIS to identify likelyimpacts including the locations where impacts will be more severe.This landscape desktop assessment can be used as the first step inidentifying where management actions are required to minimizeand/or ameliorate existing impacts and where there should befield-based monitoring of impacts. We illustrate this approach
egrate visitor and environmental data with recreation ecology research to assess the

A. Barros et al. / Journal of Environmental Management 150 (2015) 179e195 181
using data from the highest Park in the Southern Hemisphere,Aconcagua Provincial Park in Argentina.
2. Methods
2.1. Study site
Aconcagua Provincial Park (710 km2, 69�560 W, 32�390 S) in theSouthern Andean Steppe ecoregion of the Central Andes, Argentina,is characterized by a cold and dry climate, with low temperaturesyear round (Departamento General de Irrigaci�on, 2011). The Parkincludes the highest peak in the Southern Hemisphere, Mt. Acon-cagua (6962 m a.s.l.), and is a popular destination for internationalmountaineers (Barros et al., 2013). It was declared a protected areain 1983 to conserve glaciers, rivers, alpine ecosystems andarchaeological sites (Barros et al., 2013). It is a Category II Interna-tional Union for the Conservation of Nature (IUCN) Park and it ismanaged by the Mendoza Natural Resource Division.
Aconcagua is a mixed use park in which recreation and tourismare important. Recreation use is the main revenue source sup-porting the operational costs of this Park along with 13 otherprotected areas in Mendoza Province (Direcci�on de RecursosNaturales, 2013) (Fig. 2). The primary objectives of this Parkinclude protecting the natural biodiversity of high Andean eco-systems and cultural heritage, conserving the watersheds aroundMt. Aconcagua, and providing opportunities for recreation, mainlymountaineering and hiking.
Historically, there has been limited human use of the Aconcaguaarea, with transient use by pre-Incas and Inca aboriginal commu-nities for ceremonies (Barcena, 1998), some military training and afew mountaineering expeditions in the mid-1900s (Quiroga, 1996)Mountaineering and trekking activities have become more popularsince the 1980s with recreation use increasing steadily over the lasttwo decades during the five month visitor season that runs fromNovember to March (Direcci�on de Recursos Naturales, 2009). Forexample, the number of hikers and climbers increased from ~1000in 1990e~6000 in 2010e2011 (Direcci�on de Recursos Naturales,2011). In addition, the front country area of the Park is a majorsightseeing destination with over 27,000 day visitors over thevisitor season. Coupled with this increasing visitor use is an in-crease in commercial services including the provision of guides andporters, base camp facilities and pack animal (mules and horses)transportation for food and equipment for mountaineers (Direcci�onde Recursos Naturales, 2009). The Park agency has also increased
Fig. 2. Visitor use in Horcones Valley, Aconcagua Provincial Park, Argentina. Photo byAB.
the number of staff and the use of a helicopter during summer forrescues, staff movement, evacuations and waste management(Direcci�on de Recursos Naturales, 2009).
Based on its biophysical features the Park is divided into fouraltitudinal zones: 1) low alpine (2400e3200 m a.s.l.), 2) inter-mediate alpine (3200e3800 m a.s.l.), 3) high alpine(3800e4400 m a.s.l.), and 4) nival/glacial (4400e6962 m a.s.l.).Only 30% of the Park is covered by vegetation (210 km2), mostly inthe low and intermediate alpine zones (Mendez et al., 2006),where visitor use is also concentrated (Barros et al., 2013)(Table 1). In the high alpine zone there is nearly no vegetation,with plants occurring only in sheltered sites. Above the altitudinallimit of vegetation in the nival/glacial zone, the area is covered bypermafrost soils, glaciers (uncovered, debris covered and rockglaciers) and snow that regulates river flows (Corte and Espizua,1981).
There are more than 120 native plant species recorded in thePark, along with an increasing diversity of weeds (which arepredominantly from Europe) in the lower areas of the Park (Barrosand Pickering, 2014a). The Park provides habitat for >90 birdspecies, predominantly in the alpine steppe and meadows (Oliveraand Lardelli, 2009; Barros et al., 2013). Ground nesting birds arecommon including seedsnipes, earthcreepers and ducks, whichare threatened by egg predation by feral dogs and trampling frompack animals and hikers (Olivera and Lardelli, 2009). The onlylarge native grazing mammal in the Park is the camelid Lamaguanicoe (guanaco). The Park is also an important water catchmentfor Mendoza River that supplies water to a population of over 1million people and irrigate important agricultural areas (IANIGLA,2012).
2.2. Desktop landscape based analysis
A desktop landscape based analysis approach was used todetermine the severity of likely ecological impacts. It involved sixstages: 1) collection of existing data on Park visitor infrastructure,2) conversion of visitor permit data and commercial operator datainto GIS layers to map visitor distribution and use intensity, 3)identification of key biophysical features and collection of this datain the form of GIS layers, 4) identification of likely impacts andrelevant indicators for the range of visitor activities based on therecreation ecology literature, 5) calculation of impact indicatorvalues using visitor and infrastructure data, and 6) classification ofimpact indicator values and biophysical features followed by theintegration of these data sets to assess the severity of likely impactson water resources and terrestrial biodiversity in specific locationsin the Park (Fig. 1). This methodology was derived from, and ex-pands on, previous conceptual frameworks developed to integratevisitor data and/or activities in protected areas with visitor impactresearch (Ward et al., 2002; Hadwen et al., 2008b; Castley et al.,2009).
2.2.1. Collection of visitor infrastructure dataThe first stages of this process involved obtaining spatial and
attribute data for trails, campsites and infrastructure from the ParkAgency as GIS layers (Figs. 1 and 3). Trail data (polylines) includedthe altitudinal range, length and averagewidth of each trail section.Attribute information on the average width of trails was then usedto determine the buffer area per trail section converting the linefeatures into polygons. Campsite data included the surface area ofcampsites (polygons), the buffer areas used by pack animals aroundcampsites (polygons) and the surface area of all infrastructure(polygons).

Table 1Biophysical characteristics and potential ecological impacts of visitor use in each of the four main zones, Aconcagua Provincial Park.
Zone and elevation range Biophysical characteristics Likely ecological impacts of visitor use
Front country/low alpine(2400e3200 m)
Represents 8% of the Park. Over 50% of the area covered bysteppe vegetation and 1.4% by alpine meadows. High birdspecies richness (>60 spp.) and important bird nesting sites.Presence of guanacos in winter. Snow cover only in winter.
Vegetation clearance and disturbance dueto trampling, camping andinfrastructure. Weed dispersal throughclothing and pack animal dung. Wildlifedisplacement due to camping andtrampling. Reduced habitat quality forground nesting birds due to heavytrampling. Changes in hydrologicaldynamics of alpine meadows due towater extraction.
Intermediate alpine(3200e3800 m)
Represents 20% of the Park. Around 40% of the area covered bysteppe vegetation and 0.4% by alpine meadows. High birdspecies richness (>40 spp.) and important bird nesting sites.Presence of guanacos in summer. Glacier feeding areas.
Vegetation clearance and disturbancedue to trampling and camping. Weeddispersal through clothing and packanimal dung. Wildlife displacement duecamping and trampling. Reduced habitatquality for ground nesting birds due totrampling. Changes in hydrologicaldynamics of alpine meadows due towater extraction.
High alpine(3800e4400 m)
Represents 36% of the Park. Less than 5% of the area covered byvegetation in sheltered sites. Moderate bird species richness (>11 spp.).Snow covered in winter and sporadic snow in summer. Area characterized bypermafrost soils, glacier feeding areas, some covered glaciers, and glacier lakes.
Direct contamination of glaciers, lakes,rivers, snow and rock glaciers fromhuman waste and grey water discharge.
Nival/Glacial(4400e6962 m)
Represents 34% of the Park. Low bird species richness (<3 spp.). Snow covered inwinter and summer. Area characterized by permafrost soils, uncovered glaciers,rock and debris covered glaciers and glacier feeding areas. Temporary highaltitude lakes.
Direct contamination of snow and iceby human waste.
A. Barros et al. / Journal of Environmental Management 150 (2015) 179e195182
2.2.2. Conversion of visitor permit data into GIS layers to mapvisitor distribution
Data on visitor numbers including tourists, tour operators andpack animals were provided by the Aconcagua Provincial ParkAgency (Fig. 3). This Agency collects data from fee permits for
Fig. 3. Steps to estimate visitor use and impact indicator values based on the visitor data prindicator values with the corresponding GIS shapefiles, an excel spread sheet with the valuelayer by using a common field (e.g. number of passes in campsite A joined with campsite
tourists and commercial tour operators (Direcci�on de RecursosNaturales, 2011). Tourist data were provided in an excel spreadsheet, including the number of day entries per Valley, the trailsections and campsites they used and the types of activities theyundertook in the Park (day visit, short or long trek, climb). The
ovided for Aconcagua Provincial Park for the 2010/2011 season. To integrate the impacts of the impact indicator was joined and related to the corresponding feature of the GISA feature).
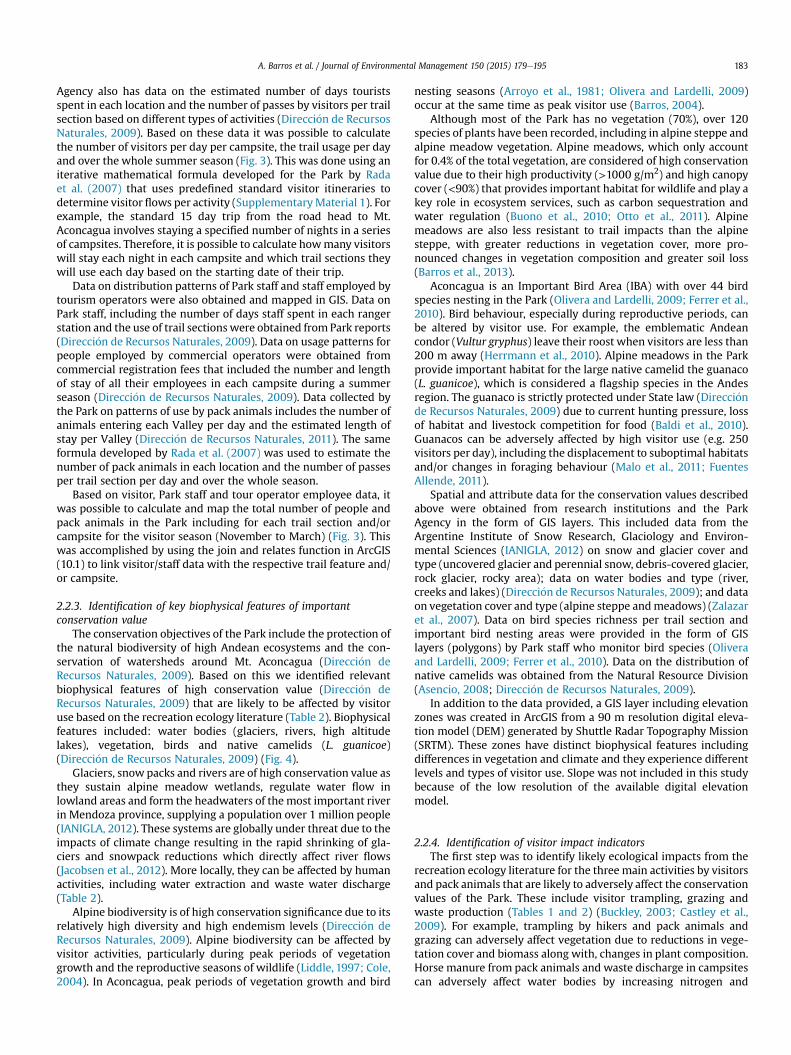
A. Barros et al. / Journal of Environmental Management 150 (2015) 179e195 183
Agency also has data on the estimated number of days touristsspent in each location and the number of passes by visitors per trailsection based on different types of activities (Direcci�on de RecursosNaturales, 2009). Based on these data it was possible to calculatethe number of visitors per day per campsite, the trail usage per dayand over the whole summer season (Fig. 3). This was done using aniterative mathematical formula developed for the Park by Radaet al. (2007) that uses predefined standard visitor itineraries todetermine visitor flows per activity (SupplementaryMaterial 1). Forexample, the standard 15 day trip from the road head to Mt.Aconcagua involves staying a specified number of nights in a seriesof campsites. Therefore, it is possible to calculate howmany visitorswill stay each night in each campsite and which trail sections theywill use each day based on the starting date of their trip.
Data on distribution patterns of Park staff and staff employed bytourism operators were also obtained and mapped in GIS. Data onPark staff, including the number of days staff spent in each rangerstation and the use of trail sections were obtained fromPark reports(Direcci�on de Recursos Naturales, 2009). Data on usage patterns forpeople employed by commercial operators were obtained fromcommercial registration fees that included the number and lengthof stay of all their employees in each campsite during a summerseason (Direcci�on de Recursos Naturales, 2009). Data collected bythe Park on patterns of use by pack animals includes the number ofanimals entering each Valley per day and the estimated length ofstay per Valley (Direcci�on de Recursos Naturales, 2011). The sameformula developed by Rada et al. (2007) was used to estimate thenumber of pack animals in each location and the number of passesper trail section per day and over the whole season.
Based on visitor, Park staff and tour operator employee data, itwas possible to calculate and map the total number of people andpack animals in the Park including for each trail section and/orcampsite for the visitor season (November to March) (Fig. 3). Thiswas accomplished by using the join and relates function in ArcGIS(10.1) to link visitor/staff data with the respective trail feature and/or campsite.
2.2.3. Identification of key biophysical features of importantconservation value
The conservation objectives of the Park include the protection ofthe natural biodiversity of high Andean ecosystems and the con-servation of watersheds around Mt. Aconcagua (Direcci�on deRecursos Naturales, 2009). Based on this we identified relevantbiophysical features of high conservation value (Direcci�on deRecursos Naturales, 2009) that are likely to be affected by visitoruse based on the recreation ecology literature (Table 2). Biophysicalfeatures included: water bodies (glaciers, rivers, high altitudelakes), vegetation, birds and native camelids (L. guanicoe)(Direcci�on de Recursos Naturales, 2009) (Fig. 4).
Glaciers, snow packs and rivers are of high conservation value asthey sustain alpine meadow wetlands, regulate water flow inlowland areas and form the headwaters of the most important riverin Mendoza province, supplying a population over 1 million people(IANIGLA, 2012). These systems are globally under threat due to theimpacts of climate change resulting in the rapid shrinking of gla-ciers and snowpack reductions which directly affect river flows(Jacobsen et al., 2012). More locally, they can be affected by humanactivities, including water extraction and waste water discharge(Table 2).
Alpine biodiversity is of high conservation significance due to itsrelatively high diversity and high endemism levels (Direcci�on deRecursos Naturales, 2009). Alpine biodiversity can be affected byvisitor activities, particularly during peak periods of vegetationgrowth and the reproductive seasons of wildlife (Liddle, 1997; Cole,2004). In Aconcagua, peak periods of vegetation growth and bird
nesting seasons (Arroyo et al., 1981; Olivera and Lardelli, 2009)occur at the same time as peak visitor use (Barros, 2004).
Although most of the Park has no vegetation (70%), over 120species of plants have been recorded, including in alpine steppe andalpine meadow vegetation. Alpine meadows, which only accountfor 0.4% of the total vegetation, are considered of high conservationvalue due to their high productivity (>1000 g/m2) and high canopycover (<90%) that provides important habitat for wildlife and play akey role in ecosystem services, such as carbon sequestration andwater regulation (Buono et al., 2010; Otto et al., 2011). Alpinemeadows are also less resistant to trail impacts than the alpinesteppe, with greater reductions in vegetation cover, more pro-nounced changes in vegetation composition and greater soil loss(Barros et al., 2013).
Aconcagua is an Important Bird Area (IBA) with over 44 birdspecies nesting in the Park (Olivera and Lardelli, 2009; Ferrer et al.,2010). Bird behaviour, especially during reproductive periods, canbe altered by visitor use. For example, the emblematic Andeancondor (Vultur gryphus) leave their roost when visitors are less than200 m away (Herrmann et al., 2010). Alpine meadows in the Parkprovide important habitat for the large native camelid the guanaco(L. guanicoe), which is considered a flagship species in the Andesregion. The guanaco is strictly protected under State law (Direcci�onde Recursos Naturales, 2009) due to current hunting pressure, lossof habitat and livestock competition for food (Baldi et al., 2010).Guanacos can be adversely affected by high visitor use (e.g. 250visitors per day), including the displacement to suboptimal habitatsand/or changes in foraging behaviour (Malo et al., 2011; FuentesAllende, 2011).
Spatial and attribute data for the conservation values describedabove were obtained from research institutions and the ParkAgency in the form of GIS layers. This included data from theArgentine Institute of Snow Research, Glaciology and Environ-mental Sciences (IANIGLA, 2012) on snow and glacier cover andtype (uncovered glacier and perennial snow, debris-covered glacier,rock glacier, rocky area); data on water bodies and type (river,creeks and lakes) (Direcci�on de Recursos Naturales, 2009); and dataon vegetation cover and type (alpine steppe andmeadows) (Zalazaret al., 2007). Data on bird species richness per trail section andimportant bird nesting areas were provided in the form of GISlayers (polygons) by Park staff who monitor bird species (Oliveraand Lardelli, 2009; Ferrer et al., 2010). Data on the distribution ofnative camelids was obtained from the Natural Resource Division(Asencio, 2008; Direcci�on de Recursos Naturales, 2009).
In addition to the data provided, a GIS layer including elevationzones was created in ArcGIS from a 90 m resolution digital eleva-tion model (DEM) generated by Shuttle Radar Topography Mission(SRTM). These zones have distinct biophysical features includingdifferences in vegetation and climate and they experience differentlevels and types of visitor use. Slope was not included in this studybecause of the low resolution of the available digital elevationmodel.
2.2.4. Identification of visitor impact indicatorsThe first step was to identify likely ecological impacts from the
recreation ecology literature for the three main activities by visitorsand pack animals that are likely to adversely affect the conservationvalues of the Park. These include visitor trampling, grazing andwaste production (Tables 1 and 2) (Buckley, 2003; Castley et al.,2009). For example, trampling by hikers and pack animals andgrazing can adversely affect vegetation due to reductions in vege-tation cover and biomass along with, changes in plant composition.Horse manure from pack animals and waste discharge in campsitescan adversely affect water bodies by increasing nitrogen and

Table 2Details of likely ecological impacts due to visitor use and associated activities in Aconcagua Provincial Park, Mendoza, Argentina. Impacts from visitor use are divided based onthe three principal activities undertaken in the Park including: visitor campsites, trails and pack animal transport. The impacts of these activities are indicated for vegetationand soils, wildlife andwater sources in the fourmain zones of the Park, including the lowalpine (LA), intermediate alpine (IA), high alpine (HA) and nival/glacial (NG) zones. Foreach zone it is indicated where activities occur (C), where impacts are likely to occur (�) and where impacts have been documented *. Key references supporting this in-formation are provided with references for research conducted in the Park indicated by a.
Likely ecological impacts LA IA HA NG Key references
Visitor campsites and trails C C C C
Vegetation and soilsVegetation clearance & disturbance due to camping & trampling * * � Barros 2004a; Barros et al., 2013a; Liddle, 1997; Cole, 2004.Changes in plant composition due to trampling & camping * * Barros et al., 2014a; Cole et al., 2008; Monz et al., 2010a.Introduction & invasion of exotic species along trails * * Barros 2004a; Hill and Pickering, 2006; Monz et al., 2010a.Soil erosion & compaction due to camping & trampling * * � Leung and Marion, 1996; Olive and Marion, 2009.Trail widening due to heavy trampling * * Barros et al., 2013a; Wimpey and Marion, 2010;
Monz et al., 2010a.Increased nutrient addition in soils due to human waste Bridle and Kirkpatrick, 2003.Internal fragmentation from the creation of informal trails � � Leung et al., 2011.Littering � � � � Monz et al., 2010a.WildlifeTemporal or spatial displacement of wildlife due to presence of humans � � � Monz et al., 2010a; Malo et al., 2011.Reduced habitat quality due to fragmentation through informal trails � � Leung et al., 2011.Increased barrier for movement for small mammals & insects due to
fragmentation through informal trails� � Leung et al., 2011.
Alteration of animal behaviour & feeding patterns due to wildlife feeding � � Orams, 2002.Decrease in bird species richness & diversity due to human presence � � � Heil et al., 2007.Water/Snow/GlaciersModified drainage patterns due to water extraction in campsites � � � Hadwen et al., 2008a.Increased nutrients & associated algal growth in lakes & rivers due
to human waste� � * Barros 2004a; Hadwen et al., 2005, 2008a;
Prideaux et al., 2009.Changes in water surface tension, addition of nutrients due to discharges � * * EPAS, 2008a, Hadwen et al., 2008a.Glacier & snow pollution due to human waste in campsites � � Goodwin et al., 2012.Weed dispersal through machinery � Pickering et al., 2010.Weed dispersal mediated by humans through clothing & equipment � � � Pickering and Mount, 2010.Pack animal transport C C C
Vegetation and soilVegetation clearance & disturbance due to trampling * * Barros et al., 2013a; Pickering et al., 2010.Changes in plant composition due to grazing � � Milchunas and Lauenroth, 1993; Cole et al., 2004.Reduced biomass due to patchy grazing � * Cole et al., 2004, Barros et al., 2014Plant defoliation through grazing � * Cole et al., 2004, Barros, 2014sSoil erosion and compaction from pack animal hooves * * Weaver and Dale, 1978; Wilson and Seney, 1994.Weed dispersal through dung and fur � � � Pickering and Mount, 2010.WildlifeReduced habitat quality for native wildlife due to plant
defoliation & trampling� � Cole et al., 2004.
Native wildlife displacement & changes in feeding behaviour dueto competition for food with pack animals
� � Puig et al., 2001; Borgnia et al., 2008.
Increased exposure of nests to predators due to plantdefoliation & trampling
� � Zalba and Cozzani, 2004; Roodbergen et al., 2012.
Water/Snow/GlaciersNutrification of waterways through horse manure � � � Hadwen et al., 2008a; Pickering et al., 2010.
A. Barros et al. / Journal of Environmental Management 150 (2015) 179e195184
phosphorus levels and changing algal composition in high altitudelakes.
Likely ecological impacts were identified for each zone basedon its biophysical features and where activities occur. We thenidentified relevant indicators for the different impacts based onreviews of visitor impact indicators (Manning, 1999; Sirakayaet al., 2001; Petrosillo et al., 2006; Castley et al., 2009) (Fig. 4).Indicators included mainly “pressure indicators”, that have adirect impact on the state of the environment (e.g. tramplingintensity on vegetation), and “environmental state indicators”,indicating the condition of the environment (e.g. percentage ofvegetation cleared) (Sirakaya et al., 2001; Buckley, 2003). For thisstudy, pressure indicators refer to the intensity of use (i.e. packanimal use intensity) and the consumption/contamination ofwater resources (i.e. water extraction, grey water discharge) andenvironmental state indicators to the consumption of biologicalresources (i.e. vegetation clearance for trails and campsites).Where management factors were likely to reduce the impacts(e.g. removal of human waste through helicopter), before andafter management intervention values were calculated (e.g.Table 3).
The main criteria for indicator selection were: 1) that theyreflect the main types of visitor activities in the Park, 2) thatthey are ecologically important as they can alter the conditionof the Park, and 3) that they are quantifiable and can be inte-grated with visitor and/or infrastructure data (Manning, 1999;Sirakaya et al., 2001; Buckley, 2003). This last criterion wascritical for quantifying a value for the impact indicator based onvisitor data (i.e. kg dung based on the number of pack animalsovernighting at a specific campsite) and/or visitor infrastructuredata (e.g. percentage vegetation cleared based on trail lengthand width).
For trails, three linear impact indicators were selected. Thesewere: 1) the number of passes by people along trails, 2) the numberof passes by pack animals along trails, and 3) damage to vegetationalong trails. Additional indicators were nodal and focused aroundcampsites. These were: 4) damage to vegetation in campsites 5e6)pack animal and people use intensity, 7) manure production, 8)human waste production, nutrient addition through 9) humanwaste and 10) manure (phosphorus and nitrogen), 11) litter pro-duction,12) water consumption,13) black water, and 14) greywaterdischarge (Fig. 4).

Fig. 4. Steps to assess the severity of likely impacts on biophysical components (water resources and terrestrial biodiversity) in Aconcagua Provincial Park by integrating impactindicator values with biophysical data on trails and campsite areas.
A. Barros et al. / Journal of Environmental Management 150 (2015) 179e195 185
These indicators provide information about the likely impacts ofvisitors on the conservation values of the Park and their potentialseverity in different locations. These types of indicators however,do not demonstrate ecological degradation. Measures of environ-mental degradation require other approaches such as examiningvisitor impacts in the field using existing monitoring protocolswhich are beyond the scope of this paper (e.g. Liddle, 1997; Leungand Marion, 2000; Cole, 2004). The use of these indicators using adesktop approach however, provides important information onwhere impacts may be more severe hence identifying where initialresearch efforts on the ground should be allocated.
2.2.5. Calculation of values for impact indicatorsValues for each of the 14 impact indicators were calculated for
the 2010/2011 visitor season using data on the intensity of use foreach location (campsite or trail section) (Figs. 1 and 3). Values forpressure indicators were calculated based on the intensity of use ofa location by people or pack animals multiplied by the number ofuses per day or the amount of material used/produced per day forthat indicator (e.g. water consumption ¼ water usage per personper day * total number of people per season in that campsite). Forsome indicators (e.g. human faeces, dung, nutrient addition) usagevalues of pressure indicators were obtained from the scientificliterature. Because of the particular use of the Park for mountain-eering and hiking, some daily usage values were obtained in thePark from a structured questionnaire of commercial operators in allcommercial campsites (33 in total). The datawas collected by one ofthe authors (AB) during the visitor season between December 2010and February 2011 with 100% of the questionnaires completed. Thequestionnaire was read aloud to each campsite manager at eachcommercial campsite and the interviewer recorded their response.Datawas recorded on: number of commercial visitors at the time ofthe interview, usage values for litter production, water consump-tion, grey water discharge and black water discharges. Usage values
were either recorded as per day and/or week. This data was thencombined with the number of people using that commercialcampsite during that period to calculate daily usage values pervisitor. The average daily usage values per visitor were calculatedfor each location as there were variations in daily usage amongcampsites.
Values for environmental state indicators (vegetation clearance)were calculated based on the GIS data provided by the NaturalResource Division for the length and width of each trail section andsurface area of campsites. Once all values for impact indicators oneach trail section and campsite location were calculated, thesevalues were integrated with the corresponding GIS layer on trailsand campsites locations as described in the following steps (Fig. 3).Impact indicator values obtained per trail or campsite locationwerethen summed for each zone to estimate the accumulated values foreach impact indicator in the four main zones in the Park and for thePark as a whole (Table 3).
2.2.6. Integration of impact indicators with key biophysical featuresImpact indicator values for trail sections and locations were
joined with the respective GIS layers (trails and campsites) usingthe join and relate functions in ArcGIS (Figs. 3 and 5). Using thequery tool it was possible to join several tables or return asubset of columns or rows from the original data in the databaseto a GIS layer. The primary condition is that both GIS layers anddatabases have common fields and types which enable thisprocess. For example, statistical area code, or campsite or trailsection name in the case of our study. Next, separate shapefileswere created for each impact indicator to run the weighted sumoverlay analyses in ArcGIS to assess the severity of the likelyecological impacts as described in the following step (Figs. 4 and5).
To better determine the severity of likely impacts on biophysicalfeatures (Ward et al., 2002), we classified biophysical features as

Table 3Integration of visitor and pack animal data for the 2010/2011 season (NovembereMarch) with impact indicators per zone in Aconcagua Provincial Park, Argentina. Values ofimpact indicators were obtained from visitor fees (fees), park reports (PR), field questionnaires (FQ) and scientific literature, including [1] Loso et al., 2012; [2] Almeida et al.,1999; [3] Tao and Mancl, 2008; [4] Matsui et al., 2003; [5] Vinneras 2002; [6] Westendorf and Krogmann, 2009. Impact indicators included pressure indicators (letters A to H)and environmental state indicators (letter I). Values for pressure indicators were calculated based on the intensity of use per location (campsite, trail) per season and the valuesfor environmental state indicators were obtained from GIS data provided by the Natural Resource Division. To estimate the accumulated values of impact indicators per zonesand thewhole Park, which included several campsites or trail sections as indicated in the table, the values obtained per location in a seasonwere summed upwithin each zone.Total values are highlighted in grey. N ¼ nitrogen and P ¼ phosphorus.
Data source Zones
Low alpine Intermediatealpine
High alpine Nival/Glacial Total
Impact indicatorsA. Intensity of use# campsites 4 4 4 7 19Visitorsa1. # tourist entries 33,976 6285 5102 3620 48,983a2. # tourists season Fees 37,099 10,793 18,479 14,486 80,857a3. # staff season PR 1100 1500 12,900 400 15,900a4. # people season (a2 þ a3) Fees/PR 38,199 12,293 31,379 14,886 96,757Pack animals (mules and horses)a5. # entries season PR 5631 5631 5631 16,893a6. % day utilization per campsite (24 h ¼ 100% ¼ 1) PR 0.56 ± 0.54 0.42 ± 0.40 0.03 ± 0.01 0.21 ± 0.14a7. Use intensity season (a5 * a6) (# pack animals) PR 6101 4589 197 10887a9. Trail length (km) 37 33 23 21 114Visitorsa10. Passes people season Fees/PR 85,400 18,284 15,318 33,828 152,830Pack animalsa11. Passes mules season PR 11,262 11,262 11,262 28,380B. Litter productionb1. Kg. produced person day per campsite FQ 0.41 ± 0 0.70 ± 0.17 1.21 ± 0.27 0.9 ± 0.09b2. Tons produced season (a4 * b1) 16 11 32 14 73C. Water consumptionc1. Litres usage person day per campsite FQ 25 ± 4 15 ± 9 16 ± 4 4 ± 0c2. Cubic meters season (a4 * c1) 626 462 627 60 1774D. Black water discharged1. Litres discharged person day per campsite FQ 11 ± 4 4 ± 4d2. Cubic meters discharged season (a4 in campsites with flush toilets * d1) 404 170 574E. Greywater discharge seasone1. Litres discharged person day campsite FQ 10 ± 5 7 ± 5 12 ± 4e2. Cubic meters discharged season (a4 * e1) Fees 69 242 501 812F. Human wastef1. Tons human faeces produced season (0.156 kg person day *
a4 in campsites with dry toilets or packout systems)[1]/PR 5 2 3 2 11
f2. Tons human faeces left (f1 * 10% non compliance) P/ 0.19 0.19f3. Cubic meters urine season (1.2 l/day * a4) [2]/PR 46 15 38 18 116f4. Litres urine left season (f3 e campsites without flush toilets) PR 2 2.07 37.65 17.86 60G. Pack animals manureg1. Tons dung season (21 kg/horse day* a7) [3]/PR 128 96 4 229g2. Cubic meters urine season (6 l/horse/day * a7) [4]/PR 37 28 1 65H. Nutrient addition through human waste and manureh1. Kg. N input human faeces season (0.01 kg N/1 kg) [5]/PR 0 0 0 2 2h2. Kg. N input human urine season (0.011 kg N/1 l) [5]/PR 24 23 414 196 658h3. Kg. N input pack animals season (0.001 kg/horse/day) [6] 6.1 4.6 0.2 0.0 10.9h4. Total Kg. N (h1 þ h2 þ h3) 31 27 414 198 671h5. Kg. P input human faeces season (0.003 kg P/1 kg) [5] 0.58 0.58h6 Kg. P input human urine season (0.0008 kg P/1 l) [5] 1.78 1.66 30.12 14.29 47.85h7. Kg. P input pack animals season (0.0025 kg/horse/day) [6] 15.3 11.5 0.5 0.0 27.3h8. Total Kg. P (h5 þ h6 þ h7) 17 13 31 15 76I. Affected vegetation by visitor usei1. Campsite surface affected (ha) PR 6 5 e e 11i2. Grazing areas (ha) PR 893 387 1280i.3. Total area affected campsites (i1þi2) PR 899 392 1291I4. Trail width (m) PR 22 ± 12 12 ± 2 12 ± 3 6 ± 1I5. Trail surface affected (a9 * i4) (ha) PR 23 48 e e 71
A. Barros et al. / Journal of Environmental Management 150 (2015) 179e195186
either related to water resources or terrestrial biodiversity thenselected impact indicators directly relevant to these two separatecomponents (Fig. 4). Key features of water resources included: 1)glacier type, and 2) distance of campsites fromwater bodies (rivers,streams and lakes). Campsite impact indicators included: 1) waterconsumption, 2) black water discharge, 3) grey water discharge, 4)manure production, 5) humanwaste, and 6e7) nutrient addition (P,N). Key features of terrestrial biodiversity included: 1) vegetation,2) camelid distribution, 3) bird species richness, and 4) distance to
areas where birds nest. Trail impact indicator shapefiles of terres-trial biodiversity included 4e5) the number of passes by pack an-imals and people and 6) vegetation clearance. Campsite indicatorshapefiles of impacts on terrestrial biodiversity componentsincluded: 4e5) people and pack animal use intensity, and 6)vegetation clearance (Fig. 4). All shapefiles were projected into theUTM zone 19S WGS84 (meters). Distance to bird nesting areas andwater bodies (rivers, streams, lakes) were calculated using the nearanalysis tool in ArcGIS that determines the distance from each

Fig. 5. Example of steps followed to run the weighted sum overlay analysis and assess the severity of likely impacts on terrestrial biodiversity from trail use using the model builderfunction in ArcGis 10.1. The first steps involved preparing the data, including 1) join the trail impact indicator values with the trail shapefile buffer areas using the add join functionand 2) calculate the distance of bird nesting areas to trails using the Near tool function. Each shapefile representing the impact indicators (number of passes people and packanimals, vegetation clearance) and terrestrial biodiversity components (guanacos, distance bird nesting areas, bird species richness and vegetation types) was classified into one offive classes, with five representing the highest category. All shapefiles were then converted into separate raster layers using the category classification of each component (impactindicators, terrestrial biodiversity features) as the value field. The final step was to run the weighted sum overlay analysis combining the multiple raster layers to produce outputrasters determining the severity of likely impacts on terrestrial biodiversity from trails.
Table 4Category classification used for biophysical components (water resources and terrestrial biodiversity) and the associated campsite and trail impact indicators used to run theweighted sum overlay analyses in ArcGis 10.1. Biophysical components were classified into five classes, with five representing the highest category based on level ofvulnerability (a), conservation value (b) and level of use (c). C. ¼ category. Dist. ¼ distance. HW ¼ human waste. BNA ¼ bird nesting areas.Obs. ¼ observations.
Campsite impact indicators for water resources
C. Class Glaciers (a) Dist. river& lakes(m) (a)
Waterconsumption(m3) (c)
Black waterdischarge(m3) (c)
Grey waterdischarge(m3) (c)
HW (kg)(c)
Manure(tons) (c)
N (kg) (c) P (kg) (c)
1 Very low/Null No glacier <1000 0.001 to 0.08 0 0 0 0 0 02 Low Rocky area 999 to 500 0.09 to 11 0.001 to 10 16 to 39 1 to 2 0.001 to 0.2 0.1 to 18 1 to 193 Medium Rock glacier 499 to 200 12 to 38 11 to 55 40 to 66 2 to 19 0.3 to 2.5 19 to 41 20 to 344 High Debris-covered 199 to 5 39 to 236 56 to 170 67 to 380 29 to 37 2.6 to 5.1 41 to 69 45 to 735 Very high Snow/glacier 5 to 0 237 to 365 171 to 339 381 to 548 37 to 62 5.1 to 123 69 to 259 74 to 277
Trail impact indicators for terrestrial biodiversity
C. Class Vegetation (a) Cameliddistribution(b)
Bird sp. richnessper trail section(b)
Trail dist.BNA (m) (a)
Trails veg.clear (ha) (c)
# passespeople (c)
# passes packanimal (c)
1 Very low/Null Bare ground No obs. 1 to 3 >400 m Above alpine 1 to 24 No passes2 Low N/A N/A 4 to 10 300 to 400 3 to 5 25 to 4458 N/A3 Medium N/A N/A 11 to 32 299 to 200 5.1 to 7 4459 to 6277 N/A4 High Alpine steppe Incidental obs. 33 to 40 199 to 100 7.1 to 14 6278 to 14424 54065 Very high Alpine meadows Frequent obs. >40 0 to 99 14.1 to 22 14425 to 66515 5856
Campsite impact indicators for terrestrial biodiversity
C. Class Vegetation(a) Cameliddistribution(b)
Bird sp. richnessper trail section (b)
Campsite dist.BNA (m) (a)
Campsite veg.clearance (ha) (c)
People useintensity (u) (c)
Pack animal useintensity (u) (c)
1 Very low/Null Bare ground No obs. 1 to 3 >400 m Above alpine 1 to 20 02 Low N/A N/A 4 to 10 300 to 400 0.2 to 0.3 21 to 2852 2 to 753 Medium N/A N/A 11 to 32 299 to 200 0.31 to 1 2853 to 4788 76 to 1224 High Steppe Incidental obs. 33 to 40 199 to 100 1.1 to 1.5 4789 to 18270 123 to 2445 Very high Meadows Frequent obs. >40 0 to 99 1.51 to 3.3 18271 to 32303 245 to 5857
A. Barros et al. / Journal of Environmental Management 150 (2015) 179e195 187

A. Barros et al. / Journal of Environmental Management 150 (2015) 179e195188
feature in the input features (e.g. trail) to the nearest feature in thenear features (e.g. river).
Impact indicators and biophysical components for all the rele-vant shapefiles were classified into five classes, with five repre-senting the highest category based on the level of vulnerability,conservation value and/or level of use (Fig. 4, Table 4) (Castley et al.,2009). Impact indicator values for different levels of use werecategorized using Jenk's natural breaks classification that reducesvariance within groups and maximizes variance between groups(Cromley, 1996). For biophysical components, the classificationwasbased on the conservation value and/or vulnerability of thatcomponent to the impact indicators (Castley et al., 2009) (Table 4).For example, the highest category (category 5) for glaciers wasassigned to uncovered glaciers and snow because they directlycontribute to river run-off, supply water to glacier lakes, and arepotentially threatened by direct contamination from human wasteand/or other waste discharges (Goodwin et al., 2012). For vegeta-tion, the two vegetation types were considered highly vulnerable todisturbance, but alpine meadows were given the highest category(category 5) because of their high conservation value, limited dis-tribution and lower tolerance to trail impacts (Barros et al., 2013).For important bird nesting areas, categories were based on thedistance of nesting sites from disturbance, with the highest cate-gory for those trails and or campsites that were closest to thesenatural features (e.g. < 100 m, Table 4) (Fern�andez-Juricic et al.,2001; Steven et al., 2011). To categorize the level of vulnerabilityof water bodies to disturbance, the same criterion was used, withthe highest category for campsites close to a water body (e.g. < 5 mfrom a stream, Table 4).
2.2.7. Weighted sum overlay analyses to determine likely impactsfrom visitor use
After all data were classified into the five classes, each shapefilewas converted into separate raster layers in order to run theweighted sum overlay analyses to calculate the severity of likelyecological impacts. This type of analyses are commonly used forsuitability and vulnerability studies in environmental science andmore recently in recreation planning, as they can be used tocombine multiple inputs to create an integrated analysis (Kliskey,2000; Geneletti, 2008; De Aranzabal et al., 2009).
For this study we conducted three separate weighted sumoverlay analyses using the model builder function in ArcGIS 10.1 toexamine the severity of likely ecological impacts on: terrestrialbiodiversity from 1) trail indicators and 2) campsite indicators, and3) on water resources from campsite indicators. To conduct eachanalysis, all classified raster layers (Table 4) are multiplied withtheir corresponding weights and then summed to create an outputraster. Raster layers included for each analysis were (Fig. 4):
1) Severity of likely impacts on terrestrial biodiversity on trails:vegetation type, guanacos distribution, bird species richnessareas, trail distance to bird nesting areas, vegetation clearance,people passes and pack animal passes.
2) Severity of likely impacts on terrestrial biodiversity on campsites:vegetation type, guanacos distribution, bird species richnessareas, bird nesting areas, vegetation clearance, people use in-tensity and pack animal use intensity.
3) Severity of likely impacts on water resources on campsites: glaciertype, distance to water bodies, water consumption, black waterdischarges, manure production, human waste, nitrogen addi-tion, phosphorus addition.
For the three analyses all biophysical components and associ-ated impact indicators were given the same weighting for theirimportance (1) except for pack animal passes which was given a
higher weighting (1.2) because trampling by pack animals has agreater effect than hiking on vegetation and soils (Liddle, 1997).
An example of the process used to run a weighted overlaysum analyses for determining the severity of impacts using themodel builder function in ArcGIS 10.1 is provided in Fig. 5 and inSupplementary Material 2. This was done to assess impacts fromtrails on terrestrial biodiversity. The results from the raster cellvalues of the three analyses were used to produce aggregatemaps for severity indices on water resources and terrestrialbiodiversity on campsites and on trails. For this study, highvalues in the output raster represent areas that are likely to bemore severely affected by visitor use. Conversely, low values inthe output raster refer to areas likely to be less impacted byvisitor use.
3. Results
3.1. Visitor infrastructure
Only 2% of the Park was directly used by people and pack ani-mals, with visitor infrastructure and use concentrated in the twovalleys used to access Mt. Aconcagua (Fig. 6a,b). The Park contains anetwork of >114 km of informal trails, of which 63% are in the lowand intermediate alpine zones and 37% in the high alpine and nival/glacial zones (Fig. 6a). It also contains 19 campsites with those inthe nival/glacial zone closer together (1.8 ± 1.9 km) than those inthe low, intermediate and high alpine zones (5.1 ± 3.9 km). In thelow and intermediate alpine zones, trails and campsites are close towater sources and often occur in areas with vegetation cover alongthe valley floors (Fig. 6a). In the high alpine and nival/glacial zones,trails traverse rocky areas with steeper slopes and campsites arenext to water sources including glacier lakes and rivers, glaciatedareas (e.g. rock glaciers, debris-covered glaciers), and areas withsome snow cover in summer.
3.2. Spatial and temporal patterns of visitor use
During the 2010/2011 summer season, a total of 33,976 tourists,5631 pack animals, ~120 employees of commercial operators and 30park staff used all, or part, of the trails and campsites. Visitor usewasconcentrated in the Horcones Valley (95% of all visitors), with mostvisitors sightseeing (82%), hiking (7%) or climbing Mt. Aconcagua(7%). In theVacasValley, activities included climbing (4%) andhiking(1%). Sightseers used thefirst 3 kmof the Park in the lowalpine zoneof theHorcones Valley,withmost visitors undertaking theHorconesLake walking circuit (2 km return). A total of 6285 visitors wentbeyond the lower altitude zone. Of these, 34% were hikers whocamped from one to three days in the low and intermediate alpinezones with only 8% staying over five days including using campsitesin the high alpine zone. Climbers (57%) stayed an average of 15 daysin the Parkmainly using base camps in the high alpine zone (Fig. 6a).As a result, there were >80,000 tourist nights (tourists * number ofnights they spent in the Park) for the 2010/2011 visitor season(Table 3). Over 70% of visitors used the Park duringmidDecember tomid January,with high concentrations of visitors in the lowandhighalpine zones (Fig. 7a). During this period, therewere on average 300visitors per day in these locations, with up to 650 visitors per day onsome days in January (Fig. 7a).
Although there were fewer Park and commercial staff thanvisitors, they stayed longer with an average of 100 days per personduring the season. Park staff was distributed among campsites fromthe low alpine zone to the nival/glacial zone and collectivelyaccounted for 3200 staff nights over the whole season. Commercialstaff was concentrated in the base camps in the high alpine zone inthe two Valleys and in the popular Confluencia campsite (3200 m)

Fig. 6. Maps of Aconcagua Park showing: a) people use, b) pack animal use, c) key biophysical features. For a) and b) only legends of main campsites (point shapefiles) are shown.
A. Barros et al. / Journal of Environmental Management 150 (2015) 179e195 189

Fig. 7. Temporal distribution of use of Aconcagua Provincial Park by: a) people, and b) mules, in the Horcones and Vacas Valleys for the 2010/2011 visitor season.
A. Barros et al. / Journal of Environmental Management 150 (2015) 179e195190
in the intermediate alpine zone. The 20 different private companiesoperating in the Park collectively accounted for 12,400 commercialstaff nights.
In contrast to visitors, pack animal use was concentrated in theVacas Valley (10,389 pack animal nights per season) compared tothe Horcones Valley (2928 pack animal nights per season) as aresult of the greater distance between the road head and the basecamp in the Vacas Valley (40 km vs 25 km) (Table 3, Fig. 6b). Over70% of pack animals use these Valleys during December andJanuary with an average of 88mules per day in the Vacas Valley anda maximum of over 170 mules per day during January for bothValleys combined (Fig. 7b).
3.3. Biophysical features of the Park
Based on the location of visitor activities in the Park (Fig. 6a,b),key biophysical features likely to be directly affected by visitor usewere identified. They included alpine vegetation and fauna, waterbodies and glaciated areas (Fig. 6c). With an altitudinal range of1400 m, vegetation in the low and intermediate alpine zones ischaracterized by alpine steppe vegetation, with average plant coverof 40%, and alpine meadows with greater vegetation cover (>80%)but limited distribution (Table 1). While alpine meadows only ac-count for 0.4% of the Park, most trails traverse meadows and allcampsites and grazing areas in the low and intermediate alpinezones intersect meadows (Fig. 6a,b,c). Alpine meadows in Acon-cagua are also important wildlife habitats, including bird nestingareas (Fig. 6c).
Larger meadows and areas with more shrubs in the alpinesteppe are important bird nesting areas and have high bird di-versity. These include the intensively used lower part of the Hor-cones Valley in the low alpine zone and popular campsites in theintermediate alpine zone (Table 1, Fig. 6c). Some of the birds nestingin the Park include species classified as near threatened (NT) by theIUCN (e.g. Phegornis mitchellii e Diademed sandpiper plover, Vulturgryphus e Andean condor) and species restricted to Argentina (e.g.Thinocorus orbignyianus e Grey-brested seed-snipe). The diversityof birds decreases with altitude, with only three species in thenival/glacial zone, all of which are also found in the low and in-termediate alpine zones. The guanacos (L. guanicoe) are mainlyrestricted to areas with low visitor use in the intermediate alpinezone.
Water bodies in the Park include rivers, creeks, springs, alpinemeadow wetlands, creeks and glacier lakes. In the low and inter-mediate alpine zones, all campsites extract water from alpinemeadow wetlands and springs. Above these zones, water forcampsites comes from creeks and snow. In the high altitude zones,campsites are located close to glaciated areas, including rock anddebris-covered glaciers, and snow covered areas near glacier lakeswhich are naturally oligotrophic (Barros, 2004).
3.4. Likely ecological impacts
The type, distribution and level of visitor use, environmentalconditions and Park management actions, influence the likelyseverity of ecological impacts in each zone (Tables 1 and 2). Likely

A. Barros et al. / Journal of Environmental Management 150 (2015) 179e195 191
ecological impacts from litter production and human faeces inwater bodies were reduced in the lower altitude zones by the carryout/fly out policy of the Park agency. In contrast, impacts from litterand human faeces were likely to be greater in campsites in thenival/glacial zone where it is difficult for the Park to control visitoractivities as there are no permanent ranger stations in this zone(Direcci�on de Recursos Naturales, 2009). It is estimated that in thenival/glacial zone, around 200 kg of human faeces were left incampsites during the 2010/2011 summer due to 10% non-compliance with Park policy (Direcci�on de Recursos Naturales,2009).
Water use was higher in the high alpine (627 m3) and low alpinezones (626 m3), due to the services provided to visitors (Table 3). Inthe low and intermediate alpine zones, human waste is managedthrough flush toilets with septic tanks, resulting in large volumes ofblack water discharge (~574 m3) during the season (Table 3). Visitorinfrastructure in base camps in the high alpine zone (i.e. shower fa-cilities and dining tents) contributed to large discharges of untreatedgrey water with an estimated volume of 812 m3 for the season(Table 3). In campsiteswith no flush toilets, there are no regulation ormanagement systems for the large volumes of urine produced(~60 m3 for the season) in the high alpine and nival/glacial zones.
Large amounts of manure (299 tons) and urine (65 m3) werealso produced by pack animals which are often deposited nearwater bodies in the low and intermediate alpine zones. Thisresulted in large additions of nitrogen and phosphorus to thesezones, with an estimated 11 kg of N and 27 kg of P added to theground or water bodies. There were also high additions of nutrients
Fig. 8. Severity of likely impacts from campsite and trail impacts (buffer polygons) on terrestin Horcones Valley; and severity of likely impacts from campsites on water resources for c
from human faeces and urine with an estimated 660 kg of N and48 kg of P per season (Table 3).
Trampling by pack animals and people in the low and interme-diate alpine zones has resulted in numerous parallel informal trailsthat provide access to campsites (Barros et al., 2013). Braidedinformal trails in the low alpine zone were on average 22 m widewhile those in the intermediate alpine zone were 12 m wide,resulting in approximately 71 ha of vegetation directly affected bytrails (Table 3). Likely impacts fromheavy trampling are particularlyimportant in the first part of the Horcones Valley, with high usage ofimportant meadows and bird nesting areas (Table 1, Fig. 6c).
Because there are relatively few campsites (8) in the low andintermediate alpine zones, less vegetation (~11 ha) was directlyaffected by campsites compared to trails in these zones. Grazing bypack animals in campsites increases the area of impact beyond theimmediate area of the campsites as pack animals graze over largerareas (~1.5 km around campsites). Pack animals mainly grazed onalpine meadows but also in the surrounding sparse steppe vege-tation characterized by shrubs, grasses and perennial herbs(Fig. 6b). Visitor use was greater in the low and intermediate alpinezone, with pack animals staying on average at least one night inthese zones (Table 3). Within these lower zones, it was likely thatgrazing impacts were greater in the Vacas Valley compared to theHorcones Valley due to the longer period animals stay in the VacasValley (2.5 days Vacas vs. 1 day Horcones). During peak visitationperiods over 100 mules grazed in the low and intermediate alpinezone campsites in the Vacas Valley (Figs. 6b and 7b). Based on theareas covered by vegetation (210 km2) and the areas used by
rial biodiversity for: a) the whole Park, and b) low and intermediate alpine zones in the) the whole Park, and d) campsites in the high alpine and nival/glacial zones.

A. Barros et al. / Journal of Environmental Management 150 (2015) 179e195192
grazing (~1280 ha, Table 3) it is estimated that at least 6% ofvegetation was likely to be affected by pack animal grazing.
3.5. Severity of likely ecological impacts
When assessing the severity of likely impacts on water re-sources from campsites (Fig. 4), base camps in the high alpine zonewere likely to be the most impacted due to the combination ofintensive visitor use and the vulnerability of these locations(Fig. 8d). The main pressures were high water use, grey waterdischarge, and nutrient addition from manure and urine in camp-sites potentially contaminating glaciers, streams and glacier lakes(Fig. 8c). Campsites that are likely to experience moderate impactsfrom human waste on water resources included some of the highaltitude campsites used by climbers (Fig. 8c). Moderate impacts onwater resources were also likely in the low and intermediate alpinezones in the Vacas Valley due to the large amount of pack animalmanure produced close to streams in alpine meadows (Fig. 8c).
Potential impacts on terrestrial biodiversity were likely in allcampsites up to the intermediate alpine zones. Impacts were likelyhowever, to be greater in the low alpine zone due to the combi-nation of intensive use and the high conservation value of alpinemeadows including high bird species richness and important birdnesting areas (Fig. 8b). The main pressures affecting biodiversityincluded high visitor use (i.e. number of passes by people and packanimals) and the amount of vegetation directly affected by infra-structure and trails. Campsites in the intermediate alpine zonewere less intensively used by visitors, but experienced high use bypack animals and have high conservation value (i.e bird nestingareas, presence of guanacos), and were therefore assessed as likelyto be highly affected (Fig. 8a).
The severity of likely impacts on terrestrial biodiversity fromtrail use were moderate to high in the low and intermediate alpinezones because of the intensive trampling in the few areas withvegetation and higher biodiversity. Following the same pattern asfor campsites, trails in the low altitude zone in the Horcones Valleywere deemed to be the most likely to be impacted, followed bytrails in the intermediate alpine zone in both Valleys (Fig. 8a,b).Overall, a greater area of the Vacas Valley was likely to be impactedthan the Horcones Valley, as there were more areas with alpinemeadows and bird nesting sites as well as receive moderate use byhikers and high use by pack animals (Fig. 6b,c).
4. Discussion
This study demonstrates how a desktop landscape based anal-ysis using data from visitor permits can be combined with otherdata sets to map likely ecological impacts from visitor use in Parks.With the support of GIS, we were able to identify likely ecologicalimpacts across Aconcagua Provincial Park based on levels of use,types of activity and biophysical features. This type of analysis isparticularly useful for protected areas with high visitor loads butlimited resources for assessing impacts. It can be used to prioritizemanagement interventions and better allocate field research andmonitoring efforts (Wardell and Moore, 2005; Castley et al., 2009).
The results fromAconcagua reinforce the importance of not onlycollecting data on how many people visit an area, but also deter-mining visitor distribution, types and amount of use (Hadwen et al.,2007, 2008b). These variables are important as they strongly in-fluence the temporal and spatial patterns of impacts (Monz et al.,2010a). For example, while only 2% of the Park was used by visi-tors, in the low and intermediate alpine zones use was concen-trated in the few areas with vegetation, potentially increasing theseverity of impacts on native biodiversity. Crowding in the lowalpine zone and grazing in the intermediate alpine zone of
Aconcagua can result in impact creep, with visitors often going offtrails (Olive and Marion, 2009; Monz et al., 2010b; Leung et al.,2011; Barros et al., 2013), and dispersed grazing by pack animalsaround campsites (Direcci�on de Recursos Naturales, 2009).
The severity of ecological impacts from localized and disperseduse can vary based on the amount and type of uses, the biophysicalfeatures and existing management systems (Monz et al., 2010a;Newsome et al., 2012). For example, previous research has foundthat trails receiving similar levels and types of use can vary in theseverity of ecological impacts depending on the characteristics ofthe environment (e.g. vegetation type, slope, habitat type, substratetype) (Arrowsmith and Inbakaran, 2002; Dixon et al., 2004;Tomczyk, 2011). In Aconcagua, likely ecological impacts on terres-trial biodiversity in trail areas receiving similar level of use weregreater in alpine meadows; due to their greater susceptibility totrail impacts (Barros et al., 2013), increased grazing pressure frompack animals, and because they are important wildlife habitats.Visitor disturbance in alpine meadows has important ecologicalimplications for the Park including affecting important ecosystemprocesses such as carbon sequestration and water regulation(Squeo et al., 2006; Buono et al., 2010).
The severity of likely impacts on water resources were alsoinfluenced by the level of use with impacts likely to be more severein base camps in the high alpine zone located in debris-coveredglaciers and close to glacier lakes. The associated impact in-dicators for visitor services (e.g. high water consumption and largedischarges of untreated grey water due to shower and dining fa-cilities) combined with the vulnerability of these glacier-fed riversystems, contributed to greater likely impacts in this zone. Nutrientinputs from campsite activities and pack animals manure can affectthe condition of glacier lakes that are naturally oligotrophic due tothe lack of bankside vegetation (Jacobsen et al., 2012) and these canaffect aquatic communities which have limited capacity to recoverfrom this type of disturbance in harsh environments (Brown et al.,2007; Jacobsen et al., 2012; Clitherow et al., 2013). Visitor impactson creeks on alpine meadows in the intermediate alpine zones,which were identified as having moderate impacts, also needspecial consideration. For example, water extraction from thesecreeks can alter the water table depth that provides a regularsupply of water to meadow grasses, affecting in turn meadowsproductivity and water regulation (Clymont et al., 2010).
Cumulative pressure from different visitor activities can in-crease the severity of ecological impacts in specific locations(Newsome et al., 2012). It can also affect the ecological integrity of aprotected area by reducing the functioning of natural processes(Parrish et al., 2003; Shultis, 2006). For example, camping and trailimpacts on vegetation, combinedwith dispersed impacts frompackanimal grazing and visitor trampling off trail in Aconcagua canreduce plant diversity which could subsequently affect ecosystemfunctioning by reducing productivity, nutrient retention andresistance to plant invasions (Smith and Knapp, 2003; Grman et al.,2010). Alteration of water flows through water consumption,nutrient addition through humanwaste andmanure, and dischargeof waste in glacier lakes could potentially result in changes to thefood web structure of water bodies (Hadwen et al., 2008a;Arthington et al., 2010; Clitherow et al., 2013).
The previous limited research assessing visitor impacts on waterresources and vegetation in the Park supports the results of thisdesktop study. In a glacier lake subjected to human disturbance inAconcagua therewas an increase in nitrate and a greater abundance ofalgal species tolerant to pollution compared to a glacier lake with noapparent human disturbance (Barros, 2004). Research on alpinemeadows has found reductions in plant cover and biomass from packanimal grazing (Barros et al., 2014). Research on trail impacts onvegetation found great reductions in vegetation cover due to the

A. Barros et al. / Journal of Environmental Management 150 (2015) 179e195 193
creation of wider trails in alpine meadows (Barros et al., 2013).Although there are nofield studies assessing the impacts of visitor useon native camelids, it is possible that visitors contribute to thedisplacement of these animals as observed in other areas in the Andeswith high levels of visitor and packstock use (Baldi et al., 2004; Maloet al., 2011)
4.1. Management implications
Managing visitors and related activities in Aconcagua ProvincialPark is challenging.Most of the Park is remote, it has limited fundingand currently lacks a management plan. It is currently managedthrough a set of regulations, which are mainly centred on admin-istrative aspects for commercial operators, the provision of recrea-tional opportunities and the safeguarding of mountaineers andhikers (Direcci�on de Recursos Naturales, 2009). Environmentalpractices are not standardized (e.g. carry out systems for humanwaste in the nival/glacial zone), and Park initiatives to monitorconservation values (e.g. bird monitoring) and minimize visitorimpacts (e.g. rehabilitation of alpine meadows heavily degradedfrom trampling and grazing) are mainly through the individual ef-forts of park staff with no guidelines or policies to secure these ef-forts over the longer term (Direcci�on de Recursos Naturales, 2009).The likely impacts identified in the spatial analysis for Aconcaguacan assist the Park agency in selecting state and response indicatorsfor monitoring and managing visitor impacts (Niemeijer and deGroot, 2008). The results can be used to identify practices thatneed to be modified and/or improved to minimize impacts.
In the low alpine zone, for example, limiting trampling impactsand monitoring impacts using existing protocols (Monz et al.,2010b; Leung et al., 2011) should be prioritized. In the intermedi-ate alpine zones, the effects of grazing by pack animals on alpinemeadows should be monitored, including parameters such asvegetation structure and productivity (Cole, 2004). Reducinggrazing intensity by limiting the number of animals with rotationalor deferred grazing would reduce impacts, strategies that havealready been implemented in some parks in North America (Mooreet al., 2000). Monitoring water systems, including changes inphysico-chemical properties in Aconcagua should be prioritized,particularly in glacier lakes in the high alpine zone due to their lowresistance to environmental change (Pearce et al., 2005; Clitherowet al., 2013).
For campsites with high usage, current human waste systemsand waste discharge should be minimized by using methodsalready tested in high altitude protected areas as in the RockyMountains National Park in United States (American Alpine Club,2010). To increase visitor compliance, the implementation ofenvironmental education programs including the use of minimumimpact codes is important (Marion and Reid, 2007).
4.2. Conclusions and main limitations
This study was able to assess the severity of likely ecologicalimpacts on the conservation values of Aconcagua Park based onenvironmental and visitor data information. Likely impacts onwater resources were more severe in campsites in the high alpinezone while impacts on terrestrial biodiversity were more severe inthe low and intermediate alpine zones. This has importantecological implications, in particular for alpine meadows andglacier lakes due to the high visitor pressure, their susceptibility tovisitor activities and the ecosystem services that they provide.
The results of this desktop landscape based analysis is the firststep in identifying where impacts from visitor activities may bemore severe and assisting protected area agencies locate areas tofocus monitoring andmanagement actions on the ground (Hadwen
et al., 2012). The method used here can be adapted to other large,poorly resourced, protected areas that have visitor data to identifylikely impacts (Wardell and Moore, 2005; Hadwen et al., 2007).Visitor data can be obtained for a variety of sources, including frompermit fees or registration books, where they contain data on trailareas/routes used by visitors, party size, days of entry and length ofthe activity.
The analyses used here to determine the severity indices forAconcagua Park were not able to capture some important factorsaffecting the severity of ecological impacts, including the environ-mental and temporal variability of visitor use due to limitations inthe datasets used (Hadwen et al., 2012). Within the five monthvisitor season in Aconcagua visitor use is concentrated betweenmidDecember and mid February which coincides with the peak periodof vegetation growth and reproductive periods for many bird spe-cies, hence potentially increasing the severity of ecological impacts.
Although this study considered variations in the severity oftrampling impacts between pack animals and people, it was notable to address variations in human behaviour, which affect theseverity of impacts (Turner, 2001; Walden-Schreiner and Leung,2013) Mountaineering expeditions following minimum impactcodes such as “Leave No Trace”, for example, are likely to produceless impacts on the environment than other types of mountainexpeditions through the careful consideration of campsite loca-tions, hiking and climbing routes and waste disposal (Pickering andBarros, in press).
New policies should be implemented including securing addi-tional funds from visitor revenue and the Government to facilitatethe development and implementation of a management plan. Asoutlined above, the results of this desktop landscape based analysiscould be used to set up guidelines for establishing monitoringprograms and prioritising management initiatives to minimisevisitor impacts in protected areas.
Acknowledgments
We thank Direcci�on de Recursos Naturales, IANIGLA, IDR, Gus-tavo Aloy, Laura Zalazar, Daniel Rada, Ester Escobar, Pablo Sampano,Ruben Massarelli, Sebastian Rossi, Silvia Delgado, Clara Rubio,Facundo Martinez, Laura Sorli, Soledad Brandi, Pablo Berlanga,Daniel Rodriguez, Jorge Gonnet, Ulises Lardelli, Ramon Olivera,Diego Ferrer, Jesus Lucero, Gabriela Keil, Hugo Freschi, Martin Perezfor providing and/or assisting in collecting the data to conduct thisresearch. We appreciate the valuable comments made by Dr. WadeHadwen and Dr. Clare Morrison to an earlier version of thismanuscript. We appreciate the support provided in the field byPark staff of Aconcagua. Funding was provided by Griffith Univer-sity, Queensland, Australia.
Appendix A. Supplementary data
Supplementary data related to this article can be found at http://dx.doi.org/10.1016/j.jenvman.2014.11.004.
References
Almeida, M., Butler, D., Friedler, E., 1999. At-source domestic wastewater quality.Urban Water 1, 49e55.
American Alpine Club, 2010. Exit Strategies: Managing Human Waste in the Wild,30 e 31 July, 2010. American Alpine Club, Golden, United States.
Arnberger, A., Hinterberger, B., 2003. Visitor monitoring methods for managingpublic use pressures in the Danube floodplains National Park, Austria. J. Nat.Conserv. 11, 260e267.
Arnberger, A., Haider, W., Brandenburg, C., 2005. Evaluating visitor-monitoringtechniques: a comparison of counting and video observation data. Environ.Manag. 36, 317e327.

A. Barros et al. / Journal of Environmental Management 150 (2015) 179e195194
Arrowsmith, C., Inbakaran, R., 2002. Estimating environmental resiliency for theGrampians National Park, Victoria, Australia: a quantitative approach. Tour.Manag. 23, 295e309.
Arroyo, M.T.K., Armesto, J.J., Villagran, C., 1981. Plant phenological patterns in thehigh Andean Cordillera of central Chile. J. Ecol. 69, 205e223.
Arthington, A.H., Naiman, R.J., McClain, M.E., Nilsson, C., 2010. Preserving thebiodiversity and ecological services of rivers: new challenges and researchopportunities. Freshw. Biol. 55, 1e16.
Asencio, H., 2008. Informe preliminar sobre las campa~nas de relevamiento ymonitoreo de poblaciones de guanaco en la quebrada del Río Vacas, �areaintangible del Parque Provincial Aconcagua. Direcci�on de Recursos Naturales,Secretaría de Ambiente, Gobierno de Mendoza, Mendoza, Argentina.
Bahaire, T., Elliott-White, M., 1999. The application of geographical information sys-tems (GIS) in sustainable tourism planning: a review. J. Sustain. Tour. 7, 159e174.
Baldi, R., Pelliza-Sbriller, A., Elston, D., Albon, S., 2004. High potential for compe-tition between guanacos and sheep in Patagonia. J. Wildl. Manag. 68, 924e938.
Baldi, R., Novaro, A., Walker, S., Funes, M., Ferrando, P., Failla, M., Carmanchahi, P.,2010. Guanaco management in patagonian rangelands: a conservation oppor-tunity on the brink of collapse. In: Toit, J.T., Kock, R., Deutsch, J.C. (Eds.), WildRangelands: Conserving Wildlife while Maintaining Livestock in Semi-aridEcosystem. Blackwell Publishing, Oxford, UK, pp. 266e290.
Balmford, A., Beresford, J., Green, J., Naidoo, R., Walpole, M., Manica, A., 2009.A global perspective on trends in nature-based tourism. PLoS Biol. 7, e1000144.
Barcena, J.R., 1998. El Tambo Real de los Ranchillos, Mendoza, Argentina. Xama 6-11,1e52.
Barros, A., 2004. Impacto del Uso Público sobre el Suelo, la Vegetaci�on y lasComunidades Acu�aticas, Quebrada de Horcones, Parque Provincial Aconcagua(Mendoza, Argentina). Masters Thesis. Centro de Zoologia Aplicada. UniversidadNacional de C�ordoba, C�ordoba, Argentina, p. 79.
Barros, A., 2014. Ecological Impacts of Visitor Use, Aconcagua Provincial Park,Argentina. PhD Thesis. Griffith University, Australia, p. 208.
Barros, A., Pickering, C.M., 2014a. Non-native plant invasion in relation to tourismuse of Aconcagua Park, Argentina, the highest protected area in the SouthernHemisphere. Mt. Res. Dev. 34, 13e26.
Barros, A., Gonnet, J., Pickering, C., 2013. Impacts of informal trails on vegetationand soils in the highest protected area in the Southern Hemisphere. J. Environ.Manag. 127, 50e60.
Barros, A., Pickering, C., Renison, D., 2014. Short-term effects of pack animal grazingexclusion from Andean alpine meadows. Arct. Antarct. Alp. Res. 46, 41e51.
Beeco, J.A., Brown, G., 2013. Integrating space, spatial tools, and spatial analysis intothe human dimensions of parks and outdoor recreation. Appl. Geogr. 38, 76e85.
Benitez, S., 2001. Visitor use fees and concession systems in protected areas: Gal-apagos National Park case study. In: Drumm, A., Troya, R. (Eds.), EcotourismProgram Technical Report Series Number 3. The Nature Conservancy, Virginia,USA.
Borgnia, M., Vil�a, B.L., Cassini, M.H., 2008. Interaction between wild camelids andlivestock in an Andean semi-desert. J. Arid Environ. 72, 2150e2158.
Bridle, K.L., Kirkpatrick, J.B., 2003. Impacts of nutrient additions and digging forhuman waste disposal in natural environments, Tasmania, Australia. J. Environ.Manag. 69, 299e306.
Brown, G., Weber, D., 2011. Public participation GIS: a newmethod for national parkplanning. Landsc. Urban Plan. 102, 1e15.
Brown, L.E., Hannah, D.M., Milner, A.M., 2007. Vulnerability of alpine stream biodi-versity to shrinking glaciers and snowpacks. Glob. Change Biol. 13, 958e966.
Buckley, R., 2003. Ecological indicators of tourist impacts in parks. J. Ecotourism 2,54e66.
Buckley, R., 2004. Environmental Impacts of Ecotourism. CAB International, London,UK.
Buckley, R., 2009a. Ecotourism: Principles and Practices. CAB International, London,UK.
Buckley, R., 2009b. Parks and tourism. PLoS Biol. 7, e1000143.Buono, G., Oesterheld, M., Nakamatsu, V., Paruelo, J.M., 2010. Spatial and temporal
variation of primary production of Patagonian wet meadows. J. Arid Environ. 74,1257e1261.
Castley, J.G., Hill, W., Pickering, C.M., 2009. Developing ecological indicators ofvisitor use of protected areas: a new integrated framework from Australia.Australas. J. Environ. Manag. 16, 196e207.
Cessford, G., Muhar, A., 2003. Monitoring options for visitor numbers in nationalparks and natural areas. J. Nat. Conserv. 11, 240e250.
Clitherow, L.R., Carrivick, J.L., Brown, L.E., 2013. Food web structure in a harshglacier-fed river. PLoS One 8, e60899.
Clymont, A., Hayashi, M., Bentley, L., Muir, D., Ernst, E., 2010. Groundwater flow andstorage within an alpine meadow-talus complex. Hydrol. Earth Syst. Sci. 14,859e872.
Cole, D.N., 2004. Impacts of hiking and camping on soils and vegetation: a review.In: Buckley, R. (Ed.), Environmental Impacts of Ecotourism. CAB International,London, UK, pp. 41e60.
Cole, D.N., Spildie, D.R., 1998. Hiker, horse and llama trampling effects on nativevegetation in Montana, USA. J. Environ. Manag. 53, 61e71.
Cole, D.N., Wagtendonk, W.V., Mclaran, M.P., Moore, P.E., Neil, K., 2004. Response ofmountain meadows to grazing by recreation packstock. J. Range Manag. 57,153e160.
Cole, D.N., Foti, P., Brown, M., 2008. Twenty years of change on campsites in thebackcountry of Grand Canyon National Park. Environ. Manag. 41, 959e970.
Corte, A.E., Espizua, L.E., 1981. Inventario de glaciares de la cuenca del río Mendoza.IANIGLA e Consejo Nacional de Investigaciones Científicas y T�ecnicas, BuenosAires, Argentina.
Cromley, R.G.,1996. A comparison of optimal classification strategies for choroplethicdisplays of spatially aggregated data. Int. J. Geogr. Inform. Syst. 10, 405e424.
D'Antonio, A., Monz, C., Newman, P., Lawson, S., Taff, D., 2013. Enhancing the utilityof visitor impact assessment in parks and protected areas: a combined social-eecological approach. J. Environ. Manag. 124, 72e81.
De Aranzabal, I., Schmitz, M.F., Pineda, F.D., 2009. Integrating landscape analysis andplanning: a multi-scale approach for oriented management of tourist recrea-tion. Environ. Manag. 44, 938e951.
Departamento General de Irrigaci�on, 2011. Estaci�on Nivometeorol�ogica Horcones,Parque Provincial Aconcagua, Mendoza, Argentina. Departamento General deIrrigacion, Mendoza, Argentina.
Direcci�on de Recursos Naturales, 2009. Documento de Avance: Plan de ManejoParque Provincial Aconcagua. Unpublished Report. Direcci�on de Recursos Nat-urales, Secretaría de Ambiente, Gobierno de Mendoza, Mendoza, Argentina.
Direcci�on de Recursos Naturales, 2011. Estadísticas de visitantes del Parque Pro-vincial 2002e2011. Unpublished report. Direcci�on de Recursos Naturales, Sec-retaría de Ambiente, Gobierno de Mendoza, Mendoza, Argentina.
Direcci�on de Recursos Naturales, 2013. Sistema de Areas Naturales Protegidas 2013.Unpublished Report. Secretaria de Ambiente y Desarrollo Sustentable, Direcci�onde Recursos Naturales, Secretaría de Ambiente, Gobierno de Mendoza, Men-doza, Argentina.
Dixon, G., Hawes, M., McPherson, G., 2004. Monitoring and modelling walking trackimpacts in the Tasmanian Wilderness World Heritage Area, Australia. J. Environ.Manag. 71, 305e320.
Eagles, P.F., 2013. Research priorities in park tourism. J. Sustain. Tour. 1e22.EPAS, 2008. Informe Tecnico de Laboratorio N� 040/09 Parque Provincial Aconca-
gua. Ente Provincial del Agua y Saneamiento, Mendoza, Argentina.Fernandez-Juricic, E., Jimenez, M.D., Lucas, E., 2001. Alert distance as an alternative
measure of bird tolerance to human disturbance: implications for park design.Environ. Conserv. 28, 263e269.
Ferrer, D., Lardelli, O., Olivera, R., 2010. Propuesta para declarar sitio AICA al ParqueProvincial Aconcagua y el Monumento Natural Puente del Inca, Las Heras,Mendoza, Argentina. Biol�ogica 14, 71e75.
Fuentes Allende, N.E., 2011. Efecto del Turismo en la Conducta del Guanaco en elArea del Parque Nacional Torres del Paine. Undergraduate Thesis. Facultad deCiencias Agron�omicas. Universidad de Chile, Santiago de Chile, Chile.
Geneletti, D., 2008. Impact assessment of proposed ski areas: a GIS approachintegrating biological, physical and landscape indicators. Environ. ImpactAssess. Rev. 28, 116e130.
Geneletti, D., Dawa, D., 2009. Environmental impact assessment of mountaintourism in developing regions: a study in Ladakh, Indian Himalaya. Environ.Impact Assess. Rev. 29, 229e242.
Goodwin, K., Loso, M.G., Braun, M., 2012. Glacial transport of human waste andsurvival of fecal bacteria on Mt. McKinley's Kahiltna Glacier, Denali NationalPark, Alaska. Arct. Antarct. Alp. Res. 44, 432e445.
Grman, E., Lau, J.A., Schoolmaster, D.R., Gross, K.L., 2010. Mechanisms contributingto stability in ecosystem function depend on the environmental context. Ecol.Lett. 13, 1400e1410.
Groves, C.R., Jensen, D.B., Valutis, L.L., Redford, K.H., Shaffer, M.L., Scott, J.M.,Baumgartner, J.V., Higgins, J.V., Beck, M.W., Anderson, M.G., 2002. Planning forbiodiversity conservation: putting conservation science into practice. BioSci-ence 52, 499e512.
Hadwen, W.L., Bunn, S.E., Arthington, A.H., Mosisch, T.D., 2005. Within-lakedetection of the effects of tourist activities in the littoral zone of oligotrophicdune lakes. Aquatic Ecosyst. Health Manag. 8, 159e173.
Hadwen, W.L., Hill, W., Pickering, C.M., 2007. Icons under threat: why monitoringvisitors and their ecological impacts in protected areas matters. Ecol. Manag.Restor. 8, 177e181.
Hadwen, W.L., Arthington, A.H., Boon, P.I., 2008a. Detecting Visitor Impacts in andAround Aquatic Ecosystems within Protected Areas. Sustainable TourismCooperative Research Centre, Gold Coast, Australia.
Hadwen, W.L., Hill, W., Pickering, C.M., 2008b. Linking visitor impact research tovisitor impact monitoring in protected areas. J. Ecotourism 7, 87e93.
Hadwen, W.L., Boon, P., Arthington, A., 2012. Not for all seasons: why timing iscritical in the design of visitor impact monitoring programs for aquatic siteswithin protected areas. Australas. J. Environ. Manag. 19, 241e254.
Hallo, J.C., Beeco, J.A., Goetcheus, C., McGee, J., McGehee, N.G., Norman, W.C., 2012.GPS as a method for assessing spatial and temporal use distributions of nature-based tourists. J. Travel Res. 51, 591e606.
Hammitt, W.E., Cole, D.N., 1998. Wildland Recreation: Ecology and Management.John Wiley & Sons, New York, USA.
Heil, L., Fern�andez-Juricic, E., Renison, D., Cingolani, A.M., Blumstein, D.T., 2007.Avian responses to tourism in the biogeographically isolated high C�ordobaMountains, Argentina. Biodivers. Conserv. 16, 1009e1026.
Herrmann, T.M., Costina, M.I., Costina, A.M.A., 2010. Roost sites and communalbehaviour of Andean condors in Chile. Geogr. Rev. 100, 246e262.
Hill, W., Pickering, C.M., 2006. Vegetation associated with different walking tracktypes in the Kosciuszko alpine area, Australia. J. Environ. Manag. 78, 24e34.
IANIGLA, 2012. Inventario nacional de glaciares. Subcuencas de los ríos de lasCuevas y de las Vacas, Cuenca del río Mendoza. Provincia de Mendoza. IANI-GLA-CONICET, Mendoza, Argentina.

A. Barros et al. / Journal of Environmental Management 150 (2015) 179e195 195
Jacobsen, D., Milner, A.M., Brown, L.E., Dangles, O., 2012. Biodiversity under threatin glacier-fed river systems. Nat. Clim. Change 2, 361e364.
Kliskey, A.D., 2000. Recreation terrain suitability mapping: a spatially explicitmethodology for determining recreation potential for resource use assessment.Landsc. Urban Plan. 52, 33e43.
Leung, Y.-F., Marion, J.L., 1996. Trail degradation as influenced by environmentalfactors: a state of the knowledge review. J. Soil Water Conserv. 51, 130e136.
Leung, Y.-F., Marion, J.L., 2000. Recreation impacts and management in wilderness:a state-of knowledge review. In: Cole, D.N., McCool, S.F., Borrie, W.T.,O'Loughlin, J. (Eds.), Wilderness Science in a Time of Change Conference e
Volume 5, Wilderness Ecosystems, Threats, and Management. USDA ForestService Rocky Mountain, Ogden, USA, pp. 23e48.
Leung, Y.-F., Newburger, T., Jones, M., Kuhn, B., Woiderski, B., 2011. Developing amonitoring protocol for visitor-created informal trails in Yosemite NationalPark, USA. Environ. Manag. 47, 93e106.
Liddle, M., 1997. Recreation Ecology: the Ecological Impact of Outdoor Recreationand Ecotourism. Chapman and Hall, London, UK.
Loso, M.G., Goodwin, K., Williams, H., Johnson, R., English, D., 2012. Glacial Trans-port of Human Waste and Survival of Fecal Bacteria on Mt. Mckinley's KahiltnaGlacier, Denali National Park, Alaska. Natural Resource Technical Report NPS/DENA/NRTR. National Park Service, U.S. Department of the Interior, DenaliNational Park and Preserve, Anchorage, USA.
Malo, J.E., Acebes, P., Traba, J., 2011.Measuring ungulate tolerance to humanwithflightdistance: a reliable visitor management tool? Biodivers. Conserv. 20, 3477e3488.
Manning, T., 1999. Indicators of tourism sustainability. Tour. Manag. 20, 179e181.Marion, J.L., Reid, S.E., 2007. Minimising visitor impacts to protected areas: the ef-
ficacy of low impact education programmes. J. Sustain. Tour. 15, 5e27.Matsui, A., Inoue, Y., Asai, Y., 2003. The effect of putting the bag with collecting feces
and urea (“equine diaper”) to the ammonia gases concentrate in horse's pen.J. Equine Sci. 14, 75e79.
Mendez, E., Martinez Carretero, E., Peralta, I., 2006. La vegetacion del Parque Pro-vincial Aconcagua (Altos Andes Centrales de Mendoza, Argentina). Boletin laSoc. Argent. Bot. 41, 41e49.
Milchunas, D.G., Lauenroth, W.K., 1993. Quantitative effects of grazing on vegetationand soils over a global range of environments. Ecol. Monogr. 63, 327e366.
Monz, C.A., Cole, D.N., Leung, Y.F., Marion, J.L., 2010a. Sustaining visitor use inprotected areas: Future opportunities in recreation ecology research based onthe USA experience. Environ. Manag. 45, 551e562.
Monz, C.A., Marion, J.L., Goonan, K.A., Manning, R.E., Wimpey, J., Carr, C., 2010b.Assessment and monitoring of recreation impacts and resource conditions onmountain summits: examples from the Northern Forest. U. S. A. Mt. Res. Dev.30, 332e343.
Monz, C.A., Pickering, C.M., Hadwen, W.L., 2013. Recent advances in recreationecology and the implications of different relationships between recreation useand ecological impacts. Front. Ecol. Environ. http://dx.doi.org/10.1890/120358.
Moore, P., Cole, D.N., Van Wagtendonk, J., McClaran, M.P., McDougald, N., 2000.Meadow Response to Pack Stock Grazing in the Yosemite Wilderness: Inte-grating Research and Management. USDA Forest Service Proceedings RMRS-P-15, Vol. 5, Fort Collins, USA, pp. 160e163.
Nepal, S.K., Way, P., 2007. Comparison of vegetation conditions along two back-country trails in Mount Robson Provincial Park, British Columbia (Canada).J. Environ. Manag. 82, 240e249.
Newsome, D., Cole, D.N., Marion, J.L., 2004. Environmental impacts associated withrecreational horse-riding. In: Buckley, R. (Ed.), Environmental Impacts ofEcotourism. CAB International, London, UK, pp. 61e82.
Newsome, D., Moore, S.A., Dowling, R.K., 2012. Natural Area Tourism: Ecology,Impacts and Management. Channel View Publications, New York, United States.
Niemeijer, D., de Groot, R.S., 2008. A conceptual framework for selecting environ-mental indicator sets. Ecol. Indic. 8, 14e25.
Olive, N.D., Marion, J.L., 2009. The influence of use-related, environmental, andmanagerial factors on soil loss from recreational trails. J. Environ. Manag. 90,1483e1493.
Olivera,R., Lardelli, U., 2009.AvesdeAconcaguayPuentedel Inca,Mendoza,Argentina,Lista comentada. Publicaciones especiales El Arunco, Santa Fe, Argentina.
Orams, M.B., 2002. Feeding wildlife as a tourism attraction: a review of issues andimpacts. Tour. Manag. 23, 281e293.
Otto, M., Scherer, D., Richters, J., 2011. Hydrological differentiation and spatial dis-tribution of high altitude wetlands in a semi-arid Andean region derived fromsatellite data. Hydrol. Earth Syst. Sci. 15, 1713e1727.
Parrish, J.D., Braun, D.P., Unnasch, R.S., 2003. Are we conserving what we say weare? Measuring ecological integrity within protected areas. BioScience 53,851e860.
Parsons, D., Stohlgren, T., Kraushaar, J., 1982. Wilderness permit accuracy: differ-ences between reported and actual use. Environ. Manag. 6, 329e335.
Pearce, D.A., Van Der Gast, C.J., Woodward, K., Newsham, K.K., 2005. Significantchanges in the bacterioplankton community structure of a maritime Antarcticfreshwater lake following nutrient enrichment. Microbiology 151, 3237e3248.
Petrosillo, I., Zurlini, G., Grato, E., Zaccarelli, N., 2006. Indicating fragility of socio-ecological tourism-based systems. Ecol. Indic. 6, 104e113.
Pickering, C.M., 2010. Ten factors that affect the severity of environmental impactsof visitors in protected areas. Ambio 39, 70e77.
Pickering, C.M., Barros, A., 2014. Environmental and physical impacts of moun-taineering. In: Musa, G., Carr, A., Higham, J. (Eds.), Mountaineering Tourism.Routledge, Oxford, UK (In press).
Pickering, C.M., Buckley, R.C., 2003. Swarming to the summit.Mt. Res.Dev. 23, 230e233.
Pickering, C.M., Growcock, A.J., 2009. Impacts of experimental trampling on tallalpine herbfields and subalpine grasslands in the Australian Alps. J. Environ.Manag. 91, 532e540.
Pickering, C.M., Hill,W., 2007. Impacts of recreation and tourismonplant biodiversityand vegetation in protected areas in Australia. J. Environ. Manag. 85, 791e800.
Pickering, C., Mount, A., 2010. Do tourists disperse weed seed? A global review ofunintentional human-mediated terrestrial seed dispersal on clothing, vehiclesand horses. J. Sustain. Tour. 18, 239e256.
Pickering, C.M., Hill, W., Newsome, D., Leung, Y.-F., 2010. Comparing hiking,mountain biking and horse riding impacts on vegetation and soils in Australiaand the United States of America. J. Environ. Manag. 91, 551e562.
Pickering, C.M., Rossi, S., Barros, A., 2011. Assessing the impacts of mountain bikingand hiking on subalpine grassland in Australia using an experimental protocol.J. Environ. Manag. 92, 3049e3057.
Prideaux, B., Timothy, D., Cooper, M., 2009. Introducing river tourism: physical,ecological and human aspects. In: Prideaux, P., Cooper, M. (Eds.), River Tourism.CAB International, London, UK, pp. 1e22.
Priskin, J., 2001. Assessment of natural resources for nature-based tourism: the caseof the central coast region of Western Australia. Tour. Manag. 22, 637e648.
Puig, S., Videla, F., Cona, M.I., Monge, S.A., 2001. Use of food availability by guanacos(Lama guanicoe) and livestock in Northern Patagonia (Mendoza, Argentina).J. Arid Environ. 47, 291e308.
Quiroga, S.G., 1996. Propuesta de Plan de Manejo para el Parque Provincial Acon-cagua. Mendoza, Argentina. Unpublished Masters Thesis. Consejo de Inves-tigaciones de la Universidad Nacional de Cuyo, Mendoza, p. 182.
Rada, D., Manzur, A., Rodriguez, D., 2007. An�alisis econ�omico del funcionamientodel Parque Provincial Aconcagua. Ministerio de Ambiente y Obras Publicas,Direcci�on de Recursos Naturales Renovables, Mendoza, Argentina.
Roodbergen, M., van der Werf, B., H€otker, H., 2012. Revealing the contributions ofreproduction and survival to the Europe-wide decline in meadow birds: reviewand meta-analysis. J. Ornithol. 153, 53e74.
Rundle, S., 2002. Monitoring Low Volume Walker Use of a Remote Mountain Range:a Case Study of the Arthur Range, Tasmania, Australia, Proceedings of the FirstConference on Monitoring and Management of Visitor Flows in Recreationaland Protected Areas. University of Natural Resources and Applied Life Sciences,Vienna, pp. 53e58.
Salisbury, R., Hawley, E., 2007. The Himalaya by the Numbers: a Statistical Analysis ofMountaineering in the Nepal Himalaya. The American Alpine Club, Golden, USA.
Shultis, J.D., 2006. Changing conceptions of protected areas and conservation:linking conservation, ecological integrity and tourism management. J. Sustain.Tour. 14, 223e227.
Sirakaya, E., Jamal, T., Choi, H.-S., 2001. Developing indicators for destination sus-tainability. In: Weaver, D. (Ed.), The Encyclopedia of Ecotourism. CAB Interna-tional, London, UK, pp. 411e432.
Smith, M.D., Knapp, A.K., 2003. Dominant species maintain ecosystem functionwith non-random species loss. Ecol. Lett. 6, 509e517.
Squeo, F.A., Warner, B.G., Aravena, R., Espinoza, D., 2006. Bofedales: high altitudepeatlands of the central Andes. Rev. Chil. Hist. Nat. 79, 245e255.
Steven, R., Pickering, C., Castley, J.G., 2011. A review of the impacts of nature basedrecreation on birds. J. Environ. Manag. 92, 2287e2294.
Tao, J., Mancl, K., 2008. Estimating Manure Production, Storage Size, and LandApplication Area. Agriculture and Natural Resources Fact Sheet. The Ohio StateUniversity Extension, Columbus, USA.
Tomczyk, A.M., 2011. A GIS assessment and modelling of environmental sensitivity ofrecreational trails: thecaseofGorceNationalPark,Poland.Appl.Geogr. 31,339e351.
Turner, R., 2001. Visitor Behaviors and Resource Impacts at Cadillac Mountain,Acadia National Park. PhD. Thesis. The University of Maine, New York, USA.
Vinneras, B., 2002. Possibilities for Sustainable Nutrient Recycling by Faecal Sepa-ration Combined with Urine Diversion. PhD. Thesis. Swedish University ofAgricultural Sciences, Uppsala, Sweden.
Walden-Schreiner, C., Leung, Y.-F., 2013. Spatially characterizing visitor use and itsassociation with informal trails in Yosemite valley meadows. Environ. Manag.52, 163e178.
Ward, J., Hughey, K., Urlich, S., 2002. A framework for managing the biophysicaleffects of tourism on the natural environment in New Zealand. J. Sustain. Tour.10, 239e259.
Wardell, M.J., Moore, S.A., 2005. Collection, storage and application of visitor usedata in protected areas: guiding principles and case studies. SustainableTourism Cooperative Tourism Research, Gold Coast, Australia.
Weaver, T., Dale, D., 1978. Trampling effects of hikers, motorcycles and horses inmeadows and forests. J. Appl. Ecol. 15, 451e457.
Westendorf, M., Krogmann, U., 2009. Horses and Manure. Fact Sheet FS036. RutgersUniversity, New Brunswick, Germany.
White, D.D., Waskey, M.T., Brodehl, G.P., Foti, P.E., 2006. A comparative study ofimpacts to mountain bike trails in five common ecological regions of thesouthwestern U.S. J. Park Recreat. Adm. 24, 21e41.
Wilson, J.P., Seney, J.P., 1994. Erosional impact of hikers, horses, motorcycles, andoff-road bicycles on mountain trails in Montana. Mt. Res. Dev. 77e88.
Wimpey, J.F., Marion, J.L., 2010. The influence of use, environmental and managerialfactors on the width of recreational trails. J. Environ. Manag. 91, 2028e2037.
Zalazar, L., Aloy, G., Sorli, L., Brandi, S., Barros, A., 2007. Mapa de Vegetaci�on delParque Provincial Aconcagua. Instituto de Desarrollo Rural and Direccion deRecursos Naturales de Mendoza, Mendoza, Argentina.
Zalba, S.M., Cozzani, N.C., 2004. The impact of feral horses on grassland birdcommunities in Argentina. Anim. Conserv. 7, 35e44.
Copyright © 2022 FDOKUMEN