Design Optimization of Axial Hydraulic Turbine for Very Low ...
11
Energy Procedia 68 (2015) 263 – 273 Available online at www.sciencedirect.com ScienceDirect 1876-6102 © 2015 The Authors. Published by Elsevier Ltd. This is an open access article under the CC BY-NC-ND license (http://creativecommons.org/licenses/by-nc-nd/4.0/). Peer-review under responsibility of Scientific Committee of ICSEEA 2014 doi:10.1016/j.egypro.2015.03.255 2nd International Conference on Sustainable Energy Engineering and Application, ICSEEA 2014 Design optimization of axial hydraulic turbine for very low head application Abdul Muis a,b, *, Priyono Sutikno a , Aryadi Soewono a , Firman Hartono a ᵃBandung Institute of Technology, Jalan Ganesha 10, Bandung, 40132, Indonesia ᵇTadulako University, Jalan Soekarno-Hatta, Palu, 94118, Indonesia Abstract Studies are conducted on axial hydraulic turbine for very low head application which operates on low speed. Design optimization is generated by optimizing the blade airfoil and blade cascade during development of the turbine blades. Blade airfoil is optimized to obtain optimum value of ratio of Lift coefficient Cl and Drag coefficient Cd, in the range of turbine operation by utilizing of XFOIL that controlled via MATLAB. These airfoils are used to develop the blade cascade. To increase the benefits of fluid flow passing through the turbine blades, the analysis and optimization of the blade cascade is conducted. Vortex panel method is used to analyze the fluid flow inside cascade to gain the maximum of the lift force, in order to optimize the potential power of the fluid that can be utilized by the turbine rotor. The cascade optimization is including arrangement of the incidence angle of the cascade to reduce cascade losses and blade loading by applying the concept of shock-free inflow. Numerical analyses are conducted to determine the performance of the designed turbine with the commercial CFD. The results of numerical simulations show that the turbine can be operated at a maximum efficiency of 91% at various ranges of flow rates. Keywords: hydraulic turbine; optimization; very low head; matlab; vortex panel method 1. Introduction One of the major barriers in utilization of the potential energy of the fluid flow is the limited ability of the conventional turbines to exploit the low head water flow. If there are any, it required a high investment value and * Corresponding author. Tel.: +62-812-427-2464 E-mail address: [email protected]; [email protected] © 2015 The Authors. Published by Elsevier Ltd. This is an open access article under the CC BY-NC-ND license (http://creativecommons.org/licenses/by-nc-nd/4.0/). Peer-review under responsibility of Scientific Committee of ICSEEA 2014
-
Upload
khangminh22 -
Category
Documents
-
view
3 -
download
0
Transcript of Design Optimization of Axial Hydraulic Turbine for Very Low ...
Energy Procedia 68 ( 2015 ) 263 – 273
Available online at www.sciencedirect.com
ScienceDirect
1876-6102 © 2015 The Authors. Published by Elsevier Ltd. This is an open access article under the CC BY-NC-ND license (http://creativecommons.org/licenses/by-nc-nd/4.0/).Peer-review under responsibility of Scientific Committee of ICSEEA 2014doi: 10.1016/j.egypro.2015.03.255
2nd International Conference on Sustainable Energy Engineering and Application, ICSEEA 2014
Design optimization of axial hydraulic turbine for very low head application
Abdul Muisa,b,*, Priyono Sutiknoa, Aryadi Soewonoa, Firman Hartonoa ᵃBandung Institute of Technology, Jalan Ganesha 10, Bandung, 40132, Indonesia
ᵇTadulako University, Jalan Soekarno-Hatta, Palu, 94118, Indonesia
Abstract
Studies are conducted on axial hydraulic turbine for very low head application which operates on low speed. Design optimization is generated by optimizing the blade airfoil and blade cascade during development of the turbine blades. Blade airfoil is optimized to obtain optimum value of ratio of Lift coefficient Cl and Drag coefficient Cd, in the range of turbine operation by utilizing of XFOIL that controlled via MATLAB. These airfoils are used to develop the blade cascade. To increase the benefits of fluid flow passing through the turbine blades, the analysis and optimization of the blade cascade is conducted. Vortex panel method is used to analyze the fluid flow inside cascade to gain the maximum of the lift force, in order to optimize the potential power of the fluid that can be utilized by the turbine rotor. The cascade optimization is including arrangement of the incidence angle of the cascade to reduce cascade losses and blade loading by applying the concept of shock-free inflow. Numerical analyses are conducted to determine the performance of the designed turbine with the commercial CFD. The results of numerical simulations show that the turbine can be operated at a maximum efficiency of 91% at various ranges of flow rates. © 2015 The Authors. Published by Elsevier B.V. Peer-review under responsibility of Scientific Committee of ICSEEA 2014.
Keywords: hydraulic turbine; optimization; very low head; matlab; vortex panel method
1. Introduction
One of the major barriers in utilization of the potential energy of the fluid flow is the limited ability of the conventional turbines to exploit the low head water flow. If there are any, it required a high investment value and
* Corresponding author. Tel.: +62-812-427-2464
E-mail address: [email protected]; [email protected]
© 2015 The Authors. Published by Elsevier Ltd. This is an open access article under the CC BY-NC-ND license (http://creativecommons.org/licenses/by-nc-nd/4.0/).Peer-review under responsibility of Scientific Committee of ICSEEA 2014
264 Abdul Muis et al. / Energy Procedia 68 ( 2015 ) 263 – 273
made the utilization of the low head flow becomes unattractive. Types of turbine that are often used for this purpose is a Kaplan or Bulb turbine type which can work in the range of 2 to 40 meters head. But because of these turbines require regulating the flow before and after of the turbine to work optimally, the turbine application becomes costly for the construction of the complex system turbine. To overcome this limitation, the turbine for very low head sites can be a very valuable solution. The very low head turbine may be designed as a compact turbine using one row of guide vane and rotor blade. The bloc of turbine used to be positioned inside the canal with a 30 to 50 degree from vertical axis. The construction of the turbine is suitable in utilization of the very low head flow with high efficiency without a complex and expensive regulator flow [1-3]. However, the optimization of turbine blades is required to increase efficiency and make this turbine as an interesting choice for application. Optimized blade design will be able to maximize the absorbing energy from the fluid flow through the turbine.
2. Turbine blade optimization
There are two main concerns in the design optimization of turbine that will be discussed. Blade Airfoil and cascade in developing the blade shape has a major contribution to increase performance of the designed turbine.
2.1. Turbine blade airfoil
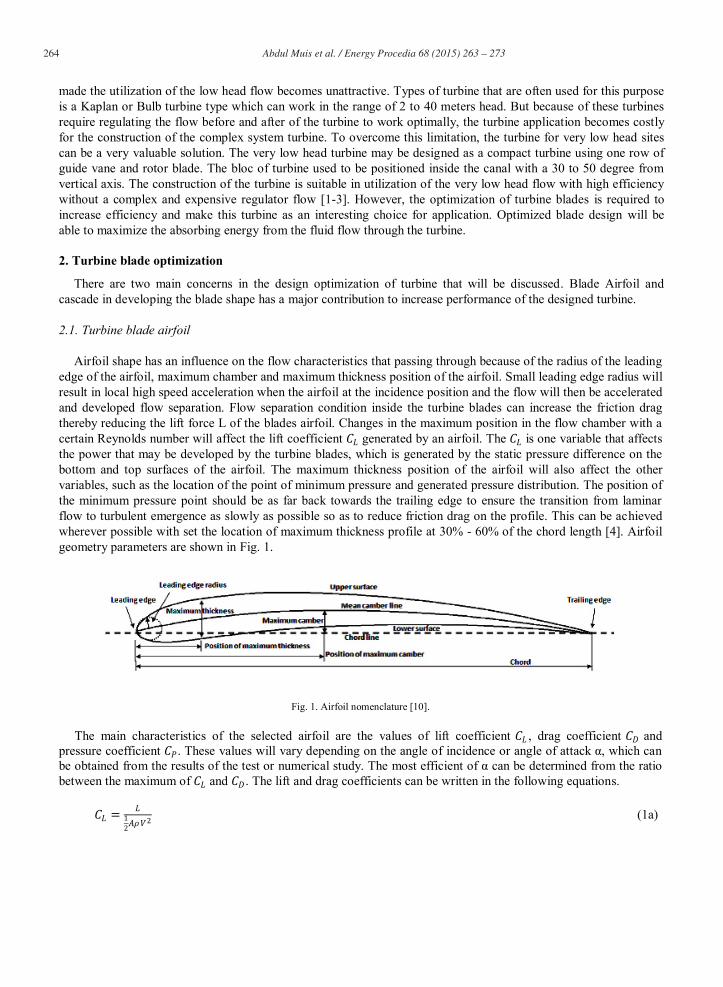
Airfoil shape has an influence on the flow characteristics that passing through because of the radius of the leading edge of the airfoil, maximum chamber and maximum thickness position of the airfoil. Small leading edge radius will result in local high speed acceleration when the airfoil at the incidence position and the flow will then be accelerated and developed flow separation. Flow separation condition inside the turbine blades can increase the friction drag thereby reducing the lift force L of the blades airfoil. Changes in the maximum position in the flow chamber with a certain Reynolds number will affect the lift coefficient generated by an airfoil. The is one variable that affects the power that may be developed by the turbine blades, which is generated by the static pressure difference on the bottom and top surfaces of the airfoil. The maximum thickness position of the airfoil will also affect the other variables, such as the location of the point of minimum pressure and generated pressure distribution. The position of the minimum pressure point should be as far back towards the trailing edge to ensure the transition from laminar flow to turbulent emergence as slowly as possible so as to reduce friction drag on the profile. This can be achieved wherever possible with set the location of maximum thickness profile at 30% - 60% of the chord length [4]. Airfoil geometry parameters are shown in Fig. 1.
Fig. 1. Airfoil nomenclature [10].
The main characteristics of the selected airfoil are the values of lift coefficient , drag coefficient and pressure coefficient . These values will vary depending on the angle of incidence or angle of attack α, which can be obtained from the results of the test or numerical study. The most efficient of α can be determined from the ratio between the maximum of and . The lift and drag coefficients can be written in the following equations.
(1a)
Abdul Muis et al. / Energy Procedia 68 ( 2015 ) 263 – 273 265
(1b)
where L and D are lift and drag forces, A is the total area of airfoil, is fluid density and V is velocity of fluid. To obtain airfoil blade that has advantages as mentioned above, the particle swarm optimization method was
applied by using the XFOIL analysis engine as controlled by MATLAB. Development and details of the method has been clearly explained in reference [5]. Design variables are used based on the NACA Report 460 [6] which is the maximum camber (m), max camber location (p), and max thickness (t). The purpose of optimization is to obtain an optimal ratio between airfoil lift and drag force over a board range of angles of attack α. In an attempt to achieve good performance over a range of α, three different angles of attack were averaged in the objective function. The objective function chosen was:
(2)
As a side constraints, the author is using NACA design variables (m, p, t) as fractions of the total units of chord length, angles of attack α, the aerodynamic pitching moment , leading edge radius and maximum thickness location.
2.2. Turbine blade cascade
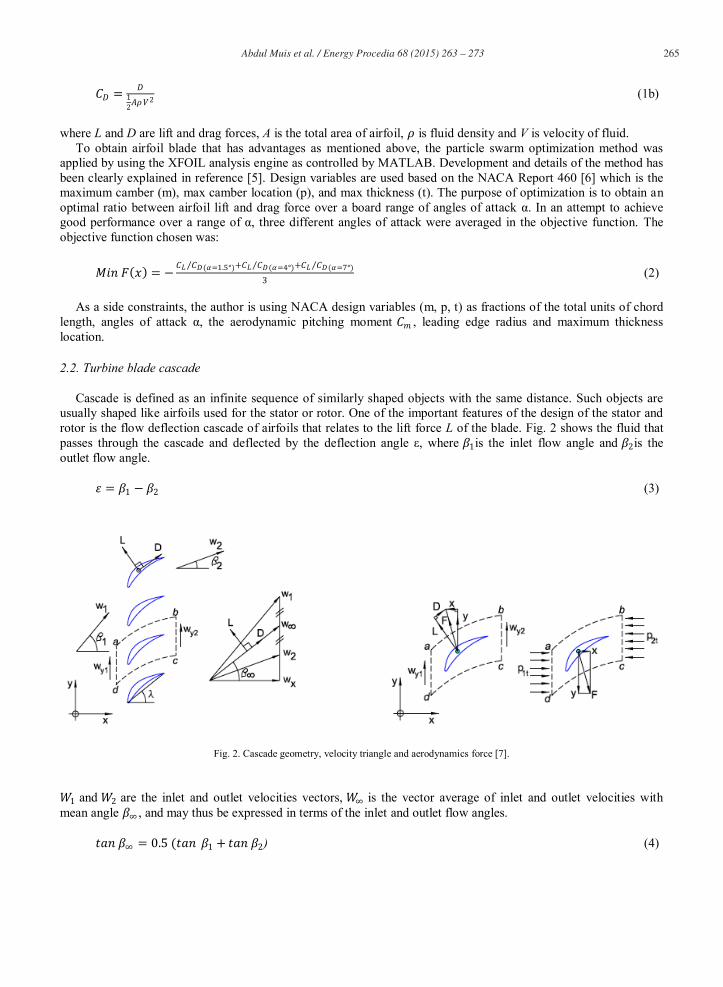
Cascade is defined as an infinite sequence of similarly shaped objects with the same distance. Such objects are usually shaped like airfoils used for the stator or rotor. One of the important features of the design of the stator and rotor is the flow deflection cascade of airfoils that relates to the lift force L of the blade. Fig. 2 shows the fluid that passes through the cascade and deflected by the deflection angle ε, where is the inlet flow angle and is the outlet flow angle.
(3)
Fig. 2. Cascade geometry, velocity triangle and aerodynamics force [7].
and are the inlet and outlet velocities vectors, is the vector average of inlet and outlet velocities with
mean angle , and may thus be expressed in terms of the inlet and outlet flow angles.
) (4)
266 Abdul Muis et al. / Energy Procedia 68 ( 2015 ) 263 – 273
Coefficient Lift and Drag may be expressed as:
(5a)
(5b)
where is the chord length of cascade. From Fig. 2, the drag force D taken in the direction normal to lift force L:
= (6)
where is the cascade blade pitch. The drag coefficient becomes:
(7)
where is the cascade loss coefficient, X and Y are the aerodynamic forces parallel to the x and y axes. And the lift force L is normal to the vector mean velocity :
(8a)
(8b)
Hence the lift coefficient becomes:
(9a)
(9b)
For simpler case of friction less fluid flow, the presence of viscous drag forces will be eliminated and we note that will be strongly affected by the term of which it closely related to fluid deflection .
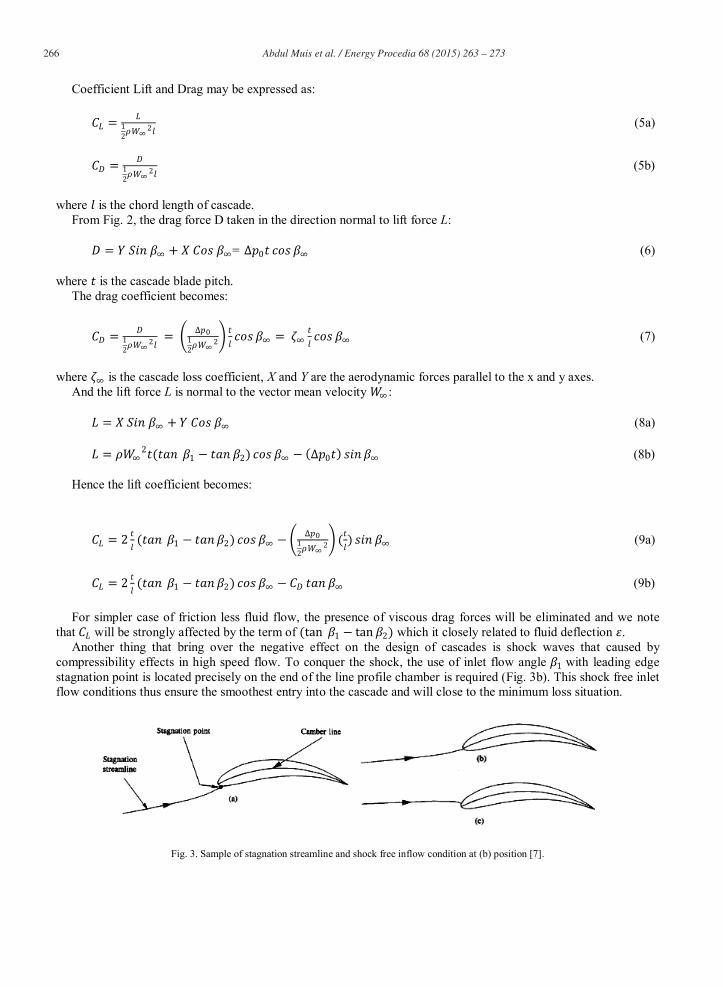
Another thing that bring over the negative effect on the design of cascades is shock waves that caused by compressibility effects in high speed flow. To conquer the shock, the use of inlet flow angle with leading edge stagnation point is located precisely on the end of the line profile chamber is required (Fig. 3b). This shock free inlet flow conditions thus ensure the smoothest entry into the cascade and will close to the minimum loss situation.
Fig. 3. Sample of stagnation streamline and shock free inflow condition at (b) position [7].
Abdul Muis et al. / Energy Procedia 68 ( 2015 ) 263 – 273 267
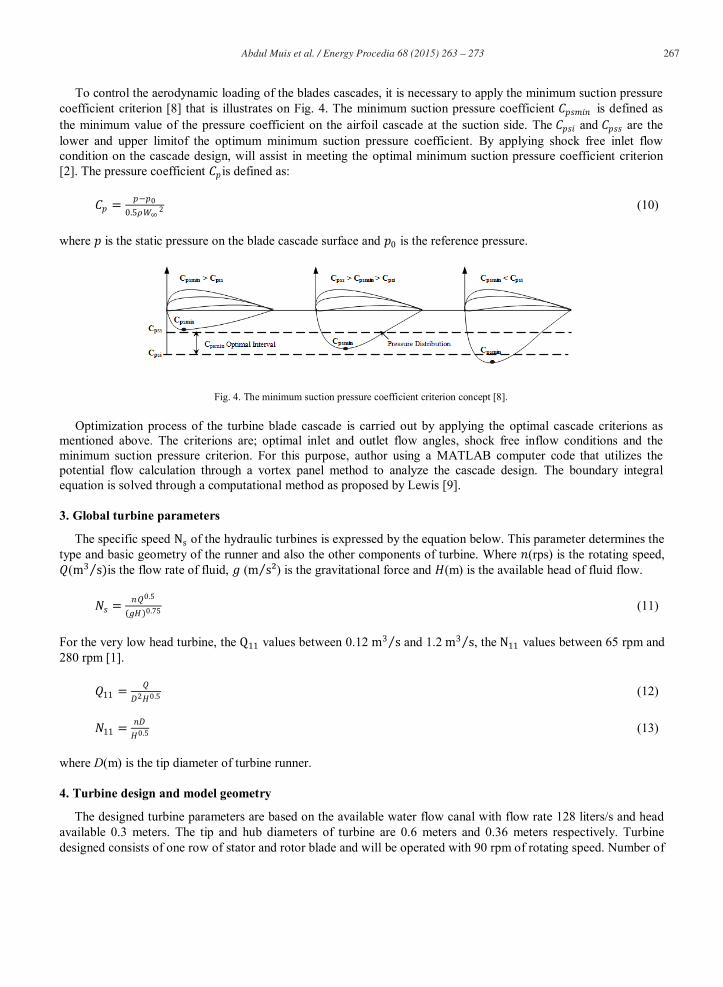
To control the aerodynamic loading of the blades cascades, it is necessary to apply the minimum suction pressure
coefficient criterion [8] that is illustrates on Fig. 4. The minimum suction pressure coefficient is defined as the minimum value of the pressure coefficient on the airfoil cascade at the suction side. The and are the lower and upper limitof the optimum minimum suction pressure coefficient. By applying shock free inlet flow condition on the cascade design, will assist in meeting the optimal minimum suction pressure coefficient criterion [2]. The pressure coefficient is defined as:
(10)
where is the static pressure on the blade cascade surface and is the reference pressure.
Fig. 4. The minimum suction pressure coefficient criterion concept [8].
Optimization process of the turbine blade cascade is carried out by applying the optimal cascade criterions as mentioned above. The criterions are; optimal inlet and outlet flow angles, shock free inflow conditions and the minimum suction pressure criterion. For this purpose, author using a MATLAB computer code that utilizes the potential flow calculation through a vortex panel method to analyze the cascade design. The boundary integral equation is solved through a computational method as proposed by Lewis [9].
3. Global turbine parameters
The specific speed of the hydraulic turbines is expressed by the equation below. This parameter determines the type and basic geometry of the runner and also the other components of turbine. Where (rps) is the rotating speed,
( is the flow rate of fluid, ( ) is the gravitational force and (m) is the available head of fluid flow.
(11)
For the very low head turbine, the values between 0.12 and 1.2 , the values between 65 rpm and 280 rpm [1].
(12)
(13)
where D(m) is the tip diameter of turbine runner.
4. Turbine design and model geometry
The designed turbine parameters are based on the available water flow canal with flow rate 128 liters/s and head available 0.3 meters. The tip and hub diameters of turbine are 0.6 meters and 0.36 meters respectively. Turbine designed consists of one row of stator and rotor blade and will be operated with 90 rpm of rotating speed. Number of
268 Abdul Muis et al. / Energy Procedia 68 ( 2015 ) 263 – 273
blade for stator and rotor are 24 and 8 blades respectively. Optimized blade airfoils are used and stacking to form the turbine blade with 11 radial stations from hub to tip. The free vortex swirl velocity criterion are applied because of the limitations in using the other swirl velocity criterions due to the low of axial fluid flow that passing through of the turbine [3].
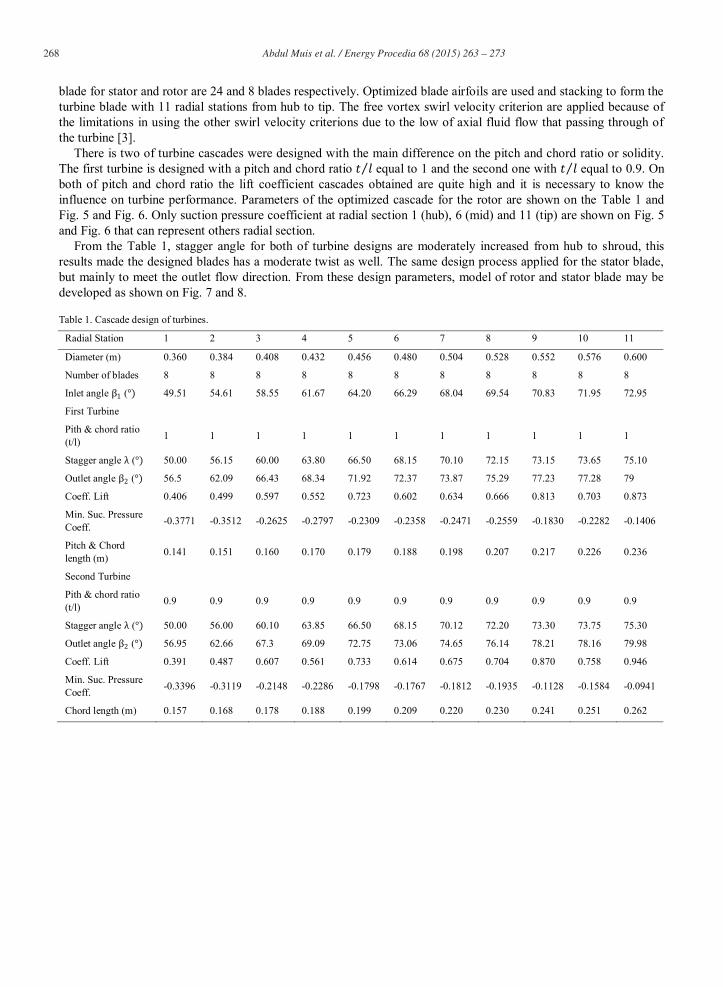
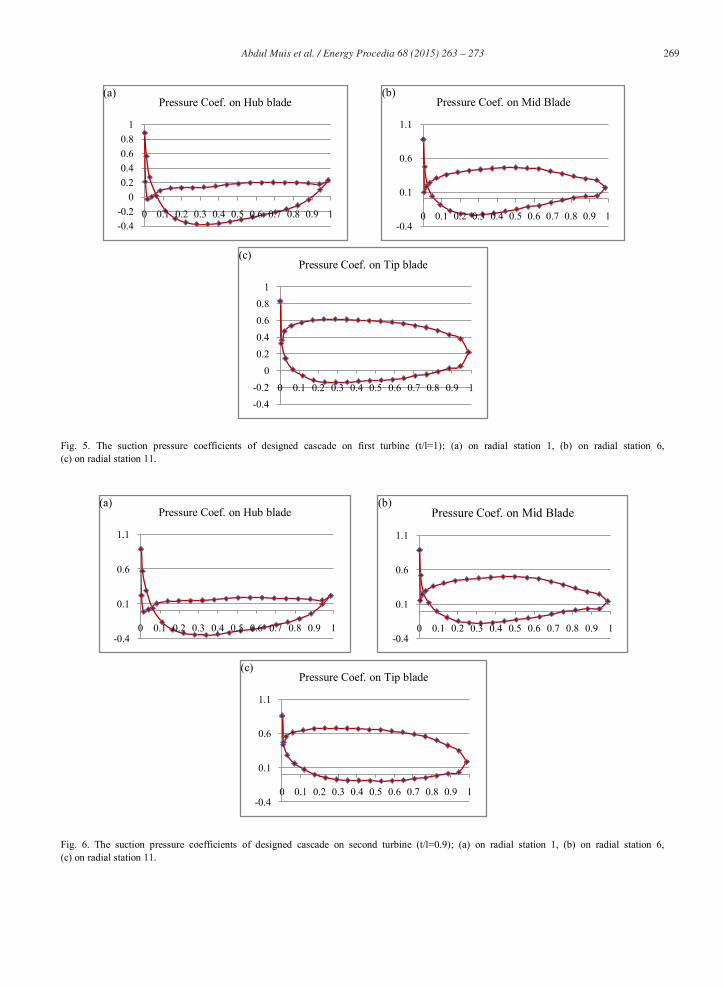
There is two of turbine cascades were designed with the main difference on the pitch and chord ratio or solidity. The first turbine is designed with a pitch and chord ratio equal to 1 and the second one with equal to 0.9. On both of pitch and chord ratio the lift coefficient cascades obtained are quite high and it is necessary to know the influence on turbine performance. Parameters of the optimized cascade for the rotor are shown on the Table 1 and Fig. 5 and Fig. 6. Only suction pressure coefficient at radial section 1 (hub), 6 (mid) and 11 (tip) are shown on Fig. 5 and Fig. 6 that can represent others radial section.
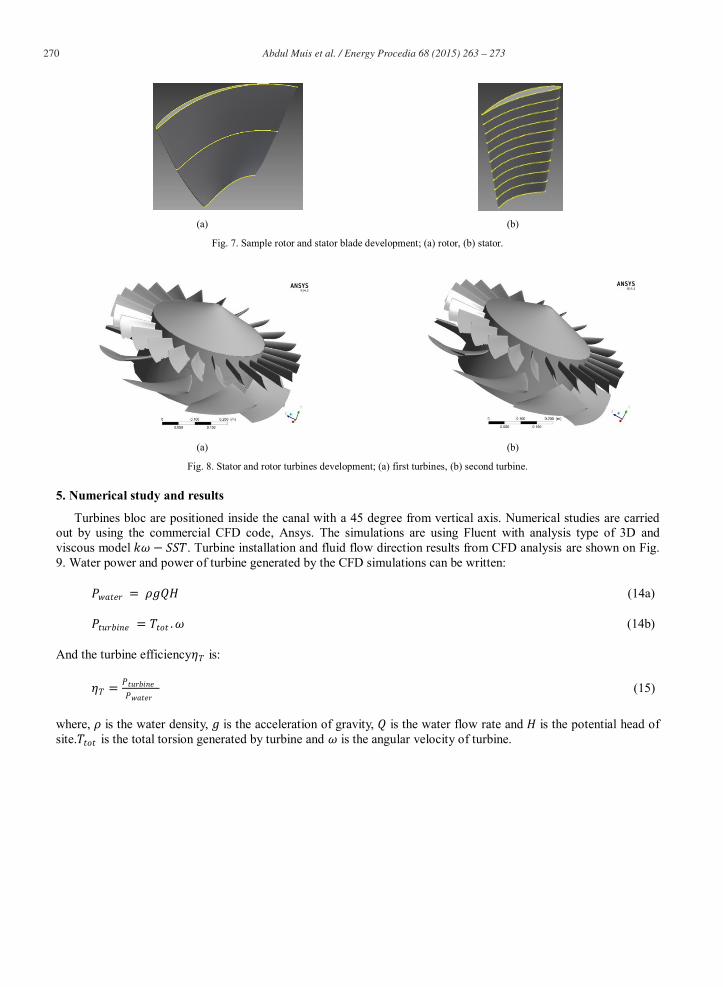
From the Table 1, stagger angle for both of turbine designs are moderately increased from hub to shroud, this results made the designed blades has a moderate twist as well. The same design process applied for the stator blade, but mainly to meet the outlet flow direction. From these design parameters, model of rotor and stator blade may be developed as shown on Fig. 7 and 8.
Table 1. Cascade design of turbines.
Radial Station 1 2 3 4 5 6 7 8 9 10 11
Diameter (m) 0.360 0.384 0.408 0.432 0.456 0.480 0.504 0.528 0.552 0.576 0.600
Number of blades 8 8 8 8 8 8 8 8 8 8 8
Inlet angle ( 49.51 54.61 58.55 61.67 64.20 66.29 68.04 69.54 70.83 71.95 72.95
First Turbine
Pith & chord ratio (t/l) 1 1 1 1 1 1 1 1 1 1 1
Stagger angle ( 50.00 56.15 60.00 63.80 66.50 68.15 70.10 72.15 73.15 73.65 75.10
Outlet angle ( 56.5 62.09 66.43 68.34 71.92 72.37 73.87 75.29 77.23 77.28 79
Coeff. Lift 0.406 0.499 0.597 0.552 0.723 0.602 0.634 0.666 0.813 0.703 0.873
Min. Suc. Pressure Coeff. -0.3771 -0.3512 -0.2625 -0.2797 -0.2309 -0.2358 -0.2471 -0.2559 -0.1830 -0.2282 -0.1406
Pitch & Chord length (m) 0.141 0.151 0.160 0.170 0.179 0.188 0.198 0.207 0.217 0.226 0.236
Second Turbine
Pith & chord ratio (t/l) 0.9 0.9 0.9 0.9 0.9 0.9 0.9 0.9 0.9 0.9 0.9
Stagger angle ( 50.00 56.00 60.10 63.85 66.50 68.15 70.12 72.20 73.30 73.75 75.30
Outlet angle ( 56.95 62.66 67.3 69.09 72.75 73.06 74.65 76.14 78.21 78.16 79.98
Coeff. Lift 0.391 0.487 0.607 0.561 0.733 0.614 0.675 0.704 0.870 0.758 0.946
Min. Suc. Pressure Coeff. -0.3396 -0.3119 -0.2148 -0.2286 -0.1798 -0.1767 -0.1812 -0.1935 -0.1128 -0.1584 -0.0941
Chord length (m) 0.157 0.168 0.178 0.188 0.199 0.209 0.220 0.230 0.241 0.251 0.262
Abdul Muis et al. / Energy Procedia 68 ( 2015 ) 263 – 273 269
Fig. 5. The suction pressure coefficients of designed cascade on first turbine (t/l=1); (a) on radial station 1, (b) on radial station 6, (c) on radial station 11.
Fig. 6. The suction pressure coefficients of designed cascade on second turbine (t/l=0.9); (a) on radial station 1, (b) on radial station 6, (c) on radial station 11.
-0.4-0.2
00.20.40.60.8
1
0 0.1 0.2 0.3 0.4 0.5 0.6 0.7 0.8 0.9 1
Pressure Coef. on Hub blade(a)
-0.4
0.1
0.6
1.1
0 0.1 0.2 0.3 0.4 0.5 0.6 0.7 0.8 0.9 1
Pressure Coef. on Mid Blade(b)
-0.4-0.2
00.20.40.60.8
1
0 0.1 0.2 0.3 0.4 0.5 0.6 0.7 0.8 0.9 1
Pressure Coef. on Tip blade (c)
-0.4
0.1
0.6
1.1
0 0.1 0.2 0.3 0.4 0.5 0.6 0.7 0.8 0.9 1
Pressure Coef. on Hub blade(a)
-0.4
0.1
0.6
1.1
0 0.1 0.2 0.3 0.4 0.5 0.6 0.7 0.8 0.9 1
Pressure Coef. on Mid Blade(b)
-0.4
0.1
0.6
1.1
0 0.1 0.2 0.3 0.4 0.5 0.6 0.7 0.8 0.9 1
Pressure Coef. on Tip blade (c)
270 Abdul Muis et al. / Energy Procedia 68 ( 2015 ) 263 – 273
(a) (b)
Fig. 7. Sample rotor and stator blade development; (a) rotor, (b) stator.
(a) (b)
Fig. 8. Stator and rotor turbines development; (a) first turbines, (b) second turbine.
5. Numerical study and results
Turbines bloc are positioned inside the canal with a 45 degree from vertical axis. Numerical studies are carried out by using the commercial CFD code, Ansys. The simulations are using Fluent with analysis type of 3D and viscous model . Turbine installation and fluid flow direction results from CFD analysis are shown on Fig. 9. Water power and power of turbine generated by the CFD simulations can be written:
(14a)
(14b)
And the turbine efficiency is:
(15)
where, is the water density, is the acceleration of gravity, is the water flow rate and is the potential head of site. is the total torsion generated by turbine and is the angular velocity of turbine.
Abdul Muis et al. / Energy Procedia 68 ( 2015 ) 263 – 273 271
Fig. 9. Turbine installation and fluid flow direction.
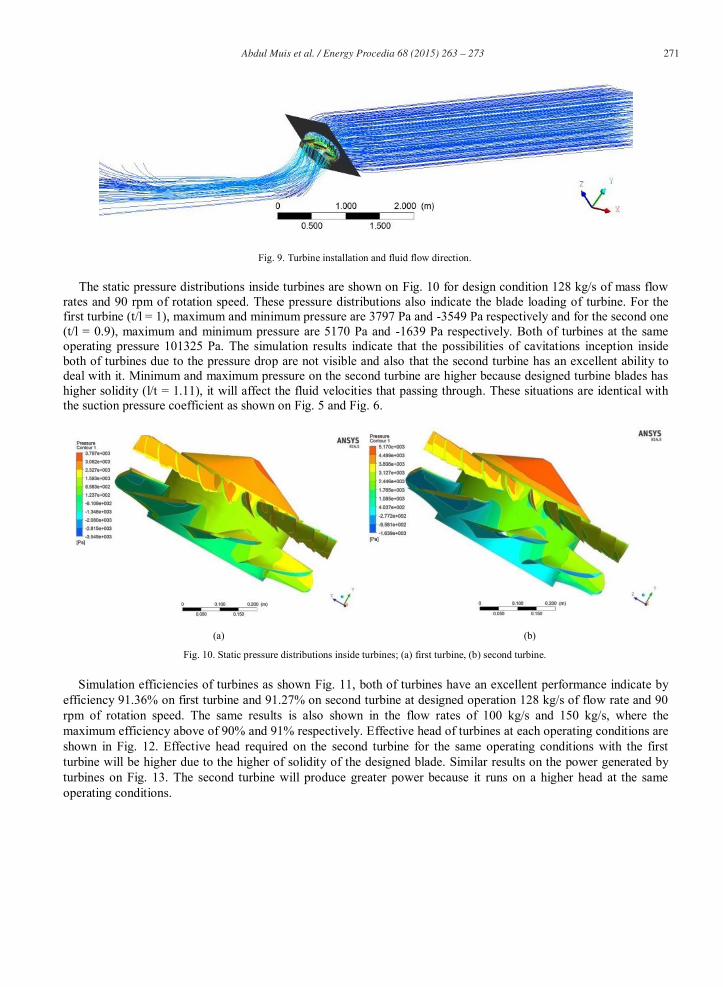
The static pressure distributions inside turbines are shown on Fig. 10 for design condition 128 kg/s of mass flow rates and 90 rpm of rotation speed. These pressure distributions also indicate the blade loading of turbine. For the first turbine (t/l = 1), maximum and minimum pressure are 3797 Pa and -3549 Pa respectively and for the second one (t/l = 0.9), maximum and minimum pressure are 5170 Pa and -1639 Pa respectively. Both of turbines at the same operating pressure 101325 Pa. The simulation results indicate that the possibilities of cavitations inception inside both of turbines due to the pressure drop are not visible and also that the second turbine has an excellent ability to deal with it. Minimum and maximum pressure on the second turbine are higher because designed turbine blades has higher solidity (l/t = 1.11), it will affect the fluid velocities that passing through. These situations are identical with the suction pressure coefficient as shown on Fig. 5 and Fig. 6.
(a) (b)
Fig. 10. Static pressure distributions inside turbines; (a) first turbine, (b) second turbine.
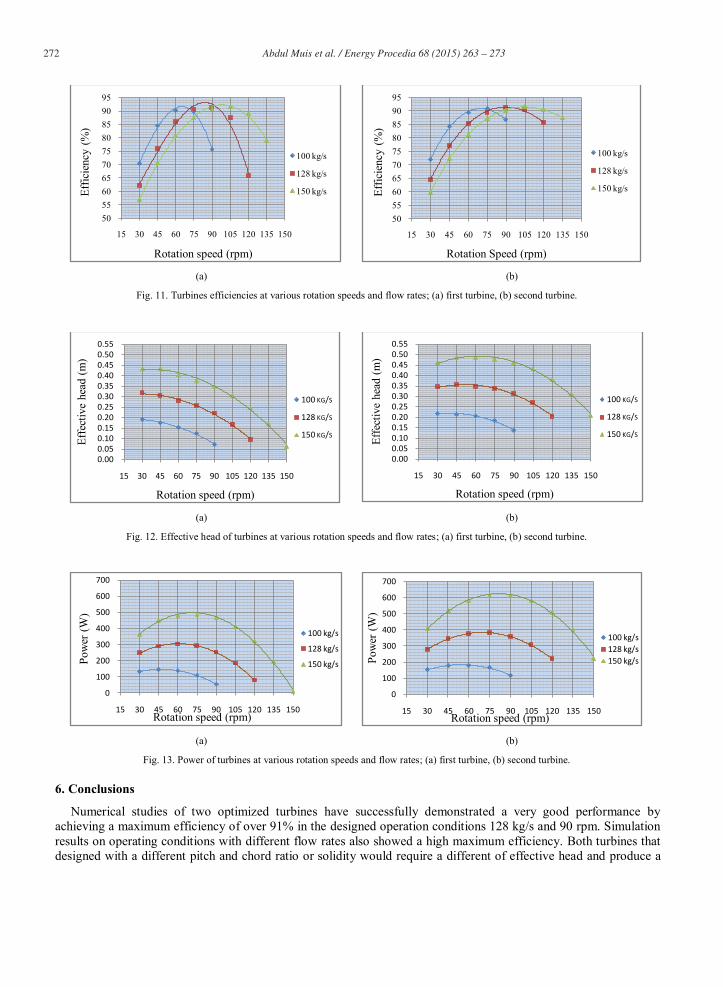
Simulation efficiencies of turbines as shown Fig. 11, both of turbines have an excellent performance indicate by efficiency 91.36% on first turbine and 91.27% on second turbine at designed operation 128 kg/s of flow rate and 90 rpm of rotation speed. The same results is also shown in the flow rates of 100 kg/s and 150 kg/s, where the maximum efficiency above of 90% and 91% respectively. Effective head of turbines at each operating conditions are shown in Fig. 12. Effective head required on the second turbine for the same operating conditions with the first turbine will be higher due to the higher of solidity of the designed blade. Similar results on the power generated by turbines on Fig. 13. The second turbine will produce greater power because it runs on a higher head at the same operating conditions.
272 Abdul Muis et al. / Energy Procedia 68 ( 2015 ) 263 – 273
(a) (b)
Fig. 11. Turbines efficiencies at various rotation speeds and flow rates; (a) first turbine, (b) second turbine.
(a) (b)
Fig. 12. Effective head of turbines at various rotation speeds and flow rates; (a) first turbine, (b) second turbine.
(a) (b)
Fig. 13. Power of turbines at various rotation speeds and flow rates; (a) first turbine, (b) second turbine.
6. Conclusions
Numerical studies of two optimized turbines have successfully demonstrated a very good performance by achieving a maximum efficiency of over 91% in the designed operation conditions 128 kg/s and 90 rpm. Simulation results on operating conditions with different flow rates also showed a high maximum efficiency. Both turbines that designed with a different pitch and chord ratio or solidity would require a different of effective head and produce a
50556065707580859095
15 30 45 60 75 90 105 120 135 150
Effic
ienc
y (%
)
Rotation speed (rpm)
100 kg/s
128 kg/s
150 kg/s
50556065707580859095
15 30 45 60 75 90 105 120 135 150
Effic
ienc
y (%
)
Rotation Speed (rpm)
100 kg/s
128 kg/s
150 kg/s
0.000.050.100.150.200.250.300.350.400.450.500.55
15 30 45 60 75 90 105 120 135 150
Effe
ctiv
e he
ad (m
)
Rotation speed (rpm)
100 KG/S
128 KG/S
150 KG/S
0.000.050.100.150.200.250.300.350.400.450.500.55
15 30 45 60 75 90 105 120 135 150
Effe
ctiv
e he
ad (m
)
Rotation speed (rpm)
100 KG/S
128 KG/S
150 KG/S
0
100
200
300
400
500
600
700
15 30 45 60 75 90 105 120 135 150
Pow
er (W
)
Rotation speed (rpm)
100 kg/s
128 kg/s
150 kg/s
0
100
200
300
400
500
600
700
15 30 45 60 75 90 105 120 135 150
Pow
er (W
)
Rotation speed (rpm)
100 kg/s128 kg/s150 kg/s
Abdul Muis et al. / Energy Procedia 68 ( 2015 ) 263 – 273 273
different of power for the same of flow rate and rotation speed. Both of turbines also produce a different of static pressure inside turbine because of the different velocity of fluids as result of the interaction of the fluid with the turbine blades.
Acknowledgements
The author would like to express special thanks to BPPS Dikti and ITB for financial support and for a chances to study and research.
References
[1] R Frazer and C Deschenes. Development of a New Turbine for Very Low Head Sites. Waterpower XV.www.hcipub.com. [2] Priyono S and Ibrahim K.A. Design. Simulation and Experimental of the Very Low Head Turbine with Minimum Pressure and Free
Vortex Criterions.Internatonal Journal of Mechanical & Mechatronics Engineering IJMME-IJENS Vol: 11 No: 01. 2011. [3] Abdul Muis, Priyono S, Ariyadi S and Firman H. Design and Simulation of Very Low Head Axial Hydraulic Turbine with Variation of
Swirl Velocity Criterion. The 12th Asian International Conference on Fluid Machinery (AICFM12). 2013. [4] Julian R. Optimization and Design of Two Micro-Hydro Turbines for Medium and Low Head Applications. Thesis of Master of Science.
University of Natal. 2000. [5] Daniel P, JJ Guerrette, A Regula, M Ozgur. Airfoil Shape Optimization using XFoil and Modified NACA Parameters. 2010. [6] Eastman NJ, Kenneth EW, Robert MP. The Characteristics of 78 Related Airfoil Sections from Tests in The Variable-Density Wind
Tunnel. NACA Report No: 460. [7] RI Lewis. Turbo machinery Performance Analysis. Elsevier Science and Technology Books; 1996. [8] Antonio GB da Cruz, Andre LAM and Claudio JCB.Minimum Pressure Coefficient Criterion Applied in Axial-Flow Hydraulic
Turbines.Journal of the Braz. Soc.of Mech. Sci & Eng. Vol. XXX No. 1. 2008. [9] R I Lewis. Vortex Element Method for Fluid Dynamic Analysis of Engineering Systems. Cambridge University Press; 1991. [10] P Pathike, T Katpradit, P Terdtoon. Optimum Shape of Airfoil for Small Horizontal-Axis Wind Turbine, J Sci Technol MSU Vol. 31 No.
5. 2012.