Design of Network Intrusion Detection Systems: - IIT Guwahati
251
Design of Network Intrusion Detection Systems: An Effective Alarm Generation Perspective Neminath Hubballi
-
Upload
khangminh22 -
Category
Documents
-
view
0 -
download
0
Transcript of Design of Network Intrusion Detection Systems: - IIT Guwahati

Design of Network Intrusion Detection Systems: An Effective Alarm Generation Perspective
Neminath Hubballi

Design of Network Intrusion Detection Systems:
An Effective Alarm Generation Perspective
Thesis submitted in partial fulfillment of the requirements for the degree of
Doctor of Philosophy
by
Neminath Hubballi
Under the supervision of
Sukumar Nandi and
Santosh Biswas
Department of Computer Science and Engineering
Indian Institute of Technology, Guwahati
March 2012
TH-1076_NHUBBALLI

TH-1076_NHUBBALLI

Dedicated to my family
TH-1076_NHUBBALLI

Declaration
I hereby declare that,
1. The work contained in this thesis is original and has been done by myself under the
supervision of my advisors.
2. To the best of my knowledge this work has not been submitted elsewhere in any
university for the award of any degree or diploma.
3. I have given appropriate credit to the original authors whenever I used materials
(data, text or figures ) from other sources.
4. Whenever I have quoted written material from other sources, I have put them under
quotation marks and given due credit to the sources by citing the sources and giving
required details in the references.
5. I have followed the norms and guidelines given in Ethical Code of Conduct of the
Institute.
Place: IIT, Guwahati
Date: (Neminath Hubballi)
TH-1076_NHUBBALLI

TH-1076_NHUBBALLI

Certificate
This is to certify that this thesis entitled “Design of Network Intrusion Detection Systems -
An Effective Alarm Generation Perspective” submitted by Neminath Hubballi, to the Indian
Institute of Technology, Guwahati, for partial fulfillment of the award of the degree of Doctor of
Philosophy, is a record of bona fide research work carried out by him under our supervision and
guidance.
The thesis, in our opinion, is worthy of consideration for award of the degree of Doctor of Philosophy
in accordance with the regulations of the institute. To the best of our knowledge, the results embodied
in the thesis have not been submitted to any other university or institute for the award of any other
degree or diploma.
Place : I.I.T. Guwahati, India
Date: (Sukumar Nandi)
Dept. of Computer Science and Engineering,
Indian Institute of Technology, Guwahati.
Place: I.I.T. Guwahati, India
Date: (Santosh Biswas)
Dept. of Computer Science and Engineering,
Indian Institute of Technology, Guwahati.
TH-1076_NHUBBALLI

TH-1076_NHUBBALLI

Acknowledgement
Submission of this thesis marks the end of my PhD research work under the official
supervision of Prof. Sukumar Nandi and Prof. Santosh Biswas. However the unofficial
bonding with the people of IIT, Guwahati, remains ever lasting. I am indebted to many
people who helped me and supported me in bringing forth this thesis. I avail myself of this
opportunity to express my heart-felt gratitude to my supervisors Prof. Sukumar Nandi
and Prof. Santosh Biswas. I would like to thank Prof. Vijay Iyengar, visiting professor
of the department, who provided many interesting research ideas which helped solving
some important problems of my PhD work. I am grateful to all the doctoral committee
members for their valuable feedback on my ideas during my research. I also thank Prof.
Himadri Shekar Paul and Prof. G. Sajith who gave me the first flavor of attending courses
in an IIT framework. I am thankful to all faculty members and staff of the department
for their kind cooperation and encouragement. A gratuitous mention goes to Prof. P.
Viswanath (my Ex supervisor) with whom I started my research in IIT Guwahati.
A special word of thanks goes to Department of Information Technology (DIT), New
Delhi for sponsoring a security project to IIT Guwahati in which I was a project staffduring
later part of my PhD. The project facilitated a wonderful security laboratory without which
many of the implementation results of my work would have been a mere dream.
It was a great fun and source of ideas and energy to have friends like Bidyut, Ferdous,
Roopa, Ritesh and Dhruwajitha to name a few, with whom I closely worked. Leaving apart
technical work, I enjoyed company of Ashok kumar, Sreenivasa, Sameer, Satyanarayana,
Maushumi, Amrita and Suresh and I thank all of them.
Last but most important is my family. An inspired man once said, “No success
whatsoever can compensate a failure in the home”. I am grateful to all my family members
for not only being as a constant source of positive energy but also for sacrificing many
comforts of their life for building this thesis.
Place: IIT, Guwahati
Date: (Neminath Hubballi)
TH-1076_NHUBBALLI

TH-1076_NHUBBALLI
AbstractIntrusion Detection System, a hardware or software that monitors network or host ac-
tivities for malicious behavior, is an indispensable component of system security. If an
IDS deals with network activities (host activities) then it is called network based IDS (host
based IDS). While signature and event based IDSs can detect known attacks only, anomaly
based systems can detect both known and unknown attacks. An IDS is characterized by
many parameters namely, effectiveness, efficiency, ease of use, security, transparency,
interoperability etc. The thesis focusses at effectiveness, also called effective alarm gener-
ation, for all variants of network based IDSs namely, signature based, event based, header
anomaly based and payload anomaly based systems. In signature based IDS, most of the
alarms generated are false positives because signatures are generic and alarms are gener-
ated for all attack traffic which match some signature irrespective of the fact whether the
attack could successfully exploit any vulnerability. To address this issue a false positive
filtering scheme for signature based IDS has been proposed, which correlates alarms with
network context information. As an enhancement to this filter, criticality of the applica-
tion being targeted by an attack is examined, before eliminating the corresponding alarm
estimated to be false positive. There is certain class of known attacks for which signatures
cannot be written and so signature based IDSs cannot detect them. A novel event based
IDS has been proposed for such attacks using the failure detection and diagnosis theory of
discrete event systems. The working of the event based IDS has been illustrated on address
resolution protocol based attacks. In header anomaly based IDSs, fairly high Detection Rate
and Accuracy can be achieved for attacks detectable by header statistics. When the datasets
to be processed by such systems are large, data summarization algorithms are applied.
However, Detection Rate and Accuracy are not high in the systems that use data summa-
rization algorithms compared to the ones which do not. A header anomaly based IDS for
handling voluminous network traffic yet maintaining high Detection Rate and Accuracy
has been proposed. Issues of effective alarm generation are more involved in payload
anomaly based IDSs compared to the header based counterparts, which become more se-
vere when training dataset has impurities. An impurity tolerant payload anomaly based
IDS has been proposed using n-gram based statistical models. Tolerance is achieved by
higher order n-grams and keeping their frequency information.
TH-1076_NHUBBALLI

TH-1076_NHUBBALLI

List of abbreviations
ARP Address Resolution Protocol
CAM Content Addressable Memory
CE Correlation Engine
CF Cluster Feature
CLAD Clustering for Anomaly Detection
COF Connectivity Outlier Factor
CVE Common Vulnerability Exposure
CWA Criticality Weighted Automaton
DNS Domain Name Server
DES Discrete Event System
DoS Denial of Service
EER Enhanced Entity Relationship
FDD Failure Detection and Diagnosis
FN False Negative
FP False Positive
FSM Finite State Machine
HIDS Host based Intrusion Detection System
HTTP Hyper Text Transfer Protocol
ICMP Internet Control Message Protocol
IDS Intrusion Detection System
IFA Intermediate False Alarms
IP Internet Protocol
IPS Intrusion Prevention System
ISS Internet Security Systems
LAN Local Area Network
MAC Media Access Control
MiTM Man-in-The-Middle
MINDS Minnesota INtrusion Detection System
MST Minimum Spanning Tree
NIC Network Interface Card
TH-1076_NHUBBALLI

x
NIDS Network based Intrusion Detection System
NVD National Vulnerability Database
OAD Output Anomaly Detector
OFP Outlier Finding Process
PBA Polymorphic Blending Attack
PNMT Passive Network Monitoring Technique
SVM Support Vector Machine
TCP Transmission Control Protocol
TP True Positive
TH-1076_NHUBBALLI
Contents
1 Introduction 1
1.1 Network security . . . . . . . . . . . . . . . . . . . . . . . . . . . . . . . . . . 1
1.2 IDS taxonomy based on attack detection . . . . . . . . . . . . . . . . . . . . . 3
1.2.1 Detecting only known attacks: signature and event based IDSs . . . 3
1.2.2 Detection of known and unknown attacks: anomaly based IDSs . . . 4
1.3 Issues in existing IDSs and motivation of the thesis . . . . . . . . . . . . . . . 6
1.3.1 Issues with signature detection systems . . . . . . . . . . . . . . . . . 6
1.3.2 Issues with event detection systems . . . . . . . . . . . . . . . . . . . 8
1.3.3 Issues with anomaly detection systems . . . . . . . . . . . . . . . . . 10
1.4 Contributions of the thesis . . . . . . . . . . . . . . . . . . . . . . . . . . . . . 12
1.5 Organization of the thesis . . . . . . . . . . . . . . . . . . . . . . . . . . . . . 13
2 Background and literature survey 15
2.1 Introduction . . . . . . . . . . . . . . . . . . . . . . . . . . . . . . . . . . . . . 15
2.1.1 Host based intrusion detection system . . . . . . . . . . . . . . . . . . 16
2.1.2 Network based intrusion detection system . . . . . . . . . . . . . . . 19
2.2 Known attack detection . . . . . . . . . . . . . . . . . . . . . . . . . . . . . . 20
2.2.1 Signature detection system . . . . . . . . . . . . . . . . . . . . . . . . 21
2.2.2 Event detection system . . . . . . . . . . . . . . . . . . . . . . . . . . . 35
2.3 Unknown and known attack detection . . . . . . . . . . . . . . . . . . . . . . 41
2.3.1 Header based anomaly detection system . . . . . . . . . . . . . . . . 45
2.3.2 Payload based anomaly detection system . . . . . . . . . . . . . . . . 47
2.4 Conclusions . . . . . . . . . . . . . . . . . . . . . . . . . . . . . . . . . . . . . 50
TH-1076_NHUBBALLI

xii CONTENTS
3 False positive alarm minimization in signature detection systems 51
3.1 Introduction . . . . . . . . . . . . . . . . . . . . . . . . . . . . . . . . . . . . . 51
3.2 Related work . . . . . . . . . . . . . . . . . . . . . . . . . . . . . . . . . . . . . 53
3.2.1 FP minimization by correlation of alarms with vulnerabilities . . . . 55
3.3 Proposed technique: FP minimization in signature detection systems . . . . 58
3.3.1 Threat profile generation . . . . . . . . . . . . . . . . . . . . . . . . . 60
3.3.2 Alarm correlation . . . . . . . . . . . . . . . . . . . . . . . . . . . . . . 63
3.3.3 Experimental results . . . . . . . . . . . . . . . . . . . . . . . . . . . . 69
3.3.4 Experiments on dataset generated in the testbed . . . . . . . . . . . . 69
3.3.5 Experiments on dataset generated offline . . . . . . . . . . . . . . . . 75
3.4 Application criticality aware FP minimization . . . . . . . . . . . . . . . . . 80
3.4.1 Experimental results . . . . . . . . . . . . . . . . . . . . . . . . . . . . 85
3.4.2 Accuracy and Detection Rate of critical and non-critical applications . 86
3.5 Conclusions . . . . . . . . . . . . . . . . . . . . . . . . . . . . . . . . . . . . . 92
4 Event detection system for ARP attacks 93
4.1 Introduction . . . . . . . . . . . . . . . . . . . . . . . . . . . . . . . . . . . . . 93
4.2 Related work . . . . . . . . . . . . . . . . . . . . . . . . . . . . . . . . . . . . . 97
4.2.1 Address Resolution Protocol . . . . . . . . . . . . . . . . . . . . . . . 97
4.2.2 ARP based attacks . . . . . . . . . . . . . . . . . . . . . . . . . . . . . 100
4.2.3 Techniques to detect ARP attacks . . . . . . . . . . . . . . . . . . . . . 102
4.3 Proposed scheme: event detection system for ARP attacks . . . . . . . . . . 103
4.3.1 Active probing technique . . . . . . . . . . . . . . . . . . . . . . . . . 103
4.3.2 Examples of ARP request and response spoofing . . . . . . . . . . . . 110
4.3.3 DES modeling . . . . . . . . . . . . . . . . . . . . . . . . . . . . . . . . 115
4.3.4 Detector . . . . . . . . . . . . . . . . . . . . . . . . . . . . . . . . . . . 121
4.3.5 Detection of MiTM and DoS using Authenticated and Spoofed tables 125
4.3.6 Analysis of extra ARP traffic due to active probing . . . . . . . . . . 127
4.4 Implementation, experimental results and comparison . . . . . . . . . . . . 127
4.5 Conclusions . . . . . . . . . . . . . . . . . . . . . . . . . . . . . . . . . . . . . 132
5 Header anomaly detection using data summarization 133
5.1 Introduction . . . . . . . . . . . . . . . . . . . . . . . . . . . . . . . . . . . . . 133
TH-1076_NHUBBALLI

CONTENTS xiii
5.2 Related work . . . . . . . . . . . . . . . . . . . . . . . . . . . . . . . . . . . . . 136
5.2.1 Overview of ADWICE . . . . . . . . . . . . . . . . . . . . . . . . . . . 137
5.3 Proposed scheme: header anomaly detection using data summarization . . 140
5.3.1 Training . . . . . . . . . . . . . . . . . . . . . . . . . . . . . . . . . . . 141
5.3.2 Testing . . . . . . . . . . . . . . . . . . . . . . . . . . . . . . . . . . . . 142
5.3.3 Time complexity analysis . . . . . . . . . . . . . . . . . . . . . . . . . 144
5.4 Experimental results . . . . . . . . . . . . . . . . . . . . . . . . . . . . . . . . 145
5.4.1 Experiment 5.1 . . . . . . . . . . . . . . . . . . . . . . . . . . . . . . . 145
5.4.2 Experiment 5.2 . . . . . . . . . . . . . . . . . . . . . . . . . . . . . . . 148
5.4.3 Experiment 5.3 . . . . . . . . . . . . . . . . . . . . . . . . . . . . . . . 149
5.4.4 Comparison with ADWICE . . . . . . . . . . . . . . . . . . . . . . . . 149
5.5 Conclusions . . . . . . . . . . . . . . . . . . . . . . . . . . . . . . . . . . . . . 153
6 Payload based anomaly detection using layerwise n-gram analysis 155
6.1 Introduction . . . . . . . . . . . . . . . . . . . . . . . . . . . . . . . . . . . . . 155
6.2 Related work . . . . . . . . . . . . . . . . . . . . . . . . . . . . . . . . . . . . . 157
6.2.1 n-gram based payload modeling and analysis . . . . . . . . . . . . . 158
6.3 Proposed approach: payload anomaly detection using n-gram analysis . . . 160
6.3.1 Training phase . . . . . . . . . . . . . . . . . . . . . . . . . . . . . . . 161
6.3.2 Testing phase . . . . . . . . . . . . . . . . . . . . . . . . . . . . . . . . 168
6.4 Complexity analysis . . . . . . . . . . . . . . . . . . . . . . . . . . . . . . . . 169
6.4.1 Time complexity analysis . . . . . . . . . . . . . . . . . . . . . . . . . 169
6.4.2 Space complexity analysis . . . . . . . . . . . . . . . . . . . . . . . . . 172
6.5 n-gram-tree compression . . . . . . . . . . . . . . . . . . . . . . . . . . . . . . 172
6.6 Experimental results . . . . . . . . . . . . . . . . . . . . . . . . . . . . . . . . 173
6.6.1 Dataset and attacks . . . . . . . . . . . . . . . . . . . . . . . . . . . . . 175
6.6.2 Accuracy and Detection Rate of Layergram and comparison . . . . . . 176
6.6.3 n-gram-tree size and compression . . . . . . . . . . . . . . . . . . . . 187
6.6.4 Effect of binning . . . . . . . . . . . . . . . . . . . . . . . . . . . . . . 190
6.7 Conclusions . . . . . . . . . . . . . . . . . . . . . . . . . . . . . . . . . . . . . 191
7 Conclusions and future scope of work 193
7.1 Summary of contributions of the thesis . . . . . . . . . . . . . . . . . . . . . . 193
TH-1076_NHUBBALLI

xiv CONTENTS
7.2 Scope for future work . . . . . . . . . . . . . . . . . . . . . . . . . . . . . . . . 195
A Failure detection and diagnosis using discrete event systems 199
A.1 Introduction . . . . . . . . . . . . . . . . . . . . . . . . . . . . . . . . . . . . . 199
A.2 Discrete event system models . . . . . . . . . . . . . . . . . . . . . . . . . . . 200
A.2.1 Models with measurement limitations . . . . . . . . . . . . . . . . . . 201
A.3 Failure modeling . . . . . . . . . . . . . . . . . . . . . . . . . . . . . . . . . . 203
A.4 Diagnoser . . . . . . . . . . . . . . . . . . . . . . . . . . . . . . . . . . . . . . 204
A.4.1 Construction of the diagnoser . . . . . . . . . . . . . . . . . . . . . . . 204
A.5 An example: FDD using DES . . . . . . . . . . . . . . . . . . . . . . . . . . . 206
A.5.1 Temperature controller system . . . . . . . . . . . . . . . . . . . . . . 206
TH-1076_NHUBBALLI

List of Figures
2.1 Increasing attack sophistication and decreasing attacker’s knowledge (from
[10]) . . . . . . . . . . . . . . . . . . . . . . . . . . . . . . . . . . . . . . . . . . 17
2.2 An example of NIDS deployment . . . . . . . . . . . . . . . . . . . . . . . . . 19
2.3 Snort internal components . . . . . . . . . . . . . . . . . . . . . . . . . . . . . 23
2.4 An example of anomaly in two dimensional data . . . . . . . . . . . . . . . . 41
3.1 Distribution of Snort signature ref. nos. across vulnerability databases . . . 55
3.2 A sample of Nessus vulnerability scanner output . . . . . . . . . . . . . . . . 57
3.3 Proposed architecture for FP minimization in signature detection systems . 60
3.4 Representation of threat profile of the network using EER model . . . . . . . 62
3.5 Proposed architecture for application criticality aware FP filter . . . . . . . . 81
3.6 Example of a CWA . . . . . . . . . . . . . . . . . . . . . . . . . . . . . . . . . 85
4.1 ARP packet format . . . . . . . . . . . . . . . . . . . . . . . . . . . . . . . . . 97
4.2 Flow chart for ARP REQUEST-HANDLER() . . . . . . . . . . . . . . . . . . . 107
4.3 Flow chart for ARP RESPONSE-HANDLER() . . . . . . . . . . . . . . . . . . 109
4.4 Example of request spoofing . . . . . . . . . . . . . . . . . . . . . . . . . . . . 110
4.5 Example of response spoofing . . . . . . . . . . . . . . . . . . . . . . . . . . . 114
4.6 ARP event sequence under normal condition . . . . . . . . . . . . . . . . . . 116
4.7 ARP event sequence under request and response spoofing conditions . . . . 117
4.8 DES model of ARP events under normal condition . . . . . . . . . . . . . . . 118
4.9 DES model of ARP events under request and response spoofing conditions 119
4.10 Detector for the DES model of Figure 4.8 and Figure 4.9 . . . . . . . . . . . . 124
4.11 Configuration of the testbed . . . . . . . . . . . . . . . . . . . . . . . . . . . . 128
4.12 Implementation level block diagram of the event detection system . . . . . 129
TH-1076_NHUBBALLI

xvi LIST OF FIGURES
4.13 ARP traffic in the normal condition . . . . . . . . . . . . . . . . . . . . . . . . 131
4.14 ARP traffic in the spoofed condition . . . . . . . . . . . . . . . . . . . . . . . 131
6.1 Proposed payload based anomaly detection system . . . . . . . . . . . . . . 161
6.2 n-gram-tree of order 3 built with one training packet . . . . . . . . . . . . . . 165
6.3 n-gram tree of Figure 6.2 after second packet is added . . . . . . . . . . . . . 165
6.4 n-gram-tree up to layer 2 (before compression) . . . . . . . . . . . . . . . . . 174
6.5 n-gram-tree of Figure 6.4 after compression . . . . . . . . . . . . . . . . . . . 174
6.6 Top 1000 frequency n-grams of order 5 from normal and generic attack
payloads . . . . . . . . . . . . . . . . . . . . . . . . . . . . . . . . . . . . . . . 185
6.7 Magnified version (lower frequencies) of Figure 6.6 . . . . . . . . . . . . . . 185
6.8 Number of distinct n-grams in the training dataset versus layer . . . . . . . 186
6.9 Detection Rate comparison: Layergram versus Anagram with varying impu-
rity (generic attacks) in training dataset . . . . . . . . . . . . . . . . . . . . . 188
6.10 Accuracy comparison: Layergram versus Anagram under impure (generic
attack) training dataset . . . . . . . . . . . . . . . . . . . . . . . . . . . . . . . 189
6.11 Cumulative distinct n-grams in training dataset versus number of days . . . 189
A.1 Hybrid system model for the temperature controller . . . . . . . . . . . . . . 208
A.2 DES model for the temperature controller . . . . . . . . . . . . . . . . . . . . 209
A.3 Diagnoser for the DES model: Figure A.1 and Figure A.2 . . . . . . . . . . . 210
TH-1076_NHUBBALLI

List of Tables
2.1 PNMT signature . . . . . . . . . . . . . . . . . . . . . . . . . . . . . . . . . . . 29
2.2 Anomaly detection systems and their types . . . . . . . . . . . . . . . . . . . 44
3.1 Snapshot of threat profile . . . . . . . . . . . . . . . . . . . . . . . . . . . . . 67
3.2 Snapshot of alarms generated . . . . . . . . . . . . . . . . . . . . . . . . . . . 68
3.3 Accuracy and Detection Rate of signature detection system without FP filter . 72
3.4 Accuracy and Detection Rate of signature detection system after FP filter . . . 74
3.5 Alarms with and without reference numbers . . . . . . . . . . . . . . . . . . 76
3.6 Accuracy and Detection Rate comparison with [94] . . . . . . . . . . . . . . . 76
3.7 Accuracy and Detection Rate before FP filter . . . . . . . . . . . . . . . . . . . 77
3.8 Accuracy and Detection Rate after FP filter . . . . . . . . . . . . . . . . . . . . 79
3.9 Accuracy and Detection Rate after correlation–critical applications . . . . . . 87
3.10 Accuracy and Detection Rate after correlation–non-critical applications . . . . 88
3.11 Accuracy and Detection Rate after CWA–critical applications . . . . . . . . . 90
3.12 Overall Accuracy and Detection Rate after CWA . . . . . . . . . . . . . . . . . 91
4.1 Cache table of host A under request spoofing . . . . . . . . . . . . . . . . . . 111
4.2 Spoofed table entry at IDS on detection of request spoofing . . . . . . . . . . 112
4.3 Packet and event sequences in the example of request spoofing . . . . . . . 113
4.4 Cache of host A under normal request . . . . . . . . . . . . . . . . . . . . . . 113
4.5 Authentication table entry at IDS without request spoofing . . . . . . . . . . 113
4.6 Spoofed table entry at IDS on detection of response spoofing . . . . . . . . . 114
4.7 Packet and event sequences in the example of response spoofing . . . . . . . 115
4.8 Comparison of ARP attack detection mechanisms . . . . . . . . . . . . . . . 131
TH-1076_NHUBBALLI

xviii LIST OF TABLES
5.1 Connection table: normal . . . . . . . . . . . . . . . . . . . . . . . . . . . . . 134
5.2 Connection table: SYN flooding . . . . . . . . . . . . . . . . . . . . . . . . . . 134
5.3 List of attacks present in RTUNND dataset . . . . . . . . . . . . . . . . . . . 146
5.4 Accuracy and Detection Rate in Experiment 5.1 . . . . . . . . . . . . . . . . . 147
5.5 Characteristics of KDD dataset . . . . . . . . . . . . . . . . . . . . . . . . . . 149
5.6 Accuracy and Detection Rate in Experiment 5.2 . . . . . . . . . . . . . . . . . 150
5.7 Characteristics of IIT Guwahati dataset . . . . . . . . . . . . . . . . . . . . . 150
5.8 List of attacks present in IIT Guwahati dataset . . . . . . . . . . . . . . . . . 151
5.9 Accuracy and Detection Rate in Experiment 5.3 . . . . . . . . . . . . . . . . . . 152
5.10 Comparison of Accuracy with ADWICE . . . . . . . . . . . . . . . . . . . . . 153
6.1 Number of packets of DARPA99 dataset of 1st week . . . . . . . . . . . . . . 175
6.2 Accuracy and Detection Rate for generic attack . . . . . . . . . . . . . . . . . . 177
6.3 Accuracy and Detection Rate for shell-code attacks . . . . . . . . . . . . . . . . 177
6.4 Accuracy and Detection Rate for morphed shell-code attacks . . . . . . . . . . 178
6.5 Accuracy and Detection Rate for polymorphic blending attacks . . . . . . . . 178
6.6 Cumulative Detection Rate up to layers for generic attacks with impure
training dataset . . . . . . . . . . . . . . . . . . . . . . . . . . . . . . . . . . . 180
6.7 Individual layer Detection Rate for generic attacks with impure training
dataset . . . . . . . . . . . . . . . . . . . . . . . . . . . . . . . . . . . . . . . . 181
6.8 Cumulative Accuracy up to layers for generic attacks with impure training
dataset . . . . . . . . . . . . . . . . . . . . . . . . . . . . . . . . . . . . . . . . 182
6.9 Individual layer Accuracy for generic attacks with impure training dataset . 183
6.10 Number of nodes created before and after compression . . . . . . . . . . . . 188
6.11 Comparison of cumulative Detection Rate with and without binning . . . . . 190
TH-1076_NHUBBALLI

Chapter 1
Introduction
1.1 Network security
In the past computers were not networked globally as they are today or were connected in a
small geography such as small building, office etc. At present as almost every computer is
connected to Internet they become potential targets of network or cyber attacks. A network
or cyber attack can be defined as a malicious attempt to compromise confidentiality,
integrity and availability of data in computers. Attacks can be generated from external
users or generated by internal users. External attacks are carried out by individuals
who themselves do not have any access to the computers being attacked and there is
no assistance from internal users. On the other hand, internal attacks originate from
legitimate users and comprise activities like accessing/modifying data beyond their access
privileges, compromising confidentiality etc. Network attacks involve many activities
some of them are as follows.
• Footprinting and enumeration: This activity involves collection of information re-
garding applications, Operating Systems (OSs), open ports etc. in hosts in a network.
This is basically an initial step in attacking a host in a network.
• Unauthorized data access or data manipulation: Unauthorized data access and
manipulation is the case when an attacker interprets, deletes or modifies data which
is beyond his/her access rights.
• Sniffer attacks or eavesdropping: Attacker monitors or listens to network traffic in
TH-1076_NHUBBALLI

2 Chapter 1. Introduction
transit (between hosts) and then interprets all unprotected data.
• Identity spoofing: In the Internet hosts are identified by Internet Protocol (IP) ad-
dresses. IP address spoofing occurs when an attacker creates IP packets with a
forged source IP address (of some genuine host) with the purpose of concealing its
identity and impersonating another genuine host.
• Denial of Service (DoS) attack: A denial of service attack prevents legitimate users
from accessing services on the network.
Nowadays as digital data is a major form of data storage, there is an increased need for
network security, i.e., mechanisms that can detect and prevent any malicious activity in
hosts and network. There are number of security components employed in a network by
security administrators like firewall, proxy server, access control list, Intrusion Prevention
System (IPS) and Intrusion Detection System (IDS).
Intrusions and intrusion detection system ([83]): Intrusion is any set of actions that
attempt to compromise confidentiality, integrity or availability of a computer resource
[58]. An IDS is a device or software application that monitors network and/or system
activities for malicious behavior or policy violations and prepares a report for system
administrator. IDS mainly involves detecting whether some entity has attempted or
worse gained access to system resources in an unauthorized way.
An IDS can be host based or network based depending on whether it monitors a
single host or a network. A Host based IDS (HIDS) is an IDS that monitors and analyzes
the internals of a computing system like, executions of applications, system calls etc. to
detect malicious behavior. A Network based IDS (NIDS) is an IDS that detects malicious
behavior by monitoring network traffic. Rest of the thesis mainly deals with NIDS and
henceforth unless otherwise mentioned, the term IDS refers to NIDS.
This chapter is organized as follows. Section 1.2 presents a taxonomy of IDSs based
on types of attacks they can detect. A brief report on major techniques proposed for all
classes of IDSs and issues with such techniques are discussed in Section 1.3. This section
also develops motivation for the work done in the thesis. Section 1.4 highlights the major
contributions of the thesis. In Section 1.5 the organization of the thesis in seven chapters
is discussed.
TH-1076_NHUBBALLI

1.2. IDS taxonomy based on attack detection 3
1.2 IDS taxonomy based on attack detection
IDSs found in the literature can be grouped into two classes based on the type of attacks
they detect– (i) known attacks only and (ii) known and unknown attacks.
1.2.1 Detecting only known attacks: signature and event based IDSs
Known attacks or exploits are those, whose type and consequences (may be partially) are
available in public domain. Common Vulnerability Exposure (CVE) [9] and Bugtraq [24]
are examples of public databases of known vulnerabilities. These databases are regularly
updated as and when new attacks are discovered. These attacks can be classified into two
types as given below.
• For which a signature can be generated.
• For which a signature cannot be generated. Such attacks are detected by differ-
ence in sequence of events (i.e., network packets) under normal and compromised
situations.
An IDS which uses signatures for detecting attacks is called signature based IDS and
an IDS which monitors events is called event based IDS. For the sake of brevity henceforth
signature based IDS is referred as signature detection system and event based IDS is
referred as event detection system.
1.2.1.1 Signature detection system
A signature is a pattern that is looked for, in network traffic by IDS to detect attacks. A set
of known attack signatures are stored in a database and the network or system activity
is compared with these signatures. If a match is found an alarm (used interchangeably
with “alert” in this thesis) is raised. Number of signature detection systems have been
proposed in the literature. Snort [113] and EMERALD [107] are some of the prominently
used signature detection systems.
A simple example of an attack for which signature can be generated is “land” attack;
the attack results in denial of service. Snort signature for land attack is shown below.
alert ip any any − > any any (msg : ”BAD TRAFFIC sameSRC/DST”; sameip; re f erence :
TH-1076_NHUBBALLI

4 Chapter 1. Introduction
cve,CVE−1999−0016; re f erence : url,www.cert.org/advisories/CA−1997−28.html; classtype :
bad − unknown; sid : 527; rev : 3; )
This signature monitors if a network packet has same source and destination IP address.
1.2.1.2 Event detection system
There is a certain class of known attacks for which signatures cannot be generated be-
cause there is no change in syntax of the network traffic under normal and compromised
situations. Such attacks change the intended behavior of network communication, e.g.,
Address Resolution Protocol (ARP) spoofing attack in a Local Area Network (LAN) [75].
In ARP spoofing attack, a false Media Access Control (MAC) address is associated with
an IP address by the attacker and sent to a host. As ARP is a stateless protocol, ARP cache
of the host (to which the false ARP packet is sent) updates itself with the false IP-MAC
pair. So altering IP-MAC pairing do not change the syntax of ARP message. However,
intended behavior of network communication changes. All traffic to be sent to the host
having the IP address under consideration will be sent to the host having spoofed MAC
address.
For these class of attacks it is not possible to write a signature although what happens
in the attack is exactly known. Detecting such attacks requires keeping track of sequence
of network packets also called events. The sequence under attack is different from that
under normal condition. The IDS is basically an event or state estimator which observes
sequences of events generated in the network to decide whether the states through which
the system traverses correspond to normal or compromised condition. To the best of our
knowledge, “state estimator” based concept has not been used for NIDS. However, the
idea is used for HIDS in [119, 130, 137].
1.2.2 Detection of known and unknown attacks: anomaly based IDSs
Signature and event detection systems can detect only attacks whose syntax or behavior
is known. However if an attack is new or its syntax and behavior is unknown, normally
another class of IDS termed as anomaly based IDS is used. Anomaly based IDS can detect
both known and unknown attacks. It models benign behavior of a system with a profile
and any deviation from the known profile is considered as intrusion. Benign profile is
TH-1076_NHUBBALLI

1.2. IDS taxonomy based on attack detection 5
represented as a set of parameters (which are also called features) and are extracted from
network packets. For example, number of Transmission Control Protocol (TCP) SYN
packets observed within a time window is a feature. One of the problem with anomaly
based IDS is that it requires a pure training dataset. Any contamination in the dataset
used for profile generation affects the detection accuracy. A review of various anomaly
based IDSs can be found in [44, 100].
Anomaly based IDSs can be classified into two types as follows.
• One which models packet headers and offers quick analysis.
• Other models payload of network packets and performs a detailed analysis.
Henceforth, anomaly based IDS is termed as anomaly detection system in this thesis.
1.2.2.1 Header based anomaly detection system
Header based anomaly detection systems use features extracted from network packet
headers for modeling. These features can be either contents of header fields itself or
can be derived from header fields. An example of a directly taken feature is source IP
address. On the other hand, if “number of packets arrived with TCP SYN flag set within
a time window” is used as a feature, then it is an example of a derived feature. Header
based anomaly detection system models only the packet header (which is small in size)
and hence quick analysis can be done. These IDSs perform well in detecting attacks
which either violate network protocol standards or cause denial of service. In case of
denial of service, network traffic pattern changes (e.g., huge bandwidth consumption,
more number of short lived connections etc.) which can be detected by statistics of header
fields. Techniques reported in [25, 63, 88] are the examples of header based anomaly
detection systems.
1.2.2.2 Payload based anomaly detection system
Header based anomaly detection systems do not suffice for detecting application level
attacks because in such cases attack content is inside the payload and protocol behavior
is not violated. In order to detect such application level attacks, features from packet
payloads are used for modeling and analysis; such anomaly detection systems are called
payload based anomaly detection systems [103, 134, 135].
TH-1076_NHUBBALLI

6 Chapter 1. Introduction
1.3 Issues in existing IDSs and motivation of the thesis
A typical IDS is characterized in terms of many parameters namely, effectiveness, effi-
ciency, ease of use, security, transparency and interoperability [33]. There are works in
IDS literature to improve one or a subset of these parameters. The work of the thesis
focusses at effectiveness of all three types of IDSs discussed in last section. Effectiveness
measures to what degree IDS can detect the intrusions into the target network (termed as
Detection Rate) and at the same time how many detections are for genuine attacks (termed
as Accuracy). Detection Rate and Accuracy involve three parameters- (i) True Positive (TP),
(ii) False Positive (FP) and (iii) False Negative (FN). TPs are the cases of genuine attacks
for which an IDS raises alarms. FPs are the benign cases for which an IDS raises alarms.
FNs are the attacks for which an IDS does not raise any alarm 1. So, TPs and FPs taken
together gives the number of alarms generated by an IDS. Detection Rate represents the
number of attacks that are detected (and IDS generates an alarm), out of all cases for which
IDS generates an alarm (all of which may not be an attack), i.e., TP/(TP+FN). Accuracy
represents the percentage of (real) attacks versus all cases detected as attacks by IDS,
i.e., TP/(TP+FP). Research on effectiveness of IDS aims to achieve high Detection Rate and
Accuracy. In other words, effectiveness is achieved by reducing FPs and FNs (in the alarms
generated by IDS), which is also termed as effective alarm generation. In this thesis terms
“reducing FPs and FNs”, “improving Accuracy and Detection Rate”, “effectiveness” and
“effective alarm generation” would imply the same meaning.
Now, in this section, major issues in signature, event and anomaly detection systems
with respect to Detection Rate and Accuracy are discussed and while doing so, motivation
for the work done in the thesis is drawn.
1.3.1 Issues with signature detection systems
For known attacks, signatures are developed and are stored in a database of signature
detection system. For these attacks signature detection systems generally provide a high
Detection Rate [48]. In other words, for known attacks signature detection systems have
1IDS do not generate any alarm in the case of false negatives and they are measured during off lineanalysis as number of attack traffic instances for which the signature IDS did not report an alert. However,to maintain similar phonetics with false positives and true positives, with slight abuse of language, we say“false negatives are generated by IDS”
TH-1076_NHUBBALLI

1.3. Issues in existing IDSs and motivation of the thesis 7
low FN rates. However, a major issue with signature detection systems is of large number
of FPs thereby leading to low Accuracy. Discussion in articles [105, 128] point out that,
sometimes up to 98% alarms generated by commercial signature detection systems are
FPs.
A FP is generated under two circumstances–first when an attack is launched against
a host in a network and an alarm is generated by the IDS, but the attack fails to exploit
any vulnerability (in the target host). Second, when benign network activity is detected
as attack by IDS. An example of the first situation arises when a windows based attack
is launched against a Linux system. Although an actual attack is seen on the network
traffic (and signature detection system generates an alarm due to signature matching),
this attack fails because it cannot exploit the vulnerability in a Linux system. In general,
signature detection systems are run with default set of signatures. So alarms are generated
for most of the attack attempts irrespective of success or failure to exploit vulnerability in
the network under question. It may be noted that, there is always a limited number of
known vulnerabilities which can be exploited in a network compared to the number of
signatures in a signature database. This is the cause of large number of FPs with signature
detection systems and effective alarm generation requires FP minimization. In view of
this, FP minimization is a relevant dimension of research in signature detection systems.
Techniques to minimize FPs in signature detection systems are of three broad classes as
given below.
• Enhancing usual signatures with network context information [92, 121] (i.e., config-
uration of the network in terms of applications/OSs running in hosts etc.)
• Correlating signature detection system alarms with alarms of other IDSs [39, 46].
• Correlating alarms with vulnerabilities in hosts in terms of vulnerability reference
numbers [96].
These schemes increase Accuracy but have some disadvantages. In signature enhance-
ment based scheme, signatures need to be modified and signature detection system is
restarted if the context information is changed. It may be noted that, modifying sig-
natures is tedious. Considering the dynamic context of a network in terms of installa-
tion/unistallation/patching of services and applications in hosts, this technique is not effi-
cient. Improvement in Accuracy by correlating alarms of different IDSs mainly depends
TH-1076_NHUBBALLI

8 Chapter 1. Introduction
on correlation engine, which is non-trivial because events of different domains need to be
matched. For example, correlation technique proposed in [46] matches signature detec-
tion system alarms with anomaly detection system alarms generated by HIDS, which is
often difficult because response time of NIDS and HIDS are different. So improvement in
Accuracy using these schemes are not high. The techniques based on correlating alarms
with vulnerabilities in the hosts in terms of vulnerability reference numbers do not require
signature detection system shutdown or signature modification with change in network
context. However, they can improve Accuracy only up to a certain extent because all
signatures of signature detection system (and corresponding alarms) and vulnerabilities
do not have reference numbers [91].
Any scheme that improves Accuracy also leads to drop in Detection Rate [103]. Drop in
Detection Rate can be tolerated for non-critical applications. However, lowering Detection Rate
for critical applications may lead to serious security threats as some attacks may pass un-
detected. So works reported in [27, 106, 111, 131, 145] proposed to provide a prioritized
list of alarms to the system administrator rather than filtering out some which seems to
be FPs. Now the administrator’s job is to look into the details of top few alarms (based
on a threshold) of appropriate prioritized lists; alarms looked into can be considered as
TPs and the others below in the list are FPs. So effectiveness of prioritization techniques
largely depends on the threshold selected by the administrator and also on the accuracy
of correlation techniques.
From the above discussion it may be stated that an efficient alarm generation scheme
in signature detection systems involves FP minimization and should be based on corre-
lation of alarms with vulnerabilities in the network. However, to cater to the problem
of incompleteness of reference numbers (of vulnerabilities and signatures), more features
that are generated with signature detection system alarms are to be used and suitable
correlation technique is to be developed. Also, while minimizing FPs it must be ensured
that no genuine attack is missed for a critical application.
1.3.2 Issues with event detection systems
Event detection systems basically work by observing sequences of events and then esti-
mating the condition of a system. Such systems can be used for detecting known attacks
TH-1076_NHUBBALLI

1.3. Issues in existing IDSs and motivation of the thesis 9
for which signatures cannot be generated. In other words, FNs will be generated by
signature detection systems for such known attacks. So effective alarm generation for
these class of known attacks requires event detection systems. Event detection systems
have been used in HIDS [118, 130, 137], where system calls are considered as events and
then by observing their sequence, the condition of a host is estimated. To the best of our
knowledge, event detection systems have not been applied at the NIDS level. There are
many instances of known attacks at network level for which signature cannot be deter-
mined e.g., ARP spoofing, Internet Control Message Protocol (ICMP) error message based
attacks etc. All the available techniques for detecting such known network attacks are
tailor made. In other words, detection scheme for one category of such (known) attacks
cannot be applied for others, even if they are of similar nature.
Major techniques to detect ARP spoofing attacks and their corresponding limitations are
given below.
• Static IP-MAC pairing. This is not acceptable in a dynamic environment.
• Watch for changes in IP-MAC pairs in traffic [3, 8]. This technique may fail entirely
if the first IP-MAC pair sent in the network is spoofed.
• Cryptographic technique based authentication before accepting any IP-MAC pairs
[57, 85]. Cryptographic techniques increase computation overhead and modifies the
standard ARP.
• Active probing to verify genuineness of new IP-MAC pairs [112]. Active probing in
[112] is done in TCP layer, resulting in violation of network layering architecture.
Further, the schemes for detecting ARP spoofing attacks cannot be applied for other cases
of similar type e.g., ICMP error message based attacks.
The idea of using event detection system in HIDS is generic and can be adapted in
NIDS for many attacks of similar kind (as the ones handled in [118, 130, 137]) e.g., ARP
spoofing, ICMP error message based attacks etc.
So, from the above discussion on ARP spoofing attacks and event detection systems
on HIDS [118, 130], it may be stated that the idea of event detection system can be adapted
to NIDS. This forms a systematic way of analyzing the events to detect attacks and can
be generically applied for all attacks which can be mapped to “difference in sequence
TH-1076_NHUBBALLI

10 Chapter 1. Introduction
of events”. Alternatively speaking, these attacks do not lead to change in syntax or
semantics of network traffic nor do they lead to deviation in traffic statistics. So they
cannot be detected using signature IDS or Anomaly IDS. Attacks of such nature can be
better detected using event detection systems which work by sending active probes and
monitor resulting difference in sequence of events under normal and attack situations. So
event detection systems would lead to effective alarm generation for all such attacks. In
case of ARP spoofing, the technique should have some extra properties like, (i) should
support dynamic environment, (ii) should not modify the standard ARP or network
layering architecture, (iii) should generate minimal extra traffic in the network, (iv) should
detect a large set of ARP attacks and (v) hardware cost of the scheme should not be high.
1.3.3 Issues with anomaly detection systems
By the nature of its working anomaly detection systems generate a baseline profile of
normal system activity and any observation of deviations are flagged as intrusions. As
network behavior is dynamic and intrusive activity sometimes differs slightly compared
to normal activity, these methods suffer from both FPs and FNs [56]. So effective alarm
generation for anomaly detection systems require reduction in both FPs and FNs (i.e.,
improvement in both Detection Rate and Accuracy).
1.3.3.1 Issues with header based anomaly detection systems
As the network packet header has a definite structure (i.e., number of fields, their length,
type etc.) it is relatively easy to build a model for normative system behavior. So, in case
of header based anomaly detection systems, fairly high Detection Rate and Accuracy have
been achieved [76, 80, 104] for the attacks detectable by header statistics.
Another important requirement of header based anomaly detection systems is to offer
quick decisions on the analyzed traffic as they need to handle less number of features
compared to payload based anomaly detection systems. Most of the algorithms proposed
for anomaly detection systems fall into cluster analysis category [44]. As networks become
faster in operation, the amount of data that needs to be analyzed becomes huge. Moreover,
many clustering techniques require more than one pass to generate clusters, hence most
of the anomaly detection systems cannot work for such high speed networks. To handle
TH-1076_NHUBBALLI

1.3. Issues in existing IDSs and motivation of the thesis 11
this situation, ADWICE [41] proposed a header based anomaly detection system which
is based on the well known data summarization technique BIRCH [152]. Summarization
techniques derive a summary information from the dataset and processing is done on
this summary rather than the whole dataset. This scheme can handle fairly large dataset,
however, false alarms are higher compared to other header based anomaly detection
systems without summarization. So, in header based anomaly detection systems, issues
of false alarms are of more concern when data summarization is used to handle large
dataset. In other words, effective alarm generation is an important issue in header based
anomaly detection systems where data summarization is used.
1.3.3.2 Issues with payload based anomaly detection systems
Modeling normative behavior of packet payload and analysis for anomaly detection is
difficult compared to header based schemes. This is because, unlike header, there is no
defined structure for payload and payload size is large, thereby making any analysis
computationally expensive. Further, payload of different applications differ in nature.
In order to learn the benign behavior of these applications a separate model needs to
be built. Approaches found in the literature for payload based anomaly detection [103,
134, 135, 149] mainly use n-gram analysis technique. These techniques require normal
packets from application specific data for modeling and provide good Detection Rate. In
other words, if pure normal dataset can be made available for training, payload anomaly
detection systems [103, 134, 135, 149] can detect a large number of application level attacks.
However, availability of a dataset that comprises only normal packets is far from reality
in a practical scenario. Detection Rate falls drastically in these systems if the training
dataset is contaminated with attack packets. So, given the practical difficulties in getting
a clean dataset, payload based anomaly detection systems, which can tolerate impurities
in training dataset to some extent is necessary. In other words, effective alarm generation
for payload based anomaly detection systems requires attack detection (i.e., improvement
in Detection Rate) when the training dataset has impurities. The problem of effective
alarm generation in anomaly detection systems with impure training dataset has been
addressed for HIDS (i.e., system calls) in [99]. However, to the best of our knowledge,
there is no payload based network anomaly detection system which can handle impure
training dataset.
TH-1076_NHUBBALLI

12 Chapter 1. Introduction
1.4 Contributions of the thesis
In the last section, issues regarding effective alarm generation with all the three types
of IDSs, signature, event and anomaly detection systems were discussed. This thesis
provides solutions to the issues raised and has the following main contributions leading
to effective alarm generation.
• A FP alarm filtering scheme for signature detection system, taking into account the
network context information is proposed. First a dynamic threat profile representing
the vulnerabilities present in the network being monitored is built. Following that,
a neural network based correlation engine for filtering FPs generated by the sig-
nature detection system is used. The engine correlates network threat profile with
the alarms, in terms of many common parameters like IP address, port number,
vulnerability reference number etc. As an enhancement to this scheme, criticality of
the application being targeted by an attack is examined, before eliminating the cor-
responding alarm estimated to be FP. Criticality of applications are modeled using
Finite State Machine (FSM) based framework. All alarms which are declared as FPs
(by the filter) are evaluated with the criticality of the application against which the
corresponding attack is launched. If the attack is against a critical application, the
corresponding alarm is passed even if it is declared as FP. On the other hand all FP
alarms against non-critical applications are dropped.
The proposed application criticality aware FP filter provides effective alarms in sig-
nature detection systems by achieving high Accuracy yet maintaining 100% Detection Rate
for critical applications.
• A Discrete Event System (DES) based event detection system for ARP attacks is pro-
posed. Certain extensions over the classical failure detection and diagnosis theory
of DES [42] are made in the proposed event detection system namely, (i) incorpora-
tion of timing information in the model transitions and (ii) use of active probes to
differentiate events in normal model compared to faulty model.
This event detection system can detect a large class of ARP attacks (thereby result-
ing in effective alarms), maintains standard ARP and does not have much hard-
ware/software overheads.
TH-1076_NHUBBALLI

1.5. Organization of the thesis 13
• A header based anomaly detection system for handling voluminous network traffic
is proposed. The anomaly detection system uses a data summarization technique
based on BIRCH, which enables it to handle large datasets. The anomaly detection
system makes some modification in the BIRCH algorithm which achieves better clus-
tering thereby resulting in higher Detection Rate and Accuracy. The modifications in
the BIRCH algorithm involve (i) use of cluster quality indices (instead of threshold),
(ii) comparison of a new point with all clusters for finding the nearest one (instead of
hierarchal comparison) and (iii) capability of handling both categorical and ordinal
attributes (instead of only ordinal attributes).
It is shown experimentally that the proposed anomaly detection system achieves
better clustering and therefore alarms generated are more effective compared to
similar schemes reported in the literature.
• A payload based anomaly detection system which is tolerant to impure training
dataset is proposed using n-gram based statistical models. Tolerance to impure
training dataset is achieved using higher order n-grams and keeping frequency
information of the n-grams seen in the training dataset. However, keeping frequency
information and use of higher order n-grams is complex in terms of time and space
complexity. In the proposed scheme, an efficient data structure termed as n-gram-
tree is used which can store higher order n-grams with frequency information.
Experiments illustrate that level of tolerance to impurity is higher in the proposed
payload based anomaly detection system. This results in alarms generated being
more effective compared to similar schemes reported in the literature.
1.5 Organization of the thesis
The organization of the dissertation is as follows.
Chapter 2: This chapter provides an overview of existing IDS techniques and discusses
their limitations.
The subsequent chapters, Chapter 3 through Chapter 6, deal with one contribution each,
discussed in the last section.
TH-1076_NHUBBALLI

14 Chapter 1. Introduction
Chapter 3: This chapter deals with FP minimization technique for signature detection
systems.
Chapter 4: In this chapter the event detection system for detecting ARP attacks is pro-
posed.
Chapter 5: This chapter presents the header based anomaly detection system based on
data summarization technique.
Chapter 6: This chapter proposes the payload based anomaly detection system, which is
tolerant to impure training dataset.
Chapter 7: This chapter summarizes the work described in this thesis and provides direc-
tions to future work in this area.
TH-1076_NHUBBALLI

Chapter 2
Background and literature survey
2.1 Introduction
Intrusion detection deals with discovering malicious activities (e.g., break-ins, penetra-
tions, and other forms of unauthorized access) in a system. At present as almost every
computer is connected to the Internet, they become potential targets of intrusions (or at-
tacks). In the context of computer networks, Intrusion Detection System (IDS) is a device
or software that monitors network and/or system activities to detect attempts to compro-
mise confidentiality, integrity and availability of network resources. One of the earliest
work on intrusion detection in computer networks is by James. P. Anderson [32]. In the
seminal article the author presented a threat model which describes internal penetrations,
external penetrations and misfeasance. Further, a surveillance system for detecting all
the three types of activities is discussed. In another major work, D. E. Denning [49] de-
scribed that users have a defined set of actions and intrusions can be detected assuming
the intrusions deviate from the defined set of actions. The model is typically an anomaly
detection system as user behavior is profiled and deviations are detected as intrusions.
Several models based on simple statistics, Markov techniques and time series analysis are
discussed to build such a profile.
Since 1980 (after the Anderson’s seminal paper) sophistication of attacks or intrusions
has increased enormously. By contrast, the necessary intruder’s knowledge to create an
attack is decreasing. This is due to the fact that, multiple tools on the Internet are available
(freely), which make generation of attack easier. Figure 2.1 (adapted from [5]) shows
TH-1076_NHUBBALLI

16 Chapter 2. Background and literature survey
this development of increasing sophistication of attacks and decreasing requirement of
intruder’s knowledge over time. To cope up with this increasing sophistication and
number of attacks, smart IDSs are becoming indispensable. There are quite a good number
of IDSs available in open source, commercial and research laboratories. Before any IDS
is deployed at a network it is evaluated for some essential performance requirements.
The parameters used for evaluation are summarized by Stefan Axelsson [33] and are
enumerated below.
• Effectiveness: Effectiveness specifies to what degree IDS can detect attacks into the
target network and at the same time how many detections are for genuine attack
cases. Effectiveness is also called effective alarm generation.
• Efficiency: IDS efficiency is measured by many factors like run time utilization of
CPU, hardware and software requirements etc.
• Ease of use: Ease of use of an IDS depends on many factors like, effort required
for installation, up-gradation on change of network context or addition of attacks,
interpretation of alarms etc.
• Security: Security of an IDS pertains to the tolerance of the IDS (software) itself to
attacks.
IDSs found in the literature are generally classified as host based or network based.
Host based IDS (HIDS) analyzes program behavior in terms of system calls, audit log
files etc. to detect attacks. On the other hand, Network based IDS (NIDS) tries to detect
malicious activity by monitoring network traffic.
2.1.1 Host based intrusion detection system
A host based IDS typically monitors and analyzes internals of a computing system like
system calls, log files etc. to detect malicious activities. Some of the major techniques
used by HIDS are discussed below.
2.1.1.1 File integrity checkers
One popular method for detecting intrusions is by checking key system files and exe-
cutables via checksums at regular intervals for unexpected changes. A good example is
TH-1076_NHUBBALLI

2.1. Introduction 17
Figure 2.1: Increasing attack sophistication and decreasing attacker’s knowledge (from[10])
keeping a hash value of an important file which is not supposed to be changed by any
user other than system administrator. File integrity checker periodically computes hash
value of a file and compares it with the stored initial value to detect any alterations. It
raises an alarm if there is a change.
Tripwire [71] is an example of file integrity checker. It compares a designated set of
files and directories against information stored in a previously generated database; any
differences are flagged and logged. When it is run against system files on a regular basis,
any changes can be spotted.
Advanced intrusion detection environment [2] is another example of integrity checker.
AIDE generates a database of various file attributes namely file permissions, inode num-
bers, user, group, file size, mtime and ctime, atime, growing size, number of links, link
name etc. It also creates a cryptographic checksum or hash of each file using one or a
combination of the following message digest algorithms– SHA1, SHA256, SHA512, MD5,
RMD160. Similar to Tripwire, changes in stored file attributes and also hash values trigger
alarms.
Osiris [139] is a file integrity monitoring system which monitors a pool of computers.
Each system periodically exports its file snapshots to a central entity. These snapshots are
compared with the snapshots stored in databases of individual hosts in the central entity.
TH-1076_NHUBBALLI

18 Chapter 2. Background and literature survey
Any changes in the snapshots are notified with alarms.
Integrit [15] and Afick [13] are other two examples of HIDS, which use file integrity
checking.
2.1.1.2 Log file analysis and pattern matching
In log file analysis, attacks are encoded in terms of regular expressions. HIDS engine
searches these log files for known patterns using regular expressions and upon finding a
match an alarm is issued to administrator. MultiTail [16] is an example of log analyzer.
Simple WATCHer [1] is another log file analysis based HIDS which works with syslog in
Unix systems.
2.1.1.3 Statistical approach
Samba [114] proposed that there are some attributes in a host whose statistics can be used
to characterize normal condition and any deviation can be considered as attack. Examples
of such attributes include session duration, number of files opened, number of print jobs,
CPU usage patterns, login failures by user name/password mismatches etc. The scheme
performs two stage activity for detecting attacks. First is the identification of unusual
activity in the set of observed features and second is performing statistical tests on the set.
2.1.1.4 System call monitoring
These methods assume that a program in execution follows a well defined structure of
generating system calls. Standard or normal sequence of system calls is collected in two
ways – (i) synthetically, by exercising as many normal usage patterns of a program as
possible, (ii) in a live user environment by tracing actual execution of a program. An
attack would change the sequencing of system calls. HIDS monitors the sequence of these
system calls and alerts if the sequence is deviating from the standard format. Stephanie
Forrest et al. have authored series of articles [54, 59, 120] based on system call monitoring.
2.1.1.5 Hybrid methods
Latest HIDSs use all the approaches discussed above in an integrated manner, called
hybrid HIDS. For example, Samhain et al. [22] have developed an HIDS using hybrid
TH-1076_NHUBBALLI

2.1. Introduction 19
Router
Figure 2.2: An example of NIDS deployment
approach comprising file integrity checking, log file analysis and monitoring. It facili-
tates monitoring multiple hosts with different OSs and provides centralized logging and
maintenance.
2.1.2 Network based intrusion detection system
NIDS derives its name from the fact that it monitors a network rather than a host. More
precisely, it monitors an entire network segment consisting of several hosts. An NIDS
attempts to detect malicious activities by monitoring network traffic (series of packets
exchanged in the network segment). NIDS is normally deployed on a host which receives
entire network traffic for analysis. In order to feed all network traffic to NIDS, the network
interface card of the host on which NIDS is running is put in promiscuous mode. 1 NIDS
is deployed at every network segment (subnet) as shown in Figure 2.2. In the figure there
are three NIDSs to monitor three subnets. Two of the subnets are having only servers and
third one is having hosts.
Today majority of the attacks come from the Internet. So NIDS becomes an important
security component. The primary focus of this thesis is effective alarm generation of
NIDS and subsequent discussions mainly deal with NIDS. NIDSs are divided into two
types based on the kind of attacks they detect–(i)known attacks only and (ii)known and
1In normal mode a NIC card passes only those packets to upper layers (of network stack) whose MACaddress is same as that of the NIC card. In promiscuous mode NIC card passes all received packets to upperlayers.
TH-1076_NHUBBALLI

20 Chapter 2. Background and literature survey
unknown attacks. These two techniques are elaborated in the next two subsections.
Rest of the chapter is organized as follows. Section 2.2 presents literature review
of NIDS for known attack detection. This section discuses two such types of NIDSs
namely, signature detection system in Subsection 2.2.1 and event detection system in
Subsection 2.2.2. Section 2.3 highlights works reported in the NIDS literature on unknown
attack detection, termed as anomaly detection system. Subsection 2.3.1 deals with header
based anomaly detection system and Subsection 2.3.2 deals with payload based anomaly
detection system. Finally the chapter is concluded in Section 2.4.
2.2 Known attack detection
Known attacks are the ones whose details in terms of its effects and vulnerable target
OSs/applications etc. are published in the public domain. Common Vulnerability Ex-
posure (CVE) [9], National Vulnerability Database (NVD) [17], Internet Security Systems
(ISS) [14] and Bugtraq [24] are some of the examples of public forums which publish
recently discovered security flaws in various applications and OSs. Almost all of these
databases adopt a standard method of describing and keeping track of reported vulner-
abilities. For instance, CVE has the following format. Each entry in the CVE database is
given a number which uniquely identifies it. This number is also called as identifier. It is
a combination of the word “CVE”, year of discovery and sequential number in that year.
It also includes a short description about the target application and list of all the versions
of application(s)/OS(s) known (till date) to be vulnerable.
An example of a vulnerability as recorded in CVE is given below,
identifier: CVE-1999-0003,
description: Intruder is attempting to exploit the buffer overflow weakness in ToolTalk and
vulnerable software configurations: tritreal:ted cde:4.3, irix:5.2, irix:5.3, irix:6.0, irix:6.1, irix:6.2,
irix:6.3, irix:6.4.
Based on the detection technique used, IDS for known attacks can be of two types–(i)
signature detection system and (ii) event detection system.
TH-1076_NHUBBALLI

2.2. Known attack detection 21
2.2.1 Signature detection system
Signature detection systems work by examining network traffic for well-known patterns
or signatures to detect attacks. The term signature (also called rules) refers to nothing
more than a basic definition of an attack. In other words, for every known attack a pattern
or signature is stored in the database of signature detection system and network activity
is compared with these signatures. If a match is found an alarm is raised. Many of these
signatures are written by experts after running a known exploit several times, monitoring
the data as it appears on the network and looking for a unique pattern that is repeated
on every execution of the exploit. This method works fairly well at ensuring that the
signature will consistently match an attempt by that particular exploit.
Although there is no general answer for what exactly is there in an attack signature, they
consist of several components used to uniquely identify an attack. An ideal signature will
be as simple as possible and will be capable of detecting the target attack. If the signature
is simple it is easier to search for a match in the data stream (of network packets). On
the other hand complex signatures may pose a serious processing burden. As there
are varying types of known attacks, there are different types of signatures too. There
are signatures ranging from those which define the characteristics of a single IP option
to others, which define payload of an attack. Some even combine these two. Many
signature detection systems provide support for regular expression pattern matching for
writing signatures. Regular expressions provide wildcard and complex pattern matching
which result in a more accurate representation of an attack. For example, in order to
look for an e-mail message having an executable attachment, typically signature detection
system should look for the pattern name =< some − name > .exe, where “some-name”
may be any valid filename. The difficulty with pattern matching is that, “=” sign can
be preceded or followed by any number of spaces and tabs. For example, the pattern
should match name = run−me.exe. Signature detection systems which are not equipped
with regular expression matching do not have the ability to specify that there can be any
number of spaces and tabs around the “=” and will only look for the standard number of
spaces around the “=”. By surrounding “=” with spaces and tabs, an attacker can send a
virus infected executable, while hiding the attack from a signature detection system (not
equipped with regular expression matching). A classical example of pattern matching for
attack detection is to check for the pattern “/cgi-bin/phf?”, which indicates an attempt to
TH-1076_NHUBBALLI

22 Chapter 2. Background and literature survey
access a vulnerable CGI script on a web-server. Snort [113] and Bro [102] are two widely
used signature detection systems.
2.2.1.1 Snort [113]
Snort is an open source signature detection system capable of performing real time traffic
analysis and packet logging in IP networks. It can perform protocol analysis, content
searching/matching and can be used to detect a variety of attacks such as probes, buffer
overflows, stealth port scans, CGI attacks, SMB probes, OS fingerprinting attempts etc.
Snort has four basic components– (i) sniffer (ii) preprocessor (iii) detection engine and
(iv) reporting and logging. In its most basic form, Snort is a packet sniffer. However, it is
designed to take packets and process them through a set of preprocessors and then check
those packets against a series of rules (through the detection engine). If any packet finds
a match with some rule an alarm is triggered. These alarms can be dumped to a database
or can be viewed online. Internal components of Snort are shown in Figure 2.3 and a brief
discussion about each component is as follows.
Sniffer: Packet sniffer collects packets for evaluation by other components. It is written
using libpcap library [21] which is a standard software module adopted for many network
packet sniffers and applications.
Preprocessor: Preprocessing is an evaluation step before the network packets are passed
to the detection engine. Preprocessor contains a set of plug-ins. Plug-ins either detect
particular type of behavior which is not detectable by rules (in detection engine) or convert
packets such that they can be evaluated by rules in the detection engine. For example,
one of the plug-in detects port scans. Detecting port scans require keeping statistical
measures of some attributes over a series of packets. This plug-in raises an alert when
count of some measured attributes exceed a preset threshold. Similarly another plug-in
detects fragmented packets which requires multiple fragments of a packet to be collected.
It reassembles fragments into original packets and hands it over to the detection engine.
The advantage of these plug-ins is, one can turn on any (all) of them based on attack
detection requirements.
Detection engine: It is the main attack detection component of Snort. It uses a database of
rules and each rule pertains to a specific attack. Network packets which are passed from
preprocessor module are matched against these rules. If the packets match any rule, an
TH-1076_NHUBBALLI

2.2. Known attack detection 23
Intern
etPa
cket
Sniff
er
Prep
rocess
orEv
aluati
on
HHTP
Enco
ding P
lug-in
Pack
ets
RPC
Plug-i
n
Port S
cannin
g
Plug
-in
Detec
tion E
ngine
Rule
Match
ingPa
ckets
Rule
Datab
ase
Repo
rting
Log
ging
Alert
s
Do th
e pac
kets
Matc
h
Yes
No
Disca
rd
Alert
s
Figu
re2.
3:Sn
orti
nter
nalc
ompo
nent
s
TH-1076_NHUBBALLI

24 Chapter 2. Background and literature survey
alert is sent to the reporting module.
Reporting module: This module receives the alerts and either dumps them into a database
or sends them to the administrator, if processing is configured as off-line. In case of on-line
configuration, the reporting module sends the alerts to an interface in real time.
Snort is implemented in C in the following five modules.
• decode.c: Packet decoder
• rules.c: Rules engine
• detect.c: Detection engine
• log.c Logging engine
• Snort.c Main Snort code
Effectiveness of Snort depends on the quality of rules written. Understanding and
writing rules is an important aspect of Snort. A brief description of rules follows.
Snort rules: A Snort rule can be divided into two main components as rule header and
rule body. Snort rule header is the main portion of a signature, since it identifies what
should be done when the rule is flagged (i.e., its action). The rule header is again divided
into four main parts as follows.
• Rule action: Defines what action should take place when a rule is triggered. One
can configure either to log the alert or to trigger other rules.
• Protocol: It indicates what protocol packet to use for analysis.
• Source information: This specifies the IP address of the source host. There are two
options for specifying the address, either an absolute IP address or an CIDR address.
• Destination information: This field specifies the destination IP address.
Rule body is essentially an extended portion of the rule and mainly specifies options like,
what content is to be searched in the packet payload, message to be displayed when the
rule is triggered etc. Snort allows to search the payload content either in binary or ASCII
format.
TH-1076_NHUBBALLI

2.2. Known attack detection 25
A simple example of a rule which detects “land” attack is shown below. In this attack,
a packet is sent to a victim host with same source and destination IP addresses.
alert ip any any − > any any (msg : ”Same Source and Destination IP Address”; sameip; ).
The portion of the rule “ip any any − > any any” is the header. It specifies the protocol to
look for is IP. The leftmost “any” (on the left side of arrow) specifies source IP address to
be any valid IP address, meaning the packet can originate from any host. Similarly, the
next “any” specifies the port number to be any valid port number. Finally, “any any” at the
right hand side of arrow signifies the destination IP address and destination port numbers
can be anything. Body of the rule is within the bracket. It simply has a message for the
administrator saying there is a malformed packet having same source and destination IP
address (which is not allowed in TCP/IP suite).
2.2.1.2 Bro [102]
Bro is an open source, Unix-based signature detection system. Similar to Snort, it also first
parses the network traffic to extract application level semantics. It detects intrusions by
comparing network activity with attack patterns specified in rules. Its analysis includes
detection of network attacks (those defined by signatures) and also unusual activities
(e.g., certain hosts connecting to certain services, patterns of failed connection attempts,
network statistics variations etc.). Bro can monitor high bandwidth networks because it
works by eliminating packets from detailed analysis which are not of interest. Bro uses a
custom scripting language to write the rules.
2.2.1.3 Pros and cons with signature detection systems
Intrusion detection community has developed a number of different signature detection
systems, which work in particular domains or networks (e.g., Internet or Intranet), in
specific environments (e.g., Windows NT or Solaris) and at different levels of abstraction
(e.g., only header or full packet). The main advantage of signature detection systems is
that they can detect known attacks or intrusions very well. In other words, most of the
signature detection systems have reasonably acceptable Detection Rate for known attacks.
The biggest disadvantage is that signature detection systems can not detect new or novel
attacks. Further, even in the context of known attacks, the major issue with these systems
TH-1076_NHUBBALLI

26 Chapter 2. Background and literature survey
is of large number of False Positives (FPs). Sometimes up to 98% alarms generated by
commercial signature detection systems are FPs [105, 128].
In signature detection systems, FPs are generated because generally these systems are
run with default set of signatures. So whenever there is a match between network traffic
and attack signature an alert is raised, irrespective of the fact whether the attack can exploit
any vulnerability. An example of the situation arises when land, a windows 98 based attack
is launched against a windows 7 machine (where it is patched). In general, there is always
a limited number of known vulnerabilities which can be exploited in a network compared
to the number of signatures in a default database, which is the reason for large number of
FPs. Another major cause for FP generation is loosely written signatures.
Although the issue of FPs is a major problem in signature detection systems, False
Negatives (FNs) are also generated by these systems for known attacks. The main reason
for FNs is, small variations around pertinent attack created by attackers to defeat signature
detection systems. The solution to the problem is to develop good quality signatures
capable of handling these deviations.
In the next Subsection a taxonomy of various techniques found in the literature for
FP minimization in signature detection systems is given. This section also points out the
issues with these methods.
2.2.1.4 False positive minimization in signature detection systems
FP minimization schemes found in the literature can be grouped into three classes –(i)
signature enhancement (ii) alarm mining and (iii) alarm correlation. Subsequently all the
three types are elaborated.
I. Signature enhancement
In the signature enhancement based schemes signatures are basically augmented with
additional evaluation information. This information specify the instances when the par-
ticular signature is applicable. For example, the additional information may be vulnerable
target applications.
Many signature detection systems use network byte sequences as signatures to detect
intrusions (as is the case in the above example of land attack). Sommer et al. [121] proposed
an enhancement to these byte level signatures with network context information. Further,
TH-1076_NHUBBALLI

2.2. Known attack detection 27
they have also enhanced the signatures so that comparison with network packets can
be done efficiently. The two levels of enhancements are–(i) providing regular expression
support to write signatures and (ii) providing connection state information to the detection
engine. It is to be noted that network traffic has to be matched with each signature
separately in the database, which is computationally expensive. Since regular expressions
are closed under union operation, new regular expressions can be obtained by combining
more than one regular expressions. So expressing signatures using regular expressions
facilitates simultaneously matching of more than one signature with network packets.
The second enhancement basically attempts at finding additional information which can
give some insight about the success of an attack before generating an alert (triggered by a
signature match). Authors use Bro as a the signature detection system for demonstrating
the usefulness of their method. Bro has a built in suit known as analyzers. These
analyzers follow a connection between two end points and extract connection specific
information, e.g., http URI’s visited, FTP commands used within a connection etc. So by
passive monitoring of network traffic, information about applications, OSs etc. running
in the hosts are collected. A list of vulnerable applications in each host is generated
using the information collected passively. The idea is to use the additional vulnerability
information along with a signature to determine success of the corresponding attack.
Now, only matching a signature is not enough to trigger an alert. In addition, success of
an attack is also determined before issuing the alert.
A similar approach presented in [92], uses an object oriented paradigm for modeling
signatures along with context information. A prototype version of the signature detection
system called “Passive Network Monitoring Technique (PNMT)” is designed. Context
information in the model is populated by a passive learning mechanism, and hence the
name. For example, when PNMT discovers the target OS of a particular host it creates an
object. Similarly, when an open port is discovered (when data is exchanged on that port)
for the host in question it updates this information in the corresponding object. Signatures
are written with the help of these objects by enforcing constraints on them. As matching
of packets with rules in PNMT is in object oriented paradigm whenever a new packet
arrives an object of the packet is created. A simple example (given below) of how these
signatures differ from Snort signatures is useful in understanding the concept of context
aware signatures.
TH-1076_NHUBBALLI

28 Chapter 2. Background and literature survey
“Microsoft distributed transaction” service is vulnerable to large packets sent by intruders.
This attack generates a buffer overflow which triggers a denial of service for the Microsoft
distributed transaction service. A Snort rule which is used to detect this attack is shown
below.
alert tcp EXTERNAL NET any − > HOME NET 3372 (msg : DOS MSDTC attempt; f low :
to server, established; dsize :> 1023;
re f erence : bugtraq, 4006; re f erence : cve, 2002 − 0224; re f erence : nessus, 10939; classtype :
attempted − dos; sid : 1408; vrev : 10; )
This Snort rule searches for TCP packets coming from any external network from any port
to any computer inside the network on port 3372. If one packet with these characteristics
is part of an open TCP session and also if the size of this packet is bigger than 1023 bytes,
then Snort sends a DOS MSDTC attempt (a denial of service attempt on the Microsoft
distributed transaction service) message to the network administrator.
PNMT signature for the above Snort signature is shown in Table 2.1. In the PNMT
signature, p1 represents the object of a packet. It may be noted that this rule describes that,
an alarm is raised if the payload of the packet p1 is bigger than 1023 bytes and if there is an
active session between the source IP address and the destination IP address on port 3372
of the packet p1; this part is same an in case of Snort signature. The difference between
the PNMT signature and Snort signature is that, PNMT rule will raise an alarm only if
it is able to confirm that destination host of the attack has a Windows 2000 or Windows
NT OS. This is enforced with an additional check of OS stack (this step is shown in bold
letters in the PNMT signature in Table 2.1).
Some of the advantages of signature enhancement based methods are as follows.
• Analysis of the traffic with signatures as well as network context leads to low FPs.
• As signature is enhanced, comparison technique (signature and traffic) remains
almost similar as in ordinary signature detection systems.
Some of the disadvantages of the technique are given below.
• Signatures are complex and modifying them is tedious and error prone. For example,
if it is discovered latter that “Microsoft distributed transaction” is vulnerable also in
windows millennium, then PNMT rule shown in Table 2.1 needs to be modified. The
TH-1076_NHUBBALLI

2.2. Known attack detection 29
process of updating signatures selectively in a local environment needs knowledge
and experience.
• Signature detection system needs to be shutdown when signatures are updated, so
the technique leads to system downtime.
Table 2.1: PNMT signatureContext: Packetinv: Packet.allInstances()− >forAll(p1—p1.data.size() > 1023 and
p1.tcp.destionationPort = 3372 andSession::sessionOpen(p1.ip.destinationAddress,p1.ip.sourceAddress, p1.tcp.destinationPort,p1.tcp.sourcePort) and(IPStack::hasOS(p1.ip.destinationAddress,Windows, NT) orIPStack::hasOS(p1.ip.destinationAddress,Windows, 2000)
impliesAlarm::logAttack(p1.ip.sourceAddress,p1.ip.destinationAddress,p1.tcp.sourcePort, p1.tcp.destinationPort,p1.time, DOS MSDTC attempt)
II. Alarm mining
Data mining pertains to the act of analyzing data from different perspectives and sum-
marizing into useful information. In the context of false alarm minimization, a database
of signature detection system alarms are mined to identify FPs and TPs. Data mining
techniques can be applied to alarms generated by signature detection systems because
these alarms are rich in information in terms of attributes related with an attack like, IP
addresses, port numbers, protocol etc. The idea here is to use these attributes and mine
all the alarms for summarizing them into either TPs or FPs. These characteristics learnt
during the mining stage may be used to classify future signature detection system alarms.
Kim et al. in [70] generates a decision tree model for alarm classification. This classifier
includes two phase activity. First is a feature constructor which extracts right features
for classification; a preprocessor determines highly correlated attributes and groups the
alarms based on that. Next step is of association rule mining which extracts interesting
relationship between the attributes. The system is trained with the rules generated from
TH-1076_NHUBBALLI

30 Chapter 2. Background and literature survey
the association rule mining stage and tested. As this method works on a feature ranking
scheme, some features which are near the root node find importance over others. For
example, if IP address is the first attribute after the root node and next is port number in
the decision tree, priority to IP address is higher than the port number. Quality of results
obtained using this scheme is highly dependent on the feature rank used.
Pietraszek et al. [105] proposed a model whose task is to build an alarm classifier to
classify alarms (as TP of FP) in run time. Proposed model uses a hybrid of two approaches–
one part comprises data mining of historical alerts and passing the knowledge learnt to a
human expert and the other part tunes the signature engine to reflect the learnt behavior.
The scheme uses various network entities for building the classifier and these network
entities are represented as a topology tree much similar to the decision tree. Alerts are
clustered based on the similarity of their attributes such as IP address, port numbers etc.
after traversing the topology tree. The problem with this technique is involvement of
human in the loop to tune the signature detection system which limits its practical utility.
Julisch et al. in a series of articles [66, 67, 68, 69] proposed the idea of learning patterns of
FPs and then classifying new alarms as false or true. Two different data mining algorithms
namely, episode mining and clustering algorithms are used in the experiments.
Some of the advantages of mining alarms for filtering FPs are as follows.
• Training and building a classifier is relatively easy when labeling of alerts can be
done.
• Technique is more or less automated without involving human in the loop.
Some issues with the scheme are given below.
• Labeling of alarms may not always be possible, considering the sheer number of
alarms.
• Since the underlying network context is dynamic, it may not always be possible to use
mining techniques. For example, even small changes in the network configuration
like patching an application, OS upgrading etc. have an impact on the threat level
of a particular attack to the target network.
• Since signature detection system can trigger thousands of alarms per day scalability
is an issue.
TH-1076_NHUBBALLI

2.2. Known attack detection 31
• Alarms can have mixture of numerical, categorical, time and free text attributes.
Alarm mining algorithm should work well with the mixture of attributes.
• Alarm mining techniques work offline.
III. Alarm correlation
Techniques based on correlation of alarms of more than one type of detection system
decrease the number of FPs. If more than one type of detection system, raise alarms at a
given instance, then the probability of the alert being TP is high.
Chyssler et al. in [46] proposed a framework for correlating Syslog messages and
alarms generated by HIDS with NIDS alarms. Correlation begins by removing Syslog
messages and HIDS alarms through a first stage of filtering which are known to be non-
effective. It is claimed that filtering is a necessary step because HIDS and Syslog contain
a lot of non-interesting alarms/information which need to be removed [46]. Two types
of filtering schemes are used, one is static and the other is dynamic. Static filtering
removes those alarms which are not suspects. Dynamic filtering is based on a “Naive
Bayesian Learning” algorithm which classifies alarm messages based on word statistics
in the alarm. Alarms and messages which pass through two filtering stages are used for
correlation with NIDS alarms. For every NIDS alarm, host level information generated by
HIDS alarms and Syslog messages within a time window are correlated. If a correlation
is found an additional check is made on how frequently that type of NIDS alarm is raised.
It is interpreted that, frequently occurring alarm is due to either a misconfiguration in the
software or a denial of service attack attempt or a bug in the software. Based on all the
above stages of analysis an alarm is passed to the administrator. In the implementation,
NIDS used is Snort and HIDS is Samhain.
An engine to correlate alarms generated by signature detection system and anomaly
detection system is proposed by Bolzoni et al. in [39]. Anomaly detection component
is a payload based anomaly detection system called POSEIDON. It models the payload
information of network packets by n-grams. POSEDION is deployed in the reverse
channel to monitor the outgoing traffic, so it is called Output Anomaly Detector (OAD).
OAD monitors the reverse channel for abnormal behavior and signature detection system
monitors the forward channel. Whenever signature detection system detects an attack,
it is forwarded to a central entity along with communication end points involved. This
TH-1076_NHUBBALLI

32 Chapter 2. Background and literature survey
information is stored in a hash table. Central entity marks this alert as an incident and
waits for some evidence from the OAD on the reverse channel. If OAD also reports any
deviation within a preset time frame for communication end points under consideration,
two events are said to be correlated and passed as TP to the administrator. If there is
no evidence on the reverse channel, alert is dropped as FP. This scheme is based on the
assumption that there should be an anomalous behavior seen in the reverse channel in
vicinity of alarm generation time by signature detection system. Thus, if these two are
correlated a good guess about the attack corresponding to the alarm can be made.
Correlating signature detection system alarms with vulnerability information obtained
by scanning the network being monitored (using vulnerability scanners) can be done to
detect alarms which are for attacks that can exploit some vulnerability. As signature
detection system alarms sometimes generate vulnerability reference numbers, correlation
of alarms with vulnerabilities is possible using these numbers. A feasibility study of
the idea is made in [91]. This survey studied, open source signature detection system
Snort and possible integration with Nessus and Bugtraq databases, in terms of reference
numbers. This idea is implemented by Neelakantan et al. in [96] and illustrated increase
in Accuracy by eliminating the non-correlated alarms.
Some of the advantages of correlation based techniques are the following.
• As the correlation activity is done on alarms, it is decoupled from the detection
engine. So any modification in the network context does not result into detection
system downtime.
• The technique is simpler compared to signature enhancement or data mining based
schemes. There is no requirement to alter signatures or label a huge number of
alarms for training etc.
The basic problem in correlation based schemes arises because events (i.e., signature
detection system alarms) of different domains need to be matched, which is not trivial.
Some of the disadvantages of the correlation based techniques mentioned above are as
follows.
• Syslog information and NIDS alarms with HIDS alarms: Correlating alarms from
NIDS and HIDS is often difficult because response time of NIDS and HIDS are
different.
TH-1076_NHUBBALLI

2.2. Known attack detection 33
• OAD information with signature detection system alarms: The time window used
to look for the correlation is very critical for correctness of the scheme; a very small
time window may lead to missing of attacks while a large time window may result
in increase of FPs. Further, in some scenarios no anomalous behavior is seen in the
reverse channel, for example, no response from the victim.
• Signature detection system alarms with vulnerabilities in terms of reference num-
bers: Limited Accuracy improvement is possible because all signatures (and corre-
sponding alarms) and vulnerabilities do not have reference numbers.
From the discussion in this subsection it is evident that correlation based techniques are
better compared to other approaches because, correlation approach is near real time, do
not require detection system shutdown or signature modification with change in network
context, do not require human factor in the loop etc. The technique based on vulnerability
reference numbers have advantages over the other two schemes [39, 46] because it does
not involve correlation of information from diverse domains. In other words, the reference
number based scheme provides a standardized relationship for correlation [91]. However,
the issue of incomplete reference numbers has to be addressed. Present thesis has a
contribution to address this issue.
2.2.1.5 Compromise in Detection Rate due to increase Accuracy
All the three basic techniques discussed earlier eliminate FPs thereby leading to effective
alarm generation. However, schemes that minimize FPs (i.e., improve Accuracy) also com-
promise Detection Rate because sometimes attacks which can exploit some vulnerability
(TP) are dropped. The reasons for compromise in Detection Rate are due to factors like hu-
man errors in modifying signature to accommodate context information, misclassification
in data mining techniques, error in correlating information from different domains etc.
Hence, there is a tradeoff regarding Accuracy and Detection Rate. Drop in Detection Rate
can be tolerated for non-critical applications. However, lowering Detection Rate for critical
applications may lead to serious security threats as some attacks may pass undetected.
So works reported in [27, 106] proposed to provide a prioritized list of alarms to the
system administrator rather than filtering out some which seems to be FPs. Following
that, administrator’s job is to look into the details of top few alarms of the prioritized
TH-1076_NHUBBALLI
34 Chapter 2. Background and literature survey
lists; alarms looked into can be considered as TPs and the others below in the list are FPs.
Alarm prioritization techniques reported in [27, 106] are discussed below in brief.
Porras et. al. in [106] proposed an alert ranking technique known as the M-Correlator.
This scheme considers three types of information namely, (i) alerts from different security
systems like signature detection systems, firewalls etc. (ii) network configuration (in terms
of vulnerabilities vis-a-vis IP addresses, port numbers, applications/OS in execution etc.)
and (iii) user defined parameters like criticality of applications, amount of interest in a type
of attack etc. All these information are correlated to generate the rank of a particular alert.
Different lists of alarms prioritized by various parameters are generated. Also, related
alerts can be grouped together using a clustering algorithm to generate a consolidated list
of alert messages.
Alsubhi et al. in [27] extended the technique presented in [106] by considering more
security components namely, anomaly detection systems alarms, multiple IDSs located
at different locations in a network etc. Information drawn from all these sources are
correlated and list is generated with prioritized alarms.
Other notable works in this direction are [111, 131, 145].
So from the above discussion it may be noted that effectiveness of prioritization tech-
niques depend on skill of the administrator and also on the accuracy of correlation tech-
niques. As discussed before, correlation involving information from several domains is
non-trivial. So in alert prioritization techniques also, alarms for attacks capable of ex-
ploiting vulnerabilities may be missed. This case may arise if administrator considers a
high threshold for looking into the alarms in the prioritized list. Another cause may be
due to inaccuracy of correlation schemes, which may result in assigning non-appropriate
priority scores to alarms. This changes ordering of alarms in the list which lead to drop
in Detection Rate. For example, if administrators decides a threshold which takes top 100
alarms in the list then all alarms ranked below 100 are not considered. Any such alarm
which is not considered but ideally should have been within the top 100 positions leads to
drop in Detection Rate. None of the papers [27, 106] have discussed quantitative results for
Accuracy and Detection Rate with varying experimental scenarios in terms of prioritized
lists and behaviors of administrators.
From the above discussion it may be stated that any scheme to minimize FPs in
signature detection system must also ensure that, no genuine attack is missed for a critical
TH-1076_NHUBBALLI

2.2. Known attack detection 35
application. Further, task of administrator is to be made easy. In this thesis the proposed
FP minimization filter is suitably enhanced to cater to this issue.
2.2.2 Event detection system
There is a class of known attacks for which signatures cannot be generated because
these attacks do not change the syntax and sequence of network traffic under normal
and compromised situations e.g., Address Resolution Protocol (ARP) spoofing attack in
a Local Area Network (LAN) [75], Internet Control Message Protocol (ICMP) attacks
using error and informational messages [19]. Such attacks change the intended behavior
of the network communication. For such attacks it is not possible to write a signature
although what happens in the attack is exactly known. Detecting such attacks requires
keeping track of sequence of network packets also called events. The IDS, called event
detection system is basically an event or state estimator which observes sequences of
events generated by the network to decide whether the states through which the system
traverses correspond to the normal or compromised condition. However, in a default
case there may not be a difference in sequence of events under attack situation compared
to normal condition. Active techniques e.g., sending probe packets are required to create
difference in sequencing of packets under attack and normal condition.
2.2.2.1 Address resolution protocol attacks
In this subsection, first a brief introduction of ARP is discussed followed by a description
of ARP spoofing related attacks and their detection techniques. Finally, the need for event
detection system for effective alarm generation for such attacks is also given.
I. Address resolution protocol
Computers in the Internet are identified by their IP addresses. IP addresses are used by
the network layer for identifying a host uniquely. At the data link layer, computers use
another address known as MAC address or hardware address. It is to be noted that, IP
addresses can be dynamic and change over the time but the MAC address of a computer
is constant unless the Network Interface Card (NIC) is replaced. To deliver a packet to
correct host, IP address has to be mapped to some MAC address. This dynamic binding
TH-1076_NHUBBALLI

36 Chapter 2. Background and literature survey
(since IP address is dynamic) between the MAC address and IP address is done by ARP.
ARP is responsible for finding the MAC address for a given IP address. Data link layer
uses the MAC address of the destination host for sending packets. If host sending packets
does not know the MAC address of the destination host, it sends a broadcast request to
know “what is the MAC address corresponding to the IP address”. The host which has
the IP address in the broadcast message sends a unicast response message to the sender,
mentioning its MAC address. In order to reduce the number of broadcast requests each
host maintains a table termed as ARP cache, which holds mapping between MAC and IP
addresses. Entries in the ARP cache can be either static or dynamic. In dynamic cache,
entries are erased as they get older than a predefined duration.
II. ARP spoofing attacks
The problem with ARP is that, it is a stateless protocol. Any host after receiving an ARP
response message will update its cache without verifying whether it has earlier sent a
request corresponding to the response. This enables malicious hosts to craft custom ARP
packets and forge IP-MAC pairs. By maliciously modifying association between an IP
address and its corresponding MAC address, attacker can receive data intended to some
other host or cause data to be lost. This is the idea behind ARP spoofing. For example,
consider three hosts A,B and D, where A and B are genuine hosts and D is the attacker.
D can send an ARP response packet to A having IP address of B paired with MAC of D.
Now, ARP being stateless, A will update its cache with wrong the IP-MAC pair. Following
that all traffic A wants to send B will go to D. Also, in another similar case, D can send an
ARP response packet to A having IP address of B paired with MAC of some non-existing
host. This will result in all packets being sent from A to B be lost. ARP spoofing is
the basic attack which acts as a gateway for many network attacks like denial of service,
man-in-the-middle etc.
From the above discission, it may be noted that in ARP spoofing attack, a false MAC
address is associated with an IP address by attacker and sent to a host. As ARP is stateless,
ARP cache of the host (to which the false IP-MAC pair is sent) updates itself with the false
IP-MAC pair. So altering IP-MAC pairing does not change the syntax of ARP message
and therefore no signature can be written. Moreover, no profile (anomaly model) can be
built which can model normal ARP because spoofing does not violate any parameters like,
TH-1076_NHUBBALLI

2.2. Known attack detection 37
amount of ARP requests, amount of ARP responses etc. However, ARP spoofing changes
intended behavior of network communication. So conventional methods of attack de-
tection (signature detection system or anomaly detection system) fail for such attacks.
There are custom solutions proposed in the literature to detect, mitigate and prevent ARP
attacks; they are discussed next.
III. ARP attack detection techniques
ARP attack detection techniques can be broadly classified as follows.
A. Static ARP entries[74]
The most foolproof way to prevent ARP attacks is to manually assign static IP addresses
to all hosts and maintain static IP-MAC pairings at all hosts. Static MAC entries in ARP
cache are immutable. When an entry in the ARP cache is marked as static, OS kernel
ignores all ARP replies and use the specified MAC address instead. System administrator
keeps track of authentic IP-MAC bindings and include them as static ARP cache entries.
Also system administrator must deploy new entries to every host on the network when
a new host is connected. This is not a practical solution since handling static entries for
each and every host in the network is not feasible for large networks.
B. Enabling security features offered by switch
To combat ARP attacks, enabling port security on the switch can be done [6]. This is a
feature available in high end switches which tie a physical port to a MAC address. These
port address associations are stored in Content Addressable Memory (CAM) tables. A
change in transmitter’s MAC address can result in port shutdown or ignoring the change.
Problem with this approach is, if the first sent packet itself is having a spoofed MAC
address then the whole system fails. Further, any genuine change in IP-MAC pair will be
discarded (e.g., when notified by gratuitous request).
C. Stateful ARP
ARP cache can be converted from its stateless to stateful nature [129, 153, 126]. Here, the
host has a state ARP cache which holds states of previous requests and use it to verify new
replies. It is an extension to the existing ARP protocol. A major problem in this approach
TH-1076_NHUBBALLI

38 Chapter 2. Background and literature survey
is that, gratuitous response, is not supported. Gratuitous ARP responses are sent when
a system boots up to notify other hosts in a LAN about its IP-MAC address. Gratuitous
ARP minimizes ARP traffic, because hosts in a LAN can know IP-MAC pairings of other
hosts without ARP request-response sequence. Moreover modification of stateless cache
to stateful cache requires extension of the protocol specification which is not desirable
In [126] Trabelsi et al. proposed a stateful version of ARP to detect ARP attacks and
identify the attacker. In the scheme, when an ARP request is sent, a record is maintained
and only those responses are processed which can be correlated with the request. If more
than one reply arrives (with different MAC addresses), the concept of trust and impor-
tance is applied. Many times, all these replies correlate with the request, because they
arrive with the IP address, which is same as the source IP address of the ARP request sent.
Among all these replies, a fuzzy logic based decision is applied to identify the correct
IP-MAC pair, which is then updated in the cache.
D. Software based solutions
The basic notion of port security involving observation of changes in IP-MAC pairs in
switches has also been utilized in software solutions namely, ARPWATCH [3], COLASOFT-
CAPSA [8]. These software solutions are cheaper than switches with port security but
have slower response time compared to switches. Obviously, these tools suffer from the
drawbacks as that of port security in switches.
E. Modifying ARP using cryptographic techniques
Several cryptography based techniques have been proposed to prevent ARP attacks
namely S-ARP[57], TARP [85]. Addition of cryptographic features in ARP lead to perfor-
mance penalty [26] and change the basic ARP.
F. Active techniques for detecting ARP attacks:
Active detection technique for ARP attacks, sends probe packets to hosts in the LAN in
addition to observations in changes of IP-MAC pairs.
In [112], a database of known IP-MAC pairs is maintained and on detection of a change,
new pair is actively verified by sending a probe with TCP SYN packet to the IP address
under question. The genuine host will respond with a SYN/ACK or RST depending on
TH-1076_NHUBBALLI

2.2. Known attack detection 39
whether the corresponding port is open or closed. While this scheme can validate the
genuineness of IP-MAC pairs, it violates the network layering architecture. Moreover it
is able to detect only ARP spoofing attacks.
An active scheme for detecting Man-in-The-Middle (MiTM) attack is proposed in [127].
The scheme assumes that an attacker involved in MiTM must have IP forwarding enabled.
First, all hosts with IP forwarding are detected (actively). Then IDS attacks all such hosts
one at a time and poison their caches. Poisoning is done in a way such that all traffic
being forwarded by the attacker reaches detection system (instead of computer, attacker
with IP forwarding wants to send). In this way the detection system can differentiate real
MiTM attackers from all hosts with IP forwarding. There are several drawbacks in this
approach, namely huge traffic in case of a large network with all hosts having IP forward-
ing, assumption of successful cache poisoning of the host involved in MiTM attack exactly
when the attack is going on etc.
In [95], Nam et al. proposed a modified version of ARP called as MR-ARP. The idea here
is to verify the IP-MAC pairs and store them in a table called as long term table. This is
an additional table with the existing ARP cache, which has a long refreshing time period
unlike the cache. Whenever an ARP message comes it searched in the long term table.
If an entry is found in the table whose IP-MAC pair is same as that of the ARP message
being verified, no verification is done; the message is genuine and is updated in the ARP
cache. If there is an IP address in the long term table whose MAC address is different
from the one received in the ARP packet in question, spoofing is declared. Otherwise, 50
repeated ARP verification messages (i.e., ARP requests, querying the MAC address for the
IP address in question) are broadcasted. If one ARP reply is returned, then the mapping
is registered in the long term table and updated in the cache. If no ARP reply arrives,
then the IP-MAC being verified is considered spoofed. If multiple replies arrive with
different MAC addresses, a voting-based resolution mechanism is used to differentiate
the spoofed replies with the genuine one. The authors state that as ARP cache poisoning
can be avoided, other derived attacks like MiTM can be avoided. Although the scheme
can successfully prevent ARP spoofing and derived attacks, it involves huge commutation
overhead because of 50 ARP requests and their responses for each new IP address to be
verified. Further, they have not handled the case of gratuitous ARP responses in their
scheme.
TH-1076_NHUBBALLI

40 Chapter 2. Background and literature survey
From the review, it may be stated that an ARP attack preventation/detection scheme
needs to have the following features.
• Should not modify the standard ARP.
• Should generate minimal extra traffic in the network
• Should not require patching, installation of extra softwares in all hosts.
• Should detect a large set of ARP based attacks.
• Hardware cost of the scheme should not be high.
As already discussed, for attacks like ARP spoofing, ICMP error and informational
message based attacks etc., it is not possible to write a signature although what happens
in the attack is exactly known. Such attacks can be detected by keeping track of sequence
of network packets or events. By using active technique [112, 127] the sequence of events
under attack can be made different from that under normal condition. A well known and
generic systems theory called Failure Detection and Diagnosis (FDD) of Discrete Event
Systems (DES) [42] exists where, faults can be detected if normal and failed system models
(in terms of events) can be given. The theory builds a “state estimator” called diagnoser
using normal and failed (under attack) system models. The diagnoser observes sequences
of events generated by the system (i.e., network) to decide whether states through which
the system traverses correspond to normal or failed (i.e., attack) condition1. The idea of
state estimation is used in case of HIDS in [119, 130, 137]. To the best of our knowledge,
event detection technique has not been used for known attacks in NIDS, in spite of the
fact that signature or profile cannot be built for such attacks. A contribution to address
this issue has been reported in this thesis.
Signature and event detection systems are used to detect known attacks. However, for
unknown attacks neither signatures are available nor their behavior is known. In order
to detect such attacks anomaly detection systems are used. Next section discusses works
reported in the literature on anomaly detection systems and outstanding research issues.
1A brief discussion for failure detection and diagnosis of DES is given in Appendix A
TH-1076_NHUBBALLI

2.3. Unknown and known attack detection 41
Y
X
N1
N2
o1
o2
o3
Feature 1Fe
atur
e 2
Figure 2.4: An example of anomaly in two dimensional data
2.3 Unknown and known attack detection
Anomaly detection refers to the problem of identifying patterns in data that do not conform
to expected or normal behavior. These non-conforming patterns are often referred to as
anomalies, outliers and exceptions. A generic view of how an anomaly looks like is shown
in Figure 2.4. Data has two normal regions, N1 and N2. Since most observations lie in
these two regions they are considered as normal. Region O3 which comprises less number
of observations is considered as anomaly. Also, points that are sufficiently far away from
the normal regions, e.g., O1 and O2 are regarded as anomalies.
Techniques that use anomaly detection for identifying attacks are termed as anomaly
detection systems. These schemes have two phases–(i) training and (ii) testing. In the
training phase normal and anomaly regions (also called profiles) are generated from
labeled network data. Usually the regions are represented in terms of parameters (also
called as features) which are extracted from network packets. For example, number of
TCP SYN packets observed within a time window is a feature. During testing, network
packets are classified as normal or anomalous (attack) based on the profile they fall into.
There are several factors that make this anomaly detection system design challenging.
Some of the factors are listed below.
• Availability of labeled data for training/validation of models used by anomaly detec-
tion systems is usually a major issue. Labeling is often done manually by a human
expert and hence requires substantial effort and is prone to errors.
• Often data contains noise which tends to be similar to the actual anomalies. So it is
TH-1076_NHUBBALLI

42 Chapter 2. Background and literature survey
difficult to distinguish and remove noise.
• Normal and anomalous behavior keeps evolving and a current notion might not be
sufficiently representative in the future.
• Boundary between normal and anomalous behavior is often not precise. So an
anomalous observation which lies close to the boundary can actually be normal,
and vice-versa. Hence anomaly detection systems have high false alarm rates [78].
• When anomalies are the result of malicious actions, adversaries often adapt them-
selves to make the anomalous observations appear like normal, thereby making the
task of defining normal/malicious behavior more difficult.
There are number of techniques reported in the literature to build profiles from network
packets, resulting in variety of anomaly detection systems. They are elaborated as follows.
I. Statistical anomaly detection system
In statistical approach, intensity of certain network events or statistics are used as a mea-
sure for deviation from normal profile in order to detect attacks. At any point in time
there are two (statistical) profiles, one is the stored normal profile and the other is current
profile generated by monitoring network activities online. Current profile is compared
with the stored profile for detecting deviations in the system behavior. For example, if
logging into a server up to 10 times a day is considered as normal behavior, the system
triggers an alarm when an attempt is made to login for the 11th time. Statistical models
are among the earliest anomaly detection systems. Some of the examples of this category
are IDES [86], NIDES [63] and MIDAS [117].
It is well known that network statistics vary over time. So, bare statistical measures
may lead to false alarm generation in anomaly detection systems. In addition, often se-
lection of boundaries between normal and abnormal is done manually, which may lead
to errors. In order to automate this, machine learning techniques are applied. Machine
learning techniques learn the behavioral patterns of a system and optimize detection task
by automatically setting up boundaries for classification (normal or attack). There are two
broad classes of machine learning techniques that are used in anomaly detection systems
–(i) first class is known as supervised learning and works on labeled dataset, (ii) the sec-
ond class is known as unsupervised learning and works on unlabeled dataset.
TH-1076_NHUBBALLI

2.3. Unknown and known attack detection 43
II. Supervised learning based anomaly detection system
Supervised techniques also called classification techniques assume the availability of a
training dataset which has labeled instances for normal as well as anomaly (or attack)
class. Typical approach in such cases is to build a predictive model for normal verses
anomaly classes. Any unseen data instance is compared against the model to determine
which class it belongs to. Some of the major supervised methods for anomaly detection are
decision trees [81, 122], support vector machines [142, 143], K-nearest neighbor classifier
[82], fuzzy logic techniques [60], neural networks [38] etc.
III. Unsupervised learning based anomaly detection system
Unsupervised anomaly detection systems, also known as clustering techniques assume
that training data has mixture of unlabeled instances. These techniques group similar
instances into clusters and label them. Labeling is often done based on the density of
the clusters [53, 79, 100]. More dense clusters are labeled as normal and otherwise for
less dense clusters. This labeling is valid only if the assumption of skewed distribution of
normal and abnormal instances holds i.e., normal instances are more in number compared
to abnormal instances. Since these models do not require labels (normal and anomaly) for
data, they are more widely applicable than supervised techniques. Some of the anomaly
detection systems which use unsupervised techniques are [43, 52, 60, 64, 97, 98, 125]. One
of the drawback of these methods is that density based labeling is error prone [44] and
hence generate false alarms.
IV. Hybrid techniques:
Sometimes more than one machine learning techniques are used in anomaly detection
systems for effective alarm generation. These methods combine various classification and
clustering techniques together. Some of the anomaly detection systems which use hybrid
techniques are [40, 77, 140].
As discussed, anomaly detection systems require feature extraction from network
packets. There are two options for extracting features from the packets– (i) only from
header of each packet and (ii) only from payload of each packet. First category of anomaly
detection techniques are called header based anomaly detection systems and later ones
TH-1076_NHUBBALLI

44 Chapter 2. Background and literature survey
Table 2.2: Anomaly detection systems and their types
IDS TypeMINDS [52] HeaderPHAD [88] HeaderALAD [89] PayloadPAYL [135] Payload
Anagram [134] PayloadMcPAD [103] Payload
ADWICE [41] HeaderLEARD [89] Header + Payload
are called payload based anomaly detection systems. Both the techniques are useful in
detecting different classes of attacks. While header based techniques can perform quick
analysis of test data, they can detect simple attacks. On the other hand payload based
techniques perform a detailed analysis of test data and can detect sophisticated application
level attacks. Henceforth, attacks detected by header (payload) based anomaly detection
systems will be termed header (payload) based attacks. For effective alarm generation
some anomaly detection systems use features from both header and payload parts of
network packets.
Header based attacks normally result into some kind of skewed network statistics or
change the standard protocol behavior. Since packet header fields are limited and are
of standard format, it is relatively easy to model and detect header based attacks. For
example, in case of denial of service, network traffic pattern changes (e.g., huge bandwidth
consumption, more number of short lived connections etc.) which can be detected by the
statistics of header fields. This technique will not suffice for detecting application level
attacks because in such cases attack content is inside the payload and protocol behavior is
not violated. Anomaly detection systems which model the payload can detect application
level attacks. Some of the important anomaly detection systems found in the literature
are shown in Table 2.2. These two types of anomaly detection systems are elaborated
subsequently.
TH-1076_NHUBBALLI

2.3. Unknown and known attack detection 45
2.3.1 Header based anomaly detection system
Header based anomaly detection systems use the contents of network packet header for
feature extraction and modeling. These features can be either contents of header fields
itself or can be derived. For example, if source and destination IP addresses are used as
features they are directly taken features. If the number of packets arrived with TCP SYN
flag set are used as a feature then it is an example of a derived feature. As discussed in the
last section, among many techniques for header based anomaly detection, clustering based
algorithms are more widely used since they can work with unlabeled dataset. Some of
the prominent header based anomaly detection systems which uses clustering algorithms
are the following.
Clustering for Anomaly Detection (CLAD) [43], as the name suggests, is one of clus-
tering based anomaly detection systems. In CLAD, clusters are of fixed width (radius)
and can overlap. In the training phase, clusters of fixed width W are generated from the
training feature vectors. If a feature vector is further away than width W from all existing
clusters, the feature vector becomes the centroid of a new cluster; otherwise it is assigned
to all existing clusters that are not further away than W. In the testing phase, distance of
feature vectors to the clusters formed are measured. If the distance for a feature vector
under test is more than W to all of the clusters it is declared as anomalous.
Connectivity-based Outlier Factor (COF) [125] uses nearest neighborhood clustering
technique for anomaly detection. It detects anomalies by assigning an anomaly score to
every feature vector in an incremental mode. To begin with, the closest feature vector to
the feature vector under consideration is added to its neighborhood set. The next feature
vector added to this neighborhood set is such that its distance to the existing neighborhood
set is minimum among all the remaining feature vectors. The neighborhood is grown in
this manner until it reaches size k. After this an anomaly score is assigned to the feature
vector based on its distance to its neighborhood set. If the anomaly score is higher than
a threshold, it implies that the feature vector under question is different from the other
members (and is anomalous).
In [64] Jiang et al. have proposed a two-phase clustering for anomaly detection. In the
first phase, the standard k-means algorithm [87] is modified, where more than k clusters
may be formed if a distance of a feature vector is more than a threshold from centers
of all clusters. In other words, if feature vectors contained in the same cluster are not
TH-1076_NHUBBALLI

46 Chapter 2. Background and literature survey
close enough, the cluster may be split into two smaller clusters. It results in clusters
with smaller diameters and the feature vectors in the same cluster may be most likely all
outliers or all non-outliers. An outlier-finding process (OFP) is then used in the second
phase to find the outliers in clusters obtained in the first phase. In OFP, clusters centers
are regarded as nodes which are used to construct a Minimum Spanning Tree (MST)
based upon the distance between every two nodes [148]. The MST is treated as a member
of a forest. Following that, longest edge of a tree from the forest is replaced with two
newly generated subtrees. This process is repeated until the number of trees in the forest
reaches a desired number. The trees with less number of nodes (i.e., the small clusters)
are regarded as anomalies.
Minnesota INtrusion Detection System (MINDS) [52] is a data mining based anomaly
detection system. Input to MINDS is Netflow version 5 data collected using flow-tools
[11]. Flow-tools only capture packet header information (i.e., it does not capture message
content) and builds one way sessions (flows). From this collected data a set of basic and
derived features are extracted for data mining purpose. After this step an outlier detection
algorithm is used for detecting outlying network flows.
I. Pros and cons of header based anomaly detection system
As network packet headers have definite structure (i.e., number of fields, their length, type
etc.) it is relatively easy to build a model for normative system behavior. Further, fairly
high Detection Rate and Accuracy have been achieved by header based anomaly detection
system for attacks detectable by header statistics [76, 80, 104]. However, still research in
ongoing to improve Detection Rate and Accuracy.
Many of the algorithms proposed for header based anomaly detection systems fall
into cluster analysis category as they can work with unlabeled data. As networks become
faster in operation, the amount of data that needs to be analyzed becomes huge. Since
many clustering techniques require more than one pass of the dataset, such schemes
cannot provide quick analysis for data generated by high speed networks. To cater to
this situation, ADWICE [41] used a well known data summarization technique BIRCH
[152] to build an anomaly detection system. Summarization techniques derive a summary
information from the dataset and processing is done on this summary rather than whole
dataset. The work presented in [41] illustrated results on large dataset, however, FPs are
TH-1076_NHUBBALLI

2.3. Unknown and known attack detection 47
higher compared to other schemes without summarization. A contribution to alleviate
this problem has been reported in this thesis.
Header based anomaly detection systems are generally used to detect simple attacks
but the target is to offer quick decisions on the analyzed traffic. For detecting sophisticated
attacks payload anomaly detection systems are used but they take more time for traffic
analysis.
2.3.2 Payload based anomaly detection system
Application based attacks require modeling of packet payload because attack content
is in the payload and does not violate any protocol behavior. Payload based anomaly
detection systems are used to detect application level attacks. Such detection systems
extract features from payload which are usually modeled in the form of n-grams. n-grams
capture the ordering of bytes within the payload. For example, the Code Red worm (which
is a payload based attack) observed on the Internet on July 13, 2001 attacked computers
running Microsoft’s IIS web server by exploiting a vulnerability in the indexing software
in the web server. The worm has the following payload
GET /default.ida?NNNNNNNNNNNNNNNNNNNNNNNNN
NNNNNNNNNNNNNNNNNNNNNNNNNNNNNNNNNNNN
NNNNNNNNNNNNNNNNNNNNNNNNNNNNNNNNNNNN
NNNNNNNNNNNNNNNNNNNNNNNNNNNNNNNNNNNN
NNNNNNNNNNNNNNNNNNNNNNNNNNNNNNNNNNNN
NNNNNNNNNNNNNNNNNNNNNNNNNNNNNNNNNNNN
NNNNNNNNNNNNNNNNNNN
%u9090%u6858%ucbd3%u7801%u9090%u6858%ucbd3%u7801
%u9090%u6858%ucbd3%u7801%u9090%u9090%u8190%u00c3
%u0003%u8b00%u531b%u53ff%u0078%u0000%u00=a HTTP/1.0
The worm spreads itself using a common type of vulnerability known as buffer overflow.
Buffer overflow occurs when a long string of the repeated character (“N” in this example)
is used to overflow a buffer, allowing the worm to execute arbitrary code and open access
to the host. It is to be noticed that, there are many consecutive N’s appearing in the GET
request of Hyper Text Transfer Protocol (HTTP) (payload). This is an unusual behavior
TH-1076_NHUBBALLI

48 Chapter 2. Background and literature survey
with the GET request. A payload based anomaly detection system using n-gram analysis
can detect this worm by observing repeated unusual n-grams. In this example, there are
multiple 1-grams of N, 2-grams of NN, 3-grams of NNN etc.
In the next few paragraphs some of the prominent payload based anomaly detection
techniques found in the literature are discussed.
One of the first efforts towards use of payload information for building an anomaly
detection system is reported in PAYL [135]. It extracts 256 features from the payload of
every packet to generate the feature vector. Each feature is one of the 256 possible ASCII
values of a byte. Then a simple model of normal system behavior is derived with average
and standard deviation of these vectors. A (test) feature vector is declared as anomalous if
the simplified Mahalnobis distance [135] of the vector with mean exceeds a predetermined
threshold. Although a more generic n-gram based feature vector with 256n possible values
is given in both PAYL [135] and improved PAYL [133], exponential growth of the feature
vector size limits the utility of these methods. In addition, it uses different models for
different payload lengths even for the same application. PAYL has a Detection Rate of 50%
on DARPA dataset which is comparatively low.
Application level network anomaly detection [89] is another payload based anomaly
detection system. In this anomaly detection system, first word of each line (in the payload)
is treated as a keyword. These keywords are paired with header fields (port number,
IP address etc.) of the corresponding packet. A statistical profile is generated using
“keyword-header field” pairs. The training pairs are generated from normal traffic and
the model detects any new combinations of keywords and header fields as attack. In [151]
it was shown that on DARPA 99 dataset, the anomaly detection system [89] detects only
17 of the total 34 payload based attacks bringing its Detection Rate to 50%.
Zanero et. al in [149] proposed a two tier architecture for anomaly detection system.
In the first step, entire payload is reduced to a sizeable quantity with sampling technique.
In the next step clustering algorithms are applied on feature vectors (based on n-grams)
generated from the sampled payload. Different clustering techniques such as k-means
algorithm, principle direction and partition, self organizing map have been tried out
and results are reported. As in the case of [135], [149] also suffers from the curse of
dimensionality problem.
To minimize the dimensionality problem, Ke Wang et al., in Anagram [134] introduced
TH-1076_NHUBBALLI

2.3. Unknown and known attack detection 49
the concept of binarizing the n-grams. The idea is to store binary decision regarding
occurrence of n-grams in the training dataset and build normal model. During testing,
n-grams from the test packet which appear in training dataset are counted. If the number
of n-grams that cannot be found in the training dataset exceeds a preset threshold, attack
is detected. The idea is motivated by the fact that every attack packet should contain some
byte combinations which are not similar to normal packet byte combinations. Furnished
results illustrate that the method works well on HTTP traffic. Further, Anagram uses a
highly space efficient bloom filters for storing n-grams. Bloom filter is a compressed data
structure that uses hashing to map higher order n-gram to a smaller hash value. So, mul-
tiple n-grams map to single hash value which may lead to collision. Excessive training
increases possibility of collisions which leads to drop in Detection Rate. Further, as bina-
rized n-grams are used for modeling, frequency information is not captured, rendering
the model non tolerant to impure training dataset.
McPAD [103] proposed by Perdisci et al. uses multiple one class support vector ma-
chines to classify payloads as normal or attack. McPAD proposed a new technique called
2-v grams, which pairs two bytes that are v bytes apart in the payload in a packet. All
these pairs generate feature vector of the payload. As the number of 2-grams is 2562 for a
packet, a reduction in the number of features is made using an iterative clustering algo-
rithm. With the reduced feature vectors, k number of one-class Support Vector Machines
(SVMs) are trained. During the testing phase, the final decision (attack or normal) is made
by a probabilistic algorithm which considers the outputs of all the SVMs. Although the
technique gives a very high Accuracy, the model is complex in terms of number of support
vectors that need to be trained. This method too is not tolerant to impure training dataset.
I. Pros and cons of payload based anomaly detection systems
Payload based anomaly detection systems are relatively new compared to header based
anomaly detection systems. As modern attacks have become sophisticated and applica-
tion specific, so simple header based schemes cannot be applied for detecting such attacks.
Modeling and analysis of payload is required in order to detect attacks of this nature.
Payload based anomaly detection systems have not yet matured compared to header
based counter parts, in terms of capability of attack detection. Many of the techniques
discussed in the present subsection have poor Detection Rate. Moreover these techniques
TH-1076_NHUBBALLI

50 Chapter 2. Background and literature survey
assume a clean dataset for training but availability of such a dataset is difficult. Park et al.
in [99] have developed an HIDS which is tolerant to impure training dataset. However, to
the best of our knowledge, there is no payload based network anomaly detection system
which can handle impure training dataset. So effective alarm generation in payload based
network anomaly detection systems with impure training dataset is an important research
problem; the present thesis has a contribution in this direction.
2.4 Conclusions
This chapter presented a basic background of IDSs and issues related to effective alarm
generation were highlighted. Major approaches reported in literature towards effective
alarm generation by improving Accuracy and Detection Rate were presented. Finally, re-
search direction taken in the thesis was pointed out vis-a-vis the drawbacks in exiting
effective alarm generation techniques. To start, the next chapter presents a FP minimiza-
tion technique in signature detection systems.
TH-1076_NHUBBALLI
Chapter 3
False positive alarm minimization in
signature detection systems
3.1 Introduction
Signature detection system uses a signature database and match incoming network traffic
against this database to detect attacks. Snort [113] and Bro [102] are well known signature
detection systems. A signature is a pattern that is looked for, in network traffic to be
declared as attack. For example, existence of pattern “/cgi-bin/phf?” in network traffic
implies attempt to exploit the well known character escaping vulnerability present in
some phf CGI scripts. The Snort rule to detect the attack is given below.
alert tcp any any − > any any (content : “/cgi − bin/ph f ?”; msg : “PHF probe!”; ).
The rule considers network traffic from any host and any port destined to any port of any
host in the network being monitored. Also the payload of the packets being considered
should match the pattern “/cgi-bin/phf?”.
Signature detection systems generally provide good Detection Rate [48] for known
attacks. However, a major limitation lies in these systems because they generate a huge
number of alarms to be processed by the system administrator, a major portion of which
comprises False Positives (FPs); this leads to low Accuracy. Discussion in articles [105, 128]
point out that sometimes up to 98% alarms generated by commercial signature detection
systems are FPs. One cause for FP generation is loosely written signatures, which tend
to declare benign activity as attack. The other reason is, in general, signature detection
TH-1076_NHUBBALLI
52 Chapter 3. False positive alarm minimization in signature detection systems
systems are run with default set of signatures. So alarms are generated for most attack
attempts irrespective of success or failure to exploit any vulnerability in the network
under question. It may be noted that there is always a limited number of (known)
vulnerabilities which can be exploited in a network compared to the number of signatures
in a signature database. This is the major cause of large number of FPs in such systems.
In view of this FP minimization is a relevant dimension of research in signature detection
systems. In other words, effective alarm generation in signature detection systems mainly
require FP minimization. This chapter is focussed towards effective alarm generation
in signature detection systems by addressing the major cause of FPs. As identified in
Chapter 2 Subsection 2.2.1.4, correlation based approach is the most effective technique
for FP minimization. In this chapter a correlation based FP minimization scheme is
proposed.
Schemes that improve Accuracy also compromise Detection Rate because sometimes
attacks which can exploit some vulnerability (i.e., True Positives (TPs)) are dropped [106].
Drop in Detection Rate can be tolerated for non-critical applications for increase in Accuracy.
However, lowering Detection Rate for critical applications may lead to serious security
threats as some attacks may pass undetected. In the second part of this chapter, the
proposed FP minimization scheme is suitably enhanced so that near 100% Detection Rate
is maintained for critical applications at the cost of few FPs.
The contributions of this chapter are as follows:
• Development of a FP alarm filter for signature detection systems involving the
following.
– A dynamic threat profile representing the vulnerabilities present in the network
being monitored is built.
– A neural network based correlation engine for filtering FPs generated by the
signature detection system is designed. This engine correlates the threat profile
with alarms and filters FPs.
The next phase of the chapter enhances the FP alarm filter to consider criticality factor
of the network applications. The enhancement scheme involves the following.
– A Finite State Machine (FSM) based framework is developed for representing
TH-1076_NHUBBALLI

3.2. Related work 53
criticality of applications.
– All alarms which are declared as FPs (by the filter) are evaluated with the
criticality of the application against which the corresponding attack is launched.
If the attack is against a critical application, the corresponding alarm is passed
even if it is declared as FP. On the other hand all FP alarms against non-critical
applications are dropped.
Rest of the chapter is organized as follows. Relevant literature on FP minimization in
signature detection systems is reported in Section 3.2. Section 3.3 presents the proposed
FP minimization scheme and Subsection 3.3.3 deals with experimental results illustrating
gain in Accuracy by the scheme. Section 3.4 presents the FSM based modeling of criti-
cality of applications and the technique for enhancing the FP filter. Experimental results
on Detection Rate and Accuracy for critical and non-critical applications are reported in
Subsection 3.4.1. Finally the chapter is concluded in Section 3.5.
3.2 Related work
For the sake of readability a brief summary of various techniques for FP minimization in
signature detection systems (discussed in Subsection 2.2.1.4 of Chapter 2) is reported here.
Also, an elaborate discussion is provided on works closely related (i.e., FP minimization
using correlation of alarms with vulnerabilities) to the scheme proposed in this chapter.
As presented in Chapter 2, the following are the major schemes for FP minimization in
signature detection systems.
• Signature enhancement [92, 121]: In this scheme the signatures are augmented
with additional evaluation information in terms of vulnerable target applications.
The main drawback of the scheme is because modifying signatures is not a trivial
task. Further, signatures need to be altered each time there is some change in the
vulnerable applications. Also the the system needs to be restarted after a signature
is modified.
• Alarm mining [66, 67, 68, 69, 70, 105]: Alarms generated by signature detection
systems comprise information in terms of attributes like, IP addresses, port numbers,
TH-1076_NHUBBALLI

54 Chapter 3. False positive alarm minimization in signature detection systems
protocol etc. Data mining techniques use these attributes and mine a set of given
alarms for summarizing them into either TPs or FPs. Characteristics learnt during
the mining stage are used to classify future alarms. Data mining based schemes
require labeled alarms (during training), which may not always be possible due to
their sheer numbers. Further, considering dynamic nature of network context, data
miming is not suitable for FP minimization. Data mining is inherently an offline
technique thereby making FP minimization schemes offline.
• Correlation of signature detection system alarms with alarms of other IDSs [39, 46]:
Techniques based on correlation of alarms of more than one type of IDSs increase
Accuracy because, if more than one IDS raise alerts at a given instance then probability
of the alarms being TPs is high. The basic problem in correlation based schemes is,
matching events of different domains (e.g., signature detection system alarms with
anomaly detection system alarms) is not trivial.
• Alarm correlation with vulnerabilities in hosts based on reference numbers [91,
92, 96]: Signatures and consequently alarms (generated by the signature) some-
times have reference numbers for the corresponding vulnerability (as recorded in
some public vulnerability databases). These reference numbers are used to correlate
alarms with vulnerabilities in the network being monitored. The main advantage
of this scheme is it does not require signature modification with change in network
context. In addition, it does not require system shutdown. However, improvement
in Accuracy is only up to a certain extent because all signatures (and corresponding
alarms) and vulnerabilities do not have reference numbers [91].
The FP minimization technique proposed in this chapter is based on alarm correlation
with vulnerabilities in hosts. However, the technique handles the issue of incompleteness
of reference numbers thereby improving Accuracy better than other correlation based
schemes. Schemes that improve Accuracy also leads to slight drop in Detection Rate. This
drop in Detection Rate may not be acceptable for critical applications in a network. In this
chapter an enhancement of the FP minimization technique is also proposed which checks
alarms vis-a-vis application criticality before filtering. To the best of our knowledge, there
is no work which integrates application criticality with alarm filtering engine.
TH-1076_NHUBBALLI

3.2. Related work 55
Distribution of Snort Signature Reference Numbers
15%
3%
21%
3%
4%7%3%
23%
21% CVE, Bugtraq and NessusBugtraq and NessusCVE and BugtraqCVE and NessusNessusBugtraqCVENo ReferencesOther Databses
Figure 3.1: Distribution of Snort signature reference numbers across vulnerabilitydatabases
3.2.1 FP minimization by correlation of alarms with vulnerabilities
The possibility of correlating alarms with vulnerabilities based on reference numbers is
presented by Massicotte et al. in [91]. The paper provides a survey on three open source
IDSs and three vulnerability databases namely, Common Vulnerability Exposure (CVE),
Bugtraq and Nessus database. The work indicates a possible integration of Snort with
different databases using reference numbers. The distribution of reference numbers in
Snort signatures across different vulnerability databases are shown using a pie chart in
Figure 3.1.
The idea of reference number based correlation can be better understood by looking into
some Snort alarms and outputs of vulnerability scanners as given below.
1. Snort Alarm-1
[1 : 2123 : 2] ATTACK-RESPONSES Microsoft cmd.exe banner
[Classification: Successful Administrator Privilege Gain]
[Priority: 1] 03/09-19:43:56.034979 142.172.16.182:80 − > 142.172.22.180:60134
[Xref =>http://cgi.nessus.org/plugins/dump.php3?id=11633]
TH-1076_NHUBBALLI

56 Chapter 3. False positive alarm minimization in signature detection systems
This alert is generated when the worm “WORM LOVGATE.C” is executed on win-
dows platform. The worm belongs to backdoor category (i.e., without user’s consent
it gets installed on a machine).
Some main elements of this Snort alarm can be explained as follows.
• [1:2123:2]–this field indicates the Snort module (plug-ins, detection engine etc.)
from which this alert is generated.
• ATTACK-RESPONSES Microsoft cmd.exe banner–this states that attack plat-
form is Microsoft.
• [Classification: Successful Administrator Privilege Gain]–this field states the
consequence of the corresponding attack.
• [Priority: 1]– this mentions the priority of the alert; lower the number, higher
the priority.
• 03/09–gives the date on which the alarm is generated.
• 19:43:56.034979 –this shows the time when the alarm is generated.
• 142.172.16.182:80–this mentions IP address as 142.172.16.182 and port number
as 80 of the external source of attack generation.
• 142.172.22.180:60134 - this field shows internal IP address and port numbers,
respectively of the host which is attacked.
• [Xref => http://cgi.nessus.org/plugins/dump.php3?id=11633]–this field gives
reference to Nessus database with reference number as 11633. This field implies
that details of the vulnerability being exploited by the attack corresponding to
this alarm can be found in Nessus database with reference number 11633.
2. Snort Alarm-2 [1 : 497 : 11] ATTACK-RESPONSES file copied ok
[Classification: Potentially Bad Traffic] [Priority: 2]
03/09-20:34:00.379435 142.172.16.182:80 − > 142.172.22.180:61607
[Xref =>http://cve.mitre.org/cgi-bin/cvename.cgi?name=2000-0884]
This alert is generated when a remote command execution vulnerability is exploited
against an IIS web server. Various attributes of this alarm can be inferred as in the
case of Snort alarm-1. It may be noted that Snort alarm-1 has reference to Nessus
database and this alarm has reference to CVE database.
TH-1076_NHUBBALLI

3.2. Related work 57
Figure 3.2: A sample of Nessus vulnerability scanner output
A list of vulnerabilities can be generated for the network being monitored. When an
alarm is generated it is verified with the list using reference number. If a match is found
the alarm is TP, else it is FP. Vulnerabilities of the network components can be detected
by running the vulnerability scanners. Different vulnerability scanners use different
techniques for detecting vulnerabilities. For example, “Nessus vulnerability scanner”
determines vulnerabilities by exploitation, while “Protector-plus” examines the registry
entries, patch level of the softwares or OSs. In the first case, the vulnerability scanners
have programs which generate the exploit and verifies its response. In the second case,
a list of various vulnerabilities are maintained for different applications, OSs with their
version, patches, updates etc. Such scanners just need to determine the details (i.e., version
number, patches etc.) of the running applications or OS in the systems and then cross
check in the database. Details of vulnerability scanners can be found in [12, 18, 23]. These
vulnerability scanners can be set to run periodically to get the most consistent view of the
network. A sample output of Nessus vulnerability scanner is shown in Figure 3.2. In the
report, reference number of the vulnerability is “11219”.
The idea of considering reference number for matching alarms and vulnerabilities of
a network [91], has been used by Neelakantan et al. in [96] to design a threat aware
signature detection system called TAIDS. The scheme used in TAIDS comprises three
steps.
1. Finding vulnerabilities in the network under consideration.
TH-1076_NHUBBALLI

58 Chapter 3. False positive alarm minimization in signature detection systems
2. Creating a database of all vulnerabilities having “reference numbers” (as per CVE
or Bugtracq).
3. Selection of signatures corresponding to vulnerabilities listed in Step-2, in terms of
reference numbers. These signatures are termed as network specific signatures.
Now, only network specific signatures are kept in Snort database. Accordingly, in this
scheme alarms are triggered only for attacks which exploit vulnerabilities having reference
numbers. The scheme improves Accuracy but decreases Detection Rate due to incomplete-
ness of matching vulnerability reference numbers. Moreover this technique requires
reconfiguration of the signature database periodically as and when hosts are added or
removed, OSs and applications are changed or patched, which involves detection system
downtime.
3.3 Proposed technique: FP minimization in signature de-
tection systems
This section presents the proposed FP minimization technique for signature detection sys-
tems. As discussed in the last section, Snort alarms generate information like source/destination
IP address, attack platform, time of attack generation etc. in addition to reference numbers
to vulnerability databases. Also, it may be observed from Figure 3.2 that many attributes
in addition to reference number like IP address, port number etc. are generated by the
scanner output. In the proposed technique the problem of incompleteness of reference
numbers (of vulnerabilities and IDS signatures) is addressed by taking more features that
are generated with alarms and scanner output for correlation. The proposed method has
the following two broad steps.
1. Threat profile generation in terms of vulnerabilities existing in applications, OSs etc.
(that are in execution) in hosts of the local network.
2. Correlation of signature detection system alarms with network threat profile.
The terminologies used in this chapter are given below.
• Attack: Any malicious attempt to exploit a vulnerability, which may or may not be
successful.
TH-1076_NHUBBALLI

3.3. Proposed technique: FP minimization in signature detection systems 59
• Effective attack: An attack which can exploit some vulnerability in the target net-
work.
• Non-effective attack: An attack pertaining to some vulnerability which does not
exist in the target network.
• False alarms: Consist of FPs and FNs
• FP: Alarm generated by signature detection system for non-effective attack or benign
case.
• FN: An effective attack missed from being detected.
• Effective attack alarm: Alarm generated by signature detection system for effective
attack.
• Non-effective attack alarm: Alarm generated by signature detection system for non-
effective attack.
Figure 3.3 depicts the basic architecture of the proposed scheme. A description of the
components of the architecture are as follows.
• Packet sniffer: Captures incoming network packets. These kind of sniffers can be
built using Libpcap or Winpcap libraries.
• Signature detection system sensor: It is a signature detection system engine. Packets
captured by the packet sniffer are evaluated against signatures in the (signature)
database.
• Signature database: Collection of signatures, each one representing one or more
possible vulnerabilities.
• Alarms: The output of signature detection system is a set of alarms containing both
effective attack alarms and non-effective attack alarms.
• Known vulnerability database: This is the database populated from various sources
such as CVE database, Bugtraq etc.
TH-1076_NHUBBALLI

60 Chapter 3. False positive alarm minimization in signature detection systems
PacketSnifferNetwork Signature Detection
System Sensor
Signature Database
Alarms
Network ContextInformation
(Threat Profile)
CE
Known VulnerabilityDatabase
Scan the Networkfor Possible
Vulnerabilities
Threat Generator
EffectiveAttack Alarms
(i.e., TPs)
Non-effective AttackAlarms
(i.e., FPs)
Report to admin
Figure 3.3: Proposed architecture for FP minimization in signature detection systems
• Threat generator: This entity collects the output of vulnerability scanners and select
relevant vulnerabilities to represent current threats of the network.
• Threat profile: It is the database representing threats captured by threat generator.
• Correlation engine (CE): A module to correlate threats and alarms.
• Effective attack alarms : Alarms reported as effective attack alarms by correlation
engine. They are sent to the system administrator.
• Non-effective attack alarms : Alarms reported as non-effective attack alarms by
correlation engine; they are dropped.
The two broad steps of the proposed scheme are elaborated in the next two subsections.
3.3.1 Threat profile generation
Threat profile is a collection of vulnerabilities which are applicable to the applications,
OSs etc. in the network under consideration. This network context information is used
TH-1076_NHUBBALLI

3.3. Proposed technique: FP minimization in signature detection systems 61
for validating alarms vis-a-vis vulnerabilities of the network. So there is a need to capture
network vulnerability information and generate threat profile.
Threats to any network (because of vulnerabilities) are dynamic in nature. Changes
in the network’s operating environment (H/W or S/W) have an impact on the threat level
of the network. These changes in network’s operating environment can be intentional
such as patching an application, adding new nodes, configuration changes, changes in
architecture etc. It can also be unintentional such as installing a software by opening a
mail attachment. So threat profile is updated at regular intervals.
Vulnerabilities of network components can be detected by running vulnerability scan-
ners. These vulnerability scanners can be set to run periodically to get the most consistent
threat view of the network. More than one vulnerability scanners are required because
individual scanners do not capture all vulnerabilities. The outputs from vulnerability
scanners are not consistent, however, they contain all the necessary information for build-
ing the threat profile. Building threat profile needs processing of outputs from the scanners
and can be done easily with scripting languages like Perl.
Threat profile of the network is captured using an Enhanced Entity Relationship (EER)
model as shown in Figure 3.4. The context information mainly includes the hosts present
in the network, their OSs, open ports, applications, external information from Bugtraq
and CVE databases etc. Thus, the EER model elements include host, OS, ports, TCPport,
UDPport, vulnerability, exploit, threat profile of OS, and services of TCP and UDP. The
relation between host and OS is one to many as one host can run more than one OSs. Each
host has multiple number of ports and services running which are installed on a particular
OS. So relation between OS and ports is again one to many. TCPport and UDPport extend
the port entity. The vulnerability entity is a representative of known vulnerabilities from
various sources and each vulnerability may lead to multiple exploits. Thus, the relation
between vulnerability and exploit is one to many. Threats of a network are captured by
the threat entity which is an extension of OS/service and exploit. Information to these
entities can be populated by various vulnerability scanners.
TH-1076_NHUBBALLI

62 Chapter 3. False positive alarm minimization in signature detection systems
HostIPAddress : CHAR(PK)MACAddress : CHAR(PK)
Operating SystemName : CHAR(PK)Version : CHAR(PK)HostIPAddress : CHAR(FK,PK)MACAddress : CHAR(FK)
PortsNumber : Integer(PK)State : CHARPortType : ENUMOSName : CHAR(FK,PK)OSVersion : CHAR(FK)HostIPAddress : CHAR(FK,PK)
Runs
TCPPortService : CHAR(PK)Version : REALPortNumber : Integer(FK)HostIPAddress : CHARPortsOSName : CHAR(FK,PK)
UDPPortService : CHAR(PK)Version : REALPortNumber : Integer(FK)HostIPAddress : CHARPortsOSName : CHAR(FK,PK)
VulnerabilityRefID : CHAR(PK)Name : CHAR(PK)Description : CHAR
ExploitName : CHAR(PK)Description : CHARVulnRefID : HAR(FK,PK)VulnName : CHAR(FK)
Has
Leads To
OSThreats_ProfileName : CHAR(PK)ExpID : CHAR(FK)Time : TIMEClassType : CHARHostIPAddress : CHAR(FK)Priority : INTEGERExplotName : CHAR(FK)Affects : CHARPlatform : CHAROSName : CHAR(FK)
Possess
Present
TCPThreats_ProfileName : CHAR(PK)ExpID : CHAR(FK)Time : TIMEClassType : CHARHostIPAddress : CHAR(FK)Priority : INTEGERExplotName : CHAR(FK)Affects : CHARPlatform : CHAROSName : CHAR(FK)PortNumber : Integer
Present
Possess
UDPThreats_ProfileName : CHAR(PK)ExpID : CHAR(FK)Time : TIMEClassType : CHARHostIPAddress : CHAR(FK)Priority : INTEGERExplotName : CHAR(FK)Affects : CHARPlatform : CHAROSName : CHAR(FK)PortNumber : Integer
PossessPresent
Figure 3.4: Representation of threat profile of the network using EER model
TH-1076_NHUBBALLI

3.3. Proposed technique: FP minimization in signature detection systems 63
3.3.2 Alarm correlation
In the present work correlation is essentially finding a closest match between alarm and
an entry in the threat profile. This involves two substeps–(i) correlation binary vector
generation and (ii) classification of correlation binary vectors.
3.3.2.1 Correlation binary vector generation
Alarms are to be correlated with the threat profile to decide its effectiveness with respect
to the network. This correlation can be achieved by measuring distance (match or mis-
match) between alarm and threats in terms of some common features e.g., IP address, port
number, protocol type etc. Most of the signature detection systems and vulnerability scan-
ners outputs (shown in Subsection 3.2.1) generate information to extract these features.
For simplicity, in this work distance between alarm and threat is the binary (hamming)
distance.
The positional representation of minimum distance measure of an alarm with respect
to threats, termed as “correlation binary vector” can be generated as follows. Let A = 〈
a1,a2,.....,an〉 be an alarm vector and let T = 〈 t1,t2,.....,tn〉 be a threat vector, where ai and
ti, (1 ≤ i ≤ n) are the features. The distance of an alarm vector Ai to a threat vector T j is
defined as the sum of mismatches of its features.
δcorr(Ai,T j) =n∑
p=1
δcorr(ap, tp); (3.1)
where, δcorr(ap, tp) = 0 if ap = tp else δcorr(ap, tp) = 1
with an exception of the time attribute where the criterion is
δcorr(ap, tp) = 0 if ap ≥ tp else δcorr(ap, tp) = 1.
Thus, the comparison of an alarm vector with a threat vector yields a distance metric.
Least distance is obtained by comparing an alarm vector with all relevant threat vectors
in the threat profile database. Let T j be the threat vector with minimum distance with Ai.
The positional match or mismatch of alarm Ai and threat T j is represented as a tuple ci of
the form: 〈ci1 , ci2 , · · · , cin〉where, cik = δcorr(ak, tk), 1 ≤ k ≤ n.
The algorithm for correlation binary vector generation is given below.
TH-1076_NHUBBALLI

64 Chapter 3. False positive alarm minimization in signature detection systems
Algorithm 3.1 : Algorithm for generating the correlation binary vector
Input : TRR, Ai, MAX.
Output: A binary vector of best match between Ai and TR.
/* TRR is the transaction database of the threat profile. */
/* Ai is the alarm which need to be correlated. */
/* MAX is the number of features used */
1: IPi ← IP Address against which the alarm Ai is generated.
2: Select threat vectors T j ∈ TRR that match IP address IPi. Let m be the number of such
potential candidates.
3: Curdist←MAX
4: for j = 1 to m do
5: Calculate the distance δcorr(Ai,T j) as given by Equation (1) of the alarm Ai to the
threat vector T j.
6: if δcorr(Ai,T j) < Curdist then
7: Curdist← δcorr(Ai,T j)
8: Match← j
9: end if
10: end for
11: Generate the correlation binary vector ci for Ai and TMatch
The algorithm is illustrated with the help of snapshots of a threat profile and alarms. Table
3.1 is a snapshot of the threat profile generated from vulnerability scanner output. Some
entries (e.g., Port in this case) in the table may be blank because the corresponding infor-
mation are not generated by the vulnerability scanners used. Table 3.2 is a snapshot of
the alarms generated against two hosts with IP address 172.16.26.104 and 172.16.26.109.
Threat profile in Table 3.1 is the transaction database TRR. First alarm of Table 3.2 (i.e.,
A1) having an IP address 172.16.26.104 matches only with the threat vector T1 of Table 3.1.
T1 becomes the candidate for correlation since it is the threat vector with the matching IP
address, hence Match and m are 1. Curdist is initialized to 11 (i.e., the number of features
considered in the alarms or the threat profile) as it is the maximum distance possible in
the present case. The distance between alarm A1 and threat vector T1 is 1 (according to
TH-1076_NHUBBALLI

3.3. Proposed technique: FP minimization in signature detection systems 65
Equation 1) as detailed below. The first feature (RefNo) of A1 and T1 matches, making
first bit of the correlation vector to be 0. As the time of A1 is greater than the time T1 is
generated, T1 is relevant; hence, second bit is 0. However, there is a case of mismatch
in port number, making third bit 1. Similarly all 11 bits can be generated and hamming
distance can be shown to be 1; Curdist becomes 1. Thus the correlation binary vector
generated is 〈00100000000〉.
Interestingly use of correlation binary vectors helps in representing multiple attack
instances with a single vector. In other words, the exhaustive set of known attacks for
each vulnerability need not be launched to generate the vectors. For example, the third
alarm (i.e., A3) when correlated with T5 (fifth threat of the Table 3.1) generates the binary
vector 〈00100000000〉, which is same as the one for A1 and T1. Although A1 and A3 are
two alarms for two attacks, when correlated, generate same binary vectors.
3.3.2.2 Classification of correlation vectors
Correlation binary vectors need to be classified into two classes as effective or non-effective
using a classifier. Classifiers initially require training with known class label. For training
an additional bit termed as “validity bit” is added to the correlation binary vectors.
Validity bit being 1(0) indicates corresponding alarm to be effective attack alarm (non-
effective attack alarm). During training a set of correlation binary vectors with validity
bit are inputs to the classifier. During testing or deployment validity bit is generated by
the trained classifier for any correlation binary vector.
Neural network is a common technique used for classification. Based on the nature of
the data, several variants of neural network are used, namely, perceptron, linear neural
network and backpropagation [150]. Perceptron and linear neural network can solve
linearly separable classification problems, however, in other cases backpropagation is
normally used. Since the present classification problem of the correlation binary vectors
is not linear, backpropagation neural network is used. Another advantage of using
backpropagation is because of the fact that trained backpropagation networks provide
reasonably acceptable results even on unseen data. It may be noted that in the present
case, the network is trained with correlation binary vectors corresponding to a limited
representative set of attacks. Trained neural network is expected to classify correlation
binary vectors generated for all sets of attacks for which an alarm is generated by the
TH-1076_NHUBBALLI

66 Chapter 3. False positive alarm minimization in signature detection systems
signature detection system.
TH-1076_NHUBBALLI

3.3. Proposed technique: FP minimization in signature detection systems 67
Tabl
e3.
1:Sn
apsh
otof
thre
atpr
ofile
Ref
No.
Tim
ePo
rtIP
Nam
ePr
otoc
olC
lass
Seve
rity
Effec
tA
ppl
Plat
-ica
tion
-for
mC
VE-
1999
-00
01
8:9:
2008
:22:
32:1
6-
172.
16.2
6.10
4Te
ardr
opT
CP
DoS
Hig
hC
rash
OS
Win
.
CV
E-20
00-
0148
8:9:
2008
:22:
32:1
633
0617
2.16
.26.
166
Secu
rity
Brea
chT
CP
R2U
Med
ium
Priv
ilege
Es-
cala
tion
MyS
QL
Linu
x
CV
E-20
01-
0542
8:9:
2008
:22:
32:1
614
3317
2.16
.26.
151
SQL
Serv
erBuff
erO
ver-
flow
TC
PU
2RH
igh
Arb
itra
ryC
ode
Exec
u-ti
on
SQL
Serv
erW
in.
CV
E-20
00-
0884
8:9:
2008
:22:
32:1
680
172.
16.2
6.15
0W
ebFo
lder
Dir
ec-
tory
Trav
er-
sal
TC
PR
2UH
igh
Arb
itra
ryC
omm
and
Exec
utio
n
IIS
Web
Serv
erW
in.
CV
E-19
99-
0527
9:9:
2008
:12:
28:0
7-
172.
16.2
6.10
9Te
lnet
Res
olv
Hos
tC
onf
TC
PPr
ivile
geEs
cala
-ti
on
Med
ium
Priv
ilege
Es-
cala
tion
Teln
etW
in.
TH-1076_NHUBBALLI

68 Chapter 3. False positive alarm minimization in signature detection systems
Tabl
e3.
2:Sn
apsh
otof
alar
ms
gene
rate
d
Ref
No.
Tim
ePo
rtIP
Nam
ePr
otoc
olC
lass
Seve
rity
Effec
tA
ppl
Plat
-ica
tion
-for
mC
VE-
1999
-00
01
9:9:
2008
:12:
28:0
712
3817
2.16
.26.
104
Tear
drop
TC
PD
oSH
igh
Cra
shO
SW
in.
CV
E-20
01-
0680
9:9:
2008
:12:
28:0
721
172.
16.2
6.10
4FT
PSi
teFo
rmat
Stri
ng
TC
PR
2UH
igh
Priv
ilege
Es-
cala
tion
FTP
Win
.
CV
E-19
99-
0527
9:9:
2008
:12:
28:0
710
2617
2.16
.26.
109
Teln
etR
esol
vH
ost
Con
f
TC
PPr
ivile
geEs
cala
-ti
on
Med
ium
Priv
ilege
Es-
cala
tion
Teln
etW
in.
TH-1076_NHUBBALLI

3.3. Proposed technique: FP minimization in signature detection systems 69
3.3.3 Experimental results
The proposed scheme is implemented as a filter which takes signature detection system
alarms as input and gives effective attack alarms as output, thereby minimizing FPs. The
filter has two components, threat profile and alarm correlation (which matches threat
profile and alarms generated by signature detection system). Results are illustrated on
two datasets for validation of the proposed FP filter. First set of experiments are done on
a small dataset generated in a testbed. The second is on an offline dataset shared by the
authors of [93].
3.3.4 Experiments on dataset generated in the testbed
For this set of experiments a heterogenous testbed is setup with OSs such as Winodws
98, Windows 2000 server, Windows 2003 server, Windows XP, Ubuntu 7.2, Redhat 4.2
and Fedora 9. Also applications such as FTP server, Telnet, Mysql server, SQL server are
installed on these machines. Based on context of the testbed, following eleven features
are used for threat profile generation: reference number, time, IP address, port number,
name of exploit, protocol type, class name, effect, severity, service affected and platform.
Threat profile of the testbed is created using Nmap [20], Nessus vulnerability scanner [18]
and GFLanguard [12] and stored in MySQL database. Snort with default set of rules is
used as signature detection system. One of the machines, loaded with attack generating
tools generates attacks for applications and OSs in the testbed. Most of these exploits are
generated using Metasploit tool and other publicly available exploitation programs. The
dictionary of attacks used in the experiment is -
Denial of service (DoS): Teardrop, Land, Bonk, Jolt, Smurf, Winnuke, Ping of death, Syndrop;
FTP: Finger redirect, Freeftpd username overflow, Easy file sharing FTP server overflow,
FTP format string;
SQL: SQL server buffer overflow, SQL injection;
MYSQL: SSL hello message overflow;
Telnet: Telnet usrname buffer overflow, Telnet server buffer overflow, Resolve host conf.
Nearly 80% of the alarms for these attacks are non-effective to the testbed. In other
words, nearly 80% attacks do not exploit any vulnerability in the hosts of the testbed,
but most of them have a signature in the Snort database. Alarms are raised by Snort
TH-1076_NHUBBALLI

70 Chapter 3. False positive alarm minimization in signature detection systems
corresponding to most of these attacks. These alarms are processed to extract features
mentioned earlier. Subsequently, correlation binary vectors are generated for each alarm
using Algorithm 3.1. Processing of threats and alarms is done using Perl scripts. Also,
Algorithm 3.1 is implemented in Perl. Matlab neural network tool box is configured as
alarm classifier. Correlation binary vectors with added validity bit are used for training.
During testing/deployment, validity bit is determined by the trained neural network. For
the present experiment, the following parameters are set for the backpropgation neural
network: Input layer with 11 inputs (corresponding to the number of features), a hidden
layer with 5 nodes and an output layer with a single node. Learning rate is set to 0.05,
number of epochs to 5000 and performance goal to 1e-8. Multilayer tan-sigmoid transfer
function “tansig” is used in the hidden layer and the output function is “purelin”.
As discussed before, the proposed FP filter has a training and testing phase. Experi-
mental details of these phases in the testbed are discussed subsequently.
To get a comprehensive dataset for training the following steps are followed.
• Multiple vulnerability scanners are used to find vulnerabilities present in the systems
of the network under consideration and a database is created.
• Attacks capable of exploiting the vulnerabilities are generated. Alarms were gen-
erated by Snort for most of these attacks. As discussed in Subsection 3.3.2 use of
correlation binary vectors limit the number of attacks to be generated for obtaining
the training set.
• Correlation binary vectors are generated corresponding to these alarms (using Al-
gorithm 3.1). They are labeled as effective attack alarms.
• For the non-effective training set two types of attacks are used-(i) attacks which
cannot exploit any vulnerability in the network, (ii) attacks which can exploit some
vulnerability in the network but none in the machine against which it is launched.
Correlation binary vectors for these alarms are generated and these alarms are
labeled as non-effective attack alarms.
Totally 780 correlation binary vectors are generated and used for training. The training
time for the neural network (with 780 vectors) is 3.5 minutes on an Intel core TM2 duo
processor (P8400) running at 2.26 MHz with 2GB RAM.
TH-1076_NHUBBALLI

3.3. Proposed technique: FP minimization in signature detection systems 71
The testing phase of the proposed FP alarm minimization filter involves two steps.
First step involves generation of correlation binary vector by finding the closet match of
the alarm with a threat (from the threat profile generated using Algorithm 3.1). The worst
case time complexity of this step is O(n) (where n is the number of records in the threat
profile). For the present experiment, 976 correlation binary vectors are used for testing and
the maximum time taken for binary vector generation for one alarm is 0.116 second. The
runtime of the testing phase can be made more efficient by better representation (indexing)
and searching algorithms. The second step is the classification of a correlation binary
vector using the trained neural network. In the experiment, classifying one correlation
binary vector requires 0.00047 seconds.
The performance of signature detection system (Snort) in terms of Detection Rate and
Accuracy with and without filter are given next. Detection Rate and Accuracy of Snort
without filter are tabulated in Table 3.3. The details of the table is explained as follows.
• Column 1 shows the class of attack.
• Column 2 shows the number of attacks generated
• Column 3 shows the number of non-effective attacks.
• Column 4 shows the number of effective attacks.
• Column 5 shows the number of alarms generated by Snort for the attacks launched
(in Column 2).
• Column 6 denotes the number of TPs. These are the alarms which correspond to
effective attacks (i.e., effective attack alarms, abbreviated as EFF AA in the tables in
this chapter).
• Column 7 denotes the number of FPs. These are the alarms which correspond to
non-effective attacks (i.e., non-effective attack alarms, abbreviated as Non-EFF AA
in the tables in this chapter).
• Column 8 shows the number of FNs. These are the attacks for which no alarm is
generated by Snort, but attacks are successful.
• Column 9 and Column 10 show Accuracy and Detection Rate, respectively.
TH-1076_NHUBBALLI

72 Chapter 3. False positive alarm minimization in signature detection systems
Tabl
e3.
3:A
ccur
acy
and
Det
ectio
nR
ate
ofsi
gnat
ure
dete
ctio
nsy
stem
wit
hout
the
FPfil
ter
Cla
ssA
ttac
ksN
on-eff
ecti
veEff
ecti
veA
larm
sEF
FN
on-E
EFFN
Acc
.D
et.
atta
cks
atta
cks
gene
rate
dA
AA
AR
ate
bySn
ort
(or
TP)
(or
FP)
Teln
et12
610
521
126
2110
50
16.7
%10
0.0%
DoS
3929
1033
1023
030
.3%
100.
0%FT
P40
031
981
389
8030
91
20.6
%98
.8%
SQL
191
150
4120
040
160
120
.0%
97.6
%M
ySQ
L22
017
644
210
4216
82
20.0
%95
.5%
TH-1076_NHUBBALLI

3.3. Proposed technique: FP minimization in signature detection systems 73
Detection Rate and Accuracy of Snort with the proposed filter are tabulated in Table 3.4.
First 5 columns of Table 3.4 carry the same information as that of first 5 columns of Table
3.3. Details of the remaining columns of Table 3.4 are described below.
• Column 6 denotes the alarms (generated by Snort) which are retained by the filter
as they could be correlated to some vulnerability in the testbed.
• Column 7 shows the number of TPs after the filter. TP in this case are the alarms
retained by the filter which correspond to effective attacks.
• Column 8 shows the number of FPs after the filter. FPs in this case are the alarms
retained by the filter which correspond to non-effective attacks.
• Column 9 shows the number of FNs after the filter. FNs are the effective attacks for
which no alarm is found in the set retained by the filter.
• Column 10 and Column 11 show Accuracy and Detection Rate, respectively.
Table 3.4 illustrates an increase of Accuracy of about 80% for most classes of attacks. This
conforms to attacks generated in the testbed, where only 20% of attacks are effective. This
increased Accuracy is achieved as the proposed approach utilizes context information
along with reference number as only a feature for validating alarms. However, for denial
of service attacks suppression is low, as most of denial of service attacks are flooding
attacks and they are relevant to every network. Also, it may be noted from Table 3.4 that
fall in Detection Rate due to filtering of alarms is as low as 4% on an average. This lowering
of Detection Rate is due to misclassification of some correlation binary vector of an effective
attack as FP by the neural network. Table 3.4 also illustrates that for some applications
(like Telnet), Detection Rate before alarm filtering is 100% while for some others (like denial
of service) it is lower. This implies that Snort detected all attacks (generated in the testbed)
for the former cases while it missed some for the latter ones.
In the next subsection a comparison of proposed method in terms of Detection Rate and
Accuracy is presented with the scheme proposed by Neelakantan et al. in [96].
TH-1076_NHUBBALLI

74 Chapter 3. False positive alarm minimization in signature detection systems
Tabl
e3.
4:A
ccur
acy
and
Det
ectio
nR
ate
ofsi
gnat
ure
dete
ctio
nsy
stem
afte
rth
eFP
filte
r
Cla
ssA
ttac
ksN
on-eff
ecti
veEff
ecti
veA
larm
sA
larm
sEF
FA
AN
on-E
FFA
AFN
Acc
.D
et.
atta
cks
atta
cks
gene
rate
dre
tain
ed(o
rT
P)(o
rFP
)R
ate
bySn
ort
afte
rfil
ter
Teln
et12
610
521
126
2121
00
100.
0%10
0.0%
DoS
3926
1033
109
11
90.0
%90
.0%
FTP
400
319
8138
980
800
110
0.0%
98.8
%SQ
L19
115
041
200
4040
01
100.
0%97
.6%
MyS
QL
220
176
4421
042
402
495
.2%
90.9
%
TH-1076_NHUBBALLI

3.3. Proposed technique: FP minimization in signature detection systems 75
3.3.4.1 Comparison with method of Neelakantan et al. [94]
As discussed in Subsection 3.2.1, FPs can be minimized based on reference number by a
scheme discussed in [91] which is implemented by Neelakantan et al. [96]. The technique
discussed in [96] considers only those signatures for signature database which have a
corresponding vulnerability (with a reference number) in the network. Table 3.5 illustrates
sets of alarms generated by Snort with and without matching reference numbers in the
experiment. It may be noted that quite a good number of alarms generated by Snort and
their corresponding signatures do not have reference numbers referencing to standard
vulnerability databases.
Here, Accuracy and Detection Rate obtained using the proposed scheme are compared
with the scheme presented in [96]. The comparison results are illustrated in Table 3.6. The
following points are to be noted for the results of the scheme in [96].
• Low Detection Rate: As already discussed, CVE or Bugtracq reference numbers are
not complete [91]. Attacks exploiting vulnerabilities without reference numbers will
not be detected by signature detection system and obviously there will be no alarms
for these attacks.
• Fall in Accuracy: Signatures in the signature detection system [96] are corresponding
to vulnerabilities with reference numbers only. It may be noted that reference
numbers are general and not host specific. So alarms having reference numbers
generated by such system may not be effective for host/application which do not
have the the corresponding vulnerability.
The scheme proposed in this chapter, achieved better Accuracy and Detection Rate,
thereby resulting in effective alarm generation, since it uses 11 relevant features for corre-
lation (and reference number is one of them).
3.3.5 Experiments on dataset generated offline
Dataset described in [93] was generated in 2006 to evaluate the next generation signature
detection systems, particularly to access the capability of false alarm minimization of these
systems. The dataset was created on a virtual network infrastructure built with Vmware
where a total of 208 different OSs were installed. Attack traffic was generated using 124
TH-1076_NHUBBALLI
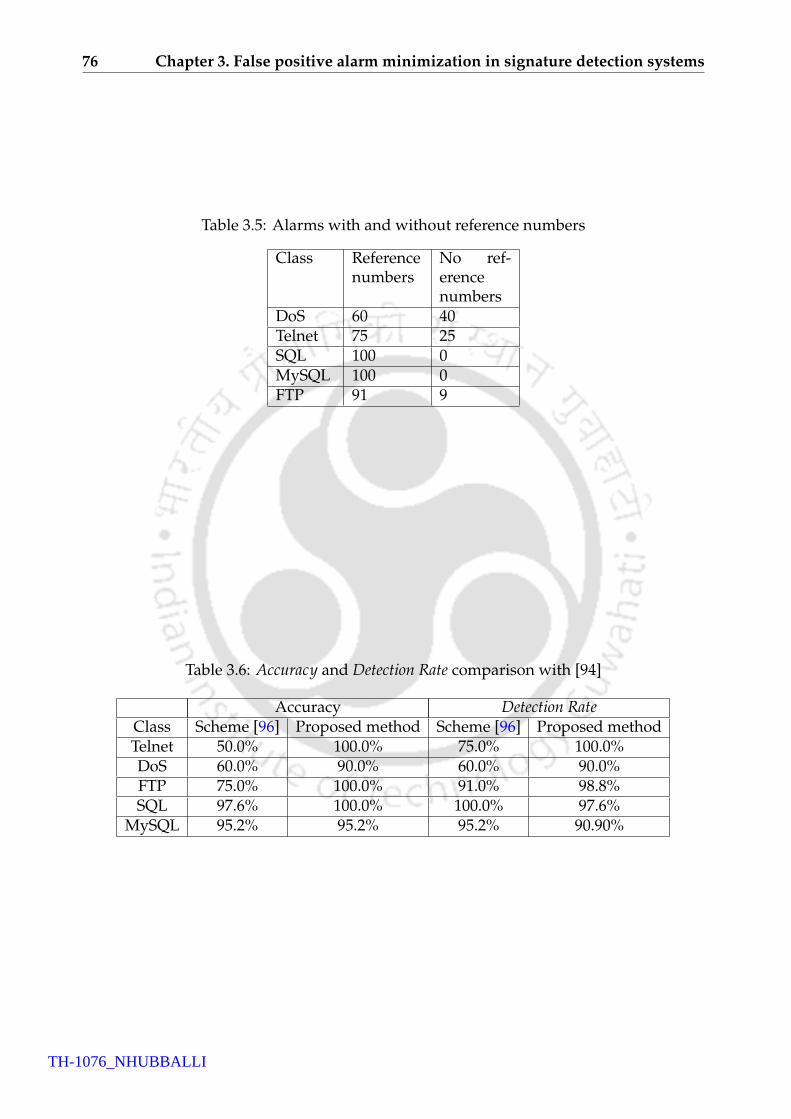
76 Chapter 3. False positive alarm minimization in signature detection systems
Table 3.5: Alarms with and without reference numbers
Class Referencenumbers
No ref-erencenumbers
DoS 60 40Telnet 75 25SQL 100 0MySQL 100 0FTP 91 9
Table 3.6: Accuracy and Detection Rate comparison with [94]
Accuracy Detection RateClass Scheme [96] Proposed method Scheme [96] Proposed methodTelnet 50.0% 100.0% 75.0% 100.0%DoS 60.0% 90.0% 60.0% 90.0%FTP 75.0% 100.0% 91.0% 98.8%SQL 97.6% 100.0% 100.0% 97.6%
MySQL 95.2% 95.2% 95.2% 90.90%
TH-1076_NHUBBALLI

3.3. Proposed technique: FP minimization in signature detection systems 77
exploitation programs. For every attack generated there was a separate trace file with (i)
complete context information (in terms of parameters like IP address of target host, port,
OS, protocol, application etc.) and (ii) a labeling of whether the attack was successful in
exploiting any vulnerability in the network.
As the network setup was virtual [93], threat profile (for the present experiment)
is generated by configuration information of the traces for successful attack instances.
For example, if the trace file for a successful attack has parameters IP=144.12.11.211,
OS=WindowsXP and Application=FTP, then FTP running on Windows in host 144.12.11.211
is vulnerable and would be included in the threat profile. On the other hand parameters
which are not present in any successful attack trace are non-vulnerable.
To study Detection Rate and Accuracy of Snort, traces of the dataset are passed through
Snort and alarms are collected. Alarms are generated by Snort for all these traces as
signature database has an entry for all the corresponding attacks. As traces are labeled,
alarms generated from successful and unsuccessful attack attempts are separated. Alarms
corresponding to successful (unsuccessful) attacks are TPs (FPs). Table 3.7 shows the
details of the study in terms of number of attack traces, number of alarms, non-effective
attack alarms, effective attack alarms and FNs. Also Detection Rate and Accuracy computed
using the value of TPs, FPs and FNs are reported in the table. It may be noted that
Detection Rate for all classes of attacks are 100% as Snort could detect all attacks (i.e., FP is
0). However, Accuracy is low because alarms are generated by Snort for all attack traces
and most of the attacks could not successfully exploit any vulnerability in the network.
Table 3.7: Accuracy and Detection Rate before FP filter
Class Total Total Non-EFF EFF FN Acc. Det.Traces Alarms AA AA Rate
(or FP) (or TP)FTP 8764 8764 8657 107 0 1.22% 100 %
IIS Webmaster 2184 2184 2096 88 0 4.03% 100%Netbios 3864 3864 3734 130 0 3.36% 100%
To improve the Accuracy, FPs generated by Snort are filtered using the proposed FP
minimizing technique. Table 3.8 reports the Accuracy and Detection Rate after filtering.
Some of the entries in the table are explained as follows (while others are self explanatory
TH-1076_NHUBBALLI

78 Chapter 3. False positive alarm minimization in signature detection systems
or explained before):
• Column 3: A subset of alarms are used for training. These alarms comprise both
TPs and FPs.
• Column 4: All alarms (including the ones used for training) are used as testing data.
• Column 7: The alarms among the test set declared as non-effective attack alarms by
the correlation engine (CE, Figure 3.3) (because they do not match any vulnerability
in the network).
• Column 8: The alarms among the test set declared as effective attack alarms by the
Correlation Engine (CE) (because they matched some vulnerability in the network).
• Column 9: TPs among the effective attack alarms declared by CE (Column 8) i.e.,
effective attack alarms (Column 6) and declared as effective attack alarms by CE. In
other words, column 9 represents the alarms for attacks exploiting some vulnerabil-
ity in the network (column 6) and correctly identified as effective attack alarms by
the CE.
• Column 10 : FPs i.e., non-effective attack alarms (Column 5) but declared as effective
attack alarms by CE. In other words, column 10 represents the alarms for attacks
not exploiting any vulnerability in the network (column 5) but wrongly identified
as effective attack alarms by the CE.
• Column 11: FNs i.e., effective attack alarms (Column 6) but declared as non-effective
attack alarms by CE. In other words, column 11 represents the alarms for attacks
exploiting some vulnerability in the network (column 6) but wrongly identified as
non-effective attack alarms by the CE.
TH-1076_NHUBBALLI

3.3. Proposed technique: FP minimization in signature detection systems 79
Tabl
e3.
8:A
ccur
acy
and
Det
ectio
nR
ate
afte
rFP
filte
r
Cla
ssTo
tal
Trai
ning
Test
ing
Non
-EFF
EFF
Non
-EFF
AA
EFF
AA
TP
FPFN
Acc
Det
.A
larm
sA
larm
sA
larm
sA
AA
AC
EC
EC
EC
EC
ER
ate
FTP
8764
1316
8764
8657
107
8662
102
966
1194
.12%
89.7
2%II
S21
8468
321
8420
9688
2015
7976
312
96.2
0%86
.36%
Net
bios
3864
764
3864
3734
130
3749
115
110
520
95.6
5%84
.62%
TH-1076_NHUBBALLI

80 Chapter 3. False positive alarm minimization in signature detection systems
It may be observed from Table 3.7 and Table 3.8 that the scheme on correlating network
threat profile with alarms, improves Accuracy by many fold but at the cost of Detection Rate.
Fall in Detection Rate is much lower when compared to gain in Accuracy. However, fall in
Detection Rate implies some effective attacks being missed. This may not be acceptable for
critical applications in the network.
It is a generally accepted fact that in any organization there are some network applica-
tions which are critical for its operation. These applications need to be protected against
attacks. Since FP minimization schemes reduce Detection Rate to some extent by filtering
out few effective attack alarms, there is a chance that some effective attack targeted against
a critical application is missed. Such cases of misinterpretations are not acceptable. On
the other hand, for other applications which are not critical, a small number of such
misinterpretations may be tolerable.
The objective of the next part of this chapter is development of an application criticality
aware FP minimization technique for signature detection systems. The scheme provides
a differentiated treatment to the alarms based on the criticality of the application that is
targeted by the corresponding attack.
3.4 Application criticality aware FP minimization
This section presents an enhancement over the proposed FP minimization technique (dis-
cussed in the last section) to consider criticality of network applications. Basic architecture
illustrating the enhancement is shown in Figure 3.5
As disused earlier alarms that could not be correlated with any vulnerability are
declared as FPs and dropped (by the proposed FP minimizer). However, some of the
dropped alarms may also correspond to attacks that can exploit some vulnerability in the
host being targeted but declared FP due to correlation error. This may lead to serious
consequences if these attacks are for critical applications but may be tolerable if the target
is a non-critical one. So alarms being filtered are to be reevaluated vis-a-vis application
criticality; such alarms are termed as “Intermediate False Alarms (IFA)” (Figure 3.5). The
procedure required for reevaluating the intermediate false alarms vis-a-vis application
criticality is discussed below.
Application criticality factor models the criticality of network resources/applications in
TH-1076_NHUBBALLI

3.4. Application criticality aware FP minimization 81
Pack
etSn
iffer
Netw
orkSig
natur
eDete
ction
Syste
mSe
nsor
Signa
ture D
ataba
se
Alarm
s
Netw
ork C
ontex
tInf
ormati
on(T
hreat
Profi
le)
CE
Know
n Vuln
erabil
ityDa
tabase
Scan
the N
etwork
for Po
ssible
Vulne
rabilit
ies
Threa
t Gen
erator
Interm
ediat
e Fals
eAl
arms (I
FA)
Effec
tive
Attac
k Alar
ms (i
.e.,T
Ps)
Critic
ality
Verif
icatio
nEf
fectiv
e Atta
ckala
rms
(i.e.,
TPs)
CWA
IFA w
as for
a Criti
cal Ap
plicat
ion
Non-e
ffecti
ve A
ttack
Alarm
s(i.
e.,FP
s)IFA
was
fora n
on Cr
itical
Reso
urce
Repo
rt toa
dmin
Repo
rt toa
dmin
Figure 3.5: Proposed architecture for application criticality aware FP filter
TH-1076_NHUBBALLI

82 Chapter 3. False positive alarm minimization in signature detection systems
terms of certain features generated along with a signature detection system alarm namely,
IP address, port number, OS etc. Advantage of such a model is the direct mapping of an
alarm with the target application and its criticality value. Application criticality factor
is represented using a weighted automata termed as Criticality Weighted Automaton
(CWA). The CWA is defined as: M = (X,Σ,=, xinitial,X f inal), where
• X represents the set of states of the automata.
• Σ = {I1, I2....It} is the set of input variables and D = {D1,D2, · · · ,Dt} is the corre-
sponding set of domains. Each element Ii of Σ can take values from a corresponding
domain Di.
Here, input variables correspond to the features like IP address, port number, OS
etc. generated along with alarms. A domain comprises only those elements of the
corresponding feature which are active (or in use) in the network under question.
Each state represents an element of some domain in D.
• = is a finite set of transitions
• xinitial is the initial state
• X f inal ⊂ X is the set of final states
The set of states can be partitioned into levels, from 0 to t. State xlj will be referred to
as lth state at the jth level; subscript is used for level number and superscript is used
to represent state number at a given level. At level 0 there is only one state xinitial.
Each state at level 1 represents one element of D1. The CWA moves from xinitial to
state xk1 at level 1 if the value of parameter I1 (generated by the alarm under question)
corresponds to the element of D1 represented by xk1. For each state at level 1, there
can be |D2| number of states at level 2, each representing one element of D2. The
CWA moves from xk1 to state xl
2 at level 2 if the value of parameter I2 corresponds
to the element of D2 represented by xl2. In a similar way the CWA up to level t can
be explained. The CWA moves through states xinitial, xk1, x
l2, · · · , x
nt if value of input
parameter I1 corresponds to state xk1, I2 corresponds to state xl
2, · · · It corresponds to
state xnt . All states at level t are final states. The details regarding transitions of the
CWA are given below.
TH-1076_NHUBBALLI

3.4. Application criticality aware FP minimization 83
A transition τ ∈ = from a state x to another state x+ is an ordered four-tuple τ = 〈x, σ, x+, cr〉
where,
• x is the initial state of the transition, denoted as initial(τ).
• x+ is the final state of the transition, denoted as f inal(τ).
• σ is the input symbol of the transition τ referred to as input(τ). If τ emanates from
a state xkj at level j and terminates at a state xl
j+1 at level j + 1 then σ is the value of
parameter I( j+1) represented by xlj+1.
• cr ∈N is the criticality value of τ.
There is a special type of transition τ = 〈x, λ, x+, 0〉. In this transition λ is the enabling
condition (and emanates from state x). It fires only if value of input parameter does not
satisfy enabling condition of any other transitions emanating from x. Broadly speaking,
〈x, λ, 0, x f inal〉 is a type of “else” transition from x to x+ and has criticality value of 0.
The algorithm below describes the construction of the CWA:
Algorithm 3.2 : Algorithm for constructing the CWA
Input :
(i) Input variables: with their ranges;
I1 : D1 = {i11, i
21 · · · i
k11 }
I2 : D2 = {i12, i
22 · · · i
k22 }
· · ·
It : Dt = {i1t , i
2t · · · i
ktt }
(ii)An order of the input variables 〈I1, I2, · · · It〉
Output: CWA
1: X = {xinitial} /* xinitial is at level 0 and the only state at that level*/
2: X f inal = x f inal /* Initially, set of final states has only one state x f inal */
3: for j = 0; j <= t; j + + do
4: /* All states at level t are final states*/
5: if j == t then
6: ∀x j,X f inal = X f inal ∪ x j.
TH-1076_NHUBBALLI

84 Chapter 3. False positive alarm minimization in signature detection systems
7: Break loop.
8: end if
9: /* for each state from level 0 to t − 1 */
10: for l = 1; l <= k j; l + + do
11: /* values of input variables at the level j */
12: For every state x at level j
13: X = X ∪ xlj+1; /* Add a new state xl
j+1 to X */
14: Add a transition τlj+1 from x to xl
j+1 as 〈x, σlj+1, x
lj+1, crl
j+1〉. σlj+1 = il
j+1; ilj+1 is called
the enabling condition of τlj+1. crl
j+1 is assigned by the system administrator based
on the role of ilj+1 in the network
15: end for
16: end for
17: Add a transition from every state x in (X − X f inal) to x f inal as 〈x, λ, 0, x f inal〉.
CWA construction is illustrated with a simple network example and shown in Figure
3.6. Let there be two machines with IP addresses IP1 and IP2. Also let there be one port
namely 80 open on machine with IP1 and 21 open on machine with IP2. The entity “IP
address” is I1 and “port” is I2. So, range of I1 is {IP1, IP2} and I2 is {80, 21}. Further, let the
ordering of input variables be 〈I1, I2〉. Initial state is marked as xinitial. As the range of I1
comprises 2 elements there are two states at level one x11 (represents IP1) and x2
1 (represents
IP2. Then two transitions are added namely, (i) xinitial to x11 : 〈xinitial, IP1, x1
1, cr11〉 and (ii) xinitial
to x21: 〈xinitial, IP2, x2
1, cr21〉. cr1
1 and cr21 are decided by the system administrator based on role
of IP1 and IP2 in the network under consideration. For example, if IP1 is for a student
machine in an university, cr11 can be given less value compared to cr2
1 if IP2 is running the
university web server.
A similar procedure is repeated from the first level states to reach to the states at level 2.
Taking x11 as the source state a new transition is added which leads to x1
2 i.e 〈x11, 80, x1
2, cr12〉.
Another transition from x21 to x2
2 i.e 〈x21, 21, x2
2, cr22〉 is added. Since in the example only
two input variables are considered, the states at level 2 are marked as final states. Then a
state x f inal is added to X f inal and (“else”) transitions from every non-final states to x f inal are
added.
TH-1076_NHUBBALLI

3.4. Application criticality aware FP minimization 85
Note: From the algorithm, in the worst case there may be an O(k1 · k2 · k3 · · · · kt) number
of states. In a practical scenario, number of states are much less. This is explained using
the example automaton (Figure 3.6). In the example, as the range of I1 and I2 are 2, there
can be 4 states in level 2. However, this is not the case, as only port 80 (21) is open on IP1
(IP2) resulting in only 2 states at the second level.
Whenever an alarm is generated the required entities which form the input to the
automaton are extracted. CWA is traversed with this input, generating a sequence of
transitions. Criticality weights of the corresponding transition sequence is added to
determine the criticality of the application being targeted by the attack. If application
criticality value exceeds a threshold (defined by administrator) then application is critical.
All alarms (for attacks) against a critical application, even if declared as FPs by the neural
network based correlation engine, are to be declared as TPs. On the other hand, for
non-critical application alarms detected as FPs by the correlation engine are dropped.
initalx
11x
21x
22x
12x
finalx
11 1,IP cr
22 1,IP cr
1280,cr
2221,cr
,0λ
,0λ,0λ
Figure 3.6: Example of a CWA
3.4.1 Experimental results
In this section results are reported for criticality aware FP minimization scheme on the
dataset shared by Massicotte et al. [93]1.
1The testbed (used in Subsection 3.3.4) has a few number of applications, thereby differentiation themas critical and noncritical is difficult. So results are not reported for the dataset generated in the testbed.
TH-1076_NHUBBALLI

86 Chapter 3. False positive alarm minimization in signature detection systems
3.4.2 Accuracy and Detection Rate of critical and non-critical applications
As described earlier criticality assessment of the alarms is the second stage of analysis
and is done on the alarms which are labeled as non-effective attack alarms (or FP) by
the correlation engine. For modeling criticality of applications, CWA is used which is
obtained by some parameters generated with the alarms. In the present experiment, three
parameters namely IP address, protocol type and port number are used to define the
criticality of the applications; these three parameters are input variables for the CWA. 3
hosts (IP addresses) are marked as critical and an order is made arbitrarily. The criticality
weight range of “IP address” parameter is taken from 70 to 100; IP address of the most
critical host is assigned a weight of 100, the next critical one is assigned a weight of 90
and least critical one is assigned weight of 70. All the “protocol type” (and “port type”)
in the critical hosts are assumed equally critical and assigned weights of 60 (and 50). IP
addresses of all other non-critical hosts are assigned a weight of 40. Similarly, the “protocol
type” (and “port type”) in the non-critical hosts are assigned weights of 30 (and 20). The
weights are given in order of importance of the parameters in defining the threat profile
of the network. For example, IP address has the highest weight among other parameters
because it defines the host against which the attack is launched. It is assumed in the
present experiment that all applications of a critical host are critical. So resource criticality
threshold is the sum of the lower values of the range of weights of the three parameters
assigned to critical applications; in the present case threshold is 180 (=70+60+50).
Weights of all alarms (in terms of these three parameters) are computed by traversing
the CWA. Based on the threshold, alarms for critical applications and non-critical ones are
differentiated. So Table 3.8 is split into two as, Table 3.9 is for critical cases and Table 3.10
is for non-critical cases.
TH-1076_NHUBBALLI

3.4. Application criticality aware FP minimization 87
Tabl
e3.
9:A
ccur
acy
and
Det
ectio
nR
ate
afte
rco
rrel
atio
n–cr
itic
alap
plic
atio
ns
Cla
ssTe
stin
gN
on-E
FFEF
FN
on-E
FFA
AEF
FA
AT
PFP
FNA
ccD
et.
Ala
rms
AA
AA
CE
CE
CE
CE
CE
Rat
eFT
P15
105
105
32
260
%60
%II
SW
ebse
rver
84
45
33
01
100%
75%
Net
bios
1811
713
54
13
80%
57.1
4%
TH-1076_NHUBBALLI

88 Chapter 3. False positive alarm minimization in signature detection systems
Tabl
e3.
10:A
ccur
acy
and
Det
ectio
nR
ate
afte
rco
rrel
atio
n–no
n-cr
itic
alap
plic
atio
ns
Cla
ssTe
stin
gN
on-E
FFEF
FN
on-E
FFA
AEF
FA
AT
PFP
FNA
ccD
et.
Ala
rms
AA
AA
CE
CE
CE
CE
CE
Rat
eFT
P87
4986
4710
286
5297
934
995
.87%
91.1
7%II
SW
ebse
rver
2176
2092
8421
0076
733
1196
.05%
86.9
0%N
etbi
os38
4637
2312
337
3611
010
64
1796
.36%
86.1
7%
TH-1076_NHUBBALLI

3.4. Application criticality aware FP minimization 89
From Table 3.9 it may be noted that Detection Rate is lower than 100%, implying detec-
tion of some attacks being missed even for critical applications.
Now change in Detection Rate and Accuracy for critical and non-critical applications are
computed when alarms dropped by correlation engine are reevaluated using the CWA.
Table 3.11 reports the Accuracy and Detection Rate after the criticality reassessment is done
using CWA for critical resources. It may be noted from Column 5 and Column 6 of Table
3.11 that all the alarms determined as non-effective attack alarms by the correlation engine
(column 5 of Table 3.9) are now made effective attack alarms as they are for the critical
applications. As all alarms (for critical applications) are passed, so the number of TPs is
same as the number of effective attack alarms labeled by the dataset [93] (i.e., Column 4
and Column 7 of Table 3.11 have same values). So, FNs are zero making Detection Rate to
100%. In the process of passing all alarms generated by Snort (including ones marked as
FP by correlation engine) Accuracy falls. In case of critical applications this fall in Accuracy
may be acceptable to some extent.
It may be noted that for non-critical applications, Detection Rate and Accuracy remain
same even after reevaluating using the CWA because if an alarm is marked as non-effective
attack alarm by the correlation engine, it is dropped. In other words, reevaluating using
the CWA does not change the non-effective attack alarms marked by correlation engine
(Column 5 of Table 3.10) to effective ones for non-critical applications.
In Table 3.12 overall Accuracy and Detection Rate, taken both the critical and non-critical
applications, after reevaluating using the CWA is given. The entries of Column 2 through
Column 9 in the table are obtained by adding the corresponding entries in Table 3.10 and
Table 3.11. Finally, overall Detection Rate and Accuracy are computed using the overall
TPs, FPs and FNs. It may be noted that overall Accuracy is acceptable even after achieving
100% Detection Rate for critical resources. In other words, effective alarm generation has
been achieved for signature detection system using the proposed FP filter augmented
with application criticality factor.
TH-1076_NHUBBALLI

90 Chapter 3. False positive alarm minimization in signature detection systems
Tabl
e3.
11:A
ccur
acy
and
Det
ectio
nR
ate
afte
rC
WA
–cri
tica
lapp
licat
ions
Cla
ssTe
stin
gN
on-E
EFEF
FN
on-E
FFA
AEF
FA
AT
PFP
FNA
ccD
et.
Ala
rms
AA
AA
CE+
CW
AC
E+C
WA
CE+
CW
AC
E+C
WA
CE+
CW
AR
ate
FTP
1510
50
155
100
33.3
3%10
0%II
S8
44
08
44
050
.00%
100%
Web
serv
erN
etbi
os18
117
018
711
038
.88%
100%
TH-1076_NHUBBALLI

3.4. Application criticality aware FP minimization 91
Tabl
e3.
12:O
vera
llA
ccur
acy
and
Det
ectio
nR
ate
afte
rC
WA
Cla
ssTe
stin
gN
on-E
FFEF
FN
on-E
FFA
AEF
FA
AT
PFP
FNA
ccD
et.
Ala
rms
AA
AA
CE+
CW
AC
E+C
WA
CE+
CW
AC
E+C
WA
CE+
CW
AR
ate
FTP
8764
8657
107
8652
112
9814
987
.50%
91.1
5%II
S21
8420
9688
2100
8477
711
91.6
6%87
.5%
Web
serv
erN
etbi
os38
6437
3413
037
3612
811
315
1788
.28%
86.9
2%
TH-1076_NHUBBALLI

92 Chapter 3. False positive alarm minimization in signature detection systems
3.5 Conclusions
Most of the alarms generated by signature detection systems are FPs. The chapter pre-
sented a FP minimization scheme based on correlation of alarms with threat profile
using Neural network. The technique improved Accuracy but also resulted in fall of
Detection Rate. This compromise in Detection Rate is not tolerable for critical applications
as some attacks may go undetected. To avoid missing of attacks for critical applica-
tions, the proposed FP minimization scheme is enhanced by incorporating an application
criticality factor. Experimental results illustrated near 100% Detection Rate for critical ap-
plications and overall Accuracy is maintained at about 90%, thereby by achieving the target
of effective alarm generation for signature detection systems. The next chapter deals with
an event detection system for known attacks for which signature cannot be generated.
TH-1076_NHUBBALLI

Chapter 4
Event detection system for ARP attacks
4.1 Introduction
There are certain classes of known attacks which do not modify the syntax of network
traffic but change the intended communication between end parties. These attacks do not
have any specific patterns for signature generation and signature detection systems fail
to detect them. Examples of such attacks are Address Resolution Protocol (ARP) attacks
[75] (e.g., ARP request spoofing and ARP response spoofing), Internet Control Message
Protocol (ICMP) attacks using error (e.g., host unreachable) and informational (e.g., ICMP
redirect) messages [19] etc. The working of these attacks are discussed below.
Computers in the Internet are identified by their IP addresses. At the data link layer,
computers use another address known as MAC address or hardware address. To deliver a
packet to a correct host, IP address has to be mapped to some MAC address. This binding
between the MAC address and IP address is done by ARP. In ARP spoofing attacks, a
false MAC address is associated with an IP address by the attacker (in an ARP message
packet) and sent to a host. As ARP is a stateless protocol, ARP cache of the host (to which
the spoofed ARP packet is sent) updates itself with the false IP-MAC pair. This leads to
all traffic being sent to host having the IP address under consideration to be sent to host
having the spoofed MAC address.
Internet Protocol (IP) is the primary protocol in network layer of the TCP/IP protocol
suite and has the task of delivering packets from source host to destination host solely
based on their network addresses. Lack of reliability in this protocol allows many faults
TH-1076_NHUBBALLI

94 Chapter 4. Event detection system for ARP attacks
to occur like data corruption, packet duplication, out of order delivery etc. So, some
mechanism is needed to control and notify the errors in the network layer. This is
facilitated by ICMP [108] which implements various error-reporting, feedback and testing
capabilities. ICMP messages can be classified into two categories depending upon their
operation– (i) error messages and (ii) informational messages. Error messages are used
to report different kinds of errors generated in the delivery of packets. Informational
messages are used for diagnostics and testing. “Host unreachable” error message is
generated by boundary gateway or router when a datagram is received which cannot be
delivered or forwarded to destination host. For example, when a host tries to ping an
unallocated IP address in another subnet, the router (corresponding to the subnet) sends
back a “host unreachable” message to the requesting host. An attacker can compromise
the router and send a spoofed “host unreachable” message. In other words, an attacker
can send fake “host unreachable” messages to all incoming requests to a host and make it
unavailable (i.e., Denial of Service (DoS)). “ICMP redirect” message is used by routers to
notify hosts about a better route being available to reach a particular destination. “ICMP
redirect” messages can be used by the attackers to cause false re-routing of packets. For
example, an attacker can send “ICMP redirect” messages to hosts in a subnet to request
them to change their routing tables thereby setting up a false route to destination. This
may lead to a Man-in-The-Middle (MiTM) attack.
From the discussion above it may be noted that spoofed packets of both ARP and ICMP
look similar to the corresponding packets generated under normal conditions. In other
words, ARP and ICMP related attacks do not change the syntax and sequence of network
packets. However, intended behavior of network communication changes. As discussed
in Chapter 2 Subsection 2.2.2, custom made techniques are used to detect such (ARP)
attacks. These attacks can be detected by keeping track of sequence of network packets
(also called events). This generic concept of observing events to detect attacks is used in
HIDS [118, 130, 137], where system calls are considered as events and then by observing
their sequence, the condition of the host is estimated; these event based IDSs are called
event detection systems. Event detection system is basically an event or state estimator
which observes sequences of events generated by the network to decide whether the states
through which the system traverses correspond to the normal or compromised condition.
To the best of our knowledge, event detection techniques have not been used at network
TH-1076_NHUBBALLI

4.1. Introduction 95
level. However, there are many instances of known attacks at network level for which
signatures cannot be generated but can be detected based on differences in sequence of
packets. So, for effective alarm generation for such known attacks, event detection system
is a promising technique.
This chapter proposes an event detection system for ARP spoofing attacks. The scheme
is designed by suitability extending the concept of “difference in sequence of events” used
in HIDS for network attacks. In this work, the basic framework of Failure Detection and
Diagnosis (FDD) of Discrete Event System (DES) has been suitably adapted to develop the
event detection system. A DES is characterized by a discrete state space and some event
driven dynamics. DES have widely been used for FDD of large systems like chemical
reaction chambers, nuclear reactors etc. [42]. The basic idea is to develop a DES model
for the system under normal condition and also under each of the failure conditions.
Following that, a state estimator called diagnoser (or detector, if only detection of failure
is required) is designed which observes sequences of events generated by the system to
decide whether the states through which the system traverses correspond to the normal
or faulty DES model1. The basic idea of the diagnoser is similar to that of the IDS used for
host based attacks [118, 130, 137].
The contributions of this chapter are as follows.
• A DES based event detection system for detecting ARP attacks is proposed. Use
of FDD of DES for detecting ARP attacks (i.e., network attacks) requires certain
extensions over the (classical) theory [42] (which is used in [118, 130, 137] for host
attacks). The extensions are as follows.
– In the case of ARP, the DES framework needs to model not only sequences
of events but also their time of occurrences. So the DES model used in the
proposed technique extends the un-timed model with time information.
– Unlike host based IDS, in case of spoofing (in ARP attacks) there is no difference
in sequence of ARP events compared to normal conditions. To handle this
situation, an active probing mechanism is used so that sequences of ARP packets
can be differentiated under spoofing and normal conditions. It may be noted
that probing technique maintains the standard ARP behavior.
1A more detailed discussion on FDD of DES is provided in Appendix A
TH-1076_NHUBBALLI

96 Chapter 4. Event detection system for ARP attacks
The proposed event detection system has the following features, which are desir-
able in any ARP attack preventation/detection scheme (as discussed in Chapter 2
Subsection 2.2.2).
– The proposed ARP attack detection scheme has two basic components– (i)
DES detector and (ii) active prober. DES detector analyzes ARP requests and
responses. Active prober sends probe requests to hosts using ARP request
packets. So the proposed scheme maintains the standard ARP and does not
violate the principles of network layering structure.
– The extra ARP traffic generated by the scheme is low. Active ARP probes
generate extra traffic in the network. To minimize additional traffic, IP-MAC
pairs corresponding to normal and spoofed conditions, already decided, are
recorded in tables. Following that, ARP probes are sent only to IP-MAC pairs
which are absent in the tables.
– The event detection system is installed in just one host which can receive all
packets of the network being monitored (by port mirroring). So installation of
extra softwares or patching in all hosts of the network being monitored is not
required.
– The only hardware requirement of the event detection system is a switch with
port mirroring facility.
– The system detects a large set of ARP related attacks namely, malformed pack-
ets, response spoofing, request spoofing, man-in-the-middle and denial of ser-
vice.
Rest of the chapter is organized as follows. In Section 4.2 background of ARP and
various attacks based on the protocol are discussed. Also, relevant literature for detecting
ARP related attacks is reported in the same section. Section 4.3 presents the proposed
approach of detecting ARP attacks using a DES based event detection system. Section
4.4 deals with implementation of the proposed scheme and comparison with similar
approaches reported in the literature. Finally the chapter is concluded in Section 4.5.
TH-1076_NHUBBALLI

4.2. Related work 97
0 8 16 32
Hardware Type Protocol Type
HLen PLen Operation
Source Hardware Address (Bytes 0-3)
Source Hardware Address (Bytes 4-5) Source Protocol Address (Bytes 0-1)
Source Protocol Address (Bytes 2-3) Target Hardware Address (Bytes 0-1)
Target Hardware Address (Bytes 2-5)
Target Protocol Address (Bytes 0-3)
Figure 4.1: ARP packet format
4.2 Related work
In this section, background of the working of ARP and attacks related to the protocol (pre-
sented briefly in Subsection 2.2.2 of Chapter 2) are elaborated. For the sake of readability
a brief summary of various techniques for detecting ARP related attacks (discussed in
Subsection 2.2.2 of Chapter 2) is also reported in this section.
4.2.1 Address Resolution Protocol
ARP packet format is shown in Figure 4.1.
Various fields of an ARP packet are explained as follows.
• Hardware type: This field in the packet specifies the type of hardware used for the
local network transmitting the ARP message. The value for Ethernet is 1.
• Protocol type: Each protocol is assigned a number. IPv4 is 2048 (0x0800).
• Hardware address length (HLen): HLen field in the packet specifies the length of
hardware (MAC) address in bytes. MAC addresses are 6 bytes long.
• Protocol address length (PLen): PLen field specifies the length of logical address in
bytes. IPv4 addresses are 4 bytes long.
TH-1076_NHUBBALLI

98 Chapter 4. Event detection system for ARP attacks
• Opcode: Opcode field specifies the nature of the ARP message; 1 for ARP request
and 2 for ARP response.
• Sender hardware address: Sender hardware address specifies the MAC address of
the host sending the ARP packet.
• Sender protocol address: This is the IP address of the host sending the ARP packet.
• Target hardware address: This field specifies the MAC address of the intended
receiver. This field is “ff:ff:ff:ff:ff:ff” in case of ARP requests (which are broadcasts).
• Target protocol address: Target protocol address is the IP address of the intended
receiver.
The steps of ARP are discussed below using an example of a LAN having hosts A and B,
where A wants to communicate with B. IP address of A is IP(A) and IP address of B is
IP(B). Similarly, MAC address of A is MAC(A) and MAC address of B is MAC(B).
• Step 1: A searches its own ARP cache to find if there is an entry for MAC address of
B. If the entry is present, it will use the MAC address for communication.
• Step 2: If entry for MAC address of B is not found in A’s cache, it will generate an
ARP request message. The message packet will have the following values in the
fields.
– Hardware type= 1.
– Protocol type=0x0800.
– HLen=6.
– PLen=4.
– Opcode=1.
– Sender hardware address=MAC(A).
– Sender protocol address=IP(A).
– Target hardware address= ff:ff:ff:ff:ff:ff
– Target protocol address=IP(B)
TH-1076_NHUBBALLI

4.2. Related work 99
This packet is broadcast in the local network.
This ARP request conversation viewed in tcpdump (an utility for watching network
packets) is as follows
MAC(A) f f : f f : f f : f f : f f : f f : 42 : arp who − has IP(B) tell IP(A).
• Step 3: The ARP request packet being broadcast, it is received by all hosts (in the
LAN) including B. Each host compares the target protocol address (i.e., IP(B) in this
example) of the packet with its own IP address. All hosts except B will drop the
packet because the target protocol address will match only with IP(B). B updates is
cache with IP(A)-MAC(A).
• Step 4: B generates an ARP response message for A containing its MAC address.
The ARP response message packet will have the following values in the fields.
– Hardware type= 1.
– Protocol type=0x0800.
– HLen=6.
– PLen=4.
– Opcode=2.
– Sender hardware address=MAC(B).
– Sender protocol address=IP(B).
– Target hardware address=MAC(A)
– Target protocol address=IP(A)
Values of the target hardware address field and the target protocol address field of
the response packet are taken from the source hardware address field and the source
protocol address field, respectively of the request packet.
This ARP response packet as viewed in tcpdump is given below
MAC(B) MAC(A) : arp reply IP(B) is − at MAC(B).
The packet is sent as unicast response to A.
• Step 5: A will process the ARP response from B and update its ARP cache with
MAC(B). Now A can communicate with B.
TH-1076_NHUBBALLI

100 Chapter 4. Event detection system for ARP attacks
Along with requests and responses, ARP also has gratuitous ARP requests. A gratuitous
ARP request is an ARP request packet where source protocol address and destination
protocol address are assigned same value as that of the IP address of the host generating
the packet. The target hardware address is broadcast address ff:ff:ff:ff:ff:ff.
Gratuitous ARP requests are useful for the following reasons.
• They can detect IP conflicts.
• They can update all hosts in a LAN about MAC address of a new host or change
in MAC address of an existing host (due to change of NIC card) without ARP
request-response sequence.
4.2.2 ARP based attacks
The problem with ARP protocol is that, it is stateless. Any host after receiving an ARP
message will update its cache without verifying its genuineness. This statelessness is
the major security loophole in the protocol. This enables malicious hosts to craft custom
ARP packets with forged IP-MAC pairs, which leads to many ARP related attacks; these
attacks are discussed below. The example which is used to illustrate working of ARP is
modified slightly to discuss the ARP related attacks. In the modified example, along with
two genuine hosts A and B, there is an attacker host D (with IP address as IP(D) and MAC
address as MAC(D)).
4.2.2.1 ARP request spoofing
In ARP request spoofing attack, an attacker sends (by broadcast) an ARP request packet
with falsified IP-MAC pair (in sender hardware address-sender protocol address fields).
The host with IP address given in the “target protocol address” field of the request packet
updates its cache with wrong IP-MAC pairing. For example, if attacker D sends a forged
ARP request packet with target protocol address as IP(A) and sender hardware address-
sender protocol address as IP(B)-MAC(D), then A’s cache will have MAC address of D
corresponding to IP address of B. This will result in packets intended to be sent to B (by
A) being sent to D. On the other hand if D sends a forged ARP response packet with
IP(B)-MAC(X) (where MAC(X) is non existent) then all packets intended to be sent to B
(by A) will be lost.
TH-1076_NHUBBALLI

4.2. Related work 101
4.2.2.2 ARP response spoofing
ARP response spoofing is similar to ARP request spoofing. However, in the case of
response spoofing, ARP response packet is used. In this attack, an attacker sends an
ARP response (unicast) packet with falsified IP-MAC pair to a host and it blindly updates
its cache with wrong IP-MAC pairing. For example if, attacker D sends a forged ARP
response packet to A with IP(B)-MAC(D) (in sender hardware address-sender protocol
address filed), then A’s cache will have MAC address of D corresponding to IP address of
B. ARP spoofing is the basic attack which acts as a gateway for many other ARP attacks
like man-in-the-middle.
4.2.2.3 ARP man-in-the-middle attack
ARP request/response spoofing may lead to man-in-the-middle attack. In this case, the
attacker is positioned between two communicating hosts and sniffs all the packets being
transferred between them. In man-in-the-middle attack, the attacker sends falsified IP-
MAC pairs to the (two) communicating hosts being targeted. When one host sends
a packet to the second, it gets diverted to the attacker (as explained for ARP request
spoofing). The attacker reads the packets and forwards them to the second host. Similarly,
when the second host communicates with the first, all packets are routed through the
attacker. As the attacker forwards the packets (after reading) to the original destinations,
its presence is not felt. For example, to launch man-in-the-middle attack between A and
B, attacker D sends two spoofed ARP replies as follows.
• IP(B)-MAC(D) to A. This will lead to all packets being sent from A reach D. D will
forward the packets to B.
• IP(A)-MAC(D) to B. This will lead to all packets being sent from B reach D. D will
forward the packets to A.
Once man-in-the-middle attack is launched between hosts, sniffing and session hijacking
may easily be performed in the LAN. Session hijacking enables an attacker to take control
of a connection between two computers. For instance, an attacker can take control of a
telnet session after a target computer has logged into a remote computer as administrator.
TH-1076_NHUBBALLI

102 Chapter 4. Event detection system for ARP attacks
4.2.2.4 ARP denial of service
In this attack, attacker fabricates a large number of spoofed ARP responses and sends to
the host being targeted within a small time interval. A denial of service attack occurs in a
host because it becomes busy in processing the responses thereby making it unavailable
for catering to other normal activities.
4.2.3 Techniques to detect ARP attacks
There are some solutions proposed in the literature to detect, mitigate and prevent ARP
related attacks. These solutions and their merits/demerits are briefly reported in this
subsection.
• Static IP-MAC pairing [74]: In this scheme each host is manually assigned a MAC
address and these static IP-MAC pairings are maintained in ARP caches of all the
hosts. This is the most foolproof way to prevent ARP attacks. However, this scheme
is not acceptable in a dynamic environment.
• Enabling port security features in switch [6]: Security features are available in high
end switches which tie a physical port to a MAC address. A change in transmitter’s
MAC address can result in port shutdown or ignoring the change. The scheme
works fine only if the first packet received by the switch has correct IP-MAC pairing.
Further, any genuine change in IP-MAC pair will be discarded (e.g., gratuitous
request).
• Software security [3, 8]: The basic notion of security features in switches (involving
observation of changes in IP-MAC pairs) can be implemented in software solutions
also. These software solutions are cheaper than switches with port security. How-
ever, they also suffer from the same drawbacks as that of port security in switches.
• Cryptographic techniques [26, 57, 85]: Cryptographic techniques can be used to
authenticate ARP requests and responses. Cryptographic techniques increase com-
putation overhead and violate the standard ARP.
TH-1076_NHUBBALLI

4.3. Proposed scheme: event detection system for ARP attacks 103
4.3 Proposed scheme: event detection system for ARP at-
tacks
In this section the proposed DES based event detection system for ARP related attacks is
presented.
Following assumptions are made regarding the LAN in which the system operates.
• Non-compromised hosts will send one response to an ARP request within a specific
interval Treq (which is the round trip delay in the LAN).
• Event detection system is running on a dedicated and trusted host with a fixed IP
address.
• Port mirroring is enabled at the switch so that event detection system has a copy of
all outgoing and incoming packets from all ports.
In the next subsection the probing technique is discussed. Following that an example
is given to motivate the requirement of probing to generate different sequences of ARP
packets under normal and attack scenarios.
4.3.1 Active probing technique
The event detection system works at network level and one host in the LAN is configured
as IDS, where all algorithms and data tables (to be discussed in this section) are maintained.
The details of the LAN architecture will explained using an example in Section 4.3.2.
Upon receiving ARP requests or ARP responses, ARP probes are sent to the source IP
address of the request or response packet. Before sending the probes it is checked that the
source IP-MAC pair is not yet verified by the detector to be genuine or spoofed1. Details
of such verified IP-MAC pairs are recorded in tables, discussed below. Henceforth in the
discussion, the following short notations are used:
IPS - source IP address; IPD - destination IP address; MACS - source MAC address; MACD
- destination MAC address; RQP - ARP request packet; RSP - ARP response packet.
Source IP address of RQP is denoted as RQPIPS; similar subscripting will be used to denote
destination IP, source MAC address and destination MAC address for RQP and RSP.1The technique to determine if an IP-MAC pair is genuine or spoofed is detailed in Subsection 4.3.4
TH-1076_NHUBBALLI

104 Chapter 4. Event detection system for ARP attacks
1. Every time an ARP request is verified as genuine an entry is made in the Authen-
ticated table, denoted as AUTHT. It has five fields, source IP address AUTHTIPS,
source MAC address AUTHTMACS, destination IP address AUTHTIPD, destination
MAC address AUTHTMACD and time when the request packet is received by event
detection system AUTHTTi.
2. For spoofed requests the details are entered in another table called the Spoofed
table (denoted as SPOOFT) which has same fields as the Authenticated table namely
source IP address SPOOFTIPS, source MAC address SPOOFTMACS, destination IP
address SPOOFTIPD, destination MAC address SPOOFTMACD and time when the
request packet is received by event detection system SPOOFTTi .
3. Every time an ARP response is verified to be genuine (spoofed) an entry is made in
the Authenticated (Spoofed) table.
4. In the case of ARP requests only four out of five fields in the tables can be filled;
MACD left as “ − −” as no destination MAC address is associated with requests.
However, in the case of responses all five fields are filled with appropriate values.
〈TableName〉MAX represents the maximum number of elements in a table at a given
time.
These tables not only help in minimizing the number of ARP probes but will also be
used for determining if spoofing has led to other attacks like man-in-the-middle, denial
of service etc.
The detection technique has two main modules namely, ARP REQUEST-HANDLER()
and ARP RESPONSE-HANDLER(). These are elaborated in Algorithm 4.1 and Algorithm
4.2, respectively. In the algorithms the term “IDS” refers to the event detection system.
Algorithm 4.1 processes ARP request packets in the network. For any ARP request packet
RQP, it first verifies whether the RQP is malformed (i.e., any changes in the immutable
fields of the ARP packet header or different MAC addresses in the MAC and ARP header
field) or unicast. These cases are abnormal and a decision can be made on observation
of any such (single) packet, unlike sequences of ARP packets in the case of spoofing.
Detection of such abnormal cases is trivial and it is not considered in DES modeling
and attack detection. Algorithm 4.1 simply exits (by setting a status flag) on such ARP
TH-1076_NHUBBALLI

4.3. Proposed scheme: event detection system for ARP attacks 105
request packets. If the packet is not unicast or malformed, but a request packet from event
detection system i.e., RQPIPS is IP address of event detection system and RQPMACS is MAC
address of event detection system, Algorithm 4.1 skips processing of this packet; it is not
required to send ARP probes to requests, from the event detection system as it is assumed
that IP-MAC pairing of the event detection system is known and validated. If none of the
above cases are matched, then RQPIPS is searched in the Authenticated table. If a match
is found as AUTHTIPS[i] and the corresponding source MAC address AUTHTMACS[i] in
the table is the same as RQPMACS, the packet has a genuine IP-MAC pair which is already
determined by the detector. This genuineness is obtained without explicit use of the DES
detector. Also, ARP probes are not sent in this case thereby saving some ARP traffic.
RQPIPS, RQPMACS, RQPIPD, −− and time of receipt are stored in the Authenticated table.
In the case of a match in the source IP address and mismatch in the source MAC address
(i.e., RQPIPS = AUTHTIPS[i] and RQPMACS , AUTHTMACS[i]) the packet is detected to be
spoofed without explicit use of the DES detector and no ARP probes are sent. The details
of the RQP are stored in the Spoofed table. On the other hand if RQPIPS is not found in
AUTHT (in field AUTHTIPS), then both RQPIPS and RQPMACS are searched in SPOOFT
(i.e., RQPIPS = SPOOFTIPS[i] and RQPMACS = SPOOFTMACS[i]). If a match is found then it
implies that the IP-MAC pair is already detected to be spoofed. No ARP probes are sent
and details of the request packet are added in the SPOOFT. If both the above cases are not
satisfied then an ARP probe request is sent (broadcast) by Algorithm 4.1 requesting the
MAC for the source IP address RQPIPS. In another case i.e., gratuitous ARP requests, ARP
probe is sent. Gratuitous ARP requests are broadcast (e.g., entry of a new host or change
in NIC card) to inform other hosts in the LAN about its IP-MAC pair. Gratuitous ARP
requests can be determined if RQPIPS = RQPIPD. For such gratuitous request, ARP probe
is sent to the RQPIPS without verifying in the tables because such requests are made when
a host with a “new IP-MAC pair” comes up which needs to be verified by the detector
afresh.
As already discussed, any DES model has states, and transitions are made among
states on occurrence of some (discrete) events. These events are modeled based on certain
changes in the system. For example, in a chemical reaction chamber, temperature mov-
ing above threshold can be modeled as an event which leads to change in state to make
heater off [42]. Sensors are kept in the system to measure such changes, e.g., a thermo-
TH-1076_NHUBBALLI

106 Chapter 4. Event detection system for ARP attacks
couple/temperature sensor in case of the chemical chamber. In this case, the following
changes in the LAN are considered as events: receipt of RQP, sending of ARP probe
request (PRQP), receipt of ARP probe response (PRSP), receipt of response (other than for
ARP probe) RSP. These requests and responses with their respective fields (e.g., source IP
address of RSP) are considered as measured events of the DES model. In addition, when
Algorithm 4.1 decides some IP-MAC pair to be geniune/spoofed using Authenticated
table/Spoofed table, it intimates the same; this is captured by event “detected (DTD)”.
Algorithm 4.1 is first illustrated using a flow chart in Figure 4.2 and formalized subse-
quently.
Algorithm 4.1 : ARP REQUEST HANDLER
Input : RQP - ARP request packet
Output: Intimate receipt of RQP, sending of ARP probe request and detected DTD,
Updated AUTHT and SPOOFT
IF(RQP is mal f ormed) OR (RQP is Unicast) “Status is abnormal” and EXIT
IF(RQPIPS = IP(IDS)) AND (RQPMACS =MAC(IDS)) EXIT
IF(RQPIPS =AUTHTIPS[i] AND RQPMACS = AUTHTMACS[i], for some i, 1 ≤ i ≤ AUTHTMAX)
“Status is Genuine”; add {RQPIPS, RQPMACS, RQPIPD, −−, time of receipt} in AUTHT;
Intimate DTD; EXIT
IF(RQPIPS=AUTHTIPS[i], for some i, 1 ≤ i ≤ AUTHTMAX) AND (RQPMACS! = AUTHTMACS[i])
“Status is Spoofed”; add {RQPIPS, RQPMACS, RQPIPD, −−, time of receipt} in SPOOFT;
Intimate DTD; EXIT
IF(RQPIPS =SPOOFTIPS[i] and RQPMACS =SPOOFTMACS[i], for some i, 1 ≤ i ≤ SPOOFTMAX)
“Status is Spoofed”; add {RQPIPS, RQPMACS, RQPIPD, −−, time of receipt} in SPOOFT;
Intimate DTD; EXIT
ELSE(/* Gratuitous i.e., RQPIPS == RQPIPD or none of the above conditions */)
Intimate receipt of RQP; Send ARP Probe Request PRQP to RQPIPS from IDS;
Intimate sending of the ARP probe request PRQP;
Algorithm 4.2 is the ARP RESPONSE HANDLER. For any ARP response packet RSP,
the algorithm first verifies if the packet is malformed and sets the status accordingly and
TH-1076_NHUBBALLI

4.3. Proposed scheme: event detection system for ARP attacks 107
Start RQ
Pis
Malf
ormed
/Un
icast
YES
Is So
urce
IP-
MAC
ofRQ
P is
ofID
SNO YES
Is so
urce
IP of
RQP i
n Auth
entic
ated
Table
NOIs
corre
spond
ing M
ACin
Authe
nticat
ed Ta
blesam
e as s
ource
MAC
ofRQ
P
NO
YES
Is so
urce
IP of
RQP
in Sp
oofed
Table
NO
YES
YES
NO
STAT
US =
Malf
ormed
/Unic
ast
Exit
STAT
US =
Spoo
fed
Stor
eRQ
P in
Spoo
fed Ta
ble
Eve
nt---R
eceive
dRQ
P;DT
D
STAT
US =
Genu
ine
Stor
eRQ
P in
Authe
nticat
ed Ta
ble
Even
t---R
eceive
dRQ
P;DT
D
Verif
yIP-
MAC
Pair
E
vent
--Rece
ived
RQP
Se
nd Pr
obe R
eque
st to
sourc
eIP
ofRQ
P
Even
t --Se
nt Pro
be R
eque
st
Is co
rrespo
nding
MAC
in Sp
oofed
Table
same
as so
urce M
AC of
RQP
YES
Exit
Exit
Exit
NO
Exit
Figure 4.2: Flow chart for ARP REQUEST-HANDLER()
TH-1076_NHUBBALLI

108 Chapter 4. Event detection system for ARP attacks
exits. Next, it verifies whether the response packet is for any ARP probe (sent by the
event detection system). The response for an ARP probe can be determined if RSPIPD is
IP address of event detection system and RSPMACD is MAC address of event detection
system. For these packets no probe is sent and the algorithm intimates the receipt of
these response packets (PRSP). If the response is not malformed or response to an ARP
probe, the event detection system sends an ARP probe request (broadcast) to the source IP
address RSPIPS requesting its MAC. Before sending the probe, Algorithm 4.2 does a check
in the Authenticated table and Spoofed table, similar to the one discussed in Algorithm
4.1.
Algorithm 4.2 is first illustrated using a flow chart in Figure 4.3 and formalized subse-
quently.
Algorithm 4.2 : ARP RESPONSE HANDLER
Input : RSP - ARP response packet
Output: Intimate receipt of RSP, ARP probe response PRSP, sending of ARP probe
request PRQP and detected DTD, Updated AUTHT and SPOOFT
IF(RSP is mal f ormed) “Status is abnormal” and EXIT
IF(RSPIPD = IP(IDS)) AND (RSPMACD =MAC(IDS)) Intimate receipt of PRSP; EXIT
IF(RSPIPS =AUTHIPS[i] AND RSPMACS = AUTHMACS[i], for some i, 1 ≤ i ≤ AUTHTMAX)
“Status is Genuine”; add {RSPIPS, RSPMACS, RSPIPD, RSPMACD, time of receipt} in
AUTHT; Intimate DTD; EXIT
IF(RQPIPS =AUTHIPS[i], for some i, 1 ≤ i ≤ AUTHMAX) AND (RQPMACS! = AUTHMACS[i])
“Status is Spoofed”; add {RSPIPS, RSPMACS, RSPIPD, RSPMACD and time of receipt} in
SPOOFT; Intimate DTD; EXIT
IF(RQPIPS =SPOOFTIPS[i] and RQPMACS =SPOOFTMACS[i], for some i, 1 ≤ i ≤ SPOOFTMAX)
“Status is Spoofed”; add {RSPIPS, RSPMACS, RSPIPD, RSPMACD, time of receipt}
in SPOOFT; Intimate DTD; EXIT
ELSE(/* Gratuitous i.e., RSPIPS == RSPIPD or none of the above conditions */)
Intimate receipt of RSP; Send ARP Probe Request PRQP to RSPIPS from event
detection system; Intimate sending of the ARP probe request PRQP;
TH-1076_NHUBBALLI

4.3. Proposed scheme: event detection system for ARP attacks 109
Start RS
Pis
Malfo
rmed
YES
Is de
stina
tion
IP-
MAC
ofRS
P is
ofID
SNO YES
Is so
urce
IP of
RSP
in Au
thenti
cated
Table
NOIs
corre
spond
ing M
AC in
Authe
nticat
ed Ta
ble sa
meas
sourc
e MAC
ofRS
P
NO
YES
Is so
urce
IP of
RSP
in Sp
oofed
Table NO
YES
YES
NO
STAT
US =
Malfo
rmed
STAT
US =
Spoo
fed
Stor
eRS
P in
Spoo
fed Ta
ble
Eve
nt---R
eceive
dRS
P;DT
D
STAT
US =
Genu
ine
Stor
eRS
P in
Authe
nticat
ed Ta
ble
Ev
ent--
-Rece
ived
RSP;
DTD
Verif
yIP-
MAC
Pair
Even
t--Re
ceive
dRS
P
Send
Prob
e Req
uest
to so
urce
IP of
RSP
Even
t --S
ent P
robe
Req
uest
Is co
rrespo
nding
MAC
in Sp
oofed
Table
same
as so
urce M
AC of
RSP
YES
Exit
Exit
Exit
NO
Eve
nt --R
eceive
d Prob
e Resp
onse
Exit
Figure 4.3: Flow chart for ARP RESPONSE-HANDLER()
TH-1076_NHUBBALLI

110 Chapter 4. Event detection system for ARP attacks
4.3.2 Examples of ARP request and response spoofing
In this subsection two example scenarios are discussed to illustrate ARP request and
response spoofing.
4.3.2.1 Request spoofing
In this subsection an example is used to illustrate handling of spoofed request packets
by Algorithm 4.1. Further, this example also highlights the difference in ARP packet
sequences (after active probing) in the case of spoofing versus normal scenarios. The
network used in the example has four hosts A, B, D and E; E is the event detection
system and D is the attacker. Port mirroring is enabled at the switch so that E has a copy
of all outgoing and incoming packets from all ports. Also, E has a network interface
solely to send ARP probes and receive ARP probe responses. The hosts A,B,D and E are
assigned IP addresses 10.0.1.1, 10.0.1.2, 10.0.1.4 and 10.0.1.5, respectively. Similarly the
MAC addresses of A, B, D and E are 08:4D:00:7D:C1, 08:4D:00:7D:C2, 08:4D:00:7D:C4 and
08:4D:00:7D:C5, respectively. It is assumed that initially ARP caches of all hosts are empty.
B
PS 1: RQPPS 2: PRQP
PS 4:PRSP
PS 3: PRSP
A
D
E
Figure 4.4: Example of request spoofing
Figure 4.4 shows the sequence of packets (indicated with packet sequence numbers)
injected in the LAN when attacker D is sending a spoofed request as “IP(B)-MAC(D) ” to
TH-1076_NHUBBALLI

4.3. Proposed scheme: event detection system for ARP attacks 111
broadcast address asking host A’s MAC address and its verification (using active probe).
In packet sequence 1, D sends an ARP request RQP to broadcast address asking MAC
address of A. This ARP request conversation is viewed in tcpdump as
08 : 4D : 00 : 7D : C4 f f : f f : f f : f f : f f : f f : 42 : arp who − has 10.0.1.1 tell 10.0.1.2.
After receiving this request message from D, A updates its cache with IP-MAC pair as
IP(B)-MAC(D) first and then responds to D with its own MAC address. The ARP cache
of A with this update is shown in Table 4.1. It may be noted that under normal condition
Table 4.1: Cache table of host A under request spoofing
IP address MAC address Interface10.0.1.2 08:4D:00:7D:C4 eth0
“B’s request to A with IP-MAC pair :IP(B)-MAC(B)” and attack condition “D’s request
to A with IP-MAC pair :IP(B)-MAC(D)”, there is no change in sequence of ARP packets.
However, under the attack condition, all traffic A wants to send to B will be sent to D.
Now use of active probing is discussed to highlight how it creates difference in se-
quences of ARP packets under normal and attack situations. It is assumed that the
Authenticated table and Spoofed table are empty (at this instant).
On receiving the RQP from D to A (packet sequence 1), ARP REQUEST HANDLER() at E
(which has a copy of this packet as port is mirrored), intimates the receipt of RQP (event
1), sends an ARP probe request PRQP to IP address of B to query the corresponding MAC
address (packet sequence 2) and intimates sending of the ARP probe request PRQP (event
2). This ARP probe request conversation is viewed in tcpdump as
08 : 4D : 00 : 7D : C5 f f : f f : f f : f f : f f : f f : 42 : arp who − has 10.0.1.2 tell 10.0.1.5.
The probe request is sent, as the source IP-MAC pair of this RQP (event 1) is not yet
verified (Authenticated table and Spoofed table being empty). As the ARP probe is a
broadcast, both B and attacker D will receive the probe. B will definitely respond to the
probe with IP(B)-MAC(B) to E (packet sequence 3) as it is assumed that non-comprised
host (B) will always respond to the probe. This ARP probe response conversation is
viewed in tcpdump as:
08 : 4D : 00 : 7D : C2 08 : 4D : 00 : 7D : C5 60 : arp reply 10.0.1.2 is − at 08 : 4D : 00 : 7D :
C2.
TH-1076_NHUBBALLI

112 Chapter 4. Event detection system for ARP attacks
Now the event detection system can know that the response made in packet sequence 1
is false (as it had IP(B)-MAC(D)) and it can generate an alarm (and also track the attacker
MAC (D)). To avoid self-identification, attacker D responds to all queries for MAC address
of IP(B) with IP(B)-MAC(D). This response as seen in tcpdump is
08 : 4D : 00 : 7D : C4 08 : 4D : 00 : 7D : C5 60 : arp reply 10.0.1.2 is − at 08 : 4D : 00 : 7D :
C4.
It may be noted that the order of response by the attacker and the genuine host is not
fixed. So, if both the attacker and the genuine host respond to a request with a single MAC
address, the event detection system can detect a spoofing but cannot point to the attacker.
So, it is reasonable to believe that, an attacker would respond to all queries against the
IP address whose corresponding MAC address it is spoofing. To summarize, at least one
response to a probe (sent to verify IP(B), say) will arrive and have the genuine IP-MAC of
B. In the case of spoofing, more than one responses will arrive which may have different
MAC addresses. Once the spoofing is detected an entry is made in the Spoofed table as
shown in Table 4.2.
Table 4.2: Spoofed table entry at IDS on detection of request spoofing
SRC IP address SRC MAC address Dest IP address Dest MAC address Time10.0.1.2 08:4D:00:7D:C4 10.0.1.1 08:4D:00:7D:C1 00:00:30
In this example, it is assumed that the genuine host B responds (packet sequence 3)
before attacker D (packet sequence 4) to the ARP probe from E. The responses in packet
sequence 3 and packet sequence 4 are processed by ARP RESPONSE HANDLER() as
“intimate receipt of PRSP” thereby generating event 3 and event 4, respectively. It may
be noted that in the two responses, different MAC addresses are associated with the IP
address being probed i.e., once MAC address of B is associated with IP address of B and
then MAC address of D is associated with IP address of B. Table 4.3 lists the sequence of
ARP packets for the example (shown in Figure 4.4). Sequence of ARP traffic if the request
packet (sequence 1) is genuine, (i.e., IP(B)-MAC(B) is sent to A by B) is given as follows.
After the arrival of the ARP request packet, A will update its cache entry as shown in
Table 4.4. For the ARP probe sent by E to verify IP(B)-MAC(B) (packet sequence 2) only B
will respond to E with IP(B)-MAC(B) (packet sequence 3). Till Treq time the event detection
TH-1076_NHUBBALLI

4.3. Proposed scheme: event detection system for ARP attacks 113
Table 4.3: Packet and event sequences in the example of request spoofing
PS: Events SRC IP address SRC MAC address Dest IP address Dest MAC addressPS 1:RQP 10.0.1.2 08:4D:00:7D:C4 10.0.1.1 –
PS 2:PRQP 10.0.1.5 08:4D:00:7D:C5 10.0.1.2 –PS 3:PRSP 10.0.1.2 08:4D:00:7D:C2 10.0.1.5 08:4D:00:7D:C5PS 4:PRSP 10.0.1.2 08:4D:00:7D:C4 10.0.1.5 08:4D:00:7D:C5
system will receive only one PRSP (unlike two in case of attack). Once the event detection
system finds the response to be genuine (by virtue of only one PRSP), details of RQP are
stored in the Authenticated table; this is shown in Table 4.5.
Table 4.4: Cache of host A under normal request
SRC IP address SRC MAC address Interface10.0.1.2 08:4D:00:7D:C2 eth0
Table 4.5: Authentication table entry at IDS without request spoofing
SRC IP address SRC MAC address Dest IP address Dest MAC address Time10.0.1.2 08:4D:00:7D:C2 10.0.1.1 08:4D:00:7D:C1 00:00:32
4.3.2.2 Response spoofing
In this subsection an example is used to illustrate handling of spoofed response packets by
Algorithm 4.2. The network example is same as the one used to illustrate request spoofing
in last subsection.
Figure 4.5 shows the sequence of packets (indicated with packet sequence numbers)
injected in the LAN when attacker D is sending a spoofed response as “IP(B)-MAC(D) ”
to host A and its verification (using active probe). As packet sequence 1, D sends an ARP
response RSP to A telling that the IP address of B is associated with MAC address of D. As
ARP is a stateless protocol, after receiving the response from D, A updates its cache with
IP-MAC pair as IP(B)-MAC(D). As in the case for request spoofing, use of active probing
TH-1076_NHUBBALLI

114 Chapter 4. Event detection system for ARP attacks
A
B
E
Dseq1: RSP seq2: PRQP
seq3: PRSP
seq4: PRSP
Figure 4.5: Example of response spoofing
creates a difference in sequences of ARP packets under normal and attack situations. On
receiving the RSP from D to A (packet sequence 1), ARP RESPONSE HANDLER() at E,
intimates the receipt of RSP (event 1), sends an ARP probe request PRQP to IP address
of B to query the corresponding MAC address (packet sequence 2) and intimates sending
of the ARP probe request PRQP (event 2). As the ARP probe is a broadcast, both B and
attacker D will receive the probe. B will respond to the probe as PRSP with IP(B)-MAC(B)
to E (packet sequence 3). Attacker D also responds to the PRQP with IP(B)-MAC(D). As
more than than one response arrives with different MAC addresses, spoofing is detected.
The entry of the Spoofed table is shown in Table 4.6.
Table 4.6: Spoofed table entry at IDS on detection of response spoofing
SRC IP address SRC MAC address Dest IP address Dest MAC address Time10.0.1.2 08:4D:00:7D:C4 10.0.1.1 08:4D:00:7D:C1 00:00:30
In this example, it is assumed that the genuine host B responds (packet sequence 3)
before attacker D (packet sequence 4) to the ARP probe. The responses in packet sequence
3 and packet sequence 4 are processed by ARP RESPONSE HANDLER() as “intimate
receipt of PRSP” thereby generating event 3 and event 4, respectively. It may be noted
that in the two responses, different MAC addresses are associated with the IP address
being probed i.e., once MAC(B) is associated with IP(B) and then MAC(D) is associated
with IP(B). Table 4.7 lists the sequence of ARP packets for the example (in Figure 4.5).
TH-1076_NHUBBALLI

4.3. Proposed scheme: event detection system for ARP attacks 115
Table 4.7: Packet and event sequences in the example of response spoofing
PS: Events SRC IP address SRC MAC address Dest IP address Dest MAC addressPS 1:RSP 10.0.1.2 08:4D:00:7D:C4 10.0.1.1 08:4D:00:7D:C1
PS 2:PRQP 10.0.1.5 08:4D:00:7D:C5 10.0.1.2 –PS 3:PRSP 10.0.1.2 08:4D:00:7D:C2 10.0.1.5 08:4D:00:7D:C5PS 4:PRSP 10.0.1.2 08:4D:00:7D:C4 10.0.1.5 08:4D:00:7D:C5
4.3.3 DES modeling
As discussed before, the event detection system engine for detecting the ARP attacks
would be constructed using a DES detector. So, initially the ARP events under normal and
spoofed conditions are modeled using DES and subsequently a DES detector is designed.
Before the formal discussion on DES modeling framework is introduced, abstract state
models for ARP events under normal and spoofed conditions are given. Figure 4.6 shows
the state based ARP model under normal condition. Events listed before, namely receipt
of RQP/RSP, sending of ARP probe request (PRQP), receipt of ARP probe response (PRSP)
and DTD are shown in bold with the transitions in the figure. Figure 4.7 (A) and Figure
4.7 (B) show the model under request spoofing and response spoofing, respectively.
The DES model used for representing the LAN under normal and attack scenarios is
a six tuple 〈Σ,S,S0,V,C,=〉, where Σ is the set of events, S is the set of states, S0 ⊆ S is the
set of initial states, V is the set of model variables, C is the set of clock variables and = is
the set of transitions. It may be noted that there is no final state as ARP traffic in LAN is
a continuous (or renewal) process (never halts as long as the network is up). There are
some states from which there is a transition to an initial state(s), representing renewal of
the process; such states are termed as renewal states.
Each element vi of V (V = {v1, v2, · · · , vn}) can take values from a domain Di. The clock
variables take values in non-negative reals R. An invariant condition on a clock variable
c, denoted as Φ(c), is a linear inequality or equality of the variable with a non-negative
real.
A transition τ ∈ = is a seven tuple 〈s, s′, σ, φ(V),Φ(C),Reset(C),Assign(V)〉, where s is the
source state, s′ is the destination state, σ is an event (on which the transition is fired),
φ(V) is the Boolean conjunction of equalities of a subset of variables in V, Φ(C) is the
TH-1076_NHUBBALLI

116 Chapter 4. Event detection system for ARP attacks
s2 s3 s4
s1
s5 s6 s7
RSP
Response Packet RSP Received
PRQPProbe Request PRQP sent at time T to verify the Source IP-MAC Pair of RSP
PRSPResponse to Probe Request from
Source of RSP received within T+Treq: IP-MAC same as that of RSP
DTD
If S
ourc
e IP
-MA
C P
air o
f RS
P is
A
lread
y V
erifi
ed
After T+Treq
After T+Treq
RQP
Response Packet RSP Received
DTDIf Source IP-MAC Pair of RQP is
Already Verified
PRQPProbe Request PRQP sent to verify the Source IP-MAC Pair of RQP at
time T
PRSPResponse to Probe Request from
Source of RSP received within T+Treq: IP-MAC same as that of RQP
Figure 4.6: ARP event sequence under normal condition
invariant condition on a subset of clock variables, Reset(C) is a subset of clock variables
to be reset and Assign(V) is a subset of model variables and assignments with values
from their corresponding domains. This DES model is obtained by taking features from
timed automaton [29] and extended finite state machine [45] and augmenting them with
its original version [42].
Two attacks are considered namely, (i) request spoofing: where the attacker sends an
ARP request with falsified IP-MAC (source) pair in a query (to know the MAC address
of some IP address in the LAN), (ii) response Spoofing: where the attacker sends falsified
IP-MAC (source) pair in a response to some host in the LAN. Figure 4.8 shows the normal
DES model of the ARP. Figure 4.9(A) shows the DES model of the ARP under an ARP
request spoofing attack and Figure 4.9(B) is for an ARP response spoofing attack.
The terms in the DES required for modeling the ARP under normal and attack condi-
tions are quantified as follows:
Σ = {RQP,RSP,PRQP,PRSP,DTD}. The set of states S is shown in Figure 4.8 and Figure
4.9. States with no primes correspond to normal situation and those with single and
double primes denote request and response spoofing, respectively. Initial states (S0) are
TH-1076_NHUBBALLI

4.3. Proposed scheme: event detection system for ARP attacks 117
(A) Request Spoofing
s2'
s3' s4’ s5’
(B) Response Spoofing
s1'
s6' s7’
After T+Treq
After T+Treq
RQPRequest Packet RQP Received
DTDIf Source IP-MAC Pair of RQP is
Already Verified
PR
QP
Pro
be
Requ
est P
RQ
P s
ent a
t time T
to
verify
the
Sou
rce
IP-M
AC
Pair o
f
RQ
P
PRSP
1st Response to Probe Request from Source
of RQP received within T+Treq: IP same but MAC not same as that of RQP
PRSP
2nd
Response to Probe Request fromSource of RQP received within T+Treq:
IP-MAC same as that of RQP
PRSP1st Response to Probe Request fromSource of RQP received within T+Treq:
IP-MAC same as that of RQP
PRSP2nd Response to Probe Request fromSource of RQP received within T+Treq:
IP same but MAC not same as that of RQP
s2''
s3'' s4'’ s5''
s1"
s6'' s7'’
RSPResponse Packet RSP Received
DTDIf Source IP-MAC Pair of RSP is
Already Verified
PRSP1st Response to Probe Request from Source
of RSP received within T+Treq:
IP same but MAC not same as that of RSP
PRSP2nd Response to Probe Request from
Source of RSP received within T+Treq: IP-MAC same as that of RSP
PRSP1st Response to Probe Request fromSource of RSP received within T+Treq:
IP-MAC same as that of RSP
PRSP2nd Response to Probe Request fromSource of RSP received within T+Treq:
IP same but MAC not same as that of RSP
After T+Treq
After T+Treq
PR
QP
Pro
be
Req
ue
st P
RQ
P s
en
t at tim
e T
to
verify
the
Sou
rce
IP-M
AC
Pair o
f
RQ
P
Figure 4.7: ARP event sequence under request and response spoofing conditions
TH-1076_NHUBBALLI

118 Chapter 4. Event detection system for ARP attacks
also shown in Figure 4.8 and Figure 4.9. The model variable set is V = {IPS,MACS};
IPS has the domain as D1 = {x.x.x.x|x ∈ {1, 2, · · · , 255}} and MACS has the domain as
D2 = {hh − hh − hh − hh − hh − hh|h ∈ Hex}. There is a clock variable y, which is used
to determine if the probe responses have arrived within Treq time of sending the corre-
sponding request. The transitions are shown in Figure 4.8 and Figure 4.9; like states,
transitions without primes are for the normal model while single (double) primes are for
request (response) spoofing. It may be noted that there are “ − ” for some fields in the
tuple representing the transitions. If “ − ” is for φ(V) or Φ(C) then it represents a TRUE
condition, while if the “− ” is for Reset(C) or Assign(V) then it represents a NO action (i.e.,
reset or assignment) is required.
s2 s3 s41, 2, , , ,{ , },IPS MACS
s s RSPIPS RSP MACS RSP
− −<= <= − 2, 3, ,{ }, ,
,{ 0}}IPDs s PRQP IPS PRQP
y= −
− <=3, 4, ,{ , },{ },,
IPS MACS reqs s PRSP IPS PRSP MACS PRSP y T= = ≤
− −1τ
2τ 3τ
s1
4, 1, , ,{ },,
reqs s y T− − >
− −
10τ
9τ
5, 1, , , ,,
s s DTD − −− − 8τ
2,1,,
,,
, ss
DTD−−
−−
7τ
s5 s6 s7
5, 6, ,{ ,}, ,,{ 0}}
IPDs s PRQP IPS PRQPy
= −− <=
6, 7, ,{ , },{ },,
IPS MACS reqs s PRSP IPS PRSP MACS PRSP y T= = ≤
− −
5τ 6τ
1, 5, , , ,{
,
},
IPS
MACS
s s RQPIPS RQP MACS RQP
− −<=
<=−
7, 1, , ,{ },,
reqs s y T− − >
− −
4τ
Figure 4.8: DES model of ARP events under normal condition
The DES models designed above for normal and attack cases are explained below.
First, the case of handling a RQP under normal condition is presented.
In the normal case (Figure 4.8), the model moves from s1 to state s5 on observation of an
event RQP by transition τ4. Enabling of τ4 is only dependent on RQP and not on any model
variables or clock invariant condition; this is depicted by “ − ” in the transition. Model
variables IPS and MACS are assigned with source IP address and source MAC address
of RQP, respectively. Clock variable y is not altered. Following that in state s5, there are
TH-1076_NHUBBALLI

4.3. Proposed scheme: event detection system for ARP attacks 119
s2'
s3' s4’
1', 2', , , ,{ , },IPS MACS
s s RQPIPS RQP MACS RQP
− −= = −
2',3',
,{},
,,{
0}}IPD
ss
PRQP
IPSPRQ
Py
=−
−<=
3', 4 ', ,{ , },{ },,
IPS MACS reqs s PRSP IPS PRSP MACS PRSP y T= = ≤
− −
s5'
4 ', 5 ', ,{ , ! },{ },,
IPS MACS reqs s PRSP IPS PRSP MACS PRSP y T= = ≤
− −
1'τ
2 'τ
3'τ 4'τ
(A) Request Spoofing
s1'
5',1',
,,
,
,req
ss
yT
−−
>
−−
9'τ
2 ', 1', , ,,
s s DTD − −− − 7'τ
s6' s7’6'τ
3', 6 ', ,{ , ! },{ },
,IPS MACS reqs s PRSP IPS PRSP MACS PRSP y T= = ≤
− −
6 ', 7 ', ,{ , },{ },,
IPS MACS reqs s PRSP IPS PRSP MACS PRSP y T= = ≤
− −
7 ', 1', , , ,
,reqs s y T− − >
− −
5'τ
8'τ
s2''
s3'' s4'’
1", 2", , , ,{ , },IPS MACS
s s RSPIPS RSP MACS RSP
− −= = −
2",3",
,{},
,,{
0}}IPD
ss
PRQP
IPSPRQ
Py
=−
−<=
3", 4", ,{ , },{ },,
IPS MACS reqs s PRSP IPS PRSP MACS PRSP y T= = ≤
− −
s5'’
4 '', 5 '', ,{ , ! },{ },,
IPS MACS reqs s PRSP IPS PRSP MACS PRSP y T= = ≤
− −
1''τ
2 ''τ
3''τ 4''τ
(B) Response Spoofing
s1''
5",1",
,,
,
,req
ss
yT
−−
>
−−
9"τ
2", 1", , ,,
s s DTD − −− − 7"τ
s6'' s7'’6''τ
3'', 6 '', ,{ , ! },{ },
,IPS MACS reqs s PRSP IPS PRSP MACS PRSP y T= = ≤
− −
6", 7", ,{ , },{ },,
IPS MACS reqs s PRSP IPS PRSP MACS PRSP y T= = ≤
− −
7", 1", , , ,,
reqs s y T− − >
− −
5''τ
8"τ
Figure 4.9: DES model of ARP events under request and response spoofing conditions
TH-1076_NHUBBALLI

120 Chapter 4. Event detection system for ARP attacks
two options, either an ARP probe is sent (τ5) or a DTD (τ8) is received if the IP-MAC
pair of the RQP is already verified and stored either in the Authenticated table/Spoofed
table. Transition τ5 is enabled on PRQP (sent to IP address of the RQP under question);
correspondence of PRQP with RQP is determined by checking model variable IPS with
PRQPIPD. Also, clock variable y is reset. After transition τ5, probe response (PRSP) from
the (normal) host arrives (τ6); correspondence of PSQP with RQP is ensured by checking
IPS = PRSPIPS and MACS = PRSPMACS. Further, the PRSP is to arrive within Treq time after
PRQP is sent; this is checked by the clock invariant condition y ≤ Treq in the transition τ6.
In the normal situation only one probe response would arrive for the probe request. So
after Treq time of sending the probe request (and receipt of one probe response), the model
returns back to the initial state s1 by transition τ10; clock invariant condition y > Treq in τ10
determines that Treq time has passed.
The transitions from the renewal states occur after Treq time of sending the probes or
on receipt of DTD. As discussed, it is assumed that all responses to a probe come within
Treq time and so processing needs to be done only on responses that come within that
time interval. In the case when no probes are sent (by virtue of verification using tables),
the model returns back to the initial state, as no probe responses are to be processed.
Sequence of states from s1 to a renewal state (not corresponding to DTD) in this model
(e.g., s1, s5, s6, s7), represent a combination of “RQP, PRQP and PRSP”.
In a similar way, the case of handling a RSP under normal condition can be explained. In
the DES model (Figure 4.8) state sequence s1, s2, s3, s4, which is a combination of “RSP,
PRQP and PRSP”, represents handling of a RSP.
The case of handling a RQP under request spoofing condition (Figure 4.9 (A)) is
discussed next.
The model moves to state s2′ on observation of an event RQP by transition τ′1. Model
variables IPS and MACS are assigned with source IP address and source MAC address
of RQP, respectively. Clock variable y is not altered. Following that in state s2′, there are
two options, either an ARP probe is sent (τ′2) or a DTD (τ′7) is received if the IP-MAC pair
of the RQP is already verified and stored either in the Authenticated or Spoofed tables.
Transition τ′2 is enabled on PRQP (sent to IP address of the RQP under question). Also,
clock variable y is reset. After transition τ′2 , there are two options–(i) probe response
from the attacker arrives (τ′3) having PRSPMACS the same as spoofed RQPMACS or (ii)
TH-1076_NHUBBALLI

4.3. Proposed scheme: event detection system for ARP attacks 121
probe response from the normal host arrives (τ′5) having PRSPMACS not same as spoofed
RQPMACS. It may be noted that the model does not capture which probe response (PRSP)
is from normal and which is from attacker. The model only denotes the fact that there are
two responses with different MAC addresses; τ′3, τ′
4 and τ′5, τ′
6 are the two combinations
of arrival of the responses with different MAC addresses. Further, these PRSPs are to
arrive within Treq time after PRQP is sent. In a similar way all transitions can be explained.
Sequences of states from s1′ to a renewal state (not corresponding to DTD) in this model,
represent a combination of “RQP, PRQP, first PRSP, second PRSP”. In all sequences two
PRSPs are received with different MAC addresses.
The case of handling a RSP under response spoofing condition (Figure 4.9 (B)) is very
similar to RQP under request spoofing. However, the enabling condition of the first tran-
sition (τ1”) from the initial state (s1”) is the event RSP (which is different).
4.3.4 Detector
After development of the DES model, a detector is designed which can identify whether
a given sequence of events correspond to a normal or attack scenario. The detector is
basically a kind of state estimator of the model which keeps updating the estimate using
events of the system (here, LAN). Finally, the detector declares an attack when a state (of
the detector) is reached whose estimate comprises states only from the attack model. Once
normal or spoofing is determined, details of the packet being processed is recorded in the
Authenticated or Spoofed tables. Before the detector is formally discussed, the following
definitions are introduced:
Definition 4.1 Measurement equivalent transitions and states:
Two transitions τ1 = 〈s1, s′1, σ1, φ1(V),Φ1(C),Reset1(C),Assign1(V)〉 and
τ2 = 〈s2, s′2, σ2, φ2(V),Φ2(C),Reset2(C),Assign2(V)〉 are equivalent if σ1 = σ2 (same event),
φ1(V) ≡ φ2(V) (same equalities over the same subset of variables in V),Φ1(C) ≡ Φ2(C) (same
invariant condition on the clock variables), Reset1(C) ≡ Reset2(C) (same subset of clock variables
are reset) and Assign1(V) ≡ Assign2(V) (same subset of model variables with same assignment).
If τ1 ≡ τ2 then the source states of the transitions are equivalent and so are the destination states,
i.e., s1 ≡ s2 and s′1 ≡ s′2.
TH-1076_NHUBBALLI

122 Chapter 4. Event detection system for ARP attacks
The detector is represented as a directed graph O = 〈Z,A〉, where Z is the set of
detector states, called O-states, and A is the set of detector transitions, called O-transitions.
Henceforth, terms like transitions, states etc. of the DES are termed as model transitions,
model states etc. to differentiate them from those of the detector. Each O-state z ∈ Z
comprises a subset of equivalent model states representing the uncertainty about the actual
state and each O-transition a ∈ A is a set of equivalent model transitions representing the
uncertainty about the actual transition that occurs. The initial O-state comprises all initial
model states. Following that, given any O-state z, the O-transitions emanating from z are
obtained as follows. Let=z denote the set of model transitions from the model states s ∈ z.
Let Az be the set of all equivalence classes of=z. For each a ∈ Az, an O-transition is created
comprising all model transitions in a. Then the successor O-state for a is constructed as
z+ = {s|s is the destination model state of τ ∈ a}. Successor for O-states determining attack
or normal scenarios are not created. This process is repeated till no new O-transition can
be created.
Definition 4.2 Normal certain O-state: An O-state, which contains only model states corre-
sponding to the normal situation is called normal certain O-state.
Definition 4.3 Attack certain O-state: An O-state, which contains only model states corre-
sponding to attacks is called attack certain O-state.
Normal/attack certain O-states denote that the current (model) state estimate com-
prises only normal/attack states, thereby making a decision. Also as discussed before,
all normal/attack certain O-states store the details of the packet being verified in the Au-
thenticated/Spoofed tables. For a given normal or attack certain O-state z say, the packet
details to be stored can be found in the event corresponding to the O-transition starting
from the initial O-state and (in the path) leading to z.
Algorithm 4.3 presents the steps for construction of the detector.
Algorithm 4.3 : Algorithm for construction of detector O for the DES model
Input: DES models for normal, request spoofing and response spoofing
Output: Detector for request spoofing and response spoofing attacks
TH-1076_NHUBBALLI

4.3. Proposed scheme: event detection system for ARP attacks 123
Begin
z1← S0;
Z← z1;
A← φ;
for all z ∈ Z, which are not normal or attack certain Do {
=z ← {τ|τ ∈ =∧ source state of τ ∈ z};
Find the set of all equivalent classes Az, of =z
FOR ALL a ∈ Az {
z+ = {s|s is destination state of τ ∈ a};
Z = Z ∪ {z+};
IF z+ is normal (attack) certain , {
E← σ, σ is the event for model transition τ ∈ a where a is the
O-transition emanating from z1 and in the path leading to z+.
Add EIPS, EMACS, EIPD, EMACD and Time of receipt of E
to AUTHT (if z+ is normal certain) else to SPOOFT
} /* Entry of tabes for certain states */
A = A ∪ {a};
} /* For all a ∈ Az */
} /* for z ∈ Z which are not certain */
End
Figure 4.10 illustrates the detector for the DES models in Figure 4.8 and Figure 4.9. Some
of the initial steps for this example are as follows.
• The initial state of the detector i.e., z1 comprises all initial model states s1, s1′, s1”.
• =z1 = {τ1, τ1′, τ1”, τ4}which are all the outgoing model transitions from model states
in z1 = {s1, s1′, s1”}. Now, Az1 = {{τ4, τ1′}, {τ1, τ1”}}, as =z1 is partitioned into two
measurement equivalent classes namely, {τ4, τ1′} and {τ1, τ1”}. Corresponding to
{τ4, τ1′} there is an O-transition a7 while corresponding to {τ1, τ1”} there is another
O-transition a1.
• The destination O-state corresponding to a1 is z2 = {s2, s2”} as the destination model
state for τ1 and τ1” is s2 and s2”, respectively.
TH-1076_NHUBBALLI

124 Chapter 4. Event detection system for ARP attacks
z2s2,s2"1 11: , "
a τ τ 2 22 : , "a τ τ3 33 : , "a τ τ
z1s1,s1',s1"
7 713 : , "a τ τ
z3s3,s3"
z6s6"
55:
"a
τ
z4s4,s4"
z7s1
z5s5"
44 : "a τ
96:
aτ
z8s5,s2'
5 28 : , 'a τ τ6 39 : , 'a τ τz9
z6,s3'
z12s6'
511:
"a
τ
z10s7,s4'
z13s1
z11s5'
410 : 'a τ
1012:
aτ
4 17 : , 'a τ τ
8 714 : , 'a τ τ
Figure 4.10: Detector for the DES model of Figure 4.8 and Figure 4.9
In the detector, states z5, z6, z11, z12 are attack certain O-states and z7, z13 are normal
certain states. Now detection of an attack scenario and a normal scenario are discussed.
Attack detection scenario
Let the detector reach state z6 by the sequence z1, z2, z3. In all these states (i.e., z1, z2, z3)
the attack or normal conditions cannot be determined as the state estimate comprises one
normal model state and one attack model state, e.g, z2 has s2 and s2”. z6 being an attack
certain O-state, reached by occurrence of a5 (by virtue of τ5”), declares an attack. It may
be observed from Figure 4.9(B) that τ5” corresponds to a PRSP for a PRQP (τ2”) within
Treq time, whose source MAC (PRSPMACS) is different from the source MAC address of the
ARP response (RSPMACS) being verified. The details of the packet being verified is added
to SPOOFT. a1 is the O-transition emanating from z1 and is in the path leading to z6.
The event corresponding to a1 is ( the same as τ1/τ1”) is RSP. So, in z6, RSPIPS, RSPMACS,
RSPIPD, RSPMACD and time of receipt are added in SPOOFT.
Normal identification scenario
Let the detector reach state z7 by the sequence z1, z2, z3, z4 (involving no normal/attack
certain states). z7 being a normal certain O-state, reached by occurrence of a6 (by virtue of
τ9), declares the packet being verified as normal. It may be observed from Figure 4.8 that
τ9 corresponds to the fact that only one PRSP (τ3) has arrived for the PRQP (τ2) within
Treq time, whose source MAC address (PRSPMACS) is same as the source MAC address of
the ARP response (RSPMACS) being verified. Now, similar to the attack detection scenario,
TH-1076_NHUBBALLI

4.3. Proposed scheme: event detection system for ARP attacks 125
RSPIPS, RSPMACS, RSPIPD, RSPMACD and time of receipt are updated in the Authenticated
table. In a similar way, the whole detector can be explained.
Request/response spoofing attacks discussed above can lead to other attacks like
man-in-the-middle and denial of service. To verify occurrences of such cases, once re-
quest/response spoofing is determined by the detector, “man-in-the-middle detector”
algorithm and “denial of service detector” algorithm, are called. These two algorithms
are detailed in the next sub section.
4.3.5 Detection of MiTM and DoS using Authenticated and Spoofed
tables
As already discussed, when attacker D performs a man-in-the-middle attack between two
hosts A and B, it can sniff all traffic from A to B and vice versa. To perform this attack D
needs to send two spoofed responses
(i) to A with IP(B)-MAC(D) (i.e., RSP1 : RSP1IPS = IP(B), RSP1MACS =MAC(D), RSP1IPD =
IP(A), RSP1MACD =MAC(A)) and
(ii) to B with IP(A)-MAC(D) (i.e., RSP2 : RSP2IPS = IP(A), RSP2MACS =MAC(D), RSP2IPD =
IP(B), RSP2MACD =MAC(B)).
These responses arrive within TMiTM time window.
Due to RSP1, all traffic A wants to send to B will go to D. D will then forward them to B,
thereby sniffing traffic from A to B. Similarly, due to RSP2, D can sniff all traffic from B to
A. So, for the successful man-in-the-middle attack there are two spoofed responses where,
the source IP address - destination IP address pair of one (spoofed response) is flipped in
the other and both have the same source MAC address.
Algorithm 4.4, discussed below, detects if spoofing (already declared by the detector
and details stored in the Spoofed table) leads to a man-in-the-middle attack. This algorithm
analyzes all the entries in the Spoofed table to check if within TMiTM there are two responses
with flipped source IP address - destination IP address and the same source MAC address.
The algorithm first determines a subset of entries of the Spoofed table whose source
MAC address matches the source MAC address of the response under question. Also,
only those entries of the Spoofed table are considered which have arrived within TMiTM
time of the arrival of the response being verified. Thus, a subset of the Spoofed table is
obtained as SPOOFT′. Then, if there is an entry in SPOOFT′with flipped source IP address
TH-1076_NHUBBALLI

126 Chapter 4. Event detection system for ARP attacks
- destination IP address (with respect to the response being verified), a man-in-the-middle
attack is detected.
Algorithm 4.4 : Man-in-the-middle detector
Input : RSP - Spoofed response to be verified, Spoofed table
Output: Status
Begin
SPOOFT′ = {SPOOFT[i]|∀i (SPOOFTMACS[i] = RSPMACS) && (time of arrival of RSP -
SPOOFTTi[i]) ≤ TMiTM }
IF (SPOOFT′IPS[ j] = RSPIPD) && (SPOOFT′IPD[ j] = RSPIPS),(for any j, 1 ≤ j ≤ SPOOFT′MAX)
Status=MiTM and “attacker has MAC address as MACS”
End
Algorithm 4.5, discussed below, detects if any denial of service is being attempted on some
host. A denial of service attack is said to occur in a host if the number of ARP responses
against IP address of the host under question, within a time interval (δ), exceeds a thresh-
old DoSTh. The host will be busy in processing responses thereby making it unavailable
for catering to other normal activities. This algorithm is executed when the detector de-
termines a RSP to be spoofed, to verify if it is involved in denial of service attacks. The
algorithm finds all responses from the Authenticated table and Spoofed table which are
having destination IP address as RSPIPD and have arrived within δdos time of arrival of
the RSP; the table capturing this information is termed as DOST. If the number of such
responses is greater than DoSTh (i.e., |DOST| > DoSTh) denial of service is detected.
Algorithm 4.5 : Denial of service detector
Input : RSP
Output: Status
AUTHT′ = {AUTHT[i]|∀i (AUTHTIPD[i] = RSPIPD) &&
(time of arrival of RSP - AUTHTTi[i]) ≤ δdos }
SPOOFT′ = {SPOOFT[i]|∀i (SPOOFTIPD[i] = RSPIPD) &&
(time of arrival of RSP - SPOOFTTi[i]) ≤ δdos }
TH-1076_NHUBBALLI

4.4. Implementation, experimental results and comparison 127
DOST = AUTHT′ ∪ SPOOFT′
IF |DOST| > DoSTh, Status is denial of service for RSPIPD
4.3.6 Analysis of extra ARP traffic due to active probing
As the scheme uses active probing, some extra ARP traffic is generated. For the sake of
analysis consider a switched LAN with n hosts among which one is the attacker. If the
attacker does not launch any attack then only 2.n extra ARP packets are generated by the
active probing mechanism. This is explained as follows. If there is no attack then only
once IP-MAC pair for each host is to be validated which requires one ARP probe being sent
and one response to the probe is received. This checking would generally happen when
each host starts up and sends a gratuitous ARP packet. Once IP-MAC pair is validated
and stored in the Authenticated table, no probes are sent for other ARP packets with these
IP-MAC pairs. Now, if the attacker sends a spoofed packet then the number of extra ARP
packets are upper bounded by 3.k, where k is the number of different spoofed packets;
this is elaborated as follows. With each spoofed ARP packet, the event detection system
sends a probe request and expects more than one responses (one from normal and the
other from the attacker), thereby adding only three APR packets for each spoofed packet.
However, sometimes no extra traffic is generated, particularly if the information about
the spoofed packet is found in the Authenticated/Spoofed table.
4.4 Implementation, experimental results and comparison
The testbed created for the experiments consists of 5 hosts running different OSs. The
hosts are named with alphabets ranging from A-E. Hosts A-C have the following OSs
in execution: Windows XP, Ubuntu and Windows 2000, respectively. The host D with
Backtrack 4 is the attacker and host E (also having Backtrack 4) has the detector in execution
(i.e., the event detection system). These hosts are connected in a LAN with a CISCO
catalyst 3560 G series switch [7] with port mirroring facility. The configuration of the
testbed is shown in Figure 4.11. E has two LAN cards–one for data collection in the
LAN through port mirroring and the second is exclusively used for sending/receiving
ARP probes requests/responses. It may be noted that IP-MAC pair for the second card
TH-1076_NHUBBALLI

128 Chapter 4. Event detection system for ARP attacks
A C E
LAN
B D
Switch(With PortMirroring)
Monitor Port:Promiscuous mode operationLogging and Monitoring
Attacker
IDS
Probe Port
Figure 4.11: Configuration of the testbed
corresponds to that of the event detection system. Attack generation tools Ettercap, Cain
and Abel are deployed in host D and several scenarios of spoofing MAC addresses are
generated.
Basic block diagram for the (software) implementation of the event detection system
is given in Figure 4.12. As shown in the figure, first the packets obtained by the mirrored
port are sniffed by the “packet sniffer” module. “ARP request handler” or “ARP response
handler” module is executed depending on whether an ARP request or response packet
is received. The ARP request handler and ARP response handler are implemented in
C language as per the steps discussed in Algorithm 4.1 and Algorithm 4.2, respectively.
These modules send ARP probe requests to verify the IP-MAC pairs whose genuineness
are not yet determined. Further, these modules also generate events when, (i) IP-MAC
pair is already verified to be genuine/ spoofed (DTD), (ii) request packet is sent, (iii) probe
request packet is sent, (iv) probe response packet is received and (v) response packet is
received. These events are given to the “DES detector” module. In the implementation,
enabling of the O-transitions (based on event, equalities over the subset of model variables
and invariant condition on the clock variables), assignment of model variables and reset-
ting of clocks is same as any one of the model transitions contained in the corresponding
O-transition. All the attack certain O-states give an output of 1, and other states output
0. For each ARP request or response packet received in the sniffer an event is generated,
which in turn spawns an instance of the detector at state z1 and is added to an active list.
On the arrival of next RQP,RSP,PRQP,PRSP or DTD events, it is given to all instances of
TH-1076_NHUBBALLI

4.4. Implementation, experimental results and comparison 129
Packet SnifferPackets from mirrored port
ARP Response
ARP Request ARP REQUEST HANDLER
ARP RESPONSE HANDLER
Tables
SpoofedAuthenticated
DES DetectorIDS
DetectionRequest/Response
Spoofing
Events:DTD
RQP ReceivedPRQP Sent
Events:DTD
RSP ReceivedPRSP Received
PRQP Sent
Send Probe Request
Send Probe Request
Man-in-the-middle detector
+Denial of service
detector
Executes on detection of spoofing
Figure 4.12: Implementation level block diagram of the event detection system
detectors in the active list to their corresponding present state. Each of them can make a
transition on these events if the enabling condition is satisfied. Any detector that reaches
an attack certain or normal certain O-state is deleted from the list. Thus, when monitoring
ARP behavior with active probes, many instances of the detector machine are created,
each of which traces a path; those detecting two PRSPs with different MAC addresses to
an PRQP within Treq, flags an alarm for spoofing.
In Figure 4.12 it may also be noted that, there are two tables namely the Authenticated
table and the Spoofed table. The “ARP REQUEST HANDLER” and “ARP RESPONSE
HANDLER” modules look into these tables to see if a given IP-MAC pair is already tested
for genuineness/spooffed. Also, these two modules and the DES detector log data into
these tables for packets as and when genuineness of IP-MAC pairs (of the packets) are
verified. Finally, the event detection system also has a module termed as “Man-in-the-
middle detector + Denial of service detector”. This module reads data from the spoofed
table and determines if spoofing has led to other attacks like man-in-the-middle or denial
of service. This module is implemented in C as per the steps disused in Algorithm 4.4
and Algorithm 4.5.
The values of extra ARP traffic (discussed before in terms of n and k) are measured
experientially. Figure 4.13 and Figure 4.14 show the amount of ARP traffic generated for 4
scenarios (discussed in next paragraph), during first 100 seconds of startup of the hosts in
TH-1076_NHUBBALLI

130 Chapter 4. Event detection system for ARP attacks
the testbed. Number of ARP packets generated in the LAN between t and t + 1 second is
plotted against the (t+1)th second. The first scenario is of normal operation in the absence
of the event detection system. Second case is when the event detection system is running
and there are no attacks generated in the network. ARP traffic in these two scenarios are
shown in 4.13. It may be noted that within the time period of 7 to 13 seconds, ARP traffic
without IDS is higher compared to the case where IDS is running. Generally speaking,
as IDS sends probes, ARP traffic with IDS running should be higher or equal to the case
without the IDS. However, there is an exception in the time period of 7 to 13 seconds;
the cause is explained as follows. ARP cache flushes old entries after a time out period
and then sequence of request-response packets are used to re-establish the entries. After
startup of the systems, when IDS is running, probes are sent to verify each ARP packet
because entries in the authenticated and spoofed tables are empty; this occurs till the
first 6 seconds in the present experiment. Following that probes are sent only when new
IP-MAC pair is seen in some ARP packet. As ARP probes and responses are present in the
traffic in the first 6 seconds, corresponding IP-MAC pairs are updated in ARP caches of
some of the hosts. So, in the case when IDS is running, re-establishing these IP-MAC pairs
in the caches is not required thereby saving some ARP traffic (7 to 13 seconds). However,
when IDS is not running, re-establishing these IP-MAC pairs may be required through
request-response packets, which increases ARP traffic. After some time of the startup of
the systems (13 seconds in this experiment), probes are sent less frequently and hence
ARP traffic with IDS running is higher or equal to the case without the IDS. Third case is
when 100 spoofed IP-MAC pairs are injected into the LAN and event detection system is
not running. Fourth case is when the same 100 spoofed IP-MAC pairs are injected into
the LAN with event detection system running. Amount of ARP traffic generated in these
two cases are shown in Figure 4.14. From Figure 4.14 it may be noted that most of the
time a little extra traffic is generated by the proposed event detection system.
Table 4.8 presents the types of ARP attacks detected successfully by the proposed
scheme. Also, in the table the capabilities of other ARP attack detecting tools for these
attacks are reported.
TH-1076_NHUBBALLI

4.4. Implementation, experimental results and comparison 131
ARP Traffic at Normal Condition
0
2
4
6
8
10
12
14
1 7 13 19 25 31 37 43 49 55 61 67 73 79 85 91 97
Seconds
AR
P P
acke
t Cou
ntNormal without IDSNormal with IDS
Figure 4.13: ARP traffic in the normal condition
ARP Traffic at Attack condition
0
2
46
8
10
1214
16
18
1 7 13 19 25 31 37 43 49 55 61 67 73 79 85 91 97
Seconds
AR
P P
acke
t Cou
nt
Attack without IDSAttack with IDS
Figure 4.14: ARP traffic in the spoofed condition
Table 4.8: Comparison of ARP attack detection mechanisms
Attacks Proposed Active [112] Colasoft [8] Arpdefender [4]Malformed packets Y Y N NRequest spoofing Y Y Y Y
Response spoofing Y Y Y YMan-in-the-middle Y N N Y
DoS Y N Y N
TH-1076_NHUBBALLI

132 Chapter 4. Event detection system for ARP attacks
4.5 Conclusions
There are certain known attacks for which signatures cannot be generated and hence
signature detection systems do not suffice. ARP request/response spoofing, exploiting
ICMP error/informational messages etc. are some examples of such kinds of attacks.
Techniques developed to detect such attacks have several drawbacks. For example, most
of the schemes reported for detecting ARP attacks add stringent constraints like making
IP-MAC pair static, patching of OSs in all the hosts, modifying the standard ARP etc.
Further, each scheme can detect only a few type of ARP related attacks. In this chapter a
DES based event detection system for ARP related attacks has been presented. It was also
shown how the proposed event detection system eliminates the drawbacks of most of the
other schemes (for ARP attack detection) reported in the literature.
The main reason for attacks against ARP or ICMP is their statelessness nature. Basically,
the proposed scheme detects attacks by actively verifying each message of ARP and then
checking the sequence of network packets. As the genuine host always responds to a
(verification) query which conflicts with that of the attacker, thereby the attack can be
detected. The basic idea is generic and can be used for detecting ICMP related attacks
also, by actively verifying each error or informational message. The next chapter deals
with header based anomaly detection system for unknown attacks.
TH-1076_NHUBBALLI

Chapter 5
Header based anomaly detection system
using data summarization
5.1 Introduction
Signature and event detection systems can detect attacks whose syntax or behavior is
known. However if an attack is new or its syntax and behavior is unknown, another class
of IDS termed as anomaly detection system is used. Anomaly detection systems model
the benign behavior of a system with a profile and any deviation from the known profile
is considered as attack. Based on part of network traffic used in modeling the profile,
anomaly detection systems can be divided into two types as (i) header based and (ii)
payload based. Header based systems are generally used to detect simple attacks but the
main aim is to offer quick decisions on the analyzed traffic. For detecting sophisticated
attacks payload based anomaly detection systems are used but they take more time for
analysis. This chapter deals with header based anomaly detection systems.
Header based anomaly detection systems use the contents of network packet header
for feature extraction and modeling. These features can be either contents of header fields
itself or can be derived. For example, if source and destination IP addresses are used as
features they are directly taken features. Number of half open TCP connections (which
can be obtained from headers of TCP packets) at a given instance in a host, is an example
of derived feature. If number of half open TCP connections are high then a Denial of
Service (DoS) can occur. This situation is caused by SYN flood attack [51]. A header based
TH-1076_NHUBBALLI

134 Chapter 5. Header anomaly detection using data summarization
anomaly detection system, where number of half open TCP connections at an instant, is a
feature, can detect SYN flood attack.
To generate a SYN flood attack, attacker sends multiple TCP packets (to the victim) with
a spoofed source IP address and TCP SYN flag being set. Each such packet corresponds
to initiating a connection request. The victim responds with a SYN-ACK and waits for
the acknowledgement (ACK) which never comes. Each of these waiting connections fill
up the connection table thereby consuming memory and CPU cycles in the victim. If SYN
packets are sent at a very rapid rate the victim will not be able to process any requests
from the other genuine hosts resulting in denial of service attack. The difference in the
connection tables under normal and SYN flood attack is shown in Table 5.1 and Table 5.2,
respectively.
Table 5.1: Connection table: normal
Source IP address Port State0.0.0.0 0 FREE0.0.0.0 0 FREE0.0.0.0 0 FREE192.168.4.23 80 TIME WAIT192.168.27.112 80 ESTABLISHED192.168.54.7 80 SYN192.168.3.94 80 ESTABLISHED192.168.15.88 80 TIME WAIT192.168.3.16 80 ESTABLISHED
Table 5.2: Connection table: SYN flooding
Source IP address Port State192.168.7.99 80 SYN192.168.7.99 80 SYN192.168.7.99 80 SYN192.168.7.99 80 SYN192.168.7.99 80 SYN192.168.7.99 80 SYN192.168.7.99 80 SYN192.168.7.99 80 SYN192.168.7.99 80 SYN
Clustering is one of the most commonly used technique to build profiles of anomaly
detection systems because labeled data is not required [44]. In a network with even
marginal number of computers it is safe to expect at least thousands of connections per
second resulting in huge amount of data. Most of the clustering algorithms proposed in
the literature need quadratic time computation and scan the dataset multiple times [101].
So these clustering techniques take large computation time if applied to header based
anomaly detection systems. In other words, if traditional clustering techniques are used
in header based anomaly detection systems the aim of quick analysis is lost.
To handle this issue, ADWICE [41], a header based anomaly detection system, uses
the well known clustering technique BIRCH [152]. BIRCH is based on data summariza-
tion [124]. Summarization techniques derive a summary information from dataset and
TH-1076_NHUBBALLI

5.1. Introduction 135
processing is done on this summary rather than the whole dataset. ADWICE works for
large dataset but has the issue of false alarms. In other words, effective alarm generation
is an issue for header based anomaly detection systems which use data summarization
techniques for handling large datasets. In the present chapter, effective alarm generation
for header based anomaly detection system handling large datasets is proposed. The
contributions of the chapter are as follows.
• The proposed anomaly detection system uses a data summarization technique based
on BIRCH [152], which enables it to handle large datasets.
• The anomaly detection system makes some modification in the BIRCH algorithm
which achieves better clustering. This improves Accuracy and Detection Rate of the
proposed system compared to similar techniques reported in the literature. The
modifications in the BIRCH algorithm are given below.
– The modified clustering algorithm do not use a threshold for including/excluding
(new) points in the clusters. Instead, cluster quality indices are used as the mea-
sure. Since cluster quality is maintained at all steps of cluster formation the
algorithm leads to better clustering.
– In the modified algorithm comparison of a (new) point is made directly with
all clusters for finding the nearest one. In BIRCH, cluster information is stored
in a height balanced tree (called Cluster Feature (CF) tree) and hierarchal com-
parison is made to reduce time complexity. However, it is shown in experimen-
tation section of the chapter that time required for comparison with all clusters
is within practical time lines.
– Unlike BRICH, which takes only ordinal attributes, the modified algorithm is
extended to work with both categorical and ordinal attributes. Categorical
attributes are very common in network data.
Rest of the chapter is organized as follows. Relevant literature on header based
anomaly detection system is reported in Section 5.2. The section also discusses briefly, the
data summarization technique BIRCH. Section 5.3 presents the proposed header based
anomaly detection system. Section 5.4 deals with experimental results and comparison of
TH-1076_NHUBBALLI

136 Chapter 5. Header anomaly detection using data summarization
Accuracy and Detection Rate with similar techniques reported in the literature. Finally the
chapter is concluded in Section 5.5.
5.2 Related work
For the sake of readability a summary of various header based anomaly detection systems
using clustering algorithms (discussed in Subsection 2.3.1 of Chapter 2) is reported in this
section. Also, ADWICE (on which the proposed detection system is based) is discussed
in brief.
As presented in Chapter 2, the following are the major header based anomaly detection
systems which use clustering algorithms.
• Clustering for Anomaly Detection (CLAD) [43]: CLAD generates fixed width, over-
lapping clusters from normal packet headers which represents the normal profile.
A test feature vector is declared anomalous if its distance to all the cluster centers is
greater than a threshold.
• Connectivity-based Outlier Factor (COF) [125]: COF uses nearest neighborhood
clustering technique for anomaly detection. Given a feature vector it assigns an
anomaly score based on its distance to its neighborhood set. If the anomaly score is
higher than a threshold, it implies that the feature vector under question is different
from the other members (and is anomalous).
• Two-phase clustering for outliers detection [64]: In this work, a two-phase clustering
algorithm is developed for detecting anomalies. In the first phase, clusters are
formed using a modified version of k-means algorithm. In the second phase, cluster
centers (obtained in first phase) are regarded as nodes which are used to construct a
minimum spanning tree (MST) based upon distance between every two nodes. The
MST is treated as a member of a forest. Following that, longest edge of a tree from
the forest is replaced with two newly generated subtrees. This process is repeated
until the number of trees in the forest reaches a desired number. The trees with less
number of nodes (i.e., the small clusters) are regarded as anomalies.
• Minnesota INtrusion Detection System (MINDS) [52]: MINDS generates a set of
basic and derived features from headers of Netflow (version 5) data, which are used
TH-1076_NHUBBALLI

5.2. Related work 137
to build the profile. An outlier detection algorithm is used for detecting outlying
network flows (which are considered anomalous).
These clustering based anomaly detection systems have fairly high Detection Rate
and Accuracy. However, in case of large datasets these techniques fail to give a
speedy solution.
• ADWICE [41]: ADWICE uses a data summarization clustering algorithm BIRCH
[152] to develop a header based anomaly detection system. Data summarization
technique enables ADWICE to handle large datasets but has the issue of false alarms
(i.e., effective alarm generation) because BIRCH sometimes leads to improper clus-
tering.
As ADWICE is mainly based on BIRCH, a basic background of BIRCH algorithm is given
below.
5.2.1 Overview of ADWICE
ADWICE basically uses BIRCH [152] as the anomaly detection engine. BIRCH is a data
summarization algorithm designed to explicitly handle large amount of training data
which can not be accommodated in the main memory. It keeps summary of the dataset
in the form of a height balanced tree called as CF tree, similar to B+ tree. A CF-tree is a
height-balanced tree with three parameters as follows.
1. Branching factor B for nonleaf node.
2. Maximum entries in a leaf node L.
3. Threshold T.
In case of the leaf nodes, the diameters of the clusters cannot exceed a threshold T.
Threshold T is used as a criterion for insertion of a new feature vector into the correct
cluster. If addition of a new feature vector increases radius of the closest cluster by not
more than T, it is included in that cluster; else a new cluster with the feature vector is
cerated.
Each non leaf node in the tree is of the form[CFi,Childi
]where CFi is the ith Cluster Feature
(CF) and Childi is the pointer to the ith child node. Each CFi has three elements
TH-1076_NHUBBALLI

138 Chapter 5. Header anomaly detection using data summarization
• N - Number of feature vectors in the cluster.
• LS- Linear sum of the feature vectors
• SS- Squared sum of the feature vectors.
Leaf nodes are constructed with only CFs. Each CF at non-leaf level summarizes all child
CFs in the level below.
Given N number of d dimensional vectors (denoted as Fk, 1 ≤ k ≤ N) in a cluster Ci, the
centroid of the cluster can be computed with Equation (5.1)
V0i =
∑Ni=1 Fi
N(5.1)
Additive property holds when two cluster features are merged, i.e., resulting CF is sum
of the two CFs. If CF1 is [N1, LS1,SS1] and CF2 is [N2, LS2,SS2] then resulting CF is
CFresult =[N1+ N2, LS1+LS2,SS1+SS2].
The distance between a feature vector v and a cluster Ci is the Euclidian distance between
v and the centroid V0i , denoted as D1(v,CFi).
Inter cluster distance D2 (i.e., distance between two clusters) between cluster C1 and C2 is
computed using Equation (5.2)
D2 =[∑N1
i=1
∑N1+N2j=N1+1(
−→Fi −−→F j)2
N1N2
]1/2(5.2)
where feature vector Fi ∈ C1 and F j ∈ C2.
Intra cluster distance D3 (i.e., average distance of the points within the cluster) within a
cluster C = C1 ∪ C2 is computed using Equation (5.3)
D3 =[∑N1+N2
i=1
∑N1+N2j=1 (
−→Fi −−→F j)2
(N1 +N2)(N1 +N2 − 1)
]1/2(5.3)
where feature vector Fi,F j ∈ C1 ∪ C2.
It may be noted that Equation (5.2) and Equation (5.3) involve reading all feature vectors
of a cluster. Advantage of BIRCH is because CF contains enough information to compute
distances D2 and D3 without reading all feature vectors. Equation (5.2) can be rewritten
TH-1076_NHUBBALLI

5.2. Related work 139
in terms of cluster feature as Equation (5.4) [109].
D2 =[ (N2 ∗ SS1) − (2
−−→LS1−−→LS2
T) + (N1SS2)N1N2
]1/2(5.4)
Similarly, Equation (5.3) can be rewritten in terms of cluster feature of as Equation (5.5)
[109].
D3 =[2(N1 +N2)(SS1 + SS2) − 2(
−−→LS1−−→LS1
T +−−→LS2−−→LS2
T)(N1 +N2)(N1 +N2 − 1)
]1/2(5.5)
ADWICE is basically a clustering based anomaly detection system; so it involves
training and testing phase. As ADWICE uses BIRCH, so training involves creating the CF
tree (by fixing B) with feature vectors derived from packet headers of normal data. The
steps are elaborated as follows.
• Search for closest leaf node: Given a new vector v, the CF tree is recursively searched
from the root to the leaf closest to v. In other words, in each step, child i is selected
such that D1(v,CFi) < D1(v,CF j) for every other child j.
• Update the leaf: v is included in (the closest) cluster having cluster feature as CFi
if threshold T is not violated. If T is violated, a new entry CFk in the leaf under
question is created with v. If the number of cluster features including CFk becomes
more than B the leaf is split into two. During splitting, the two cluster features of
the leaf which are maximum distance (D2) apart are selected as seeds and all other
cluster features from the old leaf are distributed between the two new leafs. Each
cluster feature is merged with the (new) leaf having the closest seed.
• Modify the path to the leaf: After insertion of v, the tree needs to be updated. If
root is not split, the cluster features along the paths (from root) to the updated leaf
need to be recomputed to include v by incrementally updating the cluster features.
If a split occurs, a new non-leaf entry is inserted in the parent node of the two new
leafs and the cluster feature summary is computed for the new leafs. If the number
of children in parent node is below B the new non-leaf cluster feature is inserted.
Otherwise the parent is also split. Splitting may propagate all the way up to the root
in which case the depth of the tree increases.
TH-1076_NHUBBALLI

140 Chapter 5. Header anomaly detection using data summarization
After the CF tree is built (i.e., the training phase), it is used to detect anomalies (i.e., the
testing phase). When a new feature vector v arrives, a top down search is made from the
root to find the closest cluster feature CFi. This search is performed in the same way as in
training. If D1(v,CFi) is smaller than a threshold, v is considered normal and anomalous
otherwise.
BIRCH is a good summarization technique but sometimes leads to improper clustering.
The clusters generated in BIRCH do not necessarily correspond to “natural clustering”
[152]. If the clusters are not well formed the cohesiveness that may exist in the elements
of a cluster may be lost. So effective alarm generation in anomaly detection system
(ADWICE), built using BIRCH, is an issue. In the next section the proposed header based
anomaly detection system is discussed which addresses this issue.
5.3 Proposed scheme: header based anomaly detection sys-
tem using data summarization
The proposed header based anomaly detection system is aimed at handling large datasets
and yet giving low false alarms. This is achieved by modifying the data summarization
based clustering algorithm BIRCH, so that cluster quality is improved. As discussed
before, three major modifications namely, (i) use of cluster quality index as a measure for
inclusion/exclusion of a feature vector, (ii) comparison of a new feature vector with all
clusters and (iii) inclusion of categorical attributes have been used for modification. Due
to modifications (ii) and (iii), the following changes are made in the CF-tree structure of
BIRCH.
• As a new feature vector is compared with all clusters, the whole CF-tree (in BIRCH)
maintained for hierarchial comparisons, is not required. Only the leaf nodes of the
CF tree are built in the form of a linked list.
• Unlike BRICH, the modified algorithm is extended to work with both categorical and
ordinal attributes. So each cluster is now represented as [CF, 〈a1, a2, · · · , ak〉] where
CF is the cluster feature (same as BIRCH) and 〈a1, a2, · · · , ak〉 are the k categorical
attributes for a given cluster.
TH-1076_NHUBBALLI

5.3. Proposed scheme: header anomaly detection using data summarization 141
Like any clustering based anomaly detection system, the proposed method also in-
volves training phase and testing phase. In the training phase the clusters (in the linked
list) are created from a dataset comprising only normal network traffic. In the testing
phase a feature vector (created from test network traffic) is compared with all the existing
clusters; if distance of the test feature vector is more than a (test) threshold it is declared
as attack. In the following two subsections training and testing phases are elaborated.
5.3.1 Training
The training algorithm takes as input, (i) number of clusters to be generated, (ii) feature
vectors of normal network traffic and creates clusters using only the summary informa-
tion. Algorithm 5.1 shows the training procedure.
Algorithm 5.1 : Training phase
INPUT: NC - number of clusters, NF - number of feature vectors, F = { f1, f2, · · · , fNF} -
set of feature vectors.
OUTPUT: Trained model with NC number of clusters
1: Generate a list of NC clusters from first NC feature vectors.
2: for i = NC + 1 to NF do
3: for j = 1 to NC do
4: Find a cluster C j such that categorical attributes of C j and fi are same.
5: Generate a temporary cluster C′j = C j ∪ fi
6: if D3(C′j) ≤ D3(C j) then
7: Add the point fi to cluster C j
8: break
9: else
10: if j == NC then
11: Create a separate cluster CNC+1with fi
12: distance=MAX (a high positive integer)
13: for p = 1 to NC do
14: for q = p + 1 to NC + 1 do
TH-1076_NHUBBALLI

142 Chapter 5. Header anomaly detection using data summarization
15: if ((D2(Cp, Cq) ≤ distance) AND (api is same as aqi , where api ∈ Cp, aqi ∈ Cq,
1 ≤ i ≤ k)) then
16: distance = D2(Cp, Cq)
17: index1 = p and index2 = q
18: end if
19: end for
20: end for
21: Merge index1 and index2
22: end if
23: end if
24: end for
25: end for
Initially NC number of clusters are formed from first NC feature vectors (number of clusters
is lower bounded by the feature space of categorical attributes). Subsequently, whenever
a new data point needs to be added the cluster list is searched linearly to find a suitable
cluster such that (i) categorical attributes of the new feature vector matches with that of the
categorical attributes of the cluster and (ii) satisfies a quality index. Intra cluster distance
(D3) of the existing cluster and a temporary cluster generated after adding the feature
vector in question to the cluster is calculated. If the intra cluster distance of the temporary
cluster does not increase compared to the original cluster, the temporary cluster replaces
the original cluster. In other words the temporary cluster has better quality index. On
the other hand if the new feature vector increases the intra cluster distance of any existing
cluster or its categorical attributes are different from all existing clusters, a new cluster is
formed with the feature vector. With this new cluster added, the total number of clusters
increases to NC+1. To keep the cluster number to NC (fixed) a merge operation is initiated.
In merge phase two clusters Cp and Cq with lowest inter cluster distance are merged.
5.3.2 Testing
Given a test feature vector TP, a linear search is done on the clusters to test whether TP
falls within the range of any cluster i.e., if the distance of TP with a cluster i (1 ≤ i ≤ NC)
is less than a threshold TCi then it is declared as normal, otherwise it is declared as attack.
TH-1076_NHUBBALLI

5.3. Proposed scheme: header anomaly detection using data summarization 143
The threshold for the ith cluster TCi is calculated as the sum of the ith cluster radius (Ri) and
an additional control factor δincR (where 0%Ri ≤ δincR ≤ 25%Ri). Algorithm 5.2 shows the
testing procedure.
Algorithm 5.2 : Testing Phase
INPUT: TP - testing feature vector
OUTPUT: status
1: status = attack
2: for i = 1 to NC do
3: if dist(Ci,TP) ≤ TCi then
4: status = normal
5: break
6: end if
7: end for
8: Output the status
As discussed in last subsection, feature vectors for the present case also includes
categorical attributes; computation of the distance of a feature vector with a cluster (i.e.,
dist) is computed as follows. Given a cluster C with categorical attributes 〈a1, a2, · · · , ak〉,
categorical distance (distcategorical) of C with a TP having categorical attributes
〈aTP1, aTP1, · · · , aTPk〉 is computed as
distcategorical(C,TP) =k∑
i=1
wi ∗ (δcdist(ai, aTPi)); (5.6)
where δcdist(ai, aTPi) is defined as
δcdist(ai, aTPi) = 0 if ai = aTPi, else δcdist(ai, aTPi) = 1
and wis are the weights assigned to the ith categorical attribute based on its importance on
the overall set of categorical attributes.
TH-1076_NHUBBALLI

144 Chapter 5. Header anomaly detection using data summarization
D3 is calculated using the the non-categorical attributes of the cluster and the feature
vector. The distance dist of Algorithm 5.2 is given by
dist(C,TP) = α ∗D3(C,TP) + (1 − α) ∗ distcategorical(C,TP) (5.7)
where α is a controlling factor deciding the weightage given to the categorical and non-
categorical attributes.
5.3.3 Time complexity analysis
Time complexity of both training and testing phases are discussed in this subsection.
Training phase
First step of the Algorithm 5.1 simply reads NC patterns and builds NC clusters; com-
plexity is of O(NC). Step 2 is repeated NF − NC number of times and Step 3 is repeated
NC number of times. Step 4 to Step 7 are of constant time complexity. Also, Step 10
to Step 12 are of constant complexity. Step 13 and Step 14 involve comparison of inter
cluster distance of all cluster pairs and have a complexity of O(NC2). Again Step 15 to Step
17 are of constant time complexity. Step 20 involves merging operation of two clusters
(by CFs) and hence is also of constant complexity. Thus the overall time complexity is
O(NC+(NF − NC)NC(NC2)) ≈ O(NF ∗ NC3). As NC � NF complexity of the proposed
training algorithm is much less compared to common clustering algorithms [94] which
has quadratic time complexity in the number of vectors. Moreover, NC2 factor comes into
play only when a merge operation is initiated. On the other hand if a feature vector finds
a cluster which can accommodate it without deteriorating the cluster quality index, NC2
component of the complexity is saved. In experiments it is observed that only for 5% of
the feature vectors merge operation is required.
Testing
Time complexity of testing is of order NC as in the worst case it involves NC distance
computations with the NC clusters.
TH-1076_NHUBBALLI

5.4. Experimental results 145
5.4 Experimental results
In this section a description of experiments conducted on three datasets to verify the
proposed method in terms of Accuracy and Detection Rate is given. In the first experiment
a dataset shared by authors of [31] is used. In the second experiment KDD 99 dataset is
used. Third experiment is with a dataset generated at Computer science and engineering
departmental network of IIT Guwahati. These experiments are detailed out in the next
three subsections.
First phase of any anomaly detection system based on clustering technique is to extract
appropriate features and generate feature vectors from the network traffic. In this work,
for the first and third experiment, a set of time based features are extracted from the
collected traffic1. All these features are based on attributes of network packet header.
Following 24 features listed below are identified for feature vector generation - total
number of packets, syn packets count, fin packets count, ack packets count, tcp syn + ack count,
reset packets count, urgent pointers count, distinct window size values, distinct sequence numbers
seen, udp count, icmp count, fragmented packets count, icmp echo reply messages count, total
bytes host sent, total bytes source sent, distinct TTL values, malformed packets count, udp ratio,
tcp ratio, icmp ratio, packet payload size average, packet header size average, distinct source ports
visited, distinct destination ports visited.
As discussed in the testing algorithm, if distance of a test feature vector from center
of any cluster i is less than (or equal) the threshold TCi , it is declared as normal. The
assumption here is an attack instance should differ from normal feature vectors and hence
its distance is greater compared to the normal feature vectors. In the experiments Accuracy
and Detection Rate are reported for five different values of δincR ranging between 0 to 25%
of the value of Ris. Also, Accuracy and Detection Rate would vary if the number of clusters
(NC) is varied because Ris change with change in NC. The experiments also report this
variation.
5.4.1 Experiment 5.1
In the first experiment a dataset shared by authors of RTUNND [31] is used. Dictionary
of attacks present in the dataset of RTUNND along with names of tools used to generate
1In the second experiment, features are given with the dataset
TH-1076_NHUBBALLI

146 Chapter 5. Header anomaly detection using data summarization
these attacks are listed in Table 5.3.
Table 5.3: List of attacks present in RTUNND dataset
Name Generated withBonk targa2.cJolt targa2.cLand targa2.cSaihyousen targa2.cTeardrop targa2.cNewtear targa2.c1234 targa2.cWinnuke targa2.cOshare targa2.cNestea targa2.cSyndrop targa2.cOctopus octopus.cKillwin killwin.cTwinge twinge.cTcpWindowScan NmapSynscan NmapNeptune FireHackDoSnuke FireHackSmbdie Smbdie.exeXmassTree Scan NmapLinuxICMP linux-icmp.cMoyari13 moyari13.cSesquipedlian sesquipedalian.cSmurf smurf4.cOverDrop overdrop.cOpenTear opentear.cEchochargen FireHack
One drawback with the RTUNND dataset is a very small amount of normal traffic
(which is required for training); the dataset consists of only 5000 packets which is compar-
atively low. In order to increase the size of the dataset, normal network traffic is collected
at the department of Computer science and engineering, IIT Guwahati. This network
traffic is collected at discrete intervals spanning for 3 days. After addition of the collected
dataset to RTUNND, now the combined dataset comprises 356557 normal packets; 57358
feature vectors are generated from these packets. Among these, 50000 feature vectors are
TH-1076_NHUBBALLI

5.4. Experimental results 147
used as (normal) training dataset. For the testing dataset remaining 7358 normal feature
vectors along with 1500 feature vectors generated from attack traffic packets (of RTUNND
dataset) are used. These feature vectors are generated with a time window of 6 seconds.
In this experiment as there are no categorical attributes, distancecategorical is 0.
Table 5.4 shows the Detection Rate and Accuracy for this experiment with different values
of δincR and number of clusters.
Table 5.4: Accuracy and Detection Rate in Experiment 5.1
NC Training Time δincR % of Ri Accuracy Det Rate
150 1m:31s:00ms
0% 062.26% 100.00%5% 068.30% 099.00%
10% 078.62% 098.06%15% 086.38% 097.66%20% 087.76% 095.60%25% 090.25% 093.80%
175 1m:55s:31ms
0% 075.75% 100.00%5% 078.82% 100.00%
10% 088.34% 099.53%15% 089.09% 098.06%20% 091.21% 096.93%25% 094.30% 094.86%
200 2m:12s:08ms
0% 080.90% 100.00%5% 082.55% 100.00%
10% 090.58% 100.00%15% 091.37% 098.86%20% 092.95% 097.66%25% 095.13% 095.06%
225 2m:33s:40ms
0% 085.13% 100.00%5% 090.36% 100.00%
10% 092.36% 100.00%15% 094.30% 099.26%20% 095.76% 098.00%25% 098.52% 096.40%
Table 5.4 also shows the time taken for training for different number of clusters. Training
algorithm takes nearly 2 minutes to process 50000 feature vectors. Testing time involving
7358 normal feature vectors and 1500 attack feature vectors is less than 20 seconds (not
shown in the table). This shows that even if a new feature vector is compared with all
clusters in the proposed algorithm (unlike, hierarchial in case of BIRCH) time taken for
TH-1076_NHUBBALLI

148 Chapter 5. Header anomaly detection using data summarization
training and testing are reasonable.
The following observations can be made from the table.
• Increase in number of clusters (NC) leads to increase in Accuracy and Detection Rate.
If the number of clusters are less they become too generic to differentiate attack and
normal traffic.
• For a given NC, high value of TCi (by virtue of a high value of δincR) implies better
Accuracy at the cost of Detection Rate. High value of TCi implies a larger cluster radius
and more number of feature vectors are declared as normal leading to a lower FP
rate and higher FN rate.
5.4.2 Experiment 5.2
Second experiment is done with KDD 99 dataset. This dataset was generated by Columbia
university by processing DARPA 98 offline tcpdump files as part of knowledge and data
discovery competition of the year 1999. To the best of our knowledge there is no other
publicly available dataset (at least of this size and widely accepted in the community
as of KDD 99). DARPA 98 seven weeks of training tcpdump files consist of 5 million
connections and two weeks of test data has two million connections. In total, this dataset
has 41 features and each vector is labeled as either attack or normal. The 41 features
includes some symbolic attributes as well as numeric attributes. Specifically there are
9 symbolic (categorical) attributes and remaining 32 are numerical attributes. All the
normal and (four) attack types are separated. Normal feature vectors are again divided
into two parts for training and testing. Attack feature vectors are used for only testing
purpose. Size of feature vectors used for training and testing is given in Table 5.5. Table 5.6
shows variation of Detection Rate and Accuracy for the four classes of attacks with different
values of δincR and number of clusters. Also, overall Detection Rate and Accuracy for all
attacks taken together are reported. Number of clusters are kept same as ADWICE [41]
for comparison. In case of denial of service attack Detection Rate and Accuracy are high for
all values of δincR because traffic characteristics under denial of service varies significantly
compared to normal traffic characteristics. Accuracy of U2R attack is less compared to
other cases. The number of instances of U2R is less compared to normal cases (and other
attacks). So number of TPs in U2R is less compared to number of FPs generated. Trends
TH-1076_NHUBBALLI

5.4. Experimental results 149
of other attacks in variation of Detection Rate and Accuracy by change in δincR are similar
to Experiment 5.1.
Table 5.5: Characteristics of KDD dataset
Type Number of patternsNormal training 972781Normal testing 60593
DoS 229853Probe 4166U2R 228R2L 16189
5.4.3 Experiment 5.3
For the third experiment live traffic generated at Computer science and engineering
departmental network of IIT Guwahati is used. Traffic is collected for a period of 8
hours. A system within the network generated a series of attacks against prior identified
hosts within the network. The objective here is to generate a dataset which is unbiased
as it gets mixed with the live network traffic. The time instances when a particular attack
has started and ended are noted; so the traffic could be labeled accordingly. Set of time
based features mentioned earlier are extracted by setting time window to 1 minute for this
experiment. Characteristics of the dataset generated is shown in Table 5.7. Dictionary of
attacks simulated within the live environment are listed in Table 5.8.
Table 5.9 shows variation of Detection Rate and Accuracy for different values of δincR and
number of clusters; trends are similar to Experiment 5.1 and Experiment 5.2.
5.4.4 Comparison with ADWICE
To show how the proposed algorithm reduces false alarms in comparison to ADWICE
a comparison is done in terms of best case Accuracy (for chosen δincR = 25% of Ri) on
the KDD dataset; results are reported in Table 5.10. Since results are shown for 12000
clusters in ADWICE, here the comparison is reported for the same number of clusters.
It may be observed form the table that the proposed IDS improves Accuracy for all the
TH-1076_NHUBBALLI

150 Chapter 5. Header anomaly detection using data summarization
Table 5.6: Accuracy and Detection Rate in Experiment 5.2
NC Train time type δincR% Acc Det Rate Overall Overallof Ri Acc Det Rate
12000 6m:51s:24ms
DoS 0% 099.78% 100.00% 93.71% 99.64%U2R 025.92% 076.75%R2L 096.84% 094.81%
Probe 089.28% 100.00%DoS 5% 099.80% 100.00% 99.39% 99.44%U2R 027.53% 075.00%R2L 097.06% 091.81%
Probe 090.25% 100.00%DoS 10% 099.83% 100.00% 99.46% 99.27%U2R 029.05% 071.49%R2L 097.32% 089.21%
Probe 091.23% 100.00%DoS 15% 099.86% 100.00% 99.63% 99.24%U2R 032.91% 068.86%R2L 097.77% 088.95%
Probe 092.83% 099.49%DoS 20% 099.90% 100.00% 99.67% 98.88%U2R 039.47% 064.91%R2L 098.38% 083.40%
Probe 095.40% 099.37%DoS 25% 099.95% 100.00% 99.80% 98.20%U2R 054.15% 060.09%R2L 099.04% 074.12%
Probe 097.25% 098.99%
Table 5.7: Characteristics of IIT Guwahati dataset
Type Number of PatternsNormal Training 10000Normal Testing 7376Attack Testing 11010
TH-1076_NHUBBALLI

5.4. Experimental results 151
Table 5.8: List of attacks present in IIT Guwahati dataset
UDP ScanTCP ScanPing ScanIntense ScanQuick ScanTracerouteSlow Comprehensive ScanTCP Connect ScanTCP SYN ScanSCTP INIT ScanTCP ACK ScanTCP NULL ScanTCP FIN ScanTCP XMAS ScanTCP Window ScanIP Protocol ScanRPC ScanUDP FloodARP FloodICMP FloodARP SpoofingSYN Flood
TH-1076_NHUBBALLI

152 Chapter 5. Header anomaly detection using data summarization
Table 5.9: Accuracy and Detection Rate in Experiment 5.3
NC Train Time δincR % of Ri Accuracy Det Rate
250 0m:10s:928ms
0% 095.00% 096.97%5% 097.03% 093.84%
10% 097.39% 091.80%15% 098.13% 090.48%20% 098.76% 089.15%25% 099.20% 086.24%
300 0m:22s:13ms
0% 098.32% 097.67%5% 098.99% 094.40%
10% 099.09% 092.32%15% 099.17% 090.82%20% 099.32% 090.53%25% 099.58% 089.56%
350 0m:32s:22ms
0% 099.02% 098.13%5% 099.16% 095.10%
10% 099.27% 093.25%15% 099.50% 092.02%20% 099.77% 091.03%25% 099.97% 090.00%
400 0m:32s:22ms
0% 099.26% 099.22%5% 099.44% 096.27%
10% 099.68% 094.99%15% 099.70% 092.99%20% 099.89% 091.93%25% 099.99% 091.51%
TH-1076_NHUBBALLI

5.5. Conclusions 153
classes of attacks in the KDD dataset. ADWICE has a Detection Rate of 95% in the best case
while the proposed algorithm has a Detection Rate of 99.64% in the best case (for chosen
δincR = 0% of Ri). The proposed scheme has better Accuracy and Detection Rate compared
to ADWICE. In other words, the proposed header based anomaly detection system han-
dles false alarms better than ADWICE thereby leading to effective alarm generation. The
comparative results can be explained as follows.
Table 5.10: Comparison of Accuracy with ADWICE
Class ADWICE Proposed schemeDoS 99.00% 99.95%
Probe 97.00% 97.25%U2R 31.00% 54.15%R2L 92.00% 99.04%
BIRCH (algorithm used in ADWICE) do not capture the density information of the
clusters well. A fixed threshold T is selected and used as the limiting factor of radius for all
clusters. In practice same threshold do not work for all the clusters. When there is density
variation it is expected that clusters would have different radii. Thus, a cluster depended
decision is a more suitable choice than the fixed threshold. The proposed algorithm uses
cluster quality index to make the merging decisions. A new feature vector is added to
a cluster only if it improves the cluster quality, and two clusters are merged only when
number of clusters exceeds the permitted maximum number NC. The algorithm merges
only two most similar clusters measured using D2. In other words, the proposed scheme
do not consider fixed radius and allows clusters to have any radii as long it is including
similar feature vectors in it which ensures cluster quality. The improved cluster quality in
turn results in better partitioning of attack feature vectors from the normal ones, thereby
improving Accuracy and Detection Rate.
5.5 Conclusions
Most of the header based anomaly detection systems fall into cluster analysis category.
As networks become faster in operation, the amount of data that needs to be analyzed
TH-1076_NHUBBALLI

154 Chapter 5. Header anomaly detection using data summarization
becomes huge. These clustering techniques require more than one pass of the dataset, so
the anomaly detection schemes cannot work for these high speed networks. To handle
this situation, schemes have been proposed which use data summarization techniques
like BIRCH. Data summarization techniques may generate improper clustering which
results in false alarms in the anomaly detection systems using them. In this chapter, a
header based anomaly detection system was presented, based on modified BIRCH, which
is capable in handling large dataset yet minimizing false alarms. The proposed technique
is verified on 3 datasets and the results illustrate effective alarm generation. In the next
chapter an anomaly detection system is proposed which works on data generated from
packet payloads.
TH-1076_NHUBBALLI

Chapter 6
Payload based anomaly detection using
layerwise n-gram analysis
6.1 Introduction
Anomaly detection systems are used for detection of new attacks. For detecting sophis-
ticated application level attacks, payload based anomaly detection systems are required,
which model the normal (benign) behavior of packet payload and trigger an alarm when-
ever they observe traffic that do not confirm to the learnt benign behavior. Although
these anomaly detection systems are capable of detecting new application level attacks,
the number of FNs are much higher [128] compared to header based anomaly detection
systems. Effectiveness of payload based anomaly detection systems depend on accurate
modeling of benign payload. Modeling the normal behavior from payloads is difficult
compared to packet headers due to the following reasons.
• Unlike header there is no defined structure for payload.
• As payload size is large, any analysis is computationally expensive.
• Payload of different applications differ in nature. For example, what content HTTP
application normally has is not same as Telnet application. In order to learn the
benign behavior of these applications a separate model needs to be built for each
application.
TH-1076_NHUBBALLI

156 Chapter 6. Payload based anomaly detection using layerwise n-gram analysis
There are methods proposed in the literature for payload based anomaly detection [103,
134, 135] mainly using n-gram based analysis. These schemes give good Detection Rate but
only if trained with payloads from normal packets (i.e., pure dataset). It may be noted that
availability of pure dataset is far from reality. Thus the anomaly detection systems are as
good as the dataset that is supplied. Reported works on payload based anomaly detection
systems [103, 134, 135] provide high Detection Rate on clean HTTP dataset. However, in
the present chapter it will be shown how Detection Rate suffers when training dataset is
impure. Henceforth, in this chapter pure dataset indicates payloads from only normal
packets and impure if the dataset contains payloads from both normal and attack packets.
Park et al. in [99] have proposed an HIDS which is tolerant to impure training dataset.
However, to the best of our knowledge, there is no payload based network anomaly
detection system which can handle impure training dataset.
In this chapter, an impurity tolerant payload based network anomaly detection system
“Layergram” is proposed. Layergram models the n-grams appearing in benign payloads
along with their frequency information, which makes the model tolerant to the impurity
in the training dataset. To put the problem into perspective the following question is
answered “to what extent the built model can survive the impurity of the training dataset”.
The contributions of this chapter are the following.
• An impurity tolerant payload based anomaly intrusion detection system is devel-
oped, involving the following.
– A data structure termed as n-gram-tree is used to store the n-grams found in
the training dataset along with their frequency information. A single n-gram-
tree can store n-grams of all orders, which makes it efficient for storage. Use
of the frequency information makes the model more tolerant to impurities in
training dataset.
– For testing a new packet, layerwise analysis is performed in the n-gram-tree,
starting with lower layers (i.e., lower order n-gram analysis) and subsequently
going to higher layers only if required. If a packet is found anomalous at a
lower layer, analysis is not required for higher layers. A packet is declared
normal if it is declared so by all layers. So layerwise analysis makes the testing
procedure computationally efficient.
TH-1076_NHUBBALLI

6.2. Related work 157
• Time and space complexity of building the n-gram-tree and testing of new packets
is presented and shown to be practically feasible.
• A comparative study of Layergram with Anagram [134] is done using impure training
dataset, which illustrates Layergram’s superiority over Anagram in terms of effective
alarm generation.
Rest of the chapter is organized as follows. Section 6.2 discusses relevant literature on
payload based anomaly detection technique to detect application based attacks. Section
6.3 describes the proposed method and Section 6.4 deals with its complexity analysis. A
method to compress the n-gram-tree to optimize space requirement is discussed in Section
6.5. Section 6.6 presents experimental results and the chapter is concluded in Section 6.7.
6.2 Related work
For the sake of readability a brief summary of various techniques for payload based
anomaly detection (discussed in Subsection 2.3.2 of Chapter 2) is reported here. As most
of the payload based anomaly detection systems (including Layergram) use the concept of
n-grams, a brief background on n-gram based modeling and analysis for payload based
anomaly detection is also given in this section.
As described in Chapter 2, following are the major schemes for payload based anomaly
detection which use n-gram based modeling and analysis.
• PAYL[135]: PAYL models the payload using n-grams of first order. It extracts 256
features from the payload of every packet to generate the feature vector. Each feature
is one of the 256 possible ASCII values of a byte. Then a simple model of normal
system behavior is derived with average and standard deviation of these vectors.
A test feature vector is declared as attack if its distance with the mean exceeds a
threshold. This approach has low Detection Rate (50%). In addition it is shown that,
n-gram model of size 1 can be easily evaded [73]. Higher order n-grams could not
be used in PAYL due to the dimensionality problem.
• To minimize the dimensionality problem as encountered in PAYL [135], Ke Wang et
al., in Anagram [134] introduced the concept of binarizing the n-grams. The idea is
TH-1076_NHUBBALLI

158 Chapter 6. Payload based anomaly detection using layerwise n-gram analysis
to store binary decision regarding the occurrence of n-grams in the training dataset
and build the normal model. Anagram uses highly space efficient bloom filters for
storing the n-grams. Bloom filter is a compressed data structure that uses hashing
to map higher order n-gram to a smaller hash value. During testing, n-grams from
the test packet that appear in the training dataset are counted. If the number of
n-grams that cannot be found in the training dataset exceeds a preset threshold,
attack is detected. The idea is motivated by the fact that every attack packet should
contain some byte combinations which are not similar to normal packets. In essence
Anagram is a matching scheme which uses database of good n-grams and uses
an efficient query optimization offered by the bloom filters. Furnished results of
Anagram illustrate high Detection Rate of HTTP traffic. Anagram showed that using
higher order n-grams makes it difficult for attacks to evade it, thereby achieving high
Detection Rate. However, as binarized n-grams are used for modeling, frequency
information is not captured, rendering the model non tolerant to impure training
dataset. In the experimental section of this chapter, the impact of binarization on
Detection Rate and Accuracy for impure dataset is shown.
Since most of the payload based anomaly detection techniques use n-gram based
modeling, some background on n-gram based modeling and analysis is given in the next
subsection.
6.2.1 n-gram based payload modeling and analysis
The technique of n-gram analysis is a well known statistical feature extraction method
and has been used successfully in many applications such as spoken language processing
[141], indexing structure [72], spam filtering [47] etc. An n-gram of order i is a sub-
sequence of i consecutive items in a given sequence of items. For example in the sequence
a, b, c, d, e, f the sub-sequences of 2 are 〈a, b〉, 〈b, c〉, 〈c, d〉, 〈d, e〉 and 〈e, f 〉, which are termed
as n-grams of order 2. In the context of payload based anomaly detection system, bytes
of network packet are the sequences. n-grams generated from this sequence constitute
feature vectors [135]. Since each byte can take one of the 256 possible ASCII values, the
number of different possible n-grams of order 1 are 256. In general, for any given order i
the number of n-grams is O(256i). Lower order n-grams such as 1-gram and 2-grams are
TH-1076_NHUBBALLI

6.2. Related work 159
generally used because of their low complexity, however, techniques using them have low
Detection Rates [73]. Higher order n-grams provide better results but are computationally
expensive. In case of payload analysis, the number of n-grams generated from a packet is
very low compared to the number of all possible n-grams (for any order). This is because
maximum size of a packet payload is usually 1440 bytes, making the number of possible
n-grams for order i to be (1440−i)+1 (generated with a sliding window). Typically for i = 5
the number of n-grams (i.e, number of features in a feature vector) is O(2565), however,
only (1440 − 5) + 1 = 1436 n-grams (of order 5) are possible for one packet. Redundancy
(i.e., same ASCII values) in payloads further reduces the number of n-grams. So, the
feature vector space is sparse.
An example of “Code red worm” is discussed to illustrate modeling and attack detec-
tion using n-grams. Code red worm results in buffer overflow attack. Broadly speaking,
buffer overflow occurs when malicious program writes more information into the buffer
than the space it has allocated in the memory. This allows an attacker to overwrite data
that controls the program execution path thereby giving control of the program to execute
the attackers code instead of the process code. The payload of the worm is shown below.
GET /default.ida?NNNNNNNNNNNNNNNNNNNNNNNNN
NNNNNNNNNNNNNNNNNNNNNNNNNNNNNNNNNNNN
NNNNNNNNNNNNNNNNNNNNNNNNNNNNNNNNNNNN
NNNNNNNNNNNNNNNNNNNNNNNNNNNNNNNNNNNN
NNNNNNNNNNNNNNNNNNNNNNNNNNNNNNNNNNNN
NNNNNNNNNNNNNNNNNNNNNNNNNNNNNNNNNNNN
NNNNNNNNNNNNNNNNNNN
%u9090%u6858%ucbd3%u7801%u9090%u6858%ucbd3%u7801
%u9090%u6858%ucbd3%u7801%u9090%u9090%u8190%u00c3
%u0003%u8b00%u531b%u53ff%u0078%u0000%u00=a HTTP/1.0
There is a sequence of character “N” in the payload, whose length is more than
the corresponding space allocated in the memory thereby leading to buffer overflow
attack. A payload based anomaly detection system which models the payload information
using higher order n-grams can detect this worm. n-grams of order 1 (i.e, model the
payload using n-grams of order 1) for this payload are: 〈G〉, 〈E〉, · · · , 〈N〉, 〈N〉 · · · , 〈0〉. It
TH-1076_NHUBBALLI

160 Chapter 6. Payload based anomaly detection using layerwise n-gram analysis
may be noted that since single occurrence of character “N” in sequence can appear in
normal payload too, it is not possible to detect this attack. n-grams of order 2 for this
payload are: 〈GE〉, 〈ET〉, · · · , 〈NN〉, 〈NN〉 · · · , 〈.0〉. n-grams of order 3 for this payload
are: 〈GET〉, 〈ET/〉, · · · , 〈NNN〉, 〈NNN〉 · · · , 〈1.0〉. It may be noted that since probability of
consecutive (2 or 3) occurrence of character “N” is generally low in normal payload, it is
possible to detect this attack (using n-grams of order 2 or 3).
6.3 Proposed approach: payload based anomaly detection
using layerwise n-gram analysis
This section describes the proposed scheme Layergram - a layered n-gram based statistical
model for payload anomaly detection. The method involves training phase and testing
phase, detailed as follows.
• Training phase
– Tree construction: An n-gram-tree is built with payloads of training dataset
where some impurity may be present. A node of layer (or level) i (1 ≤ i ≤ nmax)
of the tree captures a distinct n-gram of order i found in the training dataset
with its frequency of occurrence.
– Binning: Certain frequency bands (or windows) are created and n-grams
whose frequencies falling within a band are binned together and a (anomaly)
score is given. This involves two sub-steps–(i) selection of appropriate number
of bins (i.e., size of the ranges) and (ii) assigning anamoly score to the bins
– Determination of appropriate threshold for declaring a packet as attack.
• Testing phase
– First, n-grams of order 1 are generated for the payload under test. Scores for
all the 1-grams generated are calculated from the 1st layer of the n-gram-tree.
If the payload is determined as normal, the process is repeated for next layer
and so on. The payload is declared normal, if for all layers (1 ≤ i ≤ nmax) the
TH-1076_NHUBBALLI

6.3. Proposed approach: payload anomaly detection using n-gram analysis 161
1-grammodel
n-grammodel
2-grammodelPacket
Normal Normal
Abnormal Abnormal Abnormal
Normal
Figure 6.1: Proposed payload based anomaly detection system
payload is found normal. If at any layer the payload is found as abnormal,
attack is detected and processing ends.
The basic architecture of the layer based analysis of packets is shown in Figure 6.1.
6.3.1 Training phase
Training phase involves 3 substeps, namely (i) n-gram-tree construction, (ii) frequency
binning and (iii) threshold selection. Each of these substeps are elaborated subsequently.
6.3.1.1 n-gram-tree construction
The n-gram-tree is built with payloads of training dataset. A node at layer i (1 ≤ i ≤ nmax)
represents an n-gram of order i found in the training dataset. The node also has the
frequency of occurrence of the n-gram. A single tree stores n-grams of all orders efficiently.
The idea is motivated by the antimonotonicity property of the n-grams i.e., there can not
be an n-gram of higher order with higher frequency than that of its constituent lower
order n-grams.
The n-gram-tree comprises a dummy root. A node x at level i along with all nodes in
the path from root to x represents an n-gram of order i. For example, let 〈x0, x1, x2, · · · , xi〉
be the path from root x0 to xi, a node at level i. This path represents an n-gram (of order
i) 〈a1, a2, · · · , ai〉, where each at (1 ≤ t ≤ i) is the ASCII value corresponding to the node
xt. The same path also includes smaller grams e.g., the sub-path 〈x0, x1, x2〉 represents the
n-gram (of order 2) 〈a1, a2〉. So, nodes of the first level represents all the n-grams of order
1. The nodes of layer 1 constitute the layer-1 anomaly detection system. Similarly, nodes
of the first level together with the nodes of the second level form the layer-2 anomaly
detection system. In general, nodes at level i together with nodes of levels ranging from
1 to i − 1 represent the n-grams of order i and the layer-i anomaly detection system.
TH-1076_NHUBBALLI

162 Chapter 6. Payload based anomaly detection using layerwise n-gram analysis
Algorithm 6.1 and Algorithm 6.2 together construct the n-gram-tree. In the tree con-
structed by these algorithms, there is a dummy root node. Each node (other than root)
has two components as ASCII value and frequency count.
Algorithm 6.1 : Algorithm for generating n-grams
Input : packetcount - number of network packets
Input : NP1,NP2, · · · ,NPpacketcount - network packets
Input : nmax - highest order n-grams to be generated.
Output : n-gram-tree
1: for I = 1 to packetcount do
2: payloadsize← Size of payload of NPI
3: for J = 1 to nmax do
4: Generate (payloadsize − J + 1) number of n-grams of order J from NPI, each of
format 〈a1, . . . , aJ, 1〉 /* 1 is the frequency */
5: Merge all same n-grams in Step-4 to a single n-gram of format (〈a1, . . . , aJ,F〉)
where F is the number n-grams merged.
6: PJis set of n-grams of order J generated from NPI.
7: end for
8: Call Algorithm 6.2 with PJ, 1 ≤ J ≤ nmax as input.
9: end for
Algorithm 6.2 : Algorithm for constructing n-gram-tree
INPUT: PJ, 1 ≤ J ≤ nmax (Algorithm 6.1)
Output: n-gram-tree.
1: Create a dummy ROOT node.
/*Layer 1 construction */
2: for every p ∈ P1 where each p is of the form 〈a1,F〉 do
3: if there is no child for ROOT with value 〈a1〉 then
4: Add a child to ROOT and set node value to 〈a1〉 and frequency to F
TH-1076_NHUBBALLI

6.3. Proposed approach: payload anomaly detection using n-gram analysis 163
5: else
6: Find the child node y of ROOT with value 〈a1〉
7: Increment frequency of y by F
8: end if
9: end for
/*end of layer 1 construction*/
/*layer 2 construction */
10: for every p ∈ P2 where each p is of the form 〈a1, a2,F〉 do
11: Find the child node x of ROOT with value 〈a1〉
12: if there is no child for x with value 〈a2〉 then
13: Add a child node to x and set its value to 〈a2〉 and Frequency to F
14: else
15: Find the child node y of x with value 〈a2〉
16: Increment its frequency by F
17: end if
18: end for
/*end of layer 2 construction*/
/*layer nmax construction */
19: for every p ∈ Pnmax where each p is of the form 〈a1, a2, · · · , anmax,F〉 do
20: Find the (last) node x having the value of anmax−1 in the path 〈a1, a2, · · · , anmax−1〉.
21: if there is no child for x with value 〈anmax〉 then
22: Add a child node to x and set its value to 〈anmax〉 and Frequency to F
23: else
24: Find the child node y of x with value 〈anmax−1〉
25: Increment its frequency by F
26: end if
27: end for
/*end of layer nmax construction*/
This construction is illustrated with the example of a single packet having payload
length of 18 bytes (i.e., packetcount = 1 and size of payload of NP1 = 18). Let the sequence
of bytes have the ASCII values 1, 2, 5, 2, 3, 4, 1, 4, 2, 1, 2, 5, 2, 3, 4, 1, 4, 2. Step 4 of Algorithm
TH-1076_NHUBBALLI

164 Chapter 6. Payload based anomaly detection using layerwise n-gram analysis
6.1 generates the following n-grams of order 1: (〈1〉, 1), (〈2〉, 1), 〈5〉, 1), · · · , 〈2〉, 1). Step 5
of Algorithm 6.1 merges the same n-grams finally generating P1 = {(〈1〉, 4), (〈2〉, 6),(〈3〉, 2),
(〈4〉, 4), (〈5〉, 2)}. In a similar way P2 = {(〈1, 2〉, 2), (〈2, 5〉, 2), (〈5, 2〉, 2), (〈2, 3〉, 2), (〈3, 4〉, 2),
(〈4, 1〉, 2), (〈1, 4〉, 2), (〈4, 2〉, 2), (〈2, 1〉, 1)}.
The n-gram-tree (up to order 3) for this packet is shown in Figure 6.2. All the 1-grams
in P1 form the level 1 nodes. Now let the first 2-gram 〈(1, 2), 2〉 (from P2) be considered;
here a1 = 1, a2 = 2 and F = 2. In layer 1 the leftmost node (x11) has the value equal to
a1 = 1. From x11 there is no child. So a child x21 is created from x11 and its value made
equal to a2 = 2 and frequency equal to F = 2. This procedure will be repeated for all the
2-grams in P2. For layer 3 also same procedure is used with P3.
The procedure has to be repeated for every packet. Let there be another packet with 2
bytes of data having ASCII values 1, 2. Algorithm 6.1 finds n-grams of order 1, as 〈(1), 1〉,
〈(2), 1〉 and n-grams of order 2 as 〈(1, 2), 1〉. Updating the tree for the new packet again
starts with 1-grams. For the n-gram (of order 1) 〈(1), 1〉 as a child x11 with node value of
1 is present, the frequency of x11 is incremented by 1 (Step 6 of Algorithm 6.2). Similarly
node x12’s frequency is also incremented by 1. In the same way the single n-gram of order
2 〈(1, 2), 1〉 finds x11 as the match for its a1 and x21 for a2. Hence it just increments the
frequency of x21 by F(= 1). The revised tree after addition of the second packet is shown
in Figure 6.3.
6.3.1.2 Frequency binning
The basic idea of using the n-gram-tree for attack detection is based on the fact that
n-grams of higher frequencies generally correspond to normal behavior. Similarly, n-
grams of lower frequencies are probably from anomalous payloads. So, an anomaly score
based on frequency is to be associated with all the n-grams of the tree. One way is
to add an additional (anomaly score) field in the nodes of the tree, which increases the
space requirement. This additional space requirement can be avoided by assigning same
anomaly score to a range of frequencies and maintaining bins corresponding to each range.
In other words, the frequency of a node x, denoted as f (x), is mapped to a bin given by
bin( f (x)) such that f (x) lies within the range of the bin (bin( f (x))). The anomaly score for
node x is the anomaly score of bin( f (x)). This decouples the anomaly score from the node at
TH-1076_NHUBBALLI

6.3. Proposed approach: payload anomaly detection using n-gram analysis 165
2:6 3:2 4:4 5:21:4
2:2 4:2 3:2 4:2 1:2 2:2 2:2
5:2 2:2
5:2 1:1
4:2 2:2 2:1 1:2 4:2 1:1 3:2
ROOT
X11 X12 X13 X14 X15
X21 X22 X23 X24 X25 X26 X27 X28 X29
X31 X32 X33 X34 X35 X36 X37 X38 X39
Figure 6.2: n-gram-tree of order 3 built with one training packet
2:7 3:2 4:4 5:21:5
2:3 4:2 3:2 4:2 1:2 2:2 2:2
5:2 2:2
5:2 1:1
4:2 2:2 2:1 1:2 4:2 1:1 3:2
ROOT
X11 X12 X13 X14 X15
X21 X22 X23 X24 X25 X26 X27 X28 X29
X31 X32 X33 X34 X35 X36 X37 X38 X39
Figure 6.3: n-gram tree of Figure 6.2 after second packet is added
TH-1076_NHUBBALLI

166 Chapter 6. Payload based anomaly detection using layerwise n-gram analysis
the additional cost of few bins.
As discussed in the last section, frequency binning has 2 substeps–(i) selection of the
number of bins (i.e., size of the ranges) (ii) assigning scores to the bins. These steps are to
be repeated for all layers.
(i) Selection of number of bins for layer i
The well known Sturges’ rule [123] is used to determine the number of bins required.
Given the number of elements in a dataset, Sturges’ rule determines the appropriate num-
ber of bins. In the present case the number of bins is lowest integer higher than, 1 added
with the logarithm of number of nodes at level i of the tree (Equation 6.1).
numberbins = d1 + log(|nodes at level i o f n-gram-tree|e (6.1)
These bins are sequentially numbered as b1, b2, · · · , bnumberbins. The number of elements
which fall into each bin (except the last) is given by Equation (6.2). The last bin is filled
with elements that are left after all other bins are filled.
⌈|nodes at level i o f the n-gram-tree|
numberbins
⌉(6.2)
This approach equally distributes total number of distinct n-grams of a layer (i.e., |nodes
at level i of the n-gram-tree|) into the bins (except the last bin). Similarly, the fre-
quency range found in the n-grams at layer i is divided within the bins. If the fre-
quency range is from 1 to f requencymax, then range of first bin is f requencymax to
d f requencymax − f requencymax/numberbinse, range of second bin is ( f requencymax−
d f requencymax/numberbinse + 1) to ( f requencymax − 2.d f requencymax/numberbinse) and so
on, till the last but one bin. The range left over is assigned to the last bin. So, for a node x
with frequency f (x) the bin it falls into is computed using Equation 6.3.
bin( f (x)) = d f (x)/numberbinse (6.3)
(ii) Assigning anomaly score to the bins for layer i:
TH-1076_NHUBBALLI

6.3. Proposed approach: payload anomaly detection using n-gram analysis 167
As discussed earlier, an anomaly score is to be assigned to bins. This score is assigned
based on the concept of coverage. coverage of a bin b, denoted as coverage(b), is defined as
follows:
Ratio of sum of frequencies of all n-grams (of order i) falling into the bin b, to the sum of frequencies
of all n-grams (of order i) falling in all bins at level i.
The anomaly score of a bin b is given by Equation (6.4).
anomaly score(b) = |log(coverage(b))| (6.4)
Higher coverage implies that n-grams in the bin are of higher frequencies and should
have lower anomaly score. Similarly, lower coverage bins should have higher anomaly score.
coverage is always between 0 and 1. anomaly score is a magnified value of inverse of
coverage, obtained by absolute value of logarithm of the coverage.
6.3.1.3 Threshold selection
Finally, in the training phase, a threshold is to be determined for each layer. When a packet
is tested at a layer in the n-gram-tree, average anomaly score of the packet is determined
using individual anomaly scores of its n-grams. If the average score is higher than the
threshold, attack is declared. The steps to determine the threshold for any given layer i is
discussed next.
A subset of packets from training dataset are chosen randomly and n-grams of order
i are generated. anomaly scores of these n-grams are determined using steps similar to
n-gram-tree construction and binning. Subsequently, average anomaly score is determined
for the packets under consideration. This average anomaly score plus some δbin (δbin > 0) is
set as a threshold for layer i.
The intuition behind the threshold selection is the following. Average anomaly score
generated by the randomly chosen subset gives an approximate value of expected score
from the normal packets and the additional quantity δbin ensures the anomaly score of an
attack packet is higher than that of a normal packet. It has to be noted that, selection of
proper value for δbin is critical for controlling the false alarms generated. A lower value
of δbin will increase the Detection Rate but will increase false positives (thereby decreasing
Accuracy). On the other hand, a high value of δbin will increase false negatives (thereby
TH-1076_NHUBBALLI

168 Chapter 6. Payload based anomaly detection using layerwise n-gram analysis
decreasing Detection Rate).
6.3.2 Testing phase
In the testing phase, every incoming packet is evaluated layer wise against the n-gram-
tree, starting from layer 1. If at any layer the payload is detected to be anomalous, attack
is declared and processing of packet stops. The packet is declared normal if it passes
through all layers of the tree. The testing phase is discussed in detail in this subsection.
n-grams of order 1 are generated for the payload of the test packet. ASCII value of each
n-gram generated is searched in the layer 1 nodes of the tree. If a node x is found which
matches the ASCII value of the n-gram (of order 1) under consideration, it is assigned the
anomaly score of bin in which the frequency of x falls. If no node is found for the n-gram
in layer 1, an anomaly score which is two times the maximum anomaly score of all bins in
layer 1 is assigned. Finally an average of all the individual anomaly score of the n-grams
is calculated (termed as AVG-anomaly score1) and that becomes the anomaly score of the
packet for layer 1. If this average value is greater than the precalculated threshold, the
packet is declared as attack and processing stops. Else, the same procedure is repeated
with n-grams of order 2. If all the layers declare a packet to be normal, then the packet is
normal or attack free. Algorithm 6.3, discusses the testing phase for a layer i, 1 ≤ i ≤ nmax.
Algorithm 6.3 : Packet testing for layer i
INPUT: n-gram-tree, TP - testing packet, ATi-anomaly threshold for level i
OUTPUT: Status for TP
1: Generate all n-grams of order i from TP, say p1, p2, · · · , pnumberigrams /* let the number of
n-grams generated be numberigrams*/.
2: for J = 1 to numberigrams do
3: Search pJ in the ith level in the n-gram-tree. Let x be the node found for pJ. (x may
be NULL, if no match is found)
4: if pJ is not NULL then
5: anomaly score of pJ is anomaly score(bin( f (x)))).
6: else
7: anomaly score of pJ is 2*(maximum anomaly score of all bins in layer i)
TH-1076_NHUBBALLI

6.4. Complexity analysis 169
8: end if
9: end for
10: AVG-anomaly score is∑numberigramsJ=1 anomaly score o f pJ
numberigrams
11: if AVG-anomaly score ≥ ATi then
12: Declare TP abnormal
13: end if
6.4 Complexity analysis
6.4.1 Time complexity analysis
In this subsection a discussion on the time complexity of training (n-gram-tree construction
and binning) and testing phase are presented.
6.4.1.1 Time complexity analysis of training phase
Algorithm 6.1 and Algorithm 6.2 are used for n-gram-tree construction.
Time complexity of Algorithm 6.1:
For analysis, it is assumed that there are packetcount number of packets, each packet has a
length of payloadsize bytes and up to nmax levels are required to be generated in the tree.
The algorithm works for all packets (i.e., loop in Step- 1) and all n-grams (i.e., loop in
Step- 3). Step-2 calculates size of a packet, which is of O(1) complexity, as packet size
is defined in the packet header. Step 4 of Algorithm 6.1 generates all n-grams of order
i for the given packet. This requires a traversal of all bytes of the payload making its
complexity O(payloadsize). Step 5 requires merging of same n-grams (of order i). This
involves complexity O((payloadsize)2) as each n-gram has to be compared with every other
n-gram. Step 8 (i.e., Algorithm 6.1) involves O(∑nmax
I=1 ((payloadsize).256.I)) (will be shown
in complexity analysis of Algorithm 6.2). So, overall complexity of Algorithm 6.1 is
O((packetcount).{nmax.(payloadsize + (payloadsize)2) +∑nmax
I=1 ((payloadsize).256.I)}).
TH-1076_NHUBBALLI

170 Chapter 6. Payload based anomaly detection using layerwise n-gram analysis
Time complexity of Algorithm 6.2:
From Algorithm 6.2, it may be noted that n-gram-tree construction is done layerwise.
Since there are only 256 possible ASCII values, irrespective of the size of the packet, only
256 1-grams are possible. For packet size greater than 256, Step-5 of Algorithm 6.1 merges
some n-grams of order 1 resulting in 256 or less n-grams (of order 1). In a similar logic,
all possible n-grams of order i should be O(256i), i.e., O(|Pi|) = 256i. However this is not
the case. It may be noted that given a packet of size payloadsize bytes, there can be only
(payloadsize − i + 1), n-grams of order i. So, for simplicity of analysis, it is assumed that
there can be O(payloadsize) n-grams of order i, 1 ≤ i ≤ nmax, i.e., |Pi| = payloadsize.
Each node is identified by the ASCII value of the n-gram it is representing. So, number of
nodes at level I is O(256I).
Construction of layer 1 (Steps-2 to Step-8) is (O(256.(payloadsize))) explained as follows.
Step-3 and Step-6 require comparing values of a n-gram (of order 1) with all nodes of
level 1, thus having complexity of O(256). Steps-4 and Step-7 involve O(1) time. Steps
3 to Step-7 are to be repeated for all p ∈ P1. So overall complexity of Step-2 to Step-8 is
O(256.(payloadsize)).
Construction of layer 2 (Step 10 to Step-18) is O((payloadsize).256.2) and is described as
follows. Step 11 involves finding a node (x) at level-1 having value same as first byte (a1)
of the n-gram of order 2; this involves complexity of O(256). Step-12 and Step-15 require
comparing values of second byte (a2) of the n-gram with all child nodes of x at level 2,
thus having complexity of O(256). Step-13 and Step-16 involve O(1) time. Steps 11 to
Step-17 are to be repeated for all p ∈ P2. So overall complexity of Step-10 to Step-18 is
O((payloadsize).(256 + 256)) = O((payloadsize).256.2).
This construction technique can be generalized for any level i as O((payloadsize).256.i).
Complexity of binning
Binning has two steps for each layer of the n-gram-tree. Step (i), which computes the
number of bins, requires counting the number of nodes of n-gram-tree at the level under
consideration. Step (ii) requires adding the frequencies of all the nodes at the given layer
and also separately for the nodes falling in each bin. With all the frequency information,
anomaly score for each bin is computed using Equation 6.4. The same process is repeated
for all layers. So if all layers are taken together binning requires collection of ASCII values
TH-1076_NHUBBALLI

6.4. Complexity analysis 171
and corresponding frequencies for all nodes of the n-gram-tree and computations using
Equation 6.1 and Equation 6.4. The ASCII values and frequencies can be collected by
traversing all nodes of the tree, involving complexity O(number of nodes in the tree) i.e.,
O(1 + 256 + 2562· · · 256nmax) = O
(256(nmax−1)
256−1
).
Complexity of threshold calculation
It may be noted that threshold calculation for a layer i involves steps similar to generating
the layer i of n-gram-tree, binning for that layer and determining average anamoly score
for the nodes. As a subset of training dataset is used for threshold calculation, it does not
add to overall time complexity of training phase.
From the discussion on time complexity analysis of the training phase it may be noted
that all steps except binning, involves polynomial time in number of layers and payload
size. Complexity of binning is same as the number of nodes in the n-gram-tree, which
in the worst case is exponential in number of layers. It should also be noted that, due to
limited payload size and repetitive nature of the n-grams within the payload, practically
the complexity is much lower than the upper bound. In the experimentation section it
will be shown that number of nodes in the n-gram-tree is many fold less compared to the
worst case scenario.
6.4.1.2 Time complexity analysis of testing phase
Algorithm 6.3 is used for testing a packet at level i. Its complexity is discussed below.
Time complexity of Algorithm 6.3:
Step-1 generates all n-grams of order i from the payload and involves complexity of
O(payloadsize). Step-2 is repeated for all the payloadsize n-grams (generated in Step-1).
Step-3 searches each n-gram (generated in Step-1) at the ith level and involves O(256.i)
comparisons (as at each level a maximum of 256 comparisons are made). Steps-5 to
Step-7 involve constant time complexities. So the overall complexity is O((payloadsize) +
(payloadsize)(256.i)).
When a packet is normal Algorithm 6.3 is repeated for all layers making the overall
complexity of testing phase to be O(nmax.(payloadsize) + (payloadsize)∑nmax
I=1 (256.I)). So,
overall time complexity of the testing phase is linear in number of layers and payload
size.
TH-1076_NHUBBALLI

172 Chapter 6. Payload based anomaly detection using layerwise n-gram analysis
Training or n-gram-tree construction is an offline exercise. Although training phase has
polynomial time complexity, given the offline nature of the training, time required plays
secondary role. However testing is online and its time complexity plays the primary role.
As the proposed testing algorithm is linear (in number of layers and payload size) higher
order n-gram based analysis is feasible.
6.4.2 Space complexity analysisProposed n-gram-tree structure is a n-ary tree where the number of children for any node
is at most 256 (which is the number of ASCII characters). So, in the worst case an n-gram-
tree has O(
256nmax−1
256−1
)nodes. However, it is discussed in the experimentation section that the
tree size is significantly smaller in practical cases compared to the upper bound. Further,
to reduce space required for the n-gram-tree a scheme to compress the tree is discussed in
next section.
6.5 n-gram-tree compression
The technique for compressing the n-gram-tree is based on merging similar nodes. Before
discussing the technique the following definitions are introduced:
Definition 6.1 Equivalent nodes at leaf level: Two nodes xn1 and xn2 are said to be equivalent
if ASCII value of xn1 and xn2 are same AND f (xn1) = f (xn2).
Definition 6.2 Equivalent non-leaf nodes at level i: Two non leaf nodes xi1 and xi2 at level i
are said to be equivalent if all the four points holds :
• ASCII value of the xi1 and xi2 are same
• frequency are same i.e., f (xi1) = f (xi2)
• ∀x(i+1)1 nodes which is a child of xi1→∃x(i+1)2 which is a child of xi2 (i.e., for any child node x(i+1)1
of xi1 there exists a child node x(i+1)2 of xi2) such that ASCII value and frequencies of x(i+1)1 is same
as x(i+1)2.
• ¬∃x(i+1)2 which is a child of xi2 but not a child of xi1.
Equivalent nodes xi1 and xi2 are denoted as xi1Exi2. The algorithm for compression of the
n-gram-tree is given below.
TH-1076_NHUBBALLI

6.6. Experimental results 173
Algorithm 6.4 : Algorithm for n-gram-tree compression
INPUT: n-gram-tree
OUTPUT: Compressed n-gram-tree
1: for levelno = nmax to 2 do
2: for I = 1 to all nodes at levelno do
3: for J = 1 to all nodes at levelno do
4: if x(levelno)IEx(levelno)J then
5: delete x(levelno)J and reset its pointers to x(levelno)I
6: end if
7: end for
8: end for
9: end for
Algorithm 6.4 basically keeps only one of all the equivalent nodes in a layer. When some
node is deleted all pointers leading to the deleted node are diverted to the (equivalent)
node being retained. Algorithm 6.4 is illustrated with an example below.
Consider a series of bytes 〈a, b, a, b, c, c, d, a, b, c, c, d〉. The set of n-grams (of order 1) are
(〈a〉, 3), (〈b〉, 3), (〈c〉, 4) and (〈d〉, 2). Similarly the set of n-grams (of order 2) generated are
(〈a, b〉, 3), (〈b, a〉, 1), (〈b, c〉, 2), (〈c, d〉, 2), (〈c, c〉, 2) and (〈d, a〉, 1). The corresponding n-gram-
tree up to level 2 is shown in Figure 6.4.
It may be noted that there are two nodes namely x22 and x26 with same ASCII value and
same frequency value. Similarly x23 and x25 are also similar. To remove redundancy, node
x26 is deleted and the pointer from node x14 is redirected to node x22. Similarly node x25 is
removed and pointer from x13 is redirected to x23. The compressed tree is shown in Figure
6.5.
6.6 Experimental results
This section deals with experiments performed to study the performance of the proposed
scheme. First the dataset and attacks used for experiments are discussed. This is followed
by results pertaining to the major contribution of this chapter “effective alarm generation
of anomaly detection system when the training dataset is impure”. A comparison with
TH-1076_NHUBBALLI

174 Chapter 6. Payload based anomaly detection using layerwise n-gram analysis
b:3 c:4 d:2a:3
b:3 d:2a:1 c:2
ROOT
X11X12 X13 X14
X21 X22 X23 X24
c:2
X25
a:1
X26
Figure 6.4: n-gram-tree up to layer 2 (before compression)
b:3 c:4 d:2a:3
b:3 d:2a:1 c:2
ROOT
X11X12 X13 X14
X21 X22 X23 X24
Figure 6.5: n-gram-tree of Figure 6.4 after compression
TH-1076_NHUBBALLI

6.6. Experimental results 175
Table 6.1: Number of packets of DARPA99 dataset of 1st week
Day Total packets Training packets Testing packets1 161602 121201 404012 196605 147454 491513 189362 142021 473414 268250 201187 670635 150847 113135 37712
Total 966666 724998 241668
Anagram [134] in terms of Detection Rate and Accuracy is shown.
Also, in this section, results are reported to show that the actual size of the n-gram-tree (for
the dataset) is many times smaller compared to O(256nmax). This is followed by illustration
of the amount of compression achieved by the n-gram-tree compression algorithm. Finally,
experimental results are used to illustrate that Detection Rate is minimally compromised
due to binning.
6.6.1 Dataset and attacks
• Dataset: Payloads for HTTP requests from first week of DARPA 99 [84] are sepa-
rated and used in the experiments; packets of the first week comprises only normal
traffic. Although DARPA 99 dataset has been criticized by [61, 90] for the simulation
environment used for the collection of packets, to the best of our knowledge this is
the only publicly available dataset with complete payloads available. The dataset is
randomly divided into two groups for each day. First group consists of 75% of the
packets and second consists of 25% of the packets. Packets from the first group are
used as training dataset and the remaining 25% (second group) is used as testing
dataset. The details about the number of packets used in the experiments from
DARPA 99 (five days of first week) are given in Table 6.1.
• Attacks: Description of payloads of attack packets used in the experimentation is
given below. All the 4 types of attacks used here are shared by the authors of [103].
– Generic attacks: A total of 205 packets containing 66 HTTP attacks are con-
sidered for the case of generic attacks. Some of these attacks carry executable
TH-1076_NHUBBALLI

176 Chapter 6. Payload based anomaly detection using layerwise n-gram analysis
malicious code in the payload and others cause information leakage and de-
nial of service. This set of attacks includes the set shared by authors of [62]
plus another attack added by [103] that exploits a vulnerability (MS03-022) in
“Windows Media Service”.
– Shell-code attacks: Shell-code attacks contain 11 attacks in 93 packets. Shell-
code attacks inject executable code into payload and hijack the normal execu-
tion flow of target application. Some of the worms like Code-red use shell-code
attacks to propagate.
– Morphed shell-code (CLET) attacks: There are 792 packets for CLET attacks
in the dataset. These packets contain 96 polymorphic attacks generated using
polymorphic engine CLET [50]. Among the 11 shell-code attacks, 8 are chosen
for these polymorphic attack creation.
– Polymorphic Blending Attack (PBA) : PBA for these experiments consist of 6339
attacks [73] in 71449 packets. These attacks are created using the statistics of
normal dataset and mimicking the distribution. Polymorphic blending attacks
[73] are devised to defeat the statistics based anomaly detection techniques like
PAYL [135].
6.6.2 Accuracy and Detection Rate of Layergram and comparison
First a study is made on Detection Rate and Accuracy on the dataset discussed above where
the n-gram-tree is generated using pure dataset. For these experiments a random set of
5% packets from training dataset are chosen to calculate the threshold for each layer, using
the computation discussed in Subsection 6.3.1.3 and threshold δbin is set to 0.2.
Detection Rate and Accuracy are evaluated for each attack separately where the test
dataset comprises 25% of the DARPA 99 dataset of first week mixed with payloads of
attacks discussed in the last subsection. In layered analysis Detection Rate up to layer i
is the cumulative Detection Rate of all the individual layers up to i. In Layergram attacks
detected at a lower layer adds to the Detection Rate of all the higher layers, thereby in-
creasing the cumulative Detection Rate. Similarly a FP (i.e., normal packet declared as
attack) generated at lower level adds to the FP of all the higher layers, thereby decreasing
TH-1076_NHUBBALLI

6.6. Experimental results 177
cumulative Accuracy. Table 6.2, Table 6.3, Table 6.4 and Table 6.5 show Detection Rate
and Accuracy obtained for generic attacks, shell-code attacks, morphed shell-code attacks
and polymorphic blending attacks, respectively. It can be observed from these tables that
Detection Rate after layer 2 is quite high.
Table 6.2: Accuracy and Detection Rate for generic attack
Layer Detection Rate Accuracy1 60.00% 100.00%2 85.00% 100.00%3 100.00% 100.00%4 100.00% 99.999%5 100.00% 99.993%6 100.00% 99.017%7 100.00% 99.012%8 100.00% 99.001%
Table 6.3: Accuracy and Detection Rate for shell-code attacks
Layer Detection Rate Accuracy1 55.00% 100.00%2 79.00% 100.00%3 100.00% 100.00%4 100.00% 99.998%5 100.00% 99.895%6 100.00% 99.112%7 100.00% 99.012%8 100.00% 99.001%
In order to find the utility of the proposed layered approach, Detection Rate and
Accuracy are computed when the n-gram-tree is trained with impure dataset. Here a
fraction of attack payloads (whose Detecton Rate and Accuracy is being calculated itself) is
added to the training dataset. This addition maximizes the negative effect due to impu-
rity. Results are reported for generic attacks for different amount of attack packet payloads
added to the training dataset; similar trends have been observed for all attacks mentioned
in last subsection and are not presented. This experiment illustrated “to what extent the
trained model can survive the impurity of the training dataset”. Although one can filter
TH-1076_NHUBBALLI

178 Chapter 6. Payload based anomaly detection using layerwise n-gram analysis
Table 6.4: Accuracy and Detection Rate for morphed shell-code attacks
Layer Detection Rate Accuracy1 59.00% 100.00%2 82.00% 100.00%3 100.00% 100.00%4 100.00% 99.987%5 100.00% 99.895%6 100.00% 99.112%7 100.00% 99.012%8 100.00% 99.001%
Table 6.5: Accuracy and Detection Rate for polymorphic blending attacks
Layer Detection Rate Accuracy1 20.00% 100.00%2 66.00% 100.00%3 95.05% 100.00%4 95.89% 99.987%5 96.68% 99.953%6 96.72% 99.870%7 96.99% 99.568%8 97.05% 99.002%
TH-1076_NHUBBALLI

6.6. Experimental results 179
out known attacks from the training dataset, it is difficult to do so in case of attacks which
are yet to be identified. Thus it is important to build a model to survive such residual
impurities. Table 6.6 reports cumulative Detection Rate up to layers for generic attack
when different amount of impurities are added in training dataset. Also Detection Rate at
individual layers are shown in Table 6.7. Detection Rate for individual layer i, implies that
only n-grams of order i are generated from test payload, searched for anomaly score at layer
i in the n-gram-tree and declared as attack (normal) if AVG-anomaly score is higher (lower)
than threshold (TRi). In this experiment, results are reported from layer 3 and above
because it may be noted from Table 6.2 to Table 6.5 that in layer 2 and below, Detection Rate
is unacceptably low even with pure dataset. Cumulative Accuracy and layerwise Accuracy
are reported in Table 6.8 and Table 6.9, respectively.
TH-1076_NHUBBALLI

180 Chapter 6. Payload based anomaly detection using layerwise n-gram analysis
Tabl
e6.
6:C
umul
ativ
eD
etec
tion
Rat
eup
tola
yers
for
gene
ric
atta
cks
wit
him
pure
trai
ning
data
set
Laye
r5
pack
ets
15pa
cket
s25
pack
ets
40pa
cket
s50
pack
ets
100
pack
ets
150
pack
ets
205
pack
ets
399
.51%
64.3
9%51
.21%
44.8
7%41
.46%
32.7
1%32
.73%
31.7
1%4
100.
00%
81.4
6%62
.93%
46.8
3%46
.83%
36.0
9%37
.10%
31.7
1%5
100.
00%
86.8
2%67
.31%
48.7
8%46
.83%
41.4
6%37
.10%
33.1
7%6
100.
00%
87.3
1%75
.73%
51.2
1%47
.56%
42.9
2%37
.10%
33.0
7%7
100.
00%
96.5
8%95
.95%
96.0
9%90
.73%
85.5
8%76
.58%
36.0
9%8
100.
00%
97.0
7%96
.58%
96.0
9%90
.73%
85.5
8%77
.56%
46.0
9%
TH-1076_NHUBBALLI

6.6. Experimental results 181
Tabl
e6.
7:In
divi
dual
laye
rD
etec
tion
Rat
efo
rge
neri
cat
tack
sw
ith
impu
retr
aini
ngda
tase
t
Laye
r5
pack
ets
15pa
cket
s25
pack
ets
40pa
cket
s50
pack
ets
100
pack
ets
150
pack
ets
205
pack
ets
399
.51%
64.3
9%51
.21%
44.8
7%41
.46%
32.7
1%32
.73%
31.7
1%4
100.
00%
55.1
2%60
.00%
46.8
3%41
.95%
32.7
1%37
.10%
31.7
1%5
100.
00%
66.3
4%59
.51%
46.8
3%43
.43%
37.1
0%37
.10%
31.7
1%6
100.
00%
66.8
3%62
.44%
50.2
4%44
.87%
37.1
0%37
.10%
32.2
0%7
100.
00%
76.0
9%75
.61%
75.6
1%65
.85%
63.3
7%47
.32%
38.0
5%8
100.
00%
76.0
9%75
.61%
75.1
2%64
.39%
63.3
7%47
.32%
40.7
3%
TH-1076_NHUBBALLI

182 Chapter 6. Payload based anomaly detection using layerwise n-gram analysis
Tabl
e6.
8:C
umul
ativ
eA
ccur
acy
upto
laye
rsfo
rge
neri
cat
tack
sw
ith
impu
retr
aini
ngda
tase
t
Laye
r5
pack
ets
15pa
cket
s25
pack
ets
40pa
cket
s50
pack
ets
100
pack
ets
150
pack
ets
205
pack
ets
310
0.00
0%10
0.00
0%10
0.00
0%10
0.00
0%10
0.00
0%10
0.00
0%10
0.00
0%10
0.00
0%4
99.9
99%
99.9
99%
99.9
99%
99.9
99%
99.9
99%
100.
00%
100.
00%
100.
00%
599
.990
%99
.991
%99
.993
%99
.995
%99
.996
%99
.996
%99
.996
%99
.997
%6
99.2
00%
99.2
01%
99.2
04%
99.2
05%
99.3
01%
99.3
49%
99.4
11%
99.5
07%
799
.002
%99
.005
%99
.099
%99
.113
%99
.123
%99
.126
%99
.202
%99
.219
%8
98.9
99%
99.0
00%
99.0
08%
99.0
23%
99.0
98%
99.1
11%
99.1
15%
99.1
32%
TH-1076_NHUBBALLI

6.6. Experimental results 183
Tabl
e6.
9:In
divi
dual
laye
rA
ccur
acy
for
gene
ric
atta
cks
wit
him
pure
trai
ning
data
set
Laye
r5
pack
ets
15pa
cket
s25
pack
ets
40pa
cket
s50
pack
ets
100
pack
ets
150
pack
ets
205
pack
ets
310
0.00
%10
0.00
%10
0.00
%10
0.00
%10
0.00
%10
0.00
%10
0.00
%10
0.00
%4
99.9
99%
99.9
99%
99.9
99%
99.9
99%
99.9
99%
100.
00%
100.
00%
100.
00%
599
.994
%99
.995
%99
.995
%99
.996
%99
.996
%99
.996
%99
.996
%99
.997
%6
99.2
02%
99.2
05%
99.2
08%
99.2
09%
99.3
08%
99.3
56%
99.4
20%
99.5
16%
799
.012
%99
.012
%99
.103
%99
.121
%99
.132
%99
.139
%99
.215
%99
.229
%8
99.0
08%
99.0
12%
99.0
69%
99.1
13%
99.1
25%
99.1
31%
99.1
52%
99.1
90%
TH-1076_NHUBBALLI

184 Chapter 6. Payload based anomaly detection using layerwise n-gram analysis
The following observations can be made from the Table 6.6 to Table 6.9.
1. As more attack packets (impurity) are added to training set, Detection Rate falls and
Detection Rate is acceptable when impurity is within a certain limit.
2. Higher order n-grams are more resistant to impurities.
3. Cumulative Detection Rate is higher than individual layer based analysis.
4. Accuracy decreases with increase in Detection Rate.
Observation in point 1 can be explained as follows. Figure 6.6 shows top 1000 n-grams
of order 5 on the basis of their frequency of occurrence in the training dataset for both
normal and attack packets. Figure 6.7 shows the enlarged view of lower frequency portion
of Figure 6.6. In these graphs, y-axis represents frequency and x-axis represents top 1000
(order 5) n-grams numbered in decreasing order of frequency where integers are used
to index the n-grams (i.e., 1 represents the n-gram with highest frequency, 2 represents
n-gram with second highest frequency and so on). It can be noticed that after a few top
order n-grams, frequency of n-grams from both normal and attack dataset are almost
equal. In the absence of attack packets from training dataset, these low frequency n-
grams would have been either absent or had very low frequency and hence received a
very high anomaly score. Under impure dataset, these packets are part of training dataset.
This resulted in increase in frequency of these n-grams which elevates them to the higher
order bins and consequently resulted into lower anomaly scores being assigned to them.
As assigned anomaly score is low it results in lowering the Detection Rate.
The observation in point 2 can be explained as follows. The number of all possible
n-grams is limited to 256 in case of level 1 and 65536 in case of level 2 (of the n-gram-tree).
Differentiating attacks and normal behavior of the payload in terms of limited number of
n-grams is difficult. In other words, in case of lower order n-grams there are less number of
unseen n-grams in the attack packets compared to the normal packets. As attack packets
are added in the training dataset they quickly mask these unseen n-grams and hence
affect the Detection Rate. However, as the analysis goes to higher layers masking effect
is minimized because attacks and normal payloads can be differentiated by virtue of the
large number of all possible n-grams. Figure 6.8 shows the number of distinct n-grams
seen for training traffic versus rise in order of i. It is to be noted that number of different
TH-1076_NHUBBALLI

6.6. Experimental results 185
0
100000
200000
300000
400000
500000
600000
700000
800000
0 100 200 300 400 500 600 700 800 900 1000
Fre
quen
cy o
f n-g
ram
s
n-grams with decreasing order of frequency
Normal dataAttack data
Figure 6.6: Top 1000 frequency n-grams of order 5 from normal and generic attack payloads
0
50000
100000
150000
200000
0 100 200 300 400 500 600 700 800 900 1000
Fre
quen
cy o
f n-g
ram
s
n-grams with decreasing order of frequency
Normal TrafficAttack Traffic
Figure 6.7: Magnified version (lower frequencies) of Figure 6.6
TH-1076_NHUBBALLI

186 Chapter 6. Payload based anomaly detection using layerwise n-gram analysis
n-grams increases almost linearly as order of i increases thereby, increasing Detection Rate
with i.
0
50000
100000
150000
200000
250000
300000
1 2 3 4 5 6 7 8
No.
of d
istin
ct n
-gra
ms
Layer
n-grams from 75% traffic from week 1
Figure 6.8: Number of distinct n-grams in the training dataset versus layer
Cumulative Detection Rate in layered analysis implies that, attacks detected at lower
layer is added to the Detection Rate of higher layer; this explains observation in point 3.
In the process of detecting a large number of attacks some FPs are generated which
decreases the Accuracy: this explains point 4.
In addition, it can be noticed that Detection Rate of a particular layer is lesser than the
cumulative Detection Rate up to that layer. It implies that there are some attacks which are
not detected by a higher layer but are detected by a lower layer. It is observed that, this
is because of quantization error introduced due to binning. However if the layered serial
analysis is considered, there is no need for a higher order analysis if a lower layer detects
the attack.
6.6.2.1 Comparison with Anagram
In this subsection proposed Layergram is compared with Anagram [134] in terms of
Detection Rate and Accuracy. As Detection Rate and Accuracy obtained on pure training
dataset by both Anagram and Layergram are at par it is not shown here. A comparison is
done on impure training dataset and results are reported. Figure 6.9 shows the cumula-
TH-1076_NHUBBALLI

6.6. Experimental results 187
tive Detection Rate up to layer 8 for generic attack in case of Layergram and Anagram [134]
with increase in impurity in the training dataset; similar trends have been observed for
other attacks and are not reported in this chapter. It can be observed from the graph that
Anagram’s Detection Rate [134] falls much faster than Layergram as the dataset becomes
impure. n-grams of the attack packets (added as impurity) to the training dataset are
treated as normal because of the binary nature of Anagram. So, if the same generic attack
packets which are added to make the training dataset impure are used for the testing,
Detection Rate of Anagram falls sharply. However, in case of Layergram as frequency in-
formation is also retained this misinterpretation is avoided. In other words, n-grams of
the attack payloads (added as impurity) have lower frequency (compared to n-grams of
normal payload) and are rated with high anomaly score. So, even with impurity in training
dataset Layergram maintains Detection Rate better than Anagram. So Layergram outper-
forms Anagram in terms of effective alarm generation.
Figure 6.10 reports the comparison of Accuracy of both the schemes with increasing order
of n-gram analysis. It is evident from the figure that Accuracy of Layergram is at par
with Anagram in the lower layers, but at higher layers Anagram is slightly superior than
Layergram.
6.6.3 n-gram-tree size and compression
Table 6.10 illustrates number of nodes in the n-gram-tree before and after compression.
It may be noted that the number of nodes (even before compression) in the tree at any
level is many times lower than the worst case O(
256nmax−1
256−1
). For example up to 4 layers,
the cumulative count of n-grams is 137616 which is 0.0032% of the worst case 4311810305.
Further, from the table it may also be noted that there is almost 50% reduction in the
number of nodes with the proposed compression technique.
Figure 6.11 shows the number of n-grams generated for layer 3 with day wise increase
in the number of training packets (from DARPA 99 week one dataset). It may be noted
that the slope of the curve becomes almost flat with increase in the number of days. This
is because of the repetitive nature of the n-grams in the dataset.
In practice all possible n-gram values do not occur at any level. This is due to limited
payload size and redundancy in the payload. For example there are only 93 n-grams
TH-1076_NHUBBALLI

188 Chapter 6. Payload based anomaly detection using layerwise n-gram analysis
20
40
60
80
100
50 100 150 200
Det
ectio
n ra
te(%
) on
gen
eric
atta
ck d
atas
et
Number of generic attack packets added to training data
LayergramAnagram
Figure 6.9: Detection Rate comparison: Layergram versus Anagram with varying impurity(generic attacks) in training dataset
Table 6.10: Number of nodes created before and after compression
Layer Before compression After compression1 93 932 4653 36803 39507 148644 137616 518415 296440 1502036 505729 3090697 760240 5184078 1055684 599270
TH-1076_NHUBBALLI

6.6. Experimental results 189
90
92
94
96
98
100
102
104
3 4 5 6 7 8
Acc
urac
y
Layer
Layergram Anagram
Figure 6.10: Accuracy comparison: Layergram versus Anagram under impure (genericattack) training dataset
0
5000
10000
15000
20000
25000
30000
35000
40000
1 1.5 2 2.5 3 3.5 4 4.5 5
Dis
tinct
n-g
ram
s
Number of days
Number of n-grams after each day traffic
Figure 6.11: Cumulative distinct n-grams in training dataset versus number of days
TH-1076_NHUBBALLI

190 Chapter 6. Payload based anomaly detection using layerwise n-gram analysis
Table 6.11: Comparison of cumulative Detection Rate with and without binning
Layer With binning Without binning3 31.71% 34.63%4 31.71% 35.12%5 33.17% 37.56%6 34.09% 38.04%7 36.09% 38.04%8 46.09% 47.31%
of order 1 seen in the training dataset against 256 possible cases. So, the size of the
n-gram-tree always remains within practical limits and can handle large training datasets.
6.6.4 Effect of binning
All the n-grams that fall into one bin receive the same anomaly score although their fre-
quencies are not same. This has both positive and negative effects. The positive effect is
it reduces storage space. The negative effect is, in an extreme case where the variation in
frequencies of nodes (of the n-gram-tree) within a bin is high and yet all these nodes get
the same anomaly score. Experimentally it is shown that binning has minimal effect on the
Detection Rate of the scheme. Detection Rate is verified for generic attacks on an n-gram-
tree with 205 attack packets as impurity (worst case impurity for the present experiments)
in the training dataset, with binning and without binning. In the case without binning,
anomaly score is directly assigned to individual n-grams (for any layer i) by Equation 6.5.
anomaly score(n-gram) =∣∣∣log( Frequency o f n-gramTotal f requency o f all n-grams
)∣∣∣ (6.5)
Threshold value for the case with binning is also used for obtaining Detection Rate without
binning. Table 6.11 shows the Detection Rate comparison with and without binning. It
may be noted that Detection Rate varies by a small margin.
TH-1076_NHUBBALLI

6.7. Conclusions 191
6.7 Conclusions
In this chapter, a payload based anomaly detection system was presented, which uses
higher order n-grams yet having good tolerance to impurity in training dataset. Unlike
Anagram, in the proposed scheme frequency information of n-grams are retained for
modeling and analysis. A data structure called n-gram-tree is developed, where a single
tree can be used to store n-grams (with frequency) of all orders and analysis performed on
them. Further, for testing a new packet, layerwise analysis is performed in the n-gram-tree,
starting with lower layers and subsequently going to higher layers only if required. The
proposed technique is evaluated with DARPA 99 dataset and several variants of HTTP
attacks. Experimental results showed that Layergram performs better in terms of effective
alarm generation under impure training dataset compared to Anagram. The next chapter
provides a summary of the thesis and scope for future work.
TH-1076_NHUBBALLI

TH-1076_NHUBBALLI

Chapter 7
Conclusions and future scope of work
7.1 Summary of contributions of the thesis
Intrusion detection system is an integral part of network security. Depending on attack
type (i.e., known or unknown), different kinds of IDSs are used. For known attacks, sig-
nature or event detection systems are used, while for unknown attacks anomaly detection
systems are deployed. Quality of IDS is characterized in terms of various parameters
like, effective alarm generation, efficiency, ease of use, security, transparency and inter-
operability. The present thesis designed and implemented techniques for all variants of
network based IDSs namely, signature based, event based and anomaly (both header and
payload) based systems which enabled them to achieve effective alarm generation.
Signature based systems are good at detecting known attacks. One of the major issues
identified with signature detection systems, even for known attacks, is of high number
of FPs. The major reason for FPs is, in general, signature detection systems are run with
default set of signatures and alarms are generated for most attack attempts irrespective
of success or failure to exploit any vulnerability in the network under question. To
address this issue, Chapter 3 of the thesis designed and developed a FP filter for effective
alarm generation in signature detection systems. The filter basically works by correlating
alarms with vulnerabilities in the network being monitored by the signature detection
system. The alarms which correlate with some vulnerability correspond to successful
attacks and are retained, while the remaining ones are filtered out. The FP filter based
scheme improves Accuracy by a great extent, however, also results in compromise in
TH-1076_NHUBBALLI

194 Chapter 7. Conclusions and future scope of work
Detection Rate because a few TPs are also filtered out. To handle this Detection Rate issue,
as an enhancement to the proposed FP filtering scheme, application critically factor is
added to the filter. Experimental results illustrated that the proposed FP filter, enhanced
with application criticality factor, provides effective alarms in signature detection systems
by achieving high Accuracy yet maintaining 100% Detection Rate for critical applications.
There is a certain class of known attacks which do not change the syntax or sequence
of network traffic under normal and compromised situations, e.g., ARP spoofing attacks,
ICMP error and information messages based attacks. So signatures can not be written for
such attacks and therefore signature detection systems fail to detect them. To address such
special class of attacks an event detection system, using failure detection and diagnosis
theory of discrete event system, has been designed and developed in Chapter 4 to detect
ARP attacks. The proposed event detection system was shown to be capable of detecting
a large class of ARP attacks, yet does not violate standard ARP and does not have much
hardware/software overheads. The system was illustrated only on ARP attacks, however,
the basic idea of attack detection using difference in sequences of packets under normal
and compromised situation is generic and can be applied for all similar classes of known
attacks.
Anomaly detection systems are used for detecting new attacks and can be classified
into two types as, header based and payload based. Header based anomaly detection
systems use packet headers for modeling and analysis. These systems provide fairly
good Detection Rate and Accuracy for the attacks detectable by header statistics. The key
challenge in terms of efficiency in these systems arises when voluminous data (which is
generally the case in high speed networks) is to be processed using data summarization
techniques. A header based anomaly detection system for handling voluminous net-
work traffic using data summarization has been designed and implemented in Chapter 5.
The system makes some modifications in the well known data summarization algorithm
BIRCH, which achieves better clustering thereby resulting in higher Detection Rate and
Accuracy compared to similar schemes reported in literature.
Payload based anomaly detection systems are used for detecting application level
attacks because in such cases attack content is inside the payload and protocol behavior
is not violated. Effective alarm generation in payload based anomaly detection systems
is more involved compared to header based systems. Approaches found in the literature
TH-1076_NHUBBALLI

7.2. Scope for future work 195
for payload based anomaly detection systems provide good Detection Rate only if pure
normal dataset can be made available for training. However, availability of a dataset
that comprises only normal packets is far from reality in a practical scenario. To address
the issue of impure training dataset, a payload based anomaly detection system which
is tolerant to impure training dataset is designed and implemented using n-gram based
statistical models in Chapter 6. Tolerance to impure training dataset is achieved using
higher order n-grams and keeping frequency information of the n-grams seen in the
training dataset. However, keeping frequency information and use of higher order n-
grams is complex in terms of time and space complexity. In the proposed scheme, an
efficient data structure termed as n-gram-tree is used which can store higher order n-
grams with frequency information. Experiments illustrated that level of tolerance to
impurity is higher in the proposed payload based anomaly detection system compared to
similar schemes reported in literature.
7.2 Scope for future work
The schemes developed in the thesis successfully achieved effective alarm generation for
four types of network IDSs. In this section, some possible future extensions in these
schemes are discussed.
• The proposed FP filter for signature detection systems works by correlating alarms
with the threat profile i.e., vulnerabilities of the network. These vulnerabilities
are collected by scanning the network using vulnerability scanners. It may be
noted that vulnerabilities change periodically due to factors like, addition/removal
of hosts, patching of applications etc. So effectiveness of the proposed FP filter
is compromised if the threat profile is not updated regularly. At present in the
proposed scheme, the administrator updates the threat profile at regular intervals.
The administrator’s job can be simplified and issues due to outdated threat profile
can be avoided if a technique can be developed to automatically update the threat
profile. The technique would continuously monitor the network for changes and
update in threat profile can be triggered based in several criterions like, number of
changes (in vulnerabilities) raises above a threshold, changes made correspond to
critical applications etc.
TH-1076_NHUBBALLI

196 Chapter 7. Conclusions and future scope of work
• In the proposed event detection system for ARP attacks, a passive discrete event
system based detector is used for monitoring event sequences and detecting attacks.
Separate modules, which are not modeled explicitly using discrete event system, are
used for sending active probes against ARP requests/replies whose genuineness are
to be verified. If active DES framework [115] is used in the proposed event detection
system, then a single framework can be used for both active probing as will as attack
detection. A possible outline of the scheme is discussed below.
In an active DES framework, in addition to observable and unobservable events (of
passive framework) there are controllable and uncontrollable events. Controllable
events are to be exercised appropriately by the fault (attack, if applied to IDS)
detector such that some fault certain state can be reached (where attack is detected).
In case of IDSs using active techniques, the probing mechanism can be modeled as
controllable events. Other events namely, receipt of responses to the probe, other
(ordinary) packets etc. can be modeled as uncontrollable events. The active DES
based detector would fire the controllable event(s) whenever some packet is to be
verified (attack/normal). Following that genuineness of the packet under question
can be verified by the detector based on observation of sequences of uncontrollable
events.
• In the event detection system, only examples scenarios of what attack can be detected
were presented. As an extension of the work, a formal proof about the validity of
proposed system under all possible scenarios of ARP attacks can be given. Also,
repercussions of the attacks which are missed (if any) can be studied. The following
scenarios need to be considered.
– Presence of a single attacker.
– Presence of multiple attackers.
– All possible combinations of falsified IP-MAC pairings that can be used in
spoofing. Some of them are–(i) IP address of a genuine host with MAC address
of an attacker, (ii) IP address of a genuine host with a non-existing MAC
address, (iii) IP address of an attacker with MAC address of a genuine host,
(iv) IP address of a genuine host (which is down for some time) with MAC
TH-1076_NHUBBALLI

7.2. Scope for future work 197
address of an attacker, etc.
• The event detection system is illustrated only on ARP related attacks. As an ex-
tension of the work, the proposed system can be applied to similar other attacks
namely, ICMP based attacks, Domain Name Server (DNS) spoofing attacks etc. and
the effectiveness can be studied.
• Assessment regarding add on parameters required over the basic DES framework
[116] (like clock variable, model variable etc. in case of ARP) for modeling different
attacks can be studied. For example, in case of ICMP, congestion in the gateway is an
important parameter to be modeled, which may require simple arithmetic operators
like addition, division etc. to be performed in some states of the DES framework.
• The model used in the proposed payload based anomaly detection system is offline
implying that the model is first built using collected data and used to evaluate
network traffic later. As one of the extensions, the model can be made online where
n-grams seen in the testing procedure and determined to be normal are also added
to the model. This allows the model to learn continuously while in operation.
The continuous learning scheme would make the anomaly detection system more
capable of handling dynamic network behavior. Further, weightage can be given
to n-grams in the model based on factors like, how old the n-gram is or time since
when the n-gram last occurred etc. This time field facilities aging based weightage
to the n-grams which helps in handing network dynamism.
• The experimental results and assessment about efficiency of the proposed payload
based anomaly detection system are made on DARPA 99 dataset, which has been
criticized for the simulation environment used for collection of packets. A more
realistic view about the effectiveness of the proposed system can be obtained if
experiments are done on a real life dataset.
• All the four types of IDSs dealt with in this thesis detect different kinds of attacks.
So these IDSs are supplementary to each other and all of them are required to be
deployed together for a complete solution to detect network attacks. The most
promising extension of the thesis is in this direction where all the four types of IDSs
are deployed and their analysis interpreted in a coordinated manner. However,
TH-1076_NHUBBALLI

198 Chapter 7. Conclusions and future scope of work
as discussed earlier in the thesis, coordinated analysis is a very challenging task
because all the IDSs work in different domains. So techniques would be required
for effective alarm generation when these IDSs work in a coordinated environment.
TH-1076_NHUBBALLI

Appendix A
Failure detection and diagnosis using
discrete event systems
A.1 Introduction
Increase in complexity and automation of modern day systems have resulted in raise of
failures occurring in them. In order to maintain safety and reliability, failure detection and
diagnosis (FDD) is becoming a significant aspect of these systems. Several approaches to
FDD have been reported in the literature and can be broadly classified as fault-tree based
analysis [132], expert system based methods [136] and model based methods [42, 55, 116,
146]. Any kind of automated reasoning, ranging from failure diagnosability analysis to
stability analysis of complex systems, can be achieved efficiently through model based
representations. In a model based approach, a detailed process model is constructed
first. The system states are estimated from this model and the corresponding failure
condition is determined based on the values of the measurable system parameters. The
commonly used model based techniques are analytical redundancy based methods for
continuous time models [55, 138], discrete event system (DES) model based methods
[35, 36, 42, 110, 116, 146], hybrid system (HS) model based methods [34, 37, 147], etc.
Large scale dynamic systems, even with continuous dynamics, can be viewed as DESs
at some level of abstraction. Further, DES based models are simple and so are the as-
sociated algorithms. So, DES model based methods are used for FDD of a wide range
of applications. A DES is characterized by a discrete state space and some event driven
TH-1076_NHUBBALLI

200 Chapter A. Failure detection and diagnosis using discrete event systems
dynamics. Finite state machine (FSM) framework is naturally suited for modeling a DES
and accordingly has been used widely for FDD of DES models [65, 116, 144, 146]. In FDD
of DES models (based on FSM based framework), it is assumed that the set of states can be
partitioned according to (failure or normal) condition of the system. There is a condition
variable which depicts whether the system is in a failure state or a normal state. Anything
that can be measured in the system using sensor(s) is modeled as a measurable variable.
State variables are partitioned into measurable and unmeasurable ones. Obviously, the
condition variable is unmeasurable. The failure detection problem consists in determin-
ing, in finite time after occurrence of a failure, whether some measurable state variable
combination that corresponds to any failure can be reached. If the problem is to diagnose
the failure then the exact failure is to be pinpointed. Typically, the failure detection (or
diagnosis) procedure first constructs a detector (or diagnoser), which is a kind of state
estimator of the system. It is then checked whether the detector/diagnoser structure has a
property which ascertains that any failure is detectable/diagnosable within finite time of
its occurrence.
The appendix is organized as follows. In Section A.2 the FSM based DES model
is disused. Section A.3 presents failure modeling and the failure detetcion/diagnosis
problem. In Section A.4 construction of diagnoser is presented and the condition to be
checked for failure detection (diagnosis) is discussed. In Section A.5, the concept of FDD
using DES is illustrated using an example.
A.2 Discrete event system models
A discrete event system (DES) model G is defined as
G = 〈V,X,=,X0〉, (A.1)
where V = {v1, v2, ...., vn} is a finite set of discrete variables assuming values from some
finite sets, called the domains of the variables, X is a finite set of states, = is a finite set of
transitions and X0 ⊆ X is the set of initial states. A state x is a mapping of each variable
to one of the elements of the domain of the variable. A transition τ ∈ = from a state x to
another state x+ is an ordered pair 〈x, x+〉, where x is denoted as initial(τ) and x+ is denoted
TH-1076_NHUBBALLI

A.2. Discrete event system models 201
as f inal(τ). The following property is assumed to hold in a DES model:
• For any state of G there is an initial state from which it is reachable.
A trace of a DES model G is a sequence of transitions generated by G and denoted as
s∆=〈τ1, τ2, · · · 〉, where initial(τ1) is an initial state in X0 and the consecution property holds,
that is, initial(τi+1) = f inal(τi), for i ≥ 1. Traces are infinite and a finite prefix of a trace
is referred to as a “finite trace”. Henceforth, the consecution property for any “sequence
of transitions” is assumed. For any trace s = 〈τ1, τ2, · · · 〉, initial(s) = initial(τ1) and for a
finite prefix s = 〈τ1, τ2, · · · τ f 〉, f inal(τ f ) = f inal(s). A state x is said to be in a trace s, if
x = initial(τi), for some i ≥ 1. The set of all traces generated by G and their finite prefixes
is the language of G, denoted as L(G). The set L f (G) denotes the subset of L(G) comprising
the finite prefixes of the members of L(G). Naturally, L(G)− L f (G) is a subset of =w, where
=w is the set of all infinite sequences of =; L f (G) is a subset of =∗, the Kleene closure of =.
The post language of G after a finite prefix s of a trace, denoted as L(G)/s, is defined as
L(G)/s = {t ∈ =w|st ∈ L(G)}. (A.2)
L f (G)/s ⊂ L(G)/s comprises finite prefixes of the traces of L(G)/s.
A.2.1 Models with measurement limitations
Limitations of measurement give rise to uncertainty in states and transitions in the ob-
served dynamics of the model. In this subsection the notion of measurement limitation in
the DES framework is formally introduced and the consequent uncertainty in the states
and the transitions in G are characterized. To capture the measurement limitation, the set
of variables are partitioned into two disjoint subsets, Vm and Vu, of measurable and un-
measurable variables, respectively. Given such a partition, the transitions are partitioned
into two sets, =m and =u, of measurable and unmeasurable transitions, respectively, as
follows.
Definition A.1 Measurable and unmeasurable transitions: A transition τ = 〈x, x+〉 is said
to be measurable if x|Vm , x+|Vm , where x|Vm is the restriction of the function (defined by the state)
x to Vm. A transition that is not measurable is unmeasurable.
TH-1076_NHUBBALLI

202 Chapter A. Failure detection and diagnosis using discrete event systems
In other words, a measurable (unmeasurable) transition changes some (none) of the mea-
surable variables from its initial to the final state. It is assumed that there is no cycle of
unmeasurable transitions.
Definition A.2 Measurement equivalent states: Two states x and y are said to be (measure-
ment) equivalent, denoted as xEy, if x|Vm = y|Vm .
Definition A.3 Equivalent transitions: Two measurable transitions τ1 = 〈x1, x+1 〉 and τ2 =
〈x2, x+2 〉 are equivalent, denoted as τ1Eτ2, if x1Ex2 and x+1 Ex+2 .
Definition A.4 Projection operator:
A projection operator P : =∗ → =∗m can be defined in the following manner
P(ε) = ε,P(τ) = τ, τ ∈ =m,P(τ) = ε, τ ∈ =u,
P(sτ) = P(s)P(τ), s ∈ L f (G), τ ∈ =, (A.3)
where ε is the null string.
The operator P erases the unmeasurable transitions from the finite argument trace. The
term P(s) is called measurable finite trace corresponding to the finite trace s.
Definition A.5 Measurement equivalent traces: Two finite traces (or sequences of transi-
tions) s and s′ are measurement equivalent if P(s) = 〈τ1, τ2, ...τn〉, P(s′) = 〈τ′1, τ′
2, ...τn〉 and τiEτ′i ,
1 ≤ i ≤ n.
The symbol E is used to denote measurement equivalence of finite traces as well as that of
transitions, with slight abuse of notation. The inverse projection operator P−1 : =∗m → 2=∗
is defined as
P−1(s) = {s′ ∈ L f (G)|sEs′} (A.4)
Thus, P−1(s) includes all possible sequences of transitions that are equivalent to the finite
trace s. The projection operator P, the inverse projection operator P−1 and the notion of
measurement equivalence E of finite traces can be extended to traces ∈ =w, in a natural
way.
TH-1076_NHUBBALLI

A.3. Failure modeling 203
A.3 Failure modeling
Failure Modeling: Each state x is assigned a failure label by an unmeasurable status
variable C ∈ V with its domain = {N} ∪ 2{F1,F2,··· ,Fp}, where Fi, 1 ≤ i ≤ p, stand for permanent
failure status and N stands for normal status.
Definition A.6 Normal G-state: A G-state x is normal if x(C) = {N}. The set of all normal
states is denoted as XN.
Definition A.7 Fi-G-state: A G-state x is failure state, or synonymously, an Fi-state, if Fi ∈ x(C).
The set of all Fi-states is denoted as XFi .
Definition A.8 Normal-G-transition: A G-transition 〈x, x+〉 is called a normal G-transition if
x, x+ ∈ XN.
Definition A.9 Fi-G-transition: A G-transition 〈x, x+〉 is called an Fi-G-transition if x, x+ ∈ XFi .
A transition 〈x, x+〉, where x(C) , x+(C), is called a failure transition indicating the
first occurrence of some failure in the set x+(C) − x(C). Since failures are assumed to be
permanent, there is no transition from any state in xFi to any state in xN or from any state
in xFiF j to any state in xFi . Also, for a transition 〈x, x+〉, x(C) , {N} ⇒ x(C) ⊆ x+(C).
The following definition, formalizes the notion of diagnosis of failure Fi in the DES
model.
Definition A.10 Fi-diagnosability:
LetΨ(XFi) = {s ∈ L f (G)| the last transition of s is measurable and f inal(s) ∈ XFi}.
A DES model G is said to be Fi-diagnosable for the failure Fi under a measurement limitation if
the following holds
∃n ∈N s.t. [∃s ∈ Ψ(XFi){∀t ∈ L f (G)/s(|t| ≥ n⇒ D)}],
where the condition D is ∀u ∈ P−1[P(st)], f inal(u) ∈ XFi .
The above definition means the following. Let s be any finite prefix of a trace of G that ends
in an Fi-state and let t be any sufficiently long continuation of s. Condition D then requires
that there is at least one sequence of transitions, measurement equivalent with st (i.e.,
belonging to P−1(P(st))), shall end into an Fi-state. This implies that, along continuation t
of s, one can diagnose the occurrence of failure corresponding to Fi within a finite delay,
TH-1076_NHUBBALLI

204 Chapter A. Failure detection and diagnosis using discrete event systems
or more specifically, within at most n transitions after s.
If only detection of the fault Fi is the goal, the condition D is to be changed as: ∀u ∈
P−1[P(st)], f inal(u) ∈ XF, where XF comprises all failure states. The modified condition D
requires that there is at least one sequence of transitions, measurement equivalent with st,
that ends into some failure state.
A.4 Diagnoser
In this subsection, the construction method for the diagnoser O under measurement
limitation is developed. The diagnoser is represented as a directed graph
O = 〈Z,A〉, (A.5)
where Z is the set of diagnoser nodes, called O-nodes, and A is the set of diagnoser
transitions, called O-transitions. Each O-node z ∈ Z is a set of G-states representing the
uncertainty about the actual state and each O-transition a ∈ A of the form 〈zi, z f 〉 is a set of
equivalent transitions representing the uncertainty about the actual measurable transition
that occurs. Before discussing the procedure for constructing the diagnoser from G, the
following definitions are introduced.
Definition A.11 Unmeasurable successor and unmeasurable reach of a set of G-states:
The unmeasurable successor (set) of a set Y of states is defined as U(Y) =⋃
x∈Y{x+|τ = 〈x, x+〉 ∈ =u}.
The unmeasurable reach of a set Y of G-states, denoted as U∗(Y), is the reflexive-transitive closure
of unmeasurable successors of Y.
A.4.1 Construction of the diagnoser
The diagnoser is constructed starting from the initial state(s) of the model. The states in X0
are partitioned into equivalent subsets denoted as X01,X02, · · ·X0m. For all i, 1 ≤ i ≤ m, an
initial O-node z0i is obtained as the unmeasurable reach of X0i, i.e., z0i = U∗(X0i). The set of
all initial O-nodes is denoted as Z0 = z01∪· · ·∪z0m. The initial O-nodes capture the fact that
the diagnoser can infer a set z0i of the possible initial system states (or their unmeasurable
reach) by measuring the variables without waiting for the first measurable transition.
TH-1076_NHUBBALLI

A.4. Diagnoser 205
Given any O-node z, the O-transitions emanating from z are obtained as follows. Let =mz
denote the set of measurable G-transitions from the states x ∈ z. Let Az be the set of all
equivalence classes of =mz under E. For each a ∈ Az, a successor O-node z+ of z such that
z+ = f inal(a) can be created as follows. Let z+a = { f inal(τ)|τ ∈ a}; then z+ = U∗(z+a ) and a is
designated as: 〈z, z+〉. The set of diagnoser transitions is augmented as: A← A ∪ {a}, and
the set of O-nodes is augmented as: Z ← Z ∪ {z+}. Each a ∈ A is an ordered pair 〈z, z+〉,
where z = initial(a) and z+ = f inal(a). Thus, each O-node contains equivalent states. The
algorithm for diagnoser construction is discussed below:
Algorithm A.1 : Algorithm for construction of diagnoser O for a DES model G
Given: G, V = Vm ∪ Vu, = = =m ∪ =u
Begin
Partition X0 into equivalent subsets X01,X02, · · ·X0m;
For all i, 1 ≤ i ≤ m, z0i = U∗(X0i);
Z0 ← z01 ∪ · · · ∪ z0m;
Z← Z0;
A← φ;
for all z ∈ Z Do {
/* Find the set of measurable G-transitions (=mz) outgoing from z */
=mz ← {τ|τ ∈ =m ∧ initial(τ) ∈ z};
/* Find the set of all measurement equivalent classes Az, of =mz*/
For all a ∈ Az {
z+a = { f inal(τ)|τ ∈ a};
z+ = U∗(z+a );
Z = Z ∪ {z+};
A = A ∪ {a};
} /* For all a ∈ Az */
} /* for z ∈ Z */
End
TH-1076_NHUBBALLI

206 Chapter A. Failure detection and diagnosis using discrete event systems
Henceforth, states, transitions and traces of G are referred to as G-states, G-transitions
and G-traces, respectively. Similarly, for diagnoser nodes and transitions, the terms “O-
nodes” and “O-transitions”, respectively are used.
Definition A.12 Fi-O-node: An O-node, which contains an Fi-state, is called an Fi-O-node,
denoted as zFi ; the set of all Fi-O-nodes is denoted as ZFi .
When a diagnoser is in an Fi-O-node, then occurrence of failure Fi can be detected.
Definition A.13 Fi-certain O-node: An Fi-O-node z is called an Fi-certain O-node if z ⊆ XFi .
An Fi-O-node which is not Fi-certain is called Fi-uncertain.
When a diagnoser is in an Fi-certain O-node, then occurrence of failure Fi can be diagnosed.
A.5 An example: FDD using DES
First step of FDD using DES comprises modeling the system under normal and failure
conditions in DES framework. As already discussed, most of the large scale dynamic
systems, even with continuous dynamics, can be viewed as DES at a suitable level of
abstraction. For such systems, a DES model is to be developed by abstracting out the
continuous dynamics; temperature controller [28] is an example of such a system. Also,
there are systems without any continuous dynamics, which are inherently DESs; computer
networks, digital circuits etc. are examples of such systems. Once the DES model is
developed the diagnoser is constructed. Finally, it is checked, if there exist paths leading
to Fi-certain nodes (or Fi-nodes) in the diagnoser; if at least one such path exists, Fi is
diagnosable (or detectable).
In this section, the concept of FDD using DES is illustrated using an example of a
temperature controller discussed in [28, 30].
A.5.1 Temperature controller system
The temperature controller maintains temperature of the liquid (contained in a chamber)
between LOC and HOC, say (L < H and both L and H are above the ambient temperature). If
the initial temperature is greater than or equal to H◦C, H > H, then a coolant is circulated
through the chamber to lower the temperature faster (for safety from overheating) till
TH-1076_NHUBBALLI

A.5. An example: FDD using DES 207
the temperature falls to H◦C. The temperature controller is a nonlinear hybrid system.
The temperature of the plant is sensed by a temperature sensor and is converted into
an equivalent voltage which is fed to a controller. As long as the temperature is below
HOC, the controller keeps the heater ON whereby the temperature rises. The controller
switches OFF the heater when temperature rises above HOC. The output of the heater
controller is denoted by CH; CH = 0 (CH = 1) implies that the controller is to put the
heater OFF (ON). The temperature dynamics is governed by differential equations. When
the heater is OFF, the temperature, denoted by the variable T, decreases according to the
exponential function T(t) = θe−Kt; t is the time, θ is the initial temperature and K is a
constant determined by the plant. When the heater is ON, the temperature follows the
function T(t) = θe−Kt + h(1 − e−Kt), where h is a constant determined by the power of the
heater. If the initial temperature is higher than H◦C, then a coolant is circulated (denoted
by Fl = 1) and temperature is brought down faster following the equation T(t) = θe−A·Kt
to H◦C, where A is a constant > 1 such that the rate of fall of temperature by the equation
T(t) = θe−A·Kt is faster than T(t) = θe−Kt. The hybrid system model of the temperature
controller is illustrated in Figure A.1 (normal mode of operation). The hybrid automaton
has three states−− in x00 the heater is OFF and there is no flow, in x01 the heater is ON
and there is no flow and in x02 the heater is OFF and flow is ON to prevent overheating.
The state x00 is labeled as HFTF denoting heater OFF and tap OFF, x01 is labeled as HNTF
denoting heater ON and tap OFF and x02 is labeled as HFTN denoting heater OFF and tap
ON.
The hybrid automaton for the heater stuck-off failure is also shown in Figure A.1
(operation under heater stuck-off failure) involving states x10, x11 and x12; in all these
states the label corresponding to the heater is HSF, denoting heater stuck-off failure. In
the failure model in state x11, CH = 1 but T(t) = θe−Kt; from x11 there is no transition to
x10 because temperature does not rise in state x11. For simplicity, it is assumed failure can
occur from state x00; when failure occurs the system moves to the corresponding state
in the failure machine x10 by the unmeasurable dotted transition 〈x00, x10, 〉. It may be
noted that states x10 and x12 under heater stuck-off condition are respectively similar to
the states x00 and x02 under normal condition. However, state x01 (under normal condition)
is different from state x11 (under heater stuck-off condition); in state x01, CH = 1,Fl = 0 and
T(t) = θe−Kt + h(1 − e−Kt), however, in state x11, CH = 1,Fl = 0 but T(t) = θe−Kt. So failure is
TH-1076_NHUBBALLI

208 Chapter A. Failure detection and diagnosis using discrete event systems
determined only in state x11.
02 T Hτ≥
( ) KtT t eθ −=( )
+ (1 )
Kt
Kt
T t eh e
θ −
−
=
−
01 T Lτ≤
( 0)T t =
State label
Enabling condition
Dynamics of continuous variable
=Ambient temperature
0, 0HC Fl= =
F FH T N FH T01x
00x State numberTransition number
Discrete variable
( ) AKtT t eθ −=
0, 1HC Fl= =
F NH T02x
03 ˆT H
τ
≥
04 T Hτ≤
1, 0HC Fl= =
( ) KtT t eθ −=
11 T Lτ≤
0, 0HC Fl= =
SF FH T SF FH T10x
( ) AKtT t eθ −=
0, 1HC Fl= =
SF NH T12x
14 T Hτ≤
1, 0HC Fl= =
Normal mode of operation
Operation under heater stuck-off failure
( ) KtT t eθ −=
11x13
ˆT H
τ
≥
Dotted transitions: Failure causing transtions
Figure A.1: Hybrid system model for the temperature controller
For FDD using DES, the hybrid system model of the temperature controller system
shown in Figure A.1 needs to be converted to a DES model by abstracting its continuous
dynamics. A DES model of this system is illustrated in Figure A.2. To obtain the DES model
for the temperature controller, first the continuous variable temperature T is abstracted
out by replacing it with the sign of the rate of the temperature dT; dT = +1 implies that
temperature is rising and dT = −1 implies that temperature is falling. The DES model
under normal operation comprises three states namely, x00, x01 and x02. The DES model
has three discrete variables (i) dT which is the sign of the rate of variation of temperature
with the domain {+1,−1}, (ii) CH which is the heater controller output with the domain
{0, 1} and (iii) Fl with the domain {0, 1}, which is the indicator of the presence or absence
of flow of the coolant. In state x00, CH = 0,Fl = 0 and temperature falls (i.e., dT = −1).
When temperature falls below LOC the system moves to state x01 (by transition τ01) where
CH = 1,Fl = 0 and temperature rises (i.e., dT = +1). The system remains in state x01 till
temperature reaches HOC following which the system moves back to state x00 by transition
TH-1076_NHUBBALLI

A.5. An example: FDD using DES 209
τ02. Also, if temperature is higher than H◦C then the system moves to state x02 where a
coolant is circulated (i.e., Fl = 1) and temperature falls at a faster rate to H◦C, following
which the system moves to state x00; it may be noted that as continuous dynamics are
abstracted out, the enabling conditions of the transitions are not present. Similarly the
failure model involving states x10, x11 and x12 can be explained. Similar to the hybrid
system model (Figure A.1), failure is determined only in state x11 in the DES model; in
state x01, CH = 1,Fl = 0 and dT = +1, however, in state x11, CH = 1,Fl = 0 dT = −1.
02 τ
1Td = − 1Td = +
01 τ
( 0)T t =
State label
=Ambient temperature
0, 0HC Fl= =
F FH T N FH T01x
00x State numberTransition number
-1Td =
0, 1HC Fl= =
F NH T02x
03 τ
04 τ
1, 0HC Fl= =
0, 0HC Fl= =
SF FH T SF FH T10x
0, 1HC Fl= =
SF NH T12x
1, 0HC Fl= =
Normal node of operation
Operation under heater stuck-off failure
11x
Value of discrete variabledT(t) : Rate of temperature =+1 (Rising)
Heater ON, Flow absent
Rate of temperature=-1(Falling)
Heater O
FF, Flow present
11 τ13 τ
14 τ
1Td = −
Dotted transitions: Failure causing transtions
1Td = − 1Td = −
Figure A.2: DES model for the temperature controller
From Figure A.1 and Figure A.2, the following may be noted about equivalent states and
transitions:
x00Ex10, x02Ex12
τ01Eτ11, τ03Eτ13, τ04Eτ14.
The diagnoser for the DES models shown in Figure A.1 and Figure A.2 is illustrated in
Figure A.3.
Some of the initial steps for construction of this diagnoser are as follows.
• The initial state of the detector i.e., Z0 comprises all initial model states x00, x10.
TH-1076_NHUBBALLI

210 Chapter A. Failure detection and diagnosis using discrete event systems
Z0x00,x10
Z2x02,x12
Z1x01
Z3x11
03 133 : ,a τ τ
04 144 : ,a τ τ
011:a τ
112 :a τiF certain−
iF uncertain state−
iF uncertain state−
Fault Detected
Figure A.3: Diagnoser for the DES model: Figure A.1 and Figure A.2
• =Z0 = {τ03, τ13, τ01, τ11}which are all the outgoing model transitions from model states
in Z0 = {x00, x10}. Now, AZ0 = {{τ03, τ13}, {τ01}, {τ11}}, as =Z0 is partitioned into three
measurement equivalent classes namely, {τ03, τ13}, {τ01} and {τ11}. Corresponding to
{τ03, τ13}, {τ01} and {τ11} the corresponding O-transitions are a3, a1 and a2, respectively.
• The destination O-state corresponding to a3 is Z2 = {x02, x12} as the destination model
states for τ03 and τ13 are x02 and x12, respectively.
Similarly the whole diagnoser can be explained.
In the diagnoser, there is an Fi-certain O-node Z3, which can be reached (by traces a2 or
a3, a4, a2 etc.) from the initial O-node; so the fault is diagnosable. It may be noted that Z3
has a single (failure) G-state x11, where failure could be determined.
TH-1076_NHUBBALLI

Bibliography
[1] AFICK (Another File Integrity Checker),
http://www.sourceforge.net/projects/swatch. 2.1.1.2
[2] AIDE - advanced intrusion detection environment,
http://www.sourceforge.net/projects/aide. 2.1.1.1
[3] Arpalerthttp://www.arpalert.org/arpalert.html. 1.3.2, 2.2.2.1, 4.2.3
[4] ARPdefender, http://www.arpdefender.com. 4.8
[5] CERT, http://www.cert.org. 2.1
[6] Cisco Catalyst 3750 and 3560 Switches,
http://www.cisco.com/en/US/products/hw/switches/ps708/index.html. 2.2.2.1, 4.2.3
[7] Cisco Catalyst 6500 switch,
http://www.cisco.com/en/US/products/hw/switches/ps5528/index.html. 4.4
[8] Colasoft, http://www.colasoft.com. 1.3.2, 2.2.2.1, 4.2.3, 4.8
[9] Common vulnerabilities and exposures, http://www.cve.mitre.org. 1.2.1, 2.2
[10] CRET, http://www.cret.org. (document), 2.1
[11] Flow-tools, http://www.splintered.net/sw/flow-tools. 2.3.1
[12] GFI, http://www.gfi.com. 3.2.1, 3.3.4
[13] http://www.afick.sourceforge.net. 2.1.1.1
[14] IBM Internet Security Systems, http://www.iss.net. 2.2
TH-1076_NHUBBALLI
212 BIBLIOGRAPHY
[15] Integrit File Verification System, http://www.integrit.sourceforge.net/texinfo/integrit.html.
2.1.1.1
[16] MultiTail, http://www.vanheusden.com/multitail. 2.1.1.2
[17] National Vulnerability Database, http://www.nvd.nist.gov. 2.2
[18] Nessus, http://www.nessus.org. 3.2.1, 3.3.4
[19] Network Dictionary, ICMP Attacks,
http://www.networkdictionary.com/security/icmpattacks.php. 2.2.2, 4.1
[20] NMAP, http://www.nmap.org. 3.3.4
[21] Pcap, http://www.tcpdump.org/pcap.html. 2.2.1.1
[22] SAMHAIN, http://www.la-samhna.de/samhain. 2.1.1.5
[23] SecTools, http://www.sectools.org/vuln-scanners.html. 3.2.1
[24] Securityfocus, http://www.securityfocus.com. 1.2.1, 2.2
[25] SNORT, http://www.seclists.org/snort/2003/q4/472. 1.2.2.1
[26] C.L. Abad and R.I. Bonilla. An analysis on the schemes for detecting and preventing
ARP cache poisoning attacks. In ICDCSW ’07: Proceedings of the 27th International
Conference on Distributed Computing Systems Workshops, pages 60–67. IEEE, 2007.
2.2.2.1, 4.2.3
[27] K. Alsubhi, E. Al-Shaer, and R. Boutaba. Alert prioritization in intrusion detection
systems. In NOMS ’08: Proceedings of the 11th Network Operations and Management
Symposium, pages 33–40. IEEE, 2008. 1.3.1, 2.2.1.5
[28] R. Alur, C. Courcoubetis, N. Halbwachs, T.A. Henzinger, P.H. Ho, X. Nicollin,
A. Olivero, J. Sifakis, and S. Yovine. The algorithmic analysis of hybrid systems.
Theoretical Computer Science, 138(1):3–34, 1995. A.5
[29] R. Alur and D.L. Dill. A theory of timed automata. Theoretical Computer Science,
126(2):183–235, 1993. 4.3.3
TH-1076_NHUBBALLI

BIBLIOGRAPHY 213
[30] R. Alur, T.A. Henzinger, and P.H. Ho. Automatic symbolic verification of embedded
systems. IEEE Transactions on Software Engineering, 22(3):181–201, 1996. A.5
[31] M. Amini, R. Jalili, and H.R. Shahriari. RT-UNNID: A practical solution to real time
network based intrusion detection using unsupervised neural networks. Computers
and Security, 25(6):459–468, 2006. 5.4, 5.4.1
[32] J.P. Anderson. Computer security threat monitoring. Technical report, James P.
Anderson Company, USA, 1980. 2.1
[33] S. Axelsson. The base-rate fallacy and the difficulty of intrusion detection. ACM
Transactions on Information System Security, 3(3):186–205, 2000. 1.3, 2.1
[34] M. Basseville, A. Benveniste, and L. Tromp. Diagnosing hybrid dynamical systems:
fault graphs, statistical residuals and iterbi algorithms. In CDC ’97: Proceedings of
the 36th IEEE Conference on Decision and Control, pages 3757–3762. IEEE, 1997. A.1
[35] S. Bavishi and E. Chong. Automated fault diagnosis using a discrete event systems
framework. In ISIC ’94: Proceedings of 9th International Symposium on Intelligent
Control, pages 213–218. IEEE, 1994. A.1
[36] A. Benveniste, E. Fabre, S. Haar, and C. Jard. Diagnosis of asynchronous discrete
event systems, a net unfolding approach. IEEE Transactions on Automatic Control,
48(5):714–727, 2003. A.1
[37] P. Bhowal. On fault diagnosis of timed discrete event systems and hybrid systems.
Ph.D. Thesis, Department of Computer Science and Engineering, Indian Institute of
Technology Kharagpur, India, 2003. A.1
[38] A. Bivens, C. Palagiri, R. Smith, B. Szymanski, and M. Embrechts. Network - based
intrusion detection using neural networks. In ANNIE ’02: Proceedings of the 1st
Intelligent Systems Through Artificial Neural Networks, pages 10–13. ASME, 2002. 2.3
[39] D. Bolzoni, B. Crispo, and S. Etalle. ATLANTIDES: An architecture for alert veri-
fication in network intrusion detection systems. In LISA’07: Proceedings of the 21st
International Conference on Large Installation System Administration Conference, pages
141–152. USENIX Association, 2007. 1.3.1, 2.2.1.4, 3.2
TH-1076_NHUBBALLI

214 BIBLIOGRAPHY
[40] A. Borji. Combining heterogeneous classifiers for network intrusion detection. In
ASIAN ’07: Proceedings of the 12th Asian Computing Science Conference on Advances in
Computer Science: Computer and Network Security, pages 254–260. Lecture Notes in
Computer Science (4846), 2007. 2.3
[41] K. Burbeck and S.N. Tehrani. Adaptive real-time anomaly detection with incremen-
tal clustering. Information Security Technical Report, 12(1):56–67, 2007. 1.3.3.1, 2.2,
2.3.1, 5.1, 5.2, 5.4.2
[42] C.G. Cassandras and S. Lafortune. Introduction to discrete event systems. Kluwer
Academic Publishers, 1999. 1.4, 2.2.2.1, 4.1, 4.3.1, 4.3.3, A.1
[43] P. K. Chan, M. V. Mahoney, and M. H. Arshad. CLAD: A real-time network-
based intrusion detection system using self-organizing maps. Technical report,
Department of Computer Science, Florida Institute of Technology, Florida, USA,
2003. 2.3, 2.3.1, 5.2
[44] V. Chandol, A. Banerjee, and V. Kumar. Anomaly detection: A survey. ACM
Computing Survey, 41(3):1–58, 2009. 1.2.2, 1.3.3.1, 2.3, 5.1
[45] K-T. Cheng and A.S. Krishnakumar. Automatic functional test generation using
the extended finite state machine model. In DAC ’93: Proceedings of the 30th Design
Automation Conference, pages 86–91. IEEE-ACM, 1993. 4.3.3
[46] T. Chyssler, S.N. Tehrani, S. Burschka, and K. Burbeck. Alarm reduction and corre-
lation in intrusion detection systems. In WETICE ’04: Proceedings of the 13th Interna-
tional Workshops on Enabling Technologies: Infrastructures for Collaborative Enterprises,
pages 229–234. IEEE, 2005. 1.3.1, 2.2.1.4, 3.2
[47] A. Ciltik and T. Gngor. Time-efficient spam e-mail filtering using n-gram models.
Pattern Recognion Letters, 29(1):19–33, 2008. 6.2.1
[48] K. Das. Protocol anomaly detection for network-based intrusion detection. White
paper, SANS Institute InfoSec Reading Room, 2002. 1.3.1, 3.1
[49] D.E. Denning. An intrusion detection model. IEEE Transactions on Software Engi-
neering, 13(1):222–232, 1987. 2.1
TH-1076_NHUBBALLI

BIBLIOGRAPHY 215
[50] T. Detristan, Y. Malcom, and M. Underdruk. Polymorphic shelcode engine using
spectrum analysis. Phrack Magazine, 11(61):1–22, 2003. 6.6.1
[51] W. Eddy. TCP SYN Flooding attacks and common mitigations. RFC 4987, 2007. 5.1
[52] L. Ertz, E. Eilertson, A. Lazarevic, P.N. Tan, P. Dokas, V. Kumar, and J. Srivas-
tava. MINDS: Minnesota intrusion system, detection and summarization of novel
network attacks using data mining. In RAID ’01: Proceedings of 4th International
Symposium on Recent Advances in Intrusion Detection, pages 321–341. Lecture Notes
in Computer Science (2212), 2004. 2.3, 2.2, 2.3.1, 5.2
[53] E. Eskin, A. Arnold, M. Prerau, L. Portnoy, and S. Stolfo. A geometric framework for
unsupervised anomaly detection: Detecting intrusions in unlabeled data. Kluwer
Academic Publishers, 2002. 2.3
[54] S. Forrest, S. Hofmeyr, and A. Somayaji. The evolution of system-call monitoring. In
ACSAC ’08: Proceedings of the 24th Annual Computer Security Applications Conference,
pages 418–430. IEEE, 2008. 2.1.1.4
[55] P.M. Frank. Analytical and qualitative model-based fault diagnosis - A survey and
some new results. European Journal of Control, 2(1):6–28, 1996. A.1
[56] F. Gong. Deciphering detection techniques: Part II anomaly-based intrusion detec-
tion. White paper, Network Associates, McAfee Security, 2003. 1.3.3
[57] M.G. Gouda and C. Huang. A secure address resolution protocol. Computer Net-
works, 41(1):57–71, 2003. 1.3.2, 2.2.2.1, 4.2.3
[58] R. Heady, G. Lugar, M. Servilla, and A. Maccabe. The architecture of a network level
intrusion detection system. Technical report, Department of Computer Science,
University of New Mexico, USA, 1990. 1.1
[59] S.A. Hofmeyr, S. Forrest, and A. Somayaji. Intrusion detection using sequences of
system calls. Journal of Computer Security, 6(3):151–180, 1998. 2.1.1.4
[60] N. Hubballi, S. Biswas, and S. Nandi. Fuzzy mega cluster based anomaly network
intrusion detection. In N2S ’09: Proceedings of 1st International Conference on Network
and Service Security, pages 1–5. IEEE, 2009. 2.3
TH-1076_NHUBBALLI

216 BIBLIOGRAPHY
[61] J.Mc. Hugh. Testing intrusion detection systems: A critique of the 1998 and 1999
DARPA intrusion detection system evaluations as performed by Lincoln laboratory.
ACM Transactions on Information and System Security, 3(4):262–294, 2000. 6.6.1
[62] K.L. Ingham and H. Inoue. Comparing anomaly detection techniques for intrusion
detection for HTTP. In RAID ’07: Proceedings of the 10th International Sympoism
on Recent Advances in Intrusion Detection, pages 42–62. Lecture Notes in Computer
Science (4637), 2007. 6.6.1
[63] H.S. Javitz and A. Valdes. The NIDES statistical component description and justifi-
cation. Technical report, Computer Science Laboratory, Stanford Research Institute,
USA, 1993. 1.2.2.1, 2.3
[64] M.F. Jiang, S.S. Tseng, and C.M. Su. Two-phase clustering process for outliers
detection. Pattern Recognition Letters, 22(6-7):691–700, 2001. 2.3, 2.3.1, 5.2
[65] S. Jiang, Z. Huang, V. Chandra, and R. Kumar. A polynomial algorithm for testing
diagnosability of discrete-event systems. IEEE Transactions on Automatic Control,
46(8):1318–1321, 2001. A.1
[66] K. Julisch. Mining alarm clusters to improve alarm handling efficiency. In ACSAC
’01: Proceedings of the 17th Annual Computer Security Applications Conference, pages
12–21. IEEE, 2001. 2.2.1.4, 3.2
[67] K. Julisch. Clustering intrusion detection alarms to support root cause analysis.
ACM Transactions on Information and System Security, 6(4):443–471, 2003. 2.2.1.4, 3.2
[68] K. Julisch. Using root cause analysis to handle intrusion detection alarms. Ph.D.
Thesis, IBM Zurich Research Laboratory, Switzerland, 2003. 2.2.1.4, 3.2
[69] K. Julisch and M. Dacier. Mining intrusion detection alarms for actionable knowl-
edge. In SIGKDD ’02: Proceedings of the 8th ACM SIGKDD International Conference
on Knowledge Discovery and Data Mining, pages 366–375. ACM, 2002. 2.2.1.4, 3.2
[70] E.H. Kim, M.S. Shin, and K.H. Ryu. False alarm classification model for network-
based intrusion detection system. In IDEAL ’04: Proceedings of the 5th Intelligent Data
TH-1076_NHUBBALLI

BIBLIOGRAPHY 217
Engineering and Automated Learning, pages 259–265. Lecture Notes in Computer
Science (3177), 2004. 2.2.1.4, 3.2
[71] G.H. Kim and E.H. Spafford. The design and implementation of TRIPWIRE: A
file system integrity checker. In CCS ’94: Proceedings of the 2nd ACM Conference on
Computer and Communications Security, pages 18–29. ACM, 1994. 2.1.1.1
[72] M. Kim, K. Whang, J. Lee, and M. Lee. n-gram/2L: A space and time efficient
two-level n-gram inverted index structure. In VLDB ’05: Proceedings of the 31st
International Conference on Very Large Data Bases, pages 325–336. VLDB Endowment,
2005. 6.2.1
[73] O.M. Kolesnikov, D. Dagon, and W. Lee. Advanced polymorphic worms: Evading
IDS by blending in with normal traffic. Technical report, College of Computing,
Georgia Institute of Technology, USA, 2004. 6.2, 6.2.1, 6.6.1
[74] C.M. Kozierok. TCP/IP guide. No Starch Press, 2005. 2.2.2.1, 4.2.3
[75] G.D. Laet and G. Schauwers. Network security fundamentals. Cisco Press, 2004.
1.2.1.2, 2.2.2, 4.1
[76] A. Lazarevic, A. Ozgur, L. Ertoz, J. Srivastava, and V. Kumar. A comparative study of
anomaly detection schemes in network intrusion detection. In SDM ’03: Proceedings
of 3rd SIAM International Data Mining Conference, pages 1–12. SIAM, 2003. 1.3.3.1,
2.3.1
[77] K. Lee, J. Kim, K.H. Kwon, Y. Han, and S. Kim. DDoS attack detection method
using cluster analysis. Expert Systems Applications, 34(3):1659–1665, 2008. 2.3
[78] W. Lee, S.J. Stolfo, E. Eskin, M. Miller, S. Hershkop, J. Zhang, P.K. Chan, and W. Fan.
Real time data mining-based intrusion detection. In DISCEX ’01: Proceedings of the
2nd International Conference and Exposition on DARPA Information Survivability, pages
85–100. IEEE, 2001. 2.3
[79] K. Leung and C. Leckie. Unsupervised anomaly detection in network intrusion
detection using clusters. In ACSC ’05: In the Proceedings of the 28th Australasian
TH-1076_NHUBBALLI

218 BIBLIOGRAPHY
Conference on Computer Science, pages 333–342. Australian Computer Society, 2005.
2.3
[80] I. Levin. KDD-99 classifier learning contest LLSoft’s results overview. SIGKDD
Explore Newsletter, 1(2):67–75, 2000. 1.3.3.1, 2.3.1
[81] X. Li. A scalable decision tree system and its application in pattern recognition and
intrusion detection. Decision Support Systems, 41(1):112–130, 2005. 2.3
[82] Y. Liao and V. R. Vemuri. Use of K-nearest neighor classifier for intrusion detection.
Computers and Security, 21(1):439–448, 2002. 2.3
[83] T. Limmer and F. Dressler. Survey of event correlation techniques for attack detection
in early warning systems. Technical report, Department of Computer Science,
University of Erlangen, Germany, 2008. 1.1
[84] R. Lipmann, J.W. Haines, D.J. Fried, J. Kobra, and K. Das. The 1999 DARPA off-line
intrusion detection eveluation. Computer Networks, 34(4):579–595, 2000. 6.6.1
[85] W. Lootah, W. Enck, and P. McDaniel. TARP: Ticket-based address resolution
protocol. In ACSAC ’05: Proceedings of 21st Annual Computer Security Applications
Conference, pages 106–116. IEEE, 2005. 1.3.2, 2.2.2.1, 4.2.3
[86] T. F. Lunt, A. Tamaru, F. Gilham, R. Jagannathan, C. Jalali, and P.G. Neumann. IDES:
A real-time intrusion detection expert system. Technical report, Computer Science
Laboratory, Stanford Research Institute, USA, 1992. 2.3
[87] J.B. MacQueen. Some methods for classification and analysis of multivariate obser-
vations. In BSMSP’67: Proceedings of 5th Berkeley Symposium on Mathematical Statistics
and Probability, pages 281–297. University of California Press, Berkeley, 1967. 2.3.1
[88] M.V. Mahoney and P.K. Chan. PHAD: Packet header anomaly detection for iden-
tifying hostile network traffic. Technical report, Department of Computer Science,
Florida Institute of Technology, Florida, USA, 2001. 1.2.2.1, 2.2
[89] M.V. Mahoney and P.K. Chan. Learning nonstationary models of normal network
traffic for detecting novel attacks. In SIGKDD ’02: Proceedings of the 8th ACM
TH-1076_NHUBBALLI

BIBLIOGRAPHY 219
SIGKDD International Conference on Knowledge Discovery and Data Mining, pages
376–385. ACM, 2002. 2.2, 2.3.2
[90] M.V. Mahoney and P.K. Chan. An analysis of the 1999 DARPA Lincoln laboratory
intrusion detection data for network anomaly detection. In RAID ’03: Proceedings
of the 6th International Sympoism on Recent Advances in Intrusion Detection, pages
220–237. Lecture Notes in Computer Science (2820), 2003. 6.6.1
[91] F. Massicotte and L. Briand. Context-based intrusion detection using Snort, Nessus
and Bugtraq databases. In PST ’05: Proceedings of the 3rd International Conference on
Privacy, Security and Trust, pages 1–12. http://www.lib.unb.ca/Texts/PST/2005, 2005.
1.3.1, 2.2.1.4, 3.2, 3.2.1, 3.2.1, 3.3.4.1
[92] F. Massicotte, M. Couture, and Y. Labiche. Model-driven, network-context sensitive
intrusion detection. In MoDELS ’07: Proceedings of the 10th International Conference
on Model Driven Engineering Languages and Systems, pages 61–75. Lecture Notes in
Computer Science (4735), 2007. 1.3.1, 2.2.1.4, 3.2
[93] F. Massicotte, F. Gagnon, Y. Labiche, L. Briand, and M. Couture. Automatic evalu-
ation of intrusion detection systems. In ACSAC ’06: Proceedings of the 22nd Annual
Computer Security Applications Conference, pages 361–370. IEEE, 2006. 3.3.3, 3.3.5,
3.4.1, 3.4.2
[94] F. Murtagh. Complexities of hierarchic clustering algorithms: State of the art.
Computational Statistics Quarterly, 1(2):101–113, 1984. 5.3.3
[95] S. Y. Nam, D. Kim, and J. Kim. Enhanced ARP: Preventing ARP poisoning-based
man-in-the-middle attacks. IEEE Communications Letters, 14(2):187–189, 2010. 2.2.2.1
[96] S. Neelakantan and S. Rao. A threat-aware signature-based intrusion-detection
approach for obtaining network-specific useful alarms. In ICIMP ’08: Proceedings
of the 3rd International Conference on Internet Monitoring and Protection, pages 80–85.
IEEE, 2008. 1.3.1, 2.2.1.4, 3.2, 3.2.1, 3.3.4, 3.3.4.1, 3.6
[97] S.H. Oh and W.S. Lee. An anomaly intrusion detection method by clustering normal
user behaviour. Computer and Security, 22(7):596–612, 2003. 2.3
TH-1076_NHUBBALLI

220 BIBLIOGRAPHY
[98] J. Oldmeadow, S. Ravinutala, and C. Leckie. Adaptive clustering for network in-
trusion detection. In PAKDD ’04: Proceedings of the 8th Pacific-Asia International
Conference on Advances in Knowledge Discovery and Data Mining, pages 538–543. Lec-
ture Notes in Computer Science (3056), 2004. 2.3
[99] Y. Park, J. Lee, and Y. Cho. Intrusion detection using noisy training data. In
ICCSA’04: Proceedings of the 4th International Conference on Computational Science and
its Applications, pages 547–556. Lecture Notes in Computer Science (3044), 2004.
1.3.3.2, 2.3.2, 6.1
[100] A. Patcha and J. Park. An overview of anomaly detection techniques: Existing
solutions and latest technological trends. Computer Networks, 51(12):3448–3470,
2007. 1.2.2, 2.3
[101] B.K. Patra, S. Nandi, and P. Viswanath. Data summarization based fast hierarchical
clustering method for large datasets. In ICIME ’09: Proceedings of the 1st International
Conference on Information Management Engineering, pages 278–282. IEEE, 2009. 5.1
[102] V. Paxson. Bro: A system for detecting network intruders in real-time. Computer
Networks, 31(24):2435–2463, 1999. 2.2.1, 2.2.1.2, 3.1
[103] R. Perdisci, D. Ariu, P. Fogla, G. Giacinto, and W. Lee. McPAD: A multiple clas-
sifier system for accurate payload-based anomaly detection. Computer Networks,
53(6):864–881, 2009. 1.2.2.2, 1.3.1, 1.3.3.2, 2.2, 2.3.2, 6.1, 6.6.1
[104] B. Pfahringer. Winning the KDD-99 classification cup: Bagged boosting. SIGKDD
Explorer Newsletter, 1(2):65–66, 2000. 1.3.3.1, 2.3.1
[105] T. Pietraszek and A. Tanner. Data mining and machine learning - towards reducing
false positives in intrusion detection. Information Security Technical Report, 10(3):169–
183, 2005. 1.3.1, 2.2.1.3, 2.2.1.4, 3.1, 3.2
[106] P. Porras, M.W. Fong, and A. Valdes. A mission-impact-based approach to INFOSEC
alarm correlation. In RAID’02: Proceedings of the 5th International Sympoisum on Recent
Advances in Intrusion Detection, pages 95–114. Lecture Notes in Computer Science
(2516), 2002. 1.3.1, 2.2.1.5, 3.1
TH-1076_NHUBBALLI

BIBLIOGRAPHY 221
[107] P.A. Porras and P.G. Neumann. EMERALD: event monitoring enabling responses to
anomalous live disturbances. In ISSC ’97: Proceedings of the 20th National Information
Systems Security Conference, pages 353–365. IEEE, 1997. 1.2.1.1
[108] J. Postel. Internet Control Message Protocol. RFC 792, 1981. 4.1
[109] P.K. Prasad and C. Pandurangan. Privacy preserving BIRCH algorithm for clus-
tering over arbitrarily partitioned databases. In ADMA ’09: Proceedings of the 3rd
International Conference on Advanced Data Mining and Applications, pages 146–157.
Lecture Notes in Artificial Intelligence (5678), 2007. 5.2.1, 5.2.1
[110] G. Provan and Y. L. Chan. Model-based diagnosis and control reconfiguration for
discrete event systems: An integrated approach. In WODES’98: Proceedings of the
4th International Workshop on Discrete Event Systems, pages 1762–1768. IEEE, 1998.
A.1
[111] X. Qin and W. Lee. Statistical causality analysis of INFOSEC alert data. In RAID’03:
Proceedings of the 6th International Symposium on Recent Advances in Intrusion Detection,
pages 73–93. Lecture Notes in Computer Science (2820), 2003. 1.3.1, 2.2.1.5
[112] V. Ramachandran and S. Nandi. Detecting ARP spoofing: An active technique. In
ICISS ’05: Proceedings of the 1st International Conference on Information Systems Security,
pages 239–250. Lecture Notes in Computer Science (3803), 2005. 1.3.2, 2.2.2.1, 4.8
[113] M. Roesch. Snort - lightweight intrusion detection for networks. In LISA ’99:
Proceedings of the 13th USENIX System Administration Conference, pages 229–238.
USENIX Association, 1999. 1.2.1.1, 2.2.1, 2.2.1.1, 3.1
[114] S.E. Samba. HAYSTACK: An intrusion detection system. In ACSAC ’88: Proceedings
of 4th Aerospace Computer Security Applications Conference, pages 37–44. IEEE, 1988.
2.1.1.3
[115] M. Sampath and S. Lafortune. Active diagnosis of discrete event systems. IEEE
Transactions on Automatic Control, 43(7):908–929, 1998. 7.2
TH-1076_NHUBBALLI

222 BIBLIOGRAPHY
[116] M. Sampath, R. Sengupta, S. Lafortune, K. Sinnamohideen, and D.C. Teneketzis.
Diagnosability of discrete-event systems. IEEE Transactions on Automatic Control,
40(9):1555 –1575, 1995. 7.2, A.1
[117] M.M. Sebring, E. Shellhouse, M.F. Hanna, and R.A. Whitehurst. Expert systems
in intrusion detection: A case study. In NCSC ’88: Proceedings of the 11th National
Computer Security Conference, pages 74–81. NIST, 1988. 2.3
[118] R. Sekar, M. Bendre, D. Dhurjati, and P. Bollineni. A fast automaton-based method
for detecting anomalous program behaviors. In S&P ’01: Proceedings of the 22nd
Symposium on Security and Privacy, pages 144–155. IEEE, 2001. 1.3.2, 4.1
[119] R. Sekar, A. Gupta, J. Frullo, T. Shanbhag, A. Tiwari, H. Yang, and S. Zhou.
Specification-based anomaly detection: A new approach for detecting network
intrusions. In CCS ’02: Proceedings of the 9th ACM Conference on Computer and Com-
munications Security, pages 265–274. ACM, 2002. 1.2.1.2, 2.2.2.1
[120] A. Somayaji and S. Forrest. Automated response using system-call delays. In
SSYM’00: Proceedings of the 9th Conference on USENIX Security Symposium, page 14.
USENIX Association, 2000. 2.1.1.4
[121] R. Sommer and V. Paxson. Enhancing byte-level network intrusion detection signa-
tures with context. In CCS ’03: Proceedings of the 10th ACM Conference on Computer
and Communications Security, pages 262–271. ACM, 2003. 1.3.1, 2.2.1.4, 3.2
[122] G. Stein, B. Chen, A.S. Wu, and K.A. Hua. Decision tree classifier for network
intrusion detection with GA-based feature selection. In ACMSE ’05: Proceedings of
the 43rd Annual Southeast Regional Conference, pages 136–141. ACM, 2005. 2.3
[123] H.A. Sturges. The choice of a class interval. Journal of the American Statistical
Association, 21(153):65–66, 1926. 6.3.1.2
[124] P.N. Tan, M. Steibach, and V. Kumar. Introduction to data mining. Addison-Wesley,
2006. 5.1
[125] J. Tang, Z. Chen, F. Chee, and W.Cheung. Enhancing effectiveness of outlier de-
tections for low density patterns. In PAKDD ’02: Proceedings of the 5th Pacific-Asia
TH-1076_NHUBBALLI

BIBLIOGRAPHY 223
Conference on Knowledge Discovery and Data Mining, pages 535–548. Lecture Notes in
Computer Science (2336), 2002. 2.3, 2.3.1, 5.2
[126] Z. Trabelsi and W. El-Hajj. Preventing ARP attacks using a fuzzy-based stateful ARP
cache. In ICC’07: Proceedings of the 47th International Conference on Communications,
pages 547–556. Lecture Notes in Computer Science (3044), 2004. 2.2.2.1
[127] Z. Trabelsi and K. Shuaib. Man-in-the-middle intrusion detection. In GLOBECOM
’06: Proceedings of the 49th Global Telecommunications Conference, pages 1–6. IEEE,
2006. 2.2.2.1
[128] J.J. Treinen and R. Thurimella. Finding the needle: Suppression of false alarms in
large intrusion detection data sets. In CSE ’09: Proceedings of the 12th International
Conference on Computational Science and Engineering, pages 237–244. IEEE, 2009. 1.3.1,
2.2.1.3, 3.1, 6.1
[129] M.V. Tripunitara and P. Dutta. A middleware approach to asynchronous and back-
ward compatible detection and prevention of ARP cache poisoning. In ACSAC
’99: Proceedings of the 15th Annual Computer Security Applications Conference, pages
303–309. IEEE, 1999. 2.2.2.1
[130] P. Uppuluri and R. Sekar. Experiences with specification-based intrusion detection.
In RAID ’01: Proceedings of the 4th International Symposium on Recent Advances in
Intrusion Detection, pages 172–189. Lecture Notes in Computer Science (2212), 2001.
1.2.1.2, 1.3.2, 2.2.2.1, 4.1
[131] A. Valdes and K. Skinner. Probabilistic alert correlation. In RAID ’00: Proceedings
of the 4th International Symposium on Recent Advances in Intrusion Detection, pages
54–68. Lecture Notes in Computer Science (1907), 2001. 1.3.1, 2.2.1.5
[132] N. Viswanadham and T.L. Johnson. Fault detection and diagnosis of automated
manufacturing systems. In CDC ’98: Proceedings of 37th IEEE Conferencce on Decision
and Control, pages 2301–2306. IEEE, 1998. A.1
[133] K. Wang, G. Cretu, and S.J. Stolfo. Anomalous payload-based worm detection and
signature generation. In RAID ’05: Proceedings of the 8th International Sympoism on
TH-1076_NHUBBALLI

224 BIBLIOGRAPHY
Recent Advances in Intrusion Detection, pages 227–246. Lecture Notes in Computer
Science (3858), 2005. 2.3.2
[134] K. Wang, J.J. Parekh, and S.J. Stolfo. Anagram: A content anomaly detector resistant
to mimicry attack. In RAID ’06: Proceedings of the 9th International Sympoism on Recent
Advances in Intrusion Detection, pages 226–246. Lecture Notes in Computer Science
(4219), 2006. 1.2.2.2, 1.3.3.2, 2.2, 2.3.2, 6.1, 6.2, 6.6, 6.6.2.1
[135] K. Wang and S.J. Stolfo. Anomalous payload-based network intrusion detection. In
RAID ’04: Proceedings of the 7th International Sympoism on Recent Advances in Intrusion
Detection, pages 203–222. Lecture Notes in Computer Science (3224), 2004. 1.2.2.2,
1.3.3.2, 2.2, 2.3.2, 6.1, 6.2, 6.2.1, 6.6.1
[136] C.C White. A survey on the integration of decision analysis and expert systems for
decision support. IEEE Transactions on Systems, Man and Cybernetics, 20(2):358–364,
1990. A.1
[137] S.J. Whittaker, M. Zulkernine, and K. Rudie. Towards incorporating discrete-event
systems in secure software development. In ARES ’08: Proceedings of the 3rd Interna-
tional Conference on Availability, Reliability and Security, pages 1188–1195. IEEE, 2008.
1.2.1.2, 1.3.2, 2.2.2.1, 4.1
[138] A.S. Willsky. A survey of design methods for failure detection in dynamic systems.
Automatica, 12(1):601–611, 1976. A.1
[139] B. Wotring, B. Potter, M. Ranum, and R. Wichmann. Host integrity monitoring using
Osiris and Samhain. Syngress Publishing, 2005. 2.1.1.1
[140] C. Xiang, P.C. Yong, and L.S. Meng. Design of multiple-level hybrid classifier for
intrusion detection system using Bayesian clustering and decision trees. Pattern
Recognion Letters, 29(7):918–924, 2008. 2.3
[141] H. Yamamoto, S. Isogai, and Y. Sagisaka. Multi-class composite n-gram language
model for spoken language processing using multiple word clusters. In ACL ’01:
Proceedings of the 39th Annual Meeting on Association for Computational Linguistics,
pages 531–538. Association for Computational Linguistics, 2001. 6.2.1
TH-1076_NHUBBALLI

BIBLIOGRAPHY 225
[142] M. Yang, H. Zhang, J.Fu., and F. Yan. A framework for adaptive anomaly detection
based on support vector data description. In NPC ’04: Proceedings of the 1st Interna-
tional Conference on Network and Parallel Computing, pages 443–450. Lecture Notes in
Computer Science (3222), 2004. 2.3
[143] J.T. Yao, S. Zhao, and L. Fan. An enhanced Support Vector Machine model for
intrusion detection. In RSKT ’06: Proceedings of 1st International Conference on Rough
Sets and Knowledge Technology, pages 538–543. Lecture Notes in Computer Science
(4062), 2006. 2.3
[144] T. Yoo and S. Lafortune. Polynomial-time verification of diagnosability of partially
observed discrete-event systems. IEEE Transactions Automatic Control, 47(9):1491–
1495, 2002. A.1
[145] J. Yu, Y. V. R. Ramana, S. Selliah, S. Kankanahalli, S. Reddy, and V. Bharadwaj.
TRINETR: An intrusion detection alert management system. In WETICE ’04: Pro-
ceedings of the 13th IEEE International Workshop on Enabling Technologies: Infrastructure
for Collaborative Enterprises, pages 235–240. IEEE, 2004. 1.3.1, 2.2.1.5
[146] H.S. Zad, R.H. Kwong, and W.M. Wonham. Fault diagnosis in discrete-event sys-
tems: Framework and model reduction. IEEE Transactions on Automatic Control,
48(7):1199–1212, 2003. A.1
[147] S.H. Zad. Fault diagnosis in discrete and hybrid system. Ph.D. Thesis, Department
of Electrical Communication Engineering, University of Toronto, Canada, 1999. A.1
[148] C.T. Zahn. Graph-theoretical methods for detecting and describing gestalt clusters.
IEEE Transactions on Computers, 20:68–86, 1971. 2.3.1
[149] S. Zanero and S.M. Savaresi. Unsupervised learning techniques for an intrusion
detection system. In SAC ’04: Proceedings of the 19th ACM Symposium on Applied
Computing, pages 412–419. ACM, 2004. 1.3.3.2, 2.3.2
[150] G.P. Zhang. Neural networks for classification: A survey. IEEE Transactions On
Systems, Man, and Cybernetics-Part C: Applications And Reviews, 30(4):451–462, 2000.
3.3.2.2
TH-1076_NHUBBALLI

226 BIBLIOGRAPHY
[151] L. Zhang and G.B. White. Analysis of payload based application level network
anomaly detection. In HICSS ’07: Proceedings of the 40th Annual Hawaii International
Conference on System Sciences, pages 99–109. IEEE, 2007. 2.3.2
[152] T. Zhang, R. Ramakrishnan, and M. Livny. BIRCH: A new data clustering algorithm
and its applications. Data Mining and Knowledge Discovery, 1(2):141–182, 1997. 1.3.3.1,
2.3.1, 5.1, 5.2, 5.2.1, 5.2.1
[153] Y. Zhou and Z. Wang. Monitoring ARP attack using responding time and state
ARP cache. In ISNN ’09: Proceedings of the 6th International Symposium on Neural
Networks, pages 701–709. Springer Berlin/Heidelberg (56), 2009. 2.2.2.1
TH-1076_NHUBBALLI

Publications out of the workInternational journals
1. N. Hubballi, S. Biswas, S. Nandi, “Network Specific False Alarm Minimization”,
Journal of Security and Communication Networks, Vol. 1, No. 11, Pages 13391349,
2011, John Wiley
2. N. Hubballi, S. Biswas, Rupa S, R. Ratti,S. Nandi, “Disrete Event Systems Approach
to LAN Attack Detection”, ISA Transactions, Vol 50, No1, pp 119-130, Elsevier.
3. N. Hubballi, S. Biswas, S. Nandi, “Towards Reducing False Alarms in Network In-
trusion Detection Systems with Data Summarization Technique”, Journal of Security
and Communication Networks, John Wiley (Accepted).
4. N. Hubballi, S. Biswas, S. Nandi, “ A Resource Criticality Aware Framework for
False Alarm Reduction in Intrusion Detection”, Communications and Computer
Security, Acta Press (Under Review).
5. Neminath Hubballi, Santosh Biswas, Sukumar Nandi, Layergram: Layered n-gram
Based Payload Anomaly Intrusion Detection, Computer Communication (Under
Review)
International conferences
1. N. Hubballi, S. Biswas, S. Nandi, “An Efficient Data Structure for Storing Network
Intrusion Detection Dataset for Forensic Evidence”, IEEE Advanced Networks and
Telecommunication Systems-2008, Mumbai, India, pp 1-3 (IEEE).
2. N. Hubballi, S. Biswas, S. Nandi, “Layered Higher Order n-gram for Hardening Pay-
load Based Anomaly Intrusion Detection”, International Conference on Availability,
Reliability and Security-2010, Krakow Poland, pp 321-326 (IEEE).
3. N. Hubballi, S. Biswas, Roopa S., R. Ratti, S. Nandi, “ Discrete Event System Ap-
proach to Intrusion Detection System for ARP Attacks” Mediterranean Conference
on Control and Automation-2010, Marrakech, Morocco, pp 695 - 700 (IEEE).
TH-1076_NHUBBALLI

4. N. Hubballi, Roopa S., R. Ratti, F.A. Barbujiya, S. Biswas, S. Nandi, A. Sur, V.
Ramachandran, “An Active Intrusion Detection for LAN Specific Attacks”, Interna-
tional Conference on Information Security and Assurance-2010, Miyazaki, Japan, pp
129-142 (LNCS).
TH-1076_NHUBBALLI

CURRICULUM VITAE
Name : Neminath Hubballi
Father’s Name : Cholappa Hubballi,
Address : Department of Computer Science and Engineering,
IIT Guwahati,
Assam 781039, India
Email: [email protected]
Neminath Hubballi obtained his Bachelors degree in Computer Science and Engineer-
ing from Visveswaraiah Technological University, Belgaum, Karnataka in the year 2003
and Master of Technology in Computer Science and Engineering in the year 2006 from
the same university. His masters thesis was entitled “Message oriented middleware tech-
nologies”. He was placed in the 5th position in the university in his MTech. He had short
stint at Hewlett-Packard, Bangalore as a software engineer before joining Ph.D program in
IIT Guwahati. His research interests include system and network security, digital image
processing and machine learning. He has authored 11 research papers till date.
TH-1076_NHUBBALLI