Design of lattice towers from hot-rolled equal leg steel angles
137
JULY 2021 Supervisors: Ioannis VAYAS Jean-Pierre JASPART Co-supervisors: Charis GANTES Jean-François DEMONCEAU Design of lattice towers from hot-rolled equal leg steel angles A joint-thesis submitted in partial fulfillment of the requirements for the degree of Doctor of Philosophy (PhD) in Engineering Science by Marios-Zois BEZAS
-
Upload
khangminh22 -
Category
Documents
-
view
3 -
download
0
Transcript of Design of lattice towers from hot-rolled equal leg steel angles
JULY 2021
Supervisors: Ioannis VAYAS
Jean-Pierre JASPART
Co-supervisors: Charis GANTES
Jean-François DEMONCEAU
Design of lattice towers from hot-rolled equal leg
steel angles
A joint-thesis submitted in partial fulfillment of the requirements
for the degree of Doctor of Philosophy (PhD) in Engineering Science
by
Marios-Zois BEZAS


Design of lattice towers from hot-rolled equal leg steel
angles
Marios-Zois BEZAS
The thesis is submitted to the School of Civil Engineering of the National Technical
University of Athens and to the Doctoral college in Aerospace and Mechanics of the
University of Liege in fulfilment of the requirements for the Degree of Doctor of Philosophy
in Engineering Science
Members of the Examination Committee
Ioannis VAYAS, Prof. NTUA
Jean-Pierre JASPART, Prof. ULiège
Charis GANTES, Prof. NTUA
Jean-François DEMONCEAU, Prof. ULiège
Dimitrios VAMVATSIKOS, Prof. NTUA
Vincent DE VILLE DE GOYET, Prof. ULiège
Bert SNIJDER, Prof. TU Eindhoven
JULY 2021
© Copyright 2021 by Marios-Zois Bezas
All Rights Reserved
Neither the whole nor any part of this doctoral thesis may be copied, stored in a retrieval system,
distributed, reproduced, translated, or transmitted for commercial purposes, in any form or by any means
now or hereafter known, electronic or mechanical, without the written permission from the author.
Reproducing, storing and distributing this doctoral thesis for non-profitable, educational or re-search
purposes is allowed, without prejudice to reference to its source and to inclusion of the present text. Any
queries in relation to the use of the present doctoral thesis for commercial purposes must be addressed to
its author.
Approval of this doctoral thesis by the School of Civil Engineering of the National Technical University
of Athens (NTUA) does not constitute in any way an acceptance of the views of the author contained
herein by the said academic organization (L. 5343/1932, art. 202).

Σχεδιασμός δικτυωτών πύργων από ελατά ισοσκελή
χαλύβδινα γωνιακά
Μάριος-Ζώης Μπέζας
Η διδακτορική διατριβή υποβάλλεται στην Σχολή Πολιτικών Μηχανικών του Εθνικού
Μετσόβιου Πολυτεχνείου και στο Διδακτορικό Κολλέγιο Αεροδιαστημικής και Μηχανικής
του Πανεπιστημίου της Λιέγης προς εκπλήρωση των απαιτήσεων για την απόκτηση του
τίτλου του Διδάκτορος Μηχανικού.
Μέλη Εξεταστικής Επιτροπής
Ιωάννης ΒΑΓΙΑΣ, Καθηγητής ΕΜΠ
Jean-Pierre JASPART, Καθηγητής ULiège
Χάρης ΓΑΝΤΕΣ, Καθηγητής ΕΜΠ
Jean-François DEMONCEAU, Καθηγητής ULiège
Δημήτριος ΒΑΜΒΑΤΣΙΚΟΣ, Καθηγητής ΕΜΠ
Vincent DE VILLE DE GOYET, Καθηγητής ULiège
Bert SNIJDER, Καθηγητής TU Eindhoven
ΙΟΥΛΙΟΣ 2021

© Copyright 2020 by Μάριος-Ζώης Μπέζας
Με επιφύλαξη παντός δικαιώματος
Απαγορεύεται η αντιγραφή, αποθήκευση σε αρχείο πληροφοριών, διανομή, αναπαραγωγή, μετάφραση
ή μετάδοση της παρούσας εργασίας, εξ ολοκλήρου ή τμήματος αυτής, για εμπορικό σκοπό, υπό οποια-
δήποτε μορφή και με οποιοδήποτε μέσο επικοινωνίας, ηλεκτρονικό ή μηχανικό, χωρίς την προηγούμενη
έγγραφη άδεια του συγγραφέα. Επιτρέπεται η αναπαραγωγή, αποθήκευση και διανομή για σκοπό μη
κερδοσκοπικό, εκπαιδευτικής ή ερευνητικής φύσης, υπό την προϋπόθεση να αναφέρεται η πηγή προέ-
λευσης και να διατηρείται το παρόν μήνυμα. Ερωτήματα που αφορούν στη χρήση της εργασίας για
κερδοσκοπικό σκοπό πρέπει να απευθύνονται προς το συγγραφέα.
Η έγκριση της διδακτορικής διατριβής από την Ανώτατη Σχολή Πολιτικών Μηχανικών του Εθνικού
Μετσοβίου Πολυτεχνείου δεν υποδηλώνει αποδοχή των απόψεων του συγγραφέως (Ν. 5343/1932,
Άρθρο 202).

ABSTRACT
Design of lattice towers from hot-rolled equal leg steel angles
Angles profiles have been used since the very beginning of steel construction due to their easy
transportation and on-site erection. However, they exhibit specific features that clearly
distinguish them from other types of common sections, what inevitably leads to the need for
the development of specific design provisions. In a first step, existing European specifications
on hot-rolled equal angle sections were critically reviewed and then, in a second step, extensive
experimental, analytical and numerical studies have been conducted to propose a complete and
duly validated set of design rules covering all aspects of design for angles. These rules include
cross section classification, cross section resistance for all types of loading as well as rules for
member design to individual and combined internal normal forces and moments. All the
proposed rules are written in Eurocode 3 format to allow a direct possible inclusion in
forthcoming drafts.
Furthermore, angle profiles are extensively used in lattice towers and masts for
telecommunication purposes or electric power transmission. Such types of towers are mainly
designed according to EN 1993-3-1 and EN 50341-1, based on a first-order linear elastic
structural analysis of a truss structure. An assessment of the current design approach is
performed, where the tower has been simulated with a full non-linear finite element software,
considering relevant imperfections as well as geometrical and material non-linearities. The
importance of the second order effects in the analysis is underlined while the existence of an
instability mode not properly covered directly by the norms, and usually therefore not checked,
is highlighted. Two analytical models for the prediction of the critical load of the new buckling
mode are proposed and validated numerically. Both proposed models are rather easy to apply
and may fill the gap in the existing design recommendations for lattice towers.
RÉSUMÉ
Conception de tours en treillis à partir de cornières en acier à semelles égales laminées à
chaud
Les profilés de type « cornière » sont utilisés depuis le début de la construction métallique en
raison de leur facilité de transport et de montage sur site. Cependant, ils présentent des
caractéristiques spécifiques qui les distinguent clairement des autres types de sections
courantes, ce qui conduit inévitablement à la nécessité de développer des règles de
dimensionnement spécifiques. Dans un premier temps, les spécifications européennes
existantes pour le dimensionnement de cornières laminées à chaud à semelles égales ont fait
l’objet d’une analyse critique. Ensuite, dans un second temps, des études expérimentales,
analytiques et numériques approfondies ont été menées afin de proposer un ensemble complet
et dûment validé de règles de dimensionnement pour la vérification de cornières. Ces règles
comprennent la classification des sections transversales, le calcul de la résistance des sections
transversales pour tous types de sollicitation ainsi que les règles de dimensionnement pour les
membrures sous effort axial et/ou moment de flexion. Toutes les règles proposées sont écrites
au format de l’Eurocode 3 afin de permettre, si souhaité, une insertion directe de celles-ci dans
les versions à venir.

De plus, les cornières sont largement utilisées dans les tours et les mâts en treillis destinés aux
télécommunications ou au transport d'énergie électrique. Ces tours sont principalement
dimensionnées selon les normes EN 1993-3-1 et EN 50341-1, sur la base d'une analyse
structurale élastique linéaire du premier ordre d'une structure en treillis. Une évaluation de
l'approche de dimensionnement actuelle est effectuée via la simulation d’une tour avec un
logiciel aux éléments finis non linéaires complets, en tenant compte des imperfections ainsi que
des non-linéarités géométriques et matérielles. L'importance des effets du second ordre dans
l'analyse est soulignée, tandis que l'existence d'un mode d'instabilité qui n'est pas couvert
directement par les normes, et qui n'est donc généralement pas vérifié, est mise en évidence.
Deux modèles analytiques pour la prédiction de la charge critique du nouveau mode
d’instabilité sont proposés et validés numériquement. Les deux modèles proposés sont assez
faciles à appliquer et peuvent combler une lacune dans les recommandations de
dimensionnement existantes pour les tours en treillis.
ΠΕΡΙΛΗΨΗ
Σχεδιασμός δικτυωτών πύργων από ελατά ισοσκελή χαλύβδινα γωνιακά
Τα προφίλ γωνιακών διατομών χρησιμοποιούνται από τα πρώτα χρόνια των χαλύβδινων
κατασκευών λόγω της εύκολης μεταφοράς τους και της επί τόπου συναρμολόγησής τους.
Ωστόσο, παρουσιάζουν συγκεκριμένα χαρακτηριστικά που τα διαφοροποιούν από τους άλλους
τύπους κοινών διατομών, γεγονός που οδηγεί αναπόφευκτα στην ανάγκη ανάπτυξης ειδικών
κανόνων σχεδιασμού. Σε πρώτη φάση ελέγχθηκαν και αξιολογήθηκαν οι υφιστάμενες
ευρωπαϊκές διατάξεις για τα ισοσκελή γωνιακά θερμής έλασης, και στη συνέχεια, διεξήχθησαν
εκτεταμένες πειραματικές, αναλυτικές και αριθμητικές μελέτες ώστε να προταθεί ένα
ολοκληρωμένο και πλήρως επικυρωμένο σύνολο κανόνων σχεδιασμού που να καλύπτει όλες
τις πτυχές του σχεδιασμού των γωνιακών. Οι κανόνες αυτοί περιλαμβάνουν την ταξινόμηση
της διατομής, την αντοχή της διατομής για όλους τους τύπους φόρτισης, καθώς και κανόνες
για το σχεδιασμό μελών υπό μεμονωμένες ή και συνδυασμένες εσωτερικές αξονικές δυνάμεις
και ροπές. Όλοι οι προτεινόμενοι κανόνες είναι γραμμένοι υπό την μορφή των διατάξεων του
Ευρωκώδικα 3, ώστε να είναι δυνατή η άμεση ενσωμάτωσή τους στην επερχόμενη έκδοση.
Επιπλέον, τα γωνιακά προφίλ χρησιμοποιούνται ευρέως σε δικτυωτούς πύργους και ιστούς για
τηλεπικοινωνιακούς σκοπούς ή για τη μεταφορά ηλεκτρικής ενέργειας. Τέτοιοι τύποι πύργων
σχεδιάζονται κυρίως σύμφωνα με τα πρότυπα EN 1993-3-1 και EN 50341-1, βάσει μιας
γραμμικής ελαστικής ανάλυσης πρώτης τάξεως όπου η κατασκευή προσομοιώνεται ως ένα
δικτύωμα. Στην παρούσα εργασία πραγματοποιείται αξιολόγηση της τρέχουσας προσέγγισης
σχεδιασμού, όπου ο πύργος προσομοιώνεται με ένα λογισμικό μη γραμμικών πεπερασμένων
στοιχείων, λαμβάνοντας υπόψη τις αρχικές ατέλειες στην κατασκευή καθώς και τις μη
γραμμικότητες του υλικού και της γεωμετρίας. Υπογραμμίζεται η σημασία των φαινομένων
δευτέρας τάξεως στην ανάλυση, ενώ επισημαίνεται η ύπαρξη μιας μορφής αστάθειας που δεν
καλύπτεται άμεσα από τους κανονισμούς και ως εκ τούτου, συνήθως δεν ελέγχεται. Στην
συνέχεια, δύο αναλυτικά μοντέλα για την πρόβλεψη του κρίσιμου φορτίου του νέου τρόπου
λυγισμού προτείνονται και επικυρώνονται αριθμητικά. Και τα δύο προτεινόμενα μοντέλα είναι
εύκολα στην εφαρμογή τους και μπορούν να καλύψουν το κενό στις υπάρχουσες συστάσεις
σχεδιασμού για δικτυωτούς πύργους.

This project would not have been possible without the support of many people.
First, I am extremely grateful to my supervisors, Prof. Jean-Pierre Jaspart and Prof. Ioannis
Vayas and my co-supervisor Prof. Jean-François Demonceau for their invaluable advice,
continuous support, and patience during my PhD study. Their immense knowledge and
plentiful experience have encouraged me in all the time of my academic research.
I would like to thank again Prof. Jean-Pierre Jaspart and Prof. Jean-François Demonceau,
as well as Mrs. Laurence Defrere and my colleagues who make my stay in Liege happy, easy,
and pleasant.
I would like to thank all the members in the "Laboratoire de Mécanique des Matériaux et
Structures” of Liège University and especially Nicola Labeye for his technical support, help
and the excellent cooperation during the experimental campaign.
Finally, the thesis is dedicated to my parents and my girlfriend for their unconditional,
unequivocal, and loving support. Without their tremendous understanding and
encouragement in the past few years, it would be impossible for me to complete my study.
This study was carried under the financial assistance of the European Research project entitled
ANGELHY “Innovative solutions for design and strengthening of telecommunications and transmission
lattice towers using large angles from high strength steel and hybrid techniques of angles with FRP
strips”, with a financial grant from the Research Fund for Coal and Steel (RFCS) of the European
Community.
TABLE OF CONTENTS
1. INTRODUCTION.................................................................................................... 1
2. NOTATIONS, SYMBOLS AND ABBREVIATIONS .......................................... 4
2.1 Conventions for member axes ......................................................................................... 4
2.2 Symbols ............................................................................................................................ 4
2.2.1 Latin upper-case symbols ......................................................................................... 4
2.2.2 Latin lower-case symbols ......................................................................................... 6
2.2.3 Greek upper-case symbols ........................................................................................ 6
2.2.4 Greek lower-case symbols ........................................................................................ 6
3. ELASTIC INSTABILITY OF SINGLE ANGLE MEMBERS ........................... 8
3.1 Analytical derivation of the critical load of a column by Euler’s theory ........................ 8
3.1.1 Column loaded at the shear centre ........................................................................... 9
3.1.2 Column loaded with a random eccentricity ............................................................ 10
3.1.3 Summary ................................................................................................................. 12
3.2 Higher buckling modes .................................................................................................. 12
3.3 Instability due to tensile load ........................................................................................ 12
3.4 Influence of the boundary conditions ............................................................................ 13
3.5 Influence of the loading type ......................................................................................... 14
3.6 Second order elastic buckling analyses ......................................................................... 14
3.7 Numerical and analytical studies .................................................................................. 15
3.8 Conclusions ................................................................................................................... 20
4. CLASSIFICATION OF EQUAL LEG ANGLES PROFILES ......................... 22
4.1 Description of the numerical model .............................................................................. 22
4.2 Classification to compression ........................................................................................ 23
4.3 Classification to strong axis bending ............................................................................ 25
4.4 Classification to weak axis bending .............................................................................. 28
4.4.1 Tip in compression ................................................................................................. 28
4.4.2 Tip in tension .......................................................................................................... 31
4.5 Summary of classification for equal leg angle sections ................................................ 32
4.6 Conclusions ................................................................................................................... 32
5. DESIGN RESISTANCES OF ANGLE CROSS-SECTIONS ............................ 33
5.1 Cross-section resistance to tension ............................................................................... 33
5.2 Cross-section resistance to compression ....................................................................... 33
5.3 Cross-section resistance to strong axis bending ........................................................... 34
5.4 Cross-section resistance to weak axis bending ............................................................. 36
5.4.1 Tip in compression ................................................................................................. 36
5.4.2 Tip in tension .......................................................................................................... 38
5.5 Conclusions ................................................................................................................... 39
6. COMPRESSION TESTS ON HIGH STRENGTH STEEL COLUMNS ......... 40
6.1 Details of the tested specimens ...................................................................................... 40
6.2 Test measurements ........................................................................................................ 41
6.2.1 Actual dimensions of the cross-sections ................................................................. 41
6.2.2 Measurement of initial geometrical imperfections along the member length ........ 42
6.2.3 Coupon tests for the material properties ................................................................ 44
6.2.4 Measurements during the test ................................................................................. 45
6.2.5 Mathematical interpretation of the measurements ................................................. 46
6.3 Results of the experimental tests .................................................................................... 47
6.4 Comparison with FEM analyses ................................................................................... 51
6.5 Conclusions ................................................................................................................... 55
7. DESIGN RULES FOR MEMBERS MADE OF ANGLES ............................... 56
7.1 Design rules and recommendations .............................................................................. 56
7.1.1 Buckling resistance to compression ....................................................................... 56
7.1.2 Lateral torsional buckling resistance to strong axis bending ................................ 57
7.1.3 Resistance to weak axis bending ............................................................................ 59
7.1.4 Buckling resistance to bending and axial compression .......................................... 59
7.1.5 General method for angles ..................................................................................... 60
7.2 Numerical validation ..................................................................................................... 61
7.2.1 Description of the numerical models ...................................................................... 61
7.2.2 Members in axial compression ............................................................................... 63
7.2.3 Members in strong axis bending ............................................................................. 65
7.2.4 Members in weak axis bending ............................................................................... 67
7.2.5 Members in bending and axial compression .......................................................... 69
7.2.6 General method for angle sections ......................................................................... 71
7.3 Experimental validation ................................................................................................ 72
7.3.1 Centric compression tests at Tsinghua University ................................................. 73
7.3.2 Centric and eccentric compression tests at ULiège ............................................... 74
7.3.3 Eccentric compression tests at NTUA .................................................................... 75
7.3.4 Eccentric compression tests at TU Graz ................................................................ 76
7.3.5 Eccentric compression tests at TUBraunschweig .................................................. 77
7.4 Conclusions ................................................................................................................... 78
8. STRUCTURAL TYPOLOGIES OF TRANSMISSION TOWERS ................. 79
8.1 Typologies of transmission towers ................................................................................ 79
8.2 Functions of transmission towers .................................................................................. 79
8.3 Steel lattice towers ......................................................................................................... 80
8.3.1 The tower’s structure .............................................................................................. 80
8.3.2 Typologies of lattice towers .................................................................................... 83
9. ASSESSMENT OF THE DESIGN OF A TRANSMISSION TOWER ............ 86
9.1 Details of the studied tower ........................................................................................... 86
9.1.1 Geometry of the tower and the line ........................................................................ 87
9.1.2 Conductors and insulators ..................................................................................... 88
9.1.3 Initial design of the studied tower .......................................................................... 89
9.2 Numerical simulation of the tower with FINELG ......................................................... 90
9.2.1 Description of the finite element model .................................................................. 90
9.2.2 Applied loads .......................................................................................................... 91
9.2.3 Load combinations ................................................................................................. 95
9.3 Comparison of FINELG and TOWER models in the elastic range ............................... 95
9.4 Numerical results .......................................................................................................... 96
9.4.1 Elastic instability analysis ...................................................................................... 97
9.4.2 Second order elastic analyses ................................................................................ 97
9.4.3 Full non-linear analyses ......................................................................................... 99
9.5 Conclusions ................................................................................................................. 100
10. THE SEGMENT INSTABILITY MODE ....................................................... 101
10.1 Definition of segment instability ................................................................................ 101
10.2 Proposed analytical models ...................................................................................... 102
10.2.1 Simplified model ................................................................................................. 102
10.2.2 Refined model ..................................................................................................... 102
10.2.3 Ultimate resistance of the leg ............................................................................. 105
10.3 Validation of the proposed models ............................................................................ 105
10.4 Existing recommendations of the normative documents ........................................... 107
10.5 Application of the design models ............................................................................... 108
10.6 Conclusions ............................................................................................................... 109
11. GENERAL CONCLUSIONS AND PERSPECTIVES................................... 110
11.1 Conclusions ............................................................................................................... 110
11.2 Research contribution and innovation ...................................................................... 111
11.3 Perspectives for future research ................................................................................ 112
12. ANNEX A: GEOMETRICAL PROPERTIES OF ANGLE PROFILES ..... 113
12.1 Elastic and plastic modulus about strong axis .......................................................... 113
12.2 Elastic and plastic modulus about weak axis ............................................................ 113
12.3 Torsional and warping constant ................................................................................ 114
13. ANNEX B: NUMERICAL SIMULATION OF FULL-SCALE TESTS ....... 115
13.1 Details of the tests ..................................................................................................... 115
13.2 Description of the numerical model of the tower ...................................................... 117
13.3 Numerical results ...................................................................................................... 118
14. REFERENCES ................................................................................................... 121


Design of lattice towers made of large hot-rolled high strength steel angles
_______________________________________________________________________________
1 Marios-Zois BEZAS
1. INTRODUCTION
Lattice towers are extensively built in Europe and worldwide to serve telecommunication or power
transmission purposes. Such towers are often installed in mountainous terrains with very limited
access to heavy vehicles. Consequently, a lattice tower structural system, which may be transported
and erected by light machinery and equipment, is almost the only possible solution. The in situ
modular construction of the tower is simplified using bolted connections and gusset plates. On the
other hand, lattice towers need more ground space compared to cylindrical, octagonal or similar
shell-type systems. However, ground space is plentifully available in remote places outside the
densely populated regions for most of the European countries. Therefore, lattice towers are rendered
as the main structural system for telecommunication and power transmission. The main typologies
of the transmission towers are reported in chapter 8.
The members of such towers are frequently composed of equal leg angle sections; their easy
production and transportation, together with an excellent connectivity discern them from other
profiles. They are available as hot-rolled or cold-formed profiles, as equal or unequal sections
depending on the relative length of their legs, in steel grades up to S460, in sizes ranging from small
to large, 20 to 300 mm. They are employed either as single or as built-up sections in a back-to-back
or star battened configuration. The preferred bolted connection of one leg to gusset plates leads to a
most advantageous application as truss or diaphragm members in buildings, bridges or any other
structural application and, as already said, steel towers and masts. Appropriate long life corrosion
protection is additionally ensured since all angle sizes are fully amenable to hot dip galvanizing in
contrast to several other types of open or closed sections.
However, angles, and especially equal angle profiles considered here, exhibit some properties that
clearly distinguish them from other common steel profiles: (i) they are open profiles with very small
section constants in both torsion and warping, (ii) they are monosymmetrical sections, (iii) their
bending capacity and radius of gyration around the weak axis are substantially lower than around
strong axis, (iv) their legs are prone to local buckling as external plate elements, (v) their plastic
resistances are substantially higher than their elastic ones and (vi) due to the eccentric connection in
one leg, they are subjected to some bending in addition to axial force when used as single members.
The particularities of the angle sections in comparison with the doubly symmetric well-known ones
in terms of elastic instability are presented in chapter 3.
These features explain that existing design rules for other types of sections, mostly doubly symmetric
ones, cannot safely cover angles, what inevitably leads to the need for the development of specific
design provisions for angle sections. Facing the lack of unified consistent rules for angles, European
specifications have adopted a case-by-case approach, embedding individual rules and
recommendations in various parts of Eurocode 3. More specifically, EN 1993-1-1 [1] provides rules
for cross-section classification (classes 1 to 4) and general design recommendations for the
verification of the stability in compression. EN 1993-3-1 [2] presents specific rules for the buckling
resistance of angle members used in towers, when connected eccentrically with bolts in one leg. EN
1993-1-8 [3] contains rules for resistance to tension for the above-mentioned connection
configuration, while EN 1993-1-5 [4] gives rules for buckling resistance of class-4 angle sections
prone to local buckling. Another European specification, the CENELEC standard EN 50341-1 [5]
provides specific rules for lattice towers used in the field of overhead electrical lines, addressing
specific problems linked to such applications; but it also provides specific rules for the verification

Design of lattice towers made of large hot-rolled high strength steel angles
_______________________________________________________________________________
2 Marios-Zois BEZAS
of the lattice tower and its constituting parts. But for some aspects, the EN 50341-1 design methods
for angle sections may diverge from the rules provided in the Eurocodes. Moreover, EN 50341-1
allows design of lattice towers by full scale testing. However, it draws design conclusions from a
single test comparing the ultimate load achieved in the test with the corresponding one from
calculations, neglecting the fact that the results of an individual test are influenced by potential
material overstrength, strain hardening or other parameters, the values of which are associated with
statistical uncertainties Consequently, it does not touch reliability issues as it is done in the structural
Eurocodes, in accordance with EN 1990 [6]. In contrast to the European Codes, American Codes
have written down in a single document, AISC 2000 [7], all rules concerning angle design.
Extensive numerical and experimental research has been carried out to study the behaviour of angle
sections. It covers hot-rolled and cold-formed profiles, equal and unequal sections, beams or columns
subjected to various types of loading, as well as different connection conditions. Vayas et al. [8] give
the inelastic capacity of angle sections to combined axial forces and biaxial bending. Trahair [9]
examines angle section beams to uniform eccentric transverse loading and gives the section capacity
to combined shear, bending and torsion. Schillo et al. [10] examine the buckling resistance rules of
rolled angles to European standards discussed before, compare them to test results and numerical
investigations considering various types of initial imperfections. Kettler et al. [11] highlight the
importance of the end support conditions in their numerical study of rolled angles loaded in
compression through bolted connections in one leg and comparisons with experimental results and
provisions of European standards. Hussain et al. [12] provide an interaction equation in the plastic
range for the stability design of angles subjected to compression and biaxial bending. Compression
tests on large angle sections ranging from L125x125x8 to L200x200x14 in high strength steel S420
were conducted in Tsinghua University at Beijing [13]. The tests were carried out on axially loaded
pin-ended columns in order to define global-local buckling interactions since cross-sections were
class-4 ones. Tests on L70x70x7 profiles were performed at NTUA in Athens [14], where the effects
of eccentric loading were studied. Compression tests on L80x80x8 and L120x120x12 profiles were
carried out at TU Graz [11] in which the boundary conditions were varying from clamped supports
to supports allowing in-plane or in- and out-of-plane rotation. Tests series on L50x50x5 profiles were
carried out at the Technical University of Braunschweig [15] with various specimen lengths and end
support conditions, while the load was introduced eccentrically through one bolt M12 in one leg.
In the perspective of the thesis and in order to extend the knowledge for the stability behaviour of
steel columns from high strength steel (S460M) angle cross-sections subjected to compression and
bending, twelve buckling tests on such columns have been performed at Liège University and
presented in chapter 6. Furthermore, existing European specifications on rolled equal angle sections
were reviewed, extensive experimental, analytical and numerical studies have been conducted and a
complete set of design rules covering all aspects of design has been developed and duly validated.
They include cross section classification (chapter 4), cross section design for all ranges of response,
plastic, elastic-plastic or elastic including local buckling (chapter 5), as well as corresponding rules
for member design to individual and combined internal forces and moments (chapter 7). Details for
the geometrical properties of angles are given in chapter 12 (Annex A), while the notations and
symbols that are used in the whole document, are summarized in chapter 2.
Concerning the structural analysis, in the above-mentioned normative documents, the tower is
modelled as a simple truss structure where all the steel element connections are considered as hinged.
Such models do not adequately reflect the actual structural behaviour of the tower, as loads and
Design of lattice towers made of large hot-rolled high strength steel angles
_______________________________________________________________________________
3 Marios-Zois BEZAS
especially wind ones are directly imposed on the entire member length and introduce bending
moments in members. Furthermore, the design of lattice towers is usually carried out through a first
order linear elastic analysis, neglecting the significant second order effects developing in these
structures. It is therefore inconsistent, and sometimes not safe, to perform member design by
neglecting moments due to both local and overall loading, as well as the second order effects, as it is
usually done in practice. A critical assessment of the current design approach is performed in chapter
9, where the tower is simulated with the full non-linear finite element software named FINELG using
beam elements, considering relevant imperfections as well as geometrical and material non-
linearities. In these simulations, every single member has been properly modelled, in terms of
orientation and eccentricities at its extremities. The importance of considering the second order
effects in the analysis is underlined. The selected software has been firstly validated through
comparisons to full-scale tests available in the literature, as presented in chapter 13 (Annex B).
A lot of research has been performed through years on the modelling and the design of lattice towers.
Albermani et al. [16] have studied the structural behaviour of the transmission towers through full
non-linear analysis and compared them with full scale tests. The influence of the selected element
(truss or beam) in the final response of the tower have been reported also by Silva et al. [17]. Jiang
et al. [18] investigated the modelling of the bolted connections and validate their response through
available tests from the literature, while Kitiponchai et al. [19] examined the effect of bolt slippage
on the ultimate behaviour of lattice structures. Finally, a collection and critical review of full-scale
tests on lattice towers as well as practical advice for conducting future tests are reported in Ref. [20].
However, the existence of an instability mode not properly covered by the European normative
documents is highlighted in the framework of the thesis. Therefore, two analytical models for the
prediction of the critical load of the new buckling mode are proposed in chapter 10, followed by their
numerical validation through FEM simulations. Comparisons with the existing normative predictions
are presented too.
Finally, chapter 11 presents the general conclusions as well as the perspectives of the thesis for future
research.
Design of lattice towers made of large hot-rolled high strength steel angles
_______________________________________________________________________________
4 Marios-Zois BEZAS
2. NOTATIONS, SYMBOLS AND ABBREVIATIONS
The notations, symbols and abbreviations that used hereafter in this document are defined below;
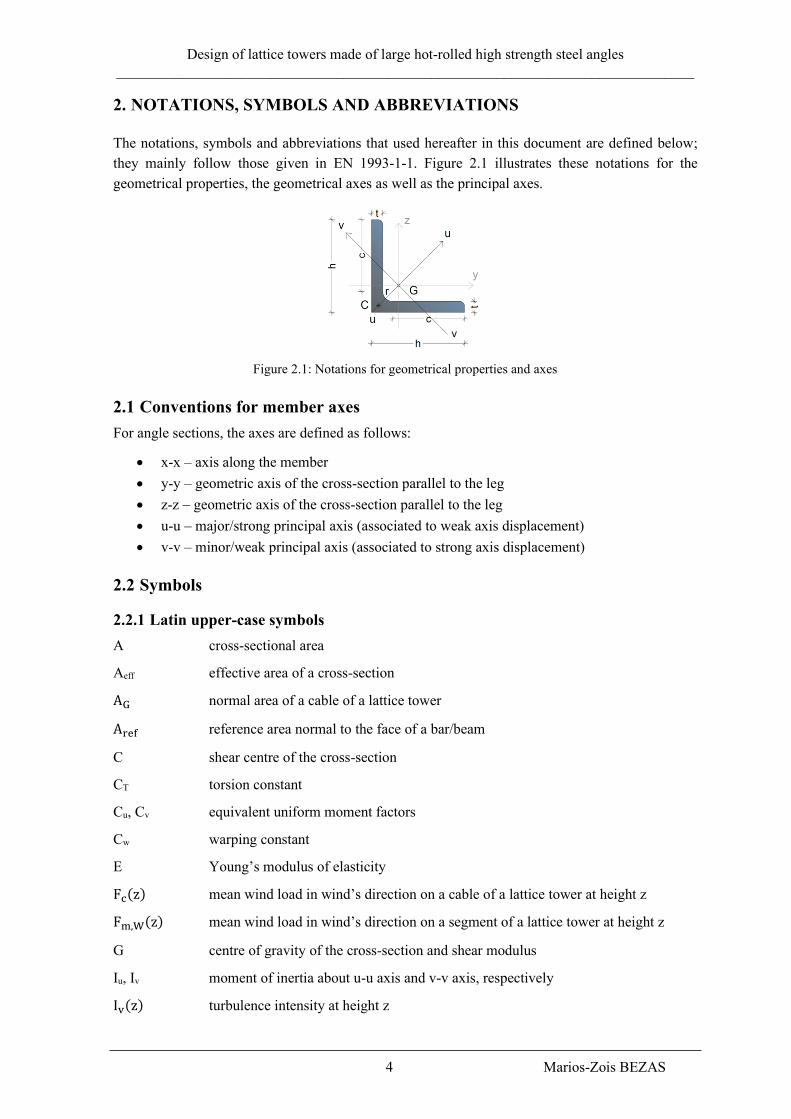
they mainly follow those given in EN 1993-1-1. Figure 2.1 illustrates these notations for the
geometrical properties, the geometrical axes as well as the principal axes.
Figure 2.1: Notations for geometrical properties and axes
2.1 Conventions for member axes
For angle sections, the axes are defined as follows:
• x-x – axis along the member
• y-y – geometric axis of the cross-section parallel to the leg
• z-z – geometric axis of the cross-section parallel to the leg
• u-u – major/strong principal axis (associated to weak axis displacement)
• v-v – minor/weak principal axis (associated to strong axis displacement)
2.2 Symbols
2.2.1 Latin upper-case symbols
A cross-sectional area
Aeff effective area of a cross-section
AG normal area of a cable of a lattice tower
Aref reference area normal to the face of a bar/beam
C shear centre of the cross-section
CT torsion constant
Cu, Cv equivalent uniform moment factors
Cw warping constant
E Young’s modulus of elasticity
Fc(z) mean wind load in wind’s direction on a cable of a lattice tower at height z
Fm,W(z) mean wind load in wind’s direction on a segment of a lattice tower at height z
G centre of gravity of the cross-section and shear modulus
Iu, Iv moment of inertia about u-u axis and v-v axis, respectively
Iv(z) turbulence intensity at height z
Design of lattice towers made of large hot-rolled high strength steel angles
_______________________________________________________________________________
5 Marios-Zois BEZAS
Iy, Iz moment of inertia about y-y geometrical axis and z-z geometrical axis, respectively
L length of the member
Lcrit buckling length of the member
Mcr elastic critical bending moment based on the gross cross-sectional properties
Mel,u , Mel,v elastic resistance to bending of the gross cross-section about u-u and v-v axis,
respectively
Mpl,u , Mpl,v plastic resistance to bending of the gross cross-section about u-u and v-v axis,
respectively
MT tortional moment
Mu,Ed , Mv,Ed is the bending moment about u-u and v-v axis respectively
Mult,u , Mult,v ultimate test resistance to bending of the cross-section about u-u and v-v axis,
respectively
Mu,Rd , Mv,Rd design value of the resistance to bending moment about u-u and v-v axis respectively
Mu,Rk , Mv,Rk characteristic value of the resistance to bending moment about u-u and v-v axis
respectively
Nbu,Rd design value of the buckling resistance of a member in compression about u-u axis
Nbv,Rd design value of the buckling resistance of a member in compression about v-v axis
Ncr elastic critical axial force for the relevant buckling mode based on the gross cross-
sectional properties
Ncr,FT elastic critical axial force for flexural-torsional buckling
Nc,Rd design value of the resistance to uniform compression axial force of the cross-section
Nc,Rk characteristic value of the resistance to compression axial force
Ncr,T elastic critical axial force for torsional buckling
Ncr,u, Ncr,v elastic critical axial force for flexural buckling about u-u axis and v-v axis,
respectively, based on the gross cross-section properties
NEd is the axial force
Nt,Rd design value of the resistance to uniform tension axial force of the cross-section
Nt,Rk characteristic value of the resistance to tension axial force
Npl design value of the plastic resistance to axial force of the gross cross-section
Nult ultimate test resistance to axial force of the cross-section
Vc,i self-weight of the i conductor or cable of a lattice tower
Weff,u, Weff,v elastic section modulus of the effective area of a cross-section for bending about u-
u and v-v axis, respectively
Wel,u, Wel,v elastic section modulus for bending about u-u axis and v-v axis, respectively
Wpl,u, Wpl,v plastic section modulus for bending about u-u axis and v-v axis, respectively
Design of lattice towers made of large hot-rolled high strength steel angles
_______________________________________________________________________________
6 Marios-Zois BEZAS
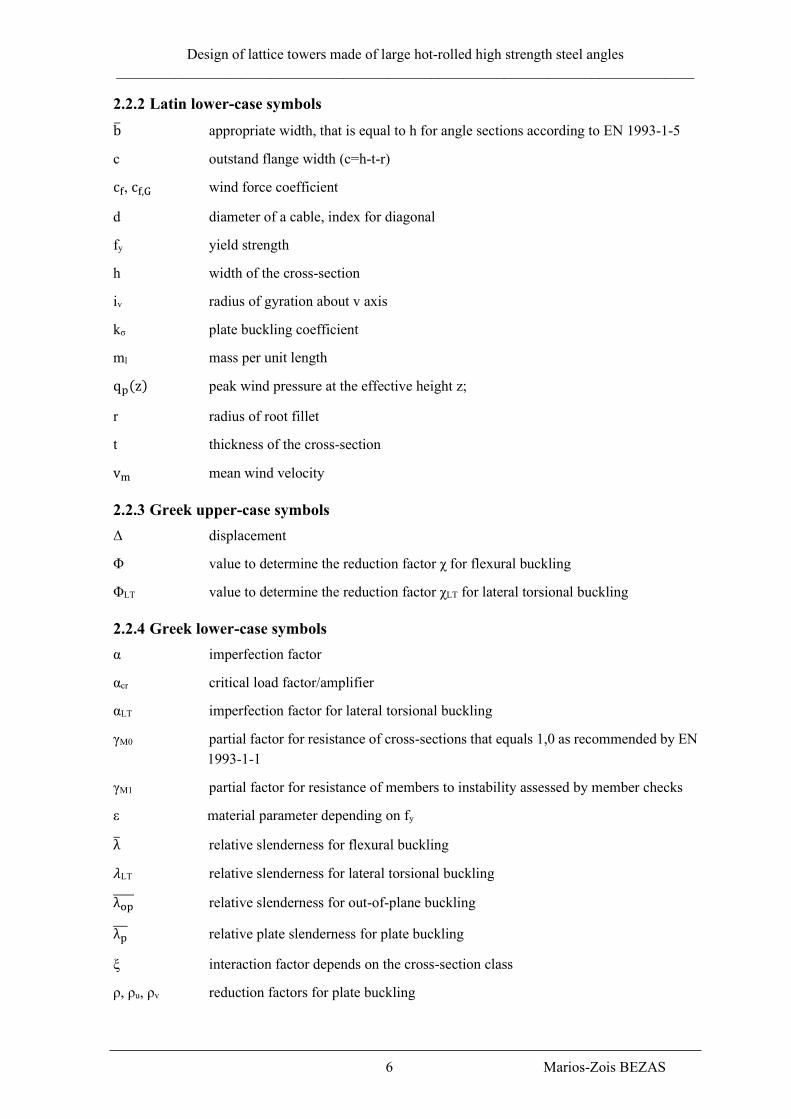
2.2.2 Latin lower-case symbols
b̅ appropriate width, that is equal to h for angle sections according to EN 1993-1-5
c outstand flange width (c=h-t-r)
cf, cf,G wind force coefficient
d diameter of a cable, index for diagonal
fy yield strength
h width of the cross-section
iv radius of gyration about v axis
kσ plate buckling coefficient
ml mass per unit length
qp(z) peak wind pressure at the effective height z;
r radius of root fillet
t thickness of the cross-section
vm mean wind velocity
2.2.3 Greek upper-case symbols
Δ displacement
Φ value to determine the reduction factor χ for flexural buckling
ΦLT value to determine the reduction factor χLT for lateral torsional buckling
2.2.4 Greek lower-case symbols
α imperfection factor
αcr critical load factor/amplifier
αLT imperfection factor for lateral torsional buckling
γM0 partial factor for resistance of cross-sections that equals 1,0 as recommended by EN
1993-1-1
γM1 partial factor for resistance of members to instability assessed by member checks
ε material parameter depending on fy
λ̅ relative slenderness for flexural buckling
𝜆LT relative slenderness for lateral torsional buckling
λop̅̅ ̅̅ relative slenderness for out-of-plane buckling
λp̅̅ ̅ relative plate slenderness for plate buckling
ξ interaction factor depends on the cross-section class
ρ, ρu, ρv reduction factors for plate buckling

Design of lattice towers made of large hot-rolled high strength steel angles
_______________________________________________________________________________
7 Marios-Zois BEZAS
ρair air density equal to 1,25 Kg/m3
σ1, σ2 end stresses in a member
σcr elastic critical plate buckling stress
χLT reduction factor for lateral torsional buckling
χu reduction factor due to flexural buckling about u-u axis
χv reduction factor due to flexural buckling about v-v axis
ψ ratio of end moments in a segment of beam, stress ratio, angle
Symbols that are used only in a specific case or example, are not defined in this chapter but they will
be defined individually where it is necessary hereafter.

Design of lattice towers made of large hot-rolled high strength steel angles
_______________________________________________________________________________
8 Marios-Zois BEZAS
3. ELASTIC INSTABILITY OF SINGLE ANGLE MEMBERS
Equal leg angles exhibit some properties that distinguish them from other common steel profiles.
They are open profiles with very small constants in both torsion and warping, are monosymmetric
sections, their legs are prone to local buckling as external elements and finally, due to the eccentric
connection in one leg, they are also subjected to bending when used as single members. In contrast
with the well-known doubly symmetric cross-sections, the critical loads of angle profile members
are affected by the position and the type of the loading and the buckling modes are not fully
decoupled, as explained below, in the most of the loading cases.
The analytical derivation of the critical load of an axially – centric or eccentric – loaded member,
based on Euler’s buckling theory, is presented in this chapter. The torsional effects and the
corresponding buckling mode, which consists a specific case for angle profiles, are investigated, and
the possibility of an instability due to a tensile load is reported. Furthermore, the influence of the
loading type, the boundary conditions and the initial imperfections to the critical load are also
addressed. Then, the analytical evaluations of the critical loads of a column are validated by
numerical simulations performed with the finite element software named FINELG through elastic
instability and 2nd order linear elastic analyses. This chapter consists a summary of the existing
knowledge aims to highlight the specificities of angle profiles, before going further in new
developments and analyse the classification, the cross-section resistance as well as the stability of
members made of angle profiles.
3.1 Analytical derivation of the critical load of a column by Euler’s theory
The analytical derivation of the critical load of a single angle pin-end column that is loaded by a
compression load P, can be found in literature [21]-[22] and is presented below. The axial load is
applied with an eccentricity at both axes (uP, vP). The cross-section is placed in such a way that its
local axes (u, v) coincide with the global ones (U, V) of the 3D Cartesian system and the static system
is schematized in Figure 3.1. The boundary conditions are:
• At node 1: 𝑥1 = 𝑢1 = 𝑣1 = 𝜃1 = 0;
• At node 2: 𝑢2 = 𝑣2 = 𝜃2 = 0;
• The warping restraint is free for both nodes.
Figure 3.1: Static system (right) and horizontal cut at the mid-height (left) for the analytical derivation of the
critical load

Design of lattice towers made of large hot-rolled high strength steel angles
_______________________________________________________________________________
9 Marios-Zois BEZAS
The internal axial force resulting from a first order linear elastic analysis is:
𝑁𝐸𝑑 = −𝑃 (Eq. 3.1)
According to the elastic buckling theory of Euler, the three equations of equilibrium for an equal
leg angle column, where (uc, up, vp ≠ 0 and vc=0), are the following:
𝐸𝐼𝑣𝑑4𝑢(𝑥)
𝑑𝑥4+ 𝑃
𝑑2𝑢(𝑥)
𝑑𝑥2− 𝑃(𝑢𝐶 − 𝑢𝑃)
𝑑2𝜃(𝑥)
𝑑𝑥2= 0 (Eq. 3.2)
𝐸𝐼𝑢𝑑4𝑣(𝑥)
𝑑𝑥4+ 𝑃
𝑑2𝑣(𝑥)
𝑑𝑥2− 𝑃𝑣𝑃
𝑑2𝜃(𝑥)
𝑑𝑥2= 0 (Eq. 3.3)
𝐺𝐶𝑇𝑑2𝜃(𝑥)
𝑑𝑥2− 𝐸𝐶𝑤
𝑑4𝜃(𝑥)
𝑑𝑥4− 𝑃 [
𝐼𝑢+𝐼𝑣
𝐴+ 𝑢𝐶
2]𝑑2𝜃(𝑥)
𝑑𝑥2− 𝑃𝑢𝑃 (
𝐼𝑢𝑟2
𝐼𝑣− 2𝑢𝐶)
𝑑2𝜃(𝑥)
𝑑𝑥2−
𝑃(𝑢𝑃 − 𝑢𝐶)𝑑2𝑢(𝑥)
𝑑𝑥2+ 𝑃𝑣𝑃
𝑑2𝑣(𝑥)
𝑑𝑥2= 0 (Eq. 3.4)
where:
𝐼𝑢𝑟2 = ∫ 𝑢(𝑢2 + 𝑣2)𝑑𝐴 ≈√2
2(ℎ − 0,5𝑡) (
(ℎ−0,5𝑡)3𝑡
12−(ℎ−0,5𝑡)𝑡3
12 )
𝐴 (Eq. 3.5)
3.1.1 Column loaded at the shear centre
It can be seen that the full decoupling between flexural and torsional buckling modes can occur only
in the case where the axial load is applied to the shear centre (𝑢𝐶 = 𝑢𝑃; 𝑣𝑃 = 0); then the three
equations of equilibrium become:
𝐸𝐼𝑣𝑑4𝑢(𝑥)
𝑑𝑥4+ 𝑃
𝑑2𝑢(𝑥)
𝑑𝑥2= 0 (Eq. 3.6)
𝐸𝐼𝑢𝑑4𝑣(𝑥)
𝑑𝑥4+ 𝑃
𝑑2𝑣(𝑥)
𝑑𝑥2= 0 (Eq. 3.7)
𝐺𝐶𝑇𝑑2𝜃(𝑥)
𝑑𝑥2− 𝐸𝐶𝑤
𝑑4𝜃(𝑥)
𝑑𝑥4− 𝑃 [
𝐼𝑢+𝐼𝑣
𝐴+ 𝑢𝐶
2]𝑑2𝜃(𝑥)
𝑑𝑥2− 𝑃𝑢𝑃 (
𝐼𝑢𝑟2
𝐼𝑣− 2𝑢𝐶)
𝑑2𝜃(𝑥)
𝑑𝑥2= 0 (Eq. 3.8)
It is assumed that the column buckles with a half-sine deformation shape. This being, the following
deformations are adopted:
𝑢(𝑥) = 𝐴1sin (𝜋𝑥
𝐿) ; 𝑣(𝑥) = 𝐴2sin (
𝜋𝑥
𝐿) ; 𝜃(𝑥) = 𝐴3sin (
𝜋𝑥
𝐿) (Eq. 3.9)
By solving the above system, one founds that the constants A1, A2 and A3 are not zero for the critical
loads:
𝑃 = 𝑁𝑐𝑟,𝑢 =𝜋2𝐸𝐼𝑣
𝐿2 (Eq. 3.10)
𝑃 = 𝑁𝑐𝑟,𝑣 =𝜋2𝐸𝐼𝑢
𝐿2 (Eq. 3.11)
𝑃 = 𝑁𝑐𝑟,𝑇 =1
𝐴𝑟𝑐( 𝐺𝐶𝑇 +
𝜋2𝐸𝐶𝑤
𝐿2) (Eq. 3.12)
where,
𝐴𝑟𝑐 =𝐼𝑢+𝐼𝑣
𝐴+ 𝑢𝐶
2 + 𝑢𝐶 (𝐼𝑢𝑟2
𝐼𝑣− 2𝑢𝐶) (Eq. 3.13)
The first two loads indicate a flexural buckling along U and V axis respectively while the third one
indicates a pure torsional buckling mode. Obviously, the critical load of the column is the smallest
one among these loads.

Design of lattice towers made of large hot-rolled high strength steel angles
_______________________________________________________________________________
10 Marios-Zois BEZAS
3.1.2 Column loaded with a random eccentricity
In the general case where the load is applied with an eccentricity at both axes (uP, vP), but not at the
shear centre, the three equations of equilibrium transform into the following ones, by using eq. (3.9):
𝐴1 (𝜋2𝐸𝐼𝑣
𝐿2− 𝑃) + 𝐴3𝑃𝑣𝑃 = 0 (Eq. 3.14)
𝐴2 (𝜋2𝐸𝐼𝑢
𝐿2− 𝑃) − 𝐴3𝑃(𝑢𝐶 − 𝑢𝑃) = 0 (Eq. 3.15)
𝐴1𝑃𝑣𝑃 + 𝐴2𝑃(𝑢𝐶 − 𝑢𝑃) + 𝐴3 (𝜋2𝐸𝐶𝑤
𝐿2+ 𝐺𝐶𝑇 − 𝑃𝐴𝑟𝑝) = 0 (Eq. 3.16)
where
𝐴𝑟𝑝 =𝐼𝑢+𝐼𝑣
𝐴+ 𝑢𝐶
2 + 𝑢𝑃 (𝐼𝑢𝑟2
𝐼𝑣− 2𝑢𝐶) (Eq. 3.17)
The column will buckle for the minimum load P that satisfies eq. (3.14) – (3.16) when the constants
A1, A2 and A3 are not zero; this can be written in a matrix format as:
[
𝑁𝑐𝑟,𝑢 − 𝑃 0 𝑃𝑣𝑃0 𝑁𝑐𝑟,𝑣 − 𝑃 𝑃(𝑢𝐶 − 𝑢𝑃)
𝑃𝑣𝑃 𝑃(𝑢𝐶 − 𝑢𝑃) 𝐴𝑟𝑝(𝑁𝑐𝑟,𝑇 − 𝑃)] = 0 (Eq. 3.18)
Therefore, the critical load can be found by solving eq. (3.19).
𝐴𝑟𝑝(𝑁𝑐𝑟,𝑢 − 𝑃)(𝑁𝑐𝑟,𝑣 − 𝑃)(𝑁𝑐𝑟,𝑇 − 𝑃) − 𝑃2(𝑁𝑐𝑟,𝑣 − 𝑃)𝑣𝑃
2 − 𝑃2(𝑁𝑐𝑟,𝑢 − 𝑃)(𝑢𝐶 − 𝑢𝑃)2 = 0
(Eq. 3.19)
It should be noted that the value of Ncr,T should be calculated according to the eccentricity of the
applied load by using eq. (3.12) and replacing Arc with Arp.
To simplify the solution of eq. (3.19), two fundamental cases may be distinguished in terms of the
position of the applied load:
1. the load is applied on the axis of symmetry (uc, up ≠ 0, vp = 0);
2. the load is not applied on the axis of symmetry (uc, up, vp ≠ 0);
To find the roots of eq. (3.19) is equivalent to the determination of the intersection points between
the abscissa P and the curves fi(P); this writes as follows for case 1 and case 2, respectively:
𝑓1(𝑃) = (𝑁𝑐𝑟,𝑢 − 𝑃)[Arp(𝑁𝑐𝑟,𝑣 − 𝑃)(𝑁𝑐𝑟,𝑇 − 𝑃) − 𝑃2(𝑢𝐶 − 𝑢𝑃)
2] (Eq. 3.20)
𝑓2(𝑃) = 𝐴𝑟𝑝(𝑁𝑐𝑟,𝑢 − 𝑃)(𝑁𝑐𝑟,𝑣 − 𝑃)(𝑁𝑐𝑟,𝑇 − 𝑃) − 𝑃2(𝑁𝑐𝑟,𝑣 − 𝑃)𝑣𝑃
2
−𝑃2(𝑁𝑐𝑟,𝑢 − 𝑃)(𝑢𝐶 − 𝑢𝑃)2 = 0 (Eq. 3.21)
For the values such that 𝐴𝑟𝑝 − (𝑢𝐶 − 𝑈𝑃)2 ≥ 0, the form of the curve fi(P) and therefore the position
of its roots, can be estimated by calculating the sign of the curve for the values 0, Ncr,u, Ncr,v, Ncr,T and
∞. The roots of the curve can be noted as P1 = Ncr,1, P2 = Ncr,2 and P3 = Ncr,3 where 𝑁𝑐𝑟,1 ≤ 𝑁𝑐𝑟,2 ≤
𝑁𝑐𝑟,3. By the acceptance that 𝑁𝑐𝑟,𝑢 ≤ 𝑁𝑐𝑟,𝑣 , the two fundamental cases considered above can be
additionally divided into three sub-groups:
a) 𝑁𝑐𝑟,𝑢 ≤ 𝑁𝑐𝑟,𝑣 ≤ 𝑁𝑐𝑟,𝑇
b) 𝑁𝑐𝑟,𝑇 ≤ 𝑁𝑐𝑟,𝑢 ≤ 𝑁𝑐𝑟,𝑣
c) 𝑁𝑐𝑟,𝑢 ≤ 𝑁𝑐𝑟,𝑇 ≤ 𝑁𝑐𝑟,𝑣

Design of lattice towers made of large hot-rolled high strength steel angles
_______________________________________________________________________________
11 Marios-Zois BEZAS
Figure 3.2, Figure 3.3 and Figure 3.4 illustrate the curves fi(P) and their roots – as they are also
reported in Ref. [22] – for the two fundamental cases for all the different sub-groups mentioned
above. It should be noted that these figures are all illustrative and do not present explicit results of a
calculation. It can be seen that the critical load P1 = Ncr,1, is:
- the flexural buckling load Pcr,u for the case 1, subgroups a and c;
- the flexural-torsional buckling load in all the other cases with a value lower than Pcr,u and Pcr,T.
Figure 3.2: Schematized form of the curves fi(P) when Ncr,u ≤ Ncr,v ≤ Ncr,T
Figure 3.3: Schematized form of the curves fi(P) when Ncr,T ≤ Ncr,u ≤ Ncr,v
Figure 3.4: Schematised form of the curves fi(P) when Ncr,u ≤ Ncr,T ≤ Ncr,v

Design of lattice towers made of large hot-rolled high strength steel angles
_______________________________________________________________________________
12 Marios-Zois BEZAS
3.1.3 Summary
There are three ways in which an angle member can buckle, if local plate buckling does not occur:
flexural buckling, torsional buckling, and flexural-torsional buckling.
Flexural buckling (FB) can occur in any compression member that experiences a deflection caused
by bending without any torsion or the cross section along the member. Flexural buckling occurs
about the axis with the largest slenderness ratio and the smallest radius of gyration. Therefore, it can
occur in direction of u or v axis as it shown if the Figure 3.5(a)-(b), but for pin-ended members it
happens along weak axis u, as it has been also shown through the analytical calculation.
Torsional buckling (TB), that it is caused by a rotation about the longitudinal axis (see Figure 3.5(c)),
occurs almost never in hot rolled angle cross-sections, except the case where the section is loaded at
the shear centre (see §3.3 for more details). In all the other cases, a flexural-torsional buckling occurs.
Flexural-torsional buckling (FTB) is the simultaneous bending and twisting of a member (see Figure
3.5(d)) and it is a very common buckling mode for angle sections. If this type of buckling occurs,
two possible buckling modes can appear: one in which the flexural deflection is predominated,
accompanied by a small torsion of the cross-section and another one in which the torsion is
predominant is accompanied by a small deflection, depending on the member length.
Figure 3.5: (a),(b) Deflections due to flexural buckling along u,v axis, (c) deflections due to torsional
buckling, (d) deflections due to flexural-torsional buckling
3.2 Higher buckling modes
In the case where the critical load of a higher buckling mode needs to be calculated, eq. (3.20) or
(3.21) may be accordingly used, where the following parameters are applied:
𝑁𝑐𝑟,𝑢,𝑛 = 𝑛2 𝜋
2𝐸𝐼𝑣
𝐿2 (Eq. 3.22)
𝑁𝑐𝑟,𝑣,𝑛 = 𝑛2 𝜋
2𝐸𝐼𝑢
𝐿2 (Eq. 3.23)
𝑁𝑐𝑟,𝑇,𝑛 =1
𝐴𝑟𝑝( 𝐺𝐶𝑇 + 𝑛
2 𝜋2𝐸𝐶𝑤
𝐿2) (Eq. 3.24)
where n=2,3,4,...,n, for the second, third, fourth, .. nth buckling mode.
It should be also noticed that as the shear centre is located at the intersection of the two legs, there is
practically no warping rigidity and the warping constant Cw can be assumed to be zero. Therefore, it
may be assumed that the torsional buckling mode is not affected by the member length.
3.3 Instability due to tensile load
Depending on the cross-section geometry and the load eccentricity, instability may be occurred even
for a tensile load, as reported in [22]. Indeed, Vlassov [23] shows that a cross-section can be unstable
Design of lattice towers made of large hot-rolled high strength steel angles
_______________________________________________________________________________
13 Marios-Zois BEZAS
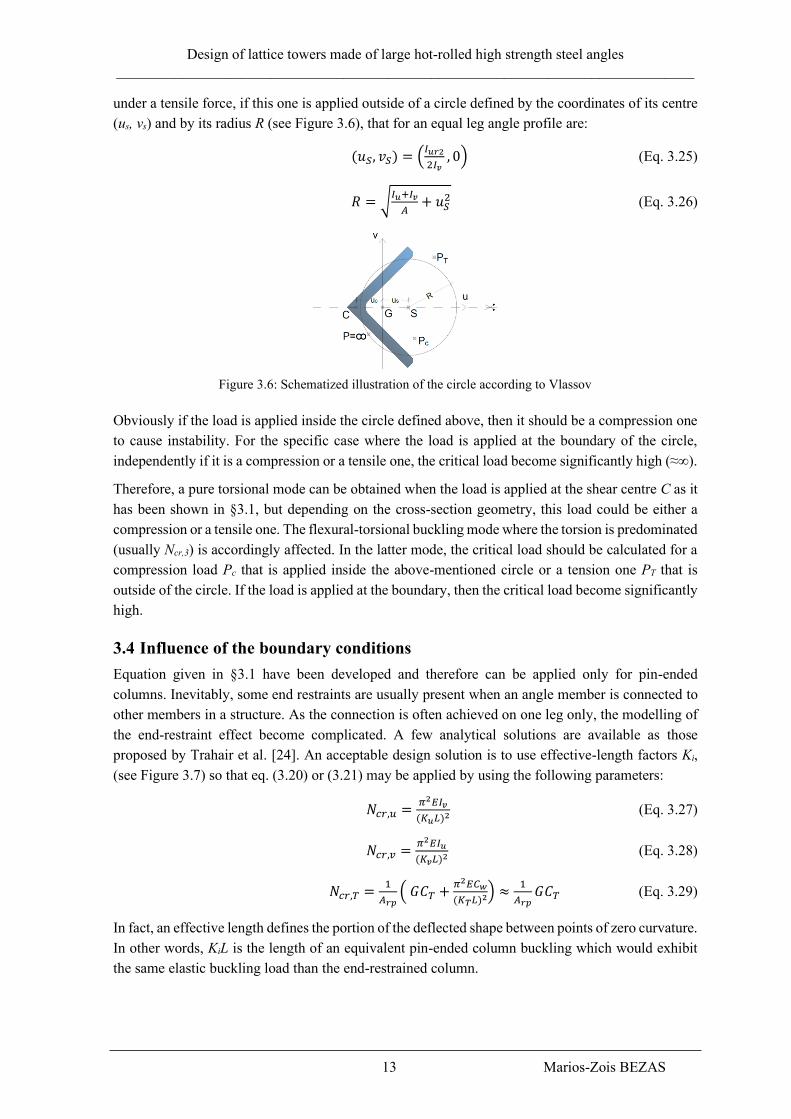
under a tensile force, if this one is applied outside of a circle defined by the coordinates of its centre
(us, vs) and by its radius R (see Figure 3.6), that for an equal leg angle profile are:
(𝑢𝑆, 𝑣𝑆) = (𝐼𝑢𝑟2
2𝐼𝑣, 0) (Eq. 3.25)
𝑅 = √𝐼𝑢+𝐼𝑣
𝐴+ 𝑢𝑆
2 (Eq. 3.26)
Figure 3.6: Schematized illustration of the circle according to Vlassov
Obviously if the load is applied inside the circle defined above, then it should be a compression one
to cause instability. For the specific case where the load is applied at the boundary of the circle,
independently if it is a compression or a tensile one, the critical load become significantly high (≈∞).
Therefore, a pure torsional mode can be obtained when the load is applied at the shear centre C as it
has been shown in §3.1, but depending on the cross-section geometry, this load could be either a
compression or a tensile one. The flexural-torsional buckling mode where the torsion is predominated
(usually Ncr,3) is accordingly affected. In the latter mode, the critical load should be calculated for a
compression load Pc that is applied inside the above-mentioned circle or a tension one PT that is
outside of the circle. If the load is applied at the boundary, then the critical load become significantly
high.
3.4 Influence of the boundary conditions
Equation given in §3.1 have been developed and therefore can be applied only for pin-ended
columns. Inevitably, some end restraints are usually present when an angle member is connected to
other members in a structure. As the connection is often achieved on one leg only, the modelling of
the end-restraint effect become complicated. A few analytical solutions are available as those
proposed by Trahair et al. [24]. An acceptable design solution is to use effective-length factors Ki,
(see Figure 3.7) so that eq. (3.20) or (3.21) may be applied by using the following parameters:
𝑁𝑐𝑟,𝑢 =𝜋2𝐸𝐼𝑣
(𝐾𝑢𝐿)2 (Eq. 3.27)
𝑁𝑐𝑟,𝑣 =𝜋2𝐸𝐼𝑢
(𝐾𝑣𝐿)2 (Eq. 3.28)
𝑁𝑐𝑟,𝑇 =1
𝐴𝑟𝑝( 𝐺𝐶𝑇 +
𝜋2𝐸𝐶𝑤
(𝐾𝑇𝐿)2) ≈
1
𝐴𝑟𝑝𝐺𝐶𝑇 (Eq. 3.29)
In fact, an effective length defines the portion of the deflected shape between points of zero curvature.
In other words, KiL is the length of an equivalent pin-ended column buckling which would exhibit
the same elastic buckling load than the end-restrained column.

Design of lattice towers made of large hot-rolled high strength steel angles
_______________________________________________________________________________
14 Marios-Zois BEZAS
The Ki factors reported in Figure 3.7 could be used to evaluate Ku and Kv factors so as to estimate the
flexural critical loads, but not to evaluate the KT one. Nevertheless, as explained before, the warping
constant Cw of angle sections can be assumed as zero and then, the torsional critical load can be
estimated only by the first term of the eq. (3.29), without determining the KT factor.
Figure 3.7:Effective-length factors Ku, Kv for axially loaded columns with various end condition [21]
When there is a need to take into account the positive effect of the restraints in the design, then the
formulas proposed in EN 1993-3-1 [2] where an angle is connected through different numbers of
bolts at its extremities, may be applied. In those formulas, a modified slenderness is proposed per
axis (u-u, v-v, z-z) depending on the boundary conditions (i.e. single/ doubled bolted at both ends
member, etc). In the present thesis, this aspect is not addressed and only pin-ended angles are so
considered.
3.5 Influence of the loading type
In contrast with other common profiles, the critical load of an angle section is affected from the
position of the axial load. The analytical solution for a centrally or eccentrically axial loaded member
is given in §3.1. If the member is loaded with an eccentric axial force (eN) and a bending moment,
this can be translated to an axial force with a fictitious eccentricity (efic=eN+M/N), and therefore same
equations may be used; at least as long as M and N vary proportionally.
But angles that are used in pylons, towers and masts are also subjected to lateral loads (wind forces)
additionally to their axial force. A few numerical simulations on single angle axially loaded members
subjected to lateral loads have been performed, and it is clear that the critical load of the column is
affected, especially when the lateral load increases. However, it can be seen (see §9.2.2) that the
wind force acting on a bar is rather small compared with the axial one. Therefore, it will be assumed
in the thesis that lateral loads remain quite modest and that M and N forces in the angle members
vary proportionally.
3.6 Second order elastic buckling analyses
Besides the first order linear elastic theory that is presented in §3.1, the critical load of a member can
be also evaluated by a second order elastic analysis using a non-linear software, as reported through
an example in section §3.7. In this case, if the column is perfectly straight and the load is applied at
the centre of gravity, the straight position becomes unstable when the load exceeds the critical value
Design of lattice towers made of large hot-rolled high strength steel angles
_______________________________________________________________________________
15 Marios-Zois BEZAS
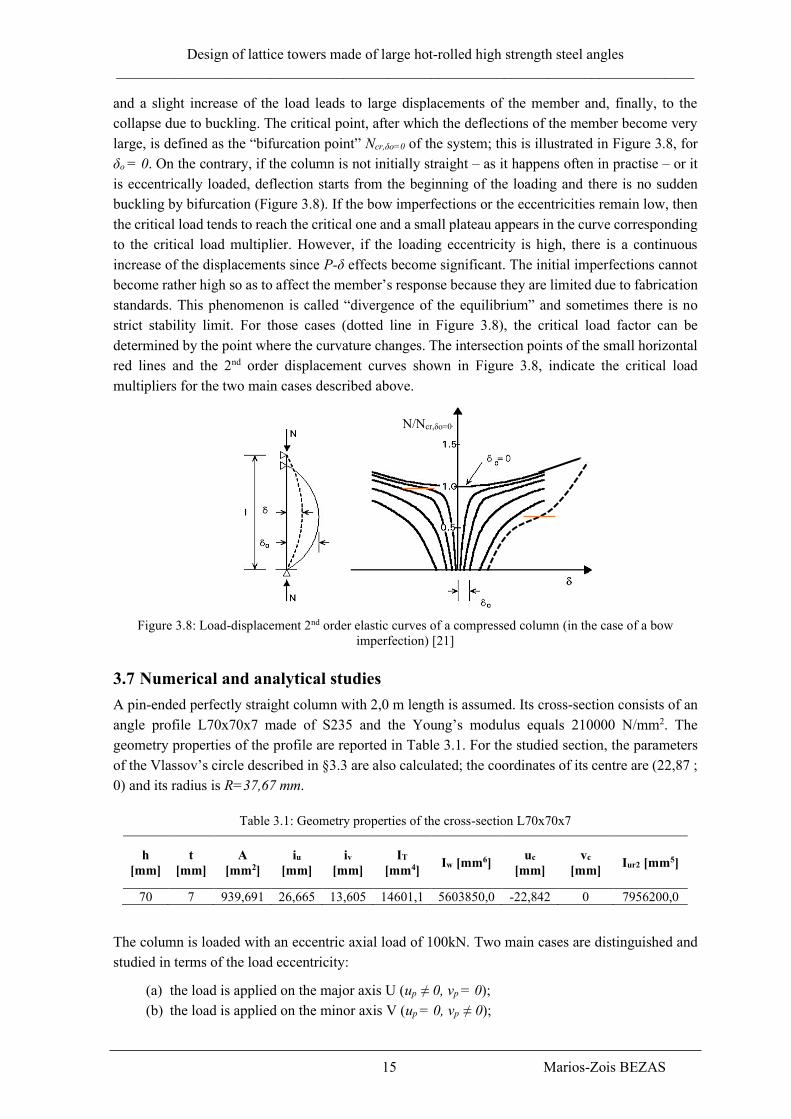
and a slight increase of the load leads to large displacements of the member and, finally, to the
collapse due to buckling. The critical point, after which the deflections of the member become very
large, is defined as the “bifurcation point” Ncr,δο=0 of the system; this is illustrated in Figure 3.8, for
δο = 0. On the contrary, if the column is not initially straight – as it happens often in practise – or it
is eccentrically loaded, deflection starts from the beginning of the loading and there is no sudden
buckling by bifurcation (Figure 3.8). If the bow imperfections or the eccentricities remain low, then
the critical load tends to reach the critical one and a small plateau appears in the curve corresponding
to the critical load multiplier. However, if the loading eccentricity is high, there is a continuous
increase of the displacements since P-δ effects become significant. The initial imperfections cannot
become rather high so as to affect the member’s response because they are limited due to fabrication
standards. This phenomenon is called “divergence of the equilibrium” and sometimes there is no
strict stability limit. For those cases (dotted line in Figure 3.8), the critical load factor can be
determined by the point where the curvature changes. The intersection points of the small horizontal
red lines and the 2nd order displacement curves shown in Figure 3.8, indicate the critical load
multipliers for the two main cases described above.
Figure 3.8: Load-displacement 2nd order elastic curves of a compressed column (in the case of a bow
imperfection) [21]
3.7 Numerical and analytical studies
A pin-ended perfectly straight column with 2,0 m length is assumed. Its cross-section consists of an
angle profile L70x70x7 made of S235 and the Young’s modulus equals 210000 N/mm2. The
geometry properties of the profile are reported in Table 3.1. For the studied section, the parameters
of the Vlassov’s circle described in §3.3 are also calculated; the coordinates of its centre are (22,87 ;
0) and its radius is R=37,67 mm.
Table 3.1: Geometry properties of the cross-section L70x70x7
h
[mm]
t
[mm]
A
[mm2]
iu
[mm]
iv
[mm]
IT
[mm4] Iw [mm6]
uc
[mm]
vc
[mm] Iur2 [mm5]
70 7 939,691 26,665 13,605 14601,1 5603850,0 -22,842 0 7956200,0
The column is loaded with an eccentric axial load of 100kN. Two main cases are distinguished and
studied in terms of the load eccentricity:
(a) the load is applied on the major axis U (up ≠ 0, vp = 0);
(b) the load is applied on the minor axis V (up = 0, vp ≠ 0);
N/Ncr,δο=0

Design of lattice towers made of large hot-rolled high strength steel angles
_______________________________________________________________________________
16 Marios-Zois BEZAS
Table 3.2: Analytical and numerical load factors for eccentrically loads on U axis
uP [m] αcr,1 [-] αcr,2 [-] αcr,3 [-] αcr,anal [-] αcr,FINELG [-] αNL-el [-]
-0,2 0,901 1,52 -0,556 -0,556 -0,5561 ---
-0,15 0,901 1,85 -0,773 -0,773 -0,7738 ---
-0,1 0,901 2,36 -1,26 0,901 0,9015 0,7621
-0,07 0,901 2,79 -2,03 0,901 0,9015 0,7722
-0,05 0,901 3,13 -3,35 0,901 0,9015 0,7992
-0,04 0,901 3,30 -4,89 0,901 0,9015 0,8051
-0,03 0,901 3,42 -8,66 0,901 0,9015 0,8452
-0,02284 0,901 3,46 -17,59 0,901 0,9015 0,8654
-0,01 0,901 3,29 36,68 0,901 0,9015 0,8892
-0,005 0,901 3,11 20,42 0,901 0,9015 0,8970
-0,001 0,901 2,94 16,38 0,901 0,9015 0,9010
0 0,901 2,89 15,74 0,901 0,9015 0,9014
0,001 0,901 2,85 15,24 0,901 0,9015 0,9010
0,005 0,901 2,66 13,96 0,901 0,9015 0,8970
0,01 0,901 2,43 13,42 0,901 0,9015 0,8892
0,015 0,901 2,21 13,59 0,901 0,9015 0,8821
0,02 0,901 2,02 14,30 0,901 0,9015 0,8782
0,025 0,901 1,86 15,54 0,901 0,9015 0,8621
0,03 0,901 1,71 17,43 0,901 0,9015 0,8452
0,04 0,901 1,47 24,60 0,901 0,9015 0,8052
0,05 0,901 1,29 46,31 0,901 0,9015 0,7992
0,07 0,901 1,03 -49,48 0,901 0,9015 0,7831
0,08 0,901 0,933 -23,72 0,901 0,9015 0,7722
0,1 0,901 0,787 -11,46 0,787 0,7869 0,7621
0,15 0,901 0,563 -4,92 0,563 0,5637 0,6411
0,2 0,901 0,439 -3,11 0,439 0,4386 0,5372
For each considered eccentricity, three load factors are calculated analytically (acr,1, acr,2, acr,3) by
using eq. (3.19), and the smallest one among them, indicates the critical one (acr,anal). Then, and in
order to evaluate numerically the critical load multiplier (acr,FINELG), an elastic instability analysis is
performed with FINELG [25] finite element software. The column is meshed in 16 beam elements
along its length and the boundary conditions are those described in Figure 3.1. Finally, a second order
linear elastic analysis without initial imperfections, but with the relevant eccentricity, is performed
with FINELG, and the acr,NL-el is evaluated according to §3.6. Only for the specific case where the
column is loaded at the centre of gravity, a rather small imperfection has been implemented so as to
the convergence of the FINELG calculations. The analytical and numerical load multipliers for
different load eccentricities are illustrated graphically in Figure 3.9 and Figure 3.10 while their values
are reported in Table 3.2 and Table 3.3 for eccentrically loads on U and V axis respectively.
Design of lattice towers made of large hot-rolled high strength steel angles
_______________________________________________________________________________
17 Marios-Zois BEZAS
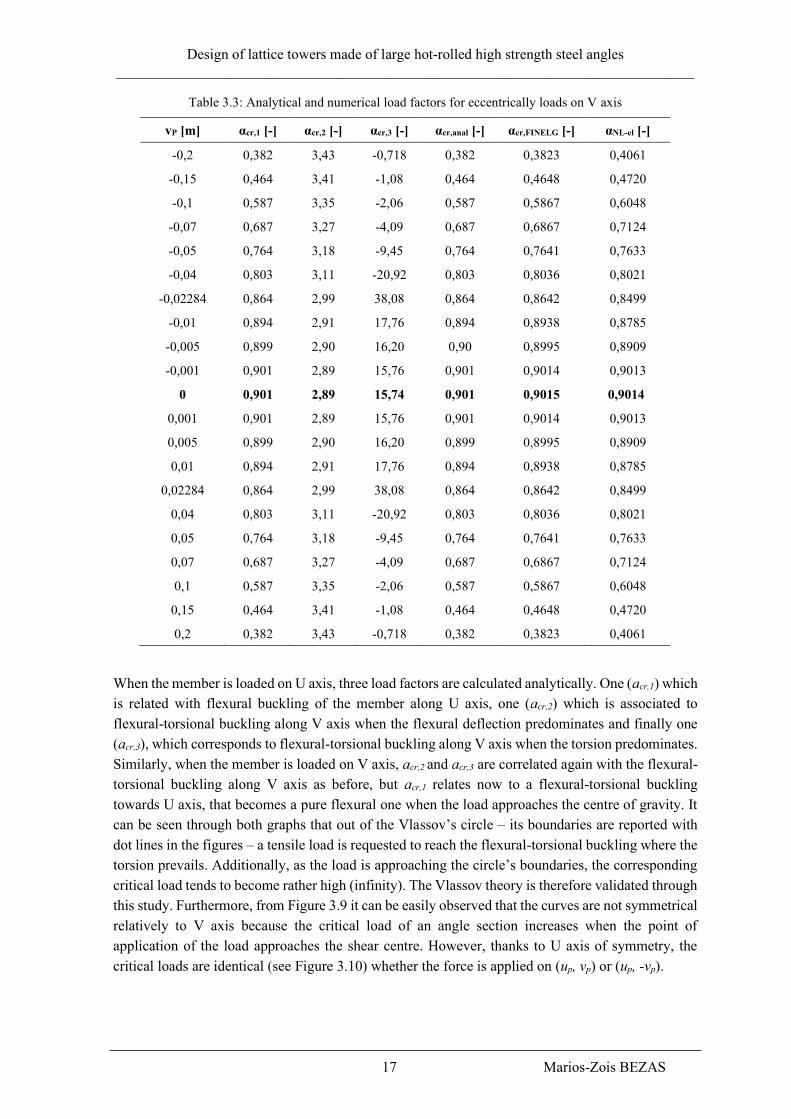
Table 3.3: Analytical and numerical load factors for eccentrically loads on V axis
vP [m] αcr,1 [-] αcr,2 [-] αcr,3 [-] αcr,anal [-] αcr,FINELG [-] αNL-el [-]
-0,2 0,382 3,43 -0,718 0,382 0,3823 0,4061
-0,15 0,464 3,41 -1,08 0,464 0,4648 0,4720
-0,1 0,587 3,35 -2,06 0,587 0,5867 0,6048
-0,07 0,687 3,27 -4,09 0,687 0,6867 0,7124
-0,05 0,764 3,18 -9,45 0,764 0,7641 0,7633
-0,04 0,803 3,11 -20,92 0,803 0,8036 0,8021
-0,02284 0,864 2,99 38,08 0,864 0,8642 0,8499
-0,01 0,894 2,91 17,76 0,894 0,8938 0,8785
-0,005 0,899 2,90 16,20 0,90 0,8995 0,8909
-0,001 0,901 2,89 15,76 0,901 0,9014 0,9013
0 0,901 2,89 15,74 0,901 0,9015 0,9014
0,001 0,901 2,89 15,76 0,901 0,9014 0,9013
0,005 0,899 2,90 16,20 0,899 0,8995 0,8909
0,01 0,894 2,91 17,76 0,894 0,8938 0,8785
0,02284 0,864 2,99 38,08 0,864 0,8642 0,8499
0,04 0,803 3,11 -20,92 0,803 0,8036 0,8021
0,05 0,764 3,18 -9,45 0,764 0,7641 0,7633
0,07 0,687 3,27 -4,09 0,687 0,6867 0,7124
0,1 0,587 3,35 -2,06 0,587 0,5867 0,6048
0,15 0,464 3,41 -1,08 0,464 0,4648 0,4720
0,2 0,382 3,43 -0,718 0,382 0,3823 0,4061
When the member is loaded on U axis, three load factors are calculated analytically. One (acr,1) which
is related with flexural buckling of the member along U axis, one (acr,2) which is associated to
flexural-torsional buckling along V axis when the flexural deflection predominates and finally one
(acr,3), which corresponds to flexural-torsional buckling along V axis when the torsion predominates.
Similarly, when the member is loaded on V axis, acr,2 and acr,3 are correlated again with the flexural-
torsional buckling along V axis as before, but acr,1 relates now to a flexural-torsional buckling
towards U axis, that becomes a pure flexural one when the load approaches the centre of gravity. It
can be seen through both graphs that out of the Vlassov’s circle – its boundaries are reported with
dot lines in the figures – a tensile load is requested to reach the flexural-torsional buckling where the
torsion prevails. Additionally, as the load is approaching the circle’s boundaries, the corresponding
critical load tends to become rather high (infinity). The Vlassov theory is therefore validated through
this study. Furthermore, from Figure 3.9 it can be easily observed that the curves are not symmetrical
relatively to V axis because the critical load of an angle section increases when the point of
application of the load approaches the shear centre. However, thanks to U axis of symmetry, the
critical loads are identical (see Figure 3.10) whether the force is applied on (up, vp) or (up, -vp).

Design of lattice towers made of large hot-rolled high strength steel angles
_______________________________________________________________________________
18 Marios-Zois BEZAS
Figure 3.9: Analytical and numerical instability load factors for eccentrically loads on U axis
Figure 3.10: Analytical and numerical instability load factors for eccentrically loads on V axis
The results obtained analytically and numerically, through the elastic instability critical analysis, are
in very close agreement, as seen from both graphs and tables. From the comparison between the
analytical results and those estimated through the 2nd order elastic analysis (Table 3.2 and Table 3.3),
one sees a very good agreement for small load eccentricities, but slight differences when the load
eccentricity increases. This difference is explained by the “divergence of the equilibrium”
phenomenon, as there is not always strict stability limit, and it seems to be more relevant for an
eccentric load on U axis than V.
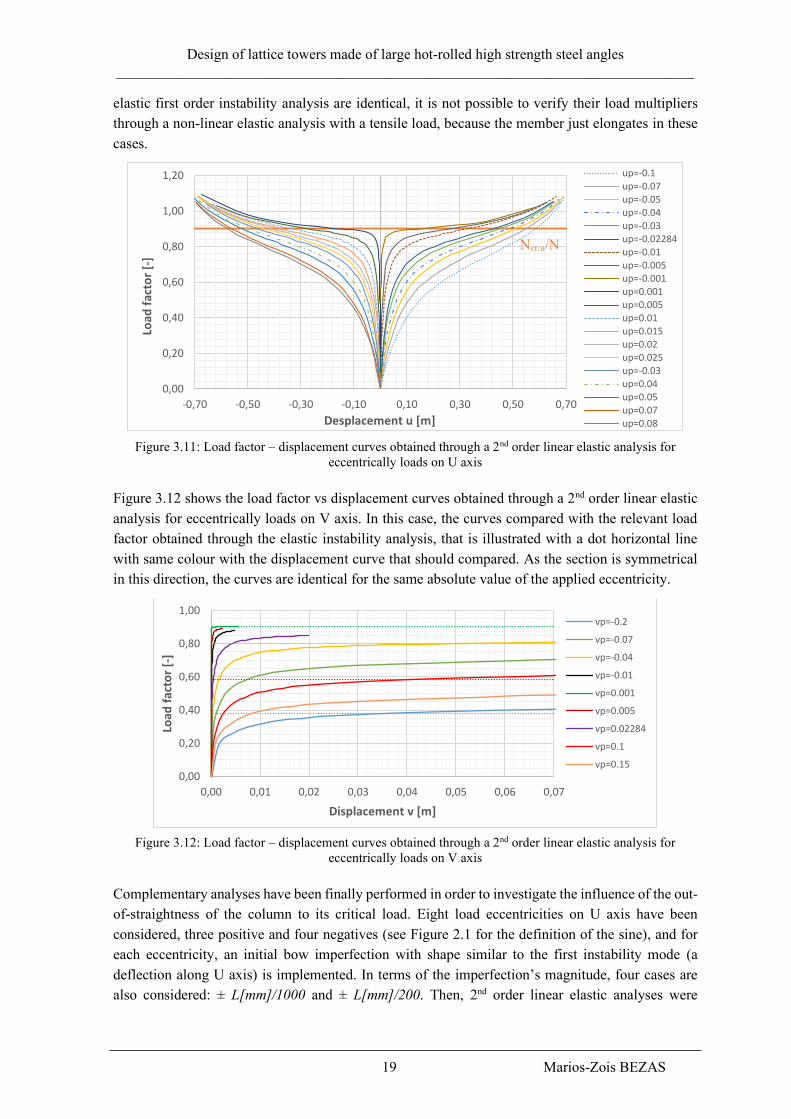
Figure 3.11 shows the load factor vs displacement curves obtained through a 2nd order linear elastic
analysis for eccentrically loads on U axis. All the curves compared with the load factor obtained for
the centrally loaded column through the elastic instability analysis (Ncr,u /N = 0,9015) that is
illustrated with the orange horizontal line. The curves that correspond to the eccentricities up equal
to 0,1, 0,15 and 0,2 are not shown in this graph due to the fact that their relevant buckling mode is a
flexural-torsional one along V axis. The values of all the load factors acr,NL-el are reported in Table
3.2. For the cases where instability occurs due to a tensile load (i.e for up = -0,15 or -0,2) according
to Vlassov’s theory (§3.3), even if the analytical solutions and the corresponding results from an
-20
-10
0
10
20
30
40
-0,20 -0,15 -0,10 -0,05 0,00 0,05 0,10 0,15 0,20
Load
fac
tor
[-]
eu=uP [m]
acr,1
acr,2
acr,3
acr,FINELG
+R
-R
us
-21
-17
-13
-9
-5
-1
3
7
11
15
19
23
27
31
35
39
-0,20 -0,15 -0,10 -0,05 0,00 0,05 0,10 0,15 0,20Load
fac
tor
[-]
ev=vP [m]
acr,1
acr,2
acr,3
acr,FINELG
-R
+R
Design of lattice towers made of large hot-rolled high strength steel angles
_______________________________________________________________________________
19 Marios-Zois BEZAS
elastic first order instability analysis are identical, it is not possible to verify their load multipliers
through a non-linear elastic analysis with a tensile load, because the member just elongates in these
cases.
Figure 3.11: Load factor – displacement curves obtained through a 2nd order linear elastic analysis for
eccentrically loads on U axis
Figure 3.12 shows the load factor vs displacement curves obtained through a 2nd order linear elastic
analysis for eccentrically loads on V axis. In this case, the curves compared with the relevant load
factor obtained through the elastic instability analysis, that is illustrated with a dot horizontal line
with same colour with the displacement curve that should compared. As the section is symmetrical
in this direction, the curves are identical for the same absolute value of the applied eccentricity.
Figure 3.12: Load factor – displacement curves obtained through a 2nd order linear elastic analysis for
eccentrically loads on V axis
Complementary analyses have been finally performed in order to investigate the influence of the out-
of-straightness of the column to its critical load. Eight load eccentricities on U axis have been
considered, three positive and four negatives (see Figure 2.1 for the definition of the sine), and for
each eccentricity, an initial bow imperfection with shape similar to the first instability mode (a
deflection along U axis) is implemented. In terms of the imperfection’s magnitude, four cases are
also considered: ± L[mm]/1000 and ± L[mm]/200. Then, 2nd order linear elastic analyses were
0,00
0,20
0,40
0,60
0,80
1,00
1,20
-0,70 -0,50 -0,30 -0,10 0,10 0,30 0,50 0,70
Load
fac
tor
[-]
Desplacement u [m]
up=-0.1up=-0.07up=-0.05up=-0.04up=-0.03up=-0.02284up=-0.01up=-0.005up=-0.001up=0.001up=0.005up=0.01up=0.015up=0.02up=0.025up=-0.03up=0.04up=0.05up=0.07up=0.08
0,00
0,20
0,40
0,60
0,80
1,00
0,00 0,01 0,02 0,03 0,04 0,05 0,06 0,07
Load
fac
tor
[-]
Displacement v [m]
vp=-0.2
vp=-0.07
vp=-0.04
vp=-0.01
vp=0.001
vp=0.005
vp=0.02284
vp=0.1
vp=0.15
Ncr,u/N

Design of lattice towers made of large hot-rolled high strength steel angles
_______________________________________________________________________________
20 Marios-Zois BEZAS
performed and the load factor – displacement curves are shown in Figure 3.13 and Figure 3.14 for
negative and positive eccentricities on U respectively.
Figure 3.13: Load factor – displacement curves obtained through a 2nd order linear elastic analysis (with
negative eccentricity on U axis and initial imperfections)
Figure 3.14: Load factor – displacement curves obtained through a 2nd order linear elastic analysis (with
positive eccentricity on U axis and initial imperfections)
It can be seen that for the same loading eccentricity, the initial imperfections do not affect the critical
load of the column so much, but they have an impact at its stiffness, that tends to be negligible as the
load eccentricity increases. Roughly, if uP < 5eu,o then the influence of the initial out-of-straightness
becomes relevant for the response of the member until it reaches its critical load. On the contrary,
the critical load of the column is affected much more by the loading eccentricity and becomes smaller
as far as the eccentricity increases.
3.8 Conclusions
Angle profiles, and more specifically the equal leg ones investigated in the present thesis, exhibit
some properties that distinguish them from the well-known profiles. It is known that, for a double-
0,00
0,10
0,20
0,30
0,40
0,50
0,60
0,70
0,80
0,90
1,00
1,10
0,00 0,10 0,20 0,30 0,40 0,50 0,60 0,70
Load
fac
tor
[-]
Displacement u [m]
up=-0.1/eu,o=0
up=-0.1/eu,o=0.002
up=-0.1/eu,o=-0.002
up=-0.1/eu,o=0.10
up=-0.1/eu,o=-0.01
up=-0.05/eu,o=0
up=-0.05/eu,o=0.002
up=-0.05/eu,o=-0.002
up=-0.05/eu,o=0.01
up=-0.05/eu,o=-0.01
up=-0.02284/eu,o=0
up=-0.02284/eu,o=0.002
up=-0.02284/eu,o=-0.002
up=-0.02284/eu,o=0.01
up=-0.02284/eu,o=-0.01
up=-0.005/eu,o=0
up=-0.005/eu,o=0.002
up=-0.005/eu,o=-0.002
up=-0.005/eu,o=0.01
up=-0.005/eu,o=-0.01
Ncr,u/N
0,00
0,10
0,20
0,30
0,40
0,50
0,60
0,70
0,80
0,90
1,00
1,10
-0,70 -0,60 -0,50 -0,40 -0,30 -0,20 -0,10 0,00
Load
fac
tor
[-]
Displacement u [m]
up=0.005/eu,o=0
up=0.005/eu,o=0.002
up=0.005/eu,o=-0.002
up=0.005/eu,o=0.010
up=0.005/eu,o=-0.010
up=0.02/eu,o=0
up=0.02/eu,o=0.002
up=0.02/eu,o=-0.002
up=0.02/eu,o=0.010
up=0.02/eu,o=-0.010
up=0.05/eu,o=0
up=0.05/eu,o=0.002
up=0.05/eu,o=-0.002
up=0.05/eu,o=0.010
up=0.05/eu,o=-0.010
Ncr,u/N
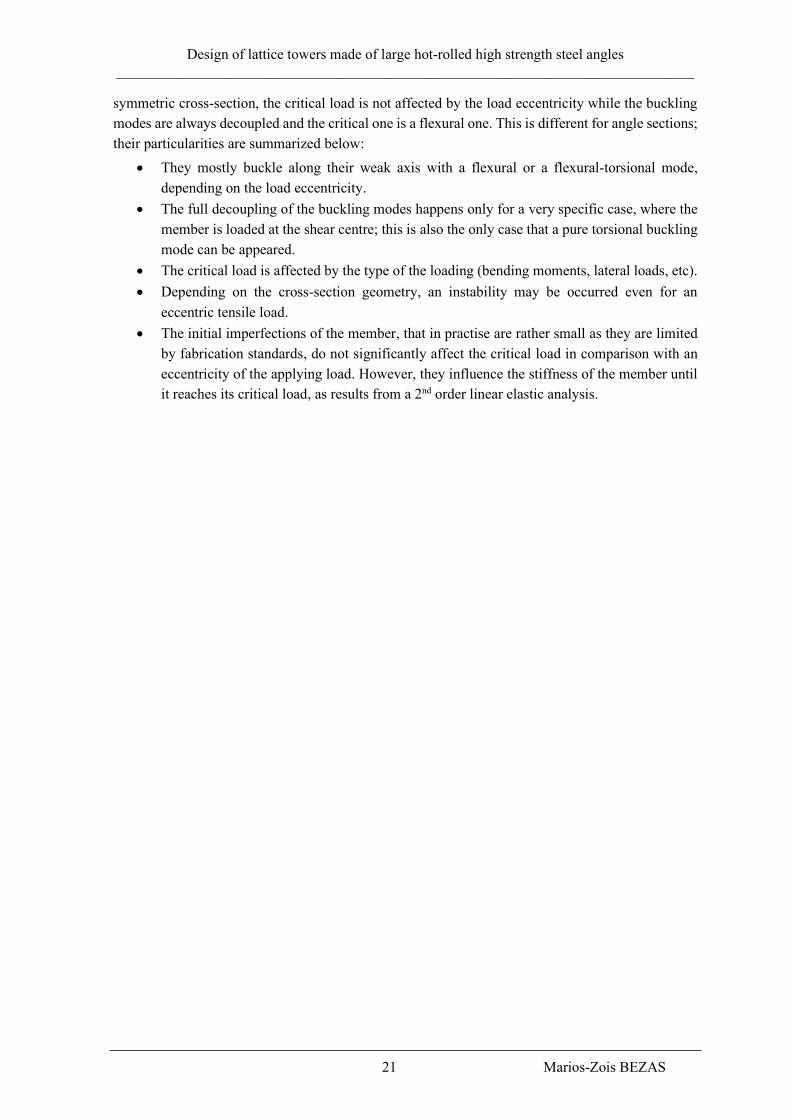
Design of lattice towers made of large hot-rolled high strength steel angles
_______________________________________________________________________________
21 Marios-Zois BEZAS
symmetric cross-section, the critical load is not affected by the load eccentricity while the buckling
modes are always decoupled and the critical one is a flexural one. This is different for angle sections;
their particularities are summarized below:
• They mostly buckle along their weak axis with a flexural or a flexural-torsional mode,
depending on the load eccentricity.
• The full decoupling of the buckling modes happens only for a very specific case, where the
member is loaded at the shear centre; this is also the only case that a pure torsional buckling
mode can be appeared.
• The critical load is affected by the type of the loading (bending moments, lateral loads, etc).
• Depending on the cross-section geometry, an instability may be occurred even for an
eccentric tensile load.
• The initial imperfections of the member, that in practise are rather small as they are limited
by fabrication standards, do not significantly affect the critical load in comparison with an
eccentricity of the applying load. However, they influence the stiffness of the member until
it reaches its critical load, as results from a 2nd order linear elastic analysis.
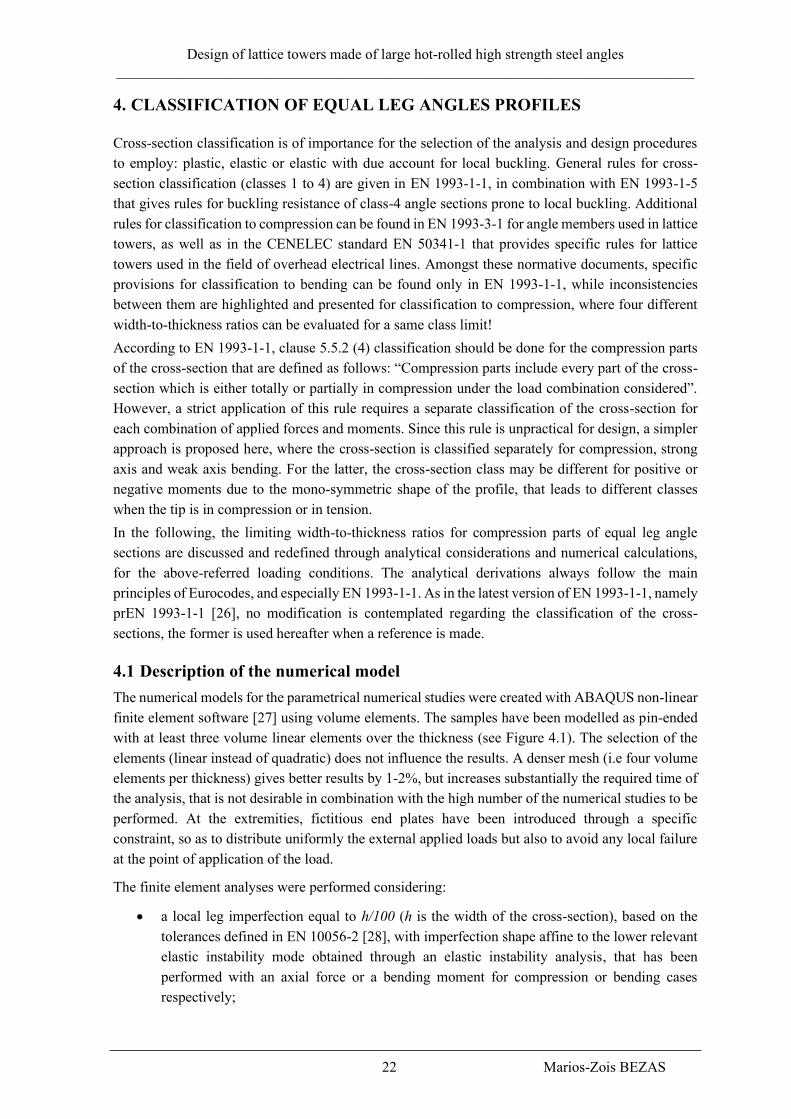
Design of lattice towers made of large hot-rolled high strength steel angles
_______________________________________________________________________________
22 Marios-Zois BEZAS
4. CLASSIFICATION OF EQUAL LEG ANGLES PROFILES
Cross-section classification is of importance for the selection of the analysis and design procedures
to employ: plastic, elastic or elastic with due account for local buckling. General rules for cross-
section classification (classes 1 to 4) are given in EN 1993-1-1, in combination with EN 1993-1-5
that gives rules for buckling resistance of class-4 angle sections prone to local buckling. Additional
rules for classification to compression can be found in EN 1993-3-1 for angle members used in lattice
towers, as well as in the CENELEC standard EN 50341-1 that provides specific rules for lattice
towers used in the field of overhead electrical lines. Amongst these normative documents, specific
provisions for classification to bending can be found only in EN 1993-1-1, while inconsistencies
between them are highlighted and presented for classification to compression, where four different
width-to-thickness ratios can be evaluated for a same class limit!
According to EN 1993-1-1, clause 5.5.2 (4) classification should be done for the compression parts
of the cross-section that are defined as follows: “Compression parts include every part of the cross-
section which is either totally or partially in compression under the load combination considered”.
However, a strict application of this rule requires a separate classification of the cross-section for
each combination of applied forces and moments. Since this rule is unpractical for design, a simpler
approach is proposed here, where the cross-section is classified separately for compression, strong
axis and weak axis bending. For the latter, the cross-section class may be different for positive or
negative moments due to the mono-symmetric shape of the profile, that leads to different classes
when the tip is in compression or in tension.
In the following, the limiting width-to-thickness ratios for compression parts of equal leg angle
sections are discussed and redefined through analytical considerations and numerical calculations,
for the above-referred loading conditions. The analytical derivations always follow the main
principles of Eurocodes, and especially EN 1993-1-1. As in the latest version of EN 1993-1-1, namely
prEN 1993-1-1 [26], no modification is contemplated regarding the classification of the cross-
sections, the former is used hereafter when a reference is made.
4.1 Description of the numerical model
The numerical models for the parametrical numerical studies were created with ABAQUS non-linear
finite element software [27] using volume elements. The samples have been modelled as pin-ended
with at least three volume linear elements over the thickness (see Figure 4.1). The selection of the
elements (linear instead of quadratic) does not influence the results. A denser mesh (i.e four volume
elements per thickness) gives better results by 1-2%, but increases substantially the required time of
the analysis, that is not desirable in combination with the high number of the numerical studies to be
performed. At the extremities, fictitious end plates have been introduced through a specific
constraint, so as to distribute uniformly the external applied loads but also to avoid any local failure
at the point of application of the load.
The finite element analyses were performed considering:
• a local leg imperfection equal to h/100 (h is the width of the cross-section), based on the
tolerances defined in EN 10056-2 [28], with imperfection shape affine to the lower relevant
elastic instability mode obtained through an elastic instability analysis, that has been
performed with an axial force or a bending moment for compression or bending cases
respectively;
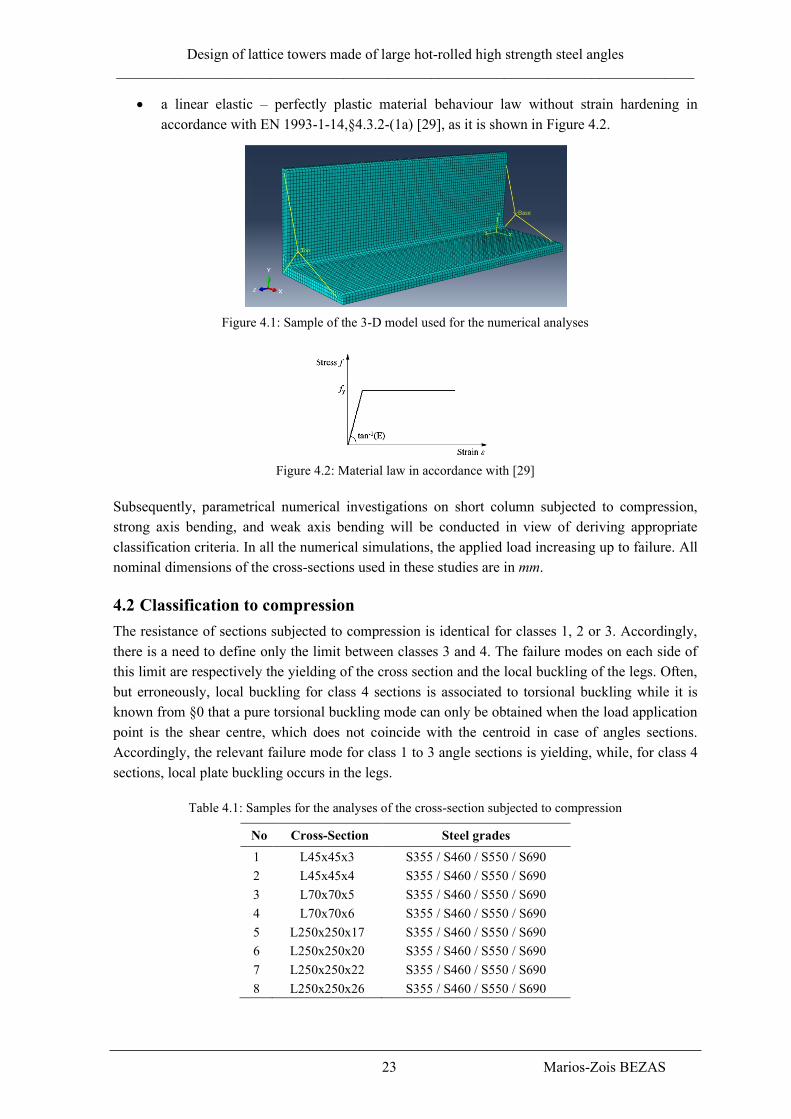
Design of lattice towers made of large hot-rolled high strength steel angles
_______________________________________________________________________________
23 Marios-Zois BEZAS
• a linear elastic – perfectly plastic material behaviour law without strain hardening in
accordance with EN 1993-1-14,§4.3.2-(1a) [29], as it is shown in Figure 4.2.
Figure 4.1: Sample of the 3-D model used for the numerical analyses
Figure 4.2: Material law in accordance with [29]
Subsequently, parametrical numerical investigations on short column subjected to compression,
strong axis bending, and weak axis bending will be conducted in view of deriving appropriate
classification criteria. In all the numerical simulations, the applied load increasing up to failure. All
nominal dimensions of the cross-sections used in these studies are in mm.
4.2 Classification to compression
The resistance of sections subjected to compression is identical for classes 1, 2 or 3. Accordingly,
there is a need to define only the limit between classes 3 and 4. The failure modes on each side of
this limit are respectively the yielding of the cross section and the local buckling of the legs. Often,
but erroneously, local buckling for class 4 sections is associated to torsional buckling while it is
known from §0 that a pure torsional buckling mode can only be obtained when the load application
point is the shear centre, which does not coincide with the centroid in case of angles sections.
Accordingly, the relevant failure mode for class 1 to 3 angle sections is yielding, while, for class 4
sections, local plate buckling occurs in the legs.
Table 4.1: Samples for the analyses of the cross-section subjected to compression
No Cross-Section Steel grades
1 L45x45x3 S355 / S460 / S550 / S690
2 L45x45x4 S355 / S460 / S550 / S690
3 L70x70x5 S355 / S460 / S550 / S690
4 L70x70x6 S355 / S460 / S550 / S690
5 L250x250x17 S355 / S460 / S550 / S690
6 L250x250x20 S355 / S460 / S550 / S690
7 L250x250x22 S355 / S460 / S550 / S690
8 L250x250x26 S355 / S460 / S550 / S690

Design of lattice towers made of large hot-rolled high strength steel angles
_______________________________________________________________________________
24 Marios-Zois BEZAS
Table 4.1 presents the cross-sections and the steel grades that have been used for the analyses in
which the samples are subjected to compression. These samples have been selected in order to cover
a wide range of cross-section leg slenderness. In particular, even if steel grade S690 is not available
on the market, it has been selected so as to reach higher slenderness ratios.
In order to prevent flexural buckling, the length of the samples was selected in such a way that �̅� ≤
0,2 , a slenderness below which the European buckling curves assume that no reduction associated
to buckling is required. This limitation leads to a value of the length of the samples equal to 18,5·𝜀·iv:
�̅� ≤ 0,2 ⇒ 𝐿𝑐𝑟
𝑖𝑣·1
𝜆1≤ 0,2 ⇒ 𝐿𝑐𝑟 ≤ 18,75 · 𝜀 · 𝑖𝑣 ⇒ 𝑳𝒄𝒓 = 𝟏𝟖, 𝟓 · 𝜺 · 𝒊𝒗 (Eq. 4.1)
Figure 4.3 and Figure 4.4 show the ratio between the numerically obtained cross-section (CS)
resistance (Nult) and the plastic characteristic resistance (Npl =A·fy), versus the h/𝜀t and c/𝜀t ratio
respectively. It can be easily observed that the scatter is bigger when the results are correlated with
the h/𝜀t ratio than the c/𝜀t one, that makes the latter ratio more suitable for classification purposes.
Figure 4.3: Compression. Ratio between numerical results and plastic resistance vs. h/𝜀t ratio
Figure 4.4: Compression. Ratio between numerical results and plastic resistance vs. c/𝜀t ratio
The samples that reach their plastic characteristic resistance even with a 3% deviation, that is
assumed as acceptable due to the selected mesh density, can be categorized as class 1 to 3. Therefore,
based on the numerical results, the class-3 limit for equal leg angles subjected to compression may
be set as c/t ≤ 13,9𝜀.
In EN 1993-1-1, table 5.2 (sheet 3), two conditions are provided to distinguish Class 3 from Class 4
sections for equal leg angles:
h/t ≤ 11,5𝜀 and h/t ≤ 15𝜀 so h/t ≤ 11,5𝜀 (Eq. 4.2)
0,840,860,880,900,920,940,960,981,001,02
10,00 12,00 14,00 16,00 18,00 20,00 22,00 24,00 26,00 28,00
Nu
lt/N
pl[-
]
h/εt [-]
L45x45xt
L70x70xt
L250x250xt
Class 1-2-3
h/εt=17
Class 4
0,84
0,86
0,88
0,90
0,92
0,94
0,96
0,98
1,00
1,02
8,00 10,00 12,00 14,00 16,00 18,00 20,00 22,00
Nu
lt/N
pl[-
]
c/εt [-]
L45x45xt
L70x70xt
L250x250xt
c/εt=13,9
Class 4 Class 1-2-3
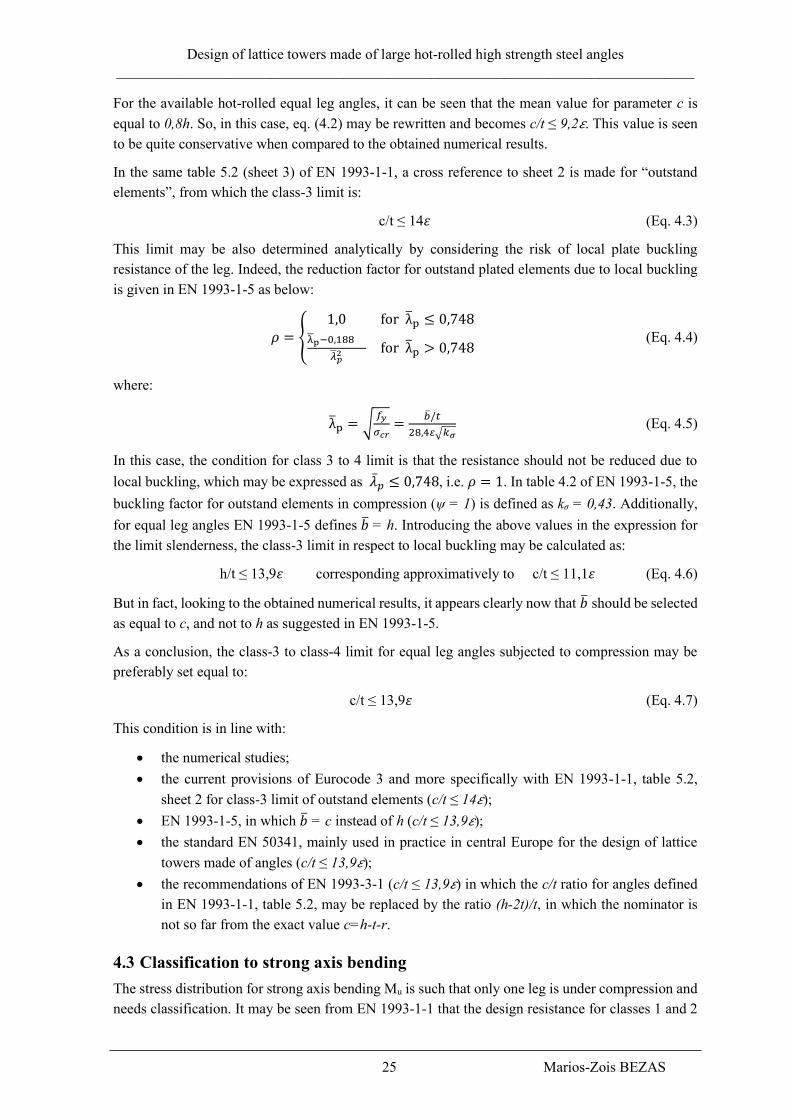
Design of lattice towers made of large hot-rolled high strength steel angles
_______________________________________________________________________________
25 Marios-Zois BEZAS
For the available hot-rolled equal leg angles, it can be seen that the mean value for parameter c is
equal to 0,8h. So, in this case, eq. (4.2) may be rewritten and becomes c/t ≤ 9,2𝜀. This value is seen
to be quite conservative when compared to the obtained numerical results.
In the same table 5.2 (sheet 3) of EN 1993-1-1, a cross reference to sheet 2 is made for “outstand
elements”, from which the class-3 limit is:
c/t ≤ 14𝜀 (Eq. 4.3)
This limit may be also determined analytically by considering the risk of local plate buckling
resistance of the leg. Indeed, the reduction factor for outstand plated elements due to local buckling
is given in EN 1993-1-5 as below:
𝜌 = {1,0 for λ̅p ≤ 0,748
λ̅p−0,188
�̅�𝑝2 for λ̅p > 0,748
(Eq. 4.4)
where:
λ̅p = √𝑓𝑦
𝜎𝑐𝑟=
�̅�/𝑡
28,4𝜀√𝑘𝜎 (Eq. 4.5)
In this case, the condition for class 3 to 4 limit is that the resistance should not be reduced due to
local buckling, which may be expressed as �̅�𝑝 ≤ 0,748, i.e. 𝜌 = 1. In table 4.2 of EN 1993-1-5, the
buckling factor for outstand elements in compression (ψ = 1) is defined as kσ = 0,43. Additionally,
for equal leg angles EN 1993-1-5 defines �̅� = h. Introducing the above values in the expression for
the limit slenderness, the class-3 limit in respect to local buckling may be calculated as:
h/t ≤ 13,9𝜀 corresponding approximatively to c/t ≤ 11,1𝜀 (Eq. 4.6)
But in fact, looking to the obtained numerical results, it appears clearly now that �̅� should be selected
as equal to c, and not to h as suggested in EN 1993-1-5.
As a conclusion, the class-3 to class-4 limit for equal leg angles subjected to compression may be
preferably set equal to:
c/t ≤ 13,9𝜀 (Eq. 4.7)
This condition is in line with:
• the numerical studies;
• the current provisions of Eurocode 3 and more specifically with EN 1993-1-1, table 5.2,
sheet 2 for class-3 limit of outstand elements (c/t ≤ 14𝜀);
• EN 1993-1-5, in which �̅� = c instead of h (c/t ≤ 13,9𝜀);
• the standard EN 50341, mainly used in practice in central Europe for the design of lattice
towers made of angles (c/t ≤ 13,9𝜀);
• the recommendations of EN 1993-3-1 (c/t ≤ 13,9𝜀) in which the c/t ratio for angles defined
in EN 1993-1-1, table 5.2, may be replaced by the ratio (h-2t)/t, in which the nominator is
not so far from the exact value c=h-t-r.
4.3 Classification to strong axis bending
The stress distribution for strong axis bending Mu is such that only one leg is under compression and
needs classification. It may be seen from EN 1993-1-1 that the design resistance for classes 1 and 2
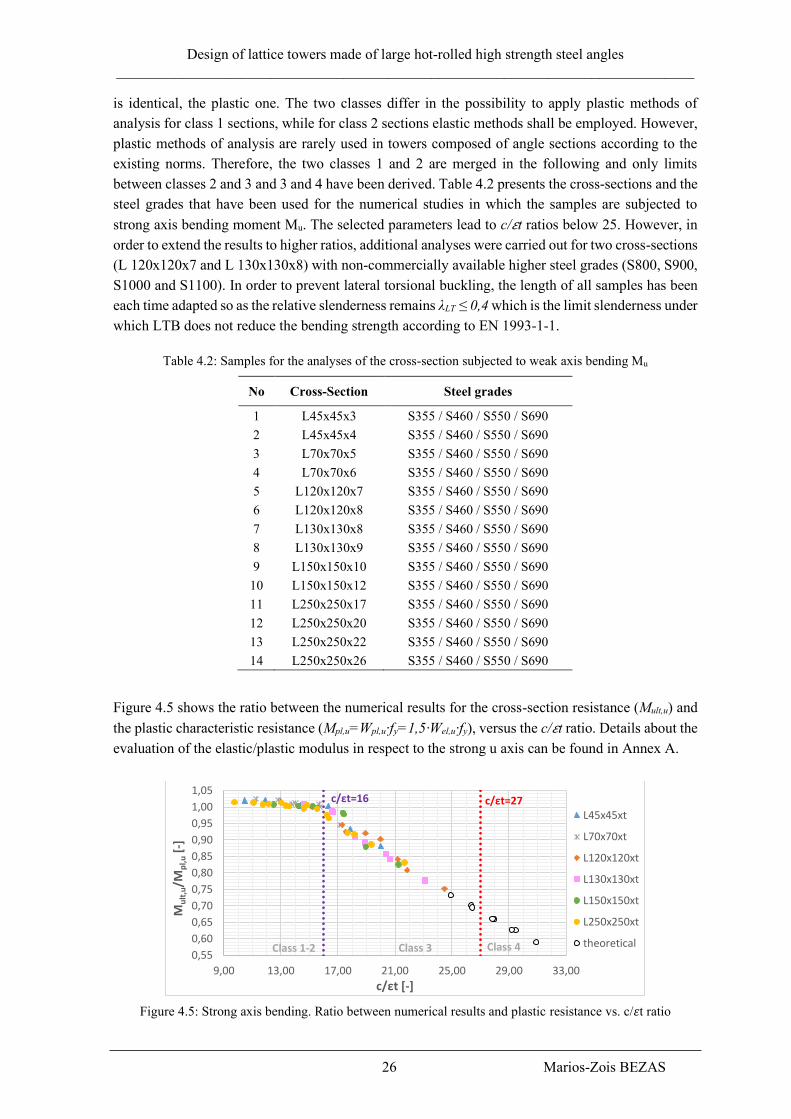
Design of lattice towers made of large hot-rolled high strength steel angles
_______________________________________________________________________________
26 Marios-Zois BEZAS
is identical, the plastic one. The two classes differ in the possibility to apply plastic methods of
analysis for class 1 sections, while for class 2 sections elastic methods shall be employed. However,
plastic methods of analysis are rarely used in towers composed of angle sections according to the
existing norms. Therefore, the two classes 1 and 2 are merged in the following and only limits
between classes 2 and 3 and 3 and 4 have been derived. Table 4.2 presents the cross-sections and the
steel grades that have been used for the numerical studies in which the samples are subjected to
strong axis bending moment Mu. The selected parameters lead to c/𝜀t ratios below 25. However, in
order to extend the results to higher ratios, additional analyses were carried out for two cross-sections
(L 120x120x7 and L 130x130x8) with non-commercially available higher steel grades (S800, S900,
S1000 and S1100). In order to prevent lateral torsional buckling, the length of all samples has been
each time adapted so as the relative slenderness remains λLT ≤ 0,4 which is the limit slenderness under
which LTB does not reduce the bending strength according to EN 1993-1-1.
Table 4.2: Samples for the analyses of the cross-section subjected to weak axis bending Mu
No Cross-Section Steel grades
1 L45x45x3 S355 / S460 / S550 / S690
2 L45x45x4 S355 / S460 / S550 / S690
3 L70x70x5 S355 / S460 / S550 / S690
4 L70x70x6 S355 / S460 / S550 / S690
5 L120x120x7 S355 / S460 / S550 / S690
6 L120x120x8 S355 / S460 / S550 / S690
7 L130x130x8 S355 / S460 / S550 / S690
8 L130x130x9 S355 / S460 / S550 / S690
9 L150x150x10 S355 / S460 / S550 / S690
10 L150x150x12 S355 / S460 / S550 / S690
11 L250x250x17 S355 / S460 / S550 / S690
12 L250x250x20 S355 / S460 / S550 / S690
13 L250x250x22 S355 / S460 / S550 / S690
14 L250x250x26 S355 / S460 / S550 / S690
Figure 4.5 shows the ratio between the numerical results for the cross-section resistance (Mult,u) and
the plastic characteristic resistance (Mpl,u=Wpl,u·fy=1,5·Wel,u·fy), versus the c/𝜀t ratio. Details about the
evaluation of the elastic/plastic modulus in respect to the strong u axis can be found in Annex A.
Figure 4.5: Strong axis bending. Ratio between numerical results and plastic resistance vs. c/𝜀t ratio
0,55
0,60
0,65
0,70
0,75
0,80
0,85
0,90
0,95
1,00
1,05
9,00 13,00 17,00 21,00 25,00 29,00 33,00
Mu
lt,u
/Mp
l,u[-
]
c/εt [-]
L45x45xt
L70x70xt
L120x120xt
L130x130xt
L150x150xt
L250x250xt
theoretical
c/εt=27c/εt=16
Class 3 Class 4Class 1-2
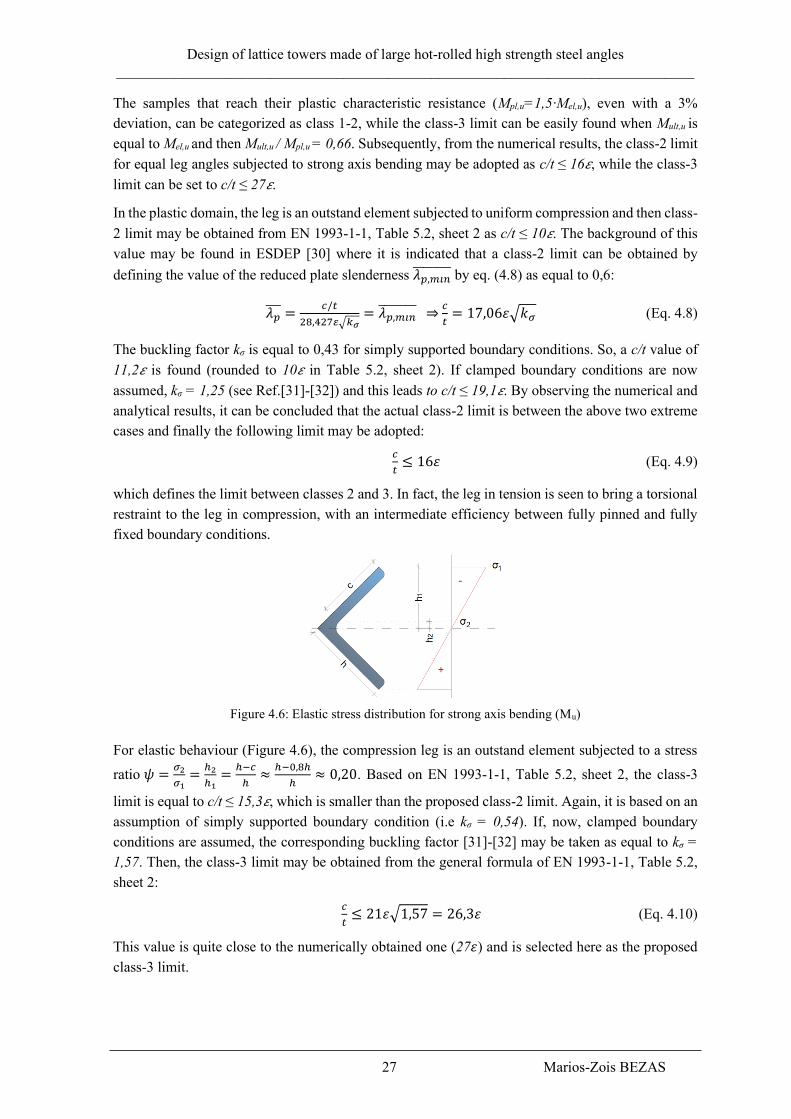
Design of lattice towers made of large hot-rolled high strength steel angles
_______________________________________________________________________________
27 Marios-Zois BEZAS
The samples that reach their plastic characteristic resistance (Mpl,u=1,5·Mel,u), even with a 3%
deviation, can be categorized as class 1-2, while the class-3 limit can be easily found when Mult,u is
equal to Mel,u and then Mult,u / Mpl,u = 0,66. Subsequently, from the numerical results, the class-2 limit
for equal leg angles subjected to strong axis bending may be adopted as c/t ≤ 16𝜀, while the class-3
limit can be set to c/t ≤ 27𝜀.
In the plastic domain, the leg is an outstand element subjected to uniform compression and then class-
2 limit may be obtained from EN 1993-1-1, Table 5.2, sheet 2 as c/t ≤ 10𝜀. The background of this
value may be found in ESDEP [30] where it is indicated that a class-2 limit can be obtained by
defining the value of the reduced plate slenderness 𝜆𝑝,𝑚𝑖𝑛̅̅ ̅̅ ̅̅ ̅̅ by eq. (4.8) as equal to 0,6:
𝜆𝑝̅̅ ̅ =𝑐/𝑡
28,427𝜀√𝑘𝜎= 𝜆𝑝,𝑚𝑖𝑛̅̅ ̅̅ ̅̅ ̅̅ ⇒
𝑐
𝑡= 17,06𝜀√𝑘𝜎 (Eq. 4.8)
The buckling factor kσ is equal to 0,43 for simply supported boundary conditions. So, a c/t value of
11,2𝜀 is found (rounded to 10𝜀 in Table 5.2, sheet 2). If clamped boundary conditions are now
assumed, kσ = 1,25 (see Ref.[31]-[32]) and this leads to c/t ≤ 19,1𝜀. By observing the numerical and
analytical results, it can be concluded that the actual class-2 limit is between the above two extreme
cases and finally the following limit may be adopted:
𝑐
𝑡≤ 16𝜀 (Eq. 4.9)
which defines the limit between classes 2 and 3. In fact, the leg in tension is seen to bring a torsional
restraint to the leg in compression, with an intermediate efficiency between fully pinned and fully
fixed boundary conditions.
Figure 4.6: Elastic stress distribution for strong axis bending (Mu)
For elastic behaviour (Figure 4.6), the compression leg is an outstand element subjected to a stress
ratio 𝜓 =𝜎2
𝜎1=ℎ2
ℎ1=ℎ−𝑐
ℎ≈ℎ−0,8ℎ
ℎ≈ 0,20. Based on EN 1993-1-1, Table 5.2, sheet 2, the class-3
limit is equal to c/t ≤ 15,3𝜀, which is smaller than the proposed class-2 limit. Again, it is based on an
assumption of simply supported boundary condition (i.e kσ = 0,54). If, now, clamped boundary
conditions are assumed, the corresponding buckling factor [31]-[32] may be taken as equal to kσ =
1,57. Then, the class-3 limit may be obtained from the general formula of EN 1993-1-1, Table 5.2,
sheet 2:
𝑐
𝑡≤ 21𝜀√1,57 = 26,3𝜀 (Eq. 4.10)
This value is quite close to the numerically obtained one (27𝜀) and is selected here as the proposed
class-3 limit.

Design of lattice towers made of large hot-rolled high strength steel angles
_______________________________________________________________________________
28 Marios-Zois BEZAS
4.4 Classification to weak axis bending
When the cross-section is subjected to weak axis bending Mv, the stress conditions for the two legs
are identical and then, classification refers to both legs. As before, only limits between classes 2 and
3 and 3 and 4 have been derived. Two cases are defined and checked afterwards: the leg tip is under
compression and under tension.
4.4.1 Tip in compression
Table 4.3 presents the cross-sections and the steel grades that have been used for the numerical
studies in which the samples are subjected to weak axis bending moment Mv, with the tip in
compression. As before, the last 8 analysis, i.e. 15* and 16* in Table 4.3, are theoretical so as to
address slenderer cross-sections.
Table 4.3: Samples for the analyses of the cross-section subjected to weak axis bending Mv
No Cross-Section Steel grades
1 L45x45x3 S355 / S460 / S550 / S690
2 L45x45x4 S355 / S460 / S550 / S690
3 L70x70x5 S355 / S460 / S550 / S690
4 L70x70x6 S355 / S460 / S550 / S690
5 L120x120x7 S355 / S460 / S550 / S690
6 L120x120x8 S355 / S460 / S550 / S690
7 L130x130x8 S355 / S460 / S550 / S690
8 L130x130x9 S355 / S460 / S550 / S690
9 L150x150x10 S355 / S460 / S550 / S690
10 L150x150x12 S355 / S460 / S550 / S690
11 L250x250x17 S355 / S460 / S550 / S690
12 L250x250x20 S355 / S460 / S550 / S690
13 L250x250x22 S355 / S460 / S550 / S690
14 L250x250x26 S355 / S460 / S550 / S690
15* L120x120x7 S700 / S800 / S900 / S950
16* L130x130x8 S700 / S800 / S900 / S950
Figure 4.7: Weak axis bending – tip in compression. Ratio between numerical results and plastic resistance
vs. the length parameter k
A number of numerical simulations have been performed to evaluate an optimal length value (L=
k·h), so that yielding develops freely along the member while the cross-section resistance is
0,50
0,60
0,70
0,80
0,90
1,00
1,10
0 1 2 3 4 5 6 7 8 9
Mu
lt,v
/Mp
l,v[-
]
k [-]
L250x26-S550L130x8-S460L250x26-S355L130x8-S690
c/εt=24,6
c/εt=18,9
c/εt=9,7c/εt=11,7

Design of lattice towers made of large hot-rolled high strength steel angles
_______________________________________________________________________________
29 Marios-Zois BEZAS
independent of the length. It has been found that the value of the sample length L= 6·h [mm], is
working quite well (see Figure 4.7):
• for small c/𝜀t ratios which corresponds to class 1 or 2 profiles, the difference between L=
4·h and L= 6·h is less than 0,5%, what is acceptable.
• for large c/𝜀t ratios which corresponds to class 3 and 4 profiles, the difference between L=
6·h and L= 8·h is less than 1,8%, what is also acceptable.
The details and results of this specific parametric study are summarized in Table 4.4.
Table 4.4: Samples of the numerical simulations about the optimal length value
No h
[mm]
fy
[N/mm2]
t
[mm] c/𝜀t k
L=k·h
[mm]
Mult,v
[kNm]
Mpl,v
[kNm]
Mult,v/Mpl,v
[-]
1 250 355 26 9,7
1,6 400 183,17 184,34 0,99
3 750 181,43 184,34 0,98
3,5 875 181,16 184,34 0,98
4 1000 180,94 184,34 0,98
6 1500 180,57 184,34 0,98
2 250 550 26 11,7
1,5 375 281,90 285,6 0,99
3 750 277,57 285,6 0,97
4 1000 276,54 285,6 0,97
6 1500 275,98 285,6 0,97
3 130 460 8 18,9
0,77 100 21,42 20,94 1,02
3 390 19,19 20,94 0,92
4 520 18,86 20,94 0,90
6 780 18,54 20,94 0,89
8 1040 18,53 20,94 0,88
4 130 690 8 24,6
1,5 195 28,96 31,42 0,92
3 390 25,92 31,42 0,82
4 520 24,65 31,42 0,78
6 780 23,32 31,42 0,74
8 1040 22,88 31,42 0,73
Figure 4.8 shows the ratio between the numerical results for the cross-section resistance (Mult,v) and
the plastic characteristic resistance (Mpl,v=Wpl,v·fy), versus the c/𝜀t ratio. The analytical expressions
for the evaluation of Wpl,v can be found in Annex A. From the numerical results, one can observe that
the class-2 limit, where the samples reach their Mpl,v even with a 3% deviation, is c/t ≤ 14𝜀, while the
class-3 limit (samples that reach their elastic resistance) is c/t ≤ 26,9𝜀.
Figure 4.8: Weak axis bending – tip in compression. Ratio between numerical results and plastic resistance
vs. c/𝜀t ratio
0,450,500,550,600,650,700,750,800,850,900,951,001,05
9,00 13,00 17,00 21,00 25,00 29,00 33,00
Mu
lt,v
/Mp
l,v[-
]
c/εt [-]
L45x45xt
L70x70xt
L120x120xt
L130x130xt
L150x150xt
L250x250xt
theoreticalClass 1-2 Class 4
c/εt=26,9c/εt=14
Class 3

Design of lattice towers made of large hot-rolled high strength steel angles
_______________________________________________________________________________
30 Marios-Zois BEZAS
Figure 4.9: Stress distribution (compression taken as positive) for weak axis bending (Mv) – tip in
compression
Figure 4.10: Stress ratio ψ for elastic stress distribution – tip in compression (angles from 70 to 300)
The stress ratio for elastic stress distribution (see Figure 4.9-a) is given by 𝜓 =𝜎2
𝜎1= −
𝑒−(ℎ−𝑐)
ℎ−𝑒 . As
is shown in Figure 4.10, the stress ratio ψ ≈ -0,1 for usual angle sections. Therefore, the buckling
factor may be conservatively set equal to kσ = 0,57 (valid for ψ = 0) and according to EN 1993-1-1,
Table 5.2, sheet 2, the class-3 limit is:
c/t ≤ 15,9𝜀 (Eq. 4.11)
If now clamped boundary conditions are considered, as done for strong axis bending, the buckling
factor is equal to kσ =1,65 (for stress ratio ψ ≈ -0,1). Then, the class-3 limit may be obtained again
from the general formula of EN 1993-1-1, Table 5.2, sheet 2 as follows:
𝑐
𝑡≤ 21𝜀√𝑘𝜎 = 21𝜀√1,65 = 26,9𝜀 (Eq. 4.12)
The class-3 limit may so be defined accordingly as it is in agreement with the numerical results.
For the plastic stress distribution, the proportion of the leg in compression is 𝑎 = 1 −𝑒𝑝−𝑡−𝑟
ℎ−𝑡−𝑟. By
considering all the available angle sections, it can be seen that the value of α is ranging between 0,50
to 0,62 with a mean value of approximately 0,58 and a standard deviation of 2%, and therefore, a
value of 0,60 is adopted. The class 2 limit may be accordingly obtained from the general formula of
EN 1993-1-1, Table 5.2, sheet 2, from:
𝑐
𝑡≤10𝜀
𝑎=10𝜀
0,6= 16,6𝜀 (Eq. 4.13)
The classification limits proposed currently by Eurocode 3, i.e. eq. (4.11) and eq. (4.13), are not at
all consistent as the c/t-ratio for class 3 (c/t ≤ 15,9𝜀) is lower than the one obtained for class 2 (c/t ≤
16,6𝜀). The reason is that the mechanical model for class 2 sections in Eurocode 3, when the tip is
in compression, is not correct because the outstand elements partially in compression are treated as
-0,16
-0,14
-0,12
-0,10
-0,08
-0,06
-0,04
1 2 3 4 5 6 7 8 9 10 11 12 13 14 15 16
stre
ss r
atio
ψ[-
]
Profile No

Design of lattice towers made of large hot-rolled high strength steel angles
_______________________________________________________________________________
31 Marios-Zois BEZAS
elements fully in compression with a reduced width αc. This means that the hinge support is
introduced exactly at the position where the compression starts. This is questionable since tension is
beneficial to local buckling. For that reason, it is proposed here to keep the c/t limit for class 2 equal
to:
𝑐
𝑡≤ 14𝜀 (Eq. 4.14)
which is in good agreement with the numerical results.
4.4.2 Tip in tension
Table 4.5 presents the cross-sections and the steel grades that have been used for the analyses in
which the pin-ended samples are subjected to weak axis bending moment Mv-tip in tension. As
already explained for the previous cases, the last 8 analysis, i.e. 3* and 4* in Table 4.5, are theoretical
so as to investigate the behaviour of the cross-section and validate the limit between class 2 and class
3. The value L = 6·h [mm] for the length has been adopted in this case too, as explained in section
4.4.1.
Table 4.5: Details for the analyses of the cross-section subjected to weak axis bending Mv-tip in tension
No Cross-Section Steel grades
1 L120x120x7 S355 / S460 / S550 / S690
2 L120x120x8 S355 / S460 / S550 / S690
3* L130x130x8 S720 / S850 / S1050 / S1250
4* L130x130x9 S820 / S990 / S1200 / S2000
Figure 4.11 shows the ratio between the numerically obtained values of the cross-section resistance
(Mult,v) and the plastic resistance, according to the c/𝜀t ratio.
Figure 4.11: Weak axis bending – tip in tension. Ratio between numerical results and plastic resistance vs.
c/𝜀t ratio
From the numerical results, one can observe that the class-2 limit for equal leg angles subjected to
weak axis bending when the tip is in tension, equals c/t ≤ 27𝜀.
In the plastic domain, the proportion of the leg subjected to compression is 𝛼 =𝑒𝑝−𝑡−𝑟
ℎ−𝑡−𝑟 and taking r
= t as an approximation, it may be shown (Figure 4.12) that, for usual angle sections, it is α ≈ 0,4.
Then, the class-2 limit may be obtained from the general formula of EN 1993-1-1, Table 5.2, sheet
2:
𝑐
𝑡≤10𝜀
𝛼√𝛼=
10𝜀
0,4√0,4= 39,52𝜀 (Eq. 4.15)
0,70
0,75
0,80
0,85
0,90
0,95
1,00
1,05
15,00 20,00 25,00 30,00 35,00 40,00 45,00
Mu
lt,v
/Mp
l,v [
-]
c/εt [-]
L120x120x7
L130x130x8
theoretical
c/εt=27
Class 1-2 Class 3
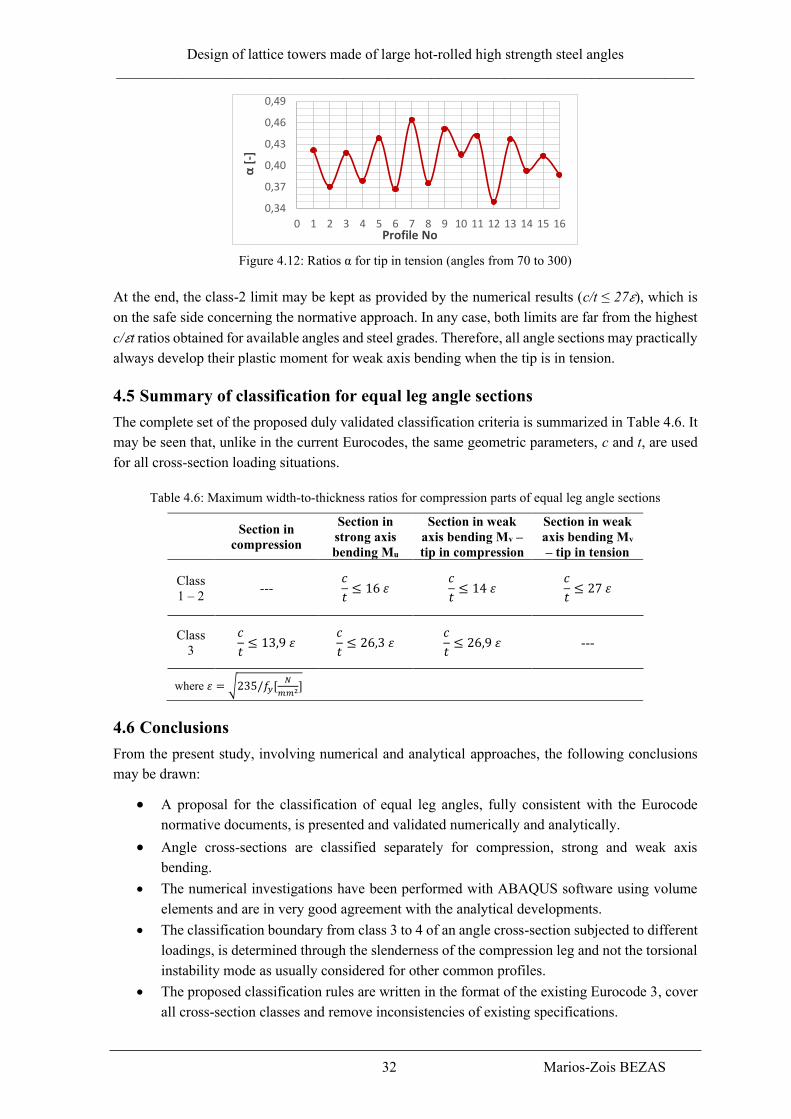
Design of lattice towers made of large hot-rolled high strength steel angles
_______________________________________________________________________________
32 Marios-Zois BEZAS
Figure 4.12: Ratios α for tip in tension (angles from 70 to 300)
At the end, the class-2 limit may be kept as provided by the numerical results (c/t ≤ 27𝜀), which is
on the safe side concerning the normative approach. In any case, both limits are far from the highest
c/𝜀t ratios obtained for available angles and steel grades. Therefore, all angle sections may practically
always develop their plastic moment for weak axis bending when the tip is in tension.
4.5 Summary of classification for equal leg angle sections
The complete set of the proposed duly validated classification criteria is summarized in Table 4.6. It
may be seen that, unlike in the current Eurocodes, the same geometric parameters, c and t, are used
for all cross-section loading situations.
Table 4.6: Maximum width-to-thickness ratios for compression parts of equal leg angle sections
Section in
compression
Section in
strong axis
bending Mu
Section in weak
axis bending Mv –
tip in compression
Section in weak
axis bending Mv
– tip in tension
Class
1 – 2 ---
𝑐
𝑡≤ 16 𝜀
𝑐
𝑡≤ 14 𝜀
𝑐
𝑡≤ 27 𝜀
Class
3
𝑐
𝑡≤ 13,9 𝜀
𝑐
𝑡≤ 26,3 𝜀
𝑐
𝑡≤ 26,9 𝜀 ---
where 𝜀 = √235/𝑓𝑦[𝑁
𝑚𝑚2]
4.6 Conclusions
From the present study, involving numerical and analytical approaches, the following conclusions
may be drawn:
• A proposal for the classification of equal leg angles, fully consistent with the Eurocode
normative documents, is presented and validated numerically and analytically.
• Angle cross-sections are classified separately for compression, strong and weak axis
bending.
• The numerical investigations have been performed with ABAQUS software using volume
elements and are in very good agreement with the analytical developments.
• The classification boundary from class 3 to 4 of an angle cross-section subjected to different
loadings, is determined through the slenderness of the compression leg and not the torsional
instability mode as usually considered for other common profiles.
• The proposed classification rules are written in the format of the existing Eurocode 3, cover
all cross-section classes and remove inconsistencies of existing specifications.
0,34
0,37
0,40
0,43
0,46
0,49
0 1 2 3 4 5 6 7 8 9 10 11 12 13 14 15 16
α [
-]Profile No

Design of lattice towers made of large hot-rolled high strength steel angles
_______________________________________________________________________________
33 Marios-Zois BEZAS
5. DESIGN RESISTANCES OF ANGLE CROSS-SECTIONS
In the following paragraphs, formulae for the evaluation of the cross-section design resistance of
equal leg angles are proposed and validated through the numerical results obtained in chapter 4
concerning the classification. The formulae were based on those given in EN 1993-1-1 and were
adjusted appropriately for angles sections when required. The notations for the material properties,
safety factors and other properties follow those given in chapter 2, and therefore no further definitions
are given here, unless it is necessary. Finally, based on the results obtained in the previous chapter
of classification, a linear transition between plastic and elastic bending resistances is adopted. This
smooth transition has been proposed and validated for double symmetric cross-sections in the SEMI-
COMP European funded project [33] and will be adopted for these sections in the forthcoming new
version of Eurocode 3 Part 1-1 (pr EN 1993-1-1 [26]).
5.1 Cross-section resistance to tension
The cross-section design resistance for axial tension may be determined from:
𝑁𝑡,𝑅𝑑 =𝐴𝑓𝑦
𝛾𝑀0 (Eq. 5.1)
The corresponding characteristic resistance Nt,Rk is given by eq. (5.1), removing γΜ0 from the
equation. No modification is recorded here from the existing Eurocode 3, but is reported just for sake
of completeness.
5.2 Cross-section resistance to compression
The proposed cross-section design resistance for axial compression may be determined from:
𝑁𝑐,𝑅𝑑 = {
𝐴𝑓𝑦
𝛾𝑀0for class 1,2 and 3 profiles
𝛢𝑒𝑓𝑓𝑓𝑦
𝛾𝑀0for class 4 profiles
(Eq. 5.2)
where,
Aeff is the area of the effective cross-section defined as:
𝐴𝑒𝑓𝑓 = 𝐴 − 2𝑐𝑡(1 − 𝜌) (Eq. 5.3)
ρ is the reduction factor accounting for plate buckling, equal to:
𝜌 = {1,0 for λ̅p ≤ 0,748
λ̅p−0,188
�̅�𝑝2 for λ̅p > 0,748
(Eq. 5.4)
considering a reduced plate slenderness of the legs equal to:
λ̅p = √fy
𝜎cr=
𝑐/𝑡
28,4𝜀√0,43=
𝑐/𝑡
18,6𝜀 (Eq. 5.5)
The corresponding characteristic resistance Nc,Rk is given by eq. (5.2), removing γΜ0 from the
equation.
In order to be in line with the classification limits as derived in section 4.2, the geometric property �̅�
must be defined differently than in the current Eurocode provisions. Consequently, the statement of
EN 1993-1-5, §4.4(2) that �̅� = ℎ for equal leg angles should be replaced for this type of section by

Design of lattice towers made of large hot-rolled high strength steel angles
_______________________________________________________________________________
34 Marios-Zois BEZAS
�̅� = 𝑐. This constitutes the only difference between the current proposal and the existing Eurocode
3 provisions.
Figure 5.1 shows the ratio between the numerically determined cross-section resistance (Nult), and
the characteristic resistance (Nc,Rk), versus the c/𝜀t ratio. It may be seen that the response is not
influenced by the cross-section size. Furthermore, it may be seen that, for stocky class 1 to 3 legs,
there is a small overestimation of resistance by the proposed formulae. However, this is largely
counterbalanced by strain hardening effect that is not considered in the numerical analysis. For class-
4 sections the proposed rules are largely on the safe side.
Figure 5.1: Cross-section resistance to compression. Ratio between numerical results and characteristic
compression resistance vs. c/εt ratio
Figure 5.2 illustrates the ratio between the numerically determined cross-section resistance (Nult), and
the design resistance (Nc,Rd), versus the c/𝜀t ratio. The design resistances have been evaluated firstly
with the current proposal and then based on the existing provisions of EN 1993-1-1 in combination
with EN 1993-1-5 for class-4 sections. The vertical dot lines represent the class-3 limit as suggested
in chapter 4 (c/t ≤ 13,9𝜀) and the one calculated using Eurocode 3 provisions (c/t ≤ 11,1𝜀 – eq. (4.6)).
It can be easily seen that the proposed model is less conservative for class-4 profiles while still
remaining on the safe side.
Figure 5.2: Cross-section resistance to compression. Ratio between numerical results and design compression
resistance obtained from the current proposal and Eurocode 3 vs. c/εt ratio
5.3 Cross-section resistance to strong axis bending
The proposed cross-section design resistance to strong axis bending Mu may be determined from:
𝑀𝑢,𝑅𝑑 = 𝑊𝑢𝑓𝑦
𝛾𝑀0 (Eq. 5.6)
0,85
0,90
0,95
1,00
1,05
1,10
1,15
1,20
8,00 10,00 12,00 14,00 16,00 18,00 20,00 22,00
Nu
lt/N
c,R
k[-
]
c/εt [-]
L45x45xt
L70x70xt
L250x250xt
c/εt=13,9
Class 1-2-3 Class 4
0,80
0,90
1,00
1,10
1,20
1,30
1,40
8,00 10,00 12,00 14,00 16,00 18,00 20,00 22,00
Nu
lt/N
c,R
d[-
]
c/εt [-]
proposal
EN 1993-1-1
c/εt=13,9 c/εt= 11,1

Design of lattice towers made of large hot-rolled high strength steel angles
_______________________________________________________________________________
35 Marios-Zois BEZAS
where,
Wu is the section modulus about u axis that equals:
𝑊𝑢 = 𝛼𝑖,𝑢𝑊𝑒𝑙,𝑢 with i = 2, 3, 4 (Eq. 5.7)
where,
α2,u = 1,5 for class 1 or 2 (Eq. 5.8)
α3,u = [1 + (26,3ε−c/t
26,3ε−16ε) ∙ (1,5 − 1)] for class 3 (Eq. 5.9)
α4,u = Weff,u /Wel,u =ρu2 for class 4 (Eq. 5.10)
ρu is the reduction factor for plate buckling, determined from eq. (5.4)
considering a plate slenderness of legs expressed by:
λ̅p = √𝑓𝑦
𝜎cr=
𝑐/𝑡
28,4𝜀√1,57=
𝑐/𝑡
35,6𝜀 (Eq. 5.11)
For strong axis bending of class-4 sections, the effective cross-section becomes non-symmetric due
to the fact that only one leg is in compression (see Figure 5.3(b)). This changes the position of the
centroid, the directions of the principal axes and all cross-section properties. In order to avoid such
laborious calculation, an approximate solution for the effective section modulus is envisaged. This
may be achieved by reducing equally the other leg too, an approach that is on the safe side (see Figure
5.3(c)). The comparison of the ratio between the initial and the approximate effective cross-section,
is shown in Figure 5.4. It may be seen that the proposed approach, applied to a large number of cross-
sections, is on the safe side.
Figure 5.3: (a) Initial cross-section, (b) actual effective cross-section and (c) Approximate effective cross-
section
Figure 5.4: Ratio of the strong axis moduli between the initial and the effective cross-section
Figure 5.5 shows the ratio between the numerically determined cross-section resistance (Mult,u), and
the characteristic resistance (Mu,Rk), versus the c/𝜀t ratio. It may be seen that the response is not
0,99
1,00
1,01
1,02
1,03
30 130 230 330
Wef
f,u/(
ρ2 u
Wel
,u)
[-]
h [mm]
Determination of α4,u
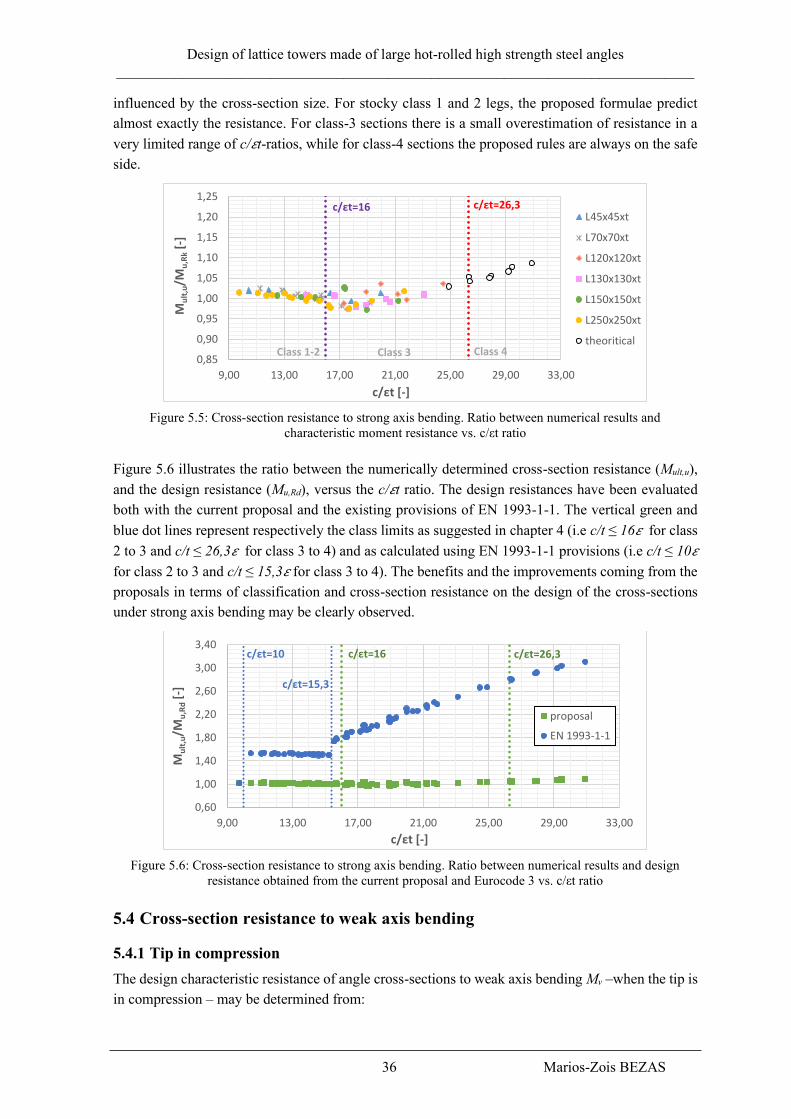
Design of lattice towers made of large hot-rolled high strength steel angles
_______________________________________________________________________________
36 Marios-Zois BEZAS
influenced by the cross-section size. For stocky class 1 and 2 legs, the proposed formulae predict
almost exactly the resistance. For class-3 sections there is a small overestimation of resistance in a
very limited range of c/𝜀t-ratios, while for class-4 sections the proposed rules are always on the safe
side.
Figure 5.5: Cross-section resistance to strong axis bending. Ratio between numerical results and
characteristic moment resistance vs. c/εt ratio
Figure 5.6 illustrates the ratio between the numerically determined cross-section resistance (Mult,u),
and the design resistance (Mu,Rd), versus the c/𝜀t ratio. The design resistances have been evaluated
both with the current proposal and the existing provisions of EN 1993-1-1. The vertical green and
blue dot lines represent respectively the class limits as suggested in chapter 4 (i.e c/t ≤ 16𝜀 for class
2 to 3 and c/t ≤ 26,3𝜀 for class 3 to 4) and as calculated using EN 1993-1-1 provisions (i.e c/t ≤ 10𝜀
for class 2 to 3 and c/t ≤ 15,3𝜀 for class 3 to 4). The benefits and the improvements coming from the
proposals in terms of classification and cross-section resistance on the design of the cross-sections
under strong axis bending may be clearly observed.
Figure 5.6: Cross-section resistance to strong axis bending. Ratio between numerical results and design
resistance obtained from the current proposal and Eurocode 3 vs. c/εt ratio
5.4 Cross-section resistance to weak axis bending
5.4.1 Tip in compression
The design characteristic resistance of angle cross-sections to weak axis bending Mv –when the tip is
in compression – may be determined from:
0,85
0,90
0,95
1,00
1,05
1,10
1,15
1,20
1,25
9,00 13,00 17,00 21,00 25,00 29,00 33,00
Mu
lt,u
/Mu
,Rk
[-]
c/εt [-]
L45x45xt
L70x70xt
L120x120xt
L130x130xt
L150x150xt
L250x250xt
theoritical
c/εt=26,3 c/εt=16
Class 1-2 Class 3 Class 4
0,60
1,00
1,40
1,80
2,20
2,60
3,00
3,40
9,00 13,00 17,00 21,00 25,00 29,00 33,00
Mu
lt,u
/Mu
,Rd
[-]
c/εt [-]
proposal
EN 1993-1-1
c/εt=26,3 c/εt=16
c/εt=15,3
c/εt=10

Design of lattice towers made of large hot-rolled high strength steel angles
_______________________________________________________________________________
37 Marios-Zois BEZAS
𝑀𝑣,𝑅𝑑 = 𝑊𝑣
𝑓𝑦
𝛾𝑀0 (Eq. 5.12)
where,
Wv is the section modulus about v axis that equals:
𝑊𝑣 = 𝛼𝑖,v𝑊𝑒𝑙,v with i = 2, 3, 4 (Eq. 5.13)
where,
α2,v = Wpl,v /Wel,v for class 1 or 2 (Eq. 5.14)
α3,v = [1 + (26,9ε−c/t
26,9ε−14ε) ∙ (α2,v − 1)] for class 3 (Eq. 5.15)
α4,v = Weff,v /Wel,v =0,94·ρv2 for class 4 (Eq. 5.16)
ρv is the reduction factor for plate buckling, determined from eq. (5.4)
considering a plate slenderness of legs expressed by:
λ̅p = √𝑓𝑦
𝜎cr=
𝑐/𝑡
28,4𝜀√1,65=
𝑐/𝑡
36,5𝜀 (Eq. 5.17)
It should be noted that, for weak axis, Wpl,v ≠1,50·min(Wel,vtip, Wel,v
toe), in contrast with the case of
strong axis bending. However, based on the numerically tested samples, it appears that Wpl,v = (1,65
~ 1,95)·min(Wel,vtip, Wel,v
toe) and so, a value α2,v = 1,75 could be possibly adopted as a rough estimation
for a preliminary design.
For class 4 cross-sections, a similar procedure than for strong axis bending is followed. Figure 5.7
shows that the modulus of the effective cross section is approximately equal to the modulus of the
initial cross-section multiplied with the factor 0,94·ρv2. Therefore, α4,v is fixed accordingly.
Figure 5.7: Ratio of the weak axis section moduli between the full and the effective cross-section
Figure 5.8 shows the ratio between the numerically determined cross-section resistance (Mult,v), and
the characteristic resistance (Mv,Rk using the exact value of Wpl,v), versus the c/𝜀t-ratio. It may be seen
that the response is not influenced by the cross-section size. For stocky legs of class 1 and 2, entering
even in class-3, there is a small overestimation of resistance. This may be counterbalanced by strain
hardening effect not considered here. This is also observed for large c/𝜀t-ratios in the border between
class 3 and 4. However, such ratios are not corresponding to existing hot-rolled angle profiles.
Figure 5.9 illustrates the ratio between the numerically determined cross-section resistance (Mult,v),
and the design resistance (Mv,Rd), versus the c/𝜀t ratio. The design resistances have been evaluated
0,85
0,90
0,95
1,00
0 100 200 300 400
Wef
f,v/
(ρ2
vWel
,v)
[-]
h [mm]
Determination of α4,v
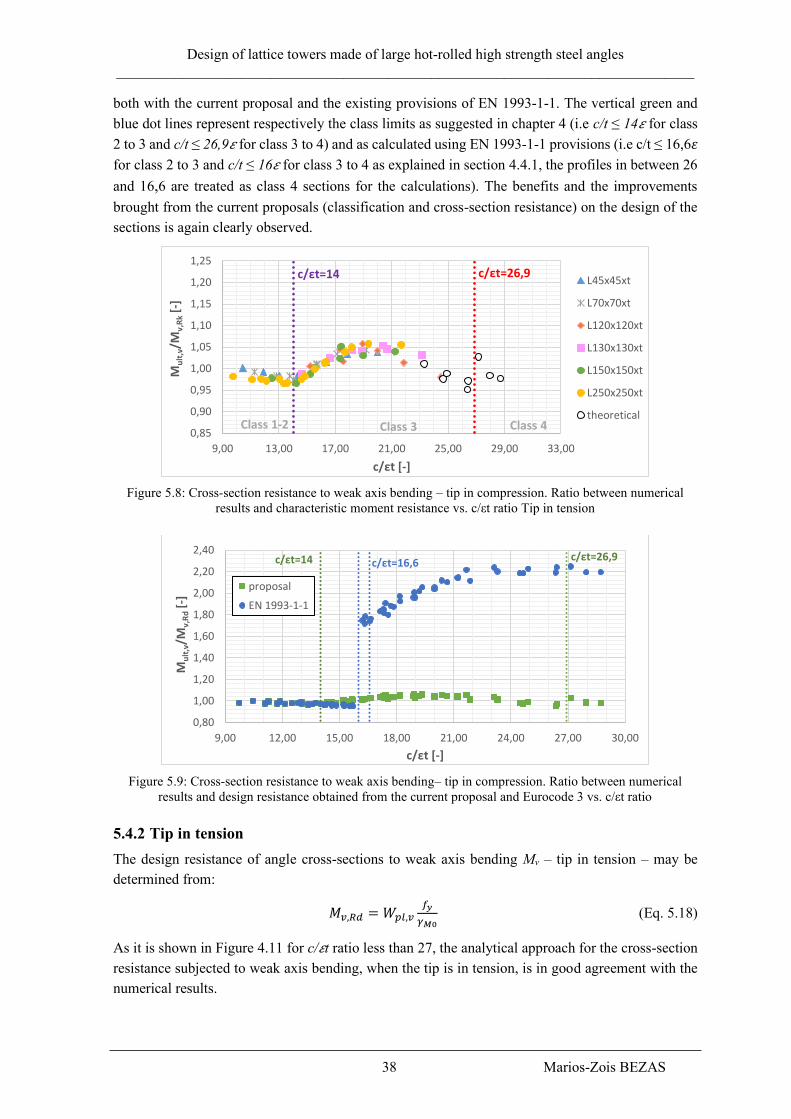
Design of lattice towers made of large hot-rolled high strength steel angles
_______________________________________________________________________________
38 Marios-Zois BEZAS
both with the current proposal and the existing provisions of EN 1993-1-1. The vertical green and
blue dot lines represent respectively the class limits as suggested in chapter 4 (i.e c/t ≤ 14𝜀 for class
2 to 3 and c/t ≤ 26,9𝜀 for class 3 to 4) and as calculated using EN 1993-1-1 provisions (i.e c/t ≤ 16,6𝜀
for class 2 to 3 and c/t ≤ 16𝜀 for class 3 to 4 as explained in section 4.4.1, the profiles in between 26
and 16,6 are treated as class 4 sections for the calculations). The benefits and the improvements
brought from the current proposals (classification and cross-section resistance) on the design of the
sections is again clearly observed.
Figure 5.8: Cross-section resistance to weak axis bending – tip in compression. Ratio between numerical
results and characteristic moment resistance vs. c/εt ratio Tip in tension
Figure 5.9: Cross-section resistance to weak axis bending– tip in compression. Ratio between numerical
results and design resistance obtained from the current proposal and Eurocode 3 vs. c/εt ratio
5.4.2 Tip in tension
The design resistance of angle cross-sections to weak axis bending Mv – tip in tension – may be
determined from:
𝑀𝑣,𝑅𝑑 = 𝑊𝑝𝑙,𝑣𝑓𝑦
𝛾𝑀0 (Eq. 5.18)
As it is shown in Figure 4.11 for c/𝜀t ratio less than 27, the analytical approach for the cross-section
resistance subjected to weak axis bending, when the tip is in tension, is in good agreement with the
numerical results.
0,85
0,90
0,95
1,00
1,05
1,10
1,15
1,20
1,25
9,00 13,00 17,00 21,00 25,00 29,00 33,00
Mu
lt,v
/Mv,
Rk
[-]
c/εt [-]
L45x45xt
L70x70xt
L120x120xt
L130x130xt
L150x150xt
L250x250xt
theoretical
c/εt=14 c/εt=26,9
Class 1-2 Class 3 Class 4
0,80
1,00
1,20
1,40
1,60
1,80
2,00
2,20
2,40
9,00 12,00 15,00 18,00 21,00 24,00 27,00 30,00
Mu
lt,v
/Mv,
Rd
[-]
c/εt [-]
proposal
EN 1993-1-1
c/εt=14 c/εt=26,9c/εt=16,6
Design of lattice towers made of large hot-rolled high strength steel angles
_______________________________________________________________________________
39 Marios-Zois BEZAS
5.5 Conclusions
The main features of the proposed design rules are summarized below:
• The proposed design rules are based on theoretical-analytical considerations and are duly
validated through extensive numerical investigations.
• They are written respecting the format of the existing Eurocode 3 specifications.
• They are simple to apply.
• They include all important loading conditions such as compression, weak and strong axis
bending.
• They allow a smooth transition between cross-section classes, removing any artificial
stepwise prediction of resistance.
• They are less conservative than the current design rules proposed by Eurocode 3.
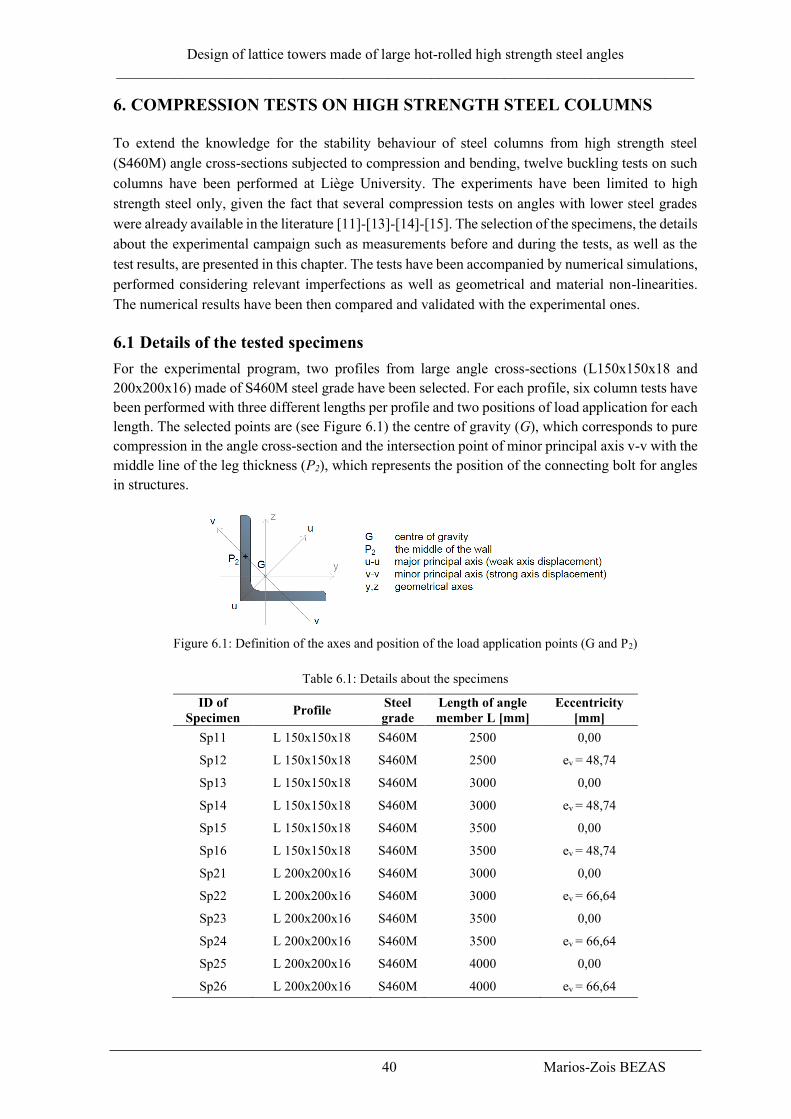
Design of lattice towers made of large hot-rolled high strength steel angles
_______________________________________________________________________________
40 Marios-Zois BEZAS
6. COMPRESSION TESTS ON HIGH STRENGTH STEEL COLUMNS
To extend the knowledge for the stability behaviour of steel columns from high strength steel
(S460M) angle cross-sections subjected to compression and bending, twelve buckling tests on such
columns have been performed at Liège University. The experiments have been limited to high
strength steel only, given the fact that several compression tests on angles with lower steel grades
were already available in the literature [11]-[13]-[14]-[15]. The selection of the specimens, the details
about the experimental campaign such as measurements before and during the tests, as well as the
test results, are presented in this chapter. The tests have been accompanied by numerical simulations,
performed considering relevant imperfections as well as geometrical and material non-linearities.
The numerical results have been then compared and validated with the experimental ones.
6.1 Details of the tested specimens
For the experimental program, two profiles from large angle cross-sections (L150x150x18 and
200x200x16) made of S460M steel grade have been selected. For each profile, six column tests have
been performed with three different lengths per profile and two positions of load application for each
length. The selected points are (see Figure 6.1) the centre of gravity (G), which corresponds to pure
compression in the angle cross-section and the intersection point of minor principal axis v-v with the
middle line of the leg thickness (P2), which represents the position of the connecting bolt for angles
in structures.
Figure 6.1: Definition of the axes and position of the load application points (G and P2)
Table 6.1: Details about the specimens
ID of
Specimen Profile
Steel
grade
Length of angle
member L [mm]
Eccentricity
[mm]
Sp11 L 150x150x18 S460M 2500 0,00
Sp12 L 150x150x18 S460M 2500 ev = 48,74
Sp13 L 150x150x18 S460M 3000 0,00
Sp14 L 150x150x18 S460M 3000 ev = 48,74
Sp15 L 150x150x18 S460M 3500 0,00
Sp16 L 150x150x18 S460M 3500 ev = 48,74
Sp21 L 200x200x16 S460M 3000 0,00
Sp22 L 200x200x16 S460M 3000 ev = 66,64
Sp23 L 200x200x16 S460M 3500 0,00
Sp24 L 200x200x16 S460M 3500 ev = 66,64
Sp25 L 200x200x16 S460M 4000 0,00
Sp26 L 200x200x16 S460M 4000 ev = 66,64

Design of lattice towers made of large hot-rolled high strength steel angles
_______________________________________________________________________________
41 Marios-Zois BEZAS
Table 6.1 summarizes all the details about the specimens. The reported length is the one of the angle
member, without considering the end plates. The system length is defined in §6.4. The name of each
specimen consists of two numbers Sp## (e.g. Sp12):
• the first number indicates the profile: 1 for L150x150x18 and 2 for 200x200x16;
• the second one is the serial number of the specimen (1 to 6 per profile).
For all tests, constant dimensions have been selected for the end plates welded at the extremities of
the angle members, in order to simplify the placement procedure of the specimen in the test rig.
Therefore, the position of the applied load is always the same for the machine and the eccentricity is
introduced by moving the profile on the end plates. The steel grade of all end plates is S355. The
welds have been designed according to EN 1993-1-8 [3]. For all specimens, the minimum required
weld thickness is 6 mm, except for specimens Sp11 and Sp21 which require a minimum thickness of
8 mm. Figure 6.2 shows the details of such end plates on which the specimens have been welded.
Figure 6.2: Detail of end plates in case of centrally (left) and eccentrally (right) loaded specimens.
6.2 Test measurements
6.2.1 Actual dimensions of the cross-sections
The actual geometrical dimensions of each angle section – the width (hi) and the thickness (ti) of each
leg – have been measured at 3 points along the member: at 1/4, 1/2 and 3/4 of the angle member
length (L). The mean values of the measurements are reported in Table 6.2; the notations can be
found in chapter 2, while indexes A and B are determined in Figure 6.3. The length of the angle
member and the load eccentricity of each specimen has been also measured and reported in Table
6.2.
Table 6.2: Measurements of the actual geometry and dimensions of the cross-sections
ID of
specimen L [mm]
Eccentricity
[mm] hA [mm] hB [mm] tA [mm] tB [mm]
Sp11 2500 0,00 149,97 150,09 18,16 18,14
Sp12 2500 ev = 48,71 150,07 150,12 18,18 18,04
Sp13 3000 0,00 150,11 149,92 18,04 18,16
Sp14 3000 ev = 48,72 150,09 150,10 18,04 18,17
Sp15 3500 0,00 150,07 150,11 18,17 18,07
Sp16 3500 ev = 48,70 150,11 149,95 18,16 18,19
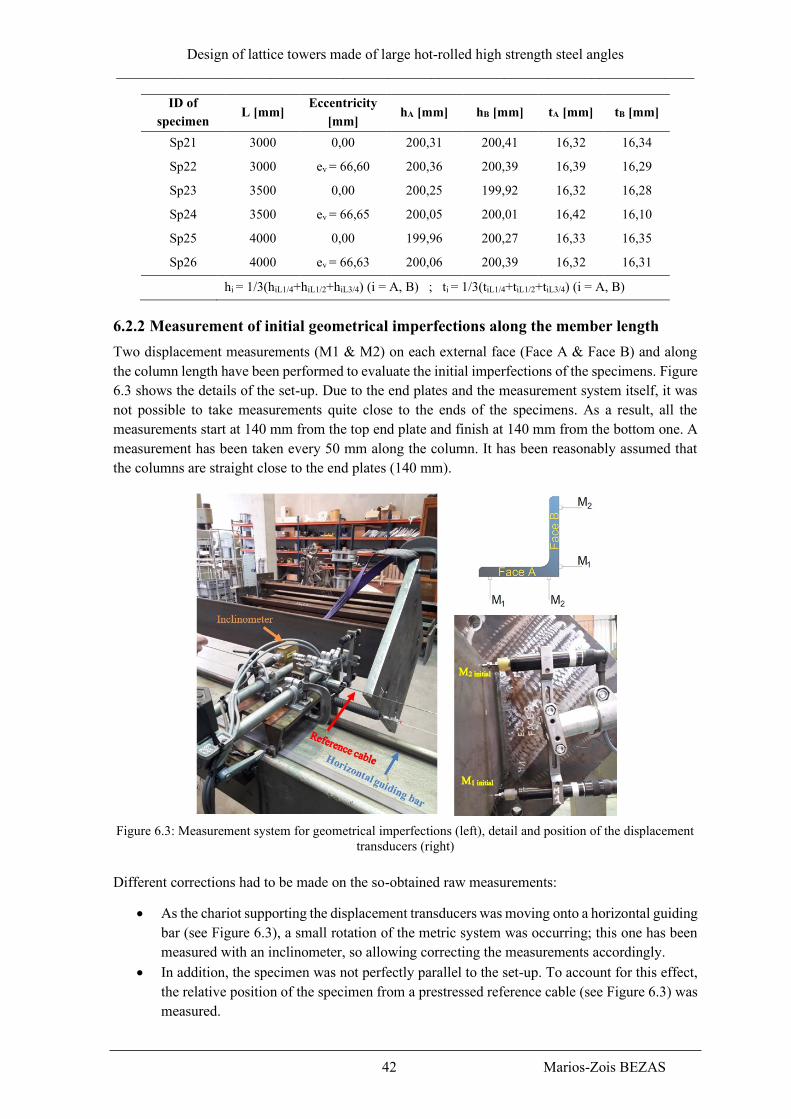
Design of lattice towers made of large hot-rolled high strength steel angles
_______________________________________________________________________________
42 Marios-Zois BEZAS
ID of
specimen L [mm]
Eccentricity
[mm] hA [mm] hB [mm] tA [mm] tB [mm]
Sp21 3000 0,00 200,31 200,41 16,32 16,34
Sp22 3000 ev = 66,60 200,36 200,39 16,39 16,29
Sp23 3500 0,00 200,25 199,92 16,32 16,28
Sp24 3500 ev = 66,65 200,05 200,01 16,42 16,10
Sp25 4000 0,00 199,96 200,27 16,33 16,35
Sp26 4000 ev = 66,63 200,06 200,39 16,32 16,31
hi = 1/3(hiL1/4+hiL1/2+hiL3/4) (i = A, B) ; ti = 1/3(tiL1/4+tiL1/2+tiL3/4) (i = A, B)
6.2.2 Measurement of initial geometrical imperfections along the member length
Two displacement measurements (M1 & M2) on each external face (Face A & Face B) and along
the column length have been performed to evaluate the initial imperfections of the specimens. Figure
6.3 shows the details of the set-up. Due to the end plates and the measurement system itself, it was
not possible to take measurements quite close to the ends of the specimens. As a result, all the
measurements start at 140 mm from the top end plate and finish at 140 mm from the bottom one. A
measurement has been taken every 50 mm along the column. It has been reasonably assumed that
the columns are straight close to the end plates (140 mm).
Figure 6.3: Measurement system for geometrical imperfections (left), detail and position of the displacement
transducers (right)
Different corrections had to be made on the so-obtained raw measurements:
• As the chariot supporting the displacement transducers was moving onto a horizontal guiding
bar (see Figure 6.3), a small rotation of the metric system was occurring; this one has been
measured with an inclinometer, so allowing correcting the measurements accordingly.
• In addition, the specimen was not perfectly parallel to the set-up. To account for this effect,
the relative position of the specimen from a prestressed reference cable (see Figure 6.3) was
measured.
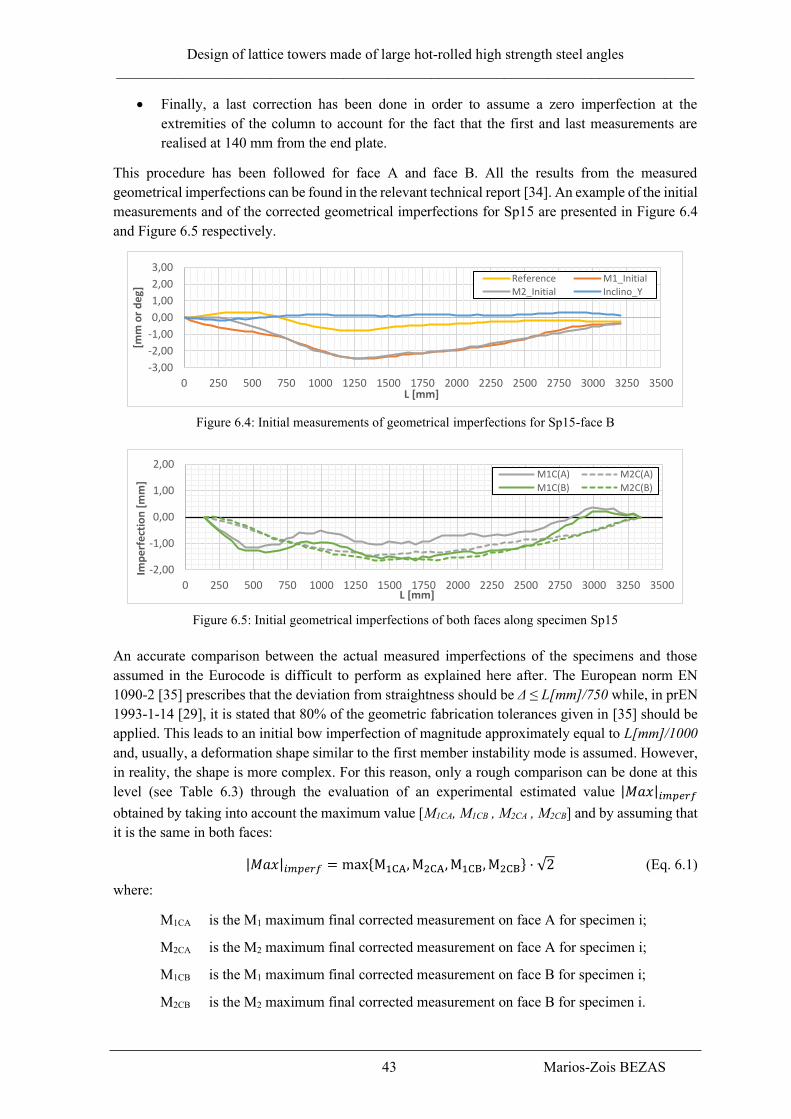
Design of lattice towers made of large hot-rolled high strength steel angles
_______________________________________________________________________________
43 Marios-Zois BEZAS
• Finally, a last correction has been done in order to assume a zero imperfection at the
extremities of the column to account for the fact that the first and last measurements are
realised at 140 mm from the end plate.
This procedure has been followed for face A and face B. All the results from the measured
geometrical imperfections can be found in the relevant technical report [34]. An example of the initial
measurements and of the corrected geometrical imperfections for Sp15 are presented in Figure 6.4
and Figure 6.5 respectively.
Figure 6.4: Initial measurements of geometrical imperfections for Sp15-face B
Figure 6.5: Initial geometrical imperfections of both faces along specimen Sp15
An accurate comparison between the actual measured imperfections of the specimens and those
assumed in the Eurocode is difficult to perform as explained here after. The European norm EN
1090-2 [35] prescribes that the deviation from straightness should be Δ ≤ L[mm]/750 while, in prEN
1993-1-14 [29], it is stated that 80% of the geometric fabrication tolerances given in [35] should be
applied. This leads to an initial bow imperfection of magnitude approximately equal to L[mm]/1000
and, usually, a deformation shape similar to the first member instability mode is assumed. However,
in reality, the shape is more complex. For this reason, only a rough comparison can be done at this
level (see Table 6.3) through the evaluation of an experimental estimated value |𝑀𝑎𝑥|𝑖𝑚𝑝𝑒𝑟𝑓
obtained by taking into account the maximum value [M1CA, M1CB , M2CA , M2CB] and by assuming that
it is the same in both faces:
|𝑀𝑎𝑥|𝑖𝑚𝑝𝑒𝑟𝑓 = max{M1CA, M2CA, M1CB, M2CB} · √2 (Eq. 6.1)
where:
M1CA is the M1 maximum final corrected measurement on face A for specimen i;
M2CA is the M2 maximum final corrected measurement on face A for specimen i;
M1CB is the M1 maximum final corrected measurement on face B for specimen i;
M2CB is the M2 maximum final corrected measurement on face B for specimen i.
-3,00
-2,00
-1,00
0,00
1,00
2,00
3,00
0 250 500 750 1000 1250 1500 1750 2000 2250 2500 2750 3000 3250 3500
[mm
or
de
g]
L [mm]
Reference M1_Initial
M2_Initial Inclino_Y
-2,00
-1,00
0,00
1,00
2,00
0 250 500 750 1000 1250 1500 1750 2000 2250 2500 2750 3000 3250 3500
Imp
erf
ect
ion
[m
m]
L [mm]
M1C(A) M2C(A)
M1C(B) M2C(B)
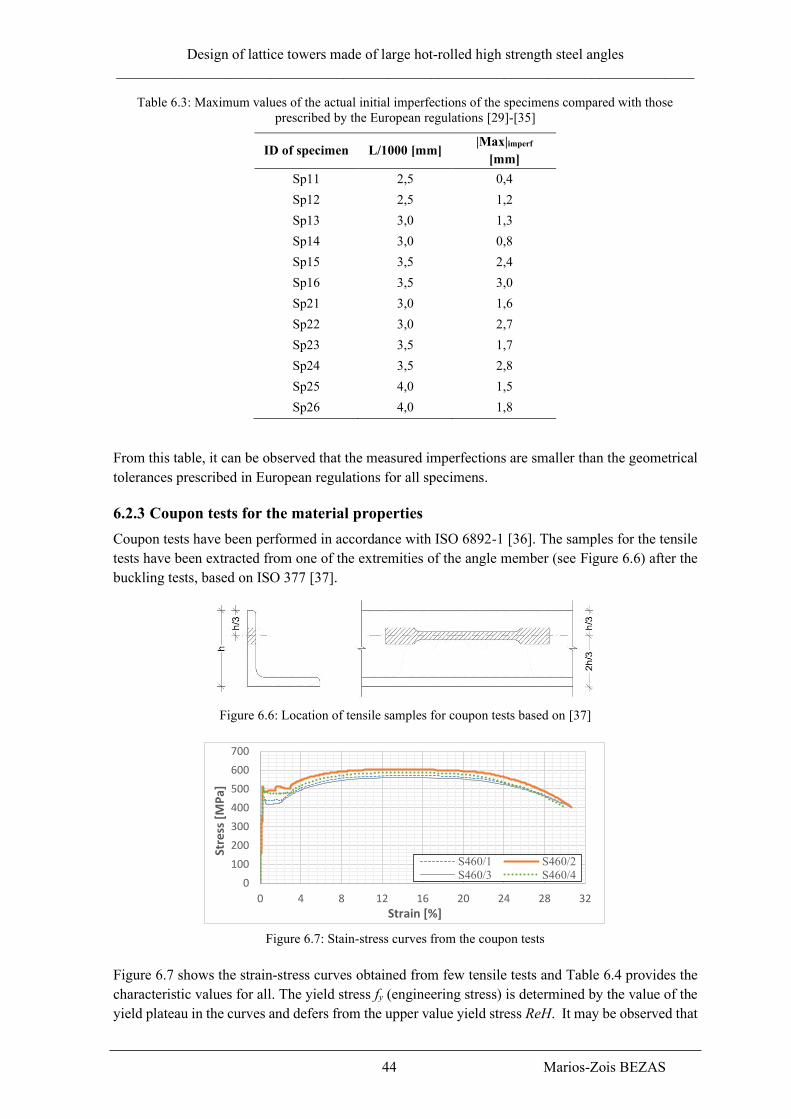
Design of lattice towers made of large hot-rolled high strength steel angles
_______________________________________________________________________________
44 Marios-Zois BEZAS
Table 6.3: Maximum values of the actual initial imperfections of the specimens compared with those
prescribed by the European regulations [29]-[35]
ID of specimen L/1000 [mm] |Max|imperf
[mm]
Sp11 2,5 0,4
Sp12 2,5 1,2
Sp13 3,0 1,3
Sp14 3,0 0,8
Sp15 3,5 2,4
Sp16 3,5 3,0
Sp21 3,0 1,6
Sp22 3,0 2,7
Sp23 3,5 1,7
Sp24 3,5 2,8
Sp25 4,0 1,5
Sp26 4,0 1,8
From this table, it can be observed that the measured imperfections are smaller than the geometrical
tolerances prescribed in European regulations for all specimens.
6.2.3 Coupon tests for the material properties
Coupon tests have been performed in accordance with ISO 6892-1 [36]. The samples for the tensile
tests have been extracted from one of the extremities of the angle member (see Figure 6.6) after the
buckling tests, based on ISO 377 [37].
Figure 6.6: Location of tensile samples for coupon tests based on [37]
Figure 6.7: Stain-stress curves from the coupon tests
Figure 6.7 shows the strain-stress curves obtained from few tensile tests and Table 6.4 provides the
characteristic values for all. The yield stress fy (engineering stress) is determined by the value of the
yield plateau in the curves and defers from the upper value yield stress ReH. It may be observed that
0
100
200
300
400
500
600
700
0 4 8 12 16 20 24 28 32
Stre
ss [
MP
a]
Strain [%]
S460/1 S460/2S460/3 S460/4

Design of lattice towers made of large hot-rolled high strength steel angles
_______________________________________________________________________________
45 Marios-Zois BEZAS
while the actual ultimate stress was above the nominal values for all specimens, this was not the case
for the yield stress.
Table 6.4: Coupon test’s results
ID of
material
E
[MPa]
Measured
yield
stress fy
[MPa]
Measured
ultimate
stress fult
[MPa]
Measured
strain at
failure
[%]
Nominal
yield
stress
fy,nom
[MPa]
fy/fy,nom
[-]
Characterized
specimens
S 460/1 203155 425,8 572,50 14,3 460,0 0,93 Sp12, Sp13, Sp14,
Sp15, Sp16
S 460/2 208947 487,6 604,64 13,7 460,0 1,06 Sp21, Sp22, Sp23,
Sp25, Sp26
S 460/3 197317 417,2 560,87 14,3 460,0 0,91 Sp11
S 460/4 203797 472,6 587,21 13,8 460,0 1,03 Sp24
6.2.4 Measurements during the test
The tests have been carried out in an Amsler 500 testing machine, with a compression capacity of
5000 kN. The specimens are pin ended in the testing rig, since the rotations about the minor and
major axes can develop freely, but no twist or warping is able to occur at the extremities. During the
tests, the following displacements illustrated in Figure 6.8 were measured:
• the vertical displacement C1 (using two transducers: one at the front and one at the back side
of the specimen);
• four horizontal displacements C2, C3, C4 and C5 at the mid cross-section (1st position);
• four horizontal displacements C6, C7, C8 and C9 at the cross-section located at ¼L from the
bottom (2nd position).
Figure 6.8: Schemes of the Amsler 500 test machine and of the measurements during a test
All the displacement transducers have been placed 30 mm from the edges/corner of all cross-sections
and profiles. The set-up allowing the record of those displacements is illustrated in Figure 6.9. In
addition, four strain gauges (I1 to I4) have been placed at the mid-height cross-section of each column
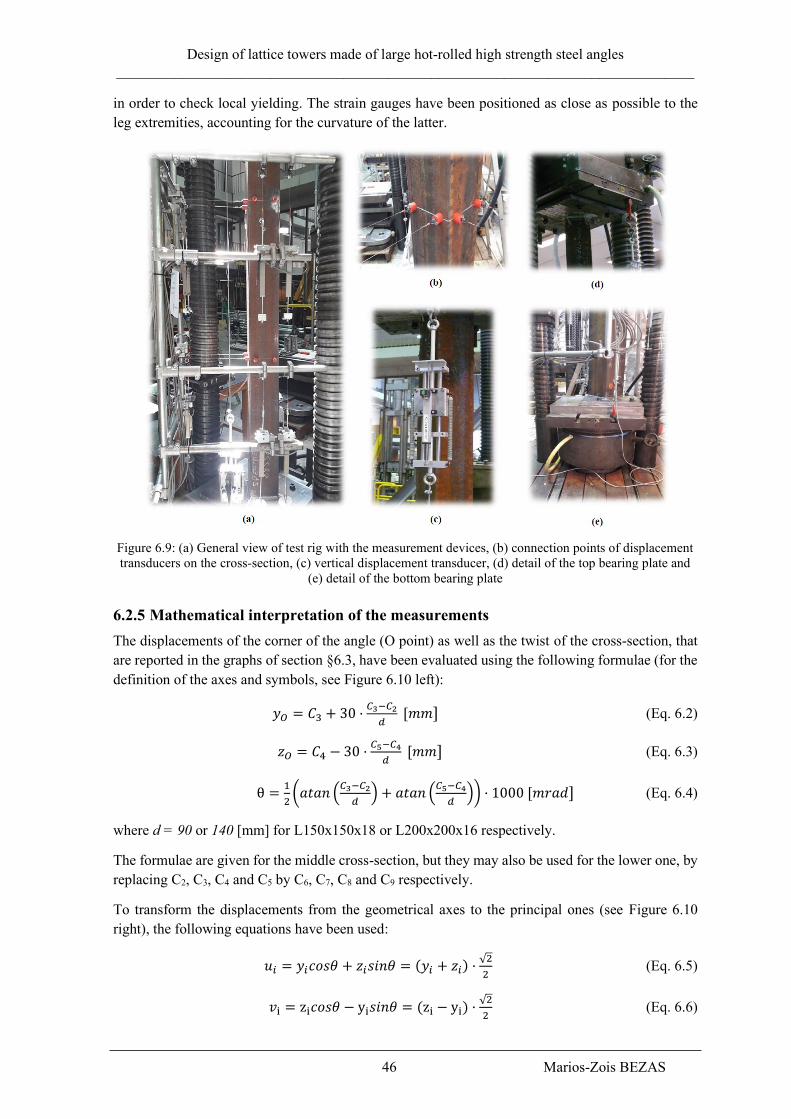
Design of lattice towers made of large hot-rolled high strength steel angles
_______________________________________________________________________________
46 Marios-Zois BEZAS
in order to check local yielding. The strain gauges have been positioned as close as possible to the
leg extremities, accounting for the curvature of the latter.
Figure 6.9: (a) General view of test rig with the measurement devices, (b) connection points of displacement
transducers on the cross-section, (c) vertical displacement transducer, (d) detail of the top bearing plate and
(e) detail of the bottom bearing plate
6.2.5 Mathematical interpretation of the measurements
The displacements of the corner of the angle (O point) as well as the twist of the cross-section, that
are reported in the graphs of section §6.3, have been evaluated using the following formulae (for the
definition of the axes and symbols, see Figure 6.10 left):
𝑦𝑂 = 𝐶3 + 30 ·𝐶3−𝐶2
𝑑 [𝑚𝑚] (Eq. 6.2)
𝑧𝑂 = 𝐶4 − 30 ·𝐶5−𝐶4
𝑑 [𝑚𝑚] (Eq. 6.3)
θ =1
2(𝑎𝑡𝑎𝑛 (
𝐶3−𝐶2
𝑑) + 𝑎𝑡𝑎𝑛 (
𝐶5−𝐶4
𝑑)) · 1000 [𝑚𝑟𝑎𝑑] (Eq. 6.4)
where d = 90 or 140 [mm] for L150x150x18 or L200x200x16 respectively.
The formulae are given for the middle cross-section, but they may also be used for the lower one, by
replacing C2, C3, C4 and C5 by C6, C7, C8 and C9 respectively.
To transform the displacements from the geometrical axes to the principal ones (see Figure 6.10
right), the following equations have been used:
𝑢𝑖 = 𝑦𝑖𝑐𝑜𝑠𝜃 + 𝑧𝑖𝑠𝑖𝑛𝜃 = (𝑦𝑖 + 𝑧𝑖) ·√2
2 (Eq. 6.5)
𝑣i = zi𝑐𝑜𝑠𝜃 − yi𝑠𝑖𝑛𝜃 = (zi − yi) ·√2
2 (Eq. 6.6)

Design of lattice towers made of large hot-rolled high strength steel angles
_______________________________________________________________________________
47 Marios-Zois BEZAS
Figure 6.10: Definition of axis and symbols for the mathematical interpretation
The axial deformation of the specimen has been evaluated as the mean value of both vertical
transducers.
6.3 Results of the experimental tests
The results of the experimental tests are presented below through graphs and tables. Figure 6.11 and
Figure 6.12 show the load-axial displacement (shortening) curves for the profiles L150x150x18 and
L200x200x16 respectively. All the measurements (initial geometrical imperfections, rotations,
strains and deflections) for each specimen are available in the relevant technical report [34].
Figure 6.11: Load vs axial deformation of tested profiles L 150x150x18
Figure 6.12: Load vs axial deformation of tested profiles L 200x200x16
Both figures indicate that the results obtained by experimentation are in line with the expectations
when the test campaign was defined, in particular in terms of influence of the member length and of
the eccentricity on the member stiffness and resistance.
0,00
150,00
300,00
450,00
600,00
750,00
900,00
1050,00
0,00 1,00 2,00 3,00 4,00 5,00 6,00 7,00 8,00 9,00
Load
[kN
]
Axial Deformation [mm]
Sp11 Sp12 Sp13
Sp14 Sp15 Sp16
0,00
300,00
600,00
900,00
1200,00
1500,00
1800,00
0,00 1,00 2,00 3,00 4,00 5,00 6,00 7,00 8,00 9,00
Load
[kN
]
Axial Deformation [mm]
Sp21 Sp22 Sp23
Sp24 Sp25 Sp26

Design of lattice towers made of large hot-rolled high strength steel angles
_______________________________________________________________________________
48 Marios-Zois BEZAS
Amongst the specimens without nominal load eccentricity, three (Sp11, Sp15, Sp25) showed nearly
zero deflections transverse to the weak axis and three (Sp13, Sp21, Sp23) showed very small ones
(see Figure 6.13). For the latter, it may indicate that some limited unintentional eccentricity resulting
from installation tolerances were introduced as explained later. Nevertheless, for all these tests, the
deflections according to the weak axis increased significantly with the load until failure was reached
by weak axis buckling; towards the heel of the cross section for Specimens Sp13, Sp15, Sp25
(negative value of u – see Figure 6.10) and in the opposite direction for Sp11, Sp21 and Sp23
(positive value of u – see Figure 6.10). It can be concluded that specimens Sp11, Sp13 and Sp15
failed in a pure flexural buckling mode (see Figure 6.15(a)), while for specimens Sp21, Sp23 and
Sp25, twist rotations were recorded (see Figure 6.14) in addition to weak axis deflections, indicating
a flexural torsional buckling mode.
*U/VO,midH is the displacement of the corner point O of the mid – height cross-section along u/v principal axis
*U/VO,lowH is the displacement of the corner point O of the low – height cross-section along u/v principal axis
Figure 6.13: Load-deflection curves for centrally loaded specimens
0,00
200,00
400,00
600,00
800,00
1000,00
1200,00
-2,00 2,00 6,00 10,00 14,00 18,00 22,00
Load
[kN
]
Displacements u,v [mm]
Specimen 11
UO,midH
VO,midH
UO,lowH
VO,lowH0,00
300,00
600,00
900,00
1200,00
1500,00
1800,00
-2,00 4,00 10,00 16,00 22,00 28,00 34,00
Load
[kN
]
Displacements u,v [mm]
Specimen 21
UO,midH
VO,midH
UO,lowH
VO,lowH
0,00
150,00
300,00
450,00
600,00
750,00
-45,00 -35,00 -25,00 -15,00 -5,00 5,00
Load
[kN
]
Displacements u,v [mm]
Specimen 13
UO,midH
VO,midH
UO,lowH
VO,lowH0,00
200,00
400,00
600,00
800,00
1000,00
1200,00
1400,00
-5,00 5,00 15,00 25,00 35,00 45,00
Load
[kN
]
Displacements u,v [mm]
Specimen 23
UO,midH
VO,midH
UO,lowH
VO,lowH
0,00
100,00
200,00
300,00
400,00
500,00
600,00
-58,00 -48,00 -38,00 -28,00 -18,00 -8,00 2,00
Load
[kN
]
Displacements u,v [mm]
Specimen 15
UO,midHVO,midHUO,lowHVO,lowH
0,00
200,00
400,00
600,00
800,00
1000,00
1200,00
-70,00 -55,00 -40,00 -25,00 -10,00 5,00
Load
[kN
]
Displacements u,v [mm]
Specimen 25
UO,midHVO,midHUO,lowHVO,lowH

Design of lattice towers made of large hot-rolled high strength steel angles
_______________________________________________________________________________
49 Marios-Zois BEZAS
Figure 6.14: Load-twist curves at mid-height cross-section for centrally loaded (left) and eccentrically loaded
(right) specimens
Figure 6.15: Final deformed shape of (a) Sp15 with a pure flexural buckling mode, (b) Sp26 with a flexural-
torsional failure buckling mode and (c) Sp14 with a mixed mode between flexural and flexural torsional
buckling
The eccentrically loaded specimens were initially subjected to compression and strong axis bending.
At low load levels, the deflections transverse to the strong axis were high while they were very small
in the other principal direction (see Figure 6.16 and green cross-sections in Figure 6.17); this was
opposite to the tendency of the angles to fail by weak axis buckling. At higher load levels, deflections
transverse to the weak axis grew quickly and prevailed at failure (in Figure 6.17, the red cross-section
corresponds to the ultimate load and the blue cross-section is after buckling). In specimens Sp22,
Sp24 and Sp26, these deflections were accompanied by significant twist rotations indicating clearly
0,00
300,00
600,00
900,00
1200,00
1500,00
1800,00
-4,00 0,00 4,00 8,00 12,00
Load
[kN
]
Rotation θ [mrad]
Centrally loaded specimens
Sp11Sp13Sp15Sp21Sp23Sp25 0,00
200,00
400,00
600,00
800,00
1000,00
1200,00
1400,00
-120,00 -90,00 -60,00 -30,00 0,00 30,00
Load
[kN
]
Rotation θ [mad]
Eccentricaly loaded specimens
Sp12Sp14Sp16Sp22Sp24

Design of lattice towers made of large hot-rolled high strength steel angles
_______________________________________________________________________________
50 Marios-Zois BEZAS
a failure with a flexural-torsional buckling mode (see Figure 6.15(b)). On the contrary, twist rotations
were small for specimens Sp12, Sp14 and Sp16 indicating a mixed mode between flexural and
flexural torsional buckling (see Figure 6.15(c)). The most stressed mid-height cross section was
subjected to compression and bi-axial bending. In fact, strong axis bending was primarily due to the
eccentric loading and weak axis bending due to second order effects.
The absence of visible local buckling in all specimens should be also mentioned, although all Sp2#
specimens are categorized as class 4 according to the existing provisions of EN 1993-1-1; with the
proposed classification system they are also classified in class-4 for compression but in class-2 for
bending (c/εt = 14,6).
*U/VO,midH is the displacement of the corner point O of the mid – height cross-section along u/v principal axis
*U/VO,lowH is the displacement of the corner point O of the low – height cross-section along u/v principal axis
Figure 6.16: Load-deflection curves for eccentrically loaded specimens
Finally, Table 6.5 presents, for each specimen the measured failure load (Nexp) as well as the
deflections about minor (vO) and major (uO) principal axes and the twist at the mid-height cross-
0,00
100,00
200,00
300,00
400,00
500,00
600,00
700,00
800,00
-40,00 -30,00 -20,00 -10,00 0,00
Load
[kN
]
Displacements u,v [mm]
Specimen 12
UO,midHVO,midHUO,lowHVO,lowH
0,00
200,00
400,00
600,00
800,00
1000,00
1200,00
1400,00
-25,00 -20,00 -15,00 -10,00 -5,00 0,00 5,00
Load
[kN
]
Displacements u,v [mm]
Specimen 22
UO,midHVO,midHUO,lowHVO,lowH
0,00
100,00
200,00
300,00
400,00
500,00
600,00
700,00
-55,00 -45,00 -35,00 -25,00 -15,00 -5,00 5,00
Load
[kN
]
Displacements u,v [mm]
Specimen 14
UO,midHVO,midHUO,lowHVO,lowH
0,00
200,00
400,00
600,00
800,00
1000,00
1200,00
-40,00 -20,00 0,00 20,00 40,00 60,00
Load
[kN
]
Displacements u,v [mm]
Specimen 24
UO,midHVO,midHUO,lowHVO,lowH
0,00
100,00
200,00
300,00
400,00
500,00
600,00
-60,00 -50,00 -40,00 -30,00 -20,00 -10,00 0,00
Load
[kN
]
Displacements u,v [mm]
Specimen 16
UO,midHVO,midHUO,lowHVO,lowH
0,00
150,00
300,00
450,00
600,00
750,00
900,00
1050,00
-30,00 -15,00 0,00 15,00 30,00 45,00 60,00
Load
[kN
]
Displacements u,v [mm]
Specimen 26
UO,midHVO,midHUO,lowHVO,lowH

Design of lattice towers made of large hot-rolled high strength steel angles
_______________________________________________________________________________
51 Marios-Zois BEZAS
section, all at the failure load. The sign of the deflections and the twist is in accordance with Figure
6.10.
Figure 6.17: Schematic movement of the mid-height cross-section along the loading for specimens Sp24 and
Sp26
Table 6.5: Deflections and twist at the mid-height cross-section at the failure load
ID of
Specimen Profile Nexp [kN] uO [mm] vO [mm] θ [mrad]
Sp11
15
0x1
50x
18
1010,6 8,88 -0,01 -0,82
Sp12 767,3 -15,28 -16,39 -3,94
Sp13 723,2 -28,22 0,53 1,71
Sp14 628,3 -16,35 -17,05 2,05
Sp15 563,9 -31,53 -0,95 0,39
Sp16 519,8 -17,78 -17,03 -1,81
Sp21
20
0x2
00x
16
1661,5 10,89 1,52 3,96
Sp22 1341,4 2,48 -17,07 -44,92
Sp23 1228,0 20,49 1,53 3,51
Sp24 1092,3 16,87 -18,09 -59,51
Sp25 1048,1 -38,43 0,62 7,77
Sp26 953,6 16,31 -22,11 -62,95
6.4 Comparison with FEM analyses
Subsequently, numerical simulations considering relevant imperfections as well as geometrical and
material non-linearities were performed and compared with the results of the experimental tests. The
numerical analyses were performed with the FINELG non-linear finite element software using beam
elements. The choice of beam elements is acceptable and justified from the fact that no local buckling
took place during the tests. Only the column has been modelled while the end plates at the extremities
have been considered indirectly: the length (L) of each column has been increased by 107 mm, what
corresponds to the thickness of the end plates of the specimens as well as the connection plate, so as
to simulate the actual buckling length (Lcrit) of the column (length between the zero moment levels
in Figure 6.8). Each column has been meshed in twenty beam finite elements along the member
length. This is an optimal mesh as the difference of member’s response (ultimate load and
deflections) is less than 1% ether the member is meshed in fifteen elements or thirty. The columns
were assumed as pin-end members with free rotations at their extremities, except the rotation that
leads to torsion along the length axis, which was blocked. All the other DOF at the extremities were
blocked, except ux at the node of the applied load. Therefore, the experimental boundary conditions
were rather well represented by the model.
The FINELG finite element analyses adopting the GMNIA method were performed considering:
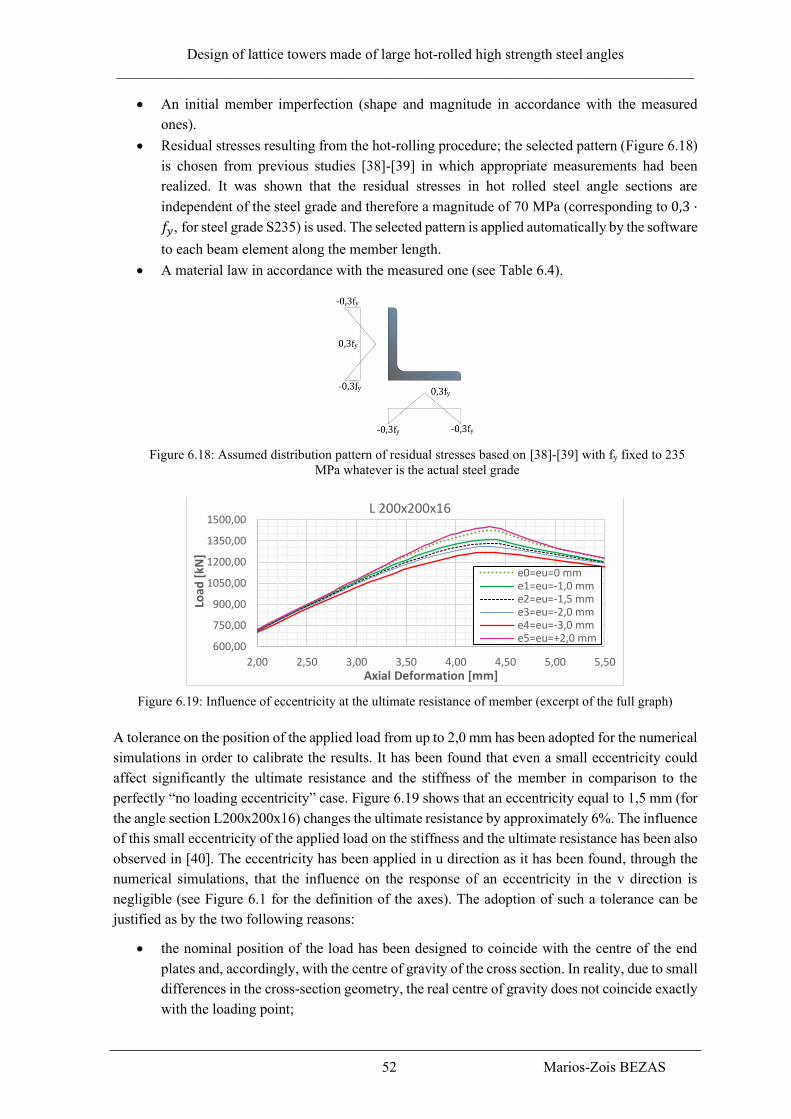
Design of lattice towers made of large hot-rolled high strength steel angles
_______________________________________________________________________________
52 Marios-Zois BEZAS
• An initial member imperfection (shape and magnitude in accordance with the measured
ones).
• Residual stresses resulting from the hot-rolling procedure; the selected pattern (Figure 6.18)
is chosen from previous studies [38]-[39] in which appropriate measurements had been
realized. It was shown that the residual stresses in hot rolled steel angle sections are
independent of the steel grade and therefore a magnitude of 70 MPa (corresponding to 0,3 ·
𝑓𝑦, for steel grade S235) is used. The selected pattern is applied automatically by the software
to each beam element along the member length.
• A material law in accordance with the measured one (see Table 6.4).
Figure 6.18: Assumed distribution pattern of residual stresses based on [38]-[39] with fy fixed to 235
MPa whatever is the actual steel grade
Figure 6.19: Influence of eccentricity at the ultimate resistance of member (excerpt of the full graph)
A tolerance on the position of the applied load from up to 2,0 mm has been adopted for the numerical
simulations in order to calibrate the results. It has been found that even a small eccentricity could
affect significantly the ultimate resistance and the stiffness of the member in comparison to the
perfectly “no loading eccentricity” case. Figure 6.19 shows that an eccentricity equal to 1,5 mm (for
the angle section L200x200x16) changes the ultimate resistance by approximately 6%. The influence
of this small eccentricity of the applied load on the stiffness and the ultimate resistance has been also
observed in [40]. The eccentricity has been applied in u direction as it has been found, through the
numerical simulations, that the influence on the response of an eccentricity in the v direction is
negligible (see Figure 6.1 for the definition of the axes). The adoption of such a tolerance can be
justified as by the two following reasons:
• the nominal position of the load has been designed to coincide with the centre of the end
plates and, accordingly, with the centre of gravity of the cross section. In reality, due to small
differences in the cross-section geometry, the real centre of gravity does not coincide exactly
with the loading point;
600,00
750,00
900,00
1050,00
1200,00
1350,00
1500,00
2,00 2,50 3,00 3,50 4,00 4,50 5,00 5,50
Load
[kN
]
Axial Deformation [mm]
L 200x200x16
e0=eu=0 mme1=eu=-1,0 mme2=eu=-1,5 mme3=eu=-2,0 mme4=eu=-3,0 mme5=eu=+2,0 mm

Design of lattice towers made of large hot-rolled high strength steel angles
_______________________________________________________________________________
53 Marios-Zois BEZAS
• the positioning of the specimen in the testing rig may also induce a small and unexpected
eccentricity.
Figure 6.20 and Figure 6.21 show the axial deformations (shortening) of the specimens versus the
load for both experimental tests (solid lines) and numerical simulations (dotted lines). Table 6.6
summarizes and compares the ultimate experimental and numerical resistances. One can see from
the graphs and the table that there is a very good agreement between numerical simulations and
experimental tests in terms of axial stiffness and load carrying capacity. The mean value of the ratio
Nexp / NFEM is equal to 0,98 with a COV of 1%.
Figure 6.20: Comparison between test and FEM results for Sp1#
Figure 6.21: Comparison between test and FEM results for Sp2#
Figure 6.22 and Figure 6.23 show some characteristic load-deflections curves of the specimens for
both experimental tests and numerical simulations.
The numerical results provide similar responses for most of the specimens without nominal loading
eccentricity (same as Specimen Sp15 in Figure 6.22), as well as a good correspondence with the
tests. However, for two specimens (Sp21, Sp23), the numerical response appears to be more flexible
than the test one, at least in the initial phase of the test; but close to the failure, a rather good
agreement with the experiment is contemplated.
0,00
150,00
300,00
450,00
600,00
750,00
900,00
1050,00
0,00 1,00 2,00 3,00 4,00 5,00 6,00 7,00 8,00 9,00
Load
[kN
]
Axial Deformation [mm]
L 150x150x18Sp11
Sp11(Num)
Sp12
Sp12(Num)
Sp13
Sp13(Num)
Sp14
Sp14(Num)
Sp15
Sp15(Num)
Sp16
Sp16(Num)
0,00
200,00
400,00
600,00
800,00
1000,00
1200,00
1400,00
1600,00
1800,00
0,00 1,00 2,00 3,00 4,00 5,00 6,00 7,00 8,00 9,00
Load
[kN
]
Axial Deformation [mm]
L 200x200x16
Sp21Sp21(Num)Sp22Sp22(Num)Sp23Sp23(Num)Sp24Sp24(Num)Sp25Sp25(Num)Sp26Sp26(Num)
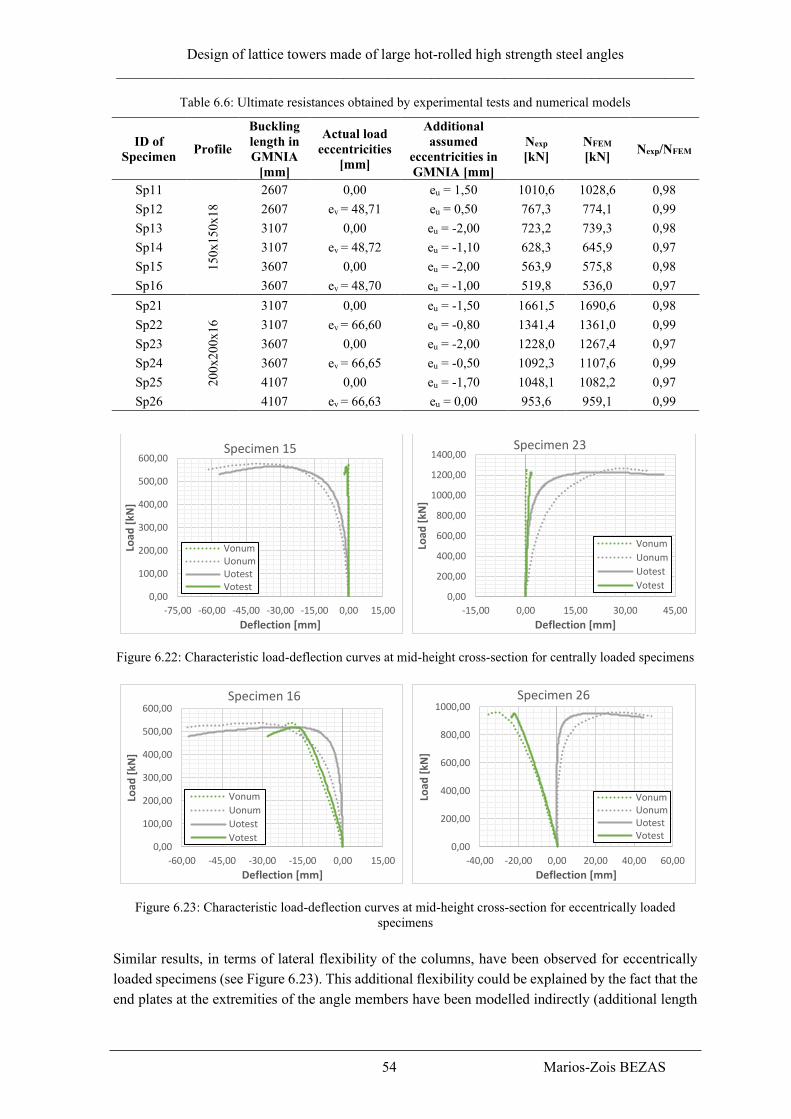
Design of lattice towers made of large hot-rolled high strength steel angles
_______________________________________________________________________________
54 Marios-Zois BEZAS
Table 6.6: Ultimate resistances obtained by experimental tests and numerical models
ID of
Specimen Profile
Buckling
length in
GMNIA
[mm]
Actual load
eccentricities
[mm]
Additional
assumed
eccentricities in
GMNIA [mm]
Nexp
[kN]
NFEM
[kN] Nexp/NFEM
Sp11
15
0x1
50x
18
2607 0,00 eu = 1,50 1010,6 1028,6 0,98
Sp12 2607 ev = 48,71 eu = 0,50 767,3 774,1 0,99
Sp13 3107 0,00 eu = -2,00 723,2 739,3 0,98
Sp14 3107 ev = 48,72 eu = -1,10 628,3 645,9 0,97
Sp15 3607 0,00 eu = -2,00 563,9 575,8 0,98
Sp16 3607 ev = 48,70 eu = -1,00 519,8 536,0 0,97
Sp21
20
0x2
00x
16
3107 0,00 eu = -1,50 1661,5 1690,6 0,98
Sp22 3107 ev = 66,60 eu = -0,80 1341,4 1361,0 0,99
Sp23 3607 0,00 eu = -2,00 1228,0 1267,4 0,97
Sp24 3607 ev = 66,65 eu = -0,50 1092,3 1107,6 0,99
Sp25 4107 0,00 eu = -1,70 1048,1 1082,2 0,97
Sp26 4107 ev = 66,63 eu = 0,00 953,6 959,1 0,99
Figure 6.22: Characteristic load-deflection curves at mid-height cross-section for centrally loaded specimens
Figure 6.23: Characteristic load-deflection curves at mid-height cross-section for eccentrically loaded
specimens
Similar results, in terms of lateral flexibility of the columns, have been observed for eccentrically
loaded specimens (see Figure 6.23). This additional flexibility could be explained by the fact that the
end plates at the extremities of the angle members have been modelled indirectly (additional length
0,00
100,00
200,00
300,00
400,00
500,00
600,00
-75,00 -60,00 -45,00 -30,00 -15,00 0,00 15,00
Load
[kN
]
Deflection [mm]
Specimen 15
VonumUonumUotestVotest
0,00
200,00
400,00
600,00
800,00
1000,00
1200,00
1400,00
-15,00 0,00 15,00 30,00 45,00
Load
[kN
]
Deflection [mm]
Specimen 23
Vonum
Uonum
Uotest
Votest
0,00
100,00
200,00
300,00
400,00
500,00
600,00
-60,00 -45,00 -30,00 -15,00 0,00 15,00
Load
[kN
]
Deflection [mm]
Specimen 16
Vonum
Uonum
Uotest
Votest0,00
200,00
400,00
600,00
800,00
1000,00
-40,00 -20,00 0,00 20,00 40,00 60,00
Load
[kN
]
Deflection [mm]
Specimen 26
VonumUonumUotestVotest
Design of lattice towers made of large hot-rolled high strength steel angles
_______________________________________________________________________________
55 Marios-Zois BEZAS
and restraints at the extremities of the member), as well as by the consideration of the unintentional
eccentricities. The prevailing of weak axis buckling near the failure load has been observed also
through the numerical simulations for the eccentrically loaded specimens.
6.5 Conclusions
The stability of columns made of large angle profiles in high strength steel and subjected to centric
and eccentric compression loads is investigated through experimental tests and numerical
simulations. The experimental campaign consists of twelve tests on columns with large angle cross-
sections (L150x150x18 and 200x200x16) made of S460 or S420 steel grade. Accompanying
numerical studies have been carried out, considering relevant geometrical imperfections as well as
geometrical and material non-linearities. From the present study, the following conclusions may be
drawn.
• The centrically loaded specimens (Sp11, Sp13, Sp15) and the eccentrically loaded specimens
(Sp22, Sp24, Sp26) failed very clearly in a pure weak axis flexural buckling mode and
correspondingly flexural torsional buckling mode.
• The centrically loaded specimens (Sp21, Sp23, Sp25) and the eccentrically loaded specimens
(Sp12, Sp14, Sp16) failed mostly in a flexural torsional buckling mode, which was more
pronounced.
• For the eccentrically loaded specimens that subjected to compression and strong axis
bending, it has been seen that at low levels of loading the deflections transverse to the strong
axis were high while they were very small in the other principal direction, but at higher load
levels, deflections transverse to the weak axis grew quickly and prevailed at failure, this is
in line with the tendency of angles to buckle along weak axis.
• Local buckling was not visibly observed in any specimen, although all Sp2# specimens are
categorised as class 4 according to the existing provisions of EN 1993-1-1; with the proposed
classification system they are also classified in class-4 for compression but in class-2 for
bending.
• A very good agreement between the numerical GMNIA simulations performed with
FINELG and the experimental results in terms of axial stiffness and ultimate resistances has
been achieved, through the consideration of an unintentional small eccentricity. Indeed, a
small eccentricity of the position of the applying load can affect the ultimate resistance of
the member in comparison with the perfect “no loading eccentricity” case. For the current
study, an eccentricity equals to 1,5 mm may reduce the ultimate resistance by about 6%. At
the end of this comparative study, it may be concluded that the FINELG is appropriate
numerical tool to predict the response of angle profiles subjected to combined axial load and
bending moments.
Design of lattice towers made of large hot-rolled high strength steel angles
_______________________________________________________________________________
56 Marios-Zois BEZAS
7. DESIGN RULES FOR MEMBERS MADE OF ANGLES
The particularities of angles explain that existing design rules for other types of sections, mostly
doubly symmetric ones, cannot safely cover angles, what inevitably leads to the need for the
development of specific design provisions for angle sections. Such specific design rules and
recommendations can be found in various parts of Eurocode 3. More specifically, EN 1993-1-1 [1]
as well as its forthcoming new version named prEN 1993-1-1 [26] provides general rules for angles,
while EN 1993-3-1[2] provides rules for the buckling resistance of angles as members in towers
when connected eccentrically with bolts on one leg. Another European specification, the CENELEC
standard EN 50341-1 [5] provides specific rules for lattice towers used in the field of overhead
electrical lines, addressing specific problems linked to such application but it also provides specific
rules for the verification of lattice towers and their constituting parts, including members made of
angles. However, all these rules are not necessarily compatible and so their validity is questionable.
In the following, formulae about the design resistance and stability of equal leg angle members are
proposed, highlighting the differences with the existing provisions of Eurocode 3. The proposed rules
were fully validated through numerical investigations and experimental tests. The extensive
numerical parametrical studies were performed by the full non-linear software ABAQUS.
Experimental results are coming from tests carried out in the framework of the thesis, as well as from
previous experimental investigations found in literature. Experimental results were also compared to
existing Eurocode 3 provisions for sake of comparison.
7.1 Design rules and recommendations
7.1.1 Buckling resistance to compression
The buckling design resistance for axial compression may be determined from:
𝑁𝑏,𝑅𝑑 = {𝜒𝑚𝑖𝑛
𝐴𝑓𝑦
𝛾𝑀1 for class 1,2 and 3 profiles
𝜒𝑚𝑖𝑛𝛢𝑒𝑓𝑓𝑓𝑦
𝛾𝑀1for class 4 profiles
(Eq. 7.1)
where Aeff is the area of the effective cross-section that equals:
𝐴𝑒𝑓𝑓 = 𝐴 − 2𝑐𝑡(1 − 𝜌) (Eq. 7.2)
The reduction factor ρ for outstand plated elements due to local buckling is given in EN 1993-1-5 as
below:
𝜌 = {1,0 for λ̅p ≤ 0,748
λ̅p−0,188
�̅�𝑝2 for λ̅p > 0,748
(Eq. 7.3)
considering the relative plate slenderness of legs equal to:
�̅�𝑝 = √𝜒𝑚𝑖𝑛
𝑐
𝑡
18,6𝜀 (Eq. 7.4)
The buckling reduction factor χmin is determined as a function of the relative slenderness 𝜆 ̅of the
compression member for the flexural buckling modes only:
𝜒𝑚𝑖𝑛 = 𝑚𝑖𝑛{𝜒𝑢; 𝜒𝑣} (Eq. 7.5)

Design of lattice towers made of large hot-rolled high strength steel angles
_______________________________________________________________________________
57 Marios-Zois BEZAS
The value of the buckling reduction factors 𝜒𝑢, 𝜒𝑣 are computed for the appropriate relative
slenderness 𝜆𝑢̅̅ ̅, 𝜆𝑣̅̅ ̅ and considering buckling curve b for steel grades S235-S420, or buckling curve
a for higher steel grades (≥ S460).
The relative slenderness 𝜆𝑢̅̅ ̅ and 𝜆𝑣̅̅ ̅ should be taken as:
𝜆𝑢 ̅̅ ̅̅ = √𝐴𝑓𝑦
𝑁𝑐𝑟,𝑢 and 𝜆𝑣 ̅̅ ̅̅ = √
𝐴𝑓𝑦
𝑁𝑐𝑟,𝑣 (Eq. 7.6)
where,
Ncr,u is the elastic critical force for the flexural buckling mode about u-u axis, based on
the gross cross-sectional properties;
Ncr,v is the elastic critical force for the flexural buckling mode about v-v axis, based on
the gross cross-sectional properties.
> Comparison with EN 1993-1-1 and prEN 1993-1-1 provisions
EN 1993-1-1 recommends the use of buckling curve b whatever is the steel grade while, in the
forthcoming new version of this normative document, prEN 1993-1-1, curve b is still used for steel
grades S235-S420 but curve a is proposed for higher steel grades (≥S460). For the purposed of the
thesis, the selection of the buckling curves follows the provisions of prEN 1993-1-1. However, both
versions recommend the use the “elastic critical load for the relevant buckling mode” for the
evaluation of the non-dimensional slenderness, i.e. the minimum eigenvalue amongst all flexural and
flexural-torsional buckling modes. As explained in §3.1, a pure torsional mode cannot be obtained
for a centrally loaded angle column. Through numerical studies on angles in compression (see §7.2.2)
considering various profiles, lengths and steel grades, it is seen that weak axis flexural buckling
always prevail at failure even for angles exhibiting a flexural-torsional elastic critical instability mode
as minimum eigenvalue. Therefore, it seems reasonable to calculate the member resistance of rolled
angles by using the slenderness for flexural buckling only and not by referring to the “relevant
buckling mode” which may include torsional effects, as EN 1993-1-1 and prEN 1993-1-1 prescribe.
Additionally, the interaction between local and global buckling are considered in the definition of
the relative plate slenderness �̅�𝑝 via the term √𝜒𝑚𝑖𝑛, unlike in EN 1993-1-1.
7.1.2 Lateral torsional buckling resistance to strong axis bending
The bending resistance of laterally unrestrained beams is determined by application of a reduction
factor, accounting for effects of lateral torsional buckling, to the relevant resistance of the same
beams assumed to be laterally restrained. It is reminded here that the bending resistance of laterally
restrained beams was derived in chapter 4, considering a linear transition between plastic and elastic
bending resistances, adopting thus the procedure for double symmetric cross-sections that was
proposed by SEMI-COMP [33].
The design buckling resistance moment Mu,Rd of a laterally unrestrained beam may accordingly be
determined from:
𝑀𝑢,𝑅𝑑 = 𝜒𝐿𝑇𝑊𝑢𝑓𝑦
𝛾𝑀1 (Eq. 7.7)
where Wu is the section modulus about the u axis equals to:
𝑊𝑢 = 𝛼𝑖,𝑢𝑊𝑒𝑙,𝑢 , i = 2, 3, 4 (Eq. 7.8)

Design of lattice towers made of large hot-rolled high strength steel angles
_______________________________________________________________________________
58 Marios-Zois BEZAS
where,
α2,u = 1,5 for class 1 or 2 (Eq. 7.9)
α3,u = [1 + (26,3𝜀−𝑐/𝑡
26,3𝜀−16𝜀) ∙ (1,5 − 1)] for class 3 (Eq. 7.10)
α4,u = Weff,u /Wel,u =ρu2 for class 4 (Eq. 7.11)
ρu is the reduction factor for plate buckling, evaluated through eq. (7.3), considering a reduced plate
slenderness of the legs equal to:
λ̅p = √𝜒𝐿𝑇
𝑐
𝑡
35,58𝜀 (Eq. 7.12)
The reduction factor for lateral torsional buckling χLT should be determined as a function of the
relative slenderness 𝜆𝐿𝑇 ̅̅ ̅̅ ̅of the member:
𝜆𝐿𝑇 ̅̅ ̅̅ ̅ = √𝑊𝑢𝑓𝑦
𝑀𝑐𝑟 (Eq. 7.13)
where the elastic critical moment for lateral-torsional buckling Mcr is given by the following equation
[7], in combination with Table 7.1:
𝛭𝑐𝑟 = 𝐶𝑏0,46∙𝐸∙ℎ2∙𝑡2
𝑙 (Eq. 7.14)
The value of the buckling reduction factor χLT for the relative slenderness 𝜆𝐿𝑇 ̅̅ ̅̅ ̅ should be derived from
buckling curve a, which can be determined using eq. (6.57) of EN 1993-1-1:§6.3.2.3(1) for lateral-
torsional buckling, using λ̅LT,0 = 0,4 and β = 1,00 (see equations below).
𝜒𝐿𝑇 =1
𝛷𝐿𝑇+√𝛷𝐿𝑇2 −�̅�𝐿𝑇
2 but {
𝜒𝐿𝑇 ≤ 1,0
𝜒𝐿𝑇 ≤ 1 �̅�𝐿𝑇2⁄
(Eq. 7.15)
𝛷𝐿𝑇 = 0,5[1 + 𝑎𝐿𝑇(�̅�𝐿𝑇 − 0,4) + �̅�𝐿𝑇2 ] (Eq. 7.16)
However, following the recommendations of EN 1993-1-1, lateral torsional buckling may be ignored
(χLT = 1,0) when one of the following conditions apply:
λ̅LT ≤ λ̅LT,0 (where λ̅LT,0 = 0,4) or 𝑀𝐸𝑑
𝑀𝑐𝑟≤ λ̅LT,0
2
Table 7.1: Determination of the Cb-factor for LTB [7]
General case:
𝐶𝑏 =12,5𝑀𝑚𝑎𝑥
2,5𝑀𝑚𝑎𝑥 + 3𝑀𝐴 + 4𝑀𝐵 + 3𝑀𝐶≤ 1,5
For linear moment distribution:
𝐶𝑏 =12,5
7,5+5𝜓 with −1 ≤ 𝜓 =
𝑀2
𝑀1 ≤ 1
> Comparison with EN 1993-1-1 and prEN 1993-1-1
The lateral torsional buckling resistance is in line with EN 1993-1-1 eq. (6.55) or prEN 1993-1-1, eq.
(8.79). However, like in flexural buckling, the interaction between local and global buckling are

Design of lattice towers made of large hot-rolled high strength steel angles
_______________________________________________________________________________
59 Marios-Zois BEZAS
considered through the relative plate slenderness �̅�𝑝 and not through the global slenderness �̅�𝐿𝑇 .
Buckling curve d is recommended by both normative documents while, a is adopted in the thesis as
a result of the validation procedure based on numerical studies (see §7.2.3).
The transition between elastic and plastic bending resistances adopts the proposals of SEMICOMP
in contrast with the existing version of Eurocode 3, but in line with the forthcoming one, at least for
doubly symmetric sections.
7.1.3 Resistance to weak axis bending
As already shown, the cross-section resistance of angles subjected to weak axis bending depend on
whether the tip is in tension or in compression, but not on the member length. Therefore, the member
resistance coincides with the cross-section resistance as provided in §5.4.
7.1.4 Buckling resistance to bending and axial compression
Following the procedures of EN 1993-1-1 and prEN 1993-1-1, two conditions for buckling around
one or the other principal axis should be satisfied for angle members subjected to compression and
biaxial bending. Torsional buckling is not checked separately but is included in the local buckling
check.
➢ strong axis check
(𝑁𝐸𝑑
𝑁𝑏𝑢,𝑅𝑑+ 𝑘𝑢𝑢
𝑀𝑢,𝐸𝑑
𝑀𝑢,𝑅𝑑)𝜉
+ 𝑘𝑢𝑣𝑀𝑣,𝐸𝑑
𝑀𝑣,𝑅𝑑≤ 1 (Eq. 7.17)
➢ weak axis check
(𝑁𝐸𝑑
𝑁𝑏𝑣,𝑅𝑑+ 𝑘𝑣𝑢
𝑀𝑢,𝐸𝑑
𝑀𝑢,𝑅𝑑)𝜉
+ 𝑘𝑣𝑣𝑀𝑣,𝐸𝑑
𝑀𝑣,𝑅𝑑≤ 1 (Eq. 7.18)
where kij are the interaction factors provided in Table 7.2;
Table 7.2: Determination of kij factors
kij factors
𝑘𝑢𝑢 =𝐶𝑢
1 −𝑁𝐸𝑑
𝑁𝑐𝑟,𝑢
𝑘𝑢𝑣 = 𝐶𝑣
𝑘𝑣𝑢 = 𝐶𝑢 𝑘𝑣𝑣 =𝐶𝑣
1 −𝑁𝐸𝑑
𝑁𝑐𝑟,𝑣
Cu= 0,6+0,4ψu Cv= 0,6+0,4ψv
-1 ≤ψu=𝑀2𝑢
𝑀1𝑢≤1 -1 ≤ψv=
𝑀2𝑣
𝑀1𝑣≤1
The ξ-factor that depends on the cross-section class, is expressing a plastic, intermediate or elastic
design and may be determined accordingly as follows: c/t ≤ 16ε: ξ = 2 (Eq. 7.19)
16ε < c/t < 26,3ε: ξ = [1 + (26,3𝜀−
𝑐
𝑡
26,3𝜀−16𝜀) ∙ (2 − 1)] (Eq. 7.20)
Design of lattice towers made of large hot-rolled high strength steel angles
_______________________________________________________________________________
60 Marios-Zois BEZAS
c/t > 26,3ε: ξ = 1 (Eq. 7.21)
> Comparison with EN 1993-1-1 and prEN 1993-1-1
The procedure exhibits similarities, but also differences with EN 1993-1-1,6.3.3 (4) and prEN 1993-
1-1, 8.3.3 (5). In both procedures there are two equations, respectively for buckling around one and
the other principal axis, the equations have three terms (one for compression, two for bending around
the principal axes), lateral torsional buckling is included in the strong axis bending term while local
buckling is included through the properties of the effective section.
In contrast, in the proposed check, the factor ξ is introduced that makes the interaction between the
three terms non-linear (as in Eurocode 3, despite they appear as linear). The quadratic term with ξ=2
tries to cover the cross-section resistance check of class-2 cross-sections as derived in Vayas et al. in
[8]. Furthermore, simpler expressions for the terms Ci and ki,j, straightforwardly derived from the
stability theory, are proposed.
7.1.5 General method for angles
The general method proposed in EN 1993-1-1 and prEN 1993-1-1 for the evaluation of the stability
of structural members or parts of structures applies to lateral and lateral torsional buckling for
structural components with mono symmetric cross-sections, built-up or not, uniform or not, with
complex support conditions or not, which are subjected to compression and/or uni-axial bending in
the plane, but which do not contain rotated plastic hinges.
The general method can be interpreted as follows, for members with equal leg angles. The out-of-
plane buckling resistance of the member is checked if the following equation satisfied:
𝜒𝑜𝑝 ·𝑎𝑢𝑙𝑡,𝑘
𝛾𝛭1≥ 1,0 (Eq. 7.22)
where,
𝜒𝑜𝑝 is the reduction factor corresponding to the non-dimensional slenderness 𝜆𝑜𝑝̅̅ ̅̅̅ and aimed at
accounting for weak axis buckling only, as it is the predominant failure mode for angles. The
selection of the buckling curve is based on prEN 1993-1-1.
𝑎𝑢𝑙𝑡,𝑘 is the minimum load factor to be applied to the design loads to reach the characteristic
resistance of the most critical cross-section of the structural component considering its in
plane behaviour without accounting for lateral or lateral torsional buckling, but accounting
for all effects due to in plane geometrical deformation and imperfections, global and local,
where relevant. It can be derived from the following equation:
1
𝛼𝑢𝑙𝑡,𝑘=𝜎𝑚𝑎𝑥
𝑓𝑦=𝜎𝑁
𝑓𝑦+𝜎𝑒0
𝑓𝑦+𝜎𝑀u
𝑓𝑦+𝜎𝑀v
𝑓𝑦 (Eq. 7.23)
in which:
➢ the first term relates to the stress under pure compression;
➢ the second, to the second order maximum stress resulting from the amplification of
the first order moment NEd·e0,EC3 (e0,EC3 is the in-plane equivalent imperfection as
defined in prEN 1993-1-1), i.e. the moment NEd·e0,EC3[1/(1-NEd/Ncr,u)];
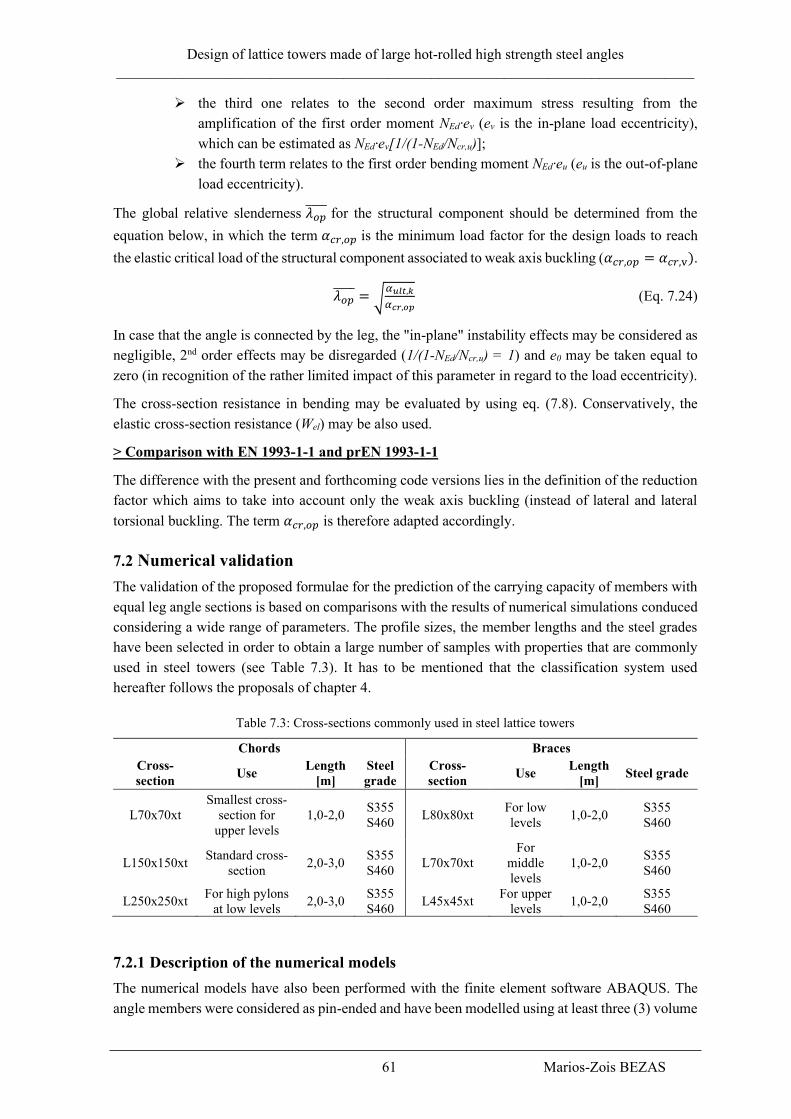
Design of lattice towers made of large hot-rolled high strength steel angles
_______________________________________________________________________________
61 Marios-Zois BEZAS
➢ the third one relates to the second order maximum stress resulting from the
amplification of the first order moment NEd·ev (ev is the in-plane load eccentricity),
which can be estimated as NEd·ev[1/(1-NEd/Ncr,u)];
➢ the fourth term relates to the first order bending moment NEd·eu (eu is the out-of-plane
load eccentricity).
The global relative slenderness 𝜆𝑜𝑝̅̅ ̅̅̅ for the structural component should be determined from the
equation below, in which the term 𝛼𝑐𝑟,𝑜𝑝 is the minimum load factor for the design loads to reach
the elastic critical load of the structural component associated to weak axis buckling (𝛼𝑐𝑟,𝑜𝑝 = 𝛼𝑐𝑟,v).
𝜆𝑜𝑝̅̅ ̅̅̅ = √𝛼𝑢𝑙𝑡,𝑘
𝛼𝑐𝑟,𝑜𝑝 (Eq. 7.24)
In case that the angle is connected by the leg, the "in-plane" instability effects may be considered as
negligible, 2nd order effects may be disregarded (1/(1-NEd/Ncr,u) = 1) and e0 may be taken equal to
zero (in recognition of the rather limited impact of this parameter in regard to the load eccentricity).
The cross-section resistance in bending may be evaluated by using eq. (7.8). Conservatively, the
elastic cross-section resistance (Wel) may be also used.
> Comparison with EN 1993-1-1 and prEN 1993-1-1
The difference with the present and forthcoming code versions lies in the definition of the reduction
factor which aims to take into account only the weak axis buckling (instead of lateral and lateral
torsional buckling. The term 𝛼𝑐𝑟,𝑜𝑝 is therefore adapted accordingly.
7.2 Numerical validation
The validation of the proposed formulae for the prediction of the carrying capacity of members with
equal leg angle sections is based on comparisons with the results of numerical simulations conduced
considering a wide range of parameters. The profile sizes, the member lengths and the steel grades
have been selected in order to obtain a large number of samples with properties that are commonly
used in steel towers (see Table 7.3). It has to be mentioned that the classification system used
hereafter follows the proposals of chapter 4.
Table 7.3: Cross-sections commonly used in steel lattice towers
Chords Braces
Cross-
section Use
Length
[m]
Steel
grade
Cross-
section Use
Length
[m] Steel grade
L70x70xt
Smallest cross-
section for
upper levels
1,0-2,0 S355
S460 L80x80xt
For low
levels 1,0-2,0
S355
S460
L150x150xt Standard cross-
section 2,0-3,0
S355
S460 L70x70xt
For
middle
levels
1,0-2,0 S355
S460
L250x250xt For high pylons
at low levels 2,0-3,0
S355
S460 L45x45xt
For upper
levels 1,0-2,0
S355
S460
7.2.1 Description of the numerical models
The numerical models have also been performed with the finite element software ABAQUS. The
angle members were considered as pin-ended and have been modelled using at least three (3) volume

Design of lattice towers made of large hot-rolled high strength steel angles
_______________________________________________________________________________
62 Marios-Zois BEZAS
elements over the leg thickness, while fictitious end plates have been introduced through a specific
constraint at the extremities. In all the numerical simulations, all the applied loads increasing
simultaneously up to failure (or at least until reaching a maximum-ultimate load). In the cases where
second order effects are significantly affecting the response, the ultimate load is defined as in §3.6.
The model is similar to the one used in the numerical studies for classification, presented in §4.1.
The finite element analyses were performed considering:
• An initial bow imperfection of magnitude approximately equal to L[mm]/1000 with a
deformation shape similar to the first member instability mode.
This value combines (i) the recommendation from the European norm EN 1090-2 [35],
which prescribes that the deviation from straightness should be Δ ≤ L[mm]/750, with (ii) the
provisions of prEN 1993-1-14 [29], which states that 80% of the geometric fabrication
tolerances given in Ref. [35] should be applied.
• Residual stresses resulting from the hot-rolling procedure as shown in Figure 6.18 .
Due to some technical difficulties to introduce residual stresses in the ABAQUS model, it has been
decided to use an equivalent imperfection e0 that will represent the effect of the combined action of
both residual stresses and initial imperfections. To calibrate the value of the equivalent imperfection
e0, some analyses have been performed with FINELG finite element software, using beam elements.
The angle members were considered as pin-ended with fictitious end plates at the extremities. The
selection of the FINELG software has been done due to its easy and automatic way of introducing
accurately residual stresses in the model. The profiles and the material and geometrical properties of
the studied samples are shown in Table 7.3.
Table 7.4: Details and results concerning the analyses to determine the equivalent imperfection e0
No Cross-Section Length
L [mm]
Steel
grade
e0 [mm]
from eq.
(7.25)
e0=L/700
[mm] Nult [kN]
Nult*
[kN]
Nult/Nult*
[-]
1 L70x70x5 1000 S355 1,34 1,42 182,41 188,45 0,97
2 L70x70x5 1000 S460 1,26 1,42 217,71 216,77 1,00
3 L70x70x5 2000 S355 2,69 2,86 64,04 64,77 0,99
4 L70x70x5 2000 S460 2,52 2,86 64,61 65,62 0,98
5 L80x80x8 2000 S355 2,74 2,86 144,31 142,03 1,02
6 L80x80x8 2000 S460 2,58 2,86 148,54 146,35 1,01
7 L150x150x13 2000 S355 2,89 2,86 1029,72 1077,83 0,96
8 L150x150x13 2000 S460 2,73 2,86 1259,42 1267,67 0,99
9 L250x250x20 2000 S355 2,87 2,86 3156,6 3236,49 0,98
10 L250x250x20 2000 S460 2,67 2,86 4005,27 3939,71 1,02
First, a full-non-linear analysis has been performed using FINELG software considering an initial
imperfection (L/1000), an elastic perfectly plastic material behaviour law, as well as residual stresses
(using the pattern shown in Figure 6.18) for each of the 10 different samples provided in Table 7.3.
Through these analyses, the ultimate resistance Nult has been predicted. By introducing this value
(Nult) in equation (7.25), a rough estimation of the equivalent imperfection e0 to be introduced in
ABAQUS can be found; a value of e0 = L/700 is fixed.
𝜎𝑚𝑎𝑥 =𝑁𝑢𝑙𝑡
𝐴+
𝑁𝑢𝑙𝑡𝑒0
(1−𝑁𝑢𝑙𝑡𝑁𝑐𝑟,𝑣
)𝑊𝑣= 𝑓𝑦 (Eq. 7.25)

Design of lattice towers made of large hot-rolled high strength steel angles
_______________________________________________________________________________
63 Marios-Zois BEZAS
Then, a second full-non-linear analysis has been performed using again FINELG software,
considering this time the equivalent imperfection (L/700) and an elastic perfectly plastic material law
for each of the 10 samples; the ultimate resistance Nult* has been recorded and reported in Table 7.4.
The mean value of the ratio Nult/Nult* is equal to 0,99 with a COV of 2,0% which seems to demonstrate
the adequacy of the adopted alternative modelling approach.
Finally, a third full-non-linear analysis, considering the equivalent imperfection (L/700), has been
performed with ABAQUS using solid elements. The mean value of the ratio Nult,abaqus/Nult is equal to
0,96 with a COV of 3,3%, which can be acceptable considering the different types of finite elements
used in the two models (beam elements in FINELG vs. solid element in ABAQUS). Therefore, the
equivalent imperfection e0 = L[mm]/700 accounting for both geometric imperfections and residual
stresses is finally used in the analyses performed with ABAQUS to validate the member resistance
formulae.
7.2.2 Members in axial compression
The profiles, lengths and steel grades have been selected from Table 7.3, but the thicknesses have
been chosen so as to have samples of different classes (class 1 and 4) but also different elastic
buckling modes as flexural or flexural-torsional. The details are summarized in Table 7.5, including
also the ratio between the elastic critical load for flexural-torsional buckling and the minimum one
obtained for flexural buckling.
Table 7.5: Details of the samples subjected to a uniform compression load
No Cross-Section L [mm] fy
[N/mm2] Class
Eigenmode
deformed shape Ncr,FT/minNcr,F [-]
1 L70x70x5 1000 355 1 Flexural 1,05
2 L70x70x5 1000 460 4 Flexural 1,05
3 L70x70x5 2000 355 1 Flexural 2,64
4 L70x70x5 2000 460 4 Flexural 2,64
5 L70x70x6 1000 355 1 Flexural 1,43
6 L70x70x6 1000 460 1 Flexural 1,43
7 L70x70x6 2000 355 1 Flexural 3,01
8 L70x70x6 2000 460 1 Flexural 3,01
9 L70x70x7 1000 355 1 Flexural 1,82
10 L70x70x7 1000 460 1 Flexural 1,82
11 L70x70x7 2000 355 1 Flexural 3,25
12 L70x70x7 2000 460 1 Flexural 3,25
13 L70x70x10 1000 355 1 Flexural 2,71
14 L70x70x10 1000 460 1 Flexural 2,71
15 L70x70x10 2000 355 1 Flexural 3,53
16 L70x70x10 2000 460 1 Flexural 3,53
17 L150x150x13 2000 355 1 Flexural 1,29
18 L150x150x13 2000 460 1 Flexural 1,29
19 L150x150x13 3000 355 1 Flexural 2,25

Design of lattice towers made of large hot-rolled high strength steel angles
_______________________________________________________________________________
64 Marios-Zois BEZAS
20 L150x150x13 3000 460 1 Flexural 2,25
21 L150x150x14 2000 355 1 Flexural 1,46
22 L150x150x14 2000 460 1 Flexural 1,46
23 L150x150x14 3000 355 1 Flexural 2,44
24 L150x150x14 3000 460 1 Flexural 2,44
25 L150x150x15 2000 355 1 Flexural 1,63
26 L150x150x15 2000 460 1 Flexural 1,63
27 L150x150x15 3000 355 1 Flexural 2,61
28 L150x150x15 3000 460 1 Flexural 2,61
29 L150x150x18 2000 355 1 Flexural 2,11
30 L150x150x18 2000 460 1 Flexural 2,11
31 L150x150x18 3000 355 1 Flexural 2,98
32 L150x150x18 3000 460 1 Flexural 2,98
33 L250x250x17 2000 355 4 Flexural-torsional 0,32
34 L250x250x17 2000 460 4 Flexural-torsional 0,32
35 L250x250x17 3000 355 4 Flexural-torsional 0,69
36 L250x250x17 3000 460 4 Flexural-torsional 0,69
37 L250x250x20 2000 355 1 Flexural-torsional 0,45
38 L250x250x20 2000 460 4 Flexural-torsional 0,45
39 L250x250x20 3000 355 1 Flexural-torsional 0,99
40 L250x250x20 3000 460 4 Flexural-torsional 0,99
41 L250x250x22 2000 355 1 Flexural-torsional 0,54
42 L250x250x22 2000 460 1 Flexural-torsional 0,54
43 L250x250x22 3000 355 1 Flexural 1,11
44 L250x250x22 3000 460 1 Flexural 1,11
45 L250x250x26 2000 355 1 Flexural-torsional 0,75
46 L250x250x26 2000 460 1 Flexural-torsional 0,75
47 L250x250x26 3000 355 1 Flexural 1,48
48 L250x250x26 3000 460 1 Flexural 1,48
The samples have been modelled as explained in §7.2.1. However, for those where the first elastic
eigenmode is a flexural-torsional one, three cases were considered in terms of initial imperfections:
a. equivalent imperfection e0,FT = L/700 with a deformation shape similar to the first member
instability mode, i.e. the flexural-torsional one (which correspond to Nult(a));
b. equivalent imperfection e0,F = L/700 with a deformation shape similar to the first flexural
instability mode (which correspond to Nult(b));
c. equivalent imperfection e0 = e0,FT + e0,F (which correspond to Nult(c)): e0,FT = L/700 with a
deformation shape similar to the first member instability mode (flexural-torsional) and e0,F
= L/700 with a deformation shape similar to the first flexural instability to counterbalance
the fact that, in most of these cases, the torsional component predominates in the flexural-
torsional mode. The combination of both modes is done automatically through the software.

Design of lattice towers made of large hot-rolled high strength steel angles
_______________________________________________________________________________
65 Marios-Zois BEZAS
Even though, in case c, there is (i) a twist of the cross-section and (ii) an initial flexural deflection a
bit higher than in case b, the difference between the values Nult(b) and Nult(c) is negligible (less than
0,5%).
Figure 7.1 illustrates the numerical results compared with the reference buckling curves a and b as
reported in prEN 1993-1-1. The buckling reduction factor χnum of the numerically tested samples has
been evaluated as χnum = Nult /Npl and the slenderness using eq. (7.6) For the samples with a flexural-
torsional eigenmode, two cases are distinguished in Figure 7.1: the numerical results reported with
blue/orange points have been evaluated using Nult = min{Nult(a), Nult(b), Nult(c)}, while the results
presented with green points using Nult = Nult(a).
Figure 7.1: Comparison of numerical results with buckling curves of prEN 1993-1-1
According to prEN 1993-1-1, the obtained numerical results for the S355 steel grade should be
compared with curve b while with curve a for S460. It can be easily observed that all the results
referred to curve b are above the curve, while the results referred to curve a are in line, above or just
a bit lower, which is acceptable given the 2% deviation that is considered. Regarding the results
obtained using only an equivalent imperfection based on the 1st eigenmode (i.e. the flexural-torsional
one), it is obvious that they are much higher even when compared with curve a. Through this
comparison, it can be easily observed that the slenderness should be calculated using only the
minimum elastic critical force for the flexural buckling mode as reported in §7.1.1.
7.2.3 Members in strong axis bending
For this load case, the profiles, lengths and steel grades have been again selected from Table 7.3,
while the thicknesses have been chosen to have samples of different classes (1 and 3). The details
are summarized in Table 7.6. As there are no hot-rolled angle profiles with S355 or S460 steel grades
that are categorized as class 4, a few analyses have been additionally considered (marked with * in
the mentioned table) with higher steel grades and member lengths so as to study some more slender
members. For each non-linear analysis, an initial imperfection of magnitude L/700 has been applied
with a deformation shape proportional to the first member instability mode to introduce a twist
imperfection at the middle cross-section (see Figure 7.2). It should also be noted that the application
of eq. (7.14) was checked numerically with satisfactory results. Indeed, the mean value of the ratio
Mcr,num /Mcr,anal is equal to 0,989 with a COV of 4%.
Figure 7.3 illustrates the numerical results compared with the buckling curves a and a0 for LTB as
they are defined in §7.1.2, eq. (7.15) and eq. (7.16). The reduction factor for lateral torsional buckling
χLT,num of the numerical samples has been evaluated by the equation χLT,num = Mult,u /Wufy and the
slenderness using eq. (7.13).
0,00
0,20
0,40
0,60
0,80
1,00
1,20
0,20 0,45 0,70 0,95 1,20 1,45 1,70 1,95 2,20 2,45
Re
du
ctio
n f
acto
r χ n
um
[-]
Non-dimensional slenderness λv [-]
curve acurve bnumerical results-S355numerical results-S460only FT imperfections

Design of lattice towers made of large hot-rolled high strength steel angles
_______________________________________________________________________________
66 Marios-Zois BEZAS
Table 7.6: Details for the samples subjected to a major axis bending moment
No Cross-Section L
[mm]
fy
[N/mm2] Class No Cross-Section
L
[mm]
fy
[N/mm2] Class
1 L 45x45x3 1000 355 1 29 L 250x250x17 2000 355 1
2 L 45x45x3 1000 460 3 30 L 250x250x17 2000 460 3
3 L 45x45x3 2000 355 1 31 L 250x250x17 3000 355 1
4 L 45x45x3 2000 460 3 32 L 250x250x17 3000 460 3
5 L70x70x5 1000 355 1 33 L 250x250x20 2000 355 1
6 L70x70x5 1000 460 1 34 L 250x250x20 2000 460 1
7 L70x70x5 2000 355 1 35 L 250x250x20 3000 355 1
8 L70x70x5 2000 460 1 36 L 250x250x20 3000 460 1
9 L70x70x6 1000 355 1 37 L 250x250x22 2000 355 1
10 L70x70x6 1000 460 1 38 L 250x250x22 2000 460 1
11 L70x70x6 2000 355 1 39 L 250x250x22 3000 355 1
12 L70x70x6 2000 460 1 40 L 250x250x22 3000 460 1
13 L 80x80x5 2000 355 1 41 L 250x250x22* 4000 355 1
14 L 80x80x5 2000 460 3 42 L 250x250x22* 4000 460 1
15 L 80x80x5 3000 355 1 43 L 250x250x22* 5000 355 1
16 L 80x80x5 3000 460 3 44 L 250x250x22* 5000 460 1
17 L150x150x13 2000 355 1 45 L 250x250x22* 4000 550 1
18 L150x150x13 2000 460 1 46 L 250x250x22* 4000 690 3
19 L150x150x13 3000 355 1 47 L 250x250x22* 5000 55 1
20 L150x150x13 3000 460 1 48 L 250x250x22* 5000 690 3
21 L150x150x14 2000 355 1 49 L 250x250x26 2000 355 1
22 L150x150x14 2000 460 1 50 L 250x250x26 2000 460 1
23 L150x150x14 3000 355 1 51 L 250x250x26 3000 355 1
24 L150x150x14 3000 460 1 52 L 250x250x26 3000 460 1
25 L150x150x15 2000 355 1
26 L150x150x15 2000 460 1
27 L150x150x15 3000 355 1
28 L150x150x15 3000 460 1
Figure 7.2: Typical shape of initial imperfection for a member subjected to strong axis bending
Figure 7.4 shows the ratio between the numerical member resistance (Mult,u) and the analytical
resistance (Mu,Rd), versus the non-dimensional slenderness. The analytical resistance has been
evaluated by using the formulas proposed in §7.1.2 and validated through the numerical results.

Design of lattice towers made of large hot-rolled high strength steel angles
_______________________________________________________________________________
67 Marios-Zois BEZAS
It is seen in Figure 7.3 that all the results are above curve a and below curve a0, and this validates the
proposed in §7.1.2 buckling curve for LTB of angle sections. However, it seems that the resistance
of some class-3 profiles is above curve a0. This could be explained by the fact that these cross-
sections are classified as class 3 but with a c/εt ratio quite close to the class-2 limit. So, they are
treated as class 3 sections while, in reality, they reach their plastic resistance. On the contrary, due to
the integration of the SEMICOMP concept, a profile classified as Class 3, but very close to Class 2,
should be characterized by a section resistance close to Mpl. To set this clear, one should have in
mind that a profile with a c/εt approximately equal to 16, could have a ratio Mult,u /Mpl from 0,95 to
1,0 (see Figure 4.5). This justifies the small increased value of the numerical results. It should be also
noticed that for higher c/εt ratios, the results conform to curve a.
Figure 7.3: Comparison of numerical results with buckling curves for LTB of EN 1993-1-1
Figure 7.4: Comparison between numerical and analytical results for the resistance of members subjected to
strong axis bending, related with the non-dimensional slenderness
7.2.4 Members in weak axis bending
The design resistance of angle cross-sections to weak axis bending Mv, either with the tip is in tension
or in compression, is independent of the member’s length. Therefore, just a few analyses have been
performed to validate the proposed formulas additionally with the analyses presented in §5.4. Again,
the profiles, lengths and steel grades have been chosen from Table 7.3, and the details are
summarized in Table 7.7.
Figure 7.5 and Figure 7.6 shows the ratio between the numerical results for the member resistance
(Mult,v) and the analytical resistance (Mv,Rd) when the tip is in compression and in tension respectively.
It can be seen that the analytical approach for the resistance of a member subjected to weak axis
0,40
0,50
0,60
0,70
0,80
0,90
1,00
1,10
0,20 0,40 0,60 0,80 1,00 1,20 1,40 1,60
Re
du
ctio
n f
acto
r χ L
T,n
um
[-]
Non-dimensional slenderness λLT [-]
numerical results (class 1)numerical results (class 3)a0a
0,96
0,98
1,00
1,02
1,04
1,06
1,08
1,10
0,20 0,40 0,60 0,80 1,00 1,20 1,40 1,60
Mu
lt,u
/Mu
,,Rd
or
χLT
,nu
m/χ
EC3
Non-dimensional slenderness λLT

Design of lattice towers made of large hot-rolled high strength steel angles
_______________________________________________________________________________
68 Marios-Zois BEZAS
bending is successfully validated when compared to the numerical results, by accepting a 2%
deviation.
Table 7.7: Details for the samples subjected to a weak axis bending moment
Tip in compression Tip in tension
No Cross-Section L
[mm]
fy
[N/mm2] Class
No Cross-Section
L
[mm]
fy
[N/mm2] Class
1 L70x70x5 1000 355 1 1 L45x45x3 1000 355 1
2 L70x70x5 1000 460 3 2 L45x45x3 1000 460 1
3 L70x70x5 2000 355 1 3 L45x45x3 2000 355 1
4 L70x70x5 2000 460 3 4 L45x45x3 2000 460 1
5 L150x150x14 2000 355 1 5 L70x70x6 1000 355 1
6 L150x150x14 2000 460 1 6 L70x70x6 1000 460 1
7 L150x150x14 3000 355 1 7 L70x70x6 2000 355 1
8 L150x150x14 3000 460 1 8 L70x70x6 2000 460 1
9 L250x250x17 2000 355 3 9 L250x250x20 2000 355 1
10 L250x250x17 2000 460 3 10 L250x250x20 2000 460 1
11 L250x250x17 3000 355 3 11 L250x250x20 3000 355 1
12 L250x250x17 3000 460 3 12 L250x250x20 3000 460 1
Figure 7.5: Comparison between numerical and analytical results for the resistance of members subjected to
weak axis bending with the tip in compression
Figure 7.6: Comparison between numerical and analytical results for the resistance of members subjected to
weak axis bending with the tip in tension
0,96
0,98
1,00
1,02
1,04
0 2 4 6 8 10 12 14
Mu
lt,v
/Mv,
Rd
No
Weak axis bending - Tip in compression
0,97
0,98
0,99
1,00
1,01
1,02
0 2 4 6 8 10 12 14
Mu
lt,v
/Mv,
Rd
No
Weak axis bending - Tip in tension
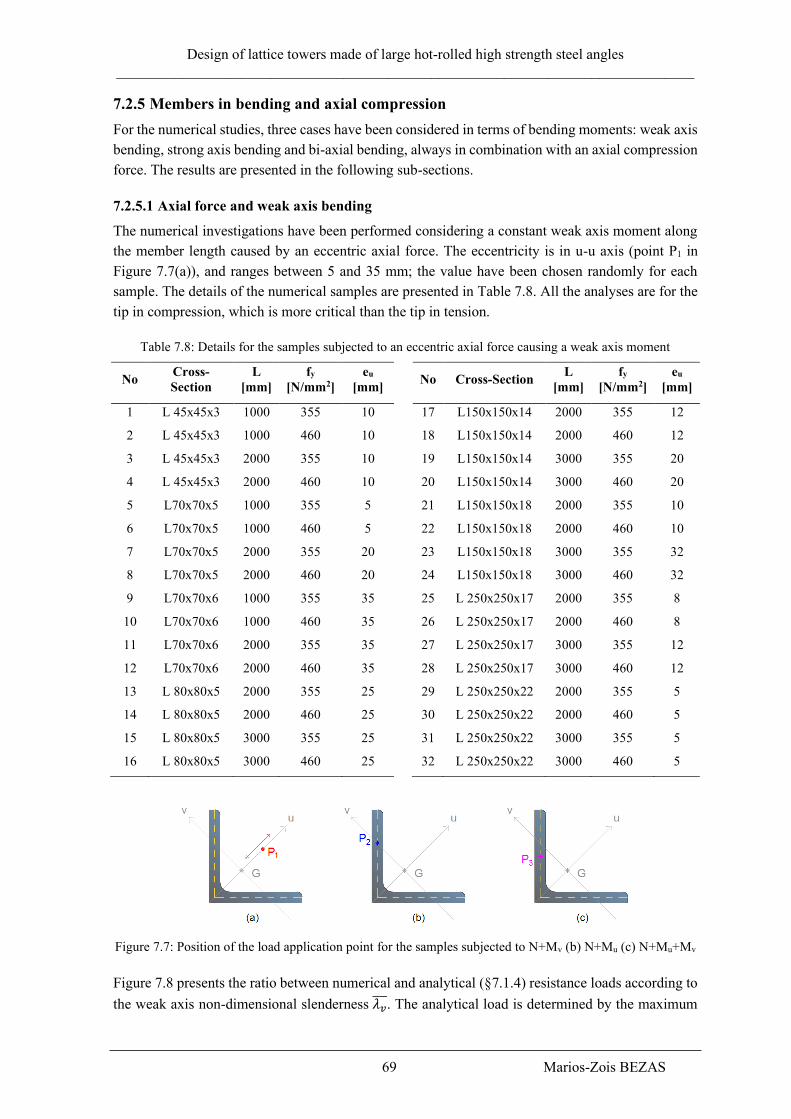
Design of lattice towers made of large hot-rolled high strength steel angles
_______________________________________________________________________________
69 Marios-Zois BEZAS
7.2.5 Members in bending and axial compression
For the numerical studies, three cases have been considered in terms of bending moments: weak axis
bending, strong axis bending and bi-axial bending, always in combination with an axial compression
force. The results are presented in the following sub-sections.
7.2.5.1 Axial force and weak axis bending
The numerical investigations have been performed considering a constant weak axis moment along
the member length caused by an eccentric axial force. The eccentricity is in u-u axis (point P1 in
Figure 7.7(a)), and ranges between 5 and 35 mm; the value have been chosen randomly for each
sample. The details of the numerical samples are presented in Table 7.8. All the analyses are for the
tip in compression, which is more critical than the tip in tension.
Table 7.8: Details for the samples subjected to an eccentric axial force causing a weak axis moment
No Cross-
Section
L
[mm]
fy
[N/mm2]
eu
[mm] No Cross-Section
L
[mm]
fy
[N/mm2]
eu
[mm]
1 L 45x45x3 1000 355 10 17 L150x150x14 2000 355 12
2 L 45x45x3 1000 460 10 18 L150x150x14 2000 460 12
3 L 45x45x3 2000 355 10 19 L150x150x14 3000 355 20
4 L 45x45x3 2000 460 10 20 L150x150x14 3000 460 20
5 L70x70x5 1000 355 5 21 L150x150x18 2000 355 10
6 L70x70x5 1000 460 5 22 L150x150x18 2000 460 10
7 L70x70x5 2000 355 20 23 L150x150x18 3000 355 32
8 L70x70x5 2000 460 20 24 L150x150x18 3000 460 32
9 L70x70x6 1000 355 35 25 L 250x250x17 2000 355 8
10 L70x70x6 1000 460 35 26 L 250x250x17 2000 460 8
11 L70x70x6 2000 355 35 27 L 250x250x17 3000 355 12
12 L70x70x6 2000 460 35 28 L 250x250x17 3000 460 12
13 L 80x80x5 2000 355 25 29 L 250x250x22 2000 355 5
14 L 80x80x5 2000 460 25 30 L 250x250x22 2000 460 5
15 L 80x80x5 3000 355 25 31 L 250x250x22 3000 355 5
16 L 80x80x5 3000 460 25 32 L 250x250x22 3000 460 5
Figure 7.7: Position of the load application point for the samples subjected to N+Mv (b) N+Mu (c) N+Mu+Mv
Figure 7.8 presents the ratio between numerical and analytical (§7.1.4) resistance loads according to
the weak axis non-dimensional slenderness 𝜆𝑣̅̅ ̅. The analytical load is determined by the maximum
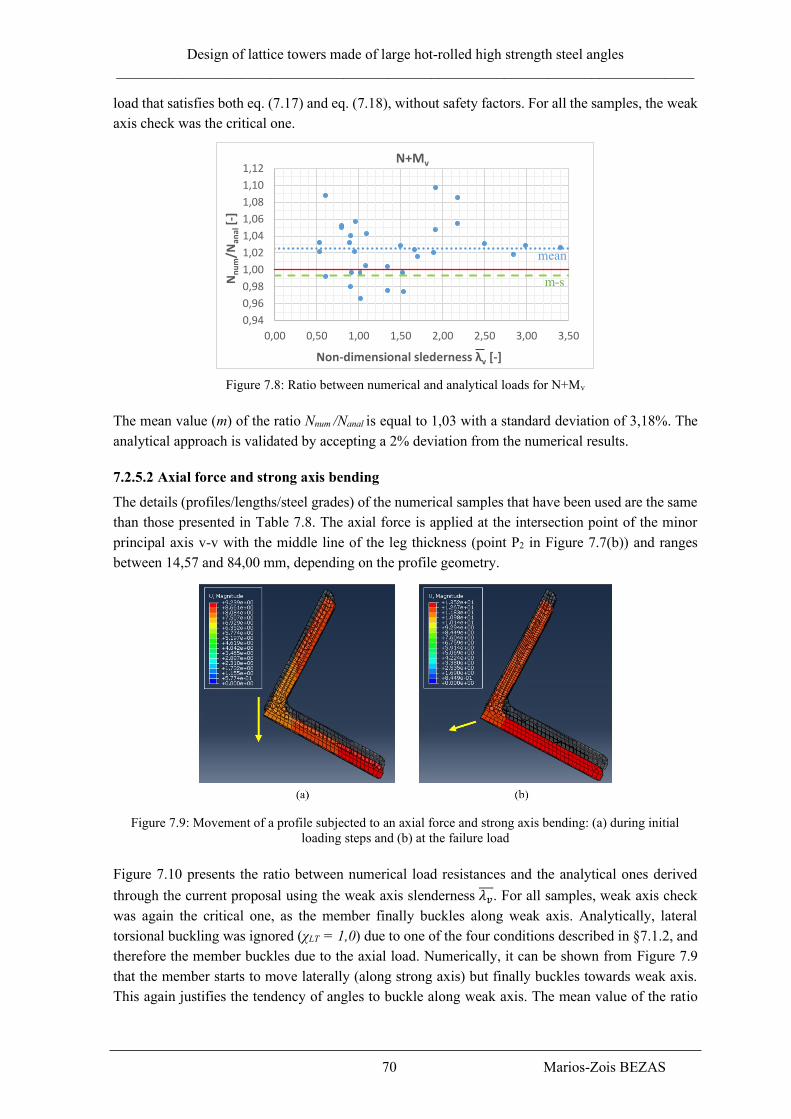
Design of lattice towers made of large hot-rolled high strength steel angles
_______________________________________________________________________________
70 Marios-Zois BEZAS
load that satisfies both eq. (7.17) and eq. (7.18), without safety factors. For all the samples, the weak
axis check was the critical one.
Figure 7.8: Ratio between numerical and analytical loads for N+Mv
The mean value (m) of the ratio Nnum /Nanal is equal to 1,03 with a standard deviation of 3,18%. The
analytical approach is validated by accepting a 2% deviation from the numerical results.
7.2.5.2 Axial force and strong axis bending
The details (profiles/lengths/steel grades) of the numerical samples that have been used are the same
than those presented in Table 7.8. The axial force is applied at the intersection point of the minor
principal axis v-v with the middle line of the leg thickness (point P2 in Figure 7.7(b)) and ranges
between 14,57 and 84,00 mm, depending on the profile geometry.
Figure 7.9: Movement of a profile subjected to an axial force and strong axis bending: (a) during initial
loading steps and (b) at the failure load
Figure 7.10 presents the ratio between numerical load resistances and the analytical ones derived
through the current proposal using the weak axis slenderness 𝜆𝑣̅̅ ̅. For all samples, weak axis check
was again the critical one, as the member finally buckles along weak axis. Analytically, lateral
torsional buckling was ignored (χLT = 1,0) due to one of the four conditions described in §7.1.2, and
therefore the member buckles due to the axial load. Numerically, it can be shown from Figure 7.9
that the member starts to move laterally (along strong axis) but finally buckles towards weak axis.
This again justifies the tendency of angles to buckle along weak axis. The mean value of the ratio
0,94
0,96
0,98
1,00
1,02
1,04
1,06
1,08
1,10
1,12
0,00 0,50 1,00 1,50 2,00 2,50 3,00 3,50
Nn
um
/Nan
al[-
]
Non-dimensional slederness λv [-]
N+Mv
m-s
mean
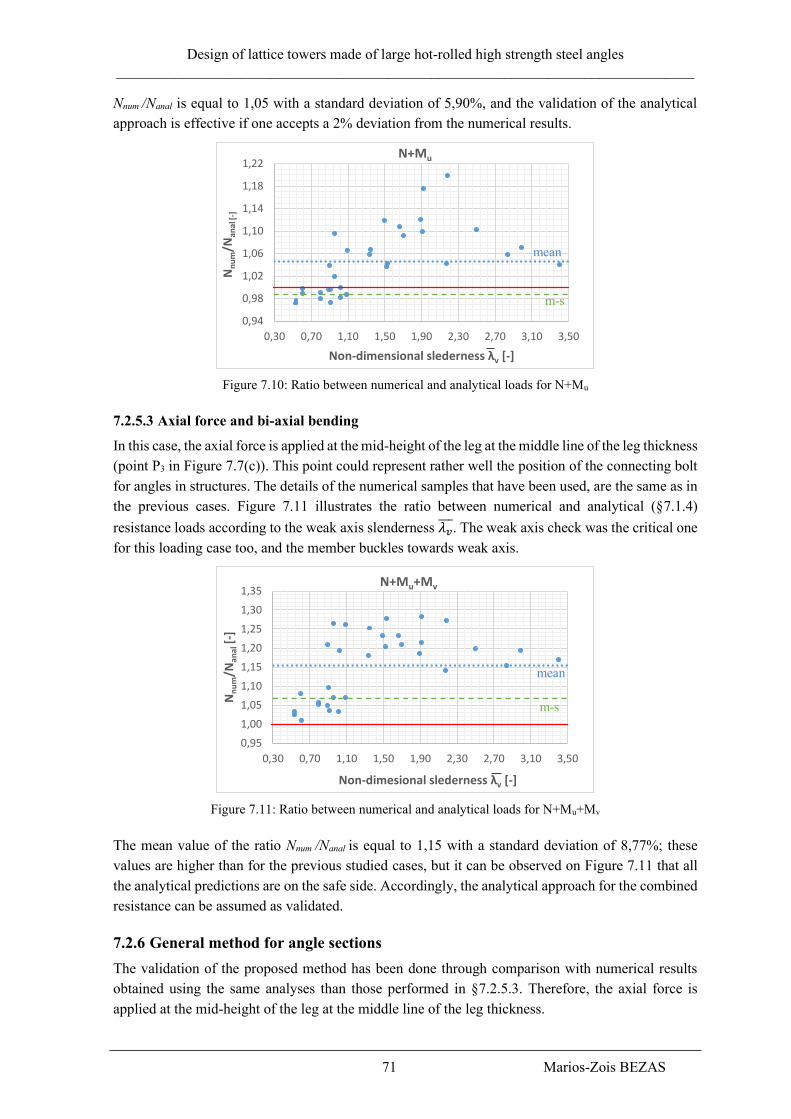
Design of lattice towers made of large hot-rolled high strength steel angles
_______________________________________________________________________________
71 Marios-Zois BEZAS
Nnum /Nanal is equal to 1,05 with a standard deviation of 5,90%, and the validation of the analytical
approach is effective if one accepts a 2% deviation from the numerical results.
Figure 7.10: Ratio between numerical and analytical loads for N+Mu
7.2.5.3 Axial force and bi-axial bending
In this case, the axial force is applied at the mid-height of the leg at the middle line of the leg thickness
(point P3 in Figure 7.7(c)). This point could represent rather well the position of the connecting bolt
for angles in structures. The details of the numerical samples that have been used, are the same as in
the previous cases. Figure 7.11 illustrates the ratio between numerical and analytical (§7.1.4)
resistance loads according to the weak axis slenderness 𝜆𝑣̅̅ ̅. The weak axis check was the critical one
for this loading case too, and the member buckles towards weak axis.
Figure 7.11: Ratio between numerical and analytical loads for N+Mu+Mv
The mean value of the ratio Nnum /Nanal is equal to 1,15 with a standard deviation of 8,77%; these
values are higher than for the previous studied cases, but it can be observed on Figure 7.11 that all
the analytical predictions are on the safe side. Accordingly, the analytical approach for the combined
resistance can be assumed as validated.
7.2.6 General method for angle sections
The validation of the proposed method has been done through comparison with numerical results
obtained using the same analyses than those performed in §7.2.5.3. Therefore, the axial force is
applied at the mid-height of the leg at the middle line of the leg thickness.
0,94
0,98
1,02
1,06
1,10
1,14
1,18
1,22
0,30 0,70 1,10 1,50 1,90 2,30 2,70 3,10 3,50
Nn
um
/Nan
al [-
]
Non-dimensional slederness λv [-]
N+Mu
mean
m-s
0,95
1,00
1,05
1,10
1,15
1,20
1,25
1,30
1,35
0,30 0,70 1,10 1,50 1,90 2,30 2,70 3,10 3,50
Nn
um
/Nan
al[-
]
Non-dimesional slederness λv [-]
N+Mu+Mv
mean
m-s
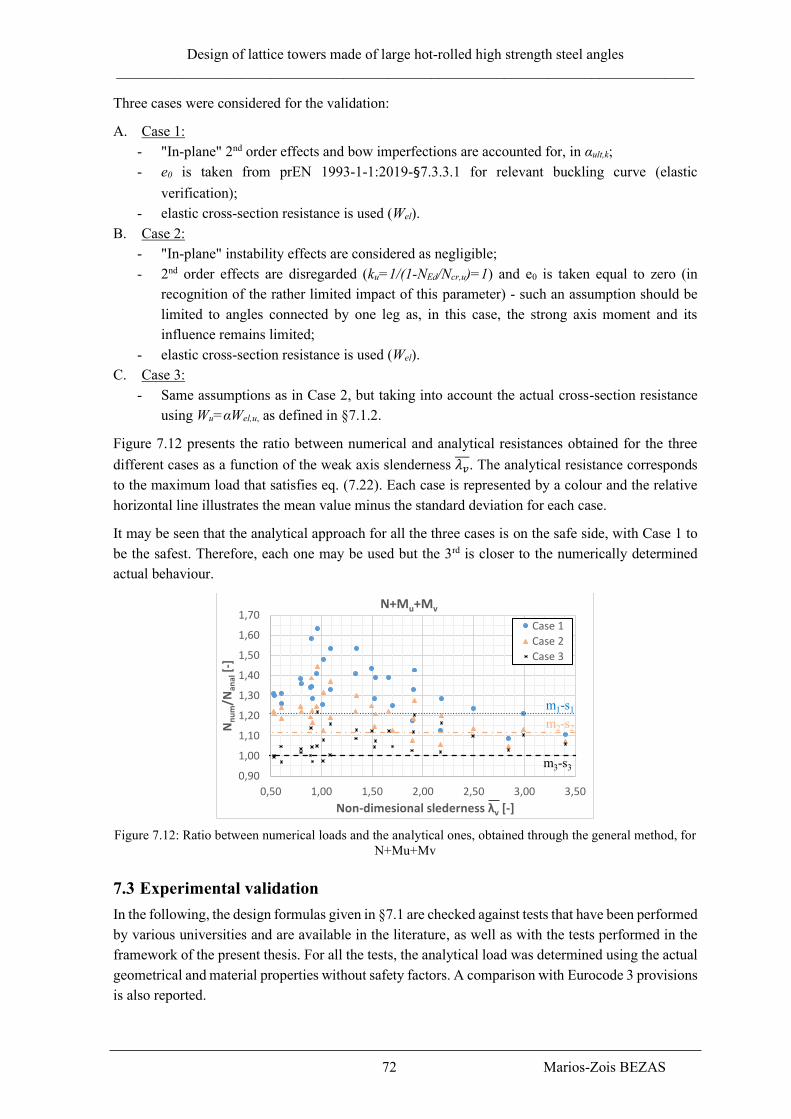
Design of lattice towers made of large hot-rolled high strength steel angles
_______________________________________________________________________________
72 Marios-Zois BEZAS
Three cases were considered for the validation:
A. Case 1:
- "In-plane" 2nd order effects and bow imperfections are accounted for, in αult,k;
- e0 is taken from prEN 1993-1-1:2019-§7.3.3.1 for relevant buckling curve (elastic
verification);
- elastic cross-section resistance is used (Wel).
B. Case 2:
- "In-plane" instability effects are considered as negligible;
- 2nd order effects are disregarded (ku=1/(1-NEd/Ncr,u)=1) and e0 is taken equal to zero (in
recognition of the rather limited impact of this parameter) - such an assumption should be
limited to angles connected by one leg as, in this case, the strong axis moment and its
influence remains limited;
- elastic cross-section resistance is used (Wel).
C. Case 3:
- Same assumptions as in Case 2, but taking into account the actual cross-section resistance
using Wu=αWel,u, as defined in §7.1.2.
Figure 7.12 presents the ratio between numerical and analytical resistances obtained for the three
different cases as a function of the weak axis slenderness 𝜆𝑣̅̅ ̅. The analytical resistance corresponds
to the maximum load that satisfies eq. (7.22). Each case is represented by a colour and the relative
horizontal line illustrates the mean value minus the standard deviation for each case.
It may be seen that the analytical approach for all the three cases is on the safe side, with Case 1 to
be the safest. Therefore, each one may be used but the 3rd is closer to the numerically determined
actual behaviour.
Figure 7.12: Ratio between numerical loads and the analytical ones, obtained through the general method, for
N+Mu+Mv
7.3 Experimental validation
In the following, the design formulas given in §7.1 are checked against tests that have been performed
by various universities and are available in the literature, as well as with the tests performed in the
framework of the present thesis. For all the tests, the analytical load was determined using the actual
geometrical and material properties without safety factors. A comparison with Eurocode 3 provisions
is also reported.
0,90
1,00
1,10
1,20
1,30
1,40
1,50
1,60
1,70
0,50 1,00 1,50 2,00 2,50 3,00 3,50
Nn
um
/Nan
al[-
]
Non-dimesional slederness λv [-]
N+Mu+Mv
Case 1
Case 2
Case 3
m1-s1
m2-s2
m3-s3
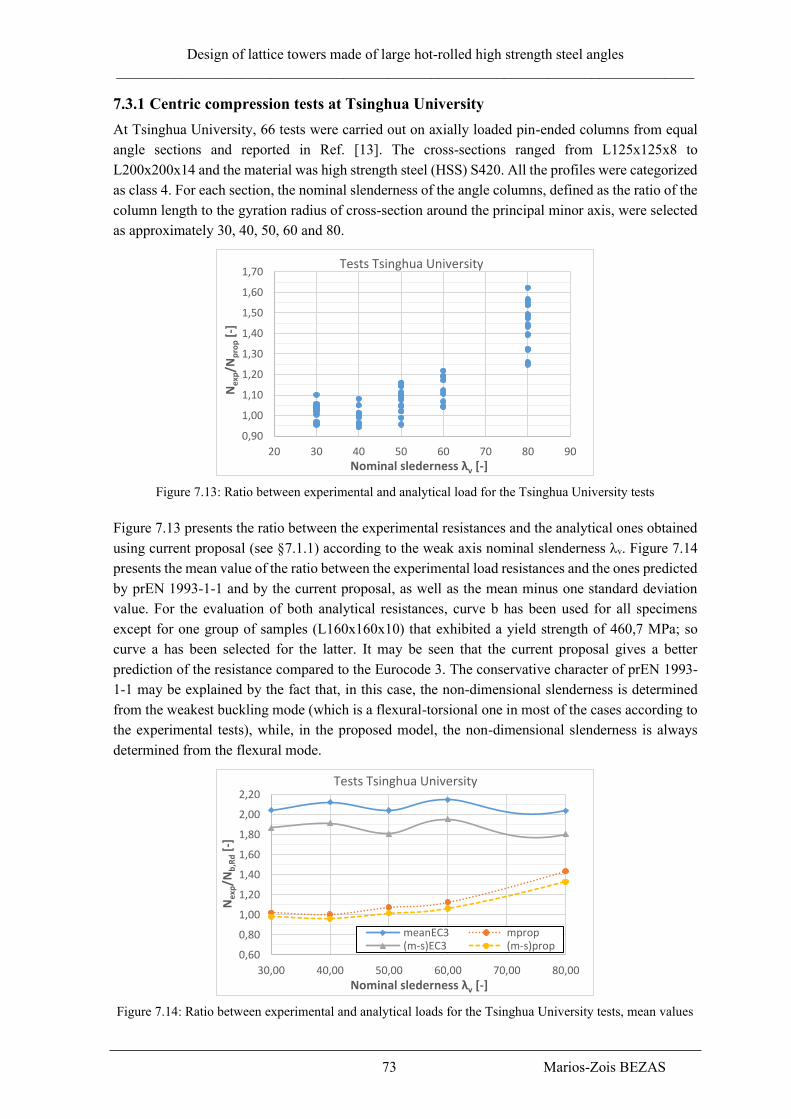
Design of lattice towers made of large hot-rolled high strength steel angles
_______________________________________________________________________________
73 Marios-Zois BEZAS
7.3.1 Centric compression tests at Tsinghua University
At Tsinghua University, 66 tests were carried out on axially loaded pin-ended columns from equal
angle sections and reported in Ref. [13]. The cross-sections ranged from L125x125x8 to
L200x200x14 and the material was high strength steel (HSS) S420. All the profiles were categorized
as class 4. For each section, the nominal slenderness of the angle columns, defined as the ratio of the
column length to the gyration radius of cross-section around the principal minor axis, were selected
as approximately 30, 40, 50, 60 and 80.
Figure 7.13: Ratio between experimental and analytical load for the Tsinghua University tests
Figure 7.13 presents the ratio between the experimental resistances and the analytical ones obtained
using current proposal (see §7.1.1) according to the weak axis nominal slenderness λv. Figure 7.14
presents the mean value of the ratio between the experimental load resistances and the ones predicted
by prEN 1993-1-1 and by the current proposal, as well as the mean minus one standard deviation
value. For the evaluation of both analytical resistances, curve b has been used for all specimens
except for one group of samples (L160x160x10) that exhibited a yield strength of 460,7 MPa; so
curve a has been selected for the latter. It may be seen that the current proposal gives a better
prediction of the resistance compared to the Eurocode 3. The conservative character of prEN 1993-
1-1 may be explained by the fact that, in this case, the non-dimensional slenderness is determined
from the weakest buckling mode (which is a flexural-torsional one in most of the cases according to
the experimental tests), while, in the proposed model, the non-dimensional slenderness is always
determined from the flexural mode.
Figure 7.14: Ratio between experimental and analytical loads for the Tsinghua University tests, mean values
0,90
1,00
1,10
1,20
1,30
1,40
1,50
1,60
1,70
20 30 40 50 60 70 80 90
Ne
xp/N
pro
p[-
]
Nominal slederness λv [-]
Tests Tsinghua University
0,60
0,80
1,00
1,20
1,40
1,60
1,80
2,00
2,20
30,00 40,00 50,00 60,00 70,00 80,00
Nex
p/N
b,R
d[-
]
Nominal slederness λv [-]
Tests Tsinghua University
meanEC3 mprop(m-s)EC3 (m-s)prop
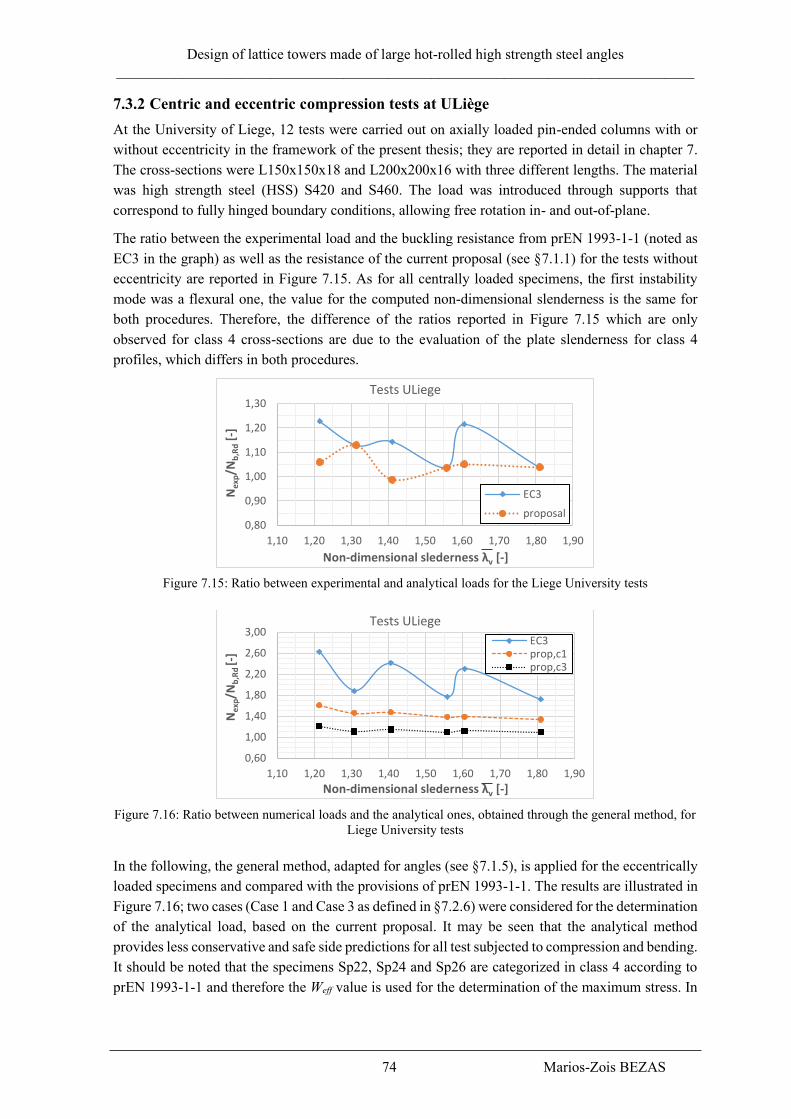
Design of lattice towers made of large hot-rolled high strength steel angles
_______________________________________________________________________________
74 Marios-Zois BEZAS
7.3.2 Centric and eccentric compression tests at ULiège
At the University of Liege, 12 tests were carried out on axially loaded pin-ended columns with or
without eccentricity in the framework of the present thesis; they are reported in detail in chapter 7.
The cross-sections were L150x150x18 and L200x200x16 with three different lengths. The material
was high strength steel (HSS) S420 and S460. The load was introduced through supports that
correspond to fully hinged boundary conditions, allowing free rotation in- and out-of-plane.
The ratio between the experimental load and the buckling resistance from prEN 1993-1-1 (noted as
EC3 in the graph) as well as the resistance of the current proposal (see §7.1.1) for the tests without
eccentricity are reported in Figure 7.15. As for all centrally loaded specimens, the first instability
mode was a flexural one, the value for the computed non-dimensional slenderness is the same for
both procedures. Therefore, the difference of the ratios reported in Figure 7.15 which are only
observed for class 4 cross-sections are due to the evaluation of the plate slenderness for class 4
profiles, which differs in both procedures.
Figure 7.15: Ratio between experimental and analytical loads for the Liege University tests
Figure 7.16: Ratio between numerical loads and the analytical ones, obtained through the general method, for
Liege University tests
In the following, the general method, adapted for angles (see §7.1.5), is applied for the eccentrically
loaded specimens and compared with the provisions of prEN 1993-1-1. The results are illustrated in
Figure 7.16; two cases (Case 1 and Case 3 as defined in §7.2.6) were considered for the determination
of the analytical load, based on the current proposal. It may be seen that the analytical method
provides less conservative and safe side predictions for all test subjected to compression and bending.
It should be noted that the specimens Sp22, Sp24 and Sp26 are categorized in class 4 according to
prEN 1993-1-1 and therefore the Weff value is used for the determination of the maximum stress. In
0,80
0,90
1,00
1,10
1,20
1,30
1,10 1,20 1,30 1,40 1,50 1,60 1,70 1,80 1,90
Nex
p/N
b,R
d[-
]
Non-dimensional slederness λv [-]
Tests ULiege
EC3
proposal
0,60
1,00
1,40
1,80
2,20
2,60
3,00
1,10 1,20 1,30 1,40 1,50 1,60 1,70 1,80 1,90
Nex
p/N
b,R
d [-
]
Non-dimensional slederness λv [-]
Tests ULiege
EC3prop,c1prop,c3
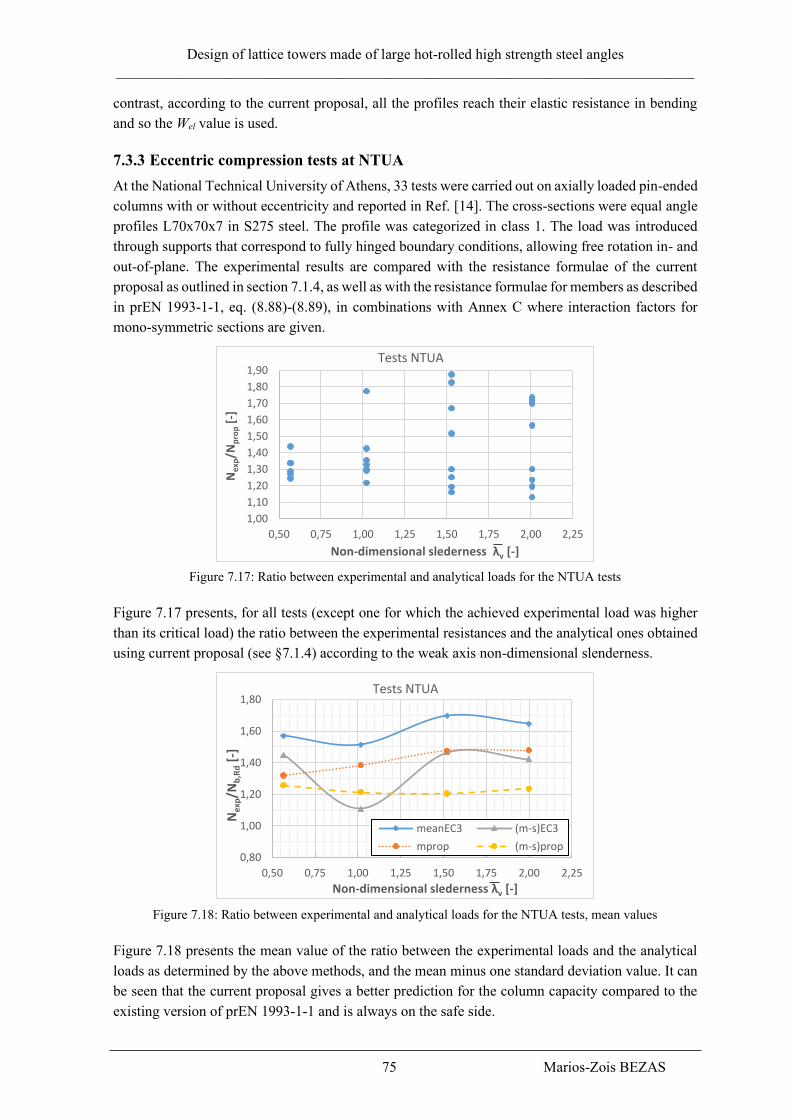
Design of lattice towers made of large hot-rolled high strength steel angles
_______________________________________________________________________________
75 Marios-Zois BEZAS
contrast, according to the current proposal, all the profiles reach their elastic resistance in bending
and so the Wel value is used.
7.3.3 Eccentric compression tests at NTUA
At the National Technical University of Athens, 33 tests were carried out on axially loaded pin-ended
columns with or without eccentricity and reported in Ref. [14]. The cross-sections were equal angle
profiles L70x70x7 in S275 steel. The profile was categorized in class 1. The load was introduced
through supports that correspond to fully hinged boundary conditions, allowing free rotation in- and
out-of-plane. The experimental results are compared with the resistance formulae of the current
proposal as outlined in section 7.1.4, as well as with the resistance formulae for members as described
in prEN 1993-1-1, eq. (8.88)-(8.89), in combinations with Annex C where interaction factors for
mono-symmetric sections are given.
Figure 7.17: Ratio between experimental and analytical loads for the NTUA tests
Figure 7.17 presents, for all tests (except one for which the achieved experimental load was higher
than its critical load) the ratio between the experimental resistances and the analytical ones obtained
using current proposal (see §7.1.4) according to the weak axis non-dimensional slenderness.
Figure 7.18: Ratio between experimental and analytical loads for the NTUA tests, mean values
Figure 7.18 presents the mean value of the ratio between the experimental loads and the analytical
loads as determined by the above methods, and the mean minus one standard deviation value. It can
be seen that the current proposal gives a better prediction for the column capacity compared to the
existing version of prEN 1993-1-1 and is always on the safe side.
1,00
1,10
1,20
1,30
1,40
1,50
1,60
1,70
1,80
1,90
0,50 0,75 1,00 1,25 1,50 1,75 2,00 2,25
Nex
p/N
pro
p[-
]
Non-dimensional slederness λv [-]
Tests NTUA
0,80
1,00
1,20
1,40
1,60
1,80
0,50 0,75 1,00 1,25 1,50 1,75 2,00 2,25
Nex
p/N
b,R
d[-
]
Non-dimensional slederness λv [-]
Tests NTUA
meanEC3 (m-s)EC3
mprop (m-s)prop

Design of lattice towers made of large hot-rolled high strength steel angles
_______________________________________________________________________________
76 Marios-Zois BEZAS
7.3.4 Eccentric compression tests at TU Graz
At the Technical University of Graz, 27 compression tests were carried out and reported in Ref. [11]
on equal angle sections: 24 on L80x80x8 and 3 on L120x120x12 profiles. The material was S275.
The boundary conditions varied from clamped supports (series BC1), to knife supports allowing
rotation in the loading plane (series BC2) and fully hinged support allowing free rotation in- and out-
of-plane (series BC3). The load was introduced to the profile through one leg by a bolted connection;
the introduction point is the centre of the hole for connection with one bolt, or the centre between the
two holes for connection with two bolts.
For this experimental campaign, the member capacity was calculated firstly by the proposed method,
checking the angle profile to compression and biaxial bending that results from the loading
eccentricity. The buckling length was set equal to the system length Lsys, for all cases except for
support conditions BC1 with connection by two bolts, where the buckling length was set equal to
Lsys/2.
The results of the current proposal are compared with the provisions of EN 1993-3-1 and not the
ones of prEN 1993-1-1 as before, so as to account for the effect of the bolted connection. In this case,
the member is checked to compression through an effective slenderness that takes into account both
the eccentric loading and the end restraints brought by the bolted connection. Buckling is checked in
respect to the weak (v) and geometric (y) axes. The relevant effective slenderness is determined from
the following equations:
�̅�𝑒𝑓𝑓,𝑣 = 0,35 + 0,7 ∙ �̅�𝑣 (Eq. 7.26)
�̅�𝑒𝑓𝑓,𝑦 = {0,40 + 0,7 ∙ �̅�𝑦 for connection with 2 bolts
0,58 + 0,7 ∙ �̅�𝑦 for connection with 1 bolt (Eq. 7.27)
The design resistance, where χ = min{χv, χy}, may be obtained as follows:
𝑁𝑏,𝑅𝑑 = {
𝜒𝐴𝑓𝑦
𝛾𝑀1for connection with 2 bolts
0,8 ·𝜒𝐴𝑓𝑦
𝛾𝑀1for connection with 1 bolt
(Eq. 7.28)
The member resistance is the lowest between the resistances according to the v- and y-axes.
Figure 7.19: Ratio between experimental and analytical loads for the TU Graz tests with two bolts
0,00
0,50
1,00
1,50
2,00
2,50
3,00
3,50
4,00
4,50
5,00
0,40 0,80 1,20 1,60 2,00 2,40
Nex
p/N
b,R
d [-
]
Non-dimensional slederness λv [-]
Tests TU Graz - 2 bolts
PROPOSAL
EC3
m-s PROPOSAL
m-s EC3

Design of lattice towers made of large hot-rolled high strength steel angles
_______________________________________________________________________________
77 Marios-Zois BEZAS
Figure 7.20: Ratio between experimental and analytical loads for the TU Graz tests with one bolt
Figure 7.19 and Figure 7.20 illustrate the ratio between the experimental and the analytical loads for
connection with two bolts and one bolt respectively and provide the mean minus one standard
deviation value for all tests. It may be seen that the EN 1993-3-1 method largely overestimates the
angle capacities and is on the unsafe side. The conclusion of the authors in Ref. [11] is therefore
confirmed who recommends, in absence of appropriate design formulae, to design through a 2nd order
system analysis accounting for member imperfections. In contrast, the proposed method provides
safe predictions for all tests with two bolts, and all but 3 tests with one bolt. Consequently, further
investigations are still required to better account for the effect of the connections at the extremities
of the angle; this could be a perspective for future research.
7.3.5 Eccentric compression tests at TUBraunschweig
At the Technical University of Braunschweig, 40 compression tests were carried out and reported in
Ref. [15] on equal leg angle L50x50x5 profiles. The specimen lengths were 300, 600, 900, 1200 and
1500 mm, while the material was S355. The end support conditions were defined as clamped and
hinged, and the load was introduced through one bolt M12.
Figure 7.21 presents, for all tests, the ratio between the experimental resistances and the analytical
ones obtained using current proposal (see §7.1.4) according to the weak axis non-dimensional
slenderness 𝜆𝑣̅̅ ̅.
Figure 7.21: Ratio between experimental and analytical loads for the TU Braunschweig tests
0,40
0,60
0,80
1,00
1,20
1,40
1,60
0,00 0,40 0,80 1,20 1,60 2,00 2,40 2,80
Ne
xp/N
b,R
d [-
]
Non-dimesional slederness λv [-]
Tests TU Graz - 1 bolt
proposalEC3m-s PROPOSALm-s EC3
0,90
1,00
1,10
1,20
1,30
1,40
1,50
1,60
1,70
0,40 0,80 1,20 1,60 2,00 2,40
Nex
p/N
pro
p[-
]
Non-dimensional slederness λv [-]
Tests TU Braunschweig
HingedClamped
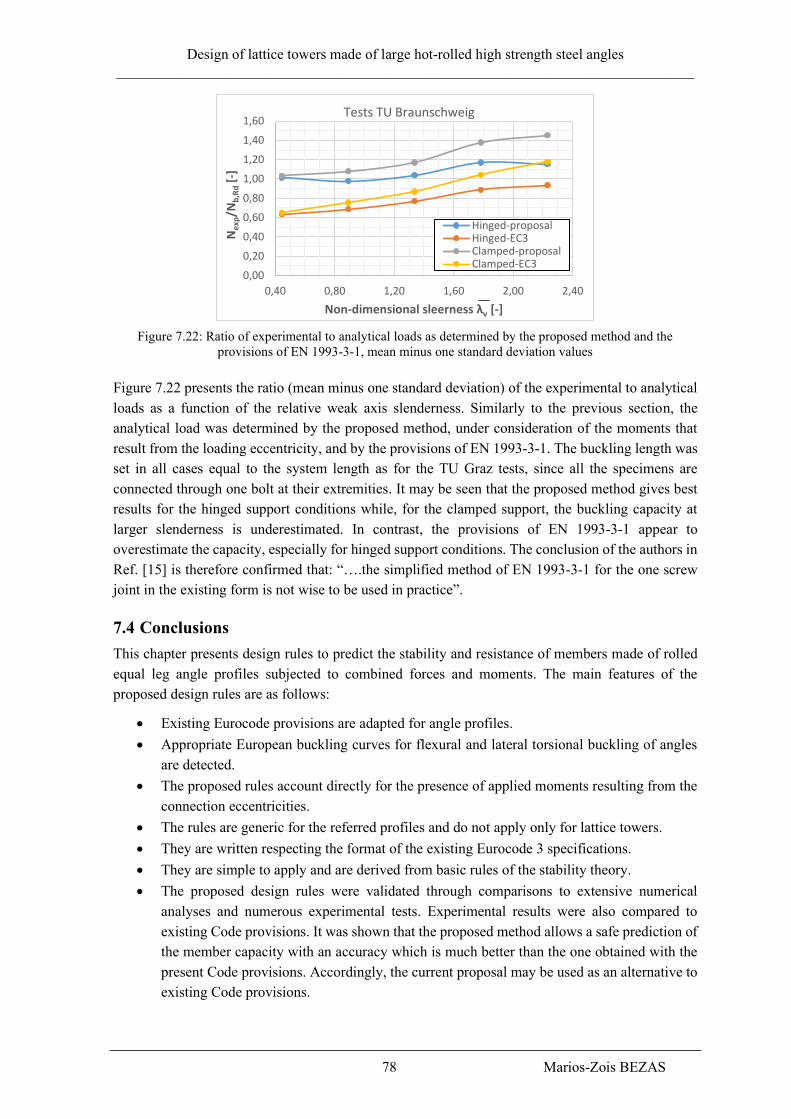
Design of lattice towers made of large hot-rolled high strength steel angles
_______________________________________________________________________________
78 Marios-Zois BEZAS
Figure 7.22: Ratio of experimental to analytical loads as determined by the proposed method and the
provisions of EN 1993-3-1, mean minus one standard deviation values
Figure 7.22 presents the ratio (mean minus one standard deviation) of the experimental to analytical
loads as a function of the relative weak axis slenderness. Similarly to the previous section, the
analytical load was determined by the proposed method, under consideration of the moments that
result from the loading eccentricity, and by the provisions of EN 1993-3-1. The buckling length was
set in all cases equal to the system length as for the TU Graz tests, since all the specimens are
connected through one bolt at their extremities. It may be seen that the proposed method gives best
results for the hinged support conditions while, for the clamped support, the buckling capacity at
larger slenderness is underestimated. In contrast, the provisions of EN 1993-3-1 appear to
overestimate the capacity, especially for hinged support conditions. The conclusion of the authors in
Ref. [15] is therefore confirmed that: “….the simplified method of EN 1993-3-1 for the one screw
joint in the existing form is not wise to be used in practice”.
7.4 Conclusions
This chapter presents design rules to predict the stability and resistance of members made of rolled
equal leg angle profiles subjected to combined forces and moments. The main features of the
proposed design rules are as follows:
• Existing Eurocode provisions are adapted for angle profiles.
• Appropriate European buckling curves for flexural and lateral torsional buckling of angles
are detected.
• The proposed rules account directly for the presence of applied moments resulting from the
connection eccentricities.
• The rules are generic for the referred profiles and do not apply only for lattice towers.
• They are written respecting the format of the existing Eurocode 3 specifications.
• They are simple to apply and are derived from basic rules of the stability theory.
• The proposed design rules were validated through comparisons to extensive numerical
analyses and numerous experimental tests. Experimental results were also compared to
existing Code provisions. It was shown that the proposed method allows a safe prediction of
the member capacity with an accuracy which is much better than the one obtained with the
present Code provisions. Accordingly, the current proposal may be used as an alternative to
existing Code provisions.
0,00
0,20
0,40
0,60
0,80
1,00
1,20
1,40
1,60
0,40 0,80 1,20 1,60 2,00 2,40
Ne
xp/N
b,R
d[-
]
Non-dimensional sleerness λv [-]
Tests TU Braunschweig
Hinged-proposalHinged-EC3Clamped-proposalClamped-EC3
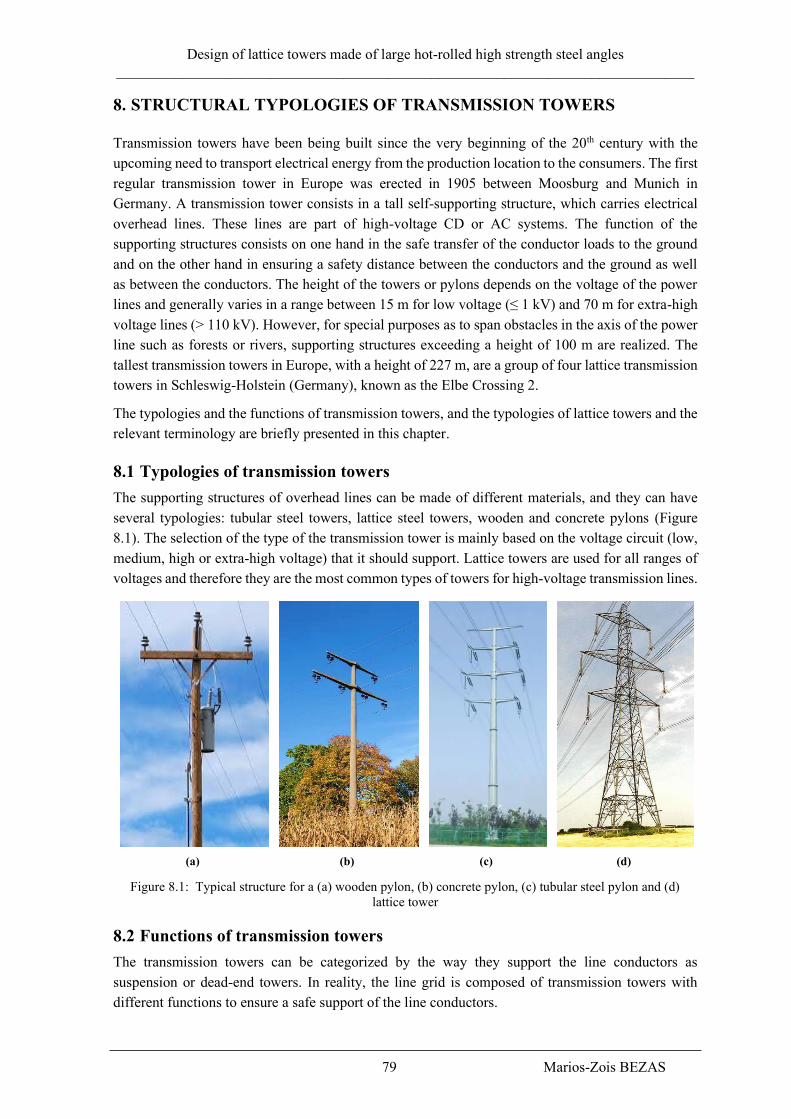
Design of lattice towers made of large hot-rolled high strength steel angles
_______________________________________________________________________________
79 Marios-Zois BEZAS
8. STRUCTURAL TYPOLOGIES OF TRANSMISSION TOWERS
Transmission towers have been being built since the very beginning of the 20th century with the
upcoming need to transport electrical energy from the production location to the consumers. The first
regular transmission tower in Europe was erected in 1905 between Moosburg and Munich in
Germany. A transmission tower consists in a tall self-supporting structure, which carries electrical
overhead lines. These lines are part of high-voltage CD or AC systems. The function of the
supporting structures consists on one hand in the safe transfer of the conductor loads to the ground
and on the other hand in ensuring a safety distance between the conductors and the ground as well
as between the conductors. The height of the towers or pylons depends on the voltage of the power
lines and generally varies in a range between 15 m for low voltage (≤ 1 kV) and 70 m for extra-high
voltage lines (> 110 kV). However, for special purposes as to span obstacles in the axis of the power
line such as forests or rivers, supporting structures exceeding a height of 100 m are realized. The
tallest transmission towers in Europe, with a height of 227 m, are a group of four lattice transmission
towers in Schleswig-Holstein (Germany), known as the Elbe Crossing 2.
The typologies and the functions of transmission towers, and the typologies of lattice towers and the
relevant terminology are briefly presented in this chapter.
8.1 Typologies of transmission towers
The supporting structures of overhead lines can be made of different materials, and they can have
several typologies: tubular steel towers, lattice steel towers, wooden and concrete pylons (Figure
8.1). The selection of the type of the transmission tower is mainly based on the voltage circuit (low,
medium, high or extra-high voltage) that it should support. Lattice towers are used for all ranges of
voltages and therefore they are the most common types of towers for high-voltage transmission lines.
(a) (b) (c) (d)
Figure 8.1: Typical structure for a (a) wooden pylon, (b) concrete pylon, (c) tubular steel pylon and (d)
lattice tower
8.2 Functions of transmission towers
The transmission towers can be categorized by the way they support the line conductors as
suspension or dead-end towers. In reality, the line grid is composed of transmission towers with
different functions to ensure a safe support of the line conductors.
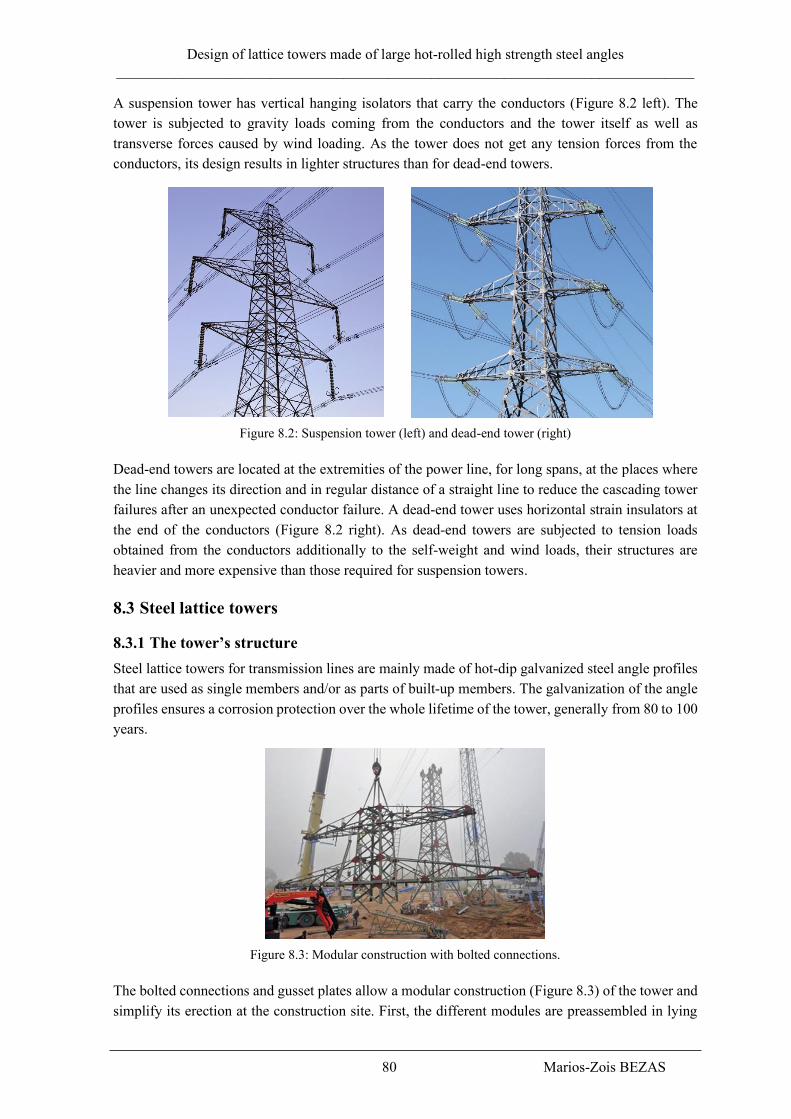
Design of lattice towers made of large hot-rolled high strength steel angles
_______________________________________________________________________________
80 Marios-Zois BEZAS
A suspension tower has vertical hanging isolators that carry the conductors (Figure 8.2 left). The
tower is subjected to gravity loads coming from the conductors and the tower itself as well as
transverse forces caused by wind loading. As the tower does not get any tension forces from the
conductors, its design results in lighter structures than for dead-end towers.
Figure 8.2: Suspension tower (left) and dead-end tower (right)
Dead-end towers are located at the extremities of the power line, for long spans, at the places where
the line changes its direction and in regular distance of a straight line to reduce the cascading tower
failures after an unexpected conductor failure. A dead-end tower uses horizontal strain insulators at
the end of the conductors (Figure 8.2 right). As dead-end towers are subjected to tension loads
obtained from the conductors additionally to the self-weight and wind loads, their structures are
heavier and more expensive than those required for suspension towers.
8.3 Steel lattice towers
8.3.1 The tower’s structure
Steel lattice towers for transmission lines are mainly made of hot-dip galvanized steel angle profiles
that are used as single members and/or as parts of built-up members. The galvanization of the angle
profiles ensures a corrosion protection over the whole lifetime of the tower, generally from 80 to 100
years.
Figure 8.3: Modular construction with bolted connections.
The bolted connections and gusset plates allow a modular construction (Figure 8.3) of the tower and
simplify its erection at the construction site. First, the different modules are preassembled in lying

Design of lattice towers made of large hot-rolled high strength steel angles
_______________________________________________________________________________
81 Marios-Zois BEZAS
position, then lifted with a crane and finally bolted by assembly operators. Alternatively, the whole
tower can be mounted in lying position and then be raised by cable pull. This operation requires a
big assembling area, and it is therefore only rarely applied. In mountains area, the different modules
are often placed by helicopter since the mounting area is too confined for cranes. Welded connections
are not used in lattice towers, as they would complicate its erection.
In general, the tower structure can be subdivided into four main parts which are described in detail
below.
(α) The tower body
The body is the main structure of the tower. It is consisted, in general, of 4 leg members connected
together through a primary and a secondary bracing system in the vertical and horizontal plane
(Figure 8.4).
Figure 8.4: Tower body with description of the different elements
The legs, made of single equal leg angle profiles or built-up ones in star-battened configuration, run
from the foundations to the top of the tower. They mainly transfer the self-weight of the structure
and therefore the profile size continuously decreases from the lower to the upper modules. Over the
height, the tower body is subdivided into several modules/segments, which are connected between
their leg profiles by bolted splices. This allows a reduction of the delivery length of the leg profiles
and a modular mounting of the tower.
The primary bracing system is constituted of diagonals often made of single equal or unequal angle
profiles and built-up angle profiles in a back-to-back configuration. It reduces the buckling length of
the legs and helps stabilizing the framework structure (e.g. triangulation) of the tower. It also transfers
the horizontal forces coming from the wind forces acting on the tower body. The secondary bracing
members are also redundant members; they are used to reduce the unsupported length of the main
legs and of primary bracing members, so increasing their buckling stability. In addition, they increase
the stiffness of the tower structure. They are commonly made of small equal or unequal angle
profiles. The type of primary and secondary vertical bracing systems depends on the loads and on
the tower’s height, and commonly varies over the height of the tower. Different layouts are given in
Figure 8.5. For standard tower geometries as used in Europe, the K-bracing and X-bracing are usually
applied for the bottom and the second section of the tower respectively. The upper modules are often

Design of lattice towers made of large hot-rolled high strength steel angles
_______________________________________________________________________________
82 Marios-Zois BEZAS
braced by a crossing diagonal system. The advantage of the crossing diagonal system is that the
compression diagonal is stabilized by the tension one, as the lateral displacement of the latter is
avoided.
Figure 8.5: Different primary and secondary vertical bracing systems as illustrated in EN 1993-3-1
Between two modules the tower is usually stiffened by a horizontal bracing system (Figure 8.6), also
called diaphragm bracing. This system takes the horizontal forces from wind loading on the tower
and transfers it to the legs. In addition, the horizontal bracing system absorbs the torsional moments
generated by an accidental unbalanced loading on the structure (e.g. rupture of one conductor).
Figure 8.6: Common horizontal bracing systems as illustrated in EN 1993-3-1
Figure 8.7: Cross arms of a lattice tower
(β) The cross arms
The cross arms (Figure 8.7) support the insulators and the conductors of the power line and transfer
their loads to the tower body. Depending on the type of tower, one, two or even more than three cross
arms on the left and right sides of the tower are necessary. The length of the cross arms depends on

Design of lattice towers made of large hot-rolled high strength steel angles
_______________________________________________________________________________
83 Marios-Zois BEZAS
the type of tower and operating voltage. For high voltage circuits, the clearance between the
conductors must be increased and the cross arms become longer. For instance, if the three phases of
a 380-kV circuit are installed on one single cross arm, the length of the cross arm is about 22 m. This
leads to a total width of the transmission tower of approximately 45 m.
The cross arm is constituted of a top and bottom angle member, each being connected by bolts to the
tower legs. These members are braced by a vertical and horizontal system of angle profiles. The size
of the angle profiles strongly depends on the tower type and the conductor loads.
(γ) The earth wire support
The earth wire support is the top module of a transmission tower which carries the earth wire. The
main role of the earth wire is the protection against lightning, and in some cases when it is made of
an optical fibre, is also used as an information transmitter.
The usual heights of the support, where the legs taper, vary between 5,0 m and 8,0 m in function of
the tower height and operating voltage of the line. The legs are commonly braced by a single lattice
staggered systems of small single angle profiles.
(δ) The foundations
The foundation of the tower depends on the form of the tower, the loading, the type of the soil and
the available space. The types which are mainly used in practice are strip or step foundations, pile or
driven pipe pile foundations (Figure 8.8). The legs are anchored by friction or by separate elements
into the concrete. The elements are usually sticking angles made of common angle profiles.
8.3.2 Typologies of lattice towers
Depending on the terrain typology, different lattice tower structures are used to overcome the several
obstacles (e.g. forests, rivers, railways, etc) encountered along the grid. Different typologies of lattice
towers are currently used all over the world. The typology differs between the continents and the
corresponding operating voltage of the power lines. In this section, on overview of the different types
of lattice towers used on the European market is given. The different configurations are illustrated in
Figure 8.9 and described below:
(a) Anchor portal tower
Anchor portal towers are gantry structures supporting the conductor in a switchyard. The internal
cross arms are supported by at least two tower bodies. The structure of anchor portal towers is adapted
to the high tensions forces in the conductors that need to be anchored in the switchyard. Anchor
Figure 8.8: Step foundation of a lattice tower
Design of lattice towers made of large hot-rolled high strength steel angles
_______________________________________________________________________________
84 Marios-Zois BEZAS
portal towers are also used to span over railways as they are less sensitive to vibrations than cross
span structures.
(b) Delta tower
In a Delta tower, the cross arm is supported by a V-shaped fork, which offers space for a conductor
in the centre line of the tower. They are commonly used to support one single circuit (i.e. 3 phases).
The delta tower is widely spread in the US, Canada, France, Spain and Italy. The name originates
from the fact that the fork with the cross arm resembles the shape of an inverted Delta.
(c) Fir tree tower
A fir tree tower belongs to the three plane tower typologies. It has three cross arms arranged in three
planes on two sides of the tower body. The lower cross arm is longer than the one in the middle,
which is again longer than the upper cross arm. This form is reminiscent of a fir tree. The tower
generally carries two circuits whereupon the conductors of each circuit are supported on each side of
the cross arms. Fir tree towers are tall and the span of the cross arms is reduced. For a 380-kV circuit
for instance, the standard height is about 60 m and the span of the cross arm is approximately 20 m.
The required width of the protection strip (i.e. the strip of land set aside for a safety corridor distance
between the power line and nearby structures and vegetation and which is used to construct, maintain
or repair the power line) is only 50 m compared to 70 m or 120 m of other tower typologies.
Therefore, fire tree towers are mainly erected in areas where the distance of the conductors to the
soil is increased and where the width of the protection strip needs to be small (e.g. forests).
(d) Single plane tower
Single plane towers only have one single cross arm and carry one or two circuits. The phases are
supported by the cross arm on the two sides of the tower body. The Single Plane tower is used in
areas with reduced height prescription like airports. The disadvantage of the tower typology is the
wide span of the cross arm (e.g. 40 m) which results in a wide protection strip (e.g. 120 m) and
therefore in a huge environmental intervention.
(e) Danube tower
The Danube tower is the most widely spread tower typology in Europe for 220-kV and 380-kV
circuits. The tower has two cross arms arranged in two planes. The lower cross arm is usually longer
then the upper one. In general, they support two circuits whose phases are ordered in a triangular
shape. The upper cross arm carries one phase while the lower one carries two phases.
(f) Barrel tower
Barrel towers have a similar typology than Fir Tree towers. They have three cross arms in three
planes and they commonly carry two circuits. The median cross arm is longer than the lower and
upper cross arms and each cross arm supports 2 phases on each side of the tower body. As for Fir
Tree towers, Barrel towers are tall with a reduced span of the cross arms, and they are applied in
areas where big heights and reduced protection strips widths are required (e.g. forests). It is the
standard tower typology in the UK National Grid.

Design of lattice towers made of large hot-rolled high strength steel angles
_______________________________________________________________________________
85 Marios-Zois BEZAS
(a) Anchor portal tower
(b) Delta tower with one circuit
(c) Fir tree tower
(d) Single plane towers at the airport of Karlsruhe,
Germany
(e) Danube tower
(f) Barrel tower
Figure 8.9: Different typologies of transmission towers
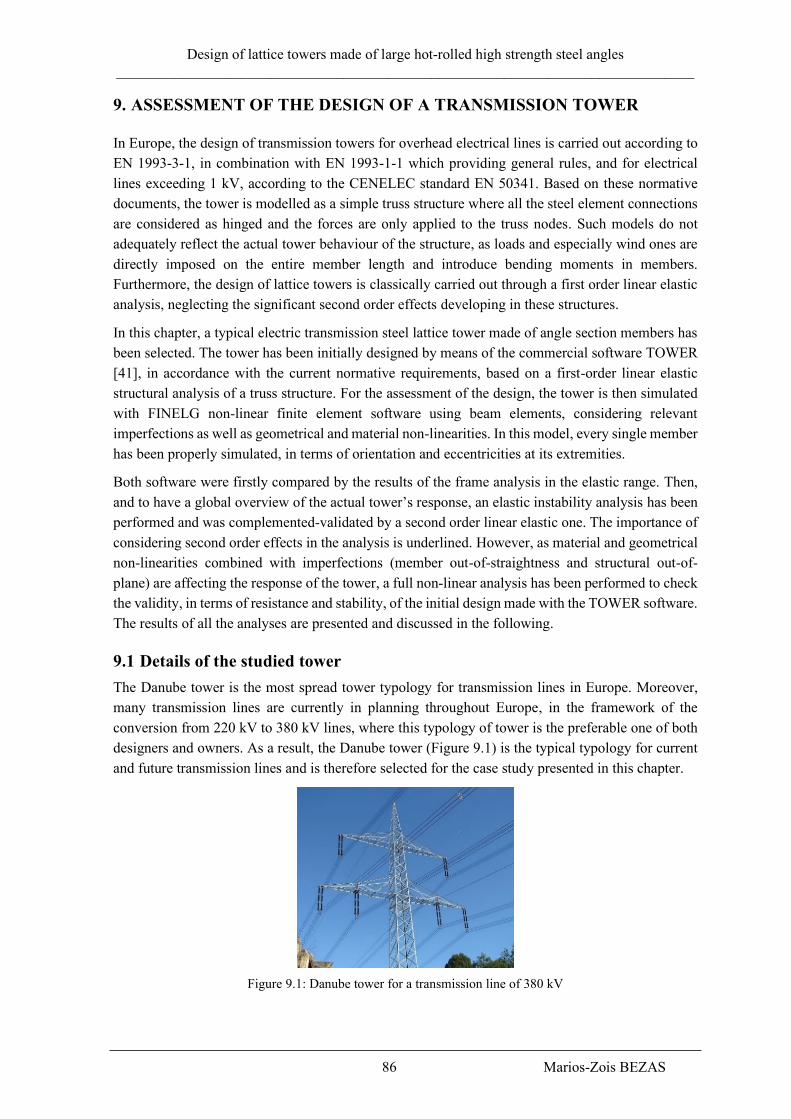
Design of lattice towers made of large hot-rolled high strength steel angles
_______________________________________________________________________________
86 Marios-Zois BEZAS
9. ASSESSMENT OF THE DESIGN OF A TRANSMISSION TOWER
In Europe, the design of transmission towers for overhead electrical lines is carried out according to
EN 1993-3-1, in combination with EN 1993-1-1 which providing general rules, and for electrical
lines exceeding 1 kV, according to the CENELEC standard EN 50341. Based on these normative
documents, the tower is modelled as a simple truss structure where all the steel element connections
are considered as hinged and the forces are only applied to the truss nodes. Such models do not
adequately reflect the actual tower behaviour of the structure, as loads and especially wind ones are
directly imposed on the entire member length and introduce bending moments in members.
Furthermore, the design of lattice towers is classically carried out through a first order linear elastic
analysis, neglecting the significant second order effects developing in these structures.
In this chapter, a typical electric transmission steel lattice tower made of angle section members has
been selected. The tower has been initially designed by means of the commercial software TOWER
[41], in accordance with the current normative requirements, based on a first-order linear elastic
structural analysis of a truss structure. For the assessment of the design, the tower is then simulated
with FINELG non-linear finite element software using beam elements, considering relevant
imperfections as well as geometrical and material non-linearities. In this model, every single member
has been properly simulated, in terms of orientation and eccentricities at its extremities.
Both software were firstly compared by the results of the frame analysis in the elastic range. Then,
and to have a global overview of the actual tower’s response, an elastic instability analysis has been
performed and was complemented-validated by a second order linear elastic one. The importance of
considering second order effects in the analysis is underlined. However, as material and geometrical
non-linearities combined with imperfections (member out-of-straightness and structural out-of-
plane) are affecting the response of the tower, a full non-linear analysis has been performed to check
the validity, in terms of resistance and stability, of the initial design made with the TOWER software.
The results of all the analyses are presented and discussed in the following.
9.1 Details of the studied tower
The Danube tower is the most spread tower typology for transmission lines in Europe. Moreover,
many transmission lines are currently in planning throughout Europe, in the framework of the
conversion from 220 kV to 380 kV lines, where this typology of tower is the preferable one of both
designers and owners. As a result, the Danube tower (Figure 9.1) is the typical typology for current
and future transmission lines and is therefore selected for the case study presented in this chapter.
Figure 9.1: Danube tower for a transmission line of 380 kV
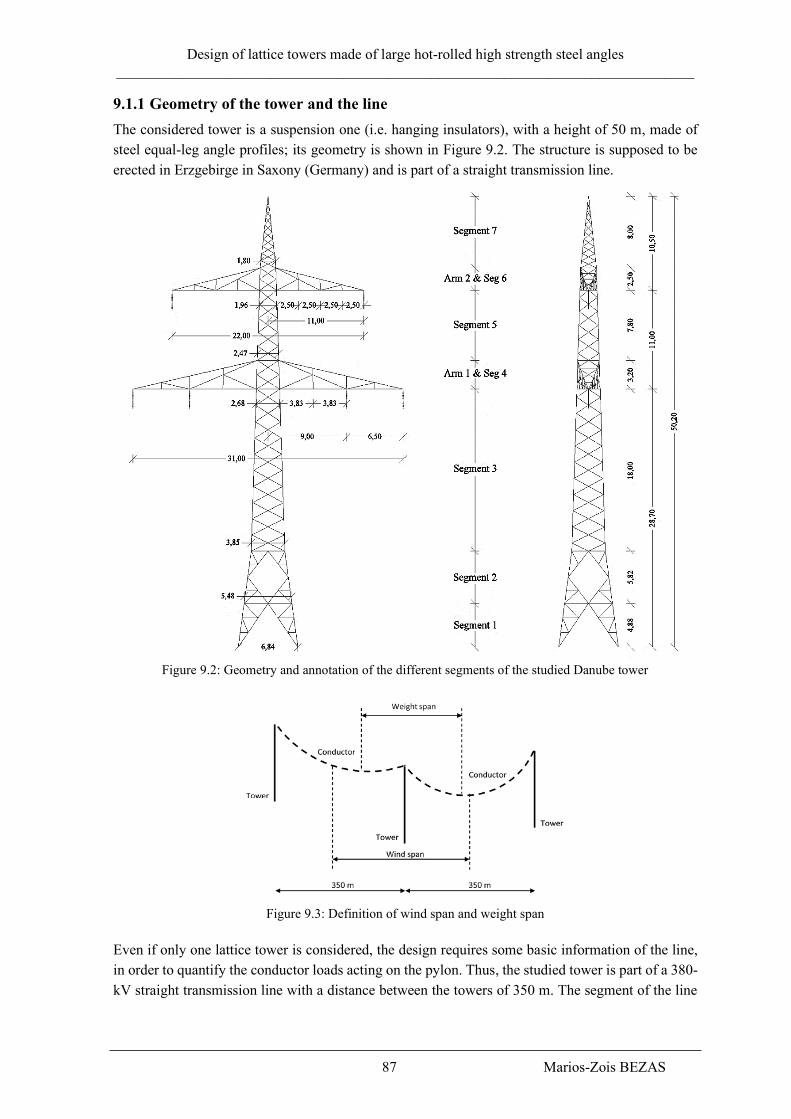
Design of lattice towers made of large hot-rolled high strength steel angles
_______________________________________________________________________________
87 Marios-Zois BEZAS
9.1.1 Geometry of the tower and the line
The considered tower is a suspension one (i.e. hanging insulators), with a height of 50 m, made of
steel equal-leg angle profiles; its geometry is shown in Figure 9.2. The structure is supposed to be
erected in Erzgebirge in Saxony (Germany) and is part of a straight transmission line.
Figure 9.2: Geometry and annotation of the different segments of the studied Danube tower
Figure 9.3: Definition of wind span and weight span
Even if only one lattice tower is considered, the design requires some basic information of the line,
in order to quantify the conductor loads acting on the pylon. Thus, the studied tower is part of a 380-
kV straight transmission line with a distance between the towers of 350 m. The segment of the line
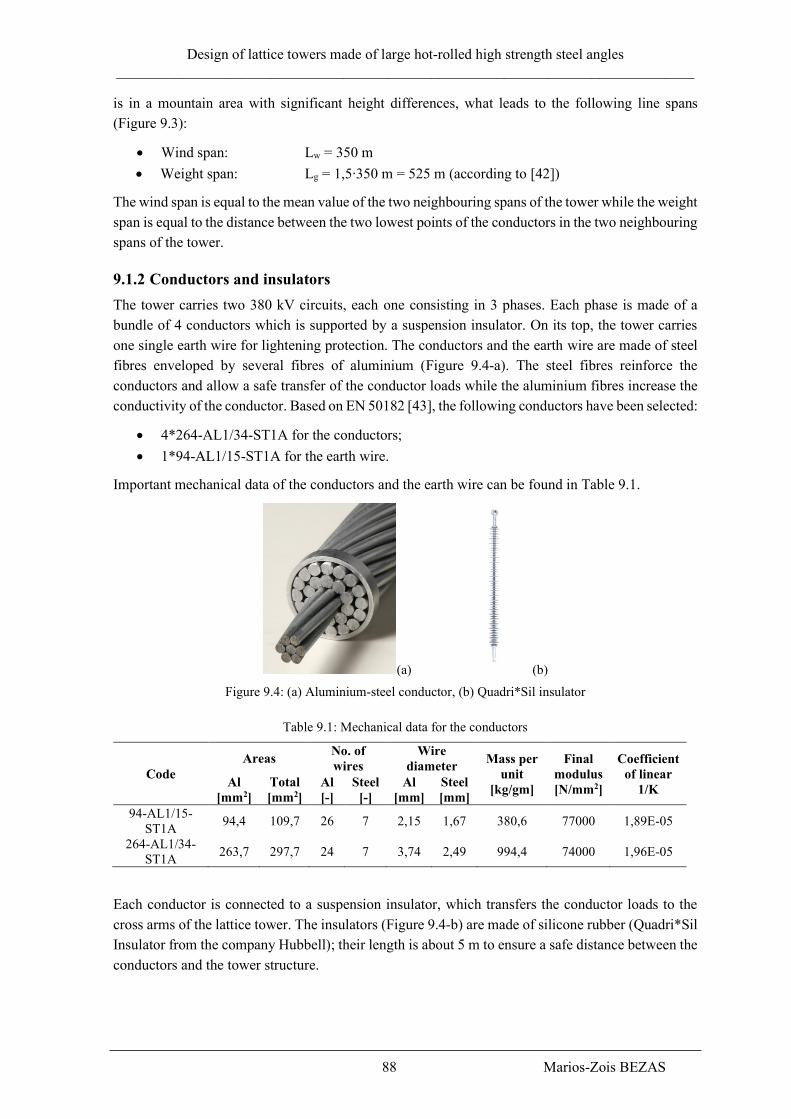
Design of lattice towers made of large hot-rolled high strength steel angles
_______________________________________________________________________________
88 Marios-Zois BEZAS
is in a mountain area with significant height differences, what leads to the following line spans
(Figure 9.3):
• Wind span: Lw = 350 m
• Weight span: Lg = 1,5∙350 m = 525 m (according to [42])
The wind span is equal to the mean value of the two neighbouring spans of the tower while the weight
span is equal to the distance between the two lowest points of the conductors in the two neighbouring
spans of the tower.
9.1.2 Conductors and insulators
The tower carries two 380 kV circuits, each one consisting in 3 phases. Each phase is made of a
bundle of 4 conductors which is supported by a suspension insulator. On its top, the tower carries
one single earth wire for lightening protection. The conductors and the earth wire are made of steel
fibres enveloped by several fibres of aluminium (Figure 9.4-a). The steel fibres reinforce the
conductors and allow a safe transfer of the conductor loads while the aluminium fibres increase the
conductivity of the conductor. Based on EN 50182 [43], the following conductors have been selected:
• 4*264-AL1/34-ST1A for the conductors;
• 1*94-AL1/15-ST1A for the earth wire.
Important mechanical data of the conductors and the earth wire can be found in Table 9.1.
(a) (b)
Figure 9.4: (a) Aluminium-steel conductor, (b) Quadri*Sil insulator
Table 9.1: Mechanical data for the conductors
Code
Areas No. of
wires
Wire
diameter Mass per
unit
[kg/gm]
Final
modulus
[N/mm2]
Coefficient
of linear
1/K Al
[mm2]
Total
[mm2]
Al
[-]
Steel
[-]
Al
[mm]
Steel
[mm]
94-AL1/15-
ST1A 94,4 109,7 26 7 2,15 1,67 380,6 77000 1,89E-05
264-AL1/34-
ST1A 263,7 297,7 24 7 3,74 2,49 994,4 74000 1,96E-05
Each conductor is connected to a suspension insulator, which transfers the conductor loads to the
cross arms of the lattice tower. The insulators (Figure 9.4-b) are made of silicone rubber (Quadri*Sil
Insulator from the company Hubbell); their length is about 5 m to ensure a safe distance between the
conductors and the tower structure.
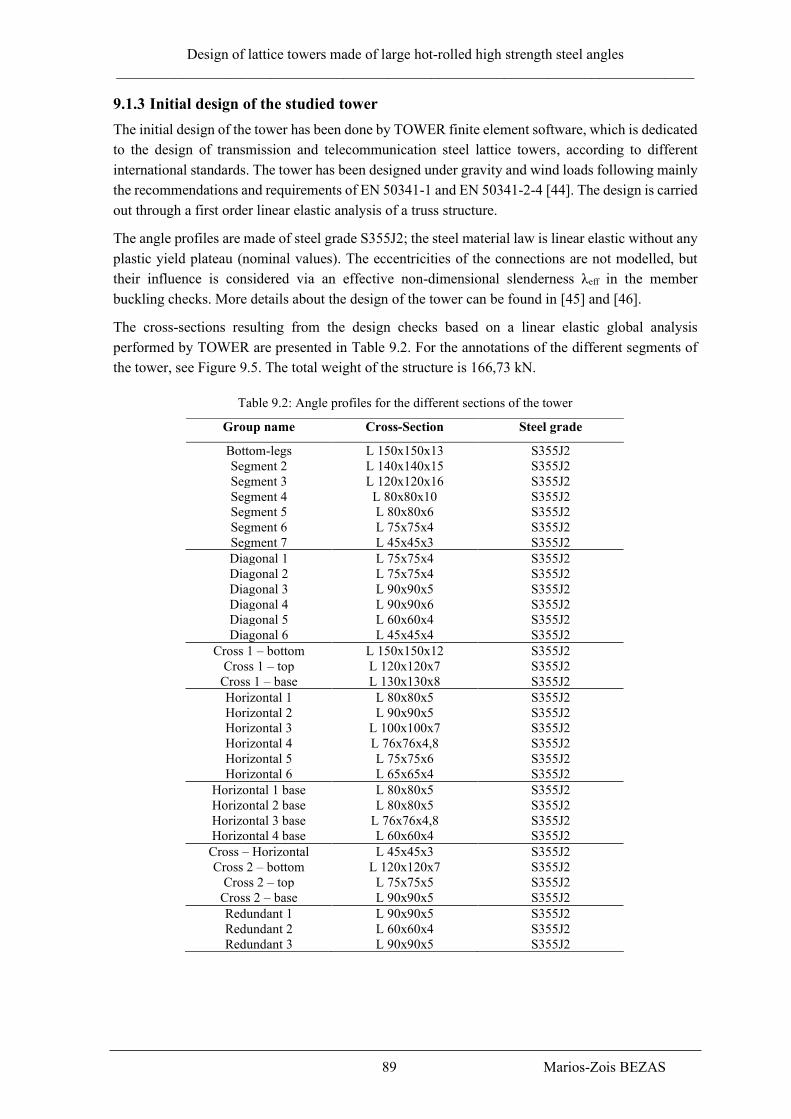
Design of lattice towers made of large hot-rolled high strength steel angles
_______________________________________________________________________________
89 Marios-Zois BEZAS
9.1.3 Initial design of the studied tower
The initial design of the tower has been done by TOWER finite element software, which is dedicated
to the design of transmission and telecommunication steel lattice towers, according to different
international standards. The tower has been designed under gravity and wind loads following mainly
the recommendations and requirements of EN 50341-1 and EN 50341-2-4 [44]. The design is carried
out through a first order linear elastic analysis of a truss structure.
The angle profiles are made of steel grade S355J2; the steel material law is linear elastic without any
plastic yield plateau (nominal values). The eccentricities of the connections are not modelled, but
their influence is considered via an effective non-dimensional slenderness λeff in the member
buckling checks. More details about the design of the tower can be found in [45] and [46].
The cross-sections resulting from the design checks based on a linear elastic global analysis
performed by TOWER are presented in Table 9.2. For the annotations of the different segments of
the tower, see Figure 9.5. The total weight of the structure is 166,73 kN.
Table 9.2: Angle profiles for the different sections of the tower
Group name Cross-Section Steel grade
Bottom-legs L 150x150x13 S355J2
Segment 2 L 140x140x15 S355J2
Segment 3 L 120x120x16 S355J2
Segment 4 L 80x80x10 S355J2
Segment 5 L 80x80x6 S355J2
Segment 6 L 75x75x4 S355J2
Segment 7 L 45x45x3 S355J2
Diagonal 1 L 75x75x4 S355J2
Diagonal 2 L 75x75x4 S355J2
Diagonal 3 L 90x90x5 S355J2
Diagonal 4 L 90x90x6 S355J2
Diagonal 5 L 60x60x4 S355J2
Diagonal 6 L 45x45x4 S355J2
Cross 1 – bottom L 150x150x12 S355J2
Cross 1 – top L 120x120x7 S355J2
Cross 1 – base L 130x130x8 S355J2
Horizontal 1 L 80x80x5 S355J2
Horizontal 2 L 90x90x5 S355J2
Horizontal 3 L 100x100x7 S355J2
Horizontal 4 L 76x76x4,8 S355J2
Horizontal 5 L 75x75x6 S355J2
Horizontal 6 L 65x65x4 S355J2
Horizontal 1 base L 80x80x5 S355J2
Horizontal 2 base L 80x80x5 S355J2
Horizontal 3 base L 76x76x4,8 S355J2
Horizontal 4 base L 60x60x4 S355J2
Cross – Horizontal L 45x45x3 S355J2
Cross 2 – bottom L 120x120x7 S355J2
Cross 2 – top L 75x75x5 S355J2
Cross 2 – base L 90x90x5 S355J2
Redundant 1 L 90x90x5 S355J2
Redundant 2 L 60x60x4 S355J2
Redundant 3 L 90x90x5 S355J2

Design of lattice towers made of large hot-rolled high strength steel angles
_______________________________________________________________________________
90 Marios-Zois BEZAS
Figure 9.5: Annotations of the different segments of the tower
9.2 Numerical simulation of the tower with FINELG
9.2.1 Description of the finite element model
For the validation and the assessment of the initial design, the tower has been simulated with FINELG
finite element software, using beam elements with 7 degrees of freedom, as plate buckling
phenomena in the angle legs are not to be contemplated. The model of the tower is represented in
Figure 9.6. It is worth noting that FINELG has been already successfully used in the past to simulate
a lattice tower [22]; and it has also been used on the framework of the present thesis to predict
successfully the failure load of full-scale experimental tests, as they reported in Annex B.
Every element/bar is modelled with its appropriate eccentricity, rotation and orientation in order to
simulate the reality as closely as possible. As a result, the elements are not only subjected to axial
forces but also to bending moments. At the level of a global analysis, the bolted connections between
the diagonals and tower legs as well as the splices in the tower legs are not considered directly in the
model, but their global response has been simulated through appropriate hinges/constraints at the
ends of the elements. Moreover, their self-weight has been considered as referred in §9.2.2(A1).
The tower structure is modelled using the following assumptions:
• the main legs are modelled considering continuity over their total length;
• the bracing members and horizontal members are considered as pinned at their ends
connected to the main legs and to the horizontal members;
• the secondary bracing elements are also considered as pinned at their ends.

Design of lattice towers made of large hot-rolled high strength steel angles
_______________________________________________________________________________
91 Marios-Zois BEZAS
For the members that are assumed as continuous over their total length (main tower legs), the 7 DOF
are blocked at the extremities of the finite beam elements. For the pin-end members (i.e horizontals,
primary and secondary bracings), all the rotations are free, except the torsion about the beam axis
which is blocked; all the other DOF are blocked too. The foundations are assumed as pinned.
Figure 9.6: 3-D model from FINELG software
All the members of the tower are made of steel grade S355J2. Two cases have been considered in
terms of material law: a linear elastic one and a non-linear perfectly plastic one. Nominal values for
the material properties have been used (E=210.000 MPa, v=0,3 and ρ=7850 kg/m3), while the yield
stress is taken equal to 345 MPa, as for the initial design checks. For each element, residual stresses
originating from hot-rolling are considered in material non-linear analyses; the pattern is in
accordance with Ref. [39], as it shown in Figure 6.18 too. Furthermore, for the analyses where initial
imperfections have been applied, those are in accordance with the 1st instability mode, calibrated so
as to reach an amplitude of L/1000 (L is the length of the member/segment where instability occurs).
The conductors and the insulators have not been modelled. However, the wind loads acting on them,
as well as their self-weight have been calculated apart and introduced in the model as point loads
acting at the top of the insulators.
9.2.2 Applied loads
The gravity (self-weight) and wind loads acting on the tower, the conductors, the earth wire and the
insulators are presented in the following. Tension loads in the conductors are not considered since it
is a suspension tower in a straight line.
A.1 Self-weight of tower
The self-weight of the tower itself is calculated automatically from the analysis program according
to the geometry, considering the specific weight of steel γ = 7850 kN/m3. Bolts and gusset plates are
not modelled in FINELG, but their self-weight is taken into account by an adjustment factor equal to
1,20 which artificially increases the dead loads of the tower; this approach has been used also for the
initial design of the tower. This leads to a total weight of the tower of 172,60 kN.

Design of lattice towers made of large hot-rolled high strength steel angles
_______________________________________________________________________________
92 Marios-Zois BEZAS
A.2 Self-weight of conductors, earth wire and insulators
The self-weight Vc,i of the conductors and the earth wire cable are evaluated according to EN 50182
[43] and summarized in Table 9.3.
Table 9.3: Self-weight of conductors and earth wire
Type / Code ml
[kg/km] Lg [m]
gc
=ml·g
[N/m]
No of
bundles
nb
Vc,i
=nb·gc·Lg
[kN]
No of
conductors
nc
Vc,tot
=nc·Vc,i
[kN]
1 Conductor
264-AL1/34-ST1A 994,4 525 9,755 4 20,49 6 122,91
Earth wire
94-AL1/15-ST1A 380,6 525 3,734 1 1,96 1 1,96
The weight of one insulator is about 0,087 kN. Consequently, for the six insulators which have been
used, the total weight equals 0,522 kN.
B.1 Wind loads at the tower’s body
The calculation of the wind loads on the tower is based on EN 1993-3-1/Annex B and EN 1991-1-4
[47]. The tower is subdivided into several segments, as illustrated in Figure 9.2, and for each segment
a mean wind load is evaluated. The mean wind load in the direction of the wind on the tower, for a
segment, should be taken as:
𝐹𝑚,𝑊(𝑧) =𝑞𝑝(𝑧)
1+7𝐼𝑣(𝑧)∑𝑐𝑓𝐴𝑟𝑒𝑓 (Eq. 9.1)
where z is the height above the base at which the load is calculated. All the notations not explained
here are provided in chapter 2. The above equation may be transformed to the following one:
𝐹𝑚,𝑊(𝑧) =1
2𝜌𝑎𝑖𝑟𝑣𝑚
2 ∑𝑐𝑓𝐴𝑟𝑒𝑓 = 𝑞𝑚(𝑧) ∑ 𝑐𝑓𝐴𝑟𝑒𝑓 (Eq. 9.2)
The mean wind velocity at the height z is:
𝑉𝑚(𝑧) = 𝑐𝑟(𝑧)𝑐𝑜(𝑧)[𝑐𝑑𝑖𝑟𝑐𝑠𝑒𝑎𝑠𝑜𝑛𝑉𝑏,0] (Eq. 9.3)
where:
𝑐𝑟(𝑧) is the roughness coefficient;
𝑐𝑜(𝑧) is the orography coefficient, equal to 1,0 according to EN 1991-1-4/§4.3.3;
𝑐𝑑𝑖𝑟 is the directional factor, equal to 1,0 according to EN 1991-1-4/§4.2;
𝑐𝑠𝑒𝑎𝑠𝑜𝑛 is the season factor, equal to 1,0 according to EN 1991-1-4/§4.2;
𝑣𝑏,0 is the fundamental value of the basic wind velocity, taken as 25,0 m/sec according
to the German national annex of EN 1991-1-4 & EN 50341-2-4.
It is assumed that the tower is located in a category II terrain, according to EN 50341-2-4 (in line
with the German National Annex); this leads to some characteristic values for the mean wind velocity
to considerer in the calculations.
The mean wind loads have been calculated at the mid-height of each segment and for two different
wind directions (see Figure 9.7 for the direction):
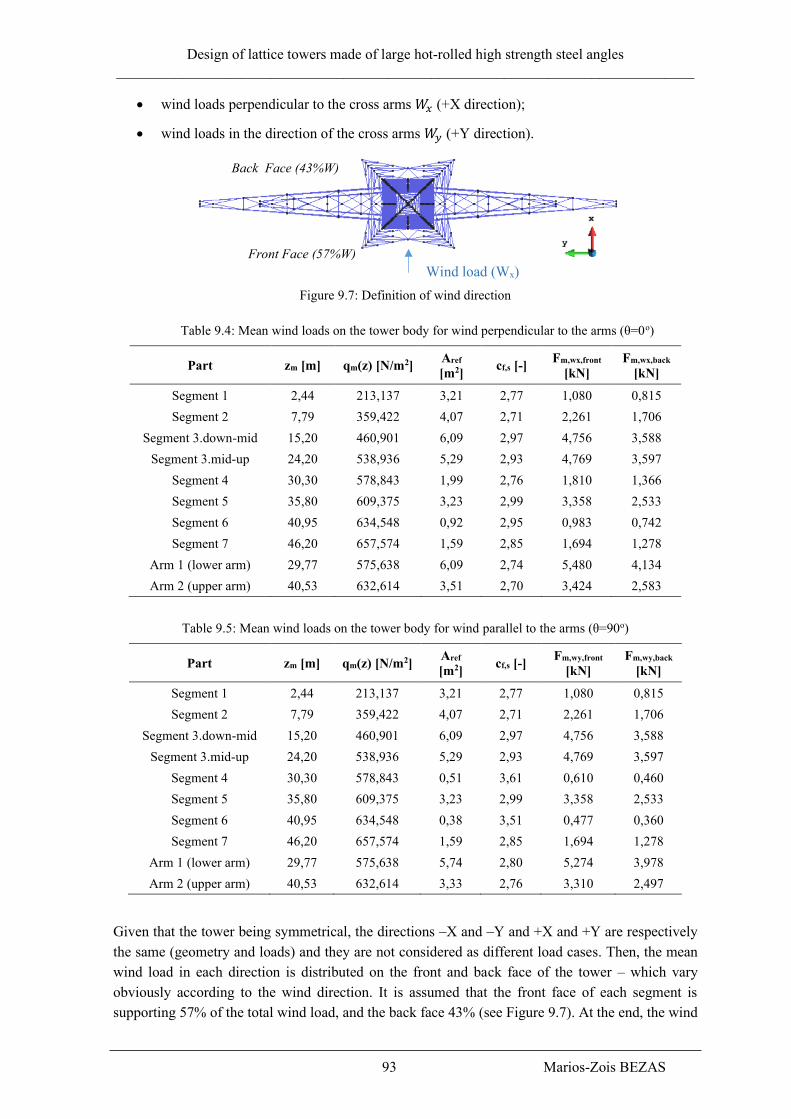
Design of lattice towers made of large hot-rolled high strength steel angles
_______________________________________________________________________________
93 Marios-Zois BEZAS
• wind loads perpendicular to the cross arms 𝑊𝑥 (+X direction);
• wind loads in the direction of the cross arms 𝑊𝑦 (+Y direction).
Figure 9.7: Definition of wind direction
Table 9.4: Mean wind loads on the tower body for wind perpendicular to the arms (θ=0ο)
Part zm [m] qm(z) [N/m2] Aref
[m2] cf,s [-]
Fm,wx,front
[kN]
Fm,wx,back
[kN]
Segment 1 2,44 213,137 3,21 2,77 1,080 0,815
Segment 2 7,79 359,422 4,07 2,71 2,261 1,706
Segment 3.down-mid 15,20 460,901 6,09 2,97 4,756 3,588
Segment 3.mid-up 24,20 538,936 5,29 2,93 4,769 3,597
Segment 4 30,30 578,843 1,99 2,76 1,810 1,366
Segment 5 35,80 609,375 3,23 2,99 3,358 2,533
Segment 6 40,95 634,548 0,92 2,95 0,983 0,742
Segment 7 46,20 657,574 1,59 2,85 1,694 1,278
Arm 1 (lower arm) 29,77 575,638 6,09 2,74 5,480 4,134
Arm 2 (upper arm) 40,53 632,614 3,51 2,70 3,424 2,583
Table 9.5: Mean wind loads on the tower body for wind parallel to the arms (θ=90ο)
Part zm [m] qm(z) [N/m2] Aref
[m2] cf,s [-]
Fm,wy,front
[kN]
Fm,wy,back
[kN]
Segment 1 2,44 213,137 3,21 2,77 1,080 0,815
Segment 2 7,79 359,422 4,07 2,71 2,261 1,706
Segment 3.down-mid 15,20 460,901 6,09 2,97 4,756 3,588
Segment 3.mid-up 24,20 538,936 5,29 2,93 4,769 3,597
Segment 4 30,30 578,843 0,51 3,61 0,610 0,460
Segment 5 35,80 609,375 3,23 2,99 3,358 2,533
Segment 6 40,95 634,548 0,38 3,51 0,477 0,360
Segment 7 46,20 657,574 1,59 2,85 1,694 1,278
Arm 1 (lower arm) 29,77 575,638 5,74 2,80 5,274 3,978
Arm 2 (upper arm) 40,53 632,614 3,33 2,76 3,310 2,497
Given that the tower being symmetrical, the directions –X and –Y and +X and +Y are respectively
the same (geometry and loads) and they are not considered as different load cases. Then, the mean
wind load in each direction is distributed on the front and back face of the tower – which vary
obviously according to the wind direction. It is assumed that the front face of each segment is
supporting 57% of the total wind load, and the back face 43% (see Figure 9.7). At the end, the wind
Back Face (43%W)
Front Face (57%W)
Wind load (Wx)
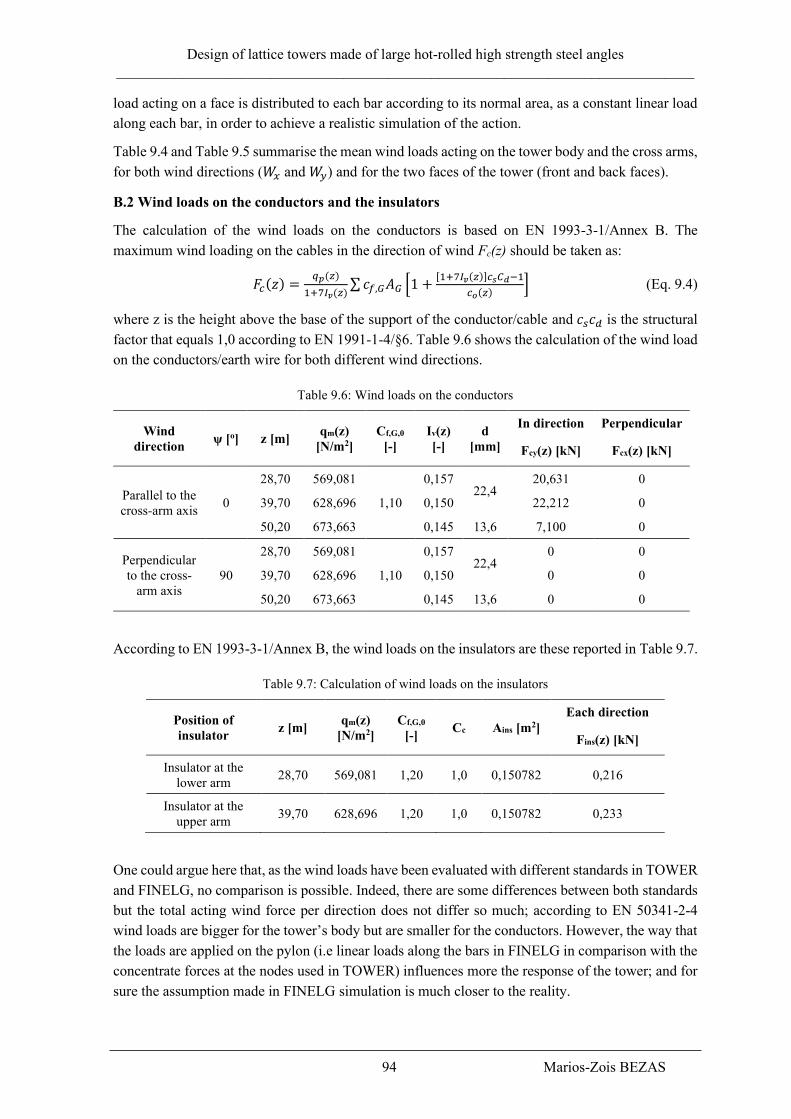
Design of lattice towers made of large hot-rolled high strength steel angles
_______________________________________________________________________________
94 Marios-Zois BEZAS
load acting on a face is distributed to each bar according to its normal area, as a constant linear load
along each bar, in order to achieve a realistic simulation of the action.
Table 9.4 and Table 9.5 summarise the mean wind loads acting on the tower body and the cross arms,
for both wind directions (𝑊𝑥 and 𝑊𝑦) and for the two faces of the tower (front and back faces).
B.2 Wind loads on the conductors and the insulators
The calculation of the wind loads on the conductors is based on EN 1993-3-1/Annex B. The
maximum wind loading on the cables in the direction of wind Fc(z) should be taken as:
𝐹𝑐(𝑧) =𝑞𝑝(𝑧)
1+7𝐼𝑣(𝑧)∑𝑐𝑓,𝐺𝐴𝐺 [1 +
[1+7𝐼𝑣(𝑧)]𝑐𝑠𝐶𝑑−1
𝑐𝑜(𝑧)] (Eq. 9.4)
where z is the height above the base of the support of the conductor/cable and 𝑐𝑠𝑐𝑑 is the structural
factor that equals 1,0 according to EN 1991-1-4/§6. Table 9.6 shows the calculation of the wind load
on the conductors/earth wire for both different wind directions.
Table 9.6: Wind loads on the conductors
Wind
direction ψ [ο] z [m]
qm(z)
[N/m2]
Cf,G,0
[-]
Iv(z)
[-]
d
[mm]
In direction Perpendicular
Fcy(z) [kN] Fcx(z) [kN]
Parallel to the
cross-arm axis 0
28,70 569,081
1,10
0,157 22,4
20,631 0
39,70 628,696 0,150 22,212 0
50,20 673,663 0,145 13,6 7,100 0
Perpendicular
to the cross-
arm axis
90
28,70 569,081
1,10
0,157 22,4
0 0
39,70 628,696 0,150 0 0
50,20 673,663 0,145 13,6 0 0
According to EN 1993-3-1/Annex B, the wind loads on the insulators are these reported in Table 9.7.
Table 9.7: Calculation of wind loads on the insulators
Position of
insulator z [m]
qm(z)
[N/m2]
Cf,G,0
[-] Cc Ains [m2]
Each direction
Fins(z) [kN]
Insulator at the
lower arm 28,70 569,081 1,20 1,0 0,150782 0,216
Insulator at the
upper arm 39,70 628,696 1,20 1,0 0,150782 0,233
One could argue here that, as the wind loads have been evaluated with different standards in TOWER
and FINELG, no comparison is possible. Indeed, there are some differences between both standards
but the total acting wind force per direction does not differ so much; according to EN 50341-2-4
wind loads are bigger for the tower’s body but are smaller for the conductors. However, the way that
the loads are applied on the pylon (i.e linear loads along the bars in FINELG in comparison with the
concentrate forces at the nodes used in TOWER) influences more the response of the tower; and for
sure the assumption made in FINELG simulation is much closer to the reality.
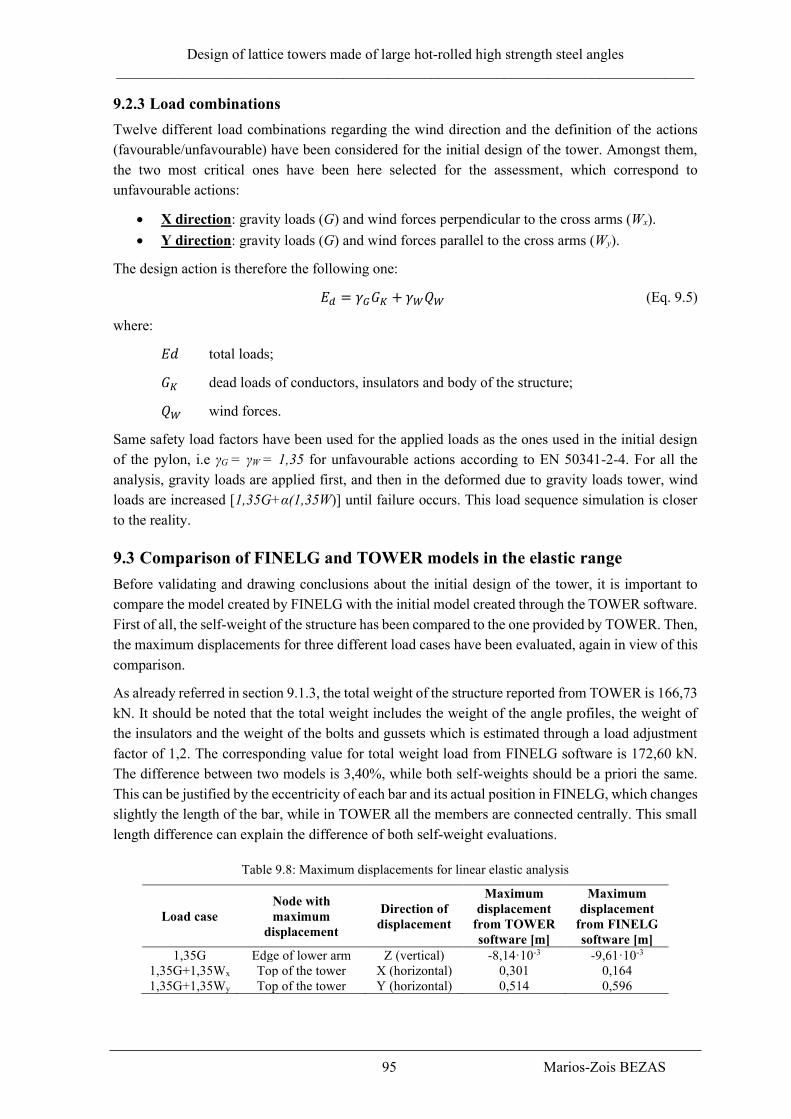
Design of lattice towers made of large hot-rolled high strength steel angles
_______________________________________________________________________________
95 Marios-Zois BEZAS
9.2.3 Load combinations
Twelve different load combinations regarding the wind direction and the definition of the actions
(favourable/unfavourable) have been considered for the initial design of the tower. Amongst them,
the two most critical ones have been here selected for the assessment, which correspond to
unfavourable actions:
• X direction: gravity loads (G) and wind forces perpendicular to the cross arms (Wx).
• Y direction: gravity loads (G) and wind forces parallel to the cross arms (Wy).
The design action is therefore the following one:
𝐸𝑑 = 𝛾𝐺𝐺𝐾 + 𝛾𝑊𝑄𝑊 (Eq. 9.5)
where:
𝐸𝑑 total loads;
𝐺𝐾 dead loads of conductors, insulators and body of the structure;
𝑄𝑊 wind forces.
Same safety load factors have been used for the applied loads as the ones used in the initial design
of the pylon, i.e γG = γW = 1,35 for unfavourable actions according to EN 50341-2-4. For all the
analysis, gravity loads are applied first, and then in the deformed due to gravity loads tower, wind
loads are increased [1,35G+α(1,35W)] until failure occurs. This load sequence simulation is closer
to the reality.
9.3 Comparison of FINELG and TOWER models in the elastic range
Before validating and drawing conclusions about the initial design of the tower, it is important to
compare the model created by FINELG with the initial model created through the TOWER software.
First of all, the self-weight of the structure has been compared to the one provided by TOWER. Then,
the maximum displacements for three different load cases have been evaluated, again in view of this
comparison.
As already referred in section 9.1.3, the total weight of the structure reported from TOWER is 166,73
kN. It should be noted that the total weight includes the weight of the angle profiles, the weight of
the insulators and the weight of the bolts and gussets which is estimated through a load adjustment
factor of 1,2. The corresponding value for total weight load from FINELG software is 172,60 kN.
The difference between two models is 3,40%, while both self-weights should be a priori the same.
This can be justified by the eccentricity of each bar and its actual position in FINELG, which changes
slightly the length of the bar, while in TOWER all the members are connected centrally. This small
length difference can explain the difference of both self-weight evaluations.
Table 9.8: Maximum displacements for linear elastic analysis
Load case
Node with
maximum
displacement
Direction of
displacement
Maximum
displacement
from TOWER
software [m]
Maximum
displacement
from FINELG
software [m]
1,35G Edge of lower arm Z (vertical) -8,14·10-3 -9,61·10-3
1,35G+1,35Wx Top of the tower X (horizontal) 0,301 0,164
1,35G+1,35Wy Top of the tower Y (horizontal) 0,514 0,596

Design of lattice towers made of large hot-rolled high strength steel angles
_______________________________________________________________________________
96 Marios-Zois BEZAS
The maximum displacements are summarized in Table 9.8. It should be noted that:
• load case 1,35G includes only the self-weight of the tower without the conductors and
insulators;
• the wind load calculations in TOWER and FINELG being based on different norms (EN
1993-3-1 for FINELG and EN 50341-1 for TOWER), it is normal to see a difference
between those displacements;
• the wind loads in FINELG are introduced as linear loads along the bars while in TOWER
they are introduced as loads at the nodes;
• the wind loads on the body of the tower are bigger according to EN 50341-1 than EN 1993-
3-1, what justifies the difference in load case 1,35𝐺 + 1,35𝑊𝑥;
• the wind loads on the conductors are smaller according to EN 50341-1 than EN 1993-3-1,
what explains why the difference in load case 1,35𝐺 + 1,35𝑊𝑦 is smaller than in load case
1,35𝐺 + 1,35𝑊𝑥.
Regarding those values, one notices that they are high. However, the displacements are appearing at
the failure limit state (applying loads with 1,35 load factors) and not at the service limit state
(applying loads without load factors). Additionally, there is no special indication or limitation
specified in both main norms (EN 1993-3-1 or EN 50341-1) in terms of maximum displacement at
service limit state. The only reason to provide displacements here is to compare the order of
magnitude – not even the exact value – between TOWER and FINELG software. However, due to
the big difference of the maximum displacements of both software, complementary analyses have
been performed to investigate the stiffness of the two models. The comparison has been achieved
through a first order linear elastic analysis, where a horizontal load of 1 kN has been applied (i.e. the
same loading in TOWER and FINELG) at the top of the tower in the two following situations:
• the load is applied perpendicularly to the cross-arm axis (X direction);
• the load is applied parallelly to the cross-arm axis (Y direction).
The results are summarized in Table 9.9. The difference between the displacements is less than 5%,
what means that both models have almost the same stiffness. This seems to indicate that a simplified
modelling of the members at their extremities (as in TOWER) could be accurately contemplated for
a first order analysis.
Table 9.9: Displacements on the top of the tower from linear elastic analyses
Load case
Direction of
load and
displacement
Displacement
from TOWER
software [m]
Displacement
from FINELG
software [m]
Difference
[%]
Stiffness of
FINELG
model [kN/m]
Fx=1 kN X 9,019·10-3 9,455·10-3 4,61 105,76
Fy=1 kN Y 9,021·10-3 9,438·10-3 4,42 105,95
9.4 Numerical results
In order to investigate the tower response and validate the initial design method, different types of
complementary analyses have been performed by means of FINELG and the results are presented in
the next paragraphs.

Design of lattice towers made of large hot-rolled high strength steel angles
_______________________________________________________________________________
97 Marios-Zois BEZAS
9.4.1 Elastic instability analysis
The critical load multipliers αcr are summarised in Table 9.10, while the deformation shape of the
first instability mode is shown in Figure 9.8 and Figure 9.9 for wind loads acting on X and Y direction
respectively.
Figure 9.8: First buckling mode for load combination 1,35G+ αcr1,35Wx
Figure 9.9: First buckling mode for load combination 1,35G+ αcr1,35Wy
Table 9.10: Results from elastic instability analysis
Load
combination 1,35G+ αcr1,35Wx 1,35G+ αcr1,35Wy
No of mode Load
factor αcr
Type of
instability
Load
factor αcr
Type of
instability
1st 3,056 Member 1,015 Segment
2nd 5,853 Member 1,179 Member
3rd 6,764 Member 1,205 Member
The instability mode observed in Figure 9.9 has been baptized as “segment instability” and is further
investigated in chapter 10, where two analytical prediction models are proposed.
9.4.2 Second order elastic analyses
A geometrically non-linear elastic analysis with elastic material law but without considering initial
imperfections has been performed, to complement-validate the elastic buckling analysis. The results
are summarized, for each direction, below.
For the load combination 1,35G+ αcr,nl1,35Wx, the load-displacement curve is reported in Figure 9.10.
The first branch of the curve represents the loading with the gravity loads while the second one, with
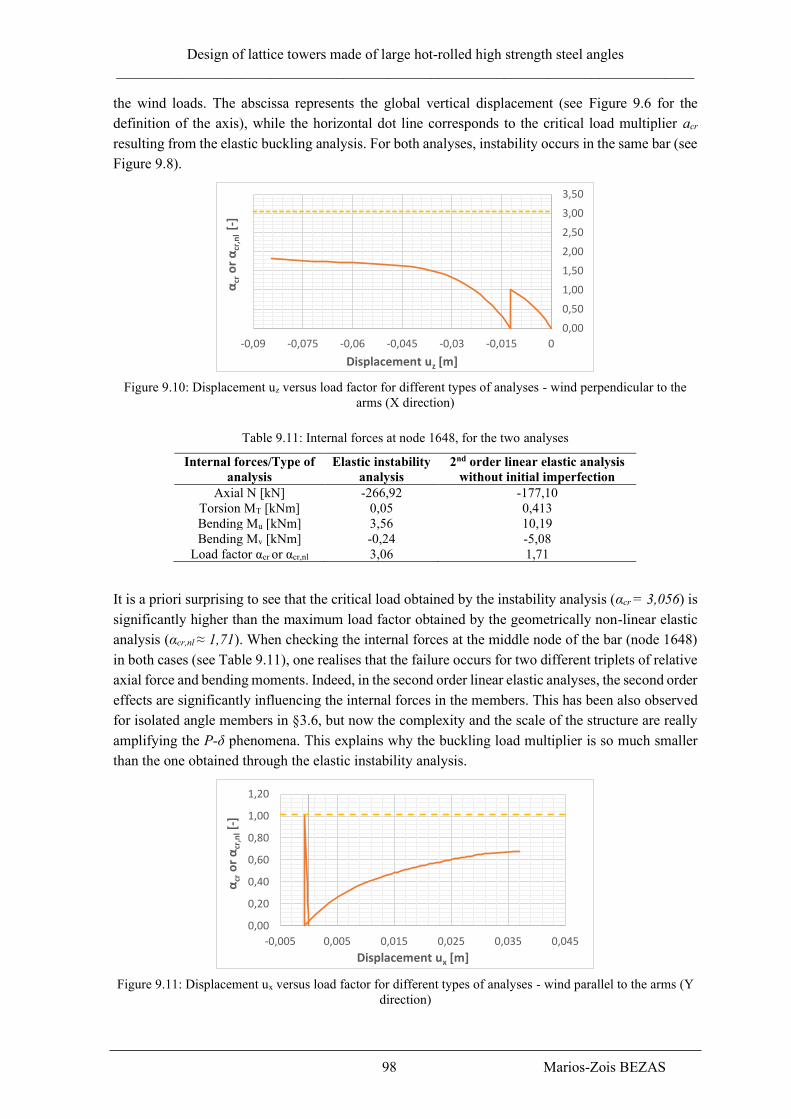
Design of lattice towers made of large hot-rolled high strength steel angles
_______________________________________________________________________________
98 Marios-Zois BEZAS
the wind loads. The abscissa represents the global vertical displacement (see Figure 9.6 for the
definition of the axis), while the horizontal dot line corresponds to the critical load multiplier acr
resulting from the elastic buckling analysis. For both analyses, instability occurs in the same bar (see
Figure 9.8).
Figure 9.10: Displacement uz versus load factor for different types of analyses - wind perpendicular to the
arms (X direction)
Table 9.11: Internal forces at node 1648, for the two analyses
Internal forces/Type of
analysis
Elastic instability
analysis
2nd order linear elastic analysis
without initial imperfection
Axial N [kN] -266,92 -177,10
Torsion MT [kNm] 0,05 0,413
Bending Mu [kNm] 3,56 10,19
Bending Mv [kNm] -0,24 -5,08
Load factor αcr or αcr,nl 3,06 1,71
It is a priori surprising to see that the critical load obtained by the instability analysis (αcr = 3,056) is
significantly higher than the maximum load factor obtained by the geometrically non-linear elastic
analysis (αcr,nl ≈ 1,71). When checking the internal forces at the middle node of the bar (node 1648)
in both cases (see Table 9.11), one realises that the failure occurs for two different triplets of relative
axial force and bending moments. Indeed, in the second order linear elastic analyses, the second order
effects are significantly influencing the internal forces in the members. This has been also observed
for isolated angle members in §3.6, but now the complexity and the scale of the structure are really
amplifying the P-δ phenomena. This explains why the buckling load multiplier is so much smaller
than the one obtained through the elastic instability analysis.
Figure 9.11: Displacement ux versus load factor for different types of analyses - wind parallel to the arms (Y
direction)
0,00
0,50
1,00
1,50
2,00
2,50
3,00
3,50
-0,09 -0,075 -0,06 -0,045 -0,03 -0,015 0
αcr
or
αcr
,nl
[-]
Displacement uz [m]
0,00
0,20
0,40
0,60
0,80
1,00
1,20
-0,005 0,005 0,015 0,025 0,035 0,045
αcr
or
αcr
,nl[-
]
Displacement ux [m]

Design of lattice towers made of large hot-rolled high strength steel angles
_______________________________________________________________________________
99 Marios-Zois BEZAS
When the wind forces acting on Y direction, a segment instability again appears, as shown in Figure
9.9. The graph in Figure 9.11 shows the horizontal displacement ux (direction of global X axis -
Figure 9.6) at the middle of diagonal 2 versus the load factor. The horizontal dot line represents the
critical load multiplier obtained from the elastic instability analysis. The difference between the
critical instability load factor and the maximum one reached through a 2nd order linear elastic
analysis, that is about αcr,nl ≈ 0,68, could again be explained by the different loading situations
(relative axial force and bending moments) in the critical bars.
9.4.3 Full non-linear analyses
The validation of the initial design requires a full non-linear analysis, considering an elastic-perfectly
plastic material, distributions of residual stresses and an initial imperfection of the structure in
accordance with the 1st instability mode. The details are presented in §9.2.1.
Figure 9.12 represents the vertical displacement uz (direction of global Z axis) at the node 1648 versus
the load factor for the load combination 1,35G+ αu1,35Wx. The failure occurs in the same bar as in
the previous analyses due to combined plasticity (see Figure 9.13) and instability. The load factor (αu
= 1,17) for this load combination is bigger than 1,0 with comparison to the design factored loads. As
a result, the initial design appears to be safe. Furthermore, it is observed that the tower remains elastic
for load factors αu ≤ 1,0, so confirming the TOWER design assumptions.
Figure 9.12: Displacement versus ultimate load factor – 1,35G+1,35Wx (X direction)
Figure 9.13: Results (plasticisation) from the 2nd order non-linear plastic analysis (X direction)
Figure 9.14 shows the horizontal displacement ux (direction of global X axis) at the middle of
diagonal 2 (see Figure 9.9) versus the load factor, for the load combination 1,35G+ αu1,35Wy. It can
be seen that the load factor is about αu ≈ 0,66. Contrary to what is seen before, the maximum load
0,00
0,20
0,40
0,60
0,80
1,00
1,20
1,40
-0,06 -0,05 -0,04 -0,03 -0,02 -0,01 0,00
Load
Fac
tor
αu
[-]
Displacement uz [m]
Node 1648

Design of lattice towers made of large hot-rolled high strength steel angles
_______________________________________________________________________________
100 Marios-Zois BEZAS
factor remains here far lower than 1,0. The initial design of the tower by TOWER software for this
direction is therefore seen as insufficient and unconservative. This may be explained by the
development, in reality, of an instability mode in one of the main tower legs, called “segment
instability” and which is not covered by TOWER; but more importantly, it is also not addressed
properly by the reference European normative documents EN 1993-3-1 and EN 50341 (more
information are provided in chapter 10).
Figure 9.14: Displacement versus ultimate load factor – 1,35G+1,35Wy (Y direction)
9.5 Conclusions
An assessment of the current design approach used for lattice transmission towers has been achieved
through numerical studies, and from the results, the following conclusions may be drawn:
• There are different norms for the design of transmission towers, mainly EN 1993-3-1 & EN
50341-1. For some aspects, for instance the amplitude of the wind loads, both norms provide
slightly different recommendations. In the present chapter, EN 1993-3-1 has been used for
evaluation of the wind loads.
• There is no special indication or limitation in the norms (EN 1993-3-1 & EN 50341-1) about
the maximum displacements of the tower at the serviceability limit state.
• A reasonable agreement is seen between FINELG and TOWER elastic analyses. The
differences may be explained by modelling aspects.
• The buckling load obtained by a 2nd order elastic analysis is smaller than the critical one
obtained by an elastic instability analysis. The reason is that the forces acting on the members
in both cases differ, so affecting the member buckling load in the case of non-symmetrical
cross-sections. Moreover, these effects are amplified by consideration of actual member
support conditions (eccentricities for instance).
• The second order effects should be considered in the analysis as they affect the global
response of the tower and its ultimate limit state.
• The initial design of the tower appears to be rather good in the case of application of the
wind loads in one direction, but it is quite unconservative for the application of wind loads
in the other direction. The reason is due to the development in the second case of an
instability mode that is not properly recommended to be checked by the present norms.
0,00
0,20
0,40
0,60
0,80
1,00
1,20
-0,005 0,005 0,015 0,025 0,035
Load
Fac
tor
αu
[-]
Displacement ux [m]

Design of lattice towers made of large hot-rolled high strength steel angles
_______________________________________________________________________________
101 Marios-Zois BEZAS
10. THE SEGMENT INSTABILITY MODE
In chapter 9, an instability mode for lattice towers not properly covered by the norms, that has been
named “segment instability”, was observed through numerical simulations. In the following, two
analytical models for the prediction of the critical load of the new buckling mode are proposed,
accompanying by their numerical validation. Comparisons with the existing norms are also provided.
10.1 Definition of segment instability
A “segment instability” is defined as a global instability mode associated to the buckling of more
than one member forming a segment. As shown in Figure 10.1, the instability is associated to the
buckling of the two diagonals of the leg in the present case, and therefore could also be named “leg-
segment instability”. More precisely, the leg is made of three vertically orientated members: the main
or “exterior” leg and the two diagonals that are connected with a number of horizontal bars and
bracing members forming “triangles”. In fact, each of the two diagonals and the exterior leg
constituting the segment are stable individually and can resist to the applied maximum forces, as they
have been initially designed for that. However, the simultaneous buckling of the diagonals over the
whole leg height, involving a longitudinal rotation of the main leg member, represents a “new mode”
which has been seen to be relevant in various usual design situations.
Figure 10.1: Segment elastic instability mode
Figure 10.2: Deformation of the members through a horizontal cut in the leg
Figure 10.2 shows a horizontal cut in the leg and indicates how the constitutive elements deform in
the instability mode. It is seen that:
• The diagonals move laterally and bend about an axis parallel to one of their angle legs.
• The main leg rotates about its longitudinal axis.
• The elements which form the “horizontal leg triangles” (not represented on the picture in
Figure 10.2) do not undergo any deformation; they are just translated.
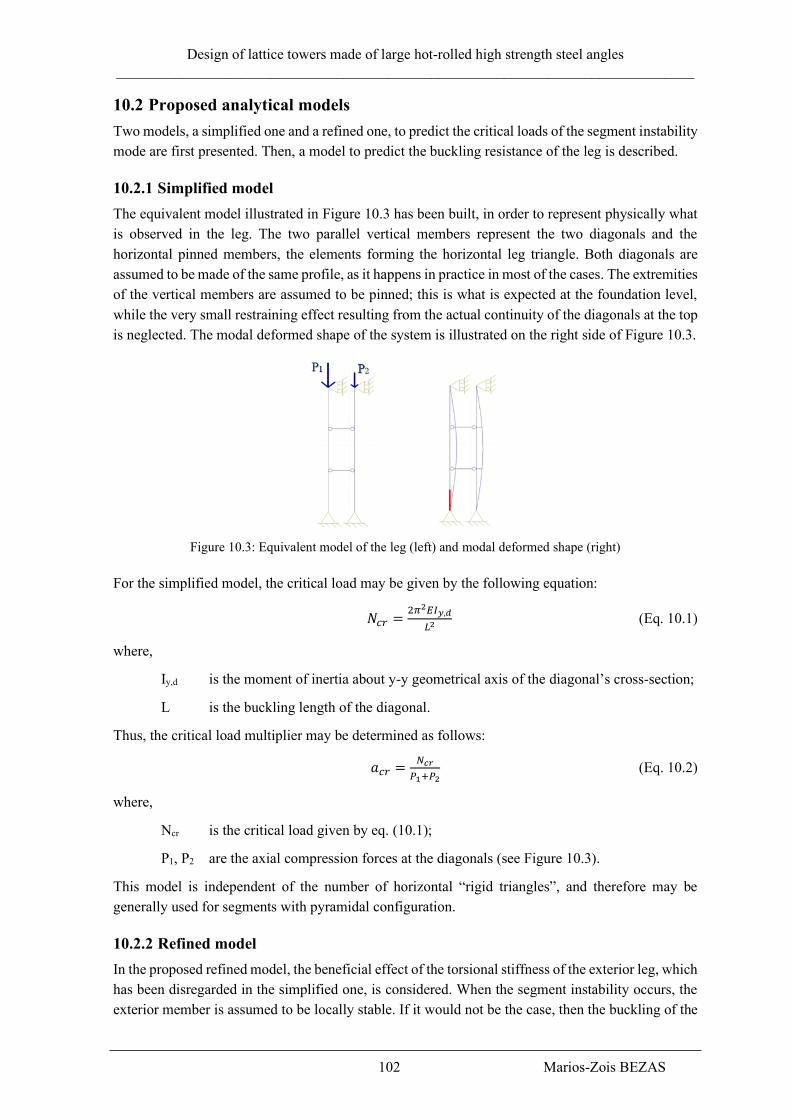
Design of lattice towers made of large hot-rolled high strength steel angles
_______________________________________________________________________________
102 Marios-Zois BEZAS
10.2 Proposed analytical models
Two models, a simplified one and a refined one, to predict the critical loads of the segment instability
mode are first presented. Then, a model to predict the buckling resistance of the leg is described.
10.2.1 Simplified model
The equivalent model illustrated in Figure 10.3 has been built, in order to represent physically what
is observed in the leg. The two parallel vertical members represent the two diagonals and the
horizontal pinned members, the elements forming the horizontal leg triangle. Both diagonals are
assumed to be made of the same profile, as it happens in practice in most of the cases. The extremities
of the vertical members are assumed to be pinned; this is what is expected at the foundation level,
while the very small restraining effect resulting from the actual continuity of the diagonals at the top
is neglected. The modal deformed shape of the system is illustrated on the right side of Figure 10.3.
Figure 10.3: Equivalent model of the leg (left) and modal deformed shape (right)
For the simplified model, the critical load may be given by the following equation:
𝑁𝑐𝑟 =2𝜋2𝐸𝐼𝑦,𝑑
𝐿2 (Eq. 10.1)
where,
Iy,d is the moment of inertia about y-y geometrical axis of the diagonal’s cross-section;
L is the buckling length of the diagonal.
Thus, the critical load multiplier may be determined as follows:
𝑎𝑐𝑟 =𝑁𝑐𝑟
𝑃1+𝑃2 (Eq. 10.2)
where,
Ncr is the critical load given by eq. (10.1);
P1, P2 are the axial compression forces at the diagonals (see Figure 10.3).
This model is independent of the number of horizontal “rigid triangles”, and therefore may be
generally used for segments with pyramidal configuration.
10.2.2 Refined model
In the proposed refined model, the beneficial effect of the torsional stiffness of the exterior leg, which
has been disregarded in the simplified one, is considered. When the segment instability occurs, the
exterior member is assumed to be locally stable. If it would not be the case, then the buckling of the

Design of lattice towers made of large hot-rolled high strength steel angles
_______________________________________________________________________________
103 Marios-Zois BEZAS
exterior leg determines the failure and limits the pylon resistance. Therefore, considering the fact that
the buckling resistance of an individual member in compression follows a flexural mode and not a
torsional one, it can be reasonably assumed that the axial force in the exterior leg is not influencing
its torsional stiffness.
When the leg instability develops, the exterior member is activated in torsion at the 1/3 and the 2/3
of the exterior leg length (Lext) where the “triangles” are here assumed to be located. The first step
consists in the evaluation of the torsional restraint offered by the rigidity of the exterior leg member
in torsion.
Figure 10.4: Schemes for the calculation for the torsional restraint brought by the exterior member
The torsional moments (see Figure 10.4) can be evaluated as follows, considering that MT1 and MT2
are equal to MT:
𝜑 = ∫𝑀𝑇
𝐶𝑑𝑥
𝐿𝑒𝑥𝑡3
0 ⇒ 𝑀𝑇 =
3𝐶
𝐿𝑒𝑥𝑡𝜑 (Eq. 10.3)
The torsional rigidity C of the cross-section is given in Annex A. Then:
𝑀𝑇 =3𝐶
𝐿𝑒𝑥𝑡𝜑
𝑀𝑇 = 2𝐹𝑑} ⇒
3𝐶
𝐿𝑒𝑥𝑡𝜑 = 2𝐹𝑑
𝐹=𝑅𝛥⇒
3𝐶
𝐿𝑒𝑥𝑡𝜑 = 2𝑅𝛥𝑑
𝛥=𝑑𝜑⇒
3𝐶
𝐿𝑒𝑥𝑡𝜑 = 2𝑅𝑑2𝜑 (Eq. 10.4)
where F is a force applied at each diagonal in direction of Δ and which causes torsional moment at
the exterior member of the leg (MT=2Fd where d is defined in Figure 10.4), while R is the lateral
restraint of the diagonal (R=F/Δ). By solving eq. (10.4), the lateral restraint of the diagonal is
obtained:
𝑅 =3𝐶
2𝐿𝑒𝑥𝑡·1
𝑑2 (Eq. 10.5)
The torsional restraints evaluated at 1/3 or at 2/3 of the member length (where the rigid triangles act)
are different as different values of d are met at these locations, what implies different values for MT1
and MT2 in Figure 10.4 and invalidates de facto the use of eq. (10.3). But, for sake of simplicity, the
actual values of R at L/3 and at 2L/3 are substituted by a mean value of Rmean defined as follows:
𝑅𝑚𝑒𝑎𝑛 =3𝐶
2𝐿𝑒𝑥𝑡·1
𝑛∑
1
𝑑𝑖2
𝑛𝑖=1 (Eq. 10.6)
This is illustrated in Figure 10.5. To simplify it further, both restraints are merged into a single one
called KT, as illustrated in the right sketch of Figure 10.5. For this case, Gardner proposes in Ref.
[48] an analytical expression of the critical load for a column of flexural inertia I:
𝑁𝑐𝑟 =𝜋2𝛦𝛪
𝐿2+3
16𝐾𝑇𝐿 with 𝐾𝑇 <
16𝜋2𝛦𝛪
𝐿3 (Eq. 10.7)
Lext/3
Lext/3
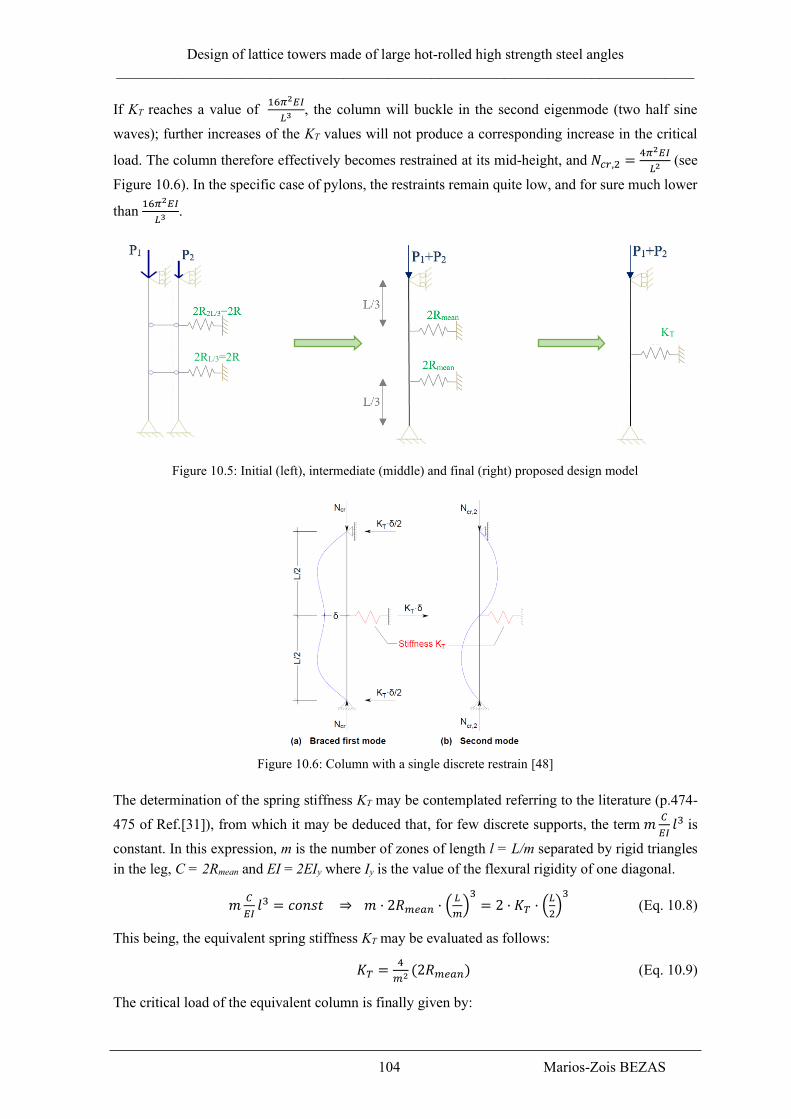
Design of lattice towers made of large hot-rolled high strength steel angles
_______________________________________________________________________________
104 Marios-Zois BEZAS
If KT reaches a value of 16𝜋2𝛦𝛪
𝐿3, the column will buckle in the second eigenmode (two half sine
waves); further increases of the KT values will not produce a corresponding increase in the critical
load. The column therefore effectively becomes restrained at its mid-height, and 𝑁𝑐𝑟,2 =4𝜋2𝛦𝛪
𝐿2 (see
Figure 10.6). In the specific case of pylons, the restraints remain quite low, and for sure much lower
than 16𝜋2𝛦𝛪
𝐿3.
Figure 10.5: Initial (left), intermediate (middle) and final (right) proposed design model
Figure 10.6: Column with a single discrete restrain [48]
The determination of the spring stiffness KT may be contemplated referring to the literature (p.474-
475 of Ref.[31]), from which it may be deduced that, for few discrete supports, the term 𝑚𝐶
𝐸𝐼𝑙3 is
constant. In this expression, m is the number of zones of length l = L/m separated by rigid triangles
in the leg, C = 2Rmean and EI = 2EIy where Iy is the value of the flexural rigidity of one diagonal.
𝑚𝐶
𝐸𝐼𝑙3 = 𝑐𝑜𝑛𝑠𝑡 ⇒ 𝑚 · 2𝑅𝑚𝑒𝑎𝑛 · (
𝐿
𝑚)3= 2 · 𝐾𝑇 · (
𝐿
2)3 (Eq. 10.8)
This being, the equivalent spring stiffness KT may be evaluated as follows:
𝐾𝑇 =4
𝑚2(2𝑅𝑚𝑒𝑎𝑛) (Eq. 10.9)
The critical load of the equivalent column is finally given by:
2RL/3=2R
KT

Design of lattice towers made of large hot-rolled high strength steel angles
_______________________________________________________________________________
105 Marios-Zois BEZAS
𝑁𝑐𝑟 =𝜋2𝐸𝐼𝑦,𝑡𝑜𝑡
𝐿2+3
16𝐾𝑇𝐿 (Eq. 10.10)
where,
Iy,tot is the total moment of inertia about y-y geometrical axis of both diagonals (i.e
Iy,tot=2Iy,d);
L is the buckling length of the diagonal;
KT is the stiffness of the unique spring restraint, equal to 4
m2(2Rmean);
Rmean can be evaluated using eq. (10.6);
m is the number of zones of length l in the leg (l = L/m separated by rigid horizontal
triangles in the leg); the accuracy of the formulae for KT is sufficient for a value of
m ≤ 6 (i.e for maximum 5 horizontal rigid triangles in the leg);
di is the horizontal distance of the longitudinal axis of one diagonal from the
longitudinal axis of the main leg, where i is the index for the horizontal level (see
Figure 10.4).
Finally, the critical load multiplier can be evaluated using eq. (10.2).
10.2.3 Ultimate resistance of the leg
The ultimate buckling resistance of the leg may be determined by the current provisions of EN 1993-
1-1, as follows:
𝑁𝑏,𝑅𝑑 = {𝜒𝐴𝑑𝑓𝑦
𝛾𝑀1 for class 1,2 and 3 profiles
𝜒𝛢𝑑,𝑒𝑓𝑓𝑓𝑦
𝛾𝑀1for class 4 profiles
(Eq. 10.11)
where the effective area of the diagonal is given using eq. (7.2). The buckling reduction factor χ is
determined as a function of the relative slenderness:
𝜆𝑠𝑒𝑔̅̅ ̅̅ ̅̅ = √2𝑁𝑝𝑙
𝑁𝑐𝑟 (Eq. 10.12)
where,
Ncr is the critical load of the segment determined by one of the proposed models
(simplified or refined);
Npl is the plastic design resistance of one diagonal (Npl=Ad·fy).
The value of the buckling reduction factor χ can be determined from the European buckling curve d
for any steel grade. It is suggested to safely use the lowest buckling curve due to the lack of studies
showing that a higher one could be safely used. The selection of the buckling curve could be further
investigated in the future.
10.3 Validation of the proposed models
The validation of the proposed formulae (simplified and refined) has first been achieved through
comparisons to results obtained through 2D numerical simulations of the proposed models
(illustrated in Figure 10.3 and Figure 10.5-right) by means of the OSSA2D software [49], and then
through the use of the whole tower model described in chapter 9, using FINELG software. The
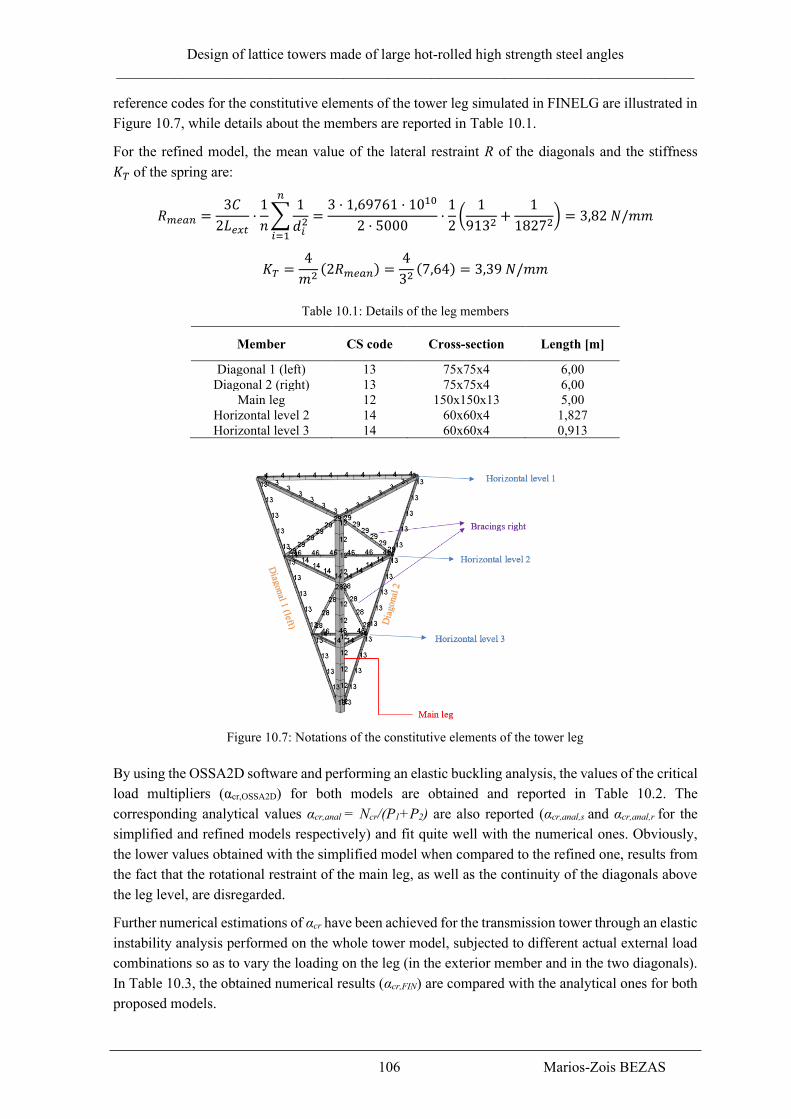
Design of lattice towers made of large hot-rolled high strength steel angles
_______________________________________________________________________________
106 Marios-Zois BEZAS
reference codes for the constitutive elements of the tower leg simulated in FINELG are illustrated in
Figure 10.7, while details about the members are reported in Table 10.1.
For the refined model, the mean value of the lateral restraint R of the diagonals and the stiffness
𝐾𝑇 of the spring are:
𝑅𝑚𝑒𝑎𝑛 =3𝐶
2𝐿𝑒𝑥𝑡·1
𝑛∑
1
𝑑𝑖2
𝑛
𝑖=1
=3 · 1,69761 · 1010
2 · 5000·1
2(1
9132+
1
18272) = 3,82 𝑁/𝑚𝑚
𝐾𝑇 =4
𝑚2(2𝑅𝑚𝑒𝑎𝑛) =
4
32(7,64) = 3,39 𝑁/𝑚𝑚
Table 10.1: Details of the leg members
Member CS code Cross-section Length [m]
Diagonal 1 (left) 13 75x75x4 6,00
Diagonal 2 (right) 13 75x75x4 6,00
Main leg 12 150x150x13 5,00
Horizontal level 2 14 60x60x4 1,827
Horizontal level 3 14 60x60x4 0,913
Figure 10.7: Notations of the constitutive elements of the tower leg
By using the OSSA2D software and performing an elastic buckling analysis, the values of the critical
load multipliers (αcr,OSSA2D) for both models are obtained and reported in Table 10.2. The
corresponding analytical values αcr,anal = Ncr/(P1+P2) are also reported (αcr,anal,s and αcr,anal,r for the
simplified and refined models respectively) and fit quite well with the numerical ones. Obviously,
the lower values obtained with the simplified model when compared to the refined one, results from
the fact that the rotational restraint of the main leg, as well as the continuity of the diagonals above
the leg level, are disregarded.
Further numerical estimations of αcr have been achieved for the transmission tower through an elastic
instability analysis performed on the whole tower model, subjected to different actual external load
combinations so as to vary the loading on the leg (in the exterior member and in the two diagonals).
In Table 10.3, the obtained numerical results (αcr,FIN) are compared with the analytical ones for both
proposed models.
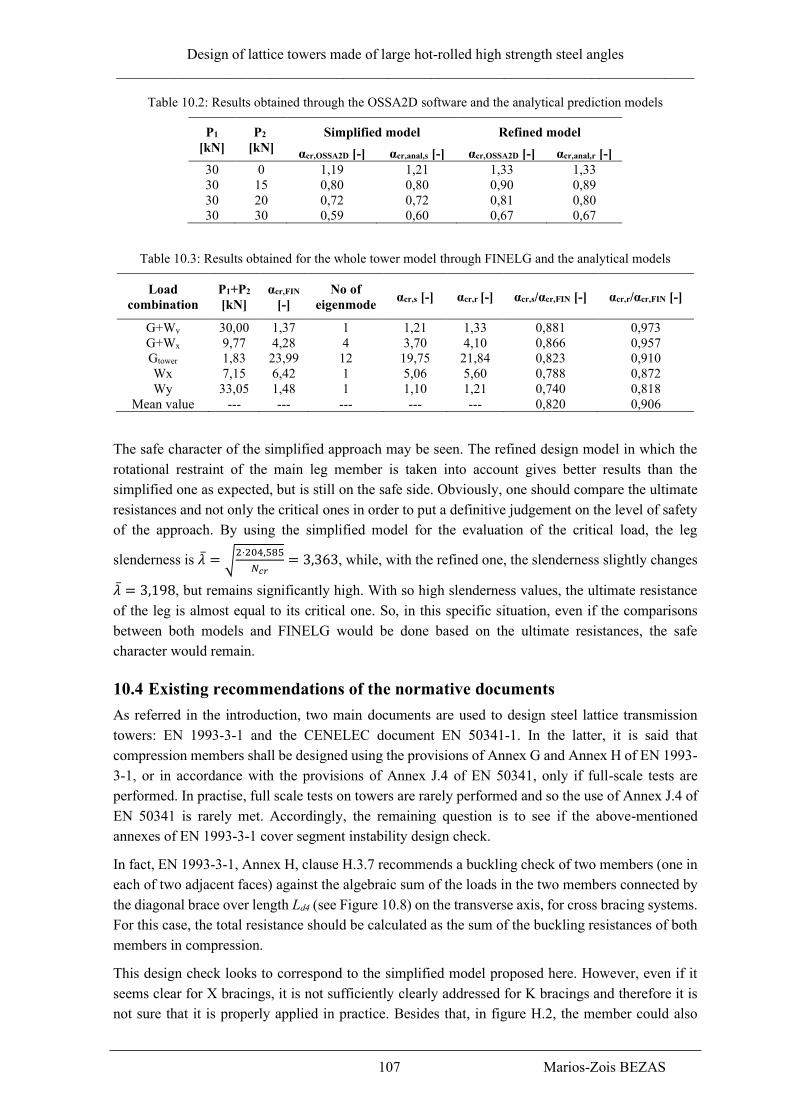
Design of lattice towers made of large hot-rolled high strength steel angles
_______________________________________________________________________________
107 Marios-Zois BEZAS
Table 10.2: Results obtained through the OSSA2D software and the analytical prediction models
P1
[kN]
P2
[kN]
Simplified model Refined model
αcr,OSSA2D [-] αcr,anal,s [-] αcr,OSSA2D [-] αcr,anal,r [-]
30 0 1,19 1,21 1,33 1,33
30 15 0,80 0,80 0,90 0,89
30 20 0,72 0,72 0,81 0,80
30 30 0,59 0,60 0,67 0,67
Table 10.3: Results obtained for the whole tower model through FINELG and the analytical models
Load
combination
P1+P2
[kN]
αcr,FIN
[-]
No of
eigenmode αcr,s [-] αcr,r [-] αcr,s/αcr,FIN [-] αcr,r/αcr,FIN [-]
G+Wy 30,00 1,37 1 1,21 1,33 0,881 0,973
G+Wx 9,77 4,28 4 3,70 4,10 0,866 0,957
Gtower 1,83 23,99 12 19,75 21,84 0,823 0,910
Wx 7,15 6,42 1 5,06 5,60 0,788 0,872
Wy 33,05 1,48 1 1,10 1,21 0,740 0,818
Mean value --- --- --- --- --- 0,820 0,906
The safe character of the simplified approach may be seen. The refined design model in which the
rotational restraint of the main leg member is taken into account gives better results than the
simplified one as expected, but is still on the safe side. Obviously, one should compare the ultimate
resistances and not only the critical ones in order to put a definitive judgement on the level of safety
of the approach. By using the simplified model for the evaluation of the critical load, the leg
slenderness is �̅� = √2·204,585
𝑁𝑐𝑟= 3,363, while, with the refined one, the slenderness slightly changes
�̅� = 3,198, but remains significantly high. With so high slenderness values, the ultimate resistance
of the leg is almost equal to its critical one. So, in this specific situation, even if the comparisons
between both models and FINELG would be done based on the ultimate resistances, the safe
character would remain.
10.4 Existing recommendations of the normative documents
As referred in the introduction, two main documents are used to design steel lattice transmission
towers: EN 1993-3-1 and the CENELEC document EN 50341-1. In the latter, it is said that
compression members shall be designed using the provisions of Annex G and Annex H of EN 1993-
3-1, or in accordance with the provisions of Annex J.4 of EN 50341, only if full-scale tests are
performed. In practise, full scale tests on towers are rarely performed and so the use of Annex J.4 of
EN 50341 is rarely met. Accordingly, the remaining question is to see if the above-mentioned
annexes of EN 1993-3-1 cover segment instability design check.
In fact, EN 1993-3-1, Annex H, clause H.3.7 recommends a buckling check of two members (one in
each of two adjacent faces) against the algebraic sum of the loads in the two members connected by
the diagonal brace over length Ld4 (see Figure 10.8) on the transverse axis, for cross bracing systems.
For this case, the total resistance should be calculated as the sum of the buckling resistances of both
members in compression.
This design check looks to correspond to the simplified model proposed here. However, even if it
seems clear for X bracings, it is not sufficiently clearly addressed for K bracings and therefore it is
not sure that it is properly applied in practice. Besides that, in figure H.2, the member could also
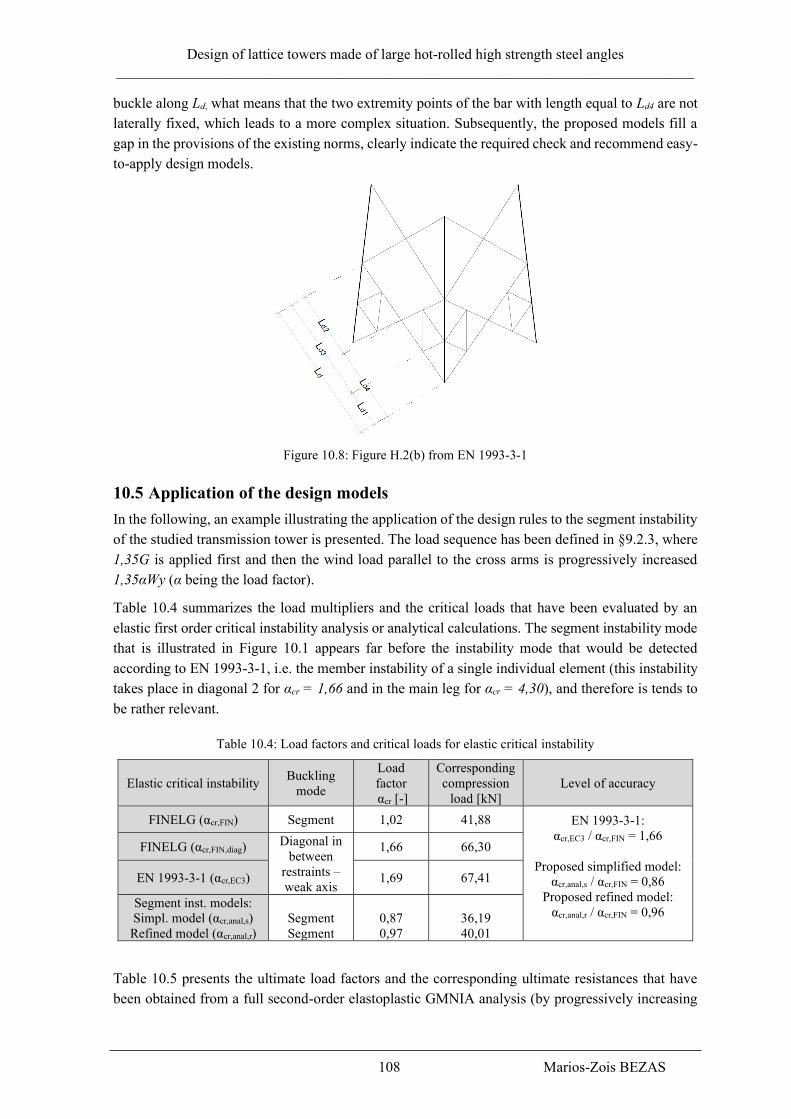
Design of lattice towers made of large hot-rolled high strength steel angles
_______________________________________________________________________________
108 Marios-Zois BEZAS
buckle along Ld, what means that the two extremity points of the bar with length equal to Ld4 are not
laterally fixed, which leads to a more complex situation. Subsequently, the proposed models fill a
gap in the provisions of the existing norms, clearly indicate the required check and recommend easy-
to-apply design models.
Figure 10.8: Figure H.2(b) from EN 1993-3-1
10.5 Application of the design models
In the following, an example illustrating the application of the design rules to the segment instability
of the studied transmission tower is presented. The load sequence has been defined in §9.2.3, where
1,35G is applied first and then the wind load parallel to the cross arms is progressively increased
1,35αWy (α being the load factor).
Table 10.4 summarizes the load multipliers and the critical loads that have been evaluated by an
elastic first order critical instability analysis or analytical calculations. The segment instability mode
that is illustrated in Figure 10.1 appears far before the instability mode that would be detected
according to EN 1993-3-1, i.e. the member instability of a single individual element (this instability
takes place in diagonal 2 for αcr = 1,66 and in the main leg for αcr = 4,30), and therefore is tends to
be rather relevant.
Table 10.4: Load factors and critical loads for elastic critical instability
Elastic critical instability Buckling
mode
Load
factor
αcr [-]
Corresponding
compression
load [kN]
Level of accuracy
FINELG (αcr,FIN) Segment 1,02 41,88 EN 1993-3-1:
αcr,EC3 / αcr,FIN = 1,66
Proposed simplified model:
αcr,anal,s / αcr,FIN = 0,86
Proposed refined model:
αcr,anal,r / αcr,FIN = 0,96
FINELG (αcr,FIN,diag) Diagonal in
between
restraints –
weak axis
1,66 66,30
EN 1993-3-1 (αcr,ΕC3) 1,69 67,41
Segment inst. models:
Simpl. model (αcr,anal,s)
Refined model (αcr,anal,r)
Segment
Segment
0,87
0,97
36,19
40,01
Table 10.5 presents the ultimate load factors and the corresponding ultimate resistances that have
been obtained from a full second-order elastoplastic GMNIA analysis (by progressively increasing
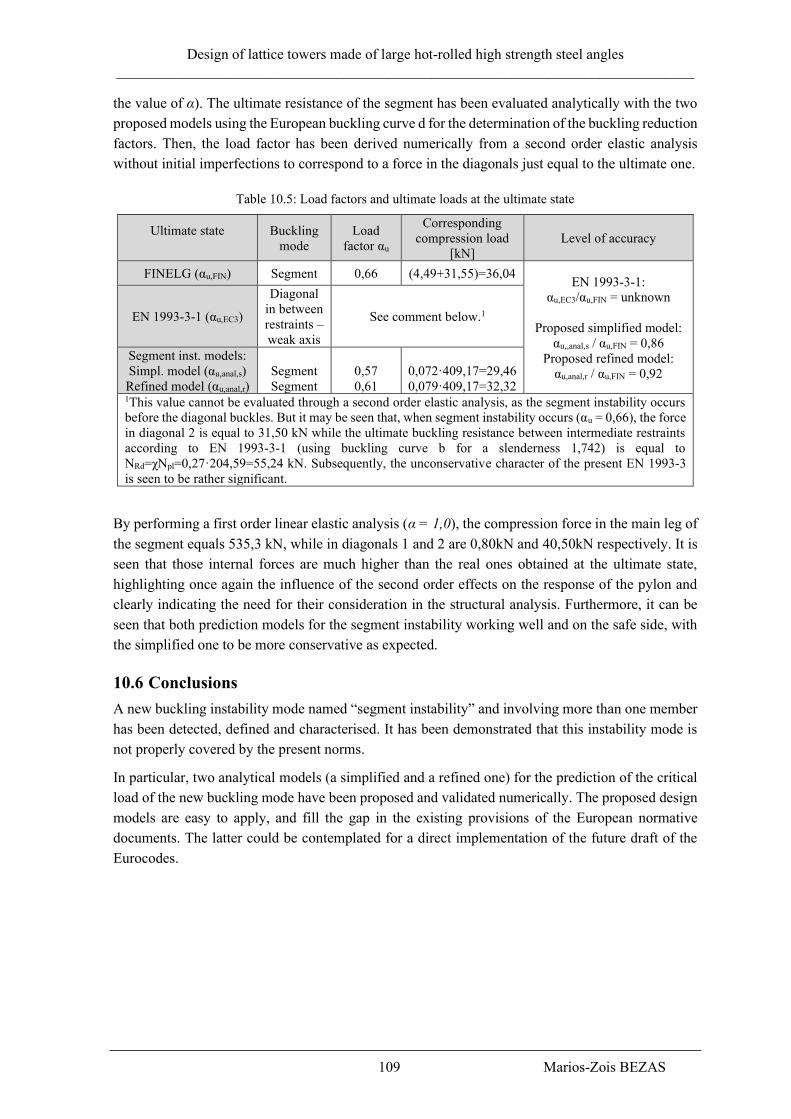
Design of lattice towers made of large hot-rolled high strength steel angles
_______________________________________________________________________________
109 Marios-Zois BEZAS
the value of α). The ultimate resistance of the segment has been evaluated analytically with the two
proposed models using the European buckling curve d for the determination of the buckling reduction
factors. Then, the load factor has been derived numerically from a second order elastic analysis
without initial imperfections to correspond to a force in the diagonals just equal to the ultimate one.
Table 10.5: Load factors and ultimate loads at the ultimate state
Ultimate state
Buckling
mode
Load
factor αu
Corresponding
compression load
[kN]
Level of accuracy
FINELG (αu,FIN) Segment 0,66 (4,49+31,55)=36,04 EN 1993-3-1:
αu,EC3/αu,FIN = unknown
Proposed simplified model:
αu,,anal,s / αu,FIN = 0,86
Proposed refined model:
αu,anal,r / αu,FIN = 0,92
EN 1993-3-1 (αu,ΕC3)
Diagonal
in between
restraints –
weak axis
See comment below.1
Segment inst. models:
Simpl. model (αu,anal,s)
Refined model (αu,anal,r)
Segment
Segment
0,57
0,61
0,072·409,17=29,46
0,079·409,17=32,32 1This value cannot be evaluated through a second order elastic analysis, as the segment instability occurs
before the diagonal buckles. But it may be seen that, when segment instability occurs (αu = 0,66), the force
in diagonal 2 is equal to 31,50 kN while the ultimate buckling resistance between intermediate restraints
according to EN 1993-3-1 (using buckling curve b for a slenderness 1,742) is equal to
NRd=χΝpl=0,27·204,59=55,24 kN. Subsequently, the unconservative character of the present EN 1993-3
is seen to be rather significant.
By performing a first order linear elastic analysis (α = 1,0), the compression force in the main leg of
the segment equals 535,3 kN, while in diagonals 1 and 2 are 0,80kN and 40,50kN respectively. It is
seen that those internal forces are much higher than the real ones obtained at the ultimate state,
highlighting once again the influence of the second order effects on the response of the pylon and
clearly indicating the need for their consideration in the structural analysis. Furthermore, it can be
seen that both prediction models for the segment instability working well and on the safe side, with
the simplified one to be more conservative as expected.
10.6 Conclusions
A new buckling instability mode named “segment instability” and involving more than one member
has been detected, defined and characterised. It has been demonstrated that this instability mode is
not properly covered by the present norms.
In particular, two analytical models (a simplified and a refined one) for the prediction of the critical
load of the new buckling mode have been proposed and validated numerically. The proposed design
models are easy to apply, and fill the gap in the existing provisions of the European normative
documents. The latter could be contemplated for a direct implementation of the future draft of the
Eurocodes.
Design of lattice towers made of large hot-rolled high strength steel angles
_______________________________________________________________________________
110 Marios-Zois BEZAS
11. GENERAL CONCLUSIONS AND PERSPECTIVES
11.1 Conclusions
Angle profiles, and more specifically equal leg ones investigated in the present thesis, exhibit some
properties that clearly distinguish them from the well-known profiles. It is known that, for a double-
symmetric cross-section, the critical load is not affected by the load eccentricity while the buckling
modes are always decoupled and the critical one is flexural. However, this is not the case for angle
sections, as they mostly buckle along their weak axis with a flexural or a flexural-torsional mode,
depending on the load eccentricity. The full decoupling of the buckling modes happens only for a
very specific case, where the member is loaded at the shear centre; this is also the only case for which
a pure torsional buckling mode can appear. Furthermore, the critical load is affected by the type of
loading; an instability can even occur for an eccentric tensile load, depending on the cross-section
geometry.
These particularities shows that existing design rules for other types of sections, mostly doubly
symmetric ones, cannot straightforwardly and safely cover angles, what inevitably leads to the need
for the development of specific design provisions for angle sections. A need that is clearly enhanced
by the lack of unified consistent rules for angles in the existing European normative documents;
design rules for angles can be currently found in EN 1993-1-1, EN 1993-3-1, EN 1993-1-5 and EN
50341-1 as explained in the introduction, but all these documents are sometimes in contradiction. In
the thesis, the existing European specifications on rolled equal angle sections were reviewed and a
complete and consistent set of design rules covering all aspects of design have been developed and
fully validated scientifically, clearing the design process for angles in contrast to the existing code
approaches.
A proposal for the classification of equal leg angle profiles, fully consistent with the Eurocode
normative documents, have been developed and validated through extensive numerical
investigations and analytical methods. The numerical investigations have been performed with the
full non-linear software ABAQUS using volume elements and are in very good agreement with the
analytical developments. Angle cross-sections have been classified separately for compression,
strong and weak axis bending, while the classification boundaries from class 3 to 4 have been
determined through the slenderness of the compression leg and not the torsional instability mode as
usually considered for other common profiles. Additionally, rules for cross-sections design
resistances including all important loading conditions (compression, weak and strong axis bending),
have been developed and validated numerically. These rules allow a smooth transition between cross-
section classes, removing any artificial stepwise prediction of resistance, as already proposed in the
new draft of Eurocode 3 for doubly symmetric sections which is presently under finalisation; they
are also less conservative than the current design rules proposed by Eurocode 3.
Design rules to predict the stability and resistance of members made of rolled equal leg angle profiles
subjected to combined normal forces and moments have also been proposed and validated through
numerical investigations and experimental tests. The extensive numerical parametrical studies were
again performed with ABAQUS software using volume elements. Experimental results are coming
from tests carried out in the framework of the thesis on large angle profiles made of S460 high
strength steel, as well as from previous experimental investigations found in literature. Appropriate
European buckling curves for flexural and lateral torsional buckling of angles have been detected
and proposed. From the experimental results, it has been shown that the proposed method allows a

Design of lattice towers made of large hot-rolled high strength steel angles
_______________________________________________________________________________
111 Marios-Zois BEZAS
safe prediction of the member capacity with an accuracy which is much better than the one obtained
with the present Code provisions.
An assessment of the current design approach used for lattice transmission towers has also been
achieved through numerical studies. From the numerical results, it can be seen that the buckling load
obtained by a 2nd order elastic analysis is smaller than the critical one obtained by an elastic instability
analysis. The reason is that the forces acting on the members in both cases differ, so affecting the
member buckling load in the case of non-symmetrical cross-sections. Moreover, these effects are
amplified when considering the actual member support conditions. Consequently, the second order
effects should be considered in the analysis as they affect the global response of the tower but also
its ultimate limit state. In addition, an instability mode for lattice towers not properly covered by the
norms has been detected and defined. Two analytical models (a simplified and a refined one) for the
prediction of the critical load of the new buckling mode have been proposed and validated
numerically. Both proposed design models are easy to apply, clearly indicate the required check to
perform and fill the gap in the existing provisions of the European normative documents. The current
provisions of Eurocode 3 have been used for the prediction of the resistance of the member associated
with this instability mode.
Concluding, all the proposed design rules and methods are simple to apply and have been written in
the format of the existing Eurocode 3 specifications. Nevertheless, they are referring only to equal
leg angle profiles mainly used in pylons; they are generic for the referred profiles.
11.2 Research contribution and innovation
The innovations and contributions of the present dissertation to the advancement of engineering
science and design practice can be summarized as following:
− Results of experimental tests on large angle high strength steel columns were presented, providing
qualitative understanding and quantitative evaluation of the member response.
− Detailed numerical simulations of the experimental tests were performed, demonstrating useful
modelling features that can prove beneficial for researchers.
− Existing European specifications on hot-rolled equal angle sections were critically reviewed,
highlighting the inconsistencies and the lack in the design approaches in these normative documents.
− A complete and full consistent set of design rules covering all aspects of design for angles was
developed, clearing thus the design process. They include cross section classification, cross section
resistance for all types of loading as well as rules for member design to individual and combined
internal normal forces and bending moments.
− Extensive experimental, analytical and numerical studies were conducted to validate the proposed
set of design rules. The validated rules can be directly applied in structural engineering design
practice involving angle profile members.
− Appropriate buckling formulas and corresponding buckling curves were proposed for flexural and
lateral-torsional buckling of angles. The buckling formulas and curves can be reliably implemented
in the structural design practice according to modern structural design standards.
− An assessment of the current design approach used for lattice transmission towers was achieved
through numerical studies. Results can be useful for designing appropriate lattice towers.

Design of lattice towers made of large hot-rolled high strength steel angles
_______________________________________________________________________________
112 Marios-Zois BEZAS
− An instability mode for lattice towers not properly covered by the norms was detected and defined.
Two analytical models for the prediction of the critical load of the new buckling mode were
developed and validated numerically. Both design models are easy to apply, clearly indicate the
required check to perform and fill the gap in the existing provisions of the European normative
documents.
− All the developed rules of the present dissertation were written in Eurocode 3 format to allow a
direct possible inclusion in forthcoming drafts.
11.3 Perspectives for future research
Based on the present dissertation, some suggestions for future research are summarized next:
− Numerical parametrical studies to find out if the application of the proposed design rules developed
for equal-leg angles, could be extended to unequal leg angles too.
− Investigations are still required to better account for the beneficial effect of the restrains due to
bolted connections at the extremities of the angle members, that is currently covered by the provisions
of EN 1993-3 through the definition of an equivalent bucking length.
− The segment instability mode detected here need further examination. First, the selection of the
buckling curve could be improved, as now it is suggested to use the lowest one (curve d) due to the
lack of studies showing that a higher one could be safely used.
− The segment instability mode detected in the framework of the thesis, was associated with a certain
tower configuration and has been observed in the tower’s leg. Consequently, further numerical and
experimental investigations are needed to check if a similar instability mode could occur in other
parts of the tower (for instance in the arms), and how this could be affected by the configuration of
the tower. Finally, the accuracy of the proposed models for other possible segment instabilities may
be checked.
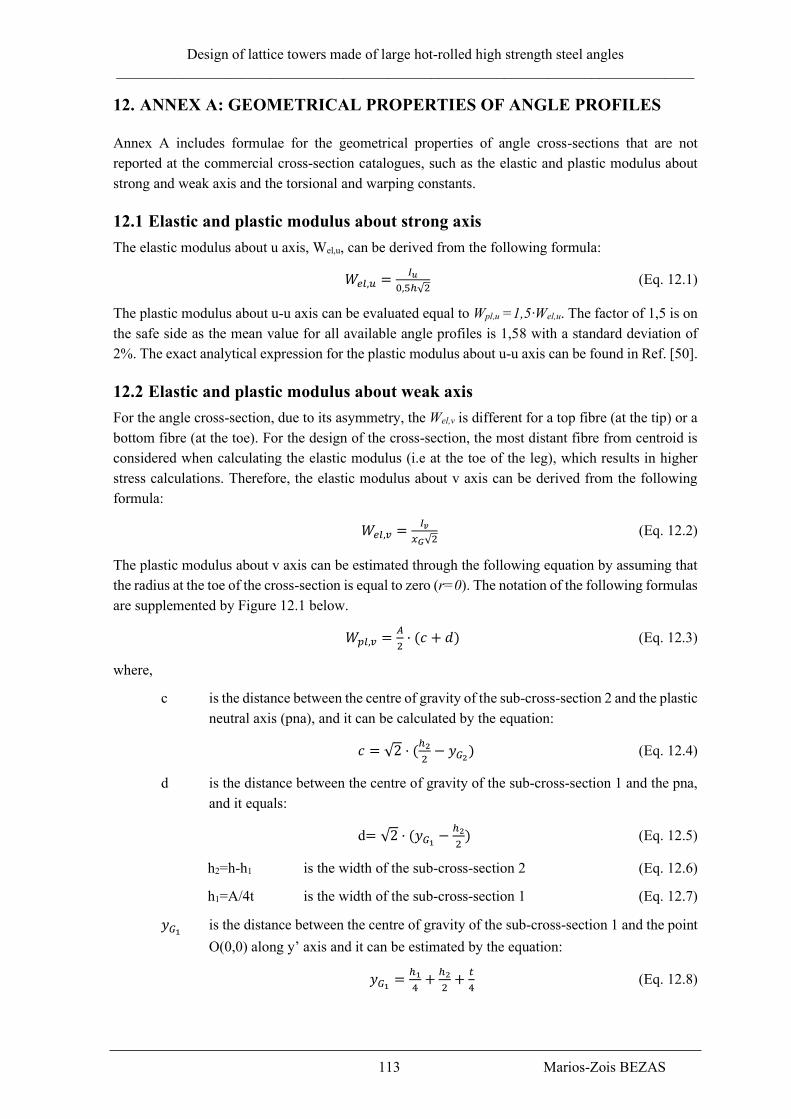
Design of lattice towers made of large hot-rolled high strength steel angles
_______________________________________________________________________________
113 Marios-Zois BEZAS
12. ANNEX A: GEOMETRICAL PROPERTIES OF ANGLE PROFILES
Annex A includes formulae for the geometrical properties of angle cross-sections that are not
reported at the commercial cross-section catalogues, such as the elastic and plastic modulus about
strong and weak axis and the torsional and warping constants.
12.1 Elastic and plastic modulus about strong axis
The elastic modulus about u axis, Wel,u, can be derived from the following formula:
𝑊𝑒𝑙,𝑢 =𝐼𝑢
0,5ℎ√2 (Eq. 12.1)
The plastic modulus about u-u axis can be evaluated equal to Wpl,u =1,5·Wel,u. The factor of 1,5 is on
the safe side as the mean value for all available angle profiles is 1,58 with a standard deviation of
2%. The exact analytical expression for the plastic modulus about u-u axis can be found in Ref. [50].
12.2 Elastic and plastic modulus about weak axis
For the angle cross-section, due to its asymmetry, the Wel,v is different for a top fibre (at the tip) or a
bottom fibre (at the toe). For the design of the cross-section, the most distant fibre from centroid is
considered when calculating the elastic modulus (i.e at the toe of the leg), which results in higher
stress calculations. Therefore, the elastic modulus about v axis can be derived from the following
formula:
𝑊𝑒𝑙,𝑣 =𝐼𝑣
𝑥𝐺√2 (Eq. 12.2)
The plastic modulus about v axis can be estimated through the following equation by assuming that
the radius at the toe of the cross-section is equal to zero (r=0). The notation of the following formulas
are supplemented by Figure 12.1 below.
𝑊𝑝𝑙,𝑣 =𝐴
2· (𝑐 + 𝑑) (Eq. 12.3)
where,
c is the distance between the centre of gravity of the sub-cross-section 2 and the plastic
neutral axis (pna), and it can be calculated by the equation:
𝑐 = √2 · (ℎ2
2− 𝑦𝐺2) (Eq. 12.4)
d is the distance between the centre of gravity of the sub-cross-section 1 and the pna,
and it equals:
d= √2 · (𝑦𝐺1 −ℎ2
2) (Eq. 12.5)
h2=h-h1 is the width of the sub-cross-section 2 (Eq. 12.6)
h1=A/4t is the width of the sub-cross-section 1 (Eq. 12.7)
𝑦𝐺1 is the distance between the centre of gravity of the sub-cross-section 1 and the point
O(0,0) along y’ axis and it can be estimated by the equation:
𝑦𝐺1 =ℎ1
4+ℎ2
2+𝑡
4 (Eq. 12.8)
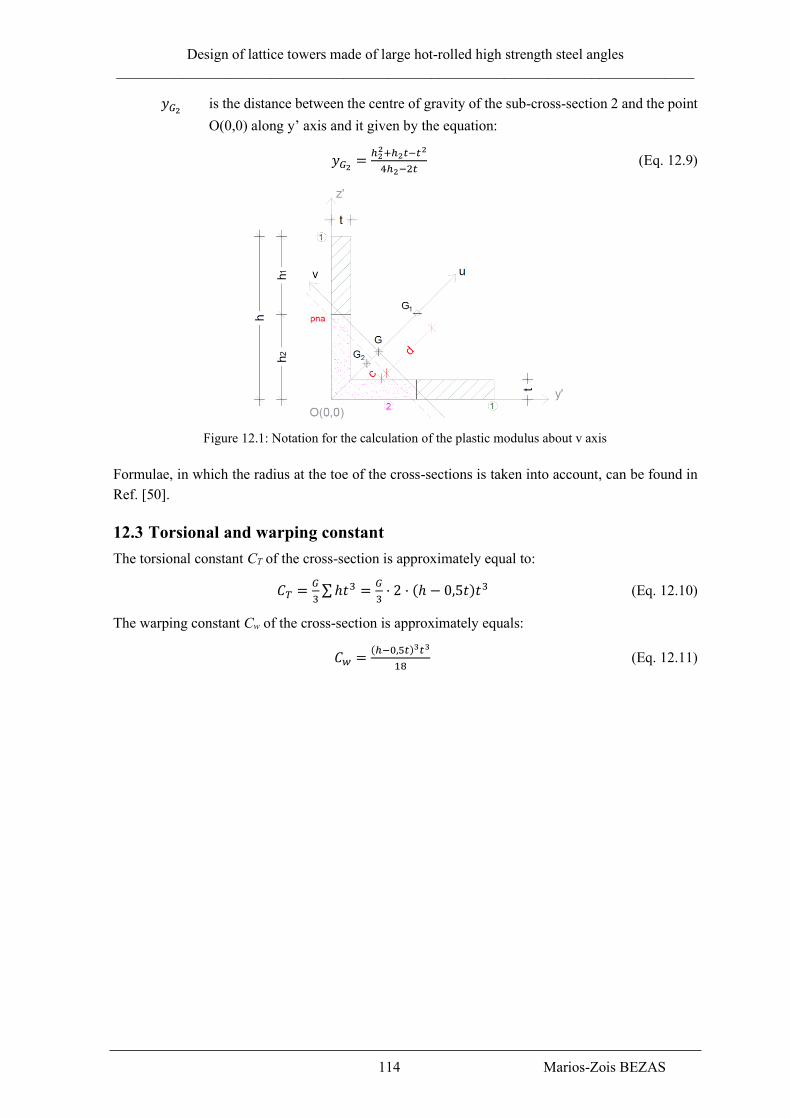
Design of lattice towers made of large hot-rolled high strength steel angles
_______________________________________________________________________________
114 Marios-Zois BEZAS
𝑦𝐺2 is the distance between the centre of gravity of the sub-cross-section 2 and the point
O(0,0) along y’ axis and it given by the equation:
𝑦𝐺2 =ℎ22+ℎ2𝑡−𝑡
2
4ℎ2−2𝑡 (Eq. 12.9)
Figure 12.1: Notation for the calculation of the plastic modulus about v axis
Formulae, in which the radius at the toe of the cross-sections is taken into account, can be found in
Ref. [50].
12.3 Torsional and warping constant
The torsional constant CT of the cross-section is approximately equal to:
𝐶𝑇 =𝐺
3∑ℎ𝑡3 =
𝐺
3· 2 · (ℎ − 0,5𝑡)𝑡3 (Eq. 12.10)
The warping constant Cw of the cross-section is approximately equals:
𝐶𝑤 =(ℎ−0,5𝑡)3𝑡3
18 (Eq. 12.11)

Design of lattice towers made of large hot-rolled high strength steel angles
_______________________________________________________________________________
115 Marios-Zois BEZAS
13. ANNEX B: NUMERICAL SIMULATION OF FULL-SCALE TESTS
In this annex, FINELG finite element software is used to predict the ultimate resistance and the
failure mode of full-scale tests performed on lattice towers at the National Technical University of
Athens and reported in Ref. [51] and [52].
13.1 Details of the tests
The experimental program consists of six full-scale tests on cell network telecommunication lattice
towers subjected to horizontal forces at their tops, increased gradually until failure occurs. Three
specimens have been subjected to orthogonal loading and three to diagonal loading as shown in
Figure 13.1. In order to transfer the horizontal force evenly to the top level, a 6 mm thick steel plate
of 100 kg weight acting as diaphragm was placed and bolted to all the beams of the top level (Figure
13.2). Amongst the tested towers, two have been strengthened with FRP strips; they are not
considered here.
Figure 13.1: Reaction frame and towers of type O (orthogonal) left and type D (diagonal) right [51]
Figure 13.2: Tested tower with diagonal loading [51]
The geometry of the specimen-tower is illustrated in Figure 13.3. The overall external dimensions
were 1,44x1,44x6,82 [m], while the axial distance between centroids of the tower legs was 1,40 [m].
The tower is subdivided in 4 levels, each with a height of 1,70 [m]. All the members of the tower are
made of single angle profiles and are detailed in Table 13.1; their actual material properties are

Design of lattice towers made of large hot-rolled high strength steel angles
_______________________________________________________________________________
116 Marios-Zois BEZAS
summarized in Table 13.2, while, for those that no tensile test has been performed, the nominal values
of steel grade S275 are used.
Figure 13.3: Tower dimensions in plan and side view
The columns run continuously over the height of the towers, while the bracing members were bolted
at their extremities with one bolt. The horizontal external members were bolted directly to the column
legs, the braces directly to the columns at the lower end and to a gusset plate 150x120x5 mm at its
top, while the horizontal internal members to gusset plates 210x140x5 mm at both extremities. The
experimental failure load and the corresponding mode are reported in Table 13.1.
Table 13.1 Results of the tested towers
Test
code
Loading
direction
Profiles for
legs
Profiles for
braces/horizontals
Experimental
failure load [kN]
Experimental
failure mode
O-1 Orthogonal L 70x70x7 L 45x45x5 39,00 Buckling of
diagonals
O-2 Orthogonal L 70x70x7 L 65x65x7 106,5 Buckling of
lower legs
D-1 Diagonal L 70x70x7 L 40x40x4 38,50 Buckling of
diagonals
D-2 Diagonal L 70x70x7 L 60x60x6 78,50 Buckling of
lower legs

Design of lattice towers made of large hot-rolled high strength steel angles
_______________________________________________________________________________
117 Marios-Zois BEZAS
Table 13.2 Measured material properties of the tested angle profiles
No Profile Yield strength
fy [Mpa]
Ultimate
strength fu [Mpa]
1 L 70x70x7 308,3 435,7
2 L 45x45x5 286,7 416,7
3 L 40x40x4 325,7 435,4
4 L 60x60x6 280,0 403,9
13.2 Description of the numerical model of the tower
The ultimate resistance and the failure mode of the tested towers are predicted through full non-linear
analyses. The tower is modelled with FINELG finite element software [25] using beam elements
with 7 degrees of freedom. The members have been considered in their exact position in terms of
orientation and eccentricities (Figure 13.4). The main legs have been simulated as continuous
elements along their length. The tower is assumed to be clamped at the ground, so as to reflect the
actual support conditions of the laboratory tests.
The bracing members were connected through bolts and gusset plates. At the level of the connections,
the bolts have been represented by fictitious elements possessing a very low torsional stiffness, as
recommended in Ref. [53]. In Figure 13.4(b), one may observe that the gusset plate have been
modelled through a beam finite element. Consequently, the eccentricity between the horizontal
member and the diagonals is also accounted for. The gusset plates, welded to the horizontal members
in the specimens, have been simulated as clamped to the horizontal members. The diagonals have
been connected to the gusset plate using fictitious elements with a low torsional stiffness reproducing
a pinned “one bolt” connection.
(a)
(b)
(c)
Figure 13.4 (a) 3-D tower model, (b) Detail of the connection between horizontal and vertical bracings, (c)
Detail of the connection between vertical bracings and leg
The self-weight of the structure (W) has been calculated automatically by the software, while the
horizontal loads (H) were introduced at the extremities of the legs at the top level. The steel plate on
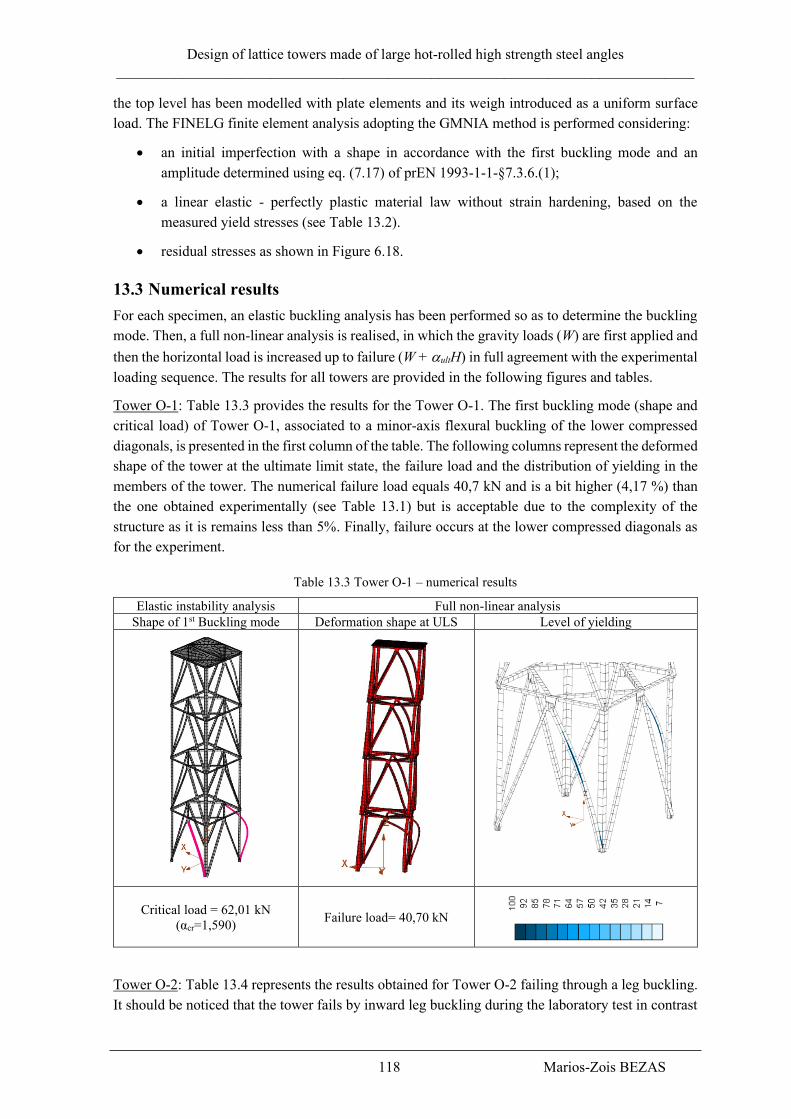
Design of lattice towers made of large hot-rolled high strength steel angles
_______________________________________________________________________________
118 Marios-Zois BEZAS
the top level has been modelled with plate elements and its weigh introduced as a uniform surface
load. The FINELG finite element analysis adopting the GMNIA method is performed considering:
• an initial imperfection with a shape in accordance with the first buckling mode and an
amplitude determined using eq. (7.17) of prEN 1993-1-1-§7.3.6.(1);
• a linear elastic - perfectly plastic material law without strain hardening, based on the
measured yield stresses (see Table 13.2).
• residual stresses as shown in Figure 6.18.
13.3 Numerical results
For each specimen, an elastic buckling analysis has been performed so as to determine the buckling
mode. Then, a full non-linear analysis is realised, in which the gravity loads (W) are first applied and
then the horizontal load is increased up to failure (W + ultH) in full agreement with the experimental
loading sequence. The results for all towers are provided in the following figures and tables.
Tower O-1: Table 13.3 provides the results for the Tower O-1. The first buckling mode (shape and
critical load) of Tower O-1, associated to a minor-axis flexural buckling of the lower compressed
diagonals, is presented in the first column of the table. The following columns represent the deformed
shape of the tower at the ultimate limit state, the failure load and the distribution of yielding in the
members of the tower. The numerical failure load equals 40,7 kN and is a bit higher (4,17 %) than
the one obtained experimentally (see Table 13.1) but is acceptable due to the complexity of the
structure as it is remains less than 5%. Finally, failure occurs at the lower compressed diagonals as
for the experiment.
Table 13.3 Tower O-1 – numerical results
Elastic instability analysis Full non-linear analysis
Shape of 1st Buckling mode Deformation shape at ULS Level of yielding
Critical load = 62,01 kN
(αcr=1,590) Failure load= 40,70 kN
Tower O-2: Table 13.4 represents the results obtained for Tower O-2 failing through a leg buckling.
It should be noticed that the tower fails by inward leg buckling during the laboratory test in contrast
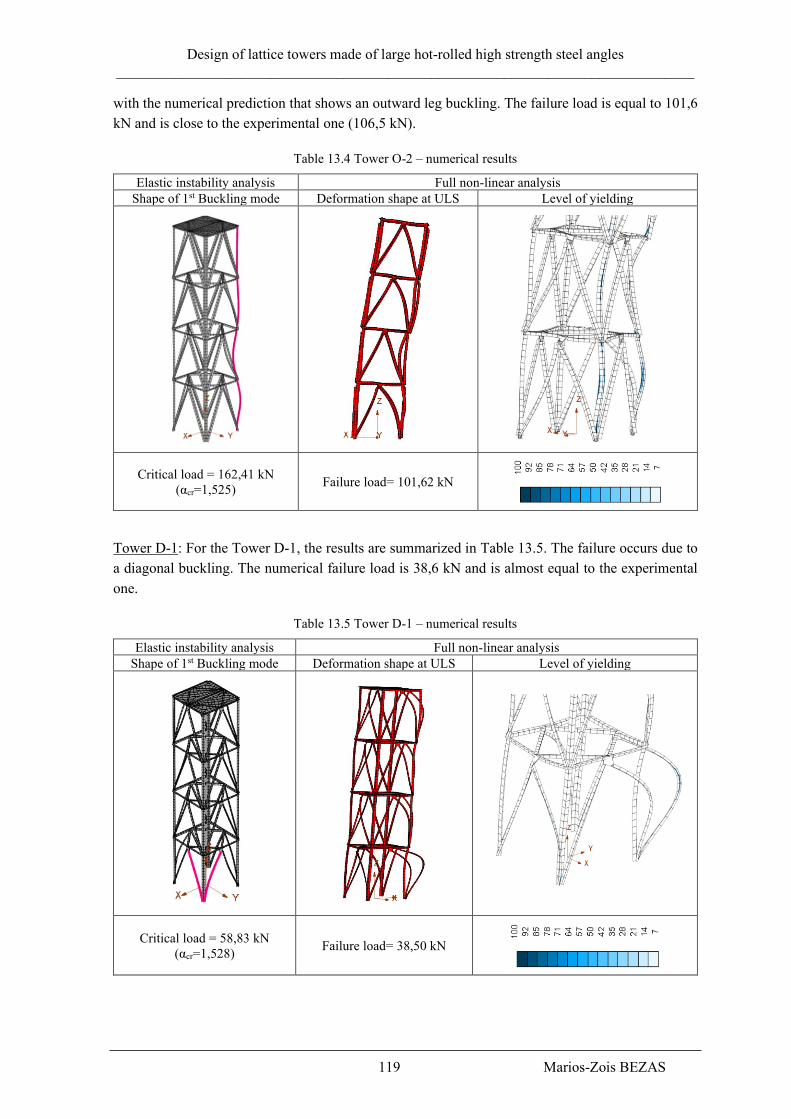
Design of lattice towers made of large hot-rolled high strength steel angles
_______________________________________________________________________________
119 Marios-Zois BEZAS
with the numerical prediction that shows an outward leg buckling. The failure load is equal to 101,6
kN and is close to the experimental one (106,5 kN).
Table 13.4 Tower O-2 – numerical results
Elastic instability analysis Full non-linear analysis
Shape of 1st Buckling mode Deformation shape at ULS Level of yielding
Critical load = 162,41 kN
(αcr=1,525) Failure load= 101,62 kN
Tower D-1: For the Tower D-1, the results are summarized in Table 13.5. The failure occurs due to
a diagonal buckling. The numerical failure load is 38,6 kN and is almost equal to the experimental
one.
Table 13.5 Tower D-1 – numerical results
Elastic instability analysis Full non-linear analysis
Shape of 1st Buckling mode Deformation shape at ULS Level of yielding
Critical load = 58,83 kN
(αcr=1,528) Failure load= 38,50 kN

Design of lattice towers made of large hot-rolled high strength steel angles
_______________________________________________________________________________
120 Marios-Zois BEZAS
Tower D-2: The results for the Tower D-2 are reported in Table 13.6. The tower fails due to a
buckling of the most compressed diagonal for a design load equal to 74,7 kN to be compared to the
experimental one equal to 78,5 kN. The buckling is developing to the inside of the tower as observed
during the experimental test. It can be observed that analyses predicting a diagonal buckling failure
give results rather close to the tests.
Table 13.6 Tower D-2 – numerical results
Elastic instability analysis Full non-linear analysis
Shape of 1st Buckling mode Deformation shape at ULS Level of yielding
Critical load = 119,16 kN
(αcr=1,518) Failure load= 74,68 kN
Table 13.7 summarises both experimental and numerical results. It can be seen that the numerical
simulation gives very satisfying results that are quite close to the tested ones.
Table 13.7 Results of different design approaches
Tower
Experimental
ultimate load
[kN]
Experimental
failure mode
Numerical
ultimate load
[kN]
Numerical
failure mode Difference [%]
O-1 39,00 Buckling of
diagonals 40,7
Buckling of
diagonals -4,17
O-2 106,5 Buckling of lower
legs 101,6
Buckling of
lower legs 4,58
D-1 38,50 Buckling of
diagonals 38,6
Buckling of
diagonals -0,34
D-2 78,50 Buckling of lower
legs 74,7
Buckling of
lower legs 4,86

Design of lattice towers made of large hot-rolled high strength steel angles
_______________________________________________________________________________
121 Marios-Zois BEZAS
14. REFERENCES
[1] EN 1993-1-1: Design of steel structures - Part 1-1: General rules and rules for buildings,
Brussels, Comité Européen de Normalisation (CEN), 2005.
[2] EN 1993-3-1: Design of steel structures - Part 3-1: Towers, masts and chimneys – Towers and
masts, Brussels, Comité Européen de Normalisation (CEN), 2007.
[3] EN 1993-1-8: Design of steel structures - Part 1-8: Design of joints, Brussels, Comité
Européen de Normalisation (CEN), 2005.
[4] EN 1993-1-5: Design of steel structures - Part 1-5: Plate structural elements, Brussels, Comité
000.Europeen de Normalisation (CEN), 2006.
[5] EN 50341-1: Overhead electrical lines exceeding AC 1 kV - Part 1: General requirements -
Common specifications, 2012.
[6] EN 1990: Eurocode - Basis of structural design, Brussels, Comité 000.Europeen de
Normalisation (CEN), 2005.
[7] Load and resistance factor specifications for single-angle members, AISC, 2000.
[8] Vayas I., Charalampakis A., Koumousis V., “Inelastic resistance of angle sections subjected
to biaxial bending and normal forces”, Steel Construction, vol. 2, no. 2, pp.138-146, 2009.
[9] Trahair N., “Bearing, Shear, and Torsion Capacities of Steel Angle Sections”, Journal of
Structural Engineering, Vol. 128, No. 11, ASCE, 2002.
[10] Schillo N., Feldmann M., “Buckling resistance of L-profiles in towers, masts and open line
Constructions”, Stahlbau 84, Heft 12, 946-954, 2015. (in German)
[11] Kettler M., Lichtl G., Unterweger H., “Laboratory tests on bolted steel angles in compression
with varying end support conditions”, Journal of Constructional steel research Vol.155, pp.
301-315, 2019.
[12] Hussain A., Liu Y.P., Chan S.L., “Finite Element Modelling and Design of Single Angle
Member Under Bi-axial Bending”, Structures, Vol.16, pp.373-389, 2018.
[13] Ban H.Y, Shi G., Shi Y.J, Wang Y.Q, “Column buckling tests of 420MPa high strength steel
single equal angles”, International Journal of Structural Stability and Dynamics, Vol.13, Issue
2, pp. 1250069-1–1250069-23, 2013.
[14] Spiliopoulos A., Dasiou M.E., Thanopoulos P., Vayas I., “Experimental tests on members
made from rolled angle sections”, Steel Construction Design and Research, Volume 11, Issue
1, pp. 84-93, 2018.
[15] Reininghaus M., Skottke M., “Dimensioning of pressed angle steel with one screw joint based
on the standards DIN 18800-2 and EN 1993-3-1”, Stahlbau 74 H7, p.p.534-538, 2005.
[16] Albermani F.G.A., Kitipornchai S., “Numerical simulation of structural behaviour of
transmission towers”, Thin-Walled Structures, Vol. 41, pp. 167–177, doi:10.1016/S0263-
8231(02)00085-X, 2003.
[17] da Silva J.G.S, da S. Vellasco P.C.G, de Andrade S.A.L, de Oliveira M.I.R., “Structural
assessment of current steel design models for transmission and telecommunication towers”,
Journal of constructional steel research, Vol. 61, pp.1108-1134,
doi:10.1016/j.jcsr.2005.02.009, 2005.
[18] Jiang W.Q., Wanga Z.Q., McClure G., Wangc G.L., Gengd J.D., “Accurate modelling of joint
effects in lattice transmission towers”, Engineering structures, Vol. 33, pp.1817-1827,
doi:10.1016/j.engstruct.2011.02.022, 2011.
[19] Kitipornchai S., AlBermani F.G.A., Peyrot A.H., “Effect of bolt slippage on ultimate
behaviour of lattice structures”, Journal of Structural Engineering, Vol.120, Issue 8,
doi.org/10.1061/(ASCE)0733-9445(1994)120:8(2281), 1994.
[20] Nuño J., Miller M., Kempner L., “Historical perspective of full-scale latticed steel
transmission tower testing”, Electrical Transmission and Substation Structures, pp. 313-322,
doi:10.1061/9780784412657.027, 2012.

Design of lattice towers made of large hot-rolled high strength steel angles
_______________________________________________________________________________
122 Marios-Zois BEZAS
[21] Ziemian R.D., “Guide to stability design criteria for metal structures”, ISBN 978-0-470-
08525-7, John Wiley & Sons, Inc., Hoboken, New Jersey, 2010.
[22] de Ville de Goyet V., “L’analyse statique non linéaire par la méthode des éléments finis des
structures spatiales formées de poutres a section non symétrique”, PhD thesis (in French),
University of Liège, 1989.
[23] Vlassov B.Z., “Pièces longues en voiles minces”, traduit par SMIRNOFF G., Editions
Eyrolles, Paris, 1962
[24] Trahair N.S., “Restrained elastic beam-columns”, Journal of the Structural Division, 1969.
[25] FINELG: Non-linear finite element analysis program, User’s manual, Version 9.0, Greisch
Ingeniere, 2003.
[26] prEN 1993-1-1: Design of steel structures - Part 1-1: General rules and rules for buildings,
Brussels, Comité Européen de Normalisation (CEN), 2019.
[27] ABAQUS, User’s manual, Version 6.14, Simulia, 2014.
[28] EN 10056-2: Structural steel equal and unequal leg angles - Part 2: Tolerances on shape and
dimensions, Brussels, Comité Européen de Normalisation (CEN), 1993.
[29] prEN 1993-1-14 (20ΧΧ): ΧΧΧΧ, Brussels. Comité Européen de Normalisation (CEN), 2018.
[30] Eaton K.J., “ESDEP-European Steel Design Education Programme”, 3rd Nordic conference on
computer aided learning, Finland, ISBN 9512207311, Helsinki University of Technology,
1991.
[31] Petersen C., “Statik und Stabilität der Baukonstruktionen” (in German), ISBN 978-3-528-
18663-0, Friedrich Vieweg & Sohn Verlag, Germany, 1982.
[32] Gardner L., Fieber A., Macorini L., “Formulae for Calculating Elastic Local Buckling Stresses
of Full Structural cross-sections”, Structures, Vol.17, pp. 2-20, 2019.
[33] Greiner R., Lechner A., Kettler M., Jaspart J.P., Weynand K., Oerder R., Dehan V.,
“Valorisation action of plastic member capacity of semi-compact steel sections: A more
economic design (SEMI-COMP+)”, RFCS European Research project, Directorate-General
for Research and Innovation (European Commission), ISBN 978-92-79-29312-2, 2013.
[34] Bezas M.Z., Jaspart J.P., Demonceau J.F., Labeye N., “Report about the compression tests on
large angle columns in high strength steel”, Research Program of the Research Fund for Coal
and Steel ANGELHY, Grant Agreement Number: 753993, European Commission, University
of Liège, 2020.
[35] EN 1090-2: Technical requirements for the execution of steel structures, Comité Européen de
Normalisation (CEN), 2008.
[36] EN ISO 6892 – 1: Metallic materials – Tensile testing – Part 1: Method of test at room
temperature, Brussels, Comité Européen de Normalisation (CEN), 2016.
[37] EN ISO 377: Steel and steel products – Location and preparation of samples and test pieces
for mechanical testing, Brussels, Comité Européen de Normalisation (CEN), 1997.
[38] Zhang L., Jaspart J.P., “Stability of members in compression made of large hot-rolled and
welded angles”, Research Report, University of Liège, 2013.
[39] Moze P., Cajot L.G., Sinur F., Rejec K., & Beg D., “Residual stress distribution of large steel
equal leg angles”, Engineering Structures, Vol.71, 35-47, 2014.
[40] de Menezes A.A., da S. Vellasco P.C.G., de Lima L.R.O., da Silva A.T., “Experimental and
numerical investigation of austenitic stainless steel hot-rolled angles under compression”,
Journal of Constructional Steel Research, Vol.152, pp. 42-56, 2019.
[41] TOWER User’s Manual – Version1 15.0, ©Power Line Systems Inc, 2017.
[42] Fischer R, Kießling F, “Freileitungen: Planung, Berechnung, Ausführung”, 4 Auflage,
Springer Verlag, 2013.
[43] EN 50182, Conductors for overhead lines - Round wire concentric lay, 2018.
Design of lattice towers made of large hot-rolled high strength steel angles
_______________________________________________________________________________
123 Marios-Zois BEZAS
[44] EN 50341-2-4, Overhead electrical lines exceeding AC 1 kV - Part 2-4: National Normative
Aspects (NNA) for Germany (based on EN 50341-1:2012), 2016.
[45] Bezas M.Z., Tibolt M., Jaspart J.P., Demonceau J.F., “Critical assessment of the design of an
electric transmission tower”, 9th International Conference on Steel and Aluminium Structures,
3-5 July, Bradford UK, 2019.
[46] Beyer A., Bureau A., Vayas I., Thanopoulos P., Bezas M.Z., Tibolt M., Jaspart J.P.,
Demonceau J.F., Papailiopoulou A., “Report on analysis and design of 6 case studies”,
Research Program of the Research Fund for Coal and Steel ANGELHY, Grant Agreement
Number: 753993, European Commission, NTUA, 2019.
[47] EN 1993-1-4, Actions on structures - Part 14: General actions, Wind actions, Comité
Européen de Normalisation (CEN), 2005.
[48] Gardner L., “Stability of steel beams and columns in accordance with Eurocodes and UK
National Annexes”, SCI publication P360, ISBN 978-1-85942-199-4, Berkshire, UK, 2011.
[49] OSSA2D: Finite element analysis program, User’s manual, Version 3.4, University of Liege,
2020.
[50] Charalampakis A.E., “Full plastic capacity of equal-angle sections under biaxial bending and
normal force”, https://doi.org/10.1016/j.engstruct.2011.02.044, Engineering Structures,
Vol.33, Issue 6, pp. 2085-2090, 2011.
[51] Vayas I., Vlachakis K., Palantzas G., Lignos X., Giquel Y., Reygner S, “Report on full scale
experimental tests for complete towers”, Research Program of the Research Fund for Coal and
Steel ANGELHY, Grant Agreement Number: 753993, European Commission, NTUA, 2019.
[52] Vlachakis K., Beyer A., Vayas I., “Tragverhalten von Fachwerkmasten aus Winkelprofilen”,
Stahlbau 90, Issue 6, pp 425-440, https://doi.org/10.1002/stab.202000059, 2021.
[53] Beyer A., Bureau A., Vayas I., Thanopoulos P., Vamvatsikos D., Vlachakis K., Bezas M.Z.,
Dasiou M.E., “Guidance on analysis models for complete towers”, Research Program of the
Research Fund for Coal and Steel ANGELHY, Grant Agreement Number: 753993, European
Commission, NTUA, 2020.