Design of Digital Hardware System for Pulse Signals
10
Journal of Medical Systems, Vol. 25, No. 6, December 2001 ( c 2001) Design of Digital Hardware System for Pulse Signals Junyoung Lee, 1, 3 Jeonghoon Kim, 2 and Myoungho Lee 1 In this study, we have developed the digital hardware system which performs signal processing necessary for the filtering to eliminate noises by inputting pulse wave sig- nals from the sensor group. With a view to obtain clinically effective information, we analyzed structural elements of pulse waveform and, thus, conducted a systematic clas- sification. What is more, we performed the modeling of the digital filter by using the Steiglitz–McBride iteration method in order to get the same results with output signals coming out of an galvanometer of analog type of existing Pulse diagnosis system with input signals entering into galvanometer and coming out of the amp group of the Pulse diagnosis system. KEY WORDS: pulse diagnosis; digital hardware system; recognition algorithm. INTRODUCTION Palpation is a procedure or a method to diagnose diseases, especially in pharma- cotherapy, acupuncture, and moxibustion therapy of oriental 4-fundamental therapy. When palpation is closely combined with looking, hearing, or speaking inspection, it will, most of all, be helpful to deciding the nature of a disease and inferring the real character of disease. The aforementioned four kinds of diagnosis methods are also referred to as the 4-diagnosis method in the Eastern medicine. Especially with a pulse that has ceased to beat, one of the methods of palpation, which is otherwise called pulse diagnosis, has held an extremely important position in diagnostics. (1) Such pulse diagnosis stems from the experiences acquired from repeated practices in the course of fighting against same diseases over a long period of time from remote ages. Because the pulse diagnosis method diagnoses diseases from the changes that take place in a body, it has been considered as an effective diagnosis method. Fur- thermore, pulse diagnosis has been an indispensably important objective basis for deciding the nature of a disease since old times. In this sense, many oriental doctors 1 Department of Electrical & Electronic Engineering, Graduate School of Yonsei University, Seoul, Korea. 2 Department of Electronic and Communication, Shinheung College, Kyungki-Do, Korea. 3 To whom correspondence should be addressed. 385 0148-5598/01/1200-0385$19.50/0 C 2001 Plenum Publishing Corporation
-
Upload
independent -
Category
Documents
-
view
1 -
download
0
Transcript of Design of Digital Hardware System for Pulse Signals

P1: FLW/FGD P2: FLW
Journal of Medical Systems [joms] PP215-342378 August 29, 2001 12:26 Style file version Nov. 19th, 1999
Journal of Medical Systems, Vol. 25, No. 6, December 2001 ( c© 2001)
Design of Digital Hardware System for Pulse Signals
Junyoung Lee,1,3 Jeonghoon Kim,2 and Myoungho Lee1
In this study, we have developed the digital hardware system which performs signalprocessing necessary for the filtering to eliminate noises by inputting pulse wave sig-nals from the sensor group. With a view to obtain clinically effective information, weanalyzed structural elements of pulse waveform and, thus, conducted a systematic clas-sification. What is more, we performed the modeling of the digital filter by using theSteiglitz–McBride iteration method in order to get the same results with output signalscoming out of an galvanometer of analog type of existing Pulse diagnosis system withinput signals entering into galvanometer and coming out of the amp group of the Pulsediagnosis system.
KEY WORDS: pulse diagnosis; digital hardware system; recognition algorithm.
INTRODUCTION
Palpation is a procedure or a method to diagnose diseases, especially in pharma-cotherapy, acupuncture, and moxibustion therapy of oriental 4-fundamental therapy.When palpation is closely combined with looking, hearing, or speaking inspection,it will, most of all, be helpful to deciding the nature of a disease and inferring thereal character of disease. The aforementioned four kinds of diagnosis methods arealso referred to as the 4-diagnosis method in the Eastern medicine. Especially witha pulse that has ceased to beat, one of the methods of palpation, which is otherwisecalled pulse diagnosis, has held an extremely important position in diagnostics.(1)
Such pulse diagnosis stems from the experiences acquired from repeated practices inthe course of fighting against same diseases over a long period of time from remoteages. Because the pulse diagnosis method diagnoses diseases from the changes thattake place in a body, it has been considered as an effective diagnosis method. Fur-thermore, pulse diagnosis has been an indispensably important objective basis fordeciding the nature of a disease since old times. In this sense, many oriental doctors
1Department of Electrical & Electronic Engineering, Graduate School of Yonsei University, Seoul, Korea.2Department of Electronic and Communication, Shinheung College, Kyungki-Do, Korea.3To whom correspondence should be addressed.
385
0148-5598/01/1200-0385$19.50/0 C© 2001 Plenum Publishing Corporation

P1: FLW/FGD P2: FLW
Journal of Medical Systems [joms] PP215-342378 August 29, 2001 12:26 Style file version Nov. 19th, 1999
386 Lee, Kim, and Lee
Fig. 1. Structure of the main system.
have highly valued and widely used pulse diagnosis. Nevertheless, in the case of theexisting pulse wave diagnosis, only a highly experienced oriental physician could di-agnose Negative(Yin), Positive(Yang), Superficial, Deep, Cold Nature, Hot Nature,Deficient and Excessive of a disease, checking pulses by looking at the analog type ofpulse wave signals printed by a thermo-transcript printer and combining 3-diagnosissuch as looking, hearing and speaking inspection. Based on such a systematic pulsewave diagnosis method, the paper presents parameters that will be beneficial to clin-ical application on the basis of its analysis of the filtering for eliminating noises frompulse wave signals inputted from sensor group.
MATERIALS AND METHODS
Designed Hardware System
This study designs hardware to efficiently deal with pulse waveform inputtedthrough the amp group. As a main processor, i386-EX processor, which is a 32-bitprocessor of Intel, is mounted, and as an input device, the 8× 16 key-matrix is used.As an output device, Samsung UG-32F01 LCD with 320× 240 dot graphic function isused. In order to be connected to printers for a common PC for outputting diagnosisresults and pulse waveform without an extra printer, a printer port to support theECP/EPP mode is built in. In addition, maintenance and security of the system areavailable with 1 Mb Flash memory block in the system board for an easy upgrade ofdiagnosis software or system operation programs(2,3) (Fig. 1).
P1: FLW/FGD P2: FLW
Journal of Medical Systems [joms] PP215-342378 August 29, 2001 12:26 Style file version Nov. 19th, 1999
Design of Digital 387
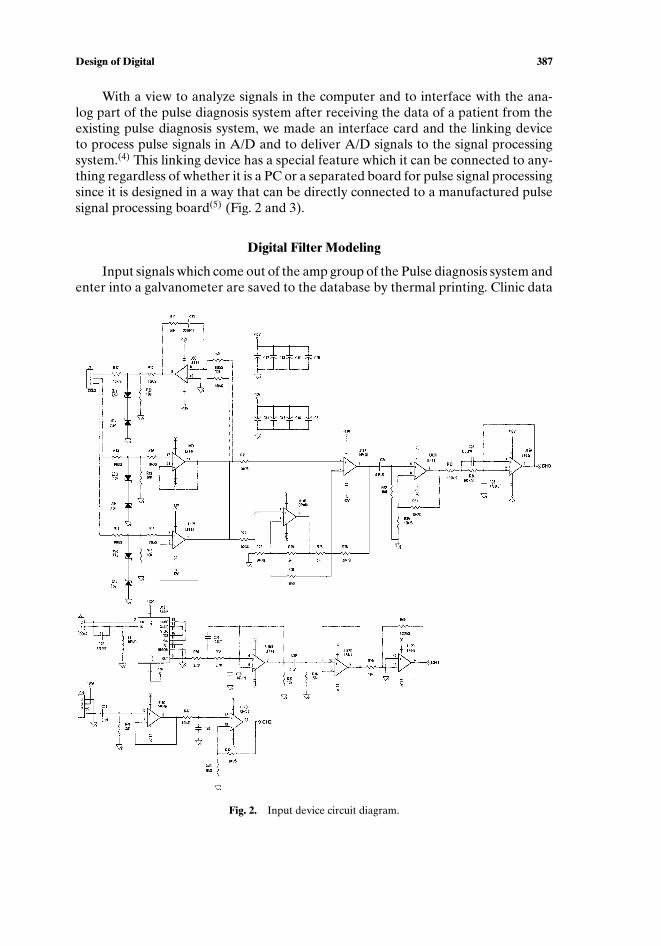
With a view to analyze signals in the computer and to interface with the ana-log part of the pulse diagnosis system after receiving the data of a patient from theexisting pulse diagnosis system, we made an interface card and the linking deviceto process pulse signals in A/D and to deliver A/D signals to the signal processingsystem.(4) This linking device has a special feature which it can be connected to any-thing regardless of whether it is a PC or a separated board for pulse signal processingsince it is designed in a way that can be directly connected to a manufactured pulsesignal processing board(5) (Fig. 2 and 3).
Digital Filter Modeling
Input signals which come out of the amp group of the Pulse diagnosis system andenter into a galvanometer are saved to the database by thermal printing. Clinic data
Fig. 2. Input device circuit diagram.

P1: FLW/FGD P2: FLW
Journal of Medical Systems [joms] PP215-342378 August 29, 2001 12:26 Style file version Nov. 19th, 1999
388 Lee, Kim, and Lee
Fig. 3. Graphic LCD control circuit diagram.
gathered up till now can be meaningful only if output signals saved to the databasein such a way can get the same results with signals output through digital hardwarecoming out of the amp group. Therefore, it is important to perform modeling ofthe digital filter which has the same results with output signals coming out of thegalvanometer. In this experiment, a digital filter has been modeled by means of theSteiglitz–McBride iteration method (Fig. 4).
Figure 4 shows a direct method to minimize least squares of error. The numericalequation is E′(z) = X(z)− Bq(z)
Ap(z) . This equation is operated to nonlinear equation ascoefficient ap(k) bq(k), where p and q represent the number of coefficient. By theShanks’ method, we can get coefficient Ap(z) with Prony’s method and coefficientBp(z) in minimizing least squares of error.(6)

P1: FLW/FGD P2: FLW
Journal of Medical Systems [joms] PP215-342378 August 29, 2001 12:26 Style file version Nov. 19th, 1999
Design of Digital 389
Fig. 4. Steiglitz-McBride iteration method.
Operating
E′(z) = X(z)− Bq(z)G(z),
where
G(z) = 1/Ap(z),
the above equation can be represented as follows
E′(z) = [X(z)Ap(z)− Bq(z)]G(z)
If G(z) is fixed in this equation, E′(z) becomes a linear equation to Ap(z) andBq(z). Furthermore, E′(z) updates Ap(z) in minimizing least squares. To put it inother words, G(z) is updating continually. As a result, these processes form iteration.Where coefficients in ith iteration are defined as A(i)
p (z) and B(i)p (z), respectively,
A(i)p (z) is fixed, and the updated coefficients are A(i+1)
p (z) and B(i+1)p (z).
E(i+1)(z) = A(i+1)p (z)X(z)− B(i+1)
q (z)
A(i)p
= [A(i+1)p (z)X(z)− B(i+1)
q (z)]G(i)(z)
Then
F (i)(z) = X(z)G(i)(z), or E(i+1)(z) = A(i+1)p (z)F (i)(z)− B(i+1)
q (z)G(i)(z).
This equation is represented as e(i+1)(n) = a(i+1)p (n) ∗ f (i)(n)− b(i+1)
q (n) ∗ g(i)(n),given with the time domain.
g(i)(n) and f (i)(n) are operated as follows:
g(i) = δ(n)−p∑
k=1
a(i)p (k)g(i)(n− k); n ≥ 0
f (i) = x(n)−p∑
k=1
a(i)p (k) f (i)(n− k); n ≥ 0.
Where g(i)(n) and f (i)(n) are 0, given n < 0. Where g(i)(n) and f (i)(n) are fixed,A(i+1)
p (k) and B(i+1)p (k) are obtained in minimizing least squares of error as follows:
E(i+1) =∞∑
n=0
∣∣ε(i+1)∣∣2.

P1: FLW/FGD P2: FLW
Journal of Medical Systems [joms] PP215-342378 August 29, 2001 12:26 Style file version Nov. 19th, 1999
390 Lee, Kim, and Lee
The linear equation to get the coefficient to minimize E(i+1) can be obtained bydifferentiating A(i+1)
p (k)∗ and B(i+1)p (k)∗, respectively. Obtaining the equation in this
way, as 0, it becomes an orthogonal condition as follows:∞∑
n=0
e(i+1)[ f (i)(n− k)]∗ = 0; k= 1, 2, . . . p
∞∑n=0
e(i+1)[g(i)(n− k)]∗ = 0; k= 1, 2, . . .q
f (i)(n)+p∑
k=1
a(i+1)p (k) f (i)(n− k)−
q∑k=0
b(i+1)q (k)g(i)(n− k) = 0; n > p
The previous equation operated to a matrix becomes
[F (i) ... G(i)] [ a(i+1)
p
−b(i+1)q
]= − f (i)
F (i) =
f (i)(p− 1) f (i)(p− 2) · · · f (i)(0)
f (i)(p) f (i)(p− 1) · · · f (i)(1)
f (i)(p+ 1) f (i)(p) · · · f (i)(2)...
......
G(i) =
g(i)(p) g(i)(p− 1) · · · g(i)(p− q)
g(i)(p+ 1) g(i)(p) · · · g(i)(p− q + 1)
g(i)(p+ 2) g(i)(p+ 1) · · · g(i)(p− q + 2)...
......
f (i) = [ f (i)(p), f (i)(p+ 1), f (i)(p+ 2) · · · ]T
.
To get least squares solution, multiply to both sides.
[F (i) ... G(i)]H[
F (i) ... G(i)] [ a(i+1)p
−b(i+1)q
]= −[F (i) ... G(i)]H
f (i)
(F (i)
)HF (i)
...(F (i)
)HG(i)
· · · · · · · · · · · · · · · · · ·(G(i)
)HF (i)
...(G(i)
)HG(i)
[
a(i+1)p
−b(i+1)q
]= −[F (i) ... G(i)]H
f (i).
Let R(i)f and R(i)
g be the auto-correlation of g(i)(n) and f (i)(n), respectively, and

P1: FLW/FGD P2: FLW
Journal of Medical Systems [joms] PP215-342378 August 29, 2001 12:26 Style file version Nov. 19th, 1999
Design of Digital 391
Fig. 5. Input signal from amplifier.
let R(i)fg be the cross-correlation of f (i)(n) and g(i)(n). R(i)
f
... R(i)g f
· · · · · · · · · · · · · · · · · ·R(i)
fg
... R(i)g
[
a(i+1)p
−b(i+1)q
]= −
r (i)f
· · · · · · · · ·r (i)
fg
.
Fig. 6. Output waveform gone through Galvanometer.

P1: FLW/FGD P2: FLW
Journal of Medical Systems [joms] PP215-342378 August 29, 2001 12:26 Style file version Nov. 19th, 1999
392 Lee, Kim, and Lee
Fig. 7. Amplitude response of digital filters.
RESULTS AND DISCUSSION
Figure 5 is an input waveform which goes through the amplifier and then entersthe galvanometer after gaining man’s pulse wave in the Pulse diagnosis system.
The figure demonstrates input waveform x(n) which appears when the Steiglitz–McBride iteration method is used. Figure 6, which is an output waveform that goesthrough the galvanometer, shows the output waveform x(n)∗h(n) which appearswhen the Steiglitz–McBride iteration method is used. At this point, for modeling ofthe digital filter, we should predetermine the numbers of coefficients of the numerator
Fig. 8. Frequency response of digital filters.
P1: FLW/FGD P2: FLW
Journal of Medical Systems [joms] PP215-342378 August 29, 2001 12:26 Style file version Nov. 19th, 1999
Design of Digital 393
Fig. 9. Poles and zeros in Z-domain of digital filters.
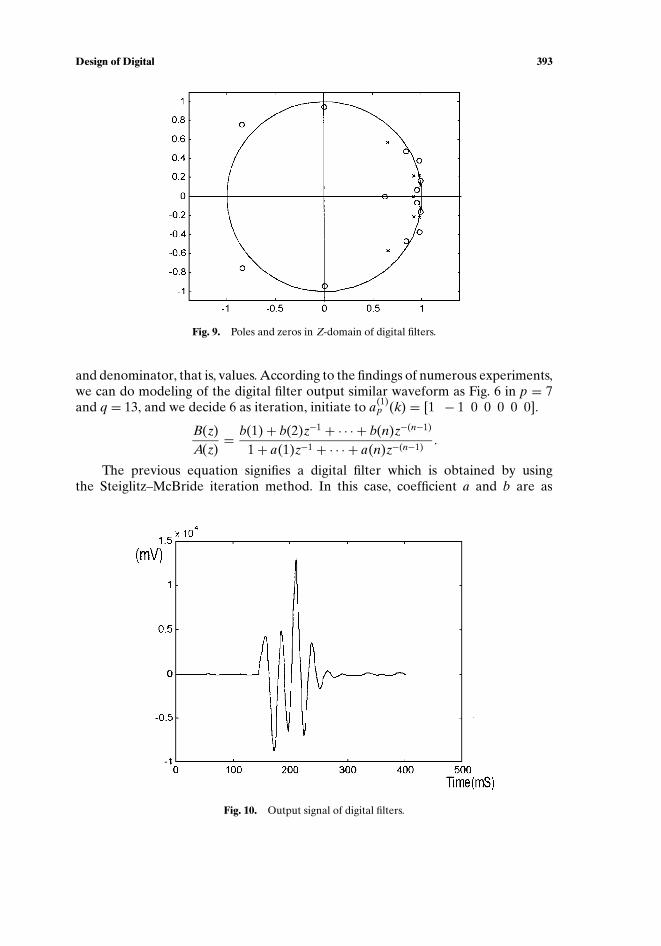
and denominator, that is, values. According to the findings of numerous experiments,we can do modeling of the digital filter output similar waveform as Fig. 6 in p = 7and q = 13, and we decide 6 as iteration, initiate to a(1)
p (k) = [1 − 1 0 0 0 0 0].
B(z)A(z)
= b(1)+ b(2)z−1 + · · · + b(n)z−(n−1)
1+ a(1)z−1 + · · · + a(n)z−(n−1).
The previous equation signifies a digital filter which is obtained by usingthe Steiglitz–McBride iteration method. In this case, coefficient a and b are as
Fig. 10. Output signal of digital filters.

P1: FLW/FGD P2: FLW
Journal of Medical Systems [joms] PP215-342378 August 29, 2001 12:26 Style file version Nov. 19th, 1999
394 Lee, Kim, and Lee
follows.
a(1) = −6.81003 a(2) = 19.991179 a(3) = −32.792306 a(4) = 32.462744
a(5) = −19.395506 a(6) = 6.476357 a(7) = −0.932434
b(1) = −0.136891 b(2) = 0.889410 b(3) = −2.527758 b(4) = 4.116764
b(5) = −4.252281 b(6) = 3.022608 b(7) = −1.835343 b(8) = 1.375893
b(9) = −1.122774 b(10) = 0.660439
b(11) = −0.221686 b(12) = 0.031618
Figures 7 and 8 show the amplitude and frequency responses of digital filtersobtained by the Steiglitz–McBride iteration method. Figure 9 shows poles and ze-ros in the Z-domain of digital filters obtained by the Steiglitz–McBride iterationmethod. Figure 10 shows findings in the filtering of input waveform of Fig. 5, usingthe obtained digital filters. As can be seen from the figure, they resemble the outputwaveform displayed in Fig. 6.
ACKNOWLEDGMENTS
This study was supported by a grant of the ’97 GITP(Generic Industrial Tech-nology Program), Ministry of Commerce, Industry & Energy, Korea.
REFERENCES
1. Hong Won Sik, The Yellow Emperor’s classic of internal medicine SOMUN, Traditional CultureResearch Association, Korea, 1992.
2. Lee, J. Y., and Lin, J. C., A microprocessor-based noninvasive arterial pulse wave analyzer. IEEETrans. Biomed. Eng. 22:57–60, 1980.
3. Wang Lin, Y. Y., Chang, C. C., and Chen, J. C., Pressure wave propagation in artery-A model withradial dilatation for simulating the behavior of a real artery, IEEE Eng. Med. Biol. 16(1):51–56, 1997.
4. Prior, J. A., Peck, K., Davies, P., and Gareth Beevers, D., Clinical evaluation of the sphygmomat 2semiautomatic blood pressure monitor. J. Med. Eng. Tech. 14(6):250–253, 1990.
5. Willis, J., Tompkins, Biomedical Digital Signal Processing, Prentice-Hall, Englewood Cliffs, NJ,1993(ISBN 0-13-143736-4).
6. Kay, M., Fundamentals of Statistical Signal Processing, PTR Prentice Hall, Englewood Cliffs, NJ,1992(ISBN 0-13-345711-7).