
Mesoscale fine structure of a tropopause fold over mountains
arX
iv:q
-bio
/050
5030
v1 [
q-bi
o.B
M]
16
May
200
5
Design of amino acid sequences to fold into Cα–model proteins
A. Amatori1,2, G. Tiana1,2, L. Sutto1,2,
J.Ferkinghoff-Borg3, A. Trovato4 and R. A. Broglia1,2,3
1Department of Physics, University of Milano and
2INFN, sez. di Milano, via Celoria 16, 20133 Milano, Italy
3The Niels Bohr Institute, Blegdamsvej 17, 2100 Copenhagen, Denmark and
4INFM and Dipartimento di Fisica ”G. Galilei”,
Universit di Padova, Via Marzolo 8, 35131 Padova, Italy
(Dated: February 9, 2008)
Abstract
In order to extend the results obtained with minimal lattice models to more realistic systems,
we study a model where proteins are described as a chain of 20 kinds of structureless amino
acids moving in a continuum space and interacting through a contact potential controlled by a
20×20 quenched random matrix. The goal of the present work is to design and characterize amino
acid sequences folding to the SH3 conformation, a 60–residues recognition domain common to
many regulatory proteins. We show that a number of sequences can fold, starting from a random
conformation, to within a distance root mean square deviation (dRMSD) of 2.6A from the native
state. Good folders are those sequences displaying in the native conformation an energy lower than
a sequence–independent threshold energy.
1
I. INTRODUCTION
A number of models have been studied in the last twenty years to describe the folding
mechanism of single–domain proteins to their unique, biologically active native conforma-
tion. All–atom models with semi-empirical potentials1,2 provide a realistic description of
proteins but are computationally too demanding to be useful to study their folding (cf. e.g.
ref.3). A class of simplified models focuses on an accurate description of the geometry of
the protein but employs minimal potential functions. It is the case of Go models4, where
the potential function sums a constant negative term for each native contact in the protein
conformation. In these models the native conformation is by definition the ground state of
the system and it is usually possible to perform extensive folding simulations. These models
are used to study some features of selected proteins, such as the conformation properties
of the transition state5. On the other hand the contribution of the different parts of the
protein to its kinetics and thermodynamics is controlled mainly by the entropic term (the
energetic term being trivial), and the frustration6 of proteins is underestimated.
Lattice models use the opposite approach, accounting in a minimal way for the geometry
of the protein chain, but focusing on the heterogeneity of the interactions7,8. The protein is
displayed as a chain of beads sitting on the vertices of a lattice interacting through a non–
trivial contact matrix. These models account for the frustration of the system, allow the
study of the amino acid sequences folding to a given model structure (and, consequently,
of the effect of mutations, of the natural evolution of protein sequences, etc.) and are
computationally quite economical. These models are used to understand the physical basis
of the folding process, trying to answer questions such as what makes that a protein displays
a low–entropy in its equilibrium state ?9, what makes that a protein folds fast?10,11, what
differentiates a good folder from a random sequence ?8, etc. On the other hand, lattice
models cannot describe the fold of real proteins with its richness of secondary structures
and motifs.
The importance of the heterogeneity in the interaction between amino acids relies on the
fact that analytical calculations made on random sequences with a replica approach have
shown9 that there is a threshold degree of heterogeneity which separates two qualitatively
different behaviours of the system. For a low degree of heterogeneity any model chain behaves
essentially as a globular homopolymer, displaying at any temperature an equilibrium state
2

populated of many (i.e., exponentially many with respect to the chain length) different
conformations. Within this context it is not possible to find protein–like sequences with
a unique native state. At high heterogeneity, sequences with few dominant conformations
appear and a fraction of them have a unique equilibrium conformation18. These are the
candidates to the role of good folders.
Simulation studies based on lattice models have highlighted (see, among others, ref.19)
a simple energetic criterion to distinguish good from bad folders; a sequence will fold to a
given native conformation if it displays, on that conformation, an energy EN lower than a
threshold energy Ec, energy which only depends on the statistical moments of the interaction
matrix and on the length of the chain9. The physical meaning of Ec is that of being the
lowest conformational energy a random sequence can have, energy which has a well–defined
value as a consequence of the frustration of the system20. This condition (EN < Ec) goes
further than to ensure the thermodynamical unicity of the native state. In fact, it is also at
the basis of the kinetic ability the protein has to reach the native state on short call10,11.
An energy minimization of the sequence, keeping the protein conformation fixed, to ener-
gies below Ec is thus a practical algorithm to design good folders. This procedure has been
applied to the design of lattice model proteins9. A more efficient and thermodynamically
rigorous method consists in optimizing the conformational free energy of the sequence in
the protein conformation, thus taking into account also the competing conformations. This
method has been introduced in refs.12,13 and further developed in refs.14,15,16,17.
The purpose of the present work is to build a model which is more realistic of both Go
and lattice models, including continuous degrees of freedom as well as a non–trivial potential
function. We show that this model allows sequences to have a unique, stable and kinetically
accessible native state, and that such sequences obey the same energetic requirement as
lattice–model sequences do. With the help of this model we will investigate the folding of
selected sequences into the SH3 domain.
II. THE PROTEIN MODEL
The model we investigate describes a protein as an inextensible chain, where amino acids
are represented by spherical beads centered around the Cα-atom, thus allowing a realistic
accounting for the protein backbone (cf. Fig. 1). Each of the 20 types σ of amino acids is
3

characterized by a hard core radius RHC(σ). The values of RHC(σ), which range from 2.25A
to 3.39A, are listed in Table I. The bond angles are limited within the interval between π/2
and 0.8π so as to give some amount of stiffness to the polypetide chain.
The potential energy of the protein depends on the positions {ri} and sequence {σi} of
amino acids according to
U({ri}, {σi}) =∑
i<j+1
B(σi, σj)θ (R(σi, σj) − |ri − rj |) , (1)
where θ is Heaviside’s step function, R(σi, σj) ≡ k · (RHC(σi) + RHC(σj)) is the range of
interaction which depends on the kind of amino acids proportionally to their hard–core radius
(k = 0.721) and Bσπ is the interaction energy between an amino acid of kind σ and one of
kind π. The matrix Bσπ is built out of quenched27 random numbers taken from a Gaussian
distribution with mean B0 = 0.25 and standard deviation σB = 0.52 (in arbitrary units).
A slighlty positive mean contact energy has been chosen because it leads to sequences with
better folding properties than those associated with a contact matrix displaying B0 ≤ 0.
The rationale behind the model is that the key ingredient to make a protein fold is the
heterogeneity existing among the different amino acids. We account for this heterogeneity
by both varying the size of the amino acid as well as the contact energy acting among
them. Because no simple energy function capable of folding real protein sequences to their
native conformation is yet known (see e.g. ref.21), we shall use in the model calculations
an interaction potential parameterized by a random matrix. This choice has the advantage
to make the model results quite general. On the other hand, it has the drawback that the
labels of amino acids (A, C, etc.) are merely nominal. Since we are interested in the general
aspects of the physical mechanism of protein folding and not in the detailed chemistry of
particular sequences, this drawback is of no consequence for the present investigation.
An important ingredient of the model is a constrain on the total number of contacts each
residue can build. This constrain reflects (together with the hard core radius) the size of the
given amino acid. Simulations performed without such a constrain led to a collapse of the
chain to unrealistically small sizes. The effect cannot be avoided be simply increasing the
hard core radius, since this value is limited from above by the average distance between two
amino acids along the chain (≈ 3.8A). This is a limit any model which pictures an amino
acid as a sphere will display. In keeping with the discussion carried out above, we assign
to each type of amino acid a quenched random number nmax(σ) ranging from 0 to 5, which
4

represents the maximum number of possible contacts the amino acid can make (cf. Table
I).
In order to design sequences with a specified energy Etarg on the SH3 target conformation
(Fig. 1(a)) we perform a sampling of the space of sequences. Starting from a random
sequence displaying an even concentration of amino acids (operatively, we have mantained
that of the wild–type Src SH3, although this choice has not any deep meaning, due to
the merely nominal character of the amino acid letters), we keep the conformation fixed
and perform swap moves among the amino acids, so that their relative frequency remains
constant. Consequently, the average and standard deviation of the contact energy matrix
weighted by this frequency remain equal to that associated with the (unweighted) 20 × 20
matrix. Examples of sequences obtained with this algorithm are listed in Table II. We note
that, although wild–type sequences do display some amount of amino acid repetitions, the
designed sequences display unrealistic repeats of amino acids of the same kind (see Table
II). This is an artifact of the simplified spherical geometry of model residues, which causes
correlations among consecutive sites. In fact, whenever the j-th residue (j being the site
index along the chain) interacts with residue j∗, then residues j − 1 and j + 1 are likely to
lie within the interaction range of j∗ as well. This effect is smaller in real proteins because
of the complicated geometry of sidechains. Since this artifact of the model does not put
obstacles in the designing of good folders, we will postpone the solution of this problem to
a future work, where the folding sequences will be analyzed from a bioinformatic point of
view.
III. CONFORMATIONAL ANALYSIS OF THE LOWEST–ENERGY SEQUENCE
The first sequence analyzed is that displaying the lowest energy Etarg = −37.80 on the
SH3 conformation, and labeled s1 in Table II. We have performed Monte Carlo simulations
(each of 109 steps) in conformational space at fixed temperatures, ranging from the value
0.05 to 1.0, starting each time from a random conformation. In 10 simulations at T = 0.12
the sequence s1 finds each time an energy minimum displaying an dRMSD28 to the SH3
target conformation (Fig. 1(a)) smaller than 3.3A and with the relative number q of native
attractive contacts larger than 0.80. The minimum energy, that is the ground state energy
found in the 10 runs is Egs = −46.96 and is associated with a conformation displaying a
5

dRMSD of 2.6A and a q of 0.85 (Fig. 1(b)). No conformation dissimilar from the native
conformation and displaying a energy lower than −46.96 is found in Monte Carlo simulations
at any temperature.
The ground state energy is smaller than the energy Etarg = −37.80 found in the sequence
minimization. This is because the ground state conformation displays Nc = 74 contacts,
while this number is 67 for the target conformation and each of the 7 new contacts has in
average an energy of −1.3. Very–low temperature simulations (T = 0.01) starting from the
target conformation converge rapidly into the ground state conformation, thus indicating
that the two conformations belong to the same basin of attraction. The reason why the
target configuration is not exactly the ground state conformation of the system is that,
during sequence optimization, the native conformation is kept strictly fixed. If one were
interested in making the target and the ground state conformations coincide exactly, one
should allow some degree of conformational relaxation during sequence minimization. That
is, perform a minimization in the crossproduct space of sequences and configurations.
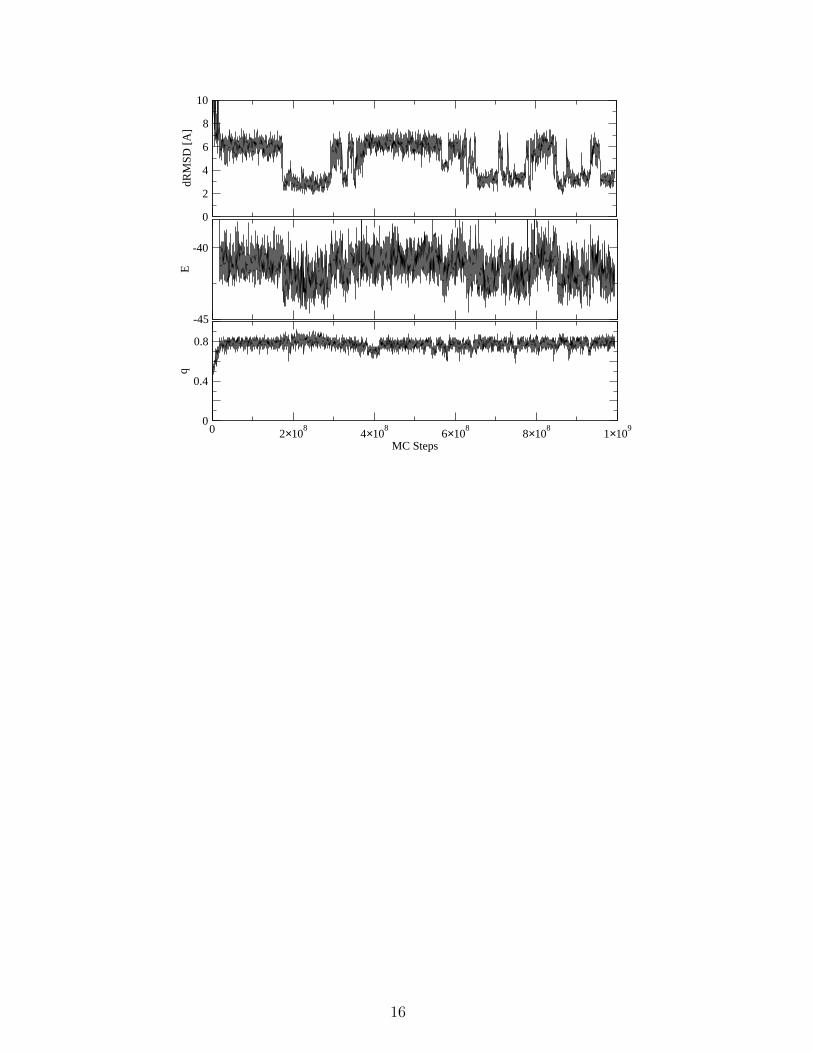
In Fig. 2 we display the dRMSD and the fraction29 of native (attractive) contacts q
associated with sequence s1 as functions of the number of Monte Carlo steps. As in the case
of Go–22 and of the lattice–model designed sequences8, the protein wanders between unfolded
states (dRMSD ≈ 6A) until it suddenly finds the native energy basin (dRMSD< 3A).
Because the conformational move implemented in the Monte Carlo simulation is a small flip
of a random–selected amino acid, one could also view such a simulation as an approximation
to the dynamical trajectory23. Note also that, unlike Go models4, in the potential function
used in these simulations there is no information concerning the native conformation of the
protein.
During the simulations one observes a number of transitions from the folded to the
unfolded conformation and vice versa (Fig. 2). These transitions are reflected by changes
in energy, the mean energy difference between the two states being about 2 energy units
(i.e., ≈ 20 kT ). On the other hand, it is difficult to distinguish between folded and unfolded
states from the fraction of native attractive contacts q alone (lower panel in Fig. 2). This
fact can be regarded as an indication that not all contacts partecipate on equal footing to
the stability of the native conformation.
The thermodynamics of sequence s1 has been studied by means of a multicanonical sam-
pling algorithm24. The probability distribution at T = 0.12 as a function of energy and
6

dRMSD is shown in Fig. 3. The plot shows a clear two–state behaviour. The centroids of
the two peaks are characterized by the values E = −42, dRMSD=3.1 (native state) and
E = −41, dRMSD=6.3 (unfolded state), respectively. The fact that at this temperature the
volumes defined by the two peaks are equal qualifies T = 0.12 as the folding temperature.
Note that the energetic difference between the two peaks is only ≈ 8 kT , while the energy
fluctuations amount to ≈ 25 kT , and thus the energy distributions overlap consistently.
Consequently, it is difficult to identify the two states only from the energy distribution of
sequence in conformational space. Anyway, the plot shows that the lowest energy that the
unfolded state can reach is −42.5.
The specific heat associated with sequence s1 is displayed in Fig. 4 and shows two major
peaks at T = 0.12 and T = 0.34. These peaks indicate cooperative kinds of transitions and
will be further investigated in a successive work.
In Fig. 5 the mean dRMSD of the s1 and of the s9 (random sequence) are displayed as
a function of the conformational energy. For energies larger than −41 the mean dRMSD
of the designed sequence s1 is very similar to that of non–designed sequence s9, displaying
a wide plateau at dRMSD 5.7A, corresponding to unfolded conformations. The designed
sequence s1, on the other hand, displays a transition around −41.5 to dRMSD 2.8A. This
allows us to define the native basin as the set of conformations displaying a dRMSD lower
than 4.2A, that is the midpoint of the transition, also consistently with the fluctuations
observed in Fig. 2 and with the transition state of Fig. 3.
IV. FOLDING PROPERTIES OF DIFFERENT SEQUENCES
The conformational analysis has been repeated for other 9 sequences displaying various
values of Etarg (cf. Table II). For every sequence the average dRMSD obtained in 10
independent Monte Carlo simulations as a function of Etarg is reported in Fig. V. One can
observe a monotonic behaviour up to Etarg ≈ −35, where the dRMSD assumes a value of
4.2A, which we have defined in the previous Section as the threshold between native and
unfolded state. Moreover, the dRMSD associated with the ground state conformation is also
listed in Table II. Sequences displaying Etarg above −35 are neither able to find during the
simulations conformations similar to the target one, nor populate a set of structurally similar
conformations (cf. inset of Fig. 6). This result allows us to obtain, within the framework of
7

the model introduced in Sect II energetic criterion to design protein–like sequences. In fact,
good folders onto the SH3 domain are those sequences displaying an energy Etarg < Ectarg,
where Ectarg = −35.
While the dependence of the folding properties of a sequence on Etarg are quite clear, the
dependence of these properties on Egs are less well–defined (cf. Table II). In fact, while
sequences with Egs well below −44 are guaranteed to fold (like the case of s1, s2 and s3) it
is difficult to assess the behaviour of sequences displaying values of Egs around −44 (see,
e.g., s5 and s6). The problem arises mainly because the minimum energy conformations
associated with these sequences display different numbers of contacts (Nc varies between 67
and 74), and consequently the system can gain or loose an amount of energy of the order
of some kT with ease. Anyway, for the purpose of designing a good folder into a given
three–dimensional conformation what matters is the Etarg criterion.
In Fig. 6, the conformational entropy of three protein–like sequences, namely s1, s2 and
s3 are shown as a function of energy. For reference, the entropy of the non–folding sequences
s8, s9 and s10 are also plotted. The entropy of high–energy states (E > −20) is very similar
for all sequences except the purely random ones (s9 and s10). This is consistent with the
idea that in high–energy conformations contact energies can be regarded as random, any
specific effect of the individual sequence being lost. In fact, the high–energy part of the plot
can be well approximated by means of the random energy model20, where the total energy
E of the system is described as the sum of Nc uncorrelated stochastic contact energies, Nc
being the typical number of contacts in a globular conformation. The resulting entropy is
S(E) = S0 −(E − NcB0)
2
2Ncσ2B
, (2)
where S0 sets the zero of the entropy, B0 = 0.25 and σB = 0.52 are the mean and standard
deviation of the interaction matrix. The curve described by Eq. (2) is plotted with dotts in
Fig. 6, fitting the values of S0 and of Nc (= 29) to the high temperatures part of the curves
obtained from the simulations. Below energy E ≈ −20 the entropy of these sequences is
influenced by the specificity of the sequence, as evinced by the departing of the curves from
Eq. (2).
The random sequences s9 and s10, on the other hand, display as expected an entropy
function which is qualitatively different from the folding sequences. Furthermore, this cannot
be fitted satisfactorly with Eq. (2). This is somewhat unexpected, since a random sequence
8
should be described better than a designed sequence by the random energy model.
Moreover, the non–designed sequences not only display low–energy conformations struc-
turally dissimilar from the target conformation, but these conformations are also dissimilar
among themselves. The inset of Fig. 6 shows the distribution of dRMSD for a good and a bad
folder, calculated pairwise in a sample of 20 conformations displaying Egs < E < Egs+10 kT .
The centroid of the distribution associated with sequence s9 lies at 10 A (dashed curve), in-
dicating that the associated conformations are structurally very different.
As expected, the ground state energy of random sequences is higher than that of good
folders (e.g. Egs = −42.36 and Egs = −39.36 for s9 and s10, respectively). Consistently
with the results of lattice models8, the mean ground state energy of random sequences is
approximately equal to the lowest energy of the unfolded state of a good folder (≈ −42, see
Fig. 3), and we shall call Ec this energy.
Consistently with these findings, a sufficient (but not necessary; cf. e.g. sequence s4)
condition for any sequence to be a good folder is that it displays a ground state energy Egs
much lower than Ec (cf. Table II). The reason is that, since Ec is essentially sequence–
independent, if a sequence displays Egs ≪ Ec, then its conformational ground state has
not to compete with the sea of unfolded conformations. Differently from the case of lattice
models, this result is only partially predicitive. While for lattice–model sequences the folding
requirement is just Egs < Ec10, in the present model it is important, although not well–
defined, the ”much lower” requirement. The reason for this difference is that in the present
model there are consistent fluctuations in the number of contacts, which produce fluctuations
in the energy. In a lattice model, due to the discreteness of the degrees of freedom, this effect
is much smaller, and the overall behaviour is consequently clearer. On the other hand, one
can easily distinguish good from bad folding sequences on the basis of the target energy
Etarg which, being calculated on a fixed conformation, does not undergo such fluctuations.
There are other features which, although not being usable for the design, set a physically
clear difference between folding and non–folding sequences. First, the density of states of
designed sequences at low and intermediate energy is much higher than for random ones (see
Fig. 6). That is, it is higher if the folding sequence is better designed. This is equivalent
to state that the conformational accessibility of the ground state of well designed sequences
is greater than for random or bad designed ones. In other words, asking for a deep funnel
to be carved in the energy landscape ensures it to be also a wide one, consistently with
9

the findings of ref.25. The second discriminant between ‘good’ and ‘bad’ folders is clearly
seen in the fraction of native attractive contacts vs. energy curve (Fig. 7). The linearity
of such curve for well designed sequences is, on the one hand, a striking confirmation that
simple topology-based models (Go-model), which assume the energy gain to be proportional
to the fraction of native attractive contacts, do indeed capture the basic feature of the
energy landscape for a ‘good’ folding sequence, i.e. the existence of a funnel towards the
native state. On the other hand, it shows that our simple model is able to reproduce such
crucial feature without any ‘a priori’ knowledge of the native state. Random or ‘bad’ folding
sequences instead fail in creating the proper folding funnel. Note that both features can be
easily appreciated only in the microcanical ensemble by looking at the behaviour of entropy
(fraction of native attractive contacts) as a function of energy.
The energy distribution per site of s1 in the target conformation is also typical of good
folders, as found in the case of lattice models26, the energy being concentrated mainly in
few ”hot” sites (cf. inset to Fig. 7). On the contrary, the stabilization energy of a random
sequence is, as expected, evenly distributed over the ground state of the protein.
V. CONCLUSIONS
In the case of simple lattice models, the thermodynamics of heteropolymers is reasonably
well–understood, and there is an efficient algorithm to design folding sequences given a target
conformation and an interaction matrix. We have studied a model with continuous degrees
of freedom, showing that it is possible to design 20–letters sequences which fold stably and
fast to a given conformation, without that the potential function contains any information
about the target conformation. A key ingredient of the model is a constrain on the total
number of contacts that each amino acid can build, which reflects geometric features of the
amino acid neglected by a spherical–bead model. By means of such a model, it is possible
to conclude that good folder sequences are those displaying on the target conformation an
energy lower than a sequence–independent threshold.
1 H. J. C.Berendsen, D. van der Spoel and R. van Drunen, Comp. Phys. Comm., 91 43 (1995)
10
2 D.A. Pearlman, D.A. Case, J.W. Caldwell, W.S. Ross, T.E. Cheatham, III, S. DeBolt, D.
Ferguson, G. Seibel, and P. Kollman, Comp. Phys. Commun., 91 1 (1995)
3 Y. Duan and P. A. Kollman, Science, 282 740 (1998)
4 N. Go, Annu. Rev. Biophys. Bioengin., 12 183-210 (1983)
5 A. Fersht, Structure and mechanism in protein science, W. H. Freeman and Co., New York
(1999)
6 H. Frauenfelder and P. G. Wolynes, Physics Today, 47 58-64 (1994)
7 K. F. Lau and K. Dill, Macromolecules, 22 3986 (1989)
8 E. I. Shakhnovich, Phys. Rev. Lett., 72 3907 (1994)
9 E. I. Shakhnovich and A. M. Gutin, Biophys. Chem., 34 187 (1989)
10 R. A. Broglia and G. Tiana, J. Chem. Phys, 114, 7267 (2001)
11 G. Tiana and R. A. Broglia, J. Chem. Phys. 114, 2503 (2001)
12 T. Kurosky and J. M. Deutsch, J. Phys. A 28, L387 (1995)
13 J. M. Deutsch and T. Kurosky, P.hys. Rev. Lett. 76, 323 (1996)
14 F. Seno, M. Vendruscolo, A. Maritan and J. R. Banavar, Phys. Rev. Lett. 77, 1901 (1996)
15 A. Irback, C. Peterson, F. Potthast, and E. Sandelin. Phys. Rev. E 58, R5249 (1998)
16 C. Micheletti, F. Seno, A. Maritan and J. R. Banavar, Phys. Rev. Lett. 80, 2237 (1998)
17 C. Micheletti, A. Maritan and F. Seno, J. Chem. Phys. 110, 9730 (1999)
18 E. I. Shakhnovich and A. M. Gutin, Nature, 346 773 (1990)
19 D. K. Klimov and D. Thirumalai, Phys. Rev. Lett. 76, 4070 (1996)
20 B. Derrida, Phys. Rev. B, 24 2613 (1981)
21 T. Lazaridis and M. Karplus, J. Mol. Biol., 288 477 (1998)
22 C. Clementi, H. Nymeyer and J. N. Onuchic, J. Mol. Biol., 298 937 (2000)
23 A. Rey and J. Skolnick, Chem. Phys., 158 199 (1991)
24 J. Ferkinghoff-Borg, Eur Phys. J. B 29, 481 (2002)
25 C. Micheletti, J.R. Banavar, A. Maritan, F. Seno, Phys. Rev. Lett., 82, 3372 (1999)
26 G. Tiana, R. A. Broglia, H. E. Roman, E. Vigezzi and E. Shakhnovich, J. Chem. Phys, 108
757 (1998)
27 Quenched in the sense that they are generated at the beginning of the investigation and main-
tained fixed.
28 We define dRMSD as the root of the mean square difference between the inter–residue distance
11

in the given conformation and in the native state, calculated over all pairs of residues. As a
reference, note that the dRMSD of a random conformation displays a dRMSD of the order of
25A to the native conformation of SH3. On the other hand, the meaning of a dRMSD of 2.6A
can be appreciated from Fig. 1.
29 Only attractive contacts are counted and the same definition of contact as in the potential
function (Eq. (1)) is used to calculate q.
12

RHC nmax RHC nmax
A 2.524 5 M 3.099 5
C 2.743 5 N 2.845 2
D 2.795 3 P 2.790 4
E 2.968 4 Q 3.013 2
F 3.188 2 R 3.287 1
G 2.258 1 S 2.597 3
H 3.048 4 T 2.816 0
I 3.099 4 V 2.922 2
K 3.188 2 W 3.395 2
L 3.099 5 Y 3.234 4
TABLE I: The features of the amino acids.
label Etarg Egs dRMSD[A]
s1 -37.80 -46.96 2.6 GLLLLAANNWWVTRTDEEKKDYVSSSSDDTQTGGYNIEGLIFFRQVVPPEAHTYYSSSTT
s2 -37.27 -46.22 3.0 GLLLLEEEGWWNGTTVYYKFDESPDSSSDTNGVTNYYVLFITRRVQQAAADHTPISSSKT
s3 -36.20 -45.58 3.2 NKSAAAHQPERFTTVSSSEEPIYEVLLNWTYTTTRDSDSDDKFGWGGLLLQGTIYVNSVY
s4 -35.53 -44.45 3.4 QQHAASSSDDSDVFTVPPLGNLTNYYGIITKTTWLLFEGGAYTRNVDEEESSTLSVKYRW
s5 -34.85 -44.55 4.0 GDSAAAHQPERWWTTSSSEEPIYEVLLNVTTTFTRDVDSSDKVGFNGLLLQGTIYYNSKY
s6 -34.30 -44.31 4.7 QWAAHEEEDYRNFGTSSSYQGPGINSSFKTGYTTVDSDSLATRVVVDLLLILWEPKNYTT
s7 -33.65 -44.22 4.8 SGLNLEEPGKKYFRRTAAWFVEGSDSSVGTTTTNQHQTALLLWVSDDYYYIIVEPDSSTN
s8 -23.67 -42.09 4.8 DSSSSEERDIFYTTTWYYQQGPLNSLLLGTVKTVDDIYSSAKTRWVGAAHGPTEEFNLVN
s9 -4.51 -42.36 5.5 NLILYEKLDNRFNKWWFLADSSPASGQVDRTTSTVSSTQEHTTYEEYVSGLGTIPDAVGY
s10 +8.26 -39.36 5.9 EYLSVIKTEDPKQSEYPSWLSEFFLLTIATGNTLYYDGVHAVTSSRNSGGDAVRNDTTWQ
TABLE II: Sequences with selected energies Etarg on the SH3 target conformation displayed in
Fig. 1. The reported dRMSD is that of the ground–state conformation. Sequences s9 and s10 are
purely random.
13

FIG. 1: (a) The native structure in a Cα representation of SRC SH3 as obtained by crystallo-
graphic experiments (pdb code 1FMK) and (b) the minimum energy structure of the sequence s1,
corresponding to a dRMSD of 2.6A.
FIG. 2: The dRMSD (above), the energy (middle) and the fraction of native attractive contacts q
(below) as a function of the number of steps for a simulation of sequence s1 starting from a random
conformation at T = 0.120.
FIG. 3: Probability distribution as function of energy and dRMSD for sequence s1 at temperature
0.120.
FIG. 4: The specific heat Cv as a function of temperature for the sequence s1.
FIG. 5: The average dRMSD as a function of energy, calculated for sequence s1 (above) and s7
(below). The error bars indicate the dRMSD standard deviation.
FIG. 6: The conformational entropy as a function of energy for some of the sequences listed in
Table II. Solid curves indicate folding sequences, dashed curves non–folding sequences. The dotted
curves are the prediction of the random energy model. In the inset, the distribution of dRMSD for
low–energy conformation sampled with sequence s1 (solid curve) and s8 (dashed curve).
FIG. 7: Fraction of native attractive contacts q as function of energy for sequences s1 (straight
line), s8 (dashed) and s9 (dotted), representing respectively a good folder, a bad folder and a
random sequence. In the inset, the distribution of stabilization energy among the residues in the
target conformation of s1.
14

(a) (b)
15
0
2
4
6
8
10
dRM
SD [
A]
-45
-40
E
0 2×10⁸
4×10⁸
6×10⁸
8×10⁸
1×10⁹
MC Steps
0
0.4
0.8
q
16

0.015
0.010
0.005
0
−44
−42
−406
24
E
dRMSD
Pro
babi
lity
Dis
trib
utio
n
17

0 0.2 0.4 0.6 0.8 1T
0
50
100
150
200
Cv
0 0.2 0.4 0.6 0.8 10
50
100
150
200
18

0
5
10
15
20
25
30
rmsd
-50 -40 -30 -20 -10 0E
0
5
10
15
20
25
30
rmsd
S1
S8
19

dRM
SD
E targ
20

-50 -40 -30 -20 -10 0E
-300
-250
-200
-150
-100
-50
0
50
S(E)
s1
s2
s3
s8
s9
s10
5 10 15RMSD
21

-50 -40 -30 -20 -10 0 E
0
0.2
0.4
0.6
0.8
q 0 10 20 30 40 50 60site
-4
-3
-2
-1
0
site
0 10 20 30 40 50 60site
-4
-3
-2
-1
0
site
22
Copyright © 2022 FDOKUMEN