Design of a Software Application for Visualization of GPS and ...
46
Design of a Software Application for Visualization of GPS and Vehicle Data Bachelor’s Thesis in Computer Science and Engineering Recep Sinan Arslan School of Information Science, Computer and Electrical Engineering Halmstad University
-
Upload
khangminh22 -
Category
Documents
-
view
0 -
download
0
Transcript of Design of a Software Application for Visualization of GPS and ...
Design of a Software Application for Visualization
of GPS and Vehicle Data
Bachelor’s Thesis in Computer Science and Engineering
Recep Sinan Arslan
School of Information Science, Computer and Electrical Engineering Halmstad University
Design of a Software Application for Visualization
of GPS and Vehicle Data
Bachelor’s Thesis in Computer Science and Engineering
School of Information Science, Computer and Electrical Engineering
Halmstad University
Box 823, S-301 18 Halmstad, Sweden
June 2009

Description of cover page picture: Image was taken from the following link:
http://media.photobucket.com/image/truck/hitfilm/hitfil
m/EuroTruck3.png
I
Acknowledgement
“Our true mentor in life is science”.
Mustafa Kemal Atatürk
First of all I would like to thank my supervisor at Halmstad University Stefan Byttner because
of his supports, suggestions, advices and ideas helping me during this process with excellent
mathematical knowledge and infinite patience. Without his help this project would not
finished.
I want to say thank to Kenneth Nilsson because of his support during my thesis work and
presentation.
Furthermore a special thanks to my family to believe and support us.
Halmstad, August 2009
Recep Sinan ARSLAN
II
Preface
First Name, Surname: Recep Sinan Arslan
University: Halmstad University, Sweden
Degree Program: Computer Science and Engineering
Title of Thesis:
Year :
Design of a Software Application For Visualization of GPS and
Vehicle data
2009
Academic Supervisor: Stefan Byttner, Phd. At Halmstad University
Abstract I present an application to visualization of GPS data and Linear Correlations and models. A
collection of data for each vehicle is used to compute correlations. Deviating correlations can be
indicative of a faulty vehicle.
The correlation values for each vehicle are computed with use linear regression algorithms using
up to 4 signals in the data (with varied time window), and display the model parameters in a
window next to the GPS map. Multiple measurements (multiple drive routes and multiple model
parameters) are displayed at the same time, allowing tracking over time and comparison of
different vehicles.
The whole technique is demonstrated on three data which is set on first frame by user. The
results are displayed with a java application and Google Map.
KEYWORDS
Deviation Detection, Linear Regression, GPS
III
Contents
ACKNOWLEDGEMENT .................................................................................................................................... I
PREFACE ............................................................................................................................................................ II
ABSTRACT ......................................................................................................................................................... II
KEYWORDS ....................................................................................................................................................... II
CONTENTS ........................................................................................................................................................ III
1 INTRODUCTION ............................................................................................................................................. 1
1.1 BACKGROUND ................................................................................................................................................ 1 1.2 PROBLEM FORMULATION ................................................................................................................................ 3 1.3 GOAL .............................................................................................................................................................. 4 1.4 LIMITATION ................................................................................................................................................... 4 1.5 RELATED WORKS ........................................................................................................................................... 4
2 METHODS ........................................................................................................................................................ 6
2.1 SYSTEM REPRESENTATION .............................................................................................................................. 6 2.2 DATA PROCESSING .......................................................................................................................................... 6 2.2.1 STANDARD SCORE(NORMALIZATION) ........................................................................................................ 7 2.2.2 LINEAR LEAST SQUARES ............................................................................................................................ 9 2.2.3 LINEAR CORRELATION ............................................................................................................................. 11 2.3 SOFTWARE COMPONENTS ............................................................................................................................. 12 2.3.1 DESKTOP APPLICATION VS. WEB APPLICATION ......................................................................................... 12 2.3.2 FRAME VS. APPLET ................................................................................................................................... 14 2.3.3 API COMPONENTS ..................................................................................................................................... 15 2.3.4 JAVASCRIPT ............................................................................................................................................. 17
3 IMPLEMENTATION ................................................................................................................................... 18
3.1 DESCRIPTION OF FUNCTIONALITY ................................................................................................................ 18 3.2 FLOW CHART AND UML DESIGN OF APPLICATION ....................................................................................... 19
4 RESULTS ....................................................................................................................................................... 26
5 CONCLUSIONS ............................................................................................................................................ 31
6 REFERENCES ............................................................................................................................................... 32
7 APPENDIX ..................................................................................................................................................... 33
7.1 CLASS DEFINITION ................................................................................................................................. 33
7.1.1 CLASS OF LINEARREGRESSION.JAVA ........................................................................................................ 33 7.1.2 CLASS OF FILEINPUT.JAVA ....................................................................................................................... 34 7.1.3 CLASS OF BUTTONFRAME.JAVA ................................................................................................................ 36 7.1.4 CLASS OF FRAME.JAVA............................................................................................................................. 36 7.1.5 CLASS OF GRAPH.JAVA ............................................................................................................................. 38 7.1.6 CLASS OF BASECLASS.JAVA ..................................................................................................................... 38 7.1.7 CLASS OF TESTCLASS.JAVA ...................................................................................................................... 38 7.1.8 JAVASCRIPT.HTM ..................................................................................................................................... 39
Introduction
1
1. Introduction
1.1. Background
Operators of commercial vehicles can have hundreds of vehicles continually on the road to
service customers. These vehicles consist of a large number of parts. While they are on the
road, these vehicles can have problems depending on if the vehicle was used in the intended way
or not. These problems can be handled in different ways. One way is switching vehicles but
because of each of them has their own task and scheduled time; this is not a good possible
solution. Moreover, in many instances, the vehicles do not come back daily to a depot area, thus
increasing the difficulty of coordinating scheduled maintenance and averting costly repairs. [1]
While daily work assignments are scheduled elsewhere, fleet managers are tasked with locating
the vehicles, assigning them to drivers, reclaiming vehicles for preventive maintenance, and
scheduling repairs in a way that minimizes downtime, in addition to driver training and
coaching. To better coordinate and expedite these tasks, it is necessary to go beyond the error
prone process of manually recording vehicle use and of relying on the driver to file a service
request. It is beneficial to implement an electronic type of mobile assets tracking that can
automatically locate the vehicles, maintain a usage log, and issue a reminder when preventive
maintenance is due. In this way, information on vehicle availability and use can be shared at the
same time by fleet managers, the organization scheduling the work, and financial departments.
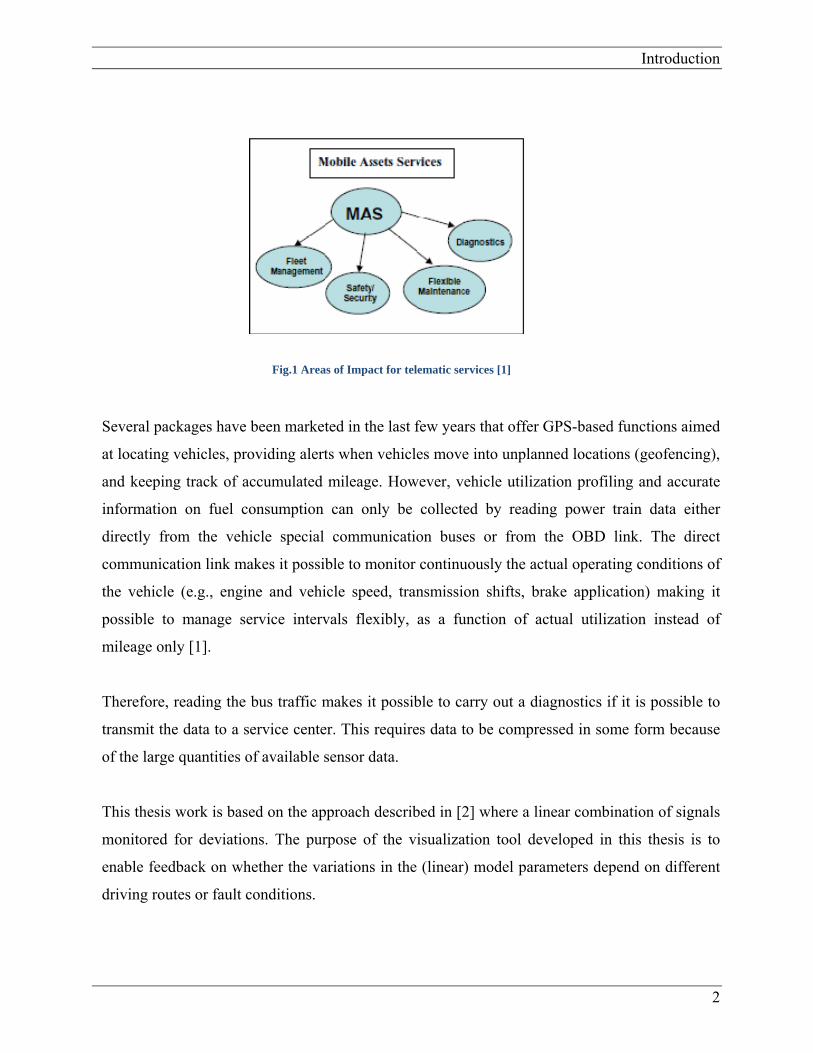
Telematics services for commercial fleet manager aim at improving the customer experience
related to vehicle operation and maintenance using remote performance monitoring and on-
board diagnostics. Fig. 1 identifies areas where telematics is expected to have the greatest
impact.[1]
Introduction
2
Several packages have been marketed in the last few years that offer GPS-based functions aimed
at locating vehicles, providing alerts when vehicles move into unplanned locations (geofencing),
and keeping track of accumulated mileage. However, vehicle utilization profiling and accurate
information on fuel consumption can only be collected by reading power train data either
directly from the vehicle special communication buses or from the OBD link. The direct
communication link makes it possible to monitor continuously the actual operating conditions of
the vehicle (e.g., engine and vehicle speed, transmission shifts, brake application) making it
possible to manage service intervals flexibly, as a function of actual utilization instead of
mileage only [1].
Therefore, reading the bus traffic makes it possible to carry out a diagnostics if it is possible to
transmit the data to a service center. This requires data to be compressed in some form because
of the large quantities of available sensor data.
This thesis work is based on the approach described in [2] where a linear combination of signals
monitored for deviations. The purpose of the visualization tool developed in this thesis is to
enable feedback on whether the variations in the (linear) model parameters depend on different
driving routes or fault conditions.
Fig.1 Areas of Impact for telematic services [1]
Introduction
3
1.2. Problem Formulation
In the RDM research project at Halmstad University there is a need for a tool to visualize GPS
data. It should be fast, intuitive and easily usable but also good graphical quality of the
background maps, drawing coordinate systems and the track since the service will be used for
the analysis of the track and its surroundings. A good way to satisfy these needs is the
development of a desktop application platform with web service, offering upload and sharing
possibilities.
The thesis work is divided into two sub-tasks.
First part is working with GPS data and displaying real routes for each vehicle on
Google map as a web application.
Second part is linear correlation of data. After execute linear correlation algorithms on
data and displaying it on coordinate system as a desktop application.
Application needs to;
Allow the upload of data from files.
User can upload the data file easily with use File Chooser.
Allow to choose data class.
User can choose data class on user interface easily
Display on coordinate system efficiently and understandable.
Application displays ratio values on coordinate system
use high quality background maps
draw the track and the profile as vector graphic (high quality)
allow interactivity between map and profile
be fast and easy to use
Introduction
4
Since none of the above mentioned tools met all of these requirements, a new web-based
desktop application for the visualization of GPS tracks using open source tools was developed.
1.3. Goal
The goal of this thesis is designing software that allows visualization of some collected data
(mainly GPS data for a particular drive route, using e.g. Google Map.). Furthermore, the
developed application will show the linear model parameters of models built on the data. The
purpose of this is to be able to visually track the parameters for e.g. deviation detection.
1.4. Limitations
The thesis work has two visualization interfaces e.g. drawing object on coordinate system and
displaying vehicles on real map. And these visualizations cannot be display on same screen so
have to use two different platforms.
Furthermore, the number of signals and the names at signals are fixed. Although all calculations
and drawing object is dynamic, different data types which is seen on frame is fixed. To add
some more data type, you need to add some new code on Frame.java class.
1.5. Related Works
Linear Regression is used in many different projects. But it can be used for many different
purposes on these projects. Many different projects are available related to linear regression
formulation. Some of them present as follows;
Practical Application of Remote Diagnostics [3],
Written by Bernard J. Carr, told about that technology in the form of enterprise equipment exists
today which enables any vehicle equipped with appropriate client equipment to report
information from itself to a distant server not local to the vehicle. Data from properly equipped
Introduction
5
ground based vehicles can then be collected, sorted, and mined for key operational indicators,
which can accurately describe vehicle subsystem operation. A server application can then apply
business, technical, or industry rules to determine if certain trends, anomalies, or other
degrading health conditions exist completely or initial signs of failure are present.
Mobile Assets Monitoring for Fleet Maintenance [4],
Written by Margherita Zanini, Alan Bitterman and Julia Giuliano, they suggest that important
benefit of remote electronic monitoring is in the ability to tailor maintenance practices to fleet
operating requirements. An even greater benefit is achieved when the system incorporates
remote diagnostic capabilities so that vehicles can be serviced faster and more reliably. On-
board vehicle utilization profiling can be combined with off-board model-based predictive
analysis for implementing cost cutting measures in servicing the fleets. However, the
complexity and affordability of the infrastructure required to support such systems are key
issues for making remote fleet monitoring a growing business.
Networked vehicles for automated fault detection [2],
Written by S. Byttner, T. Rognvaldsson, M. Svensson, G. Bitar, W. Chominsky, they suggest that
Instead of comparing a measured signal at one time to a model built on data collected at a
different time, propose to compare models built at these different times. If the models disagree,
then this is an indication that something has changed. Also, instead of doing the modelling off-
line we propose a method where the modelling and model selection is done automatically and
on-board the vehicle during operation. The approach can be described as producing compressed
images of the data observed on the vehicles over a certain time window and compressed images
from the same vehicle at different times (or from different vehicles) are compared. If the image
has changed (or is different from the other vehicles images) then this is an indication of a
possible fault.
Methods
6
2. Methods
2.1. System Representation
The representation of systems is an essential part of an application that has to work with a big
amount of high dimensional data. The idea is to capture the dynamics of a system and the
correlations among the variables that show the deviations while reducing the amount of data by
transforming it to a more compact representation.
Compact representation is desirable, because we have a limited wireless transmission channel
from the vehicles since it reduces memory consumption and computation time. If we can wrote
a compact program that has effective programming skills, needless to say that we can catch
lower computation times.
It is therefore, important to find a suitable representation that reduces the memory consumption
and computation time while it captures all data about vehicles.
2.2. Data Processing
In order to representing of systems, many different algorithms and tools are able to be used.
A first part of thesis is fall out some calculations and finds linear correlations between these
collected numbers.
Second part involves displaying these correlations between these collected data values on frame
and real map.
Methods
7
2.2.1. Standard Score (Normalization)
In statistics, the arithmetic mean (or simply the mean) of a list of numbers is the sum of the
entire list divided by the number of items in the list. If we denote a set of data by X = (x1, x2, ...
xn), then the sample mean is typically denoted with a µ.[5]
Computing way of mean value is;
Mean Value = µ = ∑ = (x1 + x2 + x3 + ... + xn) (Eq.1)
where;
n is the row number,
µ is the mean value of each vehicle,
x1, x2, …, xn are collected data.
Simple algebra will prove that a mean of n + 1 numbers is larger than the mean of n numbers if
and only if the new number is larger than the old mean, smaller if and only if it is smaller, and
remains stable if and only if it is equal to the old mean. The larger n is, the smaller is the
magnitude of the change in the mean relative to the distance between the old mean and the new
number. [5]
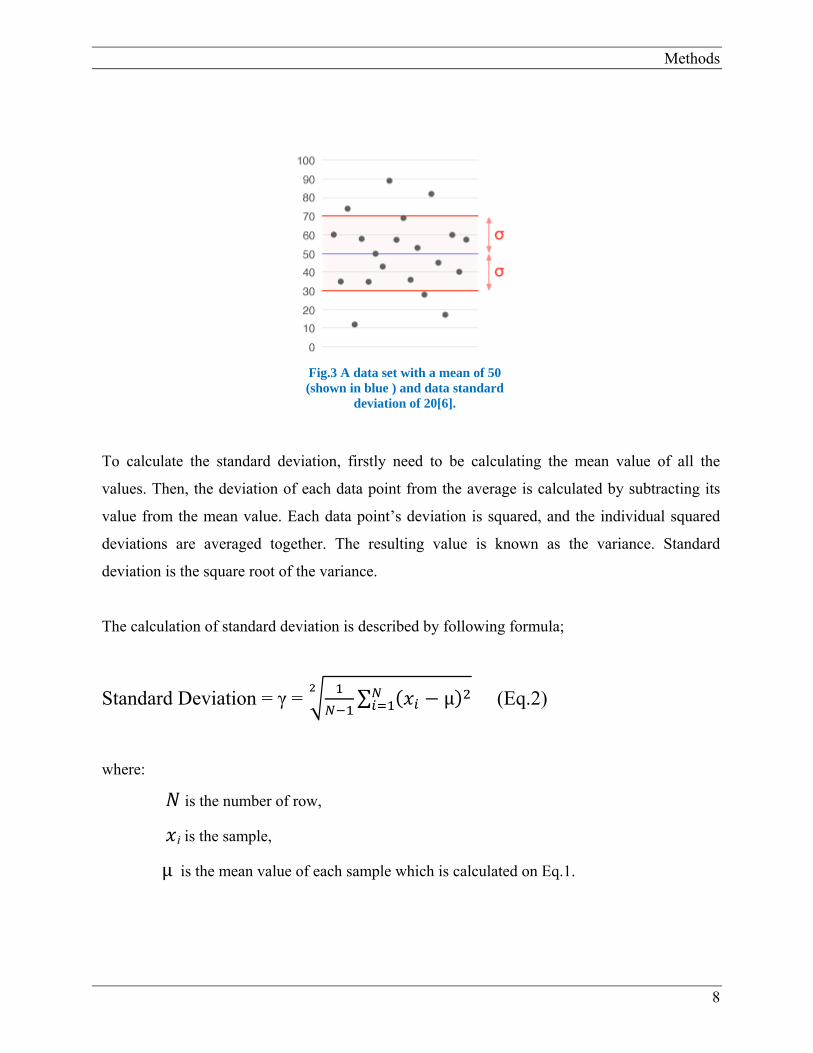
In statistics, standard deviation is a measure of the variability or dispersion of a population, a
data set, or a probability distribution. A low standard deviation indicates that the data points tend
to be very close to the same value (the mean), while high standard deviation indicates that the
data are spread out over a large range of values. [6]
Computing the value of a standard deviation is complicated. But let me show graphically what a
standard deviation represents which is shown below on Fig.3.
Methods
8
To calculate the standard deviation, firstly need to be calculating the mean value of all the
values. Then, the deviation of each data point from the average is calculated by subtracting its
value from the mean value. Each data point’s deviation is squared, and the individual squared
deviations are averaged together. The resulting value is known as the variance. Standard
deviation is the square root of the variance.
The calculation of standard deviation is described by following formula;
Standard Deviation = γ = ∑ μ (Eq.2)
where:
is the number of row,
i is the sample,
μ is the mean value of each sample which is calculated on Eq.1.
Fig.3 A data set with a mean of 50 (shown in blue ) and data standard
deviation of 20[6].

Methods
9
Standard score is a dimensionless quantity derived by subtracting the population mean from an
individual raw score and then dividing refer to many types of ratios. On the base, normalization
is the process of removing statistical error in repeated measured data. Another usage of
normalization is referring to the division of multiple sets of data by a common variable in order
to negate that variable´s effect on the data, thus allowing underlying characteristics of the data
sets to be compared: this allows data on different scales to be compared, by bringing them to a
common scale. In terms of levels of measurements, these ratios only make sense for ratio
measurements, not interval measurements.[7]
The standard score is;
Standard Score = β (Eq.3)
where:
is a row score to be standardized,
μ is the mean of the population, calculated with eq.1,
γ is the standard deviation of the population, is calculated with eq.2.
β represents the distance between the raw score and the population mean in units of the
standard deviation. β is negative when the raw score is below the mean, positive when above.
2.2.2. Linear Least Squares
Linear least squares are a computational approach to fitting a mathematical or statistical model
to data. It can be applied when the idealized value provided by the model for each data point is
expressed linearly in terms of the unknown parameters of the model. The resulting fitted model
can be used to summarize the data, to predict unobserved values from the same system, and to
understand the mechanisms that may underlie the system.

Methods
10
Function У = β1 + β2x + β3x2 (in blue) through a set of data points (xi,yi) (in red). In linear least
squares the function need not be linear in the argument x, but only in the parameters βj that are
determined to give the best fit. [8]
Consider a over determined system,
∑ У , i 1, 2, ..., m Eq.4
of m linear equations in n unknown coefficients, β1,β2,…,βn, with m > n, written in matrix form
as X*β = Y
where,
……
…
, ,
Fig.4 The result of fitting a quadratic function which is given below[8]

Methods
11
Let’s assume that n columns of the matrix X are linearly independent and is given following
equation to find solution.
(XTX) β = XTY (Eq.5)
β includes model parameters that is used to visualization of vehicles on coordinate system. β1
represents a value of x axis, β2 represents a value of y axis and β3 is constant value.
2.2.3. Linear Correlation [9]
Linear correlation which is represents r, measures the strength and the direction of a linear
relationship between two variables.
The value of r is such that -1 r +1. The + and – signs are used for positive linear
correlations and negative linear correlations, respectively.
If x and y have a strong positive linear correlation, r is close to +1. An r value of
exactly +1 indicates a prefect positive fit. Positive numbers indicate a relationship
between X and Y variables such that as values for increases, values for Y also increase.
If x and y have strong positive linear correlation, r is close to -1. An r value of exactly -
1 indicates a perfect negative fit. Negative values indicate a relationship between X and
Y such that as values for X increases, values for Y decreases.
If there is no linear correlation or a weak linear correlation, r is close to 0. A value near
zero means that there is a random or nonlinear relationship between the two variables.
Methods
12
2.3. Software Components
One important part of my thesis work is the visualization of these calculated values on graphical
coordinate system and real map. To do this, many different suitable options can be found in the
software world. For the thesis work, optimum selections try to be choosing with a manifesto.
Visualization can be done by different ways. This can be done as a web based application or
desktop application. If it is decided to choose desktop, frame or applet can be two options. And
Final part of thesis is displaying vehicles on real map. Also there are more options to do this.
2.3.1. Desktop Application vs. Web Application [10]
First part of my thesis includes some calculation and displaying objects. These things can be
done as a desktop application or web application. Both of them can be used for each of project
but each of them has some advantages and disadvantages on different project.
A web application is an application delivered to users from a web server like the Internet. Some
businesses run web applications on an intranet, as well. Web applications are becoming more
popular due to the widespread use of the web browser as a client.
A desktop application is a self-contained program that performs a defined set of tasks under the
user control. Desktop applications run from a local drive and do not require a network or
connectivity to operate or function properly, though if attached to a network desktop application
might use the resources of the network.
These two platforms have some advantages and disadvantages. While looking these
explanations, is decided to use one of them.
Methods
13
Pros and Cons to Desktop and Web Applications:
Easily Accessible: Web applications can be easily access from anywhere or computer
which has internet connection. But desktop application only can be used on computer
that installed this application.
Low Maintenance & Forced Upgrades: Desktop applications are needed to install on
each computer many times, although web application require one time.
Increased Security Risks: There are always risks included when dealing with working
online, regardless of how secure a host might say a web application is, that fact of the
matter stands that the security risk of running an application of the Internet is more
significant than when running an application on a standalone desktop computer. Some
project requires more security as my project that is included important data so if
security is problem, desktop application is excellent selection.
Cost: Web applications are generally expensive project. Desktop application doesn’t
have any fees but rarely can be paid for software use.
Connectivity: Web applications need persistent and continuously connectivity. If you
don’t have internet connectivity, or your server doesn’t have internet connectivity, you
cannot be successful to accessing information. Critical applications that have no error
margin cannot risk denial of service attacks or power outages to interrupt their
operations and access data. But desktop applications don’t need any internet
connectivity. Electricity is enough to run application.
Speed: Web application depends on internet connection speed so if you don’t have fast
connection, you may have to wait longer.
Methods
14
My thesis work runs on important data so it needs to be reliable platform. Also it has to be good
connectivity and speed. Although my project a desktop application, it has some small web part.
We have to use web platform to display routes of vehicles. Because of reliability desktop
platform is used to work with important data, however because of necessity, small part of thesis
work is done on web platform.
2.3.2. Frame vs. Applet
There are two different kinds of developing areas in Java. Desktop application platform and
applet platform. We can develop our project both of these two platforms on Java.
Applet is a java program that can be embedded in HTML pages. Java applets run on the java
enables web browser such as Internet Explorer, Mozilla or Opera. Applet is designed to run
remotely on the client browser, so there are some restrictions on it. Generally Applets used to
make the website more dynamic.
These are some advantages and disadvantages between application and applets are written
below.
Applets generally small programs while desktop application is larger programs.
Applets are designed for the client site programming purpose while applications don’t
have such type of criteria.
Applets are designed for handling client side problems, while java applications are
designed to work with the client as well as server.
Java applications are designed to work under the homogenous and more secure areas. On
the other hand, java applets are designed to run the heterogeneous and probably
unsecured environment.
Applets are not capable of reading and writing the user’s file system. Applet cannot
access local area but Application can access the user’s file system and can use native
methods.
Java applications have the majority of differences with the java applets. If we talk at the source
code level, then we don't extend any class of the standard java library that means we are not
Methods
15
restricted to use the already defined method or to override them for the execution of the
program. Instead we make set of classes that contains the various parts of the program and
attach the main method with these classes for the execution of the code written in these classes.
Consequently, I will develop a kind of large program that uses important data. So it needs to be
secure. Furthermore, I will work with user’s file system to take files on it. So, desktop
application platform is suitable, if we evaluate descriptions of application and applet. [11]
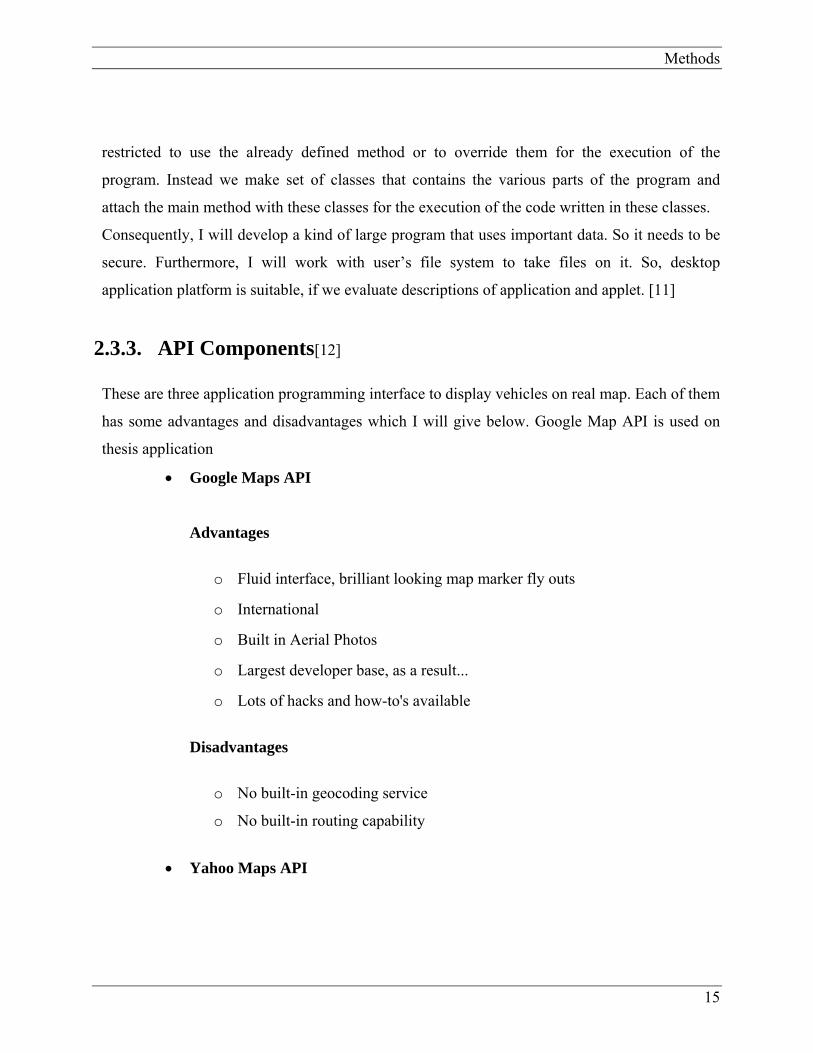
2.3.3. API Components[12]
These are three application programming interface to display vehicles on real map. Each of them
has some advantages and disadvantages which I will give below. Google Map API is used on
thesis application
Google Maps API
Advantages
o Fluid interface, brilliant looking map marker fly outs
o International
o Built in Aerial Photos
o Largest developer base, as a result...
o Lots of hacks and how-to's available
Disadvantages
o No built-in geocoding service
o No built-in routing capability
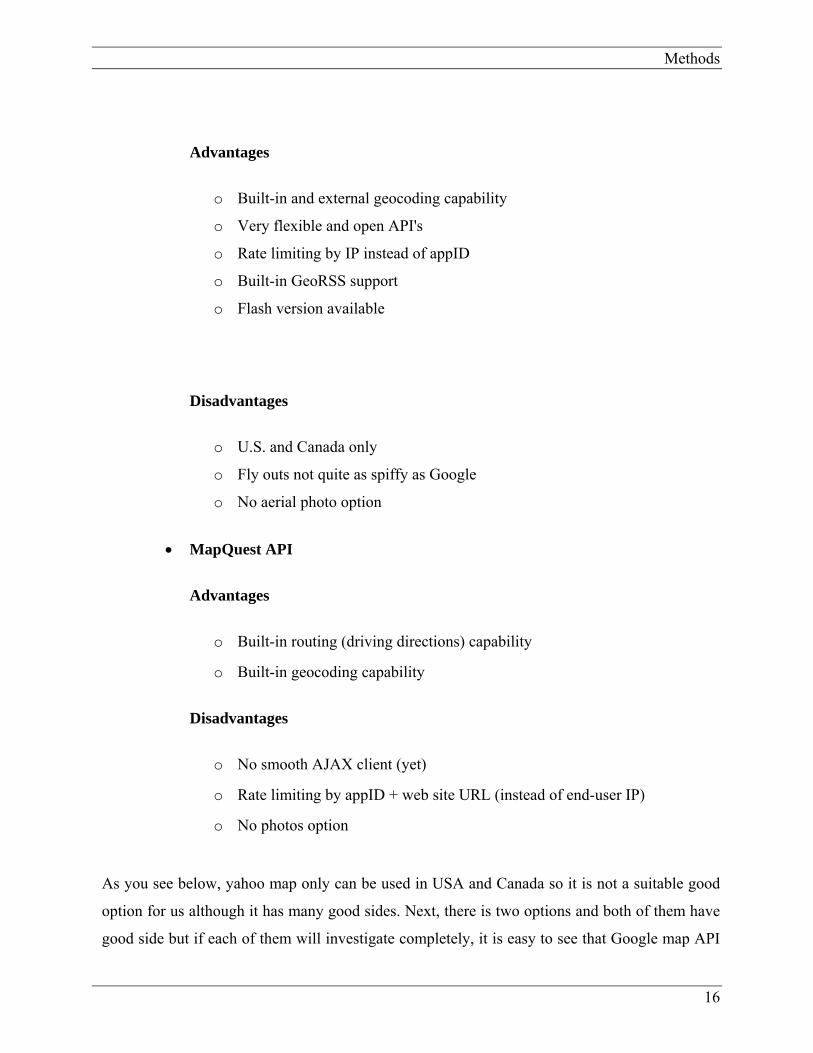
Yahoo Maps API
Methods
16
Advantages
o Built-in and external geocoding capability
o Very flexible and open API's
o Rate limiting by IP instead of appID
o Built-in GeoRSS support
o Flash version available
Disadvantages
o U.S. and Canada only
o Fly outs not quite as spiffy as Google
o No aerial photo option
MapQuest API
Advantages
o Built-in routing (driving directions) capability
o Built-in geocoding capability
Disadvantages
o No smooth AJAX client (yet)
o Rate limiting by appID + web site URL (instead of end-user IP)
o No photos option
As you see below, yahoo map only can be used in USA and Canada so it is not a suitable good
option for us although it has many good sides. Next, there is two options and both of them have
good side but if each of them will investigate completely, it is easy to see that Google map API
Methods
17
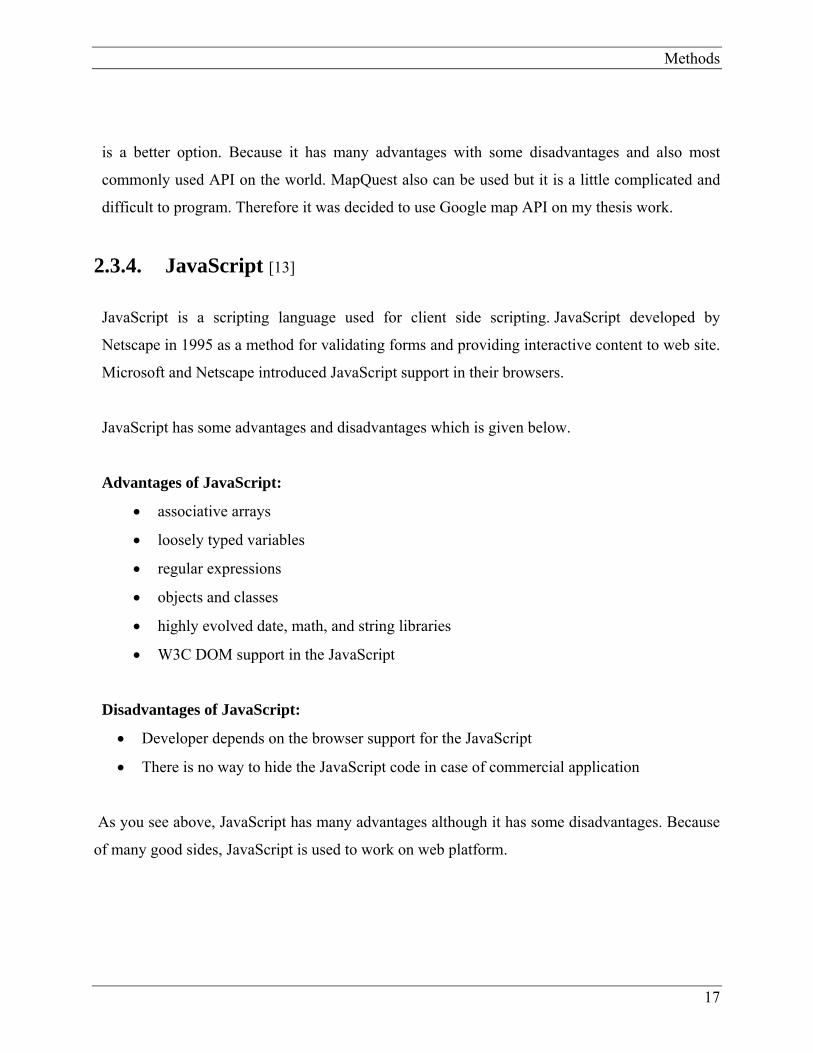
is a better option. Because it has many advantages with some disadvantages and also most
commonly used API on the world. MapQuest also can be used but it is a little complicated and
difficult to program. Therefore it was decided to use Google map API on my thesis work.
2.3.4. JavaScript [13]
JavaScript is a scripting language used for client side scripting. JavaScript developed by
Netscape in 1995 as a method for validating forms and providing interactive content to web site.
Microsoft and Netscape introduced JavaScript support in their browsers.
JavaScript has some advantages and disadvantages which is given below.
Advantages of JavaScript:
associative arrays
loosely typed variables
regular expressions
objects and classes
highly evolved date, math, and string libraries
W3C DOM support in the JavaScript
Disadvantages of JavaScript:
Developer depends on the browser support for the JavaScript
There is no way to hide the JavaScript code in case of commercial application
As you see above, JavaScript has many advantages although it has some disadvantages. Because
of many good sides, JavaScript is used to work on web platform.
Implementation
18
3. Implementation
My thesis application is generally constructed on visualization of GPS data on a coordinate
system and real map. Visualization is a kind of java application for my thesis work. Before the
work on the visualization interface, some research was done on internet about calculations and
java tools.
To develop the interface, the following steps are done one by one orderly;
It is decided to what kind of project will be done at the beginning of thesis work.
A basic flow chart is designed.
While looking this flow chart, UML design of project is done.
Then, with using this UML diagram, programming of project is done.
After finish desktop application part, writing script part which is used to see routes of
vehicle on real map is started.
Finally, a basic xml file is written to define start and end points for each vehicle.
After follow these steps, few small changes are done on application and complete the project.
3.1. Description of Functionality
Project is a client side application so user needs to be done something to see solution.
First of all, application is totally under user control. Every step is triggered following steps so
without complete one step, passing next step cannot be possible for end user. E.g. without
upload data file, pushing drawing button will not give an answer to you and application will
warn you about this wrong step. So I will talk about my project step by step to understand why
is important to do orderly.
Implementation
19
At the beginning, after run the application, user see a panel which includes all data types,
menu bar for uploading file, and percentage panel for defining the data amount and draw
button. Running process is working with these values which will define from end user.
User can start to uploading file with give file path on file chooser or to define three data
type in all data types which is about vehicle or can be define percentage of data amount.
After finished all these steps, can be push draw button to display solutions on new frame
and web application.
Before finished all three steps, pushing draw button will not give you answer and
application will open a warn panel.
Secondly, after push draw button.
All file is read until end of file in FileInput.java class.
Normalization of each value is also done same class.
Linear regression algorithm is executed on these values and finds correlation
values for each vehicle.
In Graph.java class, with use these correlation values, is displayed the vehicles
with a coordinate system on different frame.
Also, is opened another frame that includes the buttons which represents to each
vehicle.
Final part is displaying vehicles on real map and push a button on button frame is enough
to update JavaScript file .To see routes on map, run map.htm JavaScript file.
3.2. Flow Chart and Uml Design of Application
UML (Unified Modeling Language) is a standard language for specifying, visualizing,
constructing and documenting the artifacts of software systems, as well as for business modeling
and other non-software systems. The UML is a very important part of developing objects
Implementation
20
oriented software and the software development process.[14] So UML designing is used on
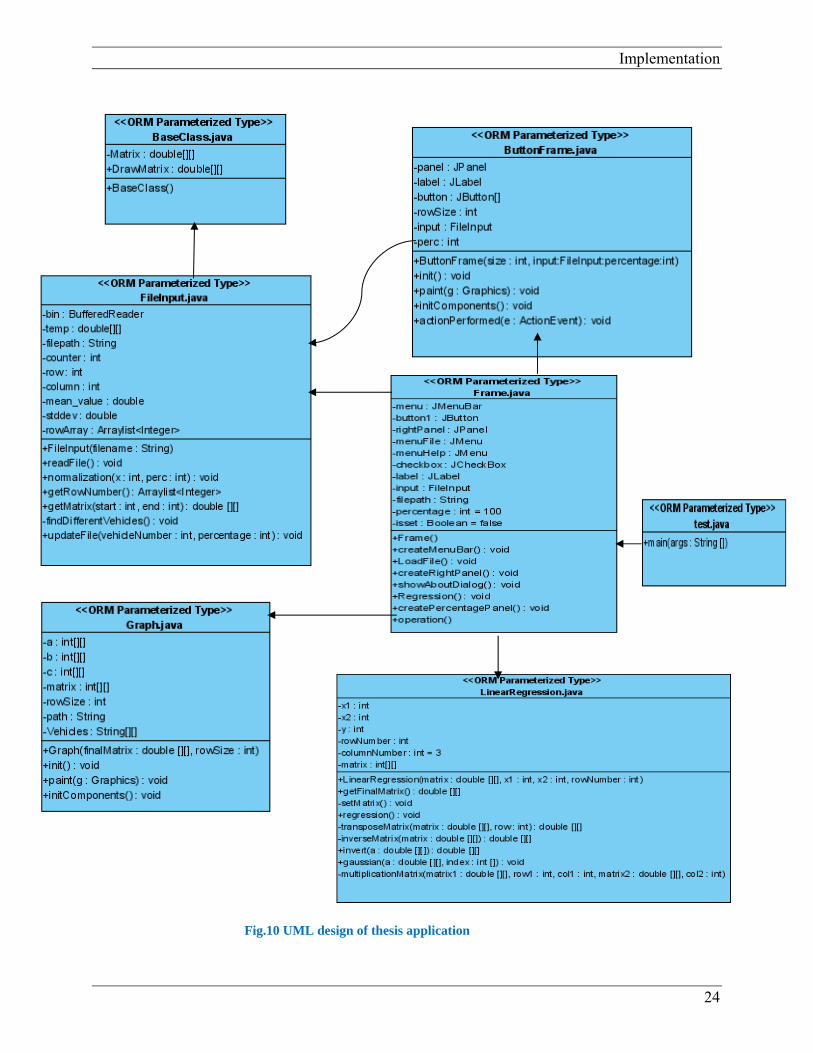
thesis application and is given below Fig.10. If we will investigate to UML design, generally we
can understand the designing of classes and inheritance of class with each other.
While looking UML design, let’s do small explanations. Broadly explanation is done in
appendixes part of report.
On the base of class design, BaseClass.java is used. This class includes only two matrixes and
it gives us a general idea of project. This class is saying us; there are only used two matrixes to
hold our values.
FileInput.java class is inherited from BaseClass.java. This class is used to file operations e.g.
reading, writing, updating. Such as,
Firstly, reading collected data on .txt file
Splitting these values and put them into a matrix
Executing normalization algorithm on these values and updating the matrix.
Definition of different vehicles.
Finally, updating script file which is used to vehicles on real map.
Frame.java is a main class of application. All control of other parts is done on this class. When it
is looked to UML design, almost all class is connected to this class and all of them have to
exchange of information. Also test class is directly calling only this class and all other classes is
running on this class. Mainly following things is done in class.
Mainly displaying main frame on screen
Controlling file update, data types and percentages of data
After push the draw button, calling regression function
In regression function, general controlling of reading file, normalization of each data on
file
Implementation
21
Calling two different object for opening two different frame which is used for displaying
vehicles on coordinate system and controlling the vehicles for real map
Finally there are action listener functions for each checkbox and button.
LinearRegression.java class is mainly used to run linear correlation algorithms with use collected
data. If you look LinearRegression.java class on UML design, there is used to regression function
to do this. This function is called by Frame.java class after read data type which is set by end user
and collected data. Linear Regression algorithm includes following steps and all of them is done
on this class.
Firstly, we need to split data into three matrixes and each of them is used for each data
types. So, after reading of total matrix, splitting into three matrixes is done on this class.
Then, regression algorithms that contain transpose of matrix, multiplication of matrix,
taking inverse of matrix are enforcing there.
ButtonFrame.java is another class to design frame which is used to put buttons that denoted each
vehicle on it. We can put these buttons on the same frame which is created by Graph.java. But
there occur a problem about drawing objects of java. When we put a panel or directly put the
buttons on same frame with drawing object, we need to repaint it every time. If it is done to
repainting of frame, we cannot see drawing object same time. Because of this problem this new
class is created. This class is called by Frame.java class. After is clicked draw button on main
frame, this class will call with use object of ButtonFrame.java class. Following steps are done in
this class.
Is used to control button frame which is used for denote each vehicle.
Calling update function to update script file which is used to displaying vehicles on real
map with listen the buttons.
Frames size and number of buttons can change dynamically depend on vehicle number.
Implementation
22
Graph.java class is used to displaying drawing object on frame. Mainly, this class is used to
displaying vehicles on coordinate system. Like ButtonFrame.java class, also this class is called by
Frame.java class at the same with Graph.java class. After called this class, following steps is done
in this class;
Displaying a frame which is used for drawing objects
Drawing coordinate systems and split it dynamically depend on x and y values.
Drawing a label panel to realize which point for which vehicle.
There is used a colourful design and each vehicle denote each vehicle on coordinate
systems and label panel.
There is also one more file which is used to connect Google map server and display vehicles on
real map, is called map.htm. This file includes a basic html and JavaScript code. If you will look
UML design, in FileInput.java class has a function which is called updateFile; also this function
is called by ButtonFrame.java class. To displaying route of vehicle on real map, updating of two
keywords which is called “saddr” and “daddr” is enough. As we said before, our project has a
small web part and web part is this html file.
To protect our data, we are doing all calculations on desktop application and final solution points
are sending this web file and displaying the routes.
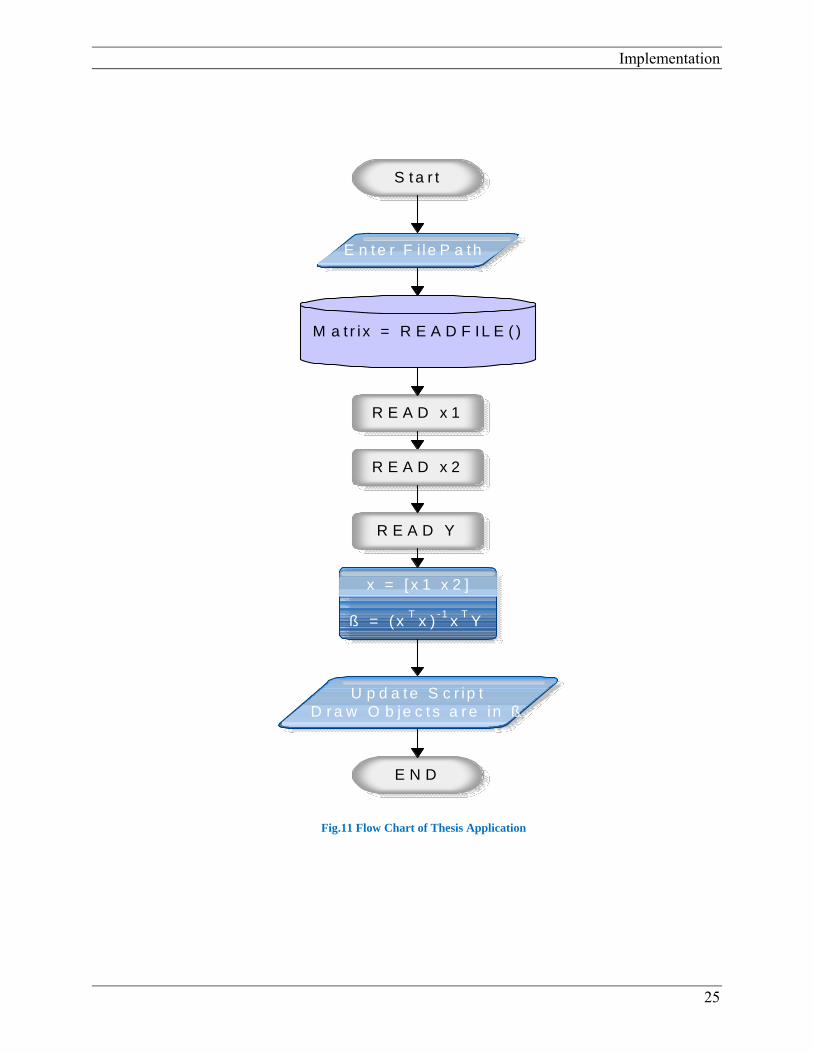
On the other hand, there is another figure that is called Fig.11, is given below. It is flow chart of
our application. Generally it helps us to understand of flowing of application.
Application is starting after run application on compiler.
After that, mainly project is working on collected so this data need to be read. To read a file, we
need a file path which is used to access file. As you see second step of flow chart is reading file
path. This path can be given statically by write path of file as a string or can be done dynamically
with use file chooser on java. As you see second step of flow chart is reading file path.
Implementation
23
Then, after take file path as a string value, we can start to reading file until end of file. Also we
can do this reading statically that we know the line number of file, or can be done dynamically
which is done on thesis work until end of file. These read values are put a matrix which is used
later.
Next step of application is executing linear correlation algorithm on these read data. To do this,
we need data types. Almost fifteen data type we have in collected data and we need three of them.
So we are given options to end user to choose which three of them want to see and these three
data type is read.
Later, to displaying values on coordinate system, we need to run algorithm. Before pass to final
step, we are doing these calculations as is shown on flow chart. And final step, displaying these
correlation values with use drawing objects and updating script to see right route on real map.
Then after see all displaying object, the application is finished while clicking close button on the
right corner of application.
Implementation
24
Fig.10 UML design of thesis application
Implementation
25
Fig.11 Flow Chart of Thesis Application
S ta r t
M a t r i x = R E A D F IL E ( )
R E A D x 1
R E A D Y
R E A D x 2
x = [ x 1 x 2 ]
ß = ( xT
x )-1
xT
Y
E N D
E n te r F i le P a th
U p d a te S c r ip tD r a w O b je c t s a r e in ß
Results
26
4. Results
This thesis work is done to visualize collected data on a coordinate system and GPS. A
collection of data for each vehicle is used to compute model parameters . Screen shots of
application is given below, maybe they can be good to understand operation of thesis work.
Now, I will try to explain dependence between model parameters of four different vehicles and
their route on real map. We will try to see if vehicle has almost same model parameters, they
have same geographical conditions. Whether one of vehicle has different model parameters , can
be say that this vehicle has different geographical conditions.
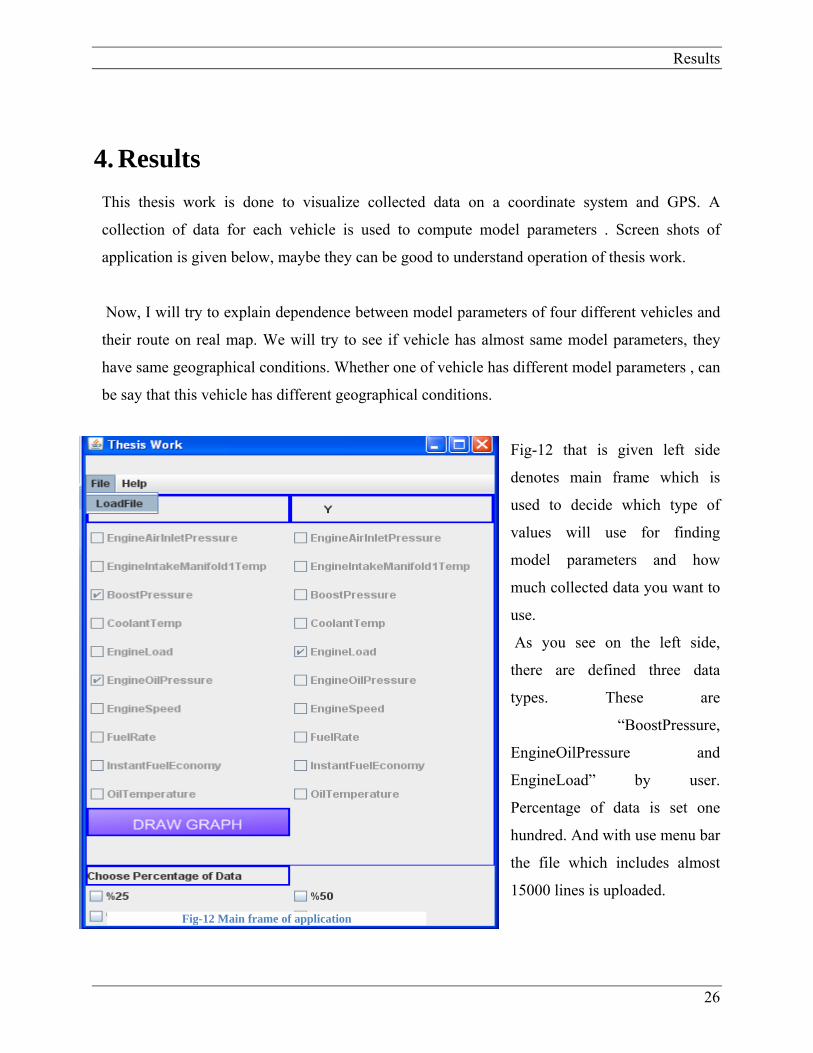
Fig-12 that is given left side
denotes main frame which is
used to decide which type of
values will use for finding
model parameters and how
much collected data you want to
use.
As you see on the left side,
there are defined three data
types. These are
“BoostPressure,
EngineOilPressure and
EngineLoad” by user.
Percentage of data is set one
hundred. And with use menu bar
the file which includes almost
15000 lines is uploaded.
Fig-12 Main frame of application
Results
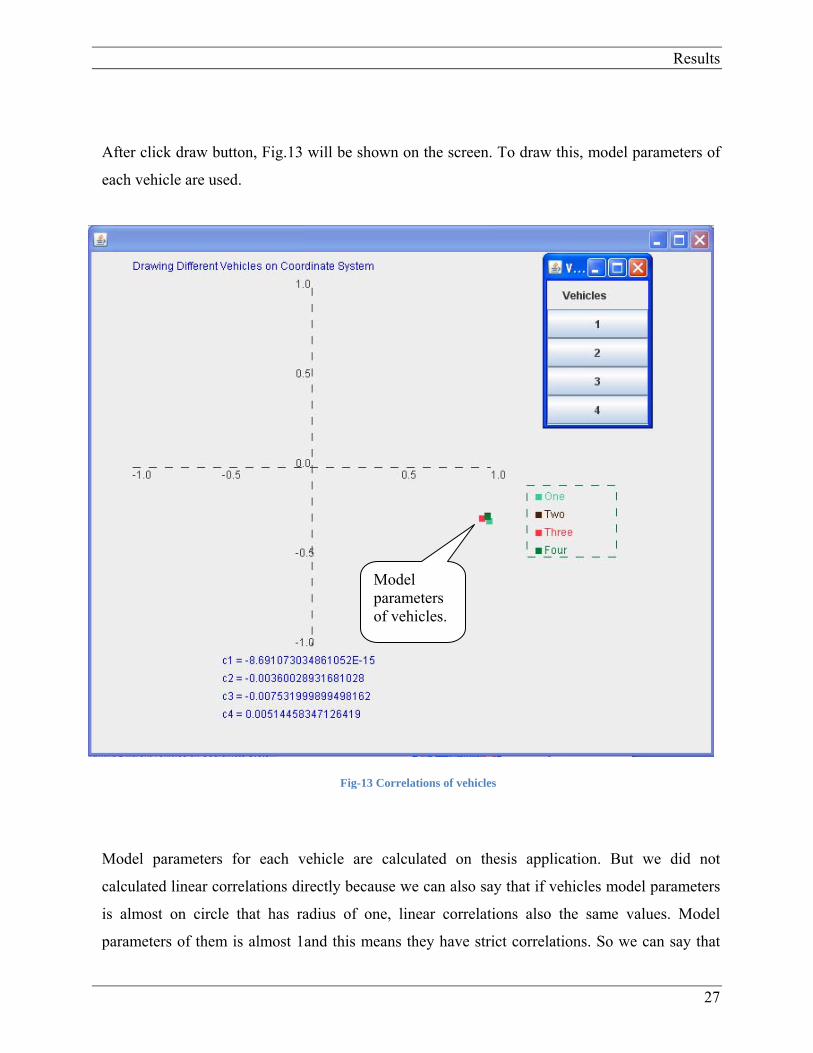
27
After click draw button, Fig.13 will be shown on the screen. To draw this, model parameters of
each vehicle are used.
Model parameters for each vehicle are calculated on thesis application. But we did not
calculated linear correlations directly because we can also say that if vehicles model parameters
is almost on circle that has radius of one, linear correlations also the same values. Model
parameters of them is almost 1and this means they have strict correlations. So we can say that
Model parameters of vehicles.
Fig-13 Correlations of vehicles
Results
28
for this example, these vehicles have similar geographical conditions. However, if they have
weak correlation, we can not exactly say that they have similar geographical conditions.
In addition, we can also say that if the geographical conditions are similar, the correlations don’t
affect driver style, vehicle type or more. So this algorithm can be use for all vehicles without
interested in driver style, vehicle type, weather conditions etc.
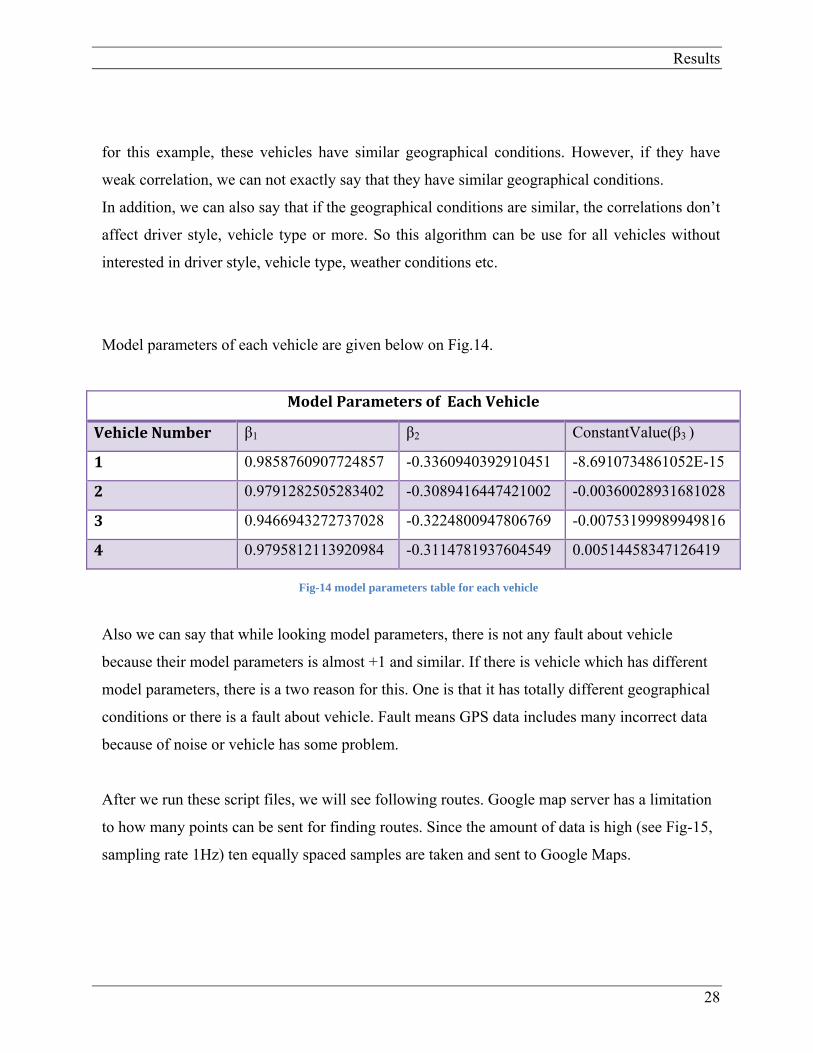
Model parameters of each vehicle are given below on Fig.14.
Model Parameters of Each Vehicle
Vehicle Number β1 β2 ConstantValue(β3 )
1 0.9858760907724857 -0.3360940392910451 -8.6910734861052E-15
2 0.9791282505283402 -0.3089416447421002 -0.00360028931681028
3 0.9466943272737028 -0.3224800947806769 -0.00753199989949816
4 0.9795812113920984 -0.3114781937604549 0.00514458347126419
Also we can say that while looking model parameters, there is not any fault about vehicle
because their model parameters is almost +1 and similar. If there is vehicle which has different
model parameters, there is a two reason for this. One is that it has totally different geographical
conditions or there is a fault about vehicle. Fault means GPS data includes many incorrect data
because of noise or vehicle has some problem.
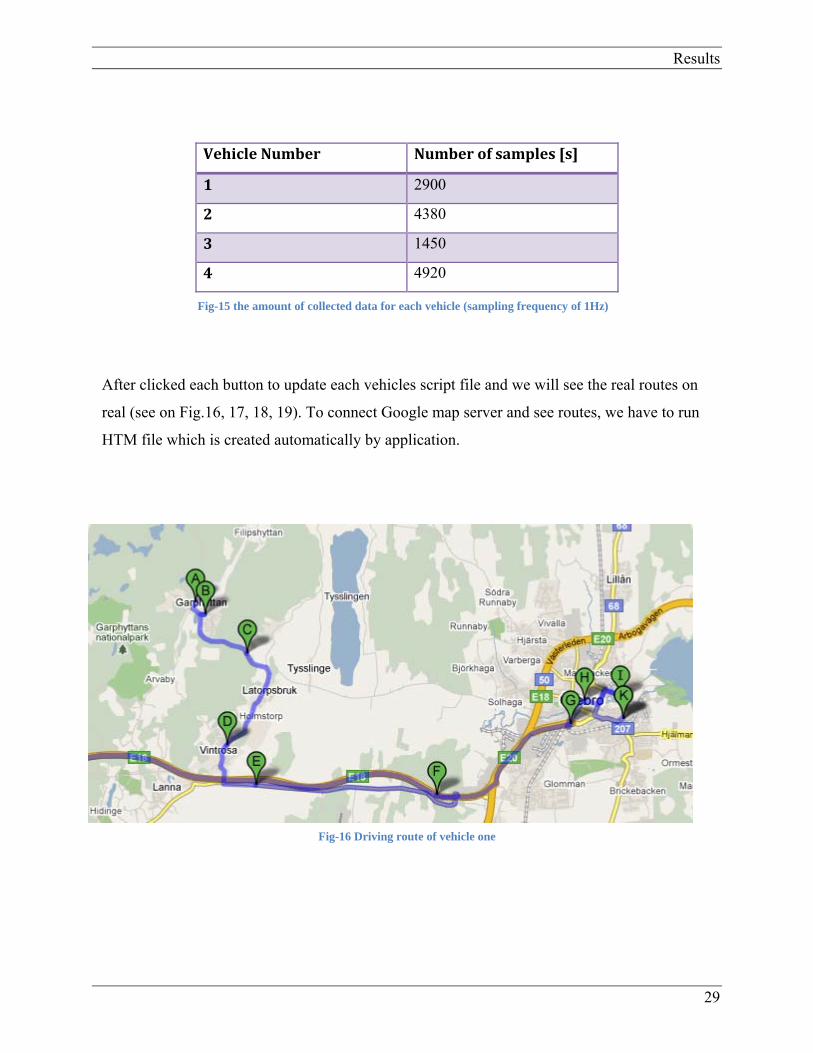
After we run these script files, we will see following routes. Google map server has a limitation
to how many points can be sent for finding routes. Since the amount of data is high (see Fig-15,
sampling rate 1Hz) ten equally spaced samples are taken and sent to Google Maps.
Fig-14 model parameters table for each vehicle
Results
29
Vehicle Number Number of samples [s]
1 2900
2 4380
3 1450
4 4920
After clicked each button to update each vehicles script file and we will see the real routes on
real (see on Fig.16, 17, 18, 19). To connect Google map server and see routes, we have to run
HTM file which is created automatically by application.
Fig-16 Driving route of vehicle one
Fig-15 the amount of collected data for each vehicle (sampling frequency of 1Hz)
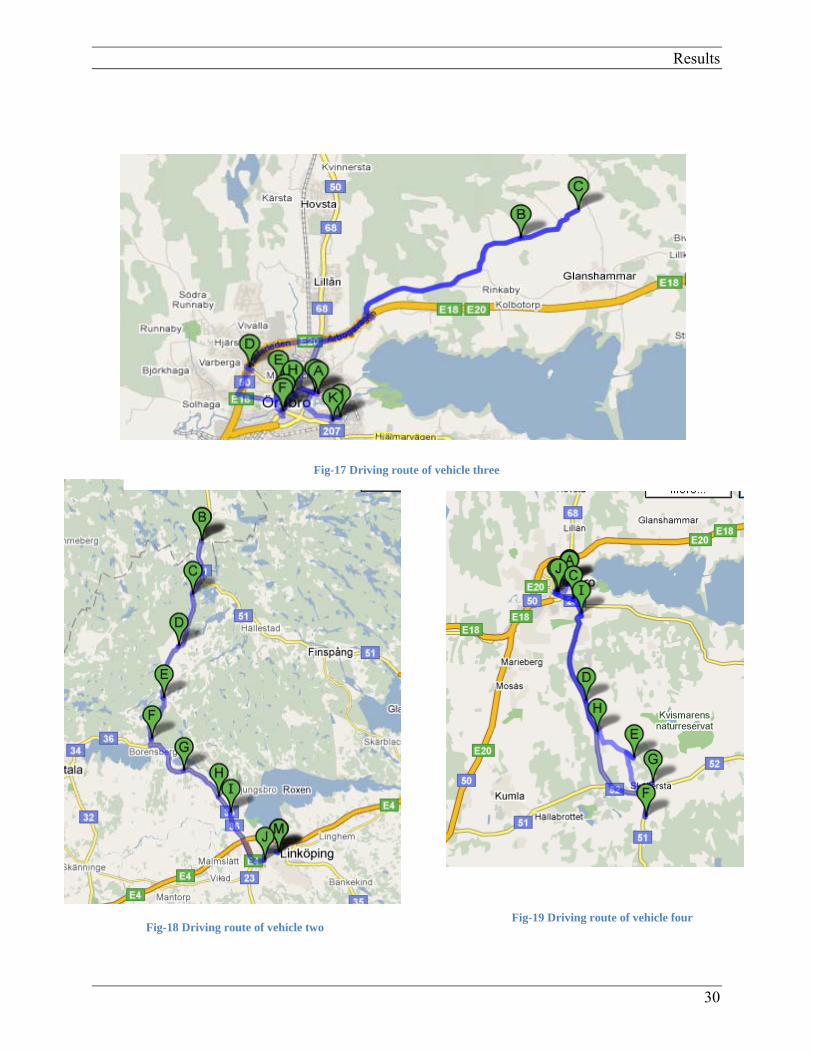
Results
30
Fig-17 Driving route of vehicle three
Fig-18 Driving route of vehicle two
Fig-19 Driving route of vehicle four
Conclusions
31
5. Conclusions
Visualization of some collected data which is coming from GPS is done on thesis work. To
doing this first model parameters of vehicle is found and display these values on coordinate
system. It is assumed that model parameters is almost same meaning with linear correlation so
all comments is done with use linear correlation of vechile. And at the end of application, all
vehicles routes is shown on real map with use Google Map server.
Model parameters are good way for an idea of how their geographical condtions are. If the
model parameters is almost on the circle that has radius of 1, there is an two different solution
can be seen on coordinate system. One is similar model parameters means they have similar
geographical conditions although these vehicle has differenct driver styles and vehicle
conditions. Another solution is vehicles are totally different model parameters because of that
they have totaly different geographical conditions or there is an fault. On the other hand, if the
model parameters is not on circle that has radius of 1, they have no strict correlations so we
can’t exactly say something about these vehicles. Because they can have values which has noisy
data or something is wrong depend on vehicle.
As a conclusion, we try to explain that model parameters of vehicle data that can be GPS data or
other sensor data give an idea about road conditions without effect driver style or weather
conditions. Visualization of these data is an easy way to appreciate of vehicles model parameters
and same as linear correlation values. Final part of thesis is displaying vehicle on real map with
use GPS data is an easy way to understand geographical condtions whilc checking routes of
vehicle.
I think that this thesis project can be develop to calculate more data in short time or use other
correlation algorithms E.g. Non-linear correlation algorithm or so on.
References
32
6. References
[1] Margherita Zanini, Alan Bitterman and Julia Giuliano, Mobile Assets Monitoring for Fleet
Maintenance Ford Motor Company, 2005 SAE World Congress Detroit, Michigan
April 11-14, 2005
[2] S. Byttner, T. R¨ognvaldsson, M. Svensson, G. Bitar, W. Chominsky, Networked vehicles for
automated fault detection Halmstad University
[3] Bernard J. Carr, Practical Application of Remote Diagnostics 2005 SAE World Congress
Detroit, Michigan, April 11-14, 2005
[4] Margherita Zanini, Alan Bitterman and Julia Giuliano, Mobile Assets Monitoring for Fleet
Maintenance, 2005 SAE World Congress Detroit, Michigan April 11-14, 2005
[5]URL: http://en.wikipedia.org/wiki/Arithmetic_mean
[6]URL: http://en.wikipedia.org/wiki/Standard_deviation
[7]URL: http://en.wikipedia.org/wiki/Standard_score
[8]URL: http://en.wikipedia.org/wiki/Linear_least_squares
[9]URL: http://mathbits.com/Mathbits/TISection/Statistics2/correlation.htm
[10]URL : http://searchwarp.com/swa43806.htm
[11]URL: http://www.roseindia.net/java/example/java/applet/applet-versus-application.shtml
[12]URL: http://www.techcrunch.com/2006/04/17/comparing-the-mapping-services/
[13]URL: http://www.roseindia.net/javascript/what-is-javascript.shtml
[14]URL : http://atlas.kennesaw.edu/~dbraun/csis4650/A&D/UML_tutorial/what_is_UML.htm
Appendix
33
7. Appendix
7.1. CLASS DEFINITIONS
7.1.1. Class of LinearRegression.java
Linear regression algorithm is performed on data in this class. Complex matrix calculations with
use theorems e.g. Gaussian is done here.
LinearRegression(double matrix[][], int x1, int x2, int y, int rowNumber)
Matrix [][] is include values for vehicles.
x1, x2 and y is denoted the order number for data type.
rowNumber is used to define amount of data
This constructor is used to initialization of matrix, x1, x2 and rowNumber and
managing of splitting matrix and regression.
double [][] getFinalMatrix()
This function is used to return final matrix that include final values of each vehicle.
void setMatrix()
This function is used to splitting matrix to one by one for each vehicle.
void regression()
This function is used to implement E.q-4 which is given above.
double[][] transposeMatrix(double matrix[][],int row)
matrix [][] is a matrix which will be taken transpose.
row is denote the number of value .
This function is used to take transpose of matrix and return it a as a double matrix.
double[][] inverseMatrix(double matrix[][])
matrix [][] is a matrix which will take inverse.
CLASS DEFINITIONS
34
This function is used to take inverse of matrix and return it a as a double matrix with
use invert and Gaussian functions.
void gaussian(double a[][],int index[])
a [][] is a matrix which will inverse.
index[] is the length of a matrix.
This function is used to execute Gaussian theorem for taking inverse of matrix.
double[][] invert(double a[][])
This function is used to control taking of inverse to matrix.
double[][] multiplicationMatrix(double[][] matrix1,int row1,int col1, double[][]
matrix2, int col2)
matrix1 [][] is the first matrix .
row1 is row number of first matrix.
col1 is column number of first matrix and row number of second matrix
matrix2[][] is the second matrix.
col2 is column number of second matrix.
This function mainly used to multiplication of two matrix and return a final matrix.
7.1.2. Class of FileInput.java
This class is used to file operations e.g. reading, writing, updating.
FileInput(String filename)
filename is denoted path of file which include collected data.
This constructor is used to take file path and initialization of values.
void readFile()
CLASS DEFINITIONS
35
This function used to reading file to end of file. Splitting these values and putting into
a matrix is done on this function. Finally, after split these values, need to be parse these
values as a double value is also done here.
void normalization(int x, int perc)
x is denoted the column number of value that is defined by user on first frame.E.g.
EngineInTakeManifold1Temperature, EngineAirInletPressure
perc is denoted the percentage of data which is used to calculate mean and
standard deviation values.
After run this function, all values are normalized and are put them into same matrix.
ArrayList<Integer> getRowNumber()
This function is used to return a array list that include different vehicle’s row numbers.
double[][] getMatrix(int start, int end)
start is denoted the start row number of vehicle
end is denoted the end row number of vehicle.
This function returns a double matrix with use start and end row numbers.
void findDifferentVehicles()
This function is used to find different vehicles row numbers and put the values into a
arraylist.
void updateFile(int vehicleNumber, int percentage) throws FileNotFoundException,
IOException
vehicleNumber is denoted the vehicle number
percentage is denoted the percentage of data.
CLASS DEFINITIONS
36
Exceptions are used because of file operations. If something problem while
reading file, exception will be thrown.
This function is used to update to script file. After click the button on button frame,
updateFile function is called and prepared the script file that will be used
to see vehicles on real map
7.1.3. Class of ButtonFrame.java
ButtonFrame(int size, FileInput input,int percentage)
size denotes the number of different vehicle
input denotes an object to use connecting the FileInput class
percentage shows the amount of data.
This constructor is used to take size, input and percentage of data and initialize the
values.
void init()
This function is used to initialization of frame.
void paint(Graphics g)
g is used to use drawing object.
This function is used to creating a panel which is used to put buttons on
void actionPerformed(ActionEvent e)
This function is used to add listener to each button.
7.1.4. Class of Frame.java
This is used to creating main frame on screen. Options of data types and percentages of data is
shown on this frame. Also controlling of data types and to display linear correlations on
coordinate system also controlling on this frame.
CLASS DEFINITIONS
37
Frame()
This constructor is used to create panels and initialization of values.
void createMenuBar()
This function is used to create MenuPanel.
void LoadFile()
This function is used to opening File Chooser and taking path of file and sending
this path to FileInput class with use creating an object of FileInput class.
void createRightPanel()
This function is used to create panel which is used to given options of different
data types . It is shown Fig-8.There is a button which is used to control other frames is
created and put it on this class. There is also actionlisteners for each check box to control
is it checked or not.
void showAboutDialog()
This function is used to open about dialog.
void Regression()
This function is used to control also steps of regression algorithms with start to
reading file. We need to send data types one by one to execute algorithm on it and these
control also is done here. After finish normalization of data, sending the values for
drawing to creating a new object is also done there.
createPercentagePanel()
This function is used to create percentage panel that include four different percentage
options.
CLASS DEFINITIONS
38
7.1.5. Class of Graph.java
This class is used to create a frame which is used for displaying vehicles on coordinate system.
Graph(Double finalMatrix[][], int rowSize)
finalMatrix includes ratio values.
rowSize is rowSize is the number of different vehicle.
This constructor is used for taking final matrix that includes final values for each
vehicle and row size. The initialization of values and splitting values as a x, y and
constant value are also done on constructor.
init()
This function is used to initialization of frame.
paint(Graphics g)
g is used to use drawing object.
Drawing coordinate system and points for each vehicle and drawing label panel is
done this function.
7.1.6. Class of BaseClass.java
This class is used for define first matrixes and initialize it with a null values. Mainly this class
can be use to understand how about my functions for other programmers that will use my
application.
7.1.7. Class of TestClass.java
This class is used to test application. Mainly, only create an object from Frame.java Class which
is given below and call constructor.
CLASS DEFINITIONS
39
7.1.8. JavaScript.htm
Final work on my thesis application is displaying route of each vehicle on real map with use
Google map API and JavaScript language.
To develop a script file which uses Google map API, we need to follow these steps:
To connect Google map server, take a Google map API key from following this
web address, http://code.google.com/intl/tr-TR/APIs/maps/signup.html with registering.
Write a basic html file which JavaScript is integrated among it such as,
<html>
<head>
// API key will add there.
</head>
<body>
// JavaScript code will add here.
</body>
</html>
If you will use xml file to store your data, write a basic xml file, such as
<markers>
<marker lat="59.2693" lng="15.2382” html="<b/> VehicleName = 1 </b/> <br
/> Xpoint = 59.2693 <br /> Ypoint = 15.2382 " label="FBC"/>
</markers>
Finally, write your JavaScript code and integrate it to html code.
Let’s look at my JavaScript code;
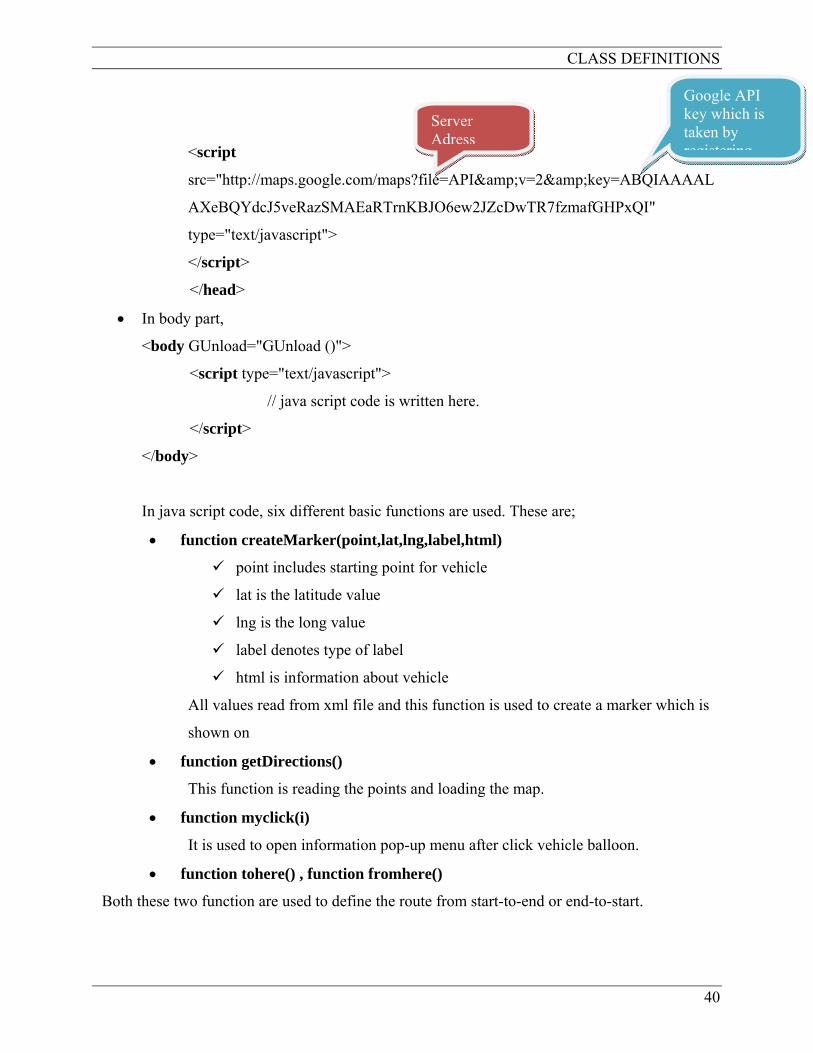
In head part,
<head>
CLASS DEFINITIONS
40
<script
src="http://maps.google.com/maps?file=API&v=2&key=ABQIAAAAL
AXeBQYdcJ5veRazSMAEaRTrnKBJO6ew2JZcDwTR7fzmafGHPxQI"
type="text/javascript">
</script>
</head>
In body part,
<body GUnload="GUnload ()">
<script type="text/javascript">
// java script code is written here.
</script>
</body>
In java script code, six different basic functions are used. These are;
function createMarker(point,lat,lng,label,html)
point includes starting point for vehicle
lat is the latitude value
lng is the long value
label denotes type of label
html is information about vehicle
All values read from xml file and this function is used to create a marker which is
shown on
function getDirections()
This function is reading the points and loading the map.
function myclick(i)
It is used to open information pop-up menu after click vehicle balloon.
function tohere() , function fromhere()
Both these two function are used to define the route from start-to-end or end-to-start.
Server Adress
Google API key which is taken by registering