Design of a neural network character recognizer for a touch terminal
15
Pattern Recognition, Vol. 24, No, 2, pp. 105-119. 1991 Printed in Great Britain 0031-3203/9l $3.00 + .00 Pergamon Press plc Pattern Recognition Society DESIGN OF A NEURAL NETWORK CHARACTER RECOGNIZER FOR A TOUCH TERMINAL I. GUYON,¢ P. ALBRECHT,* Y. LE CUN,[" J. DENKERt and W. HUBBARDt t AT&T Bell Laboratories, Holmdel, NJ 07733, U.S.A.; * AT&T Bell Laboratories, Columbus, OH 43213, U.S.A. (Received 13 March 1990; in revised form 20 June 1990; received for publication 9 July 1990) Abstract--We describe a system which can recognize digits and uppercase letters handprinted on a touch terminal. A character is input as a sequence of [x(t),y(t)] coordinates, subjected to very simple preprocessing, and then classified by a trainable neural network. The classifier is analogous to "time delay neural networks" previously applied to speech recognition. The network was trained on a set of 12,000 digits and uppercase letters, from approximately 250 different writers, and tested on 2500 such characters from other writers. Classification accuracy exceeded 96% on the test examples. Character recognition On-line character recognition Neural networks Touch terminal Touch screen Handwritten characters 1. INTRODUCTION Handwritten character recognition has enormous scientific and practical interest. Numerous methods have been proposed in the literature; for reviews see references (1, 2). These include statistical methods that require large amounts of training data, and structural approaches that require considerable detailed programming. Our neural-net approach is intermediate between these extremes. In this paper we address the on-line recognition of hand-printed characters entered on a touch terminal; i.e. trajectory information is usedJ 3) This makes the problem different from the usual Optical Character Recognition task. (4) A widely accepted approach is to perform a feature extraction, followed by a classification. The feature extractor is usually predefined and problem-depen- dent. It requires most of the design effort, and det- ermines the performance to a large extent. The classifier, on the other hand, usually incorporates a trainable module, containing little or no problem- specific information. Systems which do not incor- porate any learning can be difficult to design, and can lack generality for problems with high variability. Neural networks are appealing for pattern rec- ognition problems, since they provide a very flexible tool which allows integrating the feature extractor and the classifier in a single, trainable system. As a consequence, the demands on the preprocessor are greatly reduced. Such methods resulted in high rec- ognition accuracy on zipcode digit recognition/5~ as well as on speech recognition. (6--8) Neural nets involve only simple arithmetic opera- tions, with a very simple control structure. They can be implemented on standard sequential machines, or they can be easily pipelined or parallelized on DSP or special purpose chips. (5~ 1.1. Problem specifications The methods proposed in the literature, and the results obtained, depend heavily on several factors: the nature of the input device (sensitive pad, scanner, camera); the constraints on the characters (isolated characters or continuous writing); the number of classes or categories (digits only, upper or lowercase letters only, symbols); the number of users (single- writer or writer independent); and the possible use of contextual information. This paper describes a recognition system with the following specifications: --Characters are entered on a touch terminal, shown in Fig. 1. They are represented as sequences of [x(t), y(t)] coordinates. --Characters are drawn in disjoint boxes, so that only trivial segmentation is needed. --Either digits or uppercase letters are considered. --The system is trained to be writer independent. --No use is made of syntax, semantics or other contextual information. We used a set of 12,000 characters from approxi- mately 250 writers. The performance of the system was evaluated on a set of 2500 characters from a disjoint set of writers. The data were collected among AT&T staff at Columbus, Ohio. The touch terminal is convenient for users who prefer a touch interface over a keyboard and/or mouse, or for applications that require a smaller, more portable input device than conventional ter- 105
-
Upload
independent -
Category
Documents
-
view
0 -
download
0
Transcript of Design of a neural network character recognizer for a touch terminal

Pattern Recognition, Vol. 24, No, 2, pp. 105-119. 1991 Printed in Great Britain
0031-3203/9l $3.00 + .00 Pergamon Press plc
Pattern Recognition Society
DESIGN OF A N E U R A L NETWORK CHARACTER RECOGNIZER FOR A TOUCH TERMINAL
I. GUYON,¢ P. ALBRECHT,* Y. LE CUN,[" J. DENKERt and W. HUBBARDt t AT&T Bell Laboratories, Holmdel, NJ 07733, U.S.A.; * AT&T Bell Laboratories, Columbus, OH
43213, U.S.A.
(Received 13 March 1990; in revised form 20 June 1990; received for publication 9 July 1990)
Abstract--We describe a system which can recognize digits and uppercase letters handprinted on a touch terminal. A character is input as a sequence of [x(t),y(t)] coordinates, subjected to very simple preprocessing, and then classified by a trainable neural network. The classifier is analogous to "time delay neural networks" previously applied to speech recognition. The network was trained on a set of 12,000 digits and uppercase letters, from approximately 250 different writers, and tested on 2500 such characters from other writers. Classification accuracy exceeded 96% on the test examples.
Character recognition On-line character recognition Neural networks Touch terminal Touch screen
Handwritten characters
1. I N T R O D U C T I O N
Handwritten character recognition has enormous scientific and practical interest. Numerous methods have been proposed in the literature; for reviews see references (1, 2). These include statistical methods that require large amounts of training data, and structural approaches that require considerable detailed programming. Our neural-net approach is intermediate between these extremes.
In this paper we address the on-line recognition of hand-printed characters entered on a touch terminal; i.e. trajectory information is usedJ 3) This makes the problem different from the usual Optical Character Recognition task. (4)
A widely accepted approach is to perform a feature extraction, followed by a classification. The feature extractor is usually predefined and problem-depen- dent. It requires most of the design effort, and det- ermines the performance to a large extent. The classifier, on the other hand, usually incorporates a trainable module, containing little or no problem- specific information. Systems which do not incor- porate any learning can be difficult to design, and can lack generality for problems with high variability.
Neural networks are appealing for pattern rec- ognition problems, since they provide a very flexible tool which allows integrating the feature extractor and the classifier in a single, trainable system. As a consequence, the demands on the preprocessor are greatly reduced. Such methods resulted in high rec- ognition accuracy on zipcode digit recognition/5~ as well as on speech recognition. (6--8)
Neural nets involve only simple arithmetic opera- tions, with a very simple control structure. They can
be implemented on standard sequential machines, or they can be easily pipelined or parallelized on DSP or special purpose chips. (5~
1.1. Problem specifications
The methods proposed in the literature, and the results obtained, depend heavily on several factors: the nature of the input device (sensitive pad, scanner, camera); the constraints on the characters (isolated characters or continuous writing); the number of classes or categories (digits only, upper or lowercase letters only, symbols); the number of users (single- writer or writer independent); and the possible use of contextual information.
This paper describes a recognition system with the following specifications:
- -Characters are entered on a touch terminal, shown in Fig. 1. They are represented as sequences of [x(t), y(t)] coordinates.
- -Characters are drawn in disjoint boxes, so that only trivial segmentation is needed.
- -E i the r digits or uppercase letters are considered. - - T h e system is trained to be writer independent. - - N o use is made of syntax, semantics or other
contextual information. We used a set of 12,000 characters from approxi-
mately 250 writers. The performance of the system was evaluated on a set of 2500 characters from a disjoint set of writers. The data were collected among AT&T staff at Columbus, Ohio.
The touch terminal is convenient for users who prefer a touch interface over a keyboard and/or mouse, or for applications that require a smaller, more portable input device than conventional ter-
105

106 I. GUYON et al.
Display Controller Board
Touchscreen/Driver Board
Processor
Coiled Cable (up to 100 feet)
Case
Display - 640x480
Touchscreen Receiver Board
Adjustable-angle Desktop Stand
Fig. 1. AT&T Touch Terminal. The touch terminal (bottom) is connected to an AT&T 6386 PC with two interface boards (top).
minals and personal computers. Typical examples of characters acquired with this system are shown on Fig. 2.
The touch terminal consists of a transparent touch- sensitive screen overlayed on a standard liquid crystal display (LCD). The LCD has a resolution of 640 x 480. The touch screen is a resistive matrix with a resolution 4096 × 4096. One can write on the touch screen using any sort of stylus, or even perhaps one's finger. We will refer to any such writing instrument as "the pen" for simplicity. When the pen is touching the screen, points are returned every 12 ms; if no points are returned for longer than 60ms it is assumed that the pen was lifted.
1.2. The method
Many different approaches have been proposed in the literature, for Optical Character Recognition or for so-called on-line recognition. The methods used in these two cases are usually very different, the former dealing with 2-dimensional images, while the latter dealing with time-sequential signal. We chose to preserve the sequential nature of the information provided by the touch screen. The overall rec- ognition process is represented in Fig. 3.
This choice was justified by the following pre- liminary simulations. It is possible to remove the time information (projecting the x, y, t trajectory onto the x, y plane) and smooth the lines so that a classifier designed for optical character recognition can be used. We tried this approach, using the neural
network classifier of Yann Le Cun et al.,(5) achieving an error rate of less than 5% on zipcode digits, and 8% on uppercase letters. However, we find that a neural network which incorporates the time infor- mation performs better, while using simpler pre- processing and a smaller number of parameters.
It turns out that the ordering of the sequence of points contains more information than the exact timing of the points. Our preprocessing resamples the character and then encodes local geometric infor- mation such as the position of the pen, the direction of the movement and the curvature of the trajectory.
The classification is then performed by a neural network classifer. We use a multi-layer feed-forward network. The layers in between the input-layer and the output-layer (hidden-layers) provide additional degrees of freedom. The network is trained by a gradient descent method (the back-propagation algorithmm)). To ensure that training leads to good generalization performance (performance on not learned patterns), the network architecture is con- strained, to make it sensitive to local topological features.(5-9)
In Section 2, we explain the preprocessing. In Section 3, we describe the network architecture. In Section 4, we present the results of the simulations.
2. PREPROCESSING
The purpose of the preprocessing is to create an intermediate representation, incorporating (to the extent possible) the a priori knowledge of the

Character recognizer for a touch terminal 107
~'~
_~-..,.
0
P,
(......
0 ~,.. •--4., ° . -
...i
f i,
. . . . " r
k
i
:q :,,• .."
~.,..,,T ~ -
,..j
)
$ . . . e I~
d . , ~ ,i "
K
~F
.~ 'm • "t
L . . . )
I .@
".,."
• • • • -
i
%• • , I
C,
.3
C
L,
U .. "~ . ,
L~°°o ••,m
p r o •
i, '~,
'~. ,P
-7 f f
. . •
,f I' ":•,,."
• • " t
," N
t
D E" F
V t l
~;..- 8, ¢
"0
V
kd
, i ~ ° • ' 1 I
I .,~.s
t~
i~, ::
4 1 j,j
"K
.:..." ?
- .3'
"i:." "*.
"~...'.~ i )
4"..'. .J'-',
?2 I
e c~
"r' R
L-.C ...... %" I
• " ' : ) ".. t .." .~ ¢, ....
..~ • :
"#
Fig. 2. Examples of characters obtained from a touch terminal. The characters were written in a 72 × 72 box.
designer. This includes two complementary processes:
- -Reduc ing variability which does not help dis- crimination between classes, therefore building up some invariance.
- -Enhancing variability which does help dis- crimination between classes.
The first steps of our preprocessing (namely resam- piing, centering and rescaling), greatly reduce the meaningless variability. In particular, time and scale

108 I. GuvoN et al.
touch terminal
o.O °°.'.o • % s
°o
• °.
ooO°°~o ."...~
. . . . o..
Fig. 3. Recognition process. The recognition of a character proceeds in three steps: b--data acquisition, 2--preprocessing, 3--classification.
distortions are removed. The last step of our pre- processing enhances the useful variability by cap- turing information about the local slope and the local curvature.
2.1. Resampling
The raw data contains enormous variations in writ- ing speed. Training a neural network with such data leads to poor performance (60% errors). Resampling to obtain a constant number of regularly spaced points on the trajectory yields much better per- formance. The resampling algorithm uses simple lin- ear interpolation• Examples of characters before and after resampling are shown in Fig. 4. The resampled characters are represented as a sequence of points [x(n), y(n)], regularly spaced in arc length (as opposed to the input sequence, which was regularly spaced in time)• The two states of the pen (up or down) are encoded as the value (+1 or - 1 ) of an additional variable penup(n). Even pen-up segments are resampled (in which case the pen is assumed to go straight from one location to the next). Moreover, the pen is artifically forced to go back to is starting point, by adding a pen-up stroke from the last point back to the first.
The initial number of pen-down points recorded by the touch terminal varies between roughly 5 and 200, with an average around 50 points. The resampled characters have 81 points, including pen- up points• Some additional details regarding resam- piing can be found in Appendix B.
2.2. Centering and rescaling
To make the intermediate representation invariant to translations and scale distortions, the characters are centered and rescaled. Specifically, the origin is set at the center of a character:
Xmax + Xmin Ymax + Ymin X0 = 2 and Y0 = 2
and the character is rescaled according to the factor:
Ymax -- Ymin 6y-- 2
The new coordinates:
x - x 0 Y -Y0 and
6y 6~
are such that y varies between - 1 and + 1. Usually,
a
h , ° " ° ~
$ 2 . - . \
° ° ° ° "
e l l *
O
O O O I
o ° . i °
~ *%°o°°,al °
b
• o ° . , , ° . o " o*..~,
2 ° .g
.,~° . ,o o°°
"•.O°Oo°o°.O,1°
*°Oo
m , o ° ' ° " ~ °
• , . . o
o, ' . . ' ,
oOOOO°
"i =. ,~.. ~ , 1 o o o "~.. •
.~, Oooo,O°°
Fig. 4. Examples of characters before and after resampling. (a) Before resampling. (b) After resampling. The total number of points, after resampling, is 81. Big dots correspond to pen-down, small dots to pen-
u p .
Character recognizer for a touch terminal 109
x stays also within this range, since most characters are taller than they are wide. This rescaling has been chosen rather than (x - Xo)/6x and (y - yo)/6y (where 6x = (Xmax- Xmin)/2) because of the dis- tortions that the latter operation would introduce for very narrow characters (e.g. the digit "1" which is often drawn as a single vertical stroke).
2.3. Local angle information
In order to facilitate the task of the classifier, information about the direction and the curvature of the trajectory at a given instant of time are added to the representation.
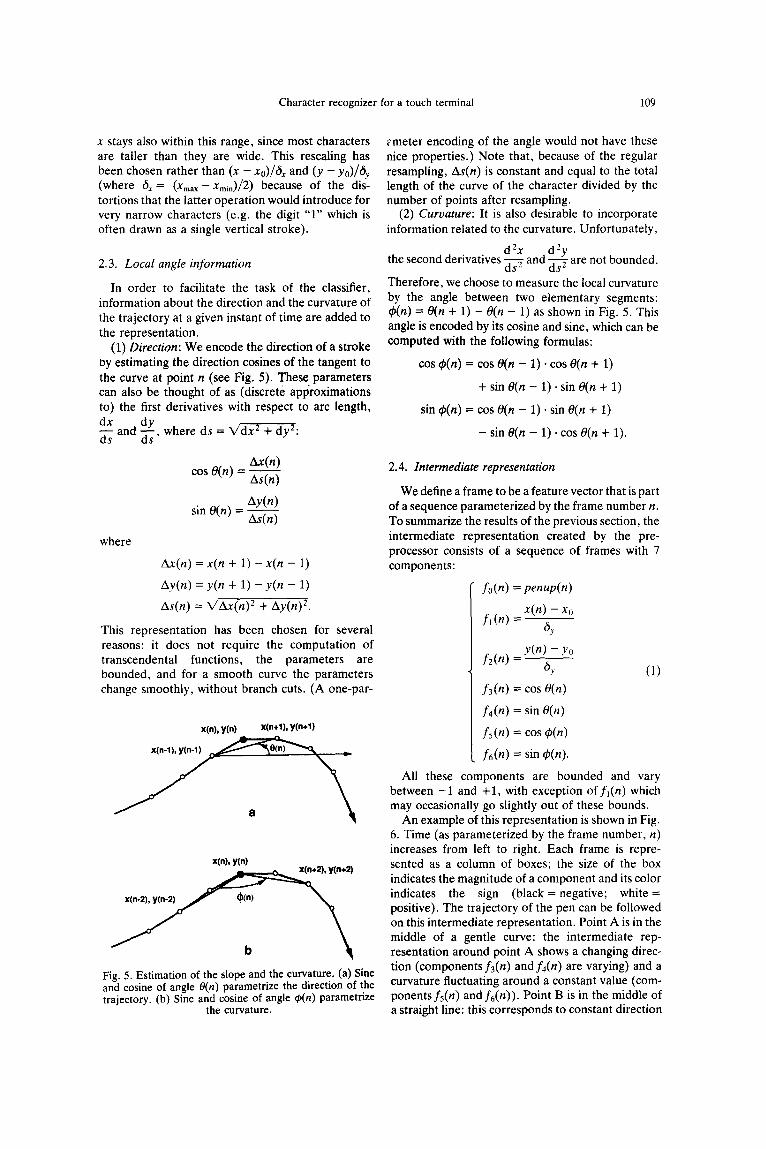
(1) Direction: We encode the direction of a stroke oy estimating the direction cosines of the tangent to the curve at point n (see Fig. 5). These. parameters can also be thought of as (discrete approximations to) the first derivatives with respect to arc length, dx d s and , where ds = X/dx 2 + dy2:
ax(n) cos O(n) = As(n)
Ay(n) sin O(n) = As(n)
where
Ax(n) = x(n + 1) - x(n - 1)
Ay(n) = y(n + 1) - y ( n - 1)
As(n) = V'Ax(n) 2 + Ay(n) 2.
This representation has been chosen for several reasons: it does not require the computation of transcendental functions, the parameters are bounded, and for a smooth curve the parameters change smoothly, without branch cuts. (A one-par-
x(n), y(n) x(n+l), y(n.l)
x(n-1),y(n-1) ~
x(n), y(n) x(n), y(n) , y(n+2)
Fig. 5. Estimation of the slope and the curvature. (a) Sine and cosine of angle O(n) parametrize the direction of the trajectory. (b) Sine and cosine of angle q~(n) parametrize
the curvature.
emeter encoding of the angle would not have these nice properties.) Note that, because of the regular resampling, As(n) is constant and equal to the total length of the curve of the character divided by the number of points after resampling.
(2) Curvature: It is also desirable to incorporate information related to the curvature. Unfortunately,
. . d 2 x d2y the second oenvatwes ~ s ~ ana ~ s 2 are not bounded.
Therefore, we choose to measure the local curvature by the angle between two elementary segments: q~(n) = 0(n + 1) - O(n - 1) as shown in Fig. 5. This angle is encoded by its cosine and sine, which can be computed with the following formulas:
COS q~(n) = cos O(n - 1)- cos O(n + 1)
+ sin O(n - 1). sin O(n + 1)
sin q~(n) = cos O(n - 1). sin O(n + 1)
- sin O(n - 1). cos O(n + 1).
2.4. Intermediate representation
We define a frame to be a feature vector that is part of a sequence parameterized by the frame number n. To summarize the results of the previous section, the intermediate representation created by the pre- processor consists of a sequence of frames with 7 components:
fo(n) = penup(n)
x ( n ) - xo f l (n ) - _ _
by
y(n) - Yo f2(n) -- _ _
6y (1)
f3(n) = cos O(n)
f4(n) = sin O(n)
fs(n) = cos q)(n)
f6(n) ---- sin q~(n).
All these components are bounded and vary between - 1 and +1, with exception o f f l (n ) which may occasionally go slightly out of these bounds.
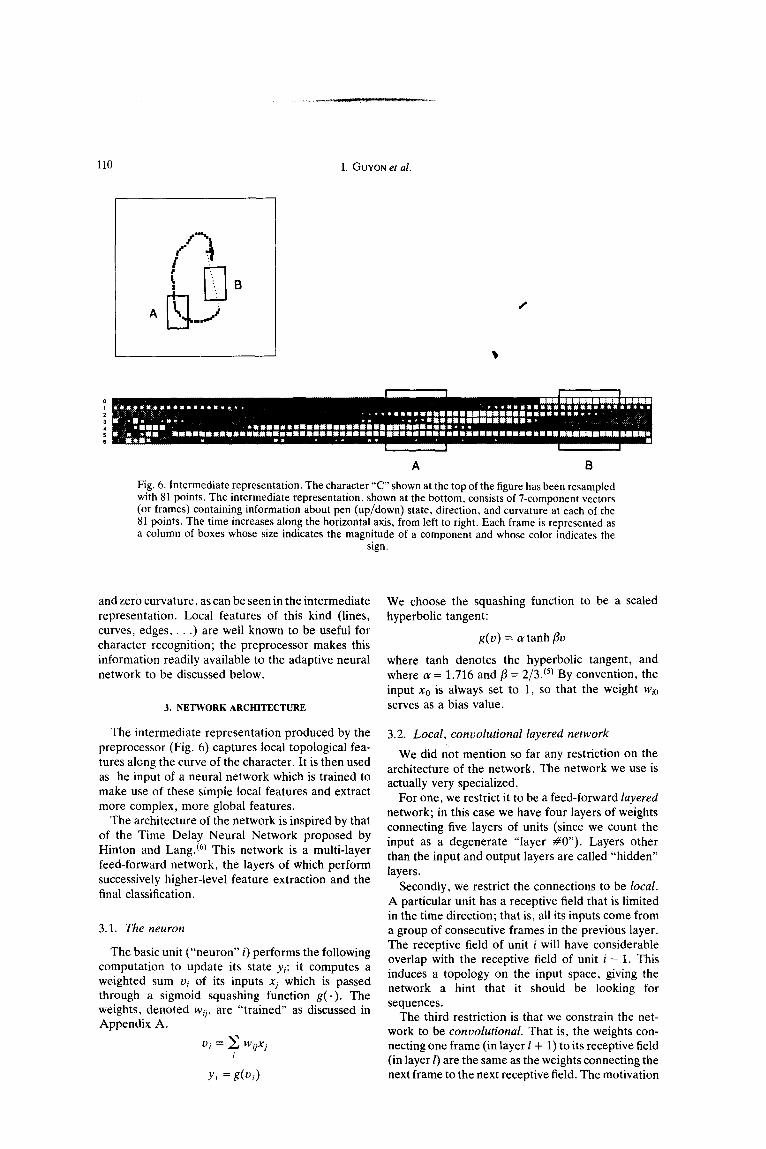
An example of this representation is shown in Fig. 6. Time (as parameterized by the frame number, n) increases from left to right. Each frame is repre- sented as a column of boxes; the size of the box indicates the magnitude of a component and its color indicates the sign (black = negative; white = positive). The trajectory of the pen can be followed on this intermediate representation. Point A is in the middle of a gentle curve: the intermediate rep- resentation around point A shows a changing direc- tion (components f3(n) and f4(n) are varying) and a curvature fluctuating around a constant value (com- ponents fs(n) and f6(n)). Point B is in the middle of a straight line: this corresponds to constant direction
110 I. GUYON et al.
A
B
~f
A B
Fig. 6. Intermediate representation. The character "C" shown at the top of the figure has been resampled with 81 points. The intermediate representation, shown at the bottom, consists of 7-component vectors (or frames) containing information about pen (up/down) state, direction, and curvature at each of the 81 points. The time increases along the horizontal axis, from left to right. Each frame is represented as a column of boxes whose size indicates the magnitude of a component and whose color indicates the
sign.
and zero curvature, as can be seen in the intermediate representation. Local features of this kind (lines, curves, edges . . . . ) are well known to be useful for character recognition; the preprocessor makes this information readily available to the adaptive neural network to be discussed below.
3. NETWORK ARCHITECTURE
The intermediate representation produced by the preprocessor (Fig. 6) captures local topological fea- tures along the curve of the character. It is then used as he input of a neural network which is trained to make use of these simple local features and extract more complex, more global features.
The architecture of the network is inspired by that of the Time Delay Neural Network proposed by Hinton and Lang. (6) This network is a multi-layer feed-forward network, the layers of which perform successively higher-level feature extraction and the final classification.
3.1. The neuron
The basic unit ("neuron" i) performs the following computation to update its state Yi: it computes a weighted sum vi of its inputs xj which is passed through a sigmoid squashing function g ( . ) . The weights, denoted w~i, are "trained" as discussed in Appendix A.
Oi ---- E Wi]Xj ]
Yi = g(vi )
We choose the squashing function to be a scaled hyperbolic tangent:
g(v) = o~tanh flv
where tanh denotes the hyperbolic tangent, and where o~ = 1.716 and fl = 2/3. ¢5) By convention, the input x0 is always set to 1, so that the weight wi0 serves as a bias value.
3.2. Local, convolutional layered network
We did not mention so far any restriction on the architecture of the network. The network we use is actually very special ized.
For one, we restrict it to be a feed-forward layered network; in this case we have four layers of weights connecting five layers of units (since we count the input as a degenerate "layer #0") . Layers other than the input and output layers are called "hidden" layers.
Secondly, we restrict the connections to be local. A particular unit has a receptive field that is limited in the time direction; that is, all its inputs come from a group of consecutive frames in the previous layer. The receptive field of unit i will have considerable overlap with the receptive field of unit i - 1. This induces a topology on the input space, giving the network a hint that it should be looking for sequences.
The third restriction is that we constrain the net- work to be convolutional. That is, the weights con- necting one frame (in layer I + 1) to its receptive field (in layer l) are the same as the weights connecting the next frame to the next receptive field. The motivation
Character recognizer for a touch terminal 111
for this is that we expect that a particular meaningful feature (e.g. a line or a curve) can occur at different times in the sequence. It also means that there are far fewer parameters, which facilitates training and improves generalization, as discussed in Appendix A.
The final specialization of our network is that each layer has a coarser time representation than the preceding layer. This is implemented by subsam- piing: (s,9~ only one every s values in the convolution is kept (and actually computed).
3.3. Time-delay neurons as feature detectors
A network of this type is called a time-delay neural network (TDNN) f6'7) (see also reference (10)) since each neuron's decision at time n is based on frames f ( n - 1), f ( n - 2) . . . . . f ( n - m), where m is the length of the kernel.
The convolutional structure of the network can be thought of in two complementary ways: as a single neuron scanned over its input sequence (re-use in time; sequential processing), or as a group of neurons with weights constrained to be equal (replication in space; parallel processing). In either case we will refer to the neuron(s) controlled by a single kernel as a regiment.
Note that the regiment's complete operation does not meet the strict definition of a convolution, because of the nonlinear squashing function, and because of the subsampling. Certainly it is a con- volution in spirit.
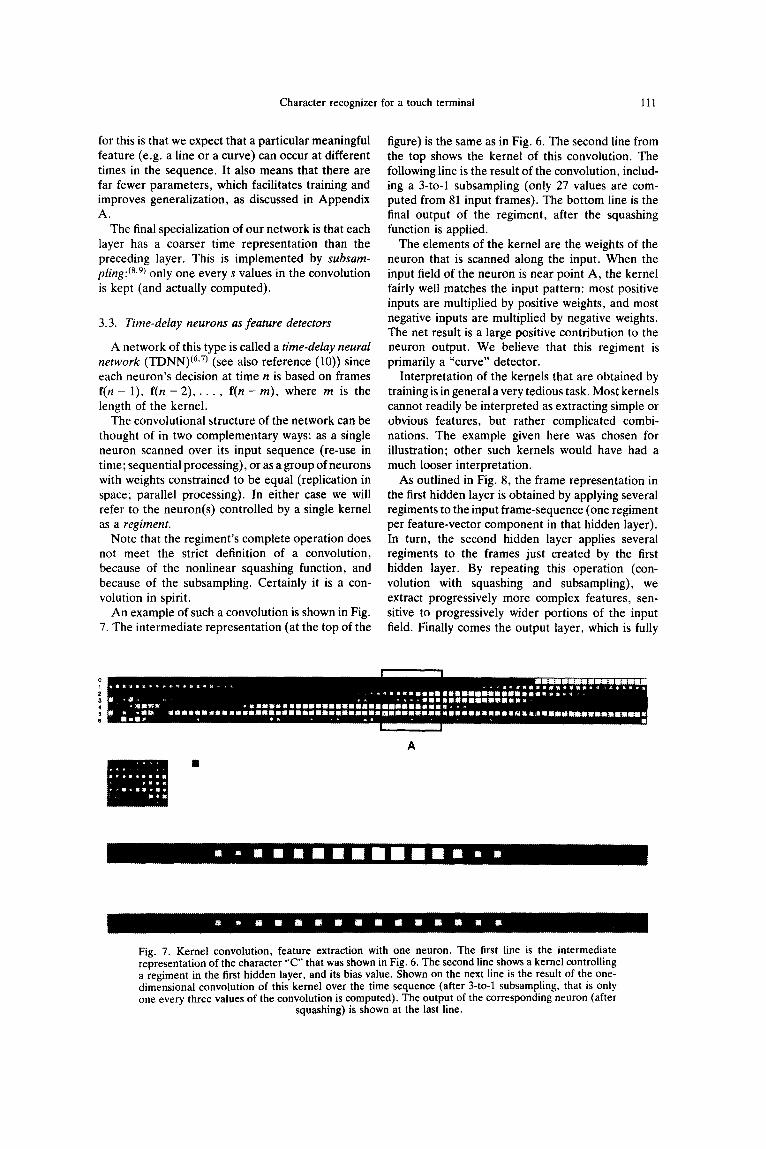
An example of such a convolution is shown in Fig. 7. The intermediate representation (at the top of the
figure) is the same as in Fig. 6. The second line from the top shows the kernel of this convolution. The following line is the result of the convolution, includ- ing a 3-to-1 subsampling (only 27 values are com- puted from 81 input frames). The bottom line is the final output of the regiment, after the squashing function is applied.
The elements of the kernel are the weights of the neuron that is scanned along the input. When the input field of the neuron is near point A, the kernel fairly well matches the input pattern: most positive inputs are multiplied by positive weights, and most negative inputs are multiplied by negative weights. The net result is a large positive contribution to the neuron output. We believe that this regiment is primarily a "curve" detector.
Interpretation of the kernels that are obtained by training is in general a very tedious task. Most kernels cannot readily be interpreted as extracting simple or obvious features, but rather complicated combi- nations. The example given here was chosen for illustration; other such kernels would have had a much looser interpretation.
As outlined in Fig. 8, the frame representation in the first hidden layer is obtained by applying several regiments to the input frame-sequence (one regiment per feature-vector component in that hidden layer). In turn, the second hidden layer applies several regiments to the frames just created by the first hidden layer. By repeating this operation (con- volution with squashing and subsampling), we extract progressively more complex features, sen- sitive to progressively wider portions of the input field. Finally comes the output layer, which is fully
. . . . . : - - ,
A
Fig. 7. Kernel convolution, feature extraction with one neuron. The first line is the intermediate representation of the character "C" that was shown in Fig. 6. The second line shows a kernel controlling a regiment in the first hidden layer, and its bias value. Shown on the next line is the result of the one- dimensional convolution of this kernel over the time sequence (after 3-to-1 subsampling, that is only one every three values of the convolution is computed). The output of the corresponding neuron (after
squashing) is shown at the last line.

112 I. GUYON et al.
data flow
neuron
t i f f same neuron repeated
along the time axis eatures b time
=
Fig. 8. Time delay neural network. (a) Convention used in b~ fo r a neuron, (b) Architecture of the network (not all neurons are represented). The connections between layers obey the following rules: (i) neurons have restricted input fields, limited in the time direction; (ii) all the components of a particular frame are outputs of neurons having the same receptive field in the previous layer; (iii) the same set of neurons is repeated along the time axis, every s time step (s being the subsampling rate): the connections between an input field and a frame (in the next layer) and the connection between the next input field and the next frame share the
same weights (see in the text the notion of regiment).
connected to the last hidden layer. In this respect, the outputs of the network can be considered as the ultimate most global features.
The loss of time resolution in the feature vectors (due to subsampling) is partially compensated by an increase in the number of features. This is called "bi-pyramidal" scaling. The number of units, and therefore the information-carrying capacity, in each layer is reduced less than the subsampling alone might suggest.
3.4. Specifications
The specifications of our latest (and best) network are sumarized in Fig. 9. The network has 35,964 connections, but only 6348 independent weights. In Appendix B, we discuss perturbations and variations of this network, which provides some further expla- nation of the parameter choices. Figure 10 shows how the character "C" of Fig. 6 is processed by the network.
To remove border effects, cyclic boundary con- ditions have been chosen, allowing some replicas of the time-delay neurons to overlap the end and the beginning of a sequence of frames. For simplicity, this is not shown on Figs 8, 9 and 10.
The weights are adjusted with a modified version
data flow
26 OUTPUT LAYER
1 ~ THIRD
3
SECOND HIDDEN LAYER
~ 5 ~
9
7 9 •
~features time
Fig. 9. Parameters of the architecture. The network has 35,964 connections, but only 6348 independent weights. The parameters of the architecture obey a bi-pyramidal scaling from the input layer to the output layer: (i) the layer length decreases in the time direction, because of the 3-to- 1 subsampling; (ii) the layer width increases in the feature direction; (iii) the kernel length decreases in the time direc-
tion.
of the back-propagation algorithm. In Appendix A, we precise our training paradigm regarding initializ- ation, stop criterion, output encoding and classifi- cation scheme.
4. SIMULATION RESULTS
The set of parameters of the architecture shown in Fig. 9 was found reasonable from the study of approximately 30 different networks (see Appendix B). The tests performed on this network are reviewed in this section.
4.1. Classification performance
As mentioned in Section 1, training was performed with a set of 12,000 examples produced by a large variety of writers. Using the cross-validation pro- cedure (see Appendix A), training was stopped after 21 passes through the training set. At that point, the percentage of mistakes was 0.3% on the training set, and 4.0% on the validation set.
The network was then tested on the test set (2500 examples from a disjoint set of writers). The raw performance (no rejections allowed) was 3.4% mis- takes on the whole test set, 2.3% if tested on digits only and 3.8% if tested on uppercase letters only.
Using the validation set (see Appendix A), the rejection threshold 0aiff was adjusted to give at most 1% substitution errors (on that set). This protocol

Character recognizer for a touch terminal 113
Fig. 10. Example of pattern classified by the network. This figure shows the states of all units, when the intermediate representation corresponding to the character "C" of Fig. 6 is presented at the input.
was necessary so that we could certify that all the parameters of the system were determined without reference to the test set. The other threshold, 0,,a~, was fixed at 0. Applying this threshold (Odiff = 0.3) to the test set, the network rejected 7.2% of the patterns as unclassifiable, and made 0.7% sub- stitution errors.
All the 17 remaining misclassified patterns (out of
the 2500 patterns of the test set) are listed on Fig. 11.
The errors listed on Fig. 11 can be split into the following two categories:
(1) The first or the second guess makes sense.
--ambiguous patterns: 13494, 13583, 14772, 14839, 15297, 15323, 15383;

114
13494
,/i T'"
den-el D -Ist A - 2nd
13997
. . . - ' " ' . % •
des-el E - 1st C - 2nd X
14624
, . gg:.
Y den-el 4 - 1 s t 0 - 2 r i d
1 5 2 9 7
4
..°°.,..
f k ...... l } v
d e s - e l W - 1s t U - 2nd W
15901
• ° .
.~za ' . . . . . • . . . .
I. GUYON et al.
1 3 5 8 3 13821
~'...
des-el U - 1s t V - 2nd U
14098
:." ~ . ,~'. D 9
des-el I - 1st L - 2nd
14161
des -e l A - 1st G - 2nd C
14772
des-el G - 1st C - 2nd
15323
: " . 6 . "
• 0 • ° o • •
. .<.... e • • •
.; .,"
des-el 4 - 1st 9 - 2nd
14839
l~•~•••===mm•===
des-el B - 1st Z - 2nd
15383
des-el M - 1st H - 2nd M des-el D - let 0 - 2nd
13898
..~ ...'•
t . ' , / ~.•..•"" "%~
den-el N - ist J - 2nd
14520
1 ."! :1
des-el 7 - let 4 - 2nd
14876
@i • "0'•" j • i •
% . • . .
o e . • •
des-el E - 1st I - 2nd
15873
. 0 • • •
"* m s • • ' • " . • . l . . ,2. -" ,p
. . . . i S
des-el A - I s t H - 2nd A
des-c1 2 - 1st 1 - 2 r i d
Fig. 11. Misclassified patterns. Remaining errors made by the system, when 7% of the test set has been rejected with the two rejection thresholds. (Ode/= 0.3). The pattern identification number is shown in the upper left corner of the squares. The desired class and the classes corresponding to the first and the
second choice of the classifier are shown below the character.
- -mean ing less patterns: 13821 (upper bar missing), 14098 (lowercase);
- -unusua l style: 13898, 13997, 14161, 15873; ---deficiency of the preprocessing: 15901 (jaggy
line)• (2) Nei ther of the two first guesses make sense•
- -unusua l sequence of strokes: 14520, 14624, 14876.
The network can learn a large variety of sequences of strokes corresponding to the same pattern. In Fig. 12, for instance, various examples of the letter " E "

Character recognizer for a touch terminal 115
"s ool °':
Q•t.° °°°~
I I i I l I I * l m l
" ~ . . . .
~ * ° o o o ' , . , w
* r . "
~ i . . : .
, • ° 1"°
~wl@
... '"
'£
~ wlm**°° I l l , I | I
. °
i ,./,-"
~olI i w I m m i l I ~ L
~.~.~ 0, a • ~° ..
I :- ". l" ".,: t
:,,.~/ • , ,~,
~......,,,, a'•
. ' . . . . I.'
~ *'.°
s i l l i i I i
II#l ' . , ° "
I "° | .~• p.o.:'. ii • . .
• I .." . . . . . . "-
... . . . . " i : " "'.,l*" """-,.
r . . . 1" ~,.-'~':.
m,ml~wl
Fig. 12. Various sequences of strokes representing the letter "E". The representation preserves the sequential structure of the input data. Similar-looking pixel maps can have very different sequential
representations.
found in the training set have been listed, The num- ber of typical styles o f "E" is still very small compared to the number of all possible permutations of strokes and directions of strokes (24. 4! = 384). However, the misclassified pattern 14876 is yet a different kind of "E" that is more unusual. As we enlarge the training set, the number of such errors keeps decreas- ing.
4.2. Implementation performance
The neural network was implemented with the preprocessing on an AT&T PC 6386. The recognition process of a character (from the acquisition to the display of the answer) is performed in 2/3 of a second. The preprocessing is only responsible for 2% of this time.
Our implementation of the TDNN is unabashedly sequential; it could be speeded up by parallelization and/or pipelining. Ideally, the answer would be available as soon as the last input is presented. In our system, though, the latency of the TDNN is relatively insignificant, since the all-important pre- processing (not the TDNN) requires the whole sequence to be known, in order to compute the length of the trajectory for the resampling.
5. CONCLUSION
Though the limited number of errors does not allow one to draw general conclusions, the above analysis suggests the following comments. Limi- tations of the classifier caused 13 mistakes (ambigu- ous or meaningless patterns that were not rejected, or deficient generalization over unusual styles). One mistake is due to the preprocessing, which (in its current implementation) does not perform well for extremely unsmooth lines. The 3 remaining mistakes are due to the representation, which makes the sys- tem unable to recognize characters written with an unusual sequence of strokes (even though the static pixel map does not look atypical).
There is no a priori guarantee that the central feature of our system, namely the emphasis on the sequential structure of the data, will be an advantage rather than a disadvantage. After all, for any par- ticular static pixel map, there are many stroke sequences that will produce it. This can (in principle) only increase the intra-class variability and com- plicate the recognition process.
The remarkable thing is that, in practice, the sequential information is highly advantageous, and is indeed required for the high recognition per-
116 I. GuYoN et al.
formance that we obtained. A system based on a pixel map representation, such as our previous digit recognition network, ~5) is not sensitive to stroke order variability. A hybrid system which combines these two approaches is under development.
SUMMARY
We describe a system for on-line recognition of hand-printed digits and uppercase letters. Characters are entered on a touch terminal consisting of a trans- parent touch-sensitive screen overlayed on a liquid- crystal display. Drawing actions are recorded as a sequence of coordinates [x(t),y(t)]. Trajectories, representing single characters, are resampled with a fixed number of regularly spaced points. Coordinates are normalized to obtain invariance with respect to position and scale. Further preprocessing extracts local geometric information such as the direction of the movement, and the curvature of the trajectory. The final output of the preprocessor is a sequence of 81 vectors with 7 elements each. This sequence is then processed by a novel Time Delay Neural Net- work (TDNN). The TDNN is a multi-layer feed- forward network, the layers of which perform suc- cessively higher level feature extraction and the final classification. TDNNs, which were previously applied to speech recognition, are well suited to sequential signal processing. This allows us to use a representation which preserves the sequential nature of the data, in contrast with other approaches based on pixel-map representation.
The same network was trained to recognize either digits or capital letters with a modified version of the back-propagation algorithm. The training set contained 12,000 examples produced by a large num- ber of different writers. The error rate was 3.4% on 2,500 test examples from a disjoint set of writers. When allowed to reject 7.2%, the system made 0.7% substitution errors. The recognizer was implemented on an AT&T 6386 PC with an auxiliary AT&T touch terminal. The throughput of the system, including acquisition, preprocessing and display, was 1.5 character per second.
Acknowledgements--We wish to thank all the Neural Net- work research group at Bell Labs, Holmdel, for supportive and interesting discussions: R. Howard, L. Jackel, S. Solla, H. P. Graf, B. Boser. We are indebted to J. Alvich and D. Henderson for technical help, to S. Palmer who provided
us with a touch terminal, and to the members of the Touch Entry Terminal software development group in AT&T Columbus that provided us with the interface software. The simulations were performed with the Neural Network simulator SN of L6on-Yves Bottou and Yann Le Cun.
REFERENCES
1. C. Y. Suen, M. Berthod and S. Mori, Automatic rec- ognition of handwritten characters--the state of the art. Proc. IEEE 68, 469-487 (1980).
2. J. Mantas, Methodologies in pattern recognition and image analysis--a brief survey. Pattern Recognition 20, 1-6 (1987).
3. C. C. Tappert, C. Y. Suen and T. Wakahara, On-line handwriting recognition--a survey, 9th Int. Conf. on Pattern Recognition, pp. 1123--1130. IAPR, IEEE Computer Society Press (1988).
4. G. Nagy, Optical character recognition--theory and practice, Handbook of Statistics, Vol. 2, pp. 621-649 P. R. Krishnaiah and L. N. Kanal, eds. North-Holland, Amsterdam (1982).
5. Y. Le Cun, L. D. Jackel, B. Boser, J. S. Denker, H. P. Graf, I. Guyon, D. Henderson, R. E. Howard and W. Hubbard, Handwritten digit recognition: Appli- cation of neural network chips and automatic learning. 1EEE Comm. Mag., pp. 41-46 (1989).
6. K. J. Lang and G. E. Hinton, A time delay neural network architecture for speech recognition. Technical Report CMU-cs-88-152, Carnegie-Mellon University, Pittsburgh PA (1988).
7. A. Waibel, T. Hanazawa, G. Hinton, K. Shikano and K. Lang, Phoneme recognition using time-delay neural networks. IEEE Trans. Acoustics Speech Signal Process. 37, 328-339 (1989).
8. L. Y. Bottou, Master's thesis, EHEI, Universite de Paris 5, 1988.
9. Y. Le Cun, Generalization and network design strat- egies, Connectionism in Perspective, R. Pfeifer, Z. Schreter, F. Fogelman and L. Steels, eds, Elsevier, Zurich, Switzerland (1989).
10. D. W. Tank and J. J. Hopfield, Neural computation by concentrating information in time. PNAS 84, 1896- 1900 (1987).
11. D. E. Rumelhart, G. E. Hinton and R. J. Williams, Learning internal representations by error propagation, Parallel Distributed Processing: Explo- rations in the Microstructure of Cognition, Vol. I, pp. 318-362. Bradford Books, Cambridge, MA (1986).
12. S. Becker and Y. Le Cun, Improving the convergence of back-propagation learning with second-order methods. Technical Report CRG-TR-88-5, University of Toronto Connectionist Research Group (1988).
13. J. Denker, D. Schwartz, B. Wittner, S. A. Solla, R. Howard, L. Jackel and J. Hopfield, Large automatic learning, rule extraction and generalization. Complex Syst. 1, 877-922 (1987).
14. E. B. Baum and D. Haussler, What size net gives valid generalization? Neural Computation 1,151-160 (1989).
About the Author--ISABELLE GUYON joined AT&T Bell Laboratories in January 1989. Her current research is on applications of neural networks to speech recognition and handwritten character recog- nition. She graduated from l'Ecole Sup6rieure de Physique et Chimie Industrielles de Paris in 1985 and received a Ph.D. degree from the University Pierre et Marie Curie, Paris, in 1988. Her thesis research investigated architectures and algorithms for artificial neural networks. She made a benchmark study of different neural networks and other classification methods, on the problem of handwritten digit recognition.
About the Author--PAUL ALBRECHT is a Distinguished Member of Technical Staff in the Business Operations Laboratory of AT&T Bell Labs in Columbus, Ohio. He received a Master's degree in

Character recognizer for a touch terminal 117
Computer Science in 1980 from the University of California, Berkeley. He joined Bell Labs in 1980 and has worked on a variety of UNIX-based application projects in the areas of communications, database design, performance analysis and graphical user interfaces. Currently, he is responsible for the user interface for the AT&T Touch Entry Terminal.
About the Author--YANN LE CUN has been a Member of Technical Staff at AT&T Bell Laboratories since October 1988. His current interests include neural networks and connectionist models, learning theory, pattern recognition and VLSI implementations of massively parallel systems. He obtained a "Dipi6me d'Ing6nieur" in E.E. from the Ecole Sup6rieure d'Ing6nieurs en Electrotechnique et Elec- tronique in Paris in 1983, and a Ph.D. in Computer Science from the Universit6 Pierre et Marie Curie, Paris, in 1987. His thesis was about connectionist learning models, and introduced an early version of the back-propagation learning algorithm. From August 1987 to October 1988 he was a research associate in the Department of Computer Science of the University of Toronto, Canada. He is an associate editor of the IEEE Transactions on Neural Networks.
About the Author--JoHN S. DENKER received a B.S. degree from Caltech and a Ph.D. from Cornell University. During his junior year he founded a successful software and electronics company which did pioneering work in many fields including security systems, Hollywood special effects, hand-held elec- tronic games and video games. His thesis research showed the existence of long-lived spinwave resonances in a gas of hydrogen atoms at milliKelvin temperatures. Other research concerned the fundamental quantum-mechanical limitations of measuring devices. He has been a Member of Technical Staff at AT&T Bell Laboratories since 1985. His current interests include neural networks, the information- theoretic foundations of learning from examples, VLSI implementations of neural networks, and real- world applications of neural networks, such as character recognition.
About the Author--WAYNE E. HUBBARD is a Member of Technical Staff at AT&T Bell Laboratories, where he has been involved in such diverse projects as optical recording, vapor phase epitaxial growth systems, and currently, neural networks. He began his career in electronics and computers in 1969 at RCA, then served six years with the U.S. Navy Tactical Data Systems. From 1976 until joining Bell Labs in 1982, he worked for Digital Equipment Corp. as a district support engineer.
APPENDIX A. TRAINING PROCEDURE
A.1. Learning scheme
The weights are adjusted during a supervised training session which performs gradient descent in weight space with a mean-squared-error (MSE) cost function:
1 ~ ~ E = - ~] (y~ - dtk) 2
p k = l / = l
where p is the number of training patterns, c the number of output units (one per class, i.e. 36), y~ the state of the output unit l, when pattern number k is presented at the input of the network, and dr* the corresponding target value. The target values are binary: dr* = 1 if l = class(k) and - 1 otherwise.
The training algorithm is a stochastic gradient procedure (on-line gradient descent). It is a modified version of the Back Propagation algorithm, ~m which makes use of the diagonal approximation of the Hessian matrix to optimally set the learning rate/TM
Before training, the weights are initialized with random values, uniformly distributed between -2.4/F, and 2.4/Fi, where F~ is the total number of inputs to unit i.
The training session is stopped according to a cross- validation criterion. For this purpose a validation set of 500 examples, distinct from both the training set and the test set, was defined. The training is stopped when the mean- squared-error on the examples of the validation set stop decreasing significantly or starts increasing. This cor- responds usually to less than 30 learning cycles through the entire training set. The network which gives the smallest mean-squared-error on the validation set is kept and re- tested with an independent test set of 2500 examples from different writers. The result of this last test is what is called the performance of the network.
The training algorithm, when it modifies the weights, must preserve the convolutional constraint on the con- nection pattern. This is implemented by "weight sharing" (see references 5, 9).
The constraints we have placed on the network greatly reduce the number of free parameters. This is very desir- able, since it has been shown ~3' 14) that among a class of networks that can learn a given task from a given set of examples, the ones which have the fewest free parameters are more likely to generalize properly. It is important to keep in mind the distinction between the number of free parameters, and the total number of connections in the network.
A.2. Splitting of the output field
There are several situations in which a digit cannot be distinguished from the corresponding capital letter, for instance zero versus "O", one versus 'T ' , five versus "S", and six versus "G". In typical applications, however, it is known a priori whether the input should be interpreted as a digit or letter, so the network is not required to make this distinction.
For this reason, the output layer was split into two fields, one devoted to digits, and one devoted to letters. It should be emphasized that the rest of the network was not divided, so that (in all layers except the last) training on digits would modify the recognition of letters and vice versa. One expects that training the early layers on all the data would be an advantage, but this has not been clearly demonstrated.
During training, if the desired output is a digit, no error is back-propagated from the output units of the letter field, and vice versa. For example, if the desired output is digit zero, there is no penalty if the letter "O" is activated.
Even during recognition when there is no known "desired output" we assume that it is known whether the digit output

118 I. GUYON et al.
field or the letter output field should be evaluated; this decision is not made by the recognizer.
A.3. Interpretation o f the outputs
The simplest classification scheme is to see which output unit has the highest output value and consider that the decision of the network. The performance on the test set according to this classification scheme is called raw performance in the text.
Besides the computation of the raw performance, the system is tested with a classification scheme involving two thresholds, providing for automatic rejection of ambiguous and meaningless patterns.
A pattern is considered ambiguous if:
max~ - max 2 < Odiff
where max~ is the largest output value, max2 the second largest output value and Odiff is the difference threshold value.
A pattern is considered meaningless if:
max i < Om,x.
APPENDIX B. EXPLORATIONS, VARIATIONS AND PERTURBATIONS
Within the basic architecture there are quite a few adjust- able parameters: the number of layers, the number of features per layer, the subsampling, the length of the ker- nels etc. Exhaustively exploring only 3 values of each par- ameter would require training and testing some 200,000 variant networks. Therefore experience, intuition, and theoretical hints must play a large role in determining these parameters.
B. 1. Resampling
When two sequences contain similar frames, but the corresponding frames occur at different places, the effective dissimilarity of the sequences can be quite large. The neural network is found to be quite sensitive to this sort of distor- tion, which we call "translation mismatch", especially when the translation is large compared to the size of the neurons' local receptive fields. The resampling algorithm was desig- ned so as to reduce the translation mismatches between sampled trajectories obtained from similar patterns.
Sampling the trajectory with points equally spaced in time is easy for the data acquisition. However, irregularities in the speed of the pen result in considerable local trans- lation mismatches. The arc length between two features is highly constrained, because this determines the appearance of the written character. In contrast, there are very loose constraints on the timing of the features. For this reason, resampling to get points regularly spaced in arc length is the central feature of our preprocessing. Note that simple linear interpolation proved to be sufficient, and that line smoothing did not result in significant classification per- formance improvement.
In the same spirit, the insertion of "pen-up" segments is fundamental in avoiding large translation mismatches for very similar characters whose only difference is that the pen was lifted or not along a particular segment (e.g. when a line-segment is retraced), or to distinguish characters that differ mainly in the direction or length of the pen-up stroke (such as "I" versus "'F"). We insert a subsequence of frames which corresponds to a straight segment between the two locations of the pen before and after pen up, and that would differ from a corresponding pen-down segment mainly by the first component fo(n) carrying the pen-up information. In other cases, when the pen is never in the down position on a given segment, it is still useful to insert a subsequence
of frames, which length is proportional to the distance between the two positions of the pen before and after pen up, to emphasize discontinuities in position of the pen.
With the introduction of resampling, the number of classification errors was divided by a factor of 3. This was the most critical improvement in the design of our recognizer. Different numbers of points in the resampled character were tried, ranging from 40 to 90 (including pen- up points). Although a resolution of 40 points is enough to perform the recognition of digits only, significant improve- ment in the recognition of uppercase letters was obtained by increasing the resolution. The number of mistakes was reduced by a factor 1.3 when the resolution was increased from 40 to 60 points, and by another factor of 1.5 when the resolution was increased to 90 points.
B.2. Cyclic boundary conditions
Both the preprocessing and the network architecture implement cyclic boundary conditions. For the prepro- cessing, the continuity of the trajectory at the boundaries is ensured by returning the pen to its starting point (with an artificial pen-up stroke). For the network, kernels are allowed to overlap the beginning and the end of the sequence. This feature makes it easier for the network to extract information about the relative position of the first and the last point of the trajectory (which is, e.g., crucial for distinguishing "0" from "6"). The cyclic boundary con- ditions resulted in a reduction of the number of mistakes by a factor of 1.3.
B.3. Intermediate representation
As indicated in Section 2, the intermediate represen- tation produced by the preprocesor is a sequence of 7- component frames. Historically, the different components of the frames were introduced progressively. In the first simulations, two-component frames, with only cos O(n) and sin O(n), were used. With such a representation, a network trained on digits only, made 5% of errors on the test set (compared to 1% with the best network). The error could be reduced by a factor of 2 by adding penup(n),
x ( n ) - xo and y(n) - Y o , and by another factor of 2 by 6y 6v
adding cos q~(n) and sin q~(n).
F ,. Subsampling
The choice of subsampling factor is related to the choice of receptive field size and the depth (number of layers) of the network. Also, the length of the input sequence is determined by the product (over layers) of all the sub- sampling factors in the network.
In our experiments, increasing the subsampling from s = 2 to s = 3, while enlarging the input field from 60 frames to 90 frames, decreased the number of connections (by a factor 1.2) and decreased number of mistakes (by a factor 1.5).
The final choice was to use four layers of weights with subsampling factor s = 3 in each, yielding 81 input frames.
B.5. Bi-pyramidal scaling o f the parameters
The simulations presented in Table 1 were run to check that the bi-pyramidal scaling is appropriate. Four networks were trained. They all had the same number of layers (input layer, output layer, and two hidden layers). The length of the kernels was set to 5 for all layers. The size of the input field was 90 frames with 7 components. The subsampling

Character recognizer for a touch terminal 119
Table 1. Simulation results on the bi-pyramidal scaling of the parameters
Number Number Approximate Number Total features features % mistakes independent number 1st layer 2nd layer on test set weights connections
24 8 8 4748 38,516 16 16 3.8 7668 36,036 8 16 3.9 6740 20,996 8 24 3.7 9948 27,156
Table 2. Simulation results on the kernel length
Ker. length Ker. length % mistakes Num. indep. Num. 1st layer 2nd layer test set weights connections
5 5 3.9 6740 20,996 5 3 4.0 6484 18,436
was set to s = 3 for all layers. Only the number of features (frame components) in the first and the second hidden layer was allowed to vary.
Reducing the number of features in the first hidden layer from 16 to 8 does not result in significant performance degradation. On the other hand, reducing the number of features in the second layer from 16 to 8 more than doubles the number of mistakes. However, going to 24 features in the second hidden layer does not improve significantly the recognition performance and only increases the size of the network.
The number of features per layer was finally chosen to increase roughly geometrically from 7 in the input layer to 36 outputs, in powers of 3/2 (see Fig. 9).
B.6. Kernel length
The size of the input field of a neuron is equal to the dimension of a frame times the length of the kernel. The kernel length has been chosen so that the number of inputs per neuron is roughly constant: as the frame dimension increases, from the input layer to the output layer, the kernel length decreases. The size of the kernel decreases more slowly than the total length of the layer, so that the kernel overlaps an ever-larger fraction of the layer.
The following simulations (Table 2) were performed to check the effect of kernel length contraction. Two networks with architectures similar to the above were trained. The number of features in the 1st and 2nd layer were set to 8 and 16 respectively. The kernel length was the only variable in this experiment.
No significant performance degradation was caused by reducing the kernel length in the second layer.
The number of connections per neuron was finally kept between 60 and 80 inputs per neuron, the kernel length decreasing approximately geometrically, with a factor 2/3, from 8 frames in the input layer to 1 frame in the output layer (see Fig. 9).
B.7. Size of the network
The simulations presented below were run to check whether any of the layers of the network were expendable. The structure of the network was preserved up to layer number 1, and the rest of it replaced by the output layer, fully connected with layer I. All possible values of l were tried: l = 0 (input layer directly connected to the output layer), l = l, l = 2 and I = 3 (the initial complete network). The raw performance on the test set are given in Table 3.
The network truncation results in significant performance degradation. The biggest network ( l = 3) was therefore chosen and implemented in our system.
Table 3. Simulation results on the network depth
Approximate Number Total % mistakes independent number on test set weights connections
0 15.7 20,448 20,448 1 7.7 10,396 27,036 2 5.1 6996 32,724 3 3.4 6348 35,964