
Design and Simulation of a domestic hybrid power supply project
63
1 DESIGN AND SIMULATION OF DOMESTIC HYBRID POWER SUPPLY PROJECT By KARANJA JAMES KIRONJI BSEE/43352/101/DF LABEJA CALEPS BSEE/43534/101/DU AUGUST 2014
-
Upload
independent -
Category
Documents
-
view
4 -
download
0
Transcript of Design and Simulation of a domestic hybrid power supply project

1
DESIGN AND SIMULATION OF DOMESTIC HYBRID
POWER SUPPLY PROJECT
By
KARANJA JAMES KIRONJI
BSEE/43352/101/DF
LABEJA CALEPS
BSEE/43534/101/DU
AUGUST 2014
i
DESIGN AND SIMULATION OF DOMESTIC HYBRID
POWER SUPPLY PROJECT
Report submitted to Kampala International University in partial fulfillment
of the requirement for the award of the degree
Of
Bachelor of Science in Electrical Engineering
By
KARANJA JAMES KIRONJI
BSEE/43352/101/DF
LABEJA CALEPS
BSEE/43534/101/DU
DEPARTMENT OF ELECTRICAL AND TELECOMMUICATION ENGINEERING
SCHOOL OF ENGINEERING AND APPLIED SCIENCES
AUGUST 2014
©2014,Labeja caleps and karanja james kironji,All rights reserved.

ii
DECLARATION
We, KARANJA JAMES KIRONJI and LABEJA CALEPS, hereby declare that this project
report is own and original work and that it has not been presented to any other
University for similar or any other degree award.
Signature ___________________
Date__________________
Labeja Caleps
BSEE/43534/101/DU
Signature ___________________
Date__________________
Karanja James Kironji
BSEE/43352/101/DF

iii
CERTIFICATE OF APPROVAL
This is to certify that the work in this project report entitled “DESIGN AND
SIMULATION OF A DOMESTIC HYBRID POWER SUPPLY PROJECT” Carried
out by Karanja James Kironji and Labeja Caleps under my supervision is in partial
fulfillment of the requirement for the degree of Bachelor of Science in Electrical
Engineering at KAMPALA INTERNATIONAL UNIVERSITY.
………………………………………………….
Mr. Olanya Isaac
Project supervisor

iv
DEDICATION
We dedicate this work to almighty God in appreciation for this far he has brought us
and believe a brighter future lies ahead through His guidance. It is also dedicated to
our families for the support and dedication they have bestowed upon during our
entire study.

v
ACKNOWLEDGEMENT
We highly appreciate the great help we received from the entire KIU society, special
thanks must go to all lecturers of the department of Electrical Engineerig led by Mr
Njubo Nelson for the knowledge and skills they helped us gain, Mr. Nurein Foum
who initiated our first field attachment setting a platform for us to gather our first-
hand experience. Mr Obedi Kiyaga the most social lecturer we have met in our
college life. We are very grateful to our supervisor Isaac Olanya for his tireless work
and maximum cooperation in supervising our research project. Thank you so much
and may God bless you.
We greatly thank Geomax Consulting Engineers, Kenya and in particular Eng. Loise
Mbaria for her facilitation during my (James) field attachment from where I acquired
relevant knowledge and information about this project.
Special thanks to our families who have played a great role in our college life our
uncles in particular Dr. Yolam Okech, Boniface Kamau, Daniel Muiruri who have
provided us with financial support through-out our college. Our Mums Janet and
Helen, My father Benny, Brothers Joshua, Ken, sisters Brenda and Ruthie Lelee who
provided us with spiritual and financial support and kept us focused.
Lastly, we sincerely thank our Grandmothers Eunice, Margret and Beatrice our
Grandfathers James and Kenneth for their personal efforts and a million dollar
advice. Our friends Helen Wanjiku, Papito Francis, Benson Waweru, Shadrack Maina,
Mary W, Beatrice Mugo, Esther Mbabazi, who were shoulders to lean on and who
stood by us when we needed friends and people to talk to. Other than that we have
really learnt from you that the value of money and happiness increases when it is
shared by many. Thank you and May God bless you all.

vi
ABSTRACT
This project is set out to design and simulate a domestic hybrid power supply
project. Thus the project is meant to carry out research on the integration of solar,
wind and a battery bank by interlinking them to act as a single source of power thus
providing a solution to frequent power shortages which is a common phenomenon in
the East African region. The research employed not only a design but a simulation
that provides real times results from arbitrary assumptions that act as proof that this
is achievable. Besides this, data was collected using face to face interviews; internet
based research; our project has been critically analyzed and all values used not
literal but real time values which can be used at the domestic level and thus a
voltage output of 120/240VAC a voltage that is used in the East African region.
The findings concluded that this energy sources integration is attainable and can
help curb the many power shortages. The results are evident and support the
project idea. The study conclusively recommends the implantation of this project at
domestic, commercial as well industrial level. The feed in tariffs can also be applied
trough connection to the smart Grid and thus provide power to the community as
well as the national grid.

vii
TABLE OF CONTENTS
DECLARATION................................................................................................................................................ii
CERTIFICATE OF APPROVAL.......................................................................................................................... iii
DEDICATION ................................................................................................................................................. iv
ACKNOWLEDGEMENT ...................................................................................................................................v
ABSTRACT.....................................................................................................................................................vi
TABLE OF CONTENTS ............................................................................................................................... vii
LIST OF FIGURES ........................................................................................................................................... ix
LIST OF TABLES ..................................................................................................................................... xi
NOMENCLATURE AND ABBREVIATIONS ..................................................................................................... xii
CHAPTER 1...................................................................................................................................................1
1.1 INTRODUCTION ..........................................................................................................................1
1.2 Problem Statement .......................................................................................................................2
1.3 SIGNIFICANCE OF THE PROJECT.............................................................................................3
1.4 MAIN OBJECTIVE ........................................................................................................................3
1.5 RESEARCH QUESTIONS..................................................................................................................4
1.6 Scope of the project ...................................................................................................................4
CHAPTER 2.....................................................................................................................................................6
LITERATURE REVIEW .....................................................................................................................................6
2.1 Introduction...................................................................................................................................6
2.2 Photovoltaic (PV) Power System...................................................................................................8
2.21 Photovoltaic cell. .......................................................................................................................9
2.22 Photovoltaic module: ................................................................................................................9
2.23 Photovoltaic array: ..................................................................................................................10
2.3 Wind Turbine Power System.......................................................................................................12
2.3.1 Wind into watts..........................................................................................................................13
2.4 Power Electronic Circuit ...........................................................................................................16
2.3.1 AC-DC Rectifier ..................................................................................................................17
2.3.2 Inverter...............................................................................................................................17
2.3.3 DC-DC Converter Analysis. ..............................................................................................18

viii
2.5 Hybrid Wind and Photovoltaic Power System.......................................................................19
2.6 Conclusion ..................................................................................................................................20
CHAPTER 3...................................................................................................................................................21
METHODOLOGY, DESIGN AND IMPLEMENTATION.........................................................................21
3.1 Introduction ...............................................................................................................................21
3.2 Modeling of Photovoltaic Power System................................................................................21
3.3 Modeling of Wind Turbine Power System .............................................................................24
3.4 Model of Battery Circuit............................................................................................................29
3.5 Modeling of AC-DC Rectifier ....................................................................................................31
3.6 Inverter model...........................................................................................................................32
3.7 spwm technique ........................................................................................................................32
3.8 Modeling of Hybrid System with battery storage.................................................................34
CHAPTER 4.................................................................................................................................................36
SIMULATION RESULTS AND DISCUSSIONS .....................................................................................36
4.1 Introduction ...............................................................................................................................36
4.2 Photovoltaic Model Simulation ................................................................................................36
4.3 Wind model simulation.............................................................................................................40
CHAPTER 5.................................................................................................................................................44
CONCLUSIONS AND RECOMMENDATIONS.......................................................................................44
5.1 Conclusions ................................................................................................................................44
5.2 Recommendations.....................................................................................................................44
REFERENCES ................................................................................................................................................45
Bibliography.................................................................................................... Error! Bookmark not defined.
Appendix I....................................................................................................................................................48
Appendix II...................................................................................................................................................49

ix
LIST OF FIGURES
Figure 2.1: Photovoltaic cell, module and Array…………………………………………………………21
Figure 2.2: Schematic block of a PV cell…………………………………………………………………..22
Figure 2.3: Simplified circuit diagram of a PV cell……………………………………………………….23
Figure 2.4: typical I-V characteristics of solar panel…………………………………………………….24
Figure 2.5: typical P-V characteristics of a solar panel…………………………………………………24
Figure 2.6: A plot of wind output power (Kw) against wind speed (m/s)……………………….27
Figure 2.7: PMSM Operation mode………………………………………………………………………………28
Figure 2.8: Three phase full wave bridge rectifier………………………………………………………….30
Figure 2.9: Igbt-diode inverter…………………………………………………………………………………….31
Figure 2.10: Basic buck converter……………………………………………………………………………..…31
Figure 2.11: proposed design for the Hybrid power project........................................32
Figure 3.1: characteristic PV cell………………………………………………………………………………….35
Figure 3.2: Simulink model of a photovoltaic solar cell…………………………………………………..36
Figure 3.3: PV cell standalone connected to the Load through battery storage…………………37
Figure 3.4: Simulink wind turbine model and its respective parameter...............................38
Figure 3.5: Turbine output power Vs Turbine speed.........................................................39
Figure 3.6: Wind turbine block model.............................................................................40
Figure 3.7: Cp (λ, β) block model...................................................................................40
Figure 3.8: Wind turbine, 2 mass drive Train and PMSM block model................................41
Figure 3.9: Equivalent circuit of battery and I-V characteristic graph..............................42
Figure 3.10: Simulink model of the battery circuit............................................................43
Figure 3.11: Battery discharge characteristics...........................................................44
Figure 3.12: Rectifier block parameters..........................................................................45
Figure 3.13: Inverter Model...........................................................................................46
Figure 3.14: PWM Generator Parameters........................................................................47
Figure 3.15: Buck converter model in Simulink................................................................47
Figure 3.15: Standalone Wind power system connected to load........................................48
Figure 3.17: Stand-Alone Hybrid Project.................................................................49
Figure 4.1 (a) at 400W/m2............................................................................................51
Figure 4.1 (b) at 600W/m2.............................................................................................51

x
Figure 4.1 (c) at 1000W/m2......................................................................................52
Figure 4.2: P-V characteristics……………………………………………………………………………………55
Figure 4.3: P-I characteristics…………………………………………………………………………………….55
Figure 4.4: voltage and Current out-puts of a wind generator respectively………………..……56
Figure 4.5: Buck Converter Voltage and Current Output…………………………………………………57
Figure 4.6 (a): PV output at the Load …………………………………………………………………………58
Figure 4.6 (b): Wind Turbine output at the Load…………………………………………………………..59
Figure 4.7: output voltage waveform of the hybrid system…………….………………………………5

xi
LIST OF TABLES
Table 2.1: wind speed Vs output power……………………………………………………………….28
Table 3.1: parameters of lead acid battery……………………………………………………………44

xii
NOMENCLATURE AND ABBREVIATIONS
AC - Alternating Current
DC - Direct Current
IGBT - Insulated Gate Bipolar Transistor
G - Solar Irradiance
MW - Megawatts
PMSG - Permanent Magnet Synchronous Generator
PMSM - Permanent Magnet Synchronous Machine
PV - Photovoltaic
PWM - Pulse Width Modulation
RPM - Revolution Per Minute
SCR - Silicon-Controlled Rectifier
STC - Standard Test Conditions
T - Temperature
VSC - Voltage Source Converter
FYP - Final Year Project
Cp - Power Coefficient
Im - Photovoltaic Current Output
Impp - Maximum Power Current
Io - Saturation Current
Ipv - Photovoltaic Current
Isc - Short-Circuit Current
KI - Short-Circuit Current/Temperature Coefficient
Kv - Open-Circuit Voltage/Temperature Coefficient
PG - Power at Generation Side
Pwb - Wind Turbine Output Power
Tm - Wind Turbine Output Torque
Vmpp - Maximum Power Voltage
Voc - Open-Circuit Voltage
Λ - Speed Ratio
Β - Blade Pitch Angle
ρ - Air Density

xiii
BB - Battery bank
LPG - Low Power Generator
Tm - Mechanical torque applied to rotor
Tem - Electromagnetic torque applied by generator to rotor

1
CHAPTER 1
1.1 INTRODUCTION
Definition of terms
Irradiance- This the flux of radiant energy per unit area (normal to the direction of
flow of radiant energy)
Autonomy- This the period of time that a battery can supply power to loads
without getting further recharged.
Solar Array- A set of solar voltaic modules connected and mounted on a supporting
structure.
Simulation- This is the imitation of the operation of a real process or system over
time through a computer.
Turbine- This is a rotary mechanical device that extracts energy from moving fluids.
Fossil- These are fuels that are formed by natural processes such as anaerobic
decomposition of buried dead organisms.
Stand-alone - A system able to operate independently of other hardware or
software.
Obsolete- To become of no- longer use.
Bus-bar- A conducting metal that carries heavy currents to supply to several
circuits.
Start-up wind speed - the wind speed that will turn an unloaded rotor.
Cut-in wind speed – the wind speed at which the rotor can be loaded.
Rated wind speed – the wind speed at which the machine is designed to run.
(This is at optimum tip-speed ratio)
Furling wind speed – the wind speed at which the machine will be turned out of
the wind to prevent damage
Maximum design wind speed – the wind speed above which damage could occur
to the machine

2
1.2 Problem Statement
The continuous instability of fossil fuel prices, the amount of oil and natural gas
reserves is getting lesser and the serious environmental degradation due to over-
exploitation of existing energy reserves are among the reasons to develop an
alternative energy generation system that based on renewable energy sources, such
as a hybrid system that combined solar and wind energy.
Although the solar and wind energy are known as dependable and widely available
renewable energy sources in east Africa, but the intermittent energy sources will
cause the power generator to produce a fluctuating output. For example, we could
not generate energy using a standalone PV system at night or during a cloudy day
because there is no solar radiation. Similarly, the varying wind speed will affect the
amount of energy generated by a standalone wind turbine system. . In other words,
both standalone systems don’t present desirable efficiency in generating energy.
This instability output voltage may cause serious problem to certain electronic
devices such as induction motor or variable speed drives that need a constant supply
for continuous processing, as well as lights which have ballasts. The consequences
vary with industry, but loss of production often relates to profitability or sometimes
personnel safety. Hence, in this project an energy storage system battery was
introduced into the hybrid wind and photovoltaic power generation system. The
added energy storage will store energy during low load demand period and helps to
stabilize the system generated output voltage.
To have only one energy/power source is expensive. The main objective of this
research is to integrate the two or more energy sources into one system and
enhance the utilization of the existing power grid such that, even if one source is off
or faulty, the other source(s) keeps the grid operational/running.
In most third world countries which has a major power source that monopolizes the
economy, power outage is unavoidable, This may either be due to faults or system
break down. Exploitation of renewable sources like solar and wind in a large scale
and incorporating them to the main grid solves the above problem.

3
1.3 SIGNIFICANCE OF THE PROJECT
Through this project we have been met with constrains that we have beaten,
limitations that almost made us change the project design and the whole project as
whole. We feel this is a great achievement running a simulation and gives an output
as close as the real output of an implemented system is a milestone.
This project sets a platform ready for implementation and future research to the
project refinement and provision of a smarter grid domestic system through the use
of micro-controllers and power factor correction banks. This country has long
embattled power failure and the implementation of this project design at any given
besides it cost constrains can really be of great importance.
This region has a lot of potential in terms of renewable source energy potential that
has been left untapped. We feel further research and investment in the energy
sector would present a golden opportunity to not only the researchers themselves
but to the citizens of this country through a more stable power supply, fuelling the
development of their businesses.
1.4 MAIN OBJECTIVE
The main objective of the project is;
To carry out a research based project on the integration of solar, wind and a battery
bank by interlinking them to act as a single source of power. This project on a large
scale aspect can be considered a national system in feed-in tariff rates for these
forms of energy thus providing a source of efficient, stable and sustainable power.
Through this project we intend to have comprehensive results that encourage
provision of incentives in the implementation of similar projects. The design and
simulation of results gives an output that displays a standing ovation project.

4
1.5 RESEARCH QUESTIONS
Which is the most economical system for short distance as well as distribution, AC or
DC?
Is the stand-alone energy production more effective than a hybrid system in which
case each source having its own storage (battery bank)?
Are Uganda’s wind-speeds ideal for power production and what speed is best to
achieve a power output of 1kW using a 3m rotor diameter?
What is the average mean-time in Uganda sunshine to achieve an irradiance of
1000W/ m2?
Is a wind power output and direct load connection achievable without creating a
system disturbance especially the battery buffering and different potential
differences due to the power input from the battery?
1.6 Scope of the project
This project revolves around uninterrupted power system, in which case we as a
team worked on a project whose power output will be a reliable. Given that we have
a battery system that can be inverted to give a power output most suitable to many
domestic appliances: television sets, LED lights, small motors among others.
Given the research and simulations this project is solely dependent on our
innovativeness and applications from the units covered during our course at this
institution. Thus MATLAB and Simulink are the major drives that catapulted the
successful delivery of this project. All assumptions: wind speeds, irradiance the ideal
PV cell are through comprehensive research and discussions with companies who
have done this projects or similar projects in the recent past. We find it important to
point out that this (hybrid) project is of its kind here in Uganda and Kenya because
none of the companies have implemented it so far.
We faced a number of problems while modeling this system and the other
components in our system in the Simulink window of the MATLAB. It was learning
process for us. So, we felt the need to discuss those issues and sum up our critical
observations:

5
Computation of bus power, load power and the battery output power was vital. This
led to us changing the whole design of our system as we realized we could not
connect the windmill to the same AC bus bar as the inverted power from our Battery
bank.
Consequently we had to change the system parameters this led to an additional
20hrs of labour to navigate through this problem.
Given we live far apart time allocation to meet our deadlines was crucial and a great
strain to our planned schedule of works.

6
CHAPTER 2
LITERATURE REVIEW
2.1 Introduction
Since the beginning of power system development, the electricity is supplied to the
users in a model of bulk-power transmission system. As the technologies in power
system improve, the traditional power system operating models appear to be
becoming obsolete. As a result some disadvantages in terms of security and
flexibility are observed. Moreover, fluctuation of fossil fuels price and generating
electricity with fossil fuel will cause pollution to the environment. Therefore to
overcome the problems and to improve the power supply quality, the distributed
generation (DG) based on green energy such in this case, solar and wind. These two
sources are keenly observed and taken into consideration as an alternative way to
generate and supply power energy to users.
The world of today is dynamic and the need to have a clean safe energy has become
an important aspect in energy development. Our project idea and growth is based
on realizing a sustainable energy source for realistic economic growth. Africa has a
high potential in hybrid power projects given its wide pool of renewable energy
sources. With our project idea we look forward to coming up with a realistic project
that solely relies on renewable sources of energy earlier mentioned. However, the
main objective being the use of this sources of energy over conventional ones.
A Hybrid Energy System incorporates various energy infrastructures covering most
inhabited areas. It comprises three stages:
Production: The production of electricity in the power farm.
Integration: It forms the most important part of this project as it brings to life the
combination of various energy systems to a single platform.
Converter and inverter points: this system has both AC and DC links which need
to be transformed from direct to alternating current and/ or vice versa.
A typical hybrid system combines two or more energy sources, from renewable
energy technologies, such as photovoltaic panels, wind or small hydro turbines; and

7
from conventional technologies, usually diesel or LPG gensets (though biomass fed
gensets are also a feasible option, if locally available). In addition, it includes power
electronics and electricity storage batteries.
The hybrid system can be designed following different configurations to effectively
use the locally available renewable energy sources and to serve ALL power
appliances (requiring DC or AC electricity). The technological configurations can be
classified according to the voltage they are coupled with; this is, using DC, AC and
mixed (DC and AC) bus lines.
Principle technological configurations for hybrid systems;
• Electricity generation coupled at a DC bus line
All electricity generating components are connected to a DC bus line from which the
battery is charged. AC generating components need an AC/DC converter. The
battery, controlled and protected from over charge and discharge by a charge
controller, then supplies power to the DC loads in response to the demand. AC loads
can be optionally supplied by an inverter.
• Electricity generation coupled at AC bus line
All electricity generating components are connected to an AC bus line. AC generating
components may be directly connected to the AC bus line or may need a AC/AC
converter to enable stable coupling of the components. In both options, a
bidirectional master inverter controls the energy supply for the AC loads and the
battery charging. DC loads can be optionally supplied by the battery.
• Electricity generation coupled at AC/DC bus lines
DC and AC electricity generating components are connected at both sides of a
master inverter, which controls the energy supply of the AC loads. DC loads can be
optionally supplied by the battery. On the AC bus line, AC generating components
may be directly connected to the AC bus line or may need an AC/AC converter to
enable stable coupling of the components.
Solar and wind are intermittent energy sources as they vary over time and do not
usually meet load demands at all times. Among these two types of renewable
energy, wind is the more affected source compare to photovoltaic due to its
variability. Similarly, the photovoltaic system also depends on the weather conditions
and only can operate during day-time. These two unpredictable energy sources

8
stand-alone system will produce fluctuated output energy and thus cannot ensure
the minimum level of power continuity required by the load. A hybrid system is
defined as the combination of two or more types of electricity generation system. In
this project, PV system is combining with wind turbine system to form a renewable
energy hybrid system. Since the output of these renewable energy is greatly
depends on climatic conditions such as solar irradiance, wind speed, temperature
among others, the instability of the system output is compensated by adding a
suitable energy storage system to the hybrid system such as a battery bank (BB).
This is to ensure a perfect balance exist between power demand and generated
power.
The advantages of using renewable energy sources based hybrid systems are it
increases the reliability of the hybrid system because it is based on more than one
electricity generation source. Besides that, it is a pollution free and environmental
friendly system as it does not use any fossil fuel. The solar energy also becomes one
of the most promising alternatives for conventional energy sources and has been
increasingly used to generate electric power from sunshine. Moreover, the hybrid
system is suitable to use in remote areas with no access to utility grid.However,
there is also disadvantage of using hybrid systems such as in most cases the system
is over- sized because it contains different types of power generation system.
This chapter presents information about the background studied on PV power
system, wind power system, hybrid power and also the AC-DC rectifier. It gives an
overall idea on developing and modeling the hybrid system and the energy storage
system.
2.2 Photovoltaic (PV) Power System
PV power system converts sunlight into electricity. The basic unit of a photovoltaic
power system is the PV cell, where cells may be grouped to form panels or modules.
The panels then can be grouped to form large photovoltaic array that connected in
series or parallel, as shown in Figure 2.1. Panels connected in parallel increase the
current and connected in series provide a greater output voltage.

9
Figure 2.1: Photovoltaic cell, module and Array.
2.21 Photovoltaic cell.
The solar cells are made from semiconductor materials that able to generate electric
current when being exposed to sunlight radiation. When a photon (particle of light)
strikes a photovoltaic cell, some of the energy it brings is captured by the
semiconductor material. That energy knocks electron loose, allowing them to flow
freely. Electric fields created between the positive layer (P-type) and the negative
layer (N-type) of the cells then force the loose electrons to go in certain direction
through a connecting wire as direct current (DC) electricity.
2.22 Photovoltaic module:
The voltage generated by a single solar cell is very low, around 0.5V. So, a number
of solar cells are connected in both series and parallel connections to achieve the
desired output. In case of partial shading, diodes may be needed to avoid reverse
current in the array. Good ventilation behind the solar panels is provided to avoid
the possibility of less efficiency at high temperatures.
10
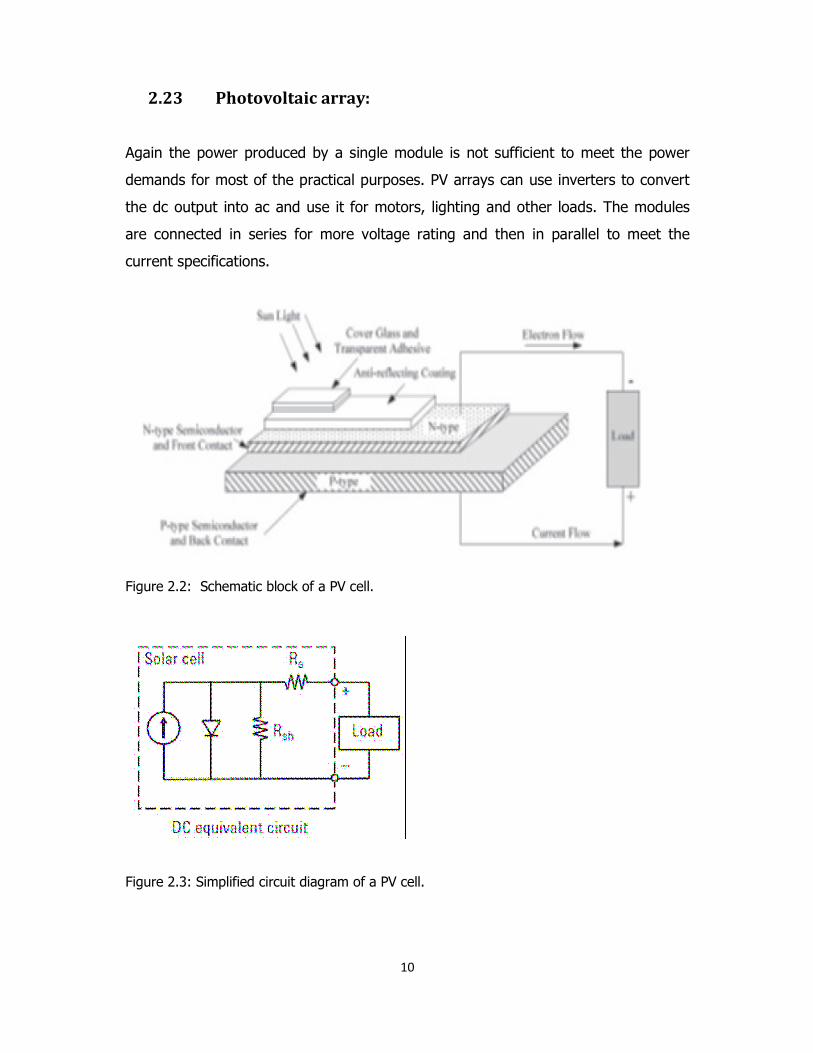
2.23 Photovoltaic array:
Again the power produced by a single module is not sufficient to meet the power
demands for most of the practical purposes. PV arrays can use inverters to convert
the dc output into ac and use it for motors, lighting and other loads. The modules
are connected in series for more voltage rating and then in parallel to meet the
current specifications.
Figure 2.2: Schematic block of a PV cell.
Figure 2.3: Simplified circuit diagram of a PV cell.

11
The photovoltaic cell output voltage is basically a function of the photocurrent which
is mainly determined by load current depending on the solar irradiation level during
the operation
Vc = (A*k*Tc/e)ln ((Iph+I0-Ic)/I0) - Rs*Ic
The symbols used are;
Vc: cell output voltage, V.
Tc: reference cell operating temperature (20 °C).
Rs: series resistance of cell (0.001 Ω).
Iph: photocurrent, function of irradiation level and junction temperature (5 A).
I0: reverse saturation current of the diode (2*10-4 A).
Ic: cell output current, A.
k: Boltzmann constant (1.38 × 10⁻²³ J/K).
e: electron
Figure 2.4: typical I-V characteristics of solar panel.

12
Figure 2.5: typical P-V characteristics of a solar panel
2.3 Wind Turbine Power System
Wind turbines that generate electricity operate in much the same way as a
hydroelectric generating station. Instead of falling water, wind turbines use the
kinetic energy of blowing air to spin the blades of the turbine which are connected to
a generator. Wind power is expected to be a leading power source in Denmark
provide more than fifty per cent of its current 16 per cent of it national grid by 2020.
In the East Africa region, Kenya has invested heavily to see the growth of current
wind power of 500MW to 2050MW by 2030 making it the country’s biggest
investment of $800 million. This project is commonly known as the Lake Turkana
wind power project (LTWP).
Wind power is the fastest growing energy source in the world and it will be playing
an increasing role in supplying our electricity. The amount of electricity a wind
turbine can produce depends on the strength and consistency of the wind at any
given time. Generally, the wind needs to be blowing at 14 km/ hr. for a wind turbine
to start producing electricity. With increasing wind speed, the power output
increases to a maximum at 50 km/hr.
Most types of power plants can run 24 hours a day. However, wind turbines can only
generate electricity when the wind is strong enough. Typically the wind is stronger

13
at night than during the day and also stronger in winter than summer. Because of
this, wind turbines cannot always be relied on to help meet peak electricity demand.
The requirements for this system were identified before thus this section will majorly
deal with the interconnection of these forms of energy. At any given time this
system should work towards the use of renewable sources of energy thus will do
away as much as possible with other energy sources as well as maximization to the
later of extra units produced being sold out to potential customers within the farms
locality. It is therefore important at this juncture to point out our system is based on
energy saving as well as the conservation of the environment.
There are various important wind speeds to consider:
Start-up wind speed - the wind speed that will turn an unloaded rotor.
Cut-in wind speed – the wind speed at which the rotor can be loaded.
Rated wind speed – the wind speed at which the machine is designed to run.
(This is at optimum tip-speed ratio).
Furling wind speed – the wind speed at which the machine will be turned out
of the wind to prevent damage.
Maximum design wind speed – the wind speed above which damage could
occur to the machine.
2.3.1 Wind into watts
Although the power equation above gives us the power in the wind, the actual
power that we can extract from the wind is significantly less than this figure
suggests. The actual power will depend on several factors, such as the type of
machine and rotor used the sophistication of blade design, friction losses, and the
losses in the pump or other equipment connected to the wind machine. There are
also physical limits to the amount of power that can be extracted realistically as a
result of losses experienced in power production using windmills a 59.3% of the
power from the wind is likely to be converted into electric power. So, modifying the
formula for ‘Power in the wind’ we can say that the power which is produced by the
wind machine can be given by:
PM = ½.Cp.ρ.A.V3

14
Where, PM is power (in watts) available from the machine
cP is the coefficient of performance of the wind machine
Where, PA is the average power output in watts over the year
V is the mean wind-speed in m/s.
The kampala wind graph.
Wind speed increases with height above the ground, because of the earth’s
boundary layer. This effect is modeled using the power law relation
Vz= V10 (z/10) α
Where
VZ =Wind speed at some height z (in meters),
V10= Wind speed at 10 meters (meteorological department weather forecasting
and reporting of wind speeds height),
Α (0.2) and is the power law exponent or index and is most common for wind
turbine analysis.
Our system design will use a four meter diameter windmill to give a 0.7kW thus
chose to have a 1kW windmill due to inverter and converter losses besides when we
have low blowing winds. The graph below depicts the power produced at various
wind-speeds in Kampala ranging from 0m/s to 14m/s measured at 18m the height of
the tower modelled using the wind power law relation.
The x-axis represents wind-speeds in m/s
While the y axis represents the wind turbine power output in watts.
X 0 2 4 6 8 10 12 14
Y 0 0.05 .19 0.3 0.42 0.56 0.74 1.1
Table 2.1: wind speed Vs output power

15
Figure 2.6: A plot of wind output power (Kw) against wind speed (m/s)
The wind turbine torque on the shaft can be calculated by using the following
equation,
Pwb is the extracted power from the wind, _ is the air density (kg/m3), R is the blade
radius (m), Vw is the wind speed (m/s), λ is the blade pitch angle (deg), β is the
rotational speed (rad/s) and Tm is the wind turbine output torque (Nm).
The excitation of a PMSG is provided by permanent magnets instead of field
windings. These permanent magnet machines are characterized as having large air
gaps, which helps to reduce the flux linkage even in machines with multi-magnetic
poles.
16
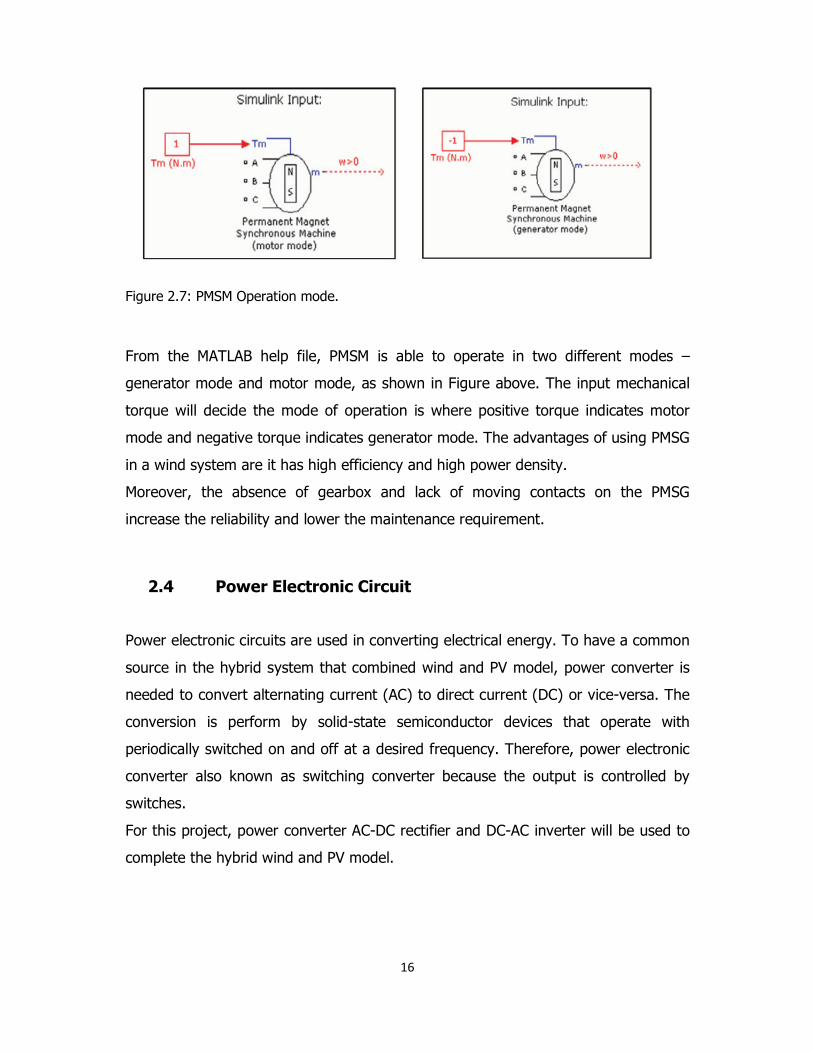
Figure 2.7: PMSM Operation mode.
From the MATLAB help file, PMSM is able to operate in two different modes –
generator mode and motor mode, as shown in Figure above. The input mechanical
torque will decide the mode of operation is where positive torque indicates motor
mode and negative torque indicates generator mode. The advantages of using PMSG
in a wind system are it has high efficiency and high power density.
Moreover, the absence of gearbox and lack of moving contacts on the PMSG
increase the reliability and lower the maintenance requirement.
2.4 Power Electronic Circuit
Power electronic circuits are used in converting electrical energy. To have a common
source in the hybrid system that combined wind and PV model, power converter is
needed to convert alternating current (AC) to direct current (DC) or vice-versa. The
conversion is perform by solid-state semiconductor devices that operate with
periodically switched on and off at a desired frequency. Therefore, power electronic
converter also known as switching converter because the output is controlled by
switches.
For this project, power converter AC-DC rectifier and DC-AC inverter will be used to
complete the hybrid wind and PV model.

17
2.3.1 AC-DC Rectifier
A rectifier is a power electronic device that converts alternating current (AC) source
to direct current (DC) source using power diodes or by controlling the firing angles
of controllable switches. In this project, a three phase full wave AC- DC rectifier as
shown in Figure below is connected to the output side of the wind model. It will
convert the AC voltages generated by the wind model into DC voltages. The Rectifier
model has been realized using a 3- phase Universal Bridge Simulink block. The
scheme of modeling is- The Universal Bridge block implements a universal three-
phase power converter that consists of up to six power diodes connected in a bridge
configuration.
Figure 2.8: Three phase full wave bridge rectifier.
2.3.2 Inverter
Presently, our main purpose of using the inverters here is to convert the dc power
from both wind and solar system into single-phase ac power. This power is used to
meet the load demands under emergency conditions when there is either a shortage
of generation or that of the wind. Since the voltage level of this ac power is not
constant due to different irradiances and temperature, we have a connected a buck
converter at it’s output to improve the efficiency of the output DC power. The

18
inverter that we have used here is an IGBT-DIODE based inverter connected in the
bridge configuration.
Figure 2.9: Igbt-diode inverter
PWM control of inverter gives variable voltage and variable frequency output.
Average power flow can be bidirectional if the DC source can accept power input.
2.3.3 DC-DC Converter Analysis.
Buck Converter
A buck converter or voltage regulator is also called a step down regulator since the
output voltage is lower than the input voltage. In a simple example of a buck
converter, a diode is connected in parallel with the input voltage source, a capacitor,
and the load, which represents output voltage.
A switch is connected between the input voltage source and the diode and an
inductor is connected between the diode and the capacitor, shown in Figure 2.10
below.

19
Figure 2.10: Basic buck converter.
2.5 Hybrid Wind and Photovoltaic Power System
A standalone PV or wind power system is not able to provide sufficient power to the
load connected due to intermittent energy source. To accommodate every
requirement of energy and providing stabilize output power to the consumers, a
hybrid system with energy storage is purpose. The advantages of using renewable
energy hybrid system are it causes no pollution and these energy sources are widely
available throughout east Africa.
The wind turbine power system connects to AC-DC rectifier to convert the AC output
into DC output. On the other hand, the PV power system is connected to DC-
DC converter to improve the efficiency of the power generated. Both generated DC
output power will be combined at the DC bus at then supply to the loads. Extra
energy will be stored into the energy storage system. The proposed hybrid system is
illustrated in Figure 2.11 below,
20
Figure 2.11: proposed design for the Hybrid power project.
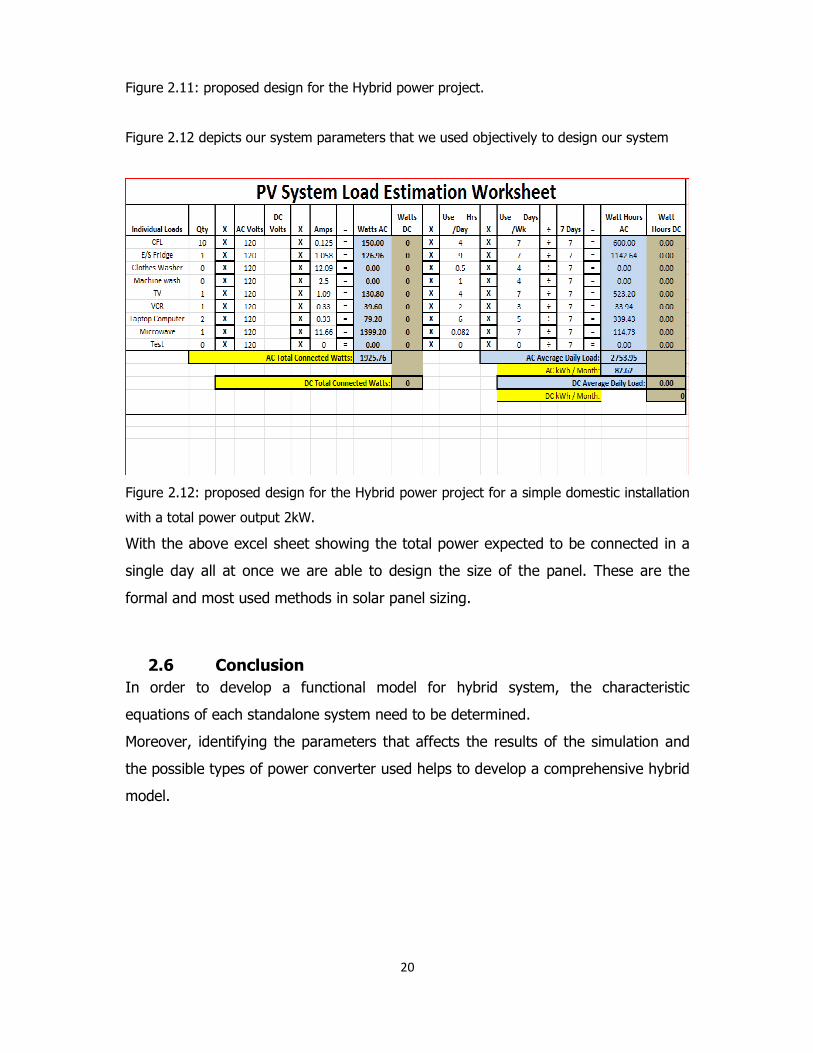
Figure 2.12 depicts our system parameters that we used objectively to design our system
Figure 2.12: proposed design for the Hybrid power project for a simple domestic installation
with a total power output 2kW.
With the above excel sheet showing the total power expected to be connected in a
single day all at once we are able to design the size of the panel. These are the
formal and most used methods in solar panel sizing.
2.6 Conclusion
In order to develop a functional model for hybrid system, the characteristic
equations of each standalone system need to be determined.
Moreover, identifying the parameters that affects the results of the simulation and
the possible types of power converter used helps to develop a comprehensive hybrid
model.

21
CHAPTER 3
METHODOLOGY, DESIGN AND IMPLEMENTATION
3.1 Introduction
This chapter explained the block modeling of photovoltaic power system, wind
turbine power system, hybrid power system, battery system, AC-DC rectifier, DC-AC
inverter, and buck converter. In addition, the MATLAB Simulink circuit block models
for each system were shown in respective section.
3.2 Modeling of Photovoltaic Power System
In this project, an equivalent circuit of a photovoltaic cell is used to produce a DC as
would have been produced by a module or photovoltaic array.
The solar cell is the basic unit of a photovoltaic module and it is the element in
charge of transforming the sun rays or photons directly into electric power. The solar
cell used is the PN junction, whose electrical characteristics differ very little from a
diode, represented by the equation of Shockley (diode equation).
…………………………. (1)
So, the process of modelling this solar cell can be developed based on being the net
current of the cell, the difference of the photocurrent Il or Iph, (the current
generated by the incident light, directly proportional to the sun irradiation) and Id
(the normal diode current),
Characteristics of PV cell
An ideal PV cell is modelled by a current source in parallel with a diode. However no
solar cell is ideal and thereby shunt and series resistances are added to the model as
shown in the PV cell diagram below. RS is the intrinsic series resistance whose value
is very small. RP is the equivalent shunt resistance which has a very high value

22
Figure 3.1: characteristic PV cell
Applying Kirchoff‟s law to the node where Iph, diode, Rp and Rs meet, we get
………………………………. (2)
We get the following equation for the photovoltaic current:
………………………. (3)
Where,
Iph = Insulation current or photocurrent
I = Cell current
I0 = Reverse saturation current
V = Cell voltage
Rs = Series resistance
Rp = Parallel resistance
VT = Thermal voltage
K = Boltzman constant
T = Temperature in Kelvin
q = Charge of an electron

23
………………………. (4)
Therefore, the ideal solar cell can, theoretically, be modelled as a current source in
anti parallel with a diode. Improving the PV cell model includes the effects of series
and shunt resistance.
Simulink block diagram of the PV cell.
Figure 3.2: Simulink model of a photovoltaic solar cell
Modelling of a standalone Photovoltaic system.
Figure 3.3: PV cell standalone connected to the Load through battery storage.

24
3.3 Modeling of Wind Turbine Power System
The wind turbine power system consists of a wind turbine model and a
Permanent Magnet Synchronous Machine (PMSM) block that was already available in
the Simulink library.
The model of wind turbine was developed based on its steady-state characteristics,
as per the wind turbine block in Simulink. Include inside the model was a subsystem
that used to determine the power coefficient Cp (λ, β) value when tip speed ratio
(λ) and blade pitch angle (β) change. Figure 3.4 shows the wind turbine block model
while the Cp (λ, β) block model was shown in Figure 3.5.
The varying wind speed was the input into the wind turbine. Mechanical torque
produced by the wind turbine will then directed to PMSM that converts mechanical
energy from wind turbine into electrical energy.
Tm
The Simulink input of the block is the mechanical torque at the machine's shaft.
When the input is a positive Simulink signal, the asynchronous machine behaves as
a motor. When the input is a negative signal, the synchronous machine behaves as a
generator. The input signal is in p.u. as we have used the p.u. mask here i.e.,
Asynchronous Machine p.u. Units.
M
The Simulink output of the block is a vector containing 21 signals. We have de-
multiplexed these signals by using the Bus Selector block provided in the Simulink
library. Depending on the type of mask we use, the units are in SI, or in p.u. In our
project we have used it in p.u mask.

25
A three phase V-I Measurement block has been placed at the output terminals of
the generator to compute the line voltages and line currents coming out from the
generator, which can also be viewed in the scope. Another measurement block
present in the Simpower System of the Simulink Library by the name of Discrete 3-
phase Power has also been used. This measurement block takes the generator line
voltages and currents as its inputs and enables us in computing the instantaneous
power and mean power produced by the generator at its output.
Figure 3.4: Simulink wind turbine model and its respective parameter.

26
The first input is the generator speed in per unit of the base generator speed i.e.,
we feedback the rotor p.u speed to the wind turbine model. The second input is the
blade pitch angle (beta) in degrees. Power is not equal to the reference power
(which controls the generation). The third input is the wind speed m/s.
The performance coefficient Cp of the turbine is the mechanical output power of the
turbine divided by wind power and a function of wind speed, rotational speed, and
pitch angle (beta).Cp reaches its maximum value at zero beta. The output is the
torque applied to the generator shaft in per unit of the generator rating.
Figure 3.5: Turbine output power Vs Turbine speed

27
Figure 3.6: Wind turbine block model
Figure 3.7: Cp (λ, β) block model

28
Figure 3.8: Wind turbine, 2 mass drive Train and PMSM block model.
The wind system model was simulated by setting the tip speed ratio to 0 and blade
angle as zero [Cp (0, 1)]. This will ensure the system achieves maximum power
coefficient of 0.48, which enable the system to generate maximum power output.
The mechanical torque produce by the wind turbine will be directed into the PMSM,
which has a 8500 RPM reference speed with the purpose of adjusting the generator
speed to enable maximum output generated. The overall wind system model was
illustrated in Figure 3.8 above.

29
3.4 Model of Battery Circuit
PV panels only provide power during the daylight hours and many applications
require energy when the sun is set, hence a battery is often needed to store energy.
A real battery has an internal resistance and is often modeled with an equivalent
circuit consisting of an ideal battery of voltage VB in series with some internal
resistance Ri. During the charge cycle, the applied voltage needs to be greater than
the battery voltage and during discharge cycle; the output voltage is less than VB.
Figure 3.9: Equivalent circuit of battery and I-V characteristic graph.
Battery is an electrochemical device that converts chemical energy into electrical
energy. The most commonly used battery is the lead acid battery because of its low
cost and simple charging process. The cell in a lead acid battery consists of lead
electrodes in an electrolyte of aqueous sulphuric acid. The anode is made up of lead
and cathode is lead oxide. Inside the cell, the oxidation and reduction reaction takes
place for discharging and charging. The regulated output from the boost converter is
fed to the battery circuit for storing energy. Here two lead acid batteries are used in
series for storing the charge. Each battery has the following characteristics shown in
table 3.1. The complete model for testing the battery characteristics is shown in
figure below. The discharge characteristic of the battery is shown in figure 3.10
below.
Parameters of lead acid battery

30
Parameters Values
Nominal Voltage 12V
Rated capacity 200Ah
Initial state of charge(SOC) 50%
Nominal discharge current 86.9565
Table 3.1: parameters of lead acid battery
Model of the battery circuit
Figure 3.10: Simulink model of the battery circuit.
Figure 3.11: Battery discharge characteristics.
31
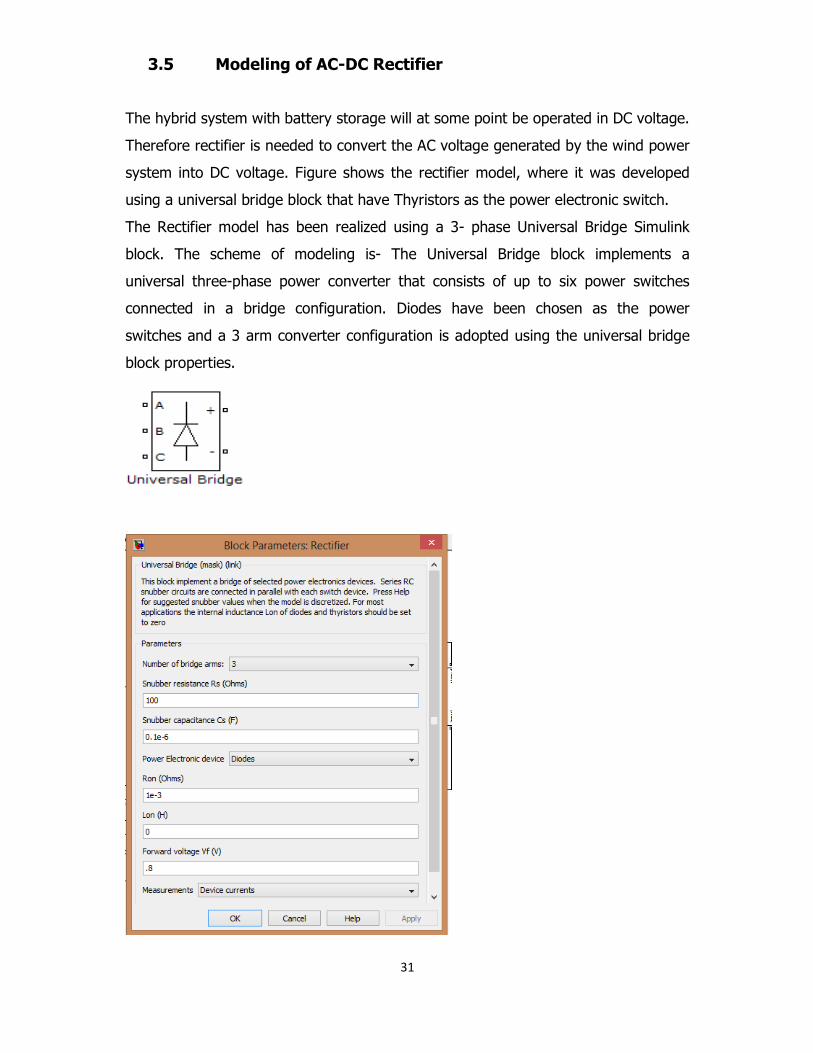
3.5 Modeling of AC-DC Rectifier
The hybrid system with battery storage will at some point be operated in DC voltage.
Therefore rectifier is needed to convert the AC voltage generated by the wind power
system into DC voltage. Figure shows the rectifier model, where it was developed
using a universal bridge block that have Thyristors as the power electronic switch.
The Rectifier model has been realized using a 3- phase Universal Bridge Simulink
block. The scheme of modeling is- The Universal Bridge block implements a
universal three-phase power converter that consists of up to six power switches
connected in a bridge configuration. Diodes have been chosen as the power
switches and a 3 arm converter configuration is adopted using the universal bridge
block properties.
32
Figure 3.12: Rectifier block and parameters
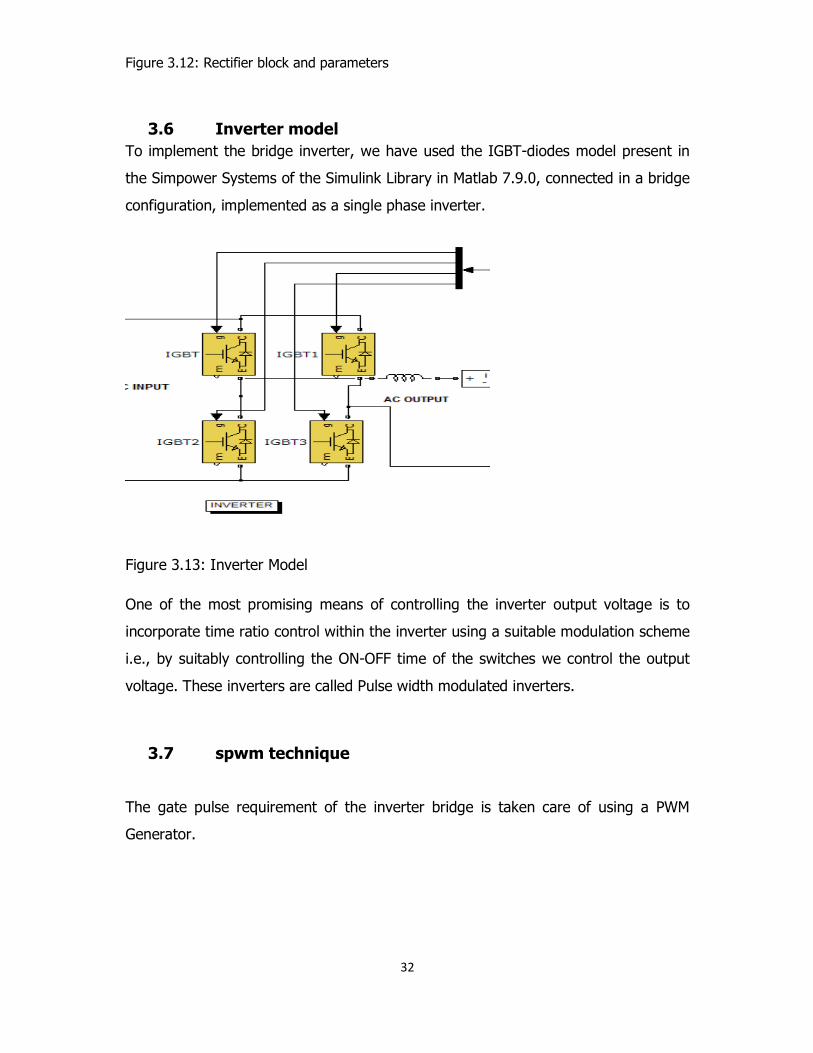
3.6 Inverter model
To implement the bridge inverter, we have used the IGBT-diodes model present in
the Simpower Systems of the Simulink Library in Matlab 7.9.0, connected in a bridge
configuration, implemented as a single phase inverter.
Figure 3.13: Inverter Model
One of the most promising means of controlling the inverter output voltage is to
incorporate time ratio control within the inverter using a suitable modulation scheme
i.e., by suitably controlling the ON-OFF time of the switches we control the output
voltage. These inverters are called Pulse width modulated inverters.
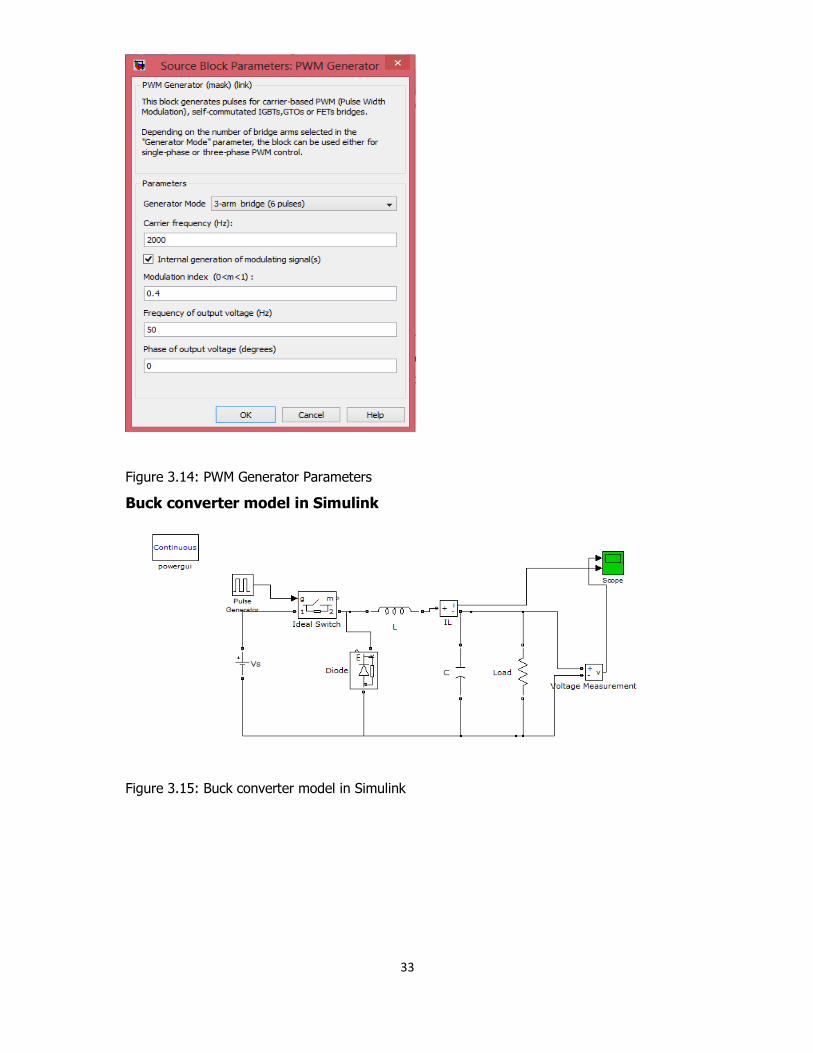
3.7 spwm technique
The gate pulse requirement of the inverter bridge is taken care of using a PWM
Generator.
33
Figure 3.14: PWM Generator Parameters
Buck converter model in Simulink
Figure 3.15: Buck converter model in Simulink

34
Standalone Wind power system connected to load.
Figure 3.15: Standalone Wind power system connected to load
3.8 Modeling of Hybrid System with battery storage.
After having completed the standalone system modeling for PV model, wind model
and battery storage model, all individual model were connected as hybrid system.
Hybrid system was formed with wind model and PV model. AC voltage generated by
wind model was rectified and converted into DC voltage. It was added with DC
voltage from PV model which was also inverted into AC and then connected to the
load. On the other hand, the battery storage model was connected in parallel with
the hybrid system. The hybrid system model is shown in Figure 3.16.

35
Figure 3.17: Stand-Alone Hybrid Project
The hybrid input and output voltage, battery state of charge, current output are the
focus during simulation. All of these output parameters are measured using a scope.
Conclusion
The block modeling for the wind and PV hybrid system, the battery storage system
and also the AC-DC rectifier were shown in this chapter. The photovoltaic model was
developed based on its characteristic equations, Besides that, a wind turbine model
was developed based on its steady-state characteristic equations .Then the wind
turbine model was added with a PMSM block to form the complete wind model. The
battery storage system was modeled with Simulink blocks of the lithium battery.
Moreover, the rectifier model was developed using a universal bridge block that have
diodes as the power electronic bridge. Lastly, all individual models were connected
as hybrid system.

36
CHAPTER 4
SIMULATION RESULTS AND DISCUSSIONS
4.1 Introduction
The models shown in the above figures were simulated using MATLAB® /
SIMULINK®
This chapter displays the input parameters and also the simulation results obtained
from MATLAB Simulink. The input wind speed variations, the changing PV irradiation
level, the characteristic of PV and wind model, the results from standalone system
simulation and the results from hybrid system at different wind speeds and solar
irradiances were plotted in graph and all the relevant data were recorded in table.
Analysis and discussion were done to determine the hybrid system output voltage
stability at constant parameters.
4.2 Photovoltaic Model Simulation
During the photovoltaic model simulation, the temperature parameter was set at
constant value 27.5°C and the irradiance parameter was set at 400 W/m2, 600 W/m2
and 1000 W/m2 respectively. The output voltage waveforms at different irradiance
value were shown in Figure 4.1 (a), (b), (c).

37
Figure 4.1 (a) at 400W/m2
Figure 4.1 (b) at 600W/m2

38
Figure 4.1 (c) at 1000W/m2
Fig PV model output voltages at (a) 400W/m2 (b) 600W/m2 (c) 1000W/m2
From Figure 4.5, a voltage output of 160.4V was obtained at 400 W/m2 irradiance,
160.6V at 600 W/m2 irradiance and 161V at 1000 W/m2 irradiance while maintaining
the PV model temperature at 27.5°C. The results indicates that the higher the
irradiation level, the greater output voltage can be generated by a PV model.

39
Figure 4.2: P-V characteristics
Figure 4.3: P-I characteristics
The IV and PV curves for various irradiance but a fixed temperature (250C) are
shown above in figures. The characteristic I-V curve tells that there are two regions
in the curve: one is the current source region and another is the voltage source
region. In the voltage source region (in the right side of the curve), the internal
impedance is low and in the current source region (in the left side of the curve), the
impedance is high. Irradiance temperature plays an important role in predicting the

40
I-V characteristic, and effects of both factors have to be considered while designing
the PV system. Whereas the irradiance affects the output, temperature mainly
affects the terminal voltage. From the PV characteristics we can observe that, there
is a point at which the power output is maximum for a given condition of irradiance
and load. If we are operating the PV panel at this point, operation of PV panel at this
region gives the maximum efficiency.
4.3 Wind model simulation
The input wind speed into the wind model was randomly varied between 4 m/s and
10 m/s, which are the typical wind speed available in Kampala.
The graph below, Figure 4.4 depicts the output voltage and currents of this system
Figure 4.4: voltage and Current out-puts of a wind generator respectively

41
From Figure 4.5, a maximum wind generator output voltage of 250V and 10Amps AC
three phase voltage was observed. The wind system output then went through an
AC/DC rectifier, which converted the AC voltage into DC voltage. After that, a
constant output voltage of 250V DC was generated, then fed to the DC link.
Figure 4.5: Buck Converter Voltage and Current Output
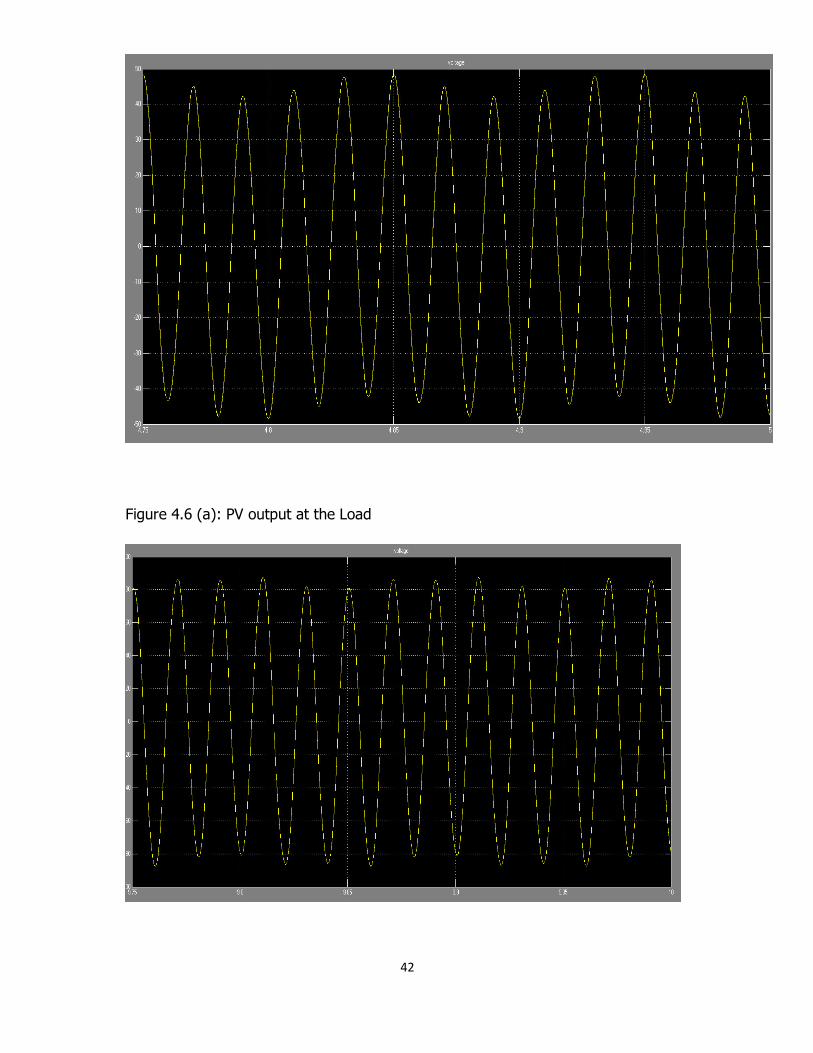
The below figures show the output of a solar PV cell and wind generator voltage at
the load respectively; it’s observed that unlike hybrid systems standalone systems
produce less voltage which may only sustain the load for a few hours but,
adequately whereas with hybrid, there is a constant power supply since when power
source is not functional, the other is and when both systems are functional a desired
output is realized and more loads can be added onto it.
42
Figure 4.6 (a): PV output at the Load

43
Figure 4.6 (b): Wind Turbine output at the Load
Figure 4.7: output voltage waveform of the hybrid system.

44
CHAPTER 5
CONCLUSIONS AND RECOMMENDATIONS
5.1 Conclusions
The objectives of this project are to develop and simulate a hybrid system that
combines the wind model and the PV model. Then develop an energy storage
system (battery) and simulate together with the hybrid system. The overall hybrid
system will be tested with varying irradiation level for the PV model and changing
wind speed for the wind model to show the variations of these inputs with the
output power inside a hybrid system.
Simulation results show that hybrid system has greater reliability compared to
standalone system because it is based on more than one type of electric generation
source. When either one of the generation system does not operate at its full
capacity due to inconsistent energy source, another system will operate and
compensate the extra load demand. In addition, the hybrid system also able to
produce a greater output voltage compare to standalone system.
5.2 Recommendations
In addition, the design and simulation of hybrid system and energy storage system
can be performed using different type of software such as PSCAD or use a newer
version of MATLAB simulation software. Although MATLAB 7.9 (R2009a) version is
still applicable in this project, but the latest version of MATLAB 7.14 (R2012a) would
provide a comprehensive list of blocks for the hybrid system and energy storage
modeling in Simulink.

45
REFERENCES
Kumar, et al., "Modeling and Control of Micro-Turbine Based Distributed
Generation System," Signal Processing, vol. 3, pp. 65-72, 2009.
S. J. Park, et al., "A Study on the Stand-Alone Operating or Photovoltaic
Wind Power Hybrid Generation System," 35th Annul IEEE Power Electronics
Specialists Conference, Aachen, Germany,2004.
D.Popni, "Analysis of diffusion paths for photovoltaic technology based on
experience curves," Solar Energy, vol. 64, pp. 331-340, 2003.
C. R. Sullivan and M. J. Powers, "A high-efficiency maximum power point
tracker for photovoltaic arrays in a solar-powered race vehicle," in Power
Electronics Specialists Conference, 1993. PESC ’93 Record., 24th Annual
IEEE, 1993, pp. 574 580.
J. K. Kaldellis, Stand-alone and hybrid wind energy systems: Technology,
energy storage and applications. New York: Woodhead Publishing Limited,
2010.
M. A. Masoum, et al., "Theoretical and Experimental Analyses of
Photovoltaic Systems with Voltage and Current-Based Maximum Power
Point Tracking," Power Engineering Review, IEEE, vol. 22, pp. 62-62, 2002.
SECO, "Introduction to Photovoltaic System," T. S. E. C. O. (SECO), Ed., ed.
Texas, pp. 1-4.
"Solar Electric Power System," in http://cogeneration.net/solar- electric
power-systems/, R. E. I. R. Cogeneration: News and Technologies, Ed., ed.
Mohd Ikhwan Bin Muhammad Ridzuan, "Modeling and Simulation of Power
Conditioning for Grid-Connected PV/Wind Hybrid Generation System,"
46
Faculty of Electrical Engineering, University of Technology Malaysia, Johor
Bahru, 2009.
H. Altas and A. M. Sharaf, "A photovoltaic array simulation model for
matlab-simulink GUI environment," Proc. Int. Conf. Clean Elect. Power
(ICCEP), pp. 341-345, 2007.
J. Yuncong, et al., "Improved solar PV cell Matlab simulation model and
comparison," in Circuits and Systems (ISCAS), Proceedings of 2010 IEEE
International Symposium on, 2010, pp. 2770-2773.
M.G.Villalva, et al., "Comprehensive approach to modeling and simulation of
photovoltaic arrays," IEEE Transactions on Power Electronics, vol. 25, pp.
1198-1208, 2009.
R. O. Ali. El.-Ali. Nazih Moubayed, "Control of an hybrid solar-wind system
with acid battery for storage," WSEAS TRANSACTIONS on Power Systems,
vol. 4, 2009.
T. DenHerder, "Design and Simulation of Photovoltaic Super System using
Simulink," California Polytechnic State University, San Luis Obispo 2006.
R. K. Nema, et al., "Computer Simulation Based Study of Photovoltaic
Cells/Modules and their Experimental Verification," International Journal of
Recent Trends in Engineering, vol. 1, May 2009.
M.G.Villalva, et al., "Modeling and circuit based simulation of photovoltaic
arrays," Brazilian Journal of Power Electronics, pp. 33- 45, 2009.
M. R.Patel, Wind and Solar Power Systems: Design, Analysis, and
Operation. United States: CRC Press Taylor & Francis Group, 2006.
47
B. Cultura and Z. M. Salameh, "Modeling and simulation of a wind turbine-
generator system," in Power and Energy Society General Meeting, 2011
IEEE, 2011, pp. 1-7.
J.Vergauwa, et al., "Optimization of a Wind Turbine using Permanent
Magnet Synchronous Generator (PMSG)," presented at the Proc. ICREPQ,
2006.
S. A. Diaz, et al., "Indirect sensorless speed control of a PMSG for wind
application," in Electric Machines and Drives Conference, 2009. IEMDC ’09.
IEEE International, 2009, pp. 1844-1850.
S. Clarke, "Electricity Generation Using SmallWind Turbines at Your Home or
Farm," Ontario Ministry of Agriculture and Food, Fact Sheet, September
2003.
J. G. Slootweg, et al., "Initialization of wind turbine models in power system
dynamics simulations," in Power Tech Proceedings, 2001 IEEE Porto, 2001,
p. 6 pp. vol.4.
MathWorks. (2012). MATLAB: Wind Turbine.
K. E. Okedu, "Wind Turbine Driven by Permanent Magnet Synchronous
Generator," Pacific Journal of Science and Technology, vol. 12, pp. 168-175,
November 2011.
MathWorks. (2012). MATLAB: Permanent Magnet Synchronous Machine.
Mohan. N and U. T, Power Electronics Converters, Applications and Design.
New York: John Wiley & Sons, 1995.

48
Appendix I
Solar module:

49
Appendix II
MATLAB CODE FOR PV ARRAY.
T=302; Tr1=40; Tr=298; S=[100 80 60 40 20]; %S=70; Ki=0.00023; Iscr=3.75; Irr=0.000021; K=1.38065*10^(-23); q=1.6022*10^(-19); A=2.15; Eg0=1.166; alpha=0.473; beta=636; Eg=Eg0-(alpha*T*T)/(T+beta)*q; Np=4; Ns=60; V0=[0:1:300]; for i=1:5 Iph=(Iscr+Ki*(T-Tr))*((S(i))/100); Irs=Irr*((T/Tr)^3)*exp(q*Eg/(K*A)*((1/Tr)-(1/T))); I0=Np*Iph-Np*Irs*(exp(q/(K*T*A)*V0./Ns)-1); P0=V0.*I0; figure(1) plot(V0,10); axis([0 50 0 20]); xlabel('Voltage in volt'); ylabel('Current in amp'); hold on; figure(2) plot(V0,P0); axis([0 50 0 400]); xlabel('Voltage in volt'); ylabel('Power in watt'); hold on; figure(3) plot(I0,P0); axis([0 20 0 400]); xlabel('Current in amp'); ylabel('Power in watt'); hold on; end