Design and Performance Verification of a Bridge Column ...
120
Design and Performance Verification of a Bridge Column/Footing/Pile System for Accelerated Bridge Construction (ABC) Final Report March 2020 Sponsored by Iowa Highway Research Board (IHRB Project TR-673) Iowa Department of Transportation (InTrans Project 14-495)
-
Upload
khangminh22 -
Category
Documents
-
view
4 -
download
0
Transcript of Design and Performance Verification of a Bridge Column ...

Design and Performance Verification of a Bridge Column/Footing/Pile System for Accelerated Bridge Construction (ABC)
Final ReportMarch 2020
Sponsored byIowa Highway Research Board(IHRB Project TR-673)Iowa Department of Transportation(InTrans Project 14-495)
About the Bridge Engineering CenterThe mission of the Bridge Engineering Center (BEC) is to conduct research on bridge technologies to help bridge designers/owners design, build, and maintain long-lasting bridges.
About the Institute for Transportation The mission of the Institute for Transportation (InTrans) at Iowa State University is to develop and implement innovative methods, materials, and technologies for improving transportation efficiency, safety, reliability, and sustainability while improving the learning environment of students, faculty, and staff in transportation-related fields.
Iowa State University Nondiscrimination Statement Iowa State University does not discriminate on the basis of race, color, age, ethnicity, religion, national origin, pregnancy, sexual orientation, gender identity, genetic information, sex, marital status, disability, or status as a US veteran. Inquiries regarding nondiscrimination policies may be directed to the Office of Equal Opportunity, 3410 Beardshear Hall, 515 Morrill Road, Ames, Iowa 50011, telephone: 515-294-7612, hotline: 515-294-1222, email: [email protected].
Disclaimer NoticeThe contents of this report reflect the views of the authors, who are responsible for the facts and the accuracy of the information presented herein. The opinions, findings and conclusions expressed in this publication are those of the authors and not necessarily those of the sponsors.
The sponsors assume no liability for the contents or use of the information contained in this document. This report does not constitute a standard, specification, or regulation.
The sponsors do not endorse products or manufacturers. Trademarks or manufacturers’ names appear in this report only because they are considered essential to the objective of the document.
Iowa DOT Statements Federal and state laws prohibit employment and/or public accommodation discrimination on the basis of age, color, creed, disability, gender identity, national origin, pregnancy, race, religion, sex, sexual orientation or veteran’s status. If you believe you have been discriminated against, please contact the Iowa Civil Rights Commission at 800-457-4416 or Iowa Department of Transportation’s affirmative action officer. If you need accommodations because of a disability to access the Iowa Department of Transportation’s services, contact the agency’s affirmative action officer at 800-262-0003.
The preparation of this report was financed in part through funds provided by the Iowa Department of Transportation through its “Second Revised Agreement for the Management of Research Conducted by Iowa State University for the Iowa Department of Transportation” and its amendments.
The opinions, findings, and conclusions expressed in this publication are those of the authors and not necessarily those of the Iowa Department of Transportation.

Technical Report Documentation Page
1. Report No. 2. Government Accession No. 3. Recipient’s Catalog No.
IHRB Project TR-673
4. Title and Subtitle 5. Report Date
Design and Performance Verification of a Bridge Column/Footing/Pile System for
Accelerated Bridge Construction (ABC)
March 2020
6. Performing Organization Code
7. Author(s)
Zhao Cheng (https://orcid.org/0000-0002-8354-3988), Sri Sritharan (orcid.org/0000-0001-9941-8156), and Jeramy Ashlock (orcid.org/0000-0003-
0677-9900)
8. Performing Organization Report No.
InTrans Project 14-495
9. Performing Organization Name and Address 10. Work Unit No. (TRAIS)
Bridge Engineering Center
Iowa State University
2711 South Loop Drive, Suite 4700
Ames, IA 50010-8664
11. Contract or Grant No.
12. Sponsoring Organization Name and Address 13. Type of Report and Period Covered
Iowa Highway Research Board
Iowa Department of Transportation
800 Lincoln Way
Ames, IA 50010
Final Report
14. Sponsoring Agency Code
IHRB Project TR-673
15. Supplementary Notes
Visit www.intrans.iastate.edu for color pdfs of this and other research reports.
16. Abstract
The use of prefabricated components has been continuously gaining momentum in bridge construction because of its numerous
advantages over conventional cast-in-place construction methods. However, there are few, if any, projects that have utilized
prefabricated components to construct the entire bridge column/footing/pile system because the sufficiency of suitable
connections has not been adequately studied to ensure satisfactory performance at the system level. Therefore, this study was
conducted to investigate a prefabricated bridge pier system suitable for accelerated bridge construction (ABC). The proposed
system consists of a precast column, a precast pile cap, and steel H-piles. These components are integrally connected utilizing a
column socket connection and pile socket connections that are preformed in the pile cap with corrugated steel pipes.
An experimental study was performed using eight specimens that modeled the full-scale connection interfaces, demonstrating that
side shear strength in the column socket connection is sufficient to transfer large vertical loads from the column to the pile cap.
Using a recently built bridge as the prototype, an outdoor test was subsequently conducted at half-scale, modeling a
column/footing/pile system at a cohesive soil site. The footing in the test unit was supported by four vertical steel H-piles and
four battered steel H-piles. To evaluate the system performance as well as the behavior of various connections and pile
foundation, the test unit was subjected to different combinations of vertical and lateral loads. Throughout the test, the socket
connections maintained fixity, confirming that the proposed system is an excellent alternative for routine use in accelerated
bridge construction.
17. Key Words 18. Distribution Statement
accelerated bridge construction (ABC)—bridge column/footing/pile system—
outdoor test—precast column—precast pile cap—steel H-pile—socket
connection—soil-foundation-structure interaction
No restrictions
19. Security Classification (of this
report)
20. Security Classification (of this
page)
21. No. of Pages 22. Price
Unclassified. Unclassified. 116 NA


DESIGN AND PERFORMANCE
VERIFICATION OF A BRIDGE
COLUMN/FOOTING/PILE SYSTEM FOR
ACCELERATED BRIDGE CONSTRUCTION
(ABC)
Final Report
March 2020
Principal Investigator
Sri Sritharan, Wilkinson Chair of Interdisciplinary Engineering
Civil, Construction, and Environmental Engineering, Iowa State University
Co-Principal Investigator
Jeramy Ashlock, Richard L. Handy Associate Professor
Civil, Construction, and Environmental Engineering, Iowa State University
Research Assistants
Zhao Cheng
Authors
Zhao Cheng, Sri Sritharan, and Jeramy Ashlock
Sponsored by
Iowa Department of Transportation and
Iowa Highway Research Board
(IHRB Project TR-673)
Preparation of this report was financed in part
through funds provided by the Iowa Department of Transportation
through its Research Management Agreement with the
Institute for Transportation
(InTrans Project 14-495)
A report from
Bridge Engineering Center
Iowa State University
2711 South Loop Drive, Suite 4700
Ames, IA 50010-8664
Phone: 515-294-8103 / Fax: 515-294-0467 www.bec.iastate.edu


v
TABLE OF CONTENTS
ACKNOWLEDGMENTS ............................................................................................................. ix
EXECUTIVE SUMMARY ........................................................................................................... xi
CHAPTER 1. INTRODUCTION ....................................................................................................1
1.1. Background ................................................................................................................1 1.2. Objectives and Scope .................................................................................................2
1.3. Report Organization ...................................................................................................2
CHAPTER 2. LITERATURE REVIEW .........................................................................................3
2.1. ABC and Precast Elements ...........................................................................................3 2.2. Precast Frame Pier ........................................................................................................4
2.3. Connections for Precast Frame Pier ..............................................................................5 2.4. Design of Socket Connection......................................................................................12 2.5. Construction of Socket Connection ............................................................................15
CHAPTER 3. PROPOSED BRIDGE COLUMN/FOOTING/PILE SYSTEM .............................17
3.1. Column Socket Connection and Pile Socket Connection ...........................................17
3.2. Assembly of Precast Frame Pier .................................................................................17
CHAPTER 4. COLUMN SOCKET CONNECTION TEST .........................................................20
4.1. Test Unit Design .........................................................................................................21
4.2. Test Unit Construction ................................................................................................24 4.3. Test Protocol ...............................................................................................................26
4.4. Test Setup....................................................................................................................26
4.5. Instrumentation ...........................................................................................................27
4.6. Test Results .................................................................................................................28 4.7. Discussion ...................................................................................................................35
CHAPTER 5. OUTDOOR SYSTEM TEST .................................................................................36
5.1. Geotechnical Site Conditions ......................................................................................36 5.2. Test Unit Design .........................................................................................................44
5.3. Test Unit Construction ................................................................................................46 5.4. Test Setup....................................................................................................................54 5.5. Load Protocol ..............................................................................................................58
5.6. Instrumentation ...........................................................................................................60 5.7. Test Results .................................................................................................................65
5.8. Discussion ...................................................................................................................91
CHAPTER 6. SUMMARY AND CONCLUSIONS .....................................................................93
REFERENCES ..............................................................................................................................95
APPENDIX. TEST UNIT DRAWINGS .......................................................................................97

vi
LIST OF FIGURES
Figure 1.1. Use of precast elements in Iowa bridge construction ....................................................1 Figure 2.1. Bridge piers ...................................................................................................................4
Figure 2.2. Precast frame piers: US 6 Bridge over Keg Creek (left) and US 12 Bridge over
I-5 at Grand Mound (right) .............................................................................................5 Figure 2.3. Bar coupler types ...........................................................................................................6 Figure 2.4. Connection details using grouted splice sleeves ...........................................................6 Figure 2.5. Column-to-footing connections with bar couplers ........................................................7
Figure 2.6. Column-to-footing connections with grouted ducts ......................................................8 Figure 2.7. Socket connections with CIP footings ...........................................................................9 Figure 2.8. Socket connections with precast members ....................................................................9 Figure 2.9. Jointed connections .....................................................................................................11
Figure 2.10. Precast cap to pile connections ..................................................................................12 Figure 2.11. Stresses and reinforcement in socket connection: stresses in socket connection
under lateral loading (left) and circular reinforcement (right) ......................................13 Figure 2.12. Top reinforcement in footing.....................................................................................14 Figure 3.1. Sockets on precast pile cap ..........................................................................................17
Figure 3.2. Assembly process of precast frame pier ......................................................................19 Figure 4.1. Axial strength of fully penetrated socket connection (left) and partially
penetrated socket connection (right) .............................................................................20 Figure 4.2. Details of socket connection test specimen .................................................................23 Figure 4.3. Reinforcing cage and CSP installation for foundation ................................................24
Figure 4.4. Form liner used to create fluted fins on the column ....................................................24 Figure 4.5. Comparison of trial specimens ....................................................................................25
Figure 4.6. Columns with different surface roughness ..................................................................25 Figure 4.7. Test setup for socket connection tests .........................................................................26
Figure 4.8. Configuration of instrumentations (left) and measurement variables (right) ..............27 Figure 4.9. LED markers capturing Δgrout ......................................................................................27
Figure 4.10. Failure modes of the specimens ................................................................................28 Figure 4.11. Overall response of each test specimen .....................................................................30 Figure 4.12. Comparisons of connection responses: (a) GF displacement responses for all
specimens, (b) CG displacement responses for specimens with different column
surface textures, and (c) CG displacement responses for specimens with
different CSP-to-column clearances .............................................................................31 Figure 4.13. Impact of cyclic loading ............................................................................................32 Figure 4.14. Strain readings versus depths below the top of socket ..............................................34 Figure 5.1. Locations of CPTs and SPTs .......................................................................................36
Figure 5.2. CPT logs for the test site .............................................................................................39 Figure 5.3. SPT boring logs ...........................................................................................................43 Figure 5.4. Frame pier of the prototype bridge ..............................................................................44
Figure 5.5. Column reinforcing cage (left) and joint reinforcing bars (right) ...............................46 Figure 5.6. Formwork for column..................................................................................................47 Figure 5.7. Completed precast column (left) and exposed aggregate finish (right) ......................48 Figure 5.8. Installation details of threaded rods .............................................................................48 Figure 5.9. CSPs and wood locks ..................................................................................................49

vii
Figure 5.10. Non-reusable reducer (left), 2 in. × 4 in. reducer supports (center), and
reusable reducer (right) .................................................................................................49 Figure 5.11. Plywood for closing the CSP with CSP hanger.........................................................50
Figure 5.12. Pile cap before concrete pour ....................................................................................50 Figure 5.13. Taking out reusable reducers .....................................................................................51 Figure 5.14. Completed precast pile cap ........................................................................................51 Figure 5.15. Driven pile template ..................................................................................................51 Figure 5.16. Weld-splicing piles ....................................................................................................52
Figure 5.17. Friction collars and plywood seal-pads .....................................................................52 Figure 5.18. Nut shimmers underneath column (left) and temporary column bracing (right) ......53 Figure 5.19. Grout pouring ............................................................................................................53 Figure 5.20. Completed test unit ....................................................................................................54 Figure 5.21. Vertical reaction frame ..............................................................................................54
Figure 5.22. Placing main reaction beam.......................................................................................55 Figure 5.23. Single friction pendulum isolator between column and reaction beam ....................55
Figure 5.24. Lateral reaction column .............................................................................................56 Figure 5.25. Precast column segment ............................................................................................56
Figure 5.26. Drilled shaft details....................................................................................................57 Figure 5.27. Construction of drilled shaft ......................................................................................57
Figure 5.28. Lateral actuator attached on reaction column ............................................................58 Figure 5.29. Test protocol for Phase I and Phase II .......................................................................59 Figure 5.30. Loading protocol for test Phases III through VI ........................................................60
Figure 5.31. Strain gauges on column reinforcements ..................................................................61 Figure 5.32. Strain gauges on CSPs of column socket and pile sockets ........................................61
Figure 5.33. Strain gauges on pile cap reinforcements ..................................................................62
Figure 5.34. Strain gauges on embedded piles ..............................................................................63
Figure 5.35. Strain gauges on the piles driven into ground ...........................................................63 Figure 5.36. Layout and location of BDI strain transducers ..........................................................64
Figure 5.37. Layout of displacement transducers ..........................................................................65 Figure 5.38. Layout of markers for NDI optical measurement system .........................................65 Figure 5.39. Pile nomenclature ......................................................................................................66
Figure 5.40. Column drift at the end of Phase I (left) and Phase II (right) ....................................66 Figure 5.41. Damage at the column base: flexural cracks (left) and cover concrete spalling
(right).............................................................................................................................67 Figure 5.42. Buckling of longitudinal reinforcing bar ...................................................................67 Figure 5.43. Column base at the end of Phase II ...........................................................................68 Figure 5.44. No damage on column connection (left) and pile connection at the end of
Phase I, (right) ...............................................................................................................68
Figure 5.45. Crack at column-to-grout pour interface ...................................................................69 Figure 5.46. Spalling of grout closure pour at the end of Phase II ................................................69
Figure 5.47. Observations of the piles and their connections ........................................................70 Figure 5.48. Vertical load as a function of column top displacement ...........................................71 Figure 5.49. Lateral load acting on test unit ..................................................................................71 Figure 5.50. Moments estimated at the section 48 in. above top of the pile cap ...........................72 Figure 5.51. Calculation of column lateral resistance....................................................................73 Figure 5.52. Column base moment versus column lateral displacement .......................................73
viii
Figure 5.53. Lateral load-displacement response measured at pile cap .........................................74 Figure 5.54. Moment rotation response measured at pile cap .......................................................76 Figure 5.55. Pile head moment as a function of moment at the bottom of the pile cap ................77
Figure 5.56. Pile axial force as a function of moment at the bottom of the pile cap .....................78 Figure 5.57. Pile vertical displacement with respect to the pile cap ..............................................79 Figure 5.58. Pile rotation with respect to the pile cap ...................................................................80 Figure 5.59. Strain history of column longitudinal reinforcement ................................................82 Figure 5.60. Strain profile along two column longitudinal reinforcements for Phase I ................83
Figure 5.61. Strain profile along two column longitudinal reinforcements for Phase II ...............83 Figure 5.62. Strain profile of column socket CSP for Phase I .......................................................84 Figure 5.63. Strain profile of column socket CSP for Phase II ......................................................85 Figure 5.64. Strain history of pile cap reinforcement perpendicular to the loading direction .......86 Figure 5.65. Strain profile of pile cap reinforcement perpendicular to the loading direction .......86
Figure 5.66. Strain history of pile cap reinforcement parallel to the loading direction .................87 Figure 5.67. Strain profile of pile cap reinforcement parallel to the loading direction .................88
Figure 5.68. Strain history of headed reinforcement in the pile cap ..............................................88 Figure 5.69. Strain profile of headed reinforcement in the pile cap ..............................................89
Figure 5.70. Strain history of embedded pile head ........................................................................90 Figure 5.71. Strain profile of embedded pile head .........................................................................90
Figure 5.72. Components of column top displacement (left) and their proportions for
Phase I and Phase II (right) ...........................................................................................92
LIST OF TABLES
Table 2.1. Precast elements for ABC ...............................................................................................3 Table 4.1. CSP-to-column clearances for common size precast columns .....................................22
Table 4.2. Testing matrix ...............................................................................................................23

ix
ACKNOWLEDGMENTS
The authors would like to thank the Iowa Highway Research Board (IHRB) and the Iowa
Department of Transportation for sponsoring this research. The authors acknowledge the
members of the technical advisory committee: Ahmad Abu-Hawash, Michael Nop, Linda
Narigon, Vanessa Goetz, Dean Bierwagen, Mark Dell, Kyle Frame, Chris Cromwell, James
Nelson, and Gary Novey, for their advice and suggestions.

xi
EXECUTIVE SUMMARY
Problem Statement
A full substructure system involving prefabricated bridge columns, footings (or pile caps), and
piles has not been used in practice because of the lack of suitable connections and performance
validation of such a system.
Objectives
Develop a bridge column/footing/pile system that can be implemented economically and
effectively using accelerated bridge construction (ABC) methodologies
Validate the performance of the proposed connection details through laboratory tests
Validate system performance through an outdoor test with consideration of soil-foundation-
structure interaction
Formulate design recommendations and details based on test results
Background
About one in five bridges in Iowa were designated as structurally deficient in 2019 and require
significant maintenance, rehabilitation, or replacement. ABC using prefabricated bridge
components helps to improve the condition of bridges as it allows for faster and better repairs or
bridge replacements. The Iowa Department of Transportation (DOT) has successfully
implemented prefabricated components in bridge superstructure construction.
Research Description
Proposed Bridge Column/Footing/Pile System
A precast pile cap was used to build the bridge column/footing/pile system for ABC. The sockets
were created within the footing using corrugated steel pipes (CSPs). The system was assembled
by embedding the precast column and steel piles into the sockets using grout and self-
consolidating concrete (SCC), respectively. The column socket was constructed to partially
penetrate the pile cap, and the pile sockets were made in the shape of a cone and installed
through the pile cap.
To construct the system, both vertical and battered steel piles were driven, and then temporary
friction collars were affixed to each pile. The precast pile cap was supported on the friction
collars, allowing the piles to be extended into the pile sockets. After erecting and bracing the
precast column, the sockets were filled with grout and SCC, respectively.
The friction collars were designed to carry the weights of the precast components until the SCC
reached adequate strength. Given that, superstructure construction could begin the day after
xii
completing the closure pours, at which point the high early-strength grout reached the specified
compressive strength of 6,500 psi.
Column Socket Connection Tests
The socket connection test was conducted to help determine the key connection parameters and
side shear strength for designing the column socket connection. Eight specimens were tested to
investigate the effects of the parameters that most influence the strength:
Surface texture along the embedded length of the precast column
Clearance between the embedded member and the CSP
Loading type
Each specimen consisted of a short precast column segment and precast foundation. The surface
textures of the column segment specimens included an exposed aggregate finish, a 0.5 in. fluted
fin, a 0.75 in. fluted fin, and a smooth finish as a reference. Two clearances, of 1.5 in. and 3 in.,
were reserved around the column segments.
Compressive force was applied to the top of the column segment so that side shear strength could
be evaluated by loading the column until it experienced a sliding failure with respect to the
foundation. Four specimens were tested using monotonic loading; whereas, the other four
specimens were subjected to cyclic loading.
Outdoor System Test
An outdoor system test was conducted to investigate the performance of the proposed
substructure assembly. The unique features of the outdoor system test included the following:
Incorporation of foundation flexibility in virgin soil
Use of steel H-piles
Inclusion of battered piles
Use of large vertical loads in an outdoor lateral load test
A half-scale test unit was constructed at an outdoor location consisting predominantly of
cohesive soil. The test unit incorporated a precast column, a precast pile cap, and eight steel H-
piles, including a battered pile in each of the four corners of the pile cap at a slope of 1:6
(horizontal to vertical).
A partially penetrated socket and eight fully penetrated sockets were designed for the pile cap.
The column end was roughened to an exposed aggregate finish and embedded into the column
socket connection over a length equal to the column diameter. Consistent with current practice,
the pile embedment length into the pile cap was 1.5 times the depth of the pile.

xiii
The outdoor system subassembly unit was tested under different combinations of vertical and
lateral loads. A vertical reaction frame and a lateral reaction column were constructed next to the
test unit to apply the vertical and lateral loads simultaneously. For the first two phases, the lateral
load was applied at the top of the column to produce a high overturning moment-to-lateral load
ratio. For the remainder of the testing phases, the lateral load was applied to the pile cap to fully
examine the pile socket connections.
Key Findings
Column Socket Connection Tests
With the exception of the specimen with the smooth column surface, the specimens provided
significant and comparable side shear strengths against the axial loads applied to the column
segments.
The specimens consisted of column segments with deep amplitude surface textures exhibited
softer connection responses. A thicker grout closure pour (resulting from wider CSP-to-
column clearance) also marginally reduced the stiffness of the socket connection.
Considering the cost and ease of construction, exposed aggregate for embedded member
surface preparation, standard CSP, and high-strength grout are recommended for effectively
establishing socket connections.
For connections following the recommended details, the side shear stress limitations of 1,000
psi and 700 psi are suggested for the column-to-grout interface and CSP-to-surrounding
concrete interface, respectively.
Outdoor System Test
The test unit modeling the proposed bridge column/footing/pile system produced dependable
performance when subjected to the factored design loads. There was no damage to the
column socket or pile socket connections at this stage of testing.
When the lateral force was gradually increased to exceed the design demand, damage
occurred at the column base due to plastification, as expected given the design, and limited
crushing or spalling was observed in the column socket connection with no damage
occurring to the pile connections. This confirmed the adequacy of all ABC connections. This
observation also confirmed that performance of the prefabricated column-pile cap-pile
system was at least as good as, if not better than, that of a comparable, conventional, cast-in-
place system.
For the column socket connection, the embedment length equal to the column diameter is
sufficient to fully develop the column flexural capacity; whereas, the pile embedment length

xiv
of 1.5 times the depth of the H-pile is recommended to maintain fixity for the pile socket
connection.
Foundation flexibility produced a significant effect on system response. About 40% of the
column top lateral displacement was due to foundation flexibility prior to developing flexural
inelastic strains in the column critical region. As inelastic action progressed in the column,
the percentage contribution of foundation flexibility toward the column top lateral
displacement was reduced to about 10%.
Implementation Readiness and Benefits
In this study, the performance of a bridge column/footing/pile system using ABC techniques was
successfully verified. The constructability advantages of the prefabricated column-pile cap-pile
system are that it is quick and simple to build, as demonstrated through the outdoor test. Using
friction collars, SCC, and grout with desirable characteristics, the assembly of the proposed
column-pile cap-pile system can be completed within a day after driving the piles.
As a result, the bridge substructure assembly involving prefabricated components can take place
shortly after driving the foundation piles. Consequently, the proposed ABC approach for the
substructure can reduce construction delays, serviceability problems, and costs, while ensuring
quality construction.
1
CHAPTER 1. INTRODUCTION
1.1. Background
As of 2016, 4,968 bridges in Iowa (about one in five) were designated structurally deficient
(ASCE 2017) and thus in need of significant maintenance, rehabilitation, or replacement.
Accelerated bridge construction (ABC) using precast bridge elements is facilitating the process
of reducing the number of structurally deficient bridges as it allows for faster and better repairs
and builds on bridges. The use of precast elements shortens the period of on-site construction,
thereby reducing mobility impacts, enhancing work-zone safety, and minimizing environmental
impacts (Culmo 2011).
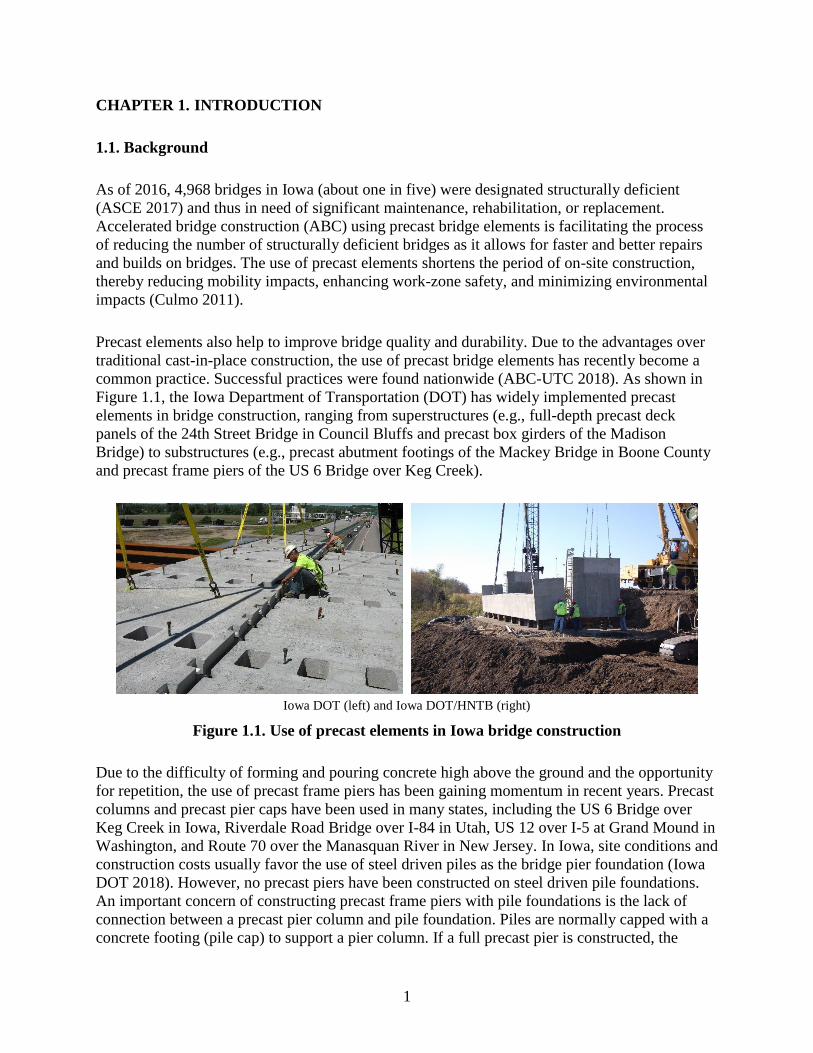
Precast elements also help to improve bridge quality and durability. Due to the advantages over
traditional cast-in-place construction, the use of precast bridge elements has recently become a
common practice. Successful practices were found nationwide (ABC-UTC 2018). As shown in
Figure 1.1, the Iowa Department of Transportation (DOT) has widely implemented precast
elements in bridge construction, ranging from superstructures (e.g., full-depth precast deck
panels of the 24th Street Bridge in Council Bluffs and precast box girders of the Madison
Bridge) to substructures (e.g., precast abutment footings of the Mackey Bridge in Boone County
and precast frame piers of the US 6 Bridge over Keg Creek).
Iowa DOT (left) and Iowa DOT/HNTB (right)
Figure 1.1. Use of precast elements in Iowa bridge construction
Due to the difficulty of forming and pouring concrete high above the ground and the opportunity
for repetition, the use of precast frame piers has been gaining momentum in recent years. Precast
columns and precast pier caps have been used in many states, including the US 6 Bridge over
Keg Creek in Iowa, Riverdale Road Bridge over I-84 in Utah, US 12 over I-5 at Grand Mound in
Washington, and Route 70 over the Manasquan River in New Jersey. In Iowa, site conditions and
construction costs usually favor the use of steel driven piles as the bridge pier foundation (Iowa
DOT 2018). However, no precast piers have been constructed on steel driven pile foundations.
An important concern of constructing precast frame piers with pile foundations is the lack of
connection between a precast pier column and pile foundation. Piles are normally capped with a
concrete footing (pile cap) to support a pier column. If a full precast pier is constructed, the
2
connection between the precast column and precast pile cap as well as the connections between
the precast pile cap and steel driven piles have to satisfy a number of challenging design criteria.
In addition to requiring they be easy to construct rapidly, these connections must be able to
dependably transfer the forces resulting from the bridge weight, traffic, and lateral loads. Several
methods have the potential to establish the connections for a precast bridge frame pier, such as a
grouted coupler, mechanical coupler, grouted duct that splices the reinforcing bars extending
from a precast element, pocket for embedding reinforcing bars extending from a precast element,
socket for embedding the end of a precast element, post-tensioning, and welding (Culmo 2009).
Among these types of connections, the socket connection offers numerous benefits including
speedy erection, ample installation tolerances, and a simplified construction procedure, making
this type of connection promising for implementation.
1.2. Objectives and Scope
Given the recent successes in the implementation of precast bridge elements and the limited use
of precast piers with steel driven pile foundations, this research aimed to develop a full precast
bridge frame pier with pile foundation to further facilitate the use of precast elements for ABC.
This was accomplished by developing the connections for constructing a precast pier on a pile
foundation, validating the precast pier performance experimentally with soil-foundation-structure
interaction effects, and developing a design guide to help with implementation. Taking into
account previous studies and practices, a precast pile cap with preformed sockets was used to
connect a precast pier column and steel driven piles. For on-site assembly, the precast column
and steel driven piles were embedded into these sockets using grout and concrete closure pours.
The performance of the socket connections and the precast pier was explored experimentally.
First, a series of socket connection tests was conducted to investigate the behavior of the column
socket connection in sustaining axial load resulting from gravity effects. Second, as the soil-
structure interaction affects the overall performance of the system as well as the demands on the
connections, a system test was performed at an outdoor test site in order to adequately account
for the soil-foundation-structure interaction and quantify the overall system performance. Based
on the knowledge gained from the literature and the experimental works conducted in this
research, best practices to follow and appropriate design procedures for the precast pier system
were developed to help with future implementation.
1.3. Report Organization
The second chapter of this report is a review of the literature describing previous practices and
studies in order to extensively assess existing connection details for precast elements and
develop new connection concepts. A detailed introduction of the connections and the precast pier
with steel driven pile foundation is presented in Chapter 3. Chapters 4 and Chapter 5 discuss the
component tests of the column socket connection and the outdoor system test of the precast
bridge pier, respectively. The details about fabrication, testing methods, and results are also
presented in these chapters. The summary and conclusions from this research along with a guide
for implementation are presented in the final chapter.

3
CHAPTER 2. LITERATURE REVIEW
2.1. ABC and Precast Elements
ABC can be defined as bridge construction that uses innovative planning, design, materials, and
construction methods in a safe and cost-effective manner to reduce the on-site construction time
that occurs when building new bridges or replacing and rehabilitating existing bridges (Culmo
2011). The successes of a number of projects in Iowa and other states prove that ABC techniques
offer many advantages over traditional cast-in-place (CIP) bridge construction, which include,
but are not limited to, accelerated project delivery, improved construction quality, low life-cycle
costs, minimal environmental impacts, improved work-zone safety, and reduced traffic
disruptions. The available ABC methods are in two main categories: (1) offline construction
where the bridge is constructed away from the final location and then moved into place through a
self-propelled modular transporter (SPMT), lateral sliding, longitudinal launching, or a crane-
based system, and (2) online construction that constructs the bridge in its final location using
prefabricated bridge elements and systems (PBES) (UDOT 2017). Among these methods, online
construction using prefabricated elements is the most common strategy for implementing ABC.
Prefabricated elements, especially precast concrete elements, have been an essential part of
bridge construction for many years. Because they are constructed in a controlled environment,
these elements normally achieve higher quality. The unrestrained condition during curing (i.e.,
no contact with previously cast concrete) reduces, and eliminates in most cases, shrinkage
cracking, thereby minimizing long-term deterioration of the concrete (Culmo 2011). Considering
transportation, fabrication, and construction, the height and width of each precast element,
including projecting reinforcing, are recommended to be less than 10 ft and 14 ft, respectively
(UDOT 2017). In addition, the elements need to be sized based on the weight limits of the
available equipment and the proposed shipping routes. Designers should carefully consider the
constructability when using precast elements. Some effective methods to improve the
constructability include providing repetitive and simple details, minimizing the number of
connections, and providing as much tolerance in the system as possible. Based on the emulating
principle, the design of individual elements can follow traditional Load and Resistance Factor
Design (LRFD) specifications as if they were constructed using CIP techniques. Precast elements
can be used for all components in bridges, as listed in Table 2.1.
Table 2.1. Precast elements for ABC
Category Component
Superstructure Deck elements
Beam elements
Substructure Pier elements
Abutment and wall elements
Miscellaneous
Approach slab elements
Barrier elements
Others

4
For the purposes of this study, only precast frame piers are discussed in the following section.
2.2. Precast Frame Pier
Most bridge piers can be grouped into frame pier, T-pier, pile bent, or diaphragm pier, as shown
in Figure 2.1 (Iowa DOT 2018).
Frame pier T-pier
Pile bent Diaphragm pier
Iowa DOT 2018
Figure 2.1. Bridge piers
Among these pier configurations, a frame pier is the preferred selection for a typical
pretensioned prestressed concrete beam (PPCB) or continuous welded plate girder (CWPG). If a
bridge is not required to be designed for vehicular collision force and ice loads, a frame pier is
preferred because of its low construction cost (Iowa DOT 2018). A frame pier typically consists
of a bent cap, columns, and foundation under each column. In Iowa, considering site conditions
and construction costs, it often is appropriate to use steel H-piles for the pier foundation (Iowa
DOT 2018).
Due to the difficulty of forming and pouring the bent cap and column at height, construction of a
frame pier can be challenging. Using precast elements can eliminate the on-site forming and save
significant time during construction. With precast technologies, a typical frame pier can be
constructed in as little as two days once the footings are in place (Culmo 2011). Many state
agencies have utilized precast elements in the construction of frame piers. The Iowa DOT has
successfully accomplished the construction of the US 6 Bridge over Keg Creek with precast
columns and precast bent caps (Figure 2.2 left).

5
Iowa DOT/HNTB (left) and WSDOT (right)
Figure 2.2. Precast frame piers: US 6 Bridge over Keg Creek (left) and US 12 Bridge over
I-5 at Grand Mound (right)
The Texas DOT (TxDOT) introduced precast reinforced bent caps in the 1990s and has
developed precast pretensioned bent cap designs in recent years. Full precast frame piers were
constructed for the Riverdale Road Bridge over I-84 in Utah. The Washington State DOT
(WSDOT) has successfully implemented precast columns and precast bent caps with CIP spread
footings (Figure 2.2 right). To address the challenges from site constraints, precast elements can
be used for the construction of foundations. The New Hampshire DOT (NHDOT) and Utah DOT
(UDOT) have developed precast spread footings for bridge construction. However, no precast
pier has been constructed on the pile foundation.
2.3. Connections for Precast Frame Pier
The connections between precast elements are the most critical parts in ABC projects. These
connections should not only be easy to construct but they should also ensure structurally
dependable performance. Most ABC projects are based on the concept of emulation design,
which requires the precast connections to be designed and detailed to act as a CIP construction
joint. Another strategy for connecting precast elements is providing a connection with a strength
lower than that of the adjacent components, while still ensuring sufficient energy dissipation and
strength to maintain the integrity of the bridge.
The successes in past projects (Culmo 2009) and extensive research projects (Marsh et al. 2011,
Restrepo et al. 2011) showed the feasibility of adequately connecting precast bent caps and
precast columns in bridge construction. A commercial grouted splice coupler is the most
common connection method. Other methods, such as a bar coupler connection, grouted duct
connection, pocket connection, or hybrid connection with post-tension technology, are also
practical selections. Aside from the connection between precast bent caps and precast columns,
the column-to-footing connection is another critical element to successfully implement a precast
frame pier. If piles are used as the foundation, the pile cap-to-pile connection is required as well.
The following sections describe the findings from the literature and practices on the connections
for precast columns and piles.

6
2.3.1. Column-to-Footing Connections
Based the force transfer mechanism, connections suitable for a precast column can be classified
as bar coupler connection, grouted duct connection, pocket connection, socket connection, and
jointed connection. However, due to geometry restraint, the pocket connection is not suitable for
connecting a precast column with a precast pile cap.
2.3.1.1. Bar Coupler Connection
A bar coupler works as a connection by splicing the reinforcing bars from the column and
footing. Several styles of couplers, as illustrated in Figure 2.3, are commercially available.
Tazarv and Saiidi 2015/Center for Civil Engineering Earthquake Research
Figure 2.3. Bar coupler types
Among these couplers, the grouted splice sleeve and headed bar with mating sleeve are used for
connecting a column and footing. Figure 2.4 shows the typical connection details using grouted
splice sleeves.
Pantelides et al. 2017/University of Utah Civil and Environmental Engineering
Figure 2.4. Connection details using grouted splice sleeves
7
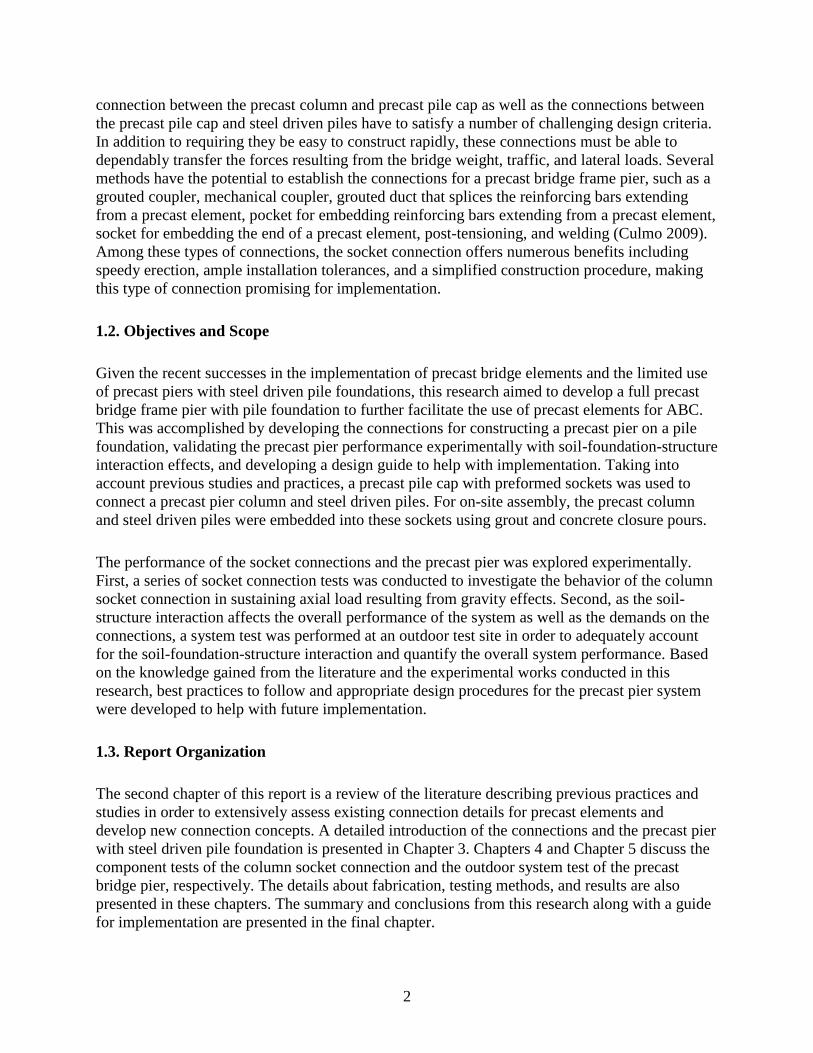
A grout bed using non-shrink grout is prepared before the column is placed. Reinforcing bars
extending from the footing or the column are grouted into splice sleeves. Another type of bar
coupler connection is shown in Figure 2.5.
Haber et al. 2013/Center for Civil Engineering Earthquake Research
Figure 2.5. Column-to-footing connections with bar couplers
Vertical reinforcing bars with headed ends project from the footing and the column. After
placing the column on the footing, the link bars are connected by mating sleeves to the bars
projecting from the column and footing. Spiral reinforcement is then put around the link bars,
and the connection is completed by casting concrete around the splice region at the column base.
For the bar coupler connections, the force transfer mechanism is straightforward, but the main
challenges are cost, tolerance, and potential congestion due to the larger diameter of the couplers.
Designers can mitigate the cost by minimizing the number of couplers through using large
diameter reinforcing bars. Tolerance is a challenge because all projected bars must be aligned in
the field. To help with this, a template can be used to position the bars and couplers during
fabrication of the column and footing. In order to reduce congestion, it is preferred to embed the
coupler into the footing and use larger bars to reduce the number of couplers required. The tests
conducted with these connections (Haber et al. 2013) showed that the strain concentration
occurred either above or below the couplers, depending on their locations.
2.3.1.2. Grouted Duct Connection
In a grouted duct connection, reinforcing bars projecting from one member are grouted into ducts
that are cast into a second member. The force is transferred from the reinforcing bars to the
concrete surrounding the ducts. A small number of larger bars are typically used for easier
alignment and less congestion. Due to the length required to anchor the large bars, ducts are
typically cast into the column, as illustrated in Figure 2.6.

8
Pang et al. 2008/Washington State Transportation Center
Figure 2.6. Column-to-footing connections with grouted ducts
Using ultra-high-performance concrete (UHPC) to fill the ducts instead of grout requires a
shorter length to fully anchor the reinforcing bars such that the ducts can be placed in the footing.
Several tests (Tazarv and Saiidi 2015, Pang et al. 2008) have been conducted on this type of
connection, and preliminary design guidelines can be found in the Precast/Prestressed Concrete
Institute (PCI) Precast and Prestressed Concrete handbook (2014). Similar to the bar coupler
connection, the challenges associated with grouted ducts are tolerance and potential congestion.
2.3.1.3. Socket Connection
A socket connection for joining the precast column and footing can be constructed using one of
the following two methods: (1) cast a CIP footing around the column, or (2) insert the column
into a preformed socket in a CIP or precast footing and secure the connection using a grout
closure pour. The surface of the column can be roughened to improve the shear transfer between
members. The preformed socket can be accomplished using commercially available corrugated
steel pipe (CSP) due to its low cost and variability in size. In addition to serving as stay-in-place
formwork, CSP offers confinement effects for the connections and its corrugations support a
robust load transfer mechanism. The column reinforcing bars in socket connections are fully
encased, and the sockets are preformed and oversized, enabling generous tolerance to be
accommodated. WSDOT has developed and successfully implemented a socket connection
suitable for a precast column with CIP spread footing, as shown in Figure 2.7.
9
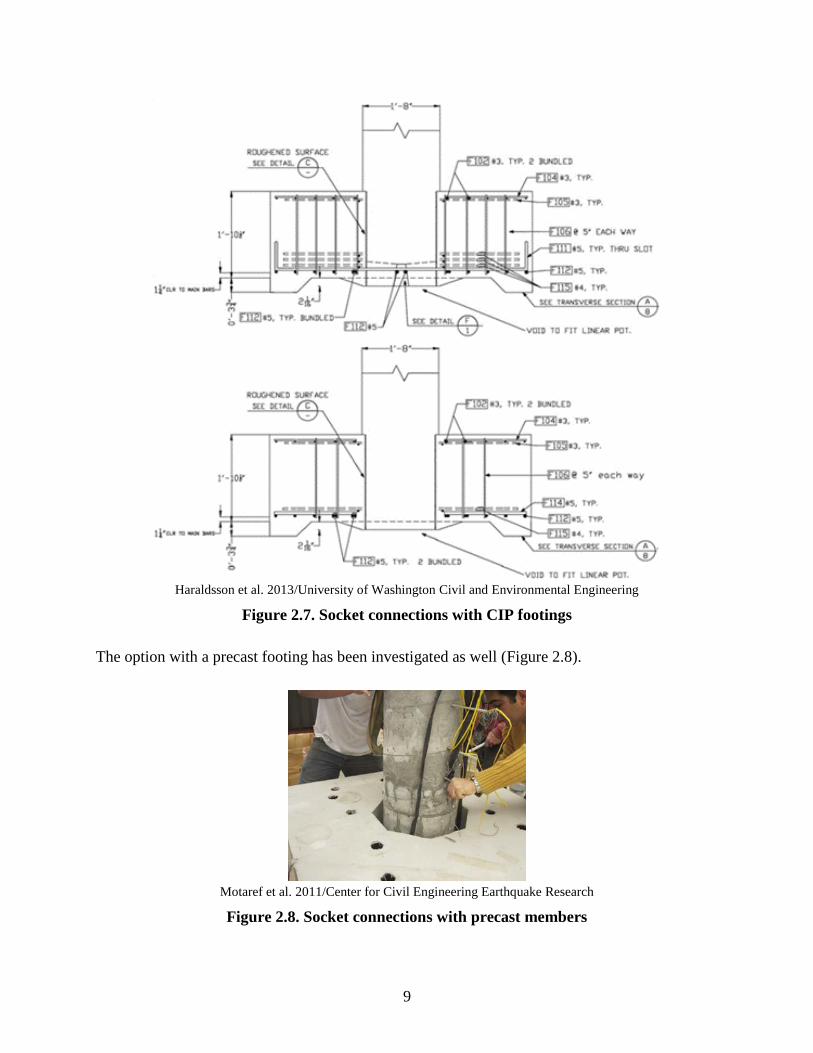
Haraldsson et al. 2013/University of Washington Civil and Environmental Engineering
Figure 2.7. Socket connections with CIP footings
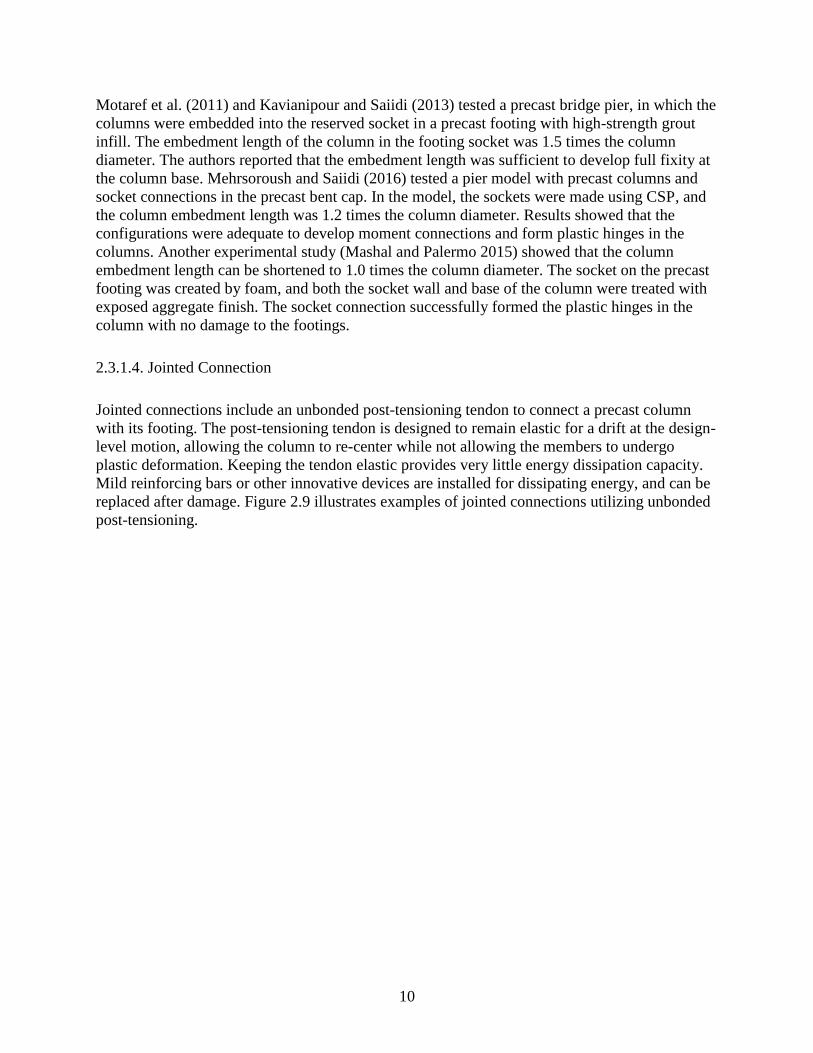
The option with a precast footing has been investigated as well (Figure 2.8).
Motaref et al. 2011/Center for Civil Engineering Earthquake Research
Figure 2.8. Socket connections with precast members
10
Motaref et al. (2011) and Kavianipour and Saiidi (2013) tested a precast bridge pier, in which the
columns were embedded into the reserved socket in a precast footing with high-strength grout
infill. The embedment length of the column in the footing socket was 1.5 times the column
diameter. The authors reported that the embedment length was sufficient to develop full fixity at
the column base. Mehrsoroush and Saiidi (2016) tested a pier model with precast columns and
socket connections in the precast bent cap. In the model, the sockets were made using CSP, and
the column embedment length was 1.2 times the column diameter. Results showed that the
configurations were adequate to develop moment connections and form plastic hinges in the
columns. Another experimental study (Mashal and Palermo 2015) showed that the column
embedment length can be shortened to 1.0 times the column diameter. The socket on the precast
footing was created by foam, and both the socket wall and base of the column were treated with
exposed aggregate finish. The socket connection successfully formed the plastic hinges in the
column with no damage to the footings.
2.3.1.4. Jointed Connection
Jointed connections include an unbonded post-tensioning tendon to connect a precast column
with its footing. The post-tensioning tendon is designed to remain elastic for a drift at the design-
level motion, allowing the column to re-center while not allowing the members to undergo
plastic deformation. Keeping the tendon elastic provides very little energy dissipation capacity.
Mild reinforcing bars or other innovative devices are installed for dissipating energy, and can be
replaced after damage. Figure 2.9 illustrates examples of jointed connections utilizing unbonded
post-tensioning.

11
Motaref et al. 2011/Center for Civil Engineering Earthquake Research
Figure 2.9. Jointed connections
Note that these connections were experimental and have not been used on actual bridges. The
challenges associated with a jointed connection include cost, constructability, and durability.
Also, this type of connection offers no advantage in non-seismic regions.
2.3.2. Pile Cap-to-Pile Connection
The steel H-pile is a common foundation choice for bridges with frame piers. Pile foundations
are normally capped with a concrete footing in order to provide a stable platform to support the
column. A pile group with a concrete cap is an indeterminate structure. In most cases (i.e., the
piles are surrounded by competent soil), the lateral movement of a pile in a pile group with a
concrete cap under lateral loads is very small. Therefore, moments in the pile-to-cap connection
can be ignored. Even though the moment is often ignored in the design process, experimental
studies (Shama et al. 2002, Xiao et al. 2006) indicated that embedding the pile head into the cap,
as typical in current practice, develops significant capacity to sustain a moment.
Few attempts have been made to implement precast pile cap in bridge construction. Only
conceptual details have been developed for the connection of precast pile caps to steel H-piles,
and one of them is from the PCI Northeast Bridge Technical Committee (Culmo 2009, 2011). As
shown in Figure 2.10, leveling bolts are used in the corners of the precast cap to set grade, and
concrete is poured through ports to fill the voids around the piles.

12
Culmo 2009/PCI Northeast Bridge Technical Committee
Figure 2.10. Precast cap to pile connections
Based on research on precast abutments, another conceptual connection has been developed,
similar to a socket connection, using CSP voids. The research findings showed that the
connection with CSP can provide a large amount of strength to transfer the axial force of steel H-
piles (Wipf et al. 2009).
The Wyoming DOT (WYDOT) developed and implemented a connection for connecting precast
concrete pier caps to steel H-piles when constructing the bridge over Crow Creek.
To establish the connection, steel plates with shear studs are cast at the pile locations along the
bottom of the pier cap. In the field, after the cap is set, the steel H-piles are welded to the steel
plates.
2.4. Design of Socket Connection
Because of numerous advantages, including speedy erection and ample installation tolerances,
the socket connection is competitive for joining precast elements in the construction of bridge
frame piers. Several design details and procedures for this type of connection have been
developed based on experimental research findings. When a precast column and a precast footing
are connected using a preformed socket, Mashal and Palermo (2015) claimed that a load couple
will form in the socket under the lateral loading of the column, which induces compressive
stresses in the radial direction and hoop tensile stresses that lie at a perpendicular direction to the
compressive stresses, as shown in Figure 2.11.
13
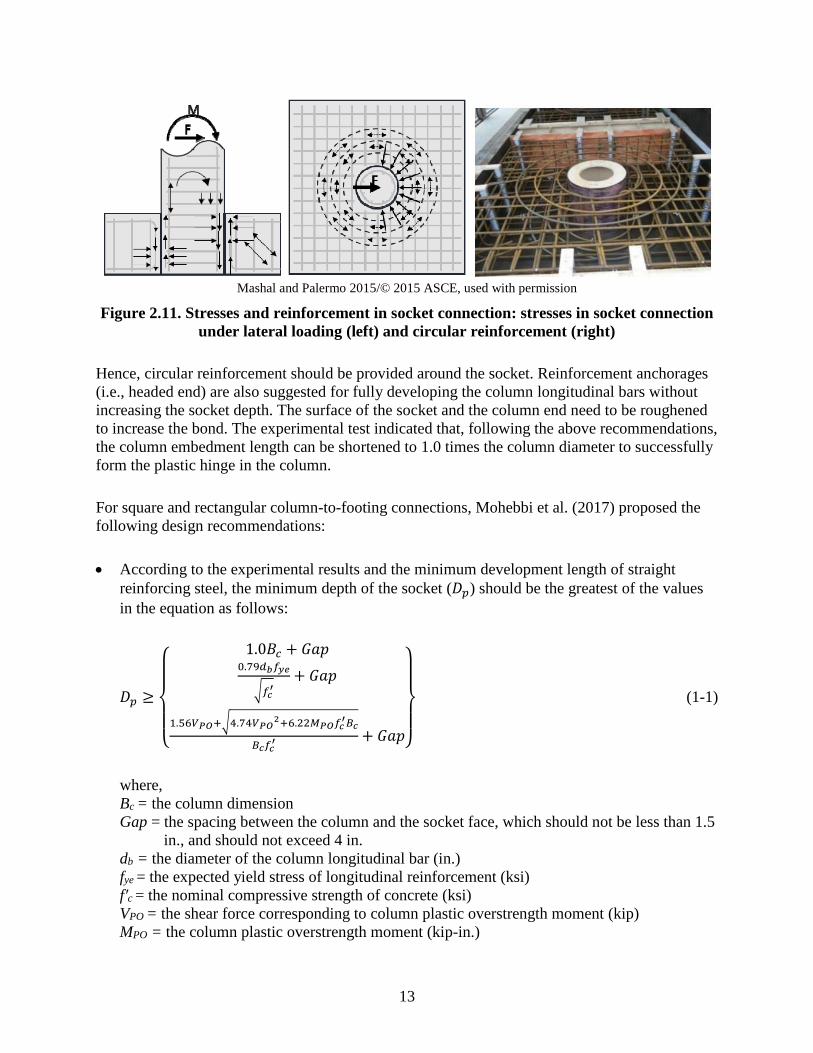
Mashal and Palermo 2015/© 2015 ASCE, used with permission
Figure 2.11. Stresses and reinforcement in socket connection: stresses in socket connection
under lateral loading (left) and circular reinforcement (right)
Hence, circular reinforcement should be provided around the socket. Reinforcement anchorages
(i.e., headed end) are also suggested for fully developing the column longitudinal bars without
increasing the socket depth. The surface of the socket and the column end need to be roughened
to increase the bond. The experimental test indicated that, following the above recommendations,
the column embedment length can be shortened to 1.0 times the column diameter to successfully
form the plastic hinge in the column.
For square and rectangular column-to-footing connections, Mohebbi et al. (2017) proposed the
following design recommendations:
According to the experimental results and the minimum development length of straight
reinforcing steel, the minimum depth of the socket (𝐷𝑝) should be the greatest of the values
in the equation as follows:
𝐷𝑝 ≥
{
1.0𝐵𝑐 + 𝐺𝑎𝑝0.79𝑑𝑏𝑓𝑦𝑒
√𝑓𝑐′
+ 𝐺𝑎𝑝
1.56𝑉𝑃𝑂+√4.74𝑉𝑃𝑂2+6.22𝑀𝑃𝑂𝑓𝑐
′𝐵𝑐
𝐵𝑐𝑓𝑐′ + 𝐺𝑎𝑝}
(1-1)
where,
Bc = the column dimension
Gap = the spacing between the column and the socket face, which should not be less than 1.5
in., and should not exceed 4 in.
db = the diameter of the column longitudinal bar (in.)
fye = the expected yield stress of longitudinal reinforcement (ksi)
f′c = the nominal compressive strength of concrete (ksi)
VPO = the shear force corresponding to column plastic overstrength moment (kip)
MPO = the column plastic overstrength moment (kip-in.)

14
The diagonal bars should be placed at 45 degrees, relative to the longitudinal axis of the
footing, as shown in Figure 2.12. The spacing of the diagonal bars should not exceed 4 times
the bar diameter, and bars should be fully anchored from the corner of the socket.
Mohebbi et al. 2017/Center for Civil Engineering Earthquake Research
Figure 2.12. Top reinforcement in footing
Due to the lack of practice and research, no design recommendations were found for detailing the
preformed socket to connect steel H-piles with precast footings. However, design
recommendations are made for construction practices with a CIP footing, which establishes CIP
socket connections by encasing the top of the piles. The pile head is typically embedded 1 to 2 ft
into the CIP cap. In Iowa, the bottom reinforcing mat of the pile cap is placed 1 in. clear above
the top of the piles. Placing the bottom reinforcing mat below the top of the piles is also an
acceptable option if the piles are widely spaced at 5 ft or more (Iowa DOT 2018). Shama et al.
(2002) defined pile-to-cap connection efficiency (𝜌) in predicting connection performance,
which compares the moment capacity of the pile to the moment capacity of the pile-to-cap
connection. Based on the assumed linear stress distribution through the connection zone, the
connection efficiency can be quantified as:
𝜌 =(𝑓𝑐𝑓𝑦)(𝑑𝑝
𝑡𝑓)(
𝑙𝑒𝑑𝑝)2
(6+𝑙𝑒𝐿∗)
(1-2)
where,
fc = the allowable concrete compressive stress
fy = the yield stress of steel pile section
dp = the pile steel section depth
tf = the pile steel section flange thickness
le = the embedment depth of the steel pile section inside the concrete cap
L* = the distance from the point of application of the lateral load to the neutral axis of the joint

15
2.5. Construction of Socket Connection
A socket connection is an easy-to-construct detail. The socket on one member can be made using
commercially available CSP. After inserting another member into the socket, the connection is
secured by using a grout closure pour. The surface of the embedded member can be intentionally
roughened to improve the force transfer between concrete and grout as they are cast separately.
The following sections contain information on the materials, the products, and the techniques
that are required for establishing a structurally adequate and easy-to-construct socket connection.
2.5.1. Corrugated Steel Pipe
CSP is an effective way to preform a socket in precast elements. In addition to serving as stay-in-
place formwork, CSP offers a confinement effect for the connection and its corrugations provide
a robust load transfer mechanism. Referring to the specifications for culvert pipes (AASHTO
2017, UDOT 2017), the CSP used for creating sockets shall meet the requirements of American
Association of State Highway and Transportation Officials (AASHTO) M 218 (2016). Metallic
coating is typically applied to improve the durability of the CSP, but aluminum cladding is not
allowed because aluminum is reactive with the surrounding concrete, leading to degradation of
the connection over time (UDOT 2017). The seam types of standard CSP include annular
corrugations with riveting or resistance spot welding and helical corrugations with lock seam or
continuous welding. For establishing sockets, annular corrugations are preferred because any
detail to convey water more efficiently is not recommended for structural applications (UDOT
2017). The corrugations of annular seams are 2.67 in. pitch by 0.5 in. depth and 3 in. pitch by 1
in. depth depending on the CSP diameter. For the most common CSPs, ranging from 12 in. to 84
in., the corrugation pattern is 2.67 in. by 0.5 in., where 2.67 in. is measured from crest to crest
and 0.5 in. is from valley to crest. Commercially available CSPs have variability in sizes from 12
in. to 144 in. measured on the inside crest of the corrugations. Designers should be aware of
manufacturing tolerances when they choose the pipe to fit their projects. For the CSP used in
bridge construction, the average inside diameter of the circular pipe shall not vary more than 1%
or 0.5 in., whichever is greater, from the nominal inside diameter (AASHTO 2016).
2.5.2. Grout
There are several different types of grouts. Among these grouts, cementitious grouts are
inexpensive, generally easy to work with, and develop adequate strengths in reasonable time,
making them suitable for bridge construction. These grouts are often prepackaged and composed
of hydraulic cement, fine aggregate and other ingredients. Most commercially available
cementitious grout requires only the addition of water for use. The manufacturer may allow the
job site addition of specific amounts and types of aggregates for some uses. For securing socket
connections, the grout is required to have the following desirable properties: fluid consistency,
extended working time, high early strength, high strength, and non-shrink. The fluid consistency
and extended working time provide the possibility of flowing easily into tight clearances and
large placements in bridge socket connections. High early strength (i.e., a compressive strength
not less than 4,000 psi at 1 day) allows the connections to gain strength quickly, such that the

16
project can be completed in a short period. High strength of the grout ensures the strength of the
finished connection. Ideally, non-shrink grout will not exhibit dimensional change in the plastic
or hardened state. This property tends to reduce the cracks that can occur at the interface between
grout and precast elements and in the grout itself, which improves the durability of the
connection.
To identify suitable products, information about cementitious grouts available on the market
were scanned and sorted (Sritharan and Cheng 2016). After reviewing the technical datasheets
and several trial mixes, Rapid Set ULTRAFLOW 4000/8, referred to as ULTRAFLOW, was
identified as the one that met the requirements for securing socket connections. This particular
type is a fluid consistency, non-shrink, precision grout that provides extended working time up to
30 minutes, but then gains strength quickly after an hour and hits 4,000 psi in 8 hours (CTS
Cement 2019). In addition, the ULTRAFLOW grout reaches a specified 28 days compressive
strength of 8,500 psi at fluid consistency. Any other products that have comparable properties
can be used for socket connections as well.
2.5.3. Concrete Surface Finishing Techniques
In the socket connection, the surface of the embedded element is often intentionally roughened.
Different practical methods can be used to achieve different degrees of roughness. Exposed
aggregate finish is popular, and deeper texture with regularized patterns can also be created by
form liners. Chemical formwork retarders are very effective in exposing coarse aggregate. The
application of retarders to the formwork prior to casting the concrete delays the surface cement
paste from hardening. After hardening of the concrete mass, the retarded outer layer can be
removed by high-pressure water washing. Acid etching is another technique to expose aggregate
on the concrete surface. Unlike retarders that are applied prior to casting concrete, acid etching
dissolves the surface cement paste after concrete hardens. Note that acid etching is only for light
to medium exposures, while formwork retarder can provide deep exposure where the coarse
aggregate becomes the major surface feature (PCI 2007). Hardened concrete can also be
mechanically roughened with sandblasting or bush hammering to produce an exposed aggregate
texture. These finishing techniques are more labor intensive, and may soften the exposed
aggregate (PCI 2007). Form liners are made of wood, steel, elastomeric, plastic, or polystyrene.
A variety of surface textures can be achieved by casting against form liners that are incorporated
in or attached to the surface of formwork. Form liners are the most suitable for flat surfaces.
17
CHAPTER 3. PROPOSED BRIDGE COLUMN/FOOTING/PILE SYSTEM
3.1. Column Socket Connection and Pile Socket Connection
Taking into consideration previous studies and practices, the socket connection was selected for
developing the full precast frame pier with the steel driven pile foundation. A precast pile cap
was used to connect the pile column and the pile foundation. Sockets were preformed on the top
and bottom of the precast pile cap, and the precast pier was assembled by embedding the column
and steel driven piles into these sockets through the use of grout or concrete closure pours. The
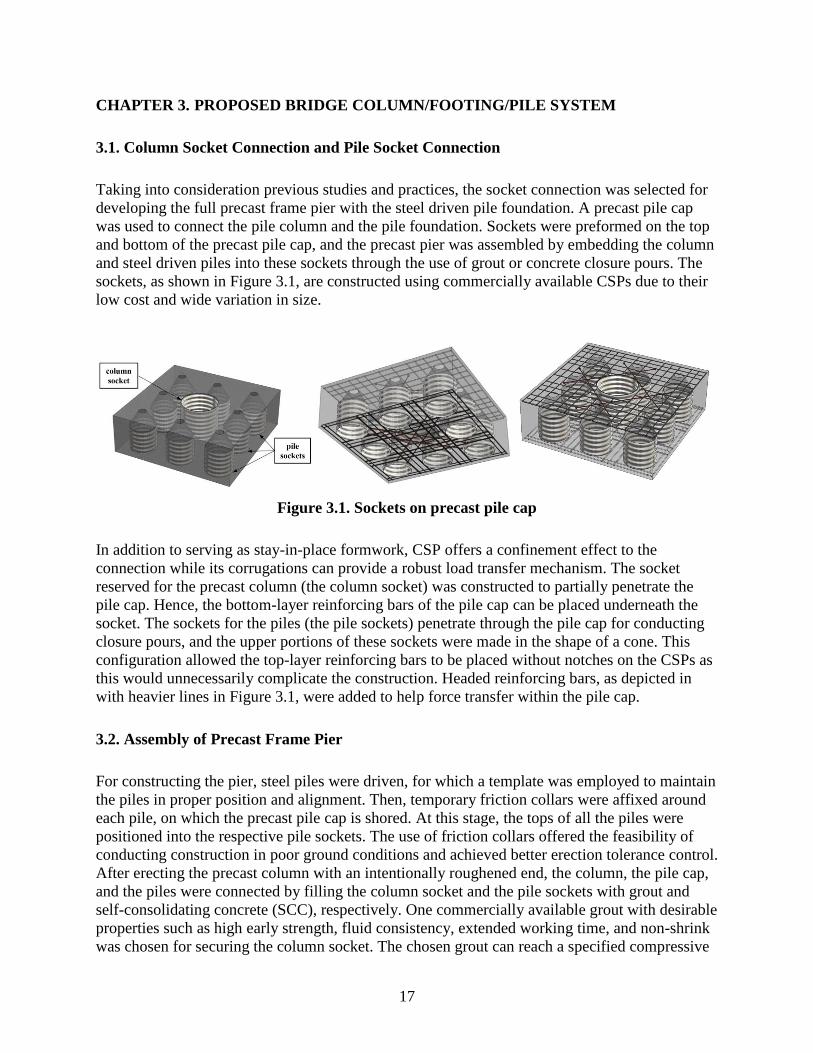
sockets, as shown in Figure 3.1, are constructed using commercially available CSPs due to their
low cost and wide variation in size.
Figure 3.1. Sockets on precast pile cap
In addition to serving as stay-in-place formwork, CSP offers a confinement effect to the
connection while its corrugations can provide a robust load transfer mechanism. The socket
reserved for the precast column (the column socket) was constructed to partially penetrate the
pile cap. Hence, the bottom-layer reinforcing bars of the pile cap can be placed underneath the
socket. The sockets for the piles (the pile sockets) penetrate through the pile cap for conducting
closure pours, and the upper portions of these sockets were made in the shape of a cone. This
configuration allowed the top-layer reinforcing bars to be placed without notches on the CSPs as
this would unnecessarily complicate the construction. Headed reinforcing bars, as depicted in
with heavier lines in Figure 3.1, were added to help force transfer within the pile cap.
3.2. Assembly of Precast Frame Pier
For constructing the pier, steel piles were driven, for which a template was employed to maintain
the piles in proper position and alignment. Then, temporary friction collars were affixed around
each pile, on which the precast pile cap is shored. At this stage, the tops of all the piles were
positioned into the respective pile sockets. The use of friction collars offered the feasibility of
conducting construction in poor ground conditions and achieved better erection tolerance control.
After erecting the precast column with an intentionally roughened end, the column, the pile cap,
and the piles were connected by filling the column socket and the pile sockets with grout and
self-consolidating concrete (SCC), respectively. One commercially available grout with desirable
properties such as high early strength, fluid consistency, extended working time, and non-shrink
was chosen for securing the column socket. The chosen grout can reach a specified compressive

18
strength of 4,000 psi in 8 hours, and the friction collars were designed to carry the weight of the
pile cap, column, and upper structural components before the SCC reaches adequate strength.
Therefore, construction of the upper structure can continue the day after completing closure
pours. When the SCC reached the specified short-term strength, the friction collars were
removed for reuse. The assembly process is illustrated in Figure 3.2.
1. Driven steel pile with a template 2. Friction collars shoring precast pile cap
3. Plywood sealing the pile sockets 4. Place precast pile cap and column
5. Pour grout and SCC securing sockets 6. Continue construction

19
7. Take off friction collars 8. Back-fill trench
Figure 3.2. Assembly process of precast frame pier

20
CHAPTER 4. COLUMN SOCKET CONNECTION TEST
As illustrated in Figure 4.1, the column socket connection can be constructed with full or partial
penetration.
Figure 4.1. Axial strength of fully penetrated socket connection (left) and partially
penetrated socket connection (right)
With any construction option, when the column is subjected to the design loads, the socket
connection should facilitate the transfer of the loads without sustaining any significant sliding.
As shown in Figure 4.1 left, the axial strength of a fully penetrated connection depends only on
the side shear resistance acting along the embedded portion of the vertical member. For a
partially penetrated connection (Figure 4.1 right), the axial load resistance can be provided by
side shear and tipping at the end of vertical member. While relying on both side shear and
tipping can be attractive to reduce the required embedment length of the vertical member, this
option is not favored herein. This is because the design of such a connection is more challenging
due to (1) the side shear and tipping mechanisms being unlikely to be active simultaneously and
(2) the requirement to design for punching failure caused by the precast vertical member to
sustain a tipping mechanism. Given that sufficient axial resistance can be developed over a short
embedment length, it is suggested that both fully and partially penetrated connections be
designed relying only on side shear.
Several experimental studies have utilized preformed sockets connections for bridge columns.
However, currently available testing results are not applicable to bridge columns subjected to 25
to 30% of the axial load capacity. In addition, for preformed socket connections that are
established using CSPs and grout closure pour, no guideline is available to help determine the
key connection parameters and side shear strength for design due to a lack of investigation that
examined the failure modes of socket connections. To address this knowledge gap, column
socket connection tests were conducted to investigate the failure modes of side shear mechanism
in preformed socket connections so that suitable vertical precast members can be designed to
transfer large axial loads through socket connections.

21
4.1. Test Unit Design
When a preformed socket is established using CSP and the connection is established using grout,
the side shear strength will depend on a number of parameters. The parameters that most
influence the strength include: (1) corrugation pattern of CSP, (2) surface texture along the
embedded length of the precast member, (3) clearance between the embedded member and CSP,
and (4) the strength and type of grout used for closure pour. More details about each parameter
are presented below.
1. A key feature of CSP is its corrugation, which provides additional load transfer capacity. The
corrugation types of standard CSPs include annular corrugation and helical corrugation;
annular corrugation was chosen in this study. The corrugation pattern in commercially
available CSP varies with the pipe size. A pattern with 2.67 in. pitch and 0.50 in. depth is
standard for CSPs with inside diameters ranging from 1 ft to 7 ft, which are considered to be
applicable to form sockets in bridge construction.
2. Bond strength between the grout closure pour and the embedded member is another
important property as shear sliding failure can trigger at this interface. The primary variable
that controls the bond strength is surface roughness of the embedded precast member. A
smooth surface with no treatment will have lower bond strength, increasing the likelihood of
shear sliding at this interface. To ensure adequate shear transfer, the AASHTO LRFD Bridge
Design Specifications (2017) suggests intentionally roughening the surface to an amplitude
of approximately 0.25 in. Exposed aggregate finish is a popular texture for achieving the
desired degree of roughness; regularized patterns with deeper amplitude (e.g., fluted fins and
saw-tooth pattern) also have been commonly used. Different practical methods such as
chemical formwork retarder, sandblasting, and bush hammering can be used to expose coarse
aggregates. Note that the mechanical methods (i.e., sandblasting and bush hammering) may
soften the exposed aggregate (PCI 2007), which will degrade the bond strength at the
interface. The regularized patterns can be achieved by casting concrete against form liners
that are incorporated in or attached to the inside surface of the formwork.
3. The preformed socket connection is secured by filling the clearance between CSP and precast
member with grout. The thickness of the grout closure pour that corresponds to the CSP-to-
precast member clearance may affect the transfer of side shear. Sufficient clearance must be
provided to conduct the grout closure pour and to account for the cumulative effects of all
allowed tolerances. For inserting a precast member, a minimum clearance of 1 in. is required
around the perimeter between the column and the socket (PCI 2000). This clearance is also
controlled by the available sizes of CSPs. For commonly used bridge column sizes, Table 4.1
presents the inside diameters of the appropriate commercially available CSPs and the
resultant CSP-to-column clearances.
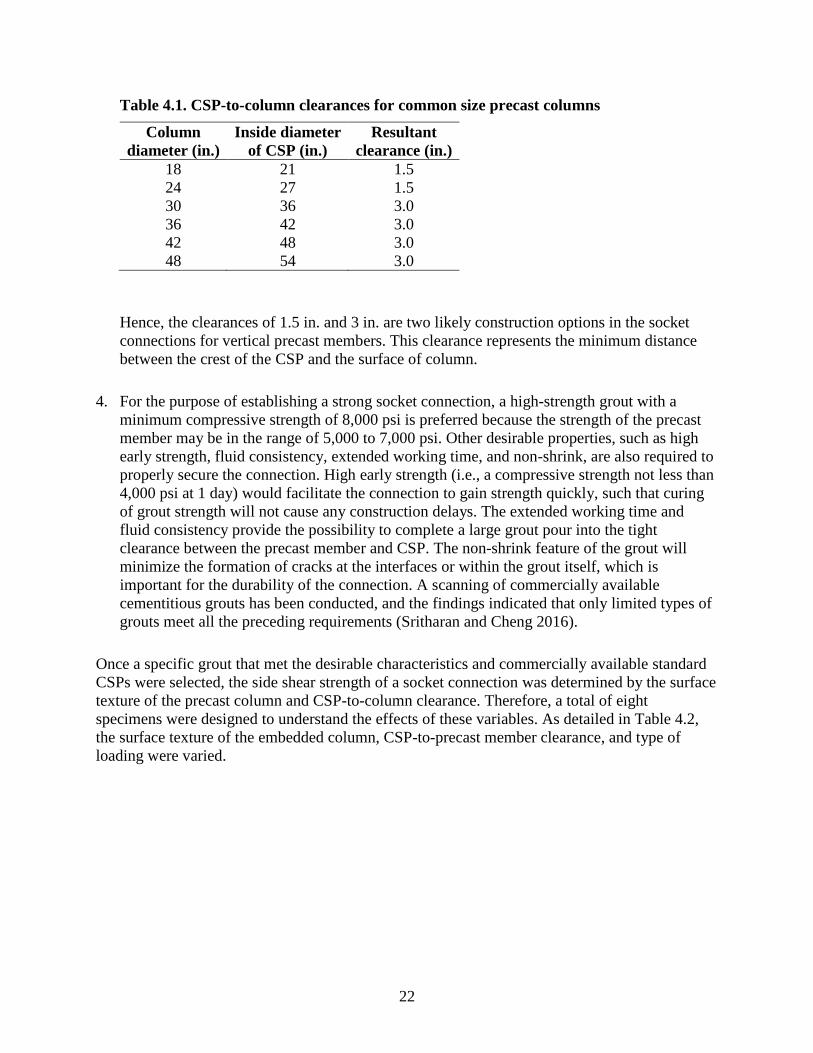
22
Table 4.1. CSP-to-column clearances for common size precast columns
Column
diameter (in.)
Inside diameter
of CSP (in.)
Resultant
clearance (in.)
18 21 1.5
24 27 1.5
30 36 3.0
36 42 3.0
42 48 3.0
48 54 3.0
Hence, the clearances of 1.5 in. and 3 in. are two likely construction options in the socket
connections for vertical precast members. This clearance represents the minimum distance
between the crest of the CSP and the surface of column.
4. For the purpose of establishing a strong socket connection, a high-strength grout with a
minimum compressive strength of 8,000 psi is preferred because the strength of the precast
member may be in the range of 5,000 to 7,000 psi. Other desirable properties, such as high
early strength, fluid consistency, extended working time, and non-shrink, are also required to
properly secure the connection. High early strength (i.e., a compressive strength not less than
4,000 psi at 1 day) would facilitate the connection to gain strength quickly, such that curing
of grout strength will not cause any construction delays. The extended working time and
fluid consistency provide the possibility to complete a large grout pour into the tight
clearance between the precast member and CSP. The non-shrink feature of the grout will
minimize the formation of cracks at the interfaces or within the grout itself, which is
important for the durability of the connection. A scanning of commercially available
cementitious grouts has been conducted, and the findings indicated that only limited types of
grouts meet all the preceding requirements (Sritharan and Cheng 2016).
Once a specific grout that met the desirable characteristics and commercially available standard
CSPs were selected, the side shear strength of a socket connection was determined by the surface
texture of the precast column and CSP-to-column clearance. Therefore, a total of eight
specimens were designed to understand the effects of these variables. As detailed in Table 4.2,
the surface texture of the embedded column, CSP-to-precast member clearance, and type of
loading were varied.

23
Table 4.2. Testing matrix
Test
specimen
Column surface
texture
CSP-to-column
clearance (in.) Loading type
F1G1M 0.5 in. fluted fin 1.5 monotonic
F2G1M 0.75 in. fluted fin 1.5 monotonic
EG1M exposed aggregate 1.5 monotonic
F2G2M 0.75 in. fluted fin 3.0 monotonic
EG1C exposed aggregate 1.5 cyclic
F1G1C 0.5 in. fluted fin 1.5 cyclic
SG1C Smooth 1.5 cyclic
F1G2C 0.5 in. fluted fin 3.0 cyclic
The surface textures included exposed aggregate finish, 0.5 in. deep fluted fin, 0.75 in. deep
fluted fin, and smooth surface. For the fluted fin patterns, the fins are routinely made in a
trapezoidal shape, and the fin-to-fin pitches of 1.5 in. and 2 in. are standard for the 0.5 in. and
0.75 in. fin depths, respectively. Two likely CSP-to-column clearances of 1.5 in. and 3 in. were
chosen as test variables. Each test specimen, as detailed in Figure 4.2 and Table 4.2, consisted of
a short precast column and a precast foundation.
Figure 4.2. Details of socket connection test specimen
Considering the limitation of the actuator capacity, the column embedment length was chosen to
be 9 in., which was equal to the outer diameter of the column. The 12 in. and 15 in. nominal
diameter CSPs with the standard corrugation pattern of 2.67 in. by 0.50 in. were used to reserve,
respectively, the 1.5 in. and 3 in. clearances for grouting. An oversized blockout was formed
under the socket in each foundation to allow the precast column to be pushed out freely when the
side shear mechanism fails. To prevent the columns above the foundation from experiencing
damage due to compression, they were confined by a steel tube with grout infill between the
column and the tube. A 2 in. gap was left between the steel tube and the top of the foundation so
that the tube would not establish contact with the top of the foundation block during testing. This
approach allowed the axial load on the column to be increased, forcing failure in the connection.

24
4.2. Test Unit Construction
To construct the foundation, a 3 in. thick circular piece of Styrofoam was glued on the base
formwork for creating the oversize blockout. After fabricating the reinforcing cage, as shown in
Figure 4.3, CSP was placed on the Styrofoam and immobilized by a crossing 2 in. by 4 in. wood
beam that was clamped to the formwork side.
Figure 4.3. Reinforcing cage and CSP installation for foundation
The columns were constructed with different surface roughness. Surface textures with 0.5 in. and
0.75 in. fluted fins were created through the use of a Scott System elastomeric form liner; the
exposed aggregate surface was achieved by applying an Altus Series V In-Form Retarder (175)
to the concrete tube form; and the smooth surface was made with a no-treatment concrete tube
form. As shown in Figure 4.4, a number of breaches were cut on the fins of the form liner to
improve its flexibility, such that the form liner could be rolled into a concrete tube form.
Figure 4.4. Form liner used to create fluted fins on the column

25
Plywood strips were wedged between the form liner and tube form to adjust the inside diameter
to be as specified. To confirm the working time of the retarder, three trial specimens were made.
A comparison of the trial specimens (Figure 4.5) indicated that the performance of the retarder is
not sensitive to the timing of the application or how soon the power washing was done following
casting of the concrete, which makes the use of this retarder in prefabrication very attractive.
Figure 4.5. Comparison of trial specimens
Hence, for the construction of the column with the exposed aggregate surface, the retarder was
applied two hours prior to placing concrete. All foundations and columns were completed with
one concrete pour. The measured 28 day compressive strength of these members, established
following the ASTM C39 (2017), was 5,362 psi. On the third day after the concrete pour, the
laitance on the columns was power washed right after stripping the forms. The columns with
different surface roughness are shown in Figure 4.6.
Figure 4.6. Columns with different surface roughness
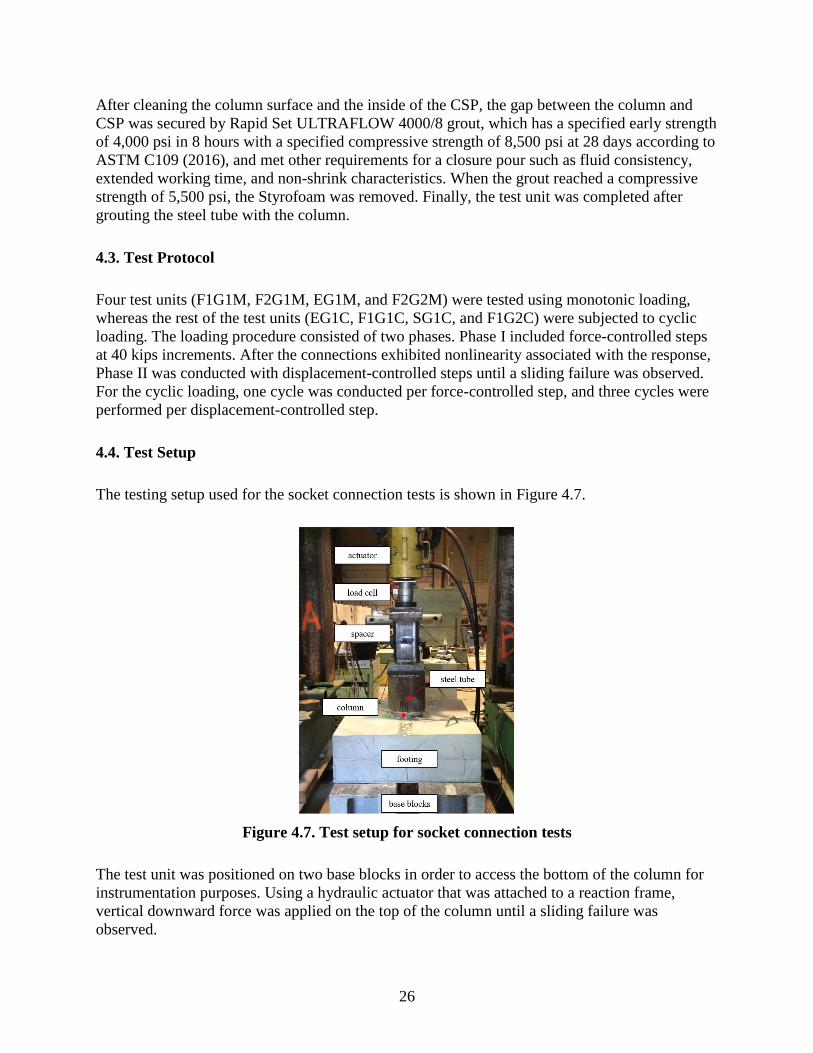
26
After cleaning the column surface and the inside of the CSP, the gap between the column and
CSP was secured by Rapid Set ULTRAFLOW 4000/8 grout, which has a specified early strength
of 4,000 psi in 8 hours with a specified compressive strength of 8,500 psi at 28 days according to
ASTM C109 (2016), and met other requirements for a closure pour such as fluid consistency,
extended working time, and non-shrink characteristics. When the grout reached a compressive
strength of 5,500 psi, the Styrofoam was removed. Finally, the test unit was completed after
grouting the steel tube with the column.
4.3. Test Protocol
Four test units (F1G1M, F2G1M, EG1M, and F2G2M) were tested using monotonic loading,
whereas the rest of the test units (EG1C, F1G1C, SG1C, and F1G2C) were subjected to cyclic
loading. The loading procedure consisted of two phases. Phase I included force-controlled steps
at 40 kips increments. After the connections exhibited nonlinearity associated with the response,
Phase II was conducted with displacement-controlled steps until a sliding failure was observed.
For the cyclic loading, one cycle was conducted per force-controlled step, and three cycles were
performed per displacement-controlled step.
4.4. Test Setup
The testing setup used for the socket connection tests is shown in Figure 4.7.
Figure 4.7. Test setup for socket connection tests
The test unit was positioned on two base blocks in order to access the bottom of the column for
instrumentation purposes. Using a hydraulic actuator that was attached to a reaction frame,
vertical downward force was applied on the top of the column until a sliding failure was
observed.

27
4.5. Instrumentation
Each test unit was instrumented with the optical measurement system, direct current differential
transformers (DCDTs), string potentiometers (string pots), and strain gauges. As shown in Figure
4.8 left, an array of light-emitting diode (LED) markers was attached to the test unit, so the
optical measurement system could capture the connection response, including the relative
displacement between the column and the grout closure pour (CG displacement), the relative
displacement between the column and the foundation (CF displacement), and the relative
displacement between the grout closure pour and the foundation (GF displacement).
Figure 4.8. Configuration of instrumentations (left) and measurement variables (right)
These measurements are detailed in Figure 4.8 right. Two DCDTs were also attached to the
column to measure the CG displacement and the CF displacement. Between the two base blocks,
one string pot was placed underneath the foundation to capture the column base settlement. In
addition to external instrumentation, strain gauges were installed on one longitudinal reinforcing
bar in the column for capturing force transfer in the joint region. To determine any vertical
movement within the grout, which could originate with shear sliding within the grout, the
vertical deformation of the grout closure pour (Δgrout) was measured using LED markers on the
top of the grout closure pour. This was monitored only for the test units with 3 in. thick grout
closure pours. One LED was located at 0.25 in. and the other at 2.5 in. from the column surface
as shown in Figure 4.9.
Figure 4.9. LED markers capturing Δgrout
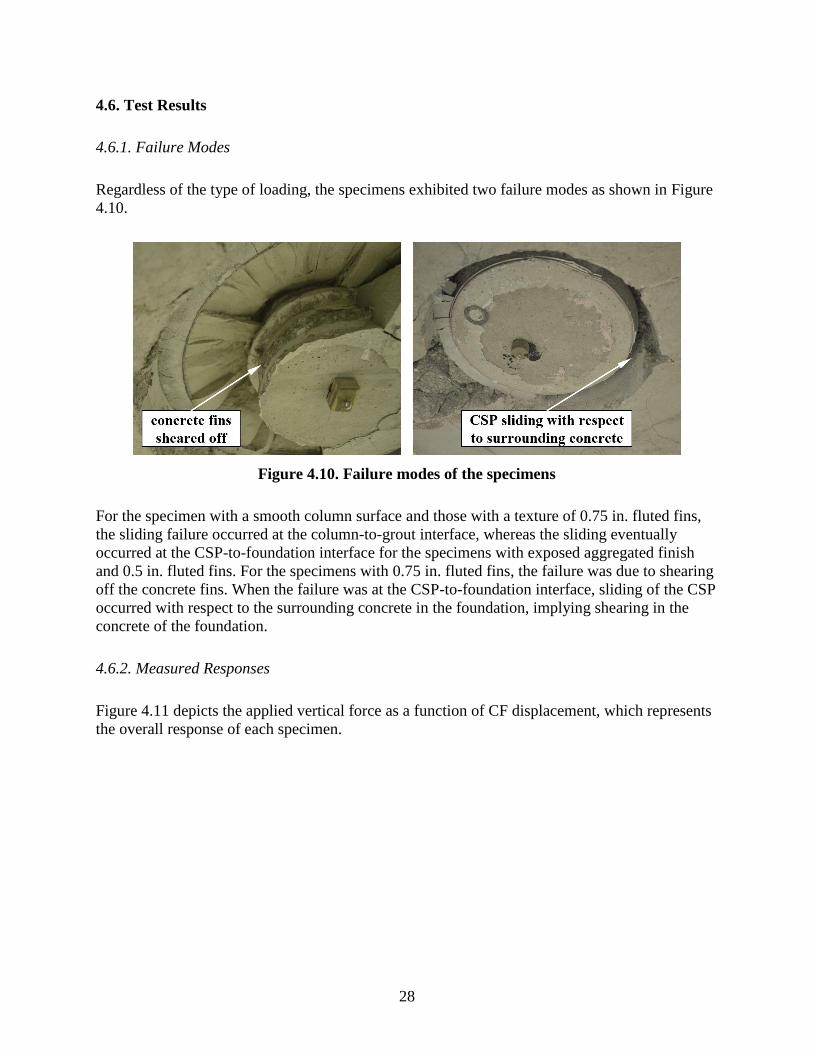
28
4.6. Test Results
4.6.1. Failure Modes
Regardless of the type of loading, the specimens exhibited two failure modes as shown in Figure
4.10.
Figure 4.10. Failure modes of the specimens
For the specimen with a smooth column surface and those with a texture of 0.75 in. fluted fins,
the sliding failure occurred at the column-to-grout interface, whereas the sliding eventually
occurred at the CSP-to-foundation interface for the specimens with exposed aggregated finish
and 0.5 in. fluted fins. For the specimens with 0.75 in. fluted fins, the failure was due to shearing
off the concrete fins. When the failure was at the CSP-to-foundation interface, sliding of the CSP
occurred with respect to the surrounding concrete in the foundation, implying shearing in the
concrete of the foundation.
4.6.2. Measured Responses
Figure 4.11 depicts the applied vertical force as a function of CF displacement, which represents
the overall response of each specimen.

29
0
50
100
150
200
250
300
350
0.0 0.1 0.2 0.3
Fo
rce
(kip
)
CF Disp. (in.)
F2G1M EG1M F2G2MEG1C F1G1C SG1CF1G2C F1G1M
0
50
100
150
200
250
300
350
0.0 0.1 0.2 0.3
Fo
rce
(kip
)
CF Disp. (in.)
F1G1M EG1M F2G2MEG1C F1G1C SG1CF1G2C F2G1M
0
50
100
150
200
250
300
350
0.0 0.1 0.2 0.3
Fo
rce
(kip
)
CF Disp. (in.)
F1G1M F2G1M F2G2MEG1C F1G1C SG1CF1G2C EG1M
0
50
100
150
200
250
300
350
0.0 0.1 0.2 0.3
Fo
rce
(kip
)
CF Disp. (in.)
F1G1M F2G1M EG1MEG1C F1G1C SG1CF1G2C F2G2M
0
50
100
150
200
250
300
350
0.0 0.1 0.2 0.3
Fo
rce
(kip
)
CF Disp. (in.)
F1G1M F2G1M EG1MF2G2M F1G1C SG1CF2G2C EG1C
0
50
100
150
200
250
300
350
0.0 0.1 0.2 0.3
Fo
rce
(kip
)
CF Disp. (in.)
F1G1M F2G1M EG1MF2G2M EG1C SG1CF1G2C F1G1C

30
Figure 4.11. Overall response of each test specimen
With the exception of the one specimen with a smooth column surface, the monotonically loaded
specimens generally produced similar resistance but higher stiffness than their counterparts
subjected to cyclic loading. The monotonically loaded specimens reached peak strengths in the
range of 264 kips to 329 kips, while the cyclically loaded units resisted as much as 261 kips to
308 kips. These ranges correspond, respectively, to 77% to 96% and 76% to 90% of column
axial capacity. The specimen with a smooth column surface failed at 161 kips and exhibited
limited ductility.
Overall, the intentionally roughened column surfaces provided adequate bond strength between
the grout and the embedded column, but the textures with deeper amplitude (i.e., 0.5 in. and 0.75
in. fluted fins) led to softer force-displacement responses. In addition, a thicker grout closure
pour resulting from wider CSP-to-column clearance tended to reduce the shear stiffness of the
connections as deformation within the connection increased. These phenomenon were evidenced
by the captured behavior. The CF displacements consisted of CG displacements, GF
displacements, and the grout vertical deformation (Δgrout) especially when a thicker grout closure
pour was included. Figure 4.12 describes the connection responses in terms of each component.
0
50
100
150
200
250
300
350
0.0 0.1 0.2 0.3
Fo
rce
(kip
)
CF Disp. (in.)
F1G1M F2G1M EG1MF2G2M EG1C F1G1CF1G2C SG1C
0
50
100
150
200
250
300
350
0.0 0.1 0.2 0.3
Fo
rce
(kip
)
CF Disp. (in.)
F1G1M F2G1M EG1MF2G2M EG1C F1G1CSG1C F1G2C

31
(a) (b)
(c)
Figure 4.12. Comparisons of connection responses: (a) GF displacement responses for all
specimens, (b) CG displacement responses for specimens with different column surface
textures, and (c) CG displacement responses for specimens with different CSP-to-column
clearances
To reveal the contribution of each component, plots were created with the same scale for the
axes. As shown in Figure 4.12a, all specimens exhibited comparable GF displacement responses
before reaching the peak strength. Hence, the differences in overall connection responses seen in
Figure 4.11 were the result of sliding at the column-to-grout interface (CG displacements) and
the deformation within the grout closure pour itself (i.e., Δgrout). Figure 4.12b plots the vertical
forces versus CG displacements for the specimens with 1.5 in. CSP-to-column clearance, but
with different column surface textures. This plot confirms that adequate roughness was necessary
to successfully develop the bond strength between the grout and the column. However, the
textures with deeper amplitude of fins would soften the response at the column-to-grout
interface. Figure 4.12c compares the force versus CG displacement responses for F1G1C and
0
50
100
150
200
250
300
350
0.0 0.1 0.2 0.3
Fo
rce
(kip
)
GF Disp. (in.)
F1G1M F2G1M EG1MF2G2M EG1C F1G1CSG1C F1G2C
0
50
100
150
200
250
300
350
0.0 0.1 0.2 0.3
Fo
rce
(kip
)
CG Disp. (in.)
F1G1M F2G1M EG1M SG1C
0
50
100
150
200
250
300
0.0 0.1 0.2 0.3
Fo
rce
(kip
)
CG Disp. (in.)
F1G1C F1G2C

32
F1G2C, which have the same column surface texture but different CSP-to-column clearance.
F1G2C with a thicker grout closure pour resulting from a wider CSP-to-column clearance
showed a softer overall connection response than F1G1C, but the two specimens exhibited
similar responses at the column-to-grout interface. Therefore, given the comparable GF
displacement responses, a thicker grout closure pour that induces significant Δgrout would soften
the connection response. With reference to the loading type, Figure 4.13 presents a comparison
of the specimen responses with the same connection parameters but different load types.
Figure 4.13. Impact of cyclic loading
For the specimens with the exposed aggregate finish (i.e., EG1M and EG1C), no significant
cumulative damage was caused by the cyclic loading until the applied load was increased to 150
kips, which was approximately 50% of the peak strength. However, the cyclic loading caused
increased strength degradation for the specimens with deeper amplitude for the column surface
texture (i.e., F1G1M and F1G1C).
4.6.3. Force Transfer Behavior
Figure 4.14 presents the column longitudinal bar strains as a function of embedment depth in the
connection at various forces/CF displacements; missing data points are due to loss of data
resulting from damaged gauges.
0
50
100
150
200
250
300
350
0.0 0.1 0.2 0.3
Fo
rce
(kip
)
CG Disp. (in.)
F1G1M EG1M
F1G1C EG1C

33
F1G1M F2G1M
EG1M F2G2M
-9
-6
-3
0
0 400 800 1200
Dep
th (
in.)
Strain (µƐ)
50K 100K 140K
-9
-6
-3
0
0 400 800 1200
Dep
th (
in)
Strain (µƐ)
50K 100K 150K
200K 250K
-9
-6
-3
0
0 400 800 1200
Dep
th (
in)
Strain (µƐ)
50K 100K 150K
200K 250K 300K
-9
-6
-3
0
0 400 800 1200
Dep
th (
in)
Strain (µƐ)
50K 100K 150K200K 250K
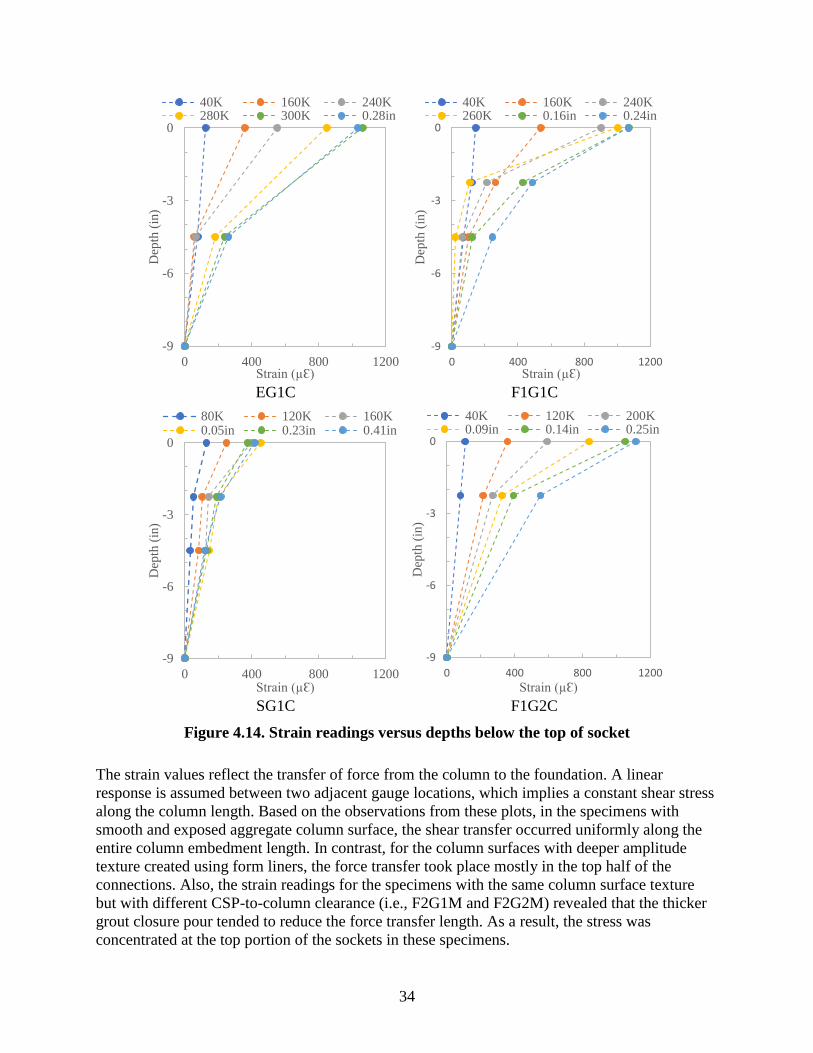
34
EG1C F1G1C
SG1C F1G2C
Figure 4.14. Strain readings versus depths below the top of socket
The strain values reflect the transfer of force from the column to the foundation. A linear
response is assumed between two adjacent gauge locations, which implies a constant shear stress
along the column length. Based on the observations from these plots, in the specimens with
smooth and exposed aggregate column surface, the shear transfer occurred uniformly along the
entire column embedment length. In contrast, for the column surfaces with deeper amplitude
texture created using form liners, the force transfer took place mostly in the top half of the
connections. Also, the strain readings for the specimens with the same column surface texture
but with different CSP-to-column clearance (i.e., F2G1M and F2G2M) revealed that the thicker
grout closure pour tended to reduce the force transfer length. As a result, the stress was
concentrated at the top portion of the sockets in these specimens.
-9
-6
-3
0
0 400 800 1200
Dep
th (
in)
Strain (µƐ)
40K 160K 240K280K 300K 0.28in
-9
-6
-3
0
0 400 800 1200
Dep
th (
in)
Strain (µƐ)
40K 160K 240K260K 0.16in 0.24in
-9
-6
-3
0
0 400 800 1200
Dep
th (
in)
Strain (µƐ)
80K 120K 160K0.05in 0.23in 0.41in
-9
-6
-3
0
0 400 800 1200
Dep
th (
in)
Strain (µƐ)
40K 120K 200K0.09in 0.14in 0.25in
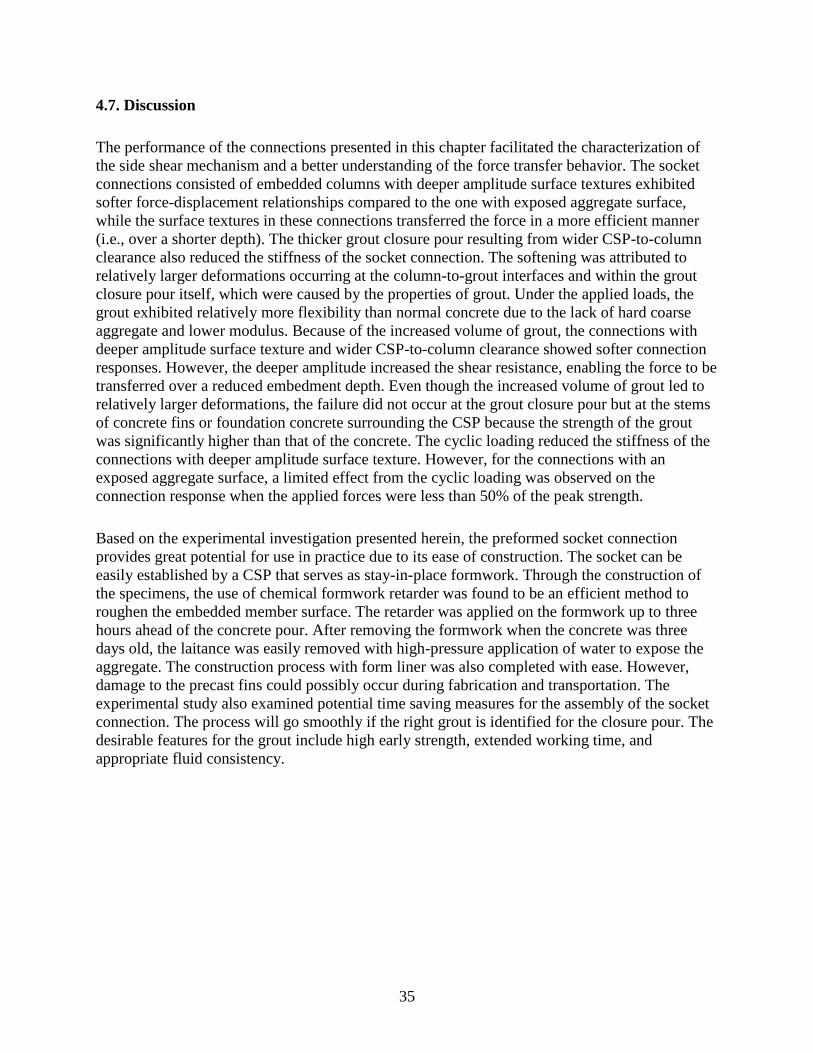
35
4.7. Discussion
The performance of the connections presented in this chapter facilitated the characterization of
the side shear mechanism and a better understanding of the force transfer behavior. The socket
connections consisted of embedded columns with deeper amplitude surface textures exhibited
softer force-displacement relationships compared to the one with exposed aggregate surface,
while the surface textures in these connections transferred the force in a more efficient manner
(i.e., over a shorter depth). The thicker grout closure pour resulting from wider CSP-to-column
clearance also reduced the stiffness of the socket connection. The softening was attributed to
relatively larger deformations occurring at the column-to-grout interfaces and within the grout
closure pour itself, which were caused by the properties of grout. Under the applied loads, the
grout exhibited relatively more flexibility than normal concrete due to the lack of hard coarse
aggregate and lower modulus. Because of the increased volume of grout, the connections with
deeper amplitude surface texture and wider CSP-to-column clearance showed softer connection
responses. However, the deeper amplitude increased the shear resistance, enabling the force to be
transferred over a reduced embedment depth. Even though the increased volume of grout led to
relatively larger deformations, the failure did not occur at the grout closure pour but at the stems
of concrete fins or foundation concrete surrounding the CSP because the strength of the grout
was significantly higher than that of the concrete. The cyclic loading reduced the stiffness of the
connections with deeper amplitude surface texture. However, for the connections with an
exposed aggregate surface, a limited effect from the cyclic loading was observed on the
connection response when the applied forces were less than 50% of the peak strength.
Based on the experimental investigation presented herein, the preformed socket connection
provides great potential for use in practice due to its ease of construction. The socket can be
easily established by a CSP that serves as stay-in-place formwork. Through the construction of
the specimens, the use of chemical formwork retarder was found to be an efficient method to
roughen the embedded member surface. The retarder was applied on the formwork up to three
hours ahead of the concrete pour. After removing the formwork when the concrete was three
days old, the laitance was easily removed with high-pressure application of water to expose the
aggregate. The construction process with form liner was also completed with ease. However,
damage to the precast fins could possibly occur during fabrication and transportation. The
experimental study also examined potential time saving measures for the assembly of the socket
connection. The process will go smoothly if the right grout is identified for the closure pour. The
desirable features for the grout include high early strength, extended working time, and
appropriate fluid consistency.
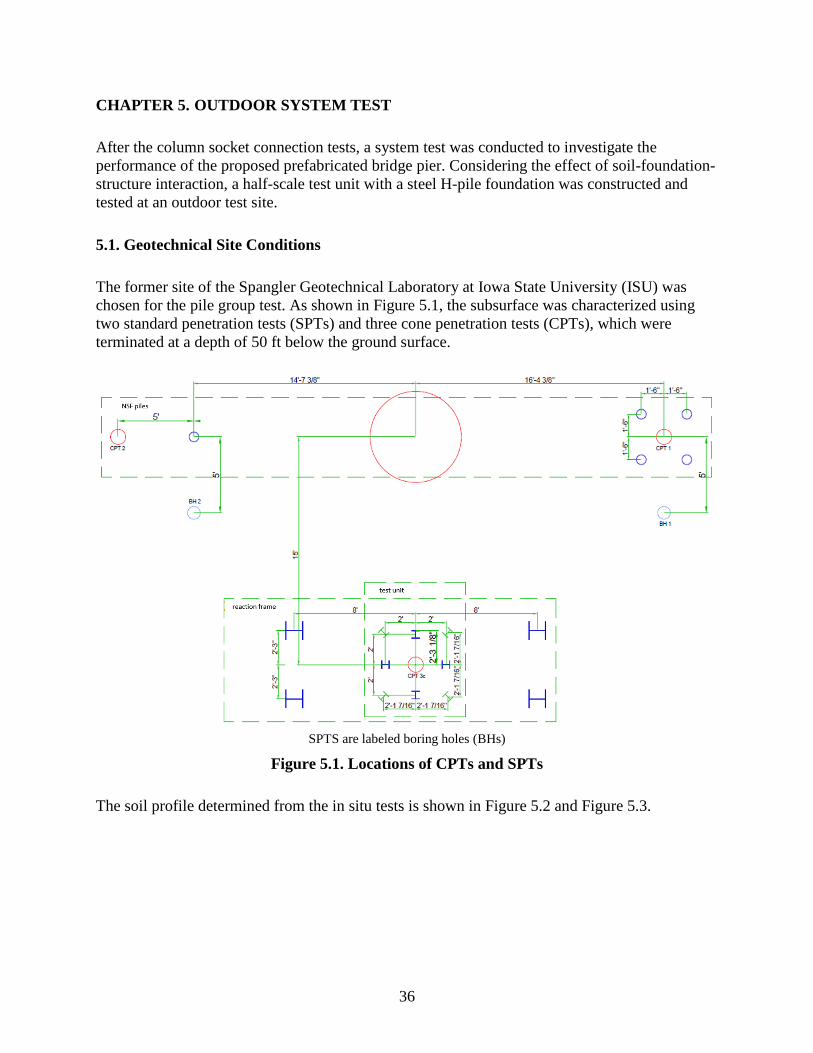
36
CHAPTER 5. OUTDOOR SYSTEM TEST
After the column socket connection tests, a system test was conducted to investigate the
performance of the proposed prefabricated bridge pier. Considering the effect of soil-foundation-
structure interaction, a half-scale test unit with a steel H-pile foundation was constructed and
tested at an outdoor test site.
5.1. Geotechnical Site Conditions
The former site of the Spangler Geotechnical Laboratory at Iowa State University (ISU) was
chosen for the pile group test. As shown in Figure 5.1, the subsurface was characterized using
two standard penetration tests (SPTs) and three cone penetration tests (CPTs), which were
terminated at a depth of 50 ft below the ground surface.
SPTS are labeled boring holes (BHs)
Figure 5.1. Locations of CPTs and SPTs
The soil profile determined from the in situ tests is shown in Figure 5.2 and Figure 5.3.

37

38

39
Figure 5.2. CPT logs for the test site
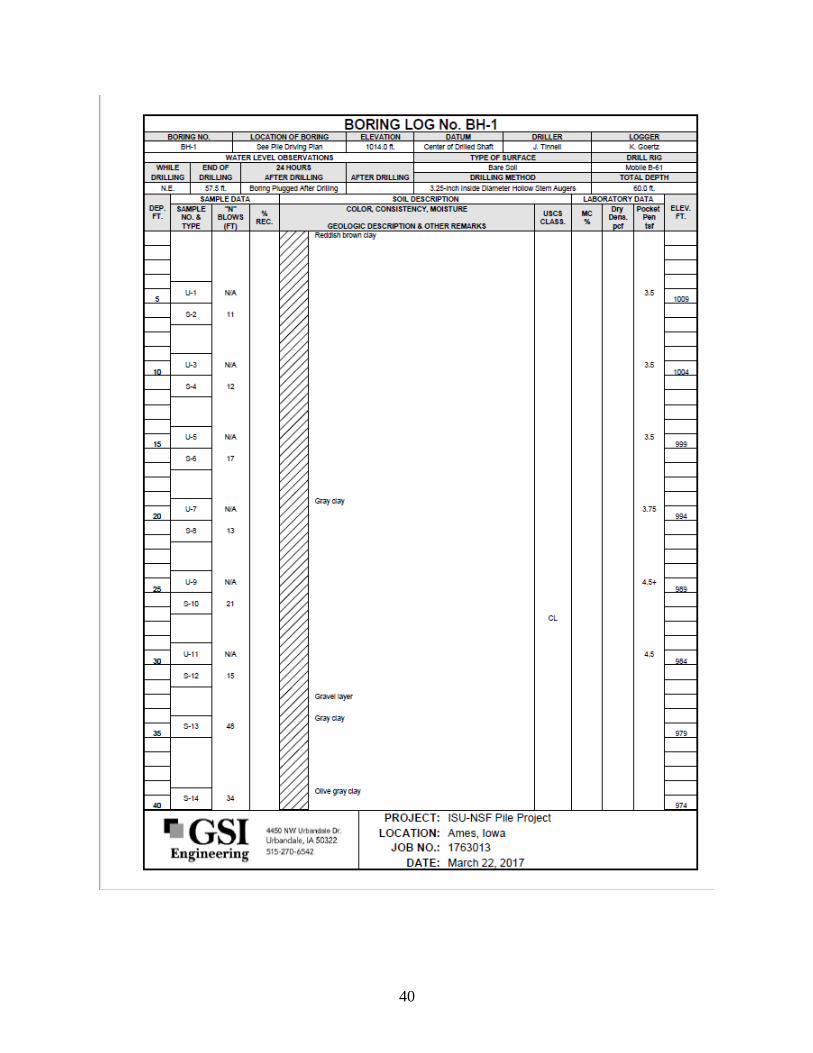
40

41

42

43
Figure 5.3. SPT boring logs

44
It was found that the soil at the test site was primarily composed of stiff clays, with a 5 ft thick
sand layer at a depth of approximately 35 ft. At the time of testing, the groundwater table was at
a depth of approximately 7.5 ft.
5.2. Test Unit Design
A half-scale test unit was designed to represent the precast pier column, the precast pile cap, and
the pile foundation in a prototype bridge because of the great reduction in loading magnitudes
and construction costs. The prototype bridge was selected to be a three-span pretensioned
prestressed concrete beam (PPCB) bridge that was comparable to one in Linn County, Iowa
(BRIDGE NEW – PPCB E.B. IA 100 OVER 16TH AVE. ACCESS IN CITY OF CEDAR
RAPIDS on preliminary design drawing). The frame pier of the prototype bridge incorporates a
precast pier cap and two precast pier columns. Each pier column is supported by steel driven pile
foundation with a precast pile cap, as shown in Figure 5.4.
Figure 5.4. Frame pier of the prototype bridge
Since the test unit modeled only a portion of the prototype pier, only the column, the pile cap,
and piles were designed in detail. Further information regarding the design are discussed
throughout this chapter.
The design stress for the materials used in the prototype bridge were in accordance with the
AASHTO LRFD Bridge Design Specifications (2017). They were a 28 day compressive strength
of 4.0 ksi for concrete, Grade 60 for the reinforcing bar, and Grade 50 for the structural steel.
Because of the similarity between the prototype bridge and the bridge in Linn County, the
column size and longitudinal reinforcement of the prototype bridge were designed to be the same
as those of the Linn County bridge. The transverse reinforcement was arranged following the

45
guidelines for column confinement. The design loading requirements for the piles and the pile
cap were determined at the specified limit states, including a strength limit state and a limit state
that resulted from the full development of the column flexural capacity, hereafter referred to as
the column capacity limit state. The strength limit state was identified to ensure that strength and
stability were provided to resist the specified statistically significant load combinations during
the design life, and the column capacity limit state was identified to fully exercise the
connections within the column/pile cap/pile system. The strength limit states for the prototype
bridge were taken as those for the bridge in Linn County. Through moment curvature analysis,
the column moment capacity was calculated for determining the loading requirements at the
column capacity limit state. By comparing the loading requirements resulting from each limit
state, the column capacity limit state that produced the most critical load case governed the
design of the piles and the pile cap. Two assumptions were made in the analysis of pile reactions
including (1) the pile cap is rigid, and (2) the moment at the pile-to-cap connection can be
ignored due to a very small lateral movement of pile cap. These assumptions resulted in a linear
distribution of pile forces. Hence, for the given layout, the pile reactions at the column hinge
limit state were calculated.
The design of the piles, the pile cap, and the socket connections was based on the AASHTO
LRFD Bridge Design Specifications (2017), the Iowa DOT’s LRFD Bridge Design Manual
(2018), and related research articles. In accordance with the structural check with the
recommendations of Structural Resistance Level 1 (SRL-1), the piles were selected to be Grade
50 HP 14×73 for the maximum pile reaction. The corner piles were battered at a 1:6 horizontal to
vertical slope to laterally stabilize the pile cap. The design of the pile cap followed the present
Iowa DOT design practice. The design guidelines required a minimum distance of 1.5 ft between
pile centerline and footing edge, which resulted in the pile cap size of 12 ft × 12 ft. Given a
typical pile cap thickness of 4 ft, the reinforcements were designed with respect to bending, one-
way shear, and the reinforcement detailing requirements. In addition, the capacity of the two-way
shear (punching shear) was checked individually for corner piles. The column socket and the pile
sockets on the pile cap were created using CSPs. A 42 in. diameter CSP was chosen for reserving
the column socket, which was the slenderest commercially available pipe fitting the 3 ft column.
In light of the findings from the socket connection tests and previous related experimental
research, the embedment length of the column was chosen to be 1.0 times the column diameter.
Combining the product tolerance for the precast column length, the depth of the column socket
was designed to be 37.5 in. The column transverse reinforcement was extended to the portion of
the column that would be inserted into the socket. The side surface of this embedded portion was
roughened by using a chemical formwork retarder, in accordance with the recommendations
from the socket connection tests. For constructing the pile sockets, a 30 in. diameter CSP was
selected to fit the geometry of the battered piles. As per the Iowa DOT practice, the piles were
embedded 1.5 ft into the pile sockets.
The half-scale test unit was designed by appropriately scaling the prototype structure. Given the
same materials were used in the test unit and the prototype system, the stresses in the test unit
and in the prototype need to be identical to represent the prototype behavior. Thus, all
dimensions of the test unit were scaled to half of the prototype pier, and the reinforcements in the
test unit were arranged to keep a comparable reinforcement ratio with the prototype. A complete
set of drawings for the test unit is provided in the Appendix. The column of the test unit was

46
scaled to be 1.5 ft in diameter with fourteen #5 longitudinal reinforcing bars, resulting in a
longitudinal reinforcement ratio of 1.7%. The column critical region was designed to form
plastic flexural capacity. This required #3 reinforcing spiral transverse reinforcement at 3 in.
spacing (i.e., a transverse reinforcement ratio of 0.88%) near the column base. Since the column
was relatively short, this reinforcement detail was used throughout the column height. The height
of the column was chosen to be 7 ft, which resulted in a flexure-critical column with a
height/depth ratio of 4.67. A socket embedment length of 1.5 ft was added to the column length,
which increased the total design length of the column to 8.5 ft. For the purpose of applying
vertical and lateral loads, a 3.5 ft × 3.5 ft × 2 ft loading block was added at the top of the column.
The column and the block were integrated by extending the column longitudinal and transverse
reinforcements into the block. Horizontal and vertical holes were reserved through the block for
attaching the loading devices. Scaling of the HP 14×73 piles resulted in W 6×20 piles for the test
unit. For conservativeness, only the unit friction of 1.6 kip/ft, which resulted from scaling the
Iowa DOT-recommended design value for HP 14×73 in firm silty glacial clay, was used to
estimate the pile nominal geotechnical resistance. The resistance factor was chosen as 0.6 since
the Iowa DOT Engineering News-Record (ENR) formula was used. Therefore, the length of
piles was determined to be 50 ft to provide adequate geotechnical resistance for the maximum
pile reaction. The pile cap of the test unit was scaled to be 6 ft × 6 ft × 2 ft. The bottom-layer and
the top-layer reinforcements in each axis were composed of fourteen and twelve #4 reinforcing
bars, respectively. The pile cap reinforcements also included the full lapped stirrups with 180°
hooks on their ends.
5.3. Test Unit Construction
The test unit used for the system test consisted of a precast column with a loading block at its
top, a precast pile cap, and eight W 6×20 as the steel driven pile foundation. The column and the
pile cap were constructed in the ISU Structural Engineering Research Laboratory. The
reinforcing cage for the loading block was first fabricated on the base formwork. The column
reinforcing cage was fabricated on the ground, and then erected into the loading block cage, as
shown in Figure 5.5 left.
Figure 5.5. Column reinforcing cage (left) and joint reinforcing bars (right)

47
The joint reinforcing bars (Figure 5.5 right) were added through the column cage to integrally
connect the loading block and the column. The polyvinyl chloride (PVC) pipes were
immobilized by stitching wires and circular plywood plugs that were screwed on the formwork.
These pipes reserved holes through the loading block for attaching loading devices. After casting
the loading block, the column formwork was built by means of concrete tube form. In order to
create the exposed aggregate surface on the end portion of the column, formwork retarder was
applied on the tube form interior surface prior to placing concrete. However, due to the narrow
spacing between the reinforcing cage and the tube form, it was difficult to apply retarder once
the tube form was installed in place. Hence, the column formwork was built in two segments. A
6 ft long segment (Segment I), which was for the portion of the column without exposed
aggregate surface, was erected on the loading block and braced with a temporary 2 in. by 4 in.
falsework. Two layers of plywood ring were screwed on the loading block, and the base of
Segment I was inserted into the rings for fixing and sealing purposes. A 1.5 ft long segment
(Segment II) was utilized for the portion with exposed aggregate surface. A coating of retarder
was applied on the interior surface of this segment 1.5 hours before placing concrete, and
Segment II was then spliced to Segment I using a sleeve made of thin rubber sheet, as shown in
Figure 5.6.
Figure 5.6. Formwork for column
The tube form was removed three days after placing concrete. The exposed aggregate surface at
the column end was finished by power washing. Figure 5.7 shows the completed precast column
with a close view of the exposed aggregate surface.
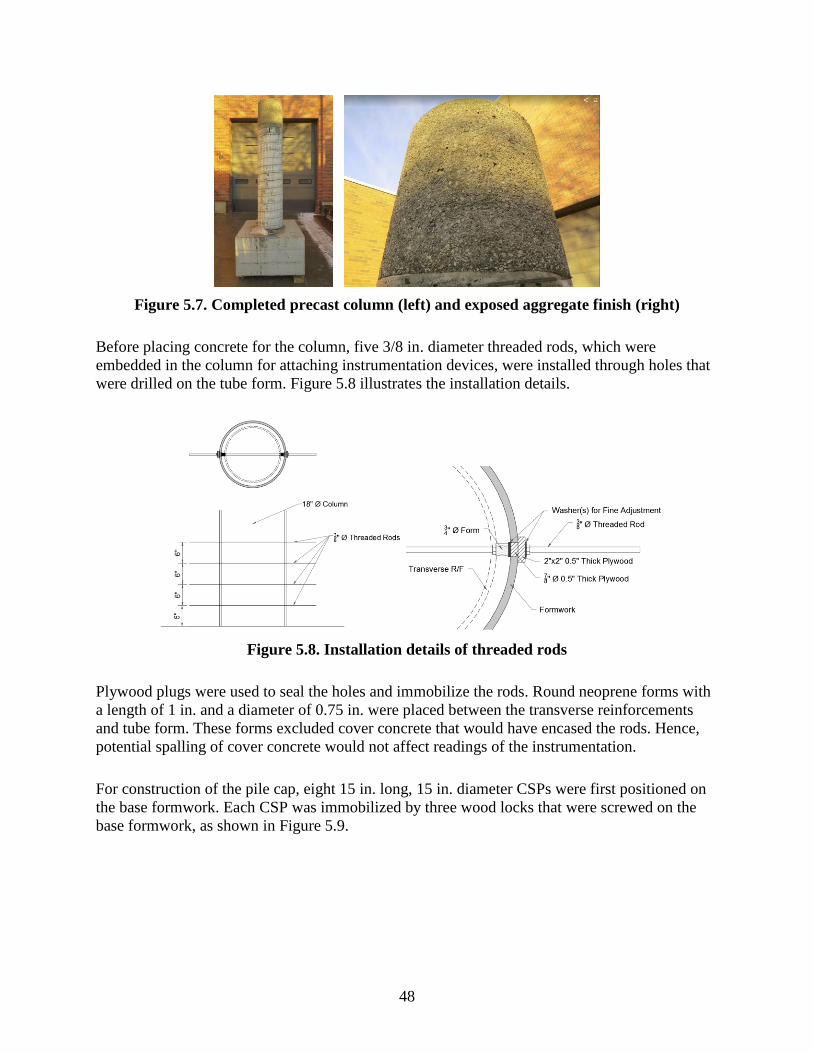
48
Figure 5.7. Completed precast column (left) and exposed aggregate finish (right)
Before placing concrete for the column, five 3/8 in. diameter threaded rods, which were
embedded in the column for attaching instrumentation devices, were installed through holes that
were drilled on the tube form. Figure 5.8 illustrates the installation details.
Figure 5.8. Installation details of threaded rods
Plywood plugs were used to seal the holes and immobilize the rods. Round neoprene forms with
a length of 1 in. and a diameter of 0.75 in. were placed between the transverse reinforcements
and tube form. These forms excluded cover concrete that would have encased the rods. Hence,
potential spalling of cover concrete would not affect readings of the instrumentation.
For construction of the pile cap, eight 15 in. long, 15 in. diameter CSPs were first positioned on
the base formwork. Each CSP was immobilized by three wood locks that were screwed on the
base formwork, as shown in Figure 5.9.

49
Figure 5.9. CSPs and wood locks
The prefabricated reinforcing cage was then placed around the CSPs. Two types of custom pipe
reducer (non-reusable and reusable) were manufactured by a local metal fabricator. Five non-
reusable reducers with oversized diameter (Figure 5.10 left) were placed on the top of the pile
CSPs.
Figure 5.10. Non-reusable reducer (left), 2 in. × 4 in. reducer supports (center), and
reusable reducer (right)
Three reusable reducers with shrunken diameter were placed inside the pile CSPs and
temporarily supported by 2 in. × 4 in. wood beams, as shown in Figure 5.10 center and Figure
5.10 right. The gaps between the CSPs and the reducers were sealed using GREAT STUFF Gaps
& Cracks foam sealant. After fabricating the reinforcing bars beside the reducers, the side
formworks were assembled. A 1 ft 8 in. long, 21 in. diameter CSP for creating the column socket
was hanged on the crossing beam that was clamped on the side formwork. The bottom of the
CSP was closed by a round plywood with a size slightly less than the inside diameter of the CSP,
as shown in Figure 5.11, such that the plywood could be taken out through the CSP.
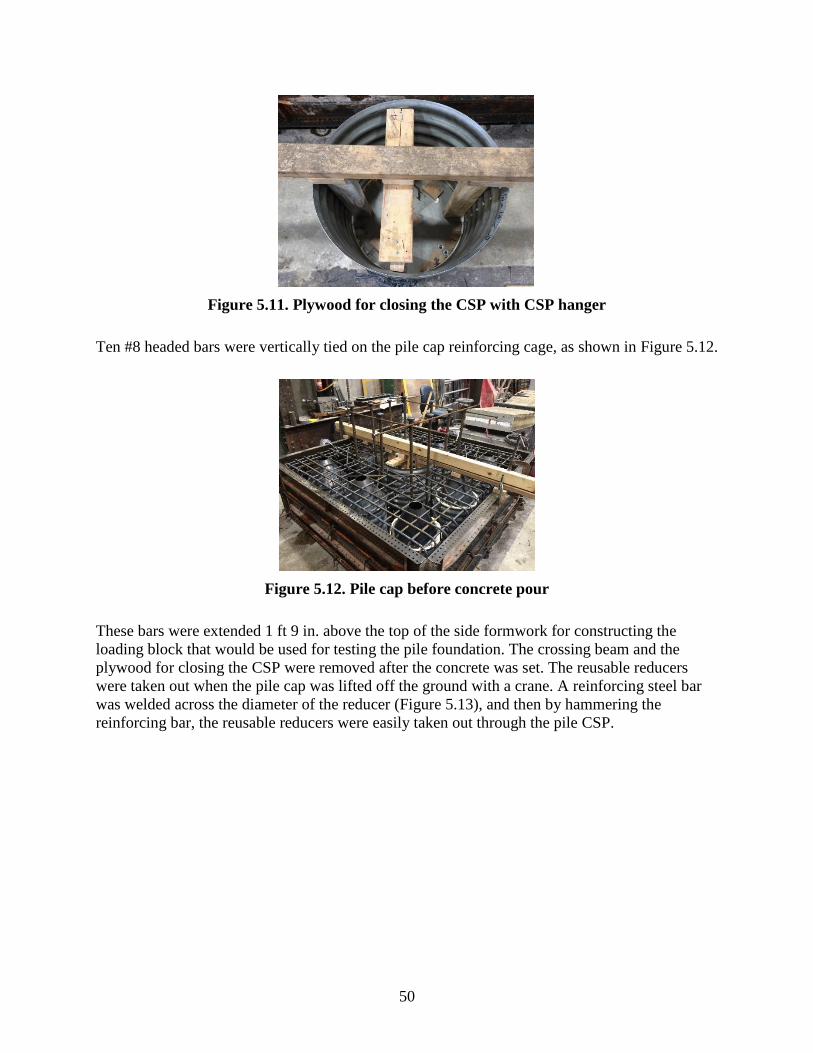
50
Figure 5.11. Plywood for closing the CSP with CSP hanger
Ten #8 headed bars were vertically tied on the pile cap reinforcing cage, as shown in Figure 5.12.
Figure 5.12. Pile cap before concrete pour
These bars were extended 1 ft 9 in. above the top of the side formwork for constructing the
loading block that would be used for testing the pile foundation. The crossing beam and the
plywood for closing the CSP were removed after the concrete was set. The reusable reducers
were taken out when the pile cap was lifted off the ground with a crane. A reinforcing steel bar
was welded across the diameter of the reducer (Figure 5.13), and then by hammering the
reinforcing bar, the reusable reducers were easily taken out through the pile CSP.
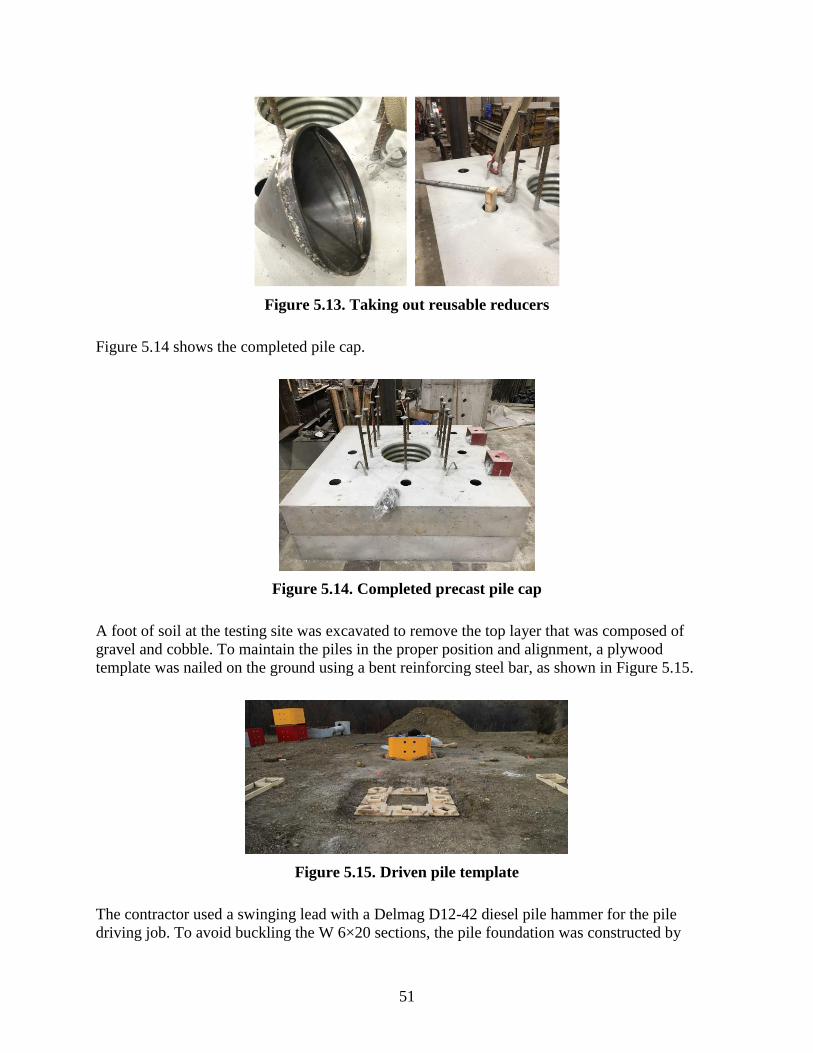
51
Figure 5.13. Taking out reusable reducers
Figure 5.14 shows the completed pile cap.
Figure 5.14. Completed precast pile cap
A foot of soil at the testing site was excavated to remove the top layer that was composed of
gravel and cobble. To maintain the piles in the proper position and alignment, a plywood
template was nailed on the ground using a bent reinforcing steel bar, as shown in Figure 5.15.
Figure 5.15. Driven pile template
The contractor used a swinging lead with a Delmag D12-42 diesel pile hammer for the pile
driving job. To avoid buckling the W 6×20 sections, the pile foundation was constructed by

52
splicing two short pile sections together. The 31 ft long pile sections were driven first, and the
top foot was cut if driving damage appeared on the top of piles. Since no damage eventually
occurred, the contractor decided to leave the top foot. After the 29 ft long sections were weld-
spliced to the 31 ft long sections by an Iowa DOT-certified welder, as shown in Figure 5.16, the
piles were driven 51 ft deep such that the preinstalled instrumentation would be located at the
specified depth.
Figure 5.16. Weld-splicing piles
The extra length was cut off, and all piles were trimmed to a horizontal line above the ground.
After driving the piles, friction collars were installed on each pile as shown in Figure 5.17.
Figure 5.17. Friction collars and plywood seal-pads
The position of each friction collar was adjusted to levelly support the pile cap. Plywood seal-
pads with voids that fit the outline of the piles were placed on the friction collars for sealing the
pile sockets. To facilitate removal, the seal-pads were made of two pieces and screwed together.
The pile sockets in the cap mostly fit over the driven piles, except one corner battered pile. Due
to the damage on the plywood template that occurred at the end of pile driving process, one
corner pile was driven with an offset of about 0.5 in. To eliminate this offset, a chain was tightly
attached to the pile in question, and the pile was pulled into the specified position using a loader.
After adjustment, the precast pile cap was successfully placed on the friction collars.

53
After cleaning surface laitance in the column socket, the precast column was erected on the pile
cap. Four stainless steel nuts, as shown in Figure 5.18, were placed in the socket to shim the
column and to create a grout pad underneath the column.
Figure 5.18. Nut shimmers underneath column (left) and temporary column bracing (right)
The column was temporarily braced with chains, and the column plumb was achieved by
adjusting the attached ratcheting binders, as shown in Figure 5.18.
The column socket and the pile sockets were then filled with Rapid Set ULTRAFLOW 4000/8
grout and SCC, respectively, to complete the test unit construction. The grout was poured at one
spot and allowed to flow around the column to prevent air void in the grout closure pour, as
shown in Figure 5.19.
Figure 5.19. Grout pouring
As the product datasheet suggested, the grout was immediately covered with a wet rag and tarp
after pouring to avoid shrinkage cracking. The column bracing was removed 10 hours after the
grout pour when the grout compressive strength reached 5,231 psi. After the SCC in the pile
sockets reached a compressive strength of 4,614 psi 7 days after the concrete pour, the friction
collars were taken off. The completed test unit is shown in Figure 5.20.

54
Figure 5.20. Completed test unit
5.4. Test Setup
A vertical reaction frame and a lateral reaction column were constructed to load the test unit
vertically and laterally, respectively. The vertical reaction frame, as shown in Figure 5.21, was
composed of four HP 14×73 anchor piles, a main reaction beam, four hollow hydraulic cylinders,
and miscellaneous attachments.
Figure 5.21. Vertical reaction frame
The anchor piles were driven 50 ft deep below ground surface with 9 ft 3 in. left above the
ground. The attachments were then bolted on the anchor piles, followed by placement of the
main reaction beam (Figure 5.22).

55
Figure 5.22. Placing main reaction beam
As shown in Figure 5.23, a friction pendulum bearing was installed between the top of the
column loading block and the main reaction beam.
Figure 5.23. Single friction pendulum isolator between column and reaction beam
This bearing was used to transfer the vertical loads from the main reaction beam to the column
with minimal friction against the lateral load, while allowing translation and rotation of the
column. The hydraulic cylinders pushed the main reaction beam down as they were pressured,
thereby generating gravity effects on the column while subjecting the anchor piles to tension.
The lateral reaction column, as shown in Figure 5.24, was composed of five precast segments
and a drilled shaft foundation.

56
Figure 5.24. Lateral reaction column
The segments and the shaft were connected using four 1.75 in. diameter 150 ksi Williams post-
tensioned (PT) rods. As shown in Figure 5.25, a 2 ft × 2 ft squared void with fillet corners was
created in each segment in order to minimize weight and to facilitate handling and transportation.
Figure 5.25. Precast column segment
Next to the four vertical holes that were reserved for PT rods, horizontal hole patterns were
created on the side faces of each segment to attach an actuator at different heights for different
testing phases. Shear keys were provided between the segments. To ensure desired contact
between the segments, the segments were match-cast one on top of the other, as shown in Figure
5.25. In the top segment, additional reinforcing hoops were added in the corners to enhance the
post-tension anchorage zone. As shown in Figure 5.26, the drilled shaft foundation was 45 ft
deep and was reinforced by twenty-six Grade 60 #11 bars.
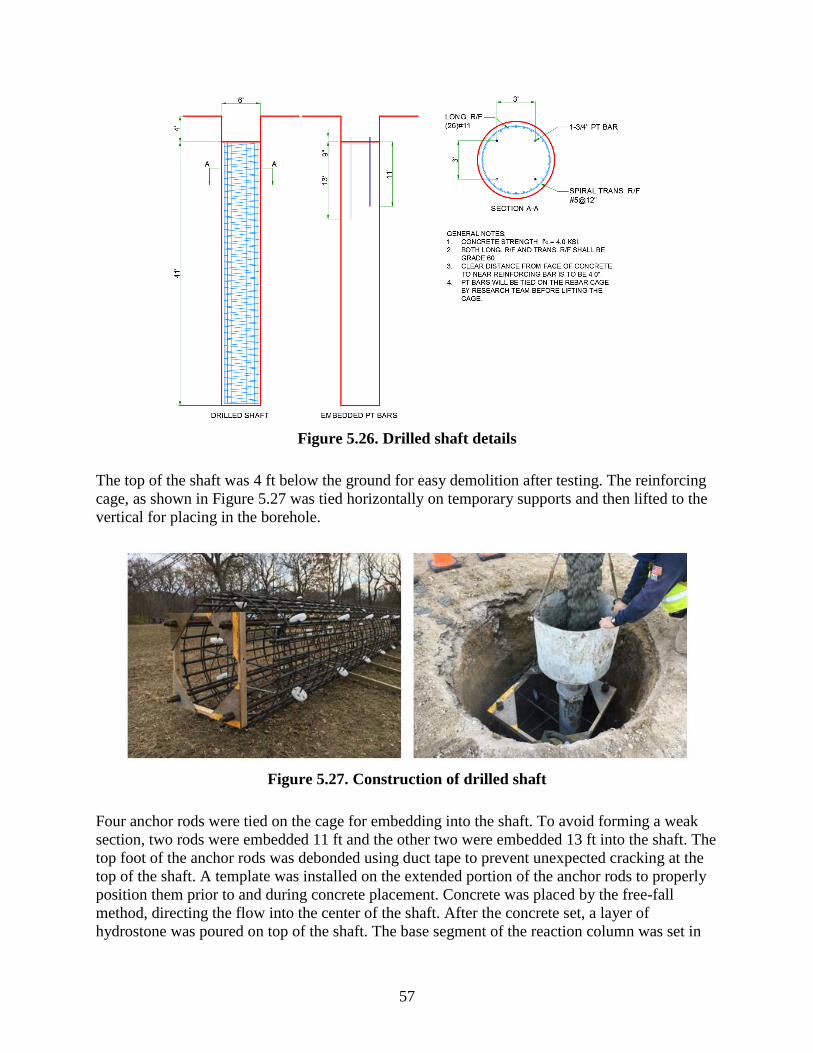
57
Figure 5.26. Drilled shaft details
The top of the shaft was 4 ft below the ground for easy demolition after testing. The reinforcing
cage, as shown in Figure 5.27 was tied horizontally on temporary supports and then lifted to the
vertical for placing in the borehole.
Figure 5.27. Construction of drilled shaft
Four anchor rods were tied on the cage for embedding into the shaft. To avoid forming a weak
section, two rods were embedded 11 ft and the other two were embedded 13 ft into the shaft. The
top foot of the anchor rods was debonded using duct tape to prevent unexpected cracking at the
top of the shaft. A template was installed on the extended portion of the anchor rods to properly
position them prior to and during concrete placement. Concrete was placed by the free-fall
method, directing the flow into the center of the shaft. After the concrete set, a layer of
hydrostone was poured on top of the shaft. The base segment of the reaction column was set in

58
place prior to hardening of the hydrostone to ensure the desired contact. The post-tensioned rods
were connected to the anchor rods using rod couplers. Following the erection of all precast
column segments, construction of the lateral reaction column was finished by post-tensioning the
rods to the specified force of 200 kips. As shown in Figure 5.28, a hydraulic actuator controlled
by an electric servo pump was laterally attached to the reaction column to apply lateral force on
the test unit.
Figure 5.28. Lateral actuator attached on reaction column
As seen in Figure 5.24, the actuator was positioned at two different heights for applying the
lateral load at either 7 ft or 1 ft above the top of the pile cap in the different test phases.
5.5. Load Protocol
The system test of the column-pile cap-pile system consisted of six phases. Each phase applied a
combination of vertical and lateral load. In each phase, positive (push) and negative (pull) lateral
loads were gradually increased in multiple levels up to the target maximum amplitude, with three
full cycles at each loading level. The peak load was held constant for about 5 minutes in the first
cycle of each loading level. In some levels, this load-holding period was longer to enable
inspection of the pile group and documentation of observations.
As shown in Figure 5.29, for Phase I and Phase II, the vertical load was targeted at 250 kips and
100 kips, corresponding to the column axial load ratio of 0.25 and 0.1, respectively.
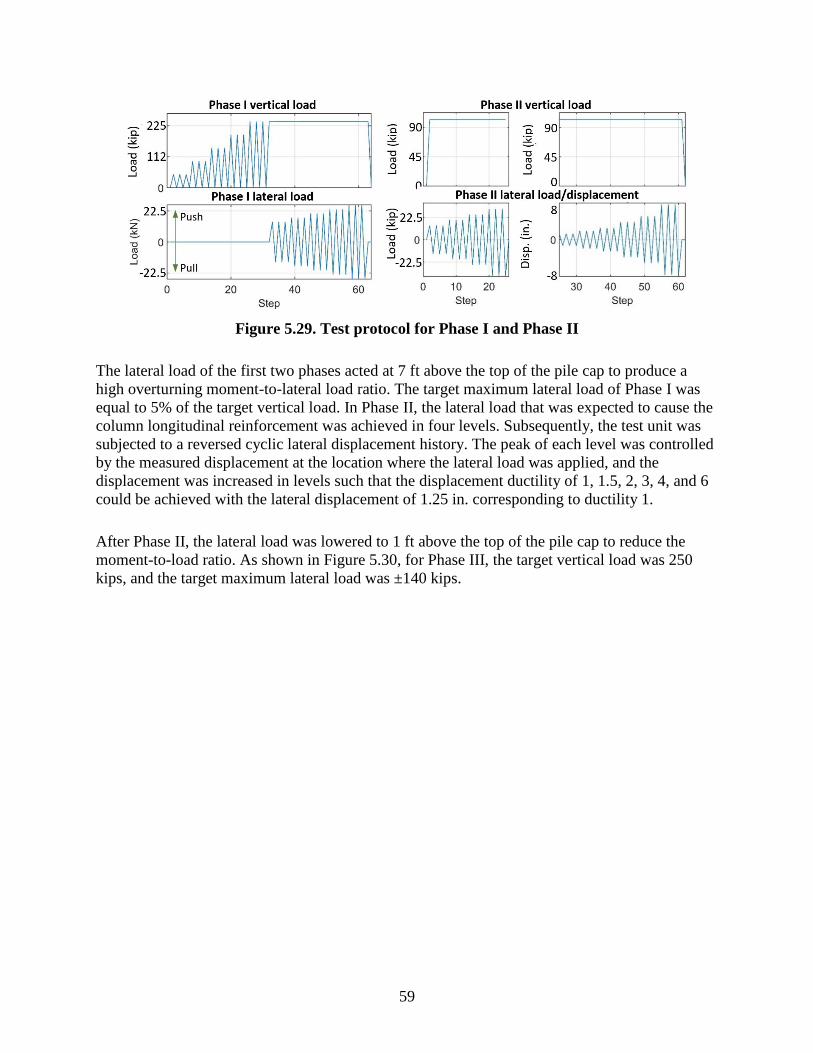
59
Figure 5.29. Test protocol for Phase I and Phase II
The lateral load of the first two phases acted at 7 ft above the top of the pile cap to produce a
high overturning moment-to-lateral load ratio. The target maximum lateral load of Phase I was
equal to 5% of the target vertical load. In Phase II, the lateral load that was expected to cause the
column longitudinal reinforcement was achieved in four levels. Subsequently, the test unit was
subjected to a reversed cyclic lateral displacement history. The peak of each level was controlled
by the measured displacement at the location where the lateral load was applied, and the
displacement was increased in levels such that the displacement ductility of 1, 1.5, 2, 3, 4, and 6
could be achieved with the lateral displacement of 1.25 in. corresponding to ductility 1.
After Phase II, the lateral load was lowered to 1 ft above the top of the pile cap to reduce the
moment-to-load ratio. As shown in Figure 5.30, for Phase III, the target vertical load was 250
kips, and the target maximum lateral load was ±140 kips.

60
Figure 5.30. Loading protocol for test Phases III through VI
For Phase IV, the target vertical load was reduced to 100 kips, and the target maximum lateral
load was 220 kips. However, the applied negative lateral load was limited by the actuator
capacity and therefore only achieved an amplitude of -150 kips. Phase V and Phase VI were
conducted to examine the pile group and the pile connections under extreme loading conditions.
The target vertical load for Phase V was 250 kips, and was reduced to 0 kips in Phase VI. The
maximum applied lateral loads for Phase V and Phase VI were 225 kips and -150 kips,
respectively.
5.6. Instrumentation
The exterior instrumentation included calibrated load cells and displacement transducers
mounted to the column, pile cap, and piles. In addition, the test unit was heavily instrumented
with over 130 strain gauges attached to the reinforcements and piles. Data from the instruments
were collected using acquisition systems at a recording frequency of 5 Hz.
Figure 5.31 through Figure 5.35 show the plan view of the strain gauges in the precast column
and the precast pile cap.

61
Figure 5.31. Strain gauges on column reinforcements
Figure 5.32. Strain gauges on CSPs of column socket and pile sockets

62
Figure 5.33. Strain gauges on pile cap reinforcements

63
Figure 5.34. Strain gauges on embedded piles
Figure 5.35. Strain gauges on the piles driven into ground

64
These strain gauges were attached to the selected longitudinal and transverse reinforcements in
the column, CSPs of the column socket and the pile sockets, flexural reinforcements, diagonal
headed bars, and vertical stirrups in the pile cap. The selected steel H-piles were also
instrumented with strain gauges that were attached on the portions embedded in the sockets and
the portions driven into the ground.
As shown in Figure 5.36, Bridge Diagnostics Inc. (BDI) strain transducers were installed on the
selected H-piles.
Figure 5.36. Layout and location of BDI strain transducers
These transducers were placed 2 in. below the base of the pile cap. The displacements of the test
unit were extensively measured using string pots, linear variable differential transformers
(LVDTs), a clinometer, and a Northern Digital Inc. (NDI) optical measurement system. Figure
5.37 and Figure 5.38 present the plan view of these displacement transducers.

65
Figure 5.37. Layout of displacement transducers
Figure 5.38. Layout of markers for NDI optical measurement system
5.7. Test Results
To aid in the description and discussion of the test unit, the lateral load orientation is defined as
follows: the push direction is away from the lateral reaction column, and the pull direction is
toward the lateral reaction column. The pile nomenclature and the pile cap orientation are
defined as shown in Figure 5.39.

66
Figure 5.39. Pile nomenclature
5.7.1. Observations
In Phase I, no cracking or any other damage was observed on column. Due to about 0.75 in.
eccentricity of the vertical load resulting from construction tolerance, the column displaced
toward the push direction with increase in vertical loads. However, under the full vertical load of
250 kips, the lateral displacement of the column at the height of the horizontal actuator, hereafter
referred to as the column top displacement, was negligible. Under the cyclic lateral loads of
Phase I, the column top displacement did not exceed 0.48 in. (Figure 5.40 left).
Figure 5.40. Column drift at the end of Phase I (left) and Phase II (right)
During Phase II, the column experienced displacement up to 7.5 in. at the height of the
horizontal actuator, as shown on the right in Figure 5.40. The primary damage occurred at the
base of the column as intended. Flexural cracks began to develop at the column base when the
applied lateral loads reached 25.2 kips. Cracking continued to develop over the lower 36 in. of
the column as testing progressed and the column lateral displacement was progressively
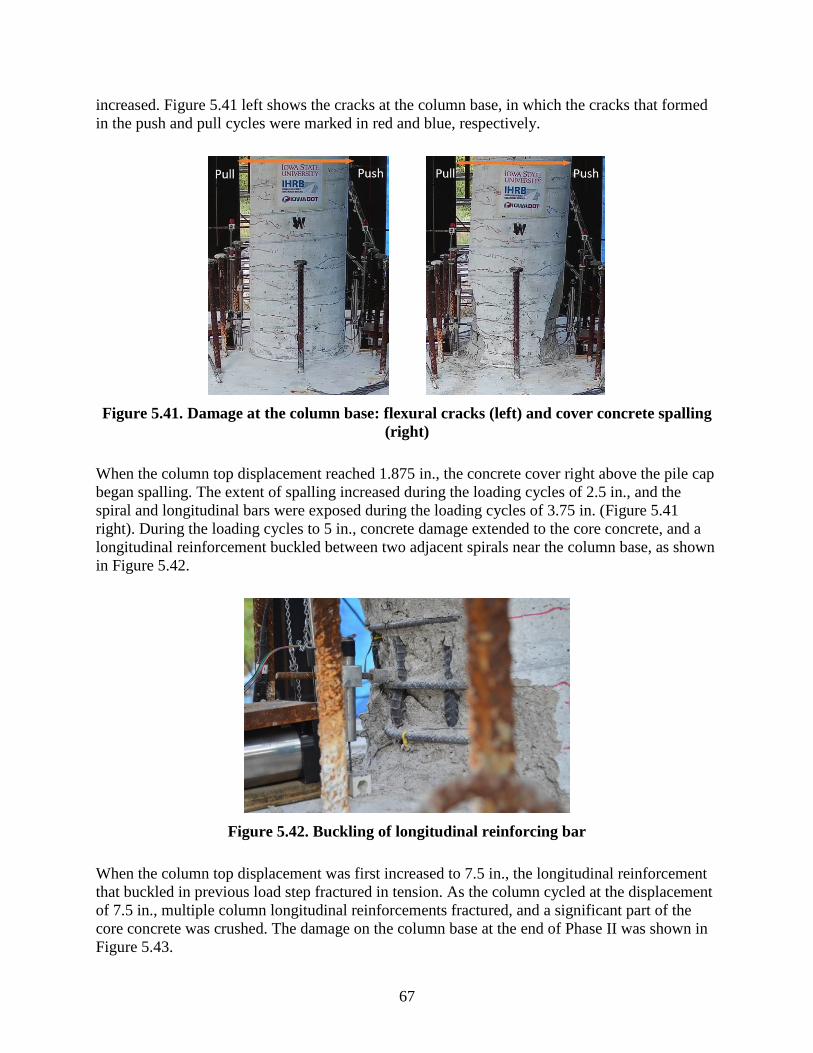
67
increased. Figure 5.41 left shows the cracks at the column base, in which the cracks that formed
in the push and pull cycles were marked in red and blue, respectively.
Figure 5.41. Damage at the column base: flexural cracks (left) and cover concrete spalling
(right)
When the column top displacement reached 1.875 in., the concrete cover right above the pile cap
began spalling. The extent of spalling increased during the loading cycles of 2.5 in., and the
spiral and longitudinal bars were exposed during the loading cycles of 3.75 in. (Figure 5.41
right). During the loading cycles to 5 in., concrete damage extended to the core concrete, and a
longitudinal reinforcement buckled between two adjacent spirals near the column base, as shown
in Figure 5.42.
Figure 5.42. Buckling of longitudinal reinforcing bar
When the column top displacement was first increased to 7.5 in., the longitudinal reinforcement
that buckled in previous load step fractured in tension. As the column cycled at the displacement
of 7.5 in., multiple column longitudinal reinforcements fractured, and a significant part of the
core concrete was crushed. The damage on the column base at the end of Phase II was shown in
Figure 5.43.

68
Figure 5.43. Column base at the end of Phase II
At the end of Phase I, no damage was observed on any of the column-to-pile cap connection or
the pile-to-pile cap connections, as shown in Figure 5.44.
Figure 5.44. No damage on column connection (left) and pile connection at the end of
Phase I, (right)
In Phase II, a circular crack, as shown on the left in Figure 5.45, appeared at the interface
between the column and the grout closure pour under the applied lateral load of 25.2 kips, and
afterward this crack progressed around the column (Figure 5.45 right).
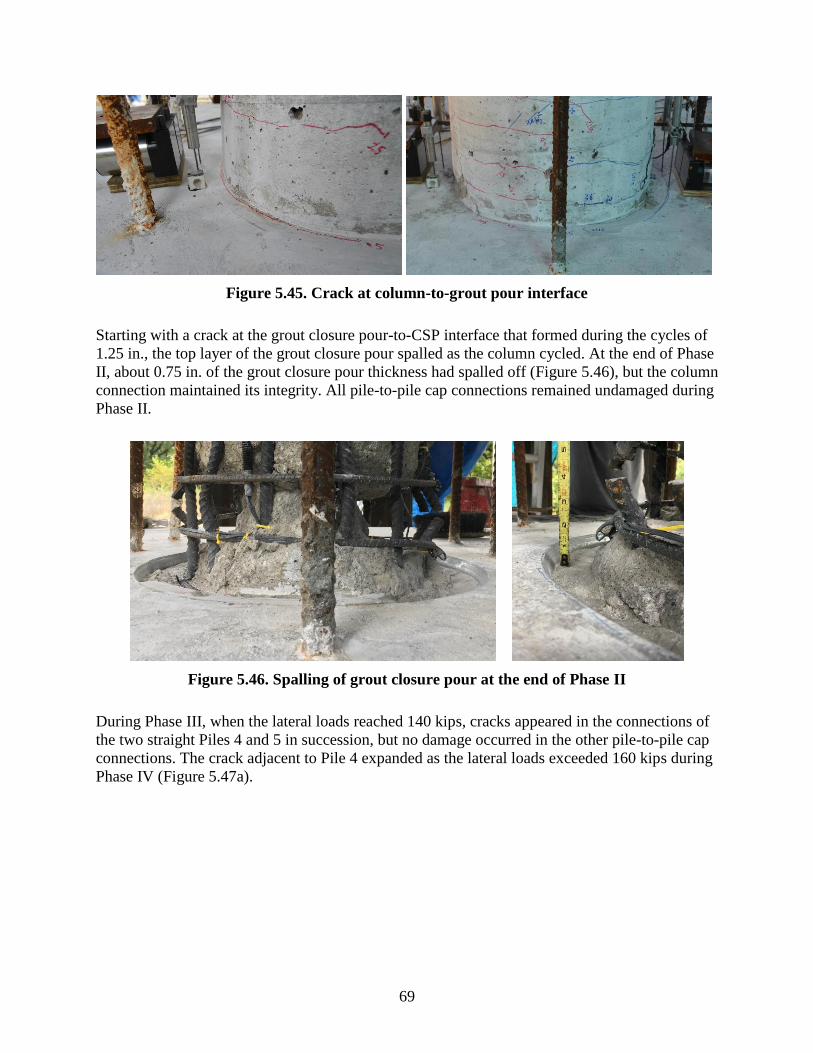
69
Figure 5.45. Crack at column-to-grout pour interface
Starting with a crack at the grout closure pour-to-CSP interface that formed during the cycles of
1.25 in., the top layer of the grout closure pour spalled as the column cycled. At the end of Phase
II, about 0.75 in. of the grout closure pour thickness had spalled off (Figure 5.46), but the column
connection maintained its integrity. All pile-to-pile cap connections remained undamaged during
Phase II.
Figure 5.46. Spalling of grout closure pour at the end of Phase II
During Phase III, when the lateral loads reached 140 kips, cracks appeared in the connections of
the two straight Piles 4 and 5 in succession, but no damage occurred in the other pile-to-pile cap
connections. The crack adjacent to Pile 4 expanded as the lateral loads exceeded 160 kips during
Phase IV (Figure 5.47a).

70
(a) (b) (c)
(d) (e) (f)
Figure 5.47. Observations of the piles and their connections
Under the maximum lateral load applied during Phase IV, yielding was visible on the flanges of
Piles 2 and 7 (Figure 5.47b), and battered Piles 3 and 8 slightly pulled out from the pile cap. The
high vertical load of Phase V induced additional compression in the piles, thereby impeding the
progression of tensile damage in the pile-to-cap connections. Under the combination of the zero
vertical load and 225 kips lateral load in Phase VI, the connections of battered Piles 3 and 8
failed in tension (Figure 5.47c), one flange of Piles 1 and 6 buckled (Figure 5.47d), and rotation
of Piles 2 and 7 was visible (Figure 5.47e). The formation of gaps between the piles and cohesive
soil initiated in Phase II, and the gap width continually grew as the pile group was subjected to
cyclic loads in subsequent phases. As shown in Figure 5.47f, the maximum permanent gap at the
end of Phase VI was approximately 6 in.
5.7.2. Column Load-Displacement Response
In Figure 5.48 the applied vertical load is shown with respect to the column top displacement.

71
Figure 5.48. Vertical load as a function of column top displacement
As the column laterally displaced with respect to the main reaction beam, the beam was pushed
up due to the concave shape of the bearing base, and thus the hollow hydraulic cylinders for
applying vertical load were compressed. As a result, the vertical load increased with the increase
of the column displacement. The asymmetry between loads in the push direction (positive
displacement) and the pull direction (negative displacement) was caused by an initial eccentricity
of the vertical load resulting from the construction tolerance. To avoid overloading the test unit
during Phase II, the applied vertical load was intentionally reduced twice when the displacement
reached -2.5 in. and -3.75 in..
As illustrated in Figure 5.49, the presence of vertical load caused some lateral resistance at the
top of the column due to friction in the pendulum bearing.
Figure 5.49. Lateral load acting on test unit
Therefore, the lateral load transferred to the column, which will be referred to as the column
lateral resistance, was not equal to the load applied by the actuator and had to be determined by
other means as detailed below.
Two gauges (L_1_48 and L_4_48) captured strains in two extreme column reinforcing bars at a
height of 48 in. above the top of the pile cap. The curvature at this height was obtained from the
strain measured in one gauge with respect to the other as detailed below:
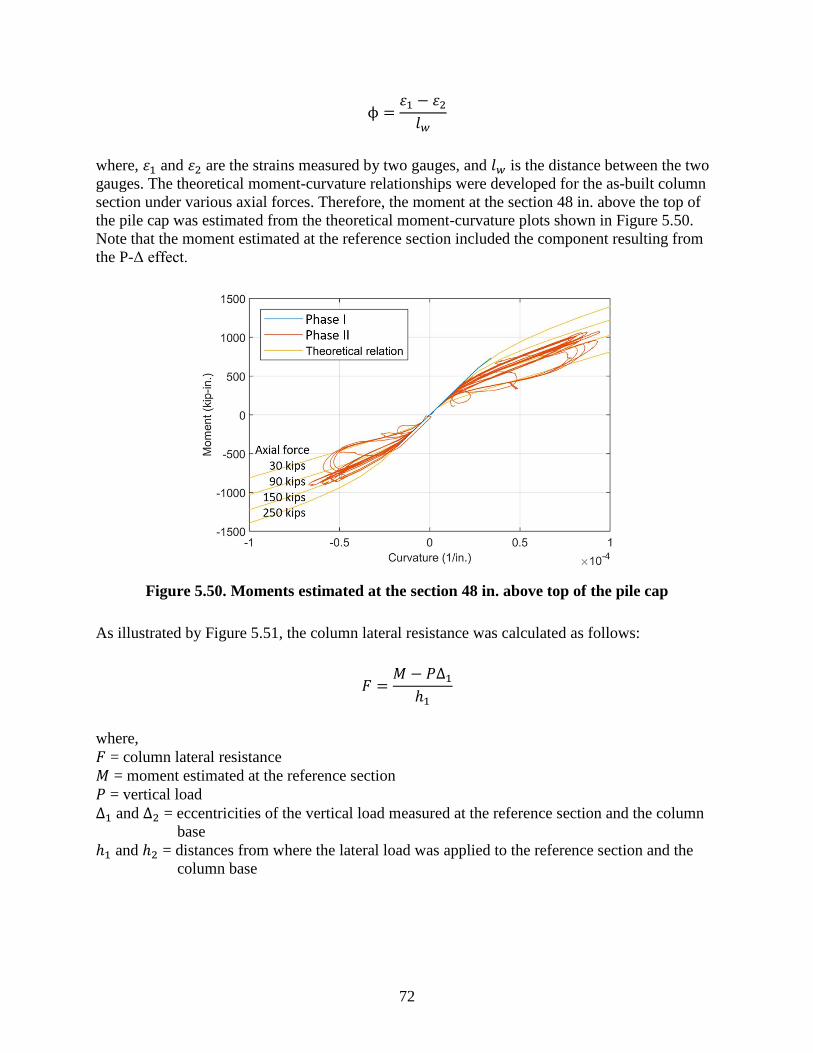
72
ϕ =𝜀1 − 𝜀2𝑙𝑤
where, 𝜀1 and 𝜀2 are the strains measured by two gauges, and 𝑙𝑤 is the distance between the two
gauges. The theoretical moment-curvature relationships were developed for the as-built column
section under various axial forces. Therefore, the moment at the section 48 in. above the top of
the pile cap was estimated from the theoretical moment-curvature plots shown in Figure 5.50.
Note that the moment estimated at the reference section included the component resulting from
the P-Δ effect.
Figure 5.50. Moments estimated at the section 48 in. above top of the pile cap
As illustrated by Figure 5.51, the column lateral resistance was calculated as follows:
𝐹 =𝑀 − 𝑃∆1
ℎ1
where,
𝐹 = column lateral resistance
𝑀 = moment estimated at the reference section
𝑃 = vertical load
∆1 and ∆2 = eccentricities of the vertical load measured at the reference section and the column
base
ℎ1 and ℎ2 = distances from where the lateral load was applied to the reference section and the
column base
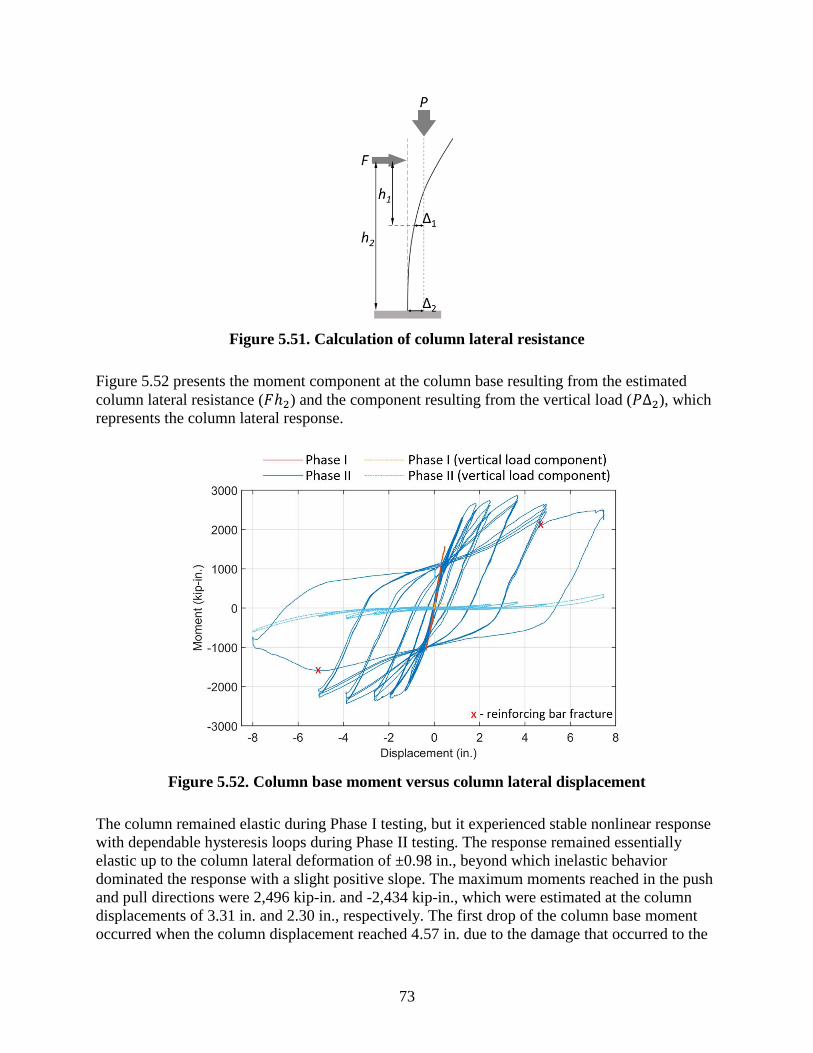
73
Figure 5.51. Calculation of column lateral resistance
Figure 5.52 presents the moment component at the column base resulting from the estimated
column lateral resistance (𝐹ℎ2) and the component resulting from the vertical load (𝑃∆2), which
represents the column lateral response.
Figure 5.52. Column base moment versus column lateral displacement
The column remained elastic during Phase I testing, but it experienced stable nonlinear response
with dependable hysteresis loops during Phase II testing. The response remained essentially
elastic up to the column lateral deformation of ±0.98 in., beyond which inelastic behavior
dominated the response with a slight positive slope. The maximum moments reached in the push
and pull directions were 2,496 kip-in. and -2,434 kip-in., which were estimated at the column
displacements of 3.31 in. and 2.30 in., respectively. The first drop of the column base moment
occurred when the column displacement reached 4.57 in. due to the damage that occurred to the

74
core concrete and buckling of a longitudinal reinforcement. As the column was displaced to 7.13
in. in the push direction, one column longitudinal reinforcement fractured in the plastic hinge
region, causing a further drop in moment resistance. As more reinforcements fractured when the
column was pulled to the deformation of -7.5 in., significant strength degradation occurred.
5.7.3. Pile Cap Load-Displacement Response
The load-displacement responses for the pile group during the different test phases are shown in
Figure 5.53, which contains the lateral load transferred to the pile cap versus the displacements
measured at the mid-depth of the pile cap. For ease of comparison, the plots are presented with
the same scales for both axes.
Figure 5.53. Lateral load-displacement response measured at pile cap
The load-displacement response remained linearly elastic for the duration of Phase I and II. The
backbone of the response for Phase III was approximately linear, whereas the responses during
individual loading cycles exhibited slight nonlinearities. This phenomenon was due to the
75
formation of permanent gaps between the piles and cohesive soil. When the pile group first
reached a given displacement, the applied lateral load was resisted by the pile stiffness and soil
pressure. As the load on the pile group was cycled, gaps developed next to the piles. For pile
displacements less than the width of the gap, the resistance was only due to the pile stiffness. As
the piles approached the previous maximum displacement, the piles engaged the soil, which
progressively provided additional resistance, causing the observed increase in the stiffness of the
load-displacement response of the pile group.
For Phase IV, the response under negative load was similar to that for the last loading step of
Phase III, but the displacement slightly increased due to progressive plastic failure of the soil as
the load on the pile group was cycled at the same negative load level. When the positive lateral
load of Phase IV exceeded 124 kips, the slope of the response backbone gradually decreased,
which was mainly associated with yielding of the piles and damage in the pile-to-pile cap
connections. Creep under constant load occurred during the load-hold periods of the positive
loading levels of 182 kips, 200 kips, and 206 kips for Phase IV.
During Phase V, as the high vertical load induced additional compression in the piles, no further
significant damage was observed, and the hysteresis responses for the three cycles of each
loading level were stable. An exception was the last loading step, in which soil creep occurred
during the load-holding period. As evidenced by the tensile failure of the pile connections and
buckling of the piles documented at the end of the test, the reduction of vertical load in Phase VI
triggered failure of the pile group, causing the continuous increase of lateral displacement under
a sustained lateral load of 225 kips.
5.7.4. Pile Cap Moment-Rotation Response
The lateral load applied above the pile cap produced overturning moments acting on the pile cap
in all loading phases of the test. The relationships between the overturning moment and pile cap
rotation are presented in Figure 5.54.

76
Figure 5.54. Moment rotation response measured at pile cap
For the duration of Phase I, the moment-rotation response remained linearly elastic. As gaps
formed between the piles and soil during Phase II, the moment-rotation response exhibited some
nonlinearity but remained elastic. Following the first two phases, the height of lateral load was
lowered from 7 ft to 1 ft above the top of the pile cap. As a result, the overturning moment-to-
lateral load ratios for the subsequent phases were significantly lower than those for Phases I and
II, causing noticeable reductions in the slopes of the moment-rotation responses.
During Phase III, the moment-rotation response exhibited increasing amounts of nonlinearity as
the pile-to-soil gaps expanded. Subsequent to the moment reaching 195 kip-ft in Phase IV, the
slope of the moment-rotation backbone response decreased, and the hysteresis loop widened.
This degradation was associated with damage occurring in the piles and pile-to-pile cap
connections, especially pull-out of the battered Piles 3 and 8. For Phase V, the nonlinearity of the
moment-rotation response became more pronounced as the gaps around the piles continually
grew. The high vertical load in this phase impeded the progression of tensile damage in the pile
connections, and thus maintained a stable hysteretic response. With the vertical load reduced to

77
zero in Phase VI, tension failure of the connections caused the significant deterioration in the
moment-rotation response.
5.7.5. Pile Head Forces
The loads acting on the test unit were transferred through the pile group, hence the eight steel H-
piles, capped with the pile cap, were subjected to axial force, moment, and shear. As mentioned
earlier, BDI strain transducers were installed on a select number of piles. These transducers
captured the deformation within the gauge length of 3 in.; therefore, the average axial forces and
the moments at the head of Piles 1, 2, 3, 4, and 6 were determined from the measurements of the
BDI transducers. In addition, strain gauges captured the forces of Pile 5. With a few exceptions,
these instrumentations provided good measurements for the duration of Phase I and Phase II.
The histories of pile head moment are plotted in Figure 5.55 as a function of the moment at the
bottom of the pile cap.
Figure 5.55. Pile head moment as a function of moment at the bottom of the pile cap
Because the lateral movement of the pile cap was small, the moments at the pile heads remained
low. Therefore, the vertical load and the overturning moment were transferred to the soil mainly
in terms of axial forces in the piles.

78
As shown in Figure 5.56, the axial forces acting on the head of Piles 1, 2, 3, 4, 5, and 6 are
plotted as a function of pile cap bottom moment.
Figure 5.56. Pile axial force as a function of moment at the bottom of the pile cap
The figures confirm the regular relationship between the axial forces and the pile cap bottom
moment. For Phase I, after the application of a vertical load of 250 kips, the measurements
indicated that each pile was subjected to the approximately uniform distributed axial force of 30
kips. As the moment at the bottom of the pile cap increased, the axial force in the rows far from
the pile cap centerline (i.e., the row of Piles 1, 4, and 6 and the row of Piles 3 and 5) fairly
linearly increased or decreased. The axial force in Pile 2, as it was close to the centerline of the
pile cap, exhibited a weak relationship with the pile cap moment.
For Phase II, the initial vertical load was decreased to 100 kips, and the measured initial pile
axial forces accordingly dropped to approximately 12 kips. Because of the lower vertical load
and the higher moment at the bottom of the pile cap in Phase II, the piles in the extreme rows
were subjected to tension up to approximately 10 kips, but the magnitudes of pile axial
compression did not exceed those of Phase I. The relationship between the variation of pile axial
force and the superimposed moment was similar to that observed in Phase I.
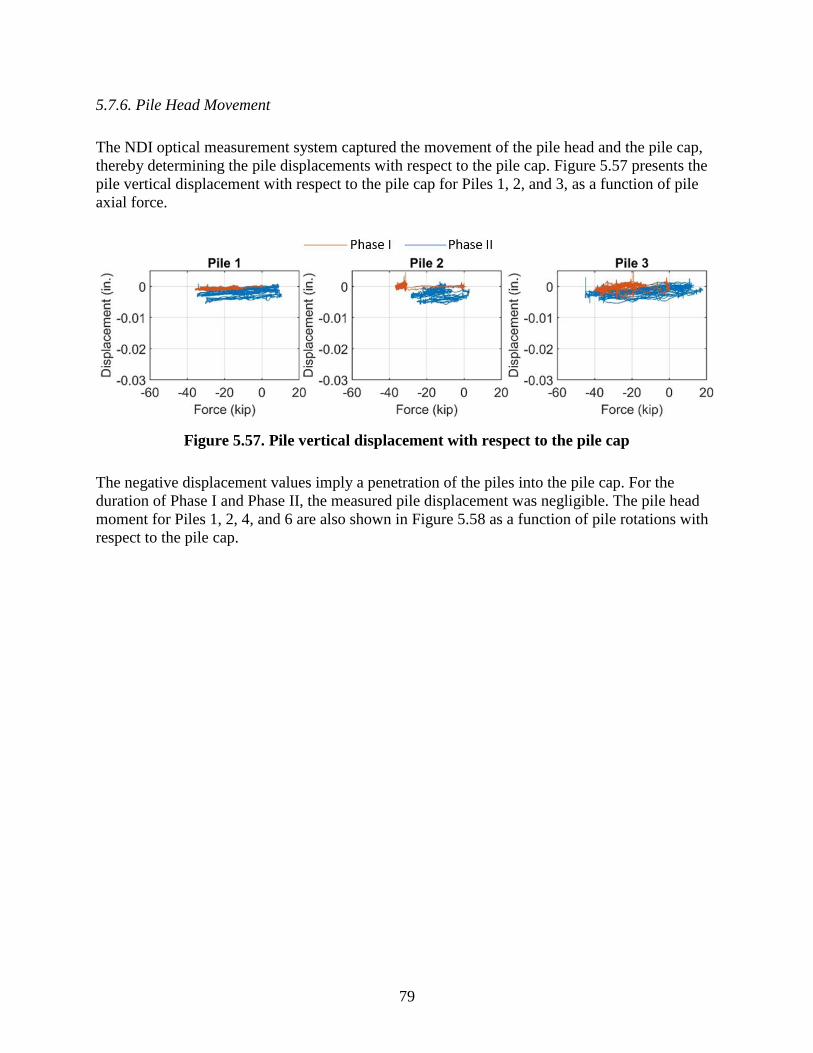
79
5.7.6. Pile Head Movement
The NDI optical measurement system captured the movement of the pile head and the pile cap,
thereby determining the pile displacements with respect to the pile cap. Figure 5.57 presents the
pile vertical displacement with respect to the pile cap for Piles 1, 2, and 3, as a function of pile
axial force.
Figure 5.57. Pile vertical displacement with respect to the pile cap
The negative displacement values imply a penetration of the piles into the pile cap. For the
duration of Phase I and Phase II, the measured pile displacement was negligible. The pile head
moment for Piles 1, 2, 4, and 6 are also shown in Figure 5.58 as a function of pile rotations with
respect to the pile cap.
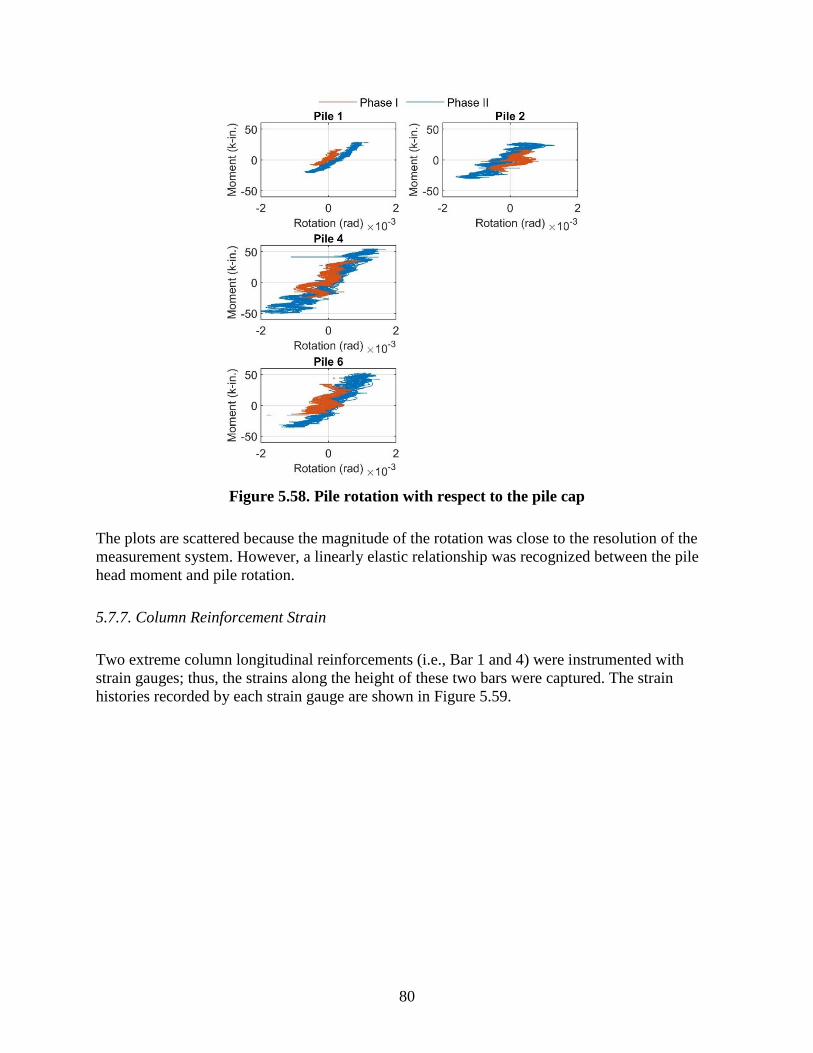
80
Figure 5.58. Pile rotation with respect to the pile cap
The plots are scattered because the magnitude of the rotation was close to the resolution of the
measurement system. However, a linearly elastic relationship was recognized between the pile
head moment and pile rotation.
5.7.7. Column Reinforcement Strain
Two extreme column longitudinal reinforcements (i.e., Bar 1 and 4) were instrumented with
strain gauges; thus, the strains along the height of these two bars were captured. The strain
histories recorded by each strain gauge are shown in Figure 5.59.

81

82
Figure 5.59. Strain history of column longitudinal reinforcement
In the figure, the strain was plotted with respect to the lateral load acting on the top of the
column, and the location of each gauge was indicated. Strain gauges within the column base
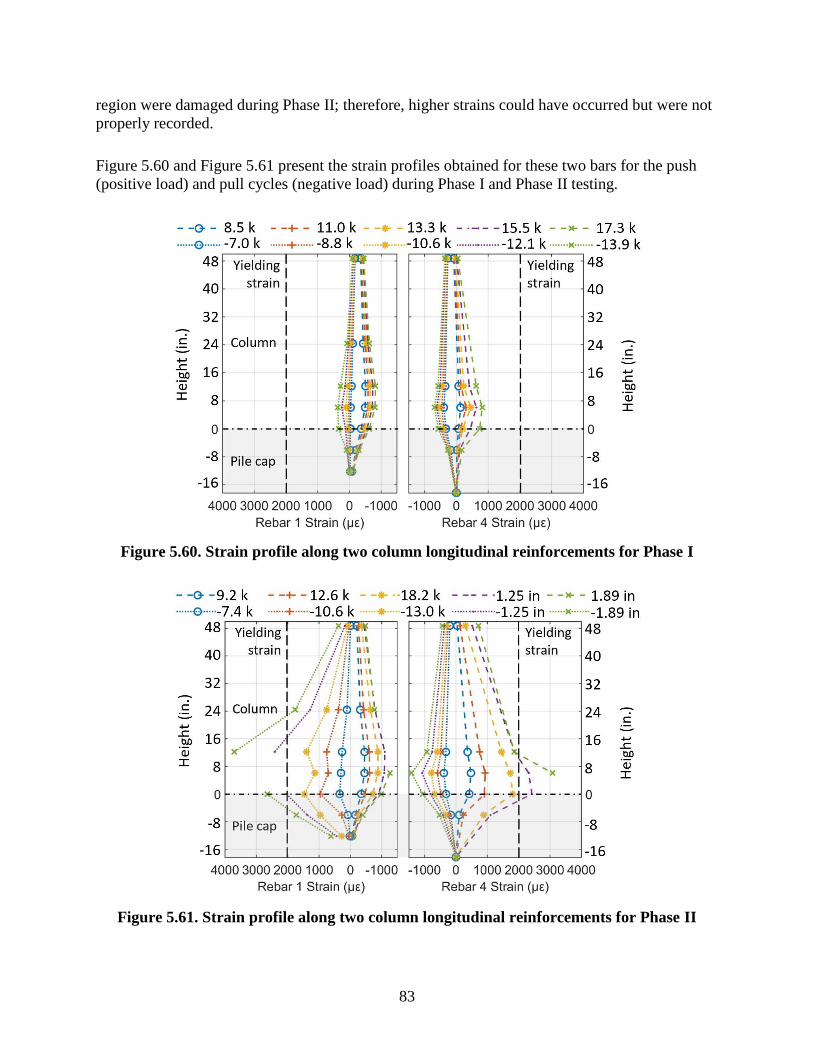
83
region were damaged during Phase II; therefore, higher strains could have occurred but were not
properly recorded.
Figure 5.60 and Figure 5.61 present the strain profiles obtained for these two bars for the push
(positive load) and pull cycles (negative load) during Phase I and Phase II testing.
Figure 5.60. Strain profile along two column longitudinal reinforcements for Phase I
Figure 5.61. Strain profile along two column longitudinal reinforcements for Phase II

84
The strain values shown here are those recorded when the peak loads were first achieved during
the loading cycles, and the positive values represent tensile strains. The ordinate indicates the
distance of the strain gauge from the top of the pile cap. During Phase I, the strains were far
below the yielding strain, and the profiles were approximately linear along the height. The strains
were largest at 6 in. above the top of the pile cap and decreased down into the pile cap and up
into the column. Within the pile cap, the strain penetration is seen, but the magnitude of
measured strains abruptly decreased to a fraction of that measured at the top of the pile cap. The
strains were negligible for the portion beyond 6 in. below the pile cap top.
For Phase II testing, the tensile strains significantly increased. Prior to the lateral load exceeding
13.1 kips, the strains remained below the yielding strain, and the profiles stayed approximately
linear. As the load increased, for push cycles, the profile indicated that the reinforcing bar
between the pile cap top and the height of 12 in. above the pile cap top yielded, and the largest
strains occurred at the top of pile cap. The tensile strains during the pull cycles were higher than
those recorded in the push cycles, whereas the reinforcing bar yielding was limited to the column
base region below the height of 24 in. Reinforcement yielding also penetrated up to 6 in. into the
pile cap, but the magnitude of measured strains abruptly decreased to a fraction of that measured
at the top of the pile cap. From 12 in. below the pile cap, the values remained below 50% of the
yielding strain for the duration of Phase II testing.
5.7.8. Column Socket CSP Strain
The strain profiles at the south and north sides of the CSP of the column socket are shown in
Figure 5.62 and Figure 5.63, in which the readings from a gauge that was placed at the east side
of the CSP are presented as well.
Figure 5.62. Strain profile of column socket CSP for Phase I

85
Figure 5.63. Strain profile of column socket CSP for Phase II
With the largest reading of 170 με, the strains in the CSP remained far below the yielding value
for the duration of Phase I and Phase II. The strains at the north side of the CSP consistently
varied with the application of the lateral loads. Generally, the gauges captured compressive
strains for the push cycles and tensile strains for the pull cycles. Few exceptions occurred when
relatively large pull loads were applied. The strain profiles at the north side exhibited some
irregularities in Phase II, which could be attributed to systematic errors in the strain gauges. In
the bottom third of the CSP, the strains were negligible regardless of the magnitude of lateral
load.
5.7.9. Pile Cap Reinforcement Strain
One quarter of the pile cap was heavily instrumented to capture its response. Of the many strain
gauges mounted on the reinforcement of the pile cap, the variation of strain as a function of
lateral load is shown only for a few selected gauges that were placed on the bottom reinforcing
mat. For the duration of the test, strain gauge readings were small; hence, the strain drift over
time due to systematic errors was visible. Strain histories of the gauges that were mounted on the
four reinforcing bars parallel to the loading direction are presented in Figure 5.64.

86
Figure 5.64. Strain history of pile cap reinforcement perpendicular to the loading direction
As indicated in the figure, the gauges were placed along a plane right next to the column and
perpendicular to the loading direction. The lateral load did not produce any variation on the
readings of BF2, as it was located close to the edge of the pile cap. The readings from BF5, BF6,
and BF9, in contrast, increased in a roughly linear fashion as the positive load (i.e., push load)
was applied, while the application of negative load (i.e., pull load) reduced the readings from
these gauges. As seen in the histories, the recorded strains did not exceed 40 με, and the majority
of the variation was due to the strain drift. Strain profiles obtained from these histories are shown
in Figure 5.65.
Figure 5.65. Strain profile of pile cap reinforcement perpendicular to the loading direction
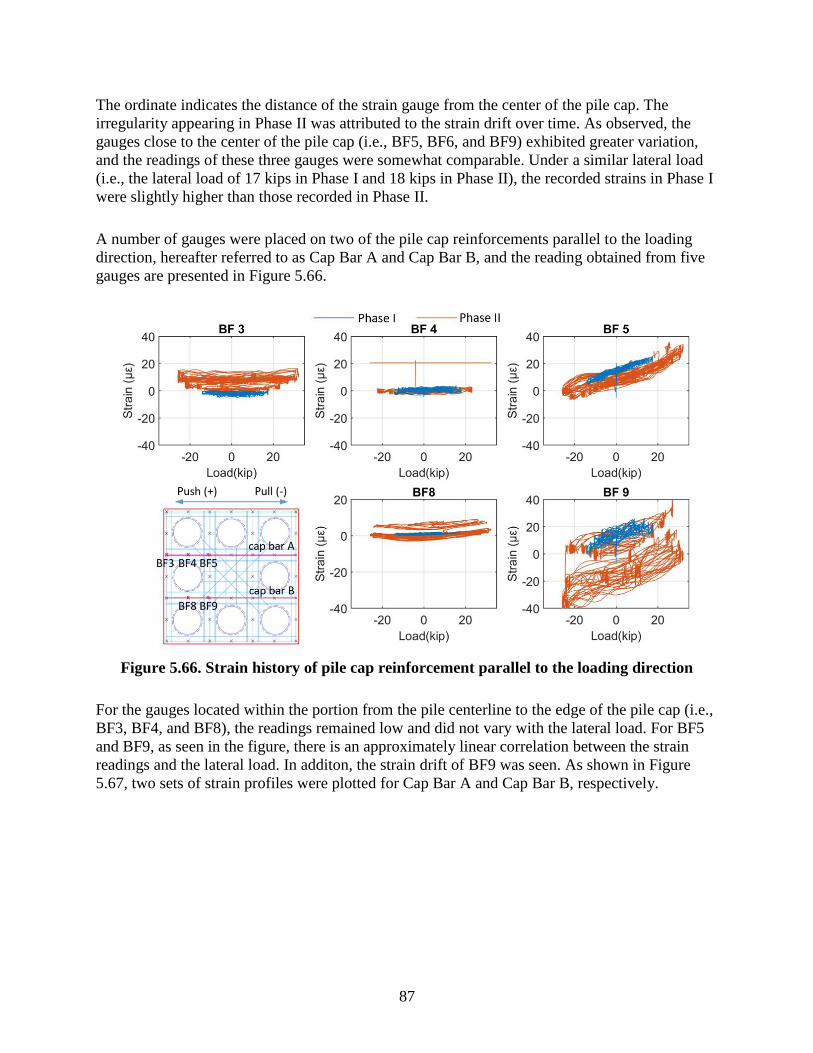
87
The ordinate indicates the distance of the strain gauge from the center of the pile cap. The
irregularity appearing in Phase II was attributed to the strain drift over time. As observed, the
gauges close to the center of the pile cap (i.e., BF5, BF6, and BF9) exhibited greater variation,
and the readings of these three gauges were somewhat comparable. Under a similar lateral load
(i.e., the lateral load of 17 kips in Phase I and 18 kips in Phase II), the recorded strains in Phase I
were slightly higher than those recorded in Phase II.
A number of gauges were placed on two of the pile cap reinforcements parallel to the loading
direction, hereafter referred to as Cap Bar A and Cap Bar B, and the reading obtained from five
gauges are presented in Figure 5.66.
Figure 5.66. Strain history of pile cap reinforcement parallel to the loading direction
For the gauges located within the portion from the pile centerline to the edge of the pile cap (i.e.,
BF3, BF4, and BF8), the readings remained low and did not vary with the lateral load. For BF5
and BF9, as seen in the figure, there is an approximately linear correlation between the strain
readings and the lateral load. In additon, the strain drift of BF9 was seen. As shown in Figure
5.67, two sets of strain profiles were plotted for Cap Bar A and Cap Bar B, respectively.

88
Figure 5.67. Strain profile of pile cap reinforcement parallel to the loading direction
The profiles were obtained from the readings under pushing lateral loads, and the missing strain
readings at the end of Cap Bar B were assumed to be zero. The distance from the gauges to the
center of the pile cap is shown on the horizontal axis. The strains were only induced in the
gauges located between the piles and the column (i.e., BF5 and BF9). The recorded strains in
Phase I were slightly higher than those recorded in Phase II. During a single phase, in other
words, under the same vertical load, the strains increased with rising lateral load. An exception
was observed for the profile of Cap Bar B under 31 kips lateral load, which was attributed to the
drift of recorded strains.
Three strain gauges were placed on one of the headed reinforcements in the bottom reinforcing
mat. The strain histories of these gauges and their profiles are presented in Figure 5.68 and
Figure 5.69, respectively.
Figure 5.68. Strain history of headed reinforcement in the pile cap
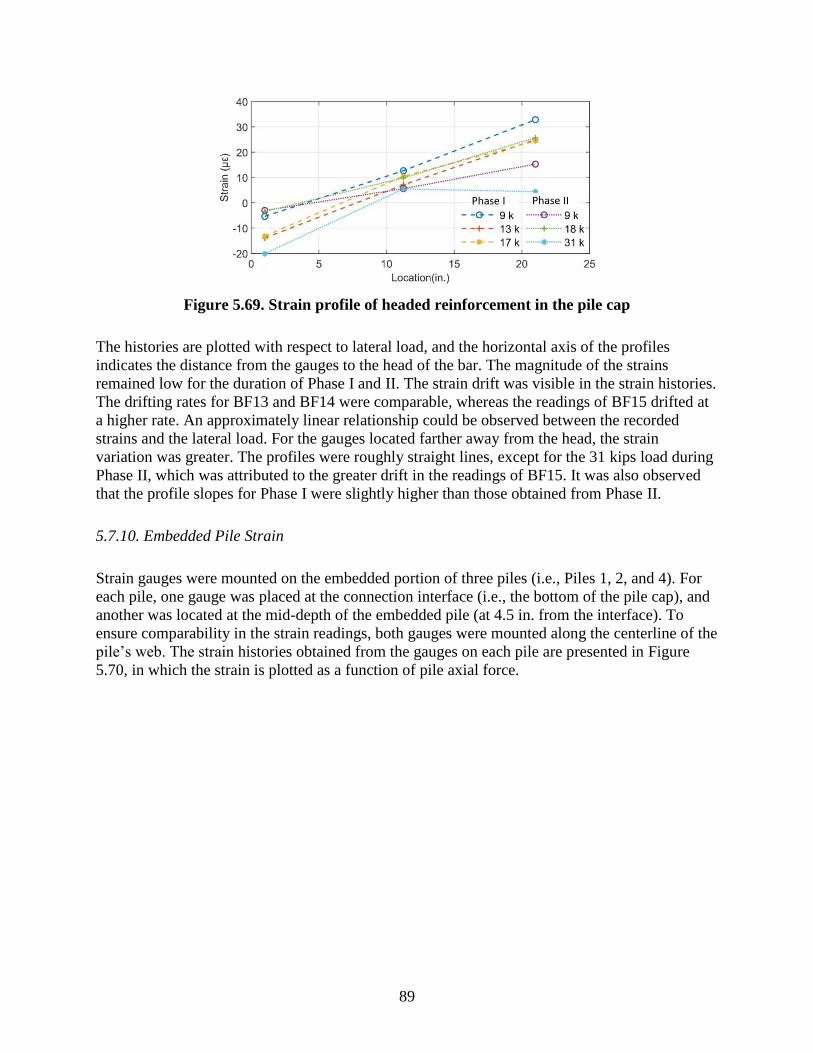
89
Figure 5.69. Strain profile of headed reinforcement in the pile cap
The histories are plotted with respect to lateral load, and the horizontal axis of the profiles
indicates the distance from the gauges to the head of the bar. The magnitude of the strains
remained low for the duration of Phase I and II. The strain drift was visible in the strain histories.
The drifting rates for BF13 and BF14 were comparable, whereas the readings of BF15 drifted at
a higher rate. An approximately linear relationship could be observed between the recorded
strains and the lateral load. For the gauges located farther away from the head, the strain
variation was greater. The profiles were roughly straight lines, except for the 31 kips load during
Phase II, which was attributed to the greater drift in the readings of BF15. It was also observed
that the profile slopes for Phase I were slightly higher than those obtained from Phase II.
5.7.10. Embedded Pile Strain
Strain gauges were mounted on the embedded portion of three piles (i.e., Piles 1, 2, and 4). For
each pile, one gauge was placed at the connection interface (i.e., the bottom of the pile cap), and
another was located at the mid-depth of the embedded pile (at 4.5 in. from the interface). To
ensure comparability in the strain readings, both gauges were mounted along the centerline of the
pile’s web. The strain histories obtained from the gauges on each pile are presented in Figure
5.70, in which the strain is plotted as a function of pile axial force.

90
Figure 5.70. Strain history of embedded pile head
For Phase I and Phase II, the recorded pile strains did not exceed 18% of the yield strain, and the
strains increased fairly linearly as the pile axial forces increased. Figure 5.71 presents the strain
profiles for the embedded pile heads under various pile axial forces.
Figure 5.71. Strain profile of embedded pile head
To develop these profiles, the strain at the top end of the pile was assumed to be zero. However,
due to end bearing, the end of pile could be subjected to compressive strains. For Piles 1 and 4,
the strains at the mid-depth of the embedded portion decreased to approximately half of their
values at the interface regardless of the magnitude of pile axial force, whereas the mid-depth

91
strains of Pile 2 were higher than half of the interface strains when the pile compressive force
exceeded 22 kips.
5.8. Discussion
5.8.1. Column Socket and Pile Socket Connections
Visual observations indicated that, except for limited crushing and spalling of the grout closure
pour near the top of the column socket toward the end of the Phase II test, the connections
remained mostly damage-free when the column flexural capacity was fully developed. The strain
profiles along the column longitudinal reinforcement embedded into the pile cap reflected the
force transfer within the connection. In Phase I, with a high axial load and low magnitude lateral
forces, the force transfer effectively took place within the top half of the connection, with
negligible strains in the column bars in the bottom half of the connection. In Phase II, the column
bars strains penetrated deeper into the connection. However, the measured strains confirmed that
the provided column embedment length equaling the column diameter was sufficient to develop
the column flexural capacity outside the connection above the pile cap. The force transfer
capacity of the socket connection was also adequately supported by the CSP. The strain profiles
from the CSP also confirmed that the bottom half of the connection did not actively participate in
anchoring the column bars into the socket connection. Based on these observations, it can be
concluded that flexural columns with axial load ratios similar to those used in testing can be
adequately anchored with a socket connection using an embedment length equal to the column
diameter. Furthermore, the thickness of the CSP could be reduced by as much as 50% or more
without compromising the connection performance.
No damage was observed on the pile socket connections during Phase I and Phase II testing,
allowing the pile-to-pile cap connection to remain fixed. The force transfer capacity of the socket
connections was reflected by the approximately linear strain profiles along the embedded length
of the piles. By embedding the piles 9 in. (i.e., 1.5 times the pile section depth) into the sockets,
the connections effectively transferred pile forces to the pile cap, confirming the sufficiency of
the pile embedment length. During Phase III to VI, the piles pulled out due to the significant
tensile forces, and the pile socket connections were damaged in a ductile manner.
5.8.2. Foundation Flexibility
For the column-pile cap-pile system, it is important to recognize the foundation flexibility, which
can be quantified using the measured pile cap response. The lateral load-translation response
demonstrates that, as the design required, the foundation remained linearly elastic and damage-
free when the column flexural capacity was fully developed at the end of Phase II. The backbone
of the response for Phase III was approximately linear, whereas the formation of permanent gaps
between the piles and cohesive soil contributed to the nonlinear responses during lateral cyclic
loading. Creep under a constant lateral load occurred during the load-hold periods of the positive
loading levels for Phase IV.
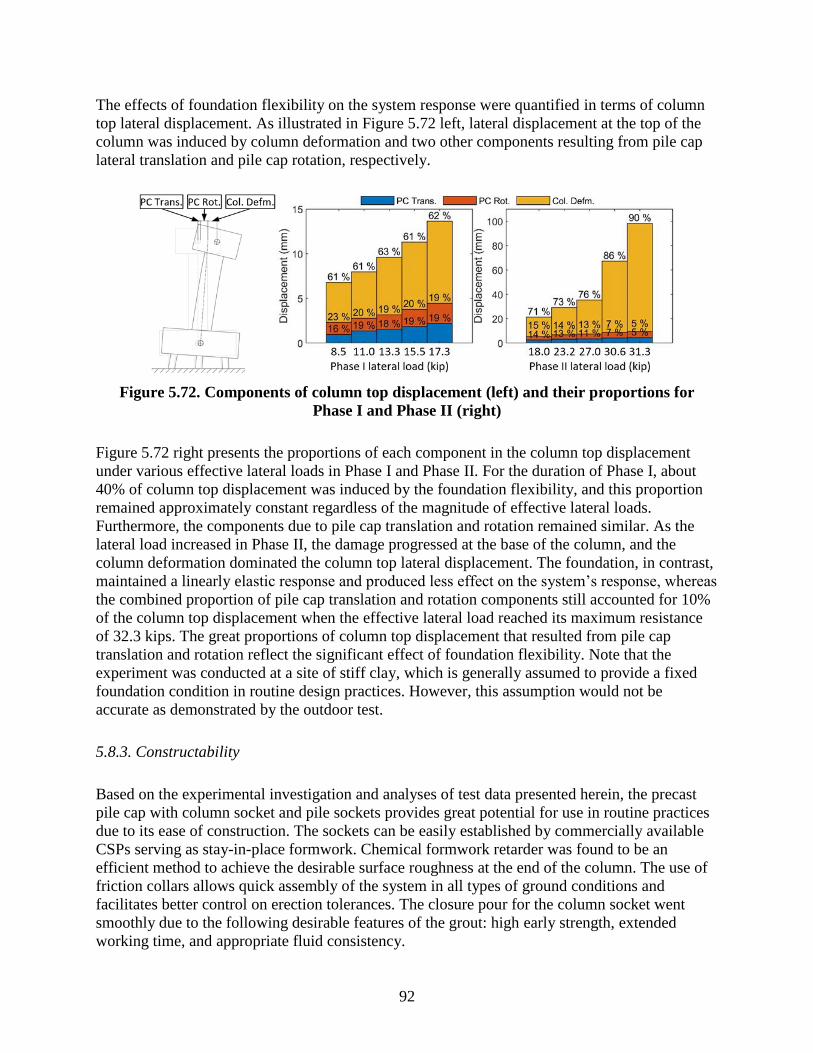
92
The effects of foundation flexibility on the system response were quantified in terms of column
top lateral displacement. As illustrated in Figure 5.72 left, lateral displacement at the top of the
column was induced by column deformation and two other components resulting from pile cap
lateral translation and pile cap rotation, respectively.
Figure 5.72. Components of column top displacement (left) and their proportions for
Phase I and Phase II (right)
Figure 5.72 right presents the proportions of each component in the column top displacement
under various effective lateral loads in Phase I and Phase II. For the duration of Phase I, about
40% of column top displacement was induced by the foundation flexibility, and this proportion
remained approximately constant regardless of the magnitude of effective lateral loads.
Furthermore, the components due to pile cap translation and rotation remained similar. As the
lateral load increased in Phase II, the damage progressed at the base of the column, and the
column deformation dominated the column top lateral displacement. The foundation, in contrast,
maintained a linearly elastic response and produced less effect on the system’s response, whereas
the combined proportion of pile cap translation and rotation components still accounted for 10%
of the column top displacement when the effective lateral load reached its maximum resistance
of 32.3 kips. The great proportions of column top displacement that resulted from pile cap
translation and rotation reflect the significant effect of foundation flexibility. Note that the
experiment was conducted at a site of stiff clay, which is generally assumed to provide a fixed
foundation condition in routine design practices. However, this assumption would not be
accurate as demonstrated by the outdoor test.
5.8.3. Constructability
Based on the experimental investigation and analyses of test data presented herein, the precast
pile cap with column socket and pile sockets provides great potential for use in routine practices
due to its ease of construction. The sockets can be easily established by commercially available
CSPs serving as stay-in-place formwork. Chemical formwork retarder was found to be an
efficient method to achieve the desirable surface roughness at the end of the column. The use of
friction collars allows quick assembly of the system in all types of ground conditions and
facilitates better control on erection tolerances. The closure pour for the column socket went
smoothly due to the following desirable features of the grout: high early strength, extended
working time, and appropriate fluid consistency.
93
CHAPTER 6. SUMMARY AND CONCLUSIONS
The focus of this report was to investigate the structural performance of a bridge
column/footing/pile system for ABC. Given the numerous advantages over conventional
construction, this study sought to develop a fully prefabricated column/footing/pile system. In
light of the current state of the art, a suitable prefabricated column-pile cap-pile system was
developed. The system consists of a precast column, precast pile cap, and pile foundation. The
components are integrally connected utilizing a column socket connection and pile sockets
connections that are preformed in the pile cap with corrugated steel pipes (CSPs).
To evaluate the side shear strength of the column socket connection with various connection
parameters, column socket connection tests were performed using eight specimens that modeled
the full-scale connection interfaces. Each specimen consisted of a short precast column segment
that was embedded in a socket on a precast foundation. When a compressive force was applied to
the top of the column segment, the side shear acting on the connection interface produced
resistance. Thus, the side shear strength could be evaluated by loading the column segment until
it experienced a sliding failure with respect to the foundation. The specimens were constructed
with different surface texture for the embedded portion of the column segment and CSP-to-
column segment clearance. They were tested by subjecting them to monotonic and cyclic axial
loading. Test results showed that the side shear mechanism in the column socket connections can
provide significant resistance, facilitating transfer of large vertical loads.
An outdoor system test was subsequently conducted on the column/footing/pile system at a
cohesive soil site. The test unit was constructed as a half-scale representation of the column-pile
cap-pile system utilizing a precast column, a precast pile cap, four vertical steel piles, and four
battered piles. The test unit was first subjected to combined vertical and lateral loads applied to
the top of the column. All components as well as their connections remained undamaged when
subjected to the load combination representing the design limit state. With the lateral load and
column displacement gradually increased beyond the design demand, damage occurred at the
base of the column as expected, and the column socket connection and pile socket connections
maintained fixity, confirming the structural sufficiency of the system. After casting a concrete
block on top of the pile cap surrounding the damaged column, the foundation of the test unit was
further tested under different combinations of vertical and lateral loads. Not only were the
magnitude of the loads changed, but the height of the lateral load was also varied to produce
different overturning moment-to-lateral load ratios. The foundation exhibited significant
resistance to the combined vertical and lateral loads and eventually failed well beyond the
targeted design forces due to the combined effects of pile buckling, damage to the pile socket
connections, and formation of permanent gaps between the piles and cohesive soil. Based on the
test results, the following conclusions can be drawn:
For the column socket connection, the intentionally roughened column surface, as required
by AASHTO, is necessary to develop satisfactory side shear strength to sustain axial loads
used in routine design practice.

94
The column surface textures with deep amplitude (e.g., fluted fins) exhibited softer
connection responses compared to the one with exposed aggregate surface finish. Thicker
grout closure pour resulting from wider CSP-to-column clearance also marginally reduced
the stiffness of the socket connection.
Exposed aggregate for column surface preparation, standard CSP, and high-strength grout are
recommended for establishing socket connections effectively. For connections established as
described in this study, the side shear stress limitations of 1,000 psi and 700 psi are
suggested, respectively, for the column-to-grout interface and CSP-to-surrounding concrete
interface to determine the minimum depth of the preformed socket.
The half-scale test unit representing a column/footing/pile system produced dependable
performance when subjected to combined vertical and lateral forces. These loads represented
factored design loads. There was no damage to the column socket and pile sockets
connections.
When the lateral force was gradually increased beyond the design demand, damage occurred
to the column base as intended in design, and superficial crushing and spalling was observed
in the column socket connection region with no damage occurring to the pile connections,
confirming the adequacy of all connections. This observation confirmed that the performance
of the prefabricated column-pile cap-pile system was at least as good as, if not better than, a
comparable conventional cast-in-place system.
For the column socket connection, the embedment length equal to the column diameter is
sufficient to fully develop the column flexural capacity, whereas the pile embedment length
of 1.5 times the depth of pile is recommended to maintain the fixity of the pile sockets
connection.
Foundation flexibility produced a significant effect on the system response. About 40% of
the column top lateral displacement was due to the foundation flexibility prior to the
development of inelastic strains induced in the column. As the damage progressed in the
column, the foundation flexibility had reduced effect on the column top lateral displacement,
while it still accounted for an important component when the column lateral resistance
reached its maximum.
The constructability advantages of the prefabricated column-pile cap-pile system are that it is
quick and simple to build, which have been sufficiently demonstrated. The precast column
and precast pile cap with no projected reinforcement are easy to build and transport and are
unlikely to be damaged during construction. With the use of friction collars and grout with
desirable characteristics (including high early strength, extended working time, and
appropriate fluid consistency), the assembly of the column-pile cap-pile system can be
completed within a day.

95
REFERENCES
AASHTO. 2016. AASHTO M 218: Standard Specification for Steel Sheet, Zinc-Coated
Galvanized, for Corrugated Steel Pipe. American Association of State Highway and
Transportation Officials, Washington, DC.
AASHTO. 2017. AASHTO LRFD Bridge Design Specifications. 8th edition. American
Association of State Highway and Transportation Officials, Washington, DC.
ABC-UTC. 2018. Accelerated Bridge Construction University Transportation Center.
https://abc-utc.fiu.edu/.Accessed April 2018.
ASCE. 2017. 2017 Infrastructure Report Card: Bridges. American Society of Civil Engineers,
Washington, DC. https://www.infrastructurereportcard.org/wp-
content/uploads/2017/01/Bridges-Final.pdf.
ASTM International. 2016. ASTM C109: Standard Test Method for Compressive Strength of
Hydraulic Cement Mortars (Using 2-in. or [50-mm] Cube Specimens). ASTM
International, West Conshohocken, PA.
ASTM International. 2017. ASTM C39: Standard Test Method for Compressive Strength of
Cylindrical Concrete Specimens. ASTM International, West Conshohocken, PA.
CTS Cement. 2019. Rapid Set ULTRAFLOW® 4000/8 Non-Shrink Precision Grout. CTS
Cement Manufacturing Corp., Garden Grove, CA.
https://www.ctscement.com/assets/doc/datasheets/ULTRAFLOW_Datasheet_DS_112_E
N.pdf.
Culmo, M. P. 2009. Connection Details for Prefabricated Bridge Elements and Systems. FHWA-
IF-09-010, Federal Highway Administration, Highways for LIFE Program, McLean, VA.
Culmo, M. P. 2011. Accelerated Bridge Construction – Experience in Design, Fabrication, and
Erection of Prefabricated Bridge Elements and Systems. Final Manual. FHWA-HIF-12-
013. Federal Highway Administration, Highways for LIFE Program, McLean, VA.
Haber, Z. B., M. S. Saiidi, and D. H. Sanders. 2013. Precast Column-Footing Connections for
Accelerated Bridge Construction in Seismic Zones. Center for Civil Engineering
Earthquake Research, University of Nevada, Reno, NV.
Haraldsson, O. S., T. M. Janes, M. O. Eberhard, and J. F. Stanton. 2013. Precast Bent System for
High Seismic Regions – Laboratory Tests of Column-to-Footing Socket Connections.
FHWA-HIF-13-039. Federal Highway Administration, Highways for LIFE Program,
Washington, DC.
Iowa DOT. 2018. LRFD Bridge Design Manual. Iowa Department of Transporatation, Bridges
and Structures, Ames, IA.
Kavianipour, F. and M. S. Saiidi. 2013. Experimental and Analytical Seismic Studies of a Four-
Span Bridge System with Composite Piers. Center for Civil Engineering Earthquake
Research, Department of Civil and Environmental Engineering, University of Nevada,
Reno, NV.
Marsh, M. L., M. Wernli, B. E. Garrett, J. F. Stanton, M. O. Eberhard, and M. D. Weinert. 2011.
NCHRP Report 698: Application of Accelerated Bridge Construction Connections in
Moderate-to-High Seismic Regions. National Cooperative Highway Research Program,
Washington, DC.
Mashal, M. and A. Palermo. 2015. High-Damage and Low-Damage Seismic Design
Technologies for Accelerated Bridge Construction. Structures Congress 2015, April 23–
25, Portland, OR, pp. 549–560.

96
Mehrsoroush, A. and M. S. Saiidi. 2016. Cyclic Response of Precast Bridge Piers with Novel
Column-Base Pipe Pins and Pocket Cap Beam Connections. Journal of Bridge
Engineering, Vol. 21, No. 4, pp. 1–13.
Mohebbi, A., M. S. Saiidi, and A. Itani. 2017. Development and Seismic Evaluation of Pier
Systems with Pocket Connections, CFRP Tendons, and ECC/UHPC Columns.
Accelerated Bridge Construction University Transportation Center, Miami, FL.
Motaref, S., M. S. Saiidi, and D. Sanders. 2011. Seismic Response of Precast Bridge Columns
with Energy Dissipating Joints. Accelerated Bridge Construction University
Transportation Center (ABC-UTC), Florida International University, Miami, FL.
http://utcdb.fiu.edu/researchprojectitem?id=76 with Part 1 at
http://utcdb.fiu.edu/final_report_task_1999%20(Part%201).pdf.
Pang, J. B. K., K. P. Steuck, L. Cohagen, J. F. Stanton, and M. O. Eberhard. 2008. Rapidly
Constructible Large-Bar Precast Bridge-Bent Seismic Connection. Washington State
Transportation Center, University of Washington, Seattle, WA.
Pantelides, C. P., M. J. Ameli, and L. D. Reaveley. 2017. Evaluation of Grouted Splice Sleeve
Connections for Precast Reinforced Concrete Bridge Piers. Mountain-Plains Consortium,
Upper Great Plains Transportation Institute, North Dakota State University, Fargo, ND.
PCI. 2000. Tolerance Manual for Precast and Prestressed Concrete Construction.
Precast/Prestressed Concrete Institute, Chicago, IL.
PCI. 2007. Section 3.5 of Architectural Precast Concrete Manual. Precast/Prestressed Concrete
Institute, Chicago, IL.
PCI. 2014. Precast and Prestressed Concrete. Precast/Prestressed Concrete Institute, Chicago,
IL.
Restrepo, J. I., M. J. Tobolski, and E. E. Matsumoto. 2011. NCHRP Report 681: Development of
a Precast Bent Cap System for Seismic Regions. National Cooperative Highway Research
Program, Washington, DC.
Shama, A. A., J. B. Mander, and A. J. Aref. 2002. Seismic Performance and Retrofit of Steel Pile
to Concrete Cap Connections. Structural Journal, Vol. 99, No. 1, pp. 51–61.
Sritharan, S. and Z. Cheng. 2016. Accelerated Bridge Construction (ABC) – Substructure: Grout.
http://sri.cce.iastate.edu/ABC-Guidelines/Grout%20New.html.
Tazarv, M. and M. S. Saiidi. 2015. Design and Construction of Bridge Columns Incorporating
Mechanical Bar Splices in Plastic Hinge Zones. Accelerated Bridge Construction
University Transportation Center (ABC-UTC), Florida International University, Miami,
FL. https://abc-utc.fiu.edu/wp-content/uploads/sites/52/2016/02/CCEER-15-07-
TazarvSaiidi-1-20-2016.pdf.
UDOT. 2017. Structures Design and Detailing Manual. Utah Department of Transportation, Salt
Lake City, UT.
Wipf, T. J., F. W. Klaiber, and S. Hockerman. 2009. Precast Concrete Elements for Accelerated
Bridge Construction, Volume 1-1. Laboratory Testing of Precast Substructure
Components: Boone County Bridge. Bridge Engineering Center, Iowa State University,
Ames, IA.
Xiao, Y., H. Wu, T. T. Yaprak, G. R. Martin, and J. B. Mander. 2006. Experimental Studies on
Seismic Behavior of Steel Pile-to-Pile-Cap Connections. Journal of Bridge Engineering,
Vol. 11, No. 2, pp. 151–159.

97
APPENDIX. TEST UNIT DRAWINGS

98

99

100

101

102


THE INSTITUTE FOR TRANSPORTATION IS THE FOCAL POINT FOR TRANSPORTATION AT IOWA STATE UNIVERSITY.
InTrans centers and programs perform transportation research and provide technology transfer services for government agencies and private companies;
InTrans contributes to Iowa State University and the College of Engineering’s educational programs for transportation students and provides K–12 outreach; and
InTrans conducts local, regional, and national transportation services and continuing education programs.
Visit InTrans.iastate.edu for color pdfs of this and other research reports.