Design and Implementation of Heart Beat Monitor System
20
_____________________________________________________________________________________________________ *Corresponding author: Email: [email protected]; Journal of Engineering Research and Reports 21(4): 68-87, 2021; Article no.JERR.76091 ISSN: 2582-2926 Design and Implementation of Heart Beat Monitor System F. T. Oyediji 1* , A. O. Aluko 1 and A. O. Adetunmbi 2 1 Department of Computer Engineering, Federal Polytechnic, Ile-Oluji, Nigeria. 2 Department of Electrical/Electronic Engineering, Federal Polytechnic, Ile-Oluji, Nigeria. Authors’ contributions This work was carried out in collaboration among all authors. All authors read and approved the final manuscript. Article Information DOI: 10.9734/JERR/2021/v21i417460 Editor(s): (1) Djordje Cica, University of Banja Luka, Bosnia and Herzegovina. Reviewers: (1) Bilal Abdullah Nasir, Northern Technical University, Iraq. (2) Gabriel Gomes De Oliveira, UNICAMP Universidade Estadual de Campinas, Brazil. Complete Peer review History: https://www.sdiarticle4.com/review-history/76091 Received 01 September 2021 Accepted 03 November 2021 Published 15 November 2021 ABSTRACT Over the years, the decline of Nigeria’s health-care infrastructure has become alarming. The 2018 annual report of WHO shows that 75% human cardiovascular disease resulted from High Blood pressure. Immediate technical action is needed to alleviate the severity to the barest minimum. This research work presents a designs and implementation of microcontroller based Heart Beat Monitoring System for High Blood Pressure Patients. The developed system consists of three sections which include; Input section consisting of Heart beat sensor that senses and converts the blood pulse from a fingertip into an electrical signal. The sensor thereafter sends the signal into microcontroller, which is the control section that acts and communicates the result through LCD and output section. The displayed results show the beat rate in unit of beat per minute (BPM). The developed system was evaluated and demonstrated with two other standard devices namely: Pulse Oximeter and Digital Arm Cuff using a one-way analysis of variance (ANOVA) to determine its level of significance. The P Value of 0.519049 was found significant at 0.05 level of significance. Additionally, the results indicate that there is no significant difference among the three devices. It was concluded the designed device is more cost effective, user friendly and easily assembled due availability of needed materials in contrast with the other standard devices. Original Research Article
-
Upload
khangminh22 -
Category
Documents
-
view
0 -
download
0
Transcript of Design and Implementation of Heart Beat Monitor System

_____________________________________________________________________________________________________ *Corresponding author: Email: [email protected];
Journal of Engineering Research and Reports
21(4): 68-87, 2021; Article no.JERR.76091 ISSN: 2582-2926
Design and Implementation of Heart Beat Monitor System
F. T. Oyediji1*, A. O. Aluko1 and A. O. Adetunmbi2
1Department of Computer Engineering, Federal Polytechnic, Ile-Oluji, Nigeria.
2Department of Electrical/Electronic Engineering, Federal Polytechnic, Ile-Oluji, Nigeria.
Authors’ contributions
This work was carried out in collaboration among all authors. All authors read and approved the final
manuscript.
Article Information
DOI: 10.9734/JERR/2021/v21i417460 Editor(s):
(1) Djordje Cica, University of Banja Luka, Bosnia and Herzegovina. Reviewers:
(1) Bilal Abdullah Nasir, Northern Technical University, Iraq. (2) Gabriel Gomes De Oliveira, UNICAMP Universidade Estadual de Campinas, Brazil.
Complete Peer review History: https://www.sdiarticle4.com/review-history/76091
Received 01 September 2021 Accepted 03 November 2021 Published 15 November 2021
ABSTRACT
Over the years, the decline of Nigeria’s health-care infrastructure has become alarming. The 2018 annual report of WHO shows that 75% human cardiovascular disease resulted from High Blood pressure. Immediate technical action is needed to alleviate the severity to the barest minimum. This research work presents a designs and implementation of microcontroller based Heart Beat Monitoring System for High Blood Pressure Patients. The developed system consists of three sections which include; Input section consisting of Heart beat sensor that senses and converts the blood pulse from a fingertip into an electrical signal. The sensor thereafter sends the signal into microcontroller, which is the control section that acts and communicates the result through LCD and output section. The displayed results show the beat rate in unit of beat per minute (BPM). The developed system was evaluated and demonstrated with two other standard devices namely: Pulse Oximeter and Digital Arm Cuff using a one-way analysis of variance (ANOVA) to determine its level of significance. The P Value of 0.519049 was found significant at 0.05 level of significance. Additionally, the results indicate that there is no significant difference among the three devices. It was concluded the designed device is more cost effective, user friendly and easily assembled due availability of needed materials in contrast with the other standard devices.
Original Research Article

Oyediji et al.; JERR, 21(4): 68-87, 2021; Article no.JERR.76091
69
Keywords: Heart beat; monitoring system; microcontroller; high blood pressure; patient.
1. INTRODUCTION There is global work demand and social issues in the nation especially African countries, this has resulted to increase in stress at work place, the end result is high blood pressure and heat related diseases, Therefore, heartbeat measurement is essential for heart health awareness, this prompted the design of a heart beat monitoring system. Heart rate, also known as pulse, is the number of reoccurrence of an individual's heart beats per minute. A normal heart rate depends on the so many factors such as age, size, body activities and other conditions. High Blood pressure which also considered as increased blood pressure or hypertension is a cardiovascular diseases (CVD) in which the blood circulates at a constant increased pressure. Blood pressure (BP) is the force per unit area applied by blood, when it exerts pressure against the walls of the blood vessels, especially the arteries. When the heart beats faster or harder, Blood Pressure increases and when blood volume increases and blood pressure also increases [1]. Blood pressure is normally recorded as a series of two numbers, usually, one written above the other. The top number is the systolic blood pressure which is the highest pressure in blood vessels which occurs as the heart contracts (heartbeat). Heart beat Monitoring System is an electronic device that is used for measurement of heart rate which is the speed of the heart beat in number of contractions of the heart per minute (bpm). In order to always remain healthy, it is necessary to constantly monitor body temperature, heart rate and blood pressure. Thermometers are used to measure body temperatures and a sphygmomanometer can be used for monitoring the Arterial Pressure or Blood Pressure. Heart Rate is usually monitored in two ways: one way is to manually check the pulse either at wrists or neck and the other method is to use a Heartbeat Sensor. Vikramsingh et al., [2] explain heart rate as the number of times a heart contracts and relaxes in a unit of time (usually per minute). The normal heart rate varies from person to person, checking of an individual’s heart beat is very essential for total good health. Knowledge of heart beat can create an awareness for the fitness of an
individual, the heart rate can vary epending on the body's physical needs. Arora et al., [3] designed a prototype for effective monitoring of Heart beat rate. Light Dependent Resistance (LDR) and Light Emitting Diode (LED) were used to capture the input signals for the Heart Beat (HB) sensor. The sensor functions by sensing the heartbeat of an individual and afterwards conversion to the form of electrical signals and pulses is done. The signals are amplified using a dedicated signal conditioning circuit and then processed by a controller. The heartbeat rate determines the frequency of the signal, this was used in the basic principle of Heart Beat measuring system. The individual undergoing the blood pressure is examined by putting his/her finger in the Heart Beat sensor for acquiring the input signals. The proposed system was implemented on the hardware and also simulated in Proteus ISIS 7.10 to prove its effectiveness. Arulananth and Shilpa, [4] describes a technique of measuring the heart rate through a fingertip and Arduino, this device is based on the principal of Photo Phelthysmo Graphy (PPG) which is non-invasive method of measuring the variation in blood volume in tissue using a light source and detector. While the heart is beating, it is pumping blood throughout the body, and that makes the blood volume inside the finger artery to change too. This fluctuation of blood can be detected through an optical sensing mechanism placed around the fingertip. The signal can be amplified and is sent to Arduino with the help of serial port communication. With the help of processing software heart rate monitoring and counting is performed. Shirzadfar et al.,[5]presented a heart rate measuring device in this paper, which first infrared light is transmitted by the infrared sensor (IR LED TX) to the fingertip and then reflects light on a Photodiode RX sensor and converted to a suitable signal by the Signal Conditioning, and suitable signal sent to the microcontroller, finally, the heart rate is measured by processing and analysis. On the device, when the power button is pressed, the user places his fingertip on the sensors then the microcontroller key is pressed and then the heart rate is measured in 15 seconds and displayed on the LCD screen. Using this device, it can be measured
Oyediji et al.; JERR, 21(4): 68-87, 2021; Article no.JERR.76091
70
easily and in a short time, heart rate with a non-invasive method without harm to the human body. Mehmet, [6] presented an Android application that monitors the heart rate, heart rate variability and CT parameters for the cardiovascular patients under constant care and monitoring. The system components comprise of wearable sensors that continuously measure the patient’s cardiovascular signs by a wireless connectivity. The system then transmits the sensed signals to an Android interface through the wireless connectivity. The system is configured to determine if the critical value of the three parameters (Heart rate (HR), Heart rate variability (HRV), and Body Temperature (BT) is exceeded. If so, then the values of the three parameters and the real-time location of the patient are transmitted to the doctor and the family members as an email message, and Twitter notification for quick response. This system provides the patients with mobility within their surroundings for better living. Asada et al., [7]designed a ring sensor for measuring blood oxygen saturation (SpO2) and heart rate, the ring sensor was completely self-contained and worn on the base of the finger (like a ring), it integrated techniques for motion artifact reduction, which were designed to improve measurement accuracy. Applications of the ring sensor ranged from the diagnosis of hypertension to the management of congestive heart failure. Nowadays, the monitoring system has been developed to continuously monitor health conditions to ensure the human body is constantly maintained in good condition. Heart rate, blood pressure, and glucose level are some of the vital parameters that are continuously measured [8]. By using the innovative approach of designing the heart monitoring device, it is easy to monitor the heartbeat rate in the hospitals, home care units, sports and anywhere. This heart monitoring system can be used for Blood pressure patients who have a daily check-up and it can easily be operated or used by the patients. Therefore, the purpose of this work is to design a simple, friendly to use and portable device that can monitor the heartbeat rate of a High Blood Pressure patient and individual.
2. LITERATURE REVIEW
2.1 Theoretical Review of Heart Beat Monitor System
The general rule is that anything that increases the heart rate increase blood pressure and anything that decreases the heart rate causes a decrease in blood pressure. We know that blood pressure can be affected by many factors such as stress, shock, emotion, exercise, sleep, etc. All the factors mentioned above also affect the heart rate. It is widely accepted that blood pressure will increase with heart rate and vice versa. When blood passes through the heart and enters the veins, a pressure wave is applied to the veins, which causes pulses to arise in the blood vessels. In fact, the pulse is a contraction and expansion in the veins that occurs when the blood passes out of the left ventricle. The pulse can be touched and measured by placing fingers on the points where the vein passes through the bone [5]. 2.1.1 High blood pressure High blood pressure is one cause of death or severe illness [9]. High blood pressure is also called hypertension is a silent killer disease because the original cause is unknown or without symptoms at all. Hypertension can cause various complications that can lead to several other diseases, such as heart disease, blindness, kidney, and stroke until death. People suffering, from hypertension should take regular blood pressure measurement because blood pressure is a vital sign of humans that can change over time. High blood pressure is a common condition leading to cardiovascular disease (CVD). Hypertension (HTN) is determined by increased pressure in the arteries that can lead to stress on the heart, also known as hypertensive heart disease, [10]. Hypertension is the single most important risk factor for cardiovascular diseases (CVD) and a key driver of global disease burden. It is also a high-yield target to reverse the epidemic of non-communicable diseases (NCDs) globally [11]. 2.1.2 The heart
The heart is a sensitive organ in most animals, which pumps blood via the blood vessels of the circulatory system provides the body with needed oxygen and nutrients, as well as in the removal of metabolic wastes [12]. In humans, the heart is

Oyediji et al.; JERR, 21(4): 68-87, 2021; Article no.JERR.76091
71
located in the middle compartment of the chest exactly between the lungs. In humans, other mammals and birds, the heart is divided into four chambers: right atrium and ventricles; and left atrium and ventricles. Commonly the right atrium and ventricle are referred together as the right heart and their left counterparts as the left heart. The heart is enclosed in a protective sac, the pericardium, which contains a small amount of fluid. The wall of the heart is made up of three layers: epicedium, myocardium, and endocardium. Although pacemaker activity does not depend on extrinsic nerves, the frequency of pacemaker firing can be modified by autonomic nerves; sympathetic activity increases it, parasympathetic activity decreases it. Sympathetic fibers also regulate the contractile force and therefore the stroke volume. Contrary to established dogma, the vagus nerve also innervates the ventricle and can depress contraction. Thus, both components of the cardiac output, namely heart rate and stroke volume (SV), are under central nervous control and local circuit control within the heart itself (the heart's little brain), to regulate cardiac excitability and contractile strength. Importantly, the central nervous system also receives sensory afferent information from skeletal muscle, the heart, kidneys, and arterial and cardiopulmonary receptors to help regulate cardiac function. 2.1.3 The heart rate Heart rate is the defined as the speed of heartbeat measured by the number of contractions (beats) of the heart per minute (bpm). The heart rate can vary according to the body's physical needs, including the need to absorb oxygen and excrete carbon dioxide. It is usually equal or close to the pulse measured at any peripheral point. Activities that can provoke change include physical exercise, sleep, anxiety, stress, illness, and ingestion of drugs. The American Heart Association states the normal resting adult human heart rate is 60–100 bpm. Tachycardia is a fast heart rate, defined as above 100 bpm at rest. Bradycardia is a slow heart rate, defined as below 60 bpm at rest. During sleep, a slow heartbeat with rates around 40–50 bpm is common and is considered normal. When the heart is not beating in a regular pattern, this is referred to as an arrhythmia.
2.1.4 Blood pressure Blood pressure (BP) is the pressure of circulating blood on the walls of blood vessels used without further specification, "blood pressure" refers to the pressure in large arteries of the systemic circulation, and is expressed in terms of the systolic pressure (maximum during one heartbeat) over diastolic pressure (minimum in between two heartbeats), is measured in millimeters of mercury (mmHg) above the surrounding atmospheric pressure. Blood pressure is one of the vital signs, along with respiratory rate, heart rate, oxygen saturation, and body temperature. Normal resting blood pressure in an adult is approximately 120 millimeters of mercury (16 kPa) systolic, and 80 millimeters of mercury (11 kPa) diastolic, abbreviated "120/80 mmHg". Traditionally, blood pressure was measured none invasively using a mercury tube sphygmomanometer, or an aneroid gauge, which is still generally considered to be the gold standard of accuracy for auscultatory readings [13]. More recently other semi-automated methods have become common, largely due to concerns about potential mercury toxicity, although cost and ease of use have also influenced this trend [13]. Early automated alternatives to mercury-tube sphygmomanometers were often seriously inaccurate but validated devices allow for an average difference between two standardized reading methods of 5 mm Hg or less and a standard deviation of less than 8 mm Hg [14]. Blood pressure is influenced by cardiac output, total peripheral resistance, and arterial stiffness and varies depending on the situation, emotional state, activity, and relative health/disease states. In the short term, blood pressure is regulated by baroreceptors which act via the brain to influence nervous and endocrine systems. Low blood pressure is called hypotension, and consistently high pressure is hypertension. Both have many causes and may be of sudden onset or long duration. Long-term hypertension is a risk factor for many diseases, including heart disease, stroke, and kidney failure. Long-term hypertension is more common than long-term hypotension, which often goes undetected because of infrequent monitoring and the absence of symptoms.

Oyediji et al.; JERR, 21(4): 68-87, 2021; Article no.JERR.76091
72
2.1.5 Heart rate and blood pressure The relationship between heart rate and blood pressure is more complicated when both central and peripheral blood pressures are considered. Recent investigations have revealed the importance of central blood pressures and the conduction properties of the vasculature with adverse outcomes [15]. Typical office blood pressure measurement is obtained peripherally, usually from the brachial artery. Unfortunately, this measurement does not account for marked variability in vascular compliance, leading to differences between central pressure measurements and pressure measurements peripherally of up to 20 mmHg. These marked differences have led to increased interest in the detection of the central blood pressure profile as an important clinical marker for increased cardiovascular risk. The relationship between heart rate and blood pressure is location-dependent. There is a direct relationship between heart rate and peripheral blood pressure. However, several studies have demonstrated an inverse relationship between heart rate and central blood pressures. Among the offspring of patients with familial hypertension, heart rate was inversely related to the augmentation index (Yasim and Brown, (2010). Investigators have also evaluated the effect of increasing heart rate via pacing or pharmacologically. Wilkinson et al., (2011) demonstrated that increased heart rate by pacing decreases the augmentation index and central systolic blood pressure. Similarly, increasing heart rate is adrenaline infusion associated with a decrease in the augmentation index. The relationship between heart rate and augmentation index may be stronger in subjects with increased PWV [16]. In summary, while elevated heart rate is associated with increased peripheral blood pressure, there appears to be an inverse relationship between heart rate, central blood pressure, and augmentation index. These varying relationships have important therapeutic implications when considering antihypertensive medications that affect heart rate. 2.1.6 The heart rate monitoring device A heart rate monitor is a personal monitoring device that allows one to measure one's heart rate in real-time or record the heart rate for later study, it is largely used by performers of various types of physical exercise. In recent years, it has been common for smart-watches to include heart
rate monitors, which has greatly increased popularity. Early models consisted of a monitoring box with a set of electrode leads attached to the chest. The first wireless ECG heart rate monitor was invented in 1977 by Polar Electro as a training aid for the Finnish National Cross Country Ski team [17]. As "intensity training" became a popular concept in athletic circles in the mid-80s, retail sales of wireless personal heart monitors started in 1983 Traditional heart rate monitors usually comprise two elements: a transmitter, worn on a chest strap, and a receiver. In early transmitters, water or liquid was required to get good conduction. In old versions, a radio signal is transmitted when a heart-beat is detected, which the receiver uses to determine the current heart rate. This signal can be a simple radio pulse or a unique coded signal from the chest strap, the latter prevents one user's receiver from using signals from other nearby transmitters (known as cross-talk interference). More recent devices use optics to measure heart rate by which measures changes in blood flow by shining a light from LED through the skin and measuring how it scatters off blood vessels. In addition to measuring the heart rate, devices using this technology can measure blood oxygen saturation (SpO2) [18]. Newer devices include a microprocessor, which simultaneously monitors heart rate, oxygen saturation, and other parameters. These may include sensors such as accelerometers, gyroscopes, and GPS to detect speed, location and distance eliminating the need for ankle worn devices. The device is most useful if it is portable, and requires a battery to be able to power all of the necessary components as well as the power output of the battery to be regulated. The implementation of the heart monitor involves low-cost amplifier and filter components coupled with a sophisticated microcontroller and LCD screen.
3. MATERIALS AND METHOD OF STUDY 3.1 Materials The materials used for the design is divided into hardware and software parts, the main hardware parts are the microcontroller interfacing with the heartbeat sensor and the Liquid Crystal Display (LCD) through connecting wires [19]. Below are the lists of components selected and used for the design, namely:

Oyediji et al.; JERR, 21(4): 68-87, 2021; Article no.JERR.76091
73
i. ATMEGA 328P ii. Heartbeat sensor module iii. Resistor (10K, 1K, 3.3K) iv. Variable Resistor 10K v. Capacitors 22Pf vi. Variable Resistor (L7805CV) vii. Crystal Oscillator Display (LCD) viii. Connecting pins ix. Connecting wires x. Vero board xi. Switch xii. Battery Clip
The working system of the designed heartbeat monitoring device consists of hardware systems and software systems. The hardware system of this tool consists of microcontroller Atmega 328 which serves as a controller work from a heartbeat device. The sensor serves as a detector of pulse, Liquid crystal display (LCD) displays four-line as the current heartbeat, time is measured in seconds, software system tool is a program created using Arduino Software (IDE) with Language C [20]. They are integrated to complete the system design, as follows:
The block diagram shows how the following units were integrated, namely;
(i) Power Supply Unit (ii) Microcontroller unit (iii). Input unit (Heart beat sensor) (iv). Output unit (LCD)
3.2 Input Unit
Heartbeat sensor serves as an analogy input signal for microcontroller through which the user communicates with the system and the Heart
beat is detected by the heartbeat pulse sensor in which the heart rate per minute can be measured [21]. This is shown in Fig. 2 below. The sensor used for the conversion of blood pulse into an electrical signal is a pair of infrared (IR) emitter and detector, the emitter and detector will be put side by side facing upwards. When a fingertip is placed on top of both the emitter and detector, the Infrared light will be reflected by the finger and the blood circulation inside the finger will gradually result in periodic change of Infrared intensity reflected, this invariably results in period current response in the detector. The response is rather weak and could be noisy, therefore there is a need for proper amplification of the signal for microcontroller input. The recommended forward voltage of the emitter from the datasheet is 1.2 V with a forward current of 20 mA.
3.3 The Control Unit The microcontroller is a central processing unit (CPU) of the system which gives instructions, accepts and process inputs through the heartbeat sensor and finally displays the processed output through the LCD [22]. A microcontroller (MCU) is a small computer on a single Integrated Circuit (IC), the program loaded in it specifies its functions, like all computers, microcontrollers are equipped with components such as central processing unit (CPU), memory system, input/output system, clock or timing system, and a bus system to interconnect constituent systems. The bus system includes an address bus, a data bus, and a control bus, the MCU consists of many systems that integrated a single integrated circuit package.
Fig. 1. Block diagram of heart beat Monitor System

Oyediji et al.; JERR, 21(4): 68-87, 2021; Article no.JERR.76091
74
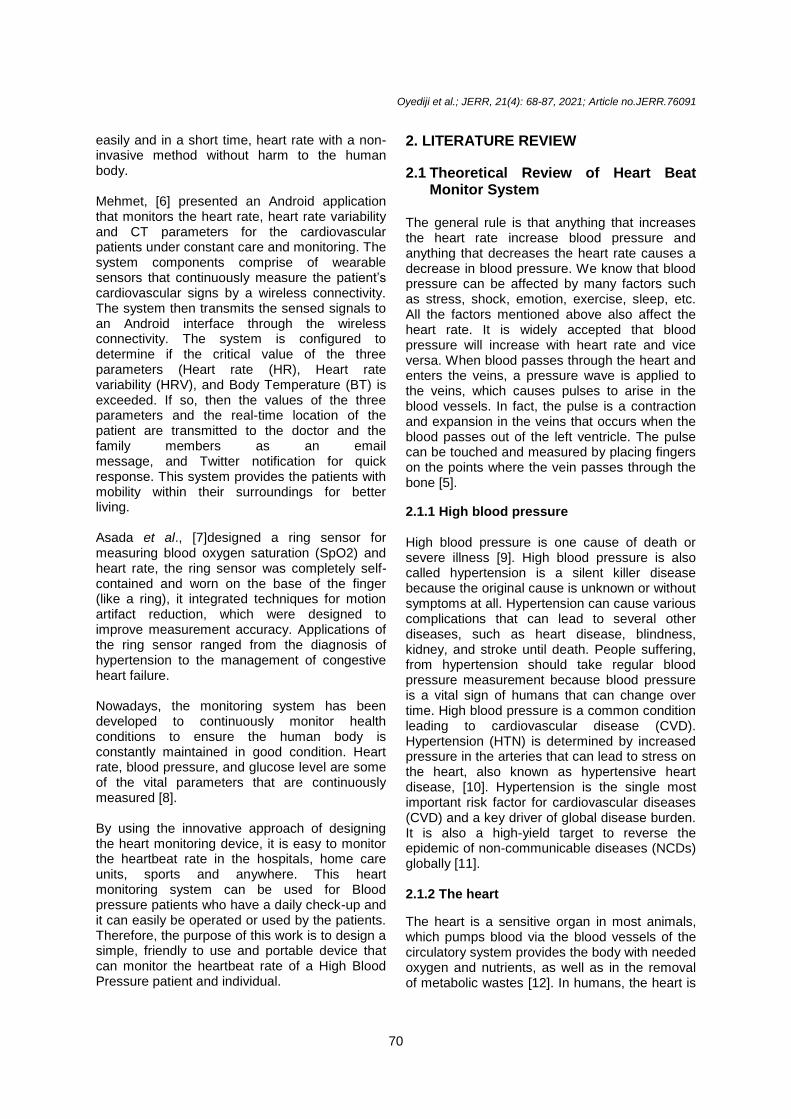
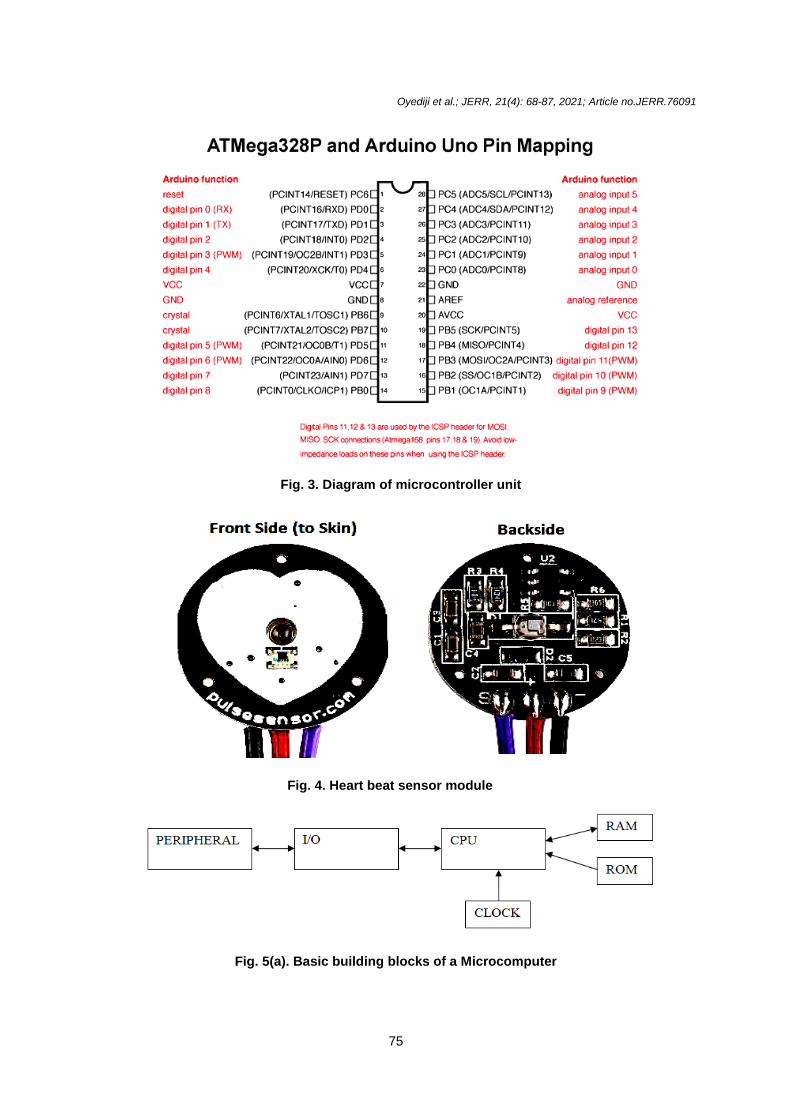
The microcontroller (ATmega328P) is the main control unit which was selected for several reasons. Firstly, it is operated on a +5 V DC supply and draws very little current. Furthermore, it has a very low power dissipation and high speed of operation and still maintains its data in case of power loss. Finally, it has a large storage memory which processes and verifies the heart rate inputs (Entered pin), and generate control signals to display unit. Thus, this is done by comparing the signal with the right PIN in the electric erasable programmable memory (EEPROM) memory (internal), if it is correct, it activates the port RD1which is connected to the sensor (this represents the load), and also send an output text display on the LCD, indicating "Enable mode. ATmega328P is used in Arduino Uno boards, and it was to install the Arduino boot loader into the chip [23]. This IC with boot loader can be placed on the Arduino Uno board and burn the program into it. Once the Arduino program is burnt into the IC, it can be removed and used in place of the Arduino board, along with a Crystal oscillator and other components as required for the project [24]. Fig. 3 is the pin mapping between Arduino Uno and ATmega328P chip. After the amplification, the sensor module used for this project is an Open Source heart rate monitor which was considered as a Photoplethysmography (PPG) device used to monitor the non-invasive heart rate, it measures the real-time heart beats and calculates BPM with the aid of algorithms implemented by Arduino [25]. This sensor has two sides, the front side which has an heart shape was attached to the skin, the pins of the pulse sensors are three as shown in Fig. 4 below. If the front side is facing the individual operating it, then pin at the left flank is the GND while the middle side is the input voltage which will be connected to the +5V Arduino. The output was connected with the analog pins of the Arduino [26].
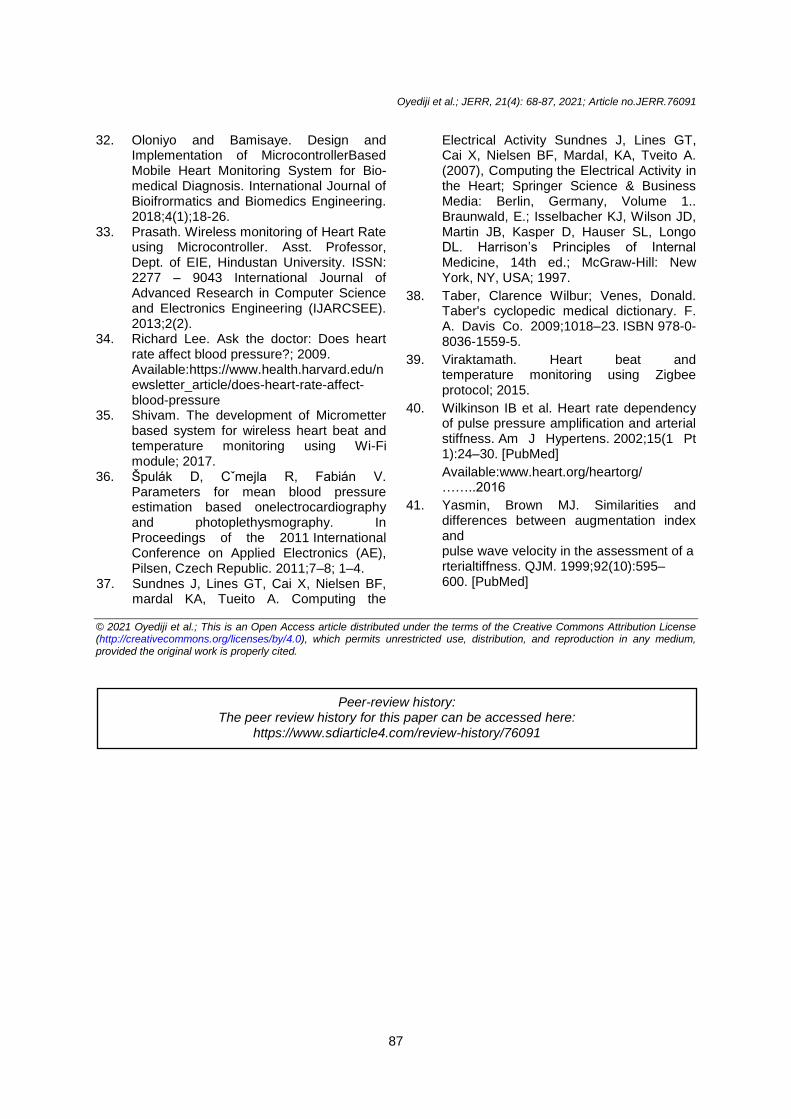
The microcontroller used in this design is Arduino Uno. The Microcontroller takes the output of the Sensor Module, which is a periodic analog voltage signal [27]. Irrespective of complexities, all microcomputer systems (Fig. 5) are based on similar building blocks. It consist of the following namely;
1. CPU (Central Processing Unit) – control for all logic and arithmetic functions
2. RAM (Random Access Memory) - storage for programs and/or program variables
3. ROM (Read Only Memory) - read-only parts of programs
4. I/O (Input/ output) - connection to external devices
The CPU or microprocessor is the core component of any microcomputer and it requires the external components such as the ROM, RAM, I/O, etc. to accomplish its purpose. A microcontroller is a stripped-down version of the very same architecture, with all the important features placed on one chip [28]. The microcontroller based system requires no additional circuit component except for a clock input and it can directly drive peripheral outputs many cases. The difference between the microprocessor and the microcontroller arises because of their different end-usage [29]. For this project, many microcontrollers were investigated and PIC16F877A was chosen because of the following features namely;
1. 14-bit instructions 2. 8 bit data values, byte addressed 3. Harvard architecture (separate
address/data memory) 4. Storage capacity: 8k x 14 Flash EPROM
(program storage) 5. 256x8 EEPROM 6. 368x8 SRAM (data storage) 7. Universal Asynchronous/Synchronous
Receiver/Transmitter (UART) 8 channel, 1-bit A/D converter.
Fig. 2. Heart beat sensor
Oyediji et al.; JERR, 21(4): 68-87, 2021; Article no.JERR.76091
75
Fig. 3. Diagram of microcontroller unit
Fig. 4. Heart beat sensor module
Fig. 5(a). Basic building blocks of a Microcomputer

Oyediji et al.; JERR, 21(4): 68-87, 2021; Article no.JERR.76091
76
Fig. 5(b). A microcontroller based system
3.4 The Output unit (LCD) The display unit (output unit) used for the design is Liquid Crystal Display (LCD) because of its ability to display numbers, character, graphics, ease of programming for characters and graphics and low power consumption [30]. The 20 x 4 character LCD has four rows of 20 characters each, it also has a back-ground light which enhances readability in low light conditions.
3.5 Method of Study The design of the heart beat monitoring system required power supply of Direct Current of 5V. To obtain a constant and stable 5V output, a regulator circuit was designed. The regulator circuit utilized an input voltage of 9V battery and produced an output of constant 5V voltage. By using a Zener diode D1, resistor R1, and transistor Q1 to form a voltage regulator, where R2 is the load resistor. The output voltage is given by the equation below: ……………………….(1) Where, ZZT = 11 ohm From the Zener model, beta = 130. The load resistance is estimated to be 10 ohms, leading to a current of 0.5 A. Assuming V3 = 5 ± 0.4 V, this lead to R1 which should larger than approximately 80 ohm. Therefore the resistance value selected for R1 will be 1 KΩ. The minimum current passing R2 will be given as shown below in equation (2)
……(2)
This yeilds maximum R2 which is about 700 ohms. Load resistance is calculated as shown below: R1 = (5 V – 1.2 V) / 20 mA = 190 Ω To control the ripples and noise, a decoupling capacitor C1 was added with 50% Duty Cycle. Frequency Equation is given by:
(3)
Where, f = frequency
R = Resistance C = capacitance
By manipulating the time constant of just one of the RC combinations, the Duty Cycle also known as the “Mark-to- Space” ratio of the output waveform can be accurately set and it is given as the ratio of resistor R2 to resistor R1. The Duty Cycle for the LM324 Oscillator or ratio of the “ON” time divided by the “OFF” time is given by:
Oscillator Duty Cycle:
To realize a gain of 10, R1 will be assigned 10 kΩ and R2 will be assigned 1 kΩ. The low-frequency roll-off fc = 1/(2πR5C3) = 0.1 Hz. So it can be designed that R3 = 100 kΩ, R4 = 150 kΩ and C1 = 10 uF. From the duty cycle formula, R1 was calculated to be equal to R2 and 100 kΩ resistors were selected.

Oyediji et al.; JERR, 21(4): 68-87, 2021; Article no.JERR.76091
77
Fig. 6. Liquid crystal display
Fig. 7. Regulated power supply circuits circuit (5V)
Fig. 8. Amplifying circuits for sensor module

Oyediji et al.; JERR, 21(4): 68-87, 2021; Article no.JERR.76091
78
3.6 Stages of Construction There are many stages involved in the construction of this project work, they are: i. Designing stage ii. Soldering stage iii. Power stage (Battery 9v regulated to 5v) iv. Programming Stage using arduino, C
language v. Coupling Stage vi. Packaging stage vii. Test running Stage viii. Statistical analysis
3.7 Designing Stage The circuits diagram was designed using Electronics Proteus Software, the circuit diagram was simulated before proceeded to the next stage [31].
3.8 Complete Circuit Description The 9V power supply was connected to the voltage regulator for the purpose of stepping down the voltage required for the microcontroller (4.5V to 5.5V). The voltage regulator has three components, the first component was connected to the 9V battery on positive terminal, and
second component was grounded which must to be connected to pin 8 of the microcontroller [32]. The last component was connected to microcontroller pin 7. A 10KΩ resistor was used and connected to pin 1 through pin 7 of microcontroller. The two capacitors with 22pF each was connected to 16MHZ crystal oscillator in parallel connection with the microcontroller on pin 14 through pin15 respectively. This is to synchronize the operation of the microcontroller and other electronics on the board.
The pin 1 of Microcontroller was described as a master clear (MCLR) which was used for reset button. The LCD with 16 pins was connected to pin 4 (RS) and pin 6 (EN) and the last 4 pins of the 8bit ASCII code: D4, D5, D6 and D7 with microcontroller at pins: 13, 12, 11 and 6 which are data bus respectively. Pins:1 (Vss), 3 (Vee), 5 (R/W) connected in series with pin D0- D3 alongside with 10KΩ resistor were grounded, pins 7 and 10 are for the backlight of the LCD and only pin 2 was connected to the power supply, pin 8 and pin 22 on microcontroller were also grounded. The heart beat sensor has 3 pins in which the output pins blue colour wire is connected to microcontroller, another pin is connected to the battery and the third pins was grounded. They were interfacing with the microcontroller on port assignments. Fig 7 shows the connection in detail.
Fig. 9. The Circuit diagram of the Heartbeat Monitor

Oyediji et al.; JERR, 21(4): 68-87, 2021; Article no.JERR.76091
79
3.8.1 Code Loading process to Program Integrated Circuit (PIC) Microcontroller
The code loading process of the microcontroller is called dumping. The microcontrollers understand only the machine level language, which contains '0 or 1s'. There is a need to load the hex code into the microcontroller. There is much software available in the market for loading the code to the microcontroller. Mikroc' programmer software was used to dump the code to the ATmega328P microcontroller through the Arduino board (Fig.10). This software needs to be installed on the computer. Here are the steps used for loading the code onto the microcontroller [33]. Entire process of using an ATMEGA328P goes like this:
1. List the functions to be executed by the controller.
2. Write the functions in programming language in IDE programs.
3. The IDE program was downloaded from Mikroc
4. ATMEGA328P programming can also be done in ARDUINO IDE.
5. After writing the program, compile it to eliminate errors.
6. Make the IDE generate the HEX file for the written program after compiling.
7. This HEX file contains the machine code which should be written in controller flash memory.
8. Choose the programming device (usually SPI programmer made for AVR controllers) which establishes communication between PC and ATMEGA328P. It can also be program
ATMEGA328P using ARDUINO UNO board.
9. Run the programmer software and choose the appropriate hex file.
10. Burn the HEX file of written program in ATMEGA328P flash memory using this program.
11. Disconnect the programmer, connect the appropriate peripherals for the controller and get the system started.
3.8.2 Coupling stage The heart beat sensor was connected to the input pins of signal conditioning circuit and the output from signal conditioning was connected to the Vin and GND of the power pins, and pin 10 and 11 of digital pins on Arduino board. Digital pins 2, 3, 4, 5 was connected to the LCD pins Do-D3 and Microcontroller circuit were connected [34]. 3.8.3 Package stage Pyrex case was chosen for the packaging (Fig.12). The portion for LCD, Sensor and switch were cut out for proper display [35].
3.8.4 Test running stage
The coupled complete circuit was tested and their effectiveness was determined, a finger-tip was place on the sensor and the switch was “ON”, the LCD was watched for information [36].
3.9 Tatistical Analysis
The one-way analysis of variance (ANOVA) was used for analysis, the heat beat reading were obtained from different individuals to confirm the effectiveness of the constructed device [37].
Fig. 10. Code dumping device

Oyediji et al.; JERR, 21(4): 68-87, 2021; Article no.JERR.76091
80
Fig. 11. Couple Microcontroller heartbeat monitor system
Fig. 12. Couple and package Microcontroller heart beat monitor system The one-way analysis of variance (ANOVA) was used to determine whether there are any statistically significant differences between the means of three or more independent (unrelated) groups [38]. The one-way ANOVA compares the means between the groups you are interested in and determines whether any of those means are statistically significantly different from each other [39]. Specifically, it tests the null hypothesis: where µ = group mean and k = number of groups. If, however, the one-way ANOVA returns a statistically significant result, we accept the alternative hypothesis (HA), which confirms that there are at least two group means that are statistically significantly different from each other [40, 41].
4. RESULTS AND DISCUSSION Different people were tested with the constructed Microcontroller based heartbeat monitor system (Fig.13) using finger-tip instrument. Medical Institutions visited includes Ogunsusi Specialist Hospital Ile-Oluji, Ondo State, and The Federal
Polytechnic Ile-Oluji Medical center which are domiciled within the research facility. The following are the results obtained. The heartbeat sensor picked the pulse signal (flow of blood) from the finger-tip and sends it to the signal conditioning circuit; the signal contains some element of ripples and noise. That ripples and noise were removed by a filter capacitor and the signal was sent to the microcontroller for proper modification. All these happenned within a few milliseconds; the results obtained from the microcontroller was loaded and displayed on the LCD. Just like the way the fingertip was placed on the constructed device, it was likewise placed on a pulse oximeter and digital arm cuff was also used to test the effectiveness of constructed microcontroller heartbeat monitor system and the readings were recorded.
4.1 Results Results of the test conducted on different people using the constructed microcontroller-based

Oyediji et al.; JERR, 21(4): 68-87, 2021; Article no.JERR.76091
81
heartbeat monitor system by finger-tip, Pulse Oximeter and heartbeat from digital arm cuff was recorded in Fig. 14 below. Three devices were used to test one person at the same time to know
the effectiveness of a constructed microcontroller heartbeat monitoring device as described below in Table 1.
Fig. 13. Testing of heart beat by placing any finger-tip on sensor
Fig. 14. The comparison of heart beat measurement from the three devices
0
20
40
60
80
100
120
140
1 3 5 7 9 11 13 15 17 19 21 23 25 27 29 31 33 35 37 39
He
art
be
at (
BP
M)
Number of Individuals
Microcontroller Based Heart Beat Monitor System (BPM)
Pulse Oximeter (EKHO) Product
Heart Beat (Pulse from digital Arm Cuff, Omron Product)

Oyediji et al.; JERR, 21(4): 68-87, 2021; Article no.JERR.76091
82
Table 1. Measurement of heart beat obtained from three devices
S/N Patient(P)
Microcontroller Based Heart Beat Monitor System (BPM)
Pulse Oximeter(EKHO) Product
Heart Beat(Pulse from digital Arm Cuff, Omron Product)
Blood Pressure (Omron Product)
1 P1 78 84 63 121/83
2 P2 84 97 93 100/70
3 P3 96 121 108 127/82
4 P4 65 76 87 105/56 *
5 P5 61 62 60 121/73
6 P6 85 80 83 148/98
7 P7 78 66 75 111/52*
8 P8 72 68 68 125/78
9 P9 72 73 75 127/80
10 P10 90 90 94 128/75
11 P11 78 89 91 112/76
12 P12 78 91 82 120/77
13 P13 66 62 74 106/78
14 P14 90 86 95 128/70
15 P15 90 81 84 119/69
16 P16 84 83 81 115/74
17 P17 90 82 77 113/68
18 P18 75 75 75 110/77
19 P19 72 82 71 103/65*
20 P20 72 76 77 120/84
21 P21 72 92 93 124/79
22 P22 78 62 69 112/77
23 P23 72 70 74 120/66
24 P24 64 72 78 118/89
25 P25 96 75 67 115/75
26 P26 76 83 86 131/77
27 P27 84 80 81 119/78
28 P28 66 70 78 123/65

Oyediji et al.; JERR, 21(4): 68-87, 2021; Article no.JERR.76091
83
S/N Patient(P)
Microcontroller Based Heart Beat Monitor System (BPM)
Pulse Oximeter(EKHO) Product
Heart Beat(Pulse from digital Arm Cuff, Omron Product)
Blood Pressure (Omron Product)
29 P29 84 84 86 150/100*
30 P30 96 90 88 121/76
31 P31 61 64 63 112/64
32 P32 66 75 80 143/87
33 P33 60 63 67 130/86
34 P34 67 76 88 114/77
35 P35 72 86 87 134/92*
36 P36 78 70 71 144/83
37 P37 78 74 88 116/71
38 P38 84 83 84 111/71
39 P39 90 83 88 125/70
40 96 98 100 104/67

Oyediji et al.; JERR, 21(4): 68-87, 2021; Article no.JERR.76091
84
Table 2. One-way analysis of variance (ANOVA) for heartbeat measurement
Anova: Single Factor
SUMMARY Groups Count Sum Average Variance Microcontroller Based Heart Beat Monitor System (BPM) 40 3116 77.9 111.0154 Pulse Oximeter (EKHO) Product 40 3174 79.35 138.4897 Heart Beat (Pulse from digital Arm Cuff, Omron Product) 40 3229 80.725 113.6404
Table 3. One-way analysis of variance (ANOVA) for P-value of heartbeat measurement
ANOVA
Source of Variation
SS Df MS F P-value F crit
Between Groups 159.65 2 79.825 0.659446 0.519049 3.073763 Within Groups 14162.68 117 121.0485 Total 14322.33 119
Since the P value (0.519049) is greater than the level of significance (α= 0.05), it was concluded that there is no significance difference between the three devices. This shows that the mean of the three devices are not significantly different from each other.
4.2 Discussion After the device has been built, there was a need to calibrate it and check for the device efficiency to a standard instrument, which was the reason why sampling testing was carried out. The test results equally signify that the constructed device was working perfectly well and it responds to the assigned purpose of checking the number of times human's heartbeat, within one minute of testing, it was approximately used to determine the health condition of the user at that particular time and to know the actual state of such health. According to the above table and graph, it was confirmed that the constructed device microcontroller based heartbeat monitor system is working according to standard. Fig. 14 shows that the constructed device recorded values that are close to those recording using pulse oximeter and digital arm cuff, there was no significant difference between the constructed device and standard device after using of One-way analysis of variance (ANOVA) for the statistical analysis. The average adult, while resting, breathes about twelve times a minute. This was known as the ventilation, or respiratory rate (Damon et.al., 2007). The average heart rate, for a healthy adult, is around sixty to one-hundred beats per minute (60-100BPM), but it can be lower,
depending on the athleticism of a specific person. When we exercise, we have to breathe more often (quicker). That was why the heartbeat count of people from the sports pavilion was lower and those that have a high rate were checked immediately after they finished the exercise. The users that have heart count above the reference range are likely to be unhealthy and needed to visit a medical doctor for proper check-up and treatment. Heartbeat is likely higher if the user is under some health conditions like stress, worry, examination tension, fight, family challenges, and some other personal health challenges. If someone is breathing slower, then his/her heart rate will be slower, if he/she is breathing quicker, then his/her heart rate will be quicker. Many conditions can cause an increase or decrease in the rate at which the heart is beating. The resting heart rate indicates how hard your heart is working in its normal state. When you exert yourself, your heart rate increases. Harvet, (2009) received complain from client that; the blood pressure is often higher when the heart rate is close to its usual resting rate (about 50 beats per minute) and lower when the heart is beating faster than that, so the body's demands can cause higher blood pressure be partially satisfied by a faster heart rate. From table 1; patient heartbeat measurement from the constructed device is 85bpm, heartbeat measurement from a pulse oximeter is 80bpm and heartbeat measurement from digital arm cuff is 83bpm, and blood pressure reading is 148/98 mmHg which is high since systolic is higher than 140 and diastolic is close to 100. If the rate of

Oyediji et al.; JERR, 21(4): 68-87, 2021; Article no.JERR.76091
85
heartbeat is fast, the patient will have to go for a checkup. Likewise patient p29. For p32 and p36, that have blood pressure reading of 143/87 mmHg and 144/83 mmHg respectively, may need to see the doctor. It may be due to stress since their heartbeat is not mush high.
5. CONCLUSION AND RECOMMENDATION
5.1 Conclusion This research focused on the design of heart rate monitoring, the constructed device was able to monitor the heartbeat rate condition of patients, and individuals, and it determines the heartbeat rate per minute with displays of the heartbeat counts. The results obtained from the constructed microcontroller-based heartbeat monitor system were validated by comparing with pulse oximeter, arm cuff pulse and blood pressure measurement, the readings were closely similar and were still within the reference range heart rate. The constructed device is user friendly, operationally faster, flexible, materials adopted for its design can be easily accessed and cost effective when compared with pulse oximeter, arm cuff pulse and blood pressure measurement, therefore the constructed device is effective, accurate, portable, versatile, mobile and readily available for use with a low-cost advantage.
5.2 Recommendation A microcontroller-based heartbeat monitor system is a measuring instrument that can save many lives as possible by helping them to know the status of their heart and how their heart is functioning per time. It necessary that every individual improve their health by monitoring which can be achieved by regular check-up of the health condition through measuring instruments like heartbeat counter and other health-related devices. Microcontroller based heart counter is recommended for everyone, young and old, literates and illiterates, medical personnel for proper health condition monitoring and follow-up, it is recommended for people to remove human error and to lessen the burden of monitoring patient's health from doctor's head. It is also recommended that more research should be carried out for the purpose of
achieving more effectiveness and accuracy of health-related equipment or device, this will reduce the cost of importing most instruments that will be necessary for the use in the country and thereafter.
ACKNOWLEDGEMENTS The authors acknowledge and appreciate the Tertiary Education Trust Fund (TETFund), Nigeria for sponsoring this research through its Institution Based Research (IBR) intervention. The authors also acknowledge the management of Federal Polytechnic, Ile-Oluji, Ondo State, Nigeria for their support
COMPETING INTERESTS Authors have declared that no competing interests exist.
REFERENCES
1. Muni Saraswathi C, AnuRadha B, Babulu K. Analysis of Various Reponses Occur in the Cardiovascular System. International Journal of Engineering. 2012;2:1515-1522.
2. Vikramsingh. Heart and Temperature Monitoring System for Remote Patients using Arduino; 2017.
3. Arora J, Gagandeep Singh A. Heartbeat Rate Monitoring System by Pulse Technique Using HB Sensor. ICICES. Fingertip based heart beat monitoring system using embedded systems; 2014.
4. Arulananth TS, Shilpa B. Fingertip based heart beat monitoring system using embedded systems. International Conference on Electronics, Communication and Aerospace Technology ICECA; 2017.
5. Shirzadfar H, Ghaziasgar MS, Piri Z, et al. Heart beat rate monitoring using optical sensors. Int J Biosen Bioelectron. 2018;4(2):45–51. DOI: 10.15406/ijbsbe.2018.04.00097
6. Mehmet T. IoT Based Wearable Smart Health Monitoring System. Celal Bayar Univ. J. Sci. 2018;14:343– 350
7. Asada H. Harry, Phillip Shaltis,Andrew Reisner, Sokwoo Rhee and Reginald C. Hutchinson. Mobile Monitoring with wearable Photoplethys mographic Biosensors. ’IEEE Engineering in Medicine & Biology Magazine: The Quarterly

Oyediji et al.; JERR, 21(4): 68-87, 2021; Article no.JERR.76091
86
Magazine of the Engineering in Medicine & Biology Society. 2003;22(3):28-40.
8. Nurul et al. The Development of wireless Heart rate and temperature monitoring system using Bluetooth low energy. Faculty of Electronic and Computer Engineering, Universiti Teknikal Malaysia Melaka, Malaysia; 2016.
9. Ratnadewi, Mohammad, Nuning, Lusi Parwito and Dahlan Abdullai, Autanatic Blood pressure Detector using Arduino to measure Blood pressure” International journal of Engineering and Technology. 2018;7:115-118.
10. Manuja Sharma, Karinne B, Victor Ho, et al. Cuff-less and continuous blood pressure monitoring, technologies; 2017. Available:www. Mdpi.com/journal/technologies.
11. Njideka U, Okubadejo Obianuju B, Ozoh, Oluwadamilola O. Ojo, Ayesha O. Akinkugbe, Ifedayo A. Odeniyi1, Oluseyi Adegoke1, Babawale T. Bello and Osigwe P. Agabi Clinical Hypertension. 2019;25:7 Available: https://doi.org/10.1186/s40885-019-0112-1
12. Akinwumi Funmilayo. Design and construction of heart beat monitor system; 2016.
13. Ogedegbe et al. Principles and techniques of blood pressure measurement". Cardiology Clinics. 2010;28(4):57186. DOI:10.1016/j.c010.07.006. ISSN 15582264.
14. Franklin, Stanley S. (1994)"Beyond blood pressure: Arterial stiffness as a new biomarker of cardiovascular disease". Journal of the American Society of Hypertension: JASH. 2008;2(3):140–51. DOI:10.1016/j.jash.2007.09.002. ISSN 1933-1711. PMID 20409896.
15. Scott et al. Heart Rate and Blood Pressure: Any Possible Implications for Management of Hypertension? CurrHypertens Rep. Author manuscript; available in PMC 2013 Dec 1. Published in final edited form as: CurrHypertens Rep. 2012;14(6):478–484.
16. Lemogoum D, et al. Validity of pulse pressure and augmentation index as surrogate measures of arterial stiffness during beta-adrenergic stimulation. J Hypertens. 2012;22(3):511–7.[PubMed]
17. Adebimbe. Evaluation of the Impact of Virtual Patients System on Clinical Reasonand Students Assessment. Burke,
(2011) (ed) Precision Heart Rate Training; 2018.
18. Gray's Anatomy. Haskins, Tristan (2013) Chest Strap Vs Wrist Based HR Accuracy. 2008;960.
19. Alastruey J, Parker KH, Sherwin SJ. Arterial pulse wave haemodynamics. In Proceedings of the 11
th International
Conference on Pressure Surges, Lisbon, Portugal. 2012;24–26:401–442.
20. Ashwini R, Jadhav, Virendra V. Shete. Android based health monitoring. Infernation Journal on Recent and innovation Trends in Computing and Communicating; 2014.
21. Ashwini R, Virenda V. Androud based Health Monitor” International Journal on recent and innovation trends in Computing and Communication. 2014;2;ISSN: 2321-8169:1429-1431.
22. ChSaiManasa (2018). Sensing heart beat and Temperature digitally using Arduino.
23. Gurvinder Singh D, Balram G. IoT –Temperature and Heart Beat Detection over the Internet using Arduino; 2018.
24. Fye WB. A history of the origin, evolution, and impact of electrocardiography Am. J. Cardiol. 2000;73:936-949.
25. Fye WB. A history of the origin, evolution, and impact of electrocardiography. Am. J. Cardiol. 73;937–949. [CrossRef]
26. Ganga Devi. Wireless patient aid alert system using microcontroller” International journal of advanced research trends in engineering and technology. 2016;3(special ISSUE 14), ISSN 2394-3777 , ISSN 2394-3785
27. Heart Foundation. Heart Watch Survey; 2016. Available:https://www.heartfoundation.org.au/about-us/what-we-do/heart-disease-in-australia/high-blood-pressure-statistics
28. Hypertension Canada, “Hypertension Canada. Guideline for management of Hypertension” Hypertens, Canada; 2017.
29. Joint National Committee on the detection, evaluation and treatment of high blood pressure. The seventh report of the joint national committee on prevedntion detection evaluation and treatment of high blood pressure (JNC 7). JAMA. 2003;289(19);2560-2572.
30. Mabadeje AF. How to live longer Despite Hypertension, Fatida, Lagos Nigeria; 2002.
31. Manuja Sharma, Karinne Barbosa, Victor Ho, Devon Griggs, Tadesse Ghirmai, Sandeep K., Tzung K., Jung-Chih C.
Oyediji et al.; JERR, 21(4): 68-87, 2021; Article no.JERR.76091
87
32. Oloniyo and Bamisaye. Design and Implementation of MicrocontrollerBased Mobile Heart Monitoring System for Bio-medical Diagnosis. International Journal of Bioifrormatics and Biomedics Engineering. 2018;4(1);18-26.
33. Prasath. Wireless monitoring of Heart Rate using Microcontroller. Asst. Professor, Dept. of EIE, Hindustan University. ISSN: 2277 – 9043 International Journal of Advanced Research in Computer Science and Electronics Engineering (IJARCSEE). 2013;2(2).
34. Richard Lee. Ask the doctor: Does heart rate affect blood pressure?; 2009. Available:https://www.health.harvard.edu/newsletter_article/does-heart-rate-affect-blood-pressure
35. Shivam. The development of Micrometter based system for wireless heart beat and temperature monitoring using Wi-Fi module; 2017.
36. Špulák D, Cˇmejla R, Fabián V. Parameters for mean blood pressure estimation based onelectrocardiography and photoplethysmography. In Proceedings of the 2011 International Conference on Applied Electronics (AE), Pilsen, Czech Republic. 2011;7–8; 1–4.
37. Sundnes J, Lines GT, Cai X, Nielsen BF, mardal KA, Tueito A. Computing the
Electrical Activity Sundnes J, Lines GT, Cai X, Nielsen BF, Mardal, KA, Tveito A. (2007), Computing the Electrical Activity in the Heart; Springer Science & Business Media: Berlin, Germany, Volume 1.. Braunwald, E.; Isselbacher KJ, Wilson JD, Martin JB, Kasper D, Hauser SL, Longo DL. Harrison’s Principles of Internal Medicine, 14th ed.; McGraw-Hill: New York, NY, USA; 1997.
38. Taber, Clarence Wilbur; Venes, Donald. Taber's cyclopedic medical dictionary. F. A. Davis Co. 2009;1018–23. ISBN 978-0-8036-1559-5.
39. Viraktamath. Heart beat and temperature monitoring using Zigbee protocol; 2015.
40. Wilkinson IB et al. Heart rate dependency of pulse pressure amplification and arterial stiffness. Am J Hypertens. 2002;15(1 Pt 1):24–30. [PubMed]
Available:www.heart.org/heartorg/ ……..2016
41. Yasmin, Brown MJ. Similarities and differences between augmentation index and pulse wave velocity in the assessment of arterialtiffness. QJM. 1999;92(10):595–600. [PubMed]
© 2021 Oyediji et al.; This is an Open Access article distributed under the terms of the Creative Commons Attribution License (http://creativecommons.org/licenses/by/4.0), which permits unrestricted use, distribution, and reproduction in any medium, provided the original work is properly cited.
Peer-review history: The peer review history for this paper can be accessed here:
https://www.sdiarticle4.com/review-history/76091