
Design and Characterisation of Metallic Bipolar Plates for ...
327
I Design and Characterisation of Metallic Bipolar Plates for Proton Exchange Membrane Fuel Cells by ATINUKE MODESOLA OLADOYE [B.SC., M.SC.] A thesis submitted in fulfilment of the requirement for the degree of Doctor of Philosophy Supervisors: Dr Joseph Stokes School of Mechanical and Manufacturing Engineering Faculty of Engineering and Computing Dublin City University, Ireland. Prof Abdul-Ghani Olabi Institute of Engineering and Energy Technologies University of the West of Scotland, United Kingdom August 2016
-
Upload
khangminh22 -
Category
Documents
-
view
6 -
download
0
Transcript of Design and Characterisation of Metallic Bipolar Plates for ...

I
Design and Characterisation of Metallic Bipolar Plates for
Proton Exchange Membrane Fuel Cells
by
ATINUKE MODESOLA OLADOYE
[B.SC., M.SC.]
A thesis submitted in fulfilment of the requirement for the degree of
Doctor of Philosophy
Supervisors:
Dr Joseph Stokes
School of Mechanical and Manufacturing Engineering
Faculty of Engineering and Computing
Dublin City University, Ireland.
Prof Abdul-Ghani Olabi
Institute of Engineering and Energy Technologies
University of the West of Scotland, United Kingdom
August 2016

II
DECLARATION
I hereby certify that this material, which I now submit for assessment on the programme of study
leading to the award of PhD is entirely my own work, that I have exercised reasonable care to
ensure that the work is original, and does not to the best of my knowledge breach any law of
copyright, and has not been taken from the work of others save and to the extent that such work
has been cited and acknowledged within the text of my work.
Signed: M.A. Oladoye ID No.10113240
Date 24/08/2016

III
PUBLICATIONS
Journals:
1. A.M. Oladoye, J.G. Carton, K. Benyounis, J. Stokes and A. G. Olabi, Optimisation of
pack chromised stainless steel for proton exchange membrane fuel cells using response
surface methodology. Surface and Coatings Technology 2016; 304: pp. 384-392.
2. A.M. Oladoye, J.G. Carton, and A.G. Olabi, Characterization of Graphite Coatings
Produced by CoBlast™ Technology, Journal of Materials (JOM), Vol. 66, No. 4, 2014,
DOI: 10.1007/s11837-014-0941-z,2014. The Minerals, Metals & Materials Society.
3. A.M. Oladoye, J.G. Carton, and A.G. Olabi, Evaluation of CoBlast™ coated Titanium
Alloy as Proton Exchange Membrane fuel Cells Bipolar plates. Journal of Materials, Vol.
2014, Article ID 914817, 10 pages, 2014. doi:10.1155/2014/914817.
International conference paper:
1. A.M. Oladoye, J. G. Carton, K. Benyounis, J. Stokes and A.G. Olabi, Optimisation of
pack chromised AISI 304 stainless steel for Proton exchange Membrane fuel cell bipolar
plates using Box-Behnken Design. 8th International Conference on Sustainable Energy &
Environmental Protection (SEEP 2015), August 11-14, 2015, Scotland, United Kingdom
2. A.M. Oladoye, J.G. Carton, and A.G. Olabi, Improvement on the Corrosion Behaviour
and Surface Conductivity of CoBlast™ Coatings by Pack Cementation, International
Conference on Metallurgical coatings and thin films (ICMCTF 2014), 28 April-3rd May
2014, San Diego, California.
3. A.M Oladoye, J.G. Carton, and A.G. Olabi, Evaluation of Graphite coated metals as
bipolar plates for Proton Exchange Membrane (PEM). 6th
International Conference on

IV
Sustainable Energy & Environmental Protection (SEEP 2013) 20 -23 August, 2013,
Maribor, Slovenia.
4. A.M Oladoye, J.G. Carton, and A.G. Olabi, The significance of the deposition method
on coated metallic bipolar plates for proton exchange membrane fuel cells. 5th
International Conference on Sustainable Energy & Environmental Protection (SEEP
2012), 5 – 8 June, 2012, Dublin, Ireland.

V
DEDICATION
This thesis is dedicated to the
God of Mountain of Fire and Miracles Ministries,
My present help in time of need,
He drew me out of the deep waters, placed my feet on a rock and established my goings.

VI
ACKNOWLEDGEMENTS
My profound gratitude to the Almighty God, the giver of life and wisdom, knowledge and
understanding, my source of inspiration, without whom this thesis would never have
materialised.
I would like to express my deepest appreciation to my Supervisors; Dr Joseph Stokes and Prof
Abdul Olabi for their academic support, guidance and encouragement throughout the
programme.
My heartfelt gratitude goes to Dr James Carton - my third and unofficial supervisor. Thank you
for all your support, I am eternally grateful. I would like to thank Prof S.M.J Hashmi for his
academic support at the beginning of the programme.
I would also like to thank my sponsors: Tertiary Education Trust Fund, (TETFund), Nigeria. I
also want to thank the Vice Chancellor and Management of the University of Lagos, Nigeria for
granting me study leave throughout the programme.
Many thanks to EnBio Limited for providing the CoBlast™ samples and providing access to
their facilities. I want to express my profound appreciation to Dr. Brendan Duffy of the FOCAS
Institute, Dublin Institute of Technology, Dublin 8 for his help on accessing the potentiostat for
the electrochemical polarisation test for the CoBlast™ samples. I also want to express my sincere
appreciation to Dr. Anthony Betts of Dublin Institute of Technology, Dublin 8 for the tutorials
on electrochemistry and corrosion.
Many thanks to the technical staff I worked with during my stay in DCU – Liam Dominican,
Chris Crouch, Michael May, Michael Tyrell and Billy Roarty of the School of Electronic

VII
Engineering. To my friends at DCU: Leonard, Asmaa, Rajani, Emmanuel, Hussam, Shadi,
Richard and so on…too numerous to mention. The journey was not so smooth but you were
there to gist with and exchange ideas.
My sincere appreciation to my Pastors: Pastor and Pastor (Mrs) Adekunle Daniel, Pastor Samuel
Adekunle and Pastor & Mrs Godwin Abia for their spiritual support. I would also want to thank
Mr & Mrs. Kehinde Adejumo and Mr. & Mrs Adeleye Olaiwola for their prayers and kind
gestures. To my brethren at R.C.C.G Open heavens, Dublin and Mountain of Fire and Miracles
Ministries, Dublin, Ireland… you were simply wonderful. My heartfelt gratitude to Mrs.
Funmilayo Akingbade for making sure I did not go hungry while writing the thesis.
I want to specially thank Dr M.O.H Amuda, my lecturer and senior colleague at the University of
Lagos, Nigeria for the role he played in making this dream come true.
My profound gratitude to my husband, Olayemi. Thank you for allowing me to fulfil my dreams
and taking care of the children while I was away in another continent. My sincere gratitude to my
children, Fiyinfoluwa and Anuoluwapo. Thank you for co-operating throughout the programme.
I want to thank my extended family for their support to my husband and children while I was in
Ireland especially my sister, Abisoye for helping out with my children.

VIII
ABSTRACT
Design and Characterisation of Metallic Bipolar Plates for Proton Exchange Membrane
Fuel Cells
Atinuke Modesola Oladoye (B.Sc., M.Sc.)
Metals are potential candidate materials for proton exchange membrane fuel cells (PEMFC)
bipolar plates (BP). However, metals require surface coatings to enhance its corrosion resistance
and interfacial contact resistance (ICR) in PEMFC environments. The present study investigated
the performance of metals coated with: graphite based coatings deposited by the CoBlast™
process and chromised coatings deposited by pack cementation in PEMFC environments.
CoBlast™ coated metals exhibited high ICR and low corrosion resistance in 0.5 M H2SO4 +
2 ppm HF. Hence, it was unsuitable for PEMFC BP application. Post chromising of CoBlast™
coated stainless steel at 900oC for 3 hours reduced its ICR by ~72 % at 140 N/cm
2 but increased
its susceptibility to corrosion. Therefore, Box–Behnken design was employed to optimise and
investigate the influence of activator content, time and temperature on the corrosion current
density of chromised 304 stainless steels exposed to aerated 0.5 M H2SO4 + 2 ppm HF at 70 oC.
Temperature was found to be the most significant parameter, while the optimum process
conditions were: activator content of 6.84 wt. %, time of 3 hours and temperature of 1040 oC.
The optimised coatings exhibited acceptable corrosion resistance in PEMFC environments and
about six fold decrease in the ICR of the substrate at 150 N/cm2. However, pack carburisation at
925 oC for 3 hours prior to chromising decreased its ICR by 55% at 150 N/cm
2. Consequently,
the single fuel cell with the modified chromised stainless steel BP attained a peak power density
of 18.20 mW/cm2 at a current density of 53.2 mA/cm
2. This result represented a two-fold and
three-fold increase in the peak power density of the single fuel cells with chromised stainless
steel produced at the optimised process conditions and uncoated BP respectively. A similar trend
was sustained in the ten-hour durability test. Surface characterisation of the plates after the test
indicated the need to adopt low temperature carburisation techniques. The work presented herein
demonstrated that both chromising and pre-carburisation prior to chromising are promising
techniques for surface modification of metallic PEMFC bipolar plates.

IX
Table of Contents
DESIGN AND CHARACTERISATION OF METALLIC BIPOLAR PLATES FOR
PREOTON EXCHANGE MEMBRANE FUEL CELLS
DECLARATION ...................................................................................................... II
PUBLICATIONS ....................................................................................................III
DEDICATION .......................................................................................................... V
ACKNOWLEDGEMENTS ................................................................................... VI
ABSTRACT .......................................................................................................... VIII
LIST OF FIGURES .............................................................................................. XII
LIST OF TABLES ............................................................................................. XXII
LIST OF ABBREVIATIONS ........................................................................... XXV
Chapter 1.................................................................................................................... 1
Introduction ............................................................................................................... 1
1.1 INTRODUCTION ......................................................................................................................... 1
1.2 FUEL CELLS ................................................................................................................................ 4
1.3 FUEL CELLS FOR ROAD TRANSPORTATION ............................................................................. 10
1.4 RESEARCH GOALS AND APPROACH ........................................................................................ 11
1.5 THESIS OUTLINE ...................................................................................................................... 14
Chapter Two ............................................................................................................ 15
Background and Literature review ..................................................................................................... 15
2.1 INTRODUCTION ....................................................................................................................... 15
2.2 PROTON EXCHANGE MEMBRANE FUEL CELLS ........................................................................ 15
2.3 CHALLENGES TO COMMERCIALISATION OF AUTOMOTIVE PEM FUEL CELLS ......................... 25
2.4 A SURVEY OF THE LITERATURE ON METALLIC BIPOLAR PLATES ............................................. 36
2.5 SUMMARY AND INDICATION OF GAP WITHIN THE LITERATURE ............................................ 81
CHAPTER THREE ................................................................................................ 83
Experimental Methodology .................................................................................... 83
3.1 INTRODUCTION ....................................................................................................................... 83

X
3.2 MATERIAL AND COATING PROCESSES .................................................................................... 83
3.3 SURFACE CHARACTERISATION .............................................................................................. 105
3.4 EVALUATION OF CORROSION PERFROMANCE OF COATED METALS IN SIMULATED PEM FUEL
CELL ENVIRONMENT. ........................................................................................................................ 111
3.5 INTERFACIAL CONTACT RESISTANCE MEASUREMENT .......................................................... 125
3.6 SINGLE FUEL CELL PERFORMANCE EVALUATION .................................................................. 128
3.7 SUMMARY ............................................................................................................................. 131
CHAPTER 4 .......................................................................................................... 133
Graphite Coatings deposited by CoBlast™ Technology ................................... 133
4.1 INTRODUCTION ..................................................................................................................... 133
4.2 SURFACE CHARACTERISATION .................................................................................................... 133
4.2 EVALUATION OF GRAPHITE COATED TITANIUM (V) ALLOY AS PEM FUEL CELL BIPOLAR
PLATES 146
4.3 EVALUATION OF GRAPHITE COATED STAINLESS STEEL AS PEM FUEL CELLS BIPOLAR PLATES
153
4.4 SUMMARY ............................................................................................................................. 160
Chapter 5................................................................................................................ 161
Post Modification Of Graphite Coated Stainless Steel. ..................................... 161
5.1 INTRODUCTION ........................................................................................................................... 161
5.2 SURFACE CHARACTERISATION .................................................................................................... 163
5.3 INTERFACIAL CONTACT RESISTANCE ........................................................................................... 170
5.4 CORROSION BEHAVIOUR IN SIMULATED PEM FUEL CELL ENVIRONMENT AT 70 OC.................. 172
5.5 SUMMARY .................................................................................................................................. 177
Chapter 6................................................................................................................ 179
Chromium Diffusion Coatings ............................................................................. 179
6.1 INTRODUCTION ..................................................................................................................... 179
6.2 EXPERIMENTAL RESULTS AND MATHEMATICAL MODELLING .............................................. 179
6.3 EVALUATION OF OPTIMISED CHROMISED COATING .................................................................. 201
6.4 SUMMARY .................................................................................................................................. 221
Chapter 7................................................................................................................ 223
Pre-carburised And Chromised Coatings .......................................................... 223

XI
7.1 INTRODUCTION ......................................................................................................................... 223
7.2 PRE-CARBURISATION AND CHROMISING PROCESSING OVERVIEW ........................................... 223
7. 3 SURFACE CHARACTERISATION ............................................................................................. 224
7.4 Interfacial contact resistance. ..................................................................................................... 235
7.5 CORROSION BEHAVIOUR EVALUATION ...................................................................................... 236
7.6 SINGLE FUEL CELL PERFORMANCE .............................................................................................. 241
7.7 SUMMARY .................................................................................................................................. 245
Chapter 8................................................................................................................ 247
Conclusions, Contributions and Future work .................................................... 247
8.1 CONCLUSIONS ............................................................................................................................. 247
8.2 CONTRIBUTION TO KNOWLEDGE ............................................................................................... 250
8.3 FUTURE WORK. ........................................................................................................................... 251
REFERENCES ...................................................................................................... 252
APPENDIX I ......................................................................................................... 286
APPENDIX II ........................................................................................................ 292
APPENDIX III ...................................................................................................... 296

XII
LIST OF FIGURES
FIGURE 1 WORLD PRIMARY ENERGY CONSUMPTION FOR 2014 . .................................................... 2
FIGURE 2 SCHEMATIC DIAGRAM OF A FUEL CELL, ADAPTED FROM .................................................. 4
FIGURE 3 COMPONENTS OF A PEM FUEL CELL. .............................................................................. 16
FIGURE 4 SCHEMATIC DIAGRAM OF A PEM FUEL CELL. ................................................................. 17
FIGURE 5 SCHEMATIC REPRESENTATION OF A PEM FUEL CELL STACKS . ....................................... 18
FIGURE 6 STRUCTURE OF PER FLUORINATED SULFONIC ACID (PFSA) MEMBRANES . ..................... 19
FIGURE 7 STRUCTURE OF SULPHONATED POLY ETHER KETONE . .................................................... 20
FIGURE 8 (A) SCHEMATIC OF STRUCTURE OF FLOW CHANNELS AND MEMBRANE ELECTRODE
ASSEMBLY SHOWING THE FLOW PATTERN (B) MICROGRAPHS OF CARBON CLOTH AND CARBON
PAPER GDL MATERIALS . ........................................................................................................ 22
FIGURE 9 FEATURES OF A TYPICAL BIPOLAR PLATE . ...................................................................... 23
FIGURE 10 SCHEMATIC DIAGRAM OF TYPICAL FLOW FIELD DESIGN: (A) PIN-TYPE, (B) SERIES-
PARALLEL, (C) SERPENTINE AND (D) INTERDIGITATED TYPE . .................................................. 24
FIGURE 11 SCHEMATIC DIAGRAM OF OXYGEN CROSSOVER THROUGH THE MEMBRANE IN A PEM
FUEL CELL . ............................................................................................................................. 31
FIGURE 12 ENERGY LOSSES IN PEM FUEL CELLS. .......................................................................... 33
FIGURE 13 EFFECT OF PTFE LOADING ON CONTACT RESISTANCE.. ............................................... 35
FIGURE 14 CLASSIFICATION OF METALLIC MATERIALS FOR PEM FUEL CELLS BIPOLAR PLATE ...... 37
FIGURE 15 (A) SEM IMAGE OF THE CROSS-SECTION OF NI-50CR ALLOY NITRIDED AT 1100 OC FOR 1
HOUR, (B) SEM IMAGE OF THE CROSS SECTION OF NITIRDED AT FE-27CR-6V STAINLESS STEEL
NITRIDED AT 900 OC FOR 4 HOURS SHOWING INTERNAL AND EXTERNAL NITRIDES . ................ 53

XIII
FIGURE 16 (A) PRE-OXIDISED (900 OC FOR 10 HOURS) 446M STAINLESS STEEL NITRIDED AT 1100
OC
FOR 2 HOURS (B) PRE-OXIDISED (900 O
C FOR 5 HOURS) 430 STAINLESS STEEL NITRIDED AT
1040OC FOR 6 HOURS. ............................................................................................................. 54
FIGURE 17 (A) SEM IMAGE OF THE CROSS-SECTION OF PRE-OXIDISED NITRIDED FE–27CR–6V
NITRIDED AT 850 °C FOR 24 HOURS IN N2–4H2 ATMOSPHERE. (B) BRIGHT-FIELD CROSS-
SECTION TEM OF SEM IMAGE IN (A) . .................................................................................... 55
FIGURE 18 SCHEMATIC ILLUSTRATION OF THE DESIGN CONCEPT OF THE GRAPHITE-COATED PLATES .
............................................................................................................................................... 70
FIGURE 19 (A) NON- HOT PRESSED (B) HOT-PRESSED GRAPHITE COMPOSITE COATING . ................. 71
FIGURE 20 ATLAS CELL CONTAINING 3.5 WT.% SODIUM CHLORIDE SOLUTION .............................. 73
FIGURE 21 COMPARISON OF BIPOLAR PLATES MADE FROM (A) METAL FOAM (B) BULK STAINLESS
STEEL . .................................................................................................................................... 80
FIGURE 22 (A) SCHEMATIC REPRESENTATION OF THE COBLAST™ PROCESS ADAPTED FROM , (B)
PICTURE OF THE COBLAST™ EQUIPMENT. .............................................................................. 86
FIGURE 23 SEM IMAGES OF (A) MICROFYNE GRAPHITE (B) ALUMINA POWDERS ............................ 87
FIGURE 24 SEM IMAGES OF (A) CHROMIUM POWDER (B) AMMONIUM CHLORIDE POWDER. ............ 88
FIGURE 25 CARBOLITE TUBE FURNACE USED IN THE STUDY. .......................................................... 88
FIGURE 26 MAJOR STEPS INVOLVED IN PACK CEMENTATION . ........................................................ 91
FIGURE 27 STRUCTURE OF ALLOYING ELEMENTS IN STAINLESS STEEL ALLOYS (A) FACE CENTERED
CUBIC STRUCTURE (FCC) (B) BODY CENTRED STRUCTURE (BCC) ........................................ 94
FIGURE 28 IRON –CARBON PHASE DIAGRAM . ................................................................................ 95
FIGURE 29 RELATIONSHIP BETWEEN M23C6 PRCIPTAION AND INTERGRANULAR CORROSION IN TYPE
304 AUSTENITIC STAINLESS STEEL .......................................................................................... 97

XIV
FIGURE 30 PICTORIAL REPRESENTATION OF BOX-BEHNKEN DESIGN ............................................. 99
FIGURE 31 PICTURE OF CRUCIBLE CONTAINING PACK POWDER MIXTURE OF CHROMIUM, AMMONIUM
CHLORIDE AND ALUMINA AND SEALED WITH FIRE CLAY ....................................................... 103
FIGURE 32 PICTURE OF THE PACK CHROMISING PROCEDURE (A) LENTON TUBE FURNACE (B)
SEALED CRUCIBLE IN TUBE FURNACE (C) TUBE FURNACE SEALED AND ARGON GAS IS PASSED
THROUGH THE TUBE (D) END OF THE TUBE CONNECTED TO THE FUME HOOD. ....................... 103
FIGURE 33 MATERIALS FOR PACK CARBURISING. ........................................................................ 104
FIGURE 34 SCHEMATIC REPRESENTATIONS OF (A) THE OPERATING PRINCIPLES OF THE SEM (B)
SIGNALS PRODUCED WITHIN THE SEM AT DIFFERENT DEPTH OF PENETRATION. ................... 106
FIGURE 35 SCHEMATIC REPRESENTATION OF XRD ..................................................................... 107
FIGURE 36 OPERATING PRINCIPLES IN XPS ................................................................................. 109
FIGURE 37 (A) TR200 SURFACE ROUGHNESS TESTER (B) CLOSE-UP VIEW ................................... 110
FIGURE 38 SCHEMATICS OF WATER CONTACT ANGLE SET UP ....................................................... 111
FIGURE 39 CORROSION CELL IN ACTION ....................................................................................... 112
FIGURE 40 (A) ANODIC AND CATHODIC HALF-CELL REACTIONS (B) EVANS DIAGRAM FOR A MIXED
ELECTRODE STATE OF A METAL, M CORRODING IN AN ACIDIC ELECTROLYTE ....................... 114
FIGURE 41 TAFEL LINE EXTRAPOLATION METHOD ...................................................................... 116
FIGURE 42 FLAT CORROSION CELL AND THE ELECTRODES USED IN THE STUDY. .......................... 119
FIGURE 43 SCHEMATIC REPRESENTATION OF EXPERIMENTAL SET UP FOR ELECTROCHEMICAL
POLARISATION EXPERIMENTS. (AE: AUXILIARY ELECTRODE, WE – WORKING ELECTRODE, RE
– REFERENCE ELECTRODE) ................................................................................................... 122
FIGURE 44 EXPERIMENTAL SET UP AT FOCAS INSTITUTE, DUBLIN INSTITUTE OF TECHNOLOGY,
IRELAND. .............................................................................................................................. 123

XV
FIGURE 45 EXPERIMENTAL SET UP AT DUBLIN CITY UNIVERSITY, IRELAND (1) EXTRACTION HOOD
(2) POLYETHYLENE FRAME WITH DANGER SIGNS (3) H2 GAS CYLINDER (4) N2 GAS (5)AIR
PUMP(6)REFERENCE ELECTRODE (7) WORKING ELECTRODE (8) COUNTER ELECTRODE (9) H2
LEAK SENSOR (10) GAMRY POTENTIOSTAT. .......................................................................... 124
FIGURE 46 SCHEMATIC OF THE TEST ASSEMBLY FOR INTERFACIAL CONTACT RESISTANCE. ......... 126
FIGURE 47 PICTURE OF EXPERIMENTAL SET UP FOR ICR (1) ZWICKROELL UTM (2) POWER SOURCE
(3) COMPUTER (4) COPPER ELECTRODES (5) MULTI-METER. .................................................. 127
FIGURE 48 304 STAINLESS STEEL BIPOLAR PLATE WITH SERPENTINE FLOW FIELD DESIGN. ......... 129
FIGURE 49 THE THREE SINGLE CELLS INVESTIGATED IN THIS STUDY. .......................................... 130
FIGURE 50 EXPERIMENTAL SET UP FOR SINGLE CELL FUEL TESTING. HYDROGEN GAS CYLINDER (1),
NITROGEN GAS CYLINDER (2), SINGLE FUEL CELL (3), POTENTIOSTAT (4), HUMIDIFIER (5). .. 131
FIGURE 51 SUMMARY OF THE EXPERIMENTAL METHODOLOGY EMPLOYED IN THE STUDY. .......... 132
FIGURE 52 SURFACE MORPHOLOGIES OF GR-SS AND GR-TIV. .................................................... 133
FIGURE 53 CROSS SECTION OF COBLAST GRAPHITE COATED STAINLESS STEEL. SIMILAR THIN AND
DISCONTINUOUS COATED LAYER WAS OBTAINED FOR GRAPHITE COATED TITANIUM GRADE (V)
ALLOY. ................................................................................................................................. 134
FIGURE 54 SEM/ BSD OF GRAPHITE COATED AISI 316 STAINLESS STEEL. ................................. 135
FIGURE 55 SEM/BSD VIEW OF THE SURFACE MORPHOLOGY OF GRAPHITE COATED TITANIUM
GRADE (V) ALLOY. ............................................................................................................... 136
FIGURE 56 CROSS SECTION OF COBLAST HA COATING ON TI (V) ALLOY. ................................... 136
FIGURE 57 SURVEY SPECTRA OF COATED (GR-SS) AND UNCOATED 316 STAINLESS STEEL. ......... 139
FIGURE 58 SURVEY SPECTRA OF COATED (GR-TIV) AND UNCOATED TITANIUM (V) ALLOYS. ...... 140

XVI
FIGURE 59 XPS NARROW SCAN REGION FOR (A) C1S (B) AL 2P AND (C) O1S FOR GR-SS AND GR-
TIV. ...................................................................................................................................... 142
FIGURE 60 XPS NARROW SCAN REGION FOR (A) CR2P (B) FE2P FOR GR-SS (C) TI2P FOR GR-TIV.
............................................................................................................................................. 143
FIGURE 61 XRD PATTERNS FOR (A) GR-SS (B) SS316 (C) GR-TIV (D) BARE-TIV. ..................... 145
FIGURE 62 PLOT OF INTERFACIAL CONTACT RESISTANCE VS. COMPACTION PRESSURE FOR GR-TIV,
BARE TIV AND GRAPHITE. .................................................................................................... 146
FIGURE 63 POTENTIODYNAMIC POLARISATION CURVES FOR GR- TIV AND BARE- TIV IN 0.5 M
H2SO4 + 2 PPM HF AT ROOM TEMPERATURE WITH (A) AIR BUBBLED (B) H2 GAS BUBBLED INTO
THE ELECTROLYTE. SCAN RATE 1 MV/S. ............................................................................... 149
FIGURE 64 POTENTIOSTATIC POLARISATION OF GR-TIV AND BARE –TIV IN 0.5 M H2SO4 + 2 PPM
HF AT 70 OC (A) AIR BUBBLED (E = 0.6 V (AG/AGCL) AND (B) H2 GAS BUBBLED ( E = -0.1 V
(AG/AGCL) INTO THE SOLUTION. .......................................................................................... 151
FIGURE 65 POTENTIODYNAMIC CURVES FOR GR-SS AND SS316 IN 0.5 M H2SO4 + 2 PPM HF AT
ROOM TEMPERATURE IN SIMULATED (A) CATHODE (AIR BUBBLED INTO THE SOLUTION) AND (B)
ANODE ENVIRONMENTS (HYDROGEN GAS BUBBLED INTO THE SOLUTION). SCAN RATE = 1
MV/S. .................................................................................................................................... 155
FIGURE 66 POTENTIOSTATIC POLARISATION OF GR-SS AND SS316 IN 0.5 M H2SO4 +2 PPM HF AT
............................................................................................................................................. 157
FIGURE 67 SEM IMAGES OF CHROMISED GR-SS (A) SECONDARY ELECTRON VIEW (B)
BACKSCATTERED (BSD) VIEW (DARK PATCHES – GRAPHITE /ALUMINA COATINGS, LIGHT AREA
–CHROMIUM RICH REGION) ................................................................................................... 163

XVII
FIGURE 68 SEM IMAGES OF CHROMISED SS316 (A) SECONDARY ELECTRON VIEW (B)
BACKSCATTERED VIEW. SURFACE MORPHOLOGIES PROVIDED AT HIGHER MAGNIFICATIONS
THAN IN FIGURE 67 IN ORDER TO REVEAL THE GRANULAR MORPHOLOGY. ........................... 164
FIGURE 69 CROSS-SECTION OF (A) CHROMISED GR-SS AND (B) CHROMISED SS316 BOTH SAMPLES
WERE PACK CHROMISED AT 900 OC FOR 3 HOURS. ................................................................ 165
FIGURE 70 XRD PATTERNS OF (A) CHROMISED GR-SS AND (B) CHROMISED SS316. .................. 166
FIGURE 71 GLANCING XRD PATTERNS FOR CHROMISED GR-SS. ................................................ 167
FIGURE 72 XPS SURVEY SPECTRA FOR CHROMISED GR-SS AFTER 10MINUTES OF ARGON
SPUTTERING. ......................................................................................................................... 168
FIGURE 73 HIGH RESOLUTION SCAN FOR C1S IN CHROMISED GR-SS. ......................................... 169
FIGURE 74 HIGH RESOLUTION SCAN FOR CR2P IN CHROMISED GR-SS. ...................................... 169
FIGURE 75 ICR OF CHROMISED GR-SS AND CHROMISED GR-SS COMPARED WITH THAT OF
GRAPHITE AND GR-SS. ......................................................................................................... 171
FIGURE 76 POTENTIODYNAMIC POLARISATION OF CHROMISED GR-SS, CHROMISED SS316, SS316
AND GR-SS IN 0.5 M H2SO4 + 2 PPM HF AT 70 OC, SCAN RATE =1 MV/S. ............................. 173
FIGURE 77 POTENTIOSTATIC POLARISATION OF CHROMISED GR-SS AND CHROMISED SS316 AT 0.6
V VS. AG/AGCL IN 0.5 M H2SO4 + 2 PPM HF PURGED WITH AIR AT 70 OC, SCAN RATE =1 MV/S.
THE INSET SHOWS THE OSCILLATORY BEHAVIOUR EXHIBITED BY CHROMISED GTR-SS. ....... 176
FIGURE 78 SEM MICROGRAPHS OF (A) CHROMISED GR-SS (B) CHROMISED SS316 AFTER 4 HOURS
OF POTENTIOSTATIC POLARISATION IN 0.5 M H2SO4 + 2 PPM HF AT 70 OC. ......................... 177
FIGURE 79 NORMAL PROBABILITY PLOT OF THE STUDENTISED RESIDUAL FOR CORROSION CURRENT
DENSITY. ............................................................................................................................... 184
FIGURE 80 PREDICTED VERSUS ACTUAL VALUES PLOT FOR CORROSION CURRENT DENSITY. ....... 184

XVIII
FIGURE 81 PERTURBATION PLOT FOR CORROSION CURRENT DENSITY. ........................................ 186
FIGURE 82 SURFACE MORPHOLOGIES OF COATINGS PRODUCED AT (A) 1000 OC (R6) AND (B)
1100OC (R1) AT 3 WT.% ACTIVATOR CONTENT AND 6 HOURS. INSET SHOWS R6 AT
MAGNIFICATION OF 2 µM. ...................................................................................................... 187
FIGURE 83 XRD OF CHROMISED COATING FORMED WITH PROCESS PARAMETERS SPECIFIED FOR R6
AND R1. ................................................................................................................................ 188
FIGURE 84 SURFACE MORPHOLOGIES OF COATINGS FORMED AT PROCESS PARAMETERS INDICATED
BY (A) R12 AND (B) R17. ...................................................................................................... 190
FIGURE 85 SURFACE MORPHOLOGIES OF COATINGS PRODUCED AT 1100OC FOR 3 HOURS WITH
POWDER CONTAINING (A) 3 WT.% (R12) (B) 7WT% ACTIVATOR CONTENT (R13). ................ 192
FIGURE 86 CONTONUR PLOT SHOWING THE INTERACTION BETWEEN TEMPERATURE AND
ACTIVATOR CONTENT. .......................................................................................................... 193
FIGURE 87 RESPONSE SURFACE PLOTS SHOWING THE INTERACTION BETWEEN TEMEPRATURE AND
TIME. .................................................................................................................................... 194
FIGURE 88 INTERACTION PLOT SHOWING INTERACTION BETWEEN TEMPERATURE AND ACTIVATOR
CONTENT. ............................................................................................................................. 195
FIGURE 89 SURFACE MORPHOLOGY OF (A) R1 AND (B) R9. ......................................................... 196
FIGURE 90 SURFACE MORPHOLOGY OF R6 AND (B) R3. .............................................................. 198
FIGURE 91 OPTIMUM CONDITIONS FOR MINIMUM CORROSION CURRENT DENSITY OF CHROMISED
304 STAINLESS STEEL IN 0.5 M H2SO4 + 2 PPM HF AT 70 OC. ............................................... 200
FIGURE 92 TAFEL PLOT FOR COATING PRODUCED WITH OPTIMAL PROCESS PARAMETERS AND THE
SUBSTRATE IN 0.5 M H2SO4 + 2 PPM HF AT 70 OC. SCANNING RATE = 1MV/S...................... 201

XIX
FIGURE 93 CHROMISED COATINGS PRODUCED AT OPTIMISED PROCESS PARAMETERS (A) SURFACE
MORPHOLOGY OF THE OPTIMISED COATING (CR-304) (B) EDX SPECTRUM AND AVERAGE
COMPOSITION. ....................................................................................................................... 203
FIGURE 94 CHROMISED COATINGS PRODUCED AT OPTIMISED PROCESS PARAMETERS (A) CROSS-
SECTION SEM IMAGE (B) EDX LINE SCAN OF CR-304. ......................................................... 204
FIGURE 95 SURVEY SPECTRUM OF CR-304 BEFORE AND AFTER ARGON ION SPUTTERING. ........... 205
FIGURE 96 XPS SPECTRUM OF (A) CARBON (B) OXYGEN (C) NITROGEN AND (D) CHROMIUM IN CR-
304 AFTER 0S, 60S AND 120S OF SPUTTERING. INSET OF (D) SHOWS THE CR2P BEFORE
SPUTTERING. ......................................................................................................................... 207
FIGURE 97 GLANCING INCIDENCE ANGLE XRD OF CR-304. ........................................................ 209
FIGURE 98 POTENTIODYNAMIC POLARISATION OF CR-304 AND SS304 IN 0.5 M H2SO4 + 2 PPM HF
AT 70 OC (A) AIR BUBBLED (B) HYDROGEN BUBBLED INTO THE ELECTROLYTE, . ................... 211
FIGURE 99 POTENTIOSTATIC POLARISATION OF CR-304 AND SS304 IN 0.5 M H2SO4 + 2 PPM HF
AT 70 OC IN SIMULATED PEM FUEL CELL (A) CATHODIC ENVIRONMENT (B) ANODIC
ENVIRONMENT, . ................................................................................................................... 213
FIGURE 100 ICR OF CR-304 AND SS304 AS A FUNCTION OF COMPACTION PRESSURE. ................ 216
FIGURE 101 COMPARISON OF ICR OF SS316 IN FIGURE 75 AND SS304 IN FIGURE 100 IN ORDER TO
SHOW THE INFLUENCE OF PTFE LOADING OF THE TORAY CARBON PAPER (T-GH-90) ON ICR.
............................................................................................................................................. 219
FIGURE 102 SINGLE FUEL CELL PERFORMANCE OF CR-304 AND SS304 BIPOLAR PLATES ............ 220
FIGURE 103 XRD OF CPC-304-3 CARBURISED AT 925 OC FOR 3 HOURS .................................. 225
FIGURE 104 CROSS-SECTION OF 304 STAINLESS STEEL CARBURISED AT 925 OC FOR 3 HOURS .... 226
FIGURE 105 SURFACE MORPHOLOGY OF (A) CPC-304-1(B) CPC-304-2 (C) CPC-304-3. ........... 227

XX
FIGURE 106 SEM IMAGE AND EDX SPECTRUM OF CPC-304 (A) DISCRETE PARTICLES (B) MATRIX.
............................................................................................................................................. 228
FIGURE 107 (A) CROSS-SECTION AND EDX COLOUR MAP OF (A) CPC-304-1(B) CPC-304-2 (C)
CPC-304-3. .......................................................................................................................... 229
FIGURE 108 GLANCING INCIDENCE XRD OF CPC-304 SAMPLES AT 5O. .................................... 230
FIGURE 109 XPS SURVEY SPECTRUM FOR CPC-304 SAMPLES AFTER 150 SECONDS OF SPUTTERING.
............................................................................................................................................. 232
FIGURE 110 XPS ANALYSIS OF CPC-304 SAMPLES (A) N1S (B) O1S SPECTRUM.......................... 233
FIGURE 111 FE2P CORE LEVEL SPECTRA FOR PRE-CARBURISED AND CHROMISED CPC-304 SAMPLES
............................................................................................................................................. 235
FIGURE 112 INTERFACIAL CONTACT RESISTANCE OF CPC-304 STAINLESS STEELS AS A FUNCTION
OF COMPACTION PRESSURE. .................................................................................................. 236
FIGURE 113 POTENTIODYNAMIC CURVES FOR CPC-304 SAMPLES IN SIMULATED PEM FUEL CELL
(A) ANODIC AND (B) CATHODIC ENVIRONMENT. .................................................................... 237
FIGURE 114 POLARISATION CURVES AND POWER DENSITY CURVES FOR SINGLE FUEL CELLS WITH
CPC-304, CR-304 AND SS304 BIPOLAR PLATES. .................................................................. 241
FIGURE 115 CURRENT DENSITY –TIME GRAPH FOR C-304-3, CR-304 AND SS304 AT 0.6 V ......... 243
FIGURE 116 CATHODE SIDE GDL OF SINGLE FUEL CELL WITH CPC-304-3 BIPOLAR PLATES AFTER
10 HOURS OF TESTING (A) SURFACE MORPHOLOGY (B) EDX SPECTRUM. .............................. 244
FIGURE 117 CATHODE SIDE GDL OF SINGLE FUEL CELL WITH CR-304 BIPOLAR PLATES AFTER 10
HOURS OF TESTING (A) SURFACE MORPHOLOGY (B) EDX SPECTRUM. ................................... 244
FIGURE 118 (A) SEM IMAGE (B) EDX SPECTRUM OF THE CATHODE SIDE GDL OF SINGLE CELL
WITH SS304 BIPOLAR PLATES AFTER 10 HOURS OF TESTING. ................................................ 245

XXI
FIGURE 119 SURFACE MORPHOLOGIES OF CHROMISED 304 STAINLESS STEEL PRODUCED AT (A)
1000 OC AND (B) 1100
OC FOR 3 HOURS ................................................................................ 287
FIGURE 120 (A) HYDROGEN GAS REGULATOR B) HYDROGEN LEAK SENSOR AND EXTRACTION HOOD
............................................................................................................................................. 294

XXII
LIST OF TABLES
TABLE 1 COMPARISONS OF THE DIFFERENT TYPES OF HYDROGEN FUEL CELLS ................................ 7
TABLE 2 REPRESENTATIVE PHYSICAL VALUES FOR DIFFERENT BIPOLAR PLATE MATERIAL. ........... 30
TABLE 3 POSSIBLE OXYGEN REDUCTION REACTIONS AT THE PEM FUEL CELL CATHODE AND THE
THERMODYNAMIC ELECTRODE POTENTIALS OF ELECTROCHEMICAL O2 REDUCTIONS . ........... 32
TABLE 4 DENSITIES OF METALS COMMONLY USED FOR BIPOLAR PLATE ......................................... 42
TABLE 5 COMPARISON OF C-17200 CU-BE ALLOY BIPOLAR PLATE PERFORMANCE WITH 316L
STAINLESS STEEL BIPOLAR PLATE. .......................................................................................... 44
TABLE 6 NOMINAL COMPOSITION OF SUBSTRATE USED FOR COBLAST™ PROCESS ........................ 85
TABLE 7 PROCESS FACTORS AND DESIGN LEVELS ........................................................................ 100
TABLE 8 DESIGN MATRIX BASED ON THREE- LEVEL, THREE –FACTOR BOX–BEHNKEN DESIGN .... 101
TABLE 9 PREPARATION METHODS FOR MATERIALS USED FOR THE BIPOLAR PLATES.................... 129
TABLE 10 SURFACE ROUGHNESS AND CONTACT ANGLE OF COATED AND UNCOATED SURFACES. . 137
TABLE 11 XPS CHEMICAL COMPOSITION OF THE OUTER LAYER FOR THE COATED AND UNCOATED
METALS................................................................................................................................. 141
TABLE 12 2 X ICR OF GR-TIV AND BARE-TIV AT 140 N/CM2. .................................................... 147
TABLE 13 CORROSION PARAMETERS OF GR-TIV AND TIV IN 0.5 M H2SO4 + 2 PPM AT ROOM
TEMPERATURE. ..................................................................................................................... 148
TABLE 14 TOTAL METAL ION CONCENTRATION AFTER 14400 SECONDS OF POTENTIOSTATIC
POLARISATION OF GR-TIV AND TIV IN SIMULATED PEM FUEL CELL ENVIRONMENT OF 0.5 M
H2SO4 +2 PPM HF AT 70 OC ............................................................................................... 153

XXIII
TABLE 15 CORROSION POTENTIAL AND CORROSION CURRENT DENSITY OF GR-SS AND SS316 IN
SIMULATED PEM FUEL CELL ENVIRONMENT OF 0.5 M + 2 PPM H2SO4 AT ROOM TEMPERATURE
WITH AIR BUBBLING (CATHODE) AND HYDROGEN GAS BUBBLING (ANODE) .......................... 156
TABLE 16 METALLIC ION CONCENTRATION (IN PPM) AFTER POTENTIOSTATIC POLARISATION IN
PEM FUEL CELL CATHODE ENVIRONMENT AND WORKING POTENTIAL. ................................. 158
TABLE 17 CORROSION PARAMETERS FOR CHROMISED GR-SS, CHROMISED SS316, SS316 AND GR-
SS. ........................................................................................................................................ 174
TABLE 18 DESIGN MATRIX BASED ON THREE LEVEL-THREE FACTOR BOX–BEHNKEN DESIGN. .... 180
TABLE 19 SEQUENTIAL MODEL SUM OF SQUARES ........................................................................ 181
TABLE 20 ANOVA FOR RESPONSE SURFACE QUADRATIC MODEL. ............................................... 182
TABLE 21 CONSTRAINTS FOR OPTIMISATION ................................................................................ 200
TABLE 22 XPS PARAMETERS FOR COMPOSITION AND BINDING ENERGY OF CR-304 WITH THE
SPUTTERING PROFILE. ........................................................................................................... 206
TABLE 23 CORROSION PARAMETERS OF SS304 AND CR-304 IN SIMULATED PEM FUEL CELL
ENVIRONMENTS. ................................................................................................................... 212
TABLE 24 COMPARISON OF THE PERFORMANCE OF CR-304 WITH PUBLISHED WORKS ON CHROMISED
STAINLESS STEELS FOR PEM FUEL CELL BIPOLAR PLATE APPLICATION................................. 215
TABLE 25 ICR OF 304 STAINLESS STEEL IN THE LITREATURE ....................................................... 218
TABLE 26 ICR OF CHROMISED STAINLESS STEEL IN THE LITREATURE ......................................... 218
TABLE 27 PEAK POWER DATA FOR THE SINGLE CELLS WITH COATED AND UNCOATED STAINLESS
STEEL AND THE CORRESPONDING ICR AT 125 N/CM2 ........................................................... 220
TABLE 28 MASS GAIN BY SS304 AFTER CARBURISING FOR 1-3 HOURS AND SUBSEQUENTLY
CHROMISING AT 1040 OC FOR ~ 3 HOURS .............................................................................. 224

XXIV
TABLE 29: CORROSION PARAMETERS OF CPC-304 SAMPLES IN 0.5 M H2SO4 + 2 PPM HF AT 70 OC
............................................................................................................................................. 238
TABLE 30 TIME RANGE REPORTED FOR PACK CHROMISING PROCESS IN THE LITERATURE. ........... 288

XXV
LIST OF ABBREVIATIONS
PEM Proton Exchange Membrane
AFC Alkaline fuel cell
GHG Greenhouse gases
MCFC Molten Carbonate fuel cell
PAFC Phosphoric acid fuel cell
SOFC Solid oxide fuel cell
MEA Membrane Electrode Assembly
GDL Gas Diffusion Layer
ICR Interfacial Contact Resistance
ORR Oxygen Reduction Reaction
HRR Hydrogen Reduction reaction
DoE Design of Experiments
DOE Department of Energy
RSM Response of Surface Methodology
OCV Open Circuit Voltage
SEM Scanning Electron Microscopy
EDX Energy-dispersive X-ray spectroscopy
MEA Membrane Electrode Assembly
XPS X-ray Photoelectron Spectroscopy
XRD X-ray Diffraction
EDM Electrical Discharge Machine
au arbitrary unit

XXVI
sccm Standard Cubic Centimetre Per Minute
𝑖𝑐𝑜𝑟𝑟 Corrosion current density
𝐸𝑐𝑜𝑟𝑟 Corrosion potential

1
Chapter 1
Introduction
1.1 INTRODUCTION
Developing alternative fuels to reduce global dependence on fossil fuel and to meet the ever-
growing global energy demand and consumption driven by an escalating population and an
upsurge in human activities, is a key energy challenge of the 21st century. According to recent
reports [1-3], more than 80% of the energy consumed globally is derived from fossil fuels, with
crude oil accounting for about one third of the total fossil fuel consumption as shown in Figure 1.
The combustion of fossil fuels within various energy-requiring activities releases anthropogenic
greenhouse gases (GHG) such as carbon dioxide (CO2), nitrous oxide (N2O), and methane (CH4)
etc. into the atmosphere resulting in air pollution, global warming and affects climate change.
Among these GHG gases, the concentration of CO2 has been reported to increase annually with
energy use in electricity and heat generation as well as the transport sector, accounting for over
50% of CO2 emissions [3]. Besides the environmental challenges, the substantiality of fossil
fuels, as the world’s major energy source is doubtful, due to the finite nature of fossil fuels and
instability of crude oil prices. Hence, it is imperative that alternatives to fossil fuels must not
only be clean, but also renewable.
Hydrogen is one of the most promising alternative fuels being developed particularly for the
transport sector, which accounted for over 60% of the world oil energy consumption and over
23% of global CO2 emission in 2012 [4-6]. Hydrogen can generally be considered as a future
energy supply to be utilised in the transport sector for the following reasons:

2
Figure 1 World Primary Energy Consumption for 2014 [1].

3
(1) Hydrogen can be produced from diverse energy sources such as steam reforming of natural
gas, gasification of coal, partial oxidation of hydrocarbon fuels, pyrolysis of biomass and
electrolysis of water, which are powered by renewable energy sources such as wind, solar and
nuclear energy.
(2) The main by-product of the chemical reaction between hydrogen and oxygen/air is water
depending on the source of hydrogen; hence, the use of hydrogen in automobiles and other
transportation devices has the potential to reduce GHG gases emissions from conventional
petroleum based fuels.
(3) Hydrogen can be used in conventional internal combustion engines, although the combustion
of hydrogen can generate small amounts of nitrous oxide.
(4) Hydrogen has a higher specific energy (120 MJ/kg) than that of any other transport fuel. For
instance, 1 kg of hydrogen can deliver about three times the energy of an equivalent weight of
petrol with a specific energy of 43 MJ/kg. However, the volumetric density of hydrogen is
lower than that of petrol, implying that a liter of petrol contains about six times more energy
than an equivalent volume of hydrogen. The low volumetric density of hydrogen poses a
challenge for on-board storage; hence, it has attracted considerable research attention.
Amongst the various modes of transport, road transport accounts for a considerable portion of the
oil consumed and CO2 emission globally [1-7]. In Europe, for instance, GHG emissions from road
transport contributed about 60% of the total CO2 emissions in 2012 with emissions from light
duties vehicles such cars and vans accounting for three quarters of the emissions [7, 8]. Although,
there are strict governmental policies and legations around the reduction of CO2 emissions,
especially in developed nations, notwithstanding, with increasing number of automobiles on our
roads, the environmental impact of CO2 emissions on life especially in our urban cities has become

4
more threatening. Hence, the need for the substitution of fossil fuel driven automobiles with
hydrogen fuelled automobiles, built on fuel cell based technology, which generates only water and
heat as by-products.
1.2 FUEL CELLS
Fuel cells are energy conversion devices that generate electricity from the electrochemical reaction
of a hydrogen-rich fuel (hydrogen, methanol, natural gas etc.) and an oxidant (air or oxygen) to
produce water and heat as the main by-products [9-13]. In other words, fuel cells convert the
chemical energy of a fuel directly into electrical energy. A single fuel cell as diagrammatically
represented in Figure 2, consists of an electrolyte sandwiched between two electrodes.
Figure 2 Schematic diagram of a fuel cell, adapted from [14]

5
At the anode, the hydrogen-rich fuel is oxidised into hydrogen or hydroxyl ions (depending on the
type of fuel cells). The electrons travel through an external circuit to generate electricity while the
hydrogen or hydroxyl ions migrate to the cathode via the electrolyte to react with oxygen forming
water as a by-product.
1.2.1 Fuel cells and competing technologies
Fuel cells offer many advantages over conventional technologies such as the internal combustion
engines and batteries which have gained widespread market acceptance. Compared to internal
combustion engines (ICEs):
(1) Fuel cells directly convert the chemical energy in fuels to electricity without an intermediate
step, thus they are not limited by Carnot cycle and can operates at efficiencies of more than 60%.
In contrast, ICEs convert chemical energy in fuels to electricity via intermediate steps of thermal
and mechanical energy.
(2) Fuel cells are environmentally friendly devices which have near zero pollutant emissions
while the water and heat by-products can be used for co-generation. Conversely, combustion of
fossil fuels in ICEs generates CO2 and other related GHG emissions.
(3) Fuel cells have no internal moving parts; hence they operate quieter than ICEs.
Fuel cells, however, operate similar energy conversion principle as batteries. Both devices convert
chemical energy into electrical energy via electrochemical reactions. Also, both devices can
achieve high efficiencies when partially loaded. The main difference between fuel cells and
batteries is the need to recharge the latter due to the limited storage capacity of the electrode from
which the energy for the electrochemical process is generated. Fuel cells, however, do not require

6
recharging as they can continuously produce direct current as long as the fuel/oxidant supply is
maintained [9 -13, 15].
1.2.2 Types of Fuel Cells
Fuel cells dates back to the 19th century when Sir William Grove, a Welsh judge and scientist,
demonstrated that the backward reaction of water electrolysis can generate electricity. Hence, he
built the first fuel cells initially called a gas battery, which has gone through various
developmental stages. At present, there are five main types of hydrogen fuel cells used in various
applications including transportation, stationary power generation and portable devices. Fuel cells
are fundamentally classified according to the type of electrolytes employed. They can also be
further classified by their operating temperatures into low and high temperature fuel cells [9-12,
14, 15]. The basic characteristics of each fuel cell type is summarised in Table 1 and briefly
described below:
1. Alkaline fuel cells
Alkaline fuel cell (AFC) was the first practical fuel cell to be developed. AFC utilises an aqueous
electrolyte, potassium hydroxide (KOH), and operates at 90-100 oC. The first AFC was built by
Francis Bacon, a British Engineer in 1939 and was later improved on by UTC, USA. The
improved AFC was used to power the National Aeronautics and Space Administration (NASA)
Apollo space craft in the 20th
century. The advantages of AFC includes: (1) a less corrosive
alkaline environment, which permits the use of cheaper component materials (2) the use of non-
noble metal catalysts such as Nickel and Silver. (3) AFC can achieve higher electrical efficiency of
up to 60% compared to other low temperature fuel cells. Nevertheless, the aqueous electrolyte in
AFC is sensitive to carbon dioxide and the volume of the liquid used affects cell performance:

7
excess/insufficient liquid results in electrode flooding/drying. Recent advances in AFC include the
replacement of KOH solution with an anion exchange membrane [9-13, 15].
Table 1 Comparisons of the different types of hydrogen fuel cells [9-13]
Type
Electrolyte
Operating
temperature
(oC)
Fuel
Efficienc
y (%)
Application
Alkaline fuel
cells
(AFC)
Aqueous
solution of
potassium
hydroxide
90-100
Pure
hydrogen
50
Military and
space
Proton
exchange
(PEM) fuel
cells
Solid polymer
membrane
60-80
Pure
hydrogen
40-60
Transportatio
n, stationary-
power back
up,
portable
power
Phosphoric
acid fuel cells
(PAFC)
Phosphoric acid
150-200
Pure
hydrogen
40
Distributed
generation
Molten
carbonate
fuel cells
(MCFC)
Lithium and
potassium
carbonate
600-700
Hydrogen,
methane and
other
hydrocarbon
>50
Distributed
power
Solid oxide
fuel cells
(SOFC)
Stabilised solid
electrolyte
700-1000
Hydrogen,
methane and
other
hydrocarbon
>50
Auxiliary
power
Distributed
generation

8
2. Proton Exchange Membrane Fuel Cells
Proton exchange membrane (PEM) fuel cells are low temperature fuel cells which operate
between 60-80 oC. They are typically based on a solid polymer electrolyte (also called the
proton exchange membrane) and porous carbon electrodes containing a platinum or platinum
alloy catalyst. The main advantages of PEM fuel cells are low operating temperatures, high
power density and near zero emissions, which make their application in automobiles very
attractive. On the other hand, the platinum based catalyst is very sensitive to carbon monoxide
poisoning, hence, pure hydrogen must be used. If impure hydrogen is used, an additional
reactor that reduces carbon monoxide (CO) is necessary. Other drawbacks of PEM fuel cells
include cost and durability of other components [9-13, 16, 17].
3. Phosphoric Acid Fuel Cells
Phosphoric acid fuel cells (PAFC) were the first type of fuel cells to be commercially
developed for stationary power generation. This type of fuel cells is currently in use for power
generation in some office buildings and hotels in Europe, America and Japan. As the name
suggests, the electrolyte in PAFC is concentrated phosphoric acid, in a Teflon-bonded silicon
carbide matrix, while the electrodes are porous carbon containing platinum catalyst. They
operate typically between 150 oC and 220 ˚C. Advantages of PAFC are (1) co-generation of
electricity and heat making it to achieve high efficiency of up to 85%. However, the efficiency
is lower (about 37-42%) when only electricity is generated. (2) Higher resistance to carbon
monoxide poisoning compared to AFC and PEM fuel cells. Hence, PAFC can utilise hydrogen
produced from fossil fuels, which often contain sulphur. The main drawback of PAFC is
associated with the high cost of the catalyst [9-13, 18].

9
4. Molten Carbonate Fuel Cells
Molten carbonate fuel cells (MCFC) are high temperature fuel cells (600-700 oC) composed
of a mixture of carbonate salt as electrolyte (e.g. Li2CO3/K2CO3 or Li2CO3/Na2CO3) and
porous carbon electrodes. At 650 oC, the electrolyte melts into conductive carbonate ion at the
cathode. MCFC are tolerant to CO poisoning, hence, they can use a wide variety of fuels such
as biogas and natural gas. These high temperature fuel cells can achieve up to 60% efficiency
when used for electricity generation alone and up to 85% efficiency when used for
cogeneration of heat and electricity. Another advantage of MCFC is the possibility of using
non-noble metal as catalyst; thereby reducing cost. However, slow start-up and limited
durability as well as high operating temperature and corrosive electrolyte which promote
material degradation are major demerits of the MCFC [9-13, 19].
5. Solid Oxide Fuel Cells
This type of fuel cells generate electricity at high temperatures between 800-1000 oC via a
solid ceramic electrolyte (e.g. zirconium oxide stabilised with yttrium oxide (YSZ))
sandwiched between porous electrodes. At the cathode, oxygen from air is reduced to oxygen
ions and thereafter migrates to the cathode to react with hydrogen producing electricity and
heat. The high operating temperature in solid oxide fuel cells (SOFC) permits the use of a
wide variety of fuels, eliminates the need for external fuel reformers and makes the use of
non-precious metal catalysts possible. Durability as in the case of MCFC is one of the major
challenges with SOFC [9-13, 20].

10
1.3 FUEL CELLS FOR ROAD TRANSPORTATION
Fuel cells find application in diverse energy requiring devices ranging from portable devices to
stationary power distribution and transportation devices. Remarkable progress has been reported in
recent times concerning the development of fuel cells for portable devices, stationary power
generation and automobiles [9, 13, 16, 18]. In the transport sector, the successful deployment of
fuel cells as power sources for automobiles could be promising for reduction of global GHG
emissions.
Amongst the different types of fuel cells, PEM fuel cells are attractive for automotive propulsion
due to its high power density, low operating temperatures and near zero emissions, all
advantageous over conventional internal combustion engines (ICEs). Nevertheless, there are a
number of economic and technical challenges that need to be addressed before PEM fuel cells
powered automobiles can be fully commercialised. One of these challenges is the development of
low cost and durable materials for key components of the PEM fuel cells stack.
A typical PEM fuel cells stack consists of a number of single fuel cells arranged in series. Each
single fuel cell is made up of a membrane electrode assembly (MEA) sandwiched between two
bipolar plates. The MEA consist of a solid polymer electrolyte, the catalyst layer and the gas
diffusion layer (GDL). These components perform vital roles, which will be discussed later in
Chapter 2, which dictate the performance of the PEM fuel cells. Hence, cost reduction and
durability enhancement of materials used for these components, are considered necessary for
commercialisation of PEM fuel cells.
The present research focuses on the bipolar plates, which constitute a significant proportion of the
cost and weight of the stack. Bipolar plates are traditionally fabricated from non-porous graphite

11
due, to their high corrosion resistance and high surface conductivity in the warm and humid PEM
fuel cells environment. Conversely, graphite is brittle and has to be made several millimetres thick
(> 2-5mm) via resin impregnation to prevent gas leakage. The use of thick plates adversely affects
the power density of the fuel cells. In addition, the processing and machining cost associated with
graphite bipolar plates are too enormous for mass production consideration. Thus, alternative
materials such as metals and carbon based composites are under investigation to replace graphite
bipolar plates [16, 17, 21-24].
Metals such as stainless steels and aluminium generally offer advantages such as higher
mechanical strength and lower cost of production, over carbon based composites and graphite.
Metals are also better conductors of heat and electricity, impermeable to gases and amendable to
low-cost production process like stamping and hydroforming. Metals are, however, susceptible to
corrosion attack in PEM fuel cell environments and exhibit high interfacial contact resistance with
the GDL. Metallic ions produced during corrosion can poison the proton exchange membrane and
be detrimental to its efficiency. On the other hand, high contact resistance with the GDL can
generate ohmic losses within the cell that degrade cell output power [21-23]. Consequently,
surface modification of metals via coatings and treatments is necessary for metals to be a viable
option for PEM fuel cells bipolar plate.
1.4 RESEARCH GOALS AND APPROACH
The primary aim of this research work is to explore the feasibility of developing surface coatings
that can enhance the performance of metal bipolar plates in PEM fuel cells. This aim was
accomplished through the following objectives:

12
1. Characterisation and evaluation of adopted coatings performance in simulated PEM fuel cells
environments.
2. Optimisation of coating parameters via experimental design.
3. Evaluation of single fuel cell performance of selected coatings.
The research was conducted in two phases:
1. Evaluation and modification of novel CoBlast™ graphite coatings.
2. Optimisation of pack-cemented chromised coating via experimental designs, performance
evaluation of the optimised chromised coating in simulated and real PEM fuel cell
environments and modification of the optimised coatings.
The targets for each phase are as outlined below:
Phase I: Evaluation and modification of CoBlast™ deposited graphite coatings
Preliminary investigations into the suitability of graphite coatings deposited by a room
temperature surface enhancement technique known as CoBlast™ and subsequent
modification of the coatings.
Surface characterisation of the coated surfaces using scanning electron microscopy (SEM),
energy dispersive X-ray (EDX) analysis and X-ray diffraction (XRD) and X-ray
photoelectron spectroscopy (XPS).
Phase 2: Optimisation of pack-chromised coating via experimental designs
Development of design matrix based on Box-Behnken experimental designs and
implementation of the design matrix to deposit coatings. Accelerated corrosion testing and

13
surface characterisation using scanning electron microscopy (SEM), energy dispersive x-
ray (EDX) analysis and X-ray diffraction (XRD) for chromised coatings
Development of a mathematical model, optimisation of deposition process parameters and
validation of model developed
Surface characterisation of the optimised coating with scanning electron microscopy
(SEM), energy dispersive x-ray (EDX) analysis and X-ray diffraction (XRD) and X-ray
photoelectron spectroscopy (XPS)
Simulative testing in PEM fuel cell cathodic and anodic working conditions and
environments.
Evaluation of single cell performance of optimised chromised coating using the substrate
as reference.
Attempts to improve single cell performance of the optimised chromised coatings via pack
carburisation prior to chromising.
The application of chromised coatings for enhancing the surface conductivity and corrosion
properties in PEM fuel cell environment has been reported in the literature. However, only
comparatively few alloys have been investigated within limited process parameters [25-29].
Hence, in this work, a design of experiments (DoE) approach will be adopted to systemically
investigate the effect of process parameters on the corrosion current density of pack-chromised
AISI304 stainless steel exposed to a simulated PEM fuel cell environment of 0.5 M H2SO4 +
2 ppm HF at 70 oC for the first time. DoE will also be employed to establish optimum process
parameters for depositing pack-chromised coating on AISI304 stainless steel with minimum
corrosion current density in the selected simulated PEM fuel cell environment.

14
1.5 THESIS OUTLINE
This thesis is presented in eight chapters. Chapter one introduces the reader to the challenges and
opportunities of fuel cell driven automobiles, as well as the research aims and objectives. In
chapter two, a review of the literature on important aspects of PEM fuel cells is given, as well as a
review of surface coatings and treatments employed in bipolar plate applications and their
performances in real and simulated environments. Chapter three focuses on the materials, methods
and equipment utilised for coating deposition, surface characterisation, and corrosion testing, as
well as surface conductivities of coating and single cell performance along with the design of
experiment (DoE) approach used. The results obtained for surface characterisation,
electrochemical polarisation and contact resistance of CoBlast™ coatings and its subsequent
modification by pack chromising are reported and discussed in Chapters 4 and 5 respectively. In
chapter 6, the DoE results for the systematic investigation of the influence of the selected
parameters on corrosion current density of chromised 304 stainless steel as well as optimisation of
the process parameters were presented and discussed. In-situ and ex-situ performance of the
chromised stainless steel produced at the optimised process parameters were also discussed.
Chapter 7 presents and discusses the surface characterisation results obtained for the surface
characterisation of the modified chromised coatings as well as its performance in real and
simulated PEM fuel cell environments. The conclusions drawn from the study, contributions to
knowledge and recommendations for future work are highlighted in the eighth chapter.

15
Chapter Two
Background and Literature review
2.1 INTRODUCTION
In this chapter, details of the operating principles and components of the PEM fuel cells as well as
the challenges to commercialisation of PEM fuel cells are presented. A review of the literature on
metallic bipolar plates is also presented.
2.2 PROTON EXCHANGE MEMBRANE FUEL CELLS
Proton exchange membrane (PEM) fuel cells are energy conversion devices that generate clean
electrical energy from the electrochemical reaction between hydrogen and oxygen. These devices
use an electro-catalyst and a solid polymer membrane and function at temperatures between 60 °C
and 80 °C producing water and heat as the only by-products. Hence, these electrochemical devices
are increasingly being targeted for automotive, stationary and portable power generation. Other
advantages of PEM fuel cells include low operating temperature, high power density, quick start-
up capacity, and rapid response to varying load. [9-13, 16, 17].
A single PEM fuel cell consists of the membrane electrode assembly (MEA), the flow fields plates
(also called bipolar plates in stacks), current collector, backing/end plates, the gaskets and bolts
arranged as shown in Figure 3. The basic operation of a typical PEM fuel cell involves oxidation
of hydrogen at the anode and reduction of either oxygen or air at the cathode.

16
As illustrated in Figure 3, humidified reactant gases (H2 and O2/air) are pumped in through the
bipolar plates to the respective electrodes:
Figure 3 Components of a PEM fuel cell [30].
At the anode, hydrogen gas is oxidised to hydrogen protons by releasing its electrons as shown
in Equation 1.The reaction is known as the hydrogen oxidation reactions (HOR).
H2 → 2𝐻+ + 2e+ Eθ = 0V at 298 K (1)
The hydrogen ion produced at the anode travels through the solid polymer electrolyte, which only
allows the passage of positively charged ions, to the cathode while the electrons are transported to
the cathode through an external circuit. At the cathode, the hydrogen protons react with oxygen or
air by a reaction known as the oxygen reduction reaction (ORR) (Equation 2)

17
1
2𝑂2 + 2𝐻+ + 2𝑒− → 𝐻2𝑂 𝐸𝜃 = 1.299 at 298 K (2)
The overall reaction is;
𝐻2 + 1
2𝑂2 → 𝐻2𝑂 𝐸Ө = 1.229 𝑉 at 298 K (3)
Figure 4 Schematic diagram of a PEM fuel cell.
2.1.1 PEM fuel cell stack
Single PEM fuel cells have little practical application due to the low voltage (0.6-0.7 V) produced.
Therefore, in order to achieve higher voltage output for practical application, two or more single
cells are arranged in series to form a stack, as shown in Figure 5.

18
PEM fuel stacks consist of the membrane electrode assembly, bipolar plates, end plate, current
collectors and bolts. Among these components, the bipolar plates and the membrane electrode
assembly (MEA) are key components that significantly influence the cost, performance and
durability of the stack. These components and their functions are briefly discussed as follows:
Figure 5 Schematic representation of a PEM fuel cell stacks [31].
(A) Proton Exchange Membrane
The membrane in a typical PEM fuel cell is a solid polymer which conducts only protons and is
often referred to as ‘the heart’ of PEM fuel stacks, as its performs critical roles that determine cell
performance. The primary roles of the membrane includes; (1) transportation of hydrogen proton
produced at the anode to the cathode, (2) structural support for the MEA and (3) separation of the
reactions at the cathode (ORR) and the anode (HOR). Hence, the basic requirements for PEMs are

19
high ionic and proton conductivity as well as high mechanical, chemical and thermal stability
under PEM fuel cell working conditions. Other requirements include cost effectiveness, low gas
impermeablility and availability.
Perfluorinated sulfonic acid (PFSA) membranes with a polymer backbone with a basic chemical
structure shown in Figure 6 are commonly used in conventional and commercially available PEM
fuel cells. Examples of PSFA membranes include Nafion® Gore
®, Flemion
® and Aciplex
®. Among
these membranes, Nafion® is the most widely used PSFA electrolyte, as it possesses high proton
conductivity and high mechanical strength. However, Nafion® is expensive and requires that the
reactant gases be humidified to prevent the membrane from drying out.
Figure 6 Structure of per fluorinated sulfonic acid (PFSA) membranes [32].
Alternative materials to Nafion®
membranes include radiation grafted polymer electrolytes,
modified Nafion membranes with porous support material or added organic/inorganic compounds
and sulfonated aromatic polymeric such as sulphonated Polyetherketone (PEEK) with chemical
structure as shown in Figure 7. PEMs are subject to mechanical degradation such pinholes, cracks,

20
tears, and chemical degradation by hydroperoxyl radicals (HO2-), cationic contaminations etc.
These failure modes have a profound effect on proton conductance and water transport within the
membrane [10, 12, 16, 32-34].
Figure 7 Structure of sulphonated Poly ether ketone [33].
(B) The Catalyst Layer
The catalyst layer consists of platinum or a platinum alloy supported on carbon materials such as
Vulcan-XC 72 carbon black or a catalyst coated membrane. The platinum catalyst facilitates the
electrochemical reactions within the fuel cells, such as hydrogen oxidation reactions (HOR) and
oxygen reduction reactions (ORR).The latter is typically a very slow reaction and therefore
determines the performance of the catalyst layer in PEM fuel cell working conditions. The rate of
these reactions depends on factors such as the chemical composition and catalyst loading. A high
catalyst loading facilitates faster electrochemical reactions at increased cost.
The catalyst layer, generally, constitutes the largest proportion of the cost of a PEM fuel cell stack
due to the high price of platinum. However, in recent times, different approaches to cost reduction
have been explored. These approaches includes: reduction of platinum loading, development of
non-precious metal catalysts such as iron-based nanostructures on nitrogen functionalised
mesoporous carbons (NMC), and the use of non-carboneous support. Nevertheless, achieving high

21
ORR activity and stability in PEM fuel cell environments is challenging. Apart from cost
reduction, improving the durability of the catalyst layer is another research and development
(R&D) focus, as the catalyst layer is subject to a couple of degradation processes such as;
poisoning and contamination from impurities which originate from the fuel/oxidant supply or other
fuel cell components, agglomeration of platinum particle (Ostwening ripening) and carbon support
corrosion [10-12, 16, 17, 33, 34].
(C) The Gas Diffusion Layer
The gas diffusion layer (GDL) is a single or dual layer carbon based material with a porous
structure which permits the diffusion of reactant gases (H2 and O2/air) from the bipolar plates to
the catalyst layer and conducts electrons between the two components. The GDL also provides
mechanical support to the catalyst layer and facilitates water and heat transport from the catalyst
layer to the bipolar plates as illustrated in Figure 8 (a). GDLs are required to be hydrophobic in
order to effectively remove water produced at the cathode which can lead to blockage of the pores
thereby preventing gas passage to the catalyst,
The single layered GDLs are made of a macro-porous substrate such as carbon paper, cloth (Figure
8 (b)) or foam treated with polytetrafluoroethylene (PTFE). The double layered GDLs, on the
other hand, contain an additional thin microporous layer of carbon black powder mixed with PTFE
which is positioned next to the catalyst layer to reduce the contact resistance and enhance water
transport between the two components. The GDL is subject to degradation modes such as
mechanical failure due to the thermal cycling nature of the PEM fuel cells and loss of hydrophobic
material due to long term use [10, 12, 13, 17, 34, 35].

22
Figure 8 (a) Schematic of structure of the flow channels within the bipolar plate and the
membrane electrode assembly (b) Micrographs of carbon cloth and carbon paper GDL
materials [35].
(D) The Bipolar plates
The bipolar plates (also called the separator plates) are multi-functional components of the PEM
fuel cells that perform critical functions that influence cell performance. The primary roles of the
bipolar plates are;
(1) Uniform distribution of reactant gases over the active electrode area,
(2) Electrical connection between individual cells,
(3) Facilitation of water and heat management within the cells,

23
(4) Provision of mechanical support and strength for the MEA [21-24, 31, 36].
In order to improve reactant gas transport and distribution, the bipolar plates are typically designed
with flow field channels, land and manifolds as shown in Figure 9. These features provide
pathway for reactant gases and uniform distribution over the active electrode area. The channels
provide routes for reactant gases to flow to the catalyst layer via the GDL (Figure 8 (a)) while the
lands facilitate electron transport to and from the GDL. On the other hand, the ‘manifolds’ carry
reactant gases and by-products from and to the bipolar plates. The design of the flow channels
significantly impacts the performance of PEM fuel cells. Hence, different types of flow field
designs as shown in Figure 10 have been developed and the influence of such design on PEM fuel
cells power output has been investigated [36].
Figure 9 Features of a typical bipolar plate [21].

24
Materials requirements for bipolar plates includes: low cost, high corrosion resistance and high
electrical and thermal conductivity. Graphite is the conventional material for PEM fuel cell bipolar
plates. However, graphite is brittle and expensive for mass production purposes amongst other
disadvantages. Hence, alternative materials such as metals and carbon/polymer composites have
attracted considerable R&D attention as potential replacement for graphite bipolar plates. Bipolar
plates are, however, subject to corrosion and increase in interfacial contact resistance with the
GDL during operation irrespective of the material from which it was fabricated [19, 21, 22, 37-39].
Figure 10 Schematic diagram of typical flow field design: (a) pin-type, (b) series-parallel, (c)
serpentine and (d) interdigitated type [36].

25
2.3 CHALLENGES TO COMMERCIALISATION OF AUTOMOTIVE PEM FUEL
CELLS
Research and development (R&D) activities on automotive PEM fuel cells, primarily driven by
the promising potential of PEM fuel cells to enhance energy security and reduce greenhouse gas
emissions in the transport sector, have been in the lime light for some decades. Extensive research
efforts by governmental agencies in Europe, United States of America (US), Japan, etc. in
collaboration with the academia and industry has resulted in remarkable progress evidenced by
field demonstration of prototypes vehicles by major automotive companies such as Ford, Toyota,
Daimler (Mercedes Benz), Hyundai, Honda etc. Nevertheless, the commercialisation of PEM fuel
cell powdered vehicles is faced with cost and technical challenges associated with both the PEM
fuel cell stack and other balance of plant components, as well as hydrogen production and
distribution [17, 40, 41].
Hydrogen PEM fuel cells systems presently cost about twice that of internal combustion engine
and suffer severe degradation during operation. According to the United States Department of
Energy (US DOE), cost of PEM fuel cells system would have to be reduced to ~ US$30/kW and
achieve stable performance for at least 5000 hours for light duty vehicles and 20,000 hours for a
bus with minimal power loss (~ 10%) at the end of life, as well operate over a wide temperature
range (- 40 to +40 oC), in order for PEM fuel cells powdered vehicles to compete with traditional
ones built on internal combustion engines [41]. In Europe, a consortium of automakers original
equipment manufacturers (OEM), automobile component and system suppliers and academic
researchers named ‘AUTOSTACK CORE’ have recently set the cost target for a 95 kW
automotive PEM fuel cell stack at 40 €/kW for 100000 units with similar operating hours and
degradation targets as the US DOE as well as other performance targets [42,43].

26
Cost reduction of the key components of PEM fuel cells; the membrane assembly electrode and
bipolar plates is widely recognised as a necessary route to commercialisation of PEM fuel cells. To
this end, cost reduction and improving the lifespan of these components have attracted global
research attention. A significant portion of the research on these key components has been centred
on materials selection and development for these components. For bipolar plates, developments of
low cost and durable bipolar plates which are amenable to rapid, high volume and cost effective
manufacturing processes as well as meeting durability targets, are major research interest. Hence,
the present research is focused on the bipolar plates and the remaining part of this chapter is
devoted to the important aspect of bipolar plates related to the research.
2.2.1 Cost and Durability of Bipolar Plates
The bipolar plates described in the previous section are important components of the PEM fuel
stack that perform critical roles that can affect the performance and durability of PEM fuel stacks.
Bipolar plates also account for a significant portion of the cost, weight and volume of the PEM
fuel cells stack being the most repeated component in a PEM fuel cell stack. Earlier reports
indicated that bipolar plates constitute about 35-45% and 60-80% of the cost and weight of typical
PEM fuel cell stacks respectively [44,45]. However, it has recently been reported that the cost
contribution of the bipolar plates to the overall cost of an 80 kW net automotive PEM fuel cell
stack composed of 369 single fuel cells and 740 bipolar plates can be reduced to about 15-20%
through replacement of conventional graphite bipolar plates with plates made from carbon
/polymers composite or metals coupled with increased production rate [46]. However, since cost
and durability are interrelated issues, for any of these alternative materials to be suitable for an
automotive PEM fuel cell bipolar plate, the material is expected to satisfy not only the cost

27
requirement of US $3/kW and be amenable to high volume cost effective manufacturing
processes, but also durability requirements as list below [ 22, 37, 38]:
Light weight
High mechanical strength: > 41 MPa
High bulk electrical conductivity: >100 S/cm
Good hydrogen permeability : < 2 x 10⁻⁶
cm3/cm
2 s
Electrochemical stability in simulated PEM fuel cell environment of pH 3 sulphuric acid
(H2SO4) + 0.1 ppm hydrofluoric acid (HF)
o High corrosion resistance with corrosion current density at -0.1 V (SCE) and
Hydrogen gas purge < 1 µ/Acm2
o High corrosion resistance with corrosion current at 0.6 V (SCE) and Air purge < 1
µ/Acm2
Low Interfacial contact resistance (ICR) at 140 N/cm2
: 10 mΩ /cm2
Good thermal conductivity : > 10 W/m K
2.2.2 Materials for Bipolar plates
(A) Graphite
Bipolar plates are conventionally fabricated from non-porous graphite due to its good chemical
stability and corrosion resistance in the warm, acidic, and humid environment within the PEM fuel
cell. Graphite also possesses low density and good electrical and thermal conductivity as well as
low contact resistance with the gas diffusion layer. Nonetheless, there are concerns about its low
mechanical strength which is compensated for by increasing the thickness of the plates to about (4-
6 mm), resulting in low gravimetric and volumetric power density. Also, graphite has to be

28
impregnated with resin or treated thermally to block its pores and improve gas impermeablility
while flow field designs are incorporated by computer numerical control (CNC) machining which
is expensive and time consuming. These secondary processing routes induce additional cost
thereby hindering large scale production. Hence, from a cost and weight perspective, graphite is
considered unsuitable for mass production. Extensive R&D on bipolar plates has led to two classes
of alternative materials: carbon- polymers composites and metals [21-24, 37-39]
(B) Carbon-polymer composites
Carbon-polymer composites are composites that have a thermosetting (e.g. vinyl ester) or
thermoplastic (e.g. polypropylene) polymer matrix loaded with conductive carbon fillers such as
graphite, carbon black, carbon nanotubes, graphene [21, 24, 47] The polymer matrix provides
structural support while the carbon fillers enhance electrical conductivity. These lightweight and
corrosion resistant materials are manufactured by low cost injection or compression moulding,
which are amenable for large-scale production. The main disadvantage associated with the use of
carbon-polymer composite as bipolar plates, is their low electrical conductivity which is
dependent of the content and particle size of the filler. Increasing the filler content improves
electrical conductivity but is detrimental to mechanical strength, a basic requirement for
automotive applications. Therefore, achieving optimum balance between mechanical strength and
electrical conductivity is prerequisite for carbon-polymers composites to emerge as alternative to
graphite [21, 24, 39, 47].
(C) Metals
Metals such as stainless steels, aluminium and titanium have several advantages over graphite and
carbon-polymer composite materials particularly in terms of cost and weight. Metallic bipolar

29
plates can be produced at relatively low cost using economic and well-established industrial
processes such as hydroforming, stamping, casting which are also amenable to mass production.
Other advantages of metals besides cost reduction include: thickness and weight reduction by
using thin sheets, foils, screens and foams, higher volumetric and gravimetric power density
comparable to that attainable with thick graphite plates can be achieved. Other advantages of
metals include gas impermeablility, higher mechanical strength and electrical conductivity
compared to the graphite and carbon composites as shown in Table 2. Metals are, however,
susceptible to corrosion in the working environment of PEM fuel cells and exhibit high interfacial
contact resistance with the GDL [21-23, 37, 38]. The consequences of these phenomenon on the
performance of PEM fuel cells are briefly described as follows;
I. Corrosion of metallic bipolar plates in PEM fuel cells environment.
The environment within a typical PEM fuel cell is warm (60-80 oC), humid and acidic (~ pH 3).
The PEM fuel cell environment could also be oxidising or reducing depending on the gas input at
the electrodes. These conditions coupled with operating potentials (-0.1 V at the anode and 0.6 V
at the cathode) are favourable for corrosion to occur. Metallic ions released from the oxidation of
metallic bipolar plates either migrate to the proton exchange membrane via the GDL or are leached
into the water by-product. In the former case, metallic ions can reduce the proton conductivity and
efficiency of the membrane by replacing the hydrogen proton on the sulphonate group of the
membranes, which has a higher affinity for metallic ions than protons.
Studies [17, 49-50] on membrane contamination indicates that the presence of metallic ions such
as Al3+
, Cr3+
, Fe3+
in trace quantities such as parts per million (ppm) can significantly degrade cell
performance. Furthermore, multivalent cations arising from corrosion of metallic bipolar plates

30
Table 2 Representative physical values for different bipolar plate material (adapted from 21-
23).
Properties
Graphite
( untreated Poco
graphite )
Composite
(SGL carbon)
Stainless steel
(316/316L)
Density (g/cm3)
1.78
(20% porous)
1.97
8.00
Bulk
electrical conductivity
(S/cm)
200
680.30
13, 513
Hydrogen permeation
(cm3/(cm
2s)
10−2
-10−6
2.5 x 10⁻⁵
< 10−12
Modulus of elasticity
10
-
193
Flexural strength (kg/cm2)
407.80
878.80
Tensile strength (MPa)
15.85
515
can react with hydrogen peroxide formed by oxygen crossover at the anode as diagrammatically
represented in Figure 11 or oxygen reduction processes at the cathode (Table 3) to form hydroxyl
(OH•) and hydroperoxyl (HO2
-) radicals (Equation 4 & 5) which poisons the catalyst layer and
degrade the membrane durability. In order to minimise dissolution of metals during corrosion,

31
corrosion resistant and low cost metals such as stainless steel, aluminium and titanium alloys
which typically exhibit passivity in PEM fuel cells environments and working potentials are
recommended. The use of chemically inert metals such as gold, platinum is not feasible due to
their high cost [21-24, 37, 38, 47].
Figure 11 Schematic diagram of oxygen crossover through the membrane in a PEM fuel cell
[51].

32
Table 3 Possible oxygen reduction reactions at the PEM fuel cell cathode and the
thermodynamic electrode potentials of electrochemical O2 reductions [34].
Oxygen reduction reactions
Thermodynamic electrode
potential at standard conditions
𝑶𝟐 + 𝟒𝑯+ + 𝟒𝒆− → 𝑯𝟐𝑶
𝑶𝟐 + 𝟐𝑯+ + 𝟐𝒆− → 𝑯𝟐𝑶𝟐
𝑯𝟐𝑶𝟐 + 𝟐𝑯+ + 𝟐𝒆− → 𝟐𝑯𝟐𝑶
1.229 V
0.70 V
1.76 V
𝑀2+ + 𝐻2𝑂2 → 𝑀3+ + 𝑂𝐻• + 𝑂𝐻− (4)
2𝑀3+ + 𝐻2𝑂2 → 3𝑀2+ + 𝑂𝑂𝐻• + 𝑂𝐻+ (5)
II. Interfacial contact resistance
Three main types of irreversible losses are encountered in PEM fuel cells: (1) Activation losses
arising from the cathode catalyst and accounts for losses in the low current density region as
shown in Figure 12. (2) Ohmic losses due to ionic resistance of the membrane and electron flow
resistance (also known as interfacial contact resistance (ICR) between components in the PEM fuel
cell stack. Concentration losses originate from mass transport limitations as oxygen is transported
through the porous electrode. As shown in Figure 12, concentration losses are prominent in the
high current density region. Among these operational losses, ohmic losses due to interfacial
contact resistance between the bipolar plates and the GDL are of major concern for metallic
bipolar plates. This is due to the fact that the native oxide layer in metals such as stainless steels,

33
Figure 12 Energy losses in PEM fuel cells adapted from [52].
titanium and aluminium, which enhances the anti-corrosion properties of these metals, is semi
conductive in nature.Hence, the native oxide layer reduces electronic conduction at the bipolar
plate / GDL interface thereby favouring the conversion of chemical energy to heat rather than the
desired electrical energy [53]. For instance, it was reported that about 59% of the power losses in a
stack built with 316 stainless steel bipolar plates was due to the ICR between the stainless steel
bipolar plates and the GDL [54]. Studies have also shown that the thickness of the passive oxide
layer on these metals increases during operation thereby increasing contact resistance between the

34
bipolar plate and the GDL [21, 22, 37, 38]. Hence, surface modification of metallic bipolar plates
via coatings and treatments is necessary for optimum cell performance.
Interfacial contact resistance between the bipolar plate and the GDL can be influenced by factors
such as surface roughness, clamping pressure and the nature of the GDL material [21, 55-60].
Studies [55, 56] show that the higher the average surface roughness (Ra) of the bipolar plates, the
lower the contact resistance. This trend is attributed to the fewer number of contact points and
smaller area of contact between the GDL and the metallic bipolar plate with a higher surface
roughness value.
The pressure at which the fuel cell stack is assembled plays a vital role in determining the contact
resistance between the bipolar plates and the GDL. Generally, ICR decreases with increasing
clamping pressure due to increasing contact area between the bipolar plate and the GDL. However,
very high clamping pressure can damage the GDL and reduce its porosity while insufficient
clamping pressure can lead to fuel leakage [51-53].
The nature of the GDL material i.e. the type of material and the type of enhancement process e.g.
polytetrafluoroethylene (PTFE)-treatment has also been reported to adversely affect ICR between
the GDL and the bipolar plate [58-60]. It is generally reported that increasing the PTFE loading of
the GDL increases ICR between the bipolar plates. For instance, Ismail et al. demonstrated that
increasing the PTFE loading contact of GDLs from SGL technologies, Germany from 0 to 30 wt.
% lead to a corresponding increase in the contact resistance as compaction pressure increased
(Figure 13).

35
Figure 13 Effect of PTFE loading on contact resistance. [59]. (10AA, 10BA, 10CA, 10DA,
10EA are designated names for SGL carbon paper with 0%, 5%, 10%, 20%, 30%
respectively).

36
2.4 A SURVEY OF THE LITERATURE ON METALLIC BIPOLAR PLATES
Metallic bipolar plates have recently attracted considerable research attention as alternative
materials for PEM fuel cell bipolar plates due to their cost, volume and weight advantages of metal
over non-porous graphite. Hence, most automotive PEM fuel cell stacks are built on metallic
bipolar plates which can attain higher power densities than stacks built on graphite bipolar plates
[26, 33, 34]. As indicated in the previous section, metals have low corrosion resistance and surface
conductivities in PEM fuel cell environments which results in degradation of cell output.
Therefore, research and development activities on metallic bipolar plates have focused on
improving corrosion resistance and reducing ICR. The literature indicates that different types of
metals which are sub-divided into bare metals, coated metals and porous metals (foams, screens
and meshes) as shown in Figure 14 have been investigated. Therefore, a review of the performance
of the different metals in in-situ and ex-situ testing is presented as follows;
2.3.1 Bare metals
(A) Stainless Steels
Stainless steels are iron based alloys containing at least 50% iron (Fe), minimum of about 11%
chromium (Cr) and other elements such as nickel (Ni), molybdenum (Mo), titanium (Ti), nitrogen
etc. [61, 62]. These ferrous based alloys are classified into different grades: austenitic, ferritic,
martensitic, duplex stainless steels etc. based on chemical composition. Stainless steels derives its
anticorrosion properties from the presence of a thin surface oxide layer (about 3-5 nm thick) which
consist of an inner layer of a p-type chromium oxide (Cr2O3) and an outer layer of a n-type iron
oxide and hydroxide [63].

37
Figure 14 Classification of metallic materials for PEM fuel cells bipolar plate [21-23].
These alloys also possess outstanding physical, electrical and mechanical properties and are
available at relatively low cost, thus, these ferrous based alloys have attracted much attention as
potential replacement for graphite bipolar plates [21, 22, 37, 39, 47]. Investigations on the
feasibility of using stainless steels as bipolar plate materials indicated that the performance of
stainless steels in PEM fuel cell environment is dependent on its alloy content especially
chromium content [64-67]. Wang et al. [65] reported that the higher the chromium content in
Metallic
Bipolar Plates
Bare
metals
Examples
Stainless steel
Titanium
Aluminium
Copper
Nickell
Coated
metals
Metal
based coating
Examples
Metal nitrides
Metal carbides
Metal oxides
Nickel based coatings
Carbon
based coating
Examples
Graphite
Conductive polymer coatings
Diamond like carbon coating
Self assembled monopolymer
Graphene
porous
metallic materials
Examples Foams, Screen
Mesh

38
349™ (23 wt.% Cr), 904L (20.48 wt.% Cr), 317L (18.10 wt.% Cr) and 316L (16.20 wt.% Cr)
austenitic stainless steels, the higher the corrosion resistance in simulated PEM fuel cell
environment of 1 M H2SO4 + 2 ppm HF at 70 oC bubbled with air or hydrogen gas and the lower
its contact resistance. A similar trend was also observed for ferritic stainless steels type AISI 434
(17.95 wt. % Cr), AISI436 (18.10 wt. % Cr), AISI441 (18.23 wt. % Cr), AISI444 (18.49 wt. % Cr)
and AISI446 (28.4 wt. % Cr) [66]. For both grades of stainless steels, XPS analysis of the passive
layer revealed that the passive layer was composed of Fe2O3 and Cr2O3, with the latter having a
profound effect on corrosion resistance while ICR values of the different grades of stainless steel
showed a dependency on the thickness and composition of the passive oxide layer. The findings
of Wang et al. [65,66] was consistent with that of Davies et al. [67] wherein single fuel cell
performance of 310L, 316L and 904L stainless steel bipolar plates were evaluated at 200 N/cm2
for 3000 hours. Their results showed that the higher the chromium and nickel content of the
stainless steels investigated, the lower the thickness of the oxide layer and the lower the ICR
values. Hence, the single cell performance was given as 904L > 310L > 316L. Based on these
results, they concluded that optimising the chemical composition of stainless steels was vital in
selecting bare stainless steels for PEM fuel bipolar plate applications.
Generally, stainless steels with high Cr and Ni content such as 904L, 310L exhibit acceptable
corrosion resistance and ICR values in PEM fuel cell environments but are considered too
expensive for bipolar plate applications. Therefore extensive research work has focused on
stainless steels alloys with lower Cr and Ni content such as 316 / 316L, 304 / 304L, low alloy
ferritic stainless steels etc. Among the low cost austenitic stainless steel alloys 316 / 316L stainless
steel, a Cr-Ni-Mo austenitic stainless steel alloy has been widely investigated due to its high
resistance to corrosion. Ma et al. [68] investigated the corrosion resistance of eight types of

39
stainless steels (i.e. 410, 439, 301, 304, 316,317L, 310 stainless steels and Incoloy alloy 825) in
K2SO4 at 80 oC with oxygen and hydrogen gas purging to mimic the anodic and cathodic PEM fuel
environment respectively. They concluded from the 72 hours corrosion test that 316/316L stainless
steel was a good choice for PEM fuel cell bipolar plate having exhibited maximum corrosion
resistance in the electrolyte, although its ICR increased from 10 mΩ.cm2
before polarisation to 11
mΩ.cm2 and 41 mΩ.cm
2 after polarisation in simulated anode and cathode conditions respectively.
Davies et al. [67] reported that single fuel cell assembled with 316 stainless steel bipolar plates
exhibited a stable performance with no evidence of corrosion after 3000 hours of operation.
However their results showed the 316L stainless steel exhibited the lowest cell performance as
well as the highest ICR among the investigated stainless steel alloys (904L, 310L) studied. The
stable performance of 316L stainless steel could probably be attributed to the high compaction
forces of 200 N/cm2 utilised in the study as it is well established that ICR decreases with
compaction forces [21, 58-60]. Secondly, the lack of evidence of corrosion could be explained
using recent work by Papadias et al. [69]. They demonstrated via potentiostatic polarisation studies
of 316L stainless steel in simulated PEMFC environment of pH 3 H2SO4 + 1 ppm HF at 80 oC
that the degradation of 316L stainless steel at a given potential was dependent on the thickness of
the passive film. Their work also showed that as soon as a steady-state passive thickness is
reached, dissolution remains low and nearly constant. Hence, it is possible that during the 3000
hours of operation dissolution was very minimal such that visible damage could not be seen on the
plates
Several other investigations argued that 316/316L stainless steels were not suitable as bipolar plate
materials without surface modification [79-81]. Li et al. [79] reported that 316 stainless steel was
in the active state under PEM fuel cell anode working conditions and environment when polarised

40
in 0.001 M hydrochloric acid solution with or without SO42-
ions at 80 oC. The finding of Makkus
et al. [71] on the performance of single fuel cell assembled with 316L stainless steels bipolar plates
further confirmed the results of Li et al. [70] as they found that the contaminants (Fe, Cr and Ni)
on the anode side were higher than that at the cathode side. Also, the ICR and metallic ion
generated from the cell with 316L bipolar plates was the highest among the seven grades of
stainless steels (UNS 1.4439, UNS 1.4541(321), UNS 1.4529, UNS 1.3974, 1.4404 (316L))
studied. Hence, they concluded that bare 316 stainless steel was not an ideal choice for bipolar
plate application but recommended surface modification of 316L stainless steel for optimum
performance.
Wang and Northwood [72] studied the influence of PEM fuel cell operating environments on the
corrosion resistance of 316L stainless steel exposed to 0.5 M H2SO4 at 70 oC. Inter-granular and
pitting corrosion was observed at both electrodes with the alloy exhibiting a higher corrosion
resistance in simulated cathode environment due to a higher tendency to passivate in oxygen rich
environments. However, when polarised at typical anodic and cathodic PEM fuel cell potentials
for 10 hours, lower transient current densities and metallic ions were recorded for 316L stainless
steel in hydrogen containing environment indicating that under PEM fuel cell working conditions,
corrosion of 316L stainless steel was minimal at the anode compared to the cathode. Based on
the ICP-MS results, the author estimated that a total of 25 ppm and 42 ppm of metallic ions would
have been leached from the anode and cathode respectively after 5000 operation hours has (as
required for PEM fuel cell powered automobiles) thereby degrading performance. Hence, they
recommended surface coatings for 316L stainless steel in agreement with previous investigations
[70, 71].

41
(B) Titanium
Titanium and its alloys have high strength to weight ratio and excellent chemical stability in acidic
environments. Although, titanium is about 40% lighter than stainless steels, its higher cost and
lower formability than stainless steels prohibits its application in automotive PEM fuel cells [21,
23, 47, 64].
Titanium and its alloys form a thin layer of titanium oxide when exposed to air. This oxide layer
is well known to be responsible for the resistance of titanium to corrosion in favourable conditions.
However, it is reported that this naturally occurring oxide becomes unstable when exposed to
PEM fuel cell anodic conditions due to the low applied potential (-0.1 V) resulting in high anodic
currents at the inception of polarisation. After rapid dissolution of the naturally occurring oxide
layer, a new oxide layer which cathodically protects the metal from further dissolution is formed.
On the other hand, the surface oxide is stable at the cathode but cannot totally prevent dissolution
leading to leaching of Ti2+
which could poison the membrane and degrade performance [73].
Similarly, Wang and Northwood [74] concluded from their 10 hours potentiostatic polarisation of
Ti (II) alloy in 0.5 M H2SO4 at 70 oC that Ti
2+ ions leached from the anode and cathode would lead
to unacceptable deterioration of stack output.
Davies et al. [60] further demonstrated that bare titanium was not suitable for PEM fuel cell
bipolar plate by comparing the performance of single cells assembled with titanium, 316 and 310
stainless steel and graphite bipolar plates. Their work revealed that at the end of 1300 hours of
single cell polarisation, the ICR of titanium increased about eight fold from the initial 32 mΩ·cm2
at 220 N/cm2
compared to 7% and 16% increase in that of 310 and 316 stainless steels, which was
given as 26 mΩ·cm2 and 44 mΩ·cm
2 before polarisation respectively. Consequently, the cell

42
suffered significant power degradation compared to cells with bipolar plates fabricated from
graphite, 316 and 310 stainless steel bipolar plates. In subsequent studies [75], they showed that
surface modification of the titanium plates improved single fuel cell performance. Similar
enhancement of single fuel cell performance has been recently reported by Jin et al. [76]. Their
studies showed that 25 cm2 active area single fuel cell assembled with TiN coated titanium bipolar
plates exhibited approximately a double fold improvement in the current density of the cell with
the uncoated plate (396 V) at 0.6 V. The improvement was attributed to ohmic losses due to
growth of oxide arising from corrosion of the bare plates during operation.
(C) Aluminium
Aluminium and its alloys are lightweight, low cost metals which exhibit good corrosion resistance
in atmospheric conditions due to the formation of a thin layer of aluminium oxide. The main
advantages of aluminium as a bipolar plate material are its low density, cost effectiveness and ease
of fabrication. Aluminium has a density of 2.7 g/cm3 which is comparatively lower than that of
stainless steel and Titanium (Table 4).
Table 4 Densities of metals commonly used for bipolar plate
Material
Aluminium
Stainless steel
Titanium
Density (g/cm3)
2.7
7.48-8.00
4.51
The ease of fabrication combined with aluminium low cost denotes the possibility of achieving a
much higher volumetric and gravimetric power density with aluminium bipolar plates than

43
stainless steels or titanium. However, aluminium has higher corrosion rates and shorter cell life
than stainless steel and titanium under PEM fuel cell operating conditions. Studies have also
shown that coatings for aluminium have to be absolutely defect-free to prevent the substrate from
corrosion in PEM fuel cells environments [77-79].
(D) Copper
Pioneering studies on copper as PEM fuel cell bipolar plate material was conducted by Nikam et
al. [80, 81]. They examined the corrosion behaviour of copper-beryllium alloy (C-17200) exposed
to 0.5 M H2SO4 (pH 3–5) and a mixture of 5% HCl + 5% Na2SO4 respectively. The electrolytes
were bubbled with oxygen and argon gases to simulate PEM fuel cell cathode and anode
environments respectively. They concluded from the electrochemical polarisation results that
copper-beryllium alloy was a potential candidate for bipolar plates given that copper alloys are
conductive materials. Hence, they further examined the single cell fuel performance of the alloy
and reported that the 16 cm2 active area single fuel cell assembled with bipolar plates fabricated
from copper-beryllium alloy exhibited good durability when tested for 100 hours under constant
load of 1 A. The single fuel cell also exhibited maximum current density and power cell resistance
comparable to single fuel cells with 316 stainless steel bipolar plates reported by Costamagna et al.
[82] as shown in Table 5. Similar studies on bare copper alloys were also reported by Hsieh et al.
[82]. However, Pan et al. [84] have recently demonstrated the need to enhance the performance of
copper in PEM fuel cell environment via surface modification.

44
Table 5 Comparison of c-17200 Cu-Be alloy bipolar plate performance with 316L stainless
steel bipolar plate [81].
Bipolar plate materials
Maximum
current density at 0.2 V
( mA/cm2)
Cell
Resistance (Ω)
Cu-Be alloy (C-17200)
(surface area – 16 cm2)
500
0.084
SS316L stainless steel
(surface area- 10.89 cm2)
380 0.349
Carbon coated SS316L stainless steel
(surface area 10.89 cm2)
800 0.134
2.3.2 Coated Metals
Surface modification of metallic bipolar plates has been widely employed as means for enhancing
the corrosion resistance and surface conductivities of metals in PEM fuel cell working conditions
and environments. Surface coatings and/or treatments for PEM fuel cell bipolar plates are required
to be electrically conductive, chemically stable and corrosion resistant under typical working
conditions of the PEM fuel cells. Other requirements include strong adherence to the substrate and
cost effectiveness. The integrity of the coating, which is dependent on the coating material and
deposition process, is often the most important aspect for bipolar plate applications as it dictates
performance and durability. However, the presence of coating defects such as pinholes, cracks, and
pores in the coating as well as thermal mismatch between coating materials and the substrate are
commonly reported to accelerate corrosion of coated metals in PEM fuel cell environments and
thus promote loss of surface conductivity [33, 34, 63]. A wide range of coatings basically divided

45
into metal-based coatings and carbon based coatings as shown in Figure 14 have been
investigated, the performance of the various types of coatings in simulated and real PEM fuel cells
environments is reviewed below:
2.3.2.1 Metal-based coatings
(A) Noble metal coatings.
Thin micron layers of noble metal coatings such as gold and platinum exhibit excellent stability
and corrosion resistance in PEM fuel cells. In some cases, comparable or better performance than
graphite bipolar plates [77, 78, 85, 86] has been reported. Hentall et al. [77] compared the single
cell performance of gold coated 316L stainless steel and aluminium bipolar plates to Poco™
graphite and reported that gold coated stainless steel showed superior performance to Poco™
graphite. The gold coated aluminium also showed equivalent current density to the graphite
bipolar plates at the onset of experiments after which performance rapidly deteriorated from 1.2
A/cm2 to 60 mA/cm
2 at 0.5 V. Examination of the plates after the experiments indicated that the
coatings were weakly adhered to the base metal. Consequently some of the coatings were leached
into the membrane thereby contaminating it and deteriorating power output. Woodman et al. [78]
added that the difference in the coefficient of thermal expansion between aluminium (Al) and gold
(Au) was also a factor that could contribute to low durability of gold coated aluminium bipolar
plates. They stated that a differential of about 18 µm/m/oC existed between the coefficient of
thermal expansion (CTE) of Au and Al and that during thermal cycling as encountered in
automobiles, failure of gold coated Al plates is inevitable. To mitigate the poor adhesion between
Au and Al, the authors demonstrated that the use of interfacial layers of copper and nickel between
Au and Al reduced the corrosion rate of gold plated Al specimen by 30% and 37.5% before and

46
after thermal cycling respectively. In-situ testing of the coated plates revealed that the coated
bipolar plates had higher open circuit voltage than graphite bipolar plates and maintained
performance akin to graphite throughout the test. Their results also emphasised the importance of
proper deposition process parameter selection. The use of pulse current during electroplating
promoted better adhesion which resulted in better performance than the plates deposited by direct
current electrodeposition which exhibited poorer output than the graphite plates.
Wind et al. [85] compared the performance of gold coated 316 stainless steel and graphite bipolar
plates tested in a 49cm2 active area single cells operated at 75
oC for 1000 hours. The results
indicated the cell with the gold coated plates exhibited equivalent cell voltage with graphite
bipolar plates showing negligible power degradation throughout the duration of the test. Wang et
al. [86] also reported that 25 cm2 active area single fuel cell assembled with Au coated titanium
plates showed superior performance to cells with graphite plates at high membrane humidifier
temperatures between 80 oC and 90
oC. On the other hand, at lower membrane humidifier
temperatures (40-60 oC) an opposite trend was observed. However in both conditions, the Au
coated titanium plates showed better output than the uncoated plates due to an increase in the
surface conductivity of the plates induced by the precious metal coatings. In another study, the
authors also reported that platinum coated titanium bipolar plates outperformed the uncoated plates
showing comparable performance to the single fuel cell with graphite bipolar plates [87].
Generally, noble metal coatings are considered too expensive for automotive PEM fuel cell despite
their comparable performance to graphite [21-23]. For instance, it is reported that gold coated
aluminium bipolar plates cost about four times graphite bipolar plates [22]. However, recent work
by Kumar et al. [88] showed that reducing the thickness of gold coatings to nano-meter scale could

47
be a viable option for cost reduction of gold coatings. In their study, they examined the
electrochemical behaviour of 10 nm gold coated 316L stainless steel developed by Daido steel,
Japan in 0.5 mM H2SO4 (pH 3) at 80 oC exhibited excellent corrosion resistance with current
density less than 1 μA/ cm2 at 0.8 V vs. NHE in 24 hours potentiostatic experiments and attained
ICR values of 6.30 mΩ.cm2 at 60 N/cm
2.
(B) Metal-Nitride coatings.
Hard ceramic nitrides coatings such as titanium nitride (TiN) and chromium nitride (CrN) are one
of the most widely studied coatings for bipolar plate applications. These coatings, which are often
deposited by vacuum based processes such as physical vapour deposition (PVD), chemical vapour
deposition (CVD) or surface treatment processes such as thermal nitridation and plasma nitridation
and more recently electrochemical nitridation and ion implantation, have been proven to be
corrosion resistant and electrically conductive. However, the beneficial effect of these nitrides
coatings is usually undermined by the presence of pinholes, cracks and other coating imperfections
mostly related to the deposition processes.
(I) Titanium nitride coatings
The performance of TiN coatings deposited on titanium and stainless steel by various techniques
in PEM fuel cell environments is widely reported. Zhang et al. [89] evaluated the in-situ and ex-
situ performance of TiN coatings deposited by a PVD based process on titanium bipolar plates.
The ex-situ test revealed that the coatings retarded the corrosion rate of the substrate while
reducing its ICR. On the other hand, the 1000 hours in-situ testing of the coated plates in a 25 cm2
active area single fuel cell indicated that the cell had a maximum power density of 0.68 W/cm2
with a corresponding current density of 1600 mA/cm2
at 0.65 V with minimal degradation. Based
on these results, the authors further investigated the performance of TiN coated Ti plates in a

48
stack. The results showed that the stack had a high gravimetric power density of 1353 W/kg even
though its volumetric power density was about 57% lower than that obtained in the single cell
experiments [90]. This lower performance of the stack was attributed to the variation in flow field
designs and flow channel parameters of the bipolar plates utilised in the stack. A similar
investigation on the single cell and stack performance of TiN coated 316L stainless steel was
reported by Cho et al. [91]. In the single cell test, TiN coatings improved the performance and
lifetime of 316L stainless steel bipolar plates, which operated for 120 hours attaining a current
density of 796 mA.cm2 compared
to the 700 hours and current density of 896 mAcm
2 at 0.6 V of
the TiN-coated plates. Nonetheless, performance of the coated Ti plates was inferior to that of the
graphite bipolar plates which operated for 1000 hours without performance degradation exhibiting
about 11.2% improvement in the current density of the TiN coated plates at the same voltage.
Analysis of the water droplets produced from the cell with the graphite and TiN coated bipolar
plates revealed that the inferior performance of the TiN coated plates was due to contaminations of
the MEA by metallic ion which originated from the dissolution of the coating. The authors further
evaluated the performance of a 1 kW stack consisting of 12 single cells and operated at a constant
load of 48 V for 1028 hours. The stack showed an average degradation rate of 11% per 100 hours
while the individual cells showed a much lower degradation rate. The study emphasised the
importance of a defect free coating in achieving better performance and lifetime with TiN coated
bipolar plates.
The need for defect free TiN coatings was reiterated by other studies on the corrosion resistance of
TiN coated 316L stainless steel in simulated PEM fuel cell working conditions [92, 93] and
confirmed by Nam et al. [94] and Jeon et al. [95]. They both reported significant improvement in
the corrosion resistance and surface conductivity of TiN coated 316L bipolar plates by increasing

49
the bias voltage [94] and partial pressure of nitrogen gas [95] during deposition respectively. In
both cases, modification of deposition parameters improved the quality of the coating leading to
better performance.
Plasma immersion ion implantation (PII) of titanium at 370°C was reported by Feng et al. [96] to
enhance surface conductivity and corrosion resistance of titanium in a simulated PEM fuel cell
environment of 0.5 M H2SO4 + 2 ppm HF, while the same process conducted at temperatures
lower than 100°C deteriorated both ICR and corrosion performance of the substrate. The
difference in the inhibitive properties of both samples was attributed to the thickness of the
titanium oxy-nitride surface layer formed during the implantation process. Omrani et al. [97] also
reported improvement in the performance of 316L stainless steel in simulative PEM fuel cell
environment using nano-crystalline TiN ions implanted on 316L stainless steel. TiN coatings were
deposited using a plasma device focus equipped with a nitrogen ion source and a titanium anode.
In order to achieve variation in the morphology and thickness of the coatings formed, multiple
nitrogen ions were fired using 10, 20 and 30 focus shots at a frequency of one shot by minute.
Their results showed that the higher the nitrogen ion shots, the better the transient corrosion
currents, with the 20 and 30 nitrogen ions shots exhibiting comparable currents of 1 µA/cm2
in
1 M H2SO4 at 70 oC with air purging. The interfacial conductivity of the samples showed that the
coatings formed with 30 shots of nitrogen ions exhibited the lowest ICR of 5 mΩ.cm2
at 200
N/cm2 while the coatings formed with 10 and 20 shots of nitrogen ions exhibited ICR of 20
mΩ.cm2 and 30 mΩ.cm
2 respectively at the same compaction force. On the other hand, Zhang et
al. [98] reported that a 3µm thick TiN coatings deposited on titanium by plasma nitriding could not
adequately protect the base metal from corrosion when exposed to 0.5 M H2SO4 + 5 ppm HF but
reduced its ICR by 60% exhibiting ICR value of 38.58 mΩ.cm2
at 220 N/cm2.

50
(II) Chromium nitride coatings
Chromium nitride is one of the most widely studied metal nitride coatings for metallic bipolar
plate. Studies on PVD deposited chromium nitride coatings abound in the literature much more
than TiN coatings, as it is reported that chromium nitride coatings are more compatible with
stainless steels than TiN coatings [89, 99].
PVD deposited chromium nitride (CrN) coatings generally exhibit good corrosion resistance in
PEM fuel cell environment. However, studies [100,101] indicate that the performance of these
coatings is dependent on composition which in turns depends on factors such as the nitrogen gas
flow rate. Wu et al. [100] reported that varying the nitrogen gas flow rate during deposition from
20 - 80 sccm increased the nitrogen content of the CrN coatings and resulted in better corrosion
resistance in a simulative PEM fuel cell environment of 0.5 M H2SO4 + 2 ppm HF and lower ICR
values. Single fuel cell performance of the CrN film with the lowest ICR of 6.4 mΩ.cm2 at
1.2 MPa and chemical formula of Cr0.5N0.5 was subsequently evaluated and compared to that of
silver-plated bipolar plates. The results revealed that the cell with CrN coated bipolar plates
exhibited 10% and 9% lower open circuit voltage and power density respectively at current density
of 500 mA/cm2 than the cell with the silver plated bipolar plates.
Similarly, Lavigne et al. [101] investigated the performance of two chromium nitride coatings
deposited on 316 stainless steel using nitrogen gas flow rate of 8 sccm and 100 sccm. The latter
consisted of a mixture of Cr2N (20%) and Cr (80%) while the latter was a single phase CrN
coatings. The authors reported that the performance of the coatings depended on the nature of the
passive film of the coatings. Using Mott-Schottky measurements, it was shown that the passive
film in both coatings exhibited similar p-type semiconductor behaviours with the single phase CrN

51
coating containing more cation vacancies which acted as dopants thereby favouring conductivity.
Hence, the single phase CrN coating exhibited lower ICR values than the Cr2N + Cr coating. At
typical compaction force of 140 N/cm2, the single phase CrN coating exhibited ICR value of 10
mΩ.cm2, which was ~67% lower than that of the Cr2N + Cr coating. Based on the ex-situ result,
the performance of a five-cell stack assembled with CrN coated bipolar plates was examined and
compared to that of gold coated bipolar plates. The result revealed that both stack exhibited similar
performance while the 200 hours durability test for the stack with CrN bipolar plates did not show
any mean voltage degradation over 200 hours of dynamic cycling.
PVD deposited chromium nitride coatings are well known to possess pin-hole defects, which
degrade their performance in PEM fuel cell environments. Hence, various attempts have been
reported in the literature to enhance their corrosion resistance and ICR in typical PEM fuel cell
environments. A primary route often employed to improve performance of CrN coatings is the use
of multi-layered coatings [21, 102-105]. Feng et al. [102] reported that multi-layered coating of
C/CrN containing 100-400 nm thick carbon layers reduced the ICR of CrN (10 mΩ.cm2) by
~75% at compaction pressure of 150 N/cm2. Similarly, potentiostatic polarisation experiments
results indicated that in a simulated PEM fuel cell environment of 0.5 M H2SO4 + 2ppm HF at 80
oC, the transient current density of CrN coating was remarkably reduced from 2.5 µA/cm
2 to the
values in the range of 2-9 pA/cm2
range under cathodic conditions. However, the influence of the
carbon layer on current density under anodic conditions was negligible although the C/CrN
coatings exhibited more stable behaviours than the CrN coating. The study further established that
a minimum thickness of 400 nm of carbon coating would be required for C/CrN coatings to
provide adequate corrosion protection in PEM fuel cell environment. This was due to the fact that

52
SEM images and ICP-MS analysis of the 100 and 200 nm carbon coatings revealed evidence of
pitting corrosion and higher metal ion release after 10 hours of polarisation.
Jin et al. [103] reported a slight improvement in the ICR and single fuel cell performance of CrN
coated bipolar plates using CrN/TiN multi-layered coating. Their work showed that CrN/TiN
multi-layered coating reduced the ICR of CrN coatings from 26.4 mΩ.cm2 to 23.5 mΩ.cm
2 while
it influences on corrosion resistance in 1M H2SO4 + 2 ppm fluoride ions was negligible. Hence,
the open circuit voltage of the 25 cm2 active area single fuel cell assembled with CrN/TiN coatings
exhibited a 5% increase in that of the cell with CrN coating, which was given as 0.62 V.
Several other studies [104-106] have also investigated the performance multi-layered CrN coatings
in simulated PEM fuel cell environments. However, the influence of the additional coating layer
cannot be deduced as the results were not compared to the single layered CrN coatings.
The performance of PVD deposited CrN coatings in PEM fuel cell environments can also be
improved by incorporating elements such as Al, C to form ternary coatings. Bi et al. [107]
recently demonstrated that incorporating 1.86 at. % of Al into CrN coatings reduced the corrosion
current density of CrN coatings in a simulated PEM fuel cell environment of 0.5 M H2SO4 + 5
ppm HF 70 oC by one order of magnitude and contact resistance by ~50% at 140 N/cm
2. The
improvement was attributed to reduction of CrN lattice and grain size by Al.
Chromium nitride coatings deposited by thermal nitriding have been extensively investigated by a
group of researchers at the Oak Ridge National laboratory (ORNL) and National Renewable
Energy Laboratory (NREL), USA [108-113]. In thermal nitriding, chromium nitride coatings are
formed by heat treating the stainless steel alloy or chromium rich metal in a nitrogen rich gas at

53
temperatures above 1000 oC. Thermal nitriding was first applied to Ni-50Cr alloy for bipolar plate
application by Brady et al. [108]. The Ni alloy was thermal nitrided at 1100 oC for 1 hour. The
nitrided layer consisted of a continuous and external layer of CrN and Cr2N coatings (Figure 15a).
Ex-situ testing of the coatings in pH 3 H2SO4 at 80 oC for 4,100 hours showed minimal voltage
change of 2 mV per 1000 hours and 2.7 mV per 1000 hours in the anode and cathode
environments respectively with low ICR values which didn’t increase during the test. Single fuel
cell testing of the nitrided Ni-50Cr also showed very promising results. However, the author
reported that Ni alloys were too expensive for mass production. Hence, they investigated the
possibility of applying the thermal nitriding process to stainless steels [109-113].
Figure 15 (a) SEM image of the cross-section of Ni-50Cr alloy nitrided at 1100 oC for 1 hour
[108], (b) SEM image of the cross section of nitirded at Fe-27Cr-6V stainless steel nitrided at
900 oC for 4 hours showing internal and external nitrides [109].
Their initial results showed that forming a continuous and external layer of chromium nitride on
commercially available stainless steels was challenging because stainless steels have high
permeability for nitrogen which favours the formation of discrete internal nitrides as shown in

54
Figure 15 (b). These discrete internal nitrides degrade the corrosion resistance of the nitrided steel
due to the depletion of chromium at the grain boundaries.
Another group of researchers based in South Korea [114,115] attempted to solve this challenge by
introducing a pre-oxidation step before nitridation of commercially available ferritic stainless
steels (430 and 446) stainless steels. The authors proposed that the chromium oxide layer formed
by oxidation prevented internal nitridation while their decomposition at the nitriding temperature
facilitated the formation of chromium nitrided. This approach yielded lower contact resistances
before and after polarisation but the formation of discrete chromium nitride particles persisted
(Figure 16).
Figure 16 (a) pre-oxidised (900 oC for 10 hours) 446M stainless steel nitrided at 1100
oC for 2
hours [114] (b) pre-oxidised (900 o
C for 5 hours) 430 stainless steel nitrided at 1040oC for 6
hours [115].

55
After a series of investigations, Brady et al. [113,114] demonstrated that adding vanadium to the
composition of stainless steel coupled with pre-oxidation was a viable way to prevent internal
nitridation and chromium particles precipitation. The pre-oxidation step process facilitated the
formation of a continuous layer of vanadium doped chromium nitride overlaying an intermixed
chromium oxide and nitride under layer as shown in Figure 17.
Figure 17 (a) SEM image of the cross-section of pre-oxidised nitrided Fe–27Cr–6V nitrided
at 850 °C for 24 hours in N2–4H2 atmosphere. (b) Bright-field cross-section TEM of SEM
image in (a) [162].
The feasibility of applying the process to Fe-(20-23%)-Cr-4%-V foils was subsequently
demonstrated and ex-situ polarisation of the surface modified foils in 1M H2SO4 + 2ppm HF at 70
oC revealed that the foils exhibited very low transient current densities in the range of 1 µA/cm
2
and a contact resistance of about 15 mΩ.cm2
at 150 N/cm
2 [111]. Based on the promising ex-situ
result, a 15 cm2
active area single cell with pre-oxidised and nitrided foils plates with a simple
serpentine flow-field design was assembled. The initial performance of the single fuel cell showed
that the cell attained an average power density of 222 mW/cm2 at 0.55 V [112]. Durability testing
of the foil plates for 1114 hours showed no significant degradation in cell power output X-ray
fluorescence (XRF) analysis of the MEA after the test showed that negligible amounts of Fe, Ni,

56
Cr and V were leached into the MEA in the course of experimentation. In comparison to cells with
untreated Fe–20Cr–4V, 2205, and 904L bipolar plates, the coated foil exhibited between 5% –20%
improvements in peak power output.
In another study [113], the group further demonstrated the feasibility of scaling up the pre-
oxidation and nitrided process to industrial scale by comparing the performance of bipolar plates
made from short-cycle infrared quartz lamp furnace and conventional laboratory furnace. Hence, a
50cm2 active area single cell with stamped, laser welded, and gas nitrided ferritic stainless steel
foils produced from both furnaces were assembled and tested under aggressive humidification
conditions (100% relative humidity and cycling relative humidity from 100%-40%) at 80 oC for
500 hours at 0.3 A/cm2
so as to hasten degradation of the membrane and facilitate a more corrosive
environment to assess durability of the foils. Details of single cell performance was not revealed
but it was reported that after 500 hours of operation, the cell voltage output showed a 10% decline
at a current of 1 A/cm2 which was attributed to MEA degradation (as the post-MEA test revealed <
1 µg/cm3 ions of metallic ions) or other degradation process not related to bipolar plates as the cell
resistance tested suggested there was no increase in ICR of the plates during the 500 hours of
operation.
Wang and Turner [116, 117] employed electrochemical nitridation of 446M stainless steels in 0.1
M HNO3 + 0.5 M KNO3 solution at -0.7 V for 4 hours at room temperature to solve the issue of
internal nitridation of stainless steel. The nitrided steel exhibited low transient current of 0.7
µA/cm2 and -2.5 µA/cm
2 at the cathode and anode respectively. However, the nitrided alloy
exhibited high ICR of 18 mΩ.cm2. In another study, the authors reported that decreasing the

57
potential at which the stainless steel was nitrided to -0.9 V reduced the ICR of the nitrided 446
stainless steel alloy to 10 mΩ.cm2 at 120 N/cm
2 without deterioration of corrosion resistance.
More recently, Jinlong et al. [118] demonstrated that grain refinement prior to electrochemical
nitridation reduced the corrosion current of electrochemically nitrided 316L stainless steel by one
order of magnitude while its transient current was in the range of 1 µA/cm2 when polarised in 0.5
M H2SO4 at 70 oC for 5 hours. The influence of grain refinement on ICR was, however, not
reported. Moreover, none of the studies on electrochemical nitridation have evaluated the single
fuel cell performance of electrochemical nitrided stainless steel despite the excellent results. This
observation may not be unrelated to the fact that potentiostatic methods of electrochemical
nitridation applied in these studies are limited to small surface areas.
Metal nitride coatings on Al bipolar plates are scarcely reported probably due to that fact that non-
defective coatings are necessary to protect Al bipolar plates from corrosion in typical PEM fuel
cells environments. However, defect-free coatings are difficult to achieve with vacuum based
deposition processes. Barranco et al. [119] studied the performance of a three cell stack assembled
with Al5058 coated with multi-layered chromium-zirconium nitride (ZrN/CrN) and mono layer
chromium nitride (CrN) PVD deposited coatings. The plates exhibited current densities of 470
mA/cm2 and 300 mA/cm
2 respectively in the 100 hours test. Visible damage was observed on the
multi-layered coated plated while none was evident on the CrN coated plates. In subsequent
studies [120], the authors attempted to improve on these results by varying the thickness of the
CrN coatings. Their results showed that as thickness increased, the coated Al5038 samples
exhibited better stability in 0.5 M H2SO4 + 2 ppm HF at 70 oC, bubbled with oxygen to simulate
the PEM fuel cell cathode environment. However, the samples were damaged after the 33 minutes

58
polarisation test due to pitting corrosion. They concluded based on their results that PVD
deposited CrN coatings were not suitable for Al bipolar plates. Similar conclusions were made by
Li et al. [121] on the performance of PVD deposited CrN and TiN coatings on 5052 Al in
simulative PEM fuel cell environment. However, their work showed that multi-layered coating
consisting of carbon and CrN (C/CrN) and TiN (C/TiN ) showed better anticorrosion properties
and lower ICR values than the single layered CrN and TiN coatings with transient currents in the
range of 10 to 100 µA/cm
2 in the cathode and anode environment respectively.
(III) Other metal nitride coatings
Wang et al. [122] investigated the ex-situ performance of niobium nitride (Nb-N) and
molybdenum nitride coatings deposited on 304 stainless steel by plasma surface diffusion alloying
technique. The Nb-N coatings exhibited ICR values of 9.26 mΩ.cm2 at 140 N/cm
2 and low and
acceptable transient current densities in a simulated PEM fuel cell environment of 0.05 M H2SO4
+ 2 ppm F- bubbled with air and hydrogen gas at 70
oC to mimic PEM fuel cell cathodic and
anodic environments respectively. After 4 hours of polarisation, the Nb-N coating exhibited
approximately double fold increase with the highest value of 19.14 mΩ.cm2. On the other hand,
Mo-N coatings exhibited higher ICR values of 27.26 mΩ.cm2 before polarisation and an increase
of 36.98% and 25.64% at the cathode and anode after polarisation respectively. Its transient
current at the cathode was similar to that of the substrate but an order of magnitude lower than that
of the substrate at the anode. These results indicated that Nb-N coatings exhibited better
performance than Mo-N in PEM fuel cell environments.
Studies on the suitability of Tantalum nitride (Ta-N) coated AISI 316L stainless steel as bipolar
plates was conducted by Choe et al. [124]. The corrosion resistance of Ta-N coatings deposited by

59
varying the nitrogen flow from 0-3.6 sccm during deposition was evaluated in a simulated PEM
fuel cell environment of 0.05 M H2SO4 + 0.2 ppm HF at 80 oC. The results indicated that the Ta-N
coatings improved the corrosion properties of the substrate and exhibited corrosion current
densities in the range of 0.1-1 µA/cm2
in the cathodic environment and 0.01-0.01 µA/cm
2 in the
anodic environment. The ICR of the samples at 150 N/cm2
showed that the Ta-N coatings
deposited at nitrogen gas flow rate of 3.6 sccm exhibited the lowest ICR value of 11 mΩcm2.
Evaluation of this coating under potentiostatic polarisation showed transient current density of
~0.2 µA/cm2 and ~0.06 µA/cm
2 under cathodic and anodic conditions.
(1V) Plasma nitrided coatings
Plasma nitriding, a surface treatment technique involving the diffusion of nitrogen ions into a
metallic surface in a plasma media, has also been reported for surface modification of stainless
steels for bipolar plate application. In contrast to conventional gas nitriding of stainless steels,
which yield discrete particles of CrN and Cr2N at temperatures above 550 0C thereby deteriorating
corrosion resistance, plasma nitriding is a low temperature process. Nitriding austenitic stainless
steel at temperatures < 550 oC yields a supersaturated nitrogen layer, otherwise called expanded
austenite (γN) or S phase. Tian et al. [125, 126] employed plasma nitriding at 370 oC for 2 hours to
deposit a dense and supersaturated nitrogen layer on 316L and 304L stainless steels. Their result
showed significant reduction in ICR of 316L stainless steel to 5-10 mΩ.cm2 at compaction
pressure of 100-200 N/cm2. Corrosion resistance evaluated by potentiodynamic polarisation in
0.05 M H2SO4 + 2 ppm HF at 70 oC with air and hydrogen gas purging was, however, not
improved. Although the potentiostatic polarisation results showed low transient currents, the result
was not compared with that of the uncoated substrates; hence, the effect of the coatings in relation
to the uncoated substrate could not be deduced. Moreover, ICR was increased by about six-fold at

60
the cathode and three-fold at the anode after 4 hours of potentiostatic polarisation. Similar results
were reported for the nitrided 304L stainless steel.
Hong et al. [127] attempted to improve both ICR and corrosion resistance of 316L stainless steel
by using inductively coupled plasma at 257 oC, 317
oC and 377
oC for 30 minutes at 6.6 Pa
respectively. Their results indicated that all the stainless steels showed low transient current of
<0.25 µA/cm2 after 2.78 hours of potentiostatic polarisation in 0.1 N H2SO4 + 2 ppm HF solution
at 80 oC with air bubbling to simulate PEM fuel cell cathodic environment. The ICR values of the
samples, however, showed a dependency on nitriding temperature. ICR decreased with increasing
temperatures attaining the highest value of 40 mΩ.cm2 at 257
oC and the lowest value of 11
mΩ.cm2 at 377
oC. XPS of the samples showed the formation of Cr2N and CrN at the outermost
layer as it was undetectable by XRD due to its higher depth of penetration.
Studies on active screen plasma nitriding of 316 stainless steels were reported by Lin et al. [128 -
130]. In their study, 316L stainless steel was nitrided at 370 oC, 410
oC and 450
oC respectively.
Their results was similar to Tian et al.’s work [125,126] showing no improvement in corrosion
resistance but with higher ICR in the range 88-37 mΩ.cm2 as temperature increased. In further
attempts to improve ICR and corrosion resistance of the active screen plasma nitrided 316L
stainless steel in 0.5 M H2SO4 + 2 ppm HF at room temperature and ICR, niobium and silver was
incorporated into the coated layer during deposition [129, 130]. ICR was significantly reduced to
8.9 mΩ.cm2 and 18.9 mΩ.cm
2 with niobium co-alloying and silver incorporation respectively but
corrosion resistance was not improved.

61
(C) Metal Carbides
Transition metal carbides coatings have excellent mechanical, anti-corrosion and electrical
properties and have been investigated for bipolar plate application. These types of coatings can be
deposited by a wide range of surface modification techniques.
Hung et al. [131] demonstrated that a patented chromium carbide based coating deposited on
aluminium bipolar plates by thermal spraying outperformed graphite composite plates in a single-
cell experiment that lasted for 1000 hours. At a current density of 200 mA/cm2, the cell with the
coated bipolar plates exhibited an output voltage of 0.7 V achieving a maximum power density of
0.32 W/cm2 and 58% efficiency. Conversely, the single fuel cell with the graphite composite
bipolar plates recorded a lower cell voltage of 0.5 V, maximum power density of 0.14 W/cm2
and
efficiency of 45% at the same current density. The higher performance of the coated Al plates was
credited to the lower bulk and interfacial contact resistances of the plates. Visual examination of
the plates after the test showed no evidence of corrosion, but the surface morphology of the
inactive part of the plates at the cathode revealed a microscale-crack in the coating. The authors,
however, argued that the crack did not penetrate the coating because EDX analysis of both the
aluminium and graphite composite bipolar plates indicated the presence of aluminium suggesting
its presence could be due to Al impurities in the inlet gases. According to the authors, the Al
impurities originated from the oxidation of the aluminium manifold in the end plates of the single
cells. They further added that the cell with the coated Al bipolar plates consumed lesser amount of
H2 than the graphite plates achieving a 22% savings in hydrogen consumption thereby reducing
cost.

62
Wang et al. [132] investigated the corrosion behaviour and ICR of niobium carbide diffusion layer
deposited on 304 stainless steel by plasma surface diffusion alloying technique. The corrosion
resistance of the niobium carbide (NbC) coating in simulated PEM fuel cell environment of 0.5 M
H2SO4 + 2 ppm HF solution at 80 oC was evaluated using potentiodynamic polarisation,
potentiostatic polarisation and electrochemical impedance spectroscopy measurements. The results
indicated that the coatings enhanced the corrosion resistance of the substrate. In particular, the
potentiostatic results indicated that the coating exhibited stable performance in the simulated PEM
fuel cell cathodic and anodic environment exhibiting two order of magnitude lower transient
current density than the substrate which stood at 7-8 µA/cm2
after 10 hours of polarisation. At the
anode, the NbC coating exhibited low transient current density of -0.05 µA/cm2 while the substrate
exhibited higher current density of 8 µA/cm2. The ICP-MS analysis of the electrolyte also
indicated that very low metallic ions were leached in the 10 hours of experimentation. ICR
measurements at room temperature showed that the coating exhibited ICR of 8.47 mΩ.cm2 at 140
N/cm2
and exhibited negligible increase of 3.54% and 6.73% after potentiostatic polarisation under
typical PEM fuel anodic and cathodic conditions respectively. In contrast, the substrate exhibited
higher ICR values before polarisation (100.98 mΩ.cm2)
and considerable increase after
polarisation (81.68% increase at the anode and 182.54% increase at the cathode).
Chromium diffusion coatings deposited on low carbon steels and stainless steels by pack
cementation at low and high temperatures have also been reported to exhibit good corrosion
resistance and low ICR in simulated PEM fuel cell environments [25-29, 133,134]. This type of
coatings typically contains a mixture of chromium iron carbide and chromium iron nitrides at the
outermost layer while the bulk of the coatings consist of chromium iron carbide. The carbides are

63
formed by the reaction between chromium and carbon in the stainless steel while the nitrides are
from the reaction between chromium and nitrogen decomposed from the ammonium chloride
(NH4Cl) activator.
Pioneering investigations on the application of chromised coatings for PEM fuel cells bipolar
plates were reported by Cho et al. [25, 26]. Their studies demonstrated that transient current
density of chromised 316L stainless steel deposited at 1050 oC for 2.5 hours in PEM fuel cell
environments of 0.5 M H2SO4 bubbled with air at 70 oC was in the 10 µA/cm
2 range. Their studies
further showed the effect of deposition time on the integrity of the coating. Chromised coatings
deposited at 1050 oC for 2.5 hours exhibited lower ICR (19–17 mΩ.cm
2 at 100-150 N/cm
2) than
the substrate (52.5–35.3 mΩ.cm2 at 100-150 N/cm
2) while the coatings deposited at longer hours
(23 hours) exhibited much higher ICR values the range of 320.7–233.5 mΩcm2
at 100-150 N/cm2.
The difference in ICR was attributed to the formation of a thin layer of chromium iron carbide
formed during lower chromising time compared to the chromium rich layer formed at extended
chromising times. In another study [27], the authors showed that shot peening pre-treatment prior
to chromising at 900 oC for 3 hours was beneficial in reducing transient current density of the
chromised coatings in 0.5 M H2SO4 + 2 ppm HF at 70 oC by one order of magnitude. The
improvement in corrosion behaviour was attributed to the 100% increase in thickness of the
chromised layer formed on pre-treated 316L stainless steel compared to the 1µm thick coated layer
formed at 1100 oC for 3 hours without pre-treatment. ICR values of the shot peened and chromised
sample was slightly lower than the untreated chromised sample which exhibited ICR values of 125
mΩ/cm2 at 100–200 N/cm
2.

64
Bai et al. [28, 29, 131, 132] investigated the effect of pre-rolling and EDM machining coupled
with low temperature chromising at 700 oC on low carbon steel (AISI 1020) and stainless steels
(420, 430, 316 type) in a simulated PEM fuel cell environment of 0.5 M H2SO4. The results
showed that increased grain boundaries induced by the pre-treatments increased diffusion of
chromium into the substrate thereby increasing the thickness of the coatings compared to their
counterparts without pre-treatment. Similarly, the anti-corrosion properties of the pre-treated
coatings in 0.5 M H2SO4 at 25 oC were superior to the untreated ones. Also, the ICR of the pre-
treated samples were lower than that of the untreated one due to increase in surface roughness
induced by the pre-treatments. ICR values as low as 5.9 mΩ.cm2, 12 mΩ.cm
2 and 11.8 mΩ.cm
2 at
140 N/cm2 were reported for pre-rolled and chromised 1045, EDM pre-treated and chromised AISI
1045 and AISI 1020 respectively.
The potential of chromium carbon (Cr-C) coatings deposited by PVD and electrodeposition
techniques to enhance the corrosion resistance and surface conductivity of stainless steel alloys in
simulated and real PEM fuel cell have also been explored [135-137]. It is, however, not clear
whether the coatings deposited by electrodeposition contain chromium carbide as none of the
investigations on electroplated Cr-C coatings conducted XRD phase analysis. Nonetheless, these
coatings have been shown to possess good corrosion resistance in simulated and real PEM fuel cell
environments.
Wang et al. [136] reported that electroplated Cr-C trivalent deposited on 304 stainless steel at
current density (10 A/cm2) for 10 minutes exhibited ICR of 19 mΩ.cm
2 at ~140 N/cm
2, The coated
steel, however, exhibited excellent corrosion resistance and stability in a simulated PEM fuel cell
cathodic environment attaining low transient current density of 1.51 x 10⁻¹⁰
A/cm2.
. Performance

65
evaluation of 25 cm2
active area single fuel cells assembled with Cr-C coated and uncoated plates
at 70 oC indicated that both cells exhibited similar OCV. However, as current density increased,
the cell with the uncoated plates showed rapid decrease in voltage attaining 0.45 V at current
density of 400 mA/cm2 while the single fuel cell with the coated plates attained 0.57 V. The study
further investigated the influence of gas flow rate and cell operation on the performance of the
single cell with coated plates. Their results indicated that increasing the gas flow rate at 70oC from
200 sccm to 300 sccm as well as increasing the operating temperature from 70 oC to 80
oC at
constant gas flow rate increased the cell performance. On the other hand, gas flow rate of 400
sccm at 70 oC and operating temperature of 90
oC at constant gas flow rate decreased performance
of the single fuel cells.
The performance of PVD deposited chromium carbon coatings on 316Ll stainless steel in a
simulated environment of 0.5 M H2SO4 + 5 ppm F- at 70
oC was studied by Wu et al. [137]. XPS
analysis of the coatings indicated the presence of chromium carbide on the outermost layer but its
concentration was too low to be detected by XRD. Nonetheless, the coatings exhibited ICR in the
range of 2.8-8.7 mΩ.cm2
as carbon content increased form 0.77 at.% to 0.95 at.% Potentiostatic
polarisation of the coating with the lowest ICR (Cr0.23C0.77) for 7 hours indicated low transient
current of in the range of 10-7.5
and 10-7
range in PEM fuel cathodic and anodic conditions
respectively. However, surface morphology of the sample polarised under anodic conditions
revealed evidence of pitting corrosion. The samples also showed increase in ICR from the initial
value of 2.8 mΩ.cm2
to 7.1 mΩ.cm2 to 6.2 mΩ.cm
2 after potentiostatic polarisation.

66
(D) Metal oxide coatings
Wang et al. [138-140] investigated the performance of fluorine doped tin oxide (FTO), SnO2: F
coatings deposited by low-pressure chemical vapour deposition (CVD) on various grades of
austenitic (grades 316L, 317L, 349™ ) and ferritic stainless steels (AISI 441, AISI 444 , AISI416)
in simulated PEM fuel cell of 1 M H2SO4 + 2 ppm HF at 70 oC. Their studies indicated that the
substrate played significant role on the stability and corrosion behaviour of the coated steels in
PEM fuel cell environments.
Among the SnO2: F coated austenitic steels [138], SnO2:F coated 317L stainless steel exhibited the
lowest ICR and transient currents in PEM fuel cell cathode and anode environments. The SnO2: F
coated 346™ stainless steel exhibited the highest transient current in the cathode environment
while SnO2: F coated 316L stainless steel was unstable in in the anode environment, hence, it
exhibited the highest transient current. However, SnO2: F coated 316L stainless steel exhibited
lower ICR than the SnO2: F coated 346™ stainless steel.
For the ferritic SnO2: F coated stainless steel coated steels [139], corrosion behaviour in the
cathodic and anodic environment was ranked as AISI 446 > AISI 444 > AISI416. However, all the
coated stainless steel exhibited higher ICR than their respective substrates. Hence, the authors
attempted to reduce the ICR of the ferritic stainless steels (AISI 446 and AISI 444) by etching the
surface oxide prior to deposition. The results showed that corrosion resistance was degraded
although ICR was significantly reduced [140].
Recently, Park et al. [141] reported the single fuel cell performance of fluorine doped tin oxide
coatings deposited on 316 stainless steel by cyclotron resonance-metal organic chemical vapour

67
deposition. Contrary to Wang’s findings, they reported that both ICR and corrosion resistance was
enhanced by mild plasma pre-treatment of the substrate before deposition. Hence, they further
investigated the effect of pre-treating the substrate at varying microwave power (800-1100 W).
The coating treated at a micro power of 1000W exhibited the lowest corrosion current density of
6.64 µA/cm2 in 1 M H2SO4 + 2 ppm HF under nitrogen gas at 80
oC and ICR of 74 mΩ.cm
2 at 150
N/cm2. The single
fuel
cell performance evaluation of this coating at 0.6 V indicated that coating
exhibited maximum power density of ~225 mW/cm2.
Comparing Park et al. [141] work to that of Wang et al. [138-140], it can be seen that in both case
ICR was significantly higher than the targeted 10 mΩcm2. Hence, it may be possible to improve
the performance of the coating by reducing its ICR. Also, corrosion performance evaluation under
nitrogen gas conditions may be a true predication of the PEM fuel cell environment as it is well
known that the cathodic environment is oxidising while the anodic environment is reducing in
nature. Therefore, further studies on the corrosion performance of SnO2: F coatings in real PEM
fuel cell environment are needed.
(E) Nickel-Phosphorous coatings
Nickel–phosphorous coatings deposited by wet deposition processes such as electro-less
deposition or electroplating are a class of coatings well reported for enhancing the performance of
Al alloys in real and simulated PEM fuel environments [140-145]. These coatings often exhibit
very high transient current density and ICR values. Hence, elements such as molybdenum, copper,
and cobalt are incorporated into the coatings to improve corrosion performance and decrease ICR.
Nonetheless, the ICR values of the modified coatings are often significantly higher than the
targeted value of 10 mΩ.cm2. For instance, Fetohi et al. [142] demonstrated that incorporating

68
cobalt into Ni-P coating deposited by electro-less deposition reduced the ICR from 150.75
mΩ.cm2 to 114.45 mΩ.cm
2 while the Ni–Co-P coating deposited by electroplating exhibited 33%
decrease in the ICR of Ni-P coating (88.85 mΩ.cm2) . Lee et al. [145], however, recently reported
that adding nano-graphite particles to Ni-Cu-P coatings can significantly reduce the in-plane
electrical resistivity and in-plane electrical resistivity of modified Ni-P coatings to acceptable
values.
2.3.2.2 Carbon-based coatings
(A) Carbon coatings
Carbon exists in many allotropic forms including amorphous carbon, graphite, and diamond.
These forms of carbon when deposited on metallic substrates generally exhibit chemical inertness
in many environments and low electrical contact resistance (except diamond). Hence they find
application for surface modification of PEM fuel cell bipolar plates. In recent times, the possibility
of employing graphene for surface protection of stainless steel bipolar plate has also been
explored.
I. Amorphous carbon coating
Amorphous carbon coatings deposited by high vacuum based processes such as chemical and
physical vapour deposition which are prone to pin holes defects are well reported for surface
modification of bipolar plates [146-149]. Although, most of the studies on amorphous carbon
coatings show that ICR is significantly reduced, only a few studies have demonstrated polarisation
studies at typical PEM fuel cell environments & working potentials. Fukutsuka et al. [146]
reported that plasma-assisted CVD deposited carbon-coating on 304 stainless steel decreased the
contact resistance of the substrate at typical compaction pressure before and after polarisation in
0.5 M H2SO4 + 2 ppm HF solution bubbled with H2 and O2 at 80 oC to simulate the anode and

69
cathode environments respectively. At 140 N/cm2, the sample polarised under PEM fuel cell
cathodic conditions exhibited 15% increase in ICR while the sample polarised under anodic
conditions exhibited 10% decrease in ICR. However, these results, which were conducted after
potentiodynamic test may not be representative of ICR changes under potentiostatic polarisation at
0.6 V (cathode) and -0.1 V (anode).
Feng et al. [147] studied the performance of a 3 µm thick amorphous carbon coating deposited
on 316L stainless steel by close field unbalanced magnetron sputter ion plating (CFUMSI) in
simulated PEM fuel cell electrolyte of 0.5 M H2SO4 + 2 ppm HF at 80 oC. Their results showed
that ICR of the substrate was reduced from 664.3-255.4 mΩ.cm2 to 10.2-5.2 mΩ.cm
2 under 90-210
N/cm2. However, the coated and uncoated samples exhibited comparable low transient currents in
both simulated anode and cathode environments after ~9 hours polarisation test although the ICP-
MS post-analysis of the electrolyte showed that the coated sample had a lower concentration of
metallic ions.
Single fuel cell and durability evaluation of amorphous carbon coatings are seldom reported in the
literature. Show et al. [148] reported the single fuel cell performance of amorphous carbon (a-C)
coatings deposited on titanium bipolar plates by radio frequency enhanced chemical vapour
deposition (RF-PECVD). At room temperature, the carbon coated plates exhibited very low
contact resistance of 2.5 mΩcm2, which represented a 50% reduction in that of the substrate. The
difference in ICR translated to a two-fold increase in the power output of that of the cell with the
uncoated bipolar plates.
Yi et al. [149] investigated the single fuel cell and stack performance of 304 stainless steel bipolar
plates coated with a-C coatings deposited by CFUMSI. The 40 cm2 active area single fuel cell

70
assembled with a-C coated bipolar plates attained a maximum power density of 1150.6 mW/cm2
while the single fuel cell with uncoated bipolar plates exhibited a lower peak power output of
562.6 mW cm−2
. Durability testing of the single fuel cell at constant cell voltage of 0.6 V for 200
hours at 60 oC showed that the single fuel cell with the coated bipolar plates outperformed the cell
with uncoated bipolar plates and experienced a lower performance degradation of 3.9% while the
performance of the single fuel with the uncoated plates deteriorated by 28.7%. Based on these
promising results, they further evaluated the performance of a three-cell stack at a constant voltage
of 1.8 V for 48 hours. The results showed that the stack exhibited an output power density is 873.3
mW/ cm2 at 1.8 V and maximum power density of 1040.1 mW/cm
2 at a current density of 2085.9
mA/cm2 with good short-term lifetime performance.
II. Graphite coatings
Graphite coatings are rarely reported for bipolar plate application compared to the other forms of
carbon coating. Wang et al. [150] developed a low cost method of depositing graphite coatings on
316L stainless steel by compressing a 10 cm x 10 cm layer of expanded graphite at 100 MPa on
316L stainless steel at 100 oC using carbon fillers and a polymer binder as schematically
represented in Figure 18. The graphite coatings which were polarised in 0.5 M H2SO4 at room
Figure 18 Schematic illustration of the design concept of the graphite-coated plates [153].

71
temperature significantly improved the corrosion resistance of the bare metal. However, the
contact resistance of the graphite coatings was impaired by the non-conductive nature of the
binder. The lowest contact resistance obtained at a filler content of 2.5 g was about 50% higher
than that of the bare metal implying that such coatings are not suitable for PEM fuel cell bipolar
plates. Husby et al. [151], however, demonstrated that by using a spraying technique followed by
hot pressing, it was possible to decrease the ICR of graphite coatings to values below that of the
substrate. The reduction in ICR was attributed to the reduction in porosity of the original coating
by ~50% as shown in Figure 19. The study revealed that carbon-based coatings made up of 45%
of graphite, 5% carbon black and 50% epoxy binder on 316L stainless steel had a contact
resistance of 9.8 mΩ/cm2
at 125 N/cm2 but its corrosion resistance was similar to that of the
substrate due to the porosity of the coating.
Figure 19 (a) non- hot pressed (b) hot-pressed graphite composite coating [151].
Chung et al. [152] deposited graphite like-carbon coatings on 304 stainless steel substrate coated
with a layer of Ni by an unnamed CVD process using a gas mixture of acetylene/hydrogen at
680oC. The coating exhibited a disarranged graphite structure at the surface but maintained a

72
highly ordered graphite structure at the carbon/Ni interface. Electrochemical polarisation of the
substrate coated 304 stainless steel and graphite in 0.5 M H2SO4 indicated that the anti-corrosion
properties of the coating were similar to that of graphite but better than that of the substrate.
Similarly, 100 hours of single cell testing of the coated bipolar plates at constant voltage of 0.6 V
revealed comparable performance to graphite bipolar plates operated at the same temperature of
40 oC while the uncoated plate showed a 16% loss in current density output.
III. Graphene
Graphene grown on electroplated Ni coated 304 stainless steel was recently proposed for metallic
bipolar plate application by Pu et al. [153]. Their work showed that graphene exhibited ICR values
of 36 mΩ.cm2 at 140 N/cm
2 before polarisation in 3.5% sodium chloride (NaCl) solution at
ambient temperature. After 20 potentiodynamic polarisation scans, ICR of the graphene Ni/304
stainless steel increased by 18% while maintaining good corrosion resistance at ambient
temperature. Hence, the authors concluded that graphene was promising for surface modification
of stainless steel in PEM fuel cell environments. In another study, Stoot et al. [154] further
demonstrated the beneficial effect of long term exposure (540 hours) of graphene to very harsh
environments of boiling 3.5% NaCl in an Atlas glass cell (Figure 20). Their results showed that
the excellent corrosion resistance of graphene grown on electroplated Ni stainless steel reported by
Pu et al. [153] may not necessarily be attributed to graphene as the corrosion parameters of
electroplated Ni stainless steel both with/without graphene coatings were very similar. However,
these studies did not consider that bipolar plates do not corrode at free potential but at 0.6 V at the
cathode and -0.1 V at the anode with the environment at each electrode either oxidising or
reducing. In addition, PEM fuel cell typically operates in an acidic environment at 60-80 oC,
hence, room temperature or boiling NaCl solution simulations may not be an adequate prediction.

73
Moreover, the ICR values reported by Pu et al. [153] were considerably too high for PEM fuel cell
operations. Therefore, more studies on the application of graphene for PE fuel cell bipolar plate
application are needed
Figure 20 Atlas cell containing 3.5 wt.% sodium chloride solution [154].
IV. Diamond like carbon coatings
Diamonds like carbon (DLC) coatings are a form of amorphous carbon coatings having a mixture
of sp3 of diamond and sp
2 bonds of graphite. These coatings exist in different forms and may or
may not contain hydrogen. Conventionally, DLC coatings are non-conductive but corrosion
resistant. However, Lee et al. [155] and Suzuki et al. [156] have reported the performance of
electrically conductive and corrosion resistant DLC coatings.
Lee et al. [155] compared the single cell performance of PVD-YZU001 DLC coated Al 5052 with
that of graphite and bare 316L stainless steel plate. Their results showed that YZU001 DLC coated
Al 5052 was promising for bipolar plate application at low operating voltage and power density.

74
The PVD coated plates exhibited lower corrosion current densities in simulated PEM fuel cell
environment of 0.5 M H2SO4 than the bare metal but was more corroded than 316L stainless steel
and graphite polarised in the same environment. The ICR of the materials revealed an opposite
trend and ranked as graphite < coated Al < bare 316L stainless steel. Hence, the coated Al plates
outperformed the 316L plates with high contact resistance were attributed to the presence of
passive oxides. At 0.6 V, the cell with the coated Al plates had a higher current density of 228
mA/cm2 while the 316L stainless steel had 158 mA/cm
2. In comparison to the single fuel cell with
the graphite plates, both metallic bipolar plates had lower performance and shorter lifetime even
though their open circuit voltage was higher.
Suzuki et al. [156] deposited a double layer of DLC coatings consisting of conventional DLC
formed at 200 oC and conductive DLC deposited at 350
oC by implanting nitrogen or boron ion via
Plasma based ion implantation and deposition techniques on 316L stainless steel. They reported
that the nitrogen/boron implanted DLC coatings exhibited very low ICR values (< 5 mΩ.cm2
at
150 N/cm2) and transient current of 1 µA/cm
2 when polarised in pH 2 H2SO4 acid at 80
oC at 1 V
vs SHE for 2 hours. Hence, they further evaluated the performance of 25 cm2 active area single
fuel cell and 167 cm2 active area stack containing 5 single fuel cells assembled with bipolar plates
coated with Ni/B implanted DLC coatings at 80 oC for 1000 hours. Their result showed that both
the single fuel cell and the stack exhibited very stable performance throughout the 1000 hours of
testing.
(B) Conductive polymer coatings
Conductive polymers are a class of coating that combine the electrical conductivity of metals and
the anti-corrosion properties of plastics. Examples include poly (o-phenylenediamine), polyaniline,
and polypyrrole. These coatings are often formed by electro polymerization techniques which

75
basically involves cathodic polarisation of the metal in a solution of the desired coating material
[157-159]. Recently, a group of researchers in Mexico have demonstrated that conductive polymer
coatings for bipolar plate application can be deposited by Electrophoretic deposition (EPD) [160].
In EPD, coatings are deposited via the transport of charged particles dispersed in a suitable solvent
towards an electrode, under an applied electric field [160].
Conductive polymer coatings often exhibit good corrosion resistance in PEM fuel cell
environments but unacceptable ICR. Joseph et al. [157, 158] studied the performance of
polypyrrole (PPy) and polyaniline (PANI) coatings on Al6061 and 304 stainless steel. They
reported that PPy and PANI coated Al 6061 exhibited higher ICR than the substrate while the
former was severely corroded when exposed to simulated PEM fuel cell environment of 0.1 M
H2SO4 [157]. However, when deposited on 304 stainless steels the coatings exhibited better
corrosion resistance and electrical conductivity [158]. In both studies, only potentiodynamic
polarisation was conducted with no gas purging. It is well known that the oxidising and reducing
nature of the PEM fuel cell electrodes cannot be correctly simulated in one environment. Moreover
the temperature at which the polarisation was conducted was not stated.
The findings of Wang and Northwood [159] on polypyrrole electro-polymerised on 316L stainless
steel by galvonanostatic and cyclic voltammetry clarified the behaviour of PPy coatings under
PEM fuel cell working conditions of -0.1 V and 0.6 V at the anode and cathode respectively. Their
results showed that the morphology of the coatings produced by the two routes differed but their
corrosion performance in 0.5 M H2SO4 purged with oxygen and hydrogen gas to simulate PEM
fuel cathode and anode conditions was similar. The coatings exhibited with transient current
density of about 10 µA/cm2
and in the range -10 to -20 µA/cm2 at the cathode and anode
respectively. In further attempts to improve the corrosion properties of the PPy coatings, the

76
authors employed Taugchi design of experiment technique to determine the effect of process
parameters (time of polymerisation and applied current as well as concentration of polypyrrole and
H2SO4 used for deposition) on the corrosion properties of the PPy coatings [161]. Their results
indicated that the coating produced at 2 A for 30 minutes with 0.05 mol/L and 0.2 mol/L
polypyrrole and H2SO4 respectively exhibited the best corrosion properties. Evaluation of the
performance of this coating in 0.5 M H2SO4 at 70 oC purged with hydrogen and oxygen gas for 10
hours indicated that the coatings exhibited transient current density of –20 µA/cm2 and ~10
µA/cm2 at the anode and cathode respectively. From the ICP-MS analysis of the dissolved metal
ions leached during the testing, they estimated that about 10 ppm and 20 ppm of metallic ions such
as Fe, Ni and Cr would have been leached into the electrolyte at the anode and cathode
respectively after 5000 hours of operation. However, the coatings exhibited comparable ICR
values to that of the substrate at typical PEM fuel cell compaction pressure with values
significantly higher than the targeted 10 mΩ.cm2
Some other authors have demonstrated that incorporating carboneous fillers such as graphite and
carbon nanotubes tubes into conductive polymer coatings can reduce the contact resistance of
these coatings. Yang et al. [162] reported that incorporating graphite into polypropylene coatings
during electro polymerisation enhanced the corrosion resistance and surface conductivity of PPY
coated 316 stainless steel. The modified polypropylene coating exhibited low transient current
densities of 0.003 µA/cm2
and 90 µA/cm2 in the cathodic and anodic simulated PEM fuel
environment of 0.5 M H2SO4 + 2 x 10⁻⁶
fluoride ions at 70oC with air and hydrogen bubbling
respectively. At 2.8 MPa, ICR of the graphite/PPy coating was ~18 mΩ/cm2. It is however noted
that 2.8 MPa is considerably higher than the compaction pressure (1-2 MPa) recommended for
bipolar plates.

77
Lee et al. [163] also showed that the contact resistance of polypropylene coating can be further
reduced by growing carbon nanotubes on 304 stainless before polymerisation rather than
incorporating CNT fillers. The ICR of CNT filler /PPY composite coating was found to be 33.8
mΩ/cm2 while that of the CNT grown /PPY coating was 9.7 mΩ/cm
2 at
200 N/cm
2. Transient
currents of the latter in a simulated PEM fuel cell environment of 1 M H2SO4 + 2 ppm HF at 70 oC
for 2.78 hours were less than 1 µA/cm2.
The contact resistance and corrosion performance of polypyrrole–Vulcan XC-72 carbon composite
coatings deposited on 316 stainless steel substrates by EPD in 0.1 M H2SO4 at room temperature
was investigated by Pech-Rodrı´guez et al. [162]. The authors employed Taugchi design of
experiment technique was employed to study the influence of applied voltage, deposition time,
concentration of the solvent used for polymerisation and pyrrole monomer concentration. Their
results showed that corrosion resistance of 316 stainless was enhanced by the EPD deposited
coatings. In particular, the coatings deposited at 50 V for 2 minutes using acetone only as the
polymerisation media at pyrrole concentration of 0.1 mol/L exhibited lower corrosion current
density of 2.3 µA/cm2, representing a two order of magnitude difference in that of the substrate
(171 µA/cm2). However, its contact resistance at 1 N/m was ~60% higher than that of the substrate
(0.3264 Ω.m) and ~97% higher than 0.2117 Ω.m reported for the substrate at 1.6 N/m. These
results imply that these coatings may not be suitable for the desired application.
(C) Composite coatings
Composites coatings with conductive fillers deposited by different coating techniques have also
attracted attention as potential coatings for metallic bipolar plates.

78
Mawdsley et al. [164] developed composite coatings with an ethylenetetrafluoroethylene (ETFE)
matrix and graphite and/or titanium carbide fillers. The corrosion resistance of the coatings which
were deposited on 300 series Al by a combination of wet spraying and heat-treatment processes
showed a dependency on the amount of fillers. In particular, the coating with equal volume
percentage of TiC and graphite (50%ETFE/25%TiC/25%graphite) retarded the corrosion rate of
the base metal when exposed to a simulated PEM fuel cell environment of 0.001 M H2SO4 + 2
ppm HF at 70 oC. However, whitish corrosion products were evident in the sample evaluated
under anodic conditions (i.e. hydrogen bubbled electrolyte) after the test. The developed coated
samples were further tested in 60 cm2 active single fuel cell at 50
oC. The polarisation results
showed that the cell assembled with bipolar plate coated with 50%ETFE/25%TiC/25%graphite
coatings exhibited relatively lower OCV compared to the cell with 50%ETFE/250%TiC coatings
bipolar plate with rapid decrease in voltage. However, the single fuel cell coated with 92% volume
fraction of graphite (90%Gr/8%ETFE) exhibited the best performance with OCV slightly higher
than 0.9 V.
Fu et al. [165] compared the performance of electroplated silver–PTFE coatings on 316L stainless
steel with silver plated-316 stainless steel. The PTFE modified coating exhibited a contact angle of
114o while the Ag-coated sample exhibited a contact angle of 73
o implying that addition of PTFE
increased the hydrophobicity of the coating which is beneficial for water management in PEM fuel
cell. However, addition of PTFE to the Ag coated sample had negligible influence on the
performance of the coatings in 0.5 M H2SO4 + 5 ppm HF bubbled with air and hydrogen at 70 oC
to simulate PEM fuel cell cathode and anode conditions. Under these conditions, the transient
current densities of both coatings were similar and were in the range of 10 µA/cm2 and 100
µA/cm2
at the cathode and anode respectively. On the other hand, Show and Takahashi [163]

79
demonstrated that 316 stainless steel coated with CNT/PTFE composite film containing 75% from
the dispersion fluids of CNT and PTFE reduced the contact resistance of the substrate (46
mΩ/cm2) by about four-fold. Similarly, the corrosion resistance of the substrate in 1 M H2SO4 was
improved. Hence, single fuel cell performance of the coated plates showed about 58% increase in
the maximum output power of the single fuel cell with the uncoated plates which was given as
1.7 W.
2.3.3 POROUS METALLIC MATERIALS (PMM)
Porous metallic materials (PMM) such as metal foams, metal screens/meshes are lightweight
cellular structured materials which possess excellent mechanical and thermal properties as well as
increased surface area and high gas permeability [167 -172]. Hence, these materials have also been
considered for bipolar plate application.
PMM are advantageous for cost reduction of PEM fuel cells in two ways: first, the inherent porous
nature of PMM eliminates the need for flow field designs as seen in Figure 21. Secondly, PMMs
can also serve as the gas diffusion layer and provide support for the catalyst layer [169-171].
Nevertheless, PMM are susceptible to corrosion in PEM fuel cell environments and need to be
coated for better performance.
Murphy et al. [170] studied the performance of two PEM fuel cell stacks consisting of eight single
cells with gold coated Ni foams and expanded Ti bipolar plates respectively. Their results
indicated that the porous nature of PMMs enhanced the flow and distribution of reactant gases
over the entire reaction area and showed comparable performance to conventional flow designs.
They demonstrated that using PMM produced by low cost mass production technique as bipolar

80
Figure 21 Comparison of bipolar plates made from (a) metal foam [168] (b) bulk stainless
steel [111].
plate would lead to significant reduction in the weight and cost of PEM fuel cells. Hence, they
recommended TiN coated Ti expanded plates for large scale production. Similar conclusions were
made by Tseng et al. [171] who compared the single cell performance of PTFE coated Ni foam
with that of graphite bipolar plate. The polarisation results revealed that in the low current density
region, the cell with the metal foam and graphite had equivalent voltage output but in the high
current density region, the voltage output of the metal foam-cell exceeded that of the graphite
plate-cell. Likewise, Kumar and Reddy [168, 172] reported that bipolar plates fabricated from Ni-
Cr and 316 stainless steel foams out-performed conventional 316 stainless steel bipolar plates with
multi parallel flow field designs in single fuel cell experiments. The better performance of the
PMM was attributed to the decrease in the permeability of the flow field design which had a
positive impact on the pressure drop across the plate resulting in better mass transport between the
plates and the membrane. In addition, they proposed that MEA contaminations can be minimised
by optimising the fluid flow of PMM so that the ions are swept away with the by-product water.

81
2.5 SUMMARY AND INDICATION OF GAP WITHIN THE LITERATURE
Metals are promising for automotive PEM fuel cells bipolar plates due to their potential to
significantly reduce cost, weight and volume. Metallic materials considered for bipolar plates
applications are, however, prone to corrosion in the humid and acidic PEM fuel cells environments
and exhibit high interfacial contact resistance with the gas diffusion layer due to the existence of a
semi-conductive oxide layer. From the foregone review the following conclusions can be deduced:
Different bare metals have been considered as potential alternative materials to replace
graphite bipolar plates. Among the metals considered, stainless steel has emerged as the
material of choice owing to its cost effectiveness, availability of variety of alloys and
amenability to low cost/high volume and rapid manufacturing processes. Nevertheless,
bare stainless steel alloys are not suitable for bipolar plates as these ferrous based alloys
exhibit high ICR values at least an order of magnitude higher than the targeted 10 mΩ.cm2
due to the presence of a thin non-conductive surface oxide layer. In addition, the thickness
of the passive oxide layer has been shown to increase during operation leading to cell
voltage output degradation. Hence, stainless steels require surface coatings and/or
treatment for optimum performance in the PEM fuel cell environments.
Extensive research work has been conducted on surface-modified stainless steels.
Nonetheless, depositing defect-free coatings is challenging therefore the search for
coatings and treatments which satisfy the corrosion resistance and ICR requirements have
continued to attract considerable research attention. Some coatings such as the metal
nitrides have been widely studied while some have been scarcely investigated despite their

82
promising potential. An example of such under-studied coatings is graphite coatings.
Graphite coatings are often deposited by low temperature vacuum deposition processes
and spraying/compression techniques using binding agents. However, the binding agents
used in spraying/compression techniques are often non-conductive in nature, thereby
deteriorating the conductivity of these carbon-based coatings. Therefore, this study,
explored the potential of a room temperature process named CoBlast™ technology to
deposit graphite coatings on metal for PEM fuel cell bipolar plate application.
There is a general need for single fuel cells and durability evaluation of coatings that have
exhibited the targeted ICR and corrosion current densities in simulated PEM fuel cell
environments. Similarly, durability studies of foam materials which are reported to exhibit
good single cell performance comparable to bulk materials or graphite bipolar plates are
also needed to access the suitability of these materials for real life applications.
Although a wide range of coatings have been investigated, optimisation of the coating
parameters and systematic investigation of the influence of process parameters on the
performance of the coatings in PEM fuel cell environments are scarcely reported. In the
few cases where optimisation of process parameters were conducted, classical experiment
methods which depend on varying one factor while keeping the other constant was
employed. However, optimisation by classical experimental methods does not give
possible interactive effects between different coating parameter and is both time
consuming and expensive. Hence, this study also considered the optimisation of corrosion
resistance of chromised coatings in simulated PEM fuel cell environments.

83
CHAPTER THREE
Experimental Methodology
3.1 INTRODUCTION
In this chapter, details of the experimental methodology and related theory where applicable are
presented. The experimental methodology consisted of the coating deposition, surface
characterisation and corrosion resistance evaluation experiments. The methodology for interfacial
contact resistance evaluation and single fuel cell experiments of selected coatings was also
presented.
3.2 MATERIAL AND COATING PROCESSES
This section presents an overview of the surface modification processes employed in this study as
well as the materials, equipment and methodology employed for each process.
3.2. 1 PHASE 1: COBLAST™ DEPOSITED GRAPHITE COATINGS & MODIFICATION
(A) GRAPHITE COATINGS DEPOSITED BY COBLAST TM
TECHNOLOGY
Graphite coatings are effective barriers against corrosion provided the substrate is cathodic relative
to graphite in the galvanic series. In the first phase of this study, the potential of a novel micro
blasting process called CoBlast™ to deposit graphite-based coatings on stainless steel and titanium
for bipolar plate application was explored.
CoBlast™ is a low cost, modified micro blasting process owned by EnBio Materials Limited,
Ireland. The ambient temperature and pressure process utilises a mixture of abrasive blast medium
mixed with a stream of ‘dopant’ particles to modify the substrate surface. The abrasive roughens

84
the metal surface while simultaneously disrupting the oxide layer and exposing the reactive metal
to bond chemically with the dopant [173-179]. The adhesion of the coatings to the substrate is due
to a combination of tribo-chemical bond formation and mechanical interlock between the dopant
and the substrate. Attractive features of the process includes its simplicity and low cost, as no wet
intermediate stages, vacuum or inert environment are involved; rather coatings are deposited from
the powder phase at room temperature. The deposition process is also reported to be energy and
time efficient. The technical versatility of the CoBlast™ process has been demonstrated in the
deposition of bio ceramic coatings such as hydroxyapatite (HA) [174-176] and industrial coatings
such as polytetrafluoroethylene (PTFE) [177] and optical/emissive black coatings for space
applications [178].
150mm x 150mm x 1mm coupons of titanium (V) alloy (Ti6Al4V) and stainless steel alloy
(AISI316) purchased from Lisnabrin Engineering Limited, Cork. Ireland was selected as substrates
for the study. Aluminum was not considered because it is anodic to graphite in the galvanic series;
hence, it corrodes in preference to graphite [179,180]. The nominal composition of the alloys is as
presented in Table 6. Prior to coating, the coupons were ultrasonically cleansed in deionised water
for 10 minutes, air dried and wiped with isopropanol.
Deposition of the coatings was conducted in a single nozzle CoBlast™ process as schematically
represented in Figure 22 (a). A picture of the equipment used for deposition is also displayed in
Figure 22 (b). The coating powder consisted of a mixture of amorphous graphite powder (particle
size: 44 µm, microfyne grade) and alumina powder (particles size: 50 μm) in a 1:1 ratio. The
surface morphologies of the different coating powders are shown in Figure 23 with graphite
powder having a flaky morphology and alumina particles, an irregular morphology. The powders

85
were blended in a laboratory tubular for 5 minutes and thereafter blasted onto the metal surfaces at
a standoff distance of 30 mm, pressure of 620 kPa and speed of 20 mm/s.
Table 6 Nominal composition of metallic substrates used for CoBlast™ process
Metal
Nominal composition
316 stainless steel alloy
0.08%C, 16 -18% Cr, 10-14%Ni, 2-3%Mo, balance Fe
Ti6Al4V alloy 5.5-6.76% Al, 3.5 -4.5% V, Balance Ti

86
Figure 22 (a) Schematic representation of the CoBlast™ process adapted from [176], (b)
picture of the CoBlast™ equipment.

87
Figure 23 SEM images of (a) microfyne graphite (b) alumina powders
After coating, the surfaces were blasted with dry air and ultrasonically washed in water for two
minutes to remove any loosely adhered powder particles. The process parameters employed in the
deposition of graphite based coatings have been optimised for CoBlast™ deposited bio-ceramic
and black coatings [175, 176, 177].
(B) MODIFICATION OF COBLAST™ COATINGS.
CoBlast™ treated 316 stainless steels were modified by pack chromising (an overview of the
process will be given in the next section) in order to enhance its performance in PEM fuel cell
environments. The CoBlast™ treated stainless steel samples were buried in a powder pack of 50%
chromium (particle size: 44 µm), 43% alumina (particle size: 50 µm) and 7% NH4Cl (particle
size100 µm) which has been previously ball milled for 12 hours. Chromium and ammonium
powders were purchased form Sigma Aldrich, Ireland. Figure 24 shows the morphologies of the
powders. The Cr powder had a flaky and irregular morphology while the

88
Figure 24 SEM images of (a) chromium powder (b) ammonium chloride powder.
Figure 25 Carbolite tube furnace used in the study.

89
NH4Cl powder had a spherical morphology. The crucibles were covered with lids and placed in a
Carbolite tube furnace in an argon gas protective environment as shown in Figure 25. The
crucibles were thereafter heated to 900 oC and held for 3 hours at a heating rate of 10
oC per
minute in a tube furnace. The furnace was thereafter cooled to room temperature at the same
heating rate while the gas supply was turned off at about 200 oC. After the heating cycle, the
chromised surfaces were ultrasonically cleansed in acetone for 15 minutes, dried with nitrogen gas
and weighed.
3.2.2 PHASE 2: CHROMIUM DIFFUSION COATINGS & MODIFCATION
In the second phase of this study, chromium diffusion coatings otherwise called chromised
coatings were deposited on AISI 304 stainless steels by pack cementation. Response surface
methodology (RSM), a design of experiment (DoE) technique, was employed to optimise selected
pack chromising process parameters. The objective of this aspect of the study was to investigate
the influence of the selected process parameters on the corrosion current density of chromised
coating in a simulated PEM fuel cell environment of 0.5 M H2SO4 + 2 ppm HF at 70oC as well as
optimisation of the selected process parameters.
The chromised coatings produced at the optimal process parameters were thereafter modified. The
modification process entailed depositing a carbon rich layer via pack cementation prior to
chromising at optimal process parameters. An overview of pack cementation process is first
presented, thereafter, RSM technique is discussed and the details of the materials and equipment
employed for pack cementation is given.

90
(A) Overview of pack cementation process
Pack cementation is an in-situ chemical vapour deposition (CVD) batch process used for
producing corrosion and wear resistant coatings on metallic materials such as steel, aluminium,
nickel etc. The thermochemical process essentially entails four components: the substrate and three
powders consisting of a master alloy (the element to be deposited), halide salt activator (usually
NH4Cl) and inert filler. The nature and characteristics of pack cementation coatings are influenced
by the composition of the substrate, temperature, time and powder pack composition [181-184].
In pack cementation processes, the substrate is either embedded in the powder mixture or placed
on top of the mixture and subsequently heated to high temperatures (800-1200 oC) in a reducing or
inert environment. The major steps in pack cementation are summarised in Figure 26. The
activator decomposes and reacts with the master alloy to form volatile metal halides vapours,
which diffuses through the powder pack to the substrate’s surface to deposit the desired coatings
via solid state diffusion. The mechanism of formation and growth kinetics as well as the phase
and microstructure of the coatings depend on the chemical composition and activity of the metallic
halides produced at the deposition temperature, which in turn depends on the amount of the
activator and master alloy in the powder mixture [181-185].
Pack cementation was first reported in the 20th
century and since then have been widely employed
to deposit different types of coatings. However, in this work, chromium and carbon diffusion
coatings were formed via pack cementation. These processes are otherwise referred to as pack-
chromising and pack-carburisation respectively.

91
Figure 26 Major steps involved in pack cementation [181].
I. Chromising
Chromising is a surface treatment involving the formation of chromium (Cr) rich surfaces on
ferrous based and nickel alloys via diffusion of Cr atoms at high temperatures (≥ 900 oC). The
process is widely used for improving the corrosion, wear and oxidation resistance of ferrous based
and nickel alloys [183, 184, 186]. Fundamentally, chromising of ferrous based alloys containing
less than 0.2 wt. % carbon e.g. stainless steels enhances corrosion and oxidation resistance and is
termed called soft-chromising. On the other hand, chromising of alloys with carbon content higher

92
than 0.2 wt. % enhances wear resistance and is referred to as hard chromising. The resulting
chromised layers differ from each other. In soft chromising, the chromised coatings are typically a
solid solution of chromium in ferrite (α-iron) while hard chromium carbides are formed in hard
chromising processes.
Chromising can be achieved by a number of techniques such as molten salt bath, pack
cementation, gas chromising, fluidised beds CVD, vacuum chromising and physical vapour
deposition (PVD) process [183, 184, 186]. Among these techniques, chromising by pack
cementation otherwise called pack chromising is a simple and inexpensive in-situ CVD process
that requires no specialised equipment. In pack chromising, the substrate is embedded in a pack of
powders containing pure chromium or ferro-chromium powders as the master alloy, ammonium
chloride as the activator and alumina as the inert filler contained in an alumina crucible or heat
resistant material and sealed. The sealed crucibles are heated in an inert environment (e.g. argon
gas protective environment) or under vacuum in a furnace to the chromising temperature (typically
between 900 oC and 1200
oC) [182-184, 186].
The chemical reactions involved in chromising treatment based on the steps shown in Figure 26
are :
1. Thermal decomposition of the activator
𝑁𝐻4𝐶𝑙 (𝑠) → 𝑁𝐻3(𝑔) + 𝐻𝐶𝑙 (𝑔) (6)
2. Reaction between the halide gas and chromium powder to form volatile halides
2𝐻𝐶𝑙(𝑔) + 𝐶𝑟(𝑠) → 𝐶𝑟𝐶𝑙2(𝑔) + 𝐻2(𝑔) (7)
3. Dissociation of ammonia
2𝑁𝐻3 (𝑔) → 3𝑁2(𝑔) + 3𝐻2(𝑔) (8)

93
4. Adsorption of transportation gas at the substrate surface
𝐶𝑟𝐶𝑙2(𝑔) + 𝐻2(𝑔) → 2𝐻𝐶𝑙(𝑔) + 𝐶𝑟 (9)
Chromium atoms deposited on the surface of the metal (Equation 9) diffuses inwards into the
ferrous based metal. Depending on the carbon content, carbon diffuses outwards form the ferrous
metal to react with inwardly diffused chromium to form chromium carbide in iron solution. Also,
nitrogen decomposed from ammonia according to Equation 6 reacts with chromium to form
chromium nitrides. This chemical reaction is, however, peculiar to pack chromising only.
II. Chromising of stainless steels
As earlier discussed in chapter 2, stainless steel are low cost, corrosion resistant iron based alloys.
The structure of stainless steels is determined by its alloying elements which are basically
classified into austenite stabilisers (e.g. Nickel, Nitrogen, Carbon) and ferrite stabilisers
(Chromium, Molybdenum, etc.). Austenite stabilisers have face centred cubic (FCC) structure
while ferrite stabilisers have body centred cubic (BCC) structure as shown in Figure 27. Stainless
steels with high amount of austenite stabilisers are called austenitic stainless steel e.g. 300 series
stainless steel (AISI 316, AISI 304, AISI 310, AISI 317 etc. ) while alloys with high amount of
ferritic stabilisers are called ferritic stainless steels e.g. the 400 series stainless steel (AISI
430,AISI 444, AISI 446 etc.).

94
Figure 27 Structure of alloying elements in stainless steel alloys (a) face centered cubic
structure (FCC) (b) Body centred structure (BCC) (adapted from [187])
Chromium is a ferritic stabiliser; hence, chromising of austenitic stainless steels involves phase
transformation from the FCC structure of austenite to BCC structure of Cr during deposition [183-
186,188]. According to Bangaru and Krutenat [188], FCC to BCC transformation in austenitic
stainless steels is dependent on the austenite stability of the steels. High austenite stability, which
is associated with high nickel content, opposes FCC to BCC transformation resulting in lower
coating thickness while low austenite stability engenders higher coating thickness. This fact was
evidently demonstrated in the work of Ralston et al. [186] on chromised coatings produced by
fluidised Bed CVD wherein AISI316 stainless steel with the highest Ni content among the
stainless steel studied exhibited the lowest thickness. Austenite stability of commercial stainless
steels can be calculated using empirical equations such as Hammar and Svensson’s chromium and
nickel equivalents [188,189]. Using this equation, Lopez et al. [189] classified the austenite
stability of common austenitic stainless steels in terms of increasing austenite stability as 310 >
309 > 316 > 303 > 304 . Hence, AISI 304 stainless steel was adopted in this study in order to

95
achieve thicker coated layers which could possibility enhance resistance to corrosion. Also, the
performances of chromised 304 stainless steels in simulated and real PEM fuel environments have
not reported in the literature before now.
III. Carburisation
Carburisation is the absorption of carbon onto the surface of low carbon steels when heated in a
carbon-rich medium. Traditionally, carburisation is conducted at temperatures within the austenitic
region in the iron-cementite phase diagram as shown in Figure 28. The essence of carburisation is
to harden the surface of the steel against wear and tear. However, the depth of diffused carbon in
the treated material otherwise referred to as ‘the case depth’ is dependent on factors such as
temperature, time, and composition of the carbon medium etc. [191-193].
Figure 28 Iron –Carbon phase diagram [190].

96
Carburisation processes are classified based on the medium of carburising which could be gaseous,
plasma, pack, ion beam and salt bath [191-193]. Pack carburisation involves heating the metallic
substrate in a pack mixture of a carbon rich material e.g. charcoal, ash etc. and an activator usually
a carbonate salt e.g. barium carbonate (BaCO3), sodium carbonate (Na2CO3), calcium carbonate
(CaCO3). At the carburising temperature, typically above 900 oC, the activator decomposes
releasing carbon monoxide needed for the carburisation reaction (Equation 10)
𝑋𝐶𝑂3 → 𝑋𝑂 + 𝐶𝑂2 ( 10)
The liberated carbon dioxide gas reacts with carbon in the carboneous material to form carbon
monoxide which decomposes at the steel surface (Equation 11-13) to form atomic carbon.
𝐶𝑂2 + 𝐶 ↔ 2𝐶𝑂 (11)
2𝐶 + 𝑂2 → 𝐶𝑂2 + [𝐶] (12)
𝐹𝑒 + [𝐶]𝑎𝑡𝑜𝑚𝑖𝑐 → 𝐹𝑒 (𝐶) (13)
The carburising process depends on the CO/CO2 ratio; the higher the ratio the higher the carbon
potential achieved within the pack and the higher the carbon at the surface of the metal to be
carburised. The carburising potential is, however, uncontrollable in pack cementation.
IV. Carburisation of austenitic stainless steels
Austenitic stainless steels are iron based alloys with 10-18% chromium and 8-14 % nickel. This
type of stainless steels is widely used for variety of applications due to their good mechanical
properties and high corrosion resistance derived from the high chromium content [191, 192].
Carburisation of austenitic stainless steels at high temperatures (> 450 oC) facilitate the formation
of chromium carbide precipitates along the grain boundaries and depletes chromium from the steel

97
matrix thereby degrading the corrosion resistance of the steel. As shown in Figure 29, the
formation of carbides at the grain boundaries otherwise called sensitisation is a time-temperature
dependent phenomenon, which engenders inter granular corrosion.
In austenitic stainless steel, the M23C6 type carbides, which contain about two to four times
chromium than the base metals, are formed [191]. These carbides not only form during at high
temperature but also during cooling in high temperatures carburisation. Hence, modern
carburisation of austenitic stainless steel is conducted at temperatures below 500 oC and is termed
Low temperature carburisation. The low temperature process yields a colossal supersaturated
carbon layer [192]. However, pack carburisation at such low temperatures is difficult because the
carbon potentials at such low temperature would be too low for carbon deposition [192,193].
Figure 29 Relationship between M23C6 prciptaion and intergranular corrosion in 304
stainless steel (adapted from [191])

98
(B) Response surface methodology
Response surface methodology (RSM) is a design of experiment (DoE) technique which consists
of a collection of mathematical and statistical tools used for designing experiments, developing
empirical models and optimising process output(s) influenced by many factors [194-198]. In
contrast to classical experimental method, RSM can establish optimal process parameters with
fewer experiments and can also deduce interactive effects between process parameters if any.
RSM consists of five basic model designs: Box–Behnken design, Central Composite design,
Plackett-Burman design, Doehlert matrix and full and fractional factorial design. Among these
model designs, Box–Behnken and Doehlert designs are reported to be more efficient than the
others. However, Box–Behnken design was adopted in this study because it required fewer
experiments and avoids combinations involving extreme conditions of higher or lower levels of
factors which could yield unsatisfactory results [194-196].
Box–Behnken designs are a family of rotatable or nearly rotatable three-level second-order designs
based on incomplete factorial designs. In Box-Behnken design, the values of the factors are
equally spaced and represented as high (+1), centre (0), low (-1). These values can be pictorially
represented on a cube as the edge, middle and edge points with a central point as shown in Figure
30 (a) or as three interlocking 22 factorial designs with a central point (Figure 30 (b)). The number
of experiments required in Box-Behnken designs is given by
𝑁 = 2𝑘 (𝑘 + 1) + 𝐶𝑜 (14)
Where k is the number of factors and Co is the replicate number of the central point [194-196].

99
Figure 30 Pictorial representation of Box-Behnken design [194]
Optimisation of anti-corrosion properties of coatings via Box-Behnken designs are increasingly
being reported in the literature [199-201]. In the present study, experimental design and statistical
modelling as well as optimisation of selected process parameters were conducted with Design
Expert statistical software package version 9.0.2.0 (State-Ease Inc., USA). The design matrix was
based on three-level, three-factor Box-Behnken design. The selected process variables or factors
are presented in Table 7. The variables were coded using Equation 15 and inputted in the design
software yielding a design matrix of a total of 17 experiments with 5 centre point replicates as
shown in Table 8.
𝑥1 =𝑋𝑖 − 𝑋𝑂
∆𝑋𝑖 (15)
where xi is the coded value of the ith process variable; Xi, actual value of the ith process variable;
Xo, actual value of the ith process variable at the central point; ΔX is the step rate change value.

100
Table 7 Process factors and design levels
Factors
Levels
Low
(-1)
Centre
(0)
High
(+1)
Time (hours) 3 6 9
Activator content (wt. %) 3 5 7
Temperature (oC) 1000 1050 1100
The experimental data obtained was thereafter analysed were fitted into in quadratic model defined
by Equation 16.
𝑌 = 𝛽𝑜 + ∑ 𝛽𝑜
3
𝑖=1
𝑥𝑖 + ∑ 𝛽𝑖𝑖
3
𝑖=1
𝑥𝑖2 + ∑ ∑ 𝛽𝑖𝑗
3
𝑖<𝑗
3
𝑖=1
𝑥𝑖𝑥𝑗 + 𝜀 (16)
where Y is the predicted response, βo is the coefficient of intercept, βi is the coefficient of linear
effect, βii is the coefficient of quadratic effect, βij, is the coefficient of interaction effect, i and j are
index numbers for the independent variables and ε is the random error [194-200].

101
Table 8 Design matrix based on three- level, three –factor Box–Behnken design
Run Actual values Coded values
Time
(Hours)
Activator
content
(wt%)
Temperature
(oC)
Time
(Hours)
Activator
content
(Wt%)
Temperature
(oC)
1 6 3 1100 0 -1 +1
2 6 5 1050 0 0 0
3 6 7 1000 0 +1 -1
4 9 5 1000 +1 0 -1
5 3 5 1000 -1 0 -1
6 6 3 1000 0 -1 -1
7 9 5 1100 +1 0 +1
9 6 7 1100 0 +1 +1
10 6 5 1050 0 0 0
11 6 5 1050 0 0 0
12 3 3 1050 -1 -1 0
13 3 7 1050 -1 +1 0
14 6 5 1050 0 0 0
15 6 5 1050 0 0 0
16 9 7 1050 +1 +1 0
17 9 3 1050 +1 -1 0

102
(C) Materials and Equipment for chromised coating and modification
I. Chromised coatings
25mm x 25mm x 2 mm coupons cut from commercially available AISI 304 stainless steel sheets
purchased from Impact Metals Ireland, Dublin, Ireland with nominal composition of 0.08 C, 18-
20Cr, 8-10.5Ni, Mn < 2, Si < 1, balance Fe (wt %) were cut into 25 mm x 25 mm coupons. The
coupons were ground with silicon carbide abrasive papers and ultrasonically cleansed in acetone
after which the samples were dried in air .The coupons were thereafter embedded in a previously
ball-milled powder pack of 50 wt. % Cr powder, x wt. % of NH4Cl and (50 - x) wt. % of alumina
where the value of x is as shown in Table 7. The crucibles were sealed with fire clay as shown in
Figure 31, cured in a laboratory oven at 60-100 oC for about an average of about 30 minutes in
order to solidify the clay. The sealed crucibles were thereafter loaded into a tube furnace (Lenton
LTF 1200o
C, USA) with an argon gas protective environment (Figure 32). The chromising
temperature ranged from coating prepared at 1000- 100 oC for different duration and powder
composition as shown in the design matrix (Table 8). After the heat treatment cycle, the chromised
samples were cleansed in acetone and dried in open air. The selected parameter was chosen based
on preliminary experiments and the literature on chromising of stainless steel [37-39,184]. Further
details on selection of process parameters and values can be found in Appendix I.

103
Figure 31 Picture of crucible containing pack powder mixture of chromium, ammonium
chloride and alumina and sealed with fire clay
Figure 32 Picture of the pack chromising procedure (a) Lenton tube furnace (b) sealed
crucible in tube furnace (c) tube furnace sealed and argon gas is passed through the tube (d)
end of the tube connected to the fume hood.

104
II. Pre-carburised and chromised coatings.
The coupons for pack carburisation were 20 mm x 20 mm x 2 mm in dimension. The surface of
the coupons was activated in 4 M hydrochloric acid at 60 oC for 10 minutes and thereafter
embedded in a carburising mixture of charcoal and sodium carbonate and sealed with fire clay to
prevent air infiltration. The carburising mixture was prepared by dissolving Na2CO3 in hot water
and gradually adding crushed charcoal powder in 1:2 proportions. The mixture was stirred and
exposed to sunlight for 2-3 days to remove any moisture. On drying, the mixture was crushed into
powder. Figure 33 shows the picture of the charcoal, sodium carbonate and the resulting mixtures.
Figure 33 Materials for pack carburising.
The sealed alumina crucibles were heated for 1-3 hours in a muffle furnace (Carbolite, England)
preheated to the carburising temperature (925 oC). At the end of each test, the crucibles were taken
out of the furnace, forced open by breaking the clay and the samples were quenched in water. All
samples were cleansed in acetone, weighed and afterwards chromised at the optimised chromised
coating process parameters (i.e. 1040 oC for ~3 hours in powder composition of 50 wt. %
chromium powder, 6.84 wt.% ammonium chloride and 42.8 wt. % alumina). After the heat

105
treatment cycle, the pre-carburised-chromised samples were cleansed in acetone, dried in open air
and weighed.
3.3 SURFACE CHARACTERISATION
(A) Scanning electron Microscope
The scanning electron microscope (SEM) is a versatile surface characterisation tool widely
employed for surface morphology analysis of crystalline or amorphous samples. When equipped
with Energy dispersive X-ray (EDX) spectrometer information on elemental composition,
mapping etc. can also be obtained. The working principle in SEM involves the generation of a
beam of electrons in the electron gun and accelerating the beam towards a sample via a series of
condensers lens or magnetic lens as shown in Figure 34 (a) at a voltage difference (typically
between 1-30 V). When the electron beam strikes the sample a couple of signals (electrons, x-rays
and photons) are emitted from the sample depending on the depth of penetration of the beam
(Figure 34 (b)) and with appropriate detectors the signals can provide the needed information.
The signals relevant to this study were:
The secondary electrons which are emitted from the surface and provide information on
the surface topography
The backscattered electrons which are reflected from the atoms in the sample and give
information on the surface topography based on the atomic number of the elements present
on the sample. A typical backscattered electron image will provide information on the
distribution of chemical phases in the sample - elements with low atomic numbers would
give a darker contrast compared to elements with higher atomic numbers.

106
The characteristic X-rays are used in the Energy-Dispersive X-ray Spectrometer (EDX) to
provide qualitative and quantitative information on chemical composition and distribution
of elements in a sample.
Figure 34 Schematic representations of (a) the operating principles of the SEM [202] (b)
Signals produced within the SEM at different depth of penetration [203].
The SEM used in this study was a ZEISS EVOLS 15 SEM equipped with INCA Energy dispersive
X-ray (EDX) spectrometer (Oxford instruments). Surface morphologies, cross sectional images,
EDX composition, line scans and mapping were obtained at an accelerating voltage of 15 kV. All
samples for cross-section imaging except the CoBlast™ treated samples were embedded in
Bakelite and metallographically prepared to 0.05 µm finish.

107
(B) X-ray diffraction
X-ray diffraction (XRD) is a non-destructive surface characterisation tool that works on the
principle of constructive interference between a monochromatic x-ray beam and a crystalline
material. In this work, XRD was primarily used for phase identification of the coatings produced
at the different stages. The X-ray diffractomer used in this study was a D8 Advance Buker XRD
with a Cu Kα radiation (λ = 1.5405 nm). When in operation, collimated X-ray beam produced in
the cathode tube at 40 KV and 40 mA is accelerated towards the metal sample. The X-ray beam
hits the metal sample at an incidence angle of Ө as shown in Figure 35.
Figure 35 Schematic representation of XRD [204]
When Bragg’s law given as:
𝑛(𝜆) = 2𝑑 𝑠𝑖𝑛Ө (17)
Where n is the order of diffraction, λ is the wavelength of the x-ray beam, d is the spacing between
atomic planes of the crystalline phase, and Ө is the angle of incidence of the x-ray.

108
is satisfied, interactions between the incident X-ray beam and the sample produce diffracted X-
rays by constructive interference.
The diffracted X-ray is recorded by the detector in form of peaks with different intensities as a
function of the diffraction angle 2Ө to give a diffraction pattern otherwise called XRD
diffractogram, which can thereafter be analysed using standard Joint Committee on Powder
Diffraction Standards (JCPDS) database via the Eva software.
In this work, conventional XRD and glancing incidence angle XRD (GXRD) techniques were
employed for phase analysis. Conventional XRD as described above is not surface sensitive as it
gives bulk phase analysis to a depth of about 10µm. However, by rotating the detector at angle of
incidence ranging from 0.1o to 3
o, the depth of penetration of the X-rays can be reduced and
surface information about the coatings without significant interference from the substrate can be
obtained. This technique is called glancing incidence angle XRD. All scans were conducted in the
continuous scanning mode at a speed of 1o/second and scan step of 0.02 from 20
o ≥ 2Ө ≤ 80
o.
(C) X-Ray Photoelectron Spectroscopy
X-Ray Photoelectron Spectroscopy (XPS) also known as Electron Spectroscopy for Chemical
Analysis (ESCA) is a surface-sensitive analytical tool used for obtaining elemental and chemical
information about the outermost layers of specimen to depth of 0 to 10 nm. In typical XPS
experiments as shown in Figure 36, the sample is irradiated with a high energy radiation (typically
monochromatic aluminium Kα or magnesium, Kα X-ray) under ultra-high vacuum causing
photoelectrons emission from the outermost layer of the specimen. The kinetic energy of the
ejected photoelectrons is a function of its binding energy as shown in Equation 18.

109
Figure 36 Operating principles in XPS [205]
𝐸𝐾 = ℎ𝑣 − 𝐸𝐵 − 𝑊 (18)
Where 𝐸𝑘 is the kinetic energy of the emitted electron, hv is the incident x-ray photon energy, 𝐸𝐵
is the binding energy of the electron from a particular energy level, and W is the work function of
the spectrometer. The binding energy of the photoelectron, however, depends on the oxidation
state and environment of the element which it was ejected from and is a characteristic feature of
that element. The intensity of the photoelectron is proportional to its concentration and can be used
to determine the concentration of the element associated with that photoelectron in the specimen.
In this study, XPS analyses were accomplished commercially at the Nano Imaging and Material
Analysis Centre (NIMAC), University College Dublin (UCD), Ireland and Materials and Surface
Science Institute (MSSI), University of Limerick (UL), Limerick. XPS analysis of the CoBlast™

110
metals were conducted at the NIMAC, UCD with a Thermo ESCALAB 250X while that of the
modified CoBlast™ 316 stainless steel was done at MSSI, UL with a Kratos Axis 165 Ultra XPS
model. All XPS analysis in phase 2 was done at NIMAC, UCD. All XPS had monochromatic
Aluminium X-ray source (Al Kα 1486.6 eV). XPS Spectra were obtained at constant pass energy
of 20 eV and 0.05 stepwise unless otherwise stated. Surface composition and survey spectrum as
well as narrow region scans of the elements on the coating surface were obtained before and after
argon ion sputtering. All spectra were referenced to adventitious C1s set at 284.5 eV unless
otherwise stated.
(D) Surface Roughness
Surface roughness of samples in the first stage was conducted with a TR200 portable surface
roughness tester. The portable device measures roughness of a flat sample via a sensor with an
built-in probe as shown in Figure 37, which uniformly slides across the sample during
measurements and roughness values are obtained after digital processing by an in built chip
system.
Figure 37 (a) TR200 surface roughness tester (b) close-up view

111
(E) Contact angle measurement
Water contact angle measurements were conducted with a First Ten Angstroms (FTA˚ 200)
dynamic contact angle goniometer. Contact angles were obtained based on sessile drop principle
wherein a defined droplet of water is deposited on a surface via a computer controlled syringe as
shown in Figure 38. Only CoBlast™ coated metals were tested.
Figure 38 Schematics of water contact angle set up adapted from [206]
3.4 EVALUATION OF CORROSION PERFROMANCE OF COATED METALS IN
SIMULATED PEM FUEL CELL ENVIRONMENT.
Corrosion can generally be described as the degradation of materials due to its electrochemical
reaction with the environment. The electrochemical nature of corrosion implies that the process
involves the transfer of electrons. However, for corrosion to occur, four basic components are
required: an anode, a cathode, an electrolyte and an electrically conductive path. These
components form an electrochemical cell as shown in Figure 39 [207-210].

112
Figure 39 Corrosion cell in action (adapted from [207])
As shown in Figure 39, the metal is oxidized by losing its electrons (Equation 19) while the
electrolyte is reduced by accepting the electrons from the metal (Equation 20), the transfer of
electrons between the metal and the electrolyte provides a conductive path for the reaction to
continue. It can also be seen in Figure 39 that the metal surface acts as both the anode and the
cathode at the same time, hence, the metal surface is referred to as a mixed electrode.
𝑀 ↔ 𝑀𝑛+ + 𝑛𝑒− (𝑂𝑥𝑖𝑑𝑎𝑡𝑖𝑜𝑛 𝑟𝑒𝑎𝑐𝑡𝑖𝑜𝑛) (19)
𝑛𝐻+ + 𝑛𝑒− ↔ 𝑛
2 𝐻2 ( 𝑅𝑒𝑑𝑢𝑐𝑡𝑖𝑜𝑛 𝑟𝑒𝑎𝑐𝑡𝑖𝑜𝑛) (20)
The electrochemical nature of corrosion facilitates the application of electrochemical techniques to
the study of corrosion rates otherwise called corrosion kinetics, which is fundamentally governed
by the Butler–Volmer equation. For an electrode process involving a slow reaction step at the
electrode surface (activation polarisation), the relationship between the current density and the
electrode potential is given by Butler–Volmer equation (Equation 21) [208- 212].

113
𝑖 = 𝑖0 [Exp ( 𝛼𝑛𝐹
𝑅𝑇(E − 𝐸0) − 𝐸𝑥𝑝 (
−(1−𝛼)𝑛 𝐹
𝑅𝑇 (𝐸 − 𝐸𝑐𝑜𝑟𝑟)] (21)
Where 𝑖0 is the exchange current density at the equilibrium potential 𝐸0, 𝛼 is the transfer
coefficient (usually 0.5) and n is the number of electrons transfered.
(A) MIXED POTENTIAL THEORY AND ITS APPLICATION TO CORROSION RATE
MEASUREMENT
The mixed potential theory was postulated by Wagner and Traud in 1938 and it states that:
(1) Any electrochemical reaction can be divided into two or more partial oxidation and reduction
reactions.
(2) The sum of anodic current in an electrochemical reaction must be equal to the sum of cathodic
current; hence, there is no accumulation of electric charges.
Based on this theory, the corrosion process represented in Figure 39 the total rate of oxidation is
equal to the total rate of reduction. Also, the oxidation and reduction processes can be described by
half-cell reactions equations given in Equation 19 and 20 respectively and represented as shown in
Figure 40 (a).
For there to be no accumulation of charges, the independent half-cell potentials has to polarise to a
single potential called the mixed electrode potential or corrosion potential, 𝐸𝑐𝑜𝑟𝑟 as shown in
Figure 40 (b).

114
Figure 40 (a) Anodic and cathodic half-cell reactions (b) Evans diagram for a mixed
electrode state of a metal, M corroding in an acidic electrolyte [adapted from [207]].

115
At the corrosion potential, the measurable current (𝑖𝑚𝑒𝑎𝑠𝑢𝑟𝑒) ) is zero since no current was applied
externally. This condition combined with the second premise of the mixed potential theory gives:
𝑖 𝑚𝑒𝑎𝑠𝑢𝑟𝑒𝑑 = 𝑖𝑜𝑥𝑖𝑑𝑎𝑡𝑖𝑜𝑛 − 𝑖 𝑟𝑒𝑑𝑢𝑐𝑡𝑖𝑜𝑛 = 0 (22)
However,
𝑖𝑜𝑥𝑖𝑑𝑎𝑡𝑖𝑜𝑛 = 𝑖𝑟𝑒𝑑𝑢𝑐𝑡𝑖𝑜𝑛 = 𝑖𝑐𝑜𝑟𝑟 (23)
Also, when the second premise of the mixed potential theory is fulfilled, the Butler–Volmer
equation given in Equation 21 becomes:
𝑖 = 𝑖𝑐𝑜𝑟𝑟 [Exp ( 𝛼𝑛𝐹
𝑅𝑇(E − 𝐸𝑐𝑜𝑟𝑟) − 𝐸𝑥𝑝 (
−𝛽𝑛 𝐹
𝑅𝑇(𝐸 − 𝐸𝑐𝑜𝑟𝑟)] (24)
Where 𝛽 = (1 − 𝛼)
When the rate of the back reaction in Equation 19 and 20 is negligible, Equation 23 becomes the
Tafel Equation:
𝐸 = 𝑎 + 𝑏𝑙𝑜𝑔 𝑖 (25)
Where a and b are constants
For anodic polarisation
𝑎 = (2.3 RT)
αFlog icorr (26)
𝑏 = −(2.3 𝑅𝑇)
𝛼𝐹 (27)

116
For cathodic polarisation
𝑎 = (2.3 RT)
βFlog icorr (28)
𝑏 = −(2.3 𝑅𝑇)
𝛽𝐹 (29)
When 𝐸 − 𝐸𝑐𝑜𝑟𝑟 = 0 in Equation 24
𝑇ℎ𝑒𝑛 𝑖 = 𝑖𝑐𝑜𝑟𝑟 = 𝑐𝑜𝑟𝑟𝑠𝑖𝑜𝑛 𝑐𝑢𝑟𝑟𝑒𝑛𝑡 𝑑𝑒𝑛𝑠𝑖𝑡𝑦 . This theoretical frame work is the basis for
determination of corrosion current density by Tafel exploration method, illustrated in Figure 41.
Figure 41 Tafel line extrapolation method (adapted from [209])

117
Corrosion current density can be determined experimentally by polarizing the electrode about
±300 mV away from the corrosion potential as shown in Figure 41, otherwise called Tafel plot.
The value of corrosion current density can be obtained by extrapolating the linear portion of the
curve as shown in Figure. The linear portion of the curve otherwise called the Tafel region is often
within 100 mV away from the corrosion potential, 𝐸𝑐𝑜𝑟𝑟, after which Tafel region can be extended
due to concentration polarisation and IR drops. Hence, determination of corrosion current by
extrapolation may be difficult [210- 212]. Another limitation of the Tafel plot is that the metal
surface can be destroyed during polarisation due to high voltage employment for polarisation.
Stearn and Geary developed a new approach to corrosion rate measurement which overcomes the
limitation of the Tafel plot method. The technique, which is called polarisation resistance, is based
on the principle that within ± 10 mV from the corrosion potential, the applied current is a linear
function of the electrode potential. Hence, the plot of over-potential against current density is
approximately linear and the slope of the plot gives the polarisation resistance [210-212].
Polarisation resistance is related to corrosion current density by the Stern and Geary-equation,
which is given as:
𝑅𝑝 = 𝑏𝑎 𝑏𝑐
2.3 𝑖𝑐𝑜𝑟𝑟 (𝑏𝑎+𝑏𝑐 ) (30)
Where 𝑏𝑎 and 𝑏𝑐 are anodic and cathodic Tafel slopes, and 𝑅𝑝 is the polarisation resistance.

118
3.4.1 MATERIALS AND METHODS USED IN THE STUDY FOR CORROSION
ASSESSMENT
(A) Electrolyte used in the study.
The selected simulated PEM fuel cell environment in this study was 0.5 M H2SO4 + 2 ppm HF
solution. H2SO4 acid was chosen based on the fact that the membranes are pre-treated in H2SO4
acid. Hydrofluoric acid was selected as a source of fluoride ion as it is reported that water by-
product of PEM fuels cell contains trace amount of fluoride ions, leached from the membrane
[65,213]. Fluoride salts such as NaF, KF were not chosen as a source of fluoride ion to avoid
possible contamination and solubility problems as well as simulate the Nafion membranes, which
will be used for the single fuel cell tests. It is however, noted that 0.5 M H2SO4 + 2 ppm HF is
quite aggressive as it had been recently shown that the actual PEM fuel cell environment is slightly
acidic with pH range of 3-4 [214].
The electrolyte was prepared in a fume hood by adding 56 ml of 95 wt.% concentrated sulphuric
acid (H2SO4) to 2 litres of deionised (DI) water after 8 µl of 98 wt. % concentrated Hydrofluoric
acid (HF) was added to the sulfuric acid. All acids were purchased from Sigma Aldrich, Ireland.
Precautionary measures taken during acid preparation can be found in Appendix II.
(B) Potentiodynamic and Potentiostatic Polarisation
Corrosion behaviour and long term performance of coated metals for bipolar plate application are
well reported to be evaluated by potentiodynamic and potentiostatic polarisation techniques
respectively [21-23, 37-40]. Hence these techniques were adopted in this study.

119
All polarisation experiments were conducted in a flat corrosion cell (model K0235, Princeton
Applied Research, USA) using a conventional three electrode system comprising of the coated or
uncoated samples as the working electrode, Ag/AgCl (saturated KCl) as the reference electrode,
platinum mesh as the counter electrode. As shown in Figure 42, the working electrode was pressed
against a Teflon ‘O’ ring exposing 1cm2
of the working electrode to the electrolyte, 0.5 M H2SO4 +
2 ppm HF. The counter electrode was located 80 mm away from the working electrode. On the
other hand, the reference electrode was positioned in the Luggin capillary with its tip very close to
working electrode to minimise solution resistance between the reference electrode and the working
electrode. Solution resistance could lead to ohmic drop leading to error in the potential difference
measured between the two electrodes.
Figure 42 Flat corrosion cell and the electrodes used in the study.
(I) Phase 1: CoBlast™ samples
Polarisation experiments in the first phase were conducted at the FOCAS Institute, Dublin Institute
of Technology (DIT), Ireland using a Solartron SI 1287/1255B system comprising of a frequency

120
analyser and potentiostat. The samples were stabilised at open circuit potential (OCP) for 15
minutes, after which potentiodynamic polarisation was conducted at a scanning rate of 1 mV/s
from a potential range of -1 V vs. OCP vs +1 V (Ag/AgCl) at room temperature. Potentiostatic
polarisation was conducted at -0.1 V (Ag/AgCl) and 0.6 V (Ag/AgCl) to simulate the anode and
cathode operating conditions respectively for four hours. For both polarisation experiments, the
electrolyte was bubbled thoroughly either with hydrogen gas or with air prior to and during the
experiments. For potentiostatic polarisation, the corrosion cell was immersed in a water bath to
raise the temperature of the electrolyte to 70 oC (Figure 42) in order to simulate the working
temperatures of PEM fuel cells. The experimental set up was thereafter enclosed in a faraday cage
to minimise noise.
Polarisation of the modified CoBlast samples was conducted with a CHI 630C potentiostat (CH
Instruments, USA) in Dublin City University (DCU), Ireland. Potentiodynamic and potentiostatic
polarisation were conducted at 70 oC using similar procedure as described for CoBlast™ samples.
However, only the cathode PEM fuel cell environment was investigated. Potentiodynamic
polarisation was conducted at -0.3 V vs. OCP vs 1.2 V (Ag/AgCl).
(II ) Phase 2: Chromised coatings
Chromised 304 stainless steels samples were exposed to the electrolyte for 3 hours at 70 oC prior
to polarisation measurements. OCP was measured for 15-30 minutes and Tafel polarisation was
conducted at ±0.3 V (Ag/AgCl) vs. OCP at 1 mV/s using CHI 630C potentiostat (CH Instruments,
USA). Corrosion potential (Ecorr) and corrosion current density (𝑖𝑐𝑜𝑟𝑟) were evaluated by the
Tafel analysis software in the CHI software. Tafel polarisation of the optimised sample was carried
out using the same experimental procedure.

121
Potentiodynamic and potentiostatic polarisation of the optimised coating was conducted with
Gamry Interface 1000™ potentiostat/galvanostat. Potentiodynamic polarisation was conducted at
1mV/s from -0.1 V (vs. Ag/AgCl) to 1.2 V (vs. Ag/AgCl) from Open circuit potential (OCP).
Potentiostatic polarisation was conducted at -0.1 V (vs. Ag/AgCl) with hydrogen gas bubbling
and 0.6 V with air bubbling for 180 minutes to simulate PEM fuel cell anodic and cathodic
working potentials respectively. The scanning rate for the potentiostatic experiments was 1 mV/s.

122
Figure 43 Schematic representation of experimental set up for electrochemical polarisation
experiments. (AE: Auxiliary electrode, WE – Working electrode, RE – Reference electrode)

123
(III.) Pre-carburised and chromised stainless steel samples
Potentiodynamic polarisation of pre-carburised stainless steel samples was conducted after 10
minutes OCP measurement at 1 mV/s from -0.1 V (vs. Ag/AgCl) vs. OCP to 1.2 V ( vs. Ag/AgCl)
vs. OCP at 70oC using a Gamry Interface 1000™ potentiostat/galvanostat. All polarisation
experiments were repeated at least twice, in some cases (potentiostatic polarisation) they were
repeated up to five times to ensure reproducibility of the results. Experiments were set up as
shown in Figure 43 while Figure 44 and Figure 45 shows pictures taken at different stages of the
experiment in DIT and DCU respectively. Precautionary measure taken during all experiments
involving HF acid can be found in Appendix II.
Figure 44 Experimental set up at FOCAS Institute, Dublin Institute of Technology, Ireland.

124
Figure 45 Experimental set up at Dublin City University, Ireland (1) extraction hood (2)
polyethylene frame with danger signs (3) H2 gas cylinder (4) N2 gas (5)air pump(6)Reference
electrode (7) working electrode (8) counter electrode (9) H2 leak sensor (10) Gamry
potentiostat.
(IV) Inductively Coupled Plasma Mass Spectrometry
The concentration of metallic ions leached in the electrolyte after 4 hours of potentiostatic
polarisation for CoBlast™ samples was analysed commercially using an Agilent 7700C
Inductively Coupled Plasma Mass Spectrometry (ICP-MS) at the Centre for Microscopy Analysis
(CMA), Trinity College, Dublin. The test was conducted for CoBlast™ samples only.

125
3.5 INTERFACIAL CONTACT RESISTANCE MEASUREMENT
Interfacial conductivity of all samples was evaluated by a well-documented method developed by
Davies et al. [60] and modified by Wang et al. [58]. The experimental set up for the measurement
is schematically represented in Figure 46. The set up consisted of two of pieces of Toray Teflon
treated carbon paper (Fuel cell store, USA, or Fuel cell Earth, USA) sandwiched between the
bipolar plate material and two copper electrodes. A direct current of 0.5 A (CoBlast™ samples) or
1.0 A (chromised samples and pre-carburised and chromised samples) was supplied to the copper
electrodes via a XHR 300-3.5 DC power source. The voltage drop across the setup shown in
Figure 46 was measured with a Tektronix DMM912 digital multimeter while the compression
forces was gradually applied by a ZwickRoell Universal tensile testing (UTS) machine controlled
by a computer. The experimental set up used for ICR measurements is shown in Figure 47.
The total resistance (R1) across the set up in Figure 46 (a) was calculated using ohm’s law
multiplied by the surface area of the samples (Equation 31)
𝑅 = 𝑉𝐴𝑠
𝐼 (31)
Where R is the electrical contact resistance in ohms (Ω), V is the voltage drop in volts (V), I is the
current applied in Amperes (A), As is the surface area in cm2. The surface area of the samples for
ICR measurements in this study was dependent on capacity of the load cell of the UTS machine
employed. As-received CoBlast had a surface area of 2.25 cm2
and the load cell of the

126
Figure 46 Schematic of the test assembly for interfacial contact resistance.
UTS machine was 500 N. However, the load cell of the UTS machine was later replaced with a
5 kN load cell and the sample size of the chromised and pre-carburised then chromised samples
were changed to 4 cm2
to accommodate 25 N/cm2 step change in the compaction pressure as
against the 16 N/cm2 change with the CoBlast™ metal samples.

127
Figure 47 Picture of experimental set up for ICR (1) ZwickRoell UTM (2) power source (3)
computer (4) copper electrodes (5) multi-meter.
Based on Equation 31, the total resistance (R1) across the setup is given as:
𝑅1 = 2𝑅𝐶𝑢 + 2𝑅𝐶𝑢/𝐶 + 2𝑅𝐶/𝑚 + 𝑅𝑚 + 2𝑅𝑐 (32)
Where RC/Cu is the contact resistance between carbon paper/copper plate interfaces, RC/M is the
contact resistance between carbon paper and the metal sample, RM, RC and RCu represent the bulk
resistance of the metal sample, carbon paper and copper electrodes respectively. In order to find

128
2RC/M, The total resistance(R2) across another set up shown in Figure 46 (b) and made up of a
piece of carbon paper sandwiched between two copper plates was used. R2 is given by:
𝑅2 = 2𝑅𝐶/𝐶𝑢 + 𝑅𝑐 + 2𝑅𝐶𝑢 (33)
Therefore,
2𝑅𝐶/𝑚 = 𝑅1 − 𝑅2 − 𝑅𝑚 − 𝑅𝑐 (34)
Assuming the bulk resistance of the metal (Rm) and carbon paper (RC) are negligible then
2𝑅𝐶/𝑚 = 𝑅1 − 𝑅2 (35)
Therefore, ICR between the sample and carbon paper is given by Equation 36
𝑅𝐶/𝑚 =1
2(𝑅1 − 𝑅2) (36)
3.6 SINGLE FUEL CELL PERFORMANCE EVALUATION
Three pairs of bipolar plates 35mm x 35mm x 2mm with serpentine flow field designs as shown in
Figure 48 were fabricated in-house at the School of Mechanical & Manufacturing Engineering
workshop, Dublin City University (DCU).The plates were prepared as shown in Table 9 and

129
assembled into three single cells with a commercially available MEA (Fuel cell store, USA) with
an active area of 5 cm2
(Figure 48).
The single fuel cells were secured using six bolts at a
compaction pressure of 125 N/cm2
using the procedure described for ex-situ ICR measurement in
section 3.4.
Figure 48 304 stainless steel bipolar plate with serpentine flow field design.
Table 9 Preparation methods for Materials used for the bipolar plates
Sample
Designation
Treatments
Bare 304 stainless steel
SS304
Slightly polished with SiC paper (grade 600)
Chromised 304 stainless steel
Cr-304
Chromised at 1040 0C for 3 hours
(slightly polished to remove residue alumina particles)
Pre-carburised and chromised
stainless steel
CPC-304-3
Pre-carburised for 3 hours and chromised at 1040 0C
for 3 hours
(slightly polished to remove residue alumina particles)

130
Figure 49 The three single cells investigated in this study.
Each single fuel cell was connected to hydrogen and compressed air gas lines and purged with
nitrogen gas before cell operation. Humidified hydrogen gas and compressed air were thereafter
supplied to the cell at gas flow rates of 50ml/min. Single cell experiments were performed at room
temperature and the cell temperature was monitored. Cell voltage as a function of current density
was evaluated and power density of the cells were calculated using Equation 37.
Power density = Cell current density x Cell voltage (37)
The single fuels cells were thereafter tested for durability for ten hours using chronoamperometry
via a Gamry Interface 1000™ potentiostat/galvanostat. After the durability test, the cells were
dismantled and the GDLs were characterised with SEM/EDX. Figure 50 gives a picture of the
single cell testing station at the School of Mechanical & Manufacturing Engineering, Dublin City
University, Ireland.

131
Figure 50 Experimental set up for single cell fuel testing. Hydrogen gas cylinder (1), Nitrogen
gas cylinder (2), single fuel cell (3), potentiostat (4), humidifier (5).
3.7 SUMMARY
In this chapter, a description of the material, methods and equipment utilised in the study has been
presented. Four types of coatings were produced as shown in Figure 51. These coatings were
surface characterised and tested in simulated PEM fuel cell environment of 0. 5 M H2SO4 + 2 ppm
HF. Interfacial contact resistance of the coatings was also evaluated. The flow chart presented in
Figure 51 gives a summary of the experimental methodology.

132
Figure 51 Summary of the experimental methodology employed in the study.

133
CHAPTER 4
Graphite Coatings deposited by
CoBlast™ Technology
4.1 INTRODUCTION
In this chapter, the characterisation and performance evaluation for the suitability of CoBlast™
coated metals for PEM fuel cells bipolar plates are presented and discussed
4.2 SURFACE CHARACTERISATION
(A) Surface morphology and cross section.
Figure 52 presents the surface morphologies of CoBlast™ graphite/alumina coated 316 stainless
steel and titanium grade (V) alloys, hereafter designated as Gr-SS and Gr-TiV respectively.
Figure 52 Surface morphologies of Gr-SS and Gr-TiV.

134
Rough morphologies characterised by craters, cracks and other surface defects can be observed for
both Gr-SS and Gr-Ti due to the blasting nature of the deposition process. In the CoBlast™
process, similar to conventional micro blasting or grit blasting process, the kinetic energy of the
abrasive powder particles during blasting at high pressures (620 kPa) induces localised substrate
surface oxide layer deformation resulting in the formation of craters, dimples and other surface
defects. However, in contrast to conventional blasting processes, the underlying reactive metals
bonds with the coating material (the dopant) in the powder mixture to form a thin coated layer as
shown in Figure 53.
Figure 53 Cross section of CoBlast graphite coated stainless steel. Similar thin and
discontinuous coated layer was obtained for graphite coated titanium grade (V) alloy.

135
Figure 54 and 55 presents the backscattered SEM image of the surface of Gr-SS and Gr-TiV
respectively. Combining these morphologies with the inset of Figure 53, it can be deduced that the
graphite/alumina coatings were discontinuous. EDX analysis of the morphologies shown in Figure
54 and 55 indicated that the surfaces consisted of isolated pockets of carbon rich phase (interpreted
as graphite based on EDX analysis which showed over 90% carbon) and Al-O rich phases
(interpreted as a mixture of alumina) heterogeneously dispersed in an iron-chromium (Fe-Cr) rich
matrix for 316 stainless steel and titanium- oxygen (Ti-O) rich matrix for titanium grade (V) alloy.
The discontinuous nature of the graphite coatings could be related to the low density of graphite
relative to that of alumina. The likely relationship between the densities of the powders and the
nature of the coatings could be justified by comparing the cross-sections of CoBlast™ graphite
coatings (Figure 53) and CoBlast™ deposited hydroxyapatite (HA) coatings (Figure 56) [175] on
Ti grade (V) alloy.
Figure 54 SEM/ BSD of graphite coated AISI 316 stainless steel.

136
Figure 55 SEM/BSD view of the surface morphology of graphite coated titanium grade (V)
alloy.
In contrast to the thin and discontinuous layer formed in Gr-TiV, a dense and continuous coated
layer of HA with an average thickness of 8 µm was formed on the same metallic alloy as seen in
Figure 56. Hence, it can be concluded form these results that the capability of the CoBlast™
process to deposit coatings from powder phase may be limited to certain powders.
Figure 56 Cross section of CoBlast HA coating on Ti (V) alloy [175].

137
(B) Surface roughness and contact angle
Table 10 compares the surface roughness and contact angles of the CoBlast™ coated metals and
uncoated substrates. It can be seen in Table 10 that CoBlast™ coated metals exhibit significant
increase in surface roughness (Ra) and contact angles. The increase in Ra is attributed to the plastic
deformation induced by blasting of particles under high pressure. Increasing the surface roughness
is also well known to reduce the wettability of a surface, hence the increase in contact angle of the
treated samples [215-217]. A similar increase in contact angle was reported for CoBlast™
deposited Teflon coatings on titanium (V) alloy [177] while a decrease in contact angle was
reported for HA coated titanium (V) alloy [175,176]. This trend suggests that the nature of the
dopant material may have significant effect on the wettability of CoBlast™ modified surfaces.
Also, this observation is consistent with the fact that chemical composition of a surface can
influence its wettability [215].
Table 10 Surface roughness and contact angle of coated and uncoated surfaces.
Material
Gr-SS
Bare Stainless
steel
Gr-TiV
Bare TiV
Surface roughness,
Ra (µm)
1.34
0.20
1.59
0.34
Contact angle (o)
100.00
65.00
99.63
66.32

138
(C) XPS analysis.
XPS survey spectra of the outermost layer of Gr-SS and Gr-TiV as well as that of the uncoated
substrates is presented in Figure 57 and Figure 58 respectively. Figure 57 reveals the presence of
Fe2p, Cr2p, C1s, O1s and Ni2p for both Gr-SS and the uncoated substrate. The presence of Al2p
peak in the spectrum of Gr-SS is attributed to alumina. Similarly, Gr-TiV and the bare substrate
showed similar Ti2p, O2p, V2p, C1S, Al2p, N1s, and Si2p peaks (Figure 58). However, the
spectrum of Gr-SS shows additional peak of Si2p which was also present in the spectrum of Gr-
TiV with a higher intensity suggesting that Si could be considered as an impurity probably form
the graphite powder. The spectrum of TiV also shows the presence of Fe2p peak which could still
be regarded as impurities form the graphite powder. The presence of C1s and O1s peaks with
higher intensity in the coated samples than that of the substrate in Figure 57 and Figure 58 is
attributed to the presence of graphite and substrate oxide and/or alumina respectively. This
observation is consistent with the compositional analysis given in Table 11 which indicates that
Gr-SS and Gr-TiV consisted mainly of carbon, aluminium and oxygen evidenced by an increase in
the concentration of these elements, compared to that of the substrate after treatment. The presence
of carbon on the substrate is related to the presence of a thin layer of adventitious carbon common
to XPS analysis.

139
0 200 400 600 800 10000
100000
200000
300000
400000
500000
600000
700000
0
100000
200000
3000000 200 400 600 800 1000
Binding Energy (eV)
SS316
Mo3d
Cr2p
Al2p Ni2pFe2p
Inte
ns
ity
(a
.u)
Inte
ns
ity
(a
.u)
Gr- SS
C1s O1s
Figure 57 Survey spectra of coated (Gr-SS) and uncoated 316 stainless steel.

140
0 200 400 600 800 1000
0
100000
200000
300000
0
100000
200000
3000000 200 400 600 800 1000
Si2p
Inte
ns
ity
(a
.u)
Binding Energy (eV)
Bare TiV
O2pC1s
inte
ns
ity
(a
.u)
Gr-TiV
Al2p Ti 2p
Si2p
Figure 58 Survey spectra of coated (Gr-TiV) and uncoated titanium (V) alloys.

141
Table 11 XPS Chemical composition (atomic %) of the outer layer for the coated and
uncoated metals.
(a)
Material
C
Al
O
Fe
Cr
Ni
Mo
Si
Gr-SS
58.7
5.5
18.7
11.2
2.0
0.7
-
2.4
Bare stainless steel
15.0
-
7.6
63.4
9.3
3.7
0.3
-
(b)
Material
C
Al
O
Ti
V
Si
N
Fe
Gr-Ti
43.8
8.6
32.1
6.5
1.3
4.1
1.4
2.3
Bare titanium
29.5
4.1
26.5
34.4
1.7
0.5
3.3
-
Figure 59 shows the XPS narrow region scan of the main elements in Table 11. The presence of
graphite on the outermost layer of both Gr-SS and Gr-TiV is confirmed by a symmetric peak at
284.48 eV (Figure 59 (a)) corresponding to carbon sp2 electrons in graphite [218]. Al2p peak at a

142
binding energy of 75.28 eV corresponds to the aluminium in alumina (Figure 59 (b)) while O1s
peak at 532 eV and 531.8 eV for Gr-SS and Gr-TiV respectively corresponds to the presence of
metal oxides (Figure 59 (c)).
Figure 59 XPS narrow scan region for (a) C1s (b) Al 2p and (c) O1s for Gr-SS and Gr-TiV.
Figure 60 displays the narrow scan region of Cr2p, Fe2p for Gr-SS and Ti2p for Gr-Ti. In Figure
60 (a), the Cr2p spectrum for Gr-SS indicates the presence of Cr2O3 at ~577 eV and 586.65 eV as
well as metallic chromium at 574.55 eV and 583.85 eV [218-220]. Similarly, the Fe2p spectrum

143
also shows the presence of metallic Fe (707.08 eV and 720.28 eV) and Fe2O3 (710.6 eV, 723.8 eV)
[218, 219, 221]. Combining these spectra with that given in Figure 59 for Gr-SS, it can be deduced
that the Gr-SS surface consisted of graphite/ alumina coatings on an exposed substrate layer,
which is consistent with the SEM analysis. A similar conclusion can also be made for Gr-TiV
based on the combination of and Figure 59 and 60 (c), which shows the presence of metallic Ti
and Ti oxides [218, 222].
Figure 60 XPS narrow scan region for (a) Cr2p (b) Fe2p for Gr-SS (c) Ti2p for Gr-TiV.

144
(D) XRD
The XRD pattern of CoBlast™ coated metals and the respective substrates are given in Figure 61.
Comparison of the diffraction patterns of Gr-SS and Gr-TiV (Figure 61 (a) & (c)) indicates that
graphite and alumina phases are common to both coated metals thereby implying that graphite and
alumina was successfully impregnated into these surfaces. This observation is in agreement with
the SEM and XPS results. Also present in the CoBlast™ treated metals are the substrate phases:
austenite (γ-Fe) for Gr-SS and titanium (TiV) for Gr-TiV. The weak intensity of graphite and
alumina peaks coupled with strongly intense peaks of the substrate phases in Figure 61 (a) & (c) is
consistent with the fact that the coated layer was very thin as earlier discussed.
A closer look at the patterns for Gr-SS and the substrate reveals an additional phase not present in
the substrate. The formation of this additional phase named, strain induced martensite (α′-Fe), is
attributed to strain hardening effect of the sub-layer as the powder particles impinge the surface
during blasting leading to partial transformation of austenite to martensite. The presence of
martensite in Gr-SS is consistent with previous reports on blasting of austenitic stainless steel by
different surface severe plastic deformation processes such as grit blasting [223], shot peening
[224], surface mechanical attrition treatment (SMAT) [225, 226]. Furthermore, a comparison of
the peaks for austenite (γ-Fe) for Gr-SS and titanium (TiV) for Gr-TiV and that of the substrate
reveals a broadening of the peak, which is suggestive of grain refinement, lattice deformation
and/or increase in micro-strain at the sub-layer of the substrate as commonly reported for blasted
surfaces [223-227]. However, further investigations to characterise these features in the CoBlast™
treated metals were not conducted.

145
20 30 40 50 60 70 80
(d)
c
Re
lative
in
ten
sity ,
a.u
-Fe
-Fe-Fe
Fe
-Fe
Graphite
Al2O
3
Al2O
3
TiTiTi
Ti
Ti
Re
lative
in
ten
sity ,
a.u
2theta, (degrees)
Graphite
Ti
Al2O
3
Graphite
Graphite
(b)
(c)
(a)
Ti
Ti
TiTi
Ti
Ti
Ti
a
Figure 61 XRD patterns for (a) Gr-SS (b) SS316 (c) Gr-TiV (d) Bare-TiV.

146
In summary, it could be concluded from the surface characterisation results that CoBlast™
deposited graphite coatings on 316 stainless steel and titanium grade (V) alloy consisted of a thin
and rough modified layer, which was composed of isolated pockets of graphite, alumina and/or a
mixture of both overlaying an exposed substrate.
4.2 EVALUATION OF GRAPHITE COATED TITANIUM (V) ALLOY AS PEM FUEL
CELL BIPOLAR PLATES
(A) Interfacial contact resistance (ICR)
Figure 62 presents the plot of 2 x ICR data as a function of compaction pressure for CoBlast
treated titanium (Gr-TiV) and bare substrate (Bare-TiV). The ICR data for graphite, the industry
bench mark, is also shown for reference. It can be seen in Figure 62 that ICR decreased with
0 50 100 150 200 2500
50
100
150
200
250
300
350
400
2 x
IC
R,
m.
.cm
2
Compaction pressure , N/cm2
Graphite
Bare TiV
Gr-TiV
100 120 140 160 180 2000
20
40
60
80
100
2 X
IC
R, m
...c
m2
Compaction pressure , N/cm2
Figure 62 Plot of Interfacial contact resistance vs. compaction pressure for Gr-TiV, Bare
TiV and graphite.

147
increasing compaction pressure for all materials due to increasing contact area between the carbon
paper and the specimens [74-76]. At compaction pressure of interest for PEM fuel cell application
(100-200 N/cm2) shown in the inset in Figure 62, Gr-TiV exhibited reduced ICR compared to that
of bare-TiV. The decrease in ICR is attributed both to the outermost layer composition and surface
roughness. As revealed in the XPS analysis, the passive layer of Gr-TiV consisted of a mixture of
conductive graphite, alumina and titanium oxides, which is more conductive than the naturally
occurring titanium oxide from the substrate. Also, the higher surface roughness of Gr-TiV
compared to that of bare-TiV would contribute to the reduction in ICR as the rougher the sample,
the lower the ICR [21, 30, 55, 56]. At typical compaction pressure of 140 N/cm2 as shown in the
Table 12, Gr-Ti exhibited ~ 32% lower ICR value compared to that of bare-TiV and about 100%
higher ICR value compared to that of graphite. Compared to the targeted ICR of 10 mΩ.cm2, it can
be seen that the ICR of Gr-TiV is significantly higher than the targeted value implying that Gr-TiV
is not suitable for PEM fuel cell bipolar plate application.
Table 12 2 x ICR of Gr-TiV and Bare-TiV at 140 N/cm2.
Material
Graphite
Gr- TiV
Bare-TiV
ICR (mΩ.cm2)
21.19
45.70
66.50
(B) Potentiodynamic and potentiostatic Polarisation
I. Potentiodynamic Polarisation
Figure 63 displays the potentiodynamic polarisation curve for Gr-TiV and bare TiV alloy in
simulated PEM fuel cell cathode (0.6 V, air purged) and anode (-0.1 V, bubbled with H2)

148
environments and working potential at room temperature respectively. It can be deduced from
Figure 63 that both Gr-TiV and bare TiV behaved identically in the simulated PEM fuel cell
cathodic and anodic environments indicating that the graphite /alumina coating had negligible
influence on the corrosion resistance of the bare metal and this is attributed to the discontinuous
nature of the coatings. In the simulated cathode environment, the corrosion potential of the bare
alloy is shifted towards more noble potential and the corrosion current density is about one order
of magnitude less than that of the substrate as shown in Table 13. A reverse trend is, however,
observed at the simulated anodic environment. At typical PEM fuel cell cathodic working potential
of 0.6 V, both Gr-TiV and the bare TiV are within the passive region. However, in Figure 63 (b),
the PEM fuel cell anodic working potential of -0.1 V is close to the free corrosion potential of TiV.
Table 13 Corrosion parameters of Gr-TiV and TiV in 0.5 M H2SO4 + 2 ppm at room
temperature.
Material Cathode Anode
𝑬𝒄𝒐𝒓𝒓
(V vs. Ag/AgCl)
𝒊𝒄𝒐𝒓𝒓
(µA/cm2)
𝑬𝒄𝒐𝒓𝒓
(V vs.
Ag/AgCl)
𝒊𝒄𝒐𝒓𝒓
(µA/cm2)
Gr-TiV
0.0
50
-0.25
2
TiV
-0.3
10
-0.15
0.7

149
Figure 63 Potentiodynamic polarisation curves for Gr- TiV and Bare- TiV in 0.5 M H2SO4
+ 2 ppm HF at room temperature with (a) air bubbled (b) H2 gas bubbled into the
electrolyte. Scan rate 1 mV/s.

150
II Potentiostatic Polarisation
Figure 64 shows the potentiostatic curves for Gr-TiV and bare TiV in simulated cathode and anode
PEM fuel cell working conditions of 0.6 V and -0.1 V with air and hydrogen gas bubbling. In the
simulated cathodic environment as shown in Figure 64 (a), Gr-TiV and bare -TiV samples
exhibited an initial decay at the inception of polarisation due to the formation of passive films in
agreement with the potentiodynamic curves [21, 58, 59]. Gr-TiV, however, exhibited a more stable
performance than the bare TiV, reaching a current density of ~42 µA/cm2 in the first 400 seconds
and gradually stabilised at 17 µA/cm2 while the bare alloy stabilised at ~ 46 µA/cm
s2.
In Figure 64 (b), both Gr-TiV and TiV exhibited negative transient current density. The
potentiostatic behaviour of both Gr-TiV and bare-TiV in the simulated anodic environment is
consistent with previous studies on other Ti alloys [73, 74, 96]. This behaviour is attributed to the
low applied potential of -0.1 V at the anode which facilitates the formation of a stable oxide after
the initial dissolution of the air-formed film. From the results presented in Figure 64, it can be seen
that the CoBlast™ deposited graphite coatings did not enhance the corrosion properties of titanium
(V) alloy

151
Figure 64 Potentiostatic polarisation of Gr-TiV and Bare –TiV in 0.5 M H2SO4 + 2 ppm HF
at 70 oC (a) air bubbled (E = 0.6 V (Ag/AgCl) and (b) H2 gas bubbled ( E = -0.1 V (Ag/AgCl)
into the solution.

152
III. ICP-MS analysis
Metallic ions arising from corrosion of metals have a detrimental effect on the proton exchange
membrane and the catalyst layer as earlier discussed in Chapter 2. Therefore, the amount of Ti ions
leached in to the bulk solution after 14,400 seconds of potentiostatic polarisation was investigated
and is presented in Table 14. In general, the amount of titanium ion leached into the electrolyte
under simulated anodic condition (-0.1 V) exceeded that in the simulated cathodic conditions for
Gr-TiV and TiV thereby suggesting that dissolution is higher under PEM fuel cell anodic
conditions than under the cathodic conditions. This observation is consistent with that reported by
Feng et al. [89] for pure Ti and could be related to the reducing nature of the anodic environment
which prevents spontaneous passivation.
It can also be seen from Table 14 that the amount of titanium ion leached in the electrolyte during
static polarisation of Gr-TiV is more than that of the substrate. Although not in comparable
electrolyte solution, a similar observation was reported by Brown et al. [227] for grit blasted
surfaces compared with polished surfaces and their findings were attributed to the increased
surface area of the grit blasted sample which led to increased sites for corrosion reactions. Hence,
the increased amount of leached metallic ions in Gr-TiV compared to TiV can be attributed to
higher surface roughness of Gr-TiV.

153
Table 14 Total metal ion concentration after 14400 seconds of potentiostatic polarisation of
Gr-TiV and TiV in simulated PEM fuel cell environment of 0.5 M H2SO4 +2 ppm HF at
70 oC
Metal ion
Gr-TiV
TiV
Cathode
Anode
Cathode
Anode
Titanium (ppm)
3.240
6.960
0.422
1.056
4.3 EVALUATION OF GRAPHITE COATED STAINLESS STEEL AS PEM FUEL
CELLS BIPOLAR PLATES
In this section, only the potentiodynamic, potentiostatic polarisation and ICP-MS results for Gr-SS
are presented. The ICR of Gr-SS will be presented in the next chapter in comparison with the ICR
of the modified graphite coated stainless steel.
(A) Potentiodynamic polarisation
Figure 65 displays the potentiodynamic curves for Gr-SS and the substrate (SS316) in 0.5 M
H2SO4 + 2 ppm HF solution at room temperature in simulated anode (hydrogen bubbling) and
cathode (air bubbling) PEM fuel cell conditions. In the simulated cathode environment (Figure
65(a)), both Gr-SS and SS316 exhibited active-passive- transpassive behaviour typical of stainless
steels. The corrosion current density of both materials is within the 10-5
A/cm2 range at free
corrosion potential (Table 15) implying that corrosion properties of SS316 were not improved by
Gr-TiV.

154
It can also be seen in Figure 65 that PEM fuel cell cathode potential of 0.6 V, SS316 is within the
passive region signifying retardation of corrosion [64, 65]. On the other hand, Gr-SS is within the
transpassive region denoting that corrosion will be accelerated within the cathodic environment.
The potentiodynamic curve of SS316 and Gr-SS in the simulated PEM fuel cell anode
environment is presented in Figure 65 (b). Both SS316 and Gr-SS exhibited extended active region
due to the inability to form passive film in hydrogen containing environment [21, 65, 66]. This
behaviour is typical of stainless steels in a reducing environment and is generally attributed to the
oxidation of Cr2O3, a primary constituent of the passive layer to higher valences (e.g. Cr6+
) [33,
73].

155
Figure 65 Potentiodynamic curves for Gr-SS and SS316 in 0.5 M H2SO4 + 2 ppm HF at
room temperature in simulated (a) cathode (air bubbled into the solution) and (b) anode
environments (hydrogen gas bubbled into the solution). Scan rate = 1 mV/s.

156
Table 15 Corrosion potential and corrosion current density of Gr-SS and SS316 in simulated
PEM fuel cell environment of 0.5 M + 2 ppm H2SO4 at room temperature with air bubbling
(cathode) and hydrogen gas bubbling (anode).
Material
Cathode Anode
𝐸𝑐𝑜𝑟𝑟
(V vs. Ag/AgCl)
𝑖𝑐𝑜𝑟𝑟
(µA/cm2)
𝐸𝑐𝑜𝑟𝑟
(V vs. Ag/AgCl)
𝑖𝑐𝑜𝑟𝑟
(µA/cm2)
Gr-SS
-0.48
20
-0.25
30
SS316 -0.34 10 -0.15 20
The polarisation curve for Gr-SS in simulated PEM fuel cell anodic environment indicated that the
coating had unsatisfactory anti-corrosion properties. The corrosion potential of the SS316 is
shifted in the negative direction from -0.29 V to -0.31 V while its corrosion current density
increased by one order of magnitude from 5 µA to 20 µA when coated with graphite. These results
signify that the coated sample has a lower corrosion resistance and corrodes faster than the
uncoated sample in the simulated PEM fuel cell environment. At the PEM fuel cell anode working
potential of -0.1 V, both samples are within the active dissolution area and would corrode when
used under PEM fuel cell anodic conditions.
(B) Potentiostatic Polarisation
Figure 66 shows the potentiostatic polarisation for Gr-SS in 0.5 M H2SO4 + 2 ppm HF with air
bubbling to mimic the PEM fuel cell cathode environment. It can be seen that SS316 exhibited
passivity indicated by a current decay, as soon as the whole surface is covered with the passive

157
film the current begins to decrease and thereafter stabilises [21, 65, 66]. This behaviour can be
further supported with the potentiodynamic curve wherein SS316 is within the passive region at
the applied potential of 0.6 V. SS316 begins to stabilise after about 800 seconds reaching a stable
current density of 55.2 µA/cm2 at the end of 14400 seconds. Gr-SS also showed passivation
characteristics but could not stabilise until about 5000 seconds.
Figure 66 Potentiostatic polarisation of Gr-SS and SS316 in 0.5 M H2SO4 +2 ppm HF at
70 oC, air bubbled, E = 0.6 V. Scan rate 1 mV/s.
The instability of Gr-SS can be explained by the fact that the applied potential (0.6 V) is at the
threshold of the trans-passive region i.e. the region where the passive film break down and
corrosion is accelerated in the potentiodynamic curve. At the end of the 14400 seconds, Gr-SS
stabilised at 151 µA/cm2, which is an order of magnitude higher than that of SS316 and four orders
of magnitude higher than the targeted 1 µA/cm2
for bipolar plates. Potentiostatic polarisation in
C
t d
s t ,
/
2

158
simulated PEM fuel cell anodic environment was not investigated because the potentiodynamic
results revealed that the substrate (SS316) exhibited better corrosion resistance than Gr-SS in
simulated PEM fuel cell anodic environment.
(C) ICP-MS analysis
The ICP-MS analysis of the concentration of metallic ions leached into the solution after
potentiostatic polarisation is shown in Table 16. Iron (Fe) has the highest concentration in both
samples due to preferential dissolution which is consistent with previous studies on stainless steels
[138-140]. It can be seen that the total metallic ions from the coated sample is more than that from
the bare metal signifying that Gr-SS could not protect the substrate from dissolution during
polarisation which is consistent with the potentiostatic polarisation result.
Table 16 Metallic ion concentration (in ppm) after potentiostatic polarisation in PEM fuel
cell cathode environment and working potential.
Material Fe Cr Mn Ni Total
Gr-SS
2.253
0.592
0.059
0.277
3.181
SS316 2.140 0.290 0.036 0.196 2.662
(D) Factors that influenced the corrosion resistance of CoBlast™ coatings in simulated PEM
fuel cell environments.
It can be deduced from the potentiodynamic and potentiostatic curves of Gr-SS and Gr-TiV that
both coated materials exhibited poor corrosion behaviour in the simulated PEM fuel cell
environments. This behaviour can be attributed to a number of factors which are discussed below:

159
(1) Nature of the coatings: The SEM, XPS and XRD characterisation of Gr-SS and Gr-TiV
revealed a thin and discontinuous coated layer. Discontinuities in coatings are well known to
promote dissolution of the substrate, in preference to the coatings. The defects provide
pathway for interaction between the substrate and the corrosive media thereby facilitating the
formation of micro-galvanic couples on the coated surface, which leads to dissolution of the
substrate [228-230]. In the case of Gr-SS and Gr-Ti, the discontinuous coatings acted as the
cathode and the exposed substrate the anode, resulting in preferential dissolution of the
substrate.
(2) Blasting nature of the coating process: It is well established that plastic deformation via
blasting generally induces an increase in surface roughness and increase in lattice defects such
as dislocations and grain boundaries of metallic materials [223-226]. An increase in surface
roughness and lattice defects engenders the formation of active sites which promote corrosion.
This phenomenon can be related to the electron work function of the metal in question. The
electron work function (EWF) is the minimum energy required to dislodge electrons from the
interior of a metal to its surface [225, 226,233].
The EWF of a metallic surface is closely related to the electron transfer phenomenon in
corrosion and can give an indication of the susceptibility of a surface to dissolution [218, 225].
An increase in surface roughness corresponds to a decrease in EWF implying that a rough
surface would more readily give up its electrons than a smooth surface, hence resulting in an
increase in the corrosion rate. Similarly, dislocations generated during blasting increase the
activity of electrons on the surface and decrease the energy required to transfer such electron
from the interior to the surface thereby promoting corrosion [233].

160
(3) Phase transformation in austenitic stainless steel: Austenitic stainless steels such as 316,
304 stainless steels are metastable in nature, hence austenite can undergo partial phase
transformation during blasting leading to the formation of strain induced martensite. It is well
reported that the presence of small amounts of strain-induced martensite deteriorates corrosion
resistance of austenitic stainless steels in both acid and alkaline media due to galvanic effect
between the austenite and martensite phases [225, 233].
4.4 SUMMARY
The surface characterisation, ICR and electrochemical polarisation of graphite/alumina
coatings deposited by CoBlast™ process on 316 stainless steel and titanium grade (V) alloys
was reported in this chapter. SEM/EDX, XRD and XPS results revealed that graphite and
alumina (the grit material) were impregnated on the substrates after the CoBlast™ treatment.
The modified layer had rougher morphologies and higher contact angles when compared with
that of the bare substrates, but the depth of modification was low and discontinuous with
patches of graphite, alumina, or a mixture of both overlaying an exposed substrate. Hence, the
graphite coatings could not adequately protect the base metal from corrosion. The presence of
substrate surface oxides also impaired the electrical conductivity of the coating, although it
was lower than the substrate, yet it was higher than graphite, the industrial benchmark. These
results indicated that improvement in the continuity and thickness of the coating is needed for
the CoBlast™ process to be feasible for surface modification of metallic PEM fuel cell bipolar
plate.

161
Chapter 5
Post Modification Of Graphite Coated
Stainless Steel.
5.1 INTRODUCTION
In the last chapter, it was established that CoBlast™ deposited graphite coatings did not offer the
desired corrosion protection in PEM fuel cell environments, due to its discontinuous nature
amongst other factors. Attempts to improve the continuity of the graphite coatings via process
optimisation were not successful; hence, it was not included in this thesis. However, it may be
possible to enhance the corrosion resistance of the coatings by post-deposition treatments. Whilst
there are many surface modification techniques that can be employed, the presence of increased
grain boundaries and high dislocation density defects arising from severe plastic deformation
induced by grit-blasting suggest that a thermochemical post-treatment could be appropriate for
enhancing the thickness and corrosion behaviour of CoBlast™ coatings. However, only graphite
coated 316 stainless steel (Gr-SS) was considered for post-modification treatments. Graphite
coated titanium (V) alloy was not considered due to its high cost compared to stainless steel [47].
Among the available thermochemical process, chromising has been widely employed for
improving the corrosion and oxidation resistance of nickel and ferrous based alloys [183,184].
Chromising as earlier described in Chapter 3, involves surface modification of a ferrous-based or
Ni alloy via diffusion of chromium atoms at high temperatures into a ferrous-based or Ni alloy
surface. The process is of interest for PEM fuel cell bipolar plate applications because corrosion
resistance and surface conductivities of stainless steels increases with its chromium content [21,
64-66].

162
Chromising is typically a slow process; hence, it is conducted at temperature ≥1000oC. However,
It is well reported that the chemical kinetics and diffusivity of chromium during chromising
process can be enhanced by the presence of lattice defects such as increased grain boundaries and
high dislocation density induced by surface severe plastic deformation processes (S2PD) such as
shot peening, surface mechanical attrition (SMAT) [223-225]. These lattice defects are reported to
enhance chemical kinetics by acting as channels for faster atomic diffusion thereby resulting in
thicker chromised coatings than the untreated substrate [223, 224]. It is also reported that the
chromised layers formed after such surface treatments exhibit better corrosion resistance than their
untreated counterpart processed at the same temperature [27-29, 232].
Yang et al. [27] reported that shot peening prior to pack chromising generated a thicker coating
which exhibited one order magnitude reduction in the current density of untreated 316 chromised
polarised in simulated PEM fuel cell environment of 0.5 M H2SO4 + 2 ppm HF at 70 oC. Wen et
al. [284] investigated the effect of rolling pre-treatments and EDM machining coupled with low
temperature chromising at 700 oC on 420 stainless steel and reported that rolling pre-treatments
was more effective in enhancing the performance of chromised 420 stainless steel than EDM
machining. A similar improvement in single fuel cell performance with bipolar plates which were
rolled prior to chromising was also reported by Bai et al. [29].
In this chapter, results obtained for post chromising treatment of graphite coated stainless steel
(Gr-SS) at 900 oC for three hours are presented and discussed in comparison with that obtained for
Gr-SS and the untreated substrate (SS316).

163
5.2 SURFACE CHARACTERISATION
I. Surface morphology
Figure 67 (a) and (b) displays the surface morphology of Gr-SS after chromising treatments at 900
oC for 3 hours in the secondary electron (SE) and backscattered (BSD) modes respectively. The
secondary electron image of chromised Gr-SS (Figure 67(a)) revealed a granular morphology with
defects such as craters, pores. On the other hand, the BSD image of chromised Gr-SS showed a
heterogeneous distribution of the former graphite/alumina coatings in a chromium rich matrix
(Figure 67 (b)).
Figure 67 SEM images of chromised Gr-SS (a) secondary electron view (b) backscattered
(BSD) view (dark patches – graphite /alumina coatings, light area –chromium rich region)
The surface morphology of the untreated 316 stainless steel (chromised SS316) presented in
Figure 68 shows a similar granular morphology with relatively smoother surface without any
inclusions. However, faint polishing lines conducted before chromising treatment, are visible in

164
the chromised SS316, indicating that the amount of chromium uptake was small; hence, a thin
coated layer was formed. The thickness of the coated layer was estimated to be ~1.8 µm. In
contrast, the thickness of chromised Gr-SS was estimated to be ~4.0 µm based on measurements
across different points on the coated layer. The two fold increase in the thickness of the coated
layer in chromised-Gr-SS is attributed to the higher diffusivity of chromium during deposition,
engendered by lattice defects in agreement with previous studies on pre-treated chromised coatings
[39-41, 223, 224].
Figure 68 SEM images of chromised SS316 (a) secondary electron view (b) backscattered
view. Surface morphologies provided at higher magnifications than in Figure 67 in order to
reveal the granular morphology.

165
Figure 69 Cross-section of (a) chromised Gr-SS and (b) chromised SS316 both samples were
pack chromised at 900 oC for 3 hours.
III. XRD analysis
Figure 70 presents the diffraction patterns for chromised Gr-SS and chromised SS316. Both XRD
patterns showed similar phases of austenite, chromium iron nitride ((Cr, Fe)2 N1-x where x = 0-0.5)
and chromium iron carbide((Cr,Fe)3C7, (Cr,Fe)23C26, (Cr,Fe)3C2)), however, the intensities of these
phases differ. In particular, the intensity of the austenite peak in chromised Gr-SS (Figure 70(a))
was significantly reduced compared to that of chromised SS316 (Figure 70(b)). The difference in
the intensities of the austenite peaks is consistent with the two fold increase observed in the
thickness of chromised Gr-SS compared to that of chromised SS316.

166
30 35 40 45 50 55 60
Chromised SS316
2 theta, (degrees)
Chromised Gr-SSIn
ten
sity (
co
un
ts)
- Fe
o
X
X
o
x
o
o
o - (CrFe)23
C26
X - Cr(Fe)N1-x
- (Cr Fe)3C
7
X X
(a)
(b)
Figure 70 XRD patterns of (a) chromised Gr-SS and (b) chromised SS316.
It can also be seen in Figure 70 (a) that graphite or alumina phases were not detected, is in contrast
to the surface morphology of chromised Gr-SS shown in Figure 68. The absence of these phases
could be related to the high depth of X-ray penetration in conventional locked couple XRD.
Hence, glancing angle XRD was conducted at relatively low depth of x-ray penetration of 0.1 to
1o.
Figure 71 shows the glancing angle XRD patterns for chromised Gr-SS. At a glancing angle of 1o,
which is about 198nm into the coated layer [223], no austenite peak was observed implying that
only chromium compounds were present at this depth which agrees with the ~4µm thick coated
layer shown in Figure 69 (cross-sectional view). At all glancing angles, graphite and alumina

167
peaks were not detected suggesting that the concentration of graphite and alumina was very low
compared to the chromium based compounds.
25 30 35 40 45 50 55 60
Rela
tive I
nte
nsit
y (
a.u
)
2 theta (degrees)
1o
0.5o
0.1o
C,Fe) 23
C6
( Cr,Fe)7 C
3
(Cr, Fe)2N
1-x
o
Figure 71 Glancing XRD patterns for chromised Gr-SS.
1V. XPS Analysis
XPS analysis was conducted in order to confirm the presence of graphite and alumina on the
surface of chromised Gr-SS. After 10 minutes of sputtering, which is representative of the depth
revealed at glancing incidence of 0.1o, the XPS survey spectra for chromised Gr-SS (Figure 72)
revealed the presence of Cr2p, O1s, N1s, C1s and Al2p peaks. Figure 72 also indicate the absence
of Fe2p peaks in agreement with the glancing XRD result (Figure 71).

168
Figure 72 XPS survey spectra for chromised Gr-SS after 10minutes of Argon sputtering.
The high resolution scan for C1s at this depth (Figure 73) revealed the presence of C-Cr at binding
energy of 282.75 eV and C-C bond at binding energy of 282.75 eV [205, 235, 236]. The C-Cr
bond is attributed to chromium carbide, while the C-C bond at 284.60 eV is attributed to graphite
[205] thereby confirming the presence of graphite on the outermost layer. Graphite was not
detected by GXRD due to it very low concentration compared to that of chromium based
compounds. The Cr2p 1/2 peak at 574.2 eV in Figure 74 further establishes the presence of
chromium carbide on the outermost layer of chromised GR-SS.
1000 800 600 400 200 00
100000
200000
300000
Inte
nsity,
counts
Binding energy, eV
Cr 2p3/2
Cr2p1/2
N1sO
1s
Cr3p
Al2pC
1s
Cr2s

169
280 282 284 286 288 290
1000
2000
3000
4000
Inte
nsity (
co
un
ts)
Binding energy (eV)
C1s
C-C
C -Cr
Figure 73 High resolution scan for C1s in Chromised Gr-SS.
572 574 576 578 5800
10000
20000
30000
40000
Inte
nsity (
counts
)
Binding energy, eV
Cr-C
Cr-N-O
Figure 74 High resolution scan for Cr2p in Chromised Gr-SS.

170
It is noted that the binding energies of the Cr-C bonds in Figure 74 are consistent with the reported
binding energies for chromium carbides or metallic Cr [205, 235, 236]. However, it is well
reported, that if the band gap of the XPS is greater than the difference in binding energies of Cr-Cr
and Cr-C bonds (which is about 0.2 eV), the difference between the two bonds cannot be resolved
[235, 236]. The band gap of the XPS used in this study was 0.6 eV; hence, the peak at 574.2 eV
can be attributed to Cr-C bonds given that a C-Cr bond can be seen in the C1s spectrum shown in
Figure 73.
Figure 74 also indicates the presence of Cr-N-O bonds at binding energy of ~575.5 eV. The Cr-N-
O bonds are due to the presence of chromium nitride in oxygen environment [219, 220]. Hence
from the XPS and the GXRD result, it can be concluded the outermost layer of chromised Gr-SS
consist of graphite, alumina and chromium based compounds.
5.3 INTERFACIAL CONTACT RESISTANCE
Figure 75 gives the plot of 2 x ICR as a function of compaction pressure for chromised Gr-SS and
chromised SS316, Gr-SS and SS316. The ICR data for graphite is also shown for reference. ICR
decreased with increasing compaction pressure for all materials due to increasing contact area
between the carbon paper and the specimens as compaction pressure increased. At the compaction
pressures of interest for PEM fuel cell applications (100-200 N/cm2
) as shown in the inset,
chromised Gr-SS exhibited ICR values of 49.06-15.93 mΩ.cm2 which were comparable to that
of graphite ( 27.47 - 15.07 mΩ.cm2
) at higher compaction pressures of ~160-200 N/cm2. On the
hand, the ICR values of chromised SS316 (122.52 - 70.82 mΩ.cm2) and SS316 (319.5 -146.92
mΩ.cm2) were significantly higher than that of chromised Gr- SS under the same range of
compaction pressure. At typical compaction pressure of 140 N/cm2, the 2 x ICR of these materials

171
Figure 75 ICR of chromised Gr-SS and chromised Gr-SS compared with that of graphite
and Gr-SS.
was found to be: chromised Gr-SS – 25.00 mΩ.cm2, graphite - 21.19 mΩ.cm
2, chromised 316 –
49.37 mΩ.cm2, Gr-SS - 90.31 and SS316 – 200.03 mΩ.cm
2. The difference in ICR of these
materials can be explained thus:
The ICR of metallic bipolar plates is fundamentally influenced by outermost composition
and surface roughness. The high contact resistance of SS316 at the compaction pressure of
interest to PEM fuel cells is consistent with previous studies on 316 stainless steel and is
attributed to its outermost composition which consists of Fe-rich and Cr-rich surface oxide
layers which are well known to be semi-conductive [73-75]. Conversely, the reduction in
ICR of Gr-SS compared to that of SS316 can be attributed to both to the doping effect of
0 40 80 120 160 200 240
0
200
400
600
800
1000
1200
1400
1600
2 x
IC
R, m
.cm
2
Compaction pressure, N/cm2
316SS
Graphite
chromised Gr-SS
Gr-SS
chromised 316SS
100 120 140 160 180 200
0
50
100
150
200
250
300
2 X
IC
R,
m.
.cm
2
Compaction pressure, N/cm2

172
graphite on the oxide layer and higher surface roughness than the substrate. Similarly, the
decrease in ICR of Gr-SS after chromising can be attributed to its chemical composition of
the outermost layer and surface roughness.
Previous studies on chromised studies have shown that increasing surface roughness of the
chromised coating through the use of pre-treatments such as shot peening, rolling etc.
decreases ICR of chromised coating albeit marginally. For instance, Yang et al. [27]
reported a 16% reduction in ICR at 200 N/cm2
while Bai et al. [29] reported a 14.3%
decrease in ICR at 140 N/cm2 for pre-rolled and chromised coatings on 420 stainless steel.
Hence, the ~72% reduction in ICR of Gr-SS at 140 N/cm2
after post chromising can be
attributed to the chemical composition at the outermost layer. As shown in the XPS
analysis in Figure 72-75, the outermost layer of chromised Gr-SS contained graphite in
addition to the chromium based compounds on the passive layer, graphite is known to be
conductive, hence, the ~50% reduction in ICR of chromised Gr-SS compared to chromised
SS316 at 140 N/cm2. This observation suggests that increasing carbon content (since
graphite is an allotrope of carbon) on the outermost layer of chromised coatings can
decrease ICR.
5.4 CORROSION BEHAVIOUR IN SIMULATED PEM FUEL CELL ENVIRONMENT
AT 70 O
C
(A) Potentiodynamic polarisation
Figure 76 presents the potentiodynamic polarisation curves of chromised Gr-SS and chromised
SS316 as well as that of Gr-SS and SS316 exposed to 0.5 M H2SO4 + 2 ppm HF at 70 oC without

173
1E-9 1E-8 1E-7 1E-6 1E-5 1E-4 1E-3 0.01
-0.6
-0.3
0.0
0.3
0.6
0.9
1.2
1.5
Pote
ntial V
s A
g/A
gC
l ,
(V)
Current density, A/cm-2
316SS Chromised Gr-SS
Gr-SS Chromised 316SS
Cathode working potential
Eb
Figure 76 Potentiodynamic polarisation of chromised Gr-SS, chromised SS316, SS316 and
Gr-SS in 0.5 M H2SO4 + 2 ppm HF at 70 oC, scan rate =1 mV/s.
air or hydrogen bubbling. It can be seen from Figure 76 that SS316 exhibited an active-passive-
trans-passive behaviour typical of stainless steels in simulated PEM fuel cell environment.
Table 17 gives the corrosion parameters derived from Figure 76 for the materials investigated.
Comparing the corrosion parameters of SS316 and Gr-SS, it can be seen that blasting SS316 with
graphite and alumina particles via CoBlast™ process degraded the corrosion resistance of SS316,
evidenced by a one of magnitude reduction corrosion current density (𝑖𝑐𝑜𝑟𝑟 ).

174
Table 17 Corrosion parameters for chromised Gr-SS, chromised SS316, SS316 and Gr-SS.
Materials
Corrosion
potential
(𝑬𝒄𝒐𝒓𝒓)
( V vs. Ag/AgCl)
Corrosion
current
density
(icorr, µA/cm2)
Breakdown
potential (𝑬𝒃)
(V vs. Ag/AgCl)
Critical
passive
current
(𝒊𝒄 µA/cm2)
Chromised
Gr-SS
0.27
2.21
0.94
-
Chromised
SS316
0.27
3.20
0.94
-
SS316
-0.28
276
0.89
32.40
Gr-SS
-0.43
5920
0.90
300
It is reported that grit blasting degrades the corrosion resistance of austenitic stainless steels [229 -
231]. Otubo et al. [229] reported that grit-blasted 304 stainless steel exhibited lower corrosion
resistance than the substrate in 1 N H2SO4 at room temperature [229]. The loss of corrosion
resistance was attributed to the surface roughness rather than the presence of martensite on the grit
blasted surface, as stress relieved grit-blasted samples, which had no martensite exhibited similar
corrosion properties with the untreated grit blasted sample. This fact was reiterated by Galvan et
al. [230] on the corrosion of medical 316LVM stainless steel in simulated human fluids. On the
other hand, Celik et al. [239] demonstrated that grit-blasting prior to coating deposition increased
the susceptibility of the thermal sprayed coatings to corrosion. Hence, from these studies, the poor
performance of Gr-SS compared to the SS316 can be attributed to its higher surface roughness.

175
The loss of corrosion resistance due to increase in surface roughness is related to the electron work
function (EWF) of the surface, as discussed earlier. An increase in surface roughness of a surface
corresponds to a decrease in its EWF and corrosion resistance.
Post chromising treatment of Gr-SS yielded a modified chromised surface, which exhibited more
noble corrosion potential (𝐸𝑐𝑜𝑟𝑟) and lower corrosion current density ( 𝑖𝑐𝑜𝑟𝑟) than Gr-SS and
SS316 respectively (Table17), implying that corrosion properties of Gr-SS was enhanced.
Interestingly, both chromised Gr-SS and chromised SS316 exhibited similar corrosion potential
and corrosion current density. However, at higher potentials, chromised Gr-SS becomes unstable
while the latter maintained its pseudo-passive state i.e. increase in current density with an
increasing potential after active dissolution.
The corrosion behaviour of the investigated material at typical PEM fuel cell cathode potential of
0.6 V can also be deduced from Figure 76. It can be seen that all materials investigated are within
the passive region. However, chromised Gr-SS showed some degree of instability at potentials
close to 0.6 V which suggest that in more aggressive environment with air bubbling chromised
Gr-SS may be active; hence, it may not be suitable for PEM fuel cell bipolar plates.
(B) Potentiostatic polarisation
Figure 77 shows the potentiostatic polarisation curves for chromised Gr-SS and chromised SS316
at 0.6 V in 0.5 M H2SO4 + 2 ppm HF at 70 oC with air bubbled into the electrolyte during
polarisation. As seen in Figure 77, chromised Gr-SS exhibited an anodic to cathodic oscillatory
behaviour throughout the 4 hours test while chromised SS316 exhibited a more stable performance
than chromised Gr-SS and stabilised within the 10 µA/cm2
range.

176
Figure 77 Potentiostatic polarisation of chromised Gr-SS and chromised SS316 at 0.6 V vs.
Ag/AgCl in 0.5 M H2SO4 + 2 ppm HF purged with air at 70 oC, scan rate =1 mV/s. The inset
shows the oscillatory behaviour exhibited by chromised Gr-SS.
Figure 78 (a) and (b) presents the surface morphologies of chromised Gr-SS and chromised SS316
after potentiostatic polarisation. Fig. 78 (a) indicates that chromised Gr-SS showed evidence of
corrosion attack characterised by the formation of micro-pits. These micro-pits appear to be on the
chromium based matrix while the graphite-alumina particles appear un-attacked (circled in red).
This observation could be attributed to the potential difference between the chromium matrix and
the graphite/alumina based coatings thereby resulting in the formation of galvanic couples between
the graphite/alumina coatings and chromised matrix, wherein the latter acted as the cathode and
0 2000 4000 6000 8000 10000 12000 14000
0.0
2.0x10⁻⁴
4.0x10⁻⁴
6.0x10⁻⁴
8.0x10⁻⁴
Cu
rre
nt
de
ns
ity
, A
/cm
2
Time, seconds
chromised Gr-SS
chromised SS316
0 200 400 600 800 1000
0.0000
0.0002
0.0004
Curr
en
t d
en
sity, A
/cm
2
Time, seconds

177
the former the anode, hence, its preferential dissolution. On the other hand, Figure 78 (b) indicate a
relatively smooth morphology with negligible evidence of corrosion attack for chromised SS316.
These results imply that chromised Gr-SS is not suitable for PEM fuel cell bipolar plate
application. However, the stable performance of chromised SS316 despite its lower thickness
compared to chromised Gr-SS suggests that it may be possible to improve the performance of
chromised coatings through process parameter optimisation.
Figure 78 SEM micrographs of (a) Chromised Gr-SS (b) Chromised SS316 after 4 hours of
potentiostatic polarisation in 0.5 M H2SO4 + 2 ppm HF at 70 oC.
5.5 SUMMARY
Post chromising of CoBlast™ coated 316 stainless steel (Gr-SS) and its performance in simulated
PEM fuel cell environment was investigated in this chapter. Post chromising was conducted at 900
oC for 3 hours and the modified surface was characterised. The SEM/EDX, XPS and XRD results
indicated that post chromising of Gr-SS yielded a multiphase coating composed of a chromium

178
rich matrix with graphite and alumina inclusions. Hence, the modified CoBlast™ coated stainless
steel (chromised Gr-SS) exhibited ICR values significantly lower than Gr-SS. At typical PEM fuel
cell compaction pressure of 140 N/cm2, chromised Gr-SS exhibited ~72% reduction in the ICR of
Gr-SS. Chromised Gr-SS also exhibited about three order of magnitude decrease in the corrosion
current density of Gr-SS in 0.5 M H2SO4 + 2 ppm HF at 70 oC. However, examination of the
surface morphologies of chromised Gr-SS after potentiostatic polarisation for 4 hours at 0.6 V vs.
Ag/AgCl showed evidence of pitting corrosion. This observation was attributed to the potential
difference between the chromium matrix and the graphite/alumina coatings which facilitated the
preferential dissolution of the matrix relative to the graphite/alumina coatings.
In order to ascertain the influence of the graphite/alumina coatings on the performance of
chromised coatings, the performance of chromised Gr-SS in simulated PEM fuel cell
environments was compared with that of chromised 316 stainless steel (chromised SS316). It was
found that both materials exhibited similar corrosion resistance in 0.5 M H2SO4 + 2 ppm HF at
70 oC. Potentiostatic polarisation of both materials at 0.6 V vs. Ag/AgCl for 4 hours indicated that
chromised SS316 was more stable in the simulated PEM fuel cell environment with transient
current density in the 10-5
A/cm2 range. However, chromised Gr-SS exhibited 50% reduction in
the ICR of chromised stainless steel at 140 N/cm2. The reduction in ICR of chromised Gr-SS
compared to that of chromised SS316 was attributed to the graphite coatings inclusions. This result
suggest that it might be possible to reduce the ICR of chromised coatings by increasing its carbon
content, given that graphite predominately consists of carbon.

179
Chapter 6
Chromium Diffusion Coatings
6.1 INTRODUCTION
This chapter presents and discusses the results of the systematic investigation of the influence of
selected process parameters namely: time, activator content and temperature on corrosion current
density (𝑖𝑐𝑜𝑟𝑟) of pack chromised 304 stainless steel in aerated 0.5 M H2SO4 + 2 ppm HF at 70 oC.
The main objective was to optimise these process parameters using a design of experiments
approach. The optimised coating was thereafter characterised and its performance in simulated and
real PEM fuel cell environments was evaluated.
6.2 EXPERIMENTAL RESULTS AND MATHEMATICAL MODELLING
Table 18 gives the experimental results obtained for Tafel polarisation of pack chromised 304
stainless steels in aerated 0.5 M H2SO4 + 2 ppm HF acid solution at 70 oC. The polarisation
experiments were conducted randomly according to design matrix given in Table 8. The
thicknesses of the chromised coatings and polarisation resistance data for each run in the design
matrix calculated using Equation 30 is also presented. Representative Tafel plots and cross-
sectional SEM images of the chromised coatings for each run in Table 18 can be found in
Appendix III. These experimental results were fitted into a quadratic model, as suggested by the
sequential model sum of squares shown in Table 19 to obtain the regression model relating
corrosion current density to time, activator content and temperature. The best fit model was
obtained after using a square root transformation and step-wise regression.

180
Table 18 Design matrix based on three level-three factor Box–Behnken design.
Run Factors Responses
Time
(Hours)
Activator
Content
(wt. %)
Temperature
(oC)
Thickness
(µm)
Corrosion current
density
(µA/cm2)
Polarisation
Resistance (kΩ)
R1 6 3 1100 78.19 2.053 107.79
R2 6 5 1050 47.30 1.850 473.70
R3 6 7 1000 31.23 1.990 311.95
R4 9 5 1000 48.01 9.127 762.85
R5 3 5 1000 19.04 3.306 136.50
R6 6 3 1000 22.96 10.00 262.23
R7 9 5 1100 92.09 4.536 191.35
R8 3 5 1100 50.90 2.743 248.55
R9 6 7 1100 80.73 4.400 145.70
R10 6 5 1050 43.25 1.016 2533.75
R11 6 5 1050 46.31 1.020 548.00
R12 3 3 1050 34.89 0.415 4988.00
R13 3 7 1050 34.17 0.757 2111.50
R14 6 5 1050 45.21 1.056 438.95
R15 6 5 1050 47.75 1.260 547.40
R16 9 7 1050 55.02 1.879 257.75
R17 9 3 1050 55.13 2.345 433.56

181
Table 19 Sequential model sum of squares
Source
Sum of
Squares
Degree of
freedom
Mean
Square
F
Value
Prob>
F
Comments
Mean vs Total
4.181 x 10⁻⁵
1
4.181 x 10⁻⁵
Linear vs Mean 1.856 x 10⁻⁶
3 6.186 x 10⁻⁷
1.33 0.3082
2FI vs Linear 1.630 x 10⁻⁶
3 5.433 x 10⁻⁷
1.23 0.3507
Quadratic vs 2FI 4.163x 10⁻⁶
3 1.388 x 10⁻⁶
36.18 0.0001 Suggested
Cubic vs
Quadratic
1.777X 10⁻⁷
3 5.922 x 10⁻⁸
2.61 0.1886 Aliased
The empirical equation for the model in terms of coded factors is given in Equation 38.
(𝑖𝑐𝑜𝑟𝑟)0.5 = +0.473 + 1.280𝐸 − 04 ∗ 𝐴 − 6.402𝐸 − 03 ∗ 𝐵 − 8.648𝐸 − 04 ∗ 𝐶 + 6.0373𝐸
− 06 ∗ (𝐵𝐶) + 3.950𝐸 − 0.07 ∗ 𝐶2 (38)
Where A is time in seconds, B is the activator content in weight percentage and C is temperature
in degree Celsius
(A) Analysis of variance (ANOVA)
The model was statistically analysed using analysis of variance (ANOVA) and the result is
presented in Table 20. The Fisher variance ratio (the F-value) with the probability value (the p-
value) was used to estimate the statistical significance of the model. The F-value is the ratio of the

182
Table 20 ANOVA for response surface quadratic model.
Source
Sum of
Squares
Degree
of
freedom
Mean
Square
F
Value
p-value
Prob> F
Model
7.443 x 10⁻⁶
5
1.489 x 10⁻⁶
34.50
< 0.0001
Significant
A-Time
1.180 x 10⁻⁶
1
1.180x 10⁻⁶
27.34
0.0003
B-Activator
content
1.280 x 10⁻⁷
1
1.280 x 10⁻⁷
2.97
0.1130
C-
Temperature
5.481 x 10⁻⁷
1
5.481x 10⁻⁷
12.70
0.0044
BC
1.458 x 10⁻⁶
1
1.458 x 10⁻⁶
33.79
0.0001
C2
4.129 x 10⁻⁶
1
4.129 x 10⁻⁶
95.70
< 0.0001
Residual
4.746 x 10⁻⁷
11
4.315 x 10⁻⁸
Lack of Fit
3.838x 10⁻⁷
7
5.482 x 10⁻⁸
2.41
0.2061
not
significant
Pure Error
9.085 x 10⁻⁸
4
2.271x 10⁻⁸
Cor Total
7.917E-006
16
R-Squared
0.9401
Adjusted R2
0.9128
Predicted R2
0.8051
Adequate precision
20.1760
mean square of the model and the mean square error [195–197]. An F-value greater than the
tabulated value of F-distribution for the degree of freedom in the model at a given level of
significance is required for the model to be adequate and be a good predictor of the experimental
values [197]. For the corrosion current density model represented by Equation 38, the tabulated F-
value for the degree of freedom at a 95% level of significance (i.e. F (5, 17) was given as 2.81).

183
This F-value is less than the calculated F value of 34.50 thereby signifying that the model is
adequate. The large F value and p-value less than 0.0001 as shown in the Table 20 indicate that the
model is significant. On the other hand, the significant factors with p-values less than 0.05 were
temperature (C2), two level interaction between activator content and temperature (B x C), time (t),
Temperature (T).
The adequacy of the model was further evaluated using the coefficient of regression (R2), adjusted
R2, and predicted R
2 values. R
2 is a measure of the degree of fit of the model and a value close to 1
is desirable [195 – 197]. Table 20 indicates that corrosion current density model showed a good
degree of fit with R2 value of 0.9401 thereby implying that the model can account for 94.01% of
the variation in the data. The predicted R2 and the adjusted R
2 values for the model also showed
good correlation with values close to 1.
The lack of fit test, adequate of precision and distribution of the residuals (i.e. the difference
between the predicted and experimental values) were also employed in checking the adequacy of
the model. The lack of fit for the model was 2.41, implying that the lack of fit is not significant
relative to pure error. On the other hand, the signal to noise ratio of 20.176 implies that the model
has an adequate signal to noise ratio and can be used to navigate the design space. Figure 79 shows
the normal plot of residuals for the developed model. The closeness of the data points to the
straight line signifies that the models showed no serious abnormalities and that the errors are
normally distributed. Hence, the model can make accurate prediction as shown in the plot of the
experimental values versus the predicted values (Figure 80).

184
Figure 79 Normal probability plot of the studentised residual for corrosion current density.
Figure 80 Predicted versus actual values plot for corrosion current density.

185
(B) Influence of process parameters on corrosion current density.
The main and interaction effects of time, activator content and temperature on corrosion current
density of chromised 304 stainless steel in simulated PEM fuel cell environment can be deduced
from Equation 38. The factors with positive coefficient i.e. time (A), two-level interaction of
activator content and temperature (BC) and second order term for temperature (C2) have a
synergistic effect while the factors with negative coefficient i.e. activator content and temperature
have an antagonistic effect on corrosion current density.
The main effect of the factors can also be represented in graphical forms using the perturbation
plot, while the interaction effect can be represented on a two- dimensional contour plot and three
dimensional response surface plots.
Figure 81 gives the perturbation plot for the corrosion current density model at the central point in
the design space (i.e. time of 6 hours, activator content of 5 wt. % and temperature of 1050oC).
The effect of each factor at the central point while keeping other factors constant is determined the
shape on the perturbation plot. A curvature or steep slope denotes sensitivity of the factors to the
response measured, while a straight line denotes insensitivity of the factor to the response
measured.
I. Effect of temperature
The perturbation plot (Figure 81) indicates that temperature had a curvature effect on the corrosion
current density of chromised 304 stainless steel in 0.5 M H2SO4 + 2 ppm HF at 70 oC. As
temperature increased from 1000 oC to 1050
oC, corrosion current destiny decreased after which it
gradually increased as temperature increased to 1100oC. For instance, at constant

186
Figure 81 Perturbation plot for corrosion current density.
activator content of 3 wt.% and time of 6 hours, corrosion current density of chromised stainless
steel produced at 1000 oC ( R6 in Table 2) was 1.00 x 10
-5 A/cm
2, however, when temperature
increased to 1100 oC, corrosion current density decreased to 2.05 x 10
-6 A/cm
2.
Examination of the surface morphologies of samples R6 and R1 shown in Figure 82 indicated
significant changes in the morphologies of the coatings as temperature increased. At 1000 oC, a
porous network-like structure matrix with small sized clusters is formed as shown in Figure 82(a),
The inset of Figure 82(a) shows the porous matrix of R6 at a higher magnification.

187
Figure 82 Surface morphologies of coatings produced at (a) 1000 oC (R6) and (b) 1100
oC
(R1) at 3 wt.% activator content and 6 hours. Inset shows R6 at magnification of 2 µm.

188
The porous matrix will facilitate electrolyte-substrate interaction thereby deteriorating the
corrosion resistance of R1. However, as temperature increased to 1100 oC, a compact surface with
bigger- sized clusters and large grain size of network carbide which can provide better corrosion
resistance than a porous coating was formed.
The enhancement of corrosion resistance as temperature increased from 1000 oC to 1100
oC can
also be attributed to the phases formed at the different temperatures [241]. Figure 83 presents the
XRD pattern of sample R6 and R1. The XRD patterns indicate that more nitrogen based
compounds were formed at 1000 oC than 1100
oC. This observation can be related to the diffusion
of chromium into the substrate at the chromising temperature. At 1000 oC, chromium diffusion
into the substrate is slower than at 1100 oC; hence the nitrogen released by the activator can react
with the un-diffused chromium at the surface to form chromium iron nitrides.
35 40 45 50 55 60
Rela
tive
In
ten
sity
, co
un
ts
Binding energy, eV
R1
R6
(Cr, Fe) N(1-x)
- (Cr,Fe)23
C6
- (Cr, Fe)
3C
7
Figure 83 XRD of chromised coating formed with process parameters specified for R6 and
R1.

189
II. Influence of time
It can be deduced from the perturbation plot in Figure 81 shows that time had a linear influence on
corrosion current density of chromised 304 stainless steel in 0.5 M H2SO4 + 2 ppm HF at 70oC.
This effect could be related to the surface morphologies of the coatings as time increased. Longer
duration of chromising treatment can facilitate higher coating thickness at constant temperature
and activator content as indicated by the thickness of the coatings in Table 18 and agrees with
Naiming et. al.’s work on chromising of low carbon steel [201]. The chromised coating formed is
more susceptible to defects such as voids pores and cracks as shown in Figure 84 for samples R12
and R17 pack-cemented for 3 hours and 9 hours respectively. These defects originate from the
difference in the inward diffusion rate of chromium and outward diffusion rate of carbon
(otherwise called Kirkendall effect). Coating defects are well known to compromise the anti-
corrosion properties of coatings [242, 243]. Hence, the coatings pack cemented for 9 hours
exhibited higher corrosion current destiny. Similar observation was reported by Cho et al. [25] for
chromised 316 stainless steels polarised in 0.5 M H2SO4 at 80 oC.

190
Figure 84 Surface morphologies of coatings formed at process parameters indicated by (a)
R12 and (b) R17.

191
III. Influence of activator content.
The perturbation plot shown in Figure 81 indicates that the influence of activator content on
corrosion current density of chromised 304 stainless steel in 0.5 M H2SO4 + 2 ppm HF at 70oC
is considerably low. This observation can be supported by the surface morphologies of sample
processed with process parameter specified by R12 and R13 (Figure 85). It can be seen that
similar surface morphologies were produced at 3 wt. % and 7 wt. % activator content. This
observation is consistent with previous studies on chromising of low carbon steel [19] and
suggests that the range of the activator content used in the study is within acceptable range for
pack cementation of stainless steels as it is reported that insufficient or excess amount of
activator content can facilitate coatings with high volume of pores [198].

192
Figure 85 Surface morphologies of coatings produced at 1100oC for 3 hours with powder
containing (a) 3 wt.% (R12) (b) 7wt% activator content (R13).

193
(IV) Interaction effect between temperature and activator content
The interaction effect between temperature and activator content as indicated by the corrosion
current density model given in Equation 38 is depicted graphically by the contour plot ( Figure
86) and the response surface plot (Figure 87).
Figure 86 Contonur plot showing the interaction between temperature and activator
content.

194
Figure 87 Response surface plots showing the interaction between temeprature and time.
It can be seen in Figure 86 and 87 that at low temperature (1000oC), increasing the activator
content from 3 wt. % to 7wt %, decreased corrosion current density. On the other hand,
increasing the activator content at high temperature showed a reverse inverse effect albeit,
marginally. An example of this interactive effect between temperature and activator content is
given in Figure 88.

195
Figure 88 Interaction plot showing interaction between temperature and activator content.
In Figure 88, it can be seen that at low temperature of 1000oC and activator content of 3 wt. % ,
corrosion current density was 1 x 10⁻⁵
A/cm2, however, as activator content increases to 7 wt. %,
corrosion current density decreased by about one order of magnitude. On the other hand, as
temperature increased to 1100oC, the effect of the activator content becomes less pronounced
causing a marginal decrease in corrosion current density as seen in Figure 88. This interaction
effect between temperature and activator content could be attributed synergy between the diffusion
rate of chromium and carbon at the chromising temperature.
Design-Expert® Software
Factor Coding: Actual
Original Scale
Corrosion current density (A/cm^2)
X1 = C: Temperature
X2 = B: Activator content
Actual Factor
A: Time = 6
B- 3
B+ 7
C: Temperature (degrees)
B: Activator content (Wt%)
1000 1020 1040 1060 1080 1100
Co
rro
sio
n c
urr
en
t de
nsi
ty (
A/c
m^2
)
0
2E-006
4E-006
6E-006
8E-006
1E-005
1.2E-005
Interaction

196
Figure 89 Surface morphology of (a) R1 and (b) R9.

197
Fast chemical kinetics and high diffusion rates engendered by a combination of high activator
content (7wt. %) and temperature (1100 oC) respectively promote formation of voids and cavities.
as seen in the surface morphology of R1 (Figure 89(a)). On the other hand, a combination of low
activator content (3 wt. %) and high temperature (1100 oC) promote a compact structure with
fewer pores and discrete particles of chromium nitrides (Figure 89 (b)). Similarly, slow chemical
kinetics and low diffusion rates facilitated by low activator content (3 wt.%) and low temperature
(1000 oC) engendered a porous network structure (Figure 90 (a)) which is susceptible to attack in
the aggressive PEM fuel cell environment. On increasing the activator content to 7 wt.%, the
porous nature of the morphology is still sustained but with a higher volume of chromium iron
nitride particles as seen in Figure 90 (b)). These observations are consistent with the fact that
insufficient or excess amount of activator content can facilitate coatings with high volume of pores
[199]; however, the interactive effect between temperature and activator content has not been
reported before now.

198
Figure 90 Surface morphology of R6 and (b) R3.

199
C. Process optimisation
Optimum condition for deposition of chromised coatings with minimum corrosion current density
in simulated PEM fuel cell environment of 0.5 M H2SO4 + 2 ppm HF at 70 oC within the
investigated experimental range was obtained by numerical simulation coupled with the
desirability function. This method determines the optimum condition by first locating the level of
each factor that can achieve the predicted response, after which the overall desirability is
maximised based on the set goals [195, 196]. The constraints applied for optimisation are as
shown in Table 21. Numerical simulation results predicted a set of solutions with desirability value
of 1; however, the condition selected by the software indicated that optimal process parameters
were: activator content of 6.84 wt.%, Time of 3.04 hours and Temperature of 1040oC, with a
predicted corrosion density value of 3.895 x 10⁻⁷
A/cm2
and thickness of 30.84 µm as shown in
Figure 91. Experiments to validate the model produced a ~30 µm chromised layer which had an
average corrosion current density value of 4.304 x 10⁻⁷
A/cm2 when polarised in aerated 0.5 M
H2SO4 + 2 ppm HF at 70 oC. In Figure 92, the Tafel plot of the optimised chromised stainless steel
and the substrate in the simulated PEM fuel cell environment are compared.

200
Table 21 Constraints for optimisation
Figure 91 Optimum conditions for minimum corrosion current density of chromised 304
stainless steel in 0.5 M H2SO4 + 2 ppm HF at 70 oC.
Factor
criteria
Lower
limit
Upper
limit
Importance
Time (hours) In range 3 9 3
Activator content
(wt.%)
In range 3 7 3
Temperature (oC) In range 1000 1100 3
Thickness (µm) In range 19.035 92.085 3
Corrosion current
density (A/cm2)
minimise 4.05x 10⁻⁷
1 x 10⁻⁵
5

201
Figure 92 Tafel plot for coating produced with optimal process parameters and the substrate
in 0.5 M H2SO4 + 2 ppm HF at 70 oC. Scanning rate = 1mV/s.
6.3 EVALUATION OF OPTIMISED CHROMISED COATING
(A) Surface characterisation
I. Surface Morphology and Composition
The surface morphology and chemical composition of the chromised 304 stainless steel produced
at optimal process parameters (afterward named Cr-304) is presented in Figure 93. The SEM
image (Figure 93(a)) revealed a granular surface morphology with surface micro-pores attributed
to the Kirkendall effect during solid state diffusion of chromium into the substrate at the
-10 -9 -8 -7 -6 -5 -4 -3
-0.4
-0.2
0.0
0.2
0.4
0.6
0.8
Po
ten
tial,
V v
s A
g/A
gC
l
log (Current density), A/cm2
substrate
optimised

202
chromising temperatures [25, 26, 182]. EDX composition analysis of the surface (Figure 93(b))
indicated that the chromised surface consisted primarily of chromium, carbon and nitrogen as well
as small amount of oxygen and iron. Trace amount of nickel and aluminium were also present. The
presence of Al is attributed to the alumina in the pack powder mixture while that of nitrogen is due
to decomposition of the NH4Cl activator. The presence of Fe in the EDX composition is due to the
fact that the coating is formed in a solution of iron [183,184]. Figure 94(a) presents the cross
sectional view of Cr-304. The coated layer was estimated to have a thickness of ~30µm (Figure
94 (b)).

203
Figure 93 Chromised coatings produced at optimised process parameters (a) Surface
morphology of the optimised coating (Cr-304) (b) EDX spectrum and average composition.

204
Figure 94 Chromised coatings produced at optimised process parameters (a) Cross-section
SEM image (b) EDX line scan of Cr-304.

205
II. X-ray photoelectron spectroscopy
Figure 95 presents the XPS survey spectra of Cr-304 before and after sputtering. The XPS
spectrum before sputtering revealed the presence of Cr, C, and O, however, on sputtering,
additional elements: N and Al were observed. Photoelectron peaks of Fe2p were not detected on
the outermost layer suggesting minimal concentration of Fe on the outermost layer in agreement
with Ralston et.al. [186] investigation on chromised 304 stainless steel produced by fluidised bed
CVD at 1000 oC for three hours. The presence of an Al2p peak at 74-75 eV confirms the presence
of alumina [218], as suggested by the EDX compositional analysis. Considering alumina and
adventitious carbon as contaminants, the estimated composition of the coatings given in Table 22
indicates that the Cr, N, C (carbide) content on the outermost layer increases as the sputtering time
increases while the concentration of oxygen and carbon decreases as sputtering time increases.
0 200 400 600 800 1000 1200
0
100000
200000
300000
Inte
ns
ity
, a
u
Binding energy, eV
Cr3p
Al2p
Cr2p
Cr2p3/2
Cr2s
C1sN1s
O1s
0s
60s
120s
OKLL
Cr2p
1/2
Figure 95 Survey spectrum of Cr-304 before and after argon ion sputtering.

206
Table 22 XPS parameters for composition and binding energy of Cr-304 with the sputtering
profile.
Time of
sputtering
(Seconds)
Cr
(*at. %)
C
(Carbide)
(*at. %)
C
Adventitious
(*at. %)
O
(*at. %)
N
(*at.%)
Fe
(*at. %)
0 1.06 - 88.56 10.44 - -
60 46.52 - 34.45 6.97 12.06 -
120 59.76 10.21 10.20 4.49 15.34 -
*at. %-atomic percentage
The chemical oxidation state of the major elements identified in Table 22 is presented in Figure
96. The C1s spectrum presented in Figure 96(a) indicates the presence of C-C and C=O bonds,
attributed to surface contamination, at ~284.5 eV and ~289 eV respectively before sputtering. On
sputtering for 1 minute, the C-C bonds was shifted to ~285 eV and its intensity was significantly
reduced, while the C=O bond was eliminated. A small intense peak attributed to chromium carbide
appeared at ~283 eV. However, on further sputtering, the C-Cr peak is shifted to 282.5 eV while
that of C-C is shifted back to 284.5 eV. The C-Cr bond is attributed to chromium carbide formed
by the reaction between the inwardly diffused chromium and the outwardly diffused carbon.
The O1s spectrum presented in Figure 96 (b) revealed the presence of Cr-OH bonds at ~532 eV,
Cr-O bonds at 530.4 eV before sputtering [218]. The Cr-OH bond is attributed to surface
contamination while the Cr-O bonds are due to surface oxidation.

207
526 528 530 532 534
Cr-OH
Cr-O-N
Binding energy, eV
Cr2O
3
(b) C=O
280 282 284 286 288 290
Inte
nsity
, cou
nts
0 minute
1 minute
2minutes
Binding energy, eV
Cr-C
C-C
C=O
(a)
C-C
572 576 580 584 588
Cr-Cr
Cr-C
Binding energy , eV
Cr-O
Cr-O-N
(d)
Binding energy
392 394 396 398 400 402 404
Inte
nsity
, cou
nts
Cr-N
Cr-N2
Cr-O-N
0 minute
1 minute
2 minutes
Binding energy, eV
Cr-N2
(c)
576 579 582 585 588
Inte
nsity
(a.
u)
A
0 2 4 6 8 10
0
2
4
6
8
10
Figure 96 XPS spectrum of (a) Carbon (b) Oxygen (c) Nitrogen and (d) Chromium in Cr-
304 after 0s, 60s and 120s of sputtering. Inset of (d) shows the Cr2p before sputtering.

208
After 60 seconds of argon ion sputtering, the wide nature of the O1s spectrum indicate the
presence of Cr-O bonds, Cr-O-N and Cr-OH bonds sat 530.4 eV, 531.2 eV and 532 eV
respectively [116, 117, 118-120]. The Cr-O-N bonds are attributed to chromium nitrides in oxygen
environment otherwise called chromium oxynitride. These types of nitrides are formed due to the
similarilty in the crystallographic structure of CrN and Cr2O3. Hence, their electrical conductivity
depends on the oxygen content and range between that if CrN (~5.5 x 10⁻¹
S/cm at room
temperature) and Cr2O3 (~1.8 x 10⁻⁷
S/cm at room temperature) [244]
The N1s spectrum shown in Figure 96 (c) established the presence of three types of Cr-N bonds
attributed to Cr (O)x Ny , CrN and Cr2N at 398.4 eV, 396 eV and 397.3 eV respectively in
agreement with binding energies reported for chromium nitrides [116, 218-220, 244, 245].
Chromium nitrides are formed from the reaction between chromium and nitrogen decomposed
from the activator.
Figure 96 (d) displays the Cr2p spectrum for the outermost layer of Cr-304. The presence of Cr2p
peaks at ~577 eV and ~586 eV as shown in the inset of Figure 96 (d) establishes the presence of
chromium oxide and hydroxide respectively before sputtering [218]. After sputtering, the presence
of chromium-oxy-nitrides confirmed by Cr2p peaks at 573.9 eV and 583.3 eV [219, 220], while
that of chromium carbide is established by Cr2p peaks at 573.9 eV and 583.3 eV [235, 236].
III. Glancing incidence angle XRD
Figure 97 displays the glancing incidence XRD (GXRD) patterns of Cr-304 at 0.5-5o. The GXRD
patterns indicates the presence of (Cr, Fe)23 C6, (Cr, Fe)3C7 and (Cr, Fe)2N1-x (where x = 0 - 0.5)
phases at incidence angle of 5o. No austenite phase was detected at this depth as the thickness of
the coating was higher than the depth of X-ray penetration (10µm). As incidence angle decreases

209
from 5o
to 2o, intensity of (Cr, Fe)3C7 peaks gradually diminished and finally disappeared at an
incidence angle of 1o, suggesting that only (Cr, Fe)23 C6 and (Cr, Fe)2N1-x phases are present on the
outermost layer. A similar observation was reported by Lee et al. [246] for chromised Fe–Mn–Al–
Cr alloy.
40 50 60 70 80 90
Inte
nsi
ty,
a.u
2hetadegrees
- (Cr,Fe)23
C6
- (Cr,Fe)2N
1-x
- (Cr,Fe)7C
3
Figure 97 Glancing incidence angle XRD of Cr-304.
It can be further observed in Figure 97 that peaks due to alumina are absent in contrast to the XPS
and EDX results. The absence of alumina peaks can be ascribed to very low concentration of
alumina compared to that of the nitrides and carbides.
From the SEM/EDX, XPS and XRD results presented above, it can be concluded that the
outermost layer of Cr-304 consist majorly of chromium iron nitrides, chromium iron carbide and
chromium iron oxide. This analysis is in agreement with previous works on chromised stainless
steels [25-28, 246].

210
(B) Electrochemical Polarisation
I. Potentiodynamic polarisation
Figure 98 (a) and (b) shows the potentiodynamic polarisation curves for Cr-304 and SS304 in 0.5
M H2SO4 + 2 ppm HF at 70 oC with air and hydrogen gas bubbling to simulate PEM fuel cell
cathode and anode environments respectively. The corrosion parameters obtained for both Cr-304
and the substrate (SS304) are presented in Table 23. From the corrosion potential ( 𝐸𝑐𝑜𝑟𝑟 ) and
corrosion current density ( 𝑖𝑐𝑜𝑟𝑟 ) values in Table 23, it can be deduced that in both environments,
Cr-304 exhibited higher 𝐸𝑐𝑜𝑟𝑟 and lower 𝑖 𝑐𝑜𝑟𝑟 values compared to SS304, thus, implying that
chromising treatments improved the corrosion resistance of the substrate in agreement with
previous studies [25-29].
In the simulated cathode environment (Figure 98 (a)), both Cr-304 and SS304 exhibit similar
passive –transpassive behaviours. It can also be seen from Figure 98 (a) that at typical PEM fuel
cell cathode working potential of 0.6 V, both Cr-304 and SS304 are within the passive region. On
the other hand, at the anode potential Cr-304 the open circuit potential of Cr-304 is close to the
anode PEM fuel cell working potential while SS304 is still within the passive region in the
simulated anode environment. Furthermore, in the anode environment, SS304 exhibited an active
region of dissolution after which it experienced similar passivity behaviour with Cr-304 within a
potential range of ~-0.1 V to +0.9 V. The improvement in corrosion behaviour of Cr-304
compared to SS304 in both oxidising and reducing environments is

211
1E-9 1E-7 1E-5 1E-3-0.4
0.0
0.4
0.8
1.2
Po
ten
tia
l, E
vs A
g/A
gC
l, V
log (current density) , A/cm2
SS304
Cr-304
(a)
Cathode working
potential,
0.6 V vs, Ag/AgCl
1E-9 1E-7 1E-5 1E-3
-0.4
0.0
0.4
0.8
1.2
Po
ten
tia
l (A
g/A
gC
l),
V
log (current density), A/cm2
SS304
Cr-304
Anode working potential,
-0.1V vs. Ag/AgCl
(b)
Figure 98 Potentiodynamic polarisation of Cr-304 and SS304 in 0.5 M H2SO4 + 2 ppm HF at
70 oC (a) air bubbled (b) hydrogen bubbled into the electrolyte, scan rate = 1 mV/s.

212
Table 23 Corrosion parameters of SS304 and Cr-304 in simulated PEM fuel cell
environments.
Material
𝑬𝒄𝒐𝒓𝒓
(V vs Ag/AgCl)
𝒊𝒄𝒐𝒓𝒓
(µA/cm2)
Cathode
Anode
Cathode
Anode
Cr-304
-0.52
-0.13
0.47
1.12
SS304 -0.17 -0.25 5.38 60.10
attributed to the presence of chromium nitrides and carbides on the chromised layer as revealed by
XPS and XRD results.
III. Potentiostatic Polarisation
Potentiostatic Polarisation curves for Cr-304 and SS304 under simulated PEM fuel cell cathodic
and anodic conditions are presented in Figure 99. In simulated cathodic conditions of 0.6 V and air
bubbling (Figure 99), both materials experienced an initial current decay as soon as the potential
was applied. The current decay is related to the formation of passive oxide and is consistent with
the potentiodynamic polarisation result, wherein both materials are within the passive region at 0.6
V. After the current decay, SS304 stabilised at ~ 20 µA/cm2 and Cr-304 at ~2 µA/cm
2,
representing an order of magnitude reduction in corrosion current density of SS304.

213
0 30 60 90 120 150 180
0.0
5.0x10⁻⁶
1.0x10⁻⁵
1.5x10⁻⁵
2.0x10⁻⁵
2.5x10⁻⁵
3.0x10⁻⁵
SS304
Cr-304
(a)
Time, minutes
Cu
rre
nt
de
nsity,
A/c
m2
0 30 60 90 120 150 180
0.0
2.0x10⁻³
4.0x10⁻³
Cu
rre
nt d
en
sity, A
/cm
2
Time, minutes
SS304
Cr-304
(b)
Figure 99 Potentiostatic polarisation of Cr-304 and SS304 in 0.5 M H2SO4 + 2 ppm HF at
70 oC in simulated PEM fuel cell (a) cathodic environment, E = 0.6 V vs. Ag/AgCl (b) anodic
environment, E= -0.1 V vs. Ag/AgCl. Scan rate = 1 mV/s.
214
At the anode, Cr-304 exhibited low current density stabilising at -6 µA/cm2 after 180 minutes of
polarisation. On the other hand, SS304 stabilised at about 161 µA/cm2 within the 100 minutes of
polarisation after which it finally stabilised at about 10.5 µA/cm2
(Figure 99 (b)).
Comparing the corrosion performance of Cr-304 in 0.5 M H2SO4 + 2 ppm HF described above
with other published work on chromised stainless steel without pre-treatments [37-41] as shown in
Table 24. It can be seen that Cr-304 exhibited remarkable reduction in corrosion current density
compared to untreated chromised stainless steel (No. 2-4 in Table 24), while it showed comparable
performance with pre-treated and chromised SS316L and 420 stainless steels (No. 5 & 6 in Table
24).The improved performance of Cr-304 is attributed to a thicker chromised layer and the
beneficial effect of the optimisation via design of experiment approach.

215
Table 24 Comparison of the performance of Cr-304 with published works on chromised
stainless steels for PEM fuel cell bipolar plate application.
S/N
Chromised stainless steel
(processing conditions)
Potentiostatic polarisation current density
Ref.
Cathode
Anode
1. SS304 (1040 o
C, ~3 hours) 2-5 µA/cm2
(3 hours @ 70
oC)
- 6 µA/cm2
(3 hours @ 70 oC)
Present
study
2.
SS316
(1050 oC, 2.5 hours )
-
10 µA/cm
range
(4 hours@ 80 oC)
26
3.
SS316
(1100 oC, 2.5 hours)
10 µA/cm2
(4hrs@ 80oC)
-
25
4.
SS316
(1100 oC, 3 hours)
10 µA/cm2
(3 hours @ 70
oC)
0.1 µA/cm2
(3 hours
@ 70 oC )
27
5.
SS316
( shot peened + 900 oC, 3 hours)
10 µA/cm2
(3 hours @ 70 o
C)
0.01 µA/cm2
(3 hours)
27
6.
SS420
(Rolling + 700 oC, 2 hours)
5 µA/cm2
(1 hours @ 80 0C)
-
28

216
(C) Interfacial contact resistance
Figure 100 displays the ICR of Cr-304 and SS304 as a function of compaction pressure. For both
materials, ICR decreases as compaction pressure increases due to increasing contact area between
the carbon paper and the metal samples. Cr-304 exhibited an order of magnitude decrease in ICR
compared to SS-304 within the range of compacting pressure investigated signifying the beneficial
effect of chromising on surface conductivity of SS304.
Figure 100 ICR of Cr-304 and SS304 as a function of compaction pressure.
At the compaction pressure range of interest for PEM fuel cell applications (i.e. 100-200 N/cm2)
[115, 116], SS304 exhibited ICR values in the range of 195.7-114.9 mΩ/cm2
while Cr-304
exhibited ICR values in the range of 35.1-19 mΩ/cm2. Furthermore, at typical PEM fuel cell
compaction pressure of 150 N/cm2, Cr-304 exhibited ICR value of 24 mΩ.cm
2 while that of the
0 50 100 150 200 250 300
-100
0
100
200
300
400
500
600 SS304
Cr-304
IC
R ,
m
.cm
2
Compaction Force, N/cm2

217
substrate was 143.29 mΩ/cm2. Reduction of ICR values after chromising treatments is ascribed to
the conductivity of chromium nitrides and carbide on the outermost layer of Cr-304. As shown in
the XPS analysis (Figure 96), the outermost layer of Cr-304 consisted of a mixture of chromium -
carbide, nitrides, and oxides. Carbides and nitrides are well known to be more electrically
conductive than naturally occurring surface oxides of the substrate, which consist primarily of iron
oxide and chromium oxide [21, 64-66].
Tables 25 and 26 presents the ICR values for 304 and chromised stainless steels reported in the
literature. Comparing these ICR values with that obtained for SS304 and Cr-304, it can be seen
that the ICR values of SS304 and Cr-304 at typical PEM fuel cell compaction pressure were higher
than ICR values reported in the literature. This increase can be attributed to the PTFE loading of
the Toray carbon paper employed for the ICR measurement. It is well reported that increasing the
PTFE loading on the GDL material increases the contact resistance measured between the bipolar
plate and the GDL [57- 60]. In particular, Ismail et al. [59] reported about 50% increase in ICR of
graphite plates when the PTFE loading of the carbon paper changed from 0% to 20-30 wt.%. It is,
however, noted that previous work on chromised stainless steels did not specify the PTFE loading
of the carbon paper employed for ICR measurements. Hence, it can be deduced from Figure 101,
which compares the ICR of SS316 reported in Figure 75 with that of SS304 in Figure 100, that the
increase in ICR values of SS304 and Cr-304 compared to that of the literature can be attributed to
the nature of the carbon paper.

218
Table 25 ICR of 304 stainless steel in the litreature
Material
ICR (mΩ.cm2)
Ref.
304/304L stainless steel
~100 @ 150 N/cm2
132, 149
Table 26 ICR of chromised stainless steel in the litreature
S/ N
Chromised stainless steel
(deposition temperature and time)
ICR
(mΩ.cm2)
Ref.
1.
SS316
(1050 oC, 2.5 hours)
17.0 @ 150 N/cm2
[26]
2.
SS316
(1100 oC, 2.5 hours)
~17.0 @ 150 N/cm2
[25]
3.
SS316
(1100 oC, 3 hours)
17.0 @ 200 N/cm2
[27]
4.
SS316L
( shot peened + 900 oC, 3 hours)
15.0 @ 200 N/cm2 [27]
5.
SS420
(Rolling + 700 oC, 2 hours)
10.2 @140 N/cm2 [28, 29]
6.
SS430
(Rolling + 700 oC,2 hours)
11.6 @140 N/cm2 [29]
7.
SS316
( Rolling + 700 oC, 2 hours)
11.1 @140 N/cm2
[29]

219
100 120 140 160 180 200
50
100
150
200
250
300
ICR
, m
..c
m2
Compaction pressure, N/cm2
SS304 (20% PTFE loading)
SS316 (5% PTFE loading)
Figure 101 Comparison of ICR of SS316 in Figure 75 and SS304 in Figure 100 in order to
show the influence of PTFE loading of the Toray carbon paper (T-GH-90) on ICR.
(D) Single Fuel Cell Performance Evaluation of the Optimised Chromised 304 Stainless
Steel.
Figure 102 displays the polarisation and power density curves of the single fuel cells assembled with
Cr-304 and the substrate (SS304) bipolar plates. The open circuit voltage (OCP) for Cr-304 and SS304
was 0.92 V and 0.85 V respectively. As current density increased, the beneficial influence of the
chromised coatings becomes evident as the voltage of SS304 decreased rapidly compared to that of the
coated plates. The single fuel cell with Cr-304 bipolar plates attained a maximum power density of 8.47
mW/cm2
at a current density of 21.60 mA/cm2
representing a two-fold increase in the maximum power
density of the single fuel cell with SS304 bipolar plates as shown in Table 27.

220
Figure 102 Single fuel cell performance of Cr-304 and SS304 bipolar plates
Table 27 Peak power data for the single cells with coated and uncoated stainless steel and the
corresponding ICR at 125 N/cm2.
Material
Maximum
Power density ( mW/cm2)
Current density,
mA/cm2
ICR (mΩ.cm2)
@ 125 N/cm2
SS304
4.21
10.00
163.7
Cr-304 8.47 21.60 29.0
It can also be seen in Table 27 that the performance of the single fuel cells with Cr-304 and SS304
bipolar plates was consistent with their ex-situ ICR values. This result is in agreement with the

221
literature, wherein it is reported that the performance of the single fuel cell is dependent on the
ICR of the material for the bipolar plate [91, 112, 149]. Therefore, the improvement in the
performance of the single fuel cell with Cr-304 bipolar plate over that of the single fuel cell with
SS304 bipolar plates can be attributed to the lower contact resistance between the bipolar plates
and the gas diffusion layer given that both single fuel cell were assembled with identical MEAs
and operated under identical conditions.
6.4 SUMMARY
The influence of selected process parameters (time, activator content and temperature) on the
corrosion current density of pack-chromised 304 stainless steel in simulated PEM fuel cell
environment of 0.5 M H2SO4 + 2 ppm HF at 70 oC was systemically investigated using Box–
Behnken design. The temperature, at which the coating was deposited, was found to be the most
significant process parameter influencing the corrosion current density of pack-chromised 304
stainless steel in the investigated environment. However, an interaction effect exists between
temperature and the activator content.
Optimisation of process parameters via numerical simulation and the desirability function revealed
that the optimal process parameters to obtain chromised coatings with the minimum corrosion
current density were time of ~3 hours, activator content of 6.84 wt.% and temperature of 1040oC.
SEM/EDX, XPS and XRD characterisation of the chromised coatings indicated that the optimised
coating consisted of a mixture of chromium-carbides, nitrides and oxides. Potentiodynamic and
potentiostatic polarisation at typical cathodic and anodic PEM fuel cell operating potentials and
environments indicated better corrosion resistance than the substrate in the selected PEM fuel cell
environment. The optimised coating exhibited a low transient current density of ~2 µA/cm2 and

222
–6 µA/cm2 in the cathode and anode environments respectively, as well as about six fold decrease
in ICR of the substrate at 150 N/cm2 which was found to be 143.2 mΩ.cm
2.
Performance evaluation of single fuel cells assembled with bipolar plates coated with the
optimised process parameters and bare 304 stainless steel indicated that the single fuel cell with
the optimised coated bipolar plates attained maximum power density of 8.47 mW/cm2 at current
density of 21.60 mA/cm2.On the other hand, the single fuel cell with the uncoated plates attained
maximum power density of 4.21 mW/cm2 at current density of 10.00 mA/cm
2. The improvement
in power out-put of the cell with the coated bipolar plates over that of the cell with the uncoated
plates was attributed to the lower contact resistance of the optimised chromised coating compared
to that of the substrate.

223
Chapter 7
Pre-carburised And Chromised Coatings
7.1 INTRODUCTION
This chapter reports preliminary attempts to improve the single fuel cell performance of the
coatings produced at the optimised process parameters. As seen in the last chapter, the single fuel
cell performance showed a correlation with the ex-situ ICR values, thereby suggesting that cell
performance could be improved by reducing ICR. Furthermore, post-modification of CoBlast™
coated stainless steel also suggested that a carbon-rich layer deposited before or after could reduce
the ICR of chromised coating. Hence, in this chapter, a carbon rich layer was deposited by pack
carburisation prior to chromising at the optimised process conditions and its performance in
simulated and real PEM fuel cell environments was reported. As indicated earlier in Chapter 3,
pack carburising is no longer commercially viable as it has been replaced by more controllable
techniques such as gas and plasma carburising; however, it was adopted in this study for ease of
application.
7.2 PRE-CARBURISATION AND CHROMISING PROCESSING OVERVIEW
Table 28 presents an overview of the carbon mass uptake after pack-carburisation at 925 oC for 1-3
hours and subsequent chromium mass uptake after chromising treatments at the optimised
processing parameters (i.e. activator content of 6.78 wt.%, time of ~3 hours and temperature of
1040 oC. The samples are hereafter named CPC-304-1, CPC-304-2, and CPC-304-3 with the last
digit representing the time of carburisation. It can be inferred from Table 28 that increasing the
carburising time resulted in a corresponding increase in carbon mass uptake. However, the
concentration of diffused chromium into the carburised steel depended on the amount of carbon

224
content in the carburised steel. This observation is attributed to the formation of chromium
carbides at chromising temperatures. It is reported that the chromium carbide layer formed during
chromising treatment limits the diffusivity of chromium. Hence, the reduced thickness with higher
carbon content as seen in Table 28 [246-248].
Table 28 Mass gain by SS304 after carburising for 1-3 hours and subsequently chromising
at 1040 oC for ~ 3 hours
Material
Time
of
carburisation
Mass gain
mg/cm2
after
carburisation
Time of
chromising
mass gain
after
chromising
(mg/ cm2)
*Average
Thickness
(µm)
CPC-304-1
1
6
3
19.8
16
CPC-304-2
2
14
3
12.6
11
CPC-304-3
3
18
3
12.1
10
*Thickness measured using SEM line measurement tools and EDX line scan
7. 3 SURFACE CHARACTERISATION
(A) Carburised stainless steel
Figure 103 shows the locked coupled XRD pattern for 304 stainless steel pack carburised at 925
oC for 3 hours. The XRD pattern of the untreated stainless steel is also shown for reference. The
XRD pattern for bare 304 stainless steel (SS304) indicates the presence of austenite and strain-
induced martensite as commonly reported for 304 stainless steels [123, 249,250]. Strain induced

225
martensite in SS304 is related with processing or fabrication route for the 304 stainless steel sheet.
After carburising, peaks due to cementite (Fe3C) and thermal induced martensite can be observed.
Martensite is attributed to fast cooling from austenitic temperatures while cementite is attributed to
diffusion of carbon into the Fe matrix during carburising [204].
35 40 45 50 55 60 65 70 75 80
Fe - strain induced martensite
Fe
Fe
Binding energy, eV
Re
lative
In
ten
sity,
au
Bare 304 stainless steel
Carburised 304 stainless steel
Fe
Cementite(Fe3C)
-Fe -austenite
Fe
Figure 103 XRD of CPC-304-3 carburised at 925 oC for 3 hours.
Figure 104 shows the cross-section of 304 stainless steel pack carburised at 925 oC for 3 hours.
EDX composition of the surface indicated that > 70% carbon, 24% oxygen and 5% iron were
present. High oxygen content in the carburised surface is attributed to surface oxidation during
carburisation as commonly reported for carburised steels [192,193]. Although carbon
concentration measured by EDX may not be a true representation of the carbon content, the high
carbon concentration compared to other elements and corresponding increase in mass after
carburising as shown in Table 28, confirms a carbon enriched surface.

226
Figure 104 Cross-section of 304 stainless steel carburised at 925 oC for 3 hours
(B) Pre-carburised and chromised AISI304 stainless steel.
I. Surface morphology
Figure 105 (a) to (c) presents the surface morphologies of the CPC-304 samples. All samples
irrespective of carburising time have similar morphologies consisting of discrete particles of Cr-N-
C rich phase buried in a Cr-C rich matrix (Figure 106). The EDX spectrum of the surface shown in
Figure 106 suggests that the discrete particles are either chromium nitrides or chromium carbo-
nitrides. It is possible that the carbon content in the discrete particles is from the matrix given the
limited depth of penetration of EDX. In any case, nitrogen is introduced into the system from the

227
Figure 105 Surface morphology of (a) CPC-304-1(b) CPC-304-2 (c) CPC-304-3.

228
Figure 106 SEM image and EDX spectrum of CPC-304 (a) discrete particles (b) matrix.
decomposition of the ammonium chloride activator, thus, creating a favourable environment for
formation of chromium nitrides or carbo-nitrides. Also noticeable in Figure 106 is the presence of
micro-pores attributed to the Kirkendall effect during solid state diffusion of chromium into the
carburised samples at high temperatures. The cross-sectional SEM images and EDX mapping of
the pre-carburised and chromised samples are shown in Figure 107. The EDX maps showed that
the surfaces of the coatings were enriched with chromium.

229
Figure 107 (a) Cross-section and EDX colour map of (a) CPC-304-1(b) CPC-304-2 (c)
CPC-304-3.

230
II. XRD phase analysis
Figure 108 shows the glancing XRD patterns of CPC-304 samples at incidence angle of 5o. The
XRD patterns at this depth of sampling show that similar phases were formed in the three samples
irrespective of the carbon content. The phases formed chromium nitrides (Cr2N), chromium
carbide (Cr2C3, Cr23C6, and Cr3C7). Previous studies on pre-carburising and chromising of 316
sintered stainless steel had reported the absence of chromium nitrides [251] while Hosmani et al.
[193 ] didn’t indicated the existence of chromium nitride in the XRD pattern of pre-carburised and
chromised low carbon steel. This observation in the literature could be attributed to the
overlapping of chromium nitrides and chromium carbides peaks or a very small concentration of
chromium nitrides making it difficult to detect by locked coupled XRD.
35 40 45 50 55 60
CPC-304-1
CPC-304-2
CPC-304-3
Inte
nsi
ty,a
.u
Difraction angle, 2 theta
- Cr2N - Cr
7C
3 - Cr
23C
6
Figure 108 Glancing incidence XRD of CPC-304 stainless steels at 5o.

231
Also, Iorga et al. [251] had reported the presence of Fe3C in pre-carburised and chromised sintered
316 stainless steels using conventional XRD which has a depth of penetration of about 10 µm.
However, Fe3C was not detected using grazing XRD, a surface sensitive XRD technique. Hence, it
is possible that Fe3C is buried at higher depths within the sample.
Comparing the phases formed in CPC-304 stainless steels to that formed in Cr-304 (Figure 97), it
can be seen that the chromium carbides formed in Cr-304 were formed in solid solution of iron;
hence, they are called chromium iron carbides. These types of carbides are formed due to the low
carbon content of stainless steels. However, with increased carbon content as in the case of CPC-
304 stainless steels, hard chromium carbides are formed.
(III) XPS
The XPS survey spectrum for CPC-304-1, CPC-304-2 and CPC-304-3 is presented in Figure 109.
The spectrum indicates the presence of Cr, C, O, N and Al in all CPC-304-3 stainless steels
irrespective of time of carburisation. It can also be seen in Figure 109 that Fe 2p peak was not
detected on the outermost layers of the CPC-304 samples, thus, implying negligible concentration
of iron on the CPC-304 stainless steels.

232
Figure 109 XPS survey spectrum for CPC-304 samples after 150 seconds of sputtering.
Figure 110 shows the core-level spectra of Cr2p, N1s, C1s and O1s for the outermost layer of
CPC-304 samples after 150 seconds of sputtering. The Cr2p spectrum (Fig. 110 (a)) indicates the
presence of Cr-C, Cr-N and Cr-O bonding in all samples irrespective of time of carburisation. The
Cr2p3/2 shoulder cantered at a binding energies of ~574.2 eV in CPC-304-1 and the Cr2p3/2 peak at
~574.6 eV in CPC-304-2 and CPC-304-3 are ascribed to chromium iron carbides and chromium
carbides respectively [218, 235, 236]. The presence of chromium nitride is established by the Cr-N
bond with Cr 2p3/2 shoulders at 575.5 eV [219, 220]. The broad nature of the Cr2p3/2 peak at 576.0-
578.0 eV is indicative of chromium oxide in +3 and +4 oxidation state [219, 220, 244, 245]. The
0 200 400 600 800 1000
CPC-304-3
CPC-304-2
Rela
tive inte
nsity,
a.u
Binding energy, eV
C1s
O1s
Cr2p
Al2p
N1s
Cr3p
Cr2sOKLL
CPC-304-1

233
572 576 580 584 588
1000
2000
3000
4000
5000
Binding energy, eVIn
tens
ity, a
u
Inte
nsity
, au
Binding energy, eV
CPC-304-1
CPC-304-2
CPC-304-3
Cr2p
(a)
392 394 396 398 400 402 404
400
600
800
1000
CPC-304-1
CPC-304-2
CPC-304-3
Cr-N
Cr-N2
Cr-O-NN1s
(b)
C-N
Cr-C
Cr-C
Cr-N
Cr-O
528 530 532 534 536 5380
1000
2000
3000
4000
Inte
nsi
ty, a.u
280 282 284 286 288 290 292
0
500
1000
1500
2000
2500
3000
CPC-304-1
CPC-304-2
CPC-304-3
C1s
(d)
C-C
C-Cr
C-N
C=O
C=N
Binding energy, eV
Inte
nsi
ty, a.u
Binding energy, eV
CPC-304-1
CPC-304-2
CPC-304-3O1sCr-O-N
Cr-O
(c)
C=O
Figure 110 XPS analysis of CPC-304 samples (a) N1S (b) O1s spectrum.

234
possibility of co-existence of chromium oxide in different oxidation state is related to the small
difference in their standard Gibbs free energy of formation per g-atom Cr – ( Cr2O3 – 569 kJ/mol,
CrO3 - 589.9 kJ/mol) [245].
The N1s spectrum shown in Figure 110 (b) indicates the presence of three types of nitrides: CrN
at binding energy of 396.75 eV, Cr2N at binding energies of 397.45 eV and chromium oxy nitrides
(CrOxNy) at binding energy of (398.02 ±0.3 eV) [219, 220, 244, 245]. The broad nature of the N1s
spectrum between 398.5-403.0 eV for CPC-304-1 stainless steel suggest the presence of different
nitrogen bonding to carbon e.g. - pyrrolic N (398.8 eV), quaternary N (400.2 eV), and oxidised N
(401.3 eV) [252, 253].
Figure 110 (c) shows the O1s spectrum of CPC-304 samples. The O1s spectrum establishes the
presence of chromium oxide at binding energy of 530.5 ± 0.3 eV, chromium oxy nitrides at
binding energy of 531.4 ± 0.2 eV and oxygen contribution from organic carbon at ~533.0 eV
[219, 220, 244, 245].
The C1s spectrum shown in Figure 110 (d) indicates the presence of chromium carbides at binding
energies of 282.3 eV and 283.6 eV for CPC-304-1, 282.8 – 283.2 eV for CPC-304-2, 282.8 - 283.7
eV for CPC-304 [218, 235, 236]. The broad nature of the C1s spectrum for CPC-304-2 and CPC-
304-3 is indicative of different types of chromium carbides. It is noted that C-Fe bonding in iron
carbide exist at a binding energy of ~283.6 eV [218]. However, the non- existence of iron carbide
at the outermost layer is further established with the absence of Fe2p peak in Figure 111. The C1s
peak at 284.9-285.7 eV in the CPC-304-samples is assigned to adventious carbon while the peak at
286.2 eV and shoulders at ~287 eV and 299.0 eV is attributed to contributions from carbon
nitrides and organic carbon respectively [218].

235
700 705 710 715 720 725 730 735
1000
1500
2000
2500
3000
3500
4000
Inte
nsity (
a.u
)
Binding energy, eV
CPC-304-1
CPC-304-2
CPC-304-3
Fe2p
Figure 111 Fe2p core level spectra for pre-carburised and chromised CPC-304 samples
7.4 Interfacial contact resistance.
The interfacial contact resistance (ICR) of the CPC-304 stainless steel samples as a function of
compaction pressure is presented in Figure 112. At typical compaction force of 150 N/cm2
as
marked in the inset of Figure 112, ICR of the CPC-304 samples is given as 20.35 mΩ.cm2, 16.10
mΩ.cm2 and 10.85 mΩ.cm
2 for CPC-304-1, CPC-304-2 and CPC-304-3 respectively. This trend is
consistent with the carbon content of the samples presented in Table 28 i.e. the higher the carbon
content of the CPC-304 stainless steels, the lower the ICR values. The decrease in ICR values of
CPC-304 samples as carbon content decreased can be attributed to increasing concentration of
chromium carbide and nitride on the outermost layer evidenced by increasing intensity of these
compounds as time of carburisation increased from 1-3 hours Figure 110 (b) and (d).

236
50 100 150 200 250 300
0
10
20
30
40
50
ICR
, mc
m2
Compaction pressure, N/cm2
CPC-304-3
CPC-304-2
CPC-304-1
100 125 150 175 200
10
20
30
40
ICR
, m
..c
m2
Binding energy, eV
Figure 112 Interfacial contact resistance of CPC-304 stainless steels as a function of
compaction pressure.
Comparison of the ICR values of the CPC-304 samples to that of Cr-304 suggest that increasing
the carbon content of chromised coatings could decrease ICR of chromised coatings. This
observation is consistent with recent reports by Wang et al. [135, 136]. The authors demonstrated
that increasing the carbon content of chromium electroplated coatings by decreasing the current
density at which the coatings were deposited resulted in a corresponding decrease in ICR.
7.5 CORROSION BEHAVIOUR EVALUATION
Figure 113 (a) and (b) shows the potentiodynamic polarisation curves of CPC-304 samples in 0.5
M H2SO4 + 2 ppm HF at 70 oC with hydrogen and air bubbled through the electrolyte to simulate

237
1E-8 1E-7 1E-6 1E-5 1E-4 1E-3
-0.4
-0.2
0.0
0.2
0.4
0.6
0.8
1.0
1.2
CPC-304-3
CPC-304-2P
ote
ntia
l, V
(vs A
g/A
gC
l)
Current density, A/cm2
CPC-304-1
Anode potential,
0.1 V vs Ag/AgCl
(a)
1E-8 1E-7 1E-6 1E-5 1E-4 1E-3 0.01
-0.9
-0.6
-0.3
0.0
0.3
0.6
0.9
1.2
1.5
Po
ten
tia
l, V
vs A
g/A
gC
l
Current density, A/cm2
CPC-304-1
CPC-304-2
CPC-304-3
(b)
Cathode potential,
0.6 V vs Ag/AgCl
Figure 113 Potentiodynamic curves for CPC-304 samples in simulated PEM fuel cell (a)
anodic and (b) cathodic environment.

238
PEM fuel cell anodic and cathodic conditions respectively. The corrosion parameters derived from
these curves are presented in Table 29. It can be seen from the polarisation curves and corrosion
parameters that the CPC-304 samples exhibited similar corrosion potentials, corrosion currents and
passive-transpassive behaviour in simulated PEM fuel cell anodic environment.
Table 29: Corrosion parameters of CPC-304 samples in 0.5 M H2SO4 + 2 ppm HF at 70 oC
Material
𝑬𝒄𝒐𝒓𝒓
(V vs Ag/AgCl)
𝒊𝒄𝒐𝒓𝒓
(µA/cm2)
Anode
Cathode
Anode
Cathode
CPC-304-1 0.19 -0.12 2.46 3.33
CPC-304-2 -0.20 -0.26 1.08 94.60
CPC-304-3 -0.18 -0.12 1.37 3.74
A similar trend was observed in the cathodic environment with the exception of the CPC-304-2
sample which exhibited double anodic nose, probably due to instability at open circuit potential or
different reduction processes occurring at different potentials [212]. At typical cathodic and anodic
PEM fuel cell working potential which are marked in Figure 113, it can also be seen that the CPC-

239
304 stainless steels exhibited similar performance, signifying that the carbon content had a
negligible influence on the corrosion performance of the stainless steels.
Comparing these results to those obtained for Cr-304 in Table 23, it can be seen that pre-
carburising prior to chromising adversely degraded the corrosion resistance of Cr-304 which can
be explained by:
a) Pack carburising of austenitic stainless steel at temperatures >550 oC promoted the
formation of chromium carbides at the grain boundaries. Consequently the Fe matrix was
devoid of chromium and corrosion resistance was degraded i.e. the steel was sensitised.
However, a subsequent chromising treatment could potentially restore chromium to the Fe
matrix such that the CPC-304 samples will essentially behave like the original stainless steel
as seen in this study and reported in Iorga et al. [251]. However, because diffusion of
chromium is restricted by the carbon rich surface when chromium carbide is formed. Hence,
the post-chromising process may not adequately restore the steel to its former corrosion
resistance state depending on the chromising process parameters.
b) The presence of micro-pores in CPC-304 samples could also contribute to its lower
corrosion resistance compared with Cr-304. Defects such as micro-pores, which serve as
channels for environment-substrate interaction in the corrosive environment, are
unavoidable in diffusion coatings due to the diffusion gradient created by the slow diffusion
of chromium compared to carbon otherwise known as the Kirkendall effect.
c) Defects such as micro-pores in CPC-304 stainless steels would also contribute to its lower
corrosion resistance. Defects in coatings are well known to facilitate environment-substrate
interaction in corrosive environments. However, defects such as micro pores are

240
unavoidable in diffusion coatings due to the diffusion gradient created by the slow diffusion
of chromium compared to carbon otherwise known as the Kirkendall effect.
d) Loss of corrosion resistance of CPC-304 stainless steels compared to chromised stainless
steel could also be attributed to the presence of discrete chromium nitride particles,
untransformed iron carbide and buried martensite in the CPC-304 stainless steels. These
features in the coatings can facilitate galvanic corrosion between the substrate and the
coatings [109, 115, 251].
Nevertheless, the corrosion resistance of CPC-304 stainless steels could potentially be alleviated
by:
(a) Carburising at low temperatures via gas and/or plasma carburising.
It is reported that low temperature carburisation at < 500 oC by gas and plasma carburisation can
facilitate the formation of carbon expanded austenitic structure with improved corrosion resistance
compared to that of the substrate [192, 254]. For instance, Nikam et al. [254] reported that
carburised 316L stainless steel produced by gas carburising within temperature range of 465-
475°C by Swagelok Company, USA exhibited better corrosion performance in simulated PEM
fuel cell environment of 1 M H2SO4 + 2 ppm HF at 80 oC. The carburised stainless steel exhibited
low transient current density of 1.5 µA/cm2, which was about one order of magnitude lower than
that of the substrate (50 µA/cm
2) after 25 hours of potentiostatic polarisation in 1 M H2SO4 + 2
ppm HF at 80 oC with oxygen bubbling. However, the ICR of the carburised steel (95 mΩ.cm
2 at
250 N/cm2)
was significantly higher than the targeted 10 mΩ.cm2 due to surface oxidation during
carburisation. Post chromising treatment of such carburised stainless steel could possibly reduce
its ICR as seen in the case of post chromising of CoBlast™ stainless steel.

241
(b) Use of non-nitrogen based halide activators.
Corrosion resistance of the CPC-304 stainless steels could also be improved by preventing the
formation of discrete chromium nitride particles via the use of other non-nitrogen based halide
activators such as AlF3, AlCl3 and NaCl.
7.6 SINGLE FUEL CELL PERFORMANCE
Among the CPC-304 stainless steels, CPC-304-3 was selected for single fuel cell evaluation based on
its ICR values, which was the lowest among the stainless steels examined. Figure 114 (a) and (b)
presents the initial polarisation and power density curve of the single fuel cell assembled with CPC-
304-3 bipolar plates. The polarisation and power density curves for Cr-304 and SS304 are also
0.00 0.01 0.02 0.03 0.04 0.050.000
0.004
0.008
0.012
0.016
0.020
SS304
CPC-304-3
Cr-304
(b)
Current density, A/cm2
Pow
er d
ensi
ty, W
/cm
2
Current density, A/cm2
0.00 0.01 0.02 0.03 0.04 0.050.0
0.2
0.4
0.6
0.8
1.0
SS304
CPC-304-3
Cr-304
Out
put V
olta
ge, V
(a)
Figure 114 Polarisation curves and power density curves for single fuel cells with CPC-304,
Cr-304 and SS304 bipolar plates.

242
plotted for reference. The single fuel cell with the CPC-304-3 bipolar plates exhibited an OCV of
0.92 V (Figure 114 (b)) and a peak power density of 18.20 mW/cm2
at a current density of 53.2
mA/cm2
(Figure 114 (b)). Comparing these values with the OCV and peak power density obtained
for the single fuel cell with Cr-304 and SS304 (Table 27), it can be seen that the single fuel cell
with the CPC-304-3 bipolar plate exhibited a similar OCV to the cell with Cr-304 bipolar plates
and a higher OCV than the cell with SS304 bipolar plates. On the other hand, the single cell with
CPC-304-3 bipolar plate attained a maximum power density which was approximately twice and
thrice the peak power output of the single fuel cells with Cr-304 and SS304 bipolar plates
respectively. The improvement in cell performance of the cell with the CPC-304-3 bipolar plate is
attributed to its ICR given that the cells were tested under similar conditions in agreement with
previously published works [89, 91,112,149].
Figure 115 presents the current –time profile of the single fuel cells with CPC-304, Cr-304 and
SS304 bipolar plates. The cells were tested for 10 hours at 0.6 V. As shown in Figure 115, the
performance of the fuel cells in descending order was: CPC-304-3 > Cr-304 > S304 in agreement
with the initial polarisation and power curves (Figure 114]. At the end of the 10-hour test, current
densities for the single fuel cells were found to be : 203 mA/cm2
for the single cell with CPC -304-
3 plates, 75 mA/cm2 for the cell with Cr-304 plate and 35 mA/cm
2 for the cell with SS304 bipolar
plates.
After the 10 hours test, the cells were dismantled and GDLs were characterised with SEM/EDX to
evaluate the effect of corrosion. On dismantling the cells, a brownish corrosion product was
observed on the cathode side GDL of the cell for the CPC-304-3 bipolar plates. The corrosion
product is ascribed to chunk effect, i.e. the loss of the metal pieces from the bulk alloy when
anodically polarised [255, 256].

243
Figure 115 Current density–time profile for single fuel cells with CPC-304-3, Cr-304 and
SS304 bipolar plate at 0.6 V.
Figure 116–118 presents the SEM images and EDX spectrum of the cathode side GDLs of the
single fuel cells with CPC-304-3, Cr-304 and SS304 bipolar plate. It can be seen that the SEM
image of the GDL for the single fuel cell with CPC-304-3 bipolar plates showed a damaged GDL
with corrosion product particles (Figure 116 (a)). It is also possible that the damage could be due
to the compaction force given that traces of the channels on the bipolar plate can be seen on the
SEM images. The EDX spectrum (Figure 116 (b)) showed the presence of Fe, Cr, Ni and Mn. On
the other hand, the GDL of the single fuel cell with Cr-304 and SS304 bipolar plates ((Figure 117
(a) and Figure 118 (a)) showed no damage, while the EDX spectrum of the respective GDLs
showed traces of Fe, Ni, Mn and Cr compared to that of the cell with the CPC-304-3 bipolar
plates.
-0.45
-0.35
-0.25
-0.15
-0.05
0.05
0 10000 20000 30000 40000
Cu
rren
t d
ensi
ty, A
/cm
2
Time (seconds)
CPC-304-3SS304Cr-304

244
Figure 116 Cathode side GDL of single fuel cell with CPC-304-3 bipolar plates after 10
hours of testing (a) surface morphology (b) EDX spectrum.
Figure 117 Cathode side GDL of single fuel cell with Cr-304 bipolar plates after 10 hours of
testing (a) surface morphology (b) EDX spectrum.

245
Figure 118 (a) SEM image (b) EDX spectrum of the cathode side GDL of single cell with
SS304 bipolar plates after 10 hours of testing.
7.7 SUMMARY
The influence of pre-carburising prior to chromising on the ex-situ and in-situ performance of Cr-
304 was investigated. Pre-carburising prior to chromising enhanced the surface conductivity of
chromised 304 stainless steel (Cr-304) via the formation of conductive chromium carbides and
nitrides. Hence, ICR of Cr-304 stainless steel was reduced by ~15%, ~33%, ~55% as carburising
time increased from 1 to 3 hours respectively. On the other hand, corrosion properties of the pre-
carburised-chromised stainless steel (CPC-304) was degraded compared to that of that of Cr-304 at
typical cathodic PEM fuel cell working potentials. However, the corrosion properties of the CPC-
304 were comparable to that of the substrate. The loss of corrosion resistance was attributed to the
sensitisation of the stainless steel via high temperature pack carburisation amongst other factors.
Single fuel cell evaluation of the CPC-304 sample carburised for 3 hours (CPC-304-3) indicated
that the cell attained a peak power density of 18.20 mW/cm2
at 53.2 mA/cm
2. This result

246
represented a two and three fold improvement in the peak output power of the single fuel cells
with Cr-304 and SS304 bipolar plates. This trend was also sustained in the durability studies.
However, SEM/EDX characterisation of the cathode side GDL after the 10 hour test indicated that
the corrosion resistance of CPC-304-3 needed to be further improved by adopting low temperature
carburisation techniques.

247
Chapter 8
Conclusions, Contributions and Future
work
8.1 CONCLUSIONS
Proton exchange membrane (PEM) fuel cells are potential alternative power sources for automobiles
and other transportation devices. However, PEM fuel cells are expensive and not as durable as
conventional power sources. Replacement of conventional graphite bipolar plates with metallic
bipolar plates is widely considered as one of the promising routes to cost reduction of PEM fuel
cells. Metals are, however, prone to corrosion in the PEM fuel cell environments and exhibit
unacceptable contact resistance with the gas diffusion layer. Hence, metals require surface
modification to be viable materials for bipolar plates. In the present study, the performance of
CoBlast™ coated metals and pack chromised stainless steels in PEM fuel cell environments was
investigated. The summary and conclusions drawn from the performance evaluation of the coatings
are given as follows:
(A) CoBlast™ deposited graphite coatings
Graphite based coatings were deposited on 316 stainless steel and Ti grade V alloys by the
CoBlast™ process, a surface modification process which deposits coatings via blasting of powders
on the substrate. Surface characterisation of the coated metals revealed a rough and discontinuous
layer of coatings composed of isolated pockets of graphite or alumina mixed with graphite
embedded in the substrate oxide layer. Hence, the coated layer did not protect the substrate from
corrosion in simulated PEM fuel cell environment of 0.5 M H2SO4 + 2 ppm HF at room

248
temperature or at typical PEM fuel cell operating temperature. The interfacial contact resistance
(ICR) of the coated metals at typical PEM fuel cell compaction pressure of 100-200 N/cm2
were
slightly lower than that of the substrates but significantly higher than the ICR of graphite and the
targeted 10 mΩ.cm2. The reduction in ICR values was attributed to the doping effect of graphite on
the surface oxide layer of the substrates.
In order to improve the continuity and thickness of the coatings, CoBlast™ treated stainless steel
was pack chromised at 900 oC for 3 hours. Post chromising treatment of CoBlast™ coated
stainless steel indicated the formation of a multiphase coating comprising of graphite, alumina and
chromium based coatings, which yielded ICR values significantly lower than that of CoBlast™
coated and chromised stainless steel at typical PEM fuel cell compaction pressure. However, the
graphite and alumina inclusions in the modified coatings promoted corrosion of the matrix in
preference to the graphite/alumina coating in simulated PEM fuel cell environment. Hence, neither
CoBlast™ deposited graphite based coating nor the modified graphite/chromised coatings can be
considered suitable coatings for surface modification of metallic bipolar plate application.
(B) Chromium diffusion coatings.
The influence of time, activator content and temperature on the corrosion current density of pack-
chromised 304 stainless steel in simulated PEM fuel cell environment of 0.5 M H2SO4 + 2 ppm HF
at 70 oC was systemically investigated using Box Behnken Box designs, a design of experiment
(DoE) technique. The temperature at which the coating was deposited was found to be the most
significant process parameter affecting the corrosion current density of pack-chromised 304
stainless steel in simulated PEM fuel cell environment of aerated 0.5 M H2SO4 + 2 ppm HF at

249
70 oC. The interaction effect existed between temperature and the activator content was also found
to be statistically significant.
Optimisation of the process parameters via numerical simulation and use of the desirability
function revealed that the optimal process parameters were: time of ~3 hours, activator content of
6.78 wt. % and temperature of 1040 oC. Surface characterisation of the chromised coatings
produced at these parameters revealed a mixture of chromium iron carbides, chromium iron
nitrides and chromium oxides. Performance evaluation of the chromised coatings deposited at the
optimised process parameters (Cr-304) in simulated PEM fuel cell environment indicated good
corrosion resistance and about six fold reductions in the ICR of the substrate at 150N/cm2. Based
on these results, the performance of 5cm2 active area single fuel cells assembled with Cr-304 and
bare 304 stainless steel was evaluated. The polarisation results indicated that Cr-304 bipolar plates
attained a maximum power density of 8.47 mW/cm2 at a current density of 21.60 mA/cm
2, while
the cell with the uncoated plates only attained a maximum power density of 4.21 mW/cm2 at 10.00
mA/cm2. Thus, it can be concluded that chromised 304 stainless steels are promising materials for
PEM fuel cell bipolar plates.
Attempts to improve single fuel cell performance of the single fuel with Cr-304 stainless steel by
pre-carburising prior to chromising were also conducted. The duplex surface treatment enhanced
the surface conductivity of chromised 304 stainless steel via the formation of conductive
chromium carbides and nitrides. Hence, ICR of chromised 304 stainless steel was reduced by
~15%, ~33%, ~55% as carburising time increased from 1-3 hours respectively. On the other hand,
corrosion properties of chromised 304 stainless steel deteriorated at typical PEM fuel cell working
potentials, but were comparable to that of the substrate, which was about an order of magnitude
higher than the targeted 1µA/cm2
for bipolar plate applications. The loss of corrosion resistance of

250
the chromised coating was attributed to sensitisation via high temperature pack carburisation
process. Considering the fact that corrosion resistance of the pre-carburised and chromised
samples could be improved by low temperature carburisation techniques such as gas and plasma
carburising, the single fuel cell performance of the 3 hour pre-carburised -chromised 304 stainless
steel samples was evaluated and compared with that of chromised 304 stainless steel and the
substrate. The initial cell polarisation results indicated that the single cell with the pre-carburised-
chromised bipolar plate attained maximum power density of 18.20 mW/cm2
at a current density of
53.2 mA/cm2 representing a doubling and tripling increase in the maximum power density of the
single fuel cell with Cr-304 and bare stainless steel bipolar plates respectively. The result of short
term durability test of the single fuel cells conducted for 10 hours was consistent with the initial
polarisation result. SEM/EDX characterisation of the cathode side GDL of the single fuel cells
after the test established the need to improve the corrosion resistance of the pre-carburised and
chromised 304 stainless steel by adopting low temperature carburisation techniques such as gas-,
plasma or electrochemical carburisation. It can be concluded from these results that duplex
treatment of pre-carburisation prior to chromising should be considered promising for surface
modification of metallic bipolar plate.
8.2 CONTRIBUTION TO KNOWLEDGE
Key contributions of this research to knowledge in the field of surface modification of metallic
bipolar plate for PEM fuel cells are:
1. Optimisation of process parameters via experimental design is an effective route to
improving the performance of surface coatings for metallic bipolar plates. Adopting this
method, chromised coatings which showed comparable performance to previously reported

251
pre-treated and chromised stainless steels in simulated PEM fuel cells environment were
achieved. More importantly, it was shown that an interaction effect exist between
chromising temperature and activator content. This finding will be helpful in tailoring the
surface morphologies of chromised coatings for the desired application.
2. Duplex treatment of carburisation and chromising has the potential to enhance the
performance of chromised stainless steel bipolar plate in PEM fuel cells environments
provided carburisation is conducted with low temperature carburising processes.
8.3 FUTURE WORK.
The following tasks are proposed for future work:
Enhancing the corrosion resistance of pre-carburisation and chromised stainless steel by
employing low temperature carburisation technique such as gas or the use of plasma
carburising.
Long term lifetime assessment of single fuel cells assembled with chromised stainless,
pre-carburised and chromised stainless steel bipolar plates produced in (1) above up to
1000 hours using graphite bipolar plate as reference.
Exploring the influence of other duplex surface treatments such as pre-oxidation, pre-
nitridation prior to chromising treatment on the corrosion, interfacial contact resistance of
chromised stainless steel and single cell performance of chromised stainless steel bipolar
plates.
In-depth XPS analysis of pre-carburised and chromised stainless steels.
Corrosion behaviour evaluation by electrochemical impedance spectroscopy (EIS).

252
REFERENCES
[1] British Petroleum Statistical Review of World Energy June 2015. [Online] Available:
www.bp.com/content/dam/bp/pdf/energy-economics/statistical-review-2015/bp-statistical-
review-of-world-energy-2015-full-report.pdf. (Last accessed on 02/01/2016)
[2] 2015 Key world Energy statistics. International energy Agency 2015. [online] Available:
www.iea.org/publications/freepublications/publication/KeyWorld_Statistics_2015.pdf.
(Last accessed on 02/01/2016)
[3] CO2 emissions from fuel consumption highlight 2014. International Energy Agency
[online] Available: www.ourenergypolicy.org/co2-emissions-from-fuel-combustion-
highlights-2014-edition (Last accessed on 02/01/2016).
[4] M. Balat, Potential importance of hydrogen as a future solution to environmental and
transportation problems. Inter. J. Hydrogen Energy 2008; 33: 4013 – 4029.
[5] S. Sharma, S. K. Ghoshal, Hydrogen the future transportation fuel: From production to
applications, Renewable and Sustainable Energy Reviews 2015; 43: pp. 1151-1158.
[6] S. McWhorter, C. Read, G. Ordaz, N. Stetson Material based hydrogen storage: attributes
for near- term, early market PEM fuel cells. Current opinion in solid state and materials
science 2011; 15: pp. 29-38.
[7] Energy in Transport 2014 report. Sustainable Energy Authority of Ireland. [Online]
Availiable:http://www.seai.ie/Publications/Statistics_Publications/Energy_in_Transport/En
ergy-in-Transport-2014-report.pdf. (Last accessed on 02/01/2016)
[8] Reducing emissions from transport. [online] Available:
www.ec.europa.eu/clima/policies/transport/transport/index_en.html. (Last accessed on
02/01/2016)

253
[9] O.Z Sharaf, M F. Orhan, An overview of fuel cell technology: Fundamentals and
applications, Renewable and Sustainable Energy Reviews 2014; 32: pp. 810-853.
[10] S. Srinivasan, Fuel cells: from fundamentals to applications. New York: Springer sience
and Business media; 2006.
[11] B. G. Pollet, I. Staffell, J. L. Shang, Current status of hybrid, battery and fuel cell electric
vehicles: From electrochemistry to market prospects, Electrochimica Acta 2012; 84: pp.
235-249.
[12] R. O`Hayre, S-W. Cha, W. Colella, F. B. Prinz, Fuel cell fundamentals, New York: John
Wiley & Sons, Inc. 2006.
[13] J. Larminie, A. Dicks, Fuel cell systems explained, England, John Wiley & Sons Ltd. 2002.
[14] P.S Greenwood, ‘‘Polymeric bipolar plates for PEM fuel cells: experimental and modelling
approach to assess factors influencing performance’’, PhD thesis, Loughborough
University, United Kingdom, (2010), pp. 20.
[15] G. Merle, M. Wessling, K. Nijmeijer, Anion exchange membranes for alkaline fuel cells: A
review, J. Membrane Science 2011; 377: pp. 1–35.
[16] F. Barbir, PEM fuel cells theory and practice, USA Eleviser 2013, 2nd
edition.
[17] Y. Wang, K. S. Chen, J. Mishler, S. C. Cho, X. C. Adroher, A review of polymer
electrolyte membrane fuel cells: Technology, applications, and needs on fundamental
research , Applied Energy 2011; 88; pp. 981-1007.
[18] J. C Yang, Y.S. Park, S.H. Seo, H.J. Lee, J.S. Noh, Development of a 50 kW PAFC power
generation system. J. Power Sources 2002; 106, (1-2): pp. 68-75.

254
[19] A.L Dicks, Molten carbonate fuel cells, Current Opinion in Solid State and Materials
Science, 2004: 8: pp. 379–383.
[20] T. A. Adams, J. Nease, D. Tucker, P. I. Barton, Energy Conversion with Solid Oxide Fuel
Cell Systems: A Review of Concepts and Outlooks for the Short- and Long-Term Ind. Eng.
Chem. Res. 2013;52: pp. 3089-3111.
[21] D. Brett and N. Brandon, Review of materials and characterization method for polymer
electrolyte fuel cell flow-field plates, J. Fuel Cell Sci.& Tech. 2007; 4: pp. 29-44.
[22] H. Tawfik, Y. Hung, D. Mahajan, Metal bipolar plates for PEM fuel cell- review
J. Power Sources 2007; 163 (2): pp. 755-767.
[23] N. Heras, E.P Roberts, R. Langton, D.R Hodgson, A review of metal separator plate
materials suitable for automotive PEM fuel cells. Energy & Environment Sci. 2009; 2: pp.
206-214.
[24] R. A. Antunes, M. C.L. de Oliveira, G. Ett, V.Ett, Carbon materials in composite bipolar
plates for polymer electrolyte membrane fuel cells: A review of the main challenges to
improve electrical performance, J. Power Sources 2011; 196 (6): pp. 2945-2961.
[25] K.H. Cho, W.G. Lee, S.B. Lee, H. Jang, Corrosion resistance of chromized 316L stainless
steel for PEMFC bipolar plates, J. Power Sources 2008; 178 : pp. 671–676.
[26] S.B. Lee, K.H. Cho, W.G. Lee, H. Jang, Improved corrosion resistance and interfacial
contact resistance of 316L stainless-steel for proton exchange membrane fuel cell bipolar
plates by chromizing surface treatment, J. Power Sources 2009; 187: pp. 318–323.

255
[27] L. Yang, H. Yu, L. Jiang, L. Zhu, X. Jian, Z. Wang, Improved anticorrosion properties and
electrical conductivity of 316L stainless steel as bipolar plate for PEM fuel cell by lower
temperature chromizing treatment, J. Power Sources 2010; 195: pp. 2810–2814.
[28] T-M. Wen, K-H Hou, C-Y Bai, M-D. Ger, P-H Chien, S-J Lee, Corrosion behaviour and
characteristics of reforming chromized coatings on SS 420 steel in the simulated
environment of proton exchange membrane fuel cells, Corros. Sci. 2010; 52: pp. 3599–
3608.
[29] C-Y. Bai, T-M Wen, M-S Huang, K-H Hou, M-D Ger, S-J Lee, Surface modification and
performance of inexpensive Fe-based bipolar plates for proton exchange membrane fuel
cells, J. Power Sources 2010;195: pp. 5686–5691.
[30] N. Guo , M. C. Leu, Performance investigation of polymer electrolyte membrane fuel cells
using graphite composite plates fabricated by selective laser sintering, J. Fuel Cell Sci.
Tech. 2014; 11(1); :011003-011003-8. doi:10.1115/1.4025520.
[31] S-P Jung, C-I Lee, C-C Chen, W-S Chang, C-C Yang, Development of novel proton
exchange membrane fuel cells using stamped metallic bipolar plates, J. Power Sources
2015; 283: pp. 429-442.
[32] M. Rikukawa, K. Sanui, Proton-conducting polymer electrolyte membranes based on
hydrocarbon polymers, Progress in Polymer Sci. 2000 (25): pp. 1463-1502
[33] S.M J. Zaidi, T. Matsuura, Polymer Membranes for Fuel Cells, Springer Science and
Business Media, LLC 2009. doi: 10.1007/978-0-387-73532-0.
[34] J. Zhang, PEM fuel cell electrocatalyst and catalyst layers: Fundamentals and application
edited by, Springer Verlag, London, 2008

256
[35] J. Benziger, J. Nehlsen, D. Blackwell, T. Brennan, J. Itescu, Water flow in the gas
diffusion layer of PEM fuel cells, J. Membrane Sci. 2005; 261: pp. 98–106.
[36] L. Peng, P. Yi, X. Lai, Design and manufacturing of stainless steel bipolar plates for
proton exchange membrane fuel cells, Inter. J. Hydrogen Energy 2014;39 (36): pp. 21127–
21153.
[37] S. Karimi, N. Fraser, B. Roberts, F.R. A Foulkes, Review of Metallic Bipolar Plates for
Proton Exchange Membrane Fuel Cells: Materials and Fabrication Methods, Advances in
Materials Sci. & Engr. 2012, Article ID 828070, http://dx.doi.org/10.1155/2012/828070.
[38] R. A. Antunes, M. Cristina, L. Oliveira G. Ett, V. Ett, Corrosion of metal bipolar plates for
PEM fuel cells: A review, Int. J. Hydrogen energy 2010; 35: pp. 3632–3647.
[39] E. Planes, L. Flandin, N. Alberola, Polymer composites bipolar plates for PEMFCs, Energy
Procedia 2012; 20: pp. 311 – 323.
[40] G. Upreti, D. L. Greene, K. G. Duleep, R.Sawhney, Fuel cells for non-automotive uses:
Status and prospects, Inter. J. Hydrogen Energy 2012; 37 (8): pp. 6339-6348.
[41] US DOE Office of energy efficiency and renewable energy: Hydrogen fuel Cells and
infrastructures technologies program: Multi-Year research, Development and
Development, and Demonstration, Plan. pp. 25-29. [Online] Available:
http://www.nrel.gov/docs/fy05osti/34289.pdf. Last accessed on 05/01/2016.
[42] A. Martin, L. Jörissen, AutoStack – CORE – Industry Led European Consortium to
Develop Next Generation Automotive Stack Hardware, ECS Transactions 2015; 69 : (17)
pp. 957-961.
[43] A. Martin, L. Jörissen, Auto-Stack - Implementing a European Automotive Fuel Cell Stack
Cluster Fuel Cell Applications, ECS Transactions 2012: 42 (1): pp. 31-38.

257
[44] H. Tsuchiya, O. Kobayashi, Mass production cost of PEM fuel cell by learning curve, Int.
J. Hydrogen Energy 2004; 29: pp. 985-990.
[45] I. Bar-On, R. Kirchain, R. Roth, Technical cost analysis for PEM fuel cells, J. Power
Sources 2002; 109(1), pp.71-75.
[46] B.D. James, J.A. Kalinoski, K.N. Baum, Mass Production Cost Estimation for Direct H2
PEM Fuel Cell Systems for Automotive Applications: 2010 Update, Directed
Technologies, Arlington,VA. [Online] Available:
https://www1.eere.energy.gov/hydrogenandfuelcells/pdfs/mass_production_cost_estimatio
n_report.pdf. (Last accessed on 06/01/2016).
[47] R. Taherian, A review of composite and metallic bipolar plates in proton exchange
membrane fuel cell: Materials, fabrication, and material selection, J. Power Sources 2014;
265: pp. 370-390.
[48] F. A. de Bruijn, V.A.T. Dam, G.J.M. Janssen, Review: Durability and degradation issues of
PEM fuel cell components, Fuel cells 2008; 1: pp. 3-22.
[49] H.L. Wang, J.A. Turner, The influence of metal ions on the conductivity of Nafion 112 in
polymer electrolyte membrane fuel cell, J. Power Sources 2008; 183 (2) : pp. 576–5809.
[50] M. Sulek, J. Adams, S. Kaberline, M. Ricketts, J.R. Waldecker, In situ metal ion
contamination and the effects on proton exchange membrane fuel cell performance, J.
Power Sources 2011;196 : pp. 8967–8972.
[51] K.D. Baik, B. K. Hong , M. S. Kim, Novel technique for measuring oxygen crossover
through the membrane in polymer electrolyte membrane fuel cells, Inter. J. Hydrogen
Energy 2013; 38 : pp. 8927 – 8933.

258
[52] Fuel cell theory, http://www.fuelcell.no/principle_fctheory_eng.htm (accessed on
01/07/2016).
[53] C. J. Netwall, B. D. Gould, J.A. Rodgers, N.J Nasello, K.E. Swider-Lyons, Decreasing
contact resistance in proton-exchange membrane fuel cells with metal bipolar plates. J.
Power sources 2013; 227: pp. 137-144.
[54] http://bama.ua.edu/∼rreddy/projects/fuel cells.htm. (Last accessed on 05/05/2016)
[55] B. Avasarala, P. Haldar, Effect of surface roughness of composite bipolar plates on the
contact resistance of a proton exchange membrane fuel cell, J. Power Sources 2009; 188
(1), pp. 225-229.
[56] A. Kraytsberg, M. Auinat, Y. Ein-Eli, Reduced contact resistance of PEM fuel cell’s
bipolar plates via surface texturing, J. Power Sources 2007; 164: pp. 697–703
[57] T. J. Mason, J. Millichamp , T. P. Neville, A. El-kharouf ,B. G. Pollet, D. J. L. Brett, Effect
of clamping pressure on ohmic resistance and compression of gas diffusion layers for
polymer electrolyte fuel cells , J. Power Sources 2012; 219: pp. 52-59.
[58] S-D. Yim, B-J. Kim, Y-J. Sohn, Y-G Yoon, G-G Park, W-Y Lee, C-S. Kim, Y. C. Kim
The influence of stack clamping pressure on the performance of PEM fuel cell stack
Current Applied Physics 2010; 10: pp. 59–61.
[59] M.S. Ismail, T. Damjanovic, D.B. Ingham, M. Pourkashanian, A. Westwood, Effect of
polytetrafluoroethylene-treatment and microporous layer-coating on the electrical
conductivity of gas diffusion layers used in proton exchange membrane fuel cells, J.
Power Sources 2010; 195: pp. 2700–2708.

259
[60] A. El-kharouf, T. J. Mason, Dan J.L. Brett, Bruno G. Pollet, Ex-situ characterisation of gas
diffusion layers for proton exchange membrane fuel cells, J. Power Sources 2012; 218: pp.
393–404.
[61] Stainless steels, ASM speciality handbook edited by J.R Davis ASM Material Park, OH
1999
[62] K.H. Lo, C.H. Shek , J.K.L. Lai, Recent developments in stainless steels, Materials Science
and Engineering R 2009; 65: pp. 39–104.
[63] J. J Kim, Y. M. Young, Study on the passive film of type 316 stainless steel, Int. J.
Electrochem. Sci. 2013; 8, pp. 11847 – 11859
[64] H. Wang, J. A. Turner. Reviewing metallic PEMFC bipolar plates, Fuel Cells 2010; 10(4):
pp. 510–519.
[65] H. Wang, M.A. Sweikart, J.A. Turner, Stainless steel as bipolar plate material for polymer
electrolyte membrane fuel cells. J. Power sources 2003, 115 (2), pp.243-251.
[66] H. Wang, J. A. Turner, Ferritic stainless steels as bipolar plate material for polymer
electrolyte membrane fuel cells, J. Power Sources 2004; 128: pp. 193-200.
[67] D.P. Davies, P.L. Adcock, M. Turpin and S.J. Rowen, Bipolar plate materials for solid
polymer fuel cells, J. Applied Electrochemistry 2000; 30: pp. 101-105.
[68] L. Ma, S. Warthesen, D.A. Shores, Evaluation of materials for bipolar plates in PEMFCs,
J. New Materials for Electrochemical Systems 2000: pp. 221-228.
[69] D. D. Papadias, R. K. Ahluwalia, J. K. Thomson, H. M. Meyer III, M. P., H. Wang, J. A.
Turner, R. M, R. Borup, Degradation of SS316L bipolar plates in simulated fuel cell
environment: Corrosion rate, barrier film formation kinetic and contact resistance, J.
Power sources 2015; 273: pp. 1237-1249.

260
[70] M. C. Li, C. L. Zeng, S. Z. Luo, J. N. Shen, H. C. Lin, C. N. Cao, Electrochemical
corrosion characteristics of type 316 stainless steel in simulated anode environment for
PEMFC. Electrochimica Acta 2003; 48:pp. 1735-1741.
[71] R. C Makkus, A. H.H Janssen, F. A de Bruijn, R. K. Mallant, Use of stainless steel for cost
competitive bipolar plates in the SPFC, J. Power Sources 2000; 86 (1–2):pp. 274-282.
[72] Y. Wang and D. Northwood, Effects of O2 and H2 on the corrosion of SS316L metallic
bipolar plate materials in simulated anode and cathode environments of PEM fuel cells.
Electrochimica Acta 2007; 52: pp. 6793–6798.
[73] Y. Soma, I. Muto, N. Hara, Electrochemical Properties of Titanium in PEFC Bipolar Plate
Environments. Materials Transactions 2010; 51 (5):pp. 939 - 947.
[74] Y. Wang and D. Northwood, An Investigation of Commercial Grade 2 Titanium as a
bipolar plate material for PEM fuel cells. Electrochemical Soc. Trans. 2008; 11 (18): pp.
53-60.
[75] D.R. Hodgson, B. May, P. L. Adcock, D, P. Davies. New lightweight bipolar plate system
for polymer electrolyte membrane fuel cells. J. Power sources 2001; 96(1): pp. 233-235.
[76] C. K. Jin, M. G. Jeong, C. G. Kang, Fabrication of titanium bipolar plates by rubber
forming and performance of single cell using TiN-coated titanium bipolar plates, Inter. J.
Hydrogen Energy 2014; 39 (36): pp. 21480-21488.
[77] P. L. Hentall, J. B.Lakeman, G. O. Mepsted, P. L. Adcock, J. M. Moore, New materials for
polymer electrolyte membrane fuel cell current collectors, J. Power Sources 1999; 80: pp.
235-241.

261
[78] A.S. Woodman, E.B. Anderson, K.D. Jayne, and M.C. Kimble, "Development of
Corrosion-Resistant Coatings for Fuel Cell Bipolar Plates," in American Electroplaters and
Surface Finishers Society 1999, AESF SUR/FIN ‘99 Proceedings, June 1999.
[79] S-J. Lee, C-H. Huang, Y-P Chen, Investigation of PVD coating on corrosion resistance of
metallic bipolar plates in PEM fuel cell, J. Materials Processing Technology 2003;140: pp.
688–693.
[80] V. V. Nikam, R. G. Reddy, Corrosion studies of a copper–beryllium alloy in a simulated
polymer electrolyte membrane fuel cell environment, J. Power Sources 2005;152: pp. 146-
155
[81] V. V. Nikam, R. G. Reddy, Copper alloy bipolar plates for polymer electrolyte membrane
fuel cell, Electrochimica Acta 2006; 51 (28): pp. 6338-6345.
[82] P. Costamagna, S. Srinivasan, Quantum jumps in the PEMFC science &Technology from
the 1960s to the year 2000.Part II Engineering technology development and application
aspect, J. Power Sources 2001; 102: 253-269.
[83] S-S. Hsieh, C-F. Huang, C-L. Feng, A novel design and micro-fabrication for copper (Cu)
electroforming bipolar plates, Micron 2008; 39 (3): pp. 263-268.
[84] T.J. Pan, X.W. Zuo, T. Wang, J. Hu, Z.D. Chen, Y.J. Ren, Electrodeposited conductive
polypyrrole/polyaniline composite film for the corrosion protection of copper bipolar plates
in proton exchange membrane fuel cells, J. Power Sources 2016; 302: pp. 180-188.
[85] J. Wind, R. Spah, W. Kaiser, G. Bohm, Metallic bipolar plates for PEM fuel cells, J. Power
Sources 2002; 105: pp. 256-260.
[86] S-H. Wang, J. Peng, W-B Lui, J.S Zhang Performance of the gold-plated titanium bipolar
plates for the light weight PEM fuel cells. J. Power Sources 2006; 162 (1):pp. 486-491

262
[87] S-H. Wang, J. Peng, W-B Lui, Surface modification and development of titanium bipolar
plates for PEM fuel cells. J. of Power Sources 2006; 160 (1): pp. 485–489.
[88] A. Kumar, M. Ricketts, S. Hirano, Ex situ evaluation of nano-meter range gold coating on
stainless steel substrate for automotive polymer electrolyte membrane fuel cell bipolar plate,
J. Power Sources 2010; 195 (5): pp. 1401-1407.
[89] D. Zhang, L. Duan , L. Guo , Z. Wang , J. Zhao , W.H Tuan , K. Niihara, TiN-coated
titanium as the bipolar plate for PEMFC by multi-arc ion plating. Int. J. Hydrogen Energy
2011; 36: pp. 9155-9161.
[90] Z. Ren, D. Zhang, Z. Wang, Stacks with TiN/titanium as the bipolar plate for PEMFCs.
Energy 2012; 48 (1): pp. 577 -581.
[91] E.A. Cho, U.-S.Jeon, S.-A.Hong, I.-H. Oh, S.-G. Kang, Performance of a 1kW-class
PEMFC stack using TiN-coated 316 stainless steel bipolar plates, J. Power Sources 2005;
142: pp. 177-183.
[92] Y. Wang and D. O. Northwood An investigation into TiN-coated 316L stainless steel as a
bipolar plate material for PEM fuel cells, J. Power Sources 2007; 165(1): pp. 293-298.
[93] R. Tian, J. Sun, L. Wang , Plasma-nitrided austenitic stainless steel 316L as bipolar plate
for PEMFC, Int. J. Hydrogen Energy 2006, 31(13): pp. 1874-1878.
[94] N.D Nam, Jung Gu Kim, W.-S. Hwang , Effect of bias voltage on the electrochemical
properties of TiN coating for polymer electrolyte membrane fuel cell, Thin Solid Films
2009; 517 (17): pp. 4772-4776
[95] W-S. Jeon, J.-G.Kim, Y.-J.Kim, J.G. Han Electrochemical properties of TiN coatings on
316L stainless steel separator for polymer electrolyte membrane fuel cell Thin Solid Films
2008 ; 516 (11): pp. 3669-3672.

263
[96] K. Feng, D.T.K. Kwok, D. Liu, Z. Li ,X. Cai, P.K. Chu, Nitrogen plasma-implanted
titanium as bipolar plates in polymer electrolyte membrane fuel cells. J. Power sources
2010; 195 (19): pp. 6798-6804.
[97] M. Omrani, M. Habibi, R. Amrollahi, A. Khosravi, Improvement of corrosion and
electrical conductivity of 316L stainless steel as bipolar plate by TiN nanoparticle
implantation using plasma focus, Inter. J. Hydrogen Energy 2012; 37(19): pp. 14676-
14686.
[98] D. Zhang , L. Duan , L. Guo , Z. Wang , J. Zhao , W.H Tuan , K. Niihara , TiN-coated
titanium as the bipolar plate for PEMFC by multi-arc ion plating, Int. J. Hydrogen Energy
2011; 36: pp. 9155-9161.
[99] S.H. Lee, N. Kakati, J. Maiti, S.H. Jee, D.J. Kalita, Y.S. Yoon, Corrosion and electrical
properties of CrN- and TiN-coated 316L stainless steel used as bipolar plates for polymer
electrolyte membrane fuel cells, Thin Solid Films 2013; 529 (1): pp. 374-379.
[100] B. Wu, Y. Fu, J. Xu, G. Lin, M. Hou, Chromium nitride films on stainless steel as bipolar
plate for proton exchange membrane fuel cell, J. Power Sources 2009; 194 (2): pp. 976-
980.
[101] O. Lavigne, C. Alemany-Dumont, B. Normand, S. Berthon-Fabry, R. Metkemeije, Thin
chromium nitride PVD coatings on stainless steel for conductive component as bipolar
plates of PEM fuel cells: Ex-situ and in-situ performances evaluation, Inter. J. Hydrogen
Energy 2012; 37(14): pp. 10789-10797.
[102] K. Feng, Z. Li, H. Sun, L. Yu, X. Cai, Y. Wu, P. K. Chu, C/CrN multilayer coating for
polymer electrolyte membrane fuel cell metallic bipolar plates, J. Power Sources 2013;
222: pp. 351-358.

264
[103] C. K. Jin, K. H. Lee, C. G. Kang, Performance and characteristics of titanium nitride,
chromium nitride, multi-coated stainless steel 304 bipolar plates fabricated through a
rubber forming process, Inter. J. Hydrogen Energy 2015; 40 (20): 6681-6688.
[104] R. Tian, Chromium nitride/Cr coated 316L stainless steel as bipolar plate for proton
exchange membrane fuel cell, J. Power Sources 2011; 196 (3): pp. 1258-1263.
[105] H. Zhang, G. Lin, M. Hou, L. Hu, Z. Han, Y. Fu, Z. Shao, B. Yi, CrN/Cr multilayer
coating on 316L stainless steel as bipolar plates for proton exchange membrane fuel cells,
J. Power Sources 2012; 198: pp. 176–181.
[106] N. D. Nam, D. S. Jo, J. G. Kim, D. H. Yoon, Corrosion protection of CrN/TiN multi-
coating for bipolar plate of polymer electrolyte membrane fuel cell, Thin Solid Films 2011;
519 ( 20):pp. 6787-6791.
[107] F. Bi, P. Yi, T. Zhou, L. Peng, X. Lai, Effects of Al incorporation on the interfacial
conductivity and corrosion resistance of CrN film on SS316L as bipolar plates for proton
exchange membrane fuel cells, Inter. J. Hydrogen Energy 2015; 40 (31): pp. 9790-9802.
[108] M.P. Brady, K. Weisbrod, I. Paulauskas, R.A. Buchanan, K.L. More, H. Wang, M. Wilson,
F. Garzon, L.R. Walker, Preferential thermal nitridation to form pin-hole free Cr-nitrides to
protect proton exchange membrane fuel cell metallic bipolar plates, Scripta Materialia
2004; 50 (7): pp. 1017-1022.
[109] B. Yang, M.P. Brady, H. Wang, J.A. Turner, K.L. More, D.J. Young, P.F. Tortorelli, E.A.
Payzant, L.R. Walker, Protective nitride formation on stainless steel alloys for proton
exchange membrane fuel cell bipolar plates, J. Power Sources 2007;174(1): pp. 228-236.

265
[110] M.P. Brady, B. Yang, H. Wang, J.A. Turner, K.L. More, M. Wilson, F. Garzon, The
formation of protective nitride surfaces for PEM Fuel Cell Metallic Bipolar Plates. TMS, J.
materials (JOM) 2006: pp. 50-57.
[111] M.Brady, H. Wang, J. Turner, H. Meyer III ,K. More,P.Tortorelli ,B. McCarthy , Pre-
oxidized and nitrided stainless steel alloy foil for proton exchange membrane fuel cell
bipolar plates: Part 1. Corrosion, interfacial contact resistance, and surface structure J.
Power Sources 2010; 195 (17) : pp. 5610-5618.
[112] T. Toops, M. Brady , P. Tortorelli , J. Pihl, F. Estevez , D. Connors , F. Garzon, T.
Rockward, T. Gervasio, W. Mylan, H. Kosaraju, Pre-oxidized and nitrided stainless steel
alloy foil for proton exchange membrane fuel cell bipolar plates. Part 2: Single-cell fuel
cell evaluation of stamped plates. J. Power Sources 2010; 195 (17): pp. 5619-5627.
[113] M.P. Brady, M. Abd Elhamid, G. Dadheech, J. Bradley, T.J. Toops, H.M. Meyer III, P.F.
Tortorelli, Manufacturing and performance assessment of stamped, laser welded, and
nitrided FeCrV stainless steel bipolar plates for proton exchange membrane fuel cells,
Inter. J. Hydrogen Energy 2013; 38 (11) : pp. 4734-4739.
[114] K-H. Lee, S-H. Lee, J-H Kim, Y-Y. Lee, Y-H. Kim, M-C. Kim, D-M Wee, Effects of
thermal oxi-nitridation on the corrosion resistance and electrical conductivity of 446M
stainless steel for PEMFC bipolar plates, Inter. J. Hydrogen Energy 2009; 34 (3): pp. 1515-
1521.
[115] S-H Lee, T-H Yang, S-H Hyun, Y-S Yoon, Corrosion behaviour of pre-oxidized and
thermally nitrided stainless steel for polymer electrolyte membrane fuel cell bipolar plate
Corros. Sci. 2012; 58: pp. 79-85.

266
[116] H. Wang, J. A. Turner, Electrochemical nitridation of a stainless steel for PEMFC bipolar
plates, Inter. J. Hydrogen Energy 2011; 36 (20): pp. 13008-13013.
[117] H. Wang, J. A. Turner, Modifying a stainless steel for PEMFC bipolar plate via
electrochemical nitration, Fuel cells 2013; 13 (5): pp. 917-921
[118] L. Jinlong, L. Tongxiang, L. Hongyun, Effect of grain refinement and electrochemical
nitridation on corrosion resistance of the 316L stainless steel for bipolar plates in PEMFCs
environment, J. Power Sources 2015; 293: pp. 692-697.
[119] J. Barranco, F. Barreras, A. Lozano, A. M. Lopez, V. Roda, J. Martin, M. Maza, Gonzalo
G. Fuentes, E. Almandoz, Cr and Zr/Cr nitride CAE-PVD coated aluminium bipolar plates
for polymer electrolyte membrane fuel cells, Inter. J. Hydrogen Energy 2010, 35; 20: pp.
11489 -11498.
[120] J. Barranco, F. Barreras, A. Lozano, M. Maza, Influence of CrN-coating thickness on the
corrosion resistance behaviour of aluminium-based bipolar plates, J. Power Sources 2011:
196, (9), pp. 4283-4289.
[121] Z. Li, K. Feng, Z. Wang, X Cai, C. Yao, Y. Wu, Investigation of single-layer and
multilayer coatings for aluminium bipolar plate in polymer electrolyte membrane fuel cell,
Inter. J. Hydrogen Energy 2014; 39 (16): pp.8421-8430.
[122] L. Wang, J. Sun, J. Sun, Y. Lv, S. Li, S. Ji, Z. Wen, Niobium nitride modified AISI 304
stainless steel bipolar plate for proton exchange membrane fuel cell, J. Power Sources
2012; 199: pp. 195-200.
[123] L. Wang, J. Sun, J. Sun, Y. Lv, S. Li, S. Ji, Z. Wen, Molybdenum nitride modified AISI
304 stainless steel bipolar plate for proton exchange membrane fuel cell, Inter. J. Hydrogen
Energy 2012; 37(7): pp. 5876-5883.

267
[124] C. Choe, H. Choi, W. Hong, J-J Lee, Tantalum nitride coated AISI 316L as bipolar plate
for polymer electrolyte membrane fuel cell, Inter. J. Hydrogen Energy,2012, 37 (1): pp. 405-
411.
[125] R.J. Tian, J.C. Sun, L. Wang, Effect of plasma nitriding on behaviour of austenitic stainless
steel 304L bipolar plate in proton exchange membrane fuel cell, J. Power Sources 2007: 163
(2): pp.719-724.
[126] R.J. Tian, J.C. Sun, L. Wang, Plasma-nitrided austenitic stainless steel 316L as bipolar
plate for PEMFC, Inter. J. Hydrogen Energy 2006; 31 (13): pp. 1874-1878.
[127] W. Hong, D-H Han, H Choi, M-W Kim, J-J Lee, High-density plasma nitriding of AISI
316L for bipolar plate in proton exchange membrane fuel cell, Inter. J. Hydrogen Energy
2011; 36(3): pp. 2207-2212.
[128] K. Lin, X. Li, L. Tian, H, Active screen plasma nitriding of 316 stainless steel for the
application of bipolar plates in proton exchange membrane fuel cells. Inter. J. Hydrogen
Energy 2014; 39 (36): pp. 21470-21479.
[129] K. Lin, X. Li, L. Tian, H. Dong, Active screen plasma surface co-alloying treatments of
316 stainless steel with nitrogen and silver for fuel cell bipolar plates, Surface & Coatings
Techn. 2015; 283: pp. 122-128.
[130] K. Lin, X. Li, L. Tian, H. Dong, Active screen plasma surface co-alloying of 316 austenitic
stainless steel with both nitrogen and niobium for the application of bipolar plates in proton
exchange membrane fuel cells. Inter. J. Hydrogen Energy 2015; 40 (32): pp. 10281-10292.
[131] Y. Hung, H. Tawfik, D. Mahajan, Durability and characterization studies of polymer
electrolyte membrane fuel cell’s coated aluminium bipolar plates and membrane electrode
assembly, J. Power Sources 2009; 186 (1): pp. 123-127.
268
[132] L. Wang, J. Sun, B. Kang, S. Li, S. Ji, Z. Wen, X. Wang, Electrochemical behaviour and
surface conductivity of niobium carbide-modified austenitic stainless steel bipolar plate, J.
Power Sources 2014; 246: pp. 775-782.
[133] C-Y Bai, M-D Ger, M-S Wu, Corrosion behaviors and contact resistances of the low-
carbon steel bipolar plate with a chromized coating containing carbides and nitrides. Inter.
J. Hydrogen Energy 2009; 34 (16): pp. 6778-6789.
[134] C-Y Bai, T-S Wen, K-H Hou, N-W Pu, M-D Ger, The characteristics and performance of
AISI 1045 steel bipolar plates with chromized coatings for proton exchange membrane fuel
cells , Inter. J. Hydrogen Energy 2011; 36 (6): pp. 3975-3983.
[135] H-C Wang, H-H Sheu, C-E Lu, K-H Hou, M-D Ger, Preparation of corrosion-resistant and
conductive trivalent Cr–C coatings on 304 stainless steel for use as bipolar plates in proton
exchange membrane fuel cells by electrodeposition, J. Power Sources 2015; 293: pp. 475-
483.
[136] H-C Wang, H-H Sheu, C-E Lu, K-H Hou, M-D Ger ,The study of electroplating trivalent
CrC alloy coatings with different current densities on stainless steel 304 as bipolar plate of
proton exchange membrane fuel cells, Thin Solid Films 2014; 570: pp. 209-214.
[137] B. Wu, G. Lin, Y. Fu, M. Hou, B. Yi, Y. Zhao, L. Wei, P. Yi, L. Peng, Chromium-
containing carbon film on stainless steel as bipolar plates for proton exchange membrane
fuel cells, Inter. J. Hydrogen Energy 2010; 35 (24): pp. 13255-13261.
[138] H. Wang, J. A. Turner, SnO2: F, coated ferritic stainless steels for PEM fuel cell bipolar
plates, J. Power Sources 2007; 70 (2): pp. 387-394.
[139] H. Wang, J. A. Turner, X. Li, R. Bhattacharya, SnO2:F coated austenite stainless steels for
PEM fuel cell bipolar plates , J. Power Sources 2007; 171( 2): pp. 567-574.

269
[140] H. Wang, J.A. Turner, X. Li, G. Teeter, Process modification for coating SnO2:F on
stainless steels for PEM fuel cell bipolar plates, J. Power Sources 2008 ; 178(1): pp. 238-
247.
[141] J. H. Park, B. J. Jeon, J. K. Lee, Electrochemical characteristics of fluorine-doped tin oxide
film coated on stainless steel bipolar plates, Surface & Coatings Techn., 2015; 277: pp. 1-
6.
[142] A. E. Fetohi, R.M. A. Hameed, K.M. El-Khatib, Ni–P and Ni–Mo–P modified aluminium
alloy 6061 as bipolar plate material for proton exchange membrane fuel cells, J. Power
Sources 2013; 240: pp. 589-597.
[143] A. E. Fetohi, R.M. A. Hameed, K.M. El-Khatib, Development of electroless Ni–P modified
aluminium substrates in a simulated fuel cell environment, J. Industrial & Engineering
Chemistry 2015; 30: pp. 239-248.
[144] A. E. Fetohi , R.M. A. Hameed , K.M. El-Khatib , E. R. Souaya, Study of different
aluminium alloy substrates coated with N-C0-P as metallic bipolar plates for PEM fuel cell
applications, Inter. J. Hydrogen Energy , 2012 ; 37: pp. 10807- 10817.
[145] C-K Lee, Electroless Ni–Cu–P/nano-graphite composite coatings for bipolar plates of
proton exchange membrane fuel cells, J. Power Sources, 2012 220: pp. 130-137.
[146] T. Fukutsuka, T. Yamaguchi, S-I Miyano, Y. Matsuo, Y. Sugie, Z. Ogumi, Carbon-coated
stainless steel as PEFC bipolar plate material , J. Power Sources 2007; 174 (1) : pp. 199-
205.
[147] K. Feng, X. Cai, H. Sun, Z. Li, P. K. Chu, Carbon coated stainless steel bipolar plates in
polymer electrolyte membrane fuel cells, Diamond and Related Materials, 2010;19 (11):
pp. 1354-1361
270
[148] Y. Show, Electrically conductive amorphous carbon coating on metal bipolar plates for
PEFC. Surface and Coatings Techn. 2007; 202 (4–7) : pp. 1252-1255.
[149] P. Yi, L. Peng, L. Feng, P. Gan, X. Lai, Performance of a proton exchange membrane fuel
cell stack using conductive amorphous carbon-coated 304 stainless steel bipolar plates, J.
Power Sources 2010; 195(20): pp. 7061-7066.
[150] W-L. Wang, S-M He, C-H Lan, Protective graphite coating on metallic bipolar plates for
PEMFC applications, Electrochimica Acta 2012; 62: pp. 30-35.
[151] H. Husby, O.E. Kongstein, A. Oedegaard, F. Seland, Carbon-polymer composite coatings
for PEM fuel cell bipolar plates, Inter Journal of Hydrogen Energy 2014; 39 (2): pp. 951-
957.
[152] C-Y Chung, S-K Chen, P-J Chiu, M-H Chang, T-T Hung, T-H Ko, Carbon film-coated 304
stainless steel as PEMFC bipolar plate, J. Power Sources 2008; 176 (1): pp. 276-281.
[153] N-W Pu, G-N. Shi, Y-M. Liu, X. Sun, J-K. Chang, C-L Sun, M-D Ger, C-Y. Chen, P-C.
Wang, Y-Y. Peng, C-H. Wu, S. Lawes, Graphene grown on stainless steel as a high-
performance and ecofriendly anti-corrosion coating for polymer electrolyte membrane fuel
cell bipolar plates, J. Power Sources 2015; 282: pp. 248-256.
[154] A. C. Stoot, L. Camilli, S-A Spiegelhauer, F. Yu, P. Bøggil, Multilayer graphene for long-
term corrosion protection of stainless steel bipolar plates for polymer electrolyte membrane
fuel cells, J. Power Sources 2015; 293: pp. 846-851.
[155] S-J. Lee, C-H. Huang, Y-P. Chen, Investigation of PVD coating on corrosion resistance of
metallic bipolar plates in PEM fuel cell, J. Materials Processing Techn. 2003; 140: pp.
688–693.

271
[156] Y. Suzuki, M. Watanabe, T. Toda and T. Fujii, Development of electrically conductive
DLC coated stainless steel separators for polymer electrolyte membrane fuel cell , J. Phys. :
Conf. Ser. 2013; 441 012027: pp1-6.
[157] S. Joseph, J.C. McClure, R. Chianelli, P. Pich, P.J. Sebastian, Conducting polymer- coated
stainless steel bipolar plates for proton exchange membrane fuel cells (PEMFC), Inter. J.
Hydrogen Energy 2005; 30: pp. 1337-1344.
[158] S. Joseph, J.C. McClure, R. Chianelli, P. Pich, P.J. Sebastian, J. Moreira, E. Valenzuela
Polyaniline and polypyrrole coatings on aluminium for PEM fuel cell bipolar plates, J.
Power Sources 2008;77 (1): pp. 161-166.
[159] Y. Wang and D. Northwood, An investigation into polypyrrole-coated 316L stainless steel
as a bipolar plate material for PEM fuel cells, J. Power Sources 2006; 163 (1): pp. 500-
508.
[160] W.J. Pech-Rodríguez, D. González-Quijano, G. Vargas-Gutiérrez, F.J. Rodríguez-Varela,
Electrophoretic deposition of polypyrrole/Vulcan XC-72 corrosion protection coatings on
SS-304 bipolar plates by asymmetric alternating current for PEM fuel cells, Inter. J.
Hydrogen Energy 2014;39 (29): pp. 16740-16749.
[161] L-J Yang, H-J Yu,L. Jiang, L. Zhu , X-Y Jian, Z. Wang, Graphite –polypyrrole coated
316L stainless steel as bipolar plates for proton exchange membrane fuel cells. Inter .J.
Minerals, Metallurgy and Materials 2011; 18 (1): pp. 53-58.

272
[162] Y. Wang and D. Northwood, Optimization of the polypyrrole-coating parameters for
proton exchange membrane fuel cell bipolar plates using the Taguchi method, J. Power
Sources 2008; 185 (1): pp. 226–232
[163] Y-B Lee, C-H Lee, D-S Lim, The electrical and corrosion properties of carbon nanotube
coated 304 stainless steel/polymer composite as PEM fuel cell bipolar plates, Inter. J.
Hydrogen Energy 2009; 34 (24) : pp. 9781-9787.
[164] J.R. Mawdsley, J.D. Carter, X. Wang, S. Niyogi, C.Q.Fan, R. Koc, G.Osterhout,
Composite-coated aluminium bipolar plates for PEM fuel cells. J. Power Sources 2013;
231: pp. 106-112.
[165] Y. Fu, M. Hou, H. Xu, Z. Hou, P. Ming, Z. Shao, B. Yi, Ag–polytetrafluoroethylene
composite coating on stainless steel as bipolar plate of proton exchange membrane fuel
cell, J. Power Sources 2008; 182 (2): pp. 580 - 584.
[166] Y. Show, K. Takahashi, Stainless steel bipolar plate coated with carbon nanotubes
(CNT)/polytetrafluoroethylene (PTFE) composite film for proton exchange membrane fuel
cell (PEMFC), J. Power Sources 2009; 190 (2): pp. 322-325.
[167] W. Yuan, Y. Tang, X. Yang, Z. Wan, Porous metal materials for polymer electrolyte
membrane fuel cells – A review .Applied Energy 2012; 94: pp. 309-329.
[168] A. Kumar, R. G. Reddy , Materials and design development for bipolar/end plates in fuel
cells. J. Power Sources 2004; 129 (1) : pp. 62-67.

273
[169] B-T. Tsai, C-J. Tseng, Z-S.Liu, C-H.Wang, C-I Lee, C-C.Yang, S-K.Lo, Effects of flow
field design on the performance of a PEM fuel cell with metal foam as the flow distributor,
Inter. J. Hydrogen Energy 2012; 37 ( 17): pp. 13060-13066.
[170] O. J. Murphy, A. Cisar, E.Clarke, Low-cost light weight high power density PEM fuel cell
stack, Electrochimica Acta 1998; 43 ( 24) : pp. 3829-3840.
[171] C-J. Tseng, B. T. Tsai, Z-S. Liu, T-C. Cheng, W-C. Chang, S-K Lo, A PEM fuel cell with
metal foam as flow distributor , Energy Conversion and Management 2012; 62 : pp. 14-21.
[172] A. Kumar, R.G Reddy Modelling of polymer electrolyte membrane fuel cell with metal
foam in the flow-field of the bipolar/end plates, J. Power Sources 2003; 114 (1) : pp. 54-62.
[173] J. O'Donoghue, D. Haverty, Method of Doping Surfaces, PCT Application:
WO2008/033867, (2008).
[174] F. Tan, M. Nasiri, M. Al-Rubeai, In vitro osteoblastic cell activity on Bioglass-derived
bioceramic surfaces deposited by a novel CoBlast™ technique, J. Biotechnology 2012;150:
pp. 454 - 456.
[175] F. Tan, M. Naciri, D. Dowling, M. Al-Rubeai, In vitro and in vivo bioactivity of CoBlast™
hydroxyapatite coating and the effect of impaction on its osteoconductivity, Biotechnology
Advances 2012; 30 (1): pp. 352-362.
[176] J.N. Barry, B. Twomey, A. Cowley, L. O'Neill, P.J. McNally, D.P. Dowling, Evaluation
and comparison of hydroxyapatite coatings deposited using both thermal and non-thermal
techniques, Surface & Coatings Techn. 2013; 226: pp. 82-91.

274
[177] D. Fleming, L. O'Neill, G. Byrne, N. Barry, D. P. Dowling, Wear resistance enhancement
of the titanium alloy Ti–6Al–4V via a novel co-incident microblasting process, Surface &
Coatings Techn. 2011; 205(21–22): pp 4941-4947.
[178] J. G. Carton, N. Cobbe, J. O'Donoghue, L. Pambaguian, A. Norman, V. Liedtke, T.
McCaul, Aerospace material and process: making next generation design possible
(AEROMAT Conference and Exposition, USA, ). June 18-21, 2012.
[179] M. Saxena, B. K. Prasad, T. K. Dan, Corrosion characteristics of aluminium alloy graphite
particulate composite in various environments, J. of Materials science 1992; 27(17), pp
4805-4812.
[180] E. M. Sherif, A. A. Almajid, F. H. Latif, H. Junaedi, Effects of Graphite on the Corrosion
Behavior of Aluminum Graphite Composite in Sodium Chloride Solutions, Int. J.
Electrochem. Sci. 2011; 6, pp. 1085 - 1099
[181] M. C. Galetz, Coatings for Superalloys, Superalloys, Dr. M. Aliofkhazraei (Ed.), (2015).
InTech, DOI: 10.5772/61141. Available from:
http://www.intechopen.com/books/superalloys/coatings-for-superalloys (last accessed
07/05/2016)
[182] R. Bianco, R. A. Rapp, Pack cementation diffusion coatings, Metallurgical and Ceramic
Protective Coatings Netherlands: Springer Science & Business Media; 978-94-009-1501-5,
1996, pp. 236-260.
[183] A.R. Castle, D.R. Gabe, Chromium diffusion coatings, Int. Mat. Rev. 1999; 44 (2): pp.
37–59.

275
[184] E. Kasprzycka, Chromizing, Encyclopedia of Tribology New York, Springer Science &
Business Media 978-0-387-92897-5, 2013, pp. 382-387.
[185] Z.D. Xiang, P.K. Datta, Relationship between pack chemistry and aluminide coating
formation for low-temperature aluminisation of alloy steels, Acta Materialia 2006; 54, pp.
4453–4463.
[186] K.D. Ralston, D. Fabijani, R.T. Jones, N. Birbilis, Achieving a chromium rich surface upon
steels via FBR-CVD chromising treatments, Corros. Sci. 2011; 5: pp. 2835–2842.
[187] Y-W Chung, Introduction to Materials Science for Engineers, Taylor and francis group,
florida,USA
[188] N. V. Bangaru, R. C. Krutenat, Diffusion Coatings of Steels: Formation Mechanism
and Microstructure of Aluminized Heat-Resistant Stainless Steels, J. Vac. Sci.
Techn. 1984; 2: pp. 806-815.
[189] C. Lopez, A. Kvryan, S. Kasnakjian, A. Coronado, S. Sujittosakul, O.
Villalpando,V. Rav, Effect of Austenite Stability on Pack Aluminizing of Austenitic
Stainless Steels, JOM 2015; 67: pp. 61-67.
[190] Iron-carbon diagram. [Online]. Available:http://www.tf.uni-
kiel.de/matwis/amat/mw1_ge/kap_8/illustr/i8_4_1.html(Last accessed on
21/01/2016).
[191] H.S. Khatak, B. Rav, Corrosion of Austenitic Stainless Steels: Mechanism,
Mitigation and Monitoring, 2002, Alpha Science International Ltd, UK.

276
[192] S.R. Collins, P.C. Williams, and S.V. Marx, A. Heuer, F. Ernst, and H. Kahn, Low-
Temperature Carburization of Austenitic Stainless Steels, ASM Handbook, Volume
4D, Heat Treating of Irons and Steels, ASM International 2014: pp. 451 – 460.
[193] S.S. Hosmani, P. Kuppusami, R.K. Goyal, An Introduction To Surface Alloying of
Metals India , Springer Briefs in Applied Sciences and Technology 978-81-322-
1888-3. 2014.
[194] S.L.C. Ferreira, R.E. Bruns, H.S. Ferreira, G.D. Matos, J.M. David, G.C. Brandao,
E.G.P. da Silva, L.A. Portugal, P.S. dos Reis, A.S. Souz, W.N.L. dos Santos, Box-
Behnken design: An alternative for the optimization of analytical methods, Analytica
Chimica Acta 2007; 597, pp. 179–186.
[195] D.C. Montgomery, Design and analysis of experiments, John Wiley & Sons Inc
2013.
[190] R.H. Myers and D.C. Montgomery, Response surface methodology, Wiley, 2002.
[197] M. Mourabet, A. El Rhilassi, M. Bennani-Ziatni, A. Taitai, Comparative Study of
Artificial Neural Network and Response Surface Methodology for Modelling and
Optimization the Adsorption Capacity of Fluoride onto Apatitic Tricalcium
Phosphate, Universal J. Applied Mathematics 2014; 2 (2), pp. 84-91.
[198] H. Ebrahimifar, M. Zandrahimi, B. Nikrooz, M. Sedighi, Production of cobalt anti-
corrosion coating on AISI 430 steel-Optimization using Box-Behnken experimental
designs, Indian J. Chemical Techn. 2013; 20: pp.40-45.

277
[199] B. Nikrooz, M. Zandrahimi, Optimization of process variables and corrosion
properties of a multi-layer silica sol gel coating on AZ91D using the Box–Behnken
design, J. Sol-Gel Sci. Techn. 2011; 59: pp. 640–649.
[200] R. Soleimani, F. Mahboubi, S.Y. Arman, M. Kazemi, A. Maniee, Development of
mathematical model to evaluate microstructure and corrosion behaviour of
electroless Ni–P/nano-SiC coating deposited on 6061Al alloy, J. Industrial & Engr.
Chemistry 2015; 23:pp. 328–337.
[201] L. Naiming, X. Faqin, W. Xiangqing, T. Wei, Influence of process parameters on
thickness and wear resistance of rare earth modified chromium coatings on P110
steel synthesized by pack cementation, J. of Rare earths 2011, 29 (4): pp. 396-400.
[202] Scanning Electron Microscopy. [Online], Available:
www.purdue.edu/ehps/rem/rs/sem.htm (Last accessed on 04/01/2016).
[203] Scanning Electron Microscopy & Energy Dispersive X-Ray Spectroscopy. [Online].
Available: http://www.surfgroup.be/semedx. (Last accessed on 04/01/2016)
[204] M. Ohring, Engineering Material science, Academic press, London 1995 pp 96.
[205] X-ray photoelectron spectroscopy. [Online] Available: https://en.wikipedia.
org/wiki/X-ray_photoelectron_spectroscopy. (Last accessed on 04/01/2016).
[206] J. Conolly ‘‘On the use of atmospheric and laser plasmas for biomedical
applications’’ PhD thesis, Dublin City University, 2012.

278
[207] N. Perez, Electrochemistry and corrosion science, Kluwer academic publishers
Boston 2004.
[208] E. McCafferty, Validation of corrosion rates measured by the Tafel extrapolation
method, Corrosion Science 2005; 47: pp. 3202–3215.
[209] J.R Davis, Corrosion: understanding the basic ASM international Material Park,
Ohio.
[210] D.A. Jones, Principles and prevention of corrosion, second edition, Prentice-Hall,
Inc. 1996.
[211] Y. Tan, Heterogeneous electrode process and localised corrosion, John Wiley and
Son Inc. 2013.
[212] E.E. Stansbury, R.A. Buchanan, Fundamentals of Electrochemical Corrosion, ASM
International, Ohio, 2000
[213] R. L. Borup and N. E. Vanderborgh, Design and Testing Criteria for Bipolar Plate
Materials for PEM Fuel Cell Applications. Materials Research Society Proceedings,
USA 1995; 393, 151 doi:10.1557/PROC-393-151.
[214] G. Hinds, E. Brightman, Towards more representative test methods for corrosion
resistance of PEMFC metallic bipolar plates, Inter. J. Hydrogen Energy 40 (2015)
2785 -2791.

279
[215] Th. Uelzen, J. Müller, Wettability enhancement by rough surfaces generated by thin
film technology Thin Solid Films 2003; 434 (1–2) : pp. 311-315.
[216] R. N. Wenzel, Surface Roughness and Contact Angle, J. Phys. Chem. 1949; 53 (9):
pp. 1466–1467.
[217] H. Nakaea, R. Inui, Y. Hirata, H. Saito, Effects of surface roughness on wettability
Acta Materialia 1998; 46 (7):pp. 2313-2318.
[218] NIST X-ray Photo spectroscopy Database 20 version 4.1 [online] Available:
http://srdata.nist.gov/xps/main_search_menu.aspx (last accessed 04/01/2016).
[219] A. Lippitz, Th. Hübert, XPS investigations of chromium nitride thin films, Surface
& Coatings Techn. 2005; 200 (1–4): pp.250-253.
[220] A. Conde, A.B. Cristóbal, G. Fuentes, T. Tate, J. de Damborenea, Surface analysis
of electrochemically stripped CrN coatings, Surface & Coatings Techn. 2006; 201
(6-4): pp.3588-3595.
[221] C. Pirlot, J. Delhalle, J.J. Pireaux, Z. Mekhalif, Surface modification of
polycrystalline iron surfaces by n-dodecanethiol: an XPS investigation, Surface &
Coatings Techn. 2001; 138 (2-3): pp. 166-172.
[222] W.H. Lee, C.Y. Hyun, XPS study of porous dental implants fabricated by electro-
discharge-sintering of spherical Ti–6Al–4V powders in a vacuum atmosphere,
Applied Surface Science 2006; 252 (12) : pp. 4250-4256.

280
[223] M. Multigner, S. Ferreira-Barragáns, E. Frutos, M. Jaafar, J. Ibáñez, P. Marín, M.T.
Pérez-Prado, G. González-Doncel, A. Asenjo, J.L. González-Carrasco, Superficial
severe plastic deformation of 316 LVM stainless steel through grit blasting : Effects
on its microstructure and subsurface mechanical properties , Surface & Coatings
Techn. 2010; 205 (7): pp. 1830-1837.
[224] O. Unal, R. Varol, Surface severe plastic deformation of AISI 304 via conventional
shot peening, severe shot peening and re-peening, Applied Surface Science 2015;
351: pp. 289-295.
[225] T. Balusamy, T.S.N. Narayanan, K. Ravichandran, Il S. Park, M. H. Lee, Influence
of surface mechanical attrition treatment (SMAT) on the corrosion behaviour of
AISI 304 stainless steel, Corros. Sci. 2013; 74: pp.332-344.
[226] W. Li, D. Y. Li, Influence of surface morphology on corrosion and electronic
behavior, Acta Materialia 2006; 54: pp. 445-452.
[227] M. Browne, P.J Gregson, Effect of mechanical surface pre-treatment on metal ion
release, Biomaterials 2000; 21 (4): pp. 385-392.
[228] H. Dong, Y. Sun, T. Bell, Enhanced corrosion resistance of duplex coatings, Surface
& Coatings Techn. 1997; 90 (1-2): pp. 91-101.
[229] J. Munemasa, T. Kumakiri, Effect of the surface roughness of substrates on the
corrosion properties of films coated by physical vapour deposition, Surface & Coatings
Techn. 1991; 49 (1-3): pp. 496-499.

281
[230] C. Liu, A. Leyland, S. Lyon, and A. Matthews, An a.c. impedance study on PVD
CrN-coated mild steel with different surface roughness, Surface and Coatings Techn.
1995; 76–77: pp. 623-631.
[231] S.D. Lu, Z.B. Wang, K. Lu, Enhanced chromizing kinetics of tool steel by means of
surface mechanical attrition treatment, Materials Science and Engineering: A 2010;
527 (4–5): pp. 995-1002.
[232] Z.B. Wang, J. Lu, K. Lu, Wear and corrosion properties of a low carbon steel
processed by means of SMAT followed by lower temperature chromizing treatment,
Surface and Coatings Techn. 2006; 201 (6): pp. 2796-2801.
[233] W. Li, D.Y. Liu, Variations of work function and corrosion behaviors of deformed
copper surfaces, Applied Surface Science 2005; 240 (1- 4): pp. 388-395.
[234] S.M. Alvarez, A. Bautista, F. Velasco, Influence of strain-induced martensite in the
anodic dissolution of austenitic stainless steels in acid medium, Corros Sci. 2013; 69:
pp.130-138.
[235] M. Detroye, F. Reniers, C. Buess-Herman, J. Vereecken, AES–XPS study of
chromium carbides and chromium iron carbides, Applied Surface Sci. 1999;144–
145: pp. 78–82.
[236] N. Tabet , I. Allam , R.C, Yin, X-ray photoelectron spectroscopy investigation of the
carburization of 310 stainless steel , Applied Surface Science 2002; 195 : pp. 166–
174.

282
[237] F. Otsubo, K. Kishitake, T. Akiyama, T. Terasaki, Characterization of blasted
austenitic stainless steel and its corrosion resistance, J. Thermal Spray Techn. 2003;
12 (4) : pp. 555-559.
[238] C. Galván, L. Saldaña, M. Multigner, A. Calzado-Martín, M. Larrea, C. Serra, N. Vilaboa,
J. L. González-Carrasco , Grit blasting of medical stainless steel: implications on its
corrosion behavior, ion release and biocompatibility, J. of Materials Science: Materials in
Medicine 2012; 23(3): pp. 657-666.
[239] E. Çelik, A.Ş. Demirkıran, E. Avcı, Effect of grit blasting of substrate on the corrosion
behaviour of plasma-sprayed Al2O3 coatings, Surface & Coatings Techn. 1999; 116–119:
pp. 1061-1064.
[240] J. Bhandari, F. Khan, R. Abbassi, V. Garaniya, R. Ojeda, Modelling of pitting
corrosion in marine and offshore steel structures – A technical review, J. Loss
prevention in the process industries 2015; 37: pp. 39-62.
[241] F. A. P. Fernandes, S. C. Heck, C. A. Picon, G. E. Totten , L. C. Casteletti, Wear and
corrosion resistance of pack chromised carbon steel, Surface Engineering, 2012; 28
(5) : pp. 313-317.
[242] J. Creus, H. Mazille, H. Idrissi, Porosity evaluation of protective coatings onto steel,
through electrochemical techniques, Surf. Coat. Technol. 2000; 130, pp. 224–232.
[243] H. Dong, Y. Sun, T. Bell, Enhanced corrosion resistance of duplex coatings, Surface
and Coatings Technol. 1997; 90, pp. 91-101.

283
[244] L. Castaldi, D. Kurapov, A. Reiter, V. Shklover, J. Patscheide, Tuning the
crystallographic and electronic properties of chromium oxynitride films, J. Appl.
Phys. 2011; 109, pp. 053720-1 – 053720-7.
[245] I. Milošev, H.-H. Strehblow, B. Navinšek, XPS in the study of high-temperature
oxidation of CrN and TiN hard coatings, Surface and Coatings Techn. 1995;74–75:
pp. 897-902.
[246] J-W Lee, J-G Duh, S-Y Tsai, Corrosion resistance and microstructural evaluation of
the chromized coating process in a dual phase Fe-Mn-Al-Cr alloy, Surface &
Coatings Techn. 2002; 153 (1): pp. 59-66.
[247] G.H. Meier, C. Cheng, R.A. Perkins, W. Bakker, Diffusion chromizing of ferrous
alloys, Surface and Coatings Techn. 1989; 39–40(1): pp. 53-64.
[248] J-W Lee, J-G Duh, Evaluation of microstructures and mechanical properties of
chromized steels with different carbon contents, Surface and Coatings Technology
2004; 177–178: pp. 525-531.
[249] C. C. Mohan, A. Prabhath, A. M Cherian, S. Vadukumpully, S. V. Nair, K.
Chennazhi, D. Menon, Nanotextured stainless steel for improved corrosion
resistance and biological response in coronary stenting, Nanoscale 2015; 7, pp. 832–
841.

284
[250] Y. Peng, J. Gong , Y. Jiang, M. Fu, D. Rong, The effect of plastic pre-strain on low-
temperature surface carburization of AISI 304 austenitic stainless steel, Surface &
Coatings Technol. 2016; 304 : pp. 16–22.
[251] S. Iorga, M. Cojocaru, A. Chivu, S. Ciuca, M. Burdusel, P. Badica, C. D. Leuvrey,
G. Schmerber, C. Ulhaq-Bouillet, S. Colis, Influence of the Carbo-Chromization
Process on the Microstructural, Hardness, and Corrosion Properties of 316L Sintered
Stainless Steel, Metallurgical & Materials transaction A 2014: pp. 3089-3096.
[252] H. Huang, X. Feng, C. Du, S. Wu and W. Song, One-step pyrolytic synthesis of
small iron carbide nanoparticles/3D porous nitrogen-rich graphene for efficient
electro-catalysis, J. Mater. Chem. A 2015; 3: pp. 4976–4982.
[253] N. A. Kumar, H. Nolan, N. McEvoy, E. Rezvani., R. L. Doyle, M. E. G. Lyons, G.
S. Duesberg, Plasma-assisted simultaneous reduction and nitrogen doping of
graphene oxide nanosheets, J. Mater. Chem. A 2013; 1, pp.4431–4435
[254] V. V. Nikam, R. G. Reddy, S. R. Collins, P. C. Williams, G. H. Schiroky, G. W.
Henrich, Corrosion resistant low temperature carburized SS 316 as bipolar plate
material for PEMFC application, Electrochimica Acta 2008; 53 (6): pp. 2743-2750.
[255] M. Andrei, F. di Gabriele, P. L. Bonora, D. Scantlebury, Corrosion behaviour of
magnesium sacrificial anodes in tap water, Materials and corrosion 2003 ;54: pp. 5-
11.

285
[256] E. McCafferty, Introduction to Corrosion Science, Springer Science + Business
Media, New York, 2010: pp. 49.

286
APPENDIX I
The value range of the selected process parameters for the design of experiments for
chromised coatings was selected based on values reported in the literature as explained
below:
I. Temperature
Temperature range for pack chromisation is commonly reported to be conducted at
temperatures above 1000 oC because the coating growth mechanism is limited by diffusion and
chemical reaction kinetics [3]. Lin et al. [4] reported that temperatures ≤ 900 oC were
unsuitable for diffusion coatings as the coating had a high volume of pores. As temperature
increased to 950 oC porosity was reduced but increased at 1000
oC with finer grains. However,
substrate composition affects chromised coating characteristics. Hence, experiments to confirm
if 900 oC was suitable for stainless steel were also performed, porous coatings was obtained as
shown in Figure 119 (a) below. The coatings obtained at 1000 oC had a lower porosity (Figure
119 (b)). The coatings obtained at 1000 oC also exhibited a higher thickness than that obtained
at 900 oC. Therefore, the lower level of the temperature range was chosen to be 1000
oC as the
lower the volume of the defects the better will be the corrosion performance of the surface.
Researchers at the Korea University, South Korea [1, 2, 5] had reported chromised stainless
steel produced at 1050 oC and 1100
oC for PEM fuel cell bipolar plate applications.
Temperatures above 1100 oC are possible. However, it is known that as temperature increases
grain size of diffusion coating increases and corrosion resistance decreases with increase in
grain size [6, 7], hence, temperature higher than 1100oC was not considered.

287
Figure 119 Surface morphology of chromised 304 stainless steel produced at (a) 1000 oC
and (b) 1100 oC for 3 hours

288
II. Time
The lower end of the time range was selected to be 3 hours based on the following work in the
literature:
Table 30 Time range reported for pack chromising process in the literature.
Material Duration/ temperature References
Chromised 316
stainless steel
2.5 hours /1100 o
C
1
Chromised 316
stainless steel
2.5 hours / 1050 o
C
2
Chromised 316
stainless steel
3 hours / 1100 oC
5
Chromised 316, 304, 409
stainless steel
3 hours / 1000 oC
8
In order to obtain a reasonable thickness and good surface morphology, 2 hours was not
considered. Also, 2.5 hours was rounded to 3 hours in order to avoid fractions.
Time of 9 hours was chosen at the upper limit based on Cho et al [1] work wherein chromised
stainless steel was produced at 10 hours. However, 9 hour was considered instead of 10 hours
because:
1. Ralston et al. [8] had shown that the thickness achieved with chromising 304 stainless steel
at 1000 oC for 3 hours was twice that achieved with 316 stainless steel at the same
processing conditions. Hence, it may be possible to achieve the same or higher thickness
achieved at 10 hours with 316 stainless steel at 9 hours given that Ref. 9 and 10 have

289
shown that the thickness of diffusion coatings in austenitic stainless steels is related to its
austenite stability, which is related to the Ni content of the austenitic stainless steel. Hence,
diffusion coatings formed with 304 stainless can achieve higher thickness than 316
stainless steels under similar processing conditions.
2. Health and safety regulation of the School of Mechanical & Manufacturing Engineering,
Dublin City University, Ireland does not permit the use of the furnace beyond working
hours. Hence, the maximum time that could be achieved was 9 hours.
III. Activator content
The literature on pack cemented coatings have indicated that insufficient or excess activator
content can yield defective chromised coatings [11-13] , hence, 1 and 2 wt. % were not
considered. 3-7 wt. % activator content was chosen based on the activator content reported in
Ref. [1], [2] and [5].
References
1. K.H. Cho, W.G. Lee, S.B. Lee, H. Jang, Corrosion resistance of chromized 316L stainless steel
for PEMFC bipolar plates, J. Power Sources 2008; 178: pp. 671–676.
2. S.B. Lee, K.H. Cho, W.G. Lee, H. Jang, Improved corrosion resistance and interfacial contact
resistance of 316L stainless-steel for proton exchange membrane fuel cell bipolar plates by
chromizing surface treatment, J. Power Sources 2009; 187: pp. 318–323.
3. Z.B. Wang , J. Lu, K. Lu, Wear and corrosion properties of a low carbon steel processed by
means of SMAT followed by lower temperature chromizing treatment, Surface & Coatings
Technology 2006; 201: pp. 2796–2801

290
4. N. Lin, F. Xie, T. Zhong, X. WU , W. Tian, influence of process parameters on thickness and
wear resistance of rare earth modified chromium coatings on P110 steel synthesized by pack
cementation, J. Rare Earths 2010; 28: pp. 301-304.
5. L. Yang, H. Yu, L. Jiang, L. Zhu, X. Jian, Z. Wang, Improved anticorrosion properties and
electrical conductivity of 316L stainless steel as bipolar plate for PEM fuel cell by lower
temperature chromizing treatment, J. Power Sources 2010; 195: pp. 2810–2814.
6. K.D. Ralston, N. Birbilis and C.H.J. Davies, Revealing the relationship between grain size and
corrosion rate of metals, Scripta Materialia 2010; 63: pp. 1201–1204.
7. K.D. Ralston, N. Birbilis, Effect of grain size on corrosion: a review, Corrosion 2010; 66: pp.
075005-0750013.
8. K.D. Ralston, D. Fabijanic, R.T. Jones, N. Birbilis, Achieving a chromium rich surface upon
steels via FBR-CVD chromising treatments, Corro. Sci. 2011, 53 (9): pp. 2835–2842.
9. N. V. Bangaru, R. C. Krutenat, Diffusion Coatings of Steels: Formation Mechanism and
Microstructure of Aluminized Heat-Resistant Stainless Steels, J. Vac. Sci. Techn. 1984; 2: pp.
806-815.
10. C. Lopez, A. Kvryan, S. Kasnakjian, A. Coronado, S. Sujittosakul, O. Villalpando,V. Rav,
Effect of Austenite Stability on Pack Aluminizing of Austenitic Stainless Steels, JOM 2015;
67: pp. 61-67.
11. H. Ebrahimifar, M. Zandrahimi, B. Nikrooz, M. Sedighi,Production of cobalt anti-corrosion
coating on AISI 430 steel-Optimization using Box-Behnken experimental designs, Indian J.
Chemical Techn. 2013; 20: pp. 40 -45.

291
12. D. Chaliampalias, G. Stergioudis, S. Skolianos, G. Vourlias, The effect of the deposition
temperature and activator concentration on the structure of NiCrBSi coatings deposited on low
carbon steels by pack cementation process, Material letters 2008; 62: pp. 4091–4093.
13. H. Ebrahimifar, M. Zandrahimi, Mn coating on AISI 430 ferritic stainless steel by pack
cementation method for SOFC interconnect applications, Solid State Ionics 2011; 183: pp. 71–
79.

292
APPENDIX II
(A) Safety procedures for Acid preparation
The following precautionary measures were taken during the acid preparation;
An acid preparation zone was cut off to prevent entry of other persons in the area with
warning signs of ‘H2SO4 + HF in use’ in place. At least one other person was around when
the acids were prepared.
Acid preparation was conducted in a fume hood to avoid inhalation of toxic acidic vapor.
Calcium gluconate gel (antidote for HF) was kept in the vicinity of the fume hood where
the acids were prepared.
Nearest phone and emergency response number were kept closed to the working area.
The following personal protective equipment (PPE) were used in the course of acids
preparation:
o Eye goggles and face shield were worn during acid preparation.
o A laboratory coat with a chemical splash apron and a shoe cover made from natural
rubber was used during the acid preparation.
o Gloves - A pair of medium weight natural rubber gloves and nitrile gloves were
worn during acid preparation to prevent body contact with both dilute and
concentrated acids
The prepared acids were stored in polyethylene containers and kept in designated cabinets.

293
All hardware used for acid preparation were immediately rinsed with water and soaked in
soapy solution for some days after which it was washed, rinsed and stored in designated
places.
(B) Safety procedures for experiments with HF acid
The following safety procedures were observed in running experiments involving HF acid:
1. Standard laboratory PPE (a pairs of neoprene gloves, goggles, nose cover and a fully
buttoned lab coat) were worn before commencement of experiment.
2. All experiments involving acid mixture containing 2 ppm HF was carried out in
designated fume hood or extraction hood. Appropriate signs: “ DANGER – H2SO4 & HF
ACID IN USE” signs were displayed on the fume hood and cabinet door throughout the
experiments.
3. The fume hood sash was open to a maximum of 25cm to prevent inhalation while,
secondary containers were used to contain spillage.
4. Calcium gluconate gel (antidote for HF acid) was kept in the vicinity of the fume hood or
extractor where the experiments were conducted. Other people in the laboratory were also
notified of the location of the gel.
5. Nearest phone and emergency response number were kept closed to the working area.
6. Everyone in the laboratory was notified of the use of hazardous chemicals (i.e. HF and
H2SO4). Experiments involving these chemicals were conducted during working hours
only with at least one other person present in the laboratory.

294
7. All equipment used were specifically designed for use with acids and washed thoroughly
with soap and rinsed in running water after use.
8. Nearest water source, safety shower and eye wash were identified before commencement
of the experiments.
(C) Safety procedures for experiments with hydrogen gas
1. Personal protective equipment: Pair of neoprene gloves, goggles, nose shield and a fully
buttoned laboratory coat was worn before commencement of experiments. Danger signs:
“HYDROGEN GAS IN USE’ was displayed on fume hood and designated areas.
2. Hydrogen gas cylinder was chained down as shown in Figure120 to prevent toppling.
Figure 120 (a) Hydrogen gas regulator b) hydrogen leak sensor and extraction hood
3. All experiments involving hydrogen gas were conducted in designated fume or extraction
hoods used. Hydrogen leak sensors were also in place in case of leakage.

295
4. Low pressures (1 to 3 bar gauge) and extremely low flow rates (20 - 50 ml/min) were used
in the experiments.
5. Hydrogen rated, fittings, piping, gauges were used as flow controllers and pressure fittings
were used throughout the experimental apparatus.
6. Fire extinguishers and fire blankets were readily available in the laboratory.

296
APPENDIX III
I. Tafel plots for chromised 304 stainless steels in 0.5 M H2SO4 + 2 ppm at 70 oC
1E-7 1E-6 1E-5 1E-4
-0.4
-0.2
0.0
0.2
0.4
0.6
0.8
Po
ten
tia
l (V
vs
Ag
/Ag
Cl)
Log current density (A/cm2)
R6
R3
R1
R9
1E-8 1E-7 1E-6 1E-5 1E-4
-0.4
-0.2
0.0
0.2
0.4
0.6
Po
ten
tia
l (V
vs
. A
g/A
gC
l)
Current density (A/cm2 )
R16
R13
R17
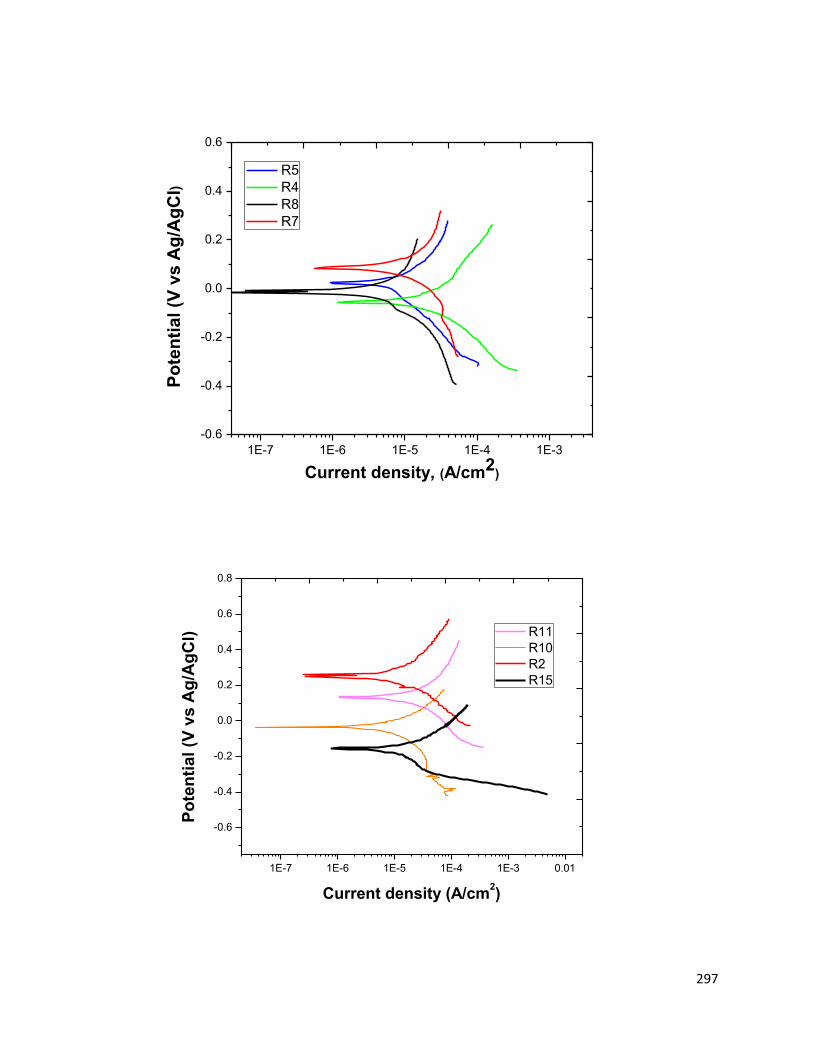
297
1E-7 1E-6 1E-5 1E-4 1E-3
-0.6
-0.4
-0.2
0.0
0.2
0.4
0.6
Po
ten
tia
l (V
vs A
g/A
gC
l)
Current density, (A/cm2)
R5
R4
R8
R7
1E-7 1E-6 1E-5 1E-4 1E-3 0.01
-0.6
-0.4
-0.2
0.0
0.2
0.4
0.6
0.8
Po
ten
tial (V
vs A
g/A
gC
l)
Current density (A/cm2)
R11
R10
R2
R15

298
1E-7 1E-6 1E-5 1E-4
-0.4
-0.2
0.0
0.2
0.4
0.6
Po
ten
tia
l (V
vs
. A
g/A
gC
l)
Current density (A/cm2
)
R14
R9
R12

299
II. Cross sectional SEM images of chromised 304 stainless steel.

300

301


![[CONFERENCE PAPER] Bipolar Bozuklukta BDT](https://static.fdokumen.com/doc/165x107/63328d1f4e0143040300b9b3/conference-paper-bipolar-bozuklukta-bdt.jpg)