DESEVO-DISSERTATION-2013.pdf - UTSW DSpace Home
242
MIR-10a REGULATION OF DRUG RESPONSE AND CANCER STEM CELL POPULATIONS IN NON-SMALL CELL LUNG CARCINOMAS APPROVED BY SUPERVISORY COMMITTEE Alexander Pertsemlidis, Ph.D. (Mentor) John D. Minna, M.D. (Mentor) Diego H. Castrillon M.D., Ph.D. (Chairman) Jerry W. Shay, Ph.D. Pier Paolo Scaglioni, M.D.
-
Upload
khangminh22 -
Category
Documents
-
view
3 -
download
0
Transcript of DESEVO-DISSERTATION-2013.pdf - UTSW DSpace Home

MIR-10a REGULATION OF DRUG RESPONSE AND CANCER STEM CELL POPULATIONS IN NON-SMALL CELL LUNG CARCINOMAS
APPROVED BY SUPERVISORY COMMITTEE
Alexander Pertsemlidis, Ph.D. (Mentor)
John D. Minna, M.D. (Mentor)
Diego H. Castrillon M.D., Ph.D. (Chairman)
Jerry W. Shay, Ph.D.
Pier Paolo Scaglioni, M.D.

Dedicated to: My wife Digvi K. DeSevo

miR-10a REGULATION OF PACLITAXEL RESPONSE AND CANCER STEM CELL
POPULATIONS IN NON-SMALL CELL LUNG CARCINOMAS
By
CHRISTOPHER GERARD DESEVO
Presented to the Faculty of the Graduate School of Biomedical Sciences
The University of Texas Southwestern Medical Center at Dallas
In Partial Fulfillment of the Requirements
For the Degree of
DOCTOR OF PHILOSOPHY The University of Texas Southwestern Medical Center at Dallas
Dallas, Texas
December 2013

Copyright
By
CHRISTOPHER GERARD DESEVO 2013
All Rights Reserved

AKNOWLEDGMENTS
I would like to thank Dr. Alexander Pertsemlidis for taking a chance with me and giving
me the independence I needed to grow as a scientist and reminding me that I am not as smart as I
think. I sincerely thank Dr. Liqin Du for all the training and support she provided when I first
started and for laying the ground for my entire dissertation and Dr. Minna for giving me the
resources I needed to finish my degree, valuable insights that took each project to the next level
and for welcoming me into one of the best research laboratories in the country.
I would like to thank all the members of the Minna lab for their guidance and support, in
particular Dr. Larsen and Dr. Shao for help with mouse work and experimental design, Dr.
Kenneth Huffman for all the cell lines and all the early-morning political rants, Ryan for
providing transfection conditions on the entire panel of cell lines, and Dr. Girard for all the
computational and database management help. And the rest of the Minna lab: Dr. Peyton, Dr.
Gao, Dr. Das, Patrick, Suzie, Dhurba, Robin, Rebecca, Paul, and Maithili for all the friendship,
advice, and counseling they each provided during my time in the Minna lab. I also thank Dr.
Brenda Timmons for all the support and lab management help that expedited my graduation and
the entire office staff for all their support to keep the lab running smoothly and efficiently.
I would like to thank Dr. Shay, who in addition to being a valued member of my thesis
committee, helped guide me during my transition me from each of my three labs to the next and
encouraged me not to give up. Dr. Castrillon and Dr. Scaglioni I thank for the support during my
transition and experimental design suggestions that were not only insightful, but also added to
my dissertation and publications.

I thank my parents for understanding it is okay to be in school until the age of thirty.
Mark, Peter and Blake for not only supporting my move to Dallas but also for taking care of Dig
while she finished her Master’s degree.
The reason for my success is my loving and understanding wife, who supported me while
I pursued my dreams and helped keep me sane and our home in order. Finally my “kids” Harley,
Bailey, and Prince always helped melt the stress and provided many great memories.

vii
miR-10a REGULATION OF DRUG RESPONSE AND CANCER STEM CELL IN NON-SMALL
CELL LUNG CARCINOMAS
Publication No.
CHRISTOPHER GERARD DESEVO
DOCTOR OF PHILOSOPHY
The University of Texas Southwestern Medical Center at Dallas, 2013
Supervising Professors: Dr. Alexander Pertsemlidis and Dr. John D. Minna
Phosphatidylinositol 3-kinases (PI3Ks) are enzymes involved in diverse cellular functions
including cell growth, proliferation, differentiation, motility, survival and apoptosis. Many of these
functions relate to class I PI3Ks, heterodimers composed of regulatory and catalytic subunits that convert
extracellular cues to intracellular responses upon activation. Overall, this signaling pathway is under tight
regulation and even slight perturbations can lead to aberrant pathway activation. In NSCLC cell lines, we
found that manipulation of miR-10a results in significant changes to both mRNA and protein levels of
PI3K. In the context of cellular response to front-line chemotherapeutic agents used to treat NSCLC, I
uncovered that miR-10a mimic decreases cell viability10-fold in the presence of paclitaxel relative to

drug alone, while inhibiting miR-10a results in a 10-fold increase, suggesting that high levels of miR-10a
may be predictive of response to such agents. To assess its prognostic value, we interrogated miR-10a
expression in NSCLC tumors and found that high miR-10a levels correlate with longer overall patient
survival. miRNAs can target hundreds of genes, meaning that miR-10a may regulate PIK3CA expression
both directly and indirectly. We identified the transcription factor GATA6 as both a target of miR-10a
with a predicted miR-10a target site in its 3’UTR and a regulator of PI3K expression, with several
conserved binding sites in the promoter of PIK3CA. These findings demonstrate that miR-10a regulates
the PI3K pathway at two distinct levels.
Microarray expression profiling of NSCLC cells treated with miR-10a mimic had significant
down regulation of ALDH1A3, a marker of cancer stem cells. This relationship was confirmed through
functional validation of ALDH activity. Multiple miRNA target prediction algorithms showed that
ALDH1A3 is not a direct target of miR-10a. To uncover the direct target of miR-10a we used a targeted
siRNA screen containing genes implicated in stem cell maintenance to reveal that the WNT and Notch
pathway are important for cell survival. Both pathways are down-regulated when cells are treated with a
miR-10a mimic. Bioinformatic analysis identified DVL3 as a miR-10a target gene. Manipulation of miR-
10a levels resulted in significant changes in both mRNA and protein levels of DVL3. Finally, loss of
DVL3 expression significantly decreased ALDH1A3 protein levels and the population of ALDH+ cells.
Collectively, my work has uncovered miR-10a as mediator of the potent PI3K oncogenic pathway
through both direct and indirect mechanisms, a modulator of cellular response to paclitaxel and finally its
identification in NSCLC stem cell maintenance through regulation of the WNT and NOTCH pathways.

x
Table of contents TITLE PAGE ................................................................................................................................... i
DEDICATION ............................................................................................................................... ii
TITLE PAGE ................................................................................................................................ iii
COPYRIGHT ................................................................................................................................. iv
ACKNOWLEDGMENTS ...............................................................................................................v
ABSTRACT ................................................................................................................................. viii
TABLE OF CONTENT ...................................................................................................................x
CHAPTER ONE miRNA regulation of the Hallmarks of Cancer .................................................. 1
1.1 miRNAs: Small Non-Coding RNAs That Control Gene Evolution ..................................... 1
1.1.2 An Almost Missed Opportunity ..................................................................................... 2
1.1.3 MiRNA Biogenesis ........................................................................................................ 3
1.1.4 Mechanisms of miRNA Gene Silencing ........................................................................ 5
1.1.5 MiRNA Target Recognitions ............................................................................................. 6
1.1.6 Biological Functions of miRNAs................................................................................... 8
1.2 Cancer, Broadly Defined ...................................................................................................... 9
1.2.2 Hallmarks of Cancer .................................................................................................... 11
1.2.2.1 Sustaining Proliferative Signaling ............................................................................ 11
1.2.2.2 Evading Growth Suppressors .................................................................................... 11
1.2.2.3 Resisting Cell Death ................................................................................................. 12
1.2.2.4 Enabling Replicative Immortality ............................................................................. 12
1.2.2.5 Angiogenesis ............................................................................................................. 13

1.2.2.6 Invasion and Metastasis ............................................................................................ 14
1.2.3 Emerging Hallmarks and Enabling Characteristics of Cancer .................................... 14
1.3 MiRNAs: An Overlooked Hallmark of Cancer .................................................................. 17
1.3.1 General Observations on miRNAs in Cancer .............................................................. 17
1.3.2 MiRNA Regulation of the Hallmarks of Cancer ............................................................. 20
1.3.2.1 Sustaining Proliferative Signaling ............................................................................ 20
1.3.2.2 Evading Growth Suppressors .................................................................................... 21
1.3.2.3 Resisting Cell Death ................................................................................................. 22
1.3.2.4 Angiogenesis ............................................................................................................. 23
1.3.2.5 Invasion and Metastasis ............................................................................................ 24
1.3.2.5.2 MiRNAs Found in Exosomes and Potential Regulation of EMT .......................... 25
1.3.2.6 Enabling Replicative Immortality ............................................................................. 26
1.3.3 Emerging Hallmarks and Enabling Characteristics of Cancer .................................... 26
1.3.3.1 Enabling Characteristics of Cancer ........................................................................... 26
1.3.3.2 Emerging Hallmarks of Cancer ................................................................................ 28
1.3.3.3 Reprogramming of Energy Metabolism ................................................................... 28
1.3.3.4 Avoiding Immune destruction .................................................................................. 29
1.4 Lung Cancer ........................................................................................................................ 31
1.4.1 Statistics ....................................................................................................................... 31
1.4.2 Molecular Epidemiology ............................................................................................. 33
1.4.2 Treatment ..................................................................................................................... 34
CHAPTER TWO MATERIALS AND METHODS .................................................................... 36

2.1 Cell Lines ............................................................................................................................ 36
2.2 Bacterial Work .................................................................................................................... 37
2.3 Transient Transfections ....................................................................................................... 38
2.4 Quantitative RT-PCR .......................................................................................................... 39
2.4 Microarray Analysis............................................................................................................ 41
2.5 NSCLC Tissue Microarray ................................................................................................. 42
2.5 Protein Expression .............................................................................................................. 42
2.6 Aldefluor Assay .................................................................................................................. 43
2.7 Colony Formation and Growth Assay ................................................................................ 44
2.8 MiRNA Target Validation .................................................................................................. 45
2.9 shRNA and miR-10a Over-Expression ............................................................................... 45
2.10 Lentiviral Production ........................................................................................................ 49
2.10 In vivo Xenograft Growth ................................................................................................. 52
2.11 Dose Response Curves ...................................................................................................... 53
2.12 Drug Dilutions and Resuspension ..................................................................................... 54
2.13 Statistical Methods ............................................................................................................ 56
2.14 Apoptosis Assay................................................................................................................ 56
2.15 GATA6 ChiP .................................................................................................................... 57
2.16 miRNA Inhibitor Screen and Validation .......................................................................... 57
CHAPTER THREE miR-337 and Cellular Response to Paclitaxel ............................................. 58
3.1 Introduction ......................................................................................................................... 58
3.2 Results ................................................................................................................................. 62
3.2.1 miR-337 Modulation of Drug Response is Specific to Microtubule Targeting Agents
............................................................................................................................................... 62
3.2.2 RAP1A and STAT3 Are Responsible for miR-337’s Effect on Cellular Response to
Microtubule Targeting Agents. ............................................................................................. 67
3.4 Discussion ....................................................................................................................... 69
3.5 Future Directions ................................................................................................................ 71
CHAPTER FOUR Synthetic Lethal Screen to Identify miRNA Inhibitors That Sensitize NSCLC
to Paclitaxel Treatment ................................................................................................................. 72
4.1 Introduction ......................................................................................................................... 72
4.2 Results ................................................................................................................................. 73
4.2.1 miRNA Inhibitor Screen Results ................................................................................. 73
4.2.2 miR-15/16 Family ........................................................................................................ 76
4.2.3 miR-15 Results............................................................................................................. 76
4.2.4 Introduction miR-10a/b ................................................................................................ 77
4.2.5 miR-10a Results ............................................................................................................... 83
4.2.5.1 miR-10a Regulates Cellular Response to Paclitaxel ................................................. 83
4.2.5.2 Parsing miR-10a from miR-10b................................................................................ 90
4.3 Discussion ........................................................................................................................... 95
4.4 Future Directions .............................................................................................................. 101
CHAPTER FIVE miR-10a Regulation of PI3K Signaling Through Direct and Indirect
Mechanisms ................................................................................................................................ 103
5.1 Introduction ....................................................................................................................... 103

5. 2 Results .............................................................................................................................. 108
5.2.1 miR-10a as a candidate for regulation of PIK3CA levels .......................................... 108
5.2.2 Direct Regulation of PIK3CA by miR-10a ................................................................ 111
5.2.3 Inhibiting PI3K Affects Cellular Response to Paclitaxel .......................................... 116
5.2.4 miR-10a Inhibits Growth and Induces Apoptosis ...................................................... 120
5.2.5 miR-10a Indirectly Regulates PIK3CA Through GATA6 ........................................ 124
5.2.6 Effects of Loss of GATA6 in NSCLC ....................................................................... 129
5.4 Discussion ......................................................................................................................... 131
CHAPTER SIX MIR-10A REGULATION OF NSCLC STEM CELLS THROUGH
MODULATION OF THE WNT PATHWAY ........................................................................... 137
6.1 Introduction ....................................................................................................................... 137
6.2 Results ............................................................................................................................... 143
6.2.1Regulation of ALDH1A3 Levels and Activity by miR-10a ....................................... 143
6.2.2 Inhibition of Cellular Growth Rate and Induction of Apoptosis by Increased miR-10a
Levels .................................................................................................................................. 145
6.2.3 miR-10a Inhibition of Growth Rate is Specific to Cancer Cells ............................... 150
6.2.4 miR-10a Regulates WNT and NOTCH Pathways by Targeting DVL3 .................... 150
6.2.5 DVL3 Regulates ALDH+ Cells ................................................................................. 156
6.2.6 DVL3 is Required for NSCLC Growth in Vitro and in Vivo. ................................... 161
6.3 Discussion ......................................................................................................................... 163
6.5 Future Directions .............................................................................................................. 165
APPENDIX A Bacterial Plasmid Stocks .................................................................................... 170

APPENDIX B Catalog of RNA preps ........................................................................................ 171
APPENDIX C Primer Sequences ............................................................................................... 184
APPENDIX D Potential MiRNA regulation of PI3KCA ........................................................... 185
Bibliography ............................................................................................................................... 188

xvi
PRIOR PUBLICATIONS
DeSevo C, Du L, Borkowski R, Behrens C, Wistuba II, Minna JD, Pertsemlidis A. (2013). miR-
10a regulation of the PI3K pathway through direct and indirect mechanism in non-small cell lung
cancer. (In preparation)
DeSevo C, Shao C, Larsen J, Minna JD, Pertsemlidis A. (2013). miR-10a regulation of cancer
stem cells through modulation of the WNT pathway in non-small cell lung cancer. (In
preparation)
Caudy AA, Guan Y, Jia Y, Hansen C, Desevo C, Hayes AP, Agee J, Alvarez-Dominguez
JR, Arellano H, Barrett D, Bauerle C,Bisaria N, Bradley PH, Breunig JS, Bush EC, Cappel
DA, Capra E, Chen W, Clore J, Combs PA, Doucette C, Demuren O,Fellowes P, Freeman
S, Frenkel E, Gadala-Maria D, Gawande R, Glass D, Grossberg S, Gupta A, Hammonds-Odie
L,Hoisos A, Hsi J, Hsu YH, Inukai S, Karczewski KJ, Ke X, Kojima M, Leachman S, Lieber
D, Liebowitz A, Liu J, Liu Y, Martin T,Mena J, Mendoza R, Myhrvold C, Millian C, Pfau S, Raj
S, Rich M, Rokicki J, Rounds W, Salazar M, Salesi M, Sharma R,Silverman SJ, Singer C, Sinha
S, Staller M, Stern P, Tang H, Weeks S, Weidmann M, Wolf A, Young C, Yuan J, Crutchfield
C,McClean MN, Murphy CT, Llinás M, Botstein D, Troyanskaya OG, Dunham MJ.
Saccharomyces bayanus, a new system for comparative functional genomics. Genetics113(1):
e152918
Du L, Subauste MC, DeSevo C, Zhao Z, Baker M, Borkowski R, Schageman J, Greer R, Yang
C, Suraokar M, Wistuba I, Gazdar A, Minna J, Pertsemlidis A. (2012) miR-337-3p and Its
Targets STAT3 and RAP1A Modulate Taxane Sensitivity in Non-Small Cell Lung Cancers. PLoS
ONE 7(6): e39167 .

Calahan D, Dunham M, DeSevo C, Koshland D. (2011) Genetic Analysis of Desiccation
Tolerance in Saccharomyces cerevisiae. Genetics 180(2):507-519
some titles are sentence case, others in title case
Martin O, DeSevo C, Guo B, Koshland D, Dunham M, Zheng Y. (2009) Telomere behavior in a
hybrid yeast. Cell Research 19(7):910-2.
Gresham D, Desai M, Tucker C, Jenq H, Pai D, Ward A, DeSevo C, Botstein D, Dunham M.
(2008) The repertoire and dynamics of evolutionary adaptations to controlled nutrient-limited
environments in yeast. PLoS Genet. 4(12):e1000303.

xviii
LIST OF FIGURES
Chapter 1
FIGURE 1.1 MiRNA Biogenesis ...................................................................................................7
FIGURE 1.2 Emerging Hallmark of Cancer..................................................................................22
FIGURE 1.3 MiRNAs Regulate the Hallmarks of Cancer ...........................................................33
FIGURE 1.4 Lung Cancer: Leading Cause of Cancer-Related Deaths World Wide ....................35
Chapter 2
FIGURE 2.1 RNA Polymerase II versus III in Gene Silencing ...................................................50
FIGURE 2.2 Gene silencing is more Efficient from Polymerase III Promoters ..........................51
Chapter 3
FIGURE 3.1 Variation of Paclitaxel Response Across NSCLC....................................................63
FIGURE 3.2 miR-337 Sensitizes H1155 to Paclitaxel Treatment .................................................64
FIGURE 3.3 miR-337 Sensitizes H1155 to Docetaxel Treatment ................................................66
FIGURE 3.4 miR-337 Sensitizes H1155 to Vinca Alkaloids .......................................................68
FIGURE 3.5 miR-337 Does Not Affect Cellular Response to Gemcitabine or Cisplatin .............69
FIGURE 3.6 Combination of RAP1A and STAT3 Affect H1155 Response to Paclitaxel ...........71
Chapter 4
FIGURE 4.1 Genomewide MiRNA Inhibitor Screen ...................................................................77
FIGURE 4.2 Discordance of Screen Hits Following Validation ...................................................78
FIGURE 4.3 miR-15a Regulates Paclitaxel Response .................................................................81
FIGURE 4.4 miR-10a Expression in Tumor and Normal Adjacent Tissue .................................83
FIGURE 4.5 miR-10a is Capable of Modulating Paclitaxel Response in H1155 .........................88
FIGURE 4.6 miR-10a Affects H1155 Cellular Response to Docetaxel ........................................89
FIGURE 4.7 miR-10a Expression Across a NSCLC Panel of Cell Lines ...................................90
FIGURE 4.8 Modulation of Paclitaxel Response is Not Specific to H1155 .................................91
FIGURE 4.9 Dynamic Range Achieved in Manipulation of miR-10a Levels ............................92
FIGURE 4.10 miR-10b Expression is Not Correlated with miR-10a
Levels Across NSCLC ...........................................................................................95
FIGURE 4.11Cross Reaction of Taqman Probes and MiRNA Inhibitors
On the miR-10 Family ..........................................................................................96
FIGURE 4.12 miR-10a, Not miR-10b, is Responsible For Drug
Response Observed in NSCLC ..............................................................................97
FIGURE 4.13 Growth Inhibitory Effect Observed With miR-10a Mimic ................................102

FIGURE 4.14 Tumor Levels of miR-10a are Associated with Patient Survival ........................105
Chapter 5
FIGURE 5.1 Overview of the PI3K/AKT/mTOR Pathway and Regulatory
Pressure Placed on PTEN .................................................................................110
FIGURE 5.2 Bioinformatics Analysis Uncovers miR-10a as Potential
Regulator of PI3K ..................................................................................................112
FIGURE 5.3 miR-10a Expression Does Not Correlate with Tissue or
Histological Subtype .............................................................................................113
FIGURE 5.4 miR-10a Affects PIK3CA Expression ..................................................................116
FIGURE 5.5 Effect of miR-10a on PIK3CA mRNA Levels are
Amplified at the Protein Level ..............................................................................117
FIGURE 5.6 Direct Interaction of miR-10a and PIK3CA UTR ................................................118
FIGURE 5.7 Loss of PI3K Sensitizes NSCLC to Paclitaxel ......................................................120
FIGURE 5.8 BEZ-235 Reduces H1155 Viability in the Presence of Paclitaxel .......................121
FIGURE 5.9 Changes in miR-10a Levels Can Manipulate Growth Rate of NSCLC ................123
FIGURE 5.10 High miR-10a Levels Induce Apoptosis .............................................................124
FIGURE 5.11 Potential Indirect Regulation of PI3K by miR-10a Through GATA6 ..............127
FIGURE 5.12 GATA6 Regulates PI3K ......................................................................................128

FIGURE 5.13 miR-10a Directly Regulates GATA6 ...................................................................129
FIGURE 5.14 Loss of GATA6 Inhibits Growth and Colony Formation
In NSCLC ..........................................................................................................131
FIGURE 5.15 Summery of the PI3K/GATA6/miR-10a Pathway ...............................................137
CHAPTER 6
FIGURE 6.1 ALDH1A3 The Major Isozyme Responsible for
Elevated ALDH Activity .......................................................................................142
FIGURE 6.2 ALDH1A3 Protein is Enriched in ALDH+ Cells and is
Responsible for the ALDH+ Population of Cells .................................................143
FIGURE 6.3 Loss of ALDH1A3 Inhibits Tumor Formation in Vivo .........................................144
FIGURE 6.4 miR-10a Reduces ALDH1A3 Levels and Activity in NSCLC .............................146
FIGURE 6.5 High miR-10a levels Inhibit Growth and Induce Apoptosis .................................148
FIGURE 6.6 Stable Overexpression of miR-10a Reduces ALDH1A3
Protein and Inhibits Colony Formation ................................................................149
FIGURE 6.7 Stable Overexpression of miR-10a Reduces ALDH1A3
Protein and Inhibits Colony Formation ................................................................150

FIGURE 6.8 miR-10a Does Not Affect ALDH1A3 Levels or Colony
Formation Ability in HBEC .................................................................................154
FIGURE 6.9 Induction of miR-10a Leads to Reduction of WNT and
NOTCH Signaling Through Potential Interaction with DVL3 ..............................155
FIGURE 6.10 miR-10a Directly Regulates DVL3 .....................................................................156
FIGURE 6.11 Only Loss of DVL3 Affect ALDH+ Cell Fraction ..............................................158
FIGURE 6.12 DVL3 Loss Reduces ALDH1A3 Protein Levels ................................................159
FIGURE 6.13 Stable Loss of DVL3 Reduces ALDH+ Cell Fraction ........................................160
FIGURE 6.14 Loss of DVL3 inhibits Growth Both In Vitro and In Vivo ..................................162
FIGURE 6.15 Summary: miR-10a Modulates ALDH1A3 Levels
By Inhibiting DVL3 .............................................................................................167
FIGURE 6.16 Transiently Induction of miR-10a Does Not
Inhibit Growth In-Vivo .......................................................................................168
FIGURE 6.17 Mini siRNA Screen Targeting Genes Involved in Stem Cell Maintenance ........169

LIST OF TABLES
TABLE 2.1 TaqMan Primers .........................................................................................................43
TABLE 2.2 Antibodies .................................................................................................................46
TABLE 3.1 miR-337 Effect on H1155 Treated With Chemotherapies ........................................67
LIST OF ABBREVIATIONS
Argonaute AGO
Aldehyde Dehydrogenase ALDH
Acute Lymphoblastic Leukemia ALL
All-Trans Retinoic Acid ATRA
Cycle Dependent Kinases CDK
Chronic Lymphocytic Leukemia CLL
Cancer Stem Cells CSC
Connective Tissue Growth Factor CTGF
Dishevelled DVL
Extra Cellular Matrix ECM
Epidermal Growth Factor Receptor EGFR
Eukaryotic Translation Initiation Factor 4E eIF4E
Echinoderm Microtubule-Associated Protein-like 4 to Anaplastic Lymphoma Kinase
EML4-
ALK
Epithelial-Mesenchymal Transition EMT
Fibroblast Growth Factor Receptor 3 FGFR3
Frizzled Fz
Glutaminase GLS
Glycogen Synthase Kinase 3 beta, GSK3Beta
Histone Deacetylases 4 HDAC4
Homology-Dependent Repair HDR
Human Epidermal Growth Factor Receptor 2 HER2
Hypoxia-Inducible Factor 1 HIF
Lethal-7 Let-7
Lock Nucleic Acids LNA
Murine Embryonic Fibroblast MEF
Mismatch Repair MMR
Mammalian Target of Rapamycin mTOR
Normal Adjacent Tissues NAT
Nuclear co-repressor 2 NcoR2
Nucleotide Excision Repair NER
National Institutes of Health NIH
Natural-killer group 2, member D NKG2D
Non-Small Cell Lung Cancer NSCLC
Nucleotide NT
Open Reading Frame ORF
Phosphoinostide-Dependent Kinase PDK1
Pleckstrin Homology PH
Phosphatidylinositide 3-kinases PI3K
Phoshatidyinositol 4,5-bisphosphate PIP2
Phoshatidyinositol 3,4,5-triphosphate PIP3
Phosphatase and Tensin homolog PTEN
Retinoblastoma RB
RNA-induced Silencing Complex RISC
RNA interference RNAi
Reactive Oxygen Species ROS
Receptor Tyrosine Kinase RTK
Small Cell Lung Cancer SCLC
Small Hairpin RNA shRNA
Smad-Interacting Protein 1 SIP1
Small Interfering RNA siRNA
Suppressor of Cytokine Signaling 1 SOCS1
TriCarboxylic Acid TCA
The Cancer Genome Atlas TCGA
Transforming Growth Factor beta TFGB1
Tumor protein 53 TP53
Thrombospondin-1 TSP1
United States US
Upstream Stimulatory Factor 2 USF2
Untanslated Region UTR
Vascular Cell Adhesion Molecule-1 VCAM1
Vascular Endothelial Growth Factor-A VEGF-A

xxvii
LIST OF APPENDICES
APPENDIX A Bacterial Stocks .....................................................................................................11
APPENDIX B Catalog of RNA Preps ...........................................................................................13
APPENDIX C Primer Sequences ..................................................................................................15
APPENDIX D Potential MiRNA Regulation of PIK3CA .............................................................17
1
CHAPTER ONE miRNA regulation of the Hallmarks of Cancer
1.1 miRNAs: Small Non-Coding RNAs That Control Gene Evolution
miRNAs are short hairpin structures that are typically 20-24 nucleotides long. They post-
transcriptionally repress the expression of target gene transcripts through interaction with the
3’untranslated region (UTR). MiRNA expression is vital for normal development, as several
knockout studies have shown that loss of any critical part of the miRNA biogenesis pathway
leads to embryonic lethality (Bernstein, Kim et al. 2003, Imielinski, Berger et al. 2012). In
worms, flies and mammals, miRNAs as a class, make up less than 1% of the genes. However
their regulatory potential is vast, they are predicted to regulate 60% of protein coding genes
(Garzon, Calin et al. 2009, Kota, Chivukula et al. 2009).
Their regulatory strength is so great that they have influenced how genes evolve.
Essential housekeeping genes have evolved to have short UTRs that are devoid of miRNA
binding sites (Stark, Brennecke et al. 2005), in contrast to developmental and tissue specific
genes, which tend to have a greater density of target sites. Intriguingly, miRNAs tend to target
genes expressed in neighboring tissues in order to prevent unwanted expression of target
transcripts. Finally, genes that contain miRNAs in their introns do not contain target sites of the
co-transcribed miRNA (Stark, Brennecke et al. 2005). Taken together, these findings indicate
that miRNAs represent a new level of regulation in the genome.
2
1.1.2 An Almost Missed Opportunity
miRNAs were first identified in 1993 in the laboratory of Victor Ambros, who noticed
that lin-4, an essential gene for the normal development of C. elegans, did not encode a protein.
He was able to identify lin-4s mature product was 22nt. Additionally, his group determined the
precursor (61nt), was predicted to fold back on itself to form a stem-loop structure. Finally, his
laboratory also reported that LIN-14, a gene important in larval development that caused a
phenotype opposite to the loss of lin-4, contains sequences complementary to lin-4 in its UTR
(Lee, Feinbaum et al. 1993). At the same time, work from the Ruvkun lab, which also identified
complementarity between lin-4 and sites in the lin-14 3’UTR, showed that lin-4 was able to
dramatically reduce LIN-14 protein with little effect on lin-14 mRNA (Wightman, Ha et al.
1993). Taken together, these findings support lin-4 as encoding a small RNA that, unlike most
other RNAs, does not produce a protein, but is capable of regulating LIN-14 protein through
potential interaction with the lin-14 3’UTR (Lee, Feinbaum et al. 1993) (Wightman, Ha et al.
1993).
This work was relatively unnoticed for almost a decade, before it was recognized that lin-4 was
the founding member of a whole new class of small non-coding RNAs that are highly conserved
and have vast regularity potential (Lau, Lim et al. 2001, Lee 2001, Lee and Ambros 2001).
3
1.1.3 MiRNA Biogenesis
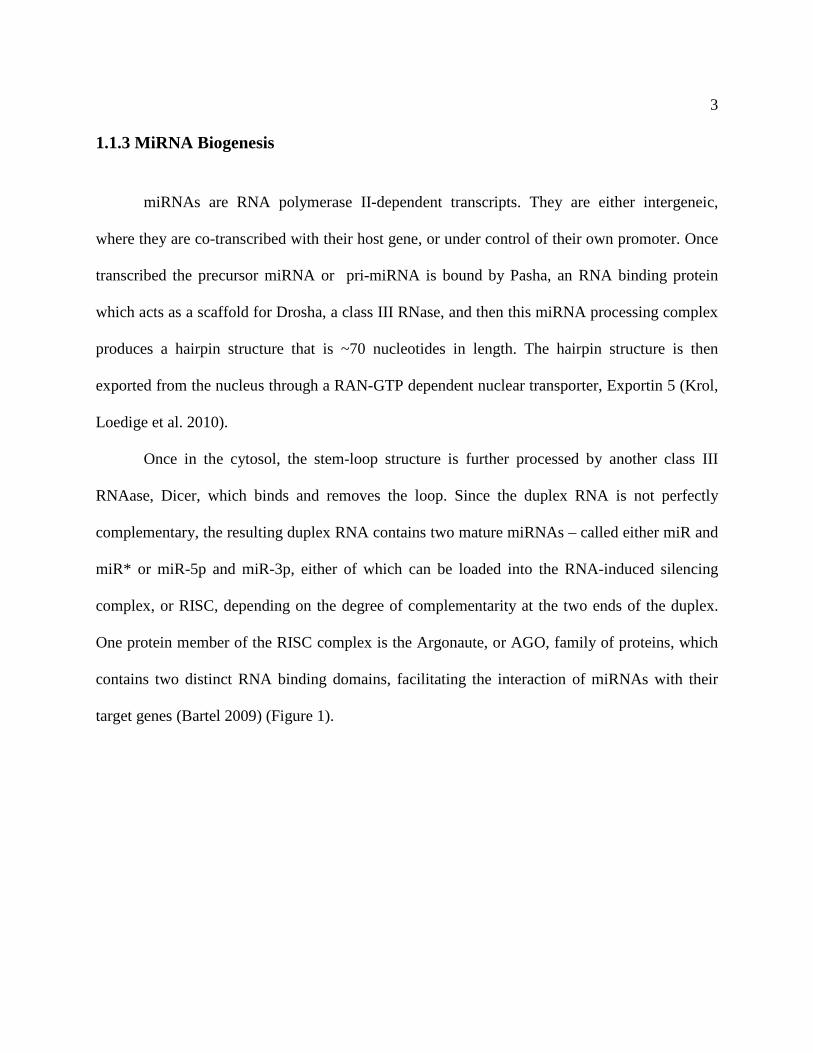
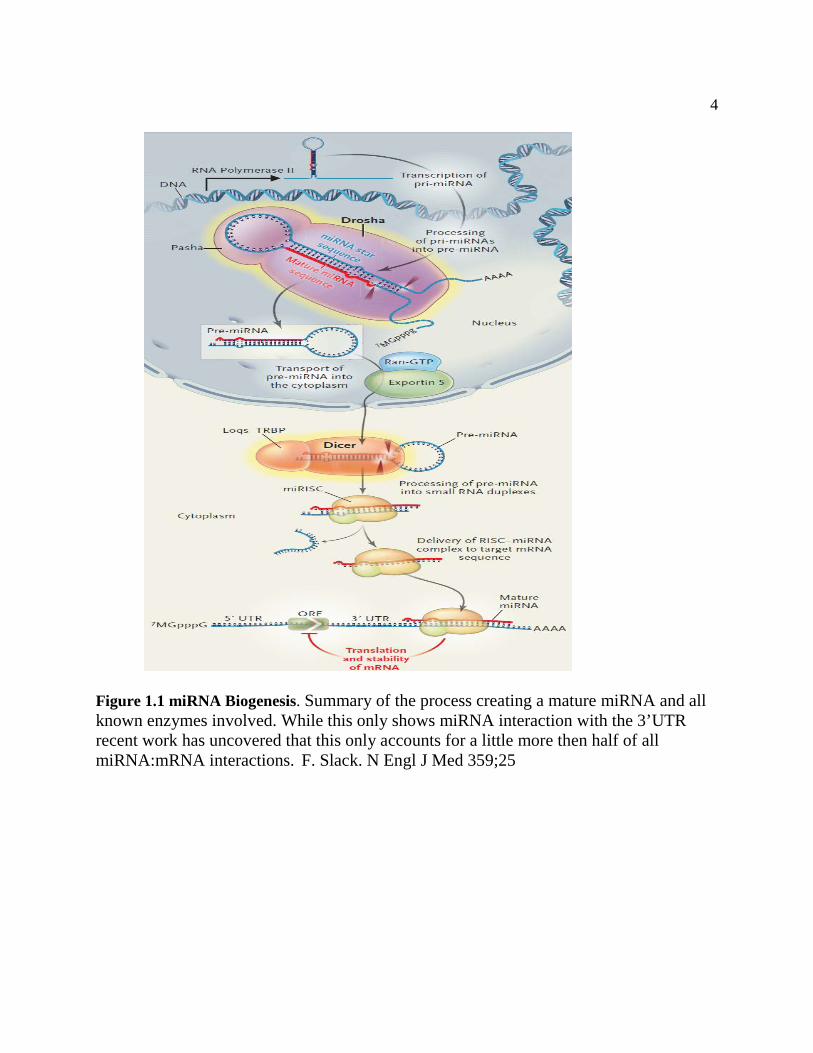
miRNAs are RNA polymerase II-dependent transcripts. They are either intergeneic,
where they are co-transcribed with their host gene, or under control of their own promoter. Once
transcribed the precursor miRNA or pri-miRNA is bound by Pasha, an RNA binding protein
which acts as a scaffold for Drosha, a class III RNase, and then this miRNA processing complex
produces a hairpin structure that is ~70 nucleotides in length. The hairpin structure is then
exported from the nucleus through a RAN-GTP dependent nuclear transporter, Exportin 5 (Krol,
Loedige et al. 2010).
Once in the cytosol, the stem-loop structure is further processed by another class III
RNAase, Dicer, which binds and removes the loop. Since the duplex RNA is not perfectly
complementary, the resulting duplex RNA contains two mature miRNAs – called either miR and
miR* or miR-5p and miR-3p, either of which can be loaded into the RNA-induced silencing
complex, or RISC, depending on the degree of complementarity at the two ends of the duplex.
One protein member of the RISC complex is the Argonaute, or AGO, family of proteins, which
contains two distinct RNA binding domains, facilitating the interaction of miRNAs with their
target genes (Bartel 2009) (Figure 1).
4
Figure 1.1 miRNA Biogenesis. Summary of the process creating a mature miRNA and all known enzymes involved. While this only shows miRNA interaction with the 3’UTR recent work has uncovered that this only accounts for a little more then half of all miRNA:mRNA interactions. F. Slack. N Engl J Med 359;25
5
1.1.4 Mechanisms of miRNA Gene Silencing
miRNA-mediated silencing occurs through one of several mechanisms (Eulalio,
Huntzinger et al. 2008). If there is perfect complementarity between the miRNA and the target
mRNA, the mRNA is degraded. This is not typically observed in mammals, as the only reported
example is miR-196 regulation of HOXB8 mRNA (Yekta, Shih et al. 2004). However, perfect
complementarity is a common feature in plants and RNA interference (RNAi) (Zamore, Tuschl
et al. 2000, Llave, Xie et al. 2002).
The canonical mechanism that operates in mammals is partial complementarity, which
inhibits gene translation in several ways. Prior to the elongation step, AGO, part of RSIC,
directly interacts with eIF4E (eukaryotic translation initiation factor 4E) and the large subunit of
the ribosome to inhibit cap-dependent translation initiation (Chendrimada, Finn et al. 2007). It
has also been shown that miRNA:mRNA interactions are associated with the polysomes in
sucrose sedimentation gradients, indicating that these interactions occur while the amino acid
chain is forming. However, the ribosome falls off in the presence of the miRNA:mRNA duplex
resulting in premature termination of protein synthesis (Petersen, Bordeleau et al. 2006). Finally,
miRNAs induce accelerated deadenylation, causing decay of mRNAs by directing them to the
general mRNA degradation machinery (Giraldez, Mishima et al. 2006). The exact mechanism of
degradation appears to be a feature of the target mRNA and not the miRNA, as it has been
determined that the same miRNA can affect different target genes in different ways (Eulalio,
Rehwinkel et al. 2007). Some of the important variable accounting for these differential effects

6
include the number of miRNA target sites, the distance separating them, and there location
within the UTR (Grimson, Farh et al. 2007).
1.1.5 MiRNA Target Recognitions
As alluded to above, the key to miRNA regulation is sequence complementarity between
the miRNA and its target gene’s UTR, as was the case with lin-14 and lin-4. Detailed analysis of
miRNA:mRNA interaction uncovered that a mammalian miRNA conserved among vertebrates
has, on average, 300 target mRNAs (Friedman, Farh et al. 2009). Several rules have been
developed to determine true miRNA target sites. First, the observation of the miRNA “seed”
sequence, which is defined as Watson-Crick base pairing of nucleotides 2-8 of the 5’ end of the
miRNA with the target transcript (Lewis, Burge et al. 2005). Additional sequence context is used
to identify high confidence binding sites: an A at position 1 and Watson-Crick pairing at position
9, while not required, do decrease false positives in target prediction (Bartel 2009). A key
advancement in target prediction was understanding that portions of the UTR which are “real”
miRNA regulatory sites are likely to be conserved relative to other segments of the UTR that are
not under selective pressure (Lewis, Shih et al. 2003). Currently there are close to a dozen
prediction tools – most of these computer programs are freely available and the advantages and
disadvantages of each have been reviewed (Bartel 2009).
Given the high level of conservation of the entire miRNA it is likely that there are
supplemental interaction between the 3’ portion of the miRNA and the 3’UTR. While this
7
possibility was suggested fairly early (Doench and Sharp 2004, Brennecke, Stark et al. 2005),
recent work in our lab and other labs have begun to support this claim. It has been shown that
nucleotides 13-16 of the miRNA that bind three to four contiguous Watson-Crick pairs,
uninterrupted by bulges or mismatches, of the target 3’UTR compensate for any bulges,
mismatches or wobbles that might be present in the seed sequence (Grimson, Farh et al. 2007).
Supplemental binding events add to the specificity of miRNA within families, which have the
same seed sequence but differ in the remaining sequence composition (Brennecke, Stark et al.
2005).
Finally, the context of the target site within the 3’UTR must be considered. The first 20-
50 base pairs of the 3’UTR are less likely to be accessible to the miRNA and the RISC complex
due to shielding caused by the ribosome (Grimson, Farh et al. 2007). Additionally, the middle
regions of long 3’UTRs tend to be devoid of conserved miRNA binding sites due to abundant
secondary structure and sites recognized by RNA binding proteins. Thus, the majority of miRNA
target sites are near the ends of 3’UTRs (Pasquinelli 2012). Only in rare circumstances have
miRNA binding sites been found outside of the 3’UTR, and these sites were not considered
effective (Grimson, Farh et al. 2007, Orom, Nielsen et al. 2008). Recently it has been suggested
that target prediction is not that simple: large scale non-canonical miRNA binding throughout the
mRNA was uncovered (Helwak, Kudla et al. 2013). Helwak, et al. were able to directly
interrogate miRNA:mRNA interaction through crosslinking and pull down of AGO protein(s),
followed by sequencing the resulting RNA. It was reported that over 60% of the identified
8
miRNA interactions were non-canonical - with 18% containing bulges or mismatched
nucleotides in the seed region and seed base-pairing often accompanied by non-seed interactions.
They also found that almost 50% of miRNA:mRNA interactions occurred outside the 3’UTR in
the ORF or 5’UTR (Helwak, Kudla et al. 2013). By historical standards, this field is still
evolving.
1.1.6 Biological Functions of miRNAs
Since the discovery of lin-4 regulation of lin-14 in the larval development of C.elegans,
miRNAs have been found to regulate a plethora of biological functions. Given that more than
half of all genetic loci are thought to be under miRNA regulation, it is not surprising that a wide
range of biological processes and functions have been shown to be influenced by miRNA
regulation (Volinia, Calin et al. 2006). miRNAs typically only have modest effects on mRNA
levels and have only been found to act as binary switches in a few circumstances (Li, Wang et al.
2006). It is much more common to observe one or a family of miRNAs regulating a biological
process at multiple points, where no single change affects the phenotype, but as a whole they
have a dramatic phenotypic response. This has been experimentally proven with the well-studied
miR-17~92 family that controls growth (Mendell 2008).
miRNAs can also be thought of as a failsafe to distinguish biological signals from
background noise. They can prevent a transcript from producing functional protein until a

9
threshold is met, at which point most signaling pathways have a positive feed-forward loop
effectively overwhelming the miRNA (Stark, Brennecke et al. 2005). It is this feature of
miRNAs that allows them to maintain cellular homeostasis by setting up boundaries of
transcripts.
Stress can be defined as a state when a cell deviates from homeostasis due to extrinsic
factors, such as growth and differentiation signals or carcinogens, or intrinsic changes such as
mutation, damage to organelle or macromolecules, or changes in the oxidative state. As such, the
cell must adapt and alter gene expression to cope with the stress and restore homeostasis. If
stress is too severe and the damage caused too great--the cell will eventually undergo cell death.
One of the most prevalent and deadly diseases in the modern world—cancer—is defined by
constant cellular stress, and the subversion of the normal intracellular pathways that control cell
death in the setting of such stress.
1.2 Cancer, Broadly Defined
Cancer is a broad term given to uncontrolled cellular growth, migration and invasion.
Worldwide, cancer is the number two cause of death and responsible for one in eight deaths,
surpassed only by cardiovascular disease. In the developed world, however, it is the number one
cause of death(Siegel, Naishadham et al. 2013). In developing and developed countries around
the world, the burden of cancer is increasing due to industrialization, physical inactivity(Mathers,
Fat et al. 2008), smoking, diets high in fats and animal proteins, and general aging of the global

10
population. Cancer is intrinsically heterogeneous, and is composed of hundreds of distinct
diseases with wide ranging risk factors, survival and treatment options.
According to the most recent figures from the NIH, in 2007 there were 1.44 million
cancer cases diagnosed in the U.S with a total economic cost of 230 billion dollars. The average
cost to the U.S economy for each cancer diagnosis is just under $160,000. Costs directly
associated with treatment are $86,111 to treat each cancer patient. These figures clearly show
that improvements in the detection and treatment could have an enormous impact not only on the
lives of individual patients, but may also have substantial economic benefits.
Decades of research have contributed to our understanding that cancer is a multi-step
process that arises from genomic alterations. Genomic alterations acquired by cells can be
classified into six core and several emerging hallmarks and characteristics of cancer (Hanahan
and Weinberg 2011). At the core of the hallmarks are sustaining proliferative signaling, evading
growth suppressors, resisting cell death, enabling replicative immortality, inducing angiogenesis,
and activating invasion and metastasis(Hanahan and Weinberg 2000) .

11
1.2.2 Hallmarks of Cancer
1.2.2.1 Sustaining Proliferative Signaling
One of the most fundamental traits of cancer cells is their ability to sustain proliferative
signaling, essentially becoming masters of their own destiny. Growth signals coming from the
outside environment bind to receptors on the cell surface. These receptors then become activated,
internalize the signal and transmit it down signaling transduction pathways. Normal cells
carefully control proliferative signals with multiple checkpoints throughout the process. Cancer
cells on the other hand dysregulate this process at multiple steps. For example, cancers cells can
produce the growth ligand, stimulate nearby cells to do so, or mutate the receptor such that it is
consistently in the active state (Di Cristofano and Pandolfi 2000, Yardena Samuels1 2004)
(Sharma, Bell et al. 2007).
1.2.2.2 Evading Growth Suppressors
A cancer cell must overcome powerful regulatory signals that normally restrain growth
and proliferation. Such is the case with PTEN, a potent tumor suppressor, which lies directly
downstream of the RTK, Ras, and PI3K inhibiting their downstream effects. In order to evade
growth suppressors, a cancer cell must deactivate tumors suppressors or induce their degradation.
Some of the most widely studied tumors suppressors that are frequently inactivated are TP53,
RB1 and PTEN (Charles J Sherr1 2002, Sherr and McCormick 2002).

12
1.2.2.3 Resisting Cell Death
The avoidance of apoptosis can occur through a variety of strategies. The most common
is loss of the tumor suppressors which function in genome surveillance. Other mechanism takes
advantage of the apoptotic machinery itself, which is composed of both upstream regulators and
downstream effectors. The set of proteins that bridge these two signals are composed of both
anti-apoptotic members of the BCL-2 family, which bind to and inhibit their counterparts, the
pro-apoptotic proteins Bax and Bak, which are embedded in the mitochondrial outer membrane
(Adams and Cory 2007). When relieved of inhibition, Bax and Bak disrupt the integrity of the
mitochondrial outer wall, causing the release of cytochrome c, which in turn activates a cascade
of caspases, the effectors of apoptosis (Scott W. Lowe1 2004). Cancer takes advantage of this
pathway by overexpression of the anti-apoptotic proteins, decreasing expression of the pro-
apoptotic proteins, or by short-circuiting the signaling from the receptors to the effectors (Scott
W. Lowe1 2004).
1.2.2.4 Enabling Replicative Immortality
Normal cells have limited replicative capacity and consequently undergo either
senescence, a state where they are still viable but no longer proliferate, or cell death, which can
occur through a variety of mechanisms depending on the cell type. Activation of telomerase is

13
central to this bypass as shown in the varied response of NSCLC cell lines to telomere inhibition
(Wright1 2000). The telomerase catalytic subunit (TERT) is currently being investigated as a
drug target in several ongoing clinical trials.
1.2.2.5 Angiogenesis
Tumors require sources of energy, nutrients and oxygen, as well as removal of metabolic
wastes and carbon dioxide. Due to their fast and largely unstructured growth, they usurp
processes that are used especially during embryogenesis and are relatively inactive in adult
tissues. Surprisingly, early in tumor progression tumors turn on angiogenic pathways, indicating
that this is an early event that must occur for tumor formation and potential therapeutic
opportunity (Raica, Cimpean et al. 2009). Two well-studied proteins, vascular endothelial
growth factor-A (VEGF-A) and thrombospondin-1 (TSP1), are both expressed by the tumor cells
and work antagonistically against one another, producing a disordered, leaky, and
underdeveloped vascular system (Nagy, Chang et al. 2010). This creates microenvironments
within a tumor that have different access to oxygen and nutrients, resulting in oxygen and pH
gradients. This intratumor heterogeneity can produce chemotherapies resistance as the drug
cannot access the core of the tumor as well as radiotherapy resistance, which requires radical
oxygen species to cause genotoxic stress. The innate immune system unwittingly collaborates
with this process by promoting an inflammatory response that induces angiogenesis (Ferrara
2010).

14
1.2.2.6 Invasion and Metastasis
The final hallmark of cancer is invasion and metastasis, which occurs in two phases.
First, the cells acquire the ability to disseminate from the primary tumor. Second, the cell then
needs the ability to attach to a distant site and adapt to the foreign microenvironment. It is well
appreciated that tumors that have invaded and metastasized are as a group histologically different
(i.e. usually poorly differentiated). Alterations occur on a genetic basis resulting in changes to
proteins that influence cellular shape, attachment and interactions with neighboring cells. For
example, loss of E-cadherin, a surface protein that binds epithelial cells through interactions with
the extra cellular matrix (ECM) and maintains a state of quiescence, is frequently observed (Berx
and van Roy 2009). Genes involved in embryogenesis, cell migration and inflammation are up-
regulated, orchestrated by a set of well-studied transcription factors: Snail, Slug, Twist, and
Zeb1/2 (Klymkowsky and Savagner 2009). This genetic reprograming, known as epithelial-
mesenchymal transition (EMT), gives the tumor cells the ability to invade, resist apoptosis,
disseminate and become resistant to chemotherapies (Polyak and Weinberg 2009).
1.2.3 Emerging Hallmarks and Enabling Characteristics of Cancer
Two enabling characteristics that produce an environment conducive for the acquisition
of the hallmarks are genomic instability and mutation, and promoting inflammation (Hanahan
and Weinberg 2011). Mutation rates in cancer are highly variable, ranging from under a dozen to
thousands of insertions, deletions or nonsynonymous polymorphism (Pleasance, Cheetham et al.
2010)(Haas and Sakr 1997, Uematsu, Kanazawa et al. 2003, Pleasance, Cheetham et al. 2010).

15
Lung adenocarcinoma mutation rates range from as low as 0.04 to over 117.4 mutations per
megabase in more advanced invasive carcinomas (Imielinski, Berger et al. 2012). In pancreatic
cancer, clonal populations of cells in the primary tumor which give rise to distant metastases
have more mutations than the parental population and represent a more evolved population;
notably, mutation occur at a faster rate as the cancer progresses (Salk, Fox et al. 2010, Yachida,
Jones et al. 2010, Imielinski, Berger et al. 2012). This positive feed-forward system of mutation
rate is attributed to the loss of the surveillance system (TP53, RB) that would normally force
DNA damaged cells to undergo apoptosis (Jackson and Bartek 2009). Finally, the loss of
telomeres produces large scale genomic reengagements in efforts to try and stabilize
chromosomes producing large scale aneuploidy contributing to cancer progression (Artandi and
DePinho 2010).
In an effort to arrest tumor growth, the innate immune system is recruited to the area
around the tumor, resulting in inflammation, which has the untended effect of promoting tumor
growth. Inflammation supplies the tumor with growth factors, pro-angiogenic factors, ECM-
modifying enzymes that support or further promote angiogenesis and can even induce metastasis
(Grivennikov, Greten et al. 2010). Cells of the immune system that have infiltrated the tumor
microenvironment can further promote mutations and genomic instability by producing reactive
oxygen species (ROS), which act as a mutagenic agent (Grivennikov, Greten et al. 2010).
16
Two emerging features that are only just starting to be understood are the deregulation of
cellular metabolism and avoiding immune destruction. Cancer cells have an insatiable appetite
for growth. To feed this appetite, they require the basic building blocks of all macromolecules.
To meet this demand cancer cells usually undergo anaerobic glycolysis, even if there is enough
oxygen present for the end product of glycolysis to enter the tricarboxylic acid (TCA) cycle. This
phenomenon was first observed by Dr. Otto Warburg and since been referred to as the Warburg
effect (Warburg 1956 ). Here is instance of the interdependence of the hallmarks of cancer: the
poor access to oxygen in parts of the tumor induces a hypoxic response, which in turn up-
regulates many glucose transporters and metabolic enzymes in the glycolytic pathway (Warburg
1956 ). Relying solely on glycolysis for energy frees up all the biological intermediates produced
in the TCA cycle for the biosynthesis of macromolecules and organelle needed for cellular
division (Warburg 1956 ).
The final emerging hallmark is evading the immune response, which has been illustrated
by the increase of tumors in immunocompromised humans or following organ transplant(Vajdic
and van Leeuwen 2009). This has been confirmed experimentally using several methods. It was
observed that human melanoma cells injected into NOD/SCID immunocompromised mice were
less capable of generating tumors than in mice that were interleukin-2 receptor gamma chain
null, a more highly immunocompromised mouse model (Quintana, Shackleton et al. 2008). It has
also been shown that tumors that arise in immunodeficient mice will not engraft in
17
immunocompetent mice, while tumors that form in immunocompetent mice will engraft in
immunodeficient mice (Kim, Emi et al. 2007).
1.3 MiRNAs: An Overlooked Hallmark of Cancer
1.3.1 General Observations on miRNAs in Cancer
miRNAs work by repressing gene translation and can act as oncogenes or tumor
suppressors. This role can change for individual miRNAs depending on the mutational status of
the cell and tissue of origin. The first study linking miRNAs to cancer was in patients with
chronic lymphocytic leukemia, CLL. It was observed that most patients had large deletions in
chromosome 13q14, which was determined to contain two miRNAs, miR-15 and miR-16 (Calin,
Dumitru et al. 2002). Further genomic profiling of human cancers discovered that of the 186
miRNAs known at the time, 98 were located in cancer-associated genomic regions. These
regions are frequently located at fragile sites and susceptible to heterozygous loss and
translocations (Calin 2004). Array based approaches of miRNAs in cancer showed that miRNA
expression profiles are more informative than mRNA expression at classifying poorly-
differentiated tumors. Additionally, miRNA expression could classify human cancers to
developmental lineages and distinct mechanism of transformation. Finally, a general
downregulation of miRNAs in tumors compared to normal tissue was observed (Lu, Getz et al.
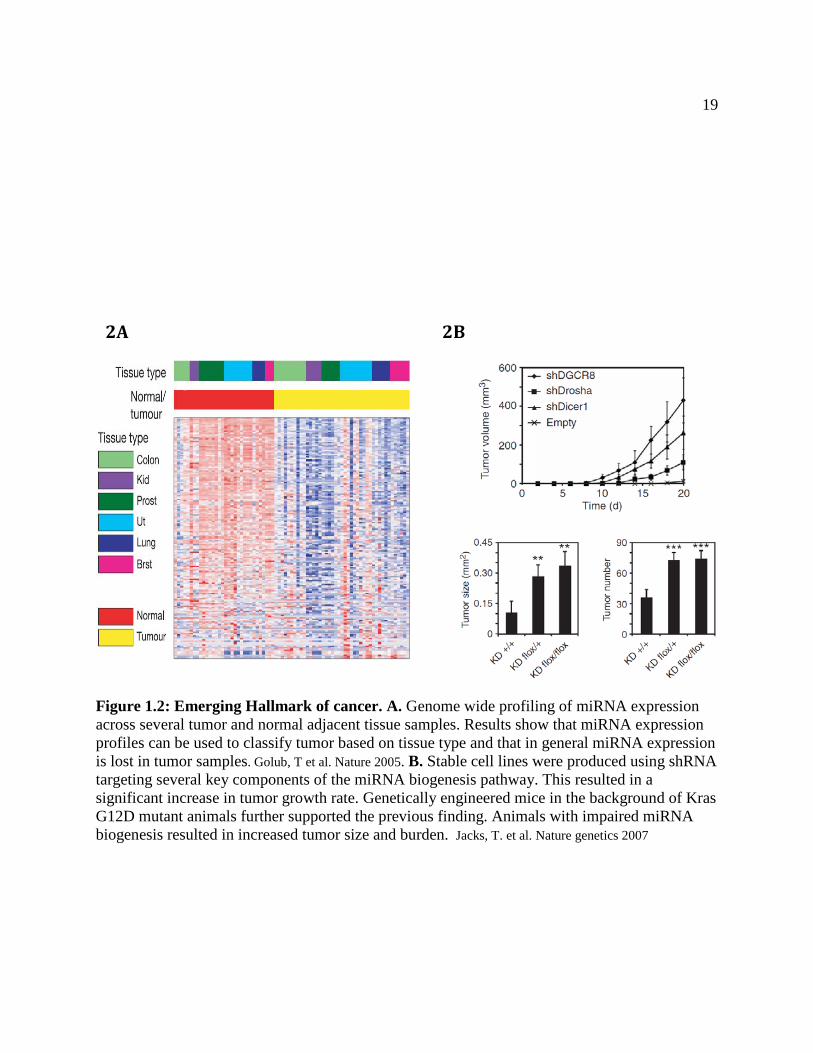
2005) (Figure 2A).
There can be several explanations for the global down-regulation of miRNAs in tumors,
one of which was mentioned above: miRNAs are located in regions of genome that tend to be

18
lost or disrupted in cancer. Another is an epigenetic silencing mechanism, which appears to be a
tissue-specific. More frequently observed are abnormalities of the miRNA biogenesis pathway. It
was first reported in non-small lung cancer patients that lower Dicer expression correlated with
reduced post-surgery survival (Karube, Tanaka et al. 2005). Both in cell culture and genetically
engineered mouse models of lung cancer, loss of various components of the miRNA biogenesis
pathway promoted tumor growth and invasiveness (Kumar, Lu et al. 2007) (Figure 2B). It should
be noted that homozygous deletions of such components have not been observed in tumors.
Recent knockout experiments have shown that cells deficient for these components produce
viable cells that were able to form tumors in mice (Ravi, Gurtan et al. 2012). However, these
cells had a much slower doubling time and delayed tumor onset in mice and it appeared that
miRNA levels were maintained in the tumor from interaction with the microenvironment, further
supporting Dicer as a haploinsufficient tumor suppressor (Ravi, Gurtan et al. 2012). To further
complicate Dicer’s role in cancer, human prostate cell lines loss of Dicer was shown to suppress
tumor growth, but it also enhanced migration in some cell lines, illustrating Dicers pleotropic
role in cancer (Zhang, Chen et al. 2013). In addition to selective loss of miRNA, it has been
reported that genes will swap or shorten 3’UTRs to avoid miRNA regulation. This was first
observed with let-7 regulation of the oncogene Hmga2, where a chromosomal translocation
disrupted the repression of let-7 resulting in oncogenic transformation (Mayr, Hemann et al.
2007). The Bartel lab further found that compared to proliferating non-transformed cell lines,
cancer cells often had shorter 3’UTRs and that the shorter UTRs resulted in increased mRNA
stability and loss of miRNA-mediated repression (Mayr and Bartel 2009).
19
Figure 1.2: Emerging Hallmark of cancer. A. Genome wide profiling of miRNA expression across several tumor and normal adjacent tissue samples. Results show that miRNA expression profiles can be used to classify tumor based on tissue type and that in general miRNA expression is lost in tumor samples. Golub, T et al. Nature 2005. B. Stable cell lines were produced using shRNA targeting several key components of the miRNA biogenesis pathway. This resulted in a significant increase in tumor growth rate. Genetically engineered mice in the background of Kras G12D mutant animals further supported the previous finding. Animals with impaired miRNA biogenesis resulted in increased tumor size and burden. Jacks, T. et al. Nature genetics 2007
2A 2B
20
1.3.2 MiRNA Regulation of the Hallmarks of Cancer
1.3.2.1 Sustaining Proliferative Signaling
Lethal-7 (let-7), a founding member of the miRNA field, like lin-4 is required for timing
of cell fate determination in C.elegans (Reinhart, Slack et al. 2000) . Regulation of vulval
development, a process that requires RAS/MAP kinase signaling, is carried out through let-7
family regulation of KRAS (Johnson, Grosshans et al. 2005). Furthermore, let-7 is poorly
expressed in lung tumors, which have one of the highest incidents of K-RAS mutation (Reinhart,
Slack et al. 2000). The reduction of let-7 expression is associated with significant shorter overall
survival in lung cancers patients(Takamizawa, Konishi et al. 2004) . Finally, ectopic expression
of let-7 in KRAS-driven NSCLC cell lines inhibited growth in vitro and overexpression of let-7
in the KRAS G12D mouse model reduced tumor formation(Takamizawa, Konishi et al. 2004) .
A second example of a miRNA regulating proliferative signals is the observation that loss
of chromosome 3p21.3, an early and frequent event in lung carcinogenesis, contains miR-128b,
which is predicted to regulate EGFR. Patients who had deletion of chromosome 3p21.3 and were
treated with gefitinib had increased survival relative to patients who did not have this deletion
21
and were also treated with gefitinib (Weiss, Bemis et al. 2008). Indicating that patients with
chromosome 3p21.3 deletion and loss of miR-128b are more “addicted” to EGFR signaling and
subsequently more sensitive to gefitinib treatment.
1.3.2.2 Evading Growth Suppressors
The tumor suppressor p53 is a central regulator of DNA damage, cellular stress and
improper mitogenic signals. It surveys the cell and integrates these signals and promotes growth
arrest, inhibits angiogenesis, initiates DNA repair or induces apoptosis if the damage is too
severe (Levine, Hu et al. 2006). Given its importance in preventing tumor formation, it is no
surprise that it is mutated in nearly all cancers at rates higher than 50% (Olivier, Hollstein et al.
2010). While p53 was discovered over five decades ago, its role as a tumor suppressor is still
being explored (Levine AJ 1991).
Recently, p53 was shown to regulate miRNA expression; in particular it had profound
effects on the miR-34 family, by directly binding to their promoter and inducing transcription in
the presences of oncogenic stress or DNA damage (He, He et al. 2007). When ectopically
expressed, miR-34 induced cell cycle arrest, cellular senescence and apoptosis and inhibited
tumor growth in vivo (Hermeking 2010). When determining miR-34 target genes it was (perhaps
unsurprisingly) noticed that genes involved in cell cycle progression and DNA damage response
were overrepresented. (He, He et al. 2007). Several of the more notable genes experimentally
shown to be directly regulated by miR-34 were cell cycle dependent kinases (CDKs) 4 and 6,

22
Cyclin E2, MET and Bcl-2, all of which have been documented to promote cellular growth or
inhibit apoptosis (He, He et al. 2007)
1.3.2.3 Resisting Cell Death
BCL-2 is a central player in cell survival that acts by inhibiting cell death. BCL-2 is
overexpressed in various human cancers, is associated with resistance to many chemotherapies,
and is currently being investigated as a druggable target by several large pharmaceutical
companies (Vogler, Dinsdale et al. 2008). Upon receiving a death signal, Bax and Bak, also
members of the BCL-2 family, form oligomers on the outer wall of the mitochondria, leading to
its permeabilization and subsequent release of cytochrome C and caspase activation, BCL-2 acts
by blocking the formation of oligomers (Cory and Adams 2002). BCL2 is overexpressed in 70%
of B-cell CCL, however in only 5% of the cases could its overexpression be explained. Another
characteristic of B-cell CCL is loss of chromosome 13q14.3, which is also lost in several other
cancer types, suggesting it harbors a tumor suppressor. After sequencing the entire region two
miRNAs, miR-15 and miR-16 were identified, it was noted that their loss is reported in 70% of
CCL, which is proportional to the number of cases with BCL-2 overexpression (Cory and Adams
2002). Finally, it was experimentally proven that miR-15 and miR-16 do in fact directly regulate
BCL-2 and their ectopic expression induce apoptosis in a verity of cancers (Aqeilan, Calin et al.
2010).
23
1.3.2.4 Angiogenesis
The first hints of the importance of miRNAs in the regulation of vasculature arose from
mouse models of homozygous deletion of Dicer. These mice were deficient for angiogenesis and
died at between days 12.5 and 14.5 of gestation (Yang, Yang et al. 2005). To further elucidate
miRNAs role in vascular development, dicer was selective deleted in endothelial cells. The
knockout mice were viable and normal compared to littermates. Interestingly, the endothelial
cells had diminished response to VEGF-A, increased expression of several pro-angiogenic
factors, and reduced microvessel formation (Suarez, Fernandez-Hernando et al. 2008). However,
none of the data points to the direct regulation of angiogenesis by a specific miRNA. Several
candidate miRNAs (miR-296, -130a and 132) were selected based on their upregulation in tumor
cells, their responsiveness to VEGF-A and ability to stimulate tumor growth, survival and
angiogenesis (Chen and Gorski 2008).
Another potent oncogene frequently overexpressed, MYC, is associated with robust
neovascularization and tumors rich in red blood cells (Dews, Homayouni et al. 2006). MYC is
known to up regulate the first identified oncogenic miRNAs described in mammals, the miR-17-
92 family (Mendell 2008). This family of miRNA is directly responsible for the MYC-driven
angiogenesis by their regulation of Tsp1, which antagonizes the pro-angiogenic VEGF-A
signaling and connective tissue growth factor, CTGF, a modulator of the ECM allowing for
infiltration of nascent blood vessels (Dews, Homayouni et al. 2006).
24
1.3.2.5 Invasion and Metastasis
The miR-200 family is perhaps the most widely studied miRNA family, with over four
thousand papers published since they first came to light as regulators of EMT (Gregory, Bert et
al. 2008). The family is composed of five members in two clusters, miR-200a/b and 429 reside
on chromosome 1 and miR-200c and 141 on chromosome 12. In a screen to identify miRNAs
that respond to EMT, only miR-200 family expression was significantly affected with a complete
loss of the entire family (Gregory, Bert et al. 2008). Forced expression of a polycistron was
sufficient to inhibit EMT, demonstrating that the miR-200 family downregulation was a critical
step in EMT. Additionally, was shown that over-expression of the miR-200 family was able to
reverse the mesenchymal characteristics of the highly invasive breast carcinoma cell line 4T07
(Korpal, Lee et al. 2008).
The miR-200 family mediated its anti-tumorigenic effect through its regulation of E-
cadherin transcriptional repressors ZEB1 and SIP1, Smad-interacting protein 1, also called ZEB2
(Korpal, Lee et al. 2008). These transcription factors lie at the core of the machinery responsible
for EMT by repressing E-cadherin and promoting cancer cell migration and invasion
(Vandewalle 2005). Finally, in attempting to understand how the miR-200 family expression was
lost, it was observed that ZEB1/2 e-box sites were located in close proximity to each polycistron
and in fact ectopic expression of ZEB1/2 led to down regulation of the miR-200 family
(Bracken, Gregory et al. 2008). Collectively, these findings established a double-negative
feedback loop between miR-200 and ZEB1/2 during EMT and tumorigenesis.
25
1.3.2.5.2 MiRNAs Found in Exosomes and Potential Regulation of EMT
It has been observed that miRNAs expressed in dicer null cells were attributed to miRNA
secreted from surrounding cells (Ravi, Gurtan et al. 2012). This is in support of the observation
made by the Lotvall group, they were able to isolate exosomes and found that they contained
both mRNA and miRNAs (Valadi, Ekstrom et al. 2007). Exosomes are small (50-90nm)
membrane vesicles and have been shown to be important for signaling (Raposo and Geuze
1996). Valadi et al. determined that exosomes contain miRNAs and mRNA that can be
internalized by a cell and that these miRNAs can regulate target mRNAs, thereby exerting an
effect on the production of functional proteins. This claim has further been supported by the
notion that miRNAs from plants can and have been absorbed in sufficient quantity to influence
gene expression in human livers (Zhang, Hou et al. 2012). It appears that the exosome protected
its content from not only the pH of the stomach but also various RNAases that naked RNAs
would normally encounter. Finally, this same group and others have shown that miRNAs that are
found in exosomes can be used as biomarkers in the detections of cancers of various origins
(Chen, Ba et al. 2008).
My first experiments focused on exosome isolation and the potential that they might have
on priming a distant site for tumor metastasis, a possibility that was further substantiated by the
26
finding that trypsinization reduces the expression of the miR-200 family that regulates ZEB and
EMT (Gregory, Bert et al. 2008). However, further analysis suggested that this was due to a bias
in the RNA prep chosen by the group and the paper was retracted (Kim, Yeo et al. 2012).
Additionally, exosomes are extremely small and might only contain several hundred total
miRNAs whereas a cell will contain thousands of copies of a single miRNA. It has been
postulated that tumors secrete more exosomes than non-malignant cells; however, this has not
been experimentally tested. But the sheer number of exosomes that a cell would have to absorb
to have a meaningful effect on gene expression does (in retrospect) raise doubts about the
plausibility of the physiologic significance of exosomes and miRNAs in tumor metastasis.
1.3.2.6 Enabling Replicative Immortality
As of this writing there are no miRNAs implicated in this process. The enzyme
responsible for telomere maintenance, Telomerase, consists of two principal components, reverse
transcriptase (hTERT) and an RNA template (hTR) (Wright1 2000). The RNA template is a
repeated hexamer and too short for conical miRNA regulation; furthermore, the UTR of hTERT
is poorly conserved and devoid of high confidence miRNA seed matches. This could reflect the
important nature of telomere maintenance in stem cell maintenance and that the gene evolved to
contain no function miRNA target sites.
1.3.3 Emerging Hallmarks and Enabling Characteristics of Cancer
1.3.3.1 Enabling Characteristics of Cancer
27
miRNAs also have significant roles in establishing the tumor microenvironment. The
tumor microenvironment tends to have a low pH and be hypoxic, conditions which promote
genomic instability by affecting DNA repair trough the downregulation of genes involved in
mismatch repair (MMR), homology-dependent repair (HDR), and nucleotide excision repair
(NER) (Bindra and Glazer 2007). It was determined that under hypoxic conditions MYC and
MAX were displaced from the promoter of MLH1, a gene involved in MMR, but this was in
hypoxia-inducible factor 1alpha (HIF1α) independent manner (Bindra and Glazer 2007). This
was surprising as HIF-1α is thought to be a master regulator of the hypoxic genetic switch. To
explore the effects that HIF-1α on genomic stability in a miRNA dependent manor, HeLa cells
were cultured in hypoxia conditions and RNA was extracted for miRNA profiling. It was
determined that several miRNA were upregulated, the most significant of which were miR-373
and the previously reported miR-210 (Camps, Buffa et al. 2008, Crosby, Kulshreshtha et al.
2009). After bioinformatic analysis it was determined that these miRNAs regulated RAD52 and
RAD23B, genes involved in HDR and NER, respectively. Inhibiting these miRNAs led to the
restoration of these target genes under hypoxic conditions (Crosby, Kulshreshtha et al. 2009).
Exploring miRNA regulation of the second enabling characteristic, tumor promoting
inflammation, we again find a miRNA that is able to produce a genetic landscape that promotes
tumor progression. miR-155 has been reported to be upregulated in breast cancer and promote
pancreatic tumor development. Additionally, its transgenic overexpression in B-cells caused
Acute Lymphoblastic Leukemia (ALL) (Costinean, Sandhu et al. 2009). While miR-155’s role
28
and targets have been determined in other cancer types, its role in breast cancer tumorigenesis
has not been defined. It was determined that several inflammatory signals, IFN-gamma, IL-6 and
LPS induce miR-155 expression (Jiang, Zhang et al. 2010). Following miR-155 induction it was
noticed that STAT3, a mediator of the inflammatory response, was activated (Jiang, Zhang et al.
2010). miR-155’s effect in promoting inflammation was dependent on its regulation of
suppressor of cytokine signaling 1 (SOCS1), a tumor suppressor that functions as a negative
regulator of the JAK/STAT pathway. Interestingly, it was observed that in two tumor samples
SOCS1 had mutations in its UTR, which abolished the effect of miR-155. This suggests that
early events in tumor formation require down regulation of the JAK/STAT pathway indicating a
potential dichotomous role (Jiang, Zhang et al. 2010).
1.3.3.2 Emerging Hallmarks of Cancer
1.3.3.3 Reprogramming of Energy Metabolism One of the central regulators of aberrant cellular metabolism is MYC, which directly
regulates glucose metabolic enzymes and genes involved in mitochondrial biogenesis (Eilers and
Eisenman 2008). In an effort to understand MYC effect on the mitochondrial proteome (Gao,
Tchernyshyov et al. 2009) uncovered that glutaminase, GLS, expression was upregulated upon
induction of MYC expression. GLS converts glutamine to glutamate for further catabolism by
the TCA cycle for the production of ATP and glutathione. Cancer cells that are “addicted” to
MYC expression are sensitive to glutamine deprivation (Yuneva, Zamboni et al. 2007). The
miR-23 family was identified as candidate miRNAs, as GLS contains conserved binding sites
and miR-23 has been documented to be down-regulated in response to MYC driven oncogensis
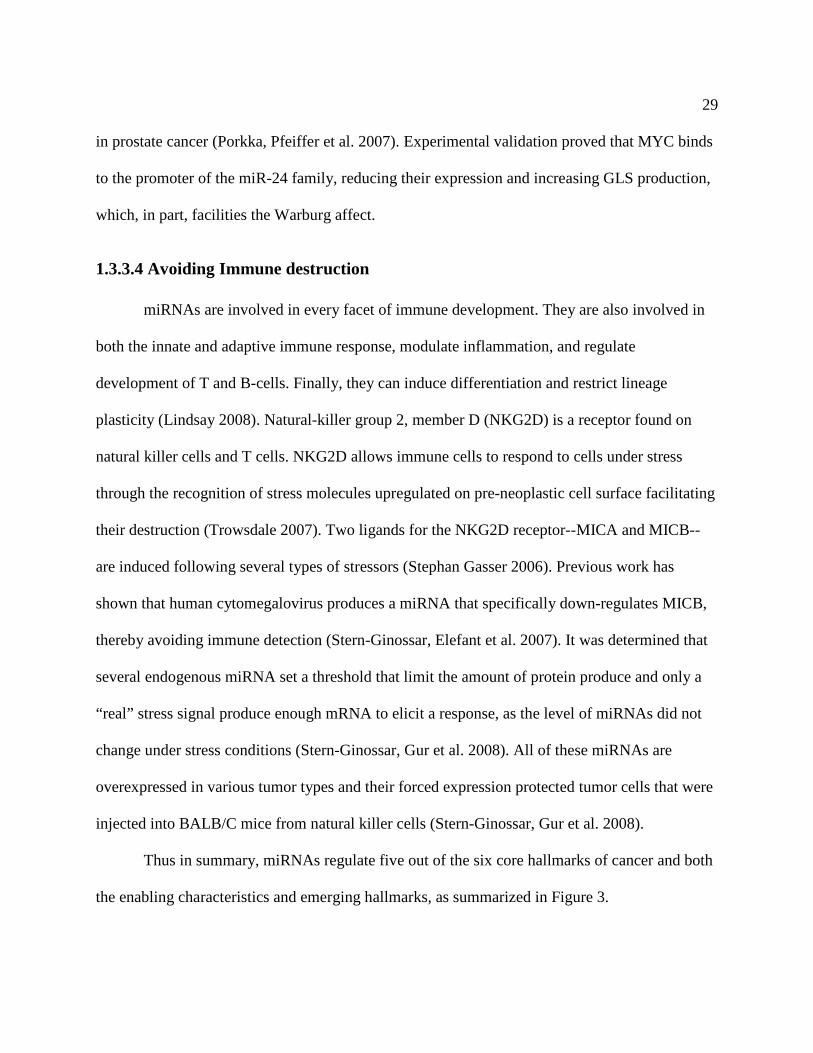
29
in prostate cancer (Porkka, Pfeiffer et al. 2007). Experimental validation proved that MYC binds
to the promoter of the miR-24 family, reducing their expression and increasing GLS production,
which, in part, facilities the Warburg affect.
1.3.3.4 Avoiding Immune destruction miRNAs are involved in every facet of immune development. They are also involved in
both the innate and adaptive immune response, modulate inflammation, and regulate
development of T and B-cells. Finally, they can induce differentiation and restrict lineage
plasticity (Lindsay 2008). Natural-killer group 2, member D (NKG2D) is a receptor found on
natural killer cells and T cells. NKG2D allows immune cells to respond to cells under stress
through the recognition of stress molecules upregulated on pre-neoplastic cell surface facilitating
their destruction (Trowsdale 2007). Two ligands for the NKG2D receptor--MICA and MICB--
are induced following several types of stressors (Stephan Gasser 2006). Previous work has
shown that human cytomegalovirus produces a miRNA that specifically down-regulates MICB,
thereby avoiding immune detection (Stern-Ginossar, Elefant et al. 2007). It was determined that
several endogenous miRNA set a threshold that limit the amount of protein produce and only a
“real” stress signal produce enough mRNA to elicit a response, as the level of miRNAs did not
change under stress conditions (Stern-Ginossar, Gur et al. 2008). All of these miRNAs are
overexpressed in various tumor types and their forced expression protected tumor cells that were
injected into BALB/C mice from natural killer cells (Stern-Ginossar, Gur et al. 2008).
Thus in summary, miRNAs regulate five out of the six core hallmarks of cancer and both
the enabling characteristics and emerging hallmarks, as summarized in Figure 3.
30
Figure 1.3 MiRNAs Regulate the Hallmarks of Cancer. Five of the six core hallmarks, both emerging hallmarks and enabling characteristics are regulated by miRNAs.

31
1.4 Lung Cancer
1.4.1 Statistics
Lung cancer comprised over 1.5 million new cases and was responsible for 1.4 million
deaths worldwide in 2008, more than breast, colon, prostate, and pancreatic cancers combined
(Figure 4A). Unsurprisingly, smoking causes 85% of lung cancer and smokers have a 10 to 20-
fold increased risk of developing the disease than never smokers (Brownson, Alavanja et al.
1998). While lung cancer death rates are decreasing among males, a reflection of the changes in
smoking habits, it is increasing in women, likely a result of the adoption of smoking by women
later in the 20th century (Escobedo and Peddicord 1996). Currently more than 50% of newly-
diagnosed lung cancers are former smokers, illustrating that the damage caused by smoking over
a person’s lifetime is permanent.
The overall 5-year survival is a dismal 16% and only 4% if metastatic disease is present
at the time of diagnosis (Larsen, Cascone et al. 2011) (Figure 4B). This reflects in large part the
lack of effective screening programs for lung cancer. Only 15% of lung cancers are diagnosed at
early stages, typically serendipitously due to chest imaging for unrelated reasons (Raz 20007) .
In contrast, effective population based screening is available for breast, colon, and prostate
cancer, as well as melanoma, and other superficial (and hence more readily-palpable and
visualized) cancers. This early detection leads to better treatment response and overall survival.

32
Figure 1.4 Lung Cancer: Leading Cause of Cancer Related Deaths World Wide. A. In 2011 there were 156,940 total reported deaths caused by lung cancer comprising 27% of all cancer related deaths. Adapted from Jemal A, et al. Cancer Statistics, 2011. B. While improvements in survival have been made in other types of cancer, lung cancer remains at a dismal overall 5-year survival rate of 16%. Only liver and pancreatic cancer have worse 5-year survival, yet represent a small fraction of new cancer diagnosis. American Cancer Society, Survellance Research 2012.
Estimated Cancer Related Deaths in 2011 A
B

33
1.4.2 Molecular Epidemiology
Lung cancer is a heterogeneous disease, molecularly, biologically and histologically.
Two main types of lung cancer are non-small cell lung cancer (NSCLC) and small cell lung
cancer (SCLC), which represent 85% and 15% of new cases respectively. NSCLC can further be
classified into adenocarcinoma, squamous carcinoma, large-cell carcinoma, and mixed histologic
subtypes. SCLC occurs with higher incidence in smokers, and typically originates in the central
airways. These different classifications are not based only on histology and gene expression
signatures, but also in the mutations that lie at the core of disease initiation.
Never-smokers can be classified as a distinct subclass of lung cancer, as it is molecularly
and clinically different. Forty-five percent of never smokers have mutations in the EGFR,
another 10% have mutation in human epidermal growth factor receptor 2 (HER2), or a
chromosomal translocation resulting in the fusion of the echinoderm microtubule-associated
protein-like 4 (EML4) gene with the anaplastic lymphoma kinase gene (ALK), producing the
EML4-ALK fusion protein (Rudin, Avila-Tang et al. 2009). Cells that contain mutations in
these receptors are addicted to the signaling pathways and responsive to “targeted” treatments
(Rudin, Avila-Tang et al. 2009). This is in stark contrast to lung cancers arising in smokers
which are characterized by mutation in KRAS in 50% of cases, PIK3CA in 8% of cases and
inactivation of tumor suppressors including p53 with mutation rates approaching 50% (Pao and
Hutchinson 2012). The sheer number of mutation in lung cancers associated with smokers and
lack of treatments targeting driving oncogenic mutations have left many patients with potentially
suboptimal treatment options such as cytotoxic cancer therapy.

34
1.4.2 Treatment
Treatment of oncogene addicted cancers by targeted therapies has been very successful
(Larsen and Minna 2011). However, targeted therapies are only available for a small number of
lung cancers and relapse is commonly observed. The recurrent tumor is typically refractory to
targeted treatment (Kosaka, Yatabe et al. 2006). Treatment, while moving towards targeted
therapies, is still largely based on the stage of the tumor, which is determined by confinement of
the tumor and if/where the tumor has metastasized to. In any case, surgery is the first choice with
adjuvant chemotherapy for stage I/II. For stage III (the tumor has metastases to the lymph
nodes), the standard treatment is chemotherapy with focused radiation on the metastatic site.
Stage IV is incurable and treatment is chemotherapy, radiation and palliative care (Gadgeel,
Ramalingam et al. 2012). Front line chemotherapy is four cycles of a two drug regiment, one of
which is platinum based (cisplatin or carboplatin) plus a third-generation chemotherapeutic agent
such as paclitaxel, docetaxel, vinorelbine, gemcitabine, or pemetrexed, with paclitaxel used most
often (Gadgeel, Ramalingam et al. 2012). The five-year survival for stage 1 lung cancer with
only local disease is 27%. For stage II the five-year survival rate is only 12% due in large part to
resistance and or recurrence which typically occurs within 4 to 6 months of disease remission.
Stage III and IV are generally incurable (Gadgeel, Ramalingam et al. 2012).
Anyone of the hallmarks of cancer could be responsible for drug resistance, and, given
that all the hallmarks have been experimentally proven to be regulated by miRNAs, it is no
surprise that miRNAs have been shown to participate in the phenomenon of drug resistance

35
(Dong, Boyd et al. 2001, Siddik and Mehta 2009, Sarkar, Li et al. 2010, Zheng, Wang et al.
2010).
We sought to better understand the role that miRNAs play in lung cancer and drug
responses. We made several profound discoveries of novel miRNAs involved in well-established
oncogenic pathways encompassing every hallmark of cancer.
36
CHAPTER TWO MATERIALS AND METHODS
2.1 Cell Lines
All human lung cancer cell lines used in this study were established in the John D.
Minna and Adi F. Gazdar laboratories. Cells were maintained in RPMI 1640 (Life Technologies
Inc) with 5% fetal calf serum (FBS) and grown in humidified incubators at 37°C at 5% CO2 and
95% air. Cell passage was kept and all experiments were performed on cell lines, which had
fewer than 25 passages. Normal human bronchial epithelial cells (HBECs) were immortalized
with ectopic overexpression of CDK4 and hTERT and were maintained in KSFM with supplied
supplements (Invitrogen). All cell lines were fingerprinted using the PowerPlex 1.2 kit
(Promega) and confirmed to be the same as the DNA fingerprint library maintained either by
ATCC or the Minna and Gazdar labs. Additionally cells were mycoplasma tested (Bulldog Bio)
prior to use and at various time points throughout their time in culture. Cell lines beginning with
“H” were established National Cancer Institute and cell lines beginning with “HCC” were
established at The University of Texas Southwestern Medical Center Hamon Center for
Therapeutic Oncology Research while colon and pancreatic cell lines were kind gifts from Shay
and Brekken Lab on campus. For experimental studies in charcoal striped media, cells were
given two weeks to adjust to new media conditions, charcoal striped media and serum were
supplied from Invitrogen. All other cell lines used in this study were obtained from collaborators
and maintained in RPMI 1640 with 5% FBS.
37
2.2 Bacterial Work
All bacterial cell lines were selected in ampicillin at 10ug/ml from a 1000x stock.
Transformations were as follows: 100ng of plasmid incubated in 50ul of XL1-Gold chemically
competent cells (Aglient) for 30 minutes on ice followed by a 45 second heat shock at 42oC.
Bacterial cells were then allowed to recover on ice for 5 minutes and 500 ul of SOC media was
added and cells were incubated at 37oC shaking for 1 to 3 hours. Cells were then plated at
various dilutions and spread using glass beads for even distribution and grown over night at
37oC.
Single colonies (usually 10) were then picked and grown up overnight in 5ml of LB with
ampicillin. 1,200ul of overnight culture was then spun down and plasmids were purified
following directions of Qiagen mini prep kits, with the exception that elution was done in water,
not TE, as most samples were sent for sequence verification. All plasmids were sequence
verified using primers recommended by the manufacturer (Appendix C). Bacterial overnight
cultures were frozen down using a 50/50 mixture of overnight culture and 80% glycerol as the
cryogenic agent. Following sequence verification, only one or two samples were kept at -80°C
for long-term storage (Appendix A).
Following sequence verification, starter cultures volumes of 5ml were prepared and
allowed to grow for eight to twelve hours before inoculation of 200-300ml LB for overnight
cultures to be used for Qiagen midi preps. Cells were spun down in a Sorvall RC5B using a GS-3
38
rotor for 30min at 4500rpm. Several modifications to the protocol were made to the protocol to
increase yield: 1) Instead of 6ml of P1, P2 and N3 solutions, 12ml of each were used, 2) During
the five minute incubation with P2, the 50ml conical tube was repeatedly inverted, 3) Once N3
was added, the solution sat in the 50ml conical for 10 minutes at a time of the liquid phase at the
bottom was added to the filter cartage to prevent overflow and clogging the cartridge. DNA was
quantified using a NanoDrop 2000. Yields were in the range of 200ng/ul to 500ng/ul when
elution volume was 1ml. Plasmids then were sequenced to ensure no point mutation had
occurred.
2.3 Transient Transfections
Lung cancer cell lines were optimized for transfection conditions in both 6 well and 96
well formats by varying lipid volume and cell number, and measuring the proliferative difference
between scrambled control (Qiagen) and toxic control (Qiagen). For 6 well experiments, 3-6ul of
RNAiMAX (Invitrogen) was added to 100ul of serum free RPMI-1640, SFM, and incubated at
room temperature for 5 minutes. Ranges of siRNA and miR-10a mimic were from 5nM-50nM
and are listed in Appendix B. Standard procedure, however was to use 20nM unless otherwise
stated. 20nM of oligo was also incubated in 100ul SFM for 5 minutes at room temperature. The
content of each tube was then mixed and allowed to incubate at room temperature for 20 minutes
for lipid-oligo complex to form. Cells were seeded at varying densities based on growth rate and
effects of oligo on cell viability; ranges from 1x10⁵ to 4x10⁵ were used. For 96 well assays 0.3ul
of RNAiMAX was used and complex with olio in 50ul SFM and added to cells suspension of
39
100ul media with serum. Cells were seeded in ranges of 1,000 to 30,000 cells per well. Cells
were quantified using a Beckman coulter counter 2000 or a hemocytometer.
2.4 Quantitative RT-PCR
RNA was harvested from cells using the mirVana miRNA isolation kit (Invitrogen). Cells
were first washed with cold PBS; 300ul of lysis solution was then added to each plate or well of
a six well dish. Cells were scraped off and not spun down to ensure no stress response genes
were up regulated. Kit directions were then followed with the following exception; I used 100ul
RNAase free water for elution. Quality was then determined using a NanoDrop 2000 and diluted
to 40ng/ul. Both stock and diluted RNA was stored at -80oC and cataloged (see Appendix B)
cDNA was produced using the iScript cDNA synthesis kit (BioRad) in 20ul reactions.
We diluted enzyme 4-fold and were still able to obtain the same amount of cDNA, thus the
limiting reagent was the 5x reaction buffer. cDNA was then diluted to 200ul final volume. Target
gene TaqMan probes (Applied Biosystems, Table 2.1) were used for quantification and internally
normalized to GAPDH for large RNAs or RNU19 for miRNAs. RT-PCR reactions were
performed in an ABI-7900 Real-time PCR System. All reactions were repeated in triplicates and
Prism GraphPad 5 or 6 was used to normalize and plot all data. qPCR primers are listed in Table
2.1.

40
GENE NAME ASSAY ID ALDH1A1 Hs00946916_m1
ALDH1A3 Hs00167476_m1
AXIN2 Hs00610344_m1
CDK6 Hs01026371_m1
DVL2 Hs00182901_m1
DVL3 Hs00610263_m1
GATA6 Hs00232018_m1
GLI2 Hs01119974_m1
HES1 Hs00172878_m1
HEY1 Hs01114113_m1
HOXB3 Hs01587922_m1
HOXD10 Hs00157974_m1
hsa-miR-101* MIMAT0004513 hsa-miR-10b* MIMAT0004556 hsa-miR-15a* MIMAT0004488
miR-101-3p MIMAT0000099 miR-10a-5p MIMAT0000253 miR-10a* MIMAT0004555 miR-10b MIMAT0000254 miR-15a MIMAT0000068 miR-337-3p MIMAT0000754 NCOR2 Hs00196955_m1
PIK3CA Hs00907957_m1
PIK3R1 Hs00933163_m1 PTCH1 Hs00181117_m1
PTEN Hs02621230_s1
RNU19 X94290 U6 snRNA NR_004394
Table 2.1: TaqMan Probes and Assay IDs for qPCR Analysis.
41
2.4 Microarray Analysis
Transcript expression data for all lung cancer cell lines was generated in the Minna Lab
using the Illumina (WG6-V2 and V3 BeadChip) array platforms. Tumor cell RNA was isolated
using Qiagen RNeasy kit and total RNA quality was confirmed by formaldehyde gel and/or
capillary electrophoresis on the Experion System (Bio-Rad). Total RNA was labeled, amplified
and re-analyzed for quality prior to hybridization by the UTSW Simmons Comprehensive
Cancer Center Genomics Core.
RNA isolated from the mirVana kit was submitted to core facilities for expression
profiling on Illumina HumanHT-12 V4 BeadArrays. Data was pre-processed using R package
mbcb for probe summarization and background correction (Ding, Xie et al. 2008). Following
pre-processing data was log-transformed after quartile-normalization. Finally MATRIX
(MicroArray Transformation in Microsoft Excel) software version 1.41 was used to import and
analyze microarray expression data. Using MATRIX, transcript expression was normalized
across samples by the median value, and then normalized expression signals were log2-
transformed and color-coded. Correlations in expression, were determined by Pearson’s
correlation coefficient. For comparison between sample classes (such as miR-10a and control
mimic transfections), the ratio of log2- transformed signals from sample classes were generated
and two-sample t-tests were performed in MATRIX to filter out non-significant differences in
expression (P = 0.05).

42
2.5 NSCLC Tissue Microarray
Archived, formalin-fixed, paraffin-embedded tissues from surgically resected lung cancer
specimens (lobectomies and pneumonectomies) containing tumor and adjacent normal
epithelium tissues were obtained from the Lung Cancer Specialized Program of Research
Excellence (SPORE) Tissue Bank at The University of Texas M. D. Anderson Cancer Center
(Houston, TX). The tissue specimens were histologically examined and classified using the 2004
World Health Organization classification system and 282 NSCLC samples (177
adenocarcinomas and 105 squamous cell carcinomas) were selected for our tissue microarray
(TMA). TMAs were constructed using triplicate 1-mm diameter cores per tumor; each core
included central, intermediate, and peripheral tumor tissue. Detailed clinical and pathologic
information, including patient demographics, smoking history, smoking status, clinical and
pathologic TNM stage, overall survival duration, and mutation status of KRAS and EGFR, was
available for most cases. The local institutional review board approved the study.
2.5 Protein Expression
Cell lysates were obtained using M-PER mammalian protein Extraction reagent (Thermo)
supplemented with protease and phosphatase inhibitor (Roche). For miRNA mimic and transient
transfections using siRNAs, cells were seeded at 200-300 thousand per well and five wells were
pooled. All other treatments were in 10 cm plates and protein lysates were collected when cells
were at 70-90% confluence. All samples have been cataloged (Appendix D). Protein lysates were
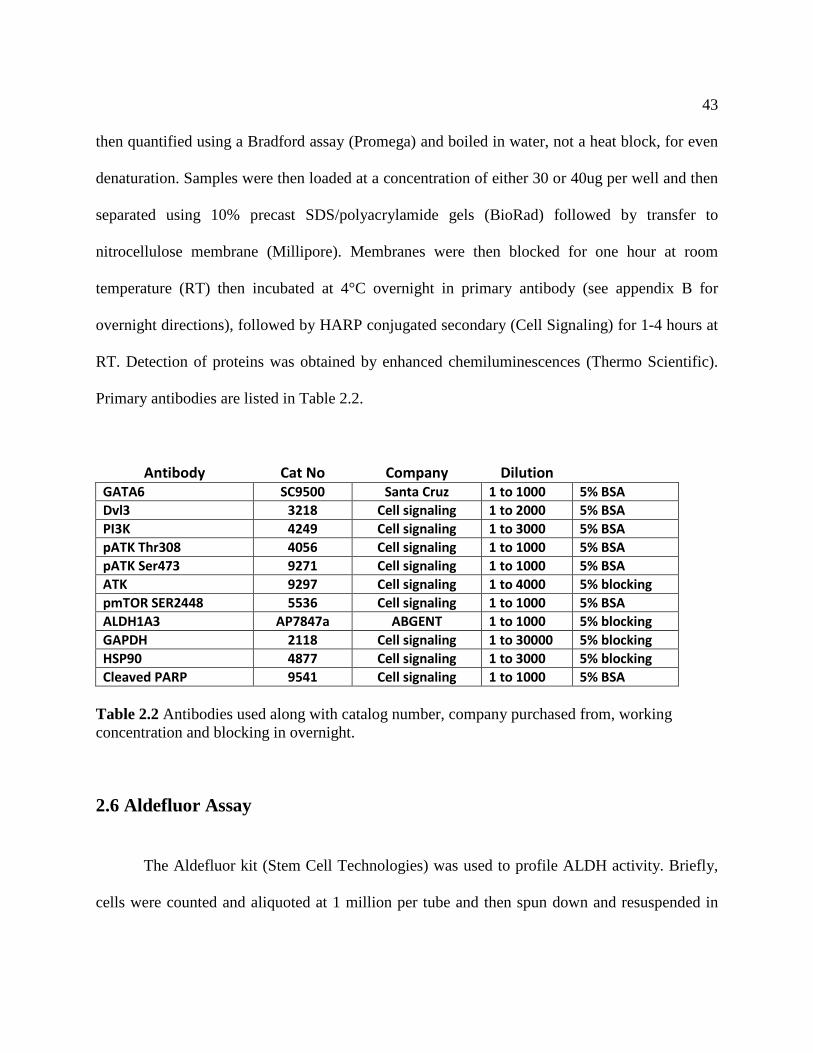
43
then quantified using a Bradford assay (Promega) and boiled in water, not a heat block, for even
denaturation. Samples were then loaded at a concentration of either 30 or 40ug per well and then
separated using 10% precast SDS/polyacrylamide gels (BioRad) followed by transfer to
nitrocellulose membrane (Millipore). Membranes were then blocked for one hour at room
temperature (RT) then incubated at 4°C overnight in primary antibody (see appendix B for
overnight directions), followed by HARP conjugated secondary (Cell Signaling) for 1-4 hours at
RT. Detection of proteins was obtained by enhanced chemiluminescences (Thermo Scientific).
Primary antibodies are listed in Table 2.2.
Antibody Cat No Company Dilution GATA6 SC9500 Santa Cruz 1 to 1000 5% BSA
Dvl3 3218 Cell signaling 1 to 2000 5% BSA PI3K 4249 Cell signaling 1 to 3000 5% BSA pATK Thr308 4056 Cell signaling 1 to 1000 5% BSA pATK Ser473 9271 Cell signaling 1 to 1000 5% BSA ATK 9297 Cell signaling 1 to 4000 5% blocking pmTOR SER2448 5536 Cell signaling 1 to 1000 5% BSA ALDH1A3 AP7847a ABGENT 1 to 1000 5% blocking GAPDH 2118 Cell signaling 1 to 30000 5% blocking HSP90 4877 Cell signaling 1 to 3000 5% blocking Cleaved PARP 9541 Cell signaling 1 to 1000 5% BSA
Table 2.2 Antibodies used along with catalog number, company purchased from, working concentration and blocking in overnight.
2.6 Aldefluor Assay
The Aldefluor kit (Stem Cell Technologies) was used to profile ALDH activity. Briefly,
cells were counted and aliquoted at 1 million per tube and then spun down and resuspended in
44
100ul assay buffer containing BAAA, the assay substrate BODIPY-aminoacetaldehyde (BAAA)
is catalyzed to a fluorescent product BODIPY-aminoacetate (BAA). This was then split into
500ul aliquots, with DEAB, an inhibitor of ALDH added to one aliquot. These samples were
then incubated for 45min at 37°C for 45 minutes in the dark. Before the samples were taken to
the core facility, 1ul of propidium iodine was added. Gating for ALDH+ cells is determined by
inhibiting ALDH activity using diethylamino-benzaldehyde (DEAB). The assay was performed
on a FACScan flow cytometer (BD Biosciences) while sorting was performed on either a
MoFlow (Cytomation) or BD Aria (BD Biosciences). Purity of isolated cells was confirmed by
post-sorting analyses.
2.7 Colony Formation and Growth Assay
For colony formation assays, stably transfected cell lines were plated and allowed to
grow for two to three weeks at which point they were stained with 0.5% crystal violet and
quantified. Transiently transfected cell lines were first reverse transfected with 20nm of miR-10a
mimic, siDVL3, siPIK3CA, siGATA6 or miR-10a inhibitor and appropriate control, allowed to
recover for 48 hours and then plated into six well dishes. Cells were plates at various
concentrations ranging from 100 to 1,000 cells per well and allowed to grow until colonies were
observed in the control wells. To measure growth rates, cells were plated into 96 well assay
plates following reverse transfection and relative cell number was quantified using Cell Titer Glo
(Promega) over 5 days. Cell numbers were optimized prior to transfection such that the control
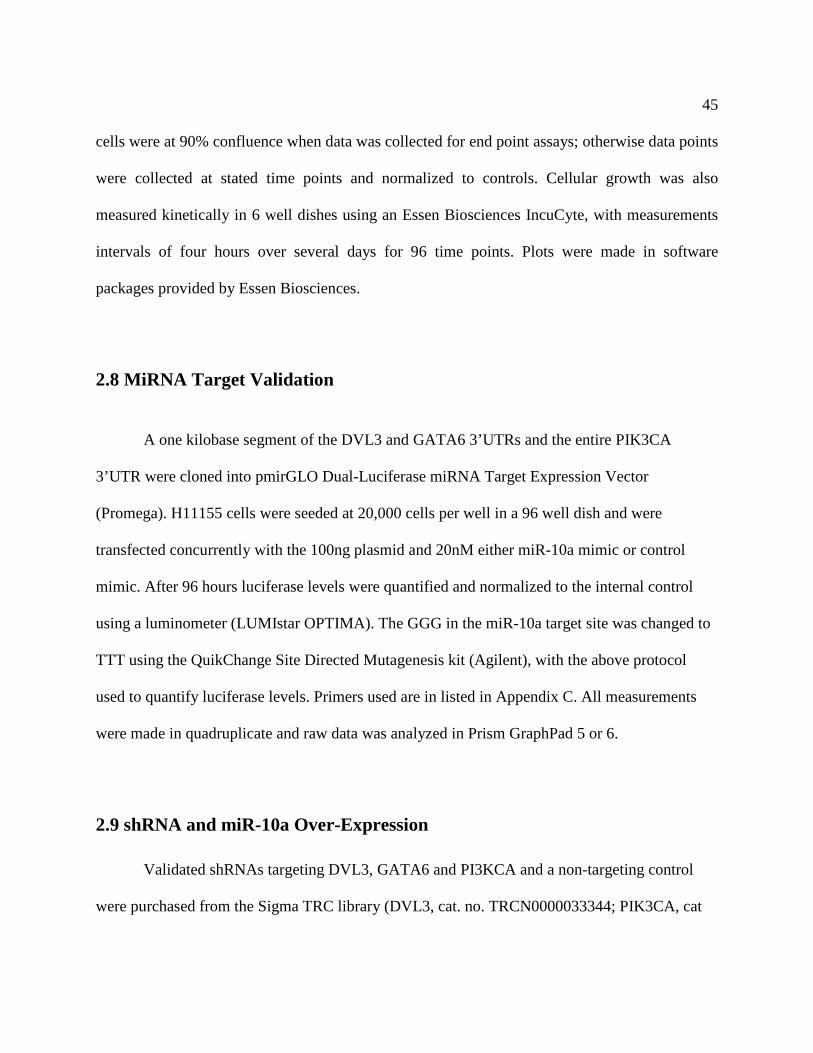
45
cells were at 90% confluence when data was collected for end point assays; otherwise data points
were collected at stated time points and normalized to controls. Cellular growth was also
measured kinetically in 6 well dishes using an Essen Biosciences IncuCyte, with measurements
intervals of four hours over several days for 96 time points. Plots were made in software
packages provided by Essen Biosciences.
2.8 MiRNA Target Validation
A one kilobase segment of the DVL3 and GATA6 3’UTRs and the entire PIK3CA
3’UTR were cloned into pmirGLO Dual-Luciferase miRNA Target Expression Vector
(Promega). H11155 cells were seeded at 20,000 cells per well in a 96 well dish and were
transfected concurrently with the 100ng plasmid and 20nM either miR-10a mimic or control
mimic. After 96 hours luciferase levels were quantified and normalized to the internal control
using a luminometer (LUMIstar OPTIMA). The GGG in the miR-10a target site was changed to
TTT using the QuikChange Site Directed Mutagenesis kit (Agilent), with the above protocol
used to quantify luciferase levels. Primers used are in listed in Appendix C. All measurements
were made in quadruplicate and raw data was analyzed in Prism GraphPad 5 or 6.
2.9 shRNA and miR-10a Over-Expression
Validated shRNAs targeting DVL3, GATA6 and PI3KCA and a non-targeting control
were purchased from the Sigma TRC library (DVL3, cat. no. TRCN0000033344; PIK3CA, cat

46
no. TRCN0000196582; GATA6, cat. no. TRCN0000005392; non-targeting control, cat no.
SHC002). Several shRNAs targeting the three genes were used from the pGIPZ library (), but the
results were inconsistent and knock-down was always less than 50%. The difference in
performance was likely due to differences in backbone construction: the Sigma TRC shRNA
construct is driven by the U6 promoter with is RNA polymerase III dependent, while the pGIPZ
shRNA construct from OpenBiosystems is CMV driven and processed using the miRNA
machinery in the context of miR-30 (Figure 5). The use of pGIPZ makes several assumptions: 1)
the cell line expresses miR-30 and can process the shRNA to produce a mature product, and 2)
CMV promoter efficiency is consistent across all cell lines. This has been documented to be case
and could be the reason for the inconsistent data generated from the pGIPZ shRNAs (Robert Jan
Lebbink, Maggie Lowe et al. 2011) (Figure 6 A-D). miR-10a over expression construct and
control were purchased from System Biosciences (miR-10a, cat. no. PMIRH10aPA-1; control,
cat. no. PMIRH000PA-1).
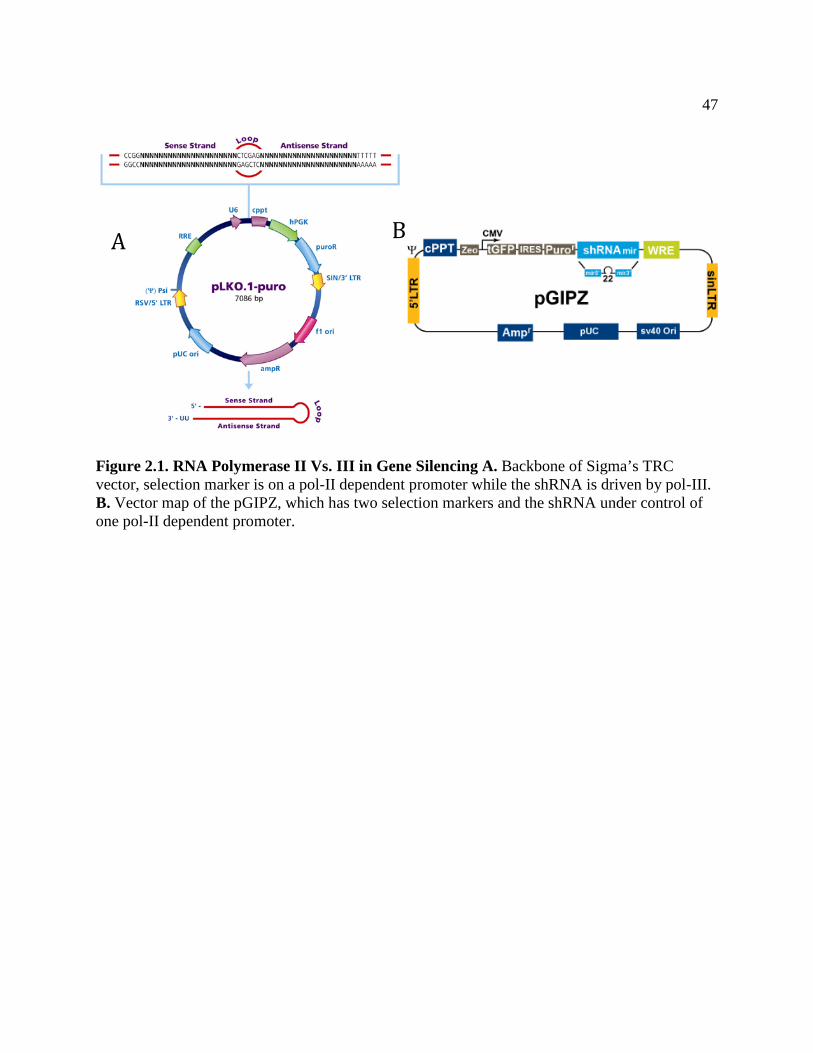
47
Figure 2.1. RNA Polymerase II Vs. III in Gene Silencing A. Backbone of Sigma’s TRC vector, selection marker is on a pol-II dependent promoter while the shRNA is driven by pol-III. B. Vector map of the pGIPZ, which has two selection markers and the shRNA under control of one pol-II dependent promoter.
A B
48
Figure 2.2 Gene Silencing is More Efficient From Polymerase III Promoters. A. shRNAs targeting PI3K or GAT6 resulted in complete and consistent loss of protein levels following selection. B. Several cells lines were tested and transduced multiple times consistently leading to same phenotype. **** P ≤ 0.0001 two tailed T-test. C. shGIPZ results were inconsistent over multiple cell lines and transduction. D. shRNAs only resulted in slight reduction of target genes even after selection dual selection, puromycin selection and then GFP sorting.
p
pGIPZ-non targeting pGIPZ-shGATA6
GAPDH
GATA6
shCtrl
shGATA6
GATA6
GAPDH
PIK3CA
shCtrl shGATA6 shPIK3CA
shTRC1
Trial 1
Trial 2
A
B D
C
49
2.10 Lentiviral Production
Lentivirus was generated using lentiviral plasmids pGIPZ and Sigma’s TRC using 293T-
packaging cells. Lentiviral plasmid DNA is co-transfected with pMD2-VSVG (envelope
plasmid) and either pCMV-deltaR8.91 or psPAX2 (gag/pol and rev expressing packaging
plasmids with HIV backbone). psPAX2 reportedly has better efficiency, but both work very well.
Requirements:
293T cells at 50-70% confluence (maintain in RPMI 1640 R5 + G418 (0.5 mg/mL)
Don’t use cells that have been in culture for > 1 month
Lentiviral plasmid DNA (in dH2O or 1X TE pH8.0) (midiprep purified)
pCMV-deltaR8.91 or psPAX2 (gag/pol and rev expressing with HIV backbone)
pMD2-VSV-G (envelope expressing with HIV backbone)
FuGENE6 (Roche, #11 815 091 001, or 11 814 443 001)
Serum-free media (SFM) e.g. Opti-MEM (Invitrogen, #51985) (pre-warmed to 37°C)
Day 1:
The day before, seed 293T cells in R5 (no G418) to obtain 50-70% confluence
60mm: 4.0-5.0×10⁵ cells
100mm: 1.3-1.5×10⁶ cells
On the day of the transfection (in the afternoon):
50
Dilute FuGENE6 in SFM – adding FuGENE directly to media and not touching the tube (use
table below). Flick to mix.
In a separate tube, dilute lentiviral plasmid and packaging/envelope plasmids in SFM (use table
below). Flick to mix.
Incubate tubes at RT for 5min.
Use a 3:1 (µL:µg) FuGene6 to DNA ratio (total DNA from all plasmids)
Add entire plasmid mix to FuGENE6 mix, tap the tube or vortex for one second to mix the
contents. Incubate complex for 20-30 min at RT.
Continued incubation for up to 45 minutes (for some cell lines up to two hours) will not affect
transfection efficiency.
1. During incubation, aspirate media off 293T cells and replace with appropriate volume of R5
(no G418) (60mm:3.5mL, 100mm: 9.0mL)
• 293T cells detach easily, add media slowly against the side of the plate
2. Gently add the DNA:FuGENE6 complex (60mm:100-200µL, 100mm: 200-400µL) to cells
in a drop-wise manner (hold tip close to media surface). Mix by gently moving plate in ↕
and ↔ directions.
3. Incubate plates overnight in 37°C 5% CO2 incubator**
** Media will begin to accumulate infectious virus so take appropriate precautions
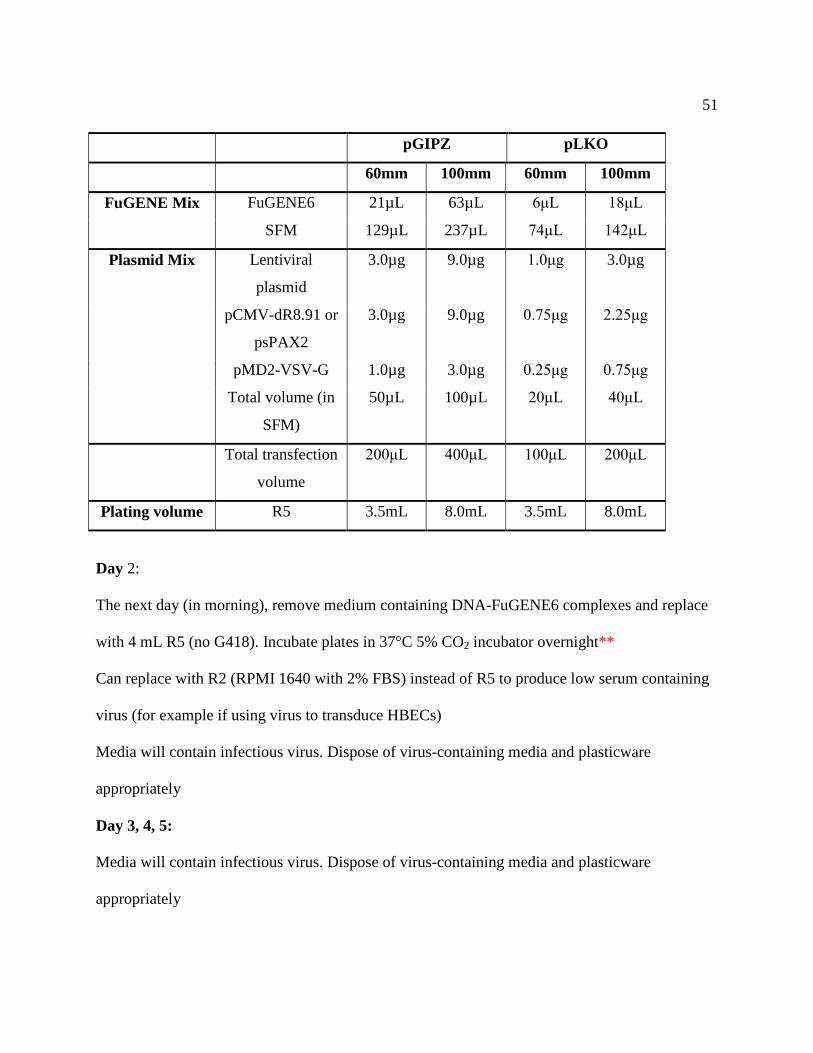
51
pGIPZ pLKO
60mm 100mm 60mm 100mm
FuGENE Mix FuGENE6 21µL 63µL 6μL 18μL
SFM 129µL 237µL 74μL 142μL
Plasmid Mix Lentiviral
plasmid
3.0µg 9.0µg 1.0μg 3.0µg
pCMV-dR8.91 or
psPAX2
3.0µg 9.0µg 0.75μg 2.25μg
pMD2-VSV-G 1.0µg 3.0µg 0.25μg 0.75μg
Total volume (in
SFM)
50µL 100µL 20μL 40μL
Total transfection
volume
200μL 400μL 100μL 200μL
Plating volume R5 3.5mL 8.0mL 3.5mL 8.0mL
Day 2:
The next day (in morning), remove medium containing DNA-FuGENE6 complexes and replace
with 4 mL R5 (no G418). Incubate plates in 37°C 5% CO2 incubator overnight**
Can replace with R2 (RPMI 1640 with 2% FBS) instead of R5 to produce low serum containing
virus (for example if using virus to transduce HBECs)
Media will contain infectious virus. Dispose of virus-containing media and plasticware
appropriately
Day 3, 4, 5:
Media will contain infectious virus. Dispose of virus-containing media and plasticware
appropriately

52
4. Virus can be harvested from days 3-5 (can harvest every 12-24 hrs). Harvest virus-
containing supernatants by removing medium into a 15 mL tube.
• If several harvests are being made, virus can be pooled and stored at 4oC until
harvesting finished, then continue with steps 10-12
• Minimal differences in viral titer are observed between collection at 48-120hr
5. (Optional) Centrifuge supernatant at 3,000 rpm for 15 min at 4°C to pellet debris
• Skipping this step avoids potential contamination of centrifuge with viral supernatant.
6. Filter viral supernatant through 0.45 μm filter (may require more than one filter)
7. Pipette supernatants into cryovials in 1-2 mL aliquots. Store at -80°C.
8. (Optional) If collecting sequential harvests, add fresh R5 to transfected 293T cells and
incubate at 37°C for 12-24hr before harvesting.
2.10 In vivo Xenograft Growth
The NOD/SCID mouse xenograft model was used to characterize the tumorigenicity of
prospective human lung cancer stem cell populations. All in vivo experiments were performed in
female NOD/SCID mice, bred and purchased from the UTSW Mouse Breeding Core. The care
and treatment of experimental animals were in accordance with institutional guidelines, and this
project was approved by the UTSW animal care committee (IACUC).
Induction of subcutaneous tumors using shDVL, shCTRl, pCDH miR-10a and pCDH ctrl
were carried out through injection of 1 million cells in 100ul of PBS. To minimize leakage at the
injection site, 27 1⁄2 or 30 1⁄2 gauge needles were used and the subcutaneous region was made
53
accessible for injection by lifting the skin at the site of injection to alleviate pressure on the
injected volume. Prior to subcutaneous injection, fur on the right flanks of mice was shaved off
using an electric razor to improve detection of xenograft formation. Tumor volume was
measured by caliper biweekly for up to ten weeks. Tumor volumes were calculated as follows:
Vtumor = (π/6)(dlarge)(dsmall)2.
2.11 Dose Response Curves
hsa-miR-337
H1155 cells were reverse transfected with 50nM of miR-337 mimic or control non-
targeting mimic complex with 0.6ul Dharmafect (Invitrogen) and seeded at a density of 6,000
cells per well in a 96 well assay plates. Following 72 hrs. of pretreatment the appropriate drug
was added and following incubation with drug for 72 hrs. cell viability was determined using
Celltiter 96 AQueous One Solution Cell Proliferation Assay (MTS) (Promega).
For combinatorial studies, siRAP1A and siSATA3 oligos were purchased from Thermo
Scientific, and used at a concentration of 25nM; the control non-targeting oligo was delivered at
50nM. The above protocol was followed.
miR-10a and miR-15a Mimic
H1155 and H460 cells were seeded at 6,000 cells per well and reverse transfected with
20nM of miR-10a mimic or control mimic #2 using 0.3ul RNAiMAX. Following 72 hrs. of pre-
54
treatment, the appropriate drug was added; following incubation with drug for 72 hrs., cell
viability was determined using Celltiter 96 (Promega).
miR-10a Inhibitor
H1155 and H460 cells were seeded at 2,000 cells per well and reverse transfected with
20nM of miR-10a mimic or control mimic #2 using 0.3ul RNAiMAX. Following 72 hrs. of
pretreatment the appropriate drug was added; following incubation with drug for 72 hrs., cell
viability was determined using Celltiter 96 (Promega).
2.12 Drug Dilutions and Resuspension
Vinorelbine (FW: 778.932 g/mol)
From stock of 10 mg/ml (12.8 mM) remove 5 microliters and add to 25 ml of R5 to give a
starting stock of 2560 nM. Add 100 microliters to the first well, when diluted this will give a
final concentration of 1024 nM. 1 to 4 dilutions can be preformed all the way down to 0.0039
nM.
Vincristine (FW: 824.958 g/mol)
From stock of 1 mg/ml (1 mM) remove 64 microliters and add to 25 ml of R5 to give a starting
stock of 2560 nM. Add 100 microliters to the first well, when diluted this will give a final
concentration of 1024 nM. 1 to 4 dilutions all the way down to 0.0039 nM.
55
Vinblastine (FW: 810.974 g/mol)
From stock of 1 mg/ml (1.23 mM) remove 52 microliters and add to 25 ml of R5 to give a
starting stock of 2560 nM. Add 100 microliters to the first well, when diluted this will give a
final concentration of 1024 nM. 1 to 4 dilutions were done all the way down to 0.0039nM.
Gemcitabine (FW: 263.198 g/mol)
From stock of 38 mg/ml (141 mM) needs a 1 to 10 dilution first done in Milli-Q water. From the
1 to 10 dilution, remove 4.539 microliters into 25 ml of R5 (this will give a starting stock of
2560 nM). Add 100 microliters to the first well, when diluted this will give a final concentration
of 1024 nM. 1 to 4 dilutions can be preformed all the way down to 0.0039 nM.
Cisplatin (FW: 300.05 g/mol)
From stock 1 mg/ml (3.3 mM), remove 2.1 ml and add to 7.9 ml R5 to give a starting stock of
693 μM. Add 100 microliters to the first well, when diluted this will give a final concentration of
262 μM. 1 to 4 dilutions can be preformed all the way down to 4 nM.
BEZ-235 (FW: 418.477g/mol)
BEZ-235was resuspended in DMSO to give a stock of concentration of 2 mM. From this stock
remove 16 μL into 12.5 ml R5 for a working stock of 2560 nM.
ATRA Resuspension (FW: 300.44 g/mol)
50 mg (0.00016 moles) ATRA was obtained from Sigma (cat. no. R2625). This was dissolved in
16ml of DMSO for a 10mM stock from which a 1 to 10 dilution was done to make a 1 mM or
1000 μM working stock. Keep protected from light.
56
9-Cis Resuspension (FW: 300.44g/mol)
1 mg 9-cis retinoic acid (3.328 μmoles) was obtained from Sigma (cat. no. R4643) and dissolved
in 332 μL of DMSO for a stock concentration of 10mM, from which a 1 to 10 dilution were
performed to make a working stock of 1000 μM.
2.13 Statistical Methods
Correlations between expression of different genes the panel of NSCLC lines was done
by simple linear regression. Differences in RT-PCR, proliferation, tumor growth and colony
formation assays were assessed by analysis of variance and Student’s t-test using GraphPad
Prism 5 or 6 software(Marcato, Dean et al.). Difference between control and experimental groups
were considered statistically significant when P<0.05. Drug sensitivity assays were graphed
using nonlinear-fit baseline-corrected dose response curves in GraphPad Prism 5 or 6;
significance was determined using sum-of-squares F test.
2.14 Apoptosis Assay H460 cells were reverse transfected with 20 nM of miR-10a mimic or control oligo and
plated into 96 well plates and incubated with DEVD-NucView (Essen Bioscience), which is a
florescence reporter for Caspase-3/7 activation. Overall cell number is determined by staining all
cells with a nuclear staining dye 72 hrs. post transfection. Differences in florescence before the
endpoint determine the percent of cells undergoing apoptosis. For H2009 cells, we used Promega
Caspase-glo 3/7 72 hrs. post transfection with miR-10a mimic and control mimic.
57
2.15 GATA6 ChiP
As described in (Verzi, Shin et al. 2010), the antibody and kit were used as directed by
the manufacturer. Cells were plated and allowed to grow to 60-80% confluence in 10 cm dishes
and cross-linked using 37% formaldehyde. The reaction was quenched using glycine, and
samples were lysed using 10% SDS. Genomic DNA was purified using the EZ-ChiP Chromatin
Immunoprecipitation kit (Millipore, cat no. 17-371). Samples were sonicated to generate a 1 Kb
smear and then incubated with the GATA6 antibody listed in Table 2.2. Following purification,
DNA was amplified using primers listed in Appendix C. PCR products were run on a 1%
agarose gel.
2.16 miRNA Inhibitor Screen and Validation A miRNA inhibitor library containing inhibitors for 747 human miRNAs was purchased
from Exiqon. H1155 cells were seeded at 10,000 cells per well, suspended in 100 ul R5 and
transfected with 0.6ul Dharmafect in 25ul of SFM and 50nM of the miRNA inhibitor in 25ul
SFM. After 72 h incubation with the miRNA inhibitor, cells were treated with paclitaxel at the
EC20 (in this case 10 nM) or media only for 72 hrs., at which point viability was determined
using CellTiter-Glo (Promega). Perimeter wells contained media only. Each measurement was
made in triplicate. Hits were determined by an FDR of less than 0.05. All data graphed are z-
scores (Figure 4.1A). All called hits were validated using the same experimental design.

58
CHAPTER THREE miR-337 and Cellular Response to Paclitaxel
3.1 Introduction
Paclitaxel is a mitotic inhibitor isolated in the 1960s from the Pacific yew tree. It first
showed anti-tumor activity in a mouse model of leukemia. However, it was not until ten years
later that it was shown to be effective in xenograft tumors of breast, endometrium, ovary, brain,
lung and tongue tumors(Riondel, Jacrot et al. 1986) . Paclitaxel-treated mice showed as much as
a 91-day growth delay compared to mice in the control group. Currently, it is still used to treat
lung, ovarian, breast and head and neck cancers.
Paclitaxel acts by binding to the beta-subunit of tubulin, an interaction that stabilizes
microtubules. Microtubules are dynamic structures that rapidly polymerize and depolymerize
and are key components of the cytoskeleton and are essential in all eukaryotic cells. They are
made up of tubulin heterodimers composed of alpha and beta tubulin monomers, each with a
molecular mass of 50kD. The tubulin subunits form the microtubule structures, which are hollow
tubes approximately 25nm in diameter and radiate from centrosomes. These dynamic structures
are involved in many cellular processes, including but not limited to cellular movement,
intracellular transportation and cell division. The biological functions of microtubules are
determined and regulated by polymerization dynamics (Storer and Salmon 1997).
Compounds that target microtubules can be grouped as either microtubule stabilizing
such as taxanes or microtubule-destabilizing. Each class suppresses microtubule dynamics,
which blocks cell cycle progression and causes cell death via apoptosis. However there is wide
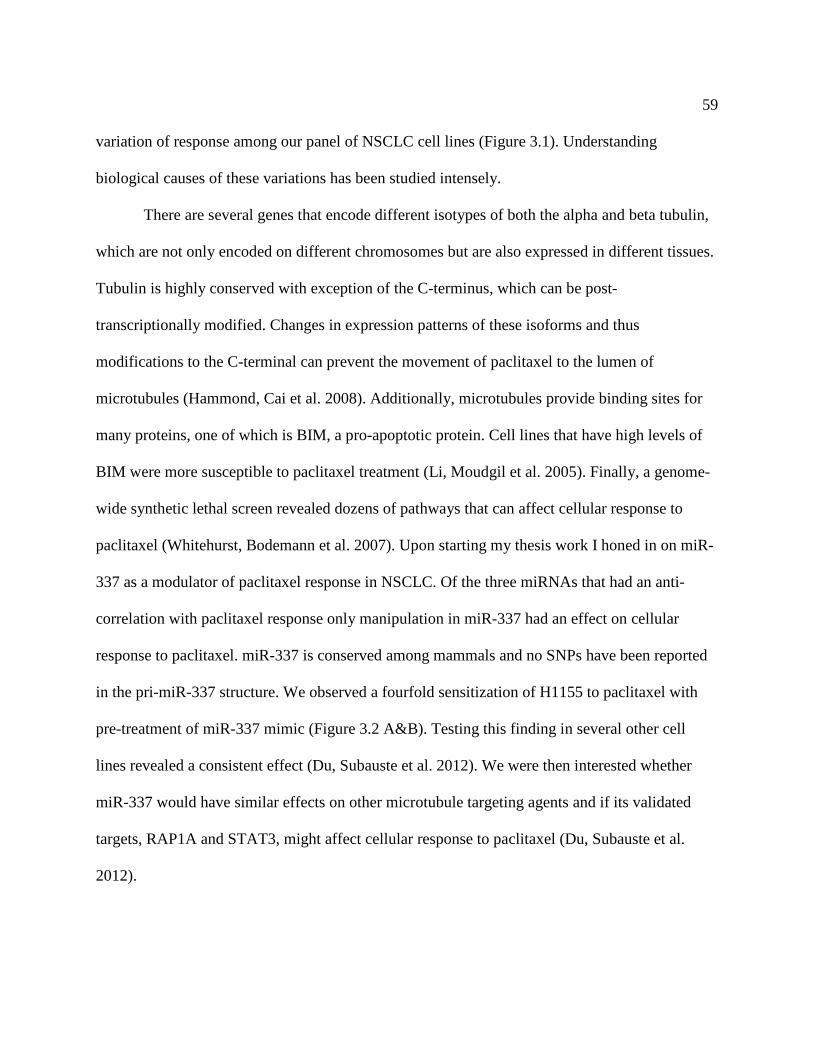
59
variation of response among our panel of NSCLC cell lines (Figure 3.1). Understanding
biological causes of these variations has been studied intensely.
There are several genes that encode different isotypes of both the alpha and beta tubulin,
which are not only encoded on different chromosomes but are also expressed in different tissues.
Tubulin is highly conserved with exception of the C-terminus, which can be post-
transcriptionally modified. Changes in expression patterns of these isoforms and thus
modifications to the C-terminal can prevent the movement of paclitaxel to the lumen of
microtubules (Hammond, Cai et al. 2008). Additionally, microtubules provide binding sites for
many proteins, one of which is BIM, a pro-apoptotic protein. Cell lines that have high levels of
BIM were more susceptible to paclitaxel treatment (Li, Moudgil et al. 2005). Finally, a genome-
wide synthetic lethal screen revealed dozens of pathways that can affect cellular response to
paclitaxel (Whitehurst, Bodemann et al. 2007). Upon starting my thesis work I honed in on miR-
337 as a modulator of paclitaxel response in NSCLC. Of the three miRNAs that had an anti-
correlation with paclitaxel response only manipulation in miR-337 had an effect on cellular
response to paclitaxel. miR-337 is conserved among mammals and no SNPs have been reported
in the pri-miR-337 structure. We observed a fourfold sensitization of H1155 to paclitaxel with
pre-treatment of miR-337 mimic (Figure 3.2 A&B). Testing this finding in several other cell
lines revealed a consistent effect (Du, Subauste et al. 2012). We were then interested whether
miR-337 would have similar effects on other microtubule targeting agents and if its validated
targets, RAP1A and STAT3, might affect cellular response to paclitaxel (Du, Subauste et al.
2012).
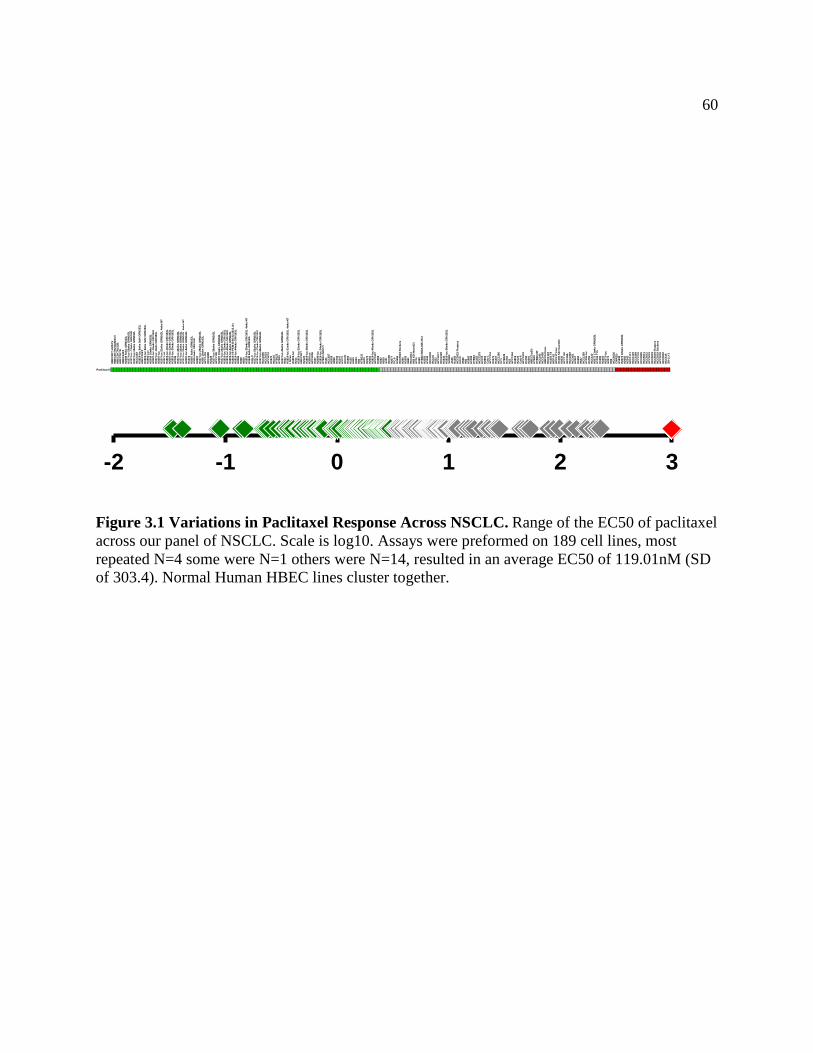
60
Figure 3.1 Variations in Paclitaxel Response Across NSCLC. Range of the EC50 of paclitaxel across our panel of NSCLC. Scale is log10. Assays were preformed on 189 cell lines, most repeated N=4 some were N=1 others were N=14, resulted in an average EC50 of 119.01nM (SD of 303.4). Normal Human HBEC lines cluster together.
HBEC
3KT
pMSC
VHB
EC3K
TRL5
3pM
SCV
HBEC
3KTR
L53B
HBEC
3KTB
HBEC
34KT
H200
9 6w
ks G
RN16
3LH1
57-lu
c-20
wks
GRN
163L
H157
-luc
-12w
ks G
RN16
3LH1
57-lu
c-16
wks
GRN
163L
HCC3
153
H181
9-lu
c 8w
ks 9
uM G
RN16
3LHB
EC30
KTH1
819-
luc
8wks
3uM
GRN
163L
H199
3-Lu
cH2
009
10w
ks G
RN16
3LH2
087-
luc-
16w
ks G
RN16
3LH1
57-lu
c -8
wks
GRN
163L
H208
7-lu
cH1
57-lu
c-31
wks
GRN
163L
4w
ks-N
TH1
57-L
ucH1
819-
luc-
16w
ks G
RN16
3LH2
087-
luc-
12w
ks G
RN16
3LH1
819-
luc-
20w
ks G
RN16
3LH2
106
H157
-luc-
40w
ks G
RN16
3LH1
57-lu
c-32
wks
GRN
163L
H157
-luc-
25w
ks G
RN16
3L 4
wks
-NT
H208
7-lu
c-8w
ks G
RN16
3LH1
373
H208
7 6w
ks G
RN16
3LH3
58 6
wks
GRN
163L
H208
7H1
57-lu
c-28
wks
GRN
163L
H358
10w
ks G
RN16
3LHC
C142
8HC
C268
8H2
228
H157
-luc-
36w
ks G
RN16
3LHC
C210
8H2
087
10w
ks G
RN16
3LH1
57-lu
c-24
wks
GRN
163L
H181
9-lu
c 52
wks
GRN
163L
H181
9-lu
c-48
wks
GRN
163L
H181
9-lu
c-8w
ks G
RN16
3LH1
819-
V5-P
EM-B
-06-
22-2
013.
xls
H181
9-lu
c-44
wks
GRN
163L
H208
6H3
58H6
50H1
819-
luc-
25w
ks G
RN16
3L 4
wks
-NT
H164
8 6w
ks G
RN16
3LCa
lu-3
H157
-luc
52w
ks G
RN16
3LH1
819-
luc-
12w
ks G
RN16
3LH1
57-lu
c-48
wks
GRN
163L
HCC1
806
HCC5
023
HCC4
019
H197
5HC
C15
HTB1
22HT
B25
H157
-luc-
44w
ks G
RN16
3LH5
22H1
819-
luc-
31w
ks G
RN16
3L 4
wks
-NT
LNCa
pH1
819-
luc
H211
H181
9-lu
c-32
wks
GRN
163L
HBEC
3KT
H212
2H1
819-
luc-
28w
ks G
RN16
3LH3
58-lu
cHC
C400
6H1
57H2
009-
luc
H181
9-lu
c-24
wks
GRN
163L
HTB2
2 (M
CF7)
H441
HCC8
27H2
009
H838
H170
3H2
347
H312
2HC
C78
H199
3H1
25H9
69H3
24H6
0HT
B131
H820
H217
0H2
052
H181
9-lu
c-40
wks
GRN
163L
HCC1
937
H156
8H2
92H9
20A4
31HC
C95
H207
7PC
-9H1
666
HCC5
023
Stic
kers
H290
H169
3H6
61HC
C401
1H8
2 KD
Neu
roD1
H226
H460
HTB2
6 (M
DA-M
B 23
1)H3
255
H164
8HC
C401
8HC
C44
H322
HCC4
017
HCC2
429
H194
4H1
819-
luc-
36w
ks G
RN16
3LSK
BR3
A549
H135
5HC
C502
3 Fl
oate
rsEK
VXH5
96H8
2H1
882
H129
9HT
B24
H115
5HC
C227
9H1
770
H288
2Ca
lu-1
HCC2
374
H157
3H1
437
HCC1
395
PC3
HTB1
26H1
781
H23
HCC1
954
H181
9H2
126
Calu
-6HC
C183
3H1
792
H229
1HB
EC3-
p53-
HTB2
0HT
B20-
HRHC
C193
HCC2
450
HBEC
3-Kr
as+
HCC1
143
H135
5 T8
HOP-
62HC
C117
1-lu
cH1
155
KD N
euro
D1H2
030
HCC1
195
HCC3
66HC
C230
2HC
C461
H288
7H1
650
H647
HCC1
359
H139
5-lu
cH1
755
HCC1
22H2
073
11w
ks G
RN16
3LH1
299
T10
H139
5H2
405
H207
3-lu
cH2
073
H69
HCC5
036
CWR2
2rH1
838
H207
3 18
wks
GRN
163L
H208
5H2
342
HCC1
171
HCC1
419
HCC1
569
HCC2
218
HCC2
935
HCC5
011
HCC5
012
HCC5
018
HCC5
019
HCC5
019
Floa
ters
HCC5
019
Stic
kers
HCC5
030
HCC5
032
HCC5
15SK
-LU-
1
Paclitaxel # # # # # # # # # # # # # # # # # # # # # # # # # # # # # # # # # # # # # # # # # # # # 0 0 0 0 0 0 0 0 0 0 0 0 0 0 0 0 0 0 0 0 0 0 0 0 0 0 0 0 0 0 0 0 0 0 0 0 0 0 0 0 0 0 0 0 0 0 0 0 0 0 0 0 0 0 1 1 1 1 1 1 1 1 1 1 1 1 1 1 1 1 1 1 1 1 1 1 1 1 1 1 1 1 1 1 1 1 1 1 1 1 1 1 1 1 1 1 1 1 1 1 1 1 1 1 1 1 1 1 1 1 1 1 1 1 1 1 1 1 1 1 1 1 1 1 1 2 2 2 2 2 2 2 2 2 2 2 2 2 2 2 3 3 3 3 3 3 3 3 3 3 3 3 3 3 3 3 3 3 3 3
-2 -1 0 1 2 3
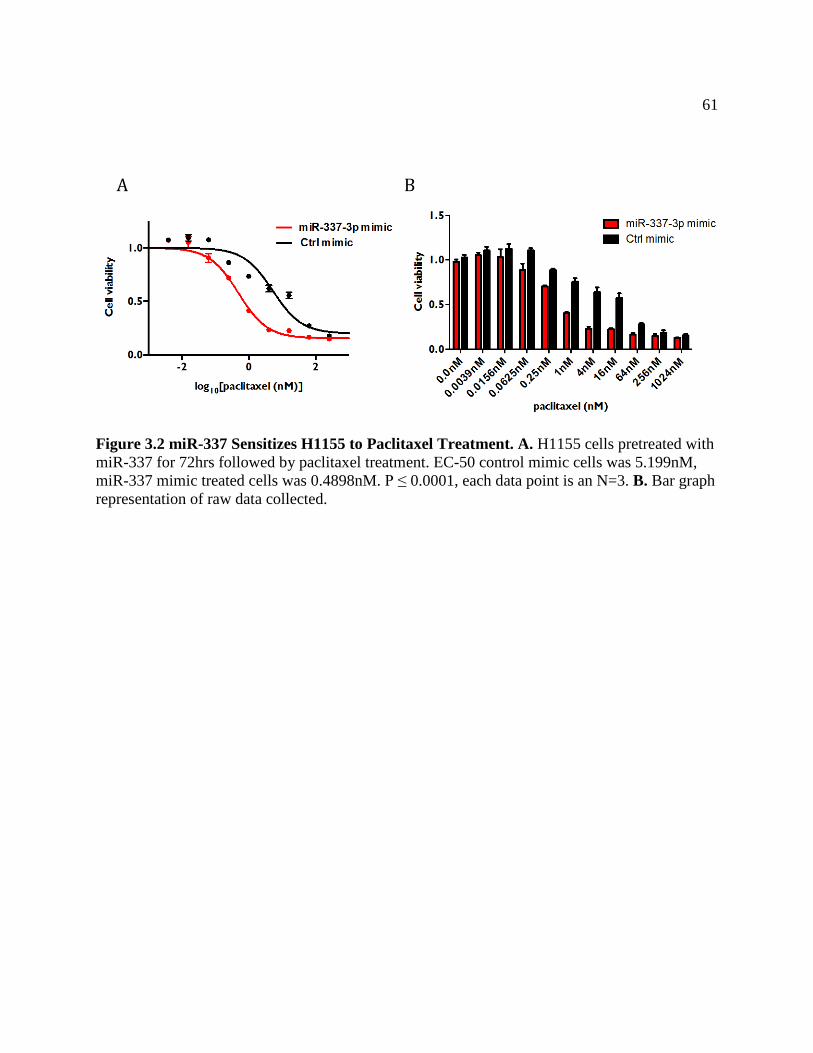
61
Figure 3.2 miR-337 Sensitizes H1155 to Paclitaxel Treatment. A. H1155 cells pretreated with miR-337 for 72hrs followed by paclitaxel treatment. EC-50 control mimic cells was 5.199nM, miR-337 mimic treated cells was 0.4898nM. P ≤ 0.0001, each data point is an N=3. B. Bar graph representation of raw data collected.
A B
62
3.2 Results
3.2.1 miR-337 Modulation of Drug Response is Specific to Microtubule Targeting Agents
Docetaxel is a semi-synthetic analogue of paclitaxel and differs at only two positions in
its chemical structure. These structural differences make it more water-soluble than paclitaxel.
Docetaxel is considered for treatment only after initial response to standard therapy fails and it
demonstrates modest improvements in overall survival. Following 72hrs of miR-337 mimic
treatment we exposed H1155 cells to various doses of docetaxel and observed an EC50 of
2.43nM when cells were pretreated with miR-337 and EC50 of 14.66nM when treated with the
scramble control (Figure 3.3 A&B).
Since paclitaxel and docetaxel are in the same family of microtubule stabilizers and
across the panel of cell lines there is a strong correlation of cellular response, we evaluated
several microtubule destabilizing compounds: vinorelbine, vincristine, and vinblastine. These
drugs make up the vinca alkaloids subset of microtubule-targeting agents and are derived from
the Madagascar periwinkle plant. They were discovered in the 1950s for the treatment of
diabetes and serendipitously found to have anti-tumor effects. Unlike paclitaxel, which binds to
and stabilizes microtubules, this class of drugs binds to the tubulin monomers preventing their
polymerization. These drugs bind directly to microtubules and cause their rapid
depolymerization (Tiburi and andrade 2002).

63
Figure 3.3 miR-337 Sensitizes H1155 to Docetaxel Treatment A. Following 72 hours of miR-337 mimic treatment we exposed H1155 cells to various concentrations of docetaxel and observed an EC50 of 2.434nM when cells were pretreated with miR-337 and EC50 of 14.66nM for the scramble control, each data point is N=4 P ≤ 0.0001. B. Bar graph representation of the raw data.
A B
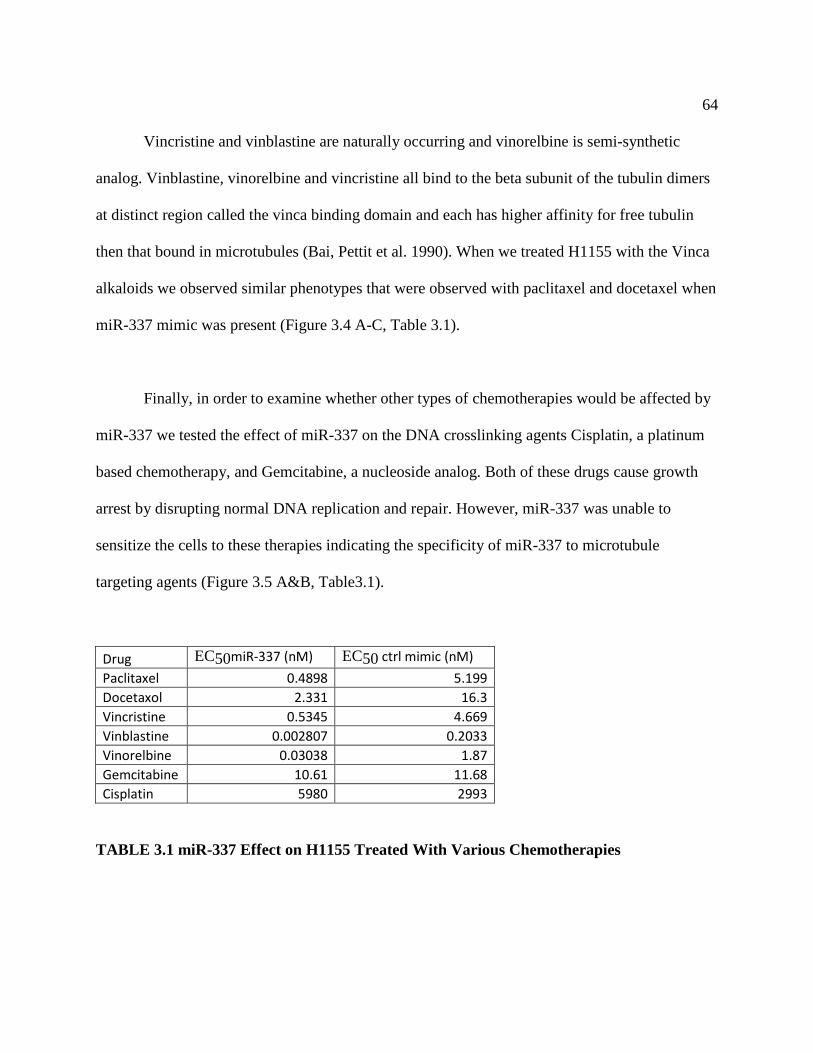
64
Vincristine and vinblastine are naturally occurring and vinorelbine is semi-synthetic
analog. Vinblastine, vinorelbine and vincristine all bind to the beta subunit of the tubulin dimers
at distinct region called the vinca binding domain and each has higher affinity for free tubulin
then that bound in microtubules (Bai, Pettit et al. 1990). When we treated H1155 with the Vinca
alkaloids we observed similar phenotypes that were observed with paclitaxel and docetaxel when
miR-337 mimic was present (Figure 3.4 A-C, Table 3.1).
Finally, in order to examine whether other types of chemotherapies would be affected by
miR-337 we tested the effect of miR-337 on the DNA crosslinking agents Cisplatin, a platinum
based chemotherapy, and Gemcitabine, a nucleoside analog. Both of these drugs cause growth
arrest by disrupting normal DNA replication and repair. However, miR-337 was unable to
sensitize the cells to these therapies indicating the specificity of miR-337 to microtubule
targeting agents (Figure 3.5 A&B, Table3.1).
Drug EC50miR-337 (nM) EC50 ctrl mimic (nM) Paclitaxel 0.4898 5.199 Docetaxol 2.331 16.3 Vincristine 0.5345 4.669 Vinblastine 0.002807 0.2033 Vinorelbine 0.03038 1.87 Gemcitabine 10.61 11.68 Cisplatin 5980 2993
TABLE 3.1 miR-337 Effect on H1155 Treated With Various Chemotherapies
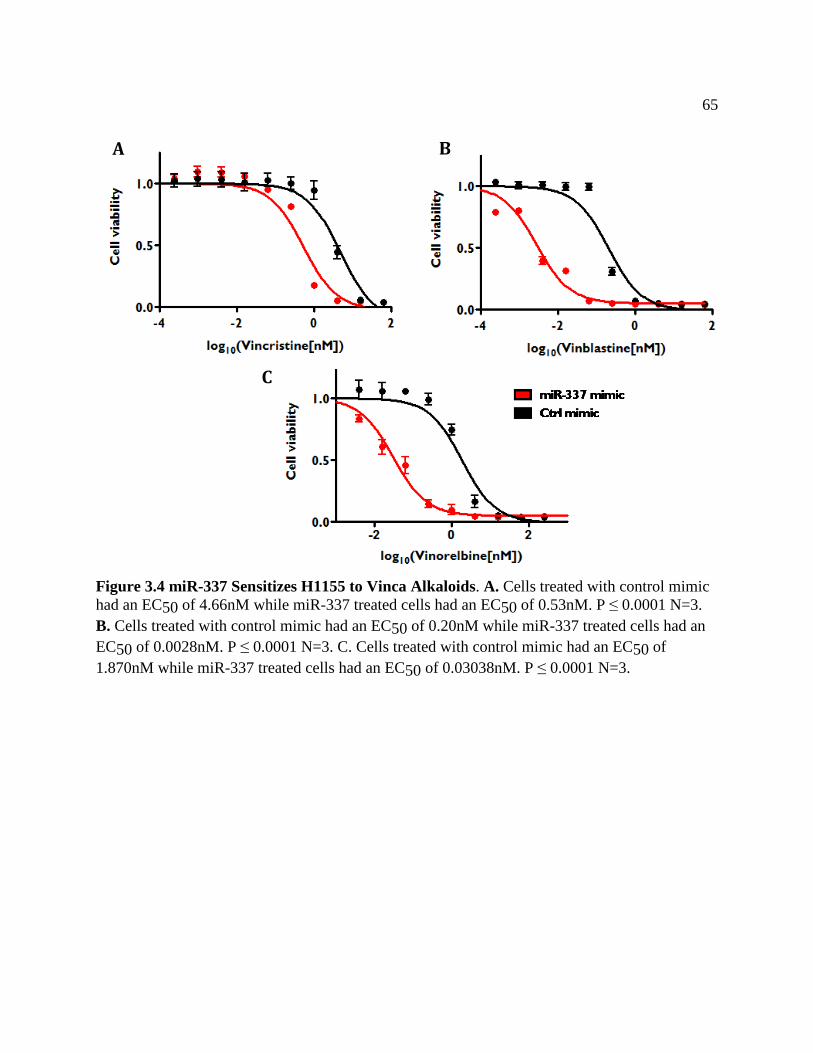
65
Figure 3.4 miR-337 Sensitizes H1155 to Vinca Alkaloids. A. Cells treated with control mimic had an EC50 of 4.66nM while miR-337 treated cells had an EC50 of 0.53nM. P ≤ 0.0001 N=3. B. Cells treated with control mimic had an EC50 of 0.20nM while miR-337 treated cells had an EC50 of 0.0028nM. P ≤ 0.0001 N=3. C. Cells treated with control mimic had an EC50 of 1.870nM while miR-337 treated cells had an EC50 of 0.03038nM. P ≤ 0.0001 N=3.
B
C
A

66
Figure 3.5 miR-337 does not Affect Cellular response to Gemcitabine or Cisplatin A. H1155 cell pretreated with miR-337 had no effect on Gemcitabine treatment: Ctrl mimic EC50 11.68nM, miR-337 mimic 10.61nM. B. Similar observations when H1155 cells were treated with cisplatin: Ctrl mimic EC50 2993nM, miR-337 mimic EC-50 5980nM. N=3 for each data point on both graphs.
B A
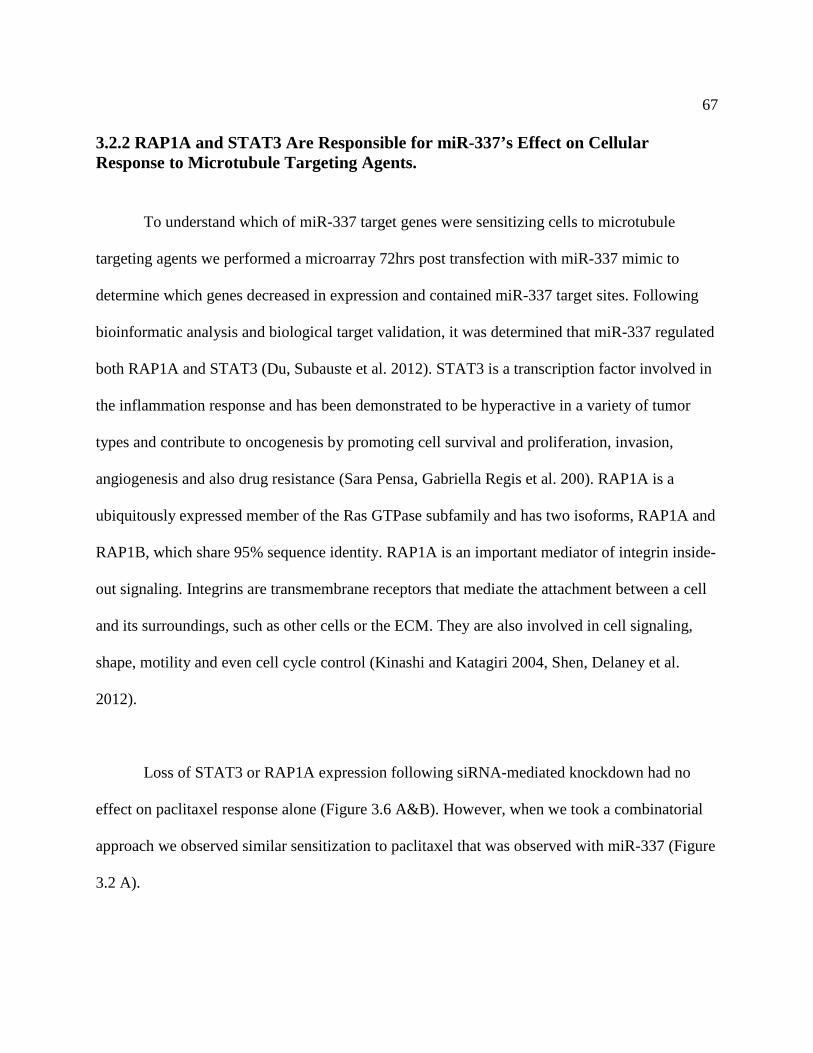
67
3.2.2 RAP1A and STAT3 Are Responsible for miR-337’s Effect on Cellular Response to Microtubule Targeting Agents.
To understand which of miR-337 target genes were sensitizing cells to microtubule
targeting agents we performed a microarray 72hrs post transfection with miR-337 mimic to
determine which genes decreased in expression and contained miR-337 target sites. Following
bioinformatic analysis and biological target validation, it was determined that miR-337 regulated
both RAP1A and STAT3 (Du, Subauste et al. 2012). STAT3 is a transcription factor involved in
the inflammation response and has been demonstrated to be hyperactive in a variety of tumor
types and contribute to oncogenesis by promoting cell survival and proliferation, invasion,
angiogenesis and also drug resistance (Sara Pensa, Gabriella Regis et al. 200). RAP1A is a
ubiquitously expressed member of the Ras GTPase subfamily and has two isoforms, RAP1A and
RAP1B, which share 95% sequence identity. RAP1A is an important mediator of integrin inside-
out signaling. Integrins are transmembrane receptors that mediate the attachment between a cell
and its surroundings, such as other cells or the ECM. They are also involved in cell signaling,
shape, motility and even cell cycle control (Kinashi and Katagiri 2004, Shen, Delaney et al.
2012).
Loss of STAT3 or RAP1A expression following siRNA-mediated knockdown had no
effect on paclitaxel response alone (Figure 3.6 A&B). However, when we took a combinatorial
approach we observed similar sensitization to paclitaxel that was observed with miR-337 (Figure
3.2 A).
68
Figure 3.6 Combination of RAP1A and STAT3 Affect H1155 response to Paclitaxel. A. H1155 cells treated with 25nM siSTAT3 for 72 hours prior to paclitaxel addition had no effect on EC50, each data point is N=4 B. H1155 cells treated with 25nM of siRAP1A for 72 hours before paclitaxel was added had no effect on EC50, each data point is N=4. C. H1155 cells treated with 12.5nM of each siSTAT3 and siRAP1A and 25nM of ctrl SI. EC50 ctrl SI = 11.89nM while the combination of siRAP1A/siSTAT3 = 3.94nM, p-value =0.0026. Each data point is N=4.
B
C
A

69
3.4 Discussion
In summary, we identified miR-337 as a modulator of microtubule targeting agent
responses in NSCLC cell lines and uncovered a novel regulator network that involves STAT3
and RAP1A. We first discovered that miR-337 expression was anti-correlated with paclitaxel
response in our panel of NSCLC cell lines. Following overexpression we observed a four-fold
sensitization to paclitaxel. Expanding on this finding we evaluated other microtubule targeting
agents (Table 3.1). We first explored miR-337’s effect on docetaxel, as we predicted miR-337
modulated cellular response to treatment. We observed an almost ten-fold sensitization, which
could be due to docetaxel’s ability to enter the cell at higher concentrations than paclitaxel. We
then tested whether miR-337 would sensitize cells to other chemotherapies. miR-337 was able to
sensitize cells to vinorelbine, vincristine, and vinblastine. In the case of vinorelbine and
vinblastine the sensitization was over 100-fold. It is interesting that miR-337 had a larger effect
on vinblastine and vinorelbine treated cells, which act in a similar manor than that of vincristine.
This could be due to the fact that only vinblastine and vinorelbine bind to the plus end of
microtubules (the growing end) and reduces microtubule treadmilling (the process of
microtubule growth) (bai, Pettit et al. 1990). However, miR-337 had no effect on the cellular
response to cisplatin or gemcitabine, suggesting that the specificity of the effect we observed was
based on the ability of miR-337 to regulate microtubules.
Following unbiased genome-wide microarray analyses we uncovered and validated
RAP1A and STAT3 as miR-337 targets, and following a combinatorial approach, we were able

70
to phenocopy miR-337 overexpression. Activation of STAT3 has been shown to up-regulate
Survivin via direct binding to the promoter in breast cancer, which conferred resistance to
paclitaxel treatment (Gritsko, Williams et al. 2006). Survivin is a fetal gene typically turned off
in adult tissue. It is a member of the IAP family of anti-apoptotic proteins and is overexpressed
in breast and gastric cancers and lymphomas (Gritsko, Williams et al. 2006). Additionally, it is
possible that STAT3 is conferring resistance through other mechanism such as directly
interacting with the microtubules antagonizing the effects of the microtubule targeting agents.
This has been shown in murine embryonic fibroblast (MEF) cells where pSTAT3 interacts with
the microtubules through its interaction with Stathmin, a small ubiquitous phosphoprotein that
binds to microtubules and facilitates their depolymerization(Ng, Lin et al. 2006) .
RAP1A is an important mediator of integrin inside-out signaling. Integrins are
transmembrane receptors that mediate the attachment of a cell and to its surroundings. There is
strong evidence suggesting that the ECM influences intercellular microtubule dynamics and thus
paclitaxel sensitivity. It was recently shown that transforming growth factor beta (TFGB1)
modulated a component of the ECM to influence microtubule polymerization and stabilization
and affect cellular response to paclitaxel (Ahmed, Mills et al. 2007). TFGB1 has been shown to
mediate adhesion in an integrin-dependent manner (Jeong and Kim 2004). Taken together
RAP1A could potentially be inhibiting integrin signaling and destabilizing microtubules
reducing the effectiveness of paclitaxel.

71
We are the first to report on miR-337’s ability to modulate cellular response specifically
to microtubule targeting agents and elicit a response in NSCLC. Additionally, we are the first to
report the regulation of STAT3 and RAP1A by miR-337 and their ability to mediate cellular
response to paclitaxel (all drug sensitivity assays EC-50 can be found in table 3.1)
3.5 Future Directions
Given the observed sensitization of miR-337-3 to vinorelbine and vinblastine, we should
further explore RAP1A and STAT3 interaction with the plus end the microtubules, to determine
if there is preferential interaction with this end. Additionally, we should explore if loss of
RAP1A and STAT3 will affect cellular response to the other drugs that were tested, to determine
if this response will be specific to microtubule targeting agents and not DNA cross linkers. It
should be noted that miR-337, siSTAT3 or siRAP1A did not have any effect on cell viability
(Figure 3.2B & data not shown). This finding is particular interesting with regard to STAT3,
given its importance in tumor maintenance and progression. Currently vast resources are being
invested in the development of novel small molecules inhibitor of STAT3 that could be
employed in a combinatorial treatment with paclitaxel against NSCLC.
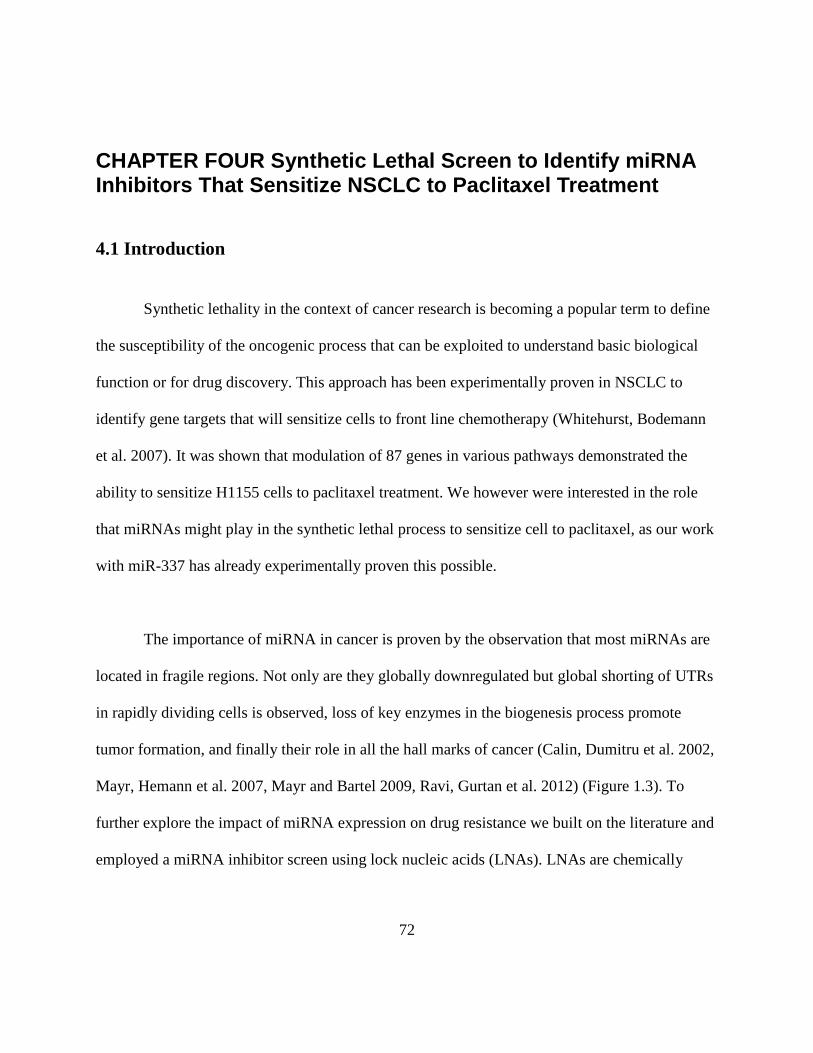
72
CHAPTER FOUR Synthetic Lethal Screen to Identify miRNA Inhibitors That Sensitize NSCLC to Paclitaxel Treatment
4.1 Introduction
Synthetic lethality in the context of cancer research is becoming a popular term to define
the susceptibility of the oncogenic process that can be exploited to understand basic biological
function or for drug discovery. This approach has been experimentally proven in NSCLC to
identify gene targets that will sensitize cells to front line chemotherapy (Whitehurst, Bodemann
et al. 2007). It was shown that modulation of 87 genes in various pathways demonstrated the
ability to sensitize H1155 cells to paclitaxel treatment. We however were interested in the role
that miRNAs might play in the synthetic lethal process to sensitize cell to paclitaxel, as our work
with miR-337 has already experimentally proven this possible.
The importance of miRNA in cancer is proven by the observation that most miRNAs are
located in fragile regions. Not only are they globally downregulated but global shorting of UTRs
in rapidly dividing cells is observed, loss of key enzymes in the biogenesis process promote
tumor formation, and finally their role in all the hall marks of cancer (Calin, Dumitru et al. 2002,
Mayr, Hemann et al. 2007, Mayr and Bartel 2009, Ravi, Gurtan et al. 2012) (Figure 1.3). To
further explore the impact of miRNA expression on drug resistance we built on the literature and
employed a miRNA inhibitor screen using lock nucleic acids (LNAs). LNAs are chemically
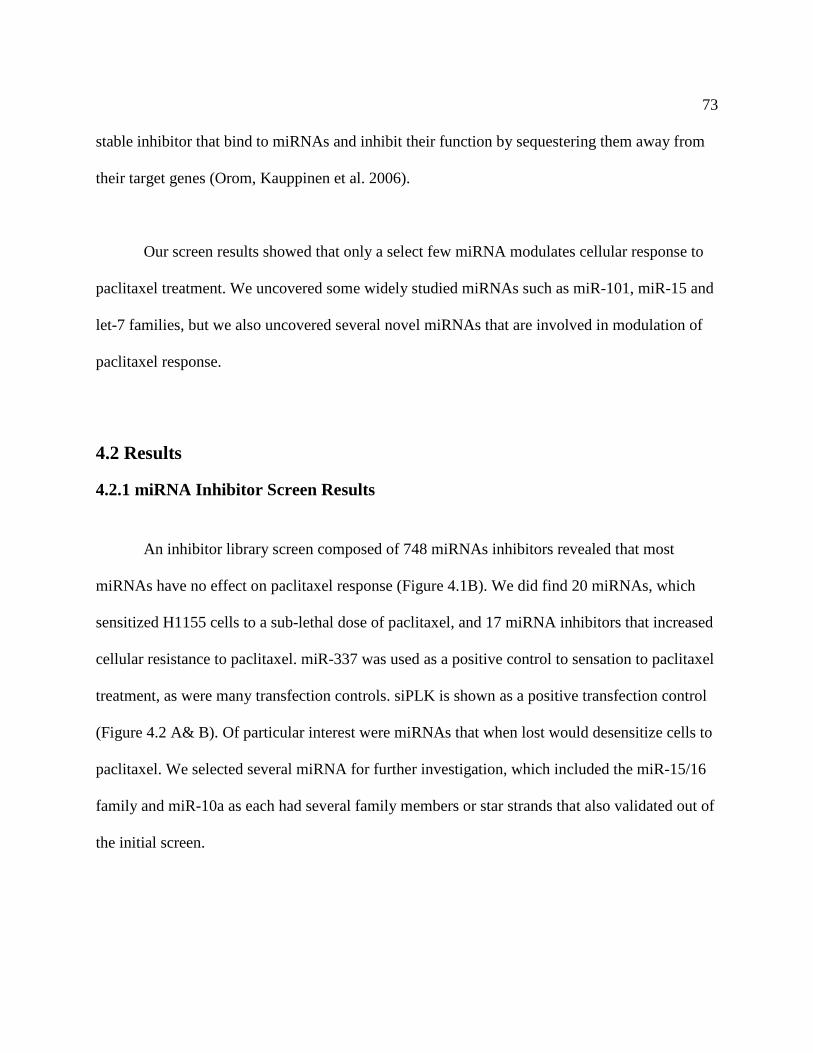
73
stable inhibitor that bind to miRNAs and inhibit their function by sequestering them away from
their target genes (Orom, Kauppinen et al. 2006).
Our screen results showed that only a select few miRNA modulates cellular response to
paclitaxel treatment. We uncovered some widely studied miRNAs such as miR-101, miR-15 and
let-7 families, but we also uncovered several novel miRNAs that are involved in modulation of
paclitaxel response.
4.2 Results
4.2.1 miRNA Inhibitor Screen Results
An inhibitor library screen composed of 748 miRNAs inhibitors revealed that most
miRNAs have no effect on paclitaxel response (Figure 4.1B). We did find 20 miRNAs, which
sensitized H1155 cells to a sub-lethal dose of paclitaxel, and 17 miRNA inhibitors that increased
cellular resistance to paclitaxel. miR-337 was used as a positive control to sensation to paclitaxel
treatment, as were many transfection controls. siPLK is shown as a positive transfection control
(Figure 4.2 A& B). Of particular interest were miRNAs that when lost would desensitize cells to
paclitaxel. We selected several miRNA for further investigation, which included the miR-15/16
family and miR-10a as each had several family members or star strands that also validated out of
the initial screen.
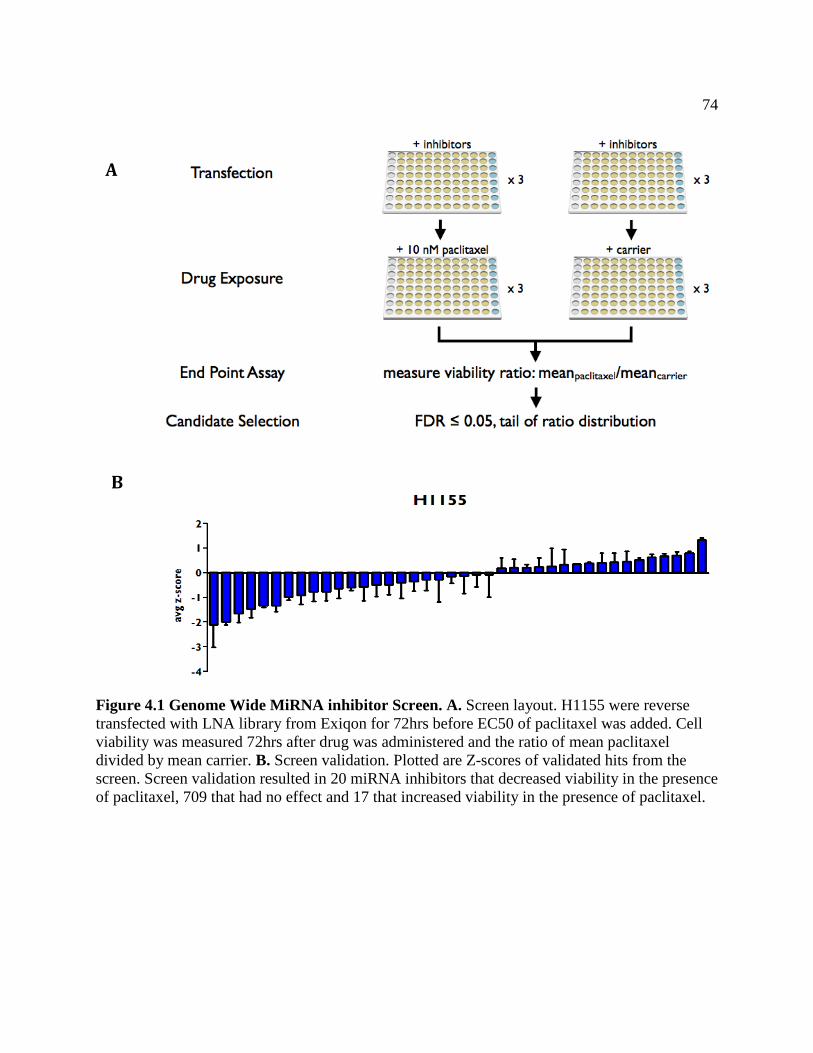
74
Figure 4.1 Genome Wide MiRNA inhibitor Screen. A. Screen layout. H1155 were reverse transfected with LNA library from Exiqon for 72hrs before EC50 of paclitaxel was added. Cell viability was measured 72hrs after drug was administered and the ratio of mean paclitaxel divided by mean carrier. B. Screen validation. Plotted are Z-scores of validated hits from the screen. Screen validation resulted in 20 miRNA inhibitors that decreased viability in the presence of paclitaxel, 709 that had no effect and 17 that increased viability in the presence of paclitaxel.
20 miRNA inhibitors that decrease cell
viability
17 miRNA inhibitors that increase cell
viability
miR-10a
A
B
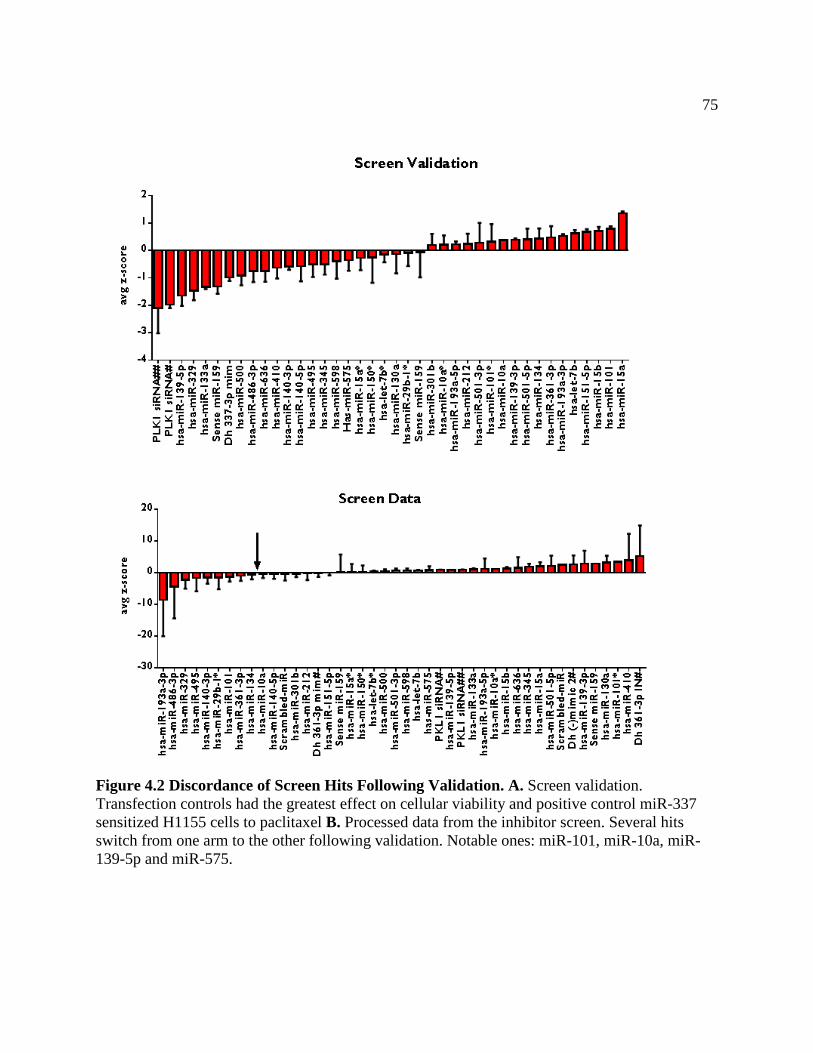
75
Figure 4.2 Discordance of Screen Hits Following Validation. A. Screen validation. Transfection controls had the greatest effect on cellular viability and positive control miR-337 sensitized H1155 cells to paclitaxel B. Processed data from the inhibitor screen. Several hits switch from one arm to the other following validation. Notable ones: miR-101, miR-10a, miR-139-5p and miR-575.

76
4.2.2 miR-15/16 Family
The miR-15/16 family was first identified in chronic lymphocytic leukemia (CLL) and
due to their location on chromosome 13q14, a region that is deleted in ~70% of CLL cases, their
expression is frequently down-regulated (Calin, Dumitru et al. 2002). Deletion of this region has
also been reported in multiple myeloma, mantle cell lymphoma and prostate carcinoma. The
miR-15/16 family has been shown to function as important tumor suppressors in both ovarian
and non-small cell lung cancer (Bandi, Zbinden et al. 2009, Bhattacharya, Nicoloso et al. 2009)
(Dong and Frierson 2001). Taken together this data suggest that this miRNA cluster is important
as a broad tumor suppressor. Using bioinformatics tools it was discovered that the miR-15/16
family regulates BCL2, which is overexpressed in 65-70% of CLL and blocks programmed cell
death (Cimmino, Calin et al. 2005) (Hockenbery, Nuñez et al. 1990). Given the amount of
literature on miR-15/16 we pursued it as are candidate miRNA.
4.2.3 miR-15 Results
Expanding on our screen data over a range of paclitaxel concentrations we observed a
four-fold increase in the EC50 of paclitaxel response when H1155 were pretreated with miR-15a
inhibitor, in line with our inhibitor screen results (Figure 4.3A). When then asked if we were to
overexpress miR-15a could be then shift the curve in the other direction, making the cell more
sensitive to paclitaxel treatment. When H1155 cells were treated with miR-15a mimic we were
able to shift the curve in the opposite direction and observed a four-fold sensitization to
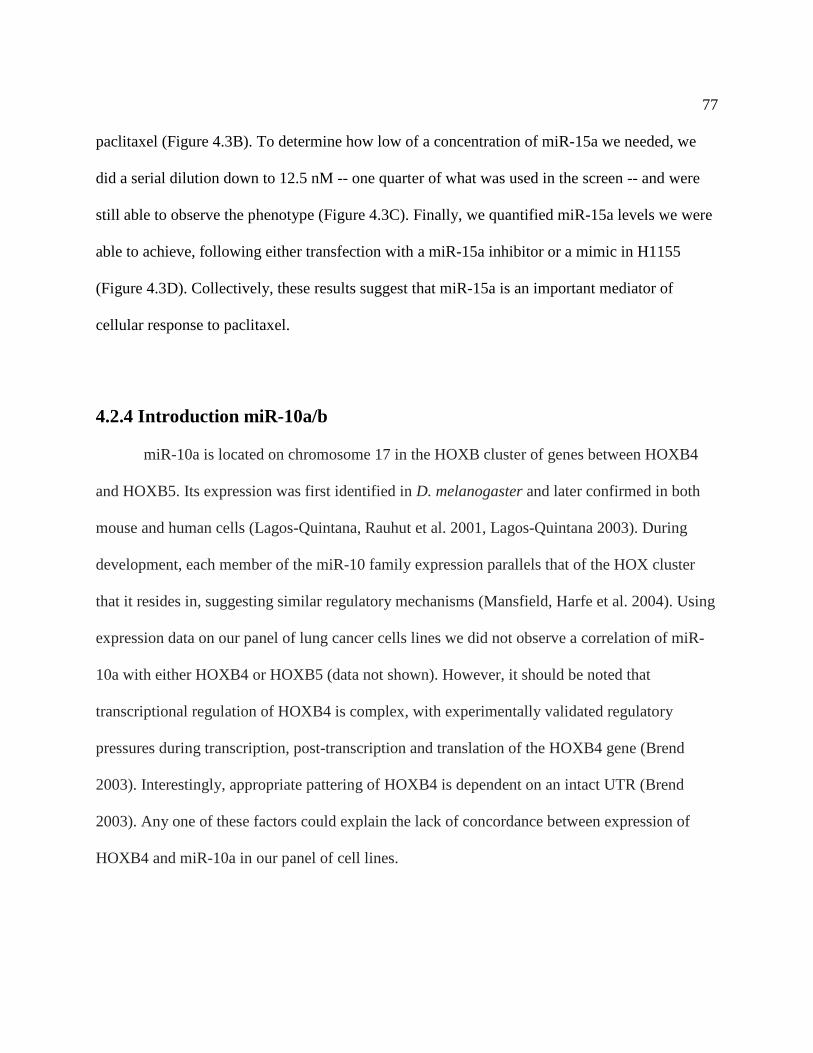
77
paclitaxel (Figure 4.3B). To determine how low of a concentration of miR-15a we needed, we
did a serial dilution down to 12.5 nM -- one quarter of what was used in the screen -- and were
still able to observe the phenotype (Figure 4.3C). Finally, we quantified miR-15a levels we were
able to achieve, following either transfection with a miR-15a inhibitor or a mimic in H1155
(Figure 4.3D). Collectively, these results suggest that miR-15a is an important mediator of
cellular response to paclitaxel.
4.2.4 Introduction miR-10a/b
miR-10a is located on chromosome 17 in the HOXB cluster of genes between HOXB4
and HOXB5. Its expression was first identified in D. melanogaster and later confirmed in both
mouse and human cells (Lagos-Quintana, Rauhut et al. 2001, Lagos-Quintana 2003). During
development, each member of the miR-10 family expression parallels that of the HOX cluster
that it resides in, suggesting similar regulatory mechanisms (Mansfield, Harfe et al. 2004). Using
expression data on our panel of lung cancer cells lines we did not observe a correlation of miR-
10a with either HOXB4 or HOXB5 (data not shown). However, it should be noted that
transcriptional regulation of HOXB4 is complex, with experimentally validated regulatory
pressures during transcription, post-transcription and translation of the HOXB4 gene (Brend
2003). Interestingly, appropriate pattering of HOXB4 is dependent on an intact UTR (Brend
2003). Any one of these factors could explain the lack of concordance between expression of
HOXB4 and miR-10a in our panel of cell lines.

78
FIGURE 4.3 miR-15a Regulates Paclitaxel Response. A. H1155 treated with miR-15a inhibitor desensitized cells to paclitaxel. Treatment with miR-15a inhibitor increased EC50 from 0.79nM for the control inhibitor to 3.09nM for miR-15a inhibitor. P ≤ 0.0001 each data point is N=4. B. miR-15a mimic was able to sensitize H1155 to paclitaxel treatment. H1155 treated with ctrl mimic had an EC50 of 8.50nM while miR-15a mimic EC50 was 2.19nM p ≤ 0.0001 each data point is N=4. C. Titration of miR-15a mimic shows that 12.5nM is sufficient to sensitize H1155 to paclitaxel. **** P ≤ 0.0001. D. Range of miR-15a we were able to achieve following transfections. Data was first normalized to appropriate control.
B A
C D

79
miR-10a role in the context of cancer is ill-defined. It was discovered that miR-10a
expression is increased during the early stages of urothelial carcinomas when the carcinoma is
confined to the inner lining of the bladder wall. During later stages of cancer progression no
difference in miR-10a levels were observed (Veerla, Lindgren et al. 2009). In chronic myeloid
leukemia (CML), however, it was observed that miR-10a is down-regulated in 70% of patient
samples. In CML miR-10a was found to directly regulate upstream stimulatory factor 2 (USF2).
In 60% patient samples, which had up regulation of USF2, loss of miR-10a expression was
observed (Agirre, Jimenez-Velasco et al. 2008). This finding supports data from The Cancer
Genome Atlas, TCGA, which shows miR-10a is down-regulated in tumors of the breast and head
and neck (Figure 4.4A&B). Finally, we mined TCGA data and found a slight increase in miR-
10a expression in lung tumor samples relative to normal adjacent tissues (NAT) (Figure 4.4C).
Some of the first work on miR-10a explored its contributions to ATRA-induced smooth
muscle cell differentiation (Huang, Xie et al. 2010). It was discovered that treating human ES
cells with ATRA for just 24 hours increased miR-10a levels 24-fold and pretreatment of ES cells
with a miR-10a inhibitor impaired differentiation. The observed effect of miR-10a was a result
of its regulation of histone deacetylase 4 (HDAC4), a known inhibitor of differentiation
(Göttlicher, Minucci et al. 2001). However, there was no observed change in miR-10b, indicating
that the effects observed were specific to miR-10a and they each have different means of
induction in muscle tissues.
80
Figure 4.4 miR-10a Expression in Tumor and Normal Adjacent Tissue. A. 45 paired samples from TCGA. NAT had a mean expression of 23135 while tumor samples had a mean expression of 6185. Plotted data are sequence reads mapped to miR-10a loci. Data was processed and normalized by TCGA. **** P ≤ 0.0001. B. Head and Neck Squamous Cell Carcinoma sample data provided to us by Dr. Michael Story. 11 paired samples, mean expression of miR-10a in Tumor 1577 and 5572 in NAT. Data plotted are sequence reads mapped to miR-10a loci. ** P = 0.0014.C. 35 paired samples from TCGA mean expression from tumor samples is 17284 and in NAT 13460. Data plotted are sequence reads mapped to miR-10a loci.
Breast HNSCC Lung A B C
81
The up regulation of miR-10a upon ATRA treatment was of particular interest to the
neuroblastoma field, as ATRA treatment causes neural cell differentiation and is used to study
the biochemical process of differentiation. It was found that after ATRA treatment, both miR-
10a and -10b levels increased and ectopic expression of each increased neurite outgrowth, a
proxy for differentiation (Foley, Bray et al. 2011). Bioinformatics analysis of down regulated
genes containing miR-10 target sites and known to be important in neurite outgrowth uncovered
nuclear co-repressor 2 (NcoR2) as a direct target of miR-10 regulation. NcoR2 functions as a
transcriptional repressor through the recruitment of histone deacetylases (1-4) to target genes and
inhibiting their transcription. It was also shown that loss of miR-10a is associated with poor
clinical outcome in patients with chromosome 11q deletions or MYCN amplification (Foley,
Bray et al. 2011). However, miR-10b expression levels in tumors and patient survival were not
significant. Finally it was observed that while miR-10a is located on chromosome 17q that is
amplified in 90% of neuroblastomas, and the expression of other genes in the amplicon are
concordantly increased, miR-10a expression is decreased by an unknown mechanism.
miR-10a differs from miR-10b at a single nucleotide outside the seed sequence and are
thus expected to have the same target genes. They do however differ dramatically in expression,
which could be a result of their location relative to neighboring HOX genes (Landgraf, Rusu et
al. 2007). miR-10a is not located within any HOXB gene and thus has its own promoter while
miR-10b is located within the last intron of HOXD4 suggesting that its expression is more likely
tied to that of HOXD4.

82
The seminal paper on the miR-10 family was from the Weinberg lab, which reported that
miR-10b is over-expressed in breast cancer cell lines that are capable of metastasizing (Ma,
Teruya-Feldstein et al. 2007). Ectopic expression of miR-10b promoted invasion and metastasis
in breast cancer cell lines both in vitro and in vivo through regulation of HOXD10. Ma, et al.
also discovered that miR-10b expression is induced by TWIST, a potent EMT inducer, while
patients whose tumors had high miR-10b levels had reduced overall survival (Ma, Teruya-
Feldstein et al. 2007). They then went on to show that systemic delivery of a miR-10b antagomir,
a chemically modified miRNA inhibitor, suppressed breast cancer invasion in vivo but had no
effect on tumor growth (Ma, Reinhardt et al. 2010). However, this work is not conclusive, as no
correlation of miR-10b levels and patient survival or metastatic potential was observed in larger
cohort of patients (Gee, Camps et al. 2008).
Other groups working on parsing miRNA targets of individual family members explored
the miR-34 family, which is composed of miR-34a on chromosome 1 and miR-34b/c on
chromosome 11. It was observed that most of the miRNA targets are conserved among the
family (He, He et al. 2007) with a notable exception: miR-34b/c have a higher affinity to MYC
than miR-34a, which can only be explained by binding events outside of the seed match
(Hermeking 2010). Finally, when we compare the literature of miR-10a to other miRNAs such as
the miR-200 family, let-7, and miR-15/16 family, relatively little is known about miR-10a and its
role in cancer and drug response in NSCLC, providing additional rationale for its study.
83
4.2.5 miR-10a Results
4.2.5.1 miR-10a Regulates Cellular Response to Paclitaxel
To further validate the screen results we used a paclitaxel dose-response curve with the
highest concentration of 1024nM followed by four-fold dilution to the lowest concentration of
0.003nM. Following pretreatment with miR-10a inhibitor we observed a shift in the EC50 from
0.22nM for the negative control inhibitor to an EC50 of 2.63 when miR-10a inhibitor was
transfected into H1155 cells (Figure 4.5A&B). To determine if miR-10a could shift the EC50 in
the other direction and sensitize H1155 paclitaxel we transiently transfected H1155 cells with
miR-10a mimic and the EC50 decreased to 1.73nM with miR-10a mimic from an EC50 of
11.69nM for the negative control (Figure 4.5C&D). As we observed with miR-337 mimic, which
was able to sensitize cells to both paclitaxel and docetaxel, miR-10a had the same effect. The
negative control mimic had an EC50 of 0.74nM while miR-10a was able to lower it to 0.028nM
(Figure 4.6A&B).
We then tested other cell lines to ensure this effect was not limited to H1155. In order not
to arbitrarily select a cell line we explored miR-10a expression across our panel of cell lines
where we observed a 60-fold range in expression across the cell line panel (Figure 4.7). We
selected H460, as expression of miR-10a fell in the middle of the distribution. After pretreatment
with either control inhibitor or mimic the EC50 were 1.91nM and 1.63nM respectively (Figure
4.8A). However, modulation of miR-10a was able to shift the curve in either direction, when we
removed miR-10a form the system the EC50 increased to 6.15nM and when we added miR-10a to

84
H460 the EC50 dropped to 0.25nM (Figure 4.8A). We then measured the effectiveness of the
inhibitor on miR-10a, which was able to completely remove miR-10a from each cell line (Figure
4.9A). While miR-10a mimic was able to increase miR-10a expression over 1000 fold in each
cell line (Figure 4.9B).
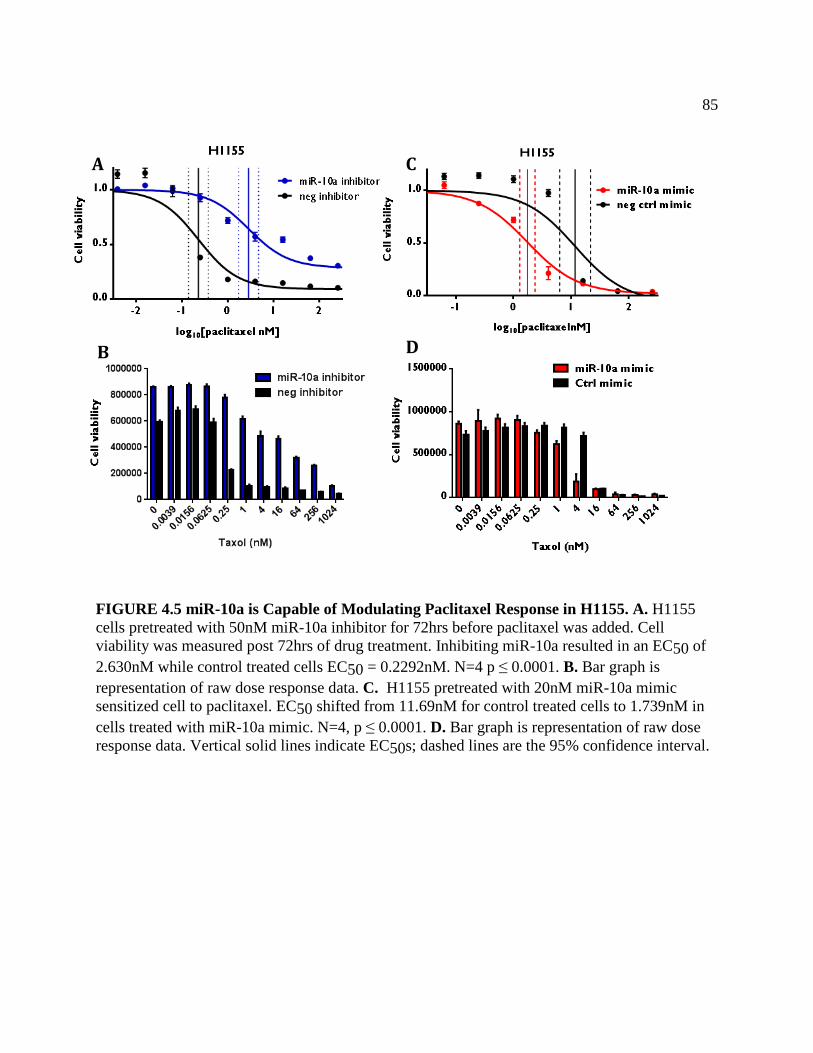
85
FIGURE 4.5 miR-10a is Capable of Modulating Paclitaxel Response in H1155. A. H1155 cells pretreated with 50nM miR-10a inhibitor for 72hrs before paclitaxel was added. Cell viability was measured post 72hrs of drug treatment. Inhibiting miR-10a resulted in an EC50 of 2.630nM while control treated cells EC50 = 0.2292nM. N=4 p ≤ 0.0001. B. Bar graph is representation of raw dose response data. C. H1155 pretreated with 20nM miR-10a mimic sensitized cell to paclitaxel. EC50 shifted from 11.69nM for control treated cells to 1.739nM in cells treated with miR-10a mimic. N=4, p ≤ 0.0001. D. Bar graph is representation of raw dose response data. Vertical solid lines indicate EC50s; dashed lines are the 95% confidence interval.
A
B D
C
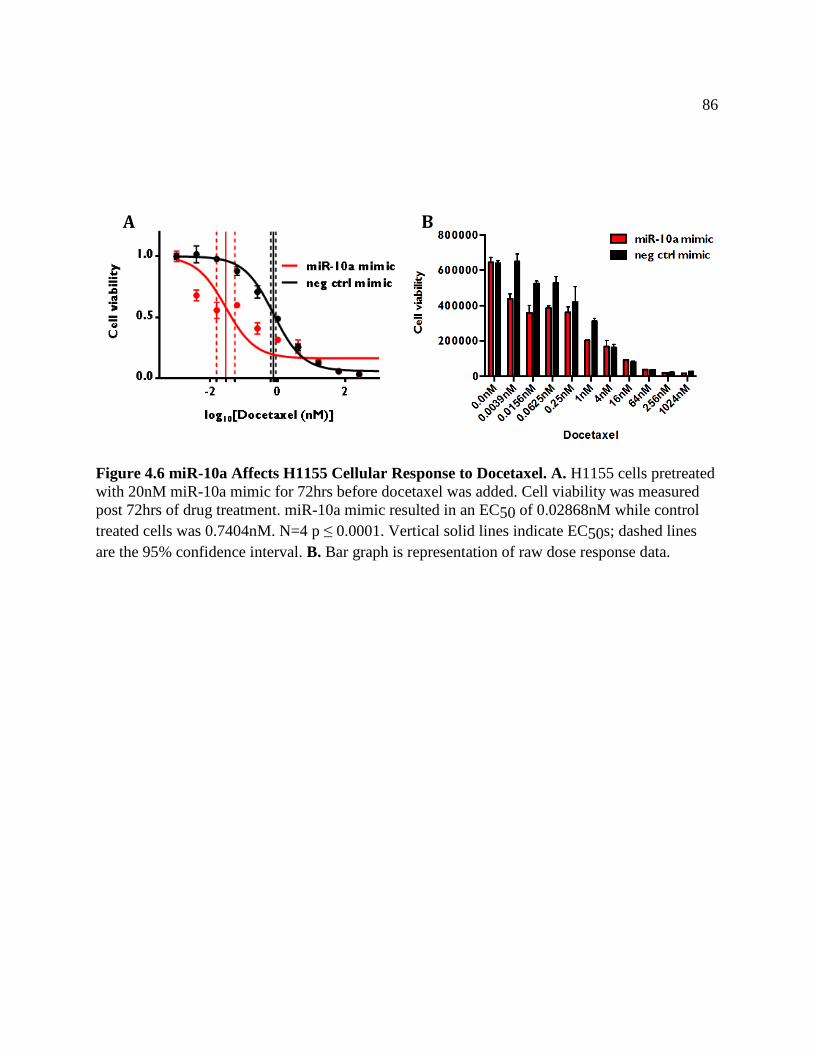
86
Figure 4.6 miR-10a Affects H1155 Cellular Response to Docetaxel. A. H1155 cells pretreated with 20nM miR-10a mimic for 72hrs before docetaxel was added. Cell viability was measured post 72hrs of drug treatment. miR-10a mimic resulted in an EC50 of 0.02868nM while control treated cells was 0.7404nM. N=4 p ≤ 0.0001. Vertical solid lines indicate EC50s; dashed lines are the 95% confidence interval. B. Bar graph is representation of raw dose response data.
A B

87
FIGURE 4.7 miR-10a Expression Across NSCLC Panel of Cell Lines. miRNA expression arrays profiling miR-10a levels across our NSCLC panel normalized to HBEC3KT as “1”.
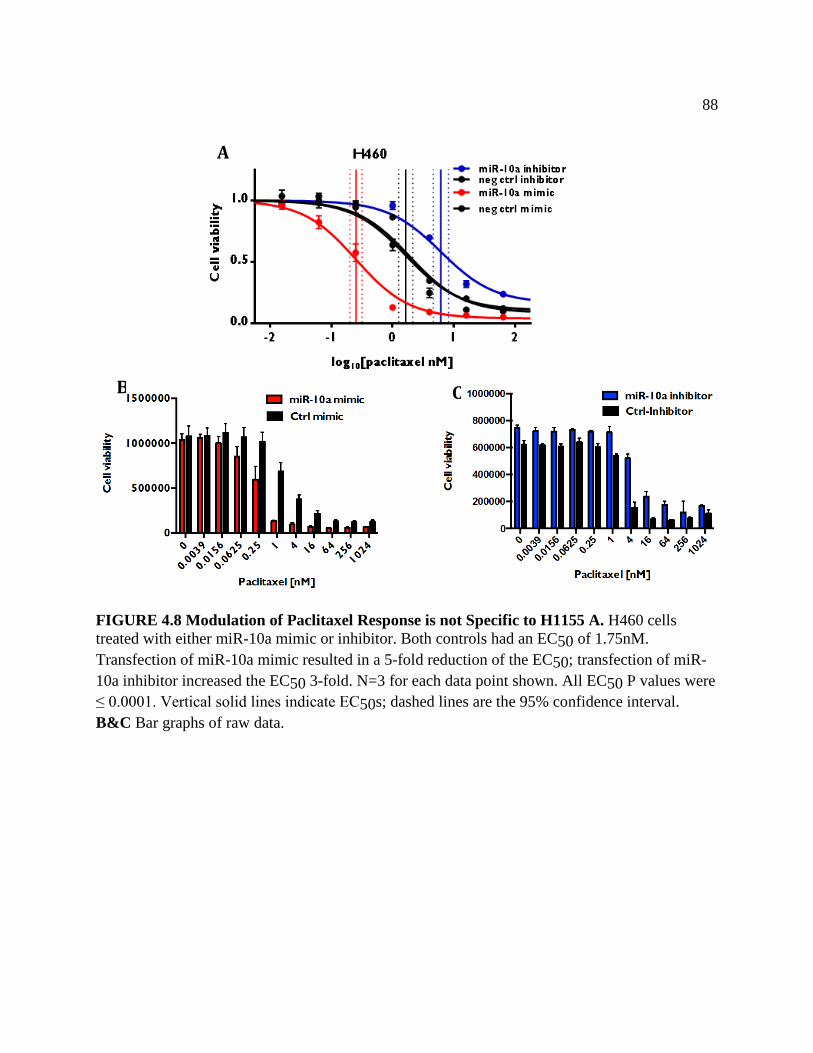
88
FIGURE 4.8 Modulation of Paclitaxel Response is not Specific to H1155 A. H460 cells treated with either miR-10a mimic or inhibitor. Both controls had an EC50 of 1.75nM. Transfection of miR-10a mimic resulted in a 5-fold reduction of the EC50; transfection of miR-10a inhibitor increased the EC50 3-fold. N=3 for each data point shown. All EC50 P values were ≤ 0.0001. Vertical solid lines indicate EC50s; dashed lines are the 95% confidence interval. B&C Bar graphs of raw data.
A
B C

89
FIGURE 4.9 Dynamic Range Achieved in Manipulation of miR-10a Levels. A. miR-10a levels quantified by qPCR following inhibition-using Exiqon LNA, in each cell line miR-10a expression inhibition is > 90%. B. miR-10a levels following transfection with miR-10a mimic, H1155 resulted in a 1000 fold increase and in H460 3200 fold increase. qPCR reads were first internally normalized to RNU-19 and then the control sample before fold change was calculated. Each is an N=3.
A B
90
4.2.5.2 Parsing miR-10a from miR-10b
As mentioned above, miR-10a is part of the miR-10 family, which includes miR-10b. As
stated earlier, the difference is a single base change outside of the seed sequence (Figure 4.10C).
miR-10b was not a hit on the original screen, and this was not due to its lack of expression in
H1155, as this cell line exhibited the highest level of miR-10b among the panel of cell lines
(Figure 4.10A). To ensure that miR-10b was not missed as a hit due to poor inhibitor quality we
transfected H1155 with miR-10b inhibitors (Figure 4.11A). The miR-10b inhibitor was effective
and removed miR-10b, but cross reaction was observed as inhibitors for both miR-10b and miR-
10a were affecting the other family member’s levels, thereby confounding the previous
experimental results. To address this issued we used the Dharmacon inhibitor, which uses a
hairpin design. While it was more specific then the Exiqon design it was not as effective, only
reducing miR-10a level by 85% (Figure 4.11B).To determine the specificity of the Taqman
qPCR probes we transfected H1975, which has undetectable endogenous miR-10a/b levels, with
both miR-10a and 10b mimic. Following transfection we observed cross detection of the qPCR
probes (Figure 4.11C).
Now that we have established that the miR-10b inhibitor is functional we then wanted to
test if it would modulate cellular response to paclitaxel in H1155. We did not observe any effect
on cellular response to paclitaxel treatment in H1155 with miR-10b inhibitor (Figure 4.12A).
Since we observed inhibitor cross reaction using the Exiqon design, to completely rule out miR-
10b as a cause of the sensitization, we used the Dharmacon design. Inhibiting miR-10a with the

91
Dharmacon inhibitor desensitized H1155 cells to paclitaxel by two fold, shifting the EC50 from
0.46nM to 0.90nM (Figure 4.12B). Taken together this data suggest that miR-10a and not miR-
10b is responsible for the modulation of cellular response paclitaxel.

92
Figure 4.10 miR-10b Expression is Not Correlated with miR-10a Across NSCLC. A. miR-10b expression measured by miRNA array. B. Sequence comparison of miR-10a and 10b, U in red denotes only base difference in mature miRNA, underlined is the seed sequence. C. Correlation of miR-10a and 10b in NSCLC. Expression levels were quantified by miRNA array.
A
C B
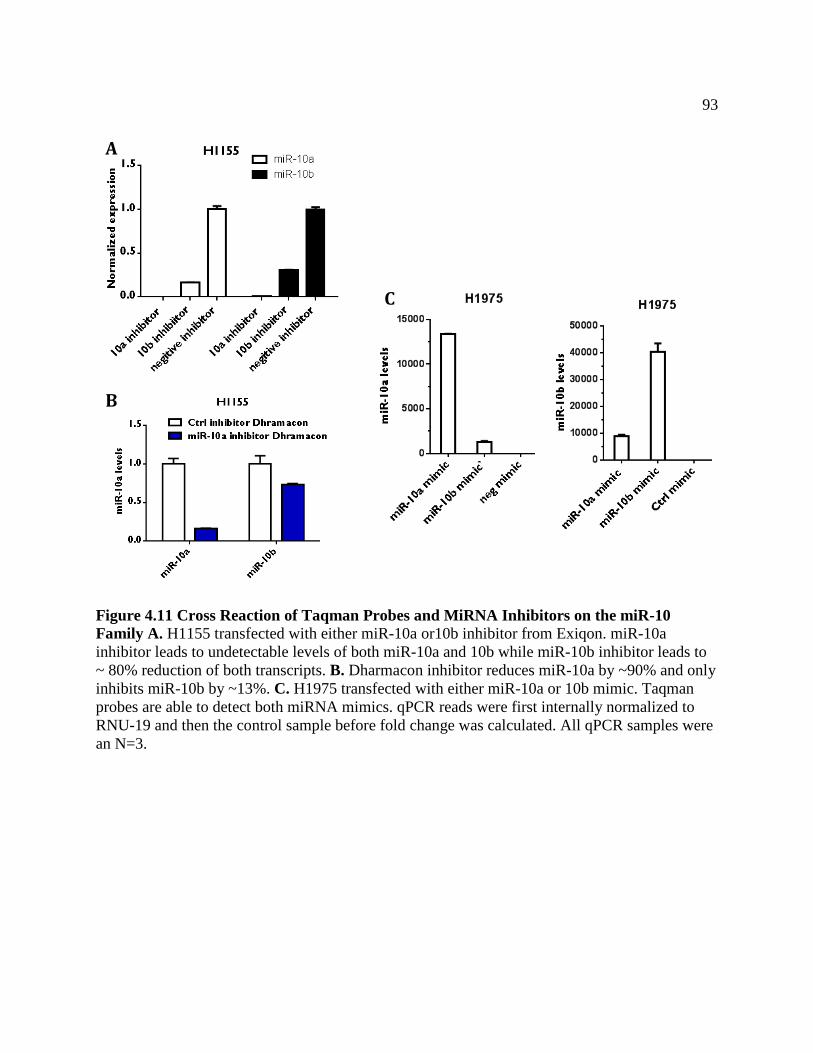
93
Figure 4.11 Cross Reaction of Taqman Probes and MiRNA Inhibitors on the miR-10 Family A. H1155 transfected with either miR-10a or10b inhibitor from Exiqon. miR-10a inhibitor leads to undetectable levels of both miR-10a and 10b while miR-10b inhibitor leads to ~ 80% reduction of both transcripts. B. Dharmacon inhibitor reduces miR-10a by ~90% and only inhibits miR-10b by ~13%. C. H1975 transfected with either miR-10a or 10b mimic. Taqman probes are able to detect both miRNA mimics. qPCR reads were first internally normalized to RNU-19 and then the control sample before fold change was calculated. All qPCR samples were an N=3.
A
B
C
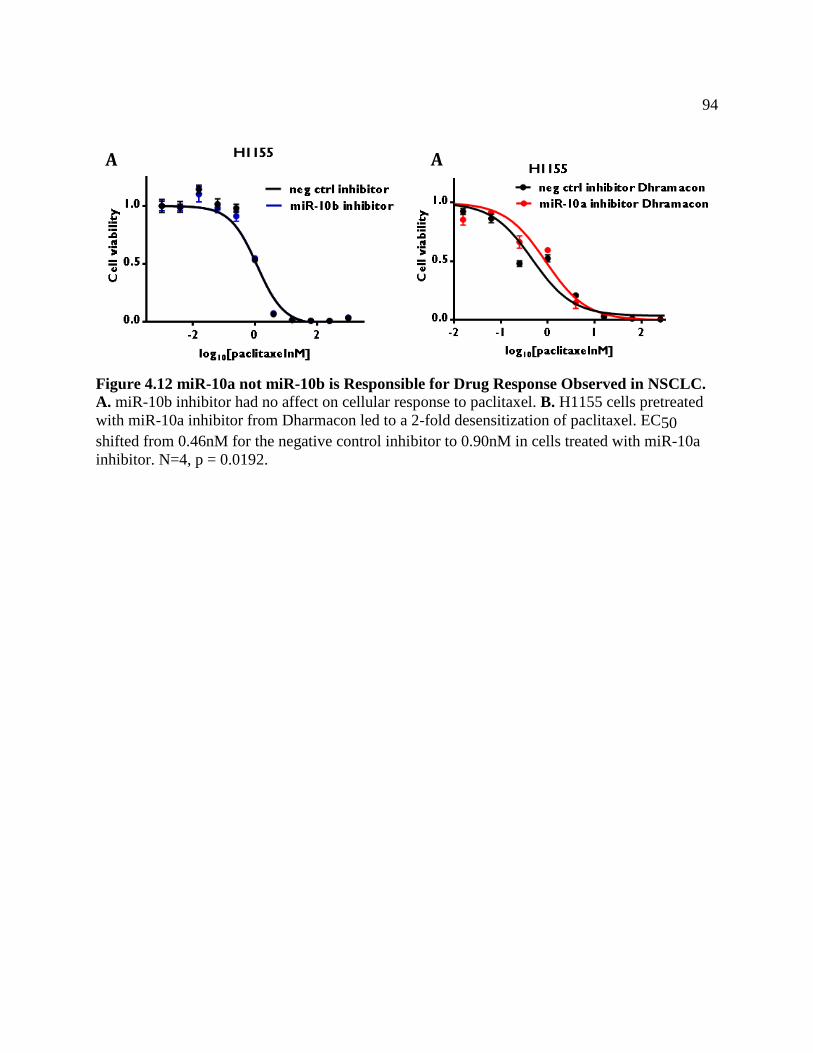
94
Figure 4.12 miR-10a not miR-10b is Responsible for Drug Response Observed in NSCLC. A. miR-10b inhibitor had no affect on cellular response to paclitaxel. B. H1155 cells pretreated with miR-10a inhibitor from Dharmacon led to a 2-fold desensitization of paclitaxel. EC50 shifted from 0.46nM for the negative control inhibitor to 0.90nM in cells treated with miR-10a inhibitor. N=4, p = 0.0192.
A A
95
4.3 Discussion
Our genome-wide miRNA inhibitor screen uncovered 20 miRNAs that when lost
decreased cellular viability in the presence of paclitaxel and 17 miRNA that increased viability.
A large portion of miRNAs had no effect on cellular response to paclitaxel. This could be due
several factors, such as loss of expression of the target miRNA during cancer progression or
perhaps that many of the miRNA screened are not expressed in the lung. There was some
discordance among the screen data and the validation; half a dozen screen hits changed arms
following validation. This could be explained by many reasons, such as the confluence of the
cells prior to transfection, condition of media such as subtle serum differences or amount of
dissolved CO2, which would affect pH. Additionally, plating of cells at the HTS core is done
mechanically which could have impacted cell number per well. Finally, our screen data consisted
of four replicates, while the validation was a triplicate of triplicates, which led to less variation,
anyone of these or a combination of several could led to the observed change of a miRNA
inhibitor from one arm to the other.
It is not surprising that in our inhibitor screen loss of miR-15a increased resistance to
paclitaxel given its tumor suppressor phenotype documented in several other types of cancer.
However, the target gene could not be Bcl-2 as paclitaxel induced apoptosis is depended on
BCL-2 expression(Haldar, Chintapalli et al. 1996) . Additionally, we did not observe correlation
of miR-15a and BCL2 expression in our NSCLC cell line panel. Looking through Targetscan.org
we observed a significant number of genes involved in the MEK/ERK signaling pathway and
following transfections with miR-15a mimic we observed loss of pERK. But this project was
96
ultimately terminated due to the inability to consistently reproduce results across our panel of
cell lines and changes made to the inhibitor design by the company.
Our lead candidate miRNA, miR-10a, which not only was validated in several cells lines,
the data was widely reproducible with small standard deviation. We serendipitously performed
the screen in H1155, which has the second highest expression of miR-10a—second only to
H2087 (Figure 4.7). The effect of miR-10a inhibition was the greatest in H1155, which became
more than ten-fold more resistant to paclitaxel treatment. While the mimic’s response was still
significant, it only resulted in a six-fold change in paclitaxel response (Figure 4.5A&B). This
response was not just specific to paclitaxel. The miR-10a mimic was able to sensitize H1155 to
docetaxol as well, where only a 0.0039nM concentration reduced cell viability by almost 50%
(Figure 4.6A&B). To confirm that the effect observed in H1155 was not idiosyncratic, we
selected H460 which expression moderate levels of miR-10a allowing a larger experiment space
(Figure 4.7). We observed a similar phenotypic effect of sensitization to paclitaxel in the
presence of miR-10a mimic and desensitization when miR-10a was removed. Measuring the
dynamic range we were able to achieve using both miR-10a mimic and inhibitor we observed
that the range was in agreement with miRNA array data. H1155, which has higher endogenous
levels, had a larger loss of miR-10a following transfection with the inhibitor then that of H460,
which expressed miR-10a at a lower level (Figure 4.9A). Conversely, H460, which has lower
endogenous expression, was able to obtain a larger increase of intracellular miR-10a following
transfection with miR-10a mimic (Figure 4.9B). It is for this reasons we believe the miR-10a
inhibitor had a larger effect in H1155 leading to over 10-fold desensitization while only a 3 fold
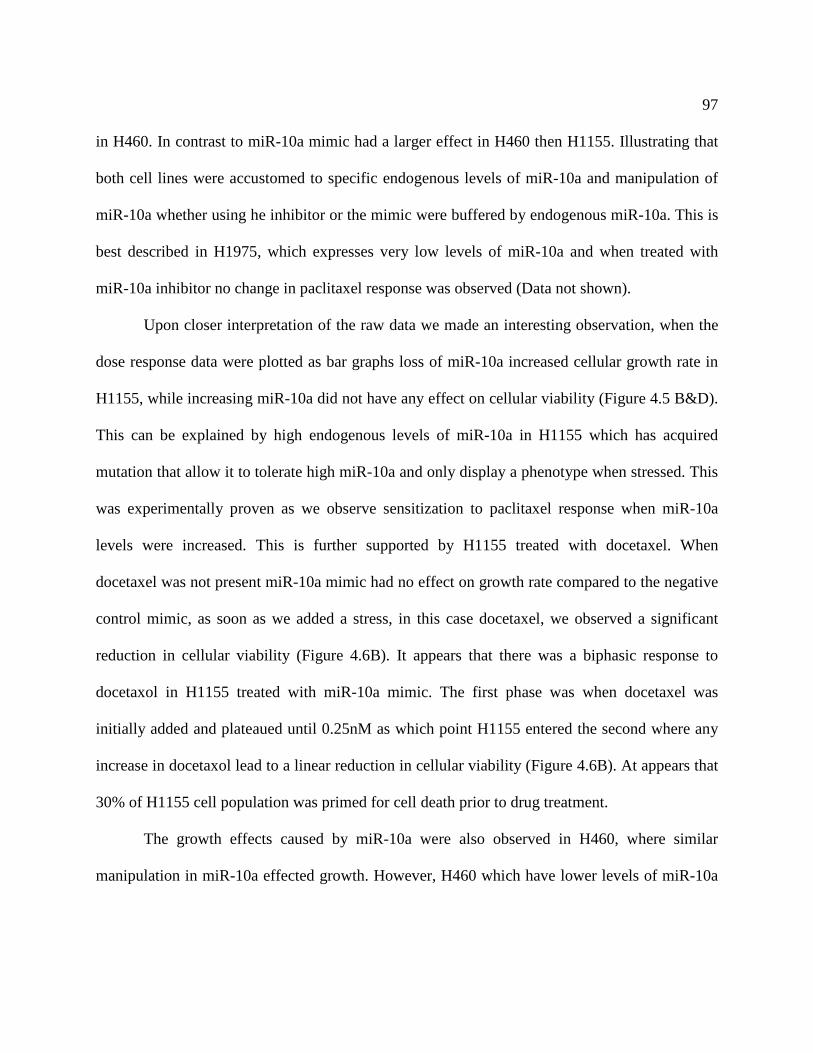
97
in H460. In contrast to miR-10a mimic had a larger effect in H460 then H1155. Illustrating that
both cell lines were accustomed to specific endogenous levels of miR-10a and manipulation of
miR-10a whether using he inhibitor or the mimic were buffered by endogenous miR-10a. This is
best described in H1975, which expresses very low levels of miR-10a and when treated with
miR-10a inhibitor no change in paclitaxel response was observed (Data not shown).
Upon closer interpretation of the raw data we made an interesting observation, when the
dose response data were plotted as bar graphs loss of miR-10a increased cellular growth rate in
H1155, while increasing miR-10a did not have any effect on cellular viability (Figure 4.5 B&D).
This can be explained by high endogenous levels of miR-10a in H1155 which has acquired
mutation that allow it to tolerate high miR-10a and only display a phenotype when stressed. This
was experimentally proven as we observe sensitization to paclitaxel response when miR-10a
levels were increased. This is further supported by H1155 treated with docetaxel. When
docetaxel was not present miR-10a mimic had no effect on growth rate compared to the negative
control mimic, as soon as we added a stress, in this case docetaxel, we observed a significant
reduction in cellular viability (Figure 4.6B). It appears that there was a biphasic response to
docetaxol in H1155 treated with miR-10a mimic. The first phase was when docetaxel was
initially added and plateaued until 0.25nM as which point H1155 entered the second where any
increase in docetaxol lead to a linear reduction in cellular viability (Figure 4.6B). At appears that
30% of H1155 cell population was primed for cell death prior to drug treatment.
The growth effects caused by miR-10a were also observed in H460, where similar
manipulation in miR-10a effected growth. However, H460 which have lower levels of miR-10a
98
were much more sensitive to miR-10a mimic treatment (Figure 4.13A). This effect was specific
to the mature miR-10a, as the star stand, which is typically not bioactive, did not affect cellular
viability (Figure 4.13B). H460 treated with miR-10a mimic resulted in an 80% loss of cellular
viability, only after seeding significantly more cells were we able to achieve dose curves (Figure
4.13A and 20A). This observation was confirmed in H1975; only the mature miR-10a had an
effect on cellular viability (Figure 4.13 C&D). Collectively this data suggests that miR-10a is
important in cellular viability.
Since miR-10a is one of two members of the miR-10 family, we had to parse if it was
solely responsible for the phenotype or only partially contributed to the drug sensitizing
phenotype. miR-10b is not widely expressed in our panel of cell lines and only two cells lines
express miR-10b: H1155 and H1770, both of which are derived from tumors with
neuroendocrine histological subtypes. Neuroendocrine histological subtypes confer poor
prognosis in NSCLC and is similar to the more aggressive SCLC (Bhattacharjee, Richards et al.
2001). Additionally, we did not observe any correlation of expression between miR-10a and
miR-10b (Figure 4.10C), suggesting that these miRNAs do not share similar regulatory
mechanism. Deep sequencing of miRNAs across tissue types in humans support this finding,
with miR-10a and miR-10b expression patterns differing widely (Landgraf, Rusu et al. 2007).
miR-10a is most prevalent in the respiratory system while miR-10b is present in the nervous
system and to lesser extent endocrine glands.
99
Figure 4.13 Growth Inhibitory Effect Observed in miR-10a Mimic Treated Cells. A. H460 cells treated with 20nM miR-10a mimic significantly inhibited growth. B. Growth inhibitory effect of miR-10a was specific to the miR-10a-5p and not miR-10a-3p or the * strand. C. 20nM of miR-10a mimic reduced growth in H1975 by over 50%. D. miR-10a star strand was not as effective as miR-10a at inhibiting growth rate in H1975.
A
B
C
D
100
Inhibiting miR-10b had no effect on cellular response to paclitaxel in H1155 (Figure
4.12A). While miR-10b inhibitor was not as effective in inhibiting expression levels as the miR-
10a inhibitor, it still removed more than 80% of the endogenous mircoRNA (Figure 4.11A).
Cross-reaction did raise concerns that miR-10a effect on cellular response to paclitaxel might be
a result of loss of both family members. We addressed this in several ways: 1) H460 does not
express miR-10b 2) Dharmacon inhibitors which showed greater specificity affected cellular
response to paclitaxel 3) H1975 miR-10b mimic had no effect on viability (data not shown). The
desensitization of paclitaxel using Dharmacon inhibitors was only 2-fold, not the 11-fold that
was observed with the Exiqon inhibitor (Figure 4.12B Vs. 4.5A), illustrating that even small
levels of miR-10a has the ability modulate paclitaxel response (Figure 4.9A&B). The use of two
inhibitors also reduced the likelihood of an off-target effect. Finally, the similarity of miR-10a
and miR-10b makes them difficult to distinguish using qPCR probes (Figure 4.10B). While we
do observe larger increases in the target miRNA expression following mimic transfections, there
is cross-reaction (Figure 4.10C). This could be due in large part to overload of the mature
product and the Taqman primers unable to distinguish endogenous from exogenous miR-10
levels. This was confirmed in H460 as we were unable to detect endogenous miR-10b levels,
similarly we could not detect miR-10a in H1770 (Data not shown). Collectively, this data
suggest that miR-10a and not miR-10b is responsible for modulation of cellular response to
paclitaxel.

101
Further confirming miR-10a’s importance in lung cancer, parsing patient survival data we
discovered that high miR-10a is predictive of recurrence free survival in white male smokers,
increasing recurrence free survival by more than ten years (Figure 4.14A&B). However, overall
this same group had the same percent survival, but it appears that between years 2 and 6 there
could be a potential therapeutic window to intervene (Figure 4.14C). No correlation of patient
survival was observed in similar groups when we look at miR-10b levels (Data not Shown).
4.4 Future Directions
We did not test the other class of microtubule destabilizers or DNA cross-linkers, nor did we
test if miR-10a inhibitor would confer resistance to docetaxel, both questions that should be
explored. Additionally, several miRNA inhibitors targeting the “star” strand were validated hits
from the inhibitor screen. Only recently has the “star” strand biology been investigated (Yang,
Phillips et al. 2011). Nonetheless this result is surprising and could be due to disruptions in the
processing of the mature miRNA, which has not been reported and warrants further
investigation. We also have several other miRNA inhibitors that are worth pursing, including
miR-101, which regulates EZH2 and has been implicated in cancer stem cell maintenance and
drug resistance (Sooryanarayana Varambally, Xiaosong Wang et al. 2007, Suva, Riggi et al.
2009). Other members in the lab are actively pursuing miRNA inhibitors that sensitize cells to
paclitaxel and other microtubule-targeting agents.
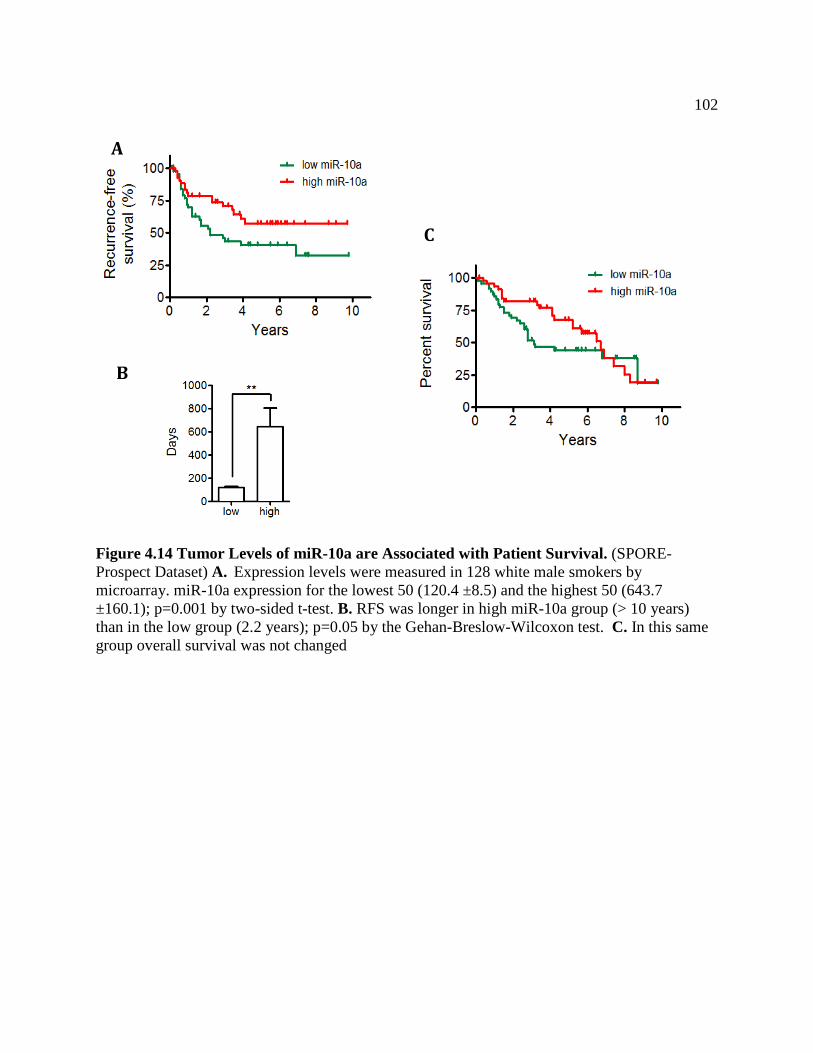
102
Figure 4.14 Tumor Levels of miR-10a are Associated with Patient Survival. (SPORE-Prospect Dataset) A. Expression levels were measured in 128 white male smokers by microarray. miR-10a expression for the lowest 50 (120.4 ±8.5) and the highest 50 (643.7 ±160.1); p=0.001 by two-sided t-test. B. RFS was longer in high miR-10a group (> 10 years) than in the low group (2.2 years); p=0.05 by the Gehan-Breslow-Wilcoxon test. C. In this same group overall survival was not changed
A
B
C
103
CHAPTER FIVE miR-10a Regulation of PI3K Signaling Through Direct and Indirect Mechanisms
5.1 Introduction
While the above findings suggest that miR-10a is a regulator of response to microtubule
stabilizers in lung cancer, we do not know which miR-10a targets are responsible for mediating
this effect. In parallel with the above studies, we were investigating miRNAs that regulate
phosphatidylinositol 3-kinases (PI3K). It could be argued that PI3K is the linchpin not only in
lung cancer, but also in many solid tumors. It lies directly downstream of both receptor tyrosine
kinases (RTKs) such as EGFR and HER2/3, and KRAS. While mutations in PI3K are rare in
lung cancer — comprising only about 10% of all mutations — when upstream signaling is taken
into account, over 50% of lung cancer signals through PI3K (Larsen, Cascone et al. 2011).
Currently, there are almost a dozen drugs targeting various components of the PI3K in clinical
trials (Courtney, Corcoran et al. 2010).
PI3K is a heterodimer protein composed of a regulatory subunit, p85, encoded by the
gene PIK3R1 and a catalytic subunit, p100α, encoded by the gene PI3KCA. The regulatory
subunit directly interacts with RTKs, transducing extracellular signals to intracellular responses.
The binding event relieves the inhibitory conformation of the catalytic subunit, which then acts
on its substrate phosphatidylinositol 4,5-bisphosphate (PIP2), converting it to
phosphatidylinositol 3,4,5-triphosphate (PIP3) (Zhao and Vogt 2008). The tumor suppressor
104
phosphatase and tensin homolog (PTEN) antagonizes the pathway by dephosphorylating PIP3
back to its inactive form PIP2. Additionally, KRAS can directly interact with the catalytic
subunit to change it to the active form. Confirming PI3K involvement in KRAS-driven
tumorigenesis was demonstrated using a mouse model of lung cancer that harbored a dominant
negative form of PI3K-inhibited KRAS-induced lung cancer (Roy Katso1 2001).
PIP3 acts as a docking site for proteins that contain pleckstrin homology (PH) domains.
Two widely studied PH domain-containing proteins are phosphoinositide-dependent kinases
PDK1 and AKT. PDK1 phosphorylates AKT at threonine 308. Activated AKT then
phosphorylates TSC2, inhibiting the GTPase activity of the TCS1/TCS2 dimer (Engelman 2009).
This then relieves suppression of mTORC1 complex, in which the mammalian target of
rapamycin, mTOR, lies at the catalytic center. The mTORC1 complex goes on to activate protein
synthesis by phosphorylating eukaryotic initiation factor 4E (EIF4E) and the ribosomal subunit
S6 proteins (Guertin and Sabatini 2007). Only recently was it discovered that activated ribosomal
protein directly interacts with the mTORC2 complex, relieving its inhibition (Zinzalla, Stracka et
al. 2011). Activation of mTORC2 allows for feed-forward signaling as it phosphorylates AKT at
serine 473 allowing for full pathway activation (Figure 27A) (Courtney, Corcoran et al. 2010).
Activation of the PI3K/AKT/mTOR pathway has been documented to regulate every one of the
hallmarks of cancer and drug resistance (Engelman 2009).

105
Cancer constitutively activates the PI3K pathways through several somatic mutations in
PIK3CA and inactivating mutations in PTEN. Mutations in PTEN are more frequently observed
— typically deletions lead to a truncated, inactive protein (Song, Salmena et al. 2012). This
inactivation causes accumulation of PIP3 and thus activation of the PI3K/AKT/mTOR signaling
axis. As deep sequencing efforts have progressed over the years, several mutations in PIK3CA
have been identified (Zhao and Vogt 2008). There are two hot-spot mutations, one in exon 9 and
the other in exon 20. Exon 9 encodes the helical domain of the p110α protein, which directly
interacts with the regulatory p85 subunit. The mutation changes the glutamic acid (E) at position
545 to a lysine (K) leading to a conformation change relieving the inhibitory effects of p85
subunit. This mutation is highly dependent on Ras-GTP activity (Zhao and Vogt 2008). The
other hotspot mutation occurs in the catalytic site and changes the histidine (H) at position 1074
to an arginine (R), constitutively activating the protein. H1074R mutations are dependent on
interaction with RTKs and are sufficient to induce lung adenocarcinomas (Engelman, Chen et al.
2008). The E545K and H1074R mutations are mutually exclusive, but in vitro experiments have
found an additive effect, suggesting that such strong activation of the pathway inhibits tumor
growth or progression (Zhao and Vogt 2008).
An immense amount of effort has been devoted to understanding the equilibrium that
exists between PTEN and PI3K. Numerous reports have shown that subtle changes to PTEN are
enough to allow for aberrant pathway activation (Carracedo, Alimonti et al. 2011), (Tay, Kats et
al. 2011, Song, Salmena et al. 2012). It was first noted that primary non-metastatic prostate
106
tumors had one intact copy of PTEN while advanced metastatic tumors had complete
inactivation. It was then experimentally shown that an 8% loss of PTEN resulted in a 28%
increase in pAKT and that homozygous loss of PTEN was sufficient to cause invasive
carcinomas (Trotman, Niki et al. 2003). Fitting with the observation that small decreases in
PTEN predispose cells to oncogenic transformation, several groups discovered a handful of
miRNAs that are over-expressed in cancer and repress PTEN. This was elegantly followed up by
work in the Pandolfi lab that showed dysregulation of PTENP1, a pseudogene that is expressed,
contains a 3’UTR that is highly homologous to that of PTEN and is selectively lost in human
cancers (Poliseno, Salmena et al. 2010). PTENP1 over-expression increases PTEN protein levels
by acting as a sponge for several miRNAs that would normally target PTEN. This concept has
been expanded to integrate dozens of genes and miRNAs into a network of competing
endogenous RNAs that act together to regulate PTEN protein levels (Figure 27B)(Salmena,
Poliseno et al. 2011). Oddly, little effort has been paid to understanding whether the same degree
of regulation exists for PI3K, in particular by miRNAs.
We discovered miR-10a as a regulator of PI3K levels that acts by directly interacting
with the PIK3CA 3’UTR as well as through indirect mechanisms. We uncovered GATA6 as a
transcription factor that activates PIK3CA expression and is also regulated by miR-10a. Finally,
we identified miR-10a as a regulator of cellular growth in NSCLC.
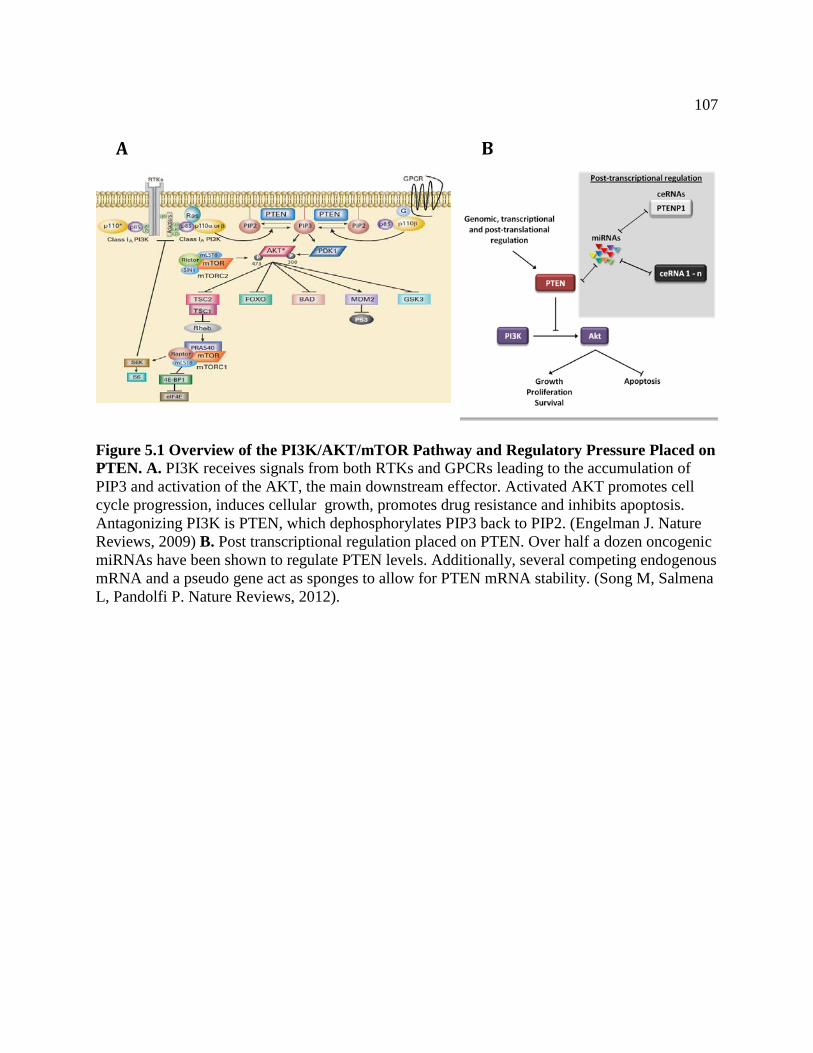
107
Figure 5.1 Overview of the PI3K/AKT/mTOR Pathway and Regulatory Pressure Placed on PTEN. A. PI3K receives signals from both RTKs and GPCRs leading to the accumulation of PIP3 and activation of the AKT, the main downstream effector. Activated AKT promotes cell cycle progression, induces cellular growth, promotes drug resistance and inhibits apoptosis. Antagonizing PI3K is PTEN, which dephosphorylates PIP3 back to PIP2. (Engelman J. Nature Reviews, 2009) B. Post transcriptional regulation placed on PTEN. Over half a dozen oncogenic miRNAs have been shown to regulate PTEN levels. Additionally, several competing endogenous mRNA and a pseudo gene act as sponges to allow for PTEN mRNA stability. (Song M, Salmena L, Pandolfi P. Nature Reviews, 2012).
A B
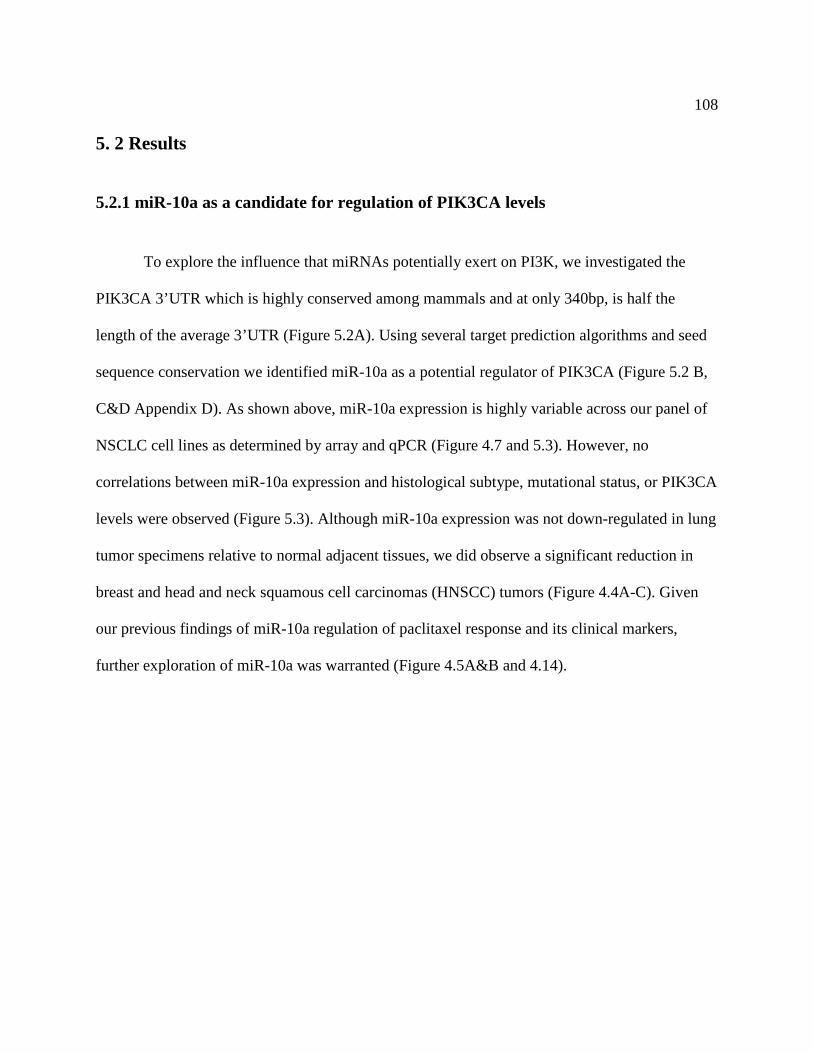
108
5. 2 Results
5.2.1 miR-10a as a candidate for regulation of PIK3CA levels
To explore the influence that miRNAs potentially exert on PI3K, we investigated the
PIK3CA 3’UTR which is highly conserved among mammals and at only 340bp, is half the
length of the average 3’UTR (Figure 5.2A). Using several target prediction algorithms and seed
sequence conservation we identified miR-10a as a potential regulator of PIK3CA (Figure 5.2 B,
C&D Appendix D). As shown above, miR-10a expression is highly variable across our panel of
NSCLC cell lines as determined by array and qPCR (Figure 4.7 and 5.3). However, no
correlations between miR-10a expression and histological subtype, mutational status, or PIK3CA
levels were observed (Figure 5.3). Although miR-10a expression was not down-regulated in lung
tumor specimens relative to normal adjacent tissues, we did observe a significant reduction in
breast and head and neck squamous cell carcinomas (HNSCC) tumors (Figure 4.4A-C). Given
our previous findings of miR-10a regulation of paclitaxel response and its clinical markers,
further exploration of miR-10a was warranted (Figure 4.5A&B and 4.14).
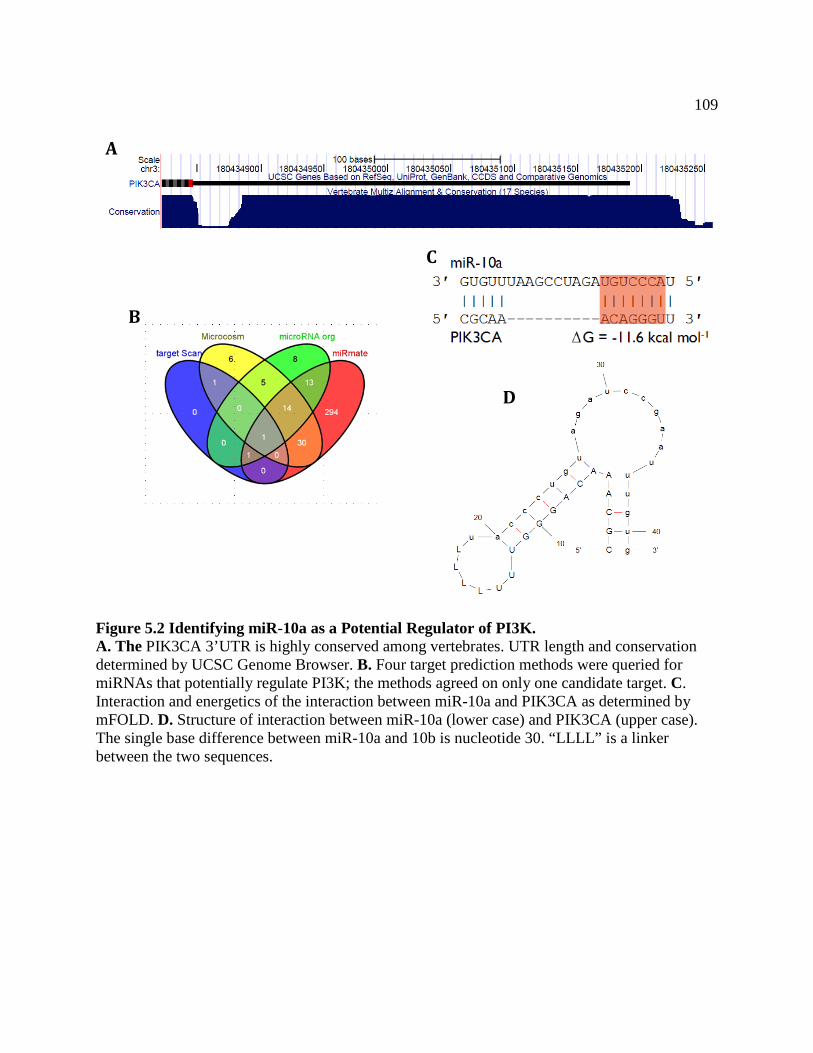
109
Figure 5.2 Identifying miR-10a as a Potential Regulator of PI3K. A. The PIK3CA 3’UTR is highly conserved among vertebrates. UTR length and conservation determined by UCSC Genome Browser. B. Four target prediction methods were queried for miRNAs that potentially regulate PI3K; the methods agreed on only one candidate target. C. Interaction and energetics of the interaction between miR-10a and PIK3CA as determined by mFOLD. D. Structure of interaction between miR-10a (lower case) and PIK3CA (upper case). The single base difference between miR-10a and 10b is nucleotide 30. “LLLL” is a linker between the two sequences.
A
B
C
D
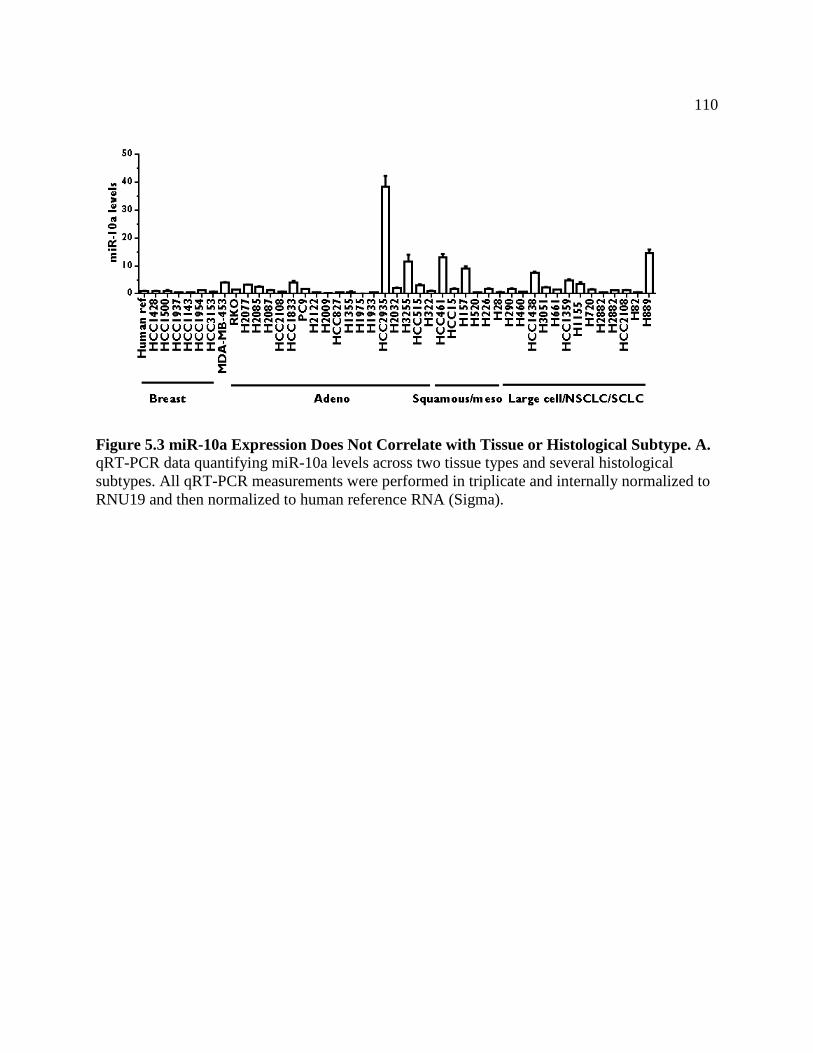
110
Figure 5.3 miR-10a Expression Does Not Correlate with Tissue or Histological Subtype. A. qRT-PCR data quantifying miR-10a levels across two tissue types and several histological subtypes. All qRT-PCR measurements were performed in triplicate and internally normalized to RNU19 and then normalized to human reference RNA (Sigma).

111
5.2.2 Direct Regulation of PIK3CA by miR-10a
To investigate the regulation of PIK3CA by miR-10a, we used H460 and H1155 as
model cell lines, one harboring a canonical mutation in the PIK3CA kinase domain (E545K) and
the other containing an inactivating mutation in PTEN, respectively. Exogenous expression of
miR-10a in each cell line led to a 3,000-fold increase in miR-10a levels in H1155 cells and a
2,700 fold in H460 cells when compared to control treated cells (Figure 4.9B). In both cell lines
we observed a 50% reduction in PIK3CA levels (Figure 5.4A). We then analyzed the robustness
of the phenotype and transiently removed miR-10a from both H460 and H1155 cells using a
LNA inhibitor specifically targeting miR-10a (Figure 4.9A). Removing miR-10a from H1155
and H460 cells resulted in three- and two-fold increases in PIK3CA levels, respectively (Figure
5.4B). To determine if in fact miR-10a was the only miRNA that regulated PIK3CA or was part
of a network of miRNAs, we tested the effects of miR-10b and two other miRNAs, miR-124 and
miR-203, which have conserved binding sites in the PIK3CA 3’UTR. Only when cells were
transfected with miR-10a mimic did we observe a reduction in PIK3CA levels (Figure 5.4C). We
then expanded this finding across a panel of cell lines containing various histological subtypes of
lung cancer, three breast cancer lines and two colon cancer cell lines. In all cases miR-10a was
able to reduce PIK3CA expression (Figure 5.4D). Since the observed changes at the mRNA level
were relatively subtle, we were unsure if this reduction would have any effect on downstream
signaling.
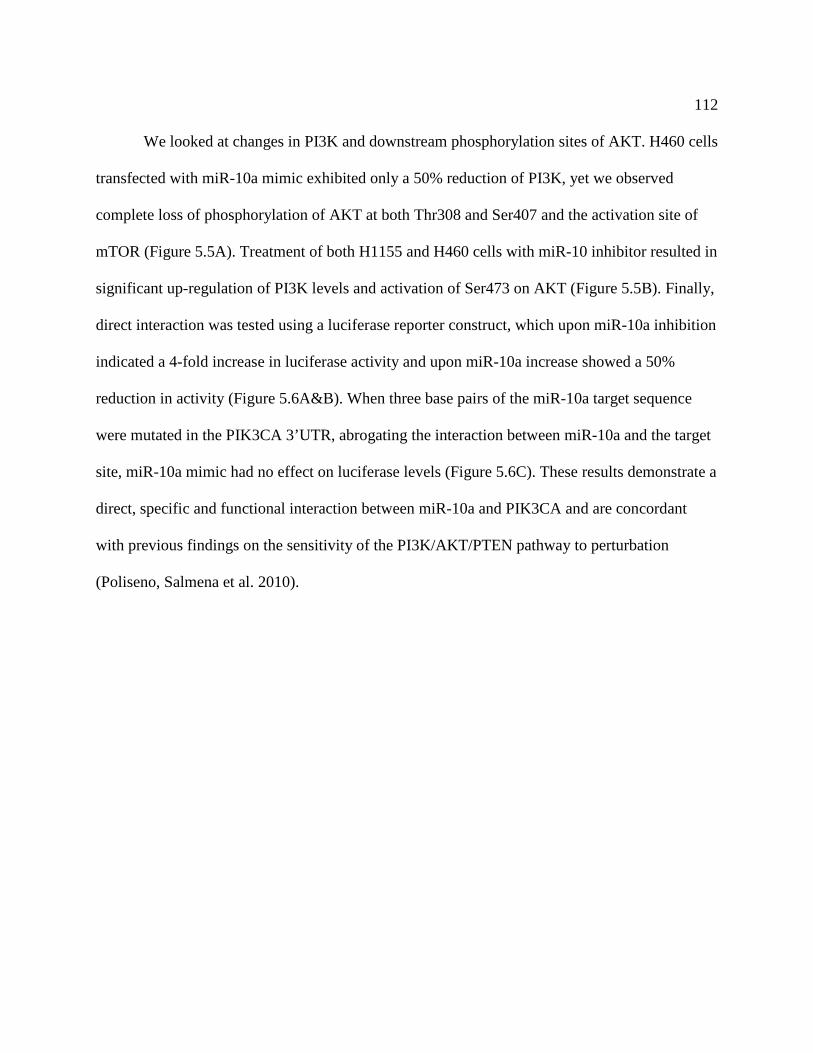
112
We looked at changes in PI3K and downstream phosphorylation sites of AKT. H460 cells
transfected with miR-10a mimic exhibited only a 50% reduction of PI3K, yet we observed
complete loss of phosphorylation of AKT at both Thr308 and Ser407 and the activation site of
mTOR (Figure 5.5A). Treatment of both H1155 and H460 cells with miR-10 inhibitor resulted in
significant up-regulation of PI3K levels and activation of Ser473 on AKT (Figure 5.5B). Finally,
direct interaction was tested using a luciferase reporter construct, which upon miR-10a inhibition
indicated a 4-fold increase in luciferase activity and upon miR-10a increase showed a 50%
reduction in activity (Figure 5.6A&B). When three base pairs of the miR-10a target sequence
were mutated in the PIK3CA 3’UTR, abrogating the interaction between miR-10a and the target
site, miR-10a mimic had no effect on luciferase levels (Figure 5.6C). These results demonstrate a
direct, specific and functional interaction between miR-10a and PIK3CA and are concordant
with previous findings on the sensitivity of the PI3K/AKT/PTEN pathway to perturbation
(Poliseno, Salmena et al. 2010).
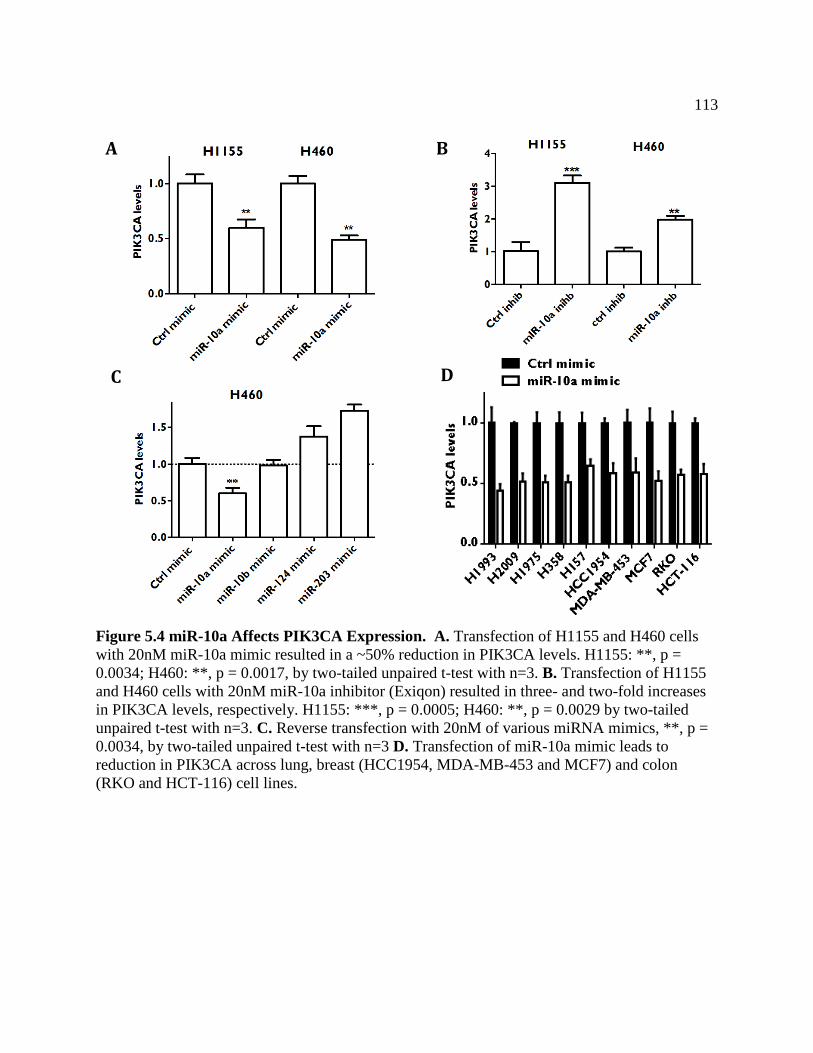
113
Figure 5.4 miR-10a Affects PIK3CA Expression. A. Transfection of H1155 and H460 cells with 20nM miR-10a mimic resulted in a ~50% reduction in PIK3CA levels. H1155: **, p = 0.0034; H460: **, p = 0.0017, by two-tailed unpaired t-test with n=3. B. Transfection of H1155 and H460 cells with 20nM miR-10a inhibitor (Exiqon) resulted in three- and two-fold increases in PIK3CA levels, respectively. H1155: ***, p = 0.0005; H460: **, p = 0.0029 by two-tailed unpaired t-test with n=3. C. Reverse transfection with 20nM of various miRNA mimics, **, p = 0.0034, by two-tailed unpaired t-test with n=3 D. Transfection of miR-10a mimic leads to reduction in PIK3CA across lung, breast (HCC1954, MDA-MB-453 and MCF7) and colon (RKO and HCT-116) cell lines.
A B
C D
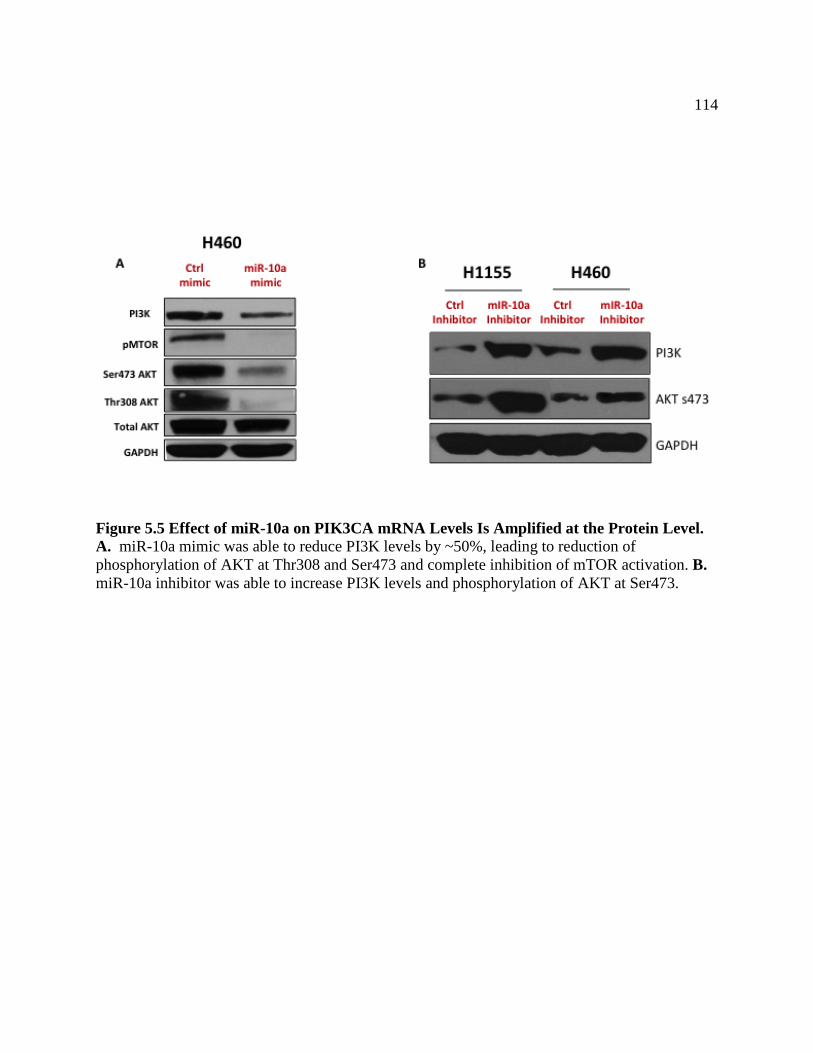
114
Figure 5.5 Effect of miR-10a on PIK3CA mRNA Levels Is Amplified at the Protein Level. A. miR-10a mimic was able to reduce PI3K levels by ~50%, leading to reduction of phosphorylation of AKT at Thr308 and Ser473 and complete inhibition of mTOR activation. B. miR-10a inhibitor was able to increase PI3K levels and phosphorylation of AKT at Ser473.

115
Figure 5.6 Direct Interaction of miR-10a and the PIK3CA 3’UTR. A. Inhibiting miR-10a expression in the presence of a luciferase reporter with the PIK3CA 3’UTR resulted in a 4-fold increase in luciferase activity, as measured in relative light units. ***, p = 0.0004, by two-tailed unpaired t-test with n=4. B. Co-treatment of miR-10a mimic and the reporter construct led to a 50% reduction in luciferase activity, as measured in relative light units. **, p = 0.0035 by two-tailed unpaired t-test with n-4. C. Ablating the miR-10a target site in the reporter construct led to no change in luciferase activity when cells were co-transfected with the miR-10a mimic.
H1155
B A C

116
5.2.3 Inhibiting PI3K Affects Cellular Response to Paclitaxel Although our previous finding that miR-10a regulates paclitaxel response was robust, we
did not know which target or targets of miR-10a were responsible for the phenotype. We have
now uncovered that miR-10a regulates PI3K. Given the importance of the PI3K/AKT/mTOR
pathway in both innate and acquired drug resistance (McCubrey, Steelman et al. 2006), we
postulated that the changes in paclitaxel response we observed were due to changes in PI3K. To
address this question, we took several approaches. First, we used both transient siRNA and stable
shRNA transfection to knock down PIK3CA, both of which dramatically reduced PI3K levels
(Figure 5.7A). In H460 cells, both the siRNA and shRNA targeting PI3K were able to sensitize
cells to paclitaxel treatment. EC50s for the ctrlSI and ctrlSH were 0.13 nM and 0.17 nM
respectively, while for siPIK3CA and shPIK3CA they were 0.057 nM and 0.072 nM,
respectively, with p < 0.0001 (Figure 5.7B-C). To confirm the effect was not cell type specific,
we also used H1155 cells transiently transfected with siPIK3CA and observed similar results.
siPIK3CA was able to shift the EC50 from 3.96 nM for the ctrlSI to 0.083 nM, a 50-fold decrease
(Figure 5.7D).
Finally, we used BEZ-235, a small molecule inhibitor, to independently assess the
synergy between inhibition of PI3K and paclitaxel. BEZ-235 is a dual inhibitor; it inhibits both
PI3K and mTOR and has shown promise in clinical trials (Serra, Markman et al. 2008). We
needed to select a concentration of BEZ-235 that only had minimal effect on cellular viability.
From the dose-response curve (Figure 5.8A&B), 5 nM was selected as having only a minimal

117
effect on viability (Figure 5.8D). Following 72 h pre-treatment with 5 nM of BEZ-235, the EC50
for paclitaxel decreased from 3.06nM for DMSO to 0.933 nM (Figure 5.8C).
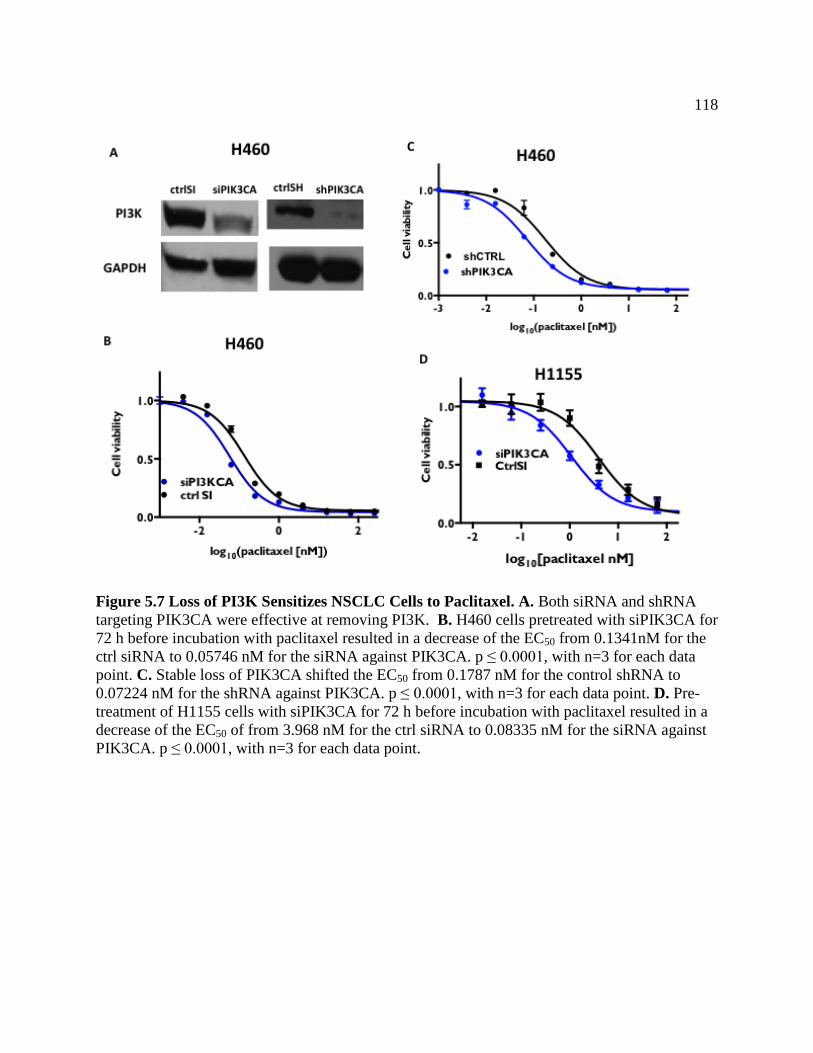
118
Figure 5.7 Loss of PI3K Sensitizes NSCLC Cells to Paclitaxel. A. Both siRNA and shRNA targeting PIK3CA were effective at removing PI3K. B. H460 cells pretreated with siPIK3CA for 72 h before incubation with paclitaxel resulted in a decrease of the EC50 from 0.1341nM for the ctrl siRNA to 0.05746 nM for the siRNA against PIK3CA. p ≤ 0.0001, with n=3 for each data point. C. Stable loss of PIK3CA shifted the EC50 from 0.1787 nM for the control shRNA to 0.07224 nM for the shRNA against PIK3CA. p ≤ 0.0001, with n=3 for each data point. D. Pre-treatment of H1155 cells with siPIK3CA for 72 h before incubation with paclitaxel resulted in a decrease of the EC50 of from 3.968 nM for the ctrl siRNA to 0.08335 nM for the siRNA against PIK3CA. p ≤ 0.0001, with n=3 for each data point.
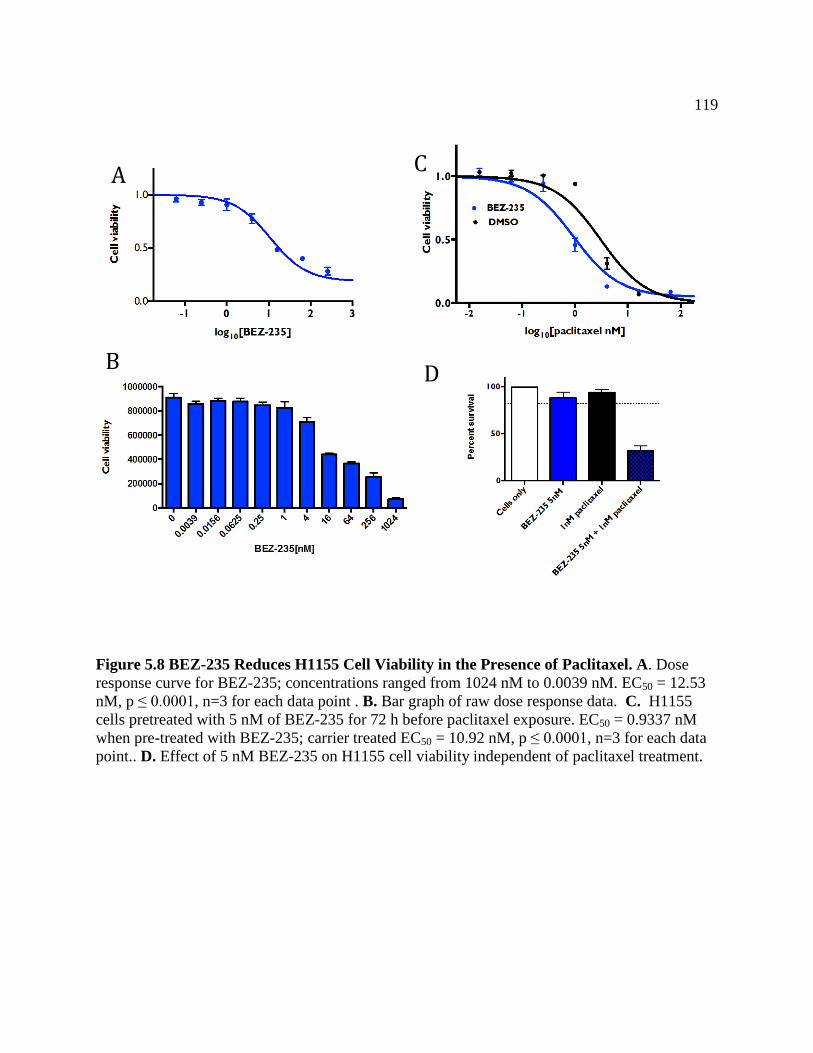
119
Figure 5.8 BEZ-235 Reduces H1155 Cell Viability in the Presence of Paclitaxel. A. Dose response curve for BEZ-235; concentrations ranged from 1024 nM to 0.0039 nM. EC50 = 12.53 nM, p ≤ 0.0001, n=3 for each data point . B. Bar graph of raw dose response data. C. H1155 cells pretreated with 5 nM of BEZ-235 for 72 h before paclitaxel exposure. EC50 = 0.9337 nM when pre-treated with BEZ-235; carrier treated EC50 = 10.92 nM, p ≤ 0.0001, n=3 for each data point.. D. Effect of 5 nM BEZ-235 on H1155 cell viability independent of paclitaxel treatment.
A
B D
C
120
5.2.4 miR-10a Inhibits Growth and Induces Apoptosis Previously, we observed that increasing intracellular levels of miR-10a mimic
significantly inhibited cellular growth rates while decreasing miR-10a levels increased growth
rates (Figure 4.13A-C and 4.5B). To test this further, we looked at growth rates using a kinetic
assay with cell confluence measured every hour over the course of several days. We observed
that manipulating miR-10a levels could move the growth curve in either direction (Figure 5.9A-
B). Ectopic miR-10a completely inhibited growth of H460 cells while the control mimic had no
significant effect on growth (Figure 5.9A). In stark contrast, the miR-10a inhibitor dramatically
increased cellular growth (Figure 5.9B). To extend this measurement of growth promotion or
inhibition over a longer time course, we looked at the ability of miR-10a to affect colony
formation. Consistent with the effects on growth, increasing miR-10a inhibited colony formation
while inhibiting miR-10a increased the number of colonies formed (Figure 5.9C). To control for
possible off-target effects caused by miR-10a mimic, we employed stable over-expression that
resulted in only a five-fold increase in miR-10a expression (Figure 5.9D). This relatively subtle
increase was enough to inhibit colony formation significantly (Figure 5.9E).
Neither assay could explain how miR-10a was inhibiting growth; it could either be
inducing apoptosis or having a cytostatic effect. We first looked at induction of apoptosis using
DEVD-NucView from Essen BioScience (see Methods). Briefly, cells with activated caspase 3/7
will cleave DEVD-NucView to NucView, which will intercalate into the DNA and cause the
cells to glow green. After 72 h of miR-10a mimic treatment nearly all the cells were green,
indicating they were undergoing apoptosis compared to control mimic (Figure 5.10A-B). We

121
then independently confirmed this result by blotting for cleaved PARP; we observed an increase
in cleaved PARP 48 h post transfection, indicating an activation of apoptosis (Figure 5.10C).
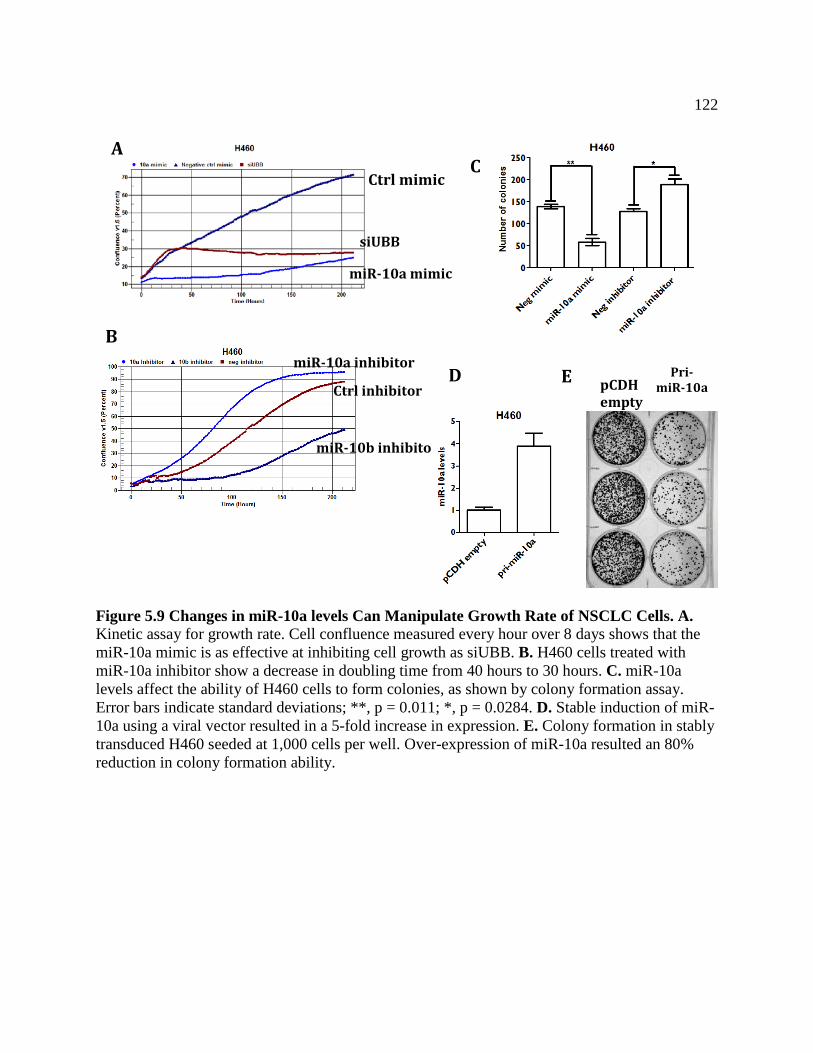
122
Figure 5.9 Changes in miR-10a levels Can Manipulate Growth Rate of NSCLC Cells. A. Kinetic assay for growth rate. Cell confluence measured every hour over 8 days shows that the miR-10a mimic is as effective at inhibiting cell growth as siUBB. B. H460 cells treated with miR-10a inhibitor show a decrease in doubling time from 40 hours to 30 hours. C. miR-10a levels affect the ability of H460 cells to form colonies, as shown by colony formation assay. Error bars indicate standard deviations; **, p = 0.011; *, p = 0.0284. D. Stable induction of miR-10a using a viral vector resulted in a 5-fold increase in expression. E. Colony formation in stably transduced H460 seeded at 1,000 cells per well. Over-expression of miR-10a resulted an 80% reduction in colony formation ability.
Ctrl mimic
miR-10a mimic
siUBB
miR-10b inhibitor
miR-10a inhibitor
Ctrl inhibitor pCDH empty
Pri- miR-10a
A
B
C
D E
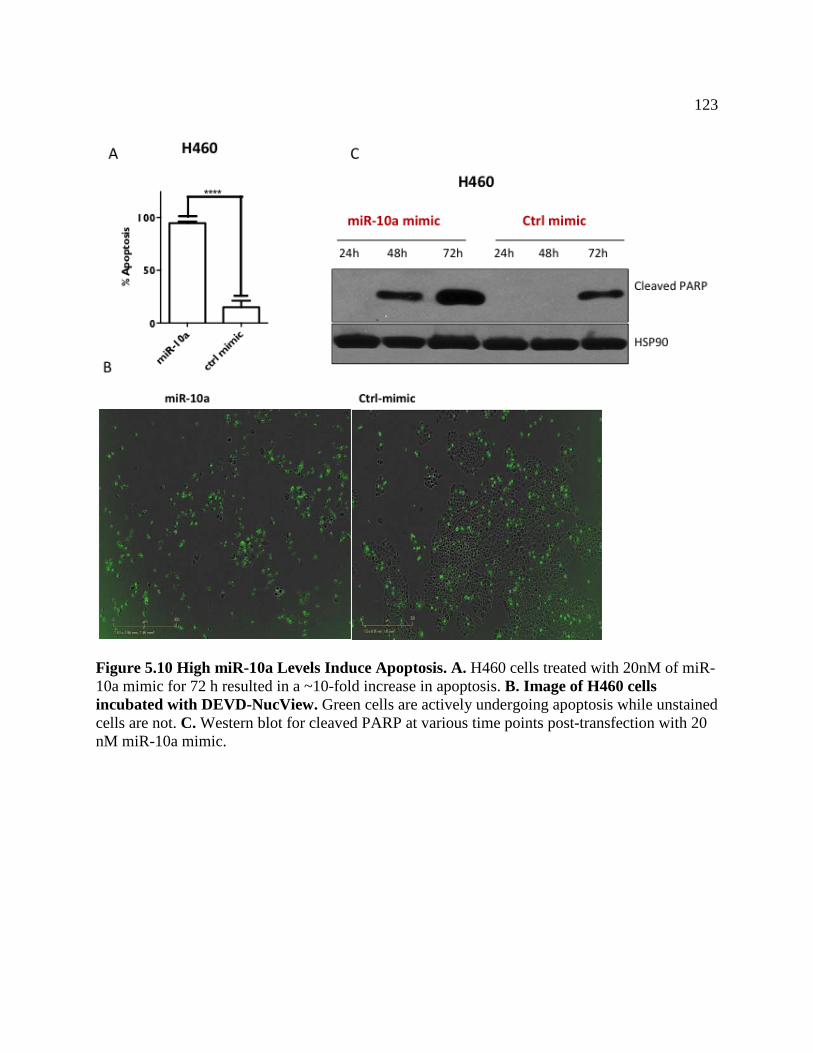
123
Figure 5.10 High miR-10a Levels Induce Apoptosis. A. H460 cells treated with 20nM of miR-10a mimic for 72 h resulted in a ~10-fold increase in apoptosis. B. Image of H460 cells incubated with DEVD-NucView. Green cells are actively undergoing apoptosis while unstained cells are not. C. Western blot for cleaved PARP at various time points post-transfection with 20 nM miR-10a mimic.
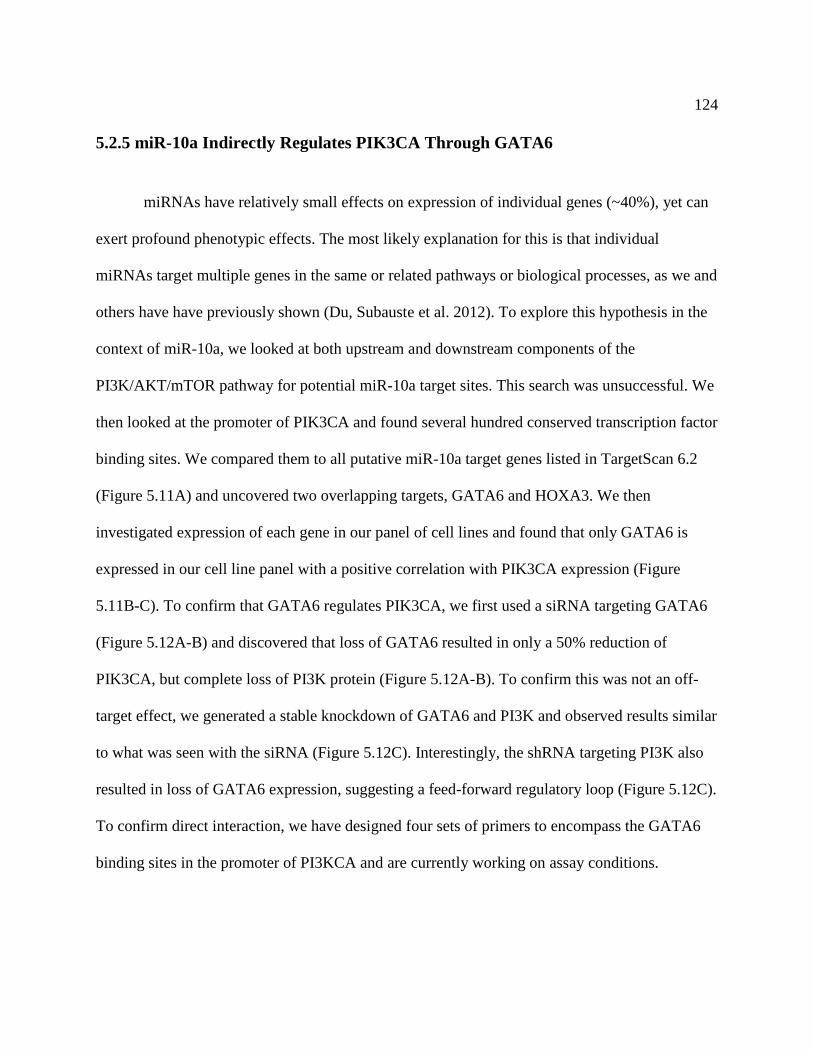
124
5.2.5 miR-10a Indirectly Regulates PIK3CA Through GATA6
miRNAs have relatively small effects on expression of individual genes (~40%), yet can
exert profound phenotypic effects. The most likely explanation for this is that individual
miRNAs target multiple genes in the same or related pathways or biological processes, as we and
others have have previously shown (Du, Subauste et al. 2012). To explore this hypothesis in the
context of miR-10a, we looked at both upstream and downstream components of the
PI3K/AKT/mTOR pathway for potential miR-10a target sites. This search was unsuccessful. We
then looked at the promoter of PIK3CA and found several hundred conserved transcription factor
binding sites. We compared them to all putative miR-10a target genes listed in TargetScan 6.2
(Figure 5.11A) and uncovered two overlapping targets, GATA6 and HOXA3. We then
investigated expression of each gene in our panel of cell lines and found that only GATA6 is
expressed in our cell line panel with a positive correlation with PIK3CA expression (Figure
5.11B-C). To confirm that GATA6 regulates PIK3CA, we first used a siRNA targeting GATA6
(Figure 5.12A-B) and discovered that loss of GATA6 resulted in only a 50% reduction of
PIK3CA, but complete loss of PI3K protein (Figure 5.12A-B). To confirm this was not an off-
target effect, we generated a stable knockdown of GATA6 and PI3K and observed results similar
to what was seen with the siRNA (Figure 5.12C). Interestingly, the shRNA targeting PI3K also
resulted in loss of GATA6 expression, suggesting a feed-forward regulatory loop (Figure 5.12C).
To confirm direct interaction, we have designed four sets of primers to encompass the GATA6
binding sites in the promoter of PI3KCA and are currently working on assay conditions.
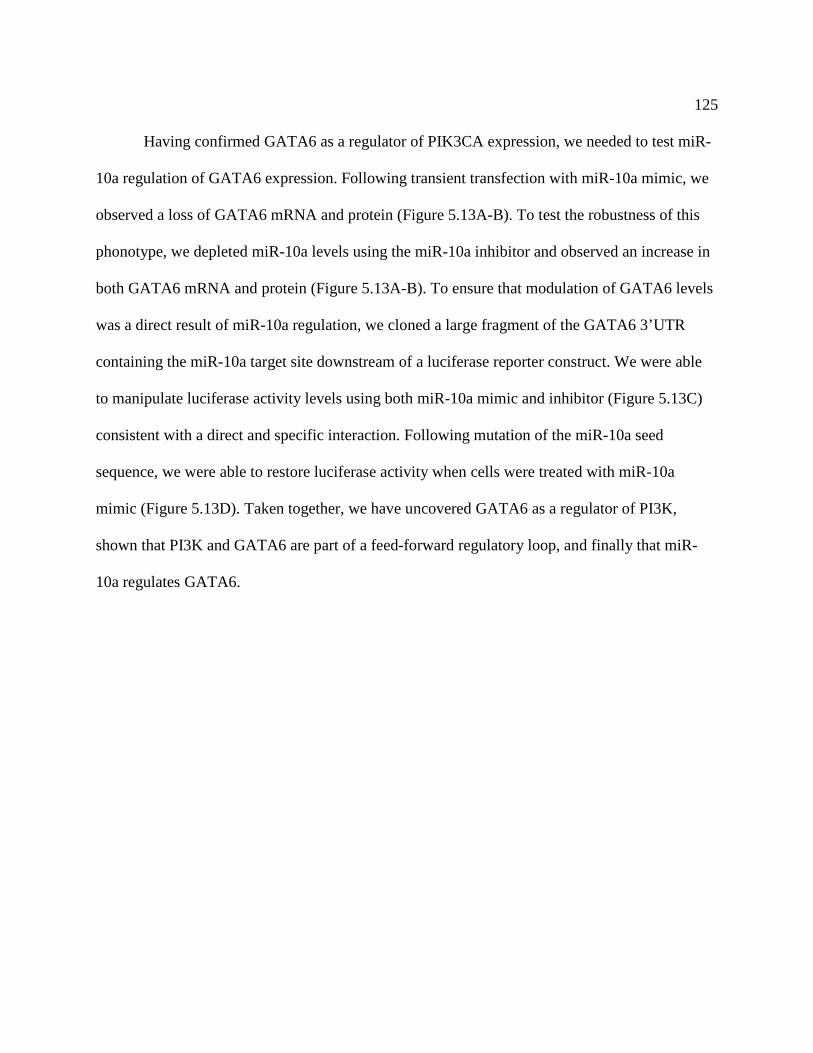
125
Having confirmed GATA6 as a regulator of PIK3CA expression, we needed to test miR-
10a regulation of GATA6 expression. Following transient transfection with miR-10a mimic, we
observed a loss of GATA6 mRNA and protein (Figure 5.13A-B). To test the robustness of this
phonotype, we depleted miR-10a levels using the miR-10a inhibitor and observed an increase in
both GATA6 mRNA and protein (Figure 5.13A-B). To ensure that modulation of GATA6 levels
was a direct result of miR-10a regulation, we cloned a large fragment of the GATA6 3’UTR
containing the miR-10a target site downstream of a luciferase reporter construct. We were able
to manipulate luciferase activity levels using both miR-10a mimic and inhibitor (Figure 5.13C)
consistent with a direct and specific interaction. Following mutation of the miR-10a seed
sequence, we were able to restore luciferase activity when cells were treated with miR-10a
mimic (Figure 5.13D). Taken together, we have uncovered GATA6 as a regulator of PI3K,
shown that PI3K and GATA6 are part of a feed-forward regulatory loop, and finally that miR-
10a regulates GATA6.
126
Figure 5.11 Potential Indirect Regulation of PI3K by miR-10a through GATA6. A. Overlapping sets of miR-10a targets from Targetscan and conserved transcription factor-binding sites in the region +/- 3.5 KB from the TSS of PIK3CA. B. GATA family expression across our panel of NSCLC cell lines. C. The only GATA family member with a positive correlation with PIK3CA expression is GATA6; R = 0.23, p = 0.0009.
PIK3CA
Putative GATA binding site
A
B
C

127
Figure 5.12 GATA6 Regulates PI3K. A. siRNA knock-down of GATA6 resulted in complete loss of GATA6 mRNA and resulted in ~50% decrease in PIK3CA mRNA. ***, p = 0.0001; ****, p ≤ 0.0001 by unpaired two-tailed t-test with n=3. B. Transfection of the siRNA against GATA6 leads to complete loss of both GATA6 and PI3K after 72 h. C. Stable knock-down of GATA6 resulted in loss of PI3K expression; stable knock-down of PIK3CA resulted in loss of GATA6 expression.
128
Figure 5.13 miR-10a Directly Regulates GATA6. A. Transfection of 20 nM of miR-10a mimic reduces GATA6 levels by ~40%, as measured by qRT-PCR. Transfection of 20nM of miR-10a inhibitor increases GATA6 levels by ~2.5-fold. **, p = 0.039; ****, p ≤ 0.0001 by unpaired two-tailed t-test with n=3. B. miR-10a mimic leads to reduction in GATA6 protein levels while miR-10a inhibitor increases GATA6 protein levels. C. miR-10a interacts directly and specifically with the GATA6 3’UTR. miR-10a mimic results in ~50% reduction in luciferase activity, while miR-10a inhibitor leads to a ~2.5-fold increase in luciferase activity. ****, p ≤ 0.0001 by unpaired two-tailed t-test with n = 4. D. Ablating the miR-10a target site in the reporter construct led to no change in luciferase activity following transfection of cells with miR-10a mimic.
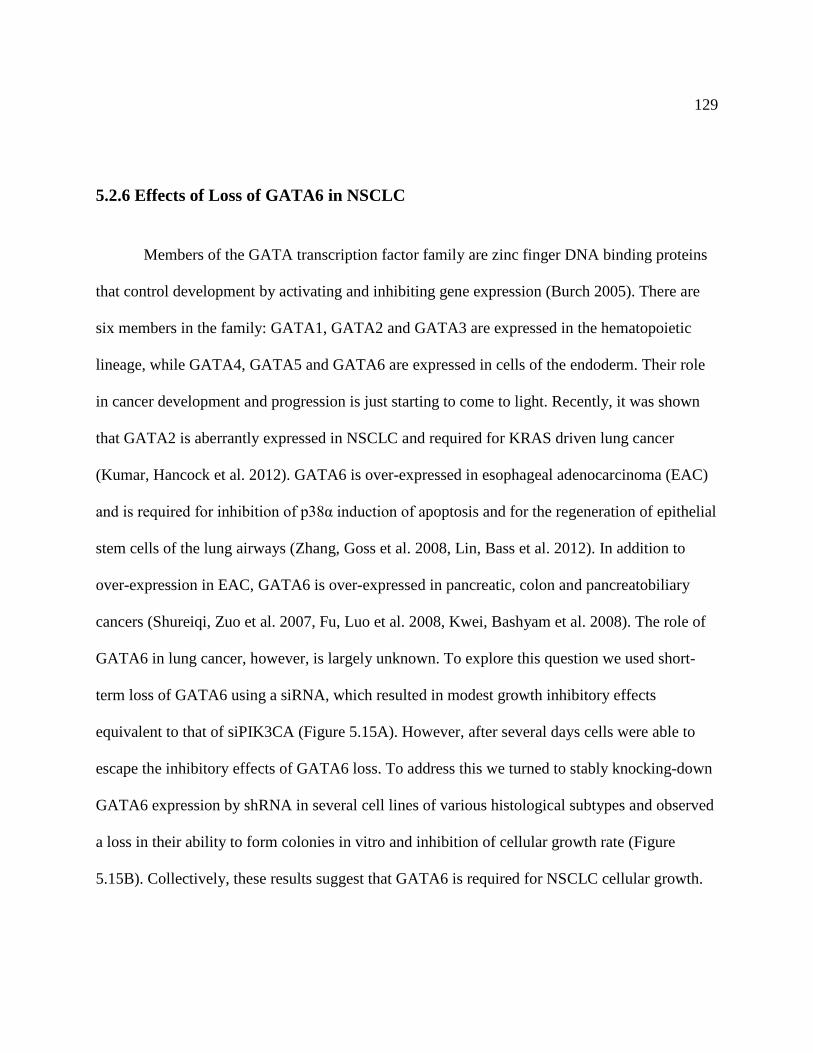
129
5.2.6 Effects of Loss of GATA6 in NSCLC
Members of the GATA transcription factor family are zinc finger DNA binding proteins
that control development by activating and inhibiting gene expression (Burch 2005). There are
six members in the family: GATA1, GATA2 and GATA3 are expressed in the hematopoietic
lineage, while GATA4, GATA5 and GATA6 are expressed in cells of the endoderm. Their role
in cancer development and progression is just starting to come to light. Recently, it was shown
that GATA2 is aberrantly expressed in NSCLC and required for KRAS driven lung cancer
(Kumar, Hancock et al. 2012). GATA6 is over-expressed in esophageal adenocarcinoma (EAC)
and is required for inhibition of p38α induction of apoptosis and for the regeneration of epithelial
stem cells of the lung airways (Zhang, Goss et al. 2008, Lin, Bass et al. 2012). In addition to
over-expression in EAC, GATA6 is over-expressed in pancreatic, colon and pancreatobiliary
cancers (Shureiqi, Zuo et al. 2007, Fu, Luo et al. 2008, Kwei, Bashyam et al. 2008). The role of
GATA6 in lung cancer, however, is largely unknown. To explore this question we used short-
term loss of GATA6 using a siRNA, which resulted in modest growth inhibitory effects
equivalent to that of siPIK3CA (Figure 5.15A). However, after several days cells were able to
escape the inhibitory effects of GATA6 loss. To address this we turned to stably knocking-down
GATA6 expression by shRNA in several cell lines of various histological subtypes and observed
a loss in their ability to form colonies in vitro and inhibition of cellular growth rate (Figure
5.15B). Collectively, these results suggest that GATA6 is required for NSCLC cellular growth.
130
FIGURE 5.15 Loss of GATA6 Inhibits Growth and Colony Formation In NSCLC. A. siRNA-mediated silencing of GATA6 resulted in modest growth inhibition. B. Stable loss of GATA inhibited colony formation, leading to an 80% loss in H460 cells. ****, p < 0.0001 by unpaired two-tailed t-test. C. Loss of GATA6 across several histological subtypes. ****, p < 0.0001; ***, p = 0.0003 (H1975 cells), p = 0.0001 (H1155, H1650 and H157 cells).
131
5.4 Discussion
We have identified miR-10a as a novel regulator of the PI3K pathway both by directly
interacting with the PIK3CA 3’UTR and indirectly via regulation of GATA6, a novel
transcription factor that activates PIK3CA expression (Figure 5.16). The PIK3CA 3’UTR is
highly conserved among mammals but extremely short, with only three conserved miRNA
recognition sites. Following a bioinformatics approach, we identified miR-10a as a candidate
regulator of PIK3CA. We have previously shown that miR-10a is a associated with recurrence-
free survival in white male smokers. Unlike other miRNAs located in the HOX clusters, it is
down-regulated in several types of cancer (Figure 4.14A-B, 4.4A-B and data not shown). In lung
cancer patients, however, miR-10a does not appear to be down-regulated in tumors compared to
NAT (Figure 4.4C) This could be due to the stage at which the samples were taken: In urothelial
carcinomas, for example, miR-10a expression is high only during the early stages of
development, specifically when the carcinoma is confined to the inner lining of the bladder wall.
It is worth noting that a majority of these carcinomas exhibit activation of Fibroblast growth
Factor Receptor 3 (FGFR3), which is directly upstream of the PI3K/AKT signaling axis,
potentially indicating that the expression increase observed in miR-10a may be an attempt by the
cell to inhibit the PI3K/AKT pathway (Veerla, Lindgren et al. 2009). We could be observing
similar inhibitory or stimulatory effects of PI3K/GATA6 on miR-10a. Currently, investigating
the potential regulation of miR-10a by GATA6 as the promoter of miR-10a does have several
GATA binding elements.
132
To test our hypothesis that miR-10a regulates PI3K, we transfected H1155 and H460
cells with both miR-10a inhibitor and mimic and observed PIK3CA levels vary inversely with
the perturbations. There are three other miRNAs to consider: the two other conserved predicted
miRNA target sites in the PI3KCA 3’UTR and the other miR-10 family member, miR-10b, that
could act as part of a PI3K regulatory network similar to what has been described with PTEN
(Salmena, Poliseno et al. 2011). After testing all three miRNAs, only miR-10a was able to
reduce PIK3CA levels. This finding was expanded to lung cancer cell lines of various
histological subtypes and breast and colon cell lines most of which contained activating PIK3CA
mutations. We consistently observed a 50% reduction in PIK3CA levels using miR-10a mimic
and a two- to three-fold increase in PIK3CA when miR-10a levels were reduced. At the protein
level, miR-10a mimic was able to reduce PI3K 50%, and this reduction was sufficient to
completely inhibit downstream signaling. Phosphorylation of AKT atThr308, which is catalyzed
by PDK1, was completely lost. This resulted in the loss of phosphorylation of mTOR at Ser2448,
which is directly phosphorylated by AKT. Reduced activation of mTOR further inhibited
signaling as loss of phosphorylation at AKT Ser473 was also observed. Our mRNA results
demonstrated that loss of miR-10a would increase both PIK3CA and PI3K levels we observed a
larger increase in PI3K then was observed with PIK3CA, this resulted in dramatic pathway
activation determined by the increase in AKT Ser473 phosphorylation. To confirm that miR-10a
was in fact directly regulating PI3K levels we cloned the entire 3’UTR of PIK3CA into the
pMIR-Glo construct. Consistent with our previous findings miR-10a manipulations were able to
change luciferase levels in the opposite direction and we were able to rescue this effect by
133
mutating several base pairs in the seed sequence. Collectively, these results demonstrate that
miR-10a directly regulates PI3K levels and is sufficient to inhibit the PI3K/AKT/mTOR
pathway.
Activation of the PI3K pathway has been implicated in resistance to targeted EGFR and
HER2, radiation and chemotherapy (Mikhail Krasilnikov1 1999, West, Sianna Castillo et al.
2002). It is therefore unsurprising that upon inhibiting PI3K using a siRNA, shRNA, small
molecule or miR-10a mimic we were able to sensitize NSCLC to paclitaxel treatment. While we
did achieve sensitivity to paclitaxel treatment using various inhibitors of PI3K, we were never
able to achieve an effect as large as that observed with over-expression of miR-10a, suggesting
that co-reduction of other miR-10a target genes must be contributing to paclitaxel sensitivity.
We had previously observed that miR-10a was able to modulate growth levels in several
cell lines that were being tested for changes in cellular response to paclitaxel. Following use of a
kinetic assay for growth rate, we observed significant growth inhibitory effects when cells were
treated with miR-10a mimic. miR-10a was as efficient as the toxic control at inhibiting NSCLC
growth rates, while inhibiting miR-10a was able to accelerate growth rate. Interestingly, loss of
miR-10b inhibited growth in H460 cells. miR-10b is expressed at very low levels, suggesting
that low levels of miR-10b are selected for during tumorigenesis. Expanding on our short-term
assay, we moved to the longer-term colony formation and again observed that miR-10a was able
to influence growth in the opposite direction; high miR-10a inhibited colony formation and loss
of miR-10a induced colony formation. We were able to confirm the growth inhibitory effects of
134
miR-10a using a stable expression vector. Only a five-fold increase in miR-10a was able to
drastically affect colony formation; the observed growth inhibitory effect of miR-10a was a
result of its ability to induce apoptosis. Collectively these finding suggest that miR-10a is an
important mediator of growth rate in NCSCLC.
Finally, we were able to show that miR-10a also indirectly regulates PI3K through
regulation of GATA6, and that GATA6 is important in NSCLC cellular survival. While GATA6
is expressed at relatively low levels across our panel of cell lines, it was the only GATA family
member that showed a positive correlation with PIK3CA expression. Furthermore, it appears that
GATA6 and PI3K act in a regulatory feedback loop. Additionally, we discovered that GATA6
expression is important in several cell lines among the NSCLC panel. We tested stable loss in
H460, H2009, HCC827, H157, H1975, H1650 and H1155 cell lines; in each cell line following
GATA6 loss there was a large reduction in cellular viability, as shown by the inability to form
colonies in vitro. However, we did not observe any change in response to paclitaxel following
GATA6 loss.
In contrast to our findings, a recent report indicated that GATA6 is a mediator of
metastasis in adenocarcinoma (Cheung, Zhao et al. 2013, Cheung, Zhao et al. 2013). This would
predict that … However, we were unable to reproduce these results and consistently found that
loss of GATA6 inhibited colony formation and inhibited cellular growth. Additionally, GATA6
has been shown to activate vascular cell adhesion molecule-1, VCAM1. This interaction is
inhibited by PTEN, in line with recent reports of PTEN nuclear function (Shen, Balajee et al.
2007, Tsoyi, Jang et al. 2010). Finally, VCAM1 is known to activate the PI3K/AKT pathway,

135
supporting our finding of PI3K regulation of GATA6 in a feed-forward system (Chen, Zhang et
al. 2011) . Furthermore, our finding of GATA6 regulation of PI3K and the importance of PI3K
in cellular metabolism was independently confirmed. The GATA6 expression signature was
associated with mitochondrial activities connected to cellular oxidative phosphorylation (Kwei,
Bashyam et al. 2008). Interestingly, GATA6 expression was positively correlated with that of
ALDH1A1. ALDH+ cells are presumed to be lung cancer stem cells and show increased
clonogenicity and tumorigenicity (Sullivan, Spinola et al. 2010). Collectively, these results
demonstrate the importance of GATA6 in NSCLC. One potential explanation for the dramatic
disagreement of phenotypes is that while GATA6 is important for the bulk of the population of
cells, the subset that is able to survive GATA6 loss or do not express GATA6 is more metastatic.
Additionally, the invasive and metastatic phenotype observed was dependent on both GATA6
and HOPX, as neither one alone had any significant effect(Cheung, Zhao et al. 2013) . However,
further testing of this theory is needed.
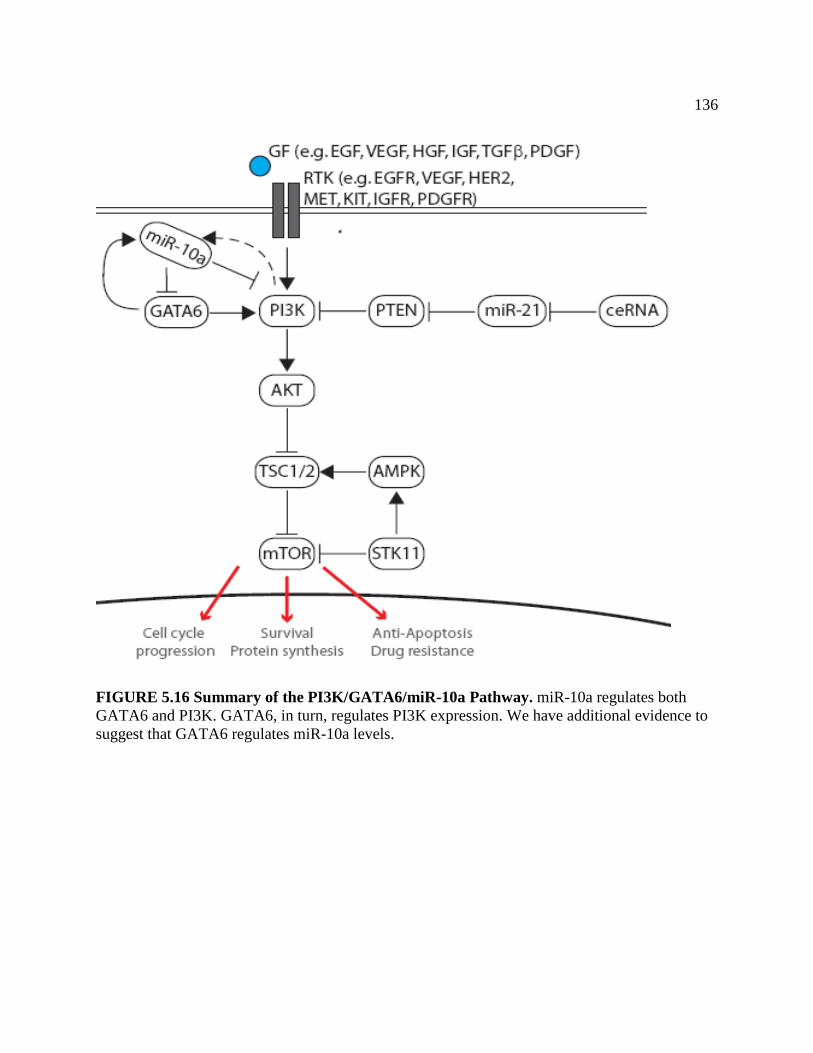
136
FIGURE 5.16 Summary of the PI3K/GATA6/miR-10a Pathway. miR-10a regulates both GATA6 and PI3K. GATA6, in turn, regulates PI3K expression. We have additional evidence to suggest that GATA6 regulates miR-10a levels.
137
CHAPTER SIX MIR-10A REGULATION OF NSCLC STEM CELLS THROUGH MODULATION OF THE WNT PATHWAY
6.1 Introduction
Lung cancer’s high mortality rate is due to its remarkable ability to relapse despite
complete disease regression. This suggests that there is a population of cells that is inherently
resistant to treatment, phenotypically distinct from the bulk of the tumor mass, that gives rise to
the heterogeneity observed in histological samples. This is the basis of the cancer stem cell
model. Akin to organogenesis, cancer has a hierarchy, which consists of ultimately non-
tumorgenic, terminally differentiated cells, and a minority population of progenitor “tumor-
initiating” cells. This was first described over 30 years ago with only a small fraction of NSCLC
patient tumor samples possessed the ability to form tumors in mice (Salk, Fox et al. 2010,
Sullivan, Minna et al. 2010). Since their identification, the stem cell fraction can be enriched
using basic flow cytometry based on the presence of cell surface markers or metabolic enzymes.
CD133 was used to identify the stem cell population of brain tumor samples and has
since been expanded to include melanoma, breast, prostate and lung cancers (Sheila K. Singh
2003, Alamgeer, Peacock et al. 2013). The CD133+ fraction of cultured cells exhibit resistance
to platinum-based therapies and is enriched for genes known to play a role in metastasis (Levina,
Marrangoni et al. 2008). However, several reports have described that CD133- cells can give rise

138
to CD133+ cells and that both cell types can give rise to tumors and produce metastatic lesions
(Wang, Sakariassen et al. 2008). Efforts devoted to exploring additional markers uncovered
aldehyde dehydrogenase (ALDH) activity as a marker for stem cell populations. In NSCLC, the
ALDH+ cell fraction demonstrates self-renewal, serial transplantation, resistance to therapy, and
increased tumorigenicity (Liu, Yuan et al. 2006, Sullivan, Spinola et al. 2010).
The ALDH family is composed of 19 distinct isozymes that catalyze the oxidation of
aldehydes generated from cellular metabolism or detoxification (Volinia, Calin et al. 2006)
(Calin et al. 2006, Stark, Brennecke et al. 2005, Chin, Pomerantz et al. 1998, Kim, Yeo et al.
2012) to maintain a state of stemness. Cells that are enriched in ALDH activity have been shown
to be more resistant to platinum treatment and exhibit gene expression profiles suggesting
enhanced metastatic potential. Early work on ALDH enzymes in the hematopoietic system found
that they maintain a state of undifferentiation through the oxidation of retinol to retinoic acid
(Chute, Muramoto et al. 2006). Increased ALDH expression and activity have been found in
stem cell populations of tumor of the brain, breast, and certain leukemia’s (William Matsui 2003,
Chute, Muramoto et al. 2006). Two isoforms, ALDH1A1 and ALDH3A1 were reported to be
highly expressed in NSCLC cell lines, it was later discovered that ALDH protein was elevated in
NSCLC patients samples with a history of smoking (Alamgeer, Peacock et al. 2013). Finally, the
ALDH+ fraction of NSCLC cell lines is more clonogenic and tumorigenic then their ALDH-
counterparts, and high ALDH1A1 levels are indicative of reduced overall patient survival
(Sullivan, Spinola et al. 2010).

139
Differential gene expression analysis between ALDH+ and ALDH- cells revealed that
ALDH1A3 is most highly expressed in ALDH+ cells and completely absent in ALDH- cells
(Figures 6.1 & 6.2A). It was experimentally proven that ALDH1A3 is the predominant isoform
among NSCLC cell lines as loss of expression of ALDH1A3 completely removed the ALDH+
cell population, e (Figure 6.2B). Finally, loss of ALDH1A3 expression inhibits growth both in
vitro and in vivo (Figure 6.3A-B).
While improved understanding of the signaling pathways maintaining cancer stem cells has led
to novel therapeutic approaches and improved clinical responses (Takebe, Harris et al. 2011), ,
the role of miRNAs in the regulation of cancer stem cells has not been explored. Our previous
work on miR-10a as a modulator of paclitaxel response through its regulation of the PI3K
pathway both directly and indirectly through interaction with GATA6 has demonstrated its
importance in lung cancer.miR-10a is a miRNA located in the HOX cluster of genes, which is
known to be important for the development of the body plane along the anterior-posterior axis
active during embryogenesis (Yekta, Shih et al. 2004). Additionally, miR-10a is induced by all-
trans-retinoic acid (ATRA), clinically used to induce differentiation in neuroblastoma and acute
promyelocytic leukemia (Agirre, Jimenez-Velasco et al. 2008, Foley, Bray et al. 2011). Given
miR-10a location in a developmental gene cluster and its induction by an inducer of
differentiation we hypothesize that miR-10a may be critical for the differentiation of lung cancer
stem cells into terminally differentiated, non-dividing cells.
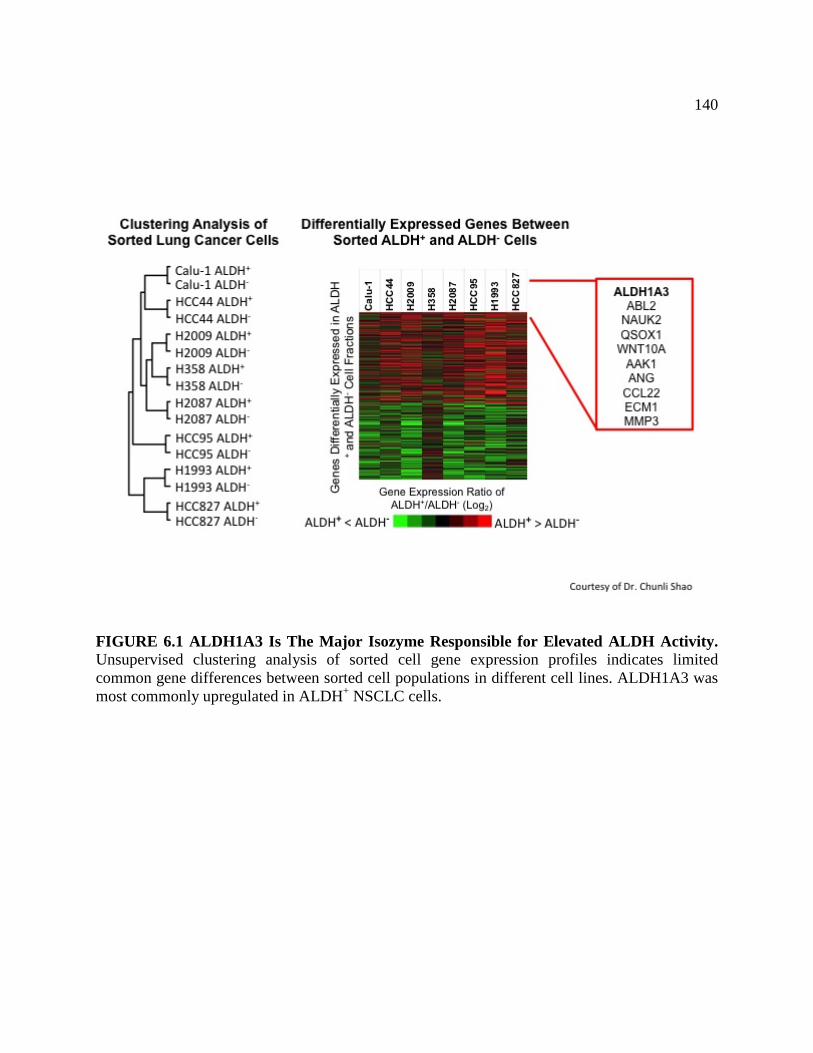
140
FIGURE 6.1 ALDH1A3 Is The Major Isozyme Responsible for Elevated ALDH Activity. Unsupervised clustering analysis of sorted cell gene expression profiles indicates limited common gene differences between sorted cell populations in different cell lines. ALDH1A3 was most commonly upregulated in ALDH+ NSCLC cells.

141
FIGURE 6.2 ALDH1A3 Protein is Enriched in ALDH+ Cells and is Responsible for the ALDH+ Population of Cells. A. ALDH1A3 protein is enriched in ALDH+ cell fraction. B. shRNA mediated loss of ALDH1A3 reduces the ALDH+ population. Courtesy of Dr. Chunli Shao.
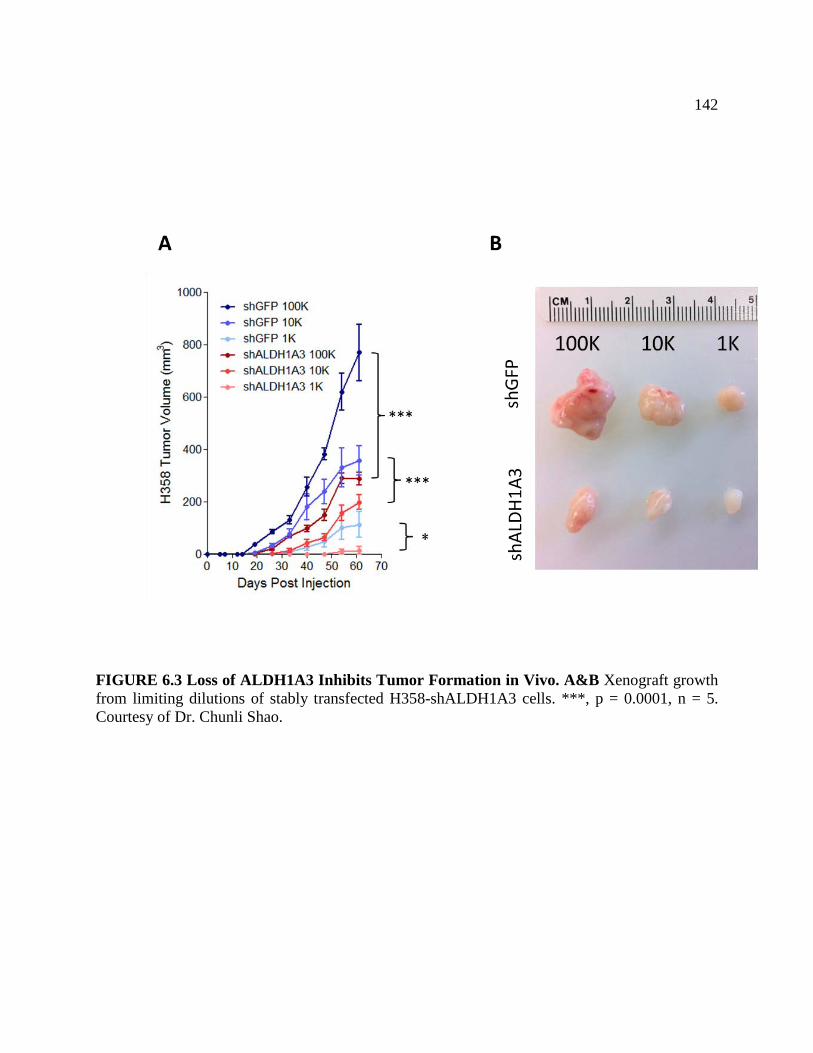
142
FIGURE 6.3 Loss of ALDH1A3 Inhibits Tumor Formation in Vivo. A&B Xenograft growth from limiting dilutions of stably transfected H358-shALDH1A3 cells. ***, p = 0.0001, n = 5. Courtesy of Dr. Chunli Shao.
143
6.2 Results
6.2.1Regulation of ALDH1A3 Levels and Activity by miR-10a
To discover novel pathways regulated by miR-10a in NSCLC, we performed expression
profiling on H460 cells which had been transiently treated with miR-10a mimic. Among the
most down-regulated genes was ALDH1A3 (Figure 6.4A), which is of particular interest given
that loss of expression in NSCLC abolishes ALDH activity and inhibits tumor formation in mice.
To confirm this finding, we validated the array results using taq-man probe for ALDH1A3 and
expanded our finding across several cell lines (Figure 6.4B). However, H460 cells have a very
small ALDH+ population (data not shown). Thus, to increase the signal space we used H2009
cells, which have a larger ALDH+ population and showed reduction of ALDH1A3 mRNA and
protein upon miR-10a treatment (Figure 6.4B-D). To confirm that loss of ALDH1A3 mRNA and
protein resulted in functional changes we employed the Aldefluor assay, which has been used to
identify ALDH+ cells in various tumor types (Christophe Ginestier1, Julie Dutcher1 et al. ,
Ginestier, Hur et al. 2007, Huang, Hynes et al. 2009) and observed a significant reduction in
ALDH+ cells treated with miR-10a mimic (Figure 6.4E). Taken together, these findings suggest
that miR-10a regulates lung cancer stem cells (CSC) as defined by the ALDH+ sub-population.
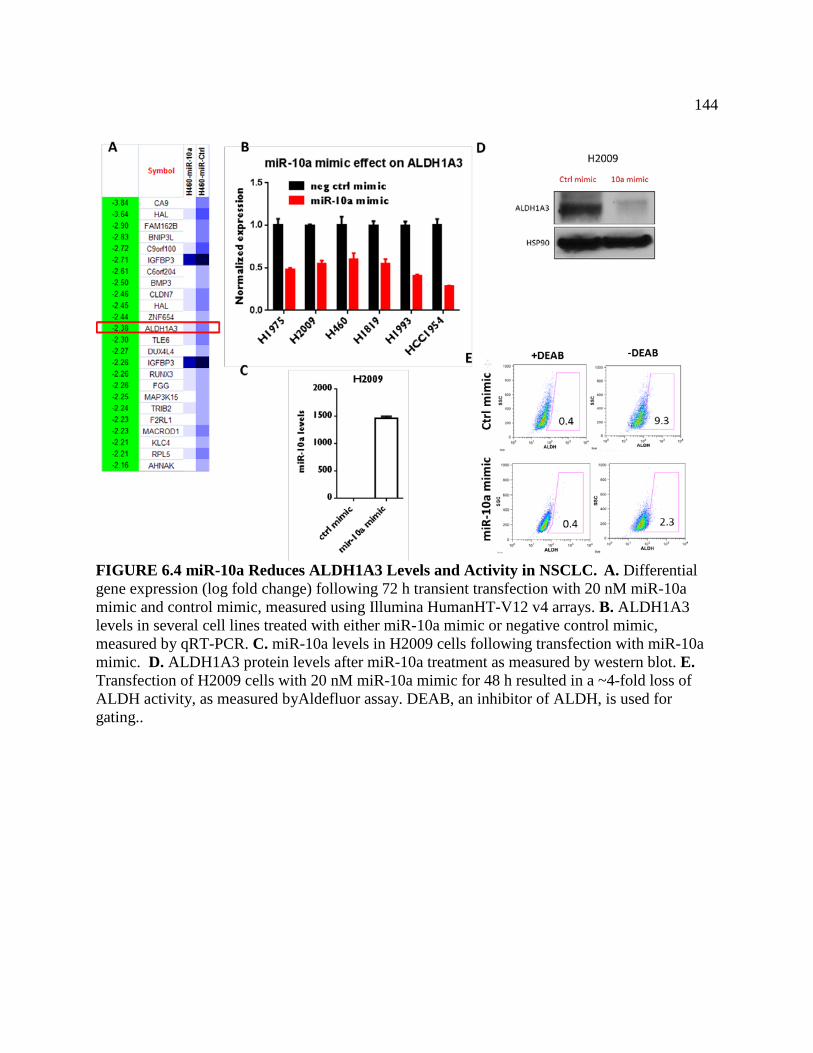
144
FIGURE 6.4 miR-10a Reduces ALDH1A3 Levels and Activity in NSCLC. A. Differential gene expression (log fold change) following 72 h transient transfection with 20 nM miR-10a mimic and control mimic, measured using Illumina HumanHT-V12 v4 arrays. B. ALDH1A3 levels in several cell lines treated with either miR-10a mimic or negative control mimic, measured by qRT-PCR. C. miR-10a levels in H2009 cells following transfection with miR-10a mimic. D. ALDH1A3 protein levels after miR-10a treatment as measured by western blot. E. Transfection of H2009 cells with 20 nM miR-10a mimic for 48 h resulted in a ~4-fold loss of ALDH activity, as measured byAldefluor assay. DEAB, an inhibitor of ALDH, is used for gating..
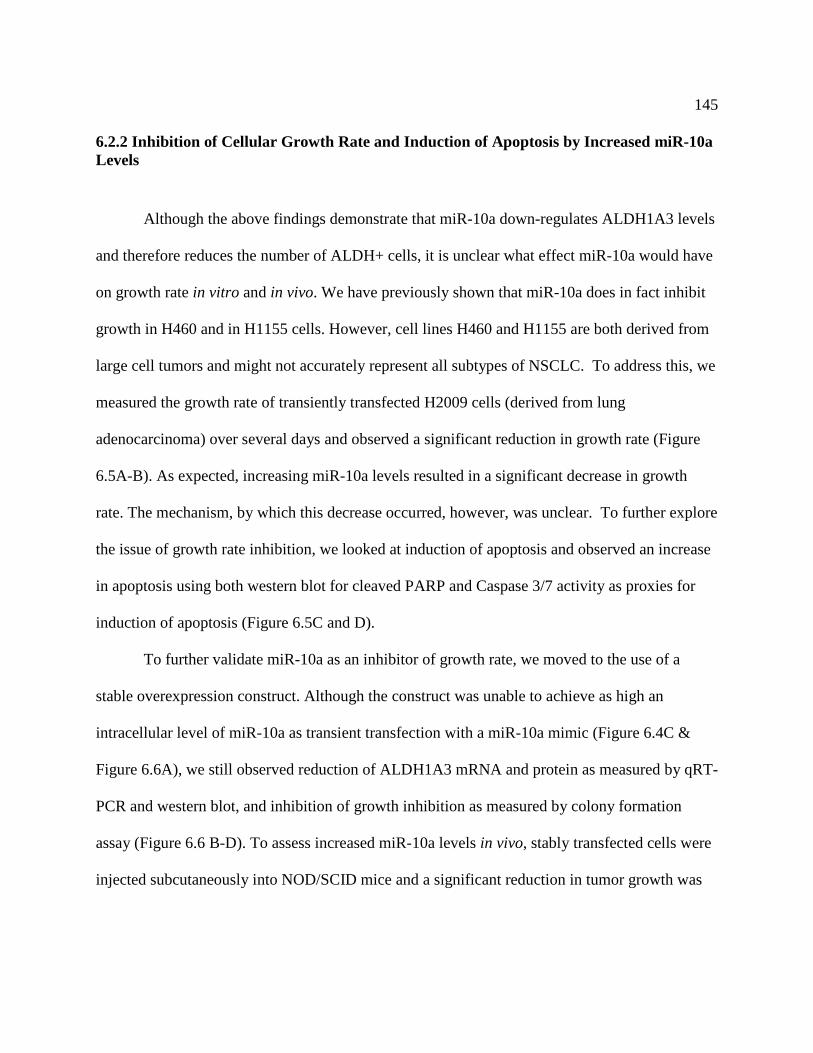
145
6.2.2 Inhibition of Cellular Growth Rate and Induction of Apoptosis by Increased miR-10a Levels
Although the above findings demonstrate that miR-10a down-regulates ALDH1A3 levels
and therefore reduces the number of ALDH+ cells, it is unclear what effect miR-10a would have
on growth rate in vitro and in vivo. We have previously shown that miR-10a does in fact inhibit
growth in H460 and in H1155 cells. However, cell lines H460 and H1155 are both derived from
large cell tumors and might not accurately represent all subtypes of NSCLC. To address this, we
measured the growth rate of transiently transfected H2009 cells (derived from lung
adenocarcinoma) over several days and observed a significant reduction in growth rate (Figure
6.5A-B). As expected, increasing miR-10a levels resulted in a significant decrease in growth
rate. The mechanism, by which this decrease occurred, however, was unclear. To further explore
the issue of growth rate inhibition, we looked at induction of apoptosis and observed an increase
in apoptosis using both western blot for cleaved PARP and Caspase 3/7 activity as proxies for
induction of apoptosis (Figure 6.5C and D).
To further validate miR-10a as an inhibitor of growth rate, we moved to the use of a
stable overexpression construct. Although the construct was unable to achieve as high an
intracellular level of miR-10a as transient transfection with a miR-10a mimic (Figure 6.4C &
Figure 6.6A), we still observed reduction of ALDH1A3 mRNA and protein as measured by qRT-
PCR and western blot, and inhibition of growth inhibition as measured by colony formation
assay (Figure 6.6 B-D). To assess increased miR-10a levels in vivo, stably transfected cells were
injected subcutaneously into NOD/SCID mice and a significant reduction in tumor growth was

146
observed (Figure 6.7). Collectively, these results indicated that miR-10a is a potent inhibitor of
cancer cell growth both in vitro and in vivo.
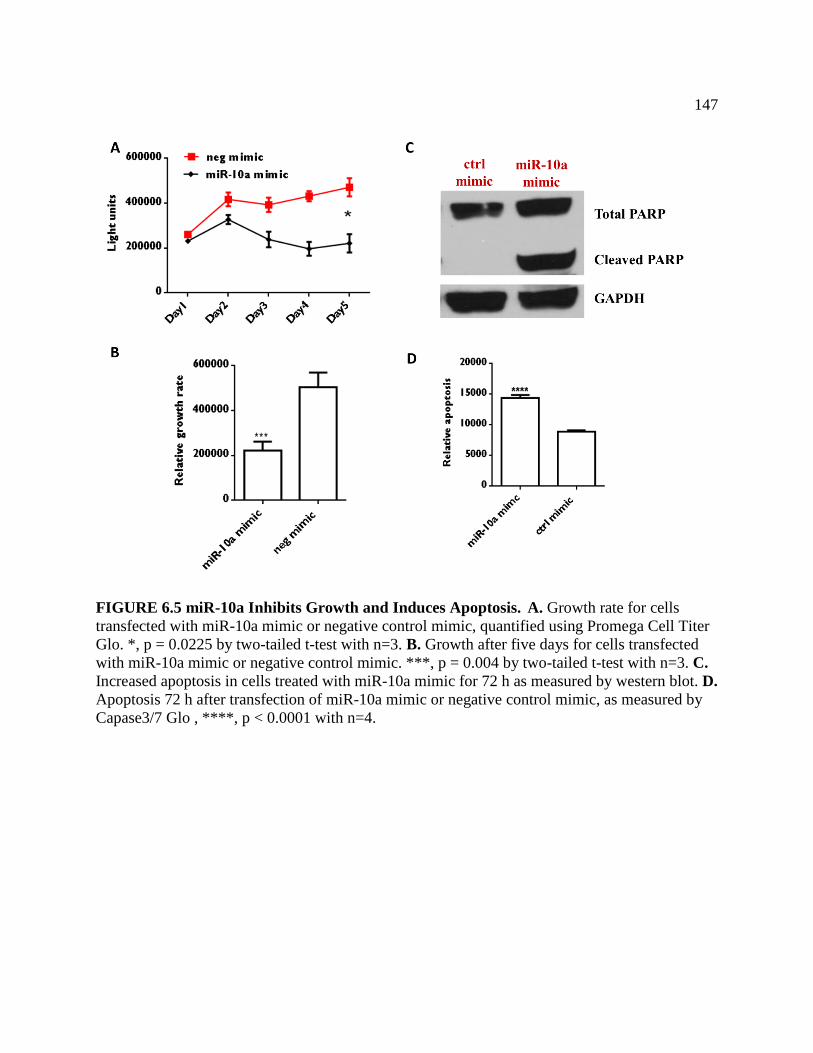
147
FIGURE 6.5 miR-10a Inhibits Growth and Induces Apoptosis. A. Growth rate for cells transfected with miR-10a mimic or negative control mimic, quantified using Promega Cell Titer Glo. *, p = 0.0225 by two-tailed t-test with n=3. B. Growth after five days for cells transfected with miR-10a mimic or negative control mimic. ***, p = 0.004 by two-tailed t-test with n=3. C. Increased apoptosis in cells treated with miR-10a mimic for 72 h as measured by western blot. D. Apoptosis 72 h after transfection of miR-10a mimic or negative control mimic, as measured by Capase3/7 Glo , ****, p < 0.0001 with n=4.
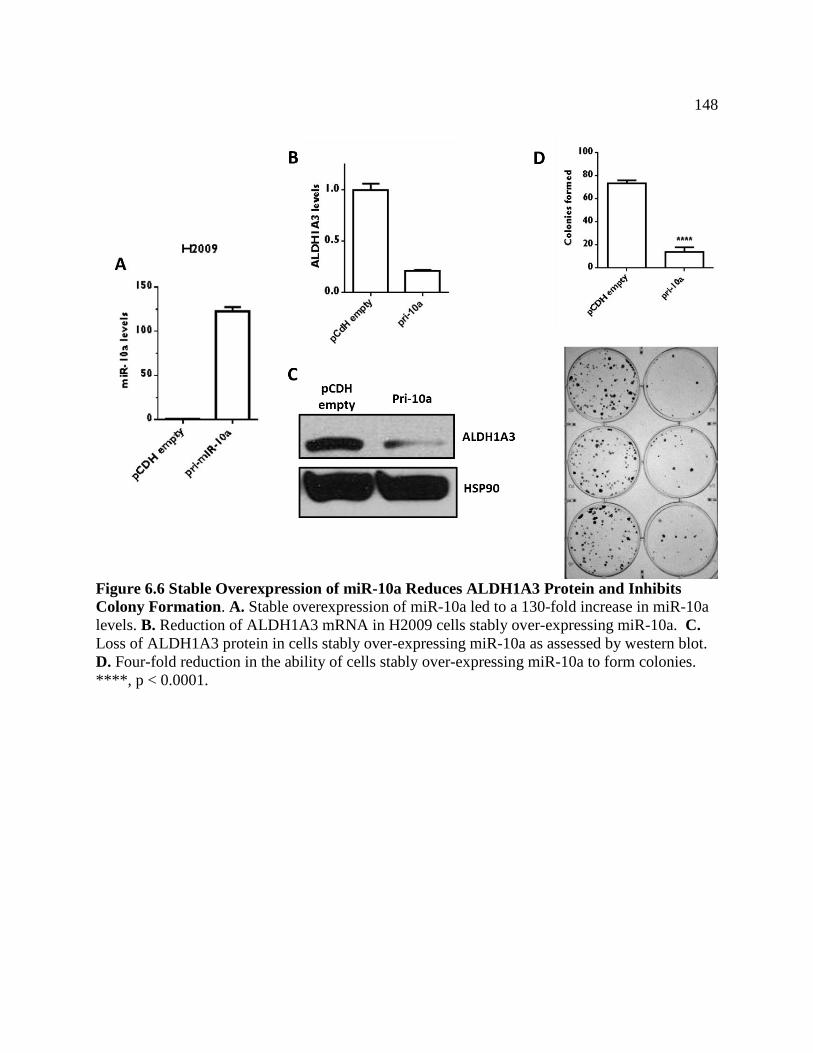
148
Figure 6.6 Stable Overexpression of miR-10a Reduces ALDH1A3 Protein and Inhibits Colony Formation. A. Stable overexpression of miR-10a led to a 130-fold increase in miR-10a levels. B. Reduction of ALDH1A3 mRNA in H2009 cells stably over-expressing miR-10a. C. Loss of ALDH1A3 protein in cells stably over-expressing miR-10a as assessed by western blot. D. Four-fold reduction in the ability of cells stably over-expressing miR-10a to form colonies. ****, p < 0.0001.
149
Figure 6.7 Stable Overexpression of miR-10a Inhibits in vivo Tumor Growth. A. Tumor volumes. Stable over-expression of miR-10a inhibited tumor growth in vivo. *, p = 0.0353, n=5. B. Tumor weights. Average weight for miR-10a over-expressing tumors was 0.4720 g ± 0.218 g; average weight for controls was 1.704 g ± 0.3278 g. *, p = 0.0141 as assessed by two-tailed t-test with n=5. C. pri-miR-10a tumors. D. pCDH control tumors. Ruler measurements are in cm.
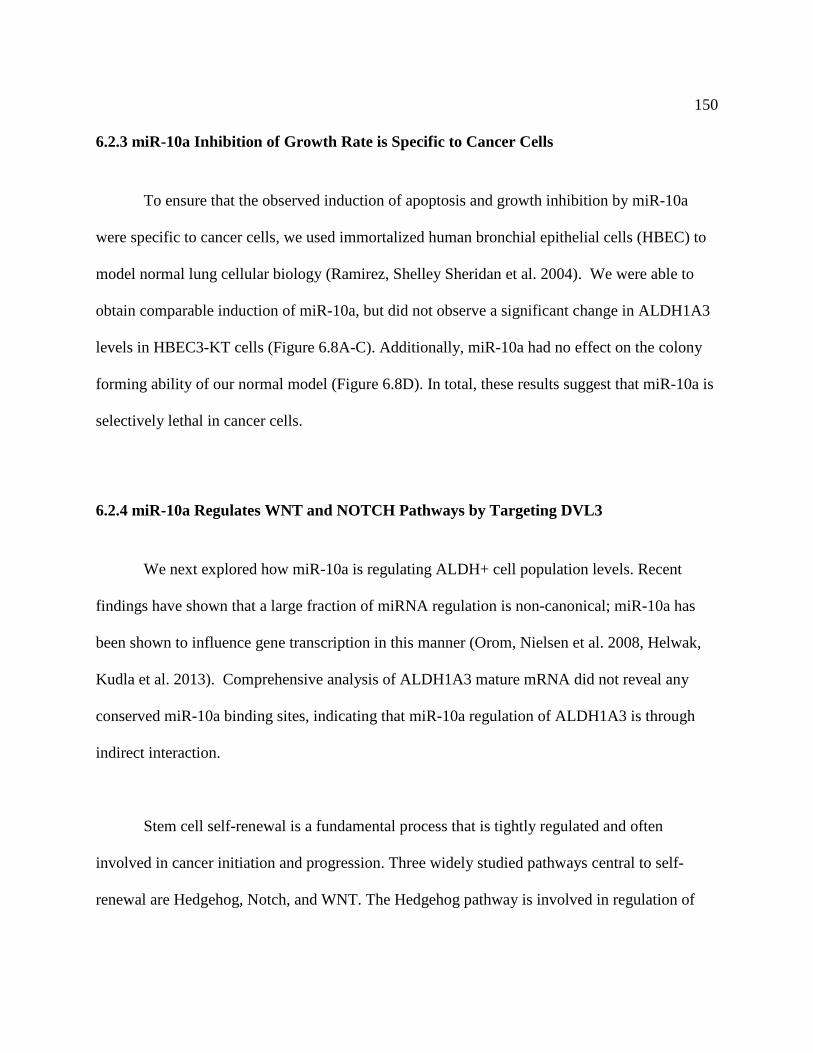
150
6.2.3 miR-10a Inhibition of Growth Rate is Specific to Cancer Cells
To ensure that the observed induction of apoptosis and growth inhibition by miR-10a
were specific to cancer cells, we used immortalized human bronchial epithelial cells (HBEC) to
model normal lung cellular biology (Ramirez, Shelley Sheridan et al. 2004). We were able to
obtain comparable induction of miR-10a, but did not observe a significant change in ALDH1A3
levels in HBEC3-KT cells (Figure 6.8A-C). Additionally, miR-10a had no effect on the colony
forming ability of our normal model (Figure 6.8D). In total, these results suggest that miR-10a is
selectively lethal in cancer cells.
6.2.4 miR-10a Regulates WNT and NOTCH Pathways by Targeting DVL3
We next explored how miR-10a is regulating ALDH+ cell population levels. Recent
findings have shown that a large fraction of miRNA regulation is non-canonical; miR-10a has
been shown to influence gene transcription in this manner (Orom, Nielsen et al. 2008, Helwak,
Kudla et al. 2013). Comprehensive analysis of ALDH1A3 mature mRNA did not reveal any
conserved miR-10a binding sites, indicating that miR-10a regulation of ALDH1A3 is through
indirect interaction.
Stem cell self-renewal is a fundamental process that is tightly regulated and often
involved in cancer initiation and progression. Three widely studied pathways central to self-
renewal are Hedgehog, Notch, and WNT. The Hedgehog pathway is involved in regulation of
151
proliferation, migration and differentiation of progenitor cells and is not active in adult tissue
(Merchant and Matsui 2010). Notch is frequently involved in cell fate determination of the
proximal and distal epithelial cell fates of the normal lung (Pannuti, Foreman et al. 2010). WNT
are a family of secreted glycoproteins that regulate proliferation, survival, migration and polarity,
and self-renewal (Reya and Clevers 2005). Work in our lab and other labs has shown the
importance of the NOTCH and WNT pathways on the maintenance of ALDH+ cells (Reya and
Clevers 2005, Androutsellis-Theotokis, Leker et al. 2006, Sullivan, Spinola et al. 2010);
however, little is known about Hedgehog signaling in maintaining the ALDH+ cell fraction in
NSCLC.
To test our whether miR-10a regulated the NOTCH, WNT or Hedgehog pathway; we
evaluated downstream signaling components of each pathway as representation of miR-10a
regulation. We observed significant downregulation of NOTCH and WNT pathways following
miR-10a transfections; however, no change in Hedgehog signaling was observed (Figure 6.10A).
Surveying target predictions for conserved miR-10a targets in the WNT and NOTCH pathways,
we uncovered potential pathway regulation through Dishevelled 3 (DVL3) (Figure 6.10B).
Once the WNT glycoprotein is secreted, it binds to the Frizzled (Fz) receptor. This
interaction then recruits the intracellular Dishevelled (DVL3) family of proteins. DVL directly
interacts with the Fz receptor propagating the WNT signal allowing for the stabilization of beta-
catenin, which then translocates to the nucleus activating downstream components (Clevers and
Nusse 2012). There are three DVL family members — DVL1, DVL2 and DVL3 — that are
152
expressed in both embryonic and adult tissues. DVL3 has been found to be overexpressed in
75% of NSCLC tumor specimens. Inhibition of its expression using a siRNA in H1703, a
NSCLC cell line known to have activated beta catenin, resulted in growth inhibition (Uematsu,
Kanazawa et al. 2003). The docking of DVL3 to Fz occurs through interaction of the PDZ
domain of DVL and is currently being explored in the context of targeted therapy (Uematsu,
Kanazawa et al. 2003, Grandy, Shan et al. 2009). Given the potential importance of DVL3, we
compared its expression in ALDH+ relative to ALDH- cells and saw increased levels of both
DVL3 mRNA and protein in ALDH+ cells, while no significant difference in miR-10a levels
was observed (Figure 6.10 C-E). Further supporting increased WNT signaling in the ALDH+
cell fraction, our differential gene expression analysis showed that WNT10a is highly expressed
in ALDH+ cells compared to ALDH- cells (Figure 6.1).
To test our hypothesis that miR-10a depletion of ALDH+ cell population is dependent on
DVL3, we measured DVL3 mRNA and protein following transfection of miR-10a mimic. Both
mRNA and protein were dramatically reduced following miR-10a treatment (Figure 6.11 A-B).
To confirm a direct interaction, we cloned a large portion of the DVL3 3’UTR downstream of
the luciferase CDS and observed a substantial reduction in luciferase activity in cells co-
transfected with miR-10a, a reduction that we were able to rescue through mutagenesis of the
seed sequence (Figure 6.11 C-D). Taken together, these results suggest that miR-10a directly
regulates DVL3 expression.
153
FIGURE 6.8 miR-10a Does Not Affect ALDH1A3 Levels or Colony Formation Ability in HBEC3-KT. A. Induction of miR-10a following transfection in H2009 cells. B. miR-10a had no effect on ALDH1A3 mRNA levels. C. miR-10a did not affect ALDH1A3 protein levels. D. Over expression of miR-10a had no effect on colony formation.

154
FIGURE 6.9 Induction of miR-10a Leads to a Reduction of WNT and NOTCH Signaling Through Potential Interaction with DVL3. A. Transfection of miR-10a mimic resulted in a ~75% reduction in AXIN2, an ~80% reduction in HES1, and a ~45% reduction in HEY1. Axin **, p = 0.0088; HES1 **, p = 0.0045; HEY1 **, p = 0.0019; by two- tailed t-test with n=3. B. Sequence alignment of miR-10a and the DVL3 3’UTR. The highlighted region is the seed sequence. Binding energy of the interaction is shown below the alignment. C. DVL3 levels in ALDH+ cells compared to ALDH- cells. D. DVL3 protein is enriched in ALDH+ cells relative to ALDH- cells, as measured by western blot. E. miR-10a levels are equivalent in both populations of cells.
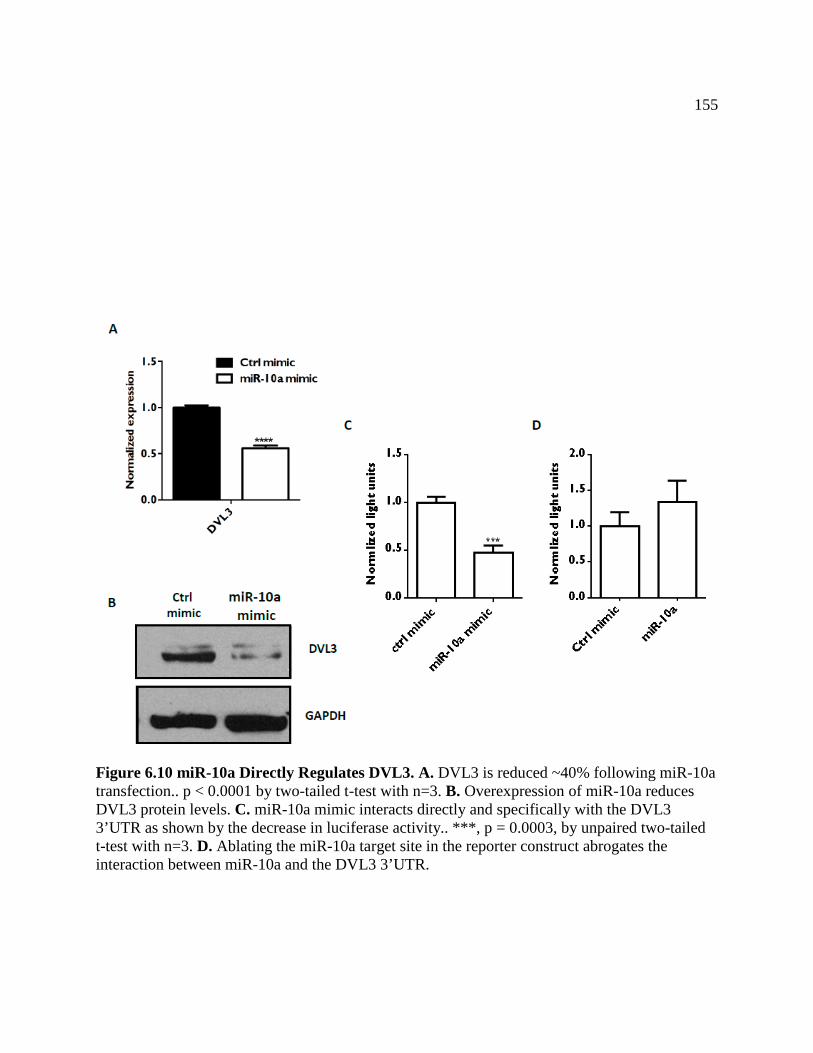
155
Figure 6.10 miR-10a Directly Regulates DVL3. A. DVL3 is reduced ~40% following miR-10a transfection.. p < 0.0001 by two-tailed t-test with n=3. B. Overexpression of miR-10a reduces DVL3 protein levels. C. miR-10a mimic interacts directly and specifically with the DVL3 3’UTR as shown by the decrease in luciferase activity.. ***, p = 0.0003, by unpaired two-tailed t-test with n=3. D. Ablating the miR-10a target site in the reporter construct abrogates the interaction between miR-10a and the DVL3 3’UTR.
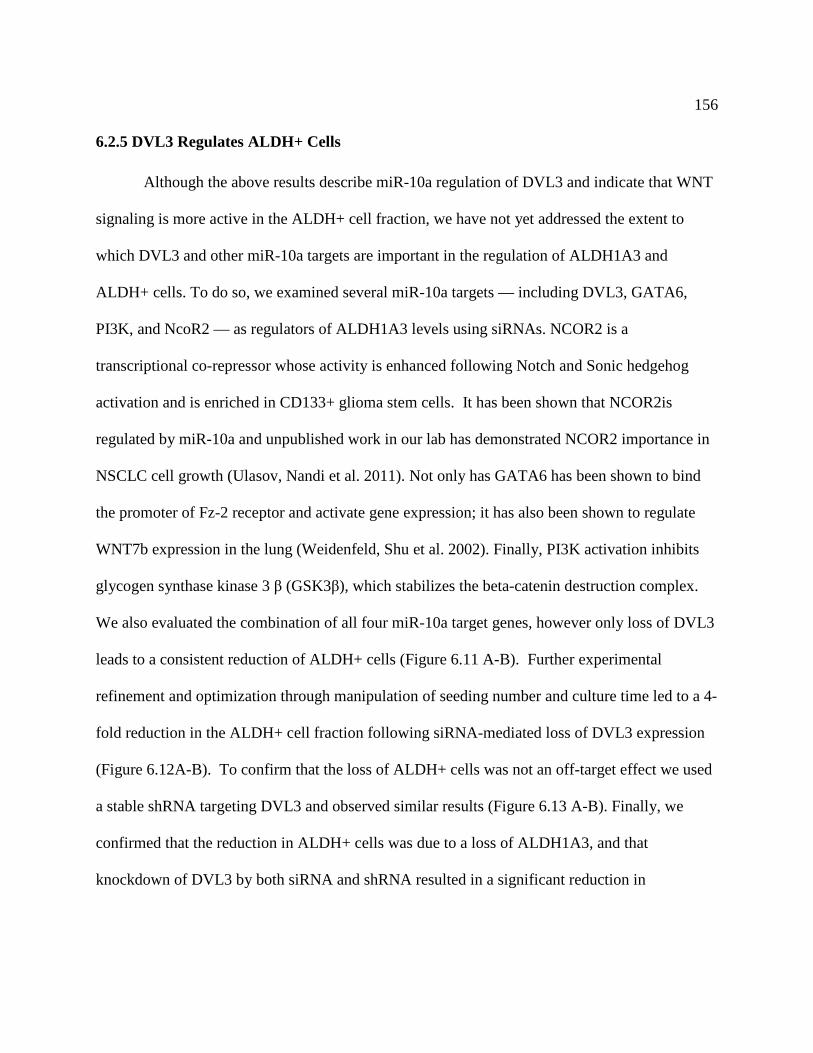
156
6.2.5 DVL3 Regulates ALDH+ Cells
Although the above results describe miR-10a regulation of DVL3 and indicate that WNT
signaling is more active in the ALDH+ cell fraction, we have not yet addressed the extent to
which DVL3 and other miR-10a targets are important in the regulation of ALDH1A3 and
ALDH+ cells. To do so, we examined several miR-10a targets — including DVL3, GATA6,
PI3K, and NcoR2 — as regulators of ALDH1A3 levels using siRNAs. NCOR2 is a
transcriptional co-repressor whose activity is enhanced following Notch and Sonic hedgehog
activation and is enriched in CD133+ glioma stem cells. It has been shown that NCOR2is
regulated by miR-10a and unpublished work in our lab has demonstrated NCOR2 importance in
NSCLC cell growth (Ulasov, Nandi et al. 2011). Not only has GATA6 has been shown to bind
the promoter of Fz-2 receptor and activate gene expression; it has also been shown to regulate
WNT7b expression in the lung (Weidenfeld, Shu et al. 2002). Finally, PI3K activation inhibits
glycogen synthase kinase 3 β (GSK3β), which stabilizes the beta-catenin destruction complex.
We also evaluated the combination of all four miR-10a target genes, however only loss of DVL3
leads to a consistent reduction of ALDH+ cells (Figure 6.11 A-B). Further experimental
refinement and optimization through manipulation of seeding number and culture time led to a 4-
fold reduction in the ALDH+ cell fraction following siRNA-mediated loss of DVL3 expression
(Figure 6.12A-B). To confirm that the loss of ALDH+ cells was not an off-target effect we used
a stable shRNA targeting DVL3 and observed similar results (Figure 6.13 A-B). Finally, we
confirmed that the reduction in ALDH+ cells was due to a loss of ALDH1A3, and that
knockdown of DVL3 by both siRNA and shRNA resulted in a significant reduction in

157
ALDH1A3 protein levels (Figure 6.12B & Figure 6.13B). Collectively, these results demonstrate
that loss of DLV3 expression reduces the ALDH+ cell fraction.
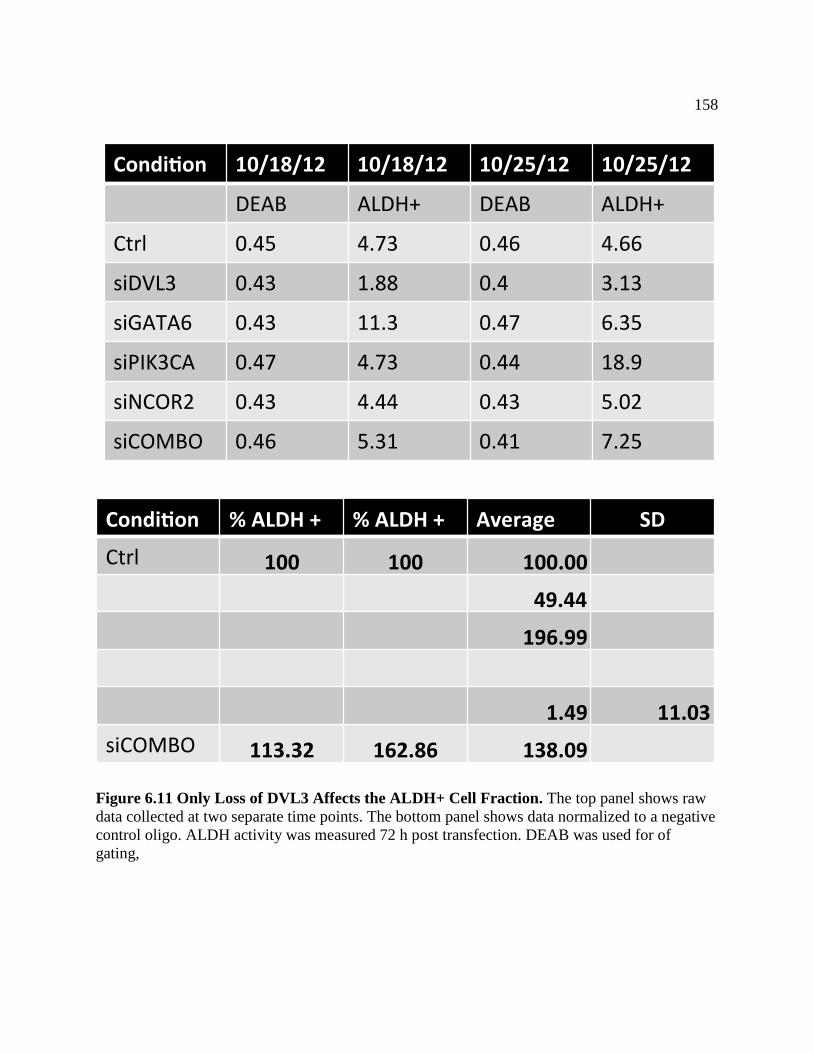
158
Figure 6.11 Only Loss of DVL3 Affects the ALDH+ Cell Fraction. The top panel shows raw data collected at two separate time points. The bottom panel shows data normalized to a negative control oligo. ALDH activity was measured 72 h post transfection. DEAB was used for of gating,
159
Figure 6.12 DVL3 Loss Reduces ALDH1A3 Protein Levels A. Loss of DVL3 expression leads to a four fold reduction of ALDH activity following. B. Loss of both DVL3 and ALDH1A3 protein following transfection with an siRNA against DVL3 relative to a negative control, confirmed by western blot.
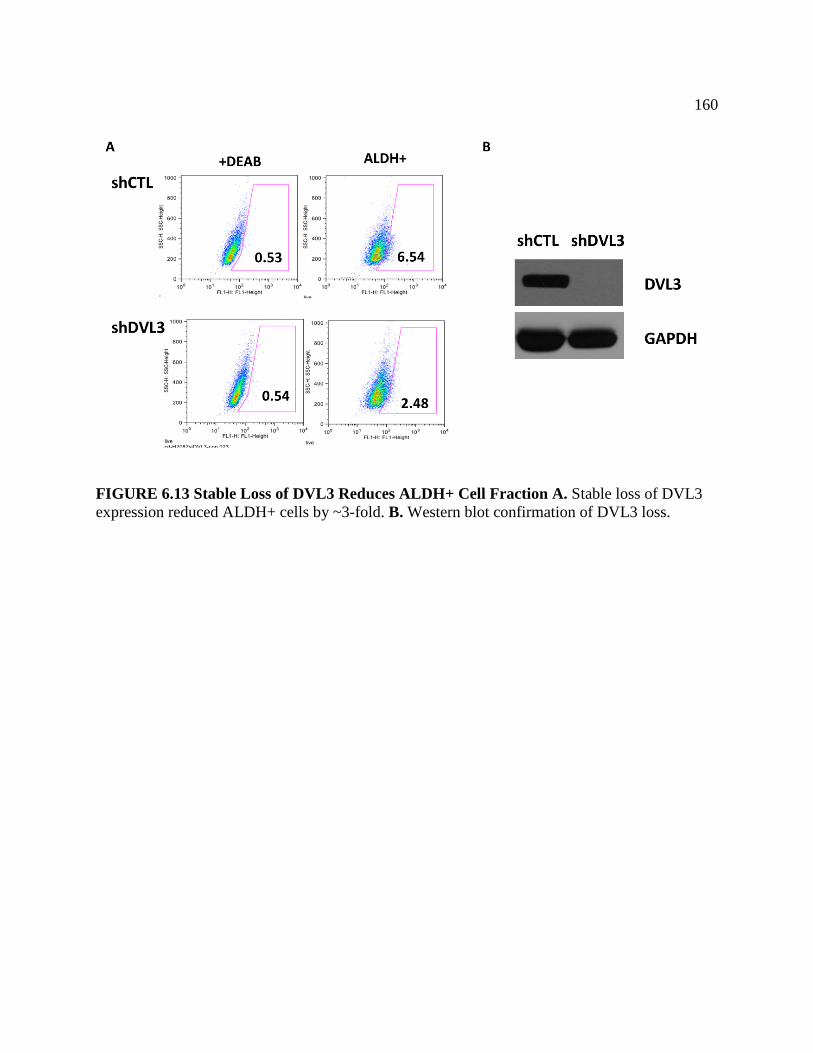
160
FIGURE 6.13 Stable Loss of DVL3 Reduces ALDH+ Cell Fraction A. Stable loss of DVL3 expression reduced ALDH+ cells by ~3-fold. B. Western blot confirmation of DVL3 loss.

161
6.2.6 DVL3 is Required for NSCLC Growth in Vitro and in Vivo.
Previous work in NSCLC has revealed growth inhibitory effects of DVL3 loss in H1703,
a NSCLC cell line known to be dependent on WNT signaling. Previous work in our lab has
shown that loss of ALDH1A3 inhibits tumor growth in vivo (Figure 6.3) and our above studies
revealed DVL3 as a regulator of ALDH+ cells. However, it was unclear what phenotype loss of
DVL3 would have both in vitro and in vivo. Transient loss of DVL3 led to only modest
inhibition of growth (Figure 6.14A). However, a significant induction of apoptosis was observed
48 h post transfection (Figure 6.14B). Stable loss of DVL3 resulted in a significant reduction in
colony formation ability (Figure 6.14C). While it appears that DVL3 is required for growth in
vitro, it was unclear whether this was maintained in vivo. While control non-targeting shRNA
cells led to robust tumor growth, DVL knockdown significantly inhibited tumor growth (Figure
6.14D). Loss of DVL3 in H2009 cells led to tumors being formed in only 3 out of 5 mice and at
a much lower rate (Figure 6.13D). Collectively, these results indicate that DVL3 is crucial for
maintaining the ALDH+ cell population and tumorigenesis.
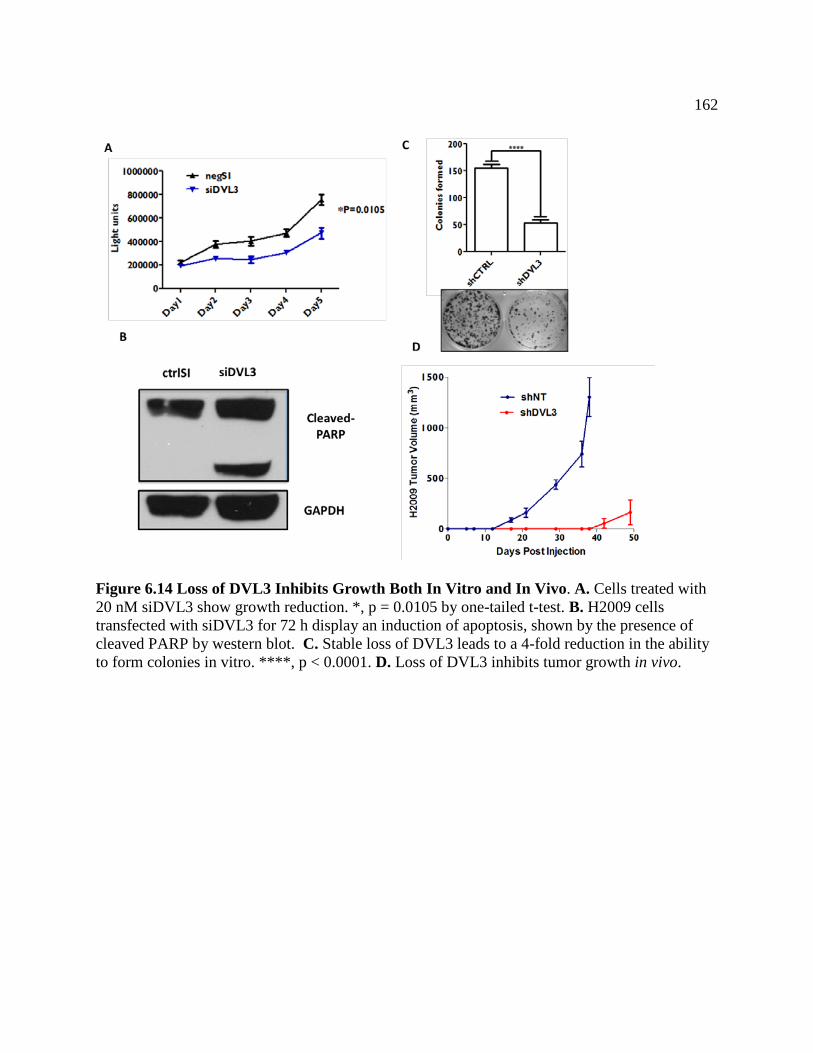
162
Figure 6.14 Loss of DVL3 Inhibits Growth Both In Vitro and In Vivo. A. Cells treated with 20 nM siDVL3 show growth reduction. *, p = 0.0105 by one-tailed t-test. B. H2009 cells transfected with siDVL3 for 72 h display an induction of apoptosis, shown by the presence of cleaved PARP by western blot. C. Stable loss of DVL3 leads to a 4-fold reduction in the ability to form colonies in vitro. ****, p < 0.0001. D. Loss of DVL3 inhibits tumor growth in vivo.
163
6.3 Discussion
Through gene expression analysis we discovered that miR-10a significantly reduced
ALDH1A3 levels and the ALDH+ cell population, and that overexpression of miR-10a inhibited
growth in vitro and in vivo. We showed that miR-10a mediated the depletion of lung cancer stem
cells through its regulation of the NOTCH and WNT pathways via direct interaction with DVL3
(Figure 6.15). Finally, we observed that DVL3 not only regulates ALDH+ cell populations but is
also vital for NSCLC tumor growth in vivo.
We expanded our finding across a panel of lung cancer cell lines representing various
histological subtypes, demonstrating the robustness of the effect of miR-10a on ALDH1A3
levels. Not only did ectopic expression of miR-10a lead to the reduction of the ALDH+ cell
population, but also significantly inhibited colony formation and induced apoptosis in vitro.
Further supporting miR-10a as a critical modulator of cell growth, when H2009 cells were
transiently transfected with miR-10a mimic and then injected the subcutaneously in mice (Figure
6.16B). Prior to injection we measured both DVL and ALDH1A3 levels and confirmed
significant reduction in expression levels for each gene (Figure 6.16C). While there was a slight
lag in tumor formation in miR-10a mimic treated cells, this difference was lost over time.
Tumors were removed and miR-10a levels were quantified, it was found that miR-10a levels had
returned to baseline levels (Figure 6.16 A-D). This finding suggests that either miR-10a cells
underwent gradual apoptosis or that only cells with high expression propagated tumor formation.
We believe the latter, as there was an initial lag in tumor formation and colony formation results
164
suggest that while miR-10a will not completely abolish colony formation it will significantly
reduce it. To address this issue further we used stable over-expression of miR-10a. The over-
expression construct led to more than a 100-fold increase in miR-10a, which was smaller than
the increase achieved with transient transfections of the miR-10a mimic, but still enough to lead
to a reduction in ALDH1A3 levels and inhibition of colony forming ability in vitro. When these
stable cells were injected into mice, we observed a dramatic inhibition of tumor formation,
implicating miR-10a as an important regulator of NSCLC growth both in vitro and in vivo. In
our model “normal” lung system (immortalized bronchial epithelial cells) we saw that miR-10a
affected DVL3 levels but had no effect on ALDH1A3 levels. This indicates that ALDH1A3
levels in HBEC3-KT are either maintained through alternative pathways or that parallel
pathways still existed that are absent in H2009 or HCC827 cells. In support of our understanding
of miRNAs as reactors to stress (Mendell and Olson 2012), miR-10a had no effect in normal
HBEC cells but had profound effects on cancer cells, which are under a constant state of various
stressors.
The reduction in ALDH1A3 levels was not a direct result of miR-10a, however, as the
entire coding sequence did not contain any conserved miR-10a binding sites. Past and ongoing
work in our lab has shown that the WNT pathway is important for NSCLC cellular growth.
Gene expression analysis showed that WNT10a is enriched in the ALDH+ cell population
(Figure 6.4A). Additionally, a mini siRNA screen, targeting genes implicated in stem cell
maintenance, again revealed an enrichment of genes involved inn the WNT pathway are
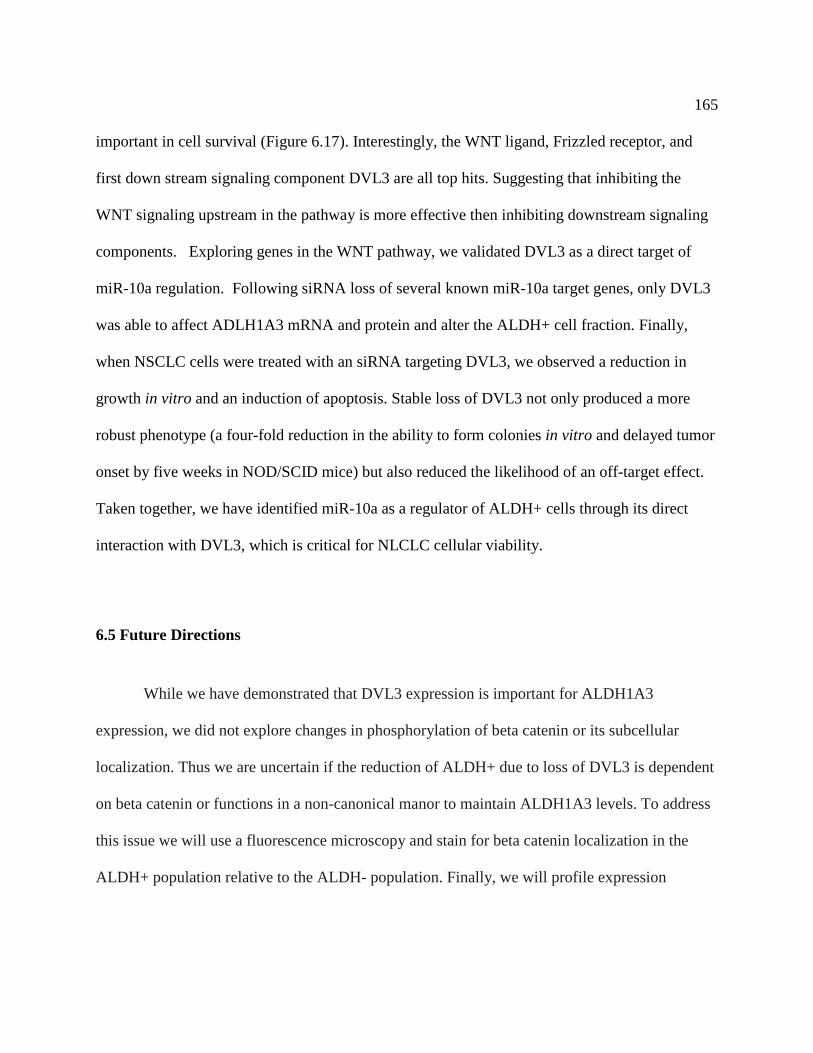
165
important in cell survival (Figure 6.17). Interestingly, the WNT ligand, Frizzled receptor, and
first down stream signaling component DVL3 are all top hits. Suggesting that inhibiting the
WNT signaling upstream in the pathway is more effective then inhibiting downstream signaling
components. Exploring genes in the WNT pathway, we validated DVL3 as a direct target of
miR-10a regulation. Following siRNA loss of several known miR-10a target genes, only DVL3
was able to affect ADLH1A3 mRNA and protein and alter the ALDH+ cell fraction. Finally,
when NSCLC cells were treated with an siRNA targeting DVL3, we observed a reduction in
growth in vitro and an induction of apoptosis. Stable loss of DVL3 not only produced a more
robust phenotype (a four-fold reduction in the ability to form colonies in vitro and delayed tumor
onset by five weeks in NOD/SCID mice) but also reduced the likelihood of an off-target effect.
Taken together, we have identified miR-10a as a regulator of ALDH+ cells through its direct
interaction with DVL3, which is critical for NLCLC cellular viability.
6.5 Future Directions
While we have demonstrated that DVL3 expression is important for ALDH1A3
expression, we did not explore changes in phosphorylation of beta catenin or its subcellular
localization. Thus we are uncertain if the reduction of ALDH+ due to loss of DVL3 is dependent
on beta catenin or functions in a non-canonical manor to maintain ALDH1A3 levels. To address
this issue we will use a fluorescence microscopy and stain for beta catenin localization in the
ALDH+ population relative to the ALDH- population. Finally, we will profile expression
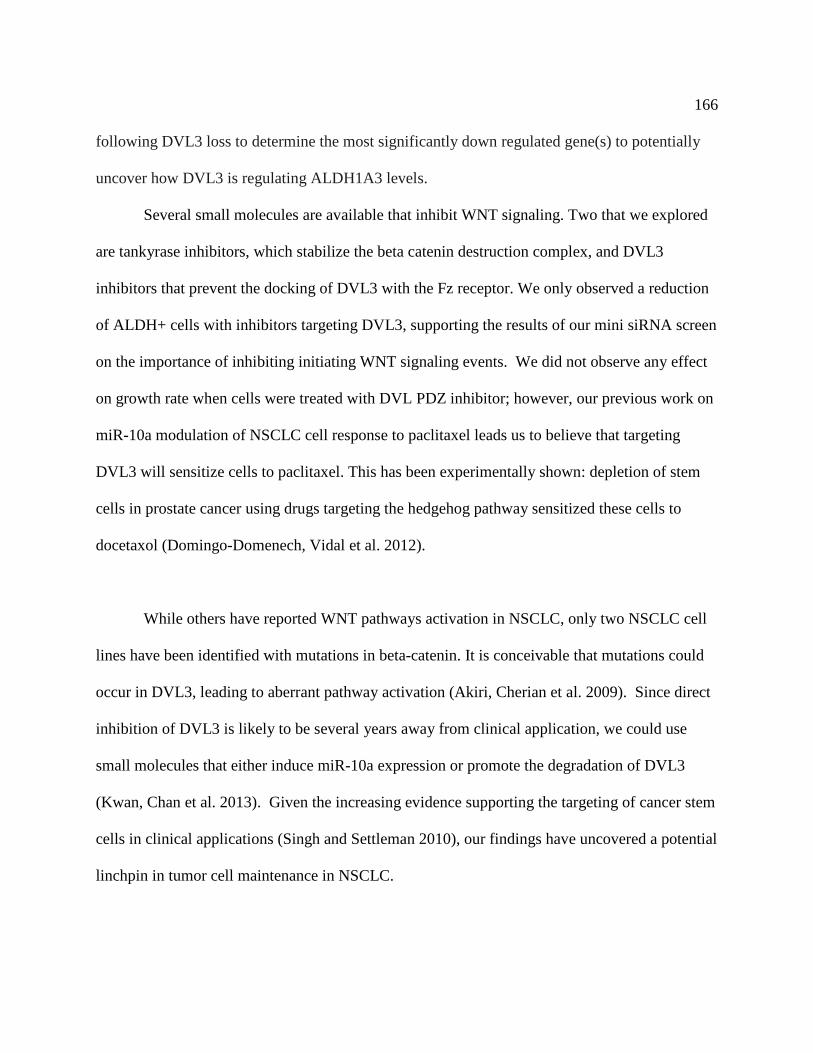
166
following DVL3 loss to determine the most significantly down regulated gene(s) to potentially
uncover how DVL3 is regulating ALDH1A3 levels.
Several small molecules are available that inhibit WNT signaling. Two that we explored
are tankyrase inhibitors, which stabilize the beta catenin destruction complex, and DVL3
inhibitors that prevent the docking of DVL3 with the Fz receptor. We only observed a reduction
of ALDH+ cells with inhibitors targeting DVL3, supporting the results of our mini siRNA screen
on the importance of inhibiting initiating WNT signaling events. We did not observe any effect
on growth rate when cells were treated with DVL PDZ inhibitor; however, our previous work on
miR-10a modulation of NSCLC cell response to paclitaxel leads us to believe that targeting
DVL3 will sensitize cells to paclitaxel. This has been experimentally shown: depletion of stem
cells in prostate cancer using drugs targeting the hedgehog pathway sensitized these cells to
docetaxol (Domingo-Domenech, Vidal et al. 2012).
While others have reported WNT pathways activation in NSCLC, only two NSCLC cell
lines have been identified with mutations in beta-catenin. It is conceivable that mutations could
occur in DVL3, leading to aberrant pathway activation (Akiri, Cherian et al. 2009). Since direct
inhibition of DVL3 is likely to be several years away from clinical application, we could use
small molecules that either induce miR-10a expression or promote the degradation of DVL3
(Kwan, Chan et al. 2013). Given the increasing evidence supporting the targeting of cancer stem
cells in clinical applications (Singh and Settleman 2010), our findings have uncovered a potential
linchpin in tumor cell maintenance in NSCLC.
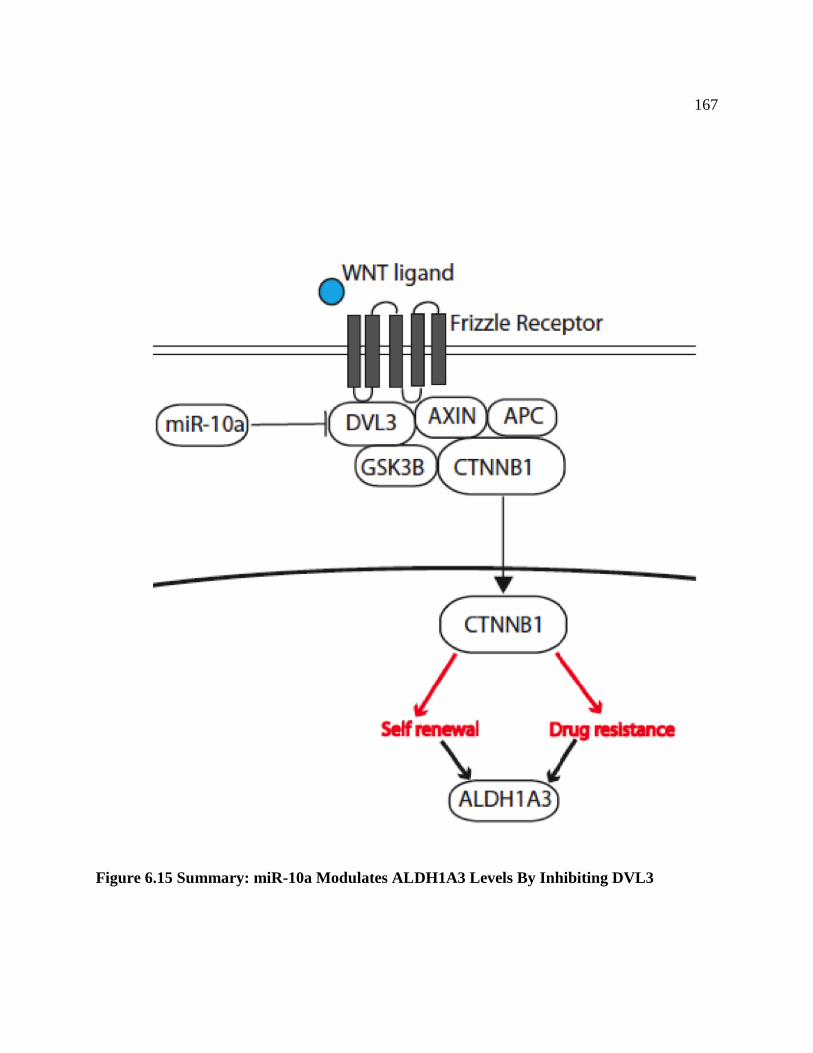
167
Figure 6.15 Summary: miR-10a Modulates ALDH1A3 Levels By Inhibiting DVL3
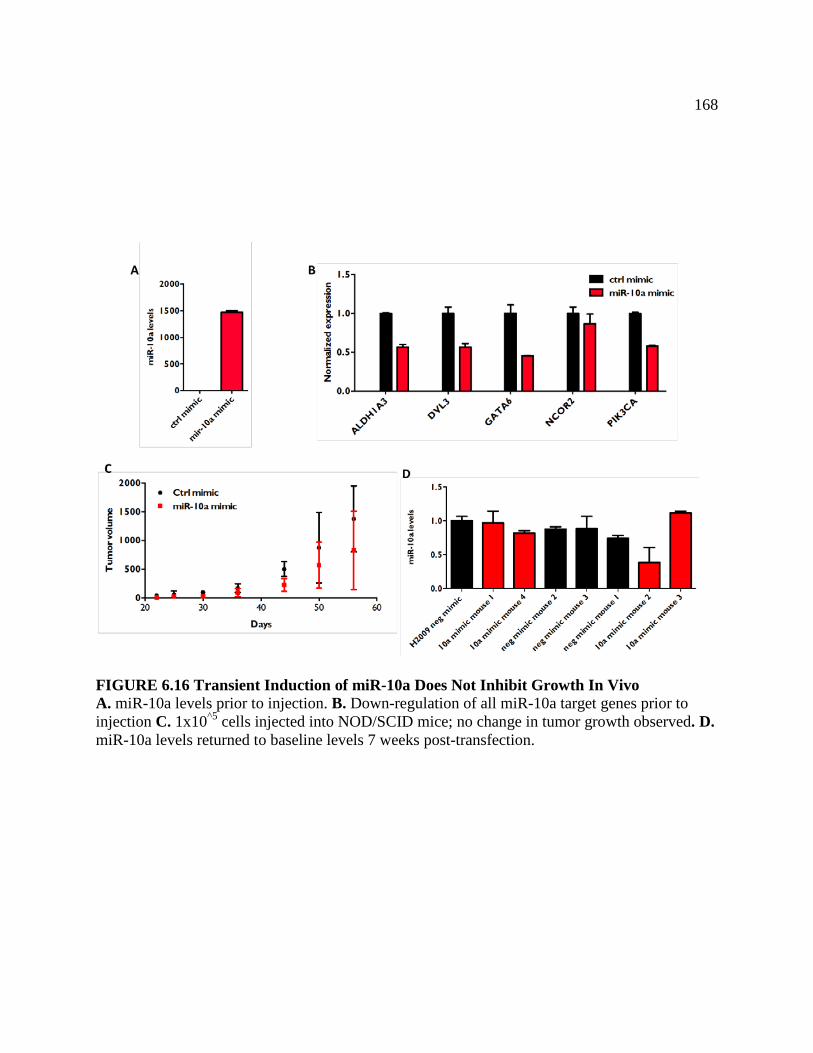
168
FIGURE 6.16 Transient Induction of miR-10a Does Not Inhibit Growth In Vivo A. miR-10a levels prior to injection. B. Down-regulation of all miR-10a target genes prior to injection C. 1x10^5 cells injected into NOD/SCID mice; no change in tumor growth observed. D. miR-10a levels returned to baseline levels 7 weeks post-transfection.
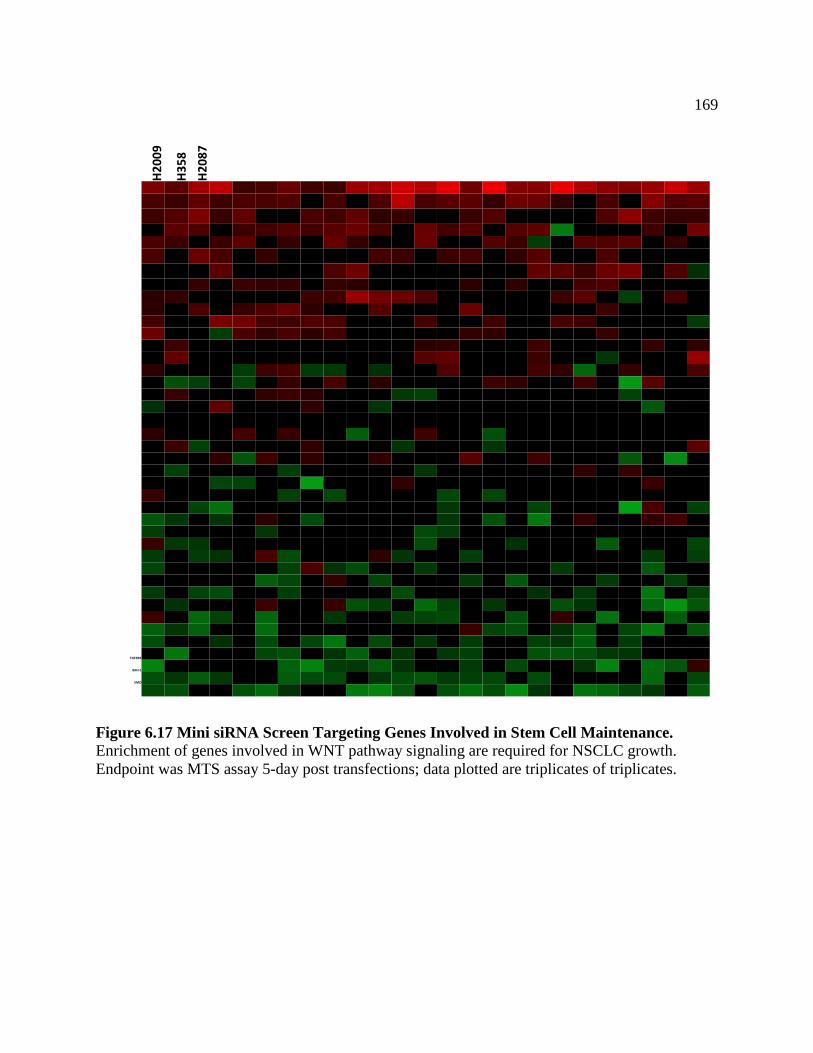
169
Figure 6.17 Mini siRNA Screen Targeting Genes Involved in Stem Cell Maintenance. Enrichment of genes involved in WNT pathway signaling are required for NSCLC growth. Endpoint was MTS assay 5-day post transfections; data plotted are triplicates of triplicates.
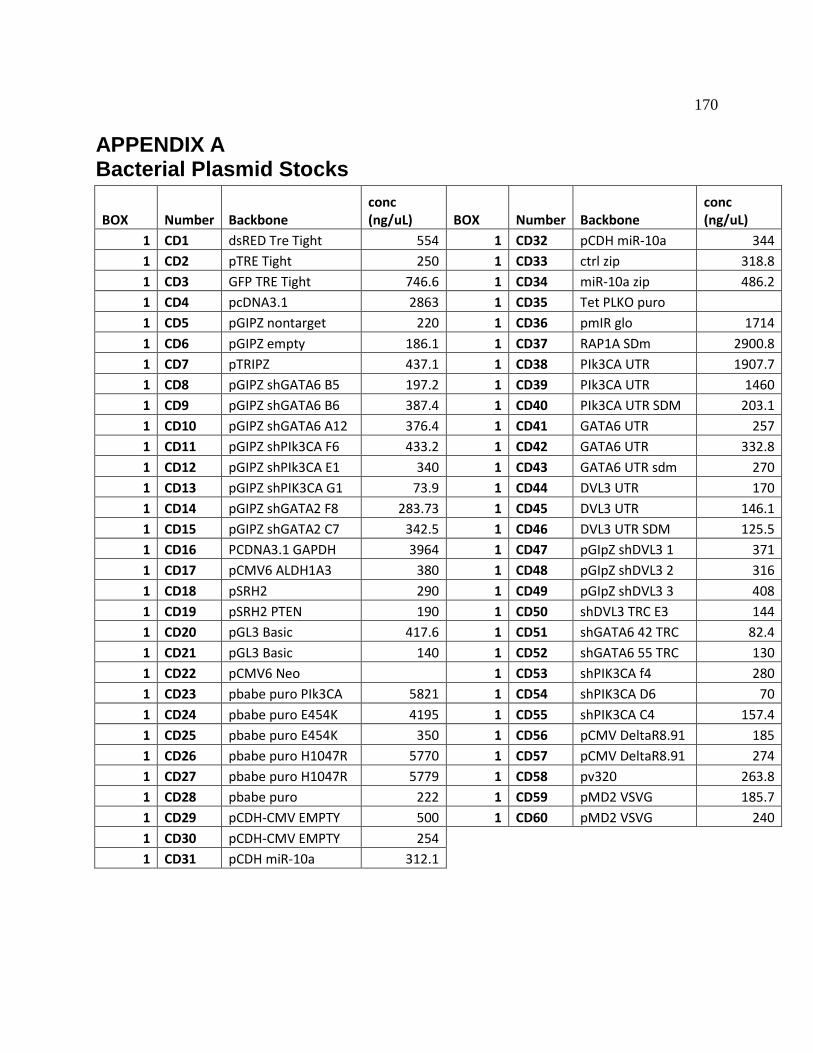
170
APPENDIX A Bacterial Plasmid Stocks
BOX Number Backbone conc (ng/uL) BOX Number Backbone
conc (ng/uL)
1 CD1 dsRED Tre Tight 554 1 CD32 pCDH miR-10a 344 1 CD2 pTRE Tight 250 1 CD33 ctrl zip 318.8 1 CD3 GFP TRE Tight 746.6 1 CD34 miR-10a zip 486.2 1 CD4 pcDNA3.1 2863 1 CD35 Tet PLKO puro 1 CD5 pGIPZ nontarget 220 1 CD36 pmIR glo 1714 1 CD6 pGIPZ empty 186.1 1 CD37 RAP1A SDm 2900.8 1 CD7 pTRIPZ 437.1 1 CD38 PIk3CA UTR 1907.7 1 CD8 pGIPZ shGATA6 B5 197.2 1 CD39 PIk3CA UTR 1460 1 CD9 pGIPZ shGATA6 B6 387.4 1 CD40 PIk3CA UTR SDM 203.1 1 CD10 pGIPZ shGATA6 A12 376.4 1 CD41 GATA6 UTR 257 1 CD11 pGIPZ shPIk3CA F6 433.2 1 CD42 GATA6 UTR 332.8 1 CD12 pGIPZ shPIk3CA E1 340 1 CD43 GATA6 UTR sdm 270 1 CD13 pGIPZ shPIK3CA G1 73.9 1 CD44 DVL3 UTR 170 1 CD14 pGIPZ shGATA2 F8 283.73 1 CD45 DVL3 UTR 146.1 1 CD15 pGIPZ shGATA2 C7 342.5 1 CD46 DVL3 UTR SDM 125.5 1 CD16 PCDNA3.1 GAPDH 3964 1 CD47 pGIpZ shDVL3 1 371 1 CD17 pCMV6 ALDH1A3 380 1 CD48 pGIpZ shDVL3 2 316 1 CD18 pSRH2 290 1 CD49 pGIpZ shDVL3 3 408 1 CD19 pSRH2 PTEN 190 1 CD50 shDVL3 TRC E3 144 1 CD20 pGL3 Basic 417.6 1 CD51 shGATA6 42 TRC 82.4 1 CD21 pGL3 Basic 140 1 CD52 shGATA6 55 TRC 130 1 CD22 pCMV6 Neo 1 CD53 shPIK3CA f4 280 1 CD23 pbabe puro PIk3CA 5821 1 CD54 shPIK3CA D6 70 1 CD24 pbabe puro E454K 4195 1 CD55 shPIK3CA C4 157.4 1 CD25 pbabe puro E454K 350 1 CD56 pCMV DeltaR8.91 185 1 CD26 pbabe puro H1047R 5770 1 CD57 pCMV DeltaR8.91 274 1 CD27 pbabe puro H1047R 5779 1 CD58 pv320 263.8 1 CD28 pbabe puro 222 1 CD59 pMD2 VSVG 185.7 1 CD29 pCDH-CMV EMPTY 500 1 CD60 pMD2 VSVG 240 1 CD30 pCDH-CMV EMPTY 254
1 CD31 pCDH miR-10a 312.1
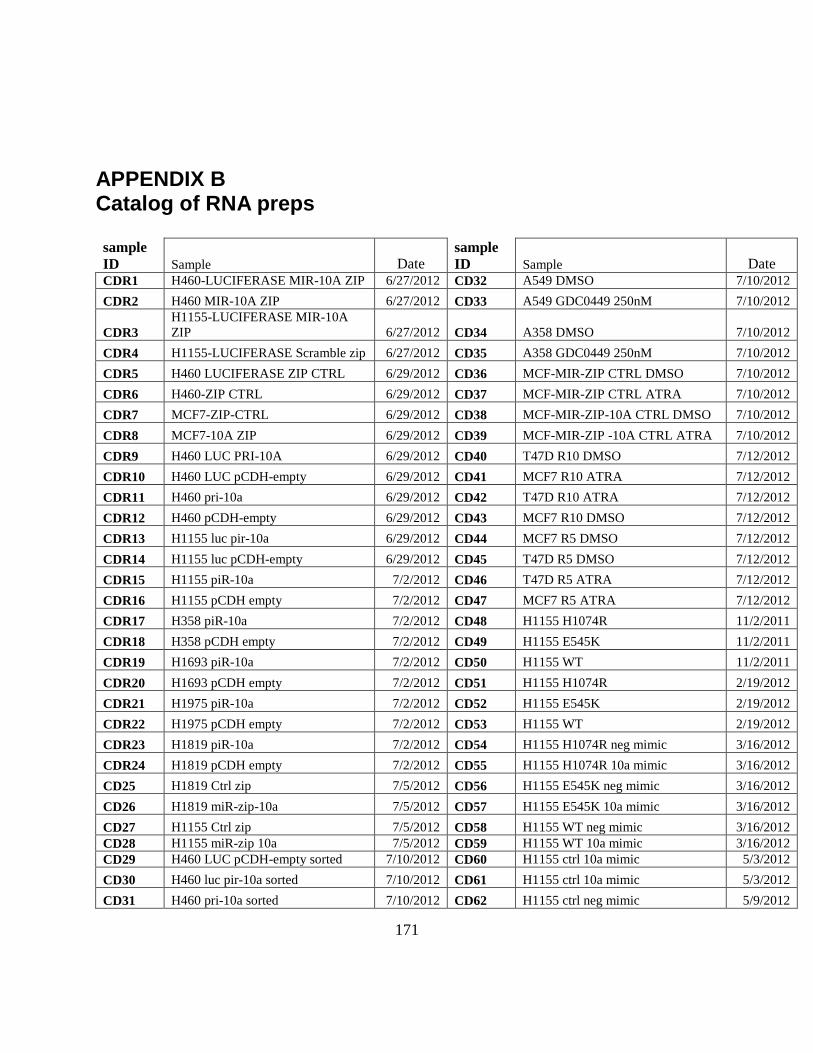
171
APPENDIX B Catalog of RNA preps sample ID Sample Date
sample ID Sample Date
CDR1 H460-LUCIFERASE MIR-10A ZIP 6/27/2012 CD32 A549 DMSO 7/10/2012 CDR2 H460 MIR-10A ZIP 6/27/2012 CD33 A549 GDC0449 250nM 7/10/2012
CDR3 H1155-LUCIFERASE MIR-10A ZIP 6/27/2012 CD34 A358 DMSO 7/10/2012
CDR4 H1155-LUCIFERASE Scramble zip 6/27/2012 CD35 A358 GDC0449 250nM 7/10/2012 CDR5 H460 LUCIFERASE ZIP CTRL 6/29/2012 CD36 MCF-MIR-ZIP CTRL DMSO 7/10/2012 CDR6 H460-ZIP CTRL 6/29/2012 CD37 MCF-MIR-ZIP CTRL ATRA 7/10/2012 CDR7 MCF7-ZIP-CTRL 6/29/2012 CD38 MCF-MIR-ZIP-10A CTRL DMSO 7/10/2012 CDR8 MCF7-10A ZIP 6/29/2012 CD39 MCF-MIR-ZIP -10A CTRL ATRA 7/10/2012 CDR9 H460 LUC PRI-10A 6/29/2012 CD40 T47D R10 DMSO 7/12/2012 CDR10 H460 LUC pCDH-empty 6/29/2012 CD41 MCF7 R10 ATRA 7/12/2012 CDR11 H460 pri-10a 6/29/2012 CD42 T47D R10 ATRA 7/12/2012 CDR12 H460 pCDH-empty 6/29/2012 CD43 MCF7 R10 DMSO 7/12/2012 CDR13 H1155 luc pir-10a 6/29/2012 CD44 MCF7 R5 DMSO 7/12/2012 CDR14 H1155 luc pCDH-empty 6/29/2012 CD45 T47D R5 DMSO 7/12/2012 CDR15 H1155 piR-10a 7/2/2012 CD46 T47D R5 ATRA 7/12/2012 CDR16 H1155 pCDH empty 7/2/2012 CD47 MCF7 R5 ATRA 7/12/2012 CDR17 H358 piR-10a 7/2/2012 CD48 H1155 H1074R 11/2/2011 CDR18 H358 pCDH empty 7/2/2012 CD49 H1155 E545K 11/2/2011 CDR19 H1693 piR-10a 7/2/2012 CD50 H1155 WT 11/2/2011 CDR20 H1693 pCDH empty 7/2/2012 CD51 H1155 H1074R 2/19/2012 CDR21 H1975 piR-10a 7/2/2012 CD52 H1155 E545K 2/19/2012 CDR22 H1975 pCDH empty 7/2/2012 CD53 H1155 WT 2/19/2012 CDR23 H1819 piR-10a 7/2/2012 CD54 H1155 H1074R neg mimic 3/16/2012 CDR24 H1819 pCDH empty 7/2/2012 CD55 H1155 H1074R 10a mimic 3/16/2012 CD25 H1819 Ctrl zip 7/5/2012 CD56 H1155 E545K neg mimic 3/16/2012 CD26 H1819 miR-zip-10a 7/5/2012 CD57 H1155 E545K 10a mimic 3/16/2012 CD27 H1155 Ctrl zip 7/5/2012 CD58 H1155 WT neg mimic 3/16/2012 CD28 H1155 miR-zip 10a 7/5/2012 CD59 H1155 WT 10a mimic 3/16/2012 CD29 H460 LUC pCDH-empty sorted 7/10/2012 CD60 H1155 ctrl 10a mimic 5/3/2012 CD30 H460 luc pir-10a sorted 7/10/2012 CD61 H1155 ctrl 10a mimic 5/3/2012 CD31 H460 pri-10a sorted 7/10/2012 CD62 H1155 ctrl neg mimic 5/9/2012
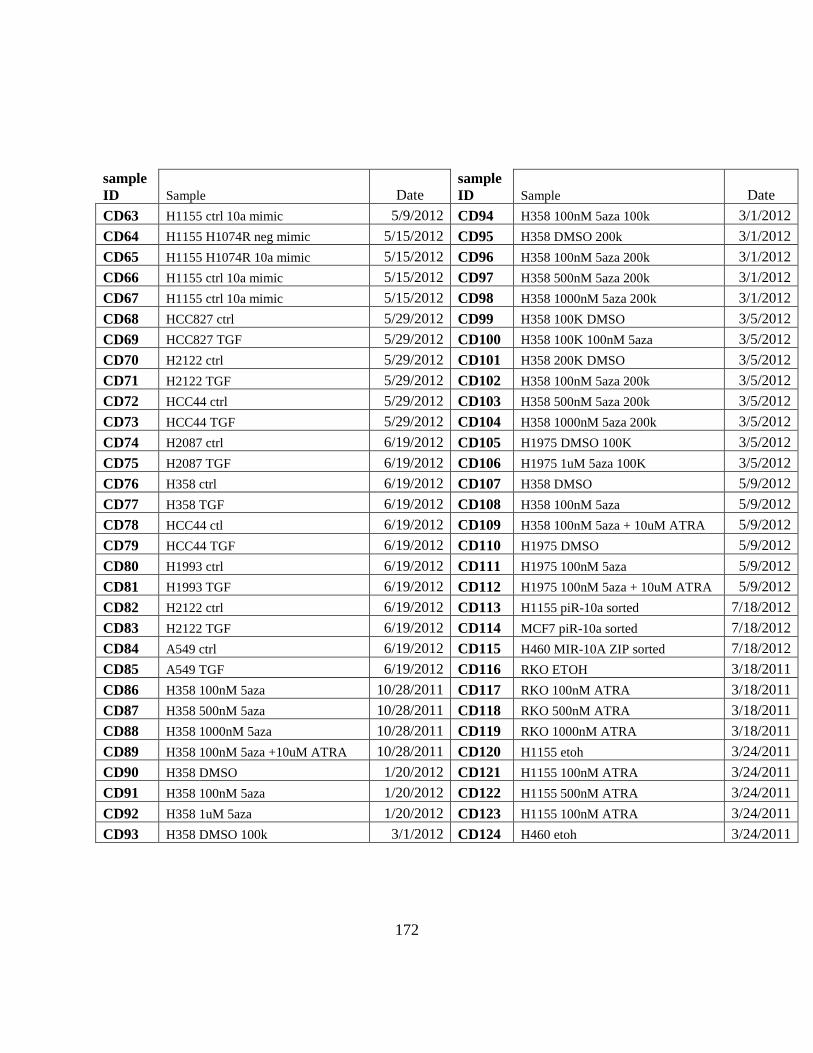
172
sample ID Sample Date
sample ID Sample Date
CD63 H1155 ctrl 10a mimic 5/9/2012 CD94 H358 100nM 5aza 100k 3/1/2012 CD64 H1155 H1074R neg mimic 5/15/2012 CD95 H358 DMSO 200k 3/1/2012 CD65 H1155 H1074R 10a mimic 5/15/2012 CD96 H358 100nM 5aza 200k 3/1/2012 CD66 H1155 ctrl 10a mimic 5/15/2012 CD97 H358 500nM 5aza 200k 3/1/2012 CD67 H1155 ctrl 10a mimic 5/15/2012 CD98 H358 1000nM 5aza 200k 3/1/2012 CD68 HCC827 ctrl 5/29/2012 CD99 H358 100K DMSO 3/5/2012 CD69 HCC827 TGF 5/29/2012 CD100 H358 100K 100nM 5aza 3/5/2012 CD70 H2122 ctrl 5/29/2012 CD101 H358 200K DMSO 3/5/2012 CD71 H2122 TGF 5/29/2012 CD102 H358 100nM 5aza 200k 3/5/2012 CD72 HCC44 ctrl 5/29/2012 CD103 H358 500nM 5aza 200k 3/5/2012 CD73 HCC44 TGF 5/29/2012 CD104 H358 1000nM 5aza 200k 3/5/2012 CD74 H2087 ctrl 6/19/2012 CD105 H1975 DMSO 100K 3/5/2012 CD75 H2087 TGF 6/19/2012 CD106 H1975 1uM 5aza 100K 3/5/2012 CD76 H358 ctrl 6/19/2012 CD107 H358 DMSO 5/9/2012 CD77 H358 TGF 6/19/2012 CD108 H358 100nM 5aza 5/9/2012 CD78 HCC44 ctl 6/19/2012 CD109 H358 100nM 5aza + 10uM ATRA 5/9/2012 CD79 HCC44 TGF 6/19/2012 CD110 H1975 DMSO 5/9/2012 CD80 H1993 ctrl 6/19/2012 CD111 H1975 100nM 5aza 5/9/2012 CD81 H1993 TGF 6/19/2012 CD112 H1975 100nM 5aza + 10uM ATRA 5/9/2012 CD82 H2122 ctrl 6/19/2012 CD113 H1155 piR-10a sorted 7/18/2012 CD83 H2122 TGF 6/19/2012 CD114 MCF7 piR-10a sorted 7/18/2012 CD84 A549 ctrl 6/19/2012 CD115 H460 MIR-10A ZIP sorted 7/18/2012 CD85 A549 TGF 6/19/2012 CD116 RKO ETOH 3/18/2011 CD86 H358 100nM 5aza 10/28/2011 CD117 RKO 100nM ATRA 3/18/2011 CD87 H358 500nM 5aza 10/28/2011 CD118 RKO 500nM ATRA 3/18/2011 CD88 H358 1000nM 5aza 10/28/2011 CD119 RKO 1000nM ATRA 3/18/2011 CD89 H358 100nM 5aza +10uM ATRA 10/28/2011 CD120 H1155 etoh 3/24/2011 CD90 H358 DMSO 1/20/2012 CD121 H1155 100nM ATRA 3/24/2011 CD91 H358 100nM 5aza 1/20/2012 CD122 H1155 500nM ATRA 3/24/2011 CD92 H358 1uM 5aza 1/20/2012 CD123 H1155 100nM ATRA 3/24/2011 CD93 H358 DMSO 100k 3/1/2012 CD124 H460 etoh 3/24/2011

173
sample ID Sample Date
sample ID Sample Date
CD125 H460 500nM ATRA 3/24/2011 CD156 MCF7 48 hrs 8/11/2011 CD126 H460 1000nM ATRA 3/24/2011 CD157 MCF7 72 hrs 8/12/2011 CD127 H1155 etoh 3/25/2011 CD158 MCF7 neg inhibitor ATRA 9/30/2011 CD128 H1155 100nM ATRA 3/25/2011 CD159 MCF7 10a inhibitor ATRA 9/30/2011 CD129 H1155 500nM ATRA 3/25/2011 CD160 MCF7 DMSO Charcoal stripped ####### CD130 H1155 1000nM ATRA 3/25/2011 CD161 MCF7 ATRA Charcoal stripped ####### CD131 H460 etoh 3/25/2011 CD162 H358 DMSO ####### CD132 H460 100nM ATRA 3/25/2011 CD163 H358 ATRA ####### CD133 H460 500nM ATRA 3/25/2011 CD164 MCF7 DMSO ####### CD134 H460 1000nM ATRA 3/25/2011 CD165 MCF7 ATRA ####### CD135 H460 etoh 4/13/2011 CD166 MCF7 R10 12/5/2011 CD136 H460 1uM ATRA 4/13/2011 CD167 MCF7 R10 ATRA 12/5/2011 CD137 H460 5uM ATRA 4/13/2011 CD168 MCF7 R10 ATRA +BEZ 12/5/2011 CD138 H460 10uM ATRA 4/13/2011 CD169 MCF7 R10 +BEZ 12/5/2011 CD139 RKO etoh 4/13/2011 CD170 MCF7 Charcoal stripped DMSO 12/5/2011 CD140 RKO 1uM ATRA 4/13/2011 CD171 MCF7 Charcoal stripped ATRA 12/5/2011 CD141 RKO 5uM ATRA 4/13/2011 CD172 MCF7 DMSO 3/3/2012 CD142 RKO 10uM ATRA 4/13/2011 CD173 MCF7 ATRA 100nM 3/3/2012 CD143 RKO etoh 5/6/2011 CD174 MCF7 ATRA 500nM 3/3/2012 CD144 RKO ATRA 5/6/2011 CD175 MCF7 ATRA 1000nM 3/3/2012 CD145 H358 ATRA 24 hrs 5/18/2011 CD176 MCF7 ATRA 5000nM 3/3/2012 CD146 H358 ATRA 48 hrs 5/19/2011 CD177 MCF7 ATRA 10000nM 3/3/2012 CD147 H358 ATRA 72 hrs 5/20/2011 CD178 MDA-MB-453 DMSO 3/13/2012 CD148 MCF7 ATRA 6/17/2011 CD179 MDA-MB-453 5uM ATRA 3/13/2012 CD149 CCRL 2274 DMSO 6/24/2011 CD180 MDA-MB-453 10uM ATRA 3/13/2012 CD150 CCRL 2274 ATRA 6/24/2011 CD181 HCC1954 DMSO 3/13/2012 CD151 MCF7 DMSO 7/1/2011 CD182 HCC1954 5uM ATRA 3/13/2012 CD152 MCF7 ATRA 7/1/2011 CD183 HCC1954 10uM ATRA 3/13/2012 CD153 MCF7 DMSO 7/30/2011 CD184 T47D DMSO 5/5/2012 CD154 MCF7 ATRA 7/30/2011 CD185 T47D ATRA 5/5/2012 CD155 MCF7 24 hrs 8/10/2011 CD186 HCC1954 DMSO 5/5/2012
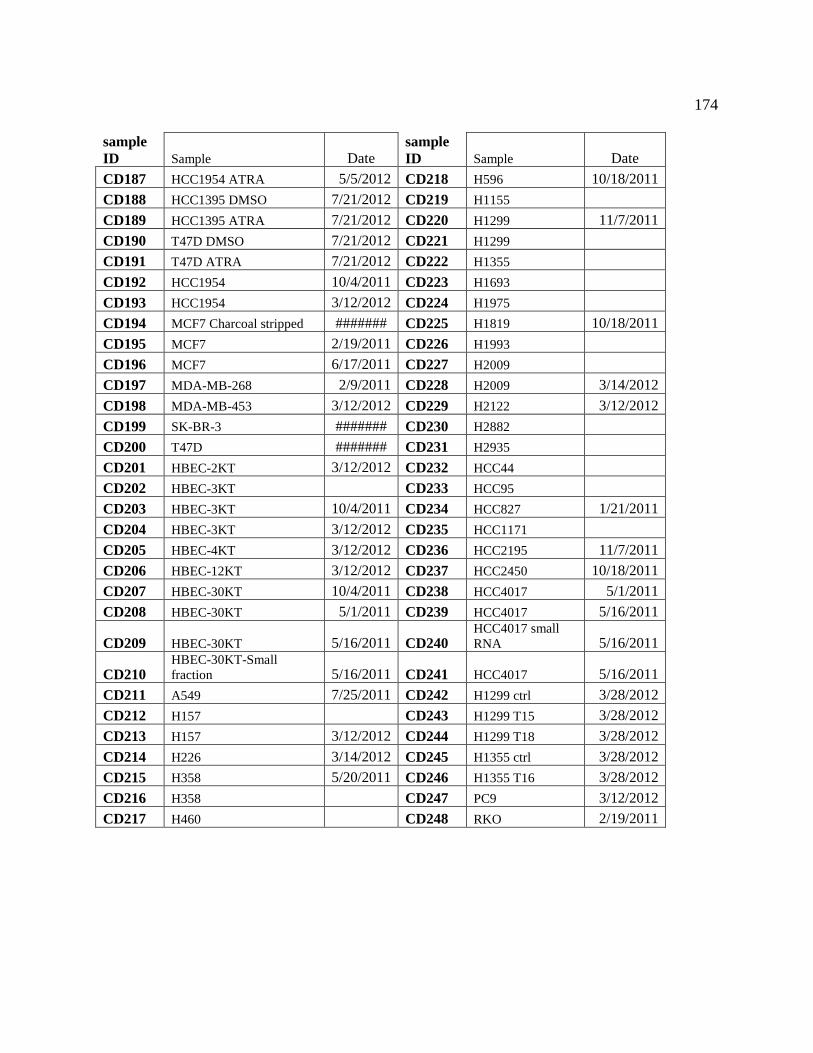
174
sample ID Sample Date
sample ID Sample Date
CD187 HCC1954 ATRA 5/5/2012 CD218 H596 10/18/2011 CD188 HCC1395 DMSO 7/21/2012 CD219 H1155 CD189 HCC1395 ATRA 7/21/2012 CD220 H1299 11/7/2011 CD190 T47D DMSO 7/21/2012 CD221 H1299 CD191 T47D ATRA 7/21/2012 CD222 H1355 CD192 HCC1954 10/4/2011 CD223 H1693 CD193 HCC1954 3/12/2012 CD224 H1975 CD194 MCF7 Charcoal stripped ####### CD225 H1819 10/18/2011 CD195 MCF7 2/19/2011 CD226 H1993 CD196 MCF7 6/17/2011 CD227 H2009 CD197 MDA-MB-268 2/9/2011 CD228 H2009 3/14/2012 CD198 MDA-MB-453 3/12/2012 CD229 H2122 3/12/2012 CD199 SK-BR-3 ####### CD230 H2882 CD200 T47D ####### CD231 H2935 CD201 HBEC-2KT 3/12/2012 CD232 HCC44 CD202 HBEC-3KT CD233 HCC95 CD203 HBEC-3KT 10/4/2011 CD234 HCC827 1/21/2011 CD204 HBEC-3KT 3/12/2012 CD235 HCC1171 CD205 HBEC-4KT 3/12/2012 CD236 HCC2195 11/7/2011 CD206 HBEC-12KT 3/12/2012 CD237 HCC2450 10/18/2011 CD207 HBEC-30KT 10/4/2011 CD238 HCC4017 5/1/2011 CD208 HBEC-30KT 5/1/2011 CD239 HCC4017 5/16/2011
CD209 HBEC-30KT 5/16/2011 CD240 HCC4017 small RNA 5/16/2011
CD210 HBEC-30KT-Small fraction 5/16/2011 CD241 HCC4017 5/16/2011
CD211 A549 7/25/2011 CD242 H1299 ctrl 3/28/2012 CD212 H157 CD243 H1299 T15 3/28/2012 CD213 H157 3/12/2012 CD244 H1299 T18 3/28/2012 CD214 H226 3/14/2012 CD245 H1355 ctrl 3/28/2012 CD215 H358 5/20/2011 CD246 H1355 T16 3/28/2012 CD216 H358 CD247 PC9 3/12/2012 CD217 H460 CD248 RKO 2/19/2011
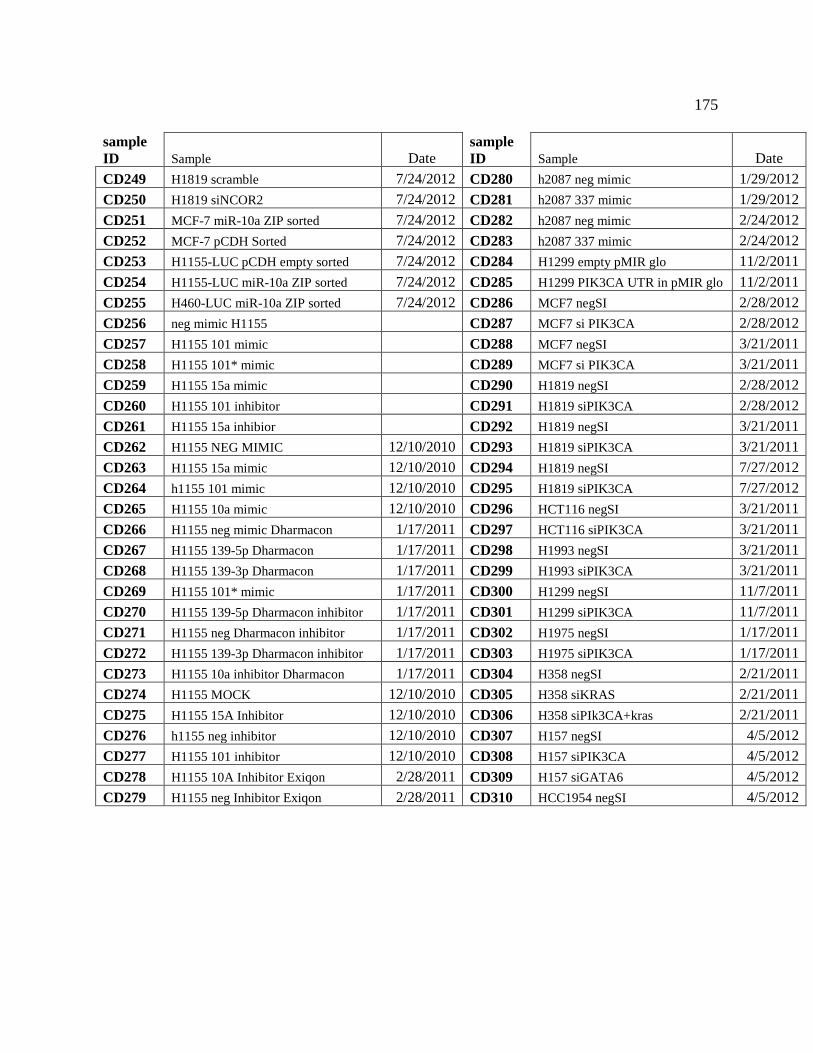
175
sample ID Sample Date
sample ID Sample Date
CD249 H1819 scramble 7/24/2012 CD280 h2087 neg mimic 1/29/2012 CD250 H1819 siNCOR2 7/24/2012 CD281 h2087 337 mimic 1/29/2012 CD251 MCF-7 miR-10a ZIP sorted 7/24/2012 CD282 h2087 neg mimic 2/24/2012 CD252 MCF-7 pCDH Sorted 7/24/2012 CD283 h2087 337 mimic 2/24/2012 CD253 H1155-LUC pCDH empty sorted 7/24/2012 CD284 H1299 empty pMIR glo 11/2/2011 CD254 H1155-LUC miR-10a ZIP sorted 7/24/2012 CD285 H1299 PIK3CA UTR in pMIR glo 11/2/2011 CD255 H460-LUC miR-10a ZIP sorted 7/24/2012 CD286 MCF7 negSI 2/28/2012 CD256 neg mimic H1155 CD287 MCF7 si PIK3CA 2/28/2012 CD257 H1155 101 mimic CD288 MCF7 negSI 3/21/2011 CD258 H1155 101* mimic CD289 MCF7 si PIK3CA 3/21/2011 CD259 H1155 15a mimic CD290 H1819 negSI 2/28/2012 CD260 H1155 101 inhibitor CD291 H1819 siPIK3CA 2/28/2012 CD261 H1155 15a inhibior CD292 H1819 negSI 3/21/2011 CD262 H1155 NEG MIMIC 12/10/2010 CD293 H1819 siPIK3CA 3/21/2011 CD263 H1155 15a mimic 12/10/2010 CD294 H1819 negSI 7/27/2012 CD264 h1155 101 mimic 12/10/2010 CD295 H1819 siPIK3CA 7/27/2012 CD265 H1155 10a mimic 12/10/2010 CD296 HCT116 negSI 3/21/2011 CD266 H1155 neg mimic Dharmacon 1/17/2011 CD297 HCT116 siPIK3CA 3/21/2011 CD267 H1155 139-5p Dharmacon 1/17/2011 CD298 H1993 negSI 3/21/2011 CD268 H1155 139-3p Dharmacon 1/17/2011 CD299 H1993 siPIK3CA 3/21/2011 CD269 H1155 101* mimic 1/17/2011 CD300 H1299 negSI 11/7/2011 CD270 H1155 139-5p Dharmacon inhibitor 1/17/2011 CD301 H1299 siPIK3CA 11/7/2011 CD271 H1155 neg Dharmacon inhibitor 1/17/2011 CD302 H1975 negSI 1/17/2011 CD272 H1155 139-3p Dharmacon inhibitor 1/17/2011 CD303 H1975 siPIK3CA 1/17/2011 CD273 H1155 10a inhibitor Dharmacon 1/17/2011 CD304 H358 negSI 2/21/2011 CD274 H1155 MOCK 12/10/2010 CD305 H358 siKRAS 2/21/2011 CD275 H1155 15A Inhibitor 12/10/2010 CD306 H358 siPIk3CA+kras 2/21/2011 CD276 h1155 neg inhibitor 12/10/2010 CD307 H157 negSI 4/5/2012 CD277 H1155 101 inhibitor 12/10/2010 CD308 H157 siPIK3CA 4/5/2012 CD278 H1155 10A Inhibitor Exiqon 2/28/2011 CD309 H157 siGATA6 4/5/2012 CD279 H1155 neg Inhibitor Exiqon 2/28/2011 CD310 HCC1954 negSI 4/5/2012
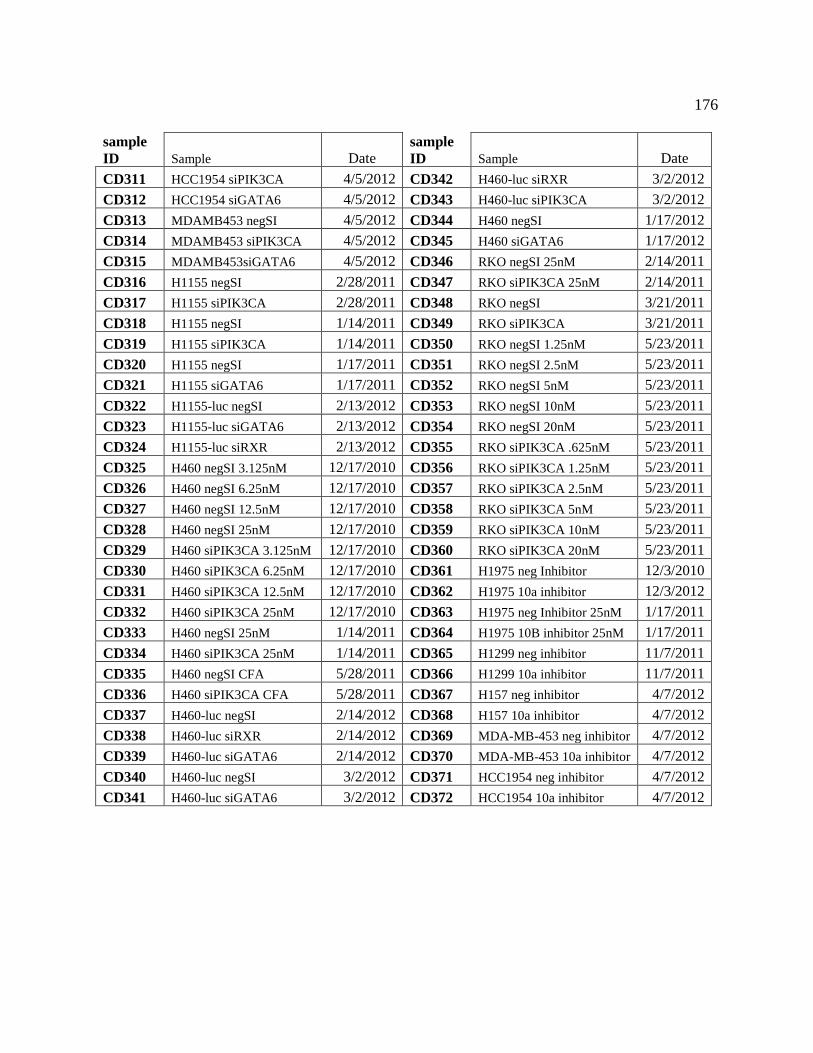
176
sample ID Sample Date
sample ID Sample Date
CD311 HCC1954 siPIK3CA 4/5/2012 CD342 H460-luc siRXR 3/2/2012 CD312 HCC1954 siGATA6 4/5/2012 CD343 H460-luc siPIK3CA 3/2/2012 CD313 MDAMB453 negSI 4/5/2012 CD344 H460 negSI 1/17/2012 CD314 MDAMB453 siPIK3CA 4/5/2012 CD345 H460 siGATA6 1/17/2012 CD315 MDAMB453siGATA6 4/5/2012 CD346 RKO negSI 25nM 2/14/2011 CD316 H1155 negSI 2/28/2011 CD347 RKO siPIK3CA 25nM 2/14/2011 CD317 H1155 siPIK3CA 2/28/2011 CD348 RKO negSI 3/21/2011 CD318 H1155 negSI 1/14/2011 CD349 RKO siPIK3CA 3/21/2011 CD319 H1155 siPIK3CA 1/14/2011 CD350 RKO negSI 1.25nM 5/23/2011 CD320 H1155 negSI 1/17/2011 CD351 RKO negSI 2.5nM 5/23/2011 CD321 H1155 siGATA6 1/17/2011 CD352 RKO negSI 5nM 5/23/2011 CD322 H1155-luc negSI 2/13/2012 CD353 RKO negSI 10nM 5/23/2011 CD323 H1155-luc siGATA6 2/13/2012 CD354 RKO negSI 20nM 5/23/2011 CD324 H1155-luc siRXR 2/13/2012 CD355 RKO siPIK3CA .625nM 5/23/2011 CD325 H460 negSI 3.125nM 12/17/2010 CD356 RKO siPIK3CA 1.25nM 5/23/2011 CD326 H460 negSI 6.25nM 12/17/2010 CD357 RKO siPIK3CA 2.5nM 5/23/2011 CD327 H460 negSI 12.5nM 12/17/2010 CD358 RKO siPIK3CA 5nM 5/23/2011 CD328 H460 negSI 25nM 12/17/2010 CD359 RKO siPIK3CA 10nM 5/23/2011 CD329 H460 siPIK3CA 3.125nM 12/17/2010 CD360 RKO siPIK3CA 20nM 5/23/2011 CD330 H460 siPIK3CA 6.25nM 12/17/2010 CD361 H1975 neg Inhibitor 12/3/2010 CD331 H460 siPIK3CA 12.5nM 12/17/2010 CD362 H1975 10a inhibitor 12/3/2012 CD332 H460 siPIK3CA 25nM 12/17/2010 CD363 H1975 neg Inhibitor 25nM 1/17/2011 CD333 H460 negSI 25nM 1/14/2011 CD364 H1975 10B inhibitor 25nM 1/17/2011 CD334 H460 siPIK3CA 25nM 1/14/2011 CD365 H1299 neg inhibitor 11/7/2011 CD335 H460 negSI CFA 5/28/2011 CD366 H1299 10a inhibitor 11/7/2011 CD336 H460 siPIK3CA CFA 5/28/2011 CD367 H157 neg inhibitor 4/7/2012 CD337 H460-luc negSI 2/14/2012 CD368 H157 10a inhibitor 4/7/2012 CD338 H460-luc siRXR 2/14/2012 CD369 MDA-MB-453 neg inhibitor 4/7/2012 CD339 H460-luc siGATA6 2/14/2012 CD370 MDA-MB-453 10a inhibitor 4/7/2012 CD340 H460-luc negSI 3/2/2012 CD371 HCC1954 neg inhibitor 4/7/2012 CD341 H460-luc siGATA6 3/2/2012 CD372 HCC1954 10a inhibitor 4/7/2012
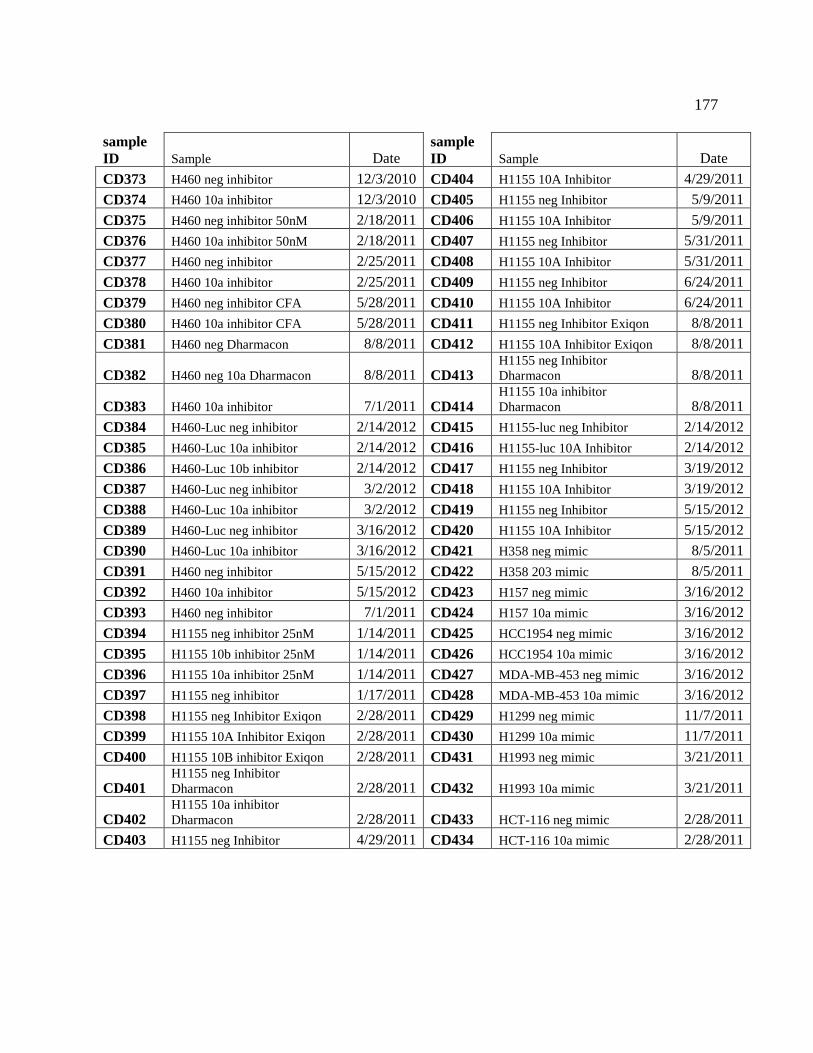
177
sample ID Sample Date
sample ID Sample Date
CD373 H460 neg inhibitor 12/3/2010 CD404 H1155 10A Inhibitor 4/29/2011 CD374 H460 10a inhibitor 12/3/2010 CD405 H1155 neg Inhibitor 5/9/2011 CD375 H460 neg inhibitor 50nM 2/18/2011 CD406 H1155 10A Inhibitor 5/9/2011 CD376 H460 10a inhibitor 50nM 2/18/2011 CD407 H1155 neg Inhibitor 5/31/2011 CD377 H460 neg inhibitor 2/25/2011 CD408 H1155 10A Inhibitor 5/31/2011 CD378 H460 10a inhibitor 2/25/2011 CD409 H1155 neg Inhibitor 6/24/2011 CD379 H460 neg inhibitor CFA 5/28/2011 CD410 H1155 10A Inhibitor 6/24/2011 CD380 H460 10a inhibitor CFA 5/28/2011 CD411 H1155 neg Inhibitor Exiqon 8/8/2011 CD381 H460 neg Dharmacon 8/8/2011 CD412 H1155 10A Inhibitor Exiqon 8/8/2011
CD382 H460 neg 10a Dharmacon 8/8/2011 CD413 H1155 neg Inhibitor Dharmacon 8/8/2011
CD383 H460 10a inhibitor 7/1/2011 CD414 H1155 10a inhibitor Dharmacon 8/8/2011
CD384 H460-Luc neg inhibitor 2/14/2012 CD415 H1155-luc neg Inhibitor 2/14/2012 CD385 H460-Luc 10a inhibitor 2/14/2012 CD416 H1155-luc 10A Inhibitor 2/14/2012 CD386 H460-Luc 10b inhibitor 2/14/2012 CD417 H1155 neg Inhibitor 3/19/2012 CD387 H460-Luc neg inhibitor 3/2/2012 CD418 H1155 10A Inhibitor 3/19/2012 CD388 H460-Luc 10a inhibitor 3/2/2012 CD419 H1155 neg Inhibitor 5/15/2012 CD389 H460-Luc neg inhibitor 3/16/2012 CD420 H1155 10A Inhibitor 5/15/2012 CD390 H460-Luc 10a inhibitor 3/16/2012 CD421 H358 neg mimic 8/5/2011 CD391 H460 neg inhibitor 5/15/2012 CD422 H358 203 mimic 8/5/2011 CD392 H460 10a inhibitor 5/15/2012 CD423 H157 neg mimic 3/16/2012 CD393 H460 neg inhibitor 7/1/2011 CD424 H157 10a mimic 3/16/2012 CD394 H1155 neg inhibitor 25nM 1/14/2011 CD425 HCC1954 neg mimic 3/16/2012 CD395 H1155 10b inhibitor 25nM 1/14/2011 CD426 HCC1954 10a mimic 3/16/2012 CD396 H1155 10a inhibitor 25nM 1/14/2011 CD427 MDA-MB-453 neg mimic 3/16/2012 CD397 H1155 neg inhibitor 1/17/2011 CD428 MDA-MB-453 10a mimic 3/16/2012 CD398 H1155 neg Inhibitor Exiqon 2/28/2011 CD429 H1299 neg mimic 11/7/2011 CD399 H1155 10A Inhibitor Exiqon 2/28/2011 CD430 H1299 10a mimic 11/7/2011 CD400 H1155 10B inhibitor Exiqon 2/28/2011 CD431 H1993 neg mimic 3/21/2011
CD401 H1155 neg Inhibitor Dharmacon 2/28/2011 CD432 H1993 10a mimic 3/21/2011
CD402 H1155 10a inhibitor Dharmacon 2/28/2011 CD433 HCT-116 neg mimic 2/28/2011
CD403 H1155 neg Inhibitor 4/29/2011 CD434 HCT-116 10a mimic 2/28/2011
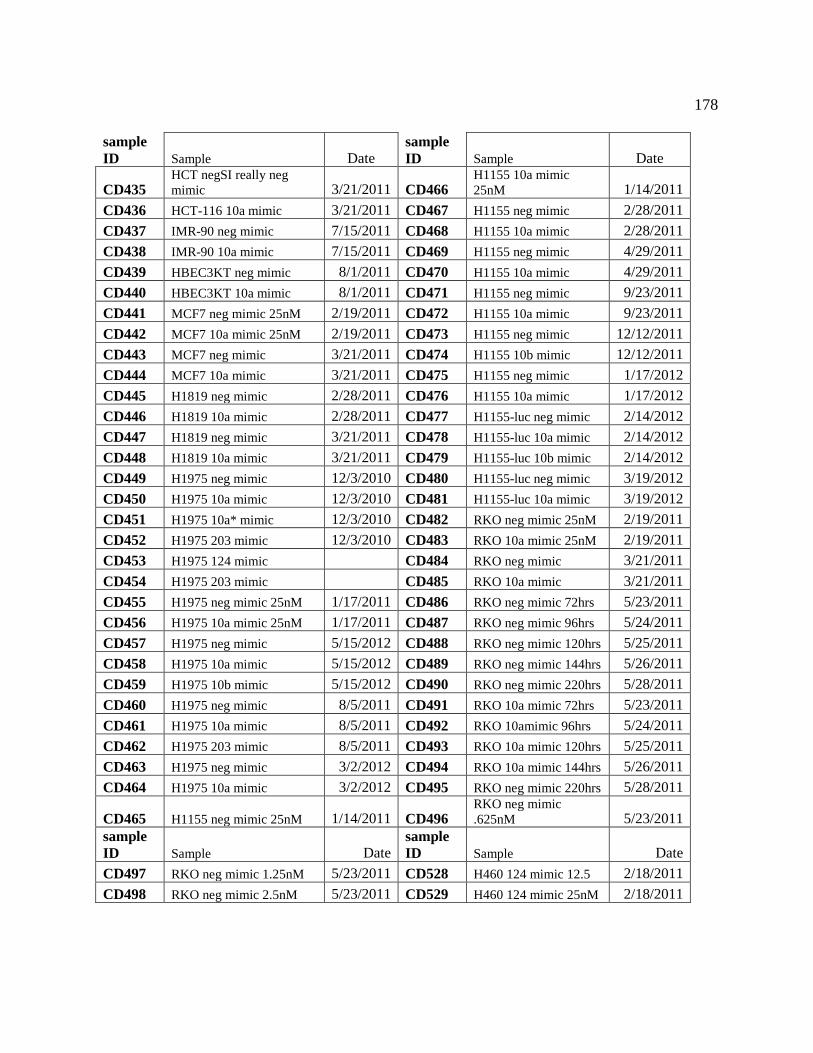
178
sample ID Sample Date
sample ID Sample Date
CD435 HCT negSI really neg mimic 3/21/2011 CD466
H1155 10a mimic 25nM 1/14/2011
CD436 HCT-116 10a mimic 3/21/2011 CD467 H1155 neg mimic 2/28/2011 CD437 IMR-90 neg mimic 7/15/2011 CD468 H1155 10a mimic 2/28/2011 CD438 IMR-90 10a mimic 7/15/2011 CD469 H1155 neg mimic 4/29/2011 CD439 HBEC3KT neg mimic 8/1/2011 CD470 H1155 10a mimic 4/29/2011 CD440 HBEC3KT 10a mimic 8/1/2011 CD471 H1155 neg mimic 9/23/2011 CD441 MCF7 neg mimic 25nM 2/19/2011 CD472 H1155 10a mimic 9/23/2011 CD442 MCF7 10a mimic 25nM 2/19/2011 CD473 H1155 neg mimic 12/12/2011 CD443 MCF7 neg mimic 3/21/2011 CD474 H1155 10b mimic 12/12/2011 CD444 MCF7 10a mimic 3/21/2011 CD475 H1155 neg mimic 1/17/2012 CD445 H1819 neg mimic 2/28/2011 CD476 H1155 10a mimic 1/17/2012 CD446 H1819 10a mimic 2/28/2011 CD477 H1155-luc neg mimic 2/14/2012 CD447 H1819 neg mimic 3/21/2011 CD478 H1155-luc 10a mimic 2/14/2012 CD448 H1819 10a mimic 3/21/2011 CD479 H1155-luc 10b mimic 2/14/2012 CD449 H1975 neg mimic 12/3/2010 CD480 H1155-luc neg mimic 3/19/2012 CD450 H1975 10a mimic 12/3/2010 CD481 H1155-luc 10a mimic 3/19/2012 CD451 H1975 10a* mimic 12/3/2010 CD482 RKO neg mimic 25nM 2/19/2011 CD452 H1975 203 mimic 12/3/2010 CD483 RKO 10a mimic 25nM 2/19/2011 CD453 H1975 124 mimic CD484 RKO neg mimic 3/21/2011 CD454 H1975 203 mimic CD485 RKO 10a mimic 3/21/2011 CD455 H1975 neg mimic 25nM 1/17/2011 CD486 RKO neg mimic 72hrs 5/23/2011 CD456 H1975 10a mimic 25nM 1/17/2011 CD487 RKO neg mimic 96hrs 5/24/2011 CD457 H1975 neg mimic 5/15/2012 CD488 RKO neg mimic 120hrs 5/25/2011 CD458 H1975 10a mimic 5/15/2012 CD489 RKO neg mimic 144hrs 5/26/2011 CD459 H1975 10b mimic 5/15/2012 CD490 RKO neg mimic 220hrs 5/28/2011 CD460 H1975 neg mimic 8/5/2011 CD491 RKO 10a mimic 72hrs 5/23/2011 CD461 H1975 10a mimic 8/5/2011 CD492 RKO 10amimic 96hrs 5/24/2011 CD462 H1975 203 mimic 8/5/2011 CD493 RKO 10a mimic 120hrs 5/25/2011 CD463 H1975 neg mimic 3/2/2012 CD494 RKO 10a mimic 144hrs 5/26/2011 CD464 H1975 10a mimic 3/2/2012 CD495 RKO neg mimic 220hrs 5/28/2011
CD465 H1155 neg mimic 25nM 1/14/2011 CD496 RKO neg mimic .625nM 5/23/2011
sample ID Sample Date
sample ID Sample Date
CD497 RKO neg mimic 1.25nM 5/23/2011 CD528 H460 124 mimic 12.5 2/18/2011 CD498 RKO neg mimic 2.5nM 5/23/2011 CD529 H460 124 mimic 25nM 2/18/2011
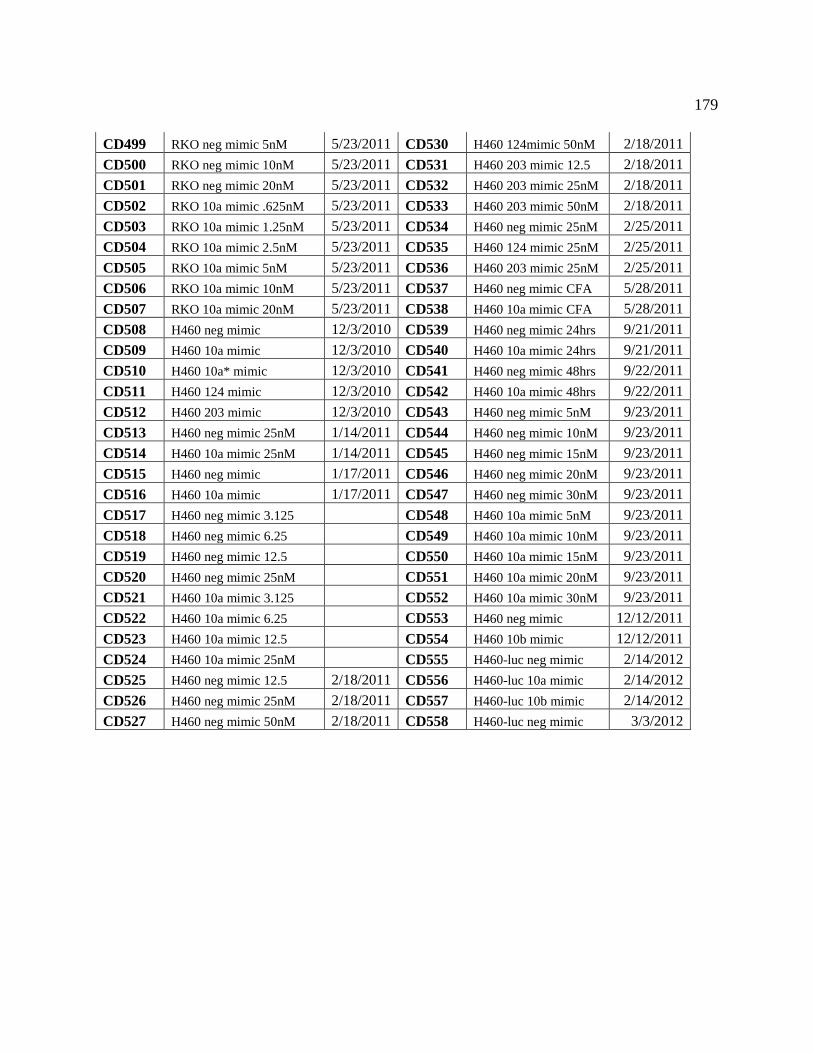
179
CD499 RKO neg mimic 5nM 5/23/2011 CD530 H460 124mimic 50nM 2/18/2011 CD500 RKO neg mimic 10nM 5/23/2011 CD531 H460 203 mimic 12.5 2/18/2011 CD501 RKO neg mimic 20nM 5/23/2011 CD532 H460 203 mimic 25nM 2/18/2011 CD502 RKO 10a mimic .625nM 5/23/2011 CD533 H460 203 mimic 50nM 2/18/2011 CD503 RKO 10a mimic 1.25nM 5/23/2011 CD534 H460 neg mimic 25nM 2/25/2011 CD504 RKO 10a mimic 2.5nM 5/23/2011 CD535 H460 124 mimic 25nM 2/25/2011 CD505 RKO 10a mimic 5nM 5/23/2011 CD536 H460 203 mimic 25nM 2/25/2011 CD506 RKO 10a mimic 10nM 5/23/2011 CD537 H460 neg mimic CFA 5/28/2011 CD507 RKO 10a mimic 20nM 5/23/2011 CD538 H460 10a mimic CFA 5/28/2011 CD508 H460 neg mimic 12/3/2010 CD539 H460 neg mimic 24hrs 9/21/2011 CD509 H460 10a mimic 12/3/2010 CD540 H460 10a mimic 24hrs 9/21/2011 CD510 H460 10a* mimic 12/3/2010 CD541 H460 neg mimic 48hrs 9/22/2011 CD511 H460 124 mimic 12/3/2010 CD542 H460 10a mimic 48hrs 9/22/2011 CD512 H460 203 mimic 12/3/2010 CD543 H460 neg mimic 5nM 9/23/2011 CD513 H460 neg mimic 25nM 1/14/2011 CD544 H460 neg mimic 10nM 9/23/2011 CD514 H460 10a mimic 25nM 1/14/2011 CD545 H460 neg mimic 15nM 9/23/2011 CD515 H460 neg mimic 1/17/2011 CD546 H460 neg mimic 20nM 9/23/2011 CD516 H460 10a mimic 1/17/2011 CD547 H460 neg mimic 30nM 9/23/2011 CD517 H460 neg mimic 3.125 CD548 H460 10a mimic 5nM 9/23/2011 CD518 H460 neg mimic 6.25 CD549 H460 10a mimic 10nM 9/23/2011 CD519 H460 neg mimic 12.5 CD550 H460 10a mimic 15nM 9/23/2011 CD520 H460 neg mimic 25nM CD551 H460 10a mimic 20nM 9/23/2011 CD521 H460 10a mimic 3.125 CD552 H460 10a mimic 30nM 9/23/2011 CD522 H460 10a mimic 6.25 CD553 H460 neg mimic 12/12/2011 CD523 H460 10a mimic 12.5 CD554 H460 10b mimic 12/12/2011 CD524 H460 10a mimic 25nM CD555 H460-luc neg mimic 2/14/2012 CD525 H460 neg mimic 12.5 2/18/2011 CD556 H460-luc 10a mimic 2/14/2012 CD526 H460 neg mimic 25nM 2/18/2011 CD557 H460-luc 10b mimic 2/14/2012 CD527 H460 neg mimic 50nM 2/18/2011 CD558 H460-luc neg mimic 3/3/2012
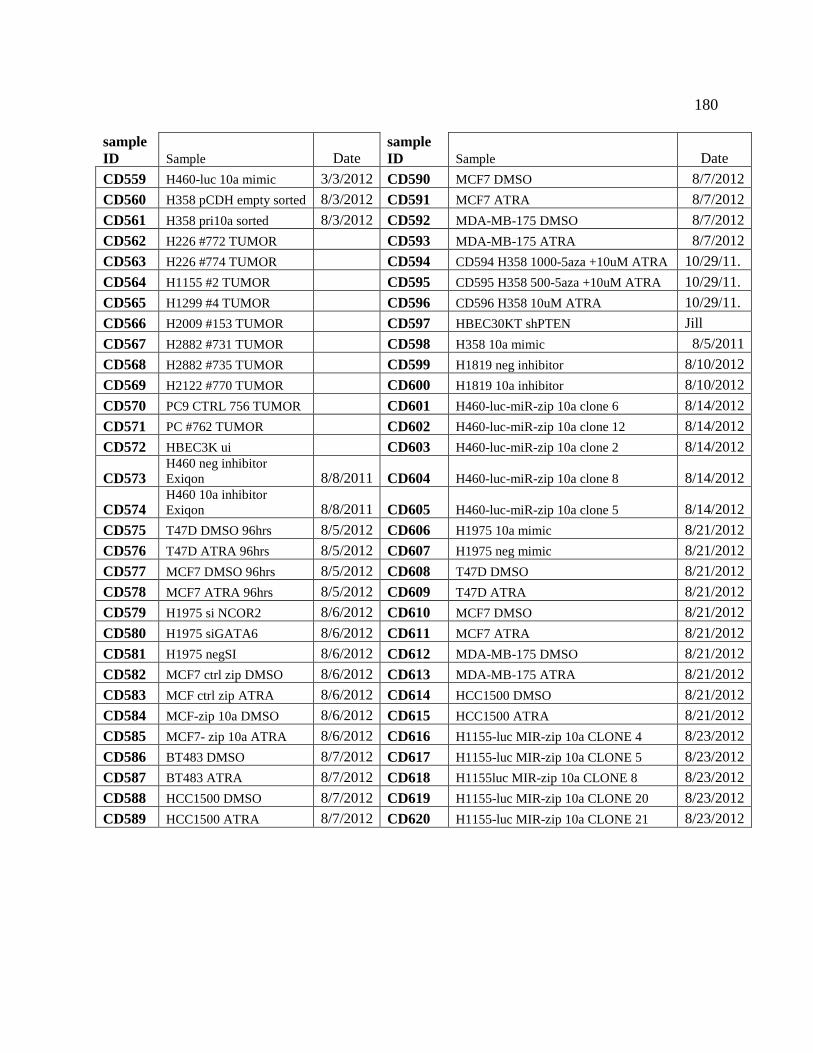
180
sample ID Sample Date
sample ID Sample Date
CD559 H460-luc 10a mimic 3/3/2012 CD590 MCF7 DMSO 8/7/2012 CD560 H358 pCDH empty sorted 8/3/2012 CD591 MCF7 ATRA 8/7/2012 CD561 H358 pri10a sorted 8/3/2012 CD592 MDA-MB-175 DMSO 8/7/2012 CD562 H226 #772 TUMOR CD593 MDA-MB-175 ATRA 8/7/2012 CD563 H226 #774 TUMOR CD594 CD594 H358 1000-5aza +10uM ATRA 10/29/11. CD564 H1155 #2 TUMOR CD595 CD595 H358 500-5aza +10uM ATRA 10/29/11. CD565 H1299 #4 TUMOR CD596 CD596 H358 10uM ATRA 10/29/11. CD566 H2009 #153 TUMOR CD597 HBEC30KT shPTEN Jill CD567 H2882 #731 TUMOR CD598 H358 10a mimic 8/5/2011 CD568 H2882 #735 TUMOR CD599 H1819 neg inhibitor 8/10/2012 CD569 H2122 #770 TUMOR CD600 H1819 10a inhibitor 8/10/2012 CD570 PC9 CTRL 756 TUMOR CD601 H460-luc-miR-zip 10a clone 6 8/14/2012 CD571 PC #762 TUMOR CD602 H460-luc-miR-zip 10a clone 12 8/14/2012 CD572 HBEC3K ui CD603 H460-luc-miR-zip 10a clone 2 8/14/2012
CD573 H460 neg inhibitor Exiqon 8/8/2011 CD604 H460-luc-miR-zip 10a clone 8 8/14/2012
CD574 H460 10a inhibitor Exiqon 8/8/2011 CD605 H460-luc-miR-zip 10a clone 5 8/14/2012
CD575 T47D DMSO 96hrs 8/5/2012 CD606 H1975 10a mimic 8/21/2012 CD576 T47D ATRA 96hrs 8/5/2012 CD607 H1975 neg mimic 8/21/2012 CD577 MCF7 DMSO 96hrs 8/5/2012 CD608 T47D DMSO 8/21/2012 CD578 MCF7 ATRA 96hrs 8/5/2012 CD609 T47D ATRA 8/21/2012 CD579 H1975 si NCOR2 8/6/2012 CD610 MCF7 DMSO 8/21/2012 CD580 H1975 siGATA6 8/6/2012 CD611 MCF7 ATRA 8/21/2012 CD581 H1975 negSI 8/6/2012 CD612 MDA-MB-175 DMSO 8/21/2012 CD582 MCF7 ctrl zip DMSO 8/6/2012 CD613 MDA-MB-175 ATRA 8/21/2012 CD583 MCF ctrl zip ATRA 8/6/2012 CD614 HCC1500 DMSO 8/21/2012 CD584 MCF-zip 10a DMSO 8/6/2012 CD615 HCC1500 ATRA 8/21/2012 CD585 MCF7- zip 10a ATRA 8/6/2012 CD616 H1155-luc MIR-zip 10a CLONE 4 8/23/2012 CD586 BT483 DMSO 8/7/2012 CD617 H1155-luc MIR-zip 10a CLONE 5 8/23/2012 CD587 BT483 ATRA 8/7/2012 CD618 H1155luc MIR-zip 10a CLONE 8 8/23/2012 CD588 HCC1500 DMSO 8/7/2012 CD619 H1155-luc MIR-zip 10a CLONE 20 8/23/2012 CD589 HCC1500 ATRA 8/7/2012 CD620 H1155-luc MIR-zip 10a CLONE 21 8/23/2012
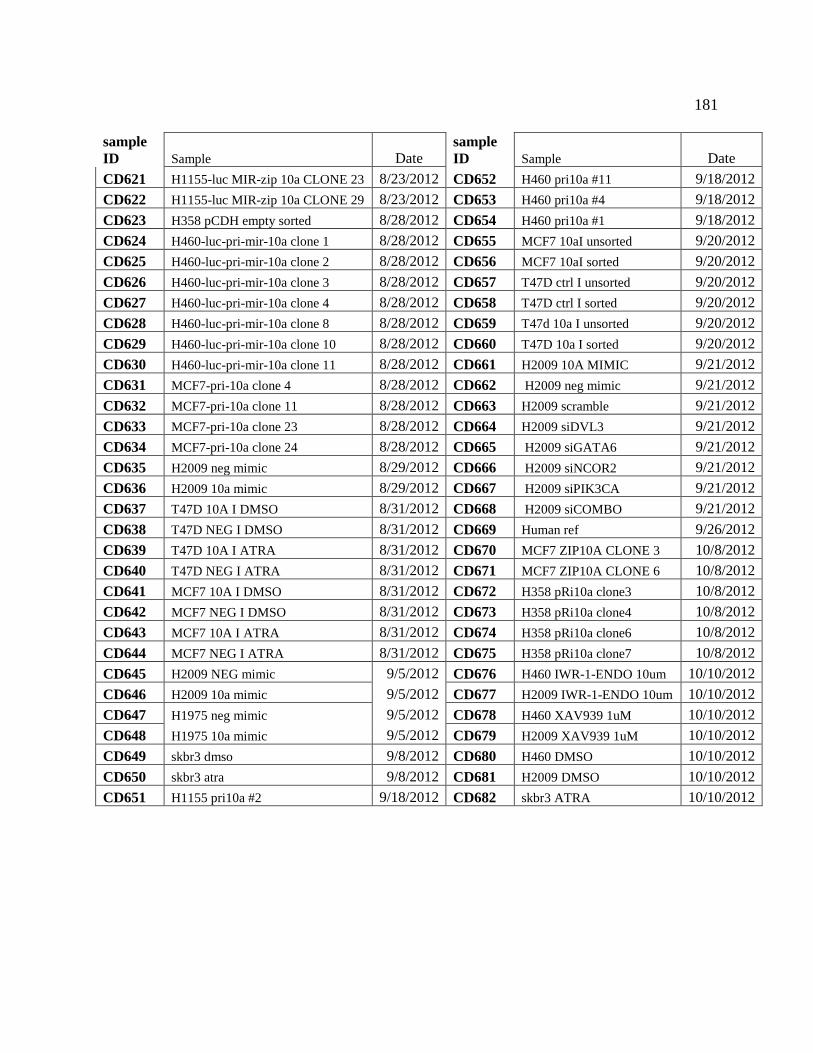
181
sample ID Sample Date
sample ID Sample Date
CD621 H1155-luc MIR-zip 10a CLONE 23 8/23/2012 CD652 H460 pri10a #11 9/18/2012 CD622 H1155-luc MIR-zip 10a CLONE 29 8/23/2012 CD653 H460 pri10a #4 9/18/2012 CD623 H358 pCDH empty sorted 8/28/2012 CD654 H460 pri10a #1 9/18/2012 CD624 H460-luc-pri-mir-10a clone 1 8/28/2012 CD655 MCF7 10aI unsorted 9/20/2012 CD625 H460-luc-pri-mir-10a clone 2 8/28/2012 CD656 MCF7 10aI sorted 9/20/2012 CD626 H460-luc-pri-mir-10a clone 3 8/28/2012 CD657 T47D ctrl I unsorted 9/20/2012 CD627 H460-luc-pri-mir-10a clone 4 8/28/2012 CD658 T47D ctrl I sorted 9/20/2012 CD628 H460-luc-pri-mir-10a clone 8 8/28/2012 CD659 T47d 10a I unsorted 9/20/2012 CD629 H460-luc-pri-mir-10a clone 10 8/28/2012 CD660 T47D 10a I sorted 9/20/2012 CD630 H460-luc-pri-mir-10a clone 11 8/28/2012 CD661 H2009 10A MIMIC 9/21/2012 CD631 MCF7-pri-10a clone 4 8/28/2012 CD662 H2009 neg mimic 9/21/2012 CD632 MCF7-pri-10a clone 11 8/28/2012 CD663 H2009 scramble 9/21/2012 CD633 MCF7-pri-10a clone 23 8/28/2012 CD664 H2009 siDVL3 9/21/2012 CD634 MCF7-pri-10a clone 24 8/28/2012 CD665 H2009 siGATA6 9/21/2012 CD635 H2009 neg mimic 8/29/2012 CD666 H2009 siNCOR2 9/21/2012 CD636 H2009 10a mimic 8/29/2012 CD667 H2009 siPIK3CA 9/21/2012 CD637 T47D 10A I DMSO 8/31/2012 CD668 H2009 siCOMBO 9/21/2012 CD638 T47D NEG I DMSO 8/31/2012 CD669 Human ref 9/26/2012 CD639 T47D 10A I ATRA 8/31/2012 CD670 MCF7 ZIP10A CLONE 3 10/8/2012 CD640 T47D NEG I ATRA 8/31/2012 CD671 MCF7 ZIP10A CLONE 6 10/8/2012 CD641 MCF7 10A I DMSO 8/31/2012 CD672 H358 pRi10a clone3 10/8/2012 CD642 MCF7 NEG I DMSO 8/31/2012 CD673 H358 pRi10a clone4 10/8/2012 CD643 MCF7 10A I ATRA 8/31/2012 CD674 H358 pRi10a clone6 10/8/2012 CD644 MCF7 NEG I ATRA 8/31/2012 CD675 H358 pRi10a clone7 10/8/2012 CD645 H2009 NEG mimic 9/5/2012 CD676 H460 IWR-1-ENDO 10um 10/10/2012 CD646 H2009 10a mimic 9/5/2012 CD677 H2009 IWR-1-ENDO 10um 10/10/2012 CD647 H1975 neg mimic 9/5/2012 CD678 H460 XAV939 1uM 10/10/2012 CD648 H1975 10a mimic 9/5/2012 CD679 H2009 XAV939 1uM 10/10/2012 CD649 skbr3 dmso 9/8/2012 CD680 H460 DMSO 10/10/2012 CD650 skbr3 atra 9/8/2012 CD681 H2009 DMSO 10/10/2012 CD651 H1155 pri10a #2 9/18/2012 CD682 skbr3 ATRA 10/10/2012
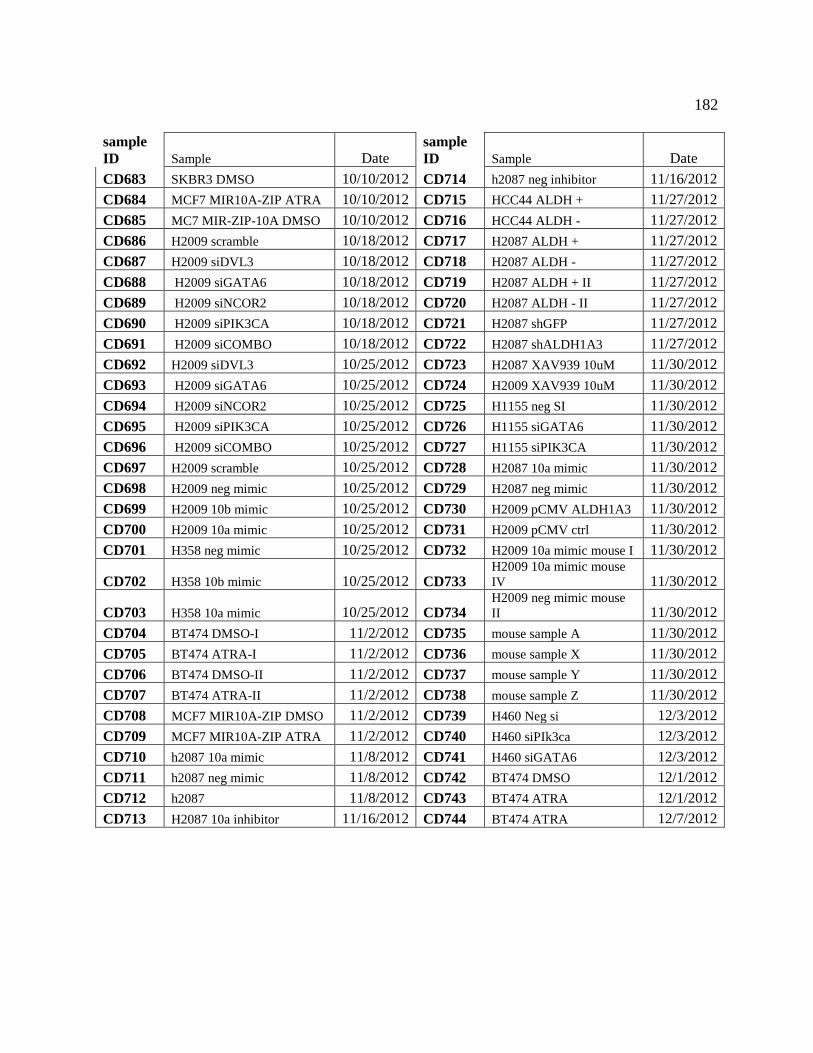
182
sample ID Sample Date
sample ID Sample Date
CD683 SKBR3 DMSO 10/10/2012 CD714 h2087 neg inhibitor 11/16/2012 CD684 MCF7 MIR10A-ZIP ATRA 10/10/2012 CD715 HCC44 ALDH + 11/27/2012 CD685 MC7 MIR-ZIP-10A DMSO 10/10/2012 CD716 HCC44 ALDH - 11/27/2012 CD686 H2009 scramble 10/18/2012 CD717 H2087 ALDH + 11/27/2012 CD687 H2009 siDVL3 10/18/2012 CD718 H2087 ALDH - 11/27/2012 CD688 H2009 siGATA6 10/18/2012 CD719 H2087 ALDH + II 11/27/2012 CD689 H2009 siNCOR2 10/18/2012 CD720 H2087 ALDH - II 11/27/2012 CD690 H2009 siPIK3CA 10/18/2012 CD721 H2087 shGFP 11/27/2012 CD691 H2009 siCOMBO 10/18/2012 CD722 H2087 shALDH1A3 11/27/2012 CD692 H2009 siDVL3 10/25/2012 CD723 H2087 XAV939 10uM 11/30/2012 CD693 H2009 siGATA6 10/25/2012 CD724 H2009 XAV939 10uM 11/30/2012 CD694 H2009 siNCOR2 10/25/2012 CD725 H1155 neg SI 11/30/2012 CD695 H2009 siPIK3CA 10/25/2012 CD726 H1155 siGATA6 11/30/2012 CD696 H2009 siCOMBO 10/25/2012 CD727 H1155 siPIK3CA 11/30/2012 CD697 H2009 scramble 10/25/2012 CD728 H2087 10a mimic 11/30/2012 CD698 H2009 neg mimic 10/25/2012 CD729 H2087 neg mimic 11/30/2012 CD699 H2009 10b mimic 10/25/2012 CD730 H2009 pCMV ALDH1A3 11/30/2012 CD700 H2009 10a mimic 10/25/2012 CD731 H2009 pCMV ctrl 11/30/2012 CD701 H358 neg mimic 10/25/2012 CD732 H2009 10a mimic mouse I 11/30/2012
CD702 H358 10b mimic 10/25/2012 CD733 H2009 10a mimic mouse IV 11/30/2012
CD703 H358 10a mimic 10/25/2012 CD734 H2009 neg mimic mouse II 11/30/2012
CD704 BT474 DMSO-I 11/2/2012 CD735 mouse sample A 11/30/2012 CD705 BT474 ATRA-I 11/2/2012 CD736 mouse sample X 11/30/2012 CD706 BT474 DMSO-II 11/2/2012 CD737 mouse sample Y 11/30/2012 CD707 BT474 ATRA-II 11/2/2012 CD738 mouse sample Z 11/30/2012 CD708 MCF7 MIR10A-ZIP DMSO 11/2/2012 CD739 H460 Neg si 12/3/2012 CD709 MCF7 MIR10A-ZIP ATRA 11/2/2012 CD740 H460 siPIk3ca 12/3/2012 CD710 h2087 10a mimic 11/8/2012 CD741 H460 siGATA6 12/3/2012 CD711 h2087 neg mimic 11/8/2012 CD742 BT474 DMSO 12/1/2012 CD712 h2087 11/8/2012 CD743 BT474 ATRA 12/1/2012 CD713 H2087 10a inhibitor 11/16/2012 CD744 BT474 ATRA 12/7/2012
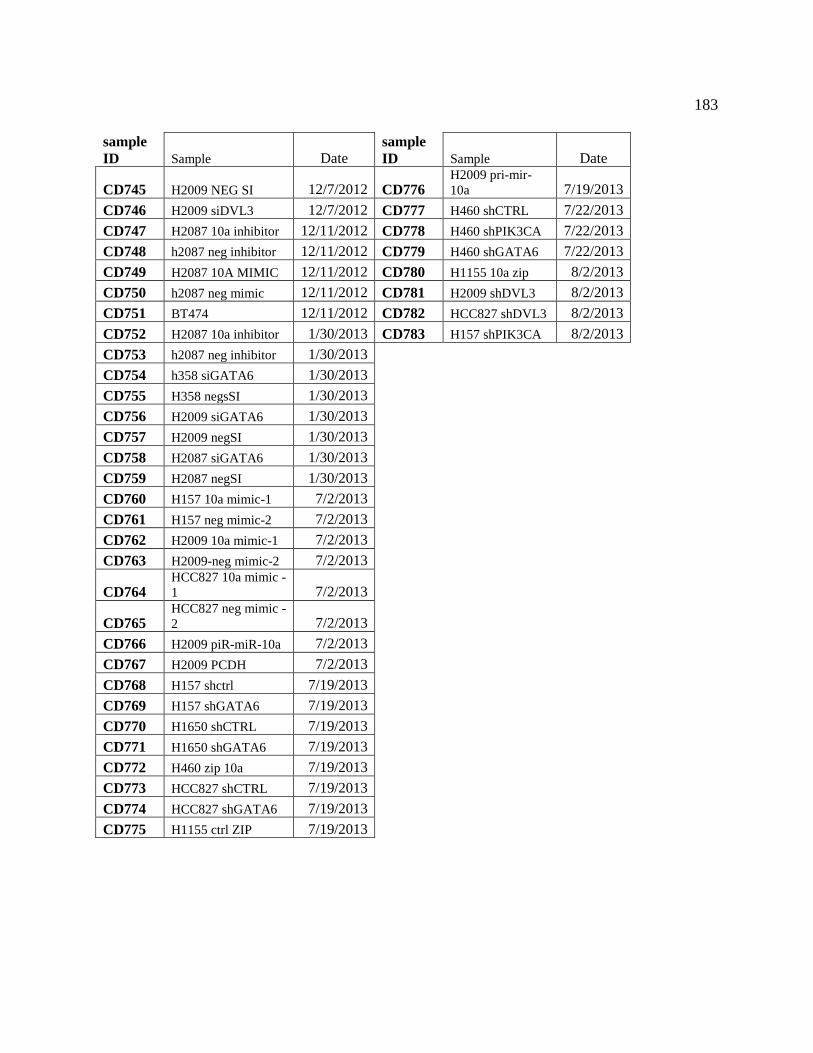
183
sample ID Sample Date
sample ID Sample Date
CD745 H2009 NEG SI 12/7/2012 CD776 H2009 pri-mir-10a 7/19/2013
CD746 H2009 siDVL3 12/7/2012 CD777 H460 shCTRL 7/22/2013 CD747 H2087 10a inhibitor 12/11/2012 CD778 H460 shPIK3CA 7/22/2013 CD748 h2087 neg inhibitor 12/11/2012 CD779 H460 shGATA6 7/22/2013 CD749 H2087 10A MIMIC 12/11/2012 CD780 H1155 10a zip 8/2/2013 CD750 h2087 neg mimic 12/11/2012 CD781 H2009 shDVL3 8/2/2013 CD751 BT474 12/11/2012 CD782 HCC827 shDVL3 8/2/2013 CD752 H2087 10a inhibitor 1/30/2013 CD783 H157 shPIK3CA 8/2/2013 CD753 h2087 neg inhibitor 1/30/2013
CD754 h358 siGATA6 1/30/2013 CD755 H358 negsSI 1/30/2013 CD756 H2009 siGATA6 1/30/2013 CD757 H2009 negSI 1/30/2013 CD758 H2087 siGATA6 1/30/2013 CD759 H2087 negSI 1/30/2013 CD760 H157 10a mimic-1 7/2/2013 CD761 H157 neg mimic-2 7/2/2013 CD762 H2009 10a mimic-1 7/2/2013 CD763 H2009-neg mimic-2 7/2/2013
CD764 HCC827 10a mimic -1 7/2/2013
CD765
HCC827 neg mimic -2 7/2/2013
CD766 H2009 piR-miR-10a 7/2/2013 CD767 H2009 PCDH 7/2/2013 CD768 H157 shctrl 7/19/2013 CD769 H157 shGATA6 7/19/2013 CD770 H1650 shCTRL 7/19/2013 CD771 H1650 shGATA6 7/19/2013 CD772 H460 zip 10a 7/19/2013 CD773 HCC827 shCTRL 7/19/2013 CD774 HCC827 shGATA6 7/19/2013 CD775 H1155 ctrl ZIP 7/19/2013
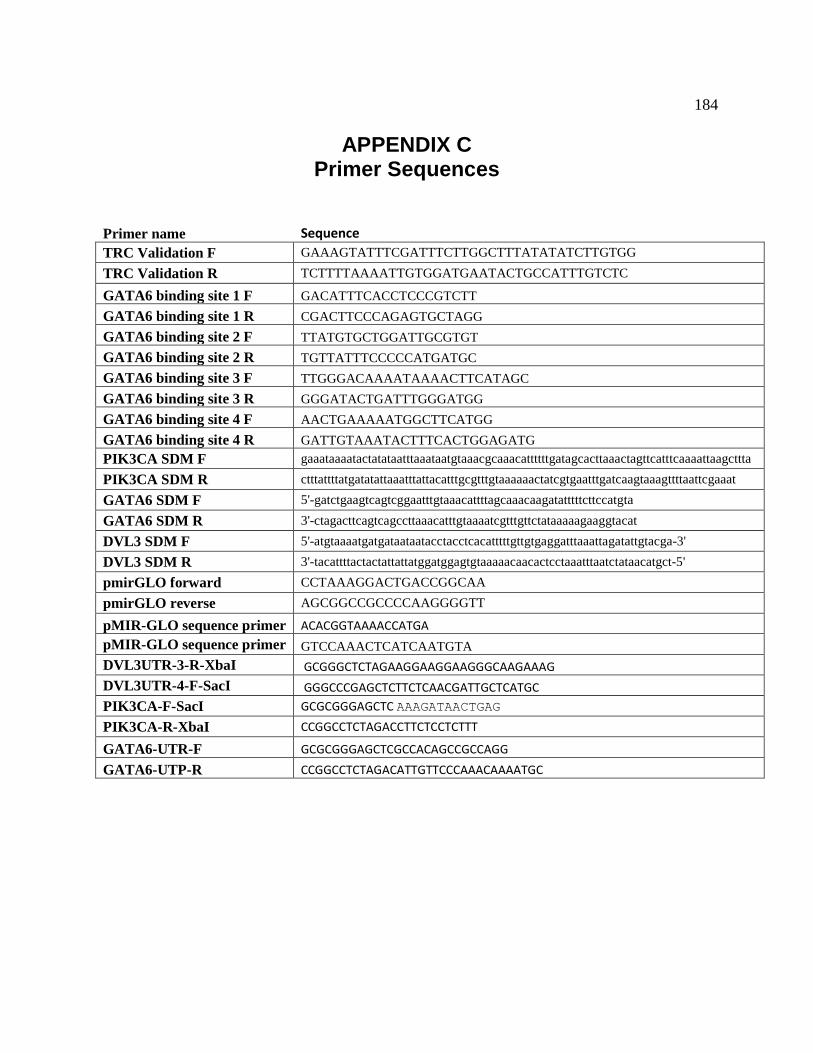
184
APPENDIX C Primer Sequences
Primer name Sequence TRC Validation F GAAAGTATTTCGATTTCTTGGCTTTATATATCTTGTGG TRC Validation R TCTTTTAAAATTGTGGATGAATACTGCCATTTGTCTC
GATA6 binding site 1 F GACATTTCACCTCCCGTCTT GATA6 binding site 1 R CGACTTCCCAGAGTGCTAGG GATA6 binding site 2 F TTATGTGCTGGATTGCGTGT GATA6 binding site 2 R TGTTATTTCCCCCATGATGC GATA6 binding site 3 F TTGGGACAAAATAAAACTTCATAGC GATA6 binding site 3 R GGGATACTGATTTGGGATGG GATA6 binding site 4 F AACTGAAAAATGGCTTCATGG GATA6 binding site 4 R GATTGTAAATACTTTCACTGGAGATG PIK3CA SDM F gaaataaaatactatataatttaaataatgtaaacgcaaacattttttgatagcacttaaactagttcatttcaaaattaagcttta PIK3CA SDM R ctttattttatgatatattaaatttattacatttgcgtttgtaaaaaactatcgtgaatttgatcaagtaaagttttaattcgaaat GATA6 SDM F 5'-gatctgaagtcagtcggaatttgtaaacattttagcaaacaagatatttttcttccatgta GATA6 SDM R 3'-ctagacttcagtcagccttaaacatttgtaaaatcgtttgttctataaaaagaaggtacat DVL3 SDM F 5'-atgtaaaatgatgataataatacctacctcacatttttgttgtgaggatttaaattagatattgtacga-3' DVL3 SDM R 3'-tacattttactactattattatggatggagtgtaaaaacaacactcctaaatttaatctataacatgct-5' pmirGLO forward CCTAAAGGACTGACCGGCAA pmirGLO reverse AGCGGCCGCCCCAAGGGGTT
pMIR-GLO sequence primer ACACGGTAAAACCATGA pMIR-GLO sequence primer GTCCAAACTCATCAATGTA DVL3UTR-3-R-XbaI GCGGGCTCTAGAAGGAAGGAAGGGCAAGAAAG DVL3UTR-4-F-SacI GGGCCCGAGCTCTTCTCAACGATTGCTCATGC PIK3CA-F-SacI GCGCGGGAGCTC AAAGATAACTGAG
PIK3CA-R-XbaI CCGGCCTCTAGACCTTCTCCTCTTT
GATA6-UTR-F GCGCGGGAGCTCGCCACAGCCGCCAGG
GATA6-UTP-R CCGGCCTCTAGACATTGTTCCCAAACAAAATGC

185
APPENDIX D Potential MiRNA regulation of PI3KCA
Target Scan Microcosm miRNA.org miRbase miRbase miRbase miRbase miRbase miR-203 miR-202* miR-590-3p miR-1289 miR-517c miR-454 miR-186* miR-320b
miR-10 miR-143* miR-203 miR-302d miR-584 miR-491-3p miR-450a
miR-450b-3p
miR-124/506 miR-302a miR-520a-3p miR-370 miR-1277 miR-548i miR-574-5p miR-629
miR-525-5p miR-520d-3p miR-202*
miR-376a* miR-24-1*
miR-548c-5p miR-936
miR-155 miR-302a miR-302a miR-519e miR-451 miR-609
miR-1207-5p
miR-302b miR-302b miR-302b miR-103
miR-516a-5p miR-621 miR-1254
miR-302d miR-302c miR-1282 miR-1250 miR-1205 miR-1288 miR-214*
miR-942 miR-302d miR-525-5p miR-384 miR-152 miR-1304
miR-519c-3p
miR-373 miR-520b miR-1206
miR-769-3p
miR-19b-2*
miR-139-5p
miR-542-5p
miR-576-5p miR-520c-3p miR-573 miR-187 miR-30c miR-196a miR-553
miR-512-3p miR-520e miR-32* miR-19a miR-449b miR-198 miR-1201
miR-370 miR-373 miR-302c miR-19b miR-517a miR-23a* miR-374b
miR-27b* miR-302e miR-302e miR-448
miR-518d-5p
miR-371-3p miR-495
miR-302c miR-372 miR-543 let-7c* miR-518e*
miR-450b-5p miR-544
miR-561 miR-155 miR-942 miR-1267 miR-519a* miR-541*
miR-654-5p
miR-520a-5p miR-10b miR-143* miR-1308
miR-519b-5p
miR-548c-3p miR-892a
miR-9* miR-10a miR-302b*
miR-302d*
miR-519c-5p
miR-576-3p miR-10a
miR-148a miR-370 miR-582-3p miR-504
miR-520c-5p miR-642 miR-1185
miR-143 miR-384
miR-519b-3p
miR-590-3p miR-522*
miR-129-5p miR-124
miR-372 miR-148a miR-27b* miR-1183 miR-523* miR-208b miR-1245
miR-152 miR-148b miR-890
miR-193a-5p miR-526a miR-635 miR-1252
miR-193a-5p miR-152 miR-143
miR-548a-5p miR-1302
miR-135a* miR-1322
miR-376a* miR-320a miR-675 miR-620 miR-1303 miR-141* miR-182
miR-422a miR-320b miR-519a
miR-146b-3p
miR-299-5p
miR-142-3p miR-196b
miR-135b miR-320c miR-518f* miR-30a miR-637 miR-1827 miR-22
miR-582-3p miR-320d miR-9* miR-449a let-7e miR-183* miR-
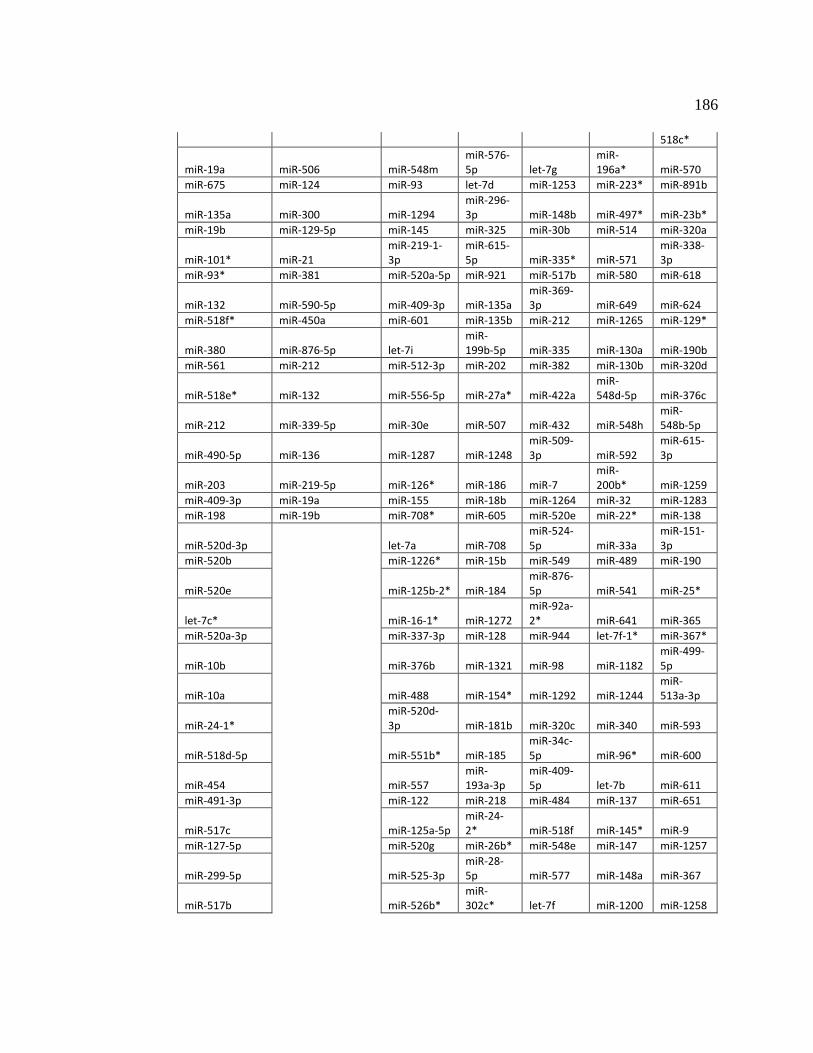
186
518c*
miR-19a miR-506 miR-548m
miR-576-5p let-7g
miR-196a* miR-570
miR-675 miR-124 miR-93 let-7d miR-1253 miR-223* miR-891b
miR-135a miR-300 miR-1294
miR-296-3p miR-148b miR-497* miR-23b*
miR-19b miR-129-5p miR-145 miR-325 miR-30b miR-514 miR-320a
miR-101* miR-21
miR-219-1-3p
miR-615-5p miR-335* miR-571
miR-338-3p
miR-93* miR-381 miR-520a-5p miR-921 miR-517b miR-580 miR-618
miR-132 miR-590-5p miR-409-3p miR-135a
miR-369-3p miR-649 miR-624
miR-518f* miR-450a miR-601 miR-135b miR-212 miR-1265 miR-129*
miR-380 miR-876-5p let-7i
miR-199b-5p miR-335 miR-130a miR-190b
miR-561 miR-212 miR-512-3p miR-202 miR-382 miR-130b miR-320d
miR-518e* miR-132 miR-556-5p miR-27a* miR-422a
miR-548d-5p miR-376c
miR-212 miR-339-5p miR-30e miR-507 miR-432 miR-548h
miR-548b-5p
miR-490-5p miR-136 miR-1287 miR-1248
miR-509-3p miR-592
miR-615-3p
miR-203 miR-219-5p miR-126* miR-186 miR-7
miR-200b* miR-1259
miR-409-3p miR-19a miR-155 miR-18b miR-1264 miR-32 miR-1283
miR-198 miR-19b miR-708* miR-605 miR-520e miR-22* miR-138
miR-520d-3p
let-7a miR-708
miR-524-5p miR-33a
miR-151-3p
miR-520b
miR-1226* miR-15b miR-549 miR-489 miR-190
miR-520e
miR-125b-2* miR-184
miR-876-5p miR-541 miR-25*
let-7c*
miR-16-1* miR-1272
miR-92a-2* miR-641 miR-365
miR-520a-3p
miR-337-3p miR-128 miR-944 let-7f-1* miR-367*
miR-10b
miR-376b miR-1321 miR-98 miR-1182
miR-499-5p
miR-10a
miR-488 miR-154* miR-1292 miR-1244
miR-513a-3p
miR-24-1*
miR-520d-3p miR-181b miR-320c miR-340 miR-593
miR-518d-5p
miR-551b* miR-185
miR-34c-5p miR-96* miR-600
miR-454
miR-557
miR-193a-3p
miR-409-5p let-7b miR-611
miR-491-3p
miR-122 miR-218 miR-484 miR-137 miR-651
miR-517c
miR-125a-5p
miR-24-2* miR-518f miR-145* miR-9
miR-127-5p
miR-520g miR-26b* miR-548e miR-147 miR-1257
miR-299-5p
miR-525-3p
miR-28-5p miR-577 miR-148a miR-367
miR-517b
miR-526b*
miR-302c* let-7f miR-1200 miR-1258

187
miR-517a
miR-548g miR-328 miR-105*
miR-1255a miR-126
miR-654-3p miR-431* miR-1273 miR-1293
miR-127-3p
miR-939 miR-513b miR-1300
miR-140-5p miR-1299
miR-1184 miR-548p miR-205
miR-219-5p miR-1324
miR-1269 miR-612
miR-299-3p
miR-28-3p miR-1826
miR-153 miR-619 miR-29b miR-363 miR-18a
miR-181d miR-132 miR-302a*
miR-374a*
miR-19b-1*
miR-342-5p miR-144 miR-31 miR-376a miR-301b
miR-500
miR-181a* miR-378 miR-421 miR-586
miR-593* miR-183
miR-509-3-5p miR-431
miR-106b*
miR-610 miR-34a miR-510 miR-493* miR-1290
miR-657 miR-34b*
miR-515-5p miR-506
miR-135b*
miR-660 miR-374a miR-559
miR-182*
miR-768-5p
miR-518d-3p
miR-582-5p
miR-208a

188
BIBLIOGRAPHY
Adams, J. M. and S. Cory (2007). "The Bcl-2 apoptotic switch in cancer development and
therapy." Oncogene 26(9): 1324-1337.
Agirre, X., A. Jimenez-Velasco, E. San Jose-Eneriz, L. Garate, E. Bandres, L. Cordeu, O.
Aparicio, B. Saez, G. Navarro, A. Vilas-Zornoza, I. Perez-Roger, J. Garcia-Foncillas, A. Torres,
A. Heiniger, M. J. Calasanz, P. Fortes, J. Roman-Gomez and F. Prosper (2008). "Down-
regulation of hsa-miR-10a in chronic myeloid leukemia CD34+ cells increases USF2-mediated
cell growth." Mol Cancer Res 6(12): 1830-1840.
Ahmed, A. A., A. D. Mills, A. E. Ibrahim, J. Temple, C. Blenkiron, M. Vias, C. E. Massie, N. G.
Iyer, A. McGeoch, R. Crawford, B. Nicke, J. Downward, C. Swanton, S. D. Bell, H. M. Earl, R.
A. Laskey, C. Caldas and J. D. Brenton (2007). "The extracellular matrix protein TGFBI induces
microtubule stabilization and sensitizes ovarian cancers to paclitaxel." Cancer Cell 12(6): 514-
527.
Akiri, G., M. M. Cherian, S. Vijayakumar, G. Liu, A. Bafico and S. A. Aaronson (2009). "Wnt
pathway aberrations including autocrine Wnt activation occur at high frequency in human non-
small-cell lung carcinoma." Oncogene 28(21): 2163-2172.
Alamgeer, M., C. D. Peacock, W. Matsui, V. Ganju and D. N. Watkins (2013). "Cancer stem
cells in lung cancer: Evidence and controversies." Respirology 18(5): 757-764.
Androutsellis-Theotokis, A., R. R. Leker, F. Soldner, D. J. Hoeppner, R. Ravin, S. W. Poser, M.
A. Rueger, S. K. Bae, R. Kittappa and R. D. McKay (2006). "Notch signalling regulates stem
cell numbers in vitro and in vivo." Nature 442(7104): 823-826.
Aqeilan, R. I., G. A. Calin and C. M. Croce (2010). "miR-15a and miR-16-1 in cancer:
discovery, function and future perspectives." Cell Death Differ 17(2): 215-220.

189
Artandi, S. E. and R. A. DePinho (2010). "Telomeres and telomerase in cancer." Carcinogenesis
31(1): 9-18.
bai, R., G. Pettit and E. Hamel (1990). "Binding of dolastatin 10 to tubulin at a distinct site for
peptide antimitotic agents near the exchangeable nucleotide and vinca alkaloid sites." J Biol
Chem.
Bai, R., G. R. Pettit and E. Hamel (1990). "Binding of dolastatin 10 to tubulin at a distinct site
for peptide antimitotic agents near the exchangeable nucleotide and vinca alkaloid sites." Journal
of Biological Chemistry 265(28): 17141-17149.
Bandi, N., S. Zbinden, M. Gugger, M. Arnold, V. Kocher, L. Hasan, A. Kappeler, T. Brunner
and E. Vassella (2009). "miR-15a and miR-16 are implicated in cell cycle regulation in a Rb-
dependent manner and are frequently deleted or down-regulated in non-small cell lung cancer."
Cancer Res 69(13): 5553-5559.
Bartel, D. P. (2009). "MicroRNAs: target recognition and regulatory functions." Cell 136(2):
215-233.
Bernstein, E., S. Y. Kim, M. A. Carmell, E. P. Murchison, H. Alcorn, M. Z. Li, A. A. Mills, S. J.
Elledge, K. V. Anderson and G. J. Hannon (2003). "Dicer is essential for mouse development."
Nature Genetics 35(3): 215-217.
Berx, G. and F. van Roy (2009). "Involvement of members of the cadherin superfamily in
cancer." Cold Spring Harb Perspect Biol 1(6): a003129.
Bhattacharjee, A., W. G. Richards, J. Staunton, C. Li, S. Monti, P. Vasa, C. Ladd, J. Beheshti, R.
Bueno, M. Gillette, M. Loda, G. Weber, E. J. Mark, E. S. Lander, W. Wong, B. E. Johnson, T. R.
Golub, D. J. Sugarbaker and M. Meyerson (2001). "Classification of human lung carcinomas by
mRNA expression profiling reveals distinct adenocarcinoma subclasses." Proceedings of the
National Academy of Sciences 98(24): 13790-13795.

190
Bhattacharya, R., M. Nicoloso, R. Arvizo, E. Wang, A. Cortez, S. Rossi, G. A. Calin and P.
Mukherjee (2009). "MiR-15a and MiR-16 control Bmi-1 expression in ovarian cancer." Cancer
Res 69(23): 9090-9095.
Bindra, R. S. and P. M. Glazer (2007). "Co-repression of mismatch repair gene expression by
hypoxia in cancer cells: role of the Myc/Max network." Cancer Lett 252(1): 93-103.
Bracken, C. P., P. A. Gregory, N. Kolesnikoff, A. G. Bert, J. Wang, M. F. Shannon and G. J.
Goodall (2008). "A double-negative feedback loop between ZEB1-SIP1 and the microRNA-200
family regulates epithelial-mesenchymal transition." Cancer Res 68(19): 7846-7854.
Brend, T. (2003). "Multiple levels of transcriptional and post-transcriptional regulation are
required to define the domain of Hoxb4 expression." Development 130(12): 2717-2728.
Brennecke, J., A. Stark, R. B. Russell and S. M. Cohen (2005). "Principles of microRNA-target
recognition." PLoS Biol 3(3): e85.
Brownson, R. C., M. C. Alavanja, N. Caporaso, E. J. Simoes and J. C. Chang (1998).
"Epidemiology and prevention of lung cancer in nonsmokers." Epidemiologic reviews 20(2):
218-236.
Burch, J. B. (2005). "Regulation of GATA gene expression during vertebrate development."
Semin Cell Dev Biol 16(1): 71-81.
Calin, G. A. (2004). "Human microRNA genes are frequently located at fragile sites and
genomic regions involved in cancers." Proceedings of the National Academy of Sciences 101(9):
2999-3004.
Calin, G. A., C. D. Dumitru, M. Shimizu, R. Bichi, S. Zupo, E. Noch, H. Aldler, S. Rattan, M.
Keating, K. Rai, L. Rassenti, T. Kipps, M. Negrini, F. Bullrich and C. M. Croce (2002).
"Frequent deletions and down-regulation of micro- RNA genes miR15 and miR16 at 13q14 in
chronic lymphocytic leukemia." Proc Natl Acad Sci U S A 99(24): 15524-15529.

191
Camps, C., F. M. Buffa, S. Colella, J. Moore, C. Sotiriou, H. Sheldon, A. L. Harris, J. M.
Gleadle and J. Ragoussis (2008). "hsa-miR-210 Is induced by hypoxia and is an independent
prognostic factor in breast cancer." Clin Cancer Res 14(5): 1340-1348.
Carracedo, A., A. Alimonti and P. P. Pandolfi (2011). "PTEN level in tumor suppression: how
much is too little?" Cancer Res 71(3): 629-633.
Charles J Sherr1, F. M. (2002). "The RB and p53 pathways in cancer." cell.
Chen, Q., X. H. Zhang and J. Massague (2011). "Macrophage binding to receptor VCAM-1
transmits survival signals in breast cancer cells that invade the lungs." Cancer Cell 20(4): 538-
549.
Chen, X., Y. Ba, L. Ma, X. Cai, Y. Yin, K. Wang, J. Guo, Y. Zhang, J. Chen, X. Guo, Q. Li, X.
Li, W. Wang, Y. Zhang, J. Wang, X. Jiang, Y. Xiang, C. Xu, P. Zheng, J. Zhang, R. Li, H.
Zhang, X. Shang, T. Gong, G. Ning, J. Wang, K. Zen, J. Zhang and C. Y. Zhang (2008).
"Characterization of microRNAs in serum: a novel class of biomarkers for diagnosis of cancer
and other diseases." Cell Res 18(10): 997-1006.
Chen, Y. and D. H. Gorski (2008). "Regulation of angiogenesis through a microRNA (miR-
130a) that down-regulates antiangiogenic homeobox genes GAX and HOXA5." Blood 111(3):
1217-1226.
Chendrimada, T. P., K. J. Finn, X. Ji, D. Baillat, R. I. Gregory, S. A. Liebhaber, A. E. Pasquinelli
and R. Shiekhattar (2007). "MicroRNA silencing through RISC recruitment of eIF6." Nature
447(7146): 823-828.
Cheung, W. K., M. Zhao, Z. Liu, L. E. Stevens, P. D. Cao, J. E. Fang, T. F. Westbrook and D. X.
Nguyen (2013). "Control of alveolar differentiation by the lineage transcription factors GATA6
and HOPX inhibits lung adenocarcinoma metastasis." Cancer Cell 23(6): 725-738.

192
Cheung, W. K., M. Zhao, Z. Liu, L. E. Stevens, P. D. Cao, J. E. Fang, T. F. Westbrook and D. X.
Nguyen (2013). "Control of Alveolar Differentiation by the Lineage Transcription Factors
GATA6 and HOPX Inhibits Lung Adenocarcinoma Metastasis." Cancer cell.
Christophe Ginestier1, M. H. H., Emmanuelle Charafe-Jauffret3, Florence Monville3,, M. B.
Julie Dutcher1, Jocelyne Jacquemier3, Patrice Viens3, Celina Kleer1, Suling and A. S. Liu1, Dan
Hayes1, Daniel Birnbaum3, Max S. Wicha1, and Gabriela Dontu1, "<ALDH1 is a marker of
normal and malignant human mammary stem cells and a predictor of poor clinical
outcome.pdf>."
Chute, J. P., G. G. Muramoto, J. Whitesides, M. Colvin, R. Safi, N. J. Chao and D. P. McDonnell
(2006). "Inhibition of aldehyde dehydrogenase and retinoid signaling induces the expansion of
human hematopoietic stem cells." Proc Natl Acad Sci U S A 103(31): 11707-11712.
Cimmino, A., G. A. Calin, M. Fabbri, M. V. Iorio, M. Ferracin, M. Shimizu, S. E. Wojcik, R. I.
Aqeilan, S. Zupo and M. Dono (2005). "miR-15 and miR-16 induce apoptosis by targeting
BCL2." Proceedings of the National Academy of Sciences of the United States of America
102(39): 13944-13949.
Clevers, H. and R. Nusse (2012). "Wnt/beta-catenin signaling and disease." Cell 149(6): 1192-
1205.
Cory, S. and J. M. Adams (2002). "The Bcl2 family: regulators of the cellular life-or-death
switch." Nat Rev Cancer 2(9): 647-656.
Costinean, S., S. K. Sandhu, I. M. Pedersen, E. Tili, R. Trotta, D. Perrotti, D. Ciarlariello, P.
Neviani, J. Harb, L. R. Kauffman, A. Shidham and C. M. Croce (2009). "Src homology 2
domain-containing inositol-5-phosphatase and CCAAT enhancer-binding protein beta are
targeted by miR-155 in B cells of Emicro-MiR-155 transgenic mice." Blood 114(7): 1374-1382.

193
Courtney, K. D., R. B. Corcoran and J. A. Engelman (2010). "The PI3K pathway as drug target
in human cancer." J Clin Oncol 28(6): 1075-1083.
Crosby, M. E., R. Kulshreshtha, M. Ivan and P. M. Glazer (2009). "MicroRNA Regulation of
DNA Repair Gene Expression in Hypoxic Stress." Cancer Research 69(3): 1221-1229.
Dews, M., A. Homayouni, D. Yu, D. Murphy, C. Sevignani, E. Wentzel, E. E. Furth, W. M. Lee,
G. H. Enders, J. T. Mendell and A. Thomas-Tikhonenko (2006). "Augmentation of tumor
angiogenesis by a Myc-activated microRNA cluster." Nat Genet 38(9): 1060-1065.
Di Cristofano, A. and P. P. Pandolfi (2000). "The Multiple Roles of PTEN in Tumor
Suppression." Cell 100(4): 387-390.
Ding, L. H., Y. Xie, S. Park, G. Xiao and M. D. Story (2008). "Enhanced identification and
biological validation of differential gene expression via Illumina whole-genome expression
arrays through the use of the model-based background correction methodology." Nucleic Acids
Res 36(10): e58.
Doench, J. G. and P. A. Sharp (2004). "Specificity of microRNA target selection in translational
repression." Genes Dev 18(5): 504-511.
Domingo-Domenech, J., S. J. Vidal, V. Rodriguez-Bravo, M. Castillo-Martin, S. A. Quinn, R.
Rodriguez-Barrueco, D. M. Bonal, E. Charytonowicz, N. Gladoun, J. de la Iglesia-Vicente, D. P.
Petrylak, M. C. Benson, J. M. Silva and C. Cordon-Cardo (2012). "Suppression of acquired
docetaxel resistance in prostate cancer through depletion of notch- and hedgehog-dependent
tumor-initiating cells." Cancer Cell 22(3): 373-388.
Dong, J.-T. and H. Frierson (2001). "Loss of heterozygosity at 13q14 and 13q21 in high grade,
high stage prostate cancer." The prostate.
Dong, J. T., J. C. Boyd and H. F. Frierson (2001). "Loss of heterozygosity at 13q14 and 13q21 in
high grade, high stage prostate cancer." The Prostate 49(3): 166-171.

194
Du, L., M. C. Subauste, C. DeSevo, Z. Zhao, M. Baker, R. Borkowski, J. J. Schageman, R.
Greer, C. R. Yang, M. Suraokar, Wistuba, II, A. F. Gazdar, J. D. Minna and A. Pertsemlidis
(2012). "miR-337-3p and its targets STAT3 and RAP1A modulate taxane sensitivity in non-
small cell lung cancers." PLoS One 7(6): e39167.
Eilers, M. and R. N. Eisenman (2008). "Myc's broad reach." Genes Dev 22(20): 2755-2766.
Engelman, J. A. (2009). "Targeting PI3K signalling in cancer: opportunities, challenges and
limitations." Nat Rev Cancer 9(8): 550-562.
Engelman, J. A., L. Chen, X. Tan, K. Crosby, A. R. Guimaraes, R. Upadhyay, M. Maira, K.
McNamara, S. A. Perera, Y. Song, L. R. Chirieac, R. Kaur, A. Lightbown, J. Simendinger, T. Li,
R. F. Padera, C. Garcia-Echeverria, R. Weissleder, U. Mahmood, L. C. Cantley and K. K. Wong
(2008). "Effective use of PI3K and MEK inhibitors to treat mutant Kras G12D and PIK3CA
H1047R murine lung cancers." Nat Med 14(12): 1351-1356.
Escobedo, L. G. and J. P. Peddicord (1996). "Smoking prevalence in US birth cohorts: the
influence of gender and education." American Journal of Public Health 86(2): 231-236.
Eulalio, A., E. Huntzinger and E. Izaurralde (2008). "Getting to the root of miRNA-mediated
gene silencing." Cell 132(1): 9-14.
Eulalio, A., J. Rehwinkel, M. Stricker, E. Huntzinger, S. F. Yang, T. Doerks, S. Dorner, P. Bork,
M. Boutros and E. Izaurralde (2007). "Target-specific requirements for enhancers of decapping
in miRNA-mediated gene silencing." Genes Dev 21(20): 2558-2570.
Ferrara, N. (2010). "Pathways mediating VEGF-independent tumor angiogenesis." Cytokine
Growth Factor Rev 21(1): 21-26.
Foley, N. H., I. Bray, K. M. Watters, S. Das, K. Bryan, T. Bernas, J. H. Prehn and R. L. Stallings
(2011). "MicroRNAs 10a and 10b are potent inducers of neuroblastoma cell differentiation
through targeting of nuclear receptor corepressor 2." Cell Death Differ 18(7): 1089-1098.
195
Friedman, R. C., K. K. Farh, C. B. Burge and D. P. Bartel (2009). "Most mammalian mRNAs are
conserved targets of microRNAs." Genome Res 19(1): 92-105.
Fu, B., M. Luo, S. Lakkur, R. Lucito and C. A. Iacobuzio-Donahue (2008). "Frequent genomic
copy number gain and overexpression of GATA-6 in pancreatic carcinoma." Cancer biology &
therapy 7(10): 1593-1601.
Gadgeel, S. M., S. S. Ramalingam and G. P. Kalemkerian (2012). "Treatment of lung cancer."
Radiol Clin North Am 50(5): 961-974.
Gao, P., I. Tchernyshyov, T. C. Chang, Y. S. Lee, K. Kita, T. Ochi, K. I. Zeller, A. M. De
Marzo, J. E. Van Eyk, J. T. Mendell and C. V. Dang (2009). "c-Myc suppression of miR-23a/b
enhances mitochondrial glutaminase expression and glutamine metabolism." Nature 458(7239):
762-765.
Garzon, R., G. A. Calin and C. M. Croce (2009). "MicroRNAs in Cancer." Annu Rev Med 60:
167-179.
Gee, H. E., C. Camps, F. M. Buffa, S. Colella, H. Sheldon, J. M. Gleadle, J. Ragoussis and A. L.
Harris (2008). "MicroRNA-10b and breast cancer metastasis." Nature 455(7216): E8-E9.
Ginestier, C., M. H. Hur, E. Charafe-Jauffret, F. Monville, J. Dutcher, M. Brown, J. Jacquemier,
P. Viens, C. G. Kleer and S. Liu (2007). "ALDH1 is a marker of normal and malignant human
mammary stem cells and a predictor of poor clinical outcome." Cell stem cell 1(5): 555-567.
Giraldez, A. J., Y. Mishima, J. Rihel, R. J. Grocock, S. Van Dongen, K. Inoue, A. J. Enright and
A. F. Schier (2006). "Zebrafish MiR-430 promotes deadenylation and clearance of maternal
mRNAs." Science 312(5770): 75-79.
Göttlicher, M., S. Minucci, P. Zhu, O. H. Krämer, A. Schimpf, S. Giavara, J. P. Sleeman, F. L.
Coco, C. Nervi and P. G. Pelicci (2001). "Valproic acid defines a novel class of HDAC inhibitors
inducing differentiation of transformed cells." The EMBO journal 20(24): 6969-6978.

196
Grandy, D., J. Shan, X. Zhang, S. Rao, S. Akunuru, H. Li, Y. Zhang, I. Alpatov, X. A. Zhang, R.
A. Lang, D. L. Shi and J. J. Zheng (2009). "Discovery and characterization of a small molecule
inhibitor of the PDZ domain of dishevelled." J Biol Chem 284(24): 16256-16263.
Gregory, P. A., A. G. Bert, E. L. Paterson, S. C. Barry, A. Tsykin, G. Farshid, M. A. Vadas, Y.
Khew-Goodall and G. J. Goodall (2008). "The miR-200 family and miR-205 regulate epithelial
to mesenchymal transition by targeting ZEB1 and SIP1." Nat Cell Biol 10(5): 593-601.
Grimson, A., K. K. Farh, W. K. Johnston, P. Garrett-Engele, L. P. Lim and D. P. Bartel (2007).
"MicroRNA targeting specificity in mammals: determinants beyond seed pairing." Mol Cell
27(1): 91-105.
Gritsko, T., A. Williams, J. Turkson, S. Kaneko, T. Bowman, M. Huang, S. Nam, I. Eweis, N.
Diaz, D. Sullivan, S. Yoder, S. Enkemann, S. Eschrich, J. H. Lee, C. A. Beam, J. Cheng, S.
Minton, C. A. Muro-Cacho and R. Jove (2006). "Persistent activation of stat3 signaling induces
survivin gene expression and confers resistance to apoptosis in human breast cancer cells." Clin
Cancer Res 12(1): 11-19.
Grivennikov, S. I., F. R. Greten and M. Karin (2010). "Immunity, inflammation, and cancer."
Cell 140(6): 883-899.
Guertin, D. A. and D. M. Sabatini (2007). "Defining the role of mTOR in cancer." Cancer Cell
12(1): 9-22.
Haldar, S., J. Chintapalli and C. M. Croce (1996). "Taxol induces bcl-2 phosphorylation and
death of prostate cancer cells." Cancer research 56(6): 1253-1255.
Hammond, J. W., D. Cai and K. J. Verhey (2008). "Tubulin modifications and their cellular
functions." Curr Opin Cell Biol 20(1): 71-76.
Hanahan, D. and R. A. Weinberg (2000). "The Hallmarks of Cancer." Cell 100(1): 57-70.

197
Hanahan, D. and R. A. Weinberg (2011). "Hallmarks of cancer: the next generation." Cell
144(5): 646-674.
He, L., X. He, L. P. Lim, E. de Stanchina, Z. Xuan, Y. Liang, W. Xue, L. Zender, J. Magnus, D.
Ridzon, A. L. Jackson, P. S. Linsley, C. Chen, S. W. Lowe, M. A. Cleary and G. J. Hannon
(2007). "A microRNA component of the p53 tumour suppressor network." Nature 447(7148):
1130-1134.
Helwak, A., G. Kudla, T. Dudnakova and D. Tollervey (2013). "Mapping the human miRNA
interactome by CLASH reveals frequent noncanonical binding." Cell 153(3): 654-665.
Hermeking, H. (2010). "The miR-34 family in cancer and apoptosis." Cell Death Differ 17(2):
193-199.
Hockenbery, D., G. Nuñez, C. Milliman, R. D. Schreiber and S. J. Korsmeyer (1990). "Bcl-2 is
an inner mitochondrial membrane protein that blocks programmed cell death."
Huang, E. H., M. J. Hynes, T. Zhang, C. Ginestier, G. Dontu, H. Appelman, J. Z. Fields, M. S.
Wicha and B. M. Boman (2009). "Aldehyde dehydrogenase 1 is a marker for normal and
malignant human colonic stem cells (SC) and tracks SC overpopulation during colon
tumorigenesis." Cancer Res 69(8): 3382-3389.
Huang, H., C. Xie, X. Sun, R. P. Ritchie, J. Zhang and Y. E. Chen (2010). "miR-10a contributes
to retinoid acid-induced smooth muscle cell differentiation." J Biol Chem 285(13): 9383-9389.
Imielinski, M., A. H. Berger, P. S. Hammerman, B. Hernandez, T. J. Pugh, E. Hodis, J. Cho, J.
Suh, M. Capelletti, A. Sivachenko, C. Sougnez, D. Auclair, M. S. Lawrence, P. Stojanov, K.
Cibulskis, K. Choi, L. de Waal, T. Sharifnia, A. Brooks, H. Greulich, S. Banerji, T. Zander, D.
Seidel, F. Leenders, S. Ansen, C. Ludwig, W. Engel-Riedel, E. Stoelben, J. Wolf, C. Goparju, K.
Thompson, W. Winckler, D. Kwiatkowski, B. E. Johnson, P. A. Janne, V. A. Miller, W. Pao, W.
D. Travis, H. I. Pass, S. B. Gabriel, E. S. Lander, R. K. Thomas, L. A. Garraway, G. Getz and M.

198
Meyerson (2012). "Mapping the hallmarks of lung adenocarcinoma with massively parallel
sequencing." Cell 150(6): 1107-1120.
Jackson, S. P. and J. Bartek (2009). "The DNA-damage response in human biology and disease."
Nature 461(7267): 1071-1078.
Jeong, H. W. and I. S. Kim (2004). "TGF-beta1 enhances betaig-h3-mediated keratinocyte cell
migration through the alpha3beta1 integrin and PI3K." J Cell Biochem 92(4): 770-780.
Jiang, S., H. W. Zhang, M. H. Lu, X. H. He, Y. Li, H. Gu, M. F. Liu and E. D. Wang (2010).
"MicroRNA-155 functions as an OncomiR in breast cancer by targeting the suppressor of
cytokine signaling 1 gene." Cancer Res 70(8): 3119-3127.
Johnson, S. M., H. Grosshans, J. Shingara, M. Byrom, R. Jarvis, A. Cheng, E. Labourier, K. L.
Reinert, D. Brown and F. J. Slack (2005). "RAS is regulated by the let-7 microRNA family."
Cell 120(5): 635-647.
Karube, Y., H. Tanaka, H. Osada, S. Tomida, Y. Tatematsu, K. Yanagisawa, Y. Yatabe, J.
Takamizawa, S. Miyoshi, T. Mitsudomi and T. Takahashi (2005). "Reduced expression of Dicer
associated with poor prognosis in lung cancer patients." Cancer Sci 96(2): 111-115.
Kim, R., M. Emi and K. Tanabe (2007). "Cancer immunoediting from immune surveillance to
immune escape." Immunology 121(1): 1-14.
Kim, Y. K., J. Yeo, B. Kim, M. Ha and V. N. Kim (2012). "Short structured RNAs with low GC
content are selectively lost during extraction from a small number of cells." Mol Cell 46(6): 893-
895.
Kinashi, T. and K. Katagiri (2004). "Regulation of lymphocyte adhesion and migration by the
small GTPase Rap1 and its effector molecule, RAPL." Immunol Lett 93(1): 1-5.

199
Klymkowsky, M. W. and P. Savagner (2009). "Epithelial-mesenchymal transition: a cancer
researcher's conceptual friend and foe." Am J Pathol 174(5): 1588-1593.
Korpal, M., E. S. Lee, G. Hu and Y. Kang (2008). "The miR-200 Family Inhibits Epithelial-
Mesenchymal Transition and Cancer Cell Migration by Direct Targeting of E-cadherin
Transcriptional Repressors ZEB1 and ZEB2." Journal of Biological Chemistry 283(22): 14910-
14914.
Korpal, M., E. S. Lee, G. Hu and Y. Kang (2008). "The miR-200 family inhibits epithelial-
mesenchymal transition and cancer cell migration by direct targeting of E-cadherin
transcriptional repressors ZEB1 and ZEB2." J Biol Chem 283(22): 14910-14914.
Kosaka, T., Y. Yatabe, H. Endoh, K. Yoshida, T. Hida, M. Tsuboi, H. Tada, H. Kuwano and T.
Mitsudomi (2006). "Analysis of epidermal growth factor receptor gene mutation in patients with
non-small cell lung cancer and acquired resistance to gefitinib." Clin Cancer Res 12(19): 5764-
5769.
Kota, J., R. R. Chivukula, K. A. O'Donnell, E. A. Wentzel, C. L. Montgomery, H. W. Hwang, T.
C. Chang, P. Vivekanandan, M. Torbenson, K. R. Clark, J. R. Mendell and J. T. Mendell (2009).
"Therapeutic microRNA delivery suppresses tumorigenesis in a murine liver cancer model." Cell
137(6): 1005-1017.
Krol, J., I. Loedige and W. Filipowicz (2010). "The widespread regulation of microRNA
biogenesis, function and decay." Nat Rev Genet 11(9): 597-610.
Kumar, M. S., D. C. Hancock, M. Molina-Arcas, M. Steckel, P. East, M. Diefenbacher, E.
Armenteros-Monterroso, F. Lassailly, N. Matthews, E. Nye, G. Stamp, A. Behrens and J.
Downward (2012). "The GATA2 transcriptional network is requisite for RAS oncogene-driven
non-small cell lung cancer." Cell 149(3): 642-655.

200
Kumar, M. S., J. Lu, K. L. Mercer, T. R. Golub and T. Jacks (2007). "Impaired microRNA
processing enhances cellular transformation and tumorigenesis." Nat Genet 39(5): 673-677.
Kwan, H., D. W. Chan, P. C. Cai, C. S. Mak, M. M. Yung, T. H. Leung, O. G. Wong, A. N.
Cheung and H. Y. Ngan (2013). "AMPK Activators Suppress Cervical Cancer Cell Growth
through Inhibition of DVL3 Mediated Wnt/β-Catenin Signaling Activity." PloS one 8(1):
e53597.
Kwei, K. A., M. D. Bashyam, J. Kao, R. Ratheesh, E. C. Reddy, Y. H. Kim, K. Montgomery, C.
P. Giacomini, Y. L. Choi, S. Chatterjee, C. A. Karikari, K. Salari, P. Wang, T. Hernandez-
Boussard, G. Swarnalata, M. van de Rijn, A. Maitra and J. R. Pollack (2008). "Genomic
profiling identifies GATA6 as a candidate oncogene amplified in pancreatobiliary cancer." PLoS
Genet 4(5): e1000081.
Lagos-Quintana, M. (2003). "New microRNAs from mouse and human." Rna 9(2): 175-179.
Lagos-Quintana, M., R. Rauhut, W. Lendeckel and T. Tuschl (2001). "Identification of novel
genes coding for small expressed RNAs." Science 294(5543): 853-858.
Landgraf, P., M. Rusu, R. Sheridan, A. Sewer, N. Iovino, A. Aravin, S. Pfeffer, A. Rice, A. O.
Kamphorst, M. Landthaler, C. Lin, N. D. Socci, L. Hermida, V. Fulci, S. Chiaretti, R. Foa, J.
Schliwka, U. Fuchs, A. Novosel, R. U. Muller, B. Schermer, U. Bissels, J. Inman, Q. Phan, M.
Chien, D. B. Weir, R. Choksi, G. De Vita, D. Frezzetti, H. I. Trompeter, V. Hornung, G. Teng,
G. Hartmann, M. Palkovits, R. Di Lauro, P. Wernet, G. Macino, C. E. Rogler, J. W. Nagle, J. Ju,
F. N. Papavasiliou, T. Benzing, P. Lichter, W. Tam, M. J. Brownstein, A. Bosio, A. Borkhardt, J.
J. Russo, C. Sander, M. Zavolan and T. Tuschl (2007). "A mammalian microRNA expression
atlas based on small RNA library sequencing." Cell 129(7): 1401-1414.
Larsen, J. E., T. Cascone, D. E. Gerber, J. V. Heymach and J. D. Minna (2011). "Targeted
therapies for lung cancer: clinical experience and novel agents." Cancer J 17(6): 512-527.

201
Larsen, J. E. and J. D. Minna (2011). "Molecular biology of lung cancer: clinical implications."
Clin Chest Med 32(4): 703-740.
Lau, N. C., L. P. Lim, E. G. Weinstein and D. P. Bartel (2001). "An abundant class of tiny RNAs
with probable regulatory roles in Caenorhabditis elegans." Science 294(5543): 858-862.
Lee, R., R. Feinbaum and V. Ambros (1993). "The C. elegans heterochronic gene lin-4 encodes
small RNAs with antisense complementarity to lin-14." Cell.
Lee, R. C. (2001). "An Extensive Class of Small RNAs in Caenorhabditis elegans." Science
294(5543): 862-864.
Lee, R. C. and V. Ambros (2001). "An extensive class of small RNAs in Caenorhabditis
elegans." Science 294(5543): 862-864.
Levina, V., A. M. Marrangoni, R. DeMarco, E. Gorelik and A. E. Lokshin (2008). "Drug-
selected human lung cancer stem cells: cytokine network, tumorigenic and metastatic
properties." PLoS One 3(8): e3077.
Levine, A. J., W. Hu and Z. Feng (2006). "The P53 pathway: what questions remain to be
explored?" Cell Death Differ 13(6): 1027-1036.
Levine AJ, M. J., Finlay CA (1991). "The p53 tumour suppressor gene." Nature.
Lewis, B. P., C. B. Burge and D. P. Bartel (2005). "Conserved Seed Pairing, Often Flanked by
Adenosines, Indicates that Thousands of Human Genes are MicroRNA Targets." Cell 120(1):
15-20.
Lewis, B. P., I.-h. Shih, M. W. Jones-Rhoades, D. P. Bartel and C. B. Burge (2003). "Prediction
of mammalian microRNA targets." Cell

202
Li, R., T. Moudgil, H. J. Ross and H. M. Hu (2005). "Apoptosis of non-small-cell lung cancer
cell lines after paclitaxel treatment involves the BH3-only proapoptotic protein Bim." Cell Death
Differ 12(3): 292-303.
Li, Y., F. Wang, J. A. Lee and F. B. Gao (2006). "MicroRNA-9a ensures the precise
specification of sensory organ precursors in Drosophila." Genes & Development 20(20): 2793-
2805.
Lin, L., A. J. Bass, W. W. Lockwood, Z. Wang, A. L. Silvers, D. G. Thomas, A. C. Chang, J.
Lin, M. B. Orringer, W. Li, T. W. Glover, T. J. Giordano, W. L. Lam, M. Meyerson and D. G.
Beer (2012). "Activation of GATA binding protein 6 (GATA6) sustains oncogenic lineage-
survival in esophageal adenocarcinoma." Proc Natl Acad Sci U S A 109(11): 4251-4256.
Lindsay, M. A. (2008). "microRNAs and the immune response." Trends Immunol 29(7): 343-
351.
Liu, G., X. Yuan, Z. Zeng, P. Tunici, H. Ng, I. R. Abdulkadir, L. Lu, D. Irvin, K. L. Black and J.
S. Yu (2006). "Analysis of gene expression and chemoresistance of CD133+ cancer stem cells in
glioblastoma." Mol Cancer 5: 67.
Llave, C., Z. Xie, K. D. Kasschau and J. C. Carrington (2002). "Cleavage of Scarecrow-like
mRNA targets directed by a class of Arabidopsis miRNA." Science 297(5589): 2053-2056.
Lu, J., G. Getz, E. A. Miska, E. Alvarez-Saavedra, J. Lamb, D. Peck, A. Sweet-Cordero, B. L.
Ebert, R. H. Mak, A. A. Ferrando, J. R. Downing, T. Jacks, H. R. Horvitz and T. R. Golub
(2005). "MicroRNA expression profiles classify human cancers." Nature 435(7043): 834-838.
Ma, L., F. Reinhardt, E. Pan, J. Soutschek, B. Bhat, E. G. Marcusson, J. Teruya-Feldstein, G. W.
Bell and R. A. Weinberg (2010). "Therapeutic silencing of miR-10b inhibits metastasis in a
mouse mammary tumor model." Nat Biotechnol 28(4): 341-347.

203
Ma, L., J. Teruya-Feldstein and R. A. Weinberg (2007). "Tumour invasion and metastasis
initiated by microRNA-10b in breast cancer." Nature 449(7163): 682-688.
Mansfield, J. H., B. D. Harfe, R. Nissen, J. Obenauer, J. Srineel, A. Chaudhuri, R. Farzan-
Kashani, M. Zuker, A. E. Pasquinelli, G. Ruvkun, P. A. Sharp, C. J. Tabin and M. T. McManus
(2004). "MicroRNA-responsive 'sensor' transgenes uncover Hox-like and other developmentally
regulated patterns of vertebrate microRNA expression." Nat Genet 36(10): 1079-1083.
Marcato, P., C. A. Dean, D. Pan, R. Araslanova, M. Gillis, M. Joshi, L. Helyer, L. Pan, A.
Leidal, S. Gujar, C. A. Giacomantonio and P. W. Lee (2011). "Aldehyde dehydrogenase activity
of breast cancer stem cells is primarily due to isoform ALDH1A3 and its expression is predictive
of metastasis." Stem Cells 29(1): 32-45.
Mathers, C. D., D. M. Fat and J. Boerma (2008). The global burden of disease: 2004 update,
World Health Organization.
Mayr, C. and D. P. Bartel (2009). "Widespread shortening of 3'UTRs by alternative cleavage and
polyadenylation activates oncogenes in cancer cells." Cell 138(4): 673-684.
Mayr, C., M. T. Hemann and D. P. Bartel (2007). "Disrupting the pairing between let-7 and
Hmga2 enhances oncogenic transformation." Science 315(5818): 1576-1579.
McCubrey, J. A., L. S. Steelman, S. L. Abrams, J. T. Lee, F. Chang, F. E. Bertrand, P. M.
Navolanic, D. M. Terrian, R. A. Franklin, A. B. D'Assoro, J. L. Salisbury, M. C. Mazzarino, F.
Stivala and M. Libra (2006). "Roles of the RAF/MEK/ERK and PI3K/PTEN/AKT pathways in
malignant transformation and drug resistance." Adv Enzyme Regul 46: 249-279.
Mendell, J. T. (2008). "miRiad roles for the miR-17-92 cluster in development and disease." Cell
133(2): 217-222.
Mendell, J. T. and E. N. Olson (2012). "MicroRNAs in stress signaling and human disease." Cell
148(6): 1172-1187.

204
Merchant, A. A. and W. Matsui (2010). "Targeting Hedgehog--a cancer stem cell pathway." Clin
Cancer Res 16(12): 3130-3140.
Mikhail Krasilnikov1, V. A., Serge Y. Fuchs2, Zheng Dong2, Adriana Haimovitz-Friedman3,
Meenhard Herlyn4, Ze'ev Ronai2,* (1999). "Contribution of phosphatidylinositol 3-kinase to
radiation resistance in human melanoma cells." Molecular carinogenesis.
Nagy, J. A., S. H. Chang, S. C. Shih, A. M. Dvorak and H. F. Dvorak (2010). "Heterogeneity of
the tumor vasculature." Semin Thromb Hemost 36(3): 321-331.
Ng, D. C. H., B. H. Lin, C. P. Lim, G. Huang, T. Zhang, V. Poli and X. Cao (2006). "Stat3
regulates microtubules by antagonizing the depolymerization activity of stathmin." The Journal
of cell biology 172(2): 245-257.
Olivier, M., M. Hollstein and P. Hainaut (2010). "TP53 mutations in human cancers: origins,
consequences, and clinical use." Cold Spring Harb Perspect Biol 2(1): a001008.
Orom, U. A., S. Kauppinen and A. H. Lund (2006). "LNA-modified oligonucleotides mediate
specific inhibition of microRNA function." Gene 372: 137-141.
Orom, U. A., F. C. Nielsen and A. H. Lund (2008). "MicroRNA-10a binds the 5'UTR of
ribosomal protein mRNAs and enhances their translation." Mol Cell 30(4): 460-471.
Pannuti, A., K. Foreman, P. Rizzo, C. Osipo, T. Golde, B. Osborne and L. Miele (2010).
"Targeting Notch to target cancer stem cells." Clin Cancer Res 16(12): 3141-3152.
Pao, W. and K. E. Hutchinson (2012). "Chipping away at the lung cancer genome." Nat Med
18(3): 349-351.
Pasquinelli, A. E. (2012). "MicroRNAs and their targets: recognition, regulation and an
emerging reciprocal relationship." Nat Rev Genet 13(4): 271-282.

205
Petersen, C. P., M. E. Bordeleau, J. Pelletier and P. A. Sharp (2006). "Short RNAs repress
translation after initiation in mammalian cells." Mol Cell 21(4): 533-542.
Pleasance, E. D., R. K. Cheetham, P. J. Stephens, D. J. McBride, S. J. Humphray, C. D.
Greenman, I. Varela, M. L. Lin, G. R. Ordonez, G. R. Bignell, K. Ye, J. Alipaz, M. J. Bauer, D.
Beare, A. Butler, R. J. Carter, L. Chen, A. J. Cox, S. Edkins, P. I. Kokko-Gonzales, N. A.
Gormley, R. J. Grocock, C. D. Haudenschild, M. M. Hims, T. James, M. Jia, Z. Kingsbury, C.
Leroy, J. Marshall, A. Menzies, L. J. Mudie, Z. Ning, T. Royce, O. B. Schulz-Trieglaff, A.
Spiridou, L. A. Stebbings, L. Szajkowski, J. Teague, D. Williamson, L. Chin, M. T. Ross, P. J.
Campbell, D. R. Bentley, P. A. Futreal and M. R. Stratton (2010). "A comprehensive catalogue
of somatic mutations from a human cancer genome." Nature 463(7278): 191-196.
Poliseno, L., L. Salmena, J. Zhang, B. Carver, W. J. Haveman and P. P. Pandolfi (2010). "A
coding-independent function of gene and pseudogene mRNAs regulates tumour biology." Nature
465(7301): 1033-1038.
Poliseno, L., L. Salmena, J. Zhang, B. Carver, W. J. Haveman and P. P. Pandolfi (2010). "A
coding-independent function of gene and pseudogene mRNAs regulates tumour biology." Nature
465(7301): 1033-1038.
Polyak, K. and R. A. Weinberg (2009). "Transitions between epithelial and mesenchymal states:
acquisition of malignant and stem cell traits." Nat Rev Cancer 9(4): 265-273.
Porkka, K. P., M. J. Pfeiffer, K. K. Waltering, R. L. Vessella, T. L. Tammela and T. Visakorpi
(2007). "MicroRNA expression profiling in prostate cancer." Cancer Res 67(13): 6130-6135.
Quintana, E., M. Shackleton, M. S. Sabel, D. R. Fullen, T. M. Johnson and S. J. Morrison
(2008). "Efficient tumour formation by single human melanoma cells." Nature 456(7222): 593-
598.

206
Raica, M., A. M. Cimpean and D. Ribatti (2009). "Angiogenesis in pre-malignant conditions."
Eur J Cancer 45(11): 1924-1934.
Ramirez, R. D., Shelley Sheridan, Luc Girard, Mitsuo Sato, Young Kim, Jon Pollack, Michael
Peyton, Ying Zou, Jonathan M. Kurie, J. Michael DiMaio, Sara Milchgrub, Alice L. Smith,
Rhonda F. Souza, Laura Gilbey, Xi Zhang, Kenia Gandia, Melville B. Vaughan, Woodring E.
Wright, Adi F. Gazdar, 4, Jerry W. Shay and and John D. Minna1 (2004). "Immortalization of
Human Bronchial Epithelial Cells in the Absence of viral oncoproteins." Cancer Res
Raposo, G. and H. Geuze (1996). "B lymphocytes secrete antigen-presenting vesicles."
Ravi, A., A. M. Gurtan, M. S. Kumar, A. Bhutkar, C. Chin, V. Lu, J. A. Lees, T. Jacks and P. A.
Sharp (2012). "Proliferation and tumorigenesis of a murine sarcoma cell line in the absence of
DICER1." Cancer Cell 21(6): 848-855.
Raz, D. J. M. G., David V. PhD†; Odisho, Anobel Y. BA‡; Jablons, David M. MD* (20007).
"Clinical Characteristics and Survival of Patients with Surgically Resected, Incidentally Detected
Lung Cancer." Journal of Thoracic Oncology
Reinhart, B. J., F. J. Slack, M. Basson, A. E. Pasquinelli, J. C. Bettinger, A. E. Rougvie, H. R.
Horvitz and G. Ruvkun (2000). "The 21-nucleotide let-7 RNA regulates developmental timing in
Caenorhabditis elegans." Nature 403(6772): 901-906.
Reya, T. and H. Clevers (2005). "Wnt signalling in stem cells and cancer." Nature 434(14).
Riondel, J., M. Jacrot, F. Picot, H. Beriel, C. Mouriquand and P. Potier (1986). "Therapeutic
response to taxol of six human tumors xenografted into nude mice." Cancer chemotherapy and
pharmacology 17(2): 137-142.

207
Robert Jan Lebbink, Maggie Lowe, Theresa Chan, Htet Khine, Xiaoyin Wang and M. T.
McManus (2011). "Polymerase II Promoter Strength Determines Efficacy of microRNA Adapted
shRNAs." PLoS Biol
Roy Katso1, K. O., Khatereh Ahmadi1, Sarah White1, John Timms1, and Michael D.
Waterfield1,2 (2001). "Cellular function of phosphoinositide 3-kinases Implications for
development, homeostasis, and cancer." Annual Review of Cell and Developmental Biology 17.
Rudin, C. M., E. Avila-Tang, C. C. Harris, J. G. Herman, F. R. Hirsch, W. Pao, A. G. Schwartz,
K. H. Vahakangas and J. M. Samet (2009). "Lung cancer in never smokers: molecular profiles
and therapeutic implications." Clin Cancer Res 15(18): 5646-5661.
Salk, J. J., E. J. Fox and L. A. Loeb (2010). "Mutational heterogeneity in human cancers: origin
and consequences." Annu Rev Pathol 5: 51-75.
Salmena, L., L. Poliseno, Y. Tay, L. Kats and P. P. Pandolfi (2011). "A ceRNA hypothesis: the
Rosetta Stone of a hidden RNA language?" Cell 146(3): 353-358.
Sara Pensa, Gabriella Regis, Daniela Boselli, F. Novelli and V. Poli (200). "STAT1 and STAT3
in Tumorigenesis: Two Sides of the Same Coin?" cell biology.
Sarkar, F. H., Y. Li, Z. Wang, D. Kong and S. Ali (2010). "Implication of microRNAs in drug
resistance for designing novel cancer therapy." Drug Resist Updat 13(3): 57-66.
Scott W. Lowe1, E. C. G. E. (2004). "Intrinsic tumour suppression." Nature
Serra, V., B. Markman, M. Scaltriti, P. J. Eichhorn, V. Valero, M. Guzman, M. L. Botero, E.
Llonch, F. Atzori, S. Di Cosimo, M. Maira, C. Garcia-Echeverria, J. L. Parra, J. Arribas and J.
Baselga (2008). "NVP-BEZ235, a dual PI3K/mTOR inhibitor, prevents PI3K signaling and
inhibits the growth of cancer cells with activating PI3K mutations." Cancer Res 68(19): 8022-
8030.

208
Sharma, S. V., D. W. Bell, J. Settleman and D. A. Haber (2007). "Epidermal growth factor
receptor mutations in lung cancer." Nat Rev Cancer 7(3): 169-181.
Sheila K. Singh, I. D. C., Mizuhiko Terasaki, Victoria E. Bonn, Cynthia Hawkins, Jeremy
Squire, and Peter B. Dirks (2003). "Identification of a Cancer Stem Cell in Human Brain
Tumors." Cancer Res
Shen, B., M. K. Delaney and X. Du (2012). "Inside-out, outside-in, and inside-outside-in: G
protein signaling in integrin-mediated cell adhesion, spreading, and retraction." Curr Opin Cell
Biol 24(5): 600-606.
Shen, W. H., A. S. Balajee, J. Wang, H. Wu, C. Eng, P. P. Pandolfi and Y. Yin (2007).
"Essential role for nuclear PTEN in maintaining chromosomal integrity." Cell 128(1): 157-170.
Sherr, C. J. and F. McCormick (2002). "The RB and p53 pathways in cancer." Cancer cell 2(2):
103-112.
Shureiqi, I., X. Zuo, R. Broaddus, Y. Wu, B. Guan, J. S. Morris and S. M. Lippman (2007). "The
transcription factor GATA-6 is overexpressed in vivo and contributes to silencing 15-LOX-1 in
vitro in human colon cancer." FASEB J 21(3): 743-753.
Siddik, Z. H. and K. Mehta (2009).
Siegel, R., D. Naishadham and A. Jemal (2013). "Cancer statistics, 2013." CA: a cancer journal
for clinicians 63(1): 11-30.
Singh, A. and J. Settleman (2010). "EMT, cancer stem cells and drug resistance: an emerging
axis of evil in the war on cancer." Oncogene 29(34): 4741-4751.
Song, M. S., L. Salmena and P. P. Pandolfi (2012). "The functions and regulation of the PTEN
tumour suppressor." Nat Rev Mol Cell Biol 13(5): 283-296.

209
Sooryanarayana Varambally, 2,3* Qi Cao,1,2* Ram-Shankar Mani,1,2 Sunita Shankar,1,2,
Xiaosong Wang, 2 Bushra Ateeq,1,2 Bharathi Laxman,1,2 Xuhong Cao,1,4 Xiaojun Jing,1,2,
Kalpana Ramnarayanan, J. Chad Brenner, 2,6 Jindan Yu,1,2 Jung H. Kim,1,3 Bo Han,1,2,
Patrick Tan, 7 Chandan Kumar-Sinha,1,2 Robert J. Lonigro,1,3 Nallasivam Palanisamy,1,2,5
and Christopher A. Maher, 2 Arul M. Chinnaiyan1,2,3,4,6, (2007). "Genomic Loss of
microRNA-101 Leads to Overexpression of Histone Methyltransferase EZH2 in Cancer."
Science.
Stark, A., J. Brennecke, N. Bushati, R. B. Russell and S. M. Cohen (2005). "Animal MicroRNAs
confer robustness to gene expression and have a significant impact on 3'UTR evolution." Cell
123(6): 1133-1146.
Stephan Gasser, D. H. R. (2006). "Activation and self-tolerance of natural killer cells."
Immunological reviews.
Stern-Ginossar, N., N. Elefant, A. Zimmermann, D. G. Wolf, N. Saleh, M. Biton, E. Horwitz, Z.
Prokocimer, M. Prichard, G. Hahn, D. Goldman-Wohl, C. Greenfield, S. Yagel, H. Hengel, Y.
Altuvia, H. Margalit and O. Mandelboim (2007). "Host immune system gene targeting by a viral
miRNA." Science 317(5836): 376-381.
Stern-Ginossar, N., C. Gur, M. Biton, E. Horwitz, M. Elboim, N. Stanietsky, M. Mandelboim
and O. Mandelboim (2008). "Human microRNAs regulate stress-induced immune responses
mediated by the receptor NKG2D." Nat Immunol 9(9): 1065-1073.
Storer, C. M. and E. D. Salmon (1997). "Microtubule dynamics treadmilling comes around
again." Current biology
Suarez, Y., C. Fernandez-Hernando, J. Yu, S. A. Gerber, K. D. Harrison, J. S. Pober, M. L.
Iruela-Arispe, M. Merkenschlager and W. C. Sessa (2008). "Dicer-dependent endothelial
microRNAs are necessary for postnatal angiogenesis." Proc Natl Acad Sci U S A 105(37):
14082-14087.

210
Sullivan, J. P., J. D. Minna and J. W. Shay (2010). "Evidence for self-renewing lung cancer stem
cells and their implications in tumor initiation, progression, and targeted therapy." Cancer
Metastasis Rev 29(1): 61-72.
Sullivan, J. P., M. Spinola, M. Dodge, M. G. Raso, C. Behrens, B. Gao, K. Schuster, C. Shao, J.
E. Larsen, L. A. Sullivan, S. Honorio, Y. Xie, P. P. Scaglioni, J. M. DiMaio, A. F. Gazdar, J. W.
Shay, Wistuba, II and J. D. Minna (2010). "Aldehyde dehydrogenase activity selects for lung
adenocarcinoma stem cells dependent on notch signaling." Cancer Res 70(23): 9937-9948.
Suva, M. L., N. Riggi, M. Janiszewska, I. Radovanovic, P. Provero, J. C. Stehle, K. Baumer, M.
A. Le Bitoux, D. Marino, L. Cironi, V. E. Marquez, V. Clement and I. Stamenkovic (2009).
"EZH2 is essential for glioblastoma cancer stem cell maintenance." Cancer Res 69(24): 9211-
9218.
Takamizawa, J., H. Konishi, K. Yanagisawa, S. Tomida, H. Osada, H. Endoh, T. Harano, Y.
Yatabe, M. Nagino and Y. Nimura (2004). "Reduced expression of the let-7 microRNAs in
human lung cancers in association with shortened postoperative survival." Cancer research
64(11): 3753-3756.
Takebe, N., P. J. Harris, R. Q. Warren and S. P. Ivy (2011). "Targeting cancer stem cells by
inhibiting Wnt, Notch, and Hedgehog pathways." Nat Rev Clin Oncol 8(2): 97-106.
Tay, Y., L. Kats, L. Salmena, D. Weiss, S. M. Tan, U. Ala, F. Karreth, L. Poliseno, P. Provero,
F. Di Cunto, J. Lieberman, I. Rigoutsos and P. P. Pandolfi (2011). "Coding-independent
regulation of the tumor suppressor PTEN by competing endogenous mRNAs." Cell 147(2): 344-
357.
Tiburi, M. and H. h. andrade (2002). "Comparative genotoxic effect of vincristine, vinblastine,
and vinorelbine in somatic cells of Drosophila melanogaster." Mutational Reserach
211
Trotman, L. C., M. Niki, Z. A. Dotan, J. A. Koutcher, A. Di Cristofano, A. Xiao, A. S. Khoo, P.
Roy-Burman, N. M. Greenberg, T. Van Dyke, C. Cordon-Cardo and P. P. Pandolfi (2003). "Pten
dose dictates cancer progression in the prostate." PLoS Biol 1(3): E59.
Trowsdale, R. A. E. J. (2007). "Promiscuity and the single receptor NKG2D." Nature reviews
immunology.
Tsoyi, K., H. J. Jang, I. T. Nizamutdinova, K. Park, Y. M. Kim, H. J. Kim, H. G. Seo, J. H. Lee
and K. C. Chang (2010). "PTEN differentially regulates expressions of ICAM-1 and VCAM-1
through PI3K/Akt/GSK-3beta/GATA-6 signaling pathways in TNF-alpha-activated human
endothelial cells." Atherosclerosis 213(1): 115-121.
Uematsu, K., S. Kanazawa, L. You, B. He, Z. Xu, K. Li, B. M. Peterlin, F. McCormick and D.
M. Jablons (2003). "Wnt Pathway Activation in Mesothelioma evidacne of Dishvelled
overexpression and transcriptional activity of beta cat." Cancer Res 63: 4547-4551.
Ulasov, I. V., S. Nandi, M. Dey, A. M. Sonabend and M. S. Lesniak (2011). "Inhibition of Sonic
hedgehog and Notch pathways enhances sensitivity of CD133(+) glioma stem cells to
temozolomide therapy." Mol Med 17(1-2): 103-112.
Vajdic, C. M. and M. T. van Leeuwen (2009). "Cancer incidence and risk factors after solid
organ transplantation." Int J Cancer 125(8): 1747-1754.
Valadi, H., K. Ekstrom, A. Bossios, M. Sjostrand, J. J. Lee and J. O. Lotvall (2007). "Exosome-
mediated transfer of mRNAs and microRNAs is a novel mechanism of genetic exchange
between cells." Nat Cell Biol 9(6): 654-659.
Vandewalle, C. (2005). "SIP1/ZEB2 induces EMT by repressing genes of different epithelial
cell-cell junctions." Nucleic Acids Research 33(20): 6566-6578.
Veerla, S., D. Lindgren, A. Kvist, A. Frigyesi, J. Staaf, H. Persson, F. Liedberg, G. Chebil, S.
Gudjonsson, A. Borg, W. Mansson, C. Rovira and M. Hoglund (2009). "MiRNA expression in

212
urothelial carcinomas: important roles of miR-10a, miR-222, miR-125b, miR-7 and miR-452 for
tumor stage and metastasis, and frequent homozygous losses of miR-31." Int J Cancer 124(9):
2236-2242.
Verzi, M. P., H. Shin, H. H. He, R. Sulahian, C. A. Meyer, R. K. Montgomery, J. C. Fleet, M.
Brown, X. S. Liu and R. A. Shivdasani (2010). "Differentiation-specific histone modifications
reveal dynamic chromatin interactions and partners for the intestinal transcription factor CDX2."
Dev Cell 19(5): 713-726.
Vogler, M., D. Dinsdale, M. J. S. Dyer and G. M. Cohen (2008). "Bcl-2 inhibitors: small
molecules with a big impact on cancer therapy." Cell Death and Differentiation 16(3): 360-367.
Volinia, S., G. A. Calin, C. G. Liu, S. Ambs, A. Cimmino, F. Petrocca, R. Visone, M. Iorio, C.
Roldo, M. Ferracin, R. L. Prueitt, N. Yanaihara, G. Lanza, A. Scarpa, A. Vecchione, M. Negrini,
C. C. Harris and C. M. Croce (2006). "A microRNA expression signature of human solid tumors
defines cancer gene targets." Proc Natl Acad Sci U S A 103(7): 2257-2261.
Wang, J., P. O. Sakariassen, O. Tsinkalovsky, H. Immervoll, S. O. Boe, A. Svendsen, L.
Prestegarden, G. Rosland, F. Thorsen, L. Stuhr, A. Molven, R. Bjerkvig and P. O. Enger (2008).
"CD133 negative glioma cells form tumors in nude rats and give rise to CD133 positive cells."
Int J Cancer 122(4): 761-768.
Warburg, O. (1956 ). "<On the origins of a cancer cell.pdf>." Science.
Weidenfeld, J., W. Shu, L. Zhang, S. E. Millar and E. E. Morrisey (2002). "The WNT7b
promoter is regulated by TTF-1, GATA6, and Foxa2 in lung epithelium." J Biol Chem 277(23):
21061-21070.
Weiss, G. J., L. T. Bemis, E. Nakajima, M. Sugita, D. K. Birks, W. A. Robinson, M. Varella-
Garcia, P. A. Bunn, Jr., J. Haney, B. A. Helfrich, H. Kato, F. R. Hirsch and W. A. Franklin
213
(2008). "EGFR regulation by microRNA in lung cancer: correlation with clinical response and
survival to gefitinib and EGFR expression in cell lines." Ann Oncol 19(6): 1053-1059.
West, K. A., S. Sianna Castillo and P. A. Dennis (2002). "Activation of the PI3K/Akt pathway
and chemotherapeutic resistance." Drug resistance updates 5(6): 234-248.
Whitehurst, A. W., B. O. Bodemann, J. Cardenas, D. Ferguson, L. Girard, M. Peyton, J. D.
Minna, C. Michnoff, W. Hao, M. G. Roth, X. J. Xie and M. A. White (2007). "Synthetic lethal
screen identification of chemosensitizer loci in cancer cells." Nature 446(7137): 815-819.
Wightman, B., I. Ha and G. Ruvkun (1993). "Posttranscriptional regulation of the heterochronic
gene lin-14 by lin-4 mediates temporal pattern formation in C. elegans." cell.
William Matsui, C. A. H., Qiuju Wang, Matthew T. Malehorn, James Barber, Yvette Tanhehco,
B. Douglas Smith, Curt I. Civin, and Richard J. Jones (2003). "Characterization of clonogenic
multiple myeloma cells." Blood.
Wright1, J. W. S. W. E. (2000). "Hayflick, his limit, and cellular ageing." Nature Reveiws
Yachida, S., S. Jones, I. Bozic, T. Antal, R. Leary, B. Fu, M. Kamiyama, R. H. Hruban, J. R.
Eshleman, M. A. Nowak, V. E. Velculescu, K. W. Kinzler, B. Vogelstein and C. A. Iacobuzio-
Donahue (2010). "Distant metastasis occurs late during the genetic evolution of pancreatic
cancer." Nature 467(7319): 1114-1117.
Yang, J. S., M. D. Phillips, D. Betel, P. Mu, A. Ventura, A. C. Siepel, K. C. Chen and E. C. Lai
(2011). "Widespread regulatory activity of vertebrate microRNA* species." RNA 17(2): 312-
326.
Yang, W. J., D. D. Yang, S. Na, G. E. Sandusky, Q. Zhang and G. Zhao (2005). "Dicer is
required for embryonic angiogenesis during mouse development." J Biol Chem 280(10): 9330-
9335.
214
Yardena Samuels1, Z. W., Alberto Bardelli1, Natalie Silliman1, Janine Ptak1, Steve Szabo1, Hai
Yan2, Adi Gazdar3, Steven M. Powell4, Gregory J. Riggins1, James K. V. Willson5, Sanford
Markowitz5, Kenneth W. Kinzler1, Bert Vogelstein1, Victor E. Velculescu (2004). "High
Frequency of Mutations of the PIK3CA Gene in Human Cancers." Science.
Yekta, S., I. H. Shih and D. P. Bartel (2004). "MicroRNA-directed cleavage of HOXB8 mRNA."
Science 304(5670): 594-596.
Yuneva, M., N. Zamboni, P. Oefner, R. Sachidanandam and Y. Lazebnik (2007). "Deficiency in
glutamine but not glucose induces MYC-dependent apoptosis in human cells." The Journal of
Cell Biology 178(1): 93-105.
Zamore, P. D., T. Tuschl, P. A. Sharp and D. P. Bartel (2000). "RNAi." Cell 101(1): 25-33.
Zhang, B., H. Chen, L. Zhang, O. Dakhova, Y. Zhang, M. T. Lewis, C. J. Creighton, M. M.
Ittmann and L. Xin (2013). "A dosage-dependent pleiotropic role of Dicer in prostate cancer
growth and metastasis." Oncogene.
Zhang, L., D. Hou, X. Chen, D. Li, L. Zhu, Y. Zhang, J. Li, Z. Bian, X. Liang, X. Cai, Y. Yin, C.
Wang, T. Zhang, D. Zhu, D. Zhang, J. Xu, Q. Chen, Y. Ba, J. Liu, Q. Wang, J. Chen, J. Wang,
M. Wang, Q. Zhang, J. Zhang, K. Zen and C. Y. Zhang (2012). "Exogenous plant MIR168a
specifically targets mammalian LDLRAP1: evidence of cross-kingdom regulation by
microRNA." Cell Res 22(1): 107-126.
Zhang, Y., A. M. Goss, E. D. Cohen, R. Kadzik, J. J. Lepore, K. Muthukumaraswamy, J. Yang,
F. J. DeMayo, J. A. Whitsett, M. S. Parmacek and E. E. Morrisey (2008). "A Gata6-Wnt
pathway required for epithelial stem cell development and airway regeneration." Nat Genet
40(7): 862-870.
Zhao, L. and P. K. Vogt (2008). "Class I PI3K in oncogenic cellular transformation." Oncogene
27(41): 5486-5496.

215
Zheng, T., J. Wang, X. Chen and L. Liu (2010). "Role of microRNA in anticancer drug
resistance." Int J Cancer 126(1): 2-10.
Zinzalla, V., D. Stracka, W. Oppliger and M. N. Hall (2011). "Activation of mTORC2 by
association with the ribosome." Cell 144(5): 757-768.