Diffusion-based spatial priors for functional magnetic resonance images
Upload
independentCategory
view
0download
0
at SciVerse ScienceDirect
Quaternary Science Reviews 48 (2012) 54e60
Contents lists available
Quaternary Science Reviews
journal homepage: www.elsevier .com/locate/quascirev
Deposition times in the northeastern United States during the Holocene:establishing valid priors for Bayesian age models
S. Goring a,*, J.W. Williams a,b, J.L. Blois a,b, S.T. Jackson c, C.J. Paciorek d, R.K. Booth e, J.R. Marlon a,M. Blaauw f, J.A. Christen g
aDepartment of Geography, University of Wisconsin e Madison, 160 Science Hall, 550 North Park St, Madison, WI 53706-1491, USAbNelson Institute Center for Climatic Research, University of Wisconsin e Madison, 1225 West Dayton St, Madison, WI 53706, USAcDepartment of Botany, University of Wyoming, 1000 E. University Ave., Laramie, WY 82071, USAdDepartment of Statistics, 367 Evans Hall, University of California, Berkeley, CA 94720, USAeDepartment of Earth & Environmental Science, Lehigh University, Bethlehem, PA 18015, USAf School of Geography, Archaeology and Palaeoecology, Queen’s University Belfast, Belfast BT7 1NN, Northern Ireland, UKgCentre for Mathematical Research (CIMAT), A.P. 402, 36000 Guanajuato, Mexico
a r t i c l e i n f o
Article history:Received 23 December 2011Received in revised form18 May 2012Accepted 25 May 2012Available online 7 July 2012
Keywords:HoloceneAgeedepth modelingRadiocarbonBayesianSedimentationUncertaintyDeposition
* Corresponding author. Tel.: þ1 608 262 6523; faxE-mail address: [email protected] (S. Goring).
0277-3791/$ e see front matter � 2012 Elsevier Ltd.http://dx.doi.org/10.1016/j.quascirev.2012.05.019
a b s t r a c t
Ageedepth relationships in sedimentary archives such as lakes, wetlands and bogs are non-linear withirregular probability distributions associated with calibrated radiocarbon dates. Bayesian approaches arethus well-suited to understanding relationships between age and depth for use in paleoecologicalstudies. Bayesian models for the accumulation of sediment and organic matter within basins combinedated material from one or more records with prior information about the behavior of depositiontimes (yr/cm) based on expert knowledge. Well-informed priors are essential to good modeling of theageedepth relationship, but are particularly important in cases where data may be sparse (e.g., fewradiocarbon dates), or unclear (e.g., age-reversals, coincident dates, age offsets, outliers and dates withina radiocarbon plateau).
Here we assessed Holocene deposition times using 204 ageedepth models obtained from the NeotomaPaleoecology Database (www.neotomadb.org) for both lacustrine and palustrine environments acrossthe northeastern United States. These ageedepth models were augmented using biostratigraphic eventsidentifiable within pollen records from the northeastern United States during the Holocene and late-Pleistocene.
Deposition times are significantly related to depositional environment (palustrine and lacustrine),sediment age, and sediment depth. Spatial variables hadnon-significant relationshipswithdeposition timewhen site effects were considered. The best-fit model was a generalized additive mixedmodel that relatesdeposition time to age, stratified by depositional environment with site as a random factor. The best-fitmodel accounts for 63.3% of the total deviance in deposition times. The strongly increasing accumula-tion rates of the last 500e1000 years indicate that gamma distributions describing lacustrine depositiontimes (a¼ 1.08, b¼ 18.28) and palustrine deposition times (a¼ 1.23, b¼ 22.32) for the entireHolocenemaybe insufficient for Bayesian approaches since there is strong variation in the gamma parameters both in themost recent sediments and throughout the Holocene. Time-averaged gamma distributions for lacustrine(a¼ 1.35, b¼ 19.64) and palustrine samples (a¼ 1.40, b¼ 20.72) show lower overall deposition times, butvariability remains. The variation in gamma parameters through time may require the use of multiplegammadistributions during theHolocene to generate accurate ageedepthmodels.Wepresent estimates ofgammaparameters for deposition times at 1000 yr intervals. The parameters generated in this study can beused directly within Bacon to act as Bayesian priors for sedimentary age models.
� 2012 Elsevier Ltd. All rights reserved.
: þ1 608 265 3991.
All rights reserved.
1. Introduction
The influx and accumulation of sediment and organic matterinto lacustrine and palustrine basins varies over time and space(Holocene: Webb and Webb, 1988; last 150 yrs: Brothers et al.,
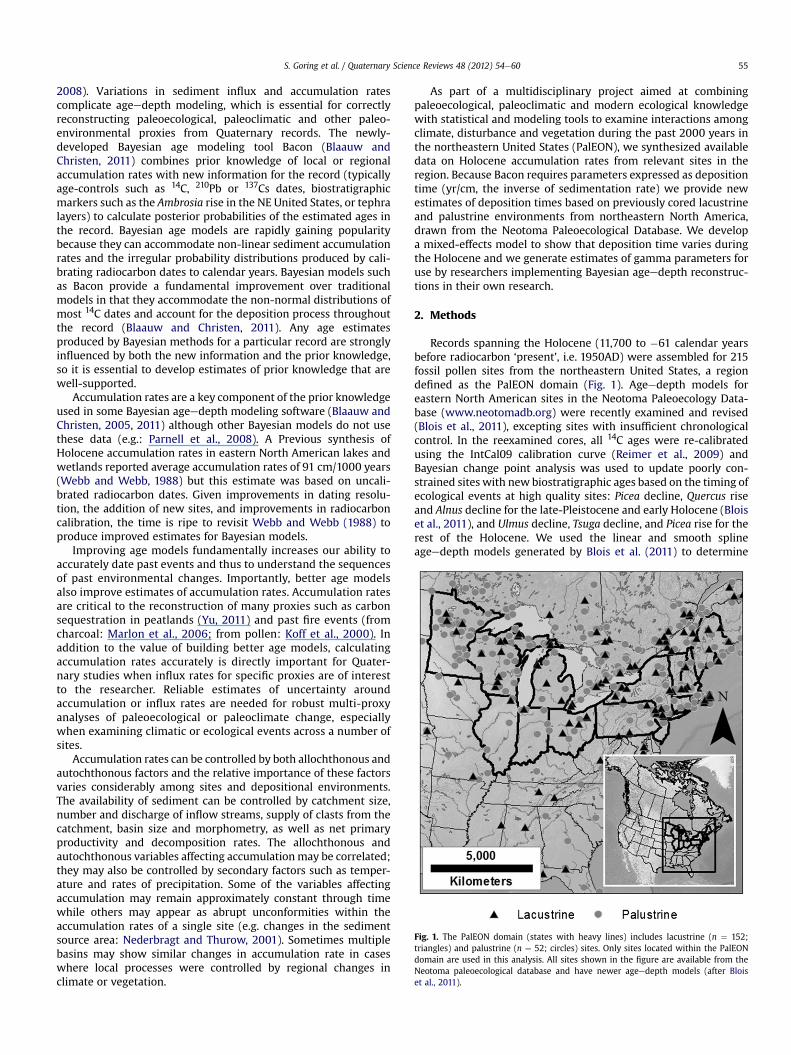
Fig. 1. The PalEON domain (states with heavy lines) includes lacustrine (n ¼ 152;triangles) and palustrine (n ¼ 52; circles) sites. Only sites located within the PalEONdomain are used in this analysis. All sites shown in the figure are available from theNeotoma paleoecological database and have newer ageedepth models (after Bloiset al., 2011).
S. Goring et al. / Quaternary Science Reviews 48 (2012) 54e60 55
2008). Variations in sediment influx and accumulation ratescomplicate ageedepth modeling, which is essential for correctlyreconstructing paleoecological, paleoclimatic and other paleo-environmental proxies from Quaternary records. The newly-developed Bayesian age modeling tool Bacon (Blaauw andChristen, 2011) combines prior knowledge of local or regionalaccumulation rates with new information for the record (typicallyage-controls such as 14C, 210Pb or 137Cs dates, biostratigraphicmarkers such as the Ambrosia rise in the NE United States, or tephralayers) to calculate posterior probabilities of the estimated ages inthe record. Bayesian age models are rapidly gaining popularitybecause they can accommodate non-linear sediment accumulationrates and the irregular probability distributions produced by cali-brating radiocarbon dates to calendar years. Bayesian models suchas Bacon provide a fundamental improvement over traditionalmodels in that they accommodate the non-normal distributions ofmost 14C dates and account for the deposition process throughoutthe record (Blaauw and Christen, 2011). Any age estimatesproduced by Bayesian methods for a particular record are stronglyinfluenced by both the new information and the prior knowledge,so it is essential to develop estimates of prior knowledge that arewell-supported.
Accumulation rates are a key component of the prior knowledgeused in some Bayesian ageedepth modeling software (Blaauw andChristen, 2005, 2011) although other Bayesian models do not usethese data (e.g.: Parnell et al., 2008). A Previous synthesis ofHolocene accumulation rates in eastern North American lakes andwetlands reported average accumulation rates of 91 cm/1000 years(Webb and Webb, 1988) but this estimate was based on uncali-brated radiocarbon dates. Given improvements in dating resolu-tion, the addition of new sites, and improvements in radiocarboncalibration, the time is ripe to revisit Webb and Webb (1988) toproduce improved estimates for Bayesian models.
Improving age models fundamentally increases our ability toaccurately date past events and thus to understand the sequencesof past environmental changes. Importantly, better age modelsalso improve estimates of accumulation rates. Accumulation ratesare critical to the reconstruction of many proxies such as carbonsequestration in peatlands (Yu, 2011) and past fire events (fromcharcoal: Marlon et al., 2006; from pollen: Koff et al., 2000). Inaddition to the value of building better age models, calculatingaccumulation rates accurately is directly important for Quater-nary studies when influx rates for specific proxies are of interestto the researcher. Reliable estimates of uncertainty aroundaccumulation or influx rates are needed for robust multi-proxyanalyses of paleoecological or paleoclimate change, especiallywhen examining climatic or ecological events across a number ofsites.
Accumulation rates can be controlled by both allochthonous andautochthonous factors and the relative importance of these factorsvaries considerably among sites and depositional environments.The availability of sediment can be controlled by catchment size,number and discharge of inflow streams, supply of clasts from thecatchment, basin size and morphometry, as well as net primaryproductivity and decomposition rates. The allochthonous andautochthonous variables affecting accumulationmay be correlated;they may also be controlled by secondary factors such as temper-ature and rates of precipitation. Some of the variables affectingaccumulation may remain approximately constant through timewhile others may appear as abrupt unconformities within theaccumulation rates of a single site (e.g. changes in the sedimentsource area: Nederbragt and Thurow, 2001). Sometimes multiplebasins may show similar changes in accumulation rate in caseswhere local processes were controlled by regional changes inclimate or vegetation.
As part of a multidisciplinary project aimed at combiningpaleoecological, paleoclimatic and modern ecological knowledgewith statistical and modeling tools to examine interactions amongclimate, disturbance and vegetation during the past 2000 years inthe northeastern United States (PalEON), we synthesized availabledata on Holocene accumulation rates from relevant sites in theregion. Because Bacon requires parameters expressed as depositiontime (yr/cm, the inverse of sedimentation rate) we provide newestimates of deposition times based on previously cored lacustrineand palustrine environments from northeastern North America,drawn from the Neotoma Paleoecological Database. We developa mixed-effects model to show that deposition time varies duringthe Holocene and we generate estimates of gamma parameters foruse by researchers implementing Bayesian ageedepth reconstruc-tions in their own research.
2. Methods
Records spanning the Holocene (11,700 to �61 calendar yearsbefore radiocarbon ‘present’, i.e. 1950AD) were assembled for 215fossil pollen sites from the northeastern United States, a regiondefined as the PalEON domain (Fig. 1). Ageedepth models foreastern North American sites in the Neotoma Paleoecology Data-base (www.neotomadb.org) were recently examined and revised(Blois et al., 2011), excepting sites with insufficient chronologicalcontrol. In the reexamined cores, all 14C ages were re-calibratedusing the IntCal09 calibration curve (Reimer et al., 2009) andBayesian change point analysis was used to update poorly con-strained sites with new biostratigraphic ages based on the timing ofecological events at high quality sites: Picea decline, Quercus riseand Alnus decline for the late-Pleistocene and early Holocene (Bloiset al., 2011), and Ulmus decline, Tsuga decline, and Picea rise for therest of the Holocene. We used the linear and smooth splineageedepth models generated by Blois et al. (2011) to determine
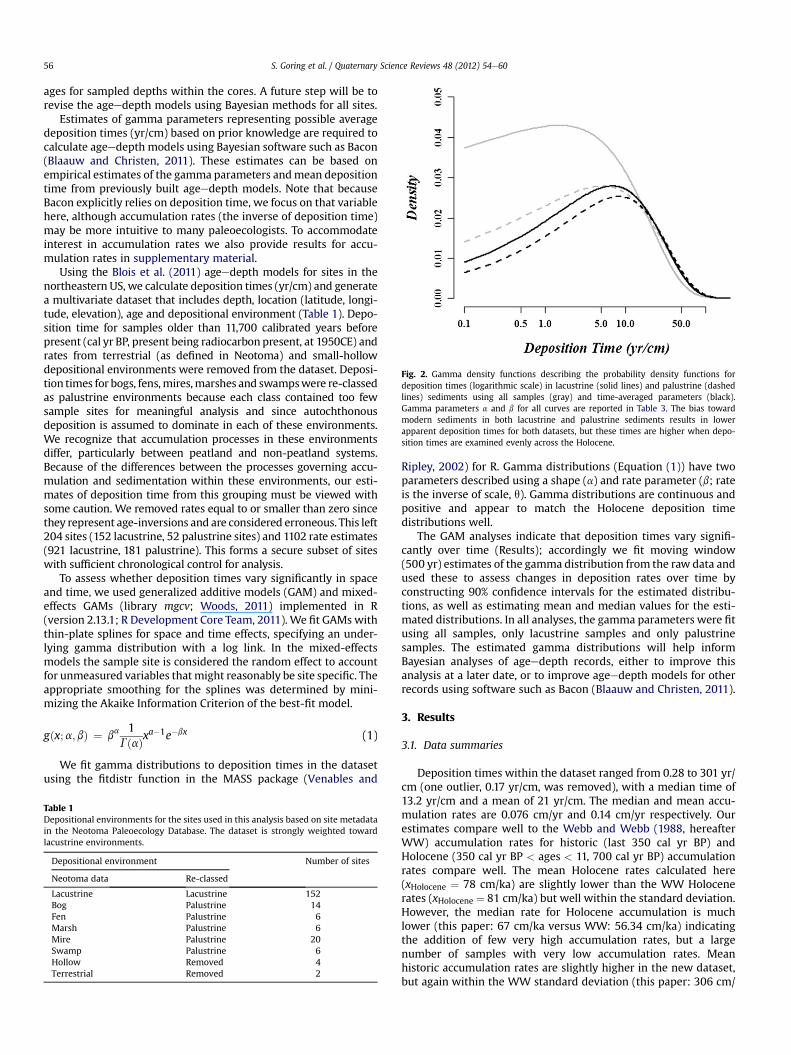
Fig. 2. Gamma density functions describing the probability density functions fordeposition times (logarithmic scale) in lacustrine (solid lines) and palustrine (dashedlines) sediments using all samples (gray) and time-averaged parameters (black).Gamma parameters a and b for all curves are reported in Table 3. The bias towardmodern sediments in both lacustrine and palustrine sediments results in lowerapparent deposition times for both datasets, but these times are higher when depo-sition times are examined evenly across the Holocene.
S. Goring et al. / Quaternary Science Reviews 48 (2012) 54e6056
ages for sampled depths within the cores. A future step will be torevise the ageedepth models using Bayesian methods for all sites.
Estimates of gamma parameters representing possible averagedeposition times (yr/cm) based on prior knowledge are required tocalculate ageedepth models using Bayesian software such as Bacon(Blaauw and Christen, 2011). These estimates can be based onempirical estimates of the gamma parameters andmean depositiontime from previously built ageedepth models. Note that becauseBacon explicitly relies on deposition time, we focus on that variablehere, although accumulation rates (the inverse of deposition time)may be more intuitive to many paleoecologists. To accommodateinterest in accumulation rates we also provide results for accu-mulation rates in supplementary material.
Using the Blois et al. (2011) ageedepth models for sites in thenortheastern US, we calculate deposition times (yr/cm) and generatea multivariate dataset that includes depth, location (latitude, longi-tude, elevation), age and depositional environment (Table 1). Depo-sition time for samples older than 11,700 calibrated years beforepresent (cal yr BP, present being radiocarbon present, at 1950CE) andrates from terrestrial (as defined in Neotoma) and small-hollowdepositional environments were removed from the dataset. Deposi-tion times for bogs, fens,mires,marshes and swampswere re-classedas palustrine environments because each class contained too fewsample sites for meaningful analysis and since autochthonousdeposition is assumed to dominate in each of these environments.We recognize that accumulation processes in these environmentsdiffer, particularly between peatland and non-peatland systems.Because of the differences between the processes governing accu-mulation and sedimentation within these environments, our esti-mates of deposition time from this grouping must be viewed withsome caution. We removed rates equal to or smaller than zero sincethey represent age-inversions and are considered erroneous. This left204 sites (152 lacustrine, 52 palustrine sites) and 1102 rate estimates(921 lacustrine, 181 palustrine). This forms a secure subset of siteswith sufficient chronological control for analysis.
To assess whether deposition times vary significantly in spaceand time, we used generalized additive models (GAM) and mixed-effects GAMs (library mgcv; Woods, 2011) implemented in R(version 2.13.1; R Development Core Team, 2011). We fit GAMswiththin-plate splines for space and time effects, specifying an under-lying gamma distribution with a log link. In the mixed-effectsmodels the sample site is considered the random effect to accountfor unmeasured variables thatmight reasonably be site specific. Theappropriate smoothing for the splines was determined by mini-mizing the Akaike Information Criterion of the best-fit model.
gðx;a; bÞ ¼ ba1
GðaÞxa�1e�bx (1)
We fit gamma distributions to deposition times in the datasetusing the fitdistr function in the MASS package (Venables and
Table 1Depositional environments for the sites used in this analysis based on site metadatain the Neotoma Paleoecology Database. The dataset is strongly weighted towardlacustrine environments.
Depositional environment Number of sites
Neotoma data Re-classed
Lacustrine Lacustrine 152Bog Palustrine 14Fen Palustrine 6Marsh Palustrine 6Mire Palustrine 20Swamp Palustrine 6Hollow Removed 4Terrestrial Removed 2
Ripley, 2002) for R. Gamma distributions (Equation (1)) have twoparameters described using a shape (a) and rate parameter (b; rateis the inverse of scale, q). Gamma distributions are continuous andpositive and appear to match the Holocene deposition timedistributions well.
The GAM analyses indicate that deposition times vary signifi-cantly over time (Results); accordingly we fit moving window(500 yr) estimates of the gamma distribution from the raw data andused these to assess changes in deposition rates over time byconstructing 90% confidence intervals for the estimated distribu-tions, as well as estimating mean and median values for the esti-mated distributions. In all analyses, the gamma parameters were fitusing all samples, only lacustrine samples and only palustrinesamples. The estimated gamma distributions will help informBayesian analyses of ageedepth records, either to improve thisanalysis at a later date, or to improve ageedepth models for otherrecords using software such as Bacon (Blaauw and Christen, 2011).
3. Results
3.1. Data summaries
Deposition times within the dataset ranged from 0.28 to 301 yr/cm (one outlier, 0.17 yr/cm, was removed), with a median time of13.2 yr/cm and a mean of 21 yr/cm. The median and mean accu-mulation rates are 0.076 cm/yr and 0.14 cm/yr respectively. Ourestimates compare well to the Webb and Webb (1988, hereafterWW) accumulation rates for historic (last 350 cal yr BP) andHolocene (350 cal yr BP < ages < 11, 700 cal yr BP) accumulationrates compare well. The mean Holocene rates calculated here(xHolocene ¼ 78 cm/ka) are slightly lower than the WW Holocenerates (xHolocene ¼ 81 cm/ka) but well within the standard deviation.However, the median rate for Holocene accumulation is muchlower (this paper: 67 cm/ka versus WW: 56.34 cm/ka) indicatingthe addition of few very high accumulation rates, but a largenumber of samples with very low accumulation rates. Meanhistoric accumulation rates are slightly higher in the new dataset,but again within the WW standard deviation (this paper: 306 cm/
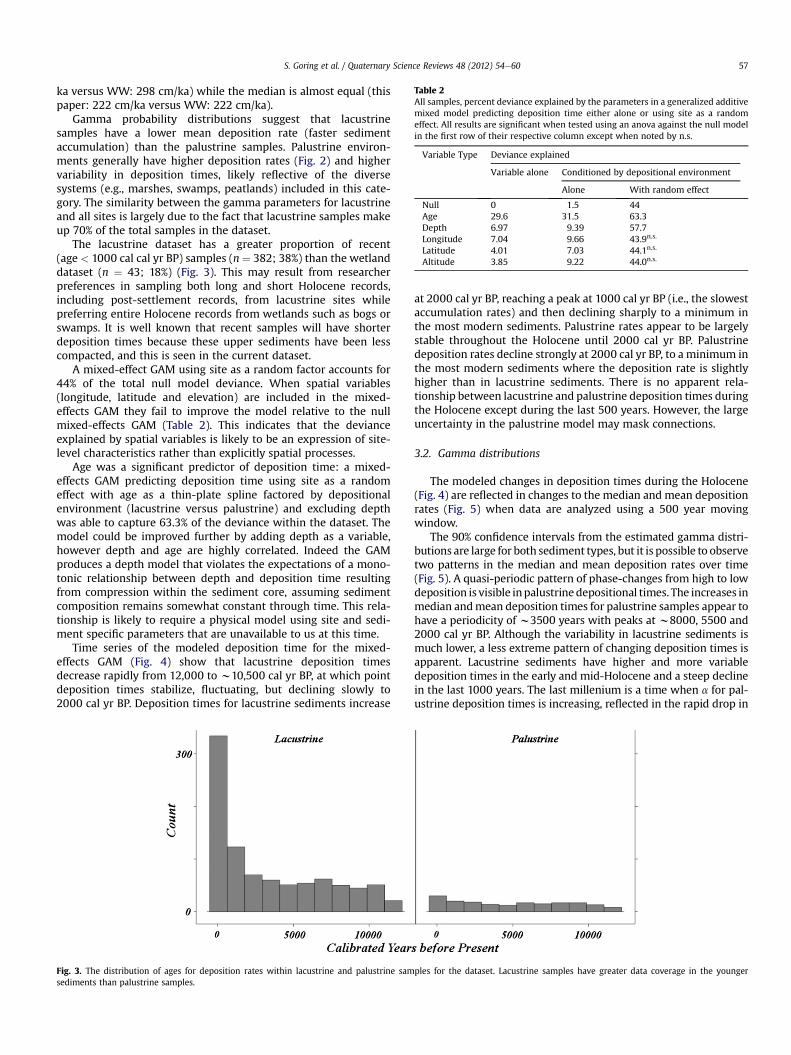
Table 2All samples, percent deviance explained by the parameters in a generalized additivemixed model predicting deposition time either alone or using site as a randomeffect. All results are significant when tested using an anova against the null modelin the first row of their respective column except when noted by n.s.
Variable Type Deviance explained
Variable alone Conditioned by depositional environment
Alone With random effect
Null 0 1.5 44Age 29.6 31.5 63.3Depth 6.97 9.39 57.7Longitude 7.04 9.66 43.9n.s.
Latitude 4.01 7.03 44.1n.s.
Altitude 3.85 9.22 44.0n.s.
S. Goring et al. / Quaternary Science Reviews 48 (2012) 54e60 57
ka versus WW: 298 cm/ka) while the median is almost equal (thispaper: 222 cm/ka versus WW: 222 cm/ka).
Gamma probability distributions suggest that lacustrinesamples have a lower mean deposition rate (faster sedimentaccumulation) than the palustrine samples. Palustrine environ-ments generally have higher deposition rates (Fig. 2) and highervariability in deposition times, likely reflective of the diversesystems (e.g., marshes, swamps, peatlands) included in this cate-gory. The similarity between the gamma parameters for lacustrineand all sites is largely due to the fact that lacustrine samples makeup 70% of the total samples in the dataset.
The lacustrine dataset has a greater proportion of recent(age < 1000 cal cal yr BP) samples (n ¼ 382; 38%) than the wetlanddataset (n ¼ 43; 18%) (Fig. 3). This may result from researcherpreferences in sampling both long and short Holocene records,including post-settlement records, from lacustrine sites whilepreferring entire Holocene records from wetlands such as bogs orswamps. It is well known that recent samples will have shorterdeposition times because these upper sediments have been lesscompacted, and this is seen in the current dataset.
A mixed-effect GAM using site as a random factor accounts for44% of the total null model deviance. When spatial variables(longitude, latitude and elevation) are included in the mixed-effects GAM they fail to improve the model relative to the nullmixed-effects GAM (Table 2). This indicates that the devianceexplained by spatial variables is likely to be an expression of site-level characteristics rather than explicitly spatial processes.
Age was a significant predictor of deposition time: a mixed-effects GAM predicting deposition time using site as a randomeffect with age as a thin-plate spline factored by depositionalenvironment (lacustrine versus palustrine) and excluding depthwas able to capture 63.3% of the deviance within the dataset. Themodel could be improved further by adding depth as a variable,however depth and age are highly correlated. Indeed the GAMproduces a depth model that violates the expectations of a mono-tonic relationship between depth and deposition time resultingfrom compression within the sediment core, assuming sedimentcomposition remains somewhat constant through time. This rela-tionship is likely to require a physical model using site and sedi-ment specific parameters that are unavailable to us at this time.
Time series of the modeled deposition time for the mixed-effects GAM (Fig. 4) show that lacustrine deposition timesdecrease rapidly from 12,000 to w10,500 cal yr BP, at which pointdeposition times stabilize, fluctuating, but declining slowly to2000 cal yr BP. Deposition times for lacustrine sediments increase
Fig. 3. The distribution of ages for deposition rates within lacustrine and palustrine samsediments than palustrine samples.
at 2000 cal yr BP, reaching a peak at 1000 cal yr BP (i.e., the slowestaccumulation rates) and then declining sharply to a minimum inthe most modern sediments. Palustrine rates appear to be largelystable throughout the Holocene until 2000 cal yr BP. Palustrinedeposition rates decline strongly at 2000 cal yr BP, to a minimum inthe most modern sediments where the deposition rate is slightlyhigher than in lacustrine sediments. There is no apparent rela-tionship between lacustrine and palustrine deposition times duringthe Holocene except during the last 500 years. However, the largeuncertainty in the palustrine model may mask connections.
3.2. Gamma distributions
The modeled changes in deposition times during the Holocene(Fig. 4) are reflected in changes to the median and mean depositionrates (Fig. 5) when data are analyzed using a 500 year movingwindow.
The 90% confidence intervals from the estimated gamma distri-butions are large for both sediment types, but it is possible to observetwo patterns in the median and mean deposition rates over time(Fig. 5). A quasi-periodic pattern of phase-changes from high to lowdeposition is visible inpalustrinedepositional times. The increases inmedian andmean deposition times for palustrine samples appear tohave a periodicity of w3500 years with peaks at w8000, 5500 and2000 cal yr BP. Although the variability in lacustrine sediments ismuch lower, a less extreme pattern of changing deposition times isapparent. Lacustrine sediments have higher and more variabledeposition times in the early and mid-Holocene and a steep declinein the last 1000 years. The last millenium is a time when a for pal-ustrine deposition times is increasing, reflected in the rapid drop in
ples for the dataset. Lacustrine samples have greater data coverage in the younger

Table 3Gamma parameters for 1000 year intervals during the Holocene. The parameters for‘All Samples’ are estimated directly from the dataset with no age control. The time-averaged parameters are estimated from the fitted distributions for each 1000-yeartime interval, removing the sample bias toward younger-aged sediments.
Lacustrine Palustrine
Alpha Beta Alpha Beta
All Samples 1.08 18.28 1.23 22.32Time-Averaged 1.35 19.64 1.40 20.720 cal yr BP 0.94 14.98 1.78 5.641000 1.72 12.65 1.65 20.492000 1.85 10.76 2.05 15.793000 1.76 11.50 2.08 11.554000 1.32 17.42 2.94 9.655000 1.70 15.87 1.49 28.256000 1.54 17.14 0.91 42.047000 2.60 8.04 3.54 4.038000 2.78 10.17 1.32 30.369000 2.11 10.45 0.89 45.2810,000 2.01 17.91 4.15 5.1811,000 0.90 62.98 2.33 11.61
S. Goring et al. / Quaternary Science Reviews 48 (2012) 54e6058
deposition times. Some of the variability in the parameters for thepalustrine sediment results from the small number of samples ineach time bin. However sample size and a show no significant rela-tionship (r ¼ �0.21, p > 0.05) in the palustrine dataset.
The a and b parameters of the gamma probability function arenegatively correlated for lacustrine (r ¼ �0.51, p ¼ 0.01) and pal-ustrine deposition times (r ¼ �0.67, p < 0.001) as might beexpected in a gamma function.
4. Discussion
Estimating accurate ageedepthmodels and quantifying temporaluncertainty is essential for all aspects of paleoclimatic and paleo-ecological research. Our analyses of deposition times in the north-easternUS contributes toward the application of Bayesian agemodelsby providing a comprehensive table of estimated gamma parametersthat can be used directly by researchers applyingmodern ageedepthmodeling software (e.g., Bacon) that require informedpriors tomodelsedimentaccumulation rates. Although the results shownhere are fora relatively limited spatiotemporal domain (northeastern US duringthe Holocene), the fitted gamma parameters may serve as a firstapproximation for other northern temperate lacustrine and palus-trine environments. This approach to establishing priors can also
Fig. 4. Modeled response of deposition time with age using a random effects model stratifiwith both predicted palustrine and lacustrine responses with age. Other sites would showrepresent one standard error. Actual deposition times from the dataset are represented asomitted from the graph for clarity but are included in the analysis.
be applied for other regions and time periods with large datasets ofpreviously collected and dated sediment. Future efforts shouldfocus on the separation of wetland types to establish more appro-priate priors for these diverse depositional settings.
The use of these estimated gamma parameters in recalculatingBayesian ageedepth models for sites in the northeastern US mayproduce some circularity. However, because a large number of sitesare used for parameter estimation, no single site should have undueinfluence on the overall estimates, minimizing circularity whenestimates are applied to recalculate age models for individual sites.Moreover, only ‘stable’ sites were considered for this analysis anda wide window (either 500 or 100 years) was chosen to calculatethe gamma parameters. Of course, the application of theseparameters to any new sites (i.e. sites not included in the estimationdataset) should be entirely free from circularity.
This analysis quantifies variability in deposition times andaccumulation rates among sites and across time, driven by physicalprocesses associated with deposition and compaction within thesediment column and perhaps also by recent human activities.Accumulation rates appear to be increasing over the last 150 yearsin European and North American lakes (Brothers et al., 2008; Roseet al., 2011), and over the last 300 years in degrading lake systemsin Japan (Ahn et al., 2006) possibly as a result of human influence.Our analysis reveals decreasing deposition times over the last 1000years, but the causes are obscure. Brothers et al. (2008) indicatethat accumulation rates over the last 150 years are spatially struc-tured in eastern North America. We find no evidence of spatialstructure at longer time scales that cannot be attributed to therandom effects associated with the distribution of sample sites inthe dataset (Table 2), but this may be an effect of the availability ofsite-specific data for basin and watershed size, sediment-type andother variables that might affect deposition times.
The results of Webb and Webb (1988) appear to be relativelyrobust across the Holocene when radiocarbon corrected data areexamined. Webb and Webb (1988) show a pattern of decliningaccumulation rates during the Holocenewhen radiocarbon ages arecalibrated. Using a larger dataset and Intcal09 radiocarbon cali-bration we show a much sharper decline in accumulation duringthe last 500e1000 years, and reveal more pronounced periodicityin variation for both lacustrine and palustrine sediments when thegamma parameters are examined (Figs. 4 and 5).
It is not clear why the fitted gamma distributions for palustrineenvironments change so strongly during the Holocene, and
ed by depositional environment. Results here are shown for one site (Aino Pond), butsimilar trends, shifted up or down depending on the random effect. Shaded regionsshaded points. Points with sedimentation rates greater than 85 yr/cm (n ¼ 37) were

Fig. 5. Change in median (thick black line) and mean (thick gray line) deposition times during the Holocene for lacustrine and palustrine sediments estimated from gammadistributions fit to a 500 year moving window of deposition times for lacustrine and palustrine sediments. The graphs show the 90% confidence intervals (thin line) for depositiontimes. Gray bands represent regions where confidence statistics could not be generated for the estimates due to small sample sizes.
S. Goring et al. / Quaternary Science Reviews 48 (2012) 54e60 59
whether this is a real signal or random fluctuations. At this time weregard the apparent variations in palustrine sedimentation ata 3500 year cycle as an interesting pattern worthy of further study,but potentially an artifact of uncertainty in the palustrine data sincethe pattern (Fig. 5) does not appear to be significant in the GAMmodel (Fig. 4).
Accumulation rates have been tied to climatic phenomena in theCathedral Mountains of British Columbia (Evans and Slaymaker,2004), where increased sediment yield rates in tree-line lakebasins is related to reduced vegetation cover as a result of coolerclimates. Evans and Slaymaker (2004) indicate the strong role oflocal basin dynamics in controlling sediment yield, and note thatnot all basins in the region show patterns similar to those of thetree-line lakes. Although the temporal patterns of change indeposition times are not particularly indicative of strong climateforcings, the distributions of gamma parameters for both lacustrineand palustrine sediments do indicate both short term and longerterm changes in the distributions of accumulation rates, potentiallyindicating climatic linkages.
5. Conclusions
This paper summarizes and quantifies our prior knowledge ofHolocene deposition times in the northeastern US in a form thatcan be readily applied by users of Bayesian age models. Mixed-effects models suggest that deposition times vary significantlyover time and from site to site, but with no evidence for significantvariations across latitude, longitude or altitude.
We hope that the use of these gamma parameter estimates willimprove ageedepth modeling in the region, and also spur thedevelopment of other regional datasets that can serve as a strongbase of prior knowledge to inform Bayesian (and other) agemodels.
Acknowledgments
This paper represents a contribution from NSF MacrosystemsBiology grant 144-PRJ45LP. This paper is a contribution of thePalEON project (www.paleonproject.org). The authors would like to
thank members of the PalEON team, Adeline Goring and CasperGruzling, members of the Williams Lab at the University ofWisconsineMadison and contributors to the Neotoma database(www.neotomadb.org) as well as one anonymous reviewer.
Appendix A. Supplementary data
Supplementary data related to this article can be found online athttp://dx.doi.org/10.1016/j.quascirev.2012.05.019.
References
Ahn, Y.S., Mizugaki, S., Nakamura, F., Nakamura, Y., 2006. Historical change in lakesedimentation in Lake Takkobu, Kushiro Mire, northern Japan over the last 300years. Geomorphology 78, 321e334.
Blaauw, M., Christen, J.A., 2005. Radiocarbon peat chronologies and environmentalchange. Applied Statistics 54, 805e816.
Blaauw, M., Christen, J.A., 2011. Flexible paleoclimate ageedepth models using anautoregressive gamma process. Bayesian Analysis 6, 457e474.
Blois, J.L., Williams, J.W., Grimm, E.C., Jackson, S.T., Graham, R.W., 2011.A methodological framework for assessing and reducing temporal uncertaintyin paleovegetation mapping from late-Quaternary pollen records. QuaternaryScience Reviews 30, 1926e1939.
Brothers, S., Vermaire, J.C., Gregory-Eaves, I., 2008. Empirical models for describingrecent sedimentation rates in lakes distributed across broad spatial scales.Journal of Paleolimnology 40, 1003e1019.
Evans, M., Slaymaker, O., 2004. Spatial and temporal variability of sediment deliveryfrom alpine lake basins, Cathedral Provincial Park, southern British Columbia.Geomorphology 61, 209e224.
Koff, T., Punninga, J.-M., Kangura, M., 2000. Impact of forest disturbance on thepollen influx in lake sediments during the last century. Review of Palaeobotanyand Palynology 111, 19e29.
Marlon, J., Bartlein, P.J., Whitlock, C., 2006. Fire-fuel-climate linkages in thenorthwestern USA during the Holocene. The Holocene 16, 1059e1071.
Nederbragt, A.J., Thurow, J.W., 2001. A 6000 year varve record of Holocene climatein Saanich Inlet, British Columbia, from digital sediment colour analysis of ODPLeg 169S cores. In: Bornhold, B.D., Kemp, A.E.S. (Eds.), Late Quaternary Sedi-mentation in Saanich Inlet, British Columbia, CanadaeOcean Drilling ProgramLeg 169S. Marine Geology, vol. 174, pp. 95e110.
Parnell, A., Haslett, J., Allen, J., Buck, C., Huntley, B., 2008. A flexible approach toassessing synchroneity of past events using Bayesian reconstructions of sedi-mentation history. Quaternary Science Reviews 27, 1872e1885.
R Development Core Team, 2011. R: a Language and Environment for StatisticalComputing. R Foundation for Statistical Computing, Vienna, Austria. ISBN 3-900051-07-0. http://www.R-project.org.

S. Goring et al. / Quaternary Science Reviews 48 (2012) 54e6060
Reimer, P.J., Baillie, M.G.L., Bard, E., Bayliss, A., Beck, J.W., Blackwell, P.G., Ramsey, C.B.,Buck, C.E., Burr, G.S., Edwards, R.L., Friedrich, M., Grootes, P.M., Guilderson, T.P.,Hajdas, I., Heaton, T.J., Hogg, A.G., Hughen, K.A., Kaiser, K.F., Kromer, B.,McCormac, F.G.,Manning, S.W., Reimer, R.W., Richards, D.A., Southon, J.R., Talamo, S.,Turney, C.S.M., van der Plicht, J., Weyhenmeyer, C.E., 2009. IntCal09 and Marine09radiocarbonagecalibrationcurves,0-50,000yearscalBP.Radiocarbon51,1111e1150.
Rose, N.L., Morley, D., Appleby, P.G., Battarbee, R.W., Alliksaar, T., Guilizzoni, P.,Jeppesen, E., Korhola, A., Punning, J.M., 2011. Sediment accumulation rates inEuropean lakes since AD 1850: trends, reference conditions and exceedence.Journal of Paleolimnology 45, 447e468.
Venables, W.N., Ripley, B.D., 2002. Modern Applied Statistics with S, fourth ed.Springer, New York. ISBN 0-387-95457-0.
Webb, R.S., Webb, T., 1988. Rates of sediment accumulation in pollen cores fromsmall lakes and mires of eastern North America. Quaternary Research 30,284e297.
Wood, S.N., 2011. Fast stable restricted maximum likelihood and marginal likeli-hood estimation of semiparametric generalized linear models. Journal of theRoyal Statistical Society (B) 73, 3e36.
Yu, Z., 2011. Holocene carbon flux histories of the world’s peatlands: Global carbon-cycle implications. The Holocene 21, 761e774.
Copyright © 2022 FDOKUMEN