Density functional theory study of the magnetic moment of ...
22
1 Density functional theory study of the magnetic moment of solute Mn in BCC Fe D. J. M. King 1* , S. C. Middleburgh 2,3 , P. A. Burr 4 , T. M. Whiting 1 , P.C. Fossati 1 , M. R. Wenman 1 1 Centre for Nuclear Engineering, Imperial College London, South Kensington, London, SW7 2AZ, United Kingdom 2 Nuclear Futures Institute, Bangor University, Dean Street, Bangor, Wales, LL57 1UT, UK 3 Westinghouse Electric Sweden AB, SE-721 63 Västerås, Sweden 4 School of Electrical Engineering, University of New South Wales, Kensington, 2052, NSW, Australia *Corresponding Author: E-mail: [email protected] Telephone: +447474031955 Abstract. An unexplained discrepancy exists between the experimentally measured and theoretically calculated magnetic moments of Mn in -Fe. In this study, we use density functional theory to suggest that this discrepancy is likely due to the local strain environment of a Mn atom in the Fe structure. The ferromagnetic coupling, found by experiment, was shown to be metastable and could be stabilised by a 2% hydrostatic compressive strain. The effects of Mn concentration, vacancies and interstitial defects on the magnetic moment of Mn are also discussed. It was found that the ground state, anti- ferromagnetic (AFM) coupling of Mn to Fe requires long range tensile relaxations of the neighbouring atoms along <111> which is hindered in the presence of other Mn atoms. Vacancies and Fe interstitial defects stabilise the AFM coupling but are not expected to have a large effect on the average measured magnetic moment. Keywords: density functional theory; ferrite; manganese; iron; RPV steels I. INTRODUCTION Steels are ubiquitous in technological applications due to the abundance and low cost of Fe and its highly desirable mechanical and corrosion properties with alloying additions. Manganese is second only to C in its importance and use in steels. Historically, Mn has been included as both a minor and major alloying addition. The former to increase workability by supressing FeS formation and latter to increase ductility, through twinning induced plasticity, in the fairly recently developed, so-called TWIP steels. The state-of-the art theoretical description of Mn in Fe has a large impact on our understanding of phenomena such as solute clustering 1 and vacancy-solute clustering 2 , which compromise the structural integrity of the steels during operation. The former occurs in the ferritic phase of duplex steels as a result of thermal ageing (573 – 773 K for >1000 h) 3–5 and in low-alloy steels 6–8 resulting from long- term (> 1 year) elevated temperature (~550 K); the latter, occurs due to neutron irradiation damage,
-
Upload
khangminh22 -
Category
Documents
-
view
3 -
download
0
Transcript of Density functional theory study of the magnetic moment of ...
1
Density functional theory study of the magnetic moment of solute Mn in
BCC Fe
D. J. M. King 1*, S. C. Middleburgh2,3, P. A. Burr4, T. M. Whiting1, P.C. Fossati1, M. R.
Wenman1
1Centre for Nuclear Engineering, Imperial College London, South Kensington, London, SW7 2AZ,
United Kingdom 2Nuclear Futures Institute, Bangor University, Dean Street, Bangor, Wales, LL57 1UT, UK
3Westinghouse Electric Sweden AB, SE-721 63 Västerås, Sweden 4School of Electrical Engineering, University of New South Wales, Kensington, 2052, NSW, Australia
*Corresponding Author:
E-mail: [email protected]
Telephone: +447474031955
Abstract. An unexplained discrepancy exists between the experimentally measured and
theoretically calculated magnetic moments of Mn in -Fe. In this study, we use density
functional theory to suggest that this discrepancy is likely due to the local strain
environment of a Mn atom in the Fe structure. The ferromagnetic coupling, found by
experiment, was shown to be metastable and could be stabilised by a 2% hydrostatic
compressive strain. The effects of Mn concentration, vacancies and interstitial defects on
the magnetic moment of Mn are also discussed. It was found that the ground state, anti-
ferromagnetic (AFM) coupling of Mn to Fe requires long range tensile relaxations of the
neighbouring atoms along <111> which is hindered in the presence of other Mn atoms.
Vacancies and Fe interstitial defects stabilise the AFM coupling but are not expected to
have a large effect on the average measured magnetic moment.
Keywords: density functional theory; ferrite; manganese; iron; RPV steels
I. INTRODUCTION
Steels are ubiquitous in technological applications due to the abundance and low cost of Fe and
its highly desirable mechanical and corrosion properties with alloying additions. Manganese is second
only to C in its importance and use in steels. Historically, Mn has been included as both a minor and
major alloying addition. The former to increase workability by supressing FeS formation and latter to
increase ductility, through twinning induced plasticity, in the fairly recently developed, so-called TWIP
steels. The state-of-the art theoretical description of Mn in Fe has a large impact on our understanding
of phenomena such as solute clustering1 and vacancy-solute clustering2, which compromise the
structural integrity of the steels during operation. The former occurs in the ferritic phase of duplex steels
as a result of thermal ageing (573 – 773 K for >1000 h)3–5 and in low-alloy steels6–8 resulting from long-
term (> 1 year) elevated temperature (~550 K); the latter, occurs due to neutron irradiation damage,

2
which is of interest to life extension of nuclear fission reactors and for fast neutron damage of steels to
be used in future fusion reactors. It is therefore important for atomic scale processes such as binding,
substitution and migration to be understood at a fundamental level, to be used in high order methods
and analyses9–13 to model these phenomena in industrial settings.
Mn has long been regarded as one of the most troublesome transition metals in terms of predicting
its magnetic behaviour and electronic interaction with other elements14. In its elemental ground state, it
adopts a 58 atom cubic unit cell of spacegroup 𝐼4̅3𝑚, and exhibits a non-collinear (NC) magnetic
structure, whereby atoms located in 2a, 8c and two 24g sites (in Wyckoff notation) exhibit different spin
vectors15,16. This magnetic structure undergoes a transition to paramagnetic (PM) structure at the Néel
temperature of ~95 K17. In contrast, Fe is one of the most well studied transition metals18–20. In its
ground-state, Fe adopts a ferromagnetic (FM) BCC structure21, which it maintains until its Curie
temperature at ~1043 K22.
With minor alloying additions of Mn to Fe the crystal structure will remain BCC as a solid
solution. The solubility limit is reached at ~3 at. % at ~600 K23, at equilibrium; however, increased
additions are reported to be stabilised using cold working24. The magnetic structure of Fe-Mn alloys is
highly variable and is thought to be affected by many different factors; namely, the Mn concentration25,
the local atomic environment26, lattice parameter14 and temperature24. This behaviour is observed to a
much lesser extent for Fe-Cu, Fe-Ni and Fe-Si solid solutions27. It is therefore no surprise that
discrepancies exist between experimental observations and theoretical frameworks. In the current study,
we use density functional theory (DFT) to study the effect of concentration, local environment, strain
and point defects on the magnetic moment and stability of Mn in α-Fe.
II. METHODOLOGY
A plane-wave density functional theory method was used, as implemented in the Vienna Ab initio
Simulation Package (VASP)28. The Perdew-Burke-Ernzerhof (PBE) exchange-correlation functional29,
based on the Generalised Gradient Approximation (GGA), is used with the projector augmented wave
(PAW) method30. Pseudopotentials provided with the VASP distribution were used, where 14 electrons
(3p6 3d7 4s1) for Fe and 13 electrons (3p6 3d5 4s2) for Mn are considered as valence electrons.

3
The k-points, energy cut-off and lattice parameters the perfect lattice of both elements (α-Fe and
α-Mn) were converged. It was determined that a real space k-point density of 0.03 Å-3 and energy cut-
off of 500 eV provided accurate results and were kept consistent for all calculations (resulting in 6×6×6,
4×4×4 and 2×2×2 k-point grids for the 54, 128 and 250 atom supercells). Constant pressure, full
relaxations with Methfessel-Paxton31 smearing (with a width of 0.1 eV) were used to obtain the ground-
state configurations. The tetrahedron smearing method with Blöchl corrections32 was used on fixed
dimension/volume calculations to generate the electronic density of states (DOS). Spin polarisation
effects were also included; non-collinear and collinear theory was used for the α-Mn structure. The
electronic energy and ionic relaxation convergence criteria were set to 10-6 and 10-4 eV, respectively,
for all calculations.
Supercells of 54 (3×3×3), 128 (4×4×4) and 250 (5×5×5) Fe atoms were relaxed at constant
pressure. To understand the behaviour of a dilute concentration of Mn in the -Fe lattice, a single Mn
was substituted for an Fe atom in each of the supercell sizes. For higher concentrations of Mn and Mn-
Mn interactions within the Fe matrix, a Mn content of 4.69 at. % was achieved by pseudo-randomly
selecting six lattice sites for Mn atom substitution in the 128 atom supercell. As this method is stochastic
in nature, this was repeated to produce 20 unique supercells (120 Mn atoms in total) to achieve a good
statistical understanding of the system. Cohesive, binding, substitutional, vacancy and interstitial
formation energies were calculated following standard procedures, outlined in the supplementary
material.
Linear elastic theory, as implemented within the ANETO framework33 for calculating the dipole
tensor using the strain method34,35, was used calculate the relaxation volume and interaction energies for
Mn in BCC ( Fe in the.
III. RESULTS AND DISCUSSION
A. Pure Mn and Fe
Table 1 reports the calculated values of cohesive enthalpies (Ec) and lattice parameters (a0),
presented for the ground-state (), cubic (, FCC ( and BCC (δ) Mn structures. Values for -Fe are

4
also provided, together with past literature values for Mn and Fe structures for comparison. The
following magnetic structures within -Mn were considered: Non-magnetic (NM), collinear anti-
ferromagnetic (AFM), non-collinear anti-ferromagnetic (NCL).
Table 1. Cohesive energy (Ec) and lattice parameter (a0) of structural and magnetic allotropes of pure Mn
and -Fe.
Crystal Structure Magnetic Structure Ec (eV/atom) a0 (Å)
Current Literature Current Literature
-Mn
NCL 3.87 - 8.61
8.61c, 8.91d AFM 3.86 - 8.64
NM 3.82 - 8.56
-Mn AFM 3.79 - 6.32 6.32e
-Mn NM 3.76 3.73a, 2.92b 3.50 3.49f
-Mn FM 3.69 - 2.79 2.78g
-Fe FM 4.88 4.78a, 4.28b
2.83 2.86b
References – theoretical: a36, c14, f37, g38; experimental: b39, d40, e41
In accordance with past literature, and the observed equilibrium behaviour of pure Mn, the -Mn
phase is the most energetically favourable at 0 K42. This is then followed by and phases, which
are temperature stabilised. The different known magnetic arrangements of -Mn were simulated, again
predicting the behaviour as found in past literature14,16. The magnetic moments of each atomic site can
be found in Table S1 (supplementary material). The overestimation of the cohesive enthalpies compared
to the experimental values can be attributed to the approximation of the exchange-correlation
functional36,43.
B. Mn in α-Fe
1. Magnetic moment and stability
After gaining confidence in the theoretical representation of pure Fe and Mn, we move to the case
in which a single Mn solute atom is placed in the -Fe matrix. The substitutional energy (Esub) provides
an indication of the stability of Mn in the BCC FM Fe lattice. This value should converge with system
size. Past literature has utilised 54 and 128 atom supercells where it was concluded that a convergence
of ±0.05 eV was achieved with the 128 atom supercell44. However, there is little agreement between the

5
magnetic moment of Mn and substitutional energy among theoretical literature27,44. In the publication
by Olsson et al. 201027, it was shown that the substitutional energy can vary ±0.3 eV between the
ultrasoft pseudopotential (USPP)45 and PAW method and that there is a large discrepancy between the
magnetic moment. This was attributed to the inability of the USPP method to correctly represent the
semi-core d electrons. In this section we investigate the effect of magnetic moment of Mn on Esub. It is
known that the magnetic moment of Mn is particularly difficult to converge in -Fe as a shallow energy
landscape exists between local FM and AFM states46 (where all magnetic states are henceforth
described, locally, in reference to the Fe matrix). Within this study it was found that the AFM state of
Mn is the ground state in -Fe and that it is also possible to model the FM state in 128 and 250 atom
supercells, provided a sufficiently high initial magnetic moment is set prior to energy minimisation, see
Table 2. The average magnetic moment of Fe remained relatively consistent at 2.26(1) B for all
calculations within this section.
Table 2. Influence of initial spin on final spin state of Mn (relative to Fe) and the corresponding substitutional
energies (Esub).
Supercell
dimensions
Mn concentration
(at. %) Initial spin Mn (B)
Final
spin Mn
(B)
Final
spin-state
Mn
Esub (eV)
3×3×3 1.85
2.00
1.89 AFM 0.20 0.00
2.00
4.00
4×4×4 0.78
2.00
AFM 0.19 0.00
2.00
4.00 0.54 FM 0.29
5×5×5 0.40
2.00
2.08 AFM 0.20 0.00
2.00
4.00 0.74 FM 0.25
These results demonstrate that it is possible to converge to both the FM and AFM state of Mn when
its initial magnetic moment is 4 or ≤ 2, respectively, for supercell sizes ≥128 atoms. The corresponding

6
substitutional energies highlight the importance of the resultant magnetic moment of Mn to its stability
in the -Fe matrix. When it is in the FM state the Esub becomes less favourable by 0.10 eV and 0.05 eV
for the 4×4×4 and 5×5×5 supercell, respectively. Since it is predicted that the AFM state is the more
stable of the two, it is recommended that it is used as the reference state for the calculation of binding
energy calculations.
When assessing the local density of states (LDOS) of Mn in -Fe, the FM and AFM spin-states are
distinct, see Fig. 1. The difference in states is observed as the shift in the anti-bonding peak of the
majority spin channel, from above the Fermi level for the AFM, to below the Fermi level in the FM
magnetic coupling of Mn. The occupation of the anti-bonding peak explains the relative stability
difference between the two states47.
Fig 1. Local density of states of the d-band of (A) FM and (B) AFM spin coupling in -Fe for a 128
atom supercell.
7
2. Calculated vs experimental magnetic moment
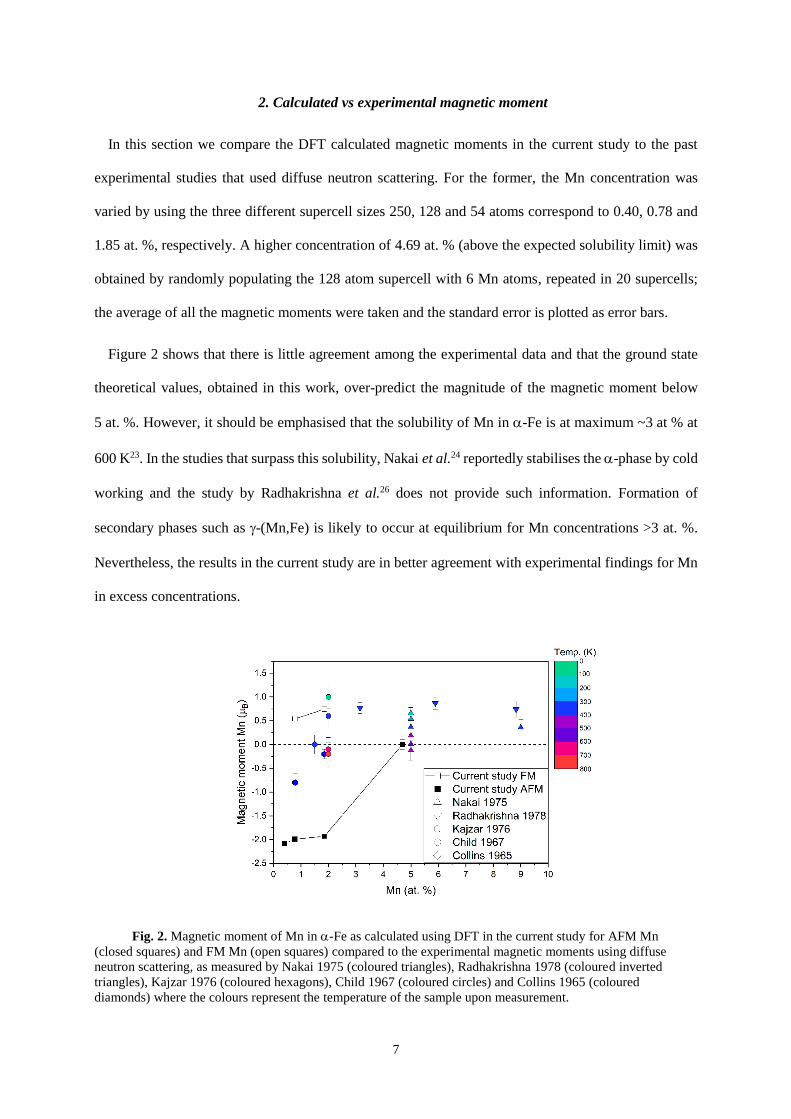
In this section we compare the DFT calculated magnetic moments in the current study to the past
experimental studies that used diffuse neutron scattering. For the former, the Mn concentration was
varied by using the three different supercell sizes 250, 128 and 54 atoms correspond to 0.40, 0.78 and
1.85 at. %, respectively. A higher concentration of 4.69 at. % (above the expected solubility limit) was
obtained by randomly populating the 128 atom supercell with 6 Mn atoms, repeated in 20 supercells;
the average of all the magnetic moments were taken and the standard error is plotted as error bars.
Figure 2 shows that there is little agreement among the experimental data and that the ground state
theoretical values, obtained in this work, over-predict the magnitude of the magnetic moment below
5 at. %. However, it should be emphasised that the solubility of Mn in -Fe is at maximum ~3 at % at
600 K23. In the studies that surpass this solubility, Nakai et al.24 reportedly stabilises the -phase by cold
working and the study by Radhakrishna et al.26 does not provide such information. Formation of
secondary phases such as -(Mn,Fe) is likely to occur at equilibrium for Mn concentrations >3 at. %.
Nevertheless, the results in the current study are in better agreement with experimental findings for Mn
in excess concentrations.
Fig. 2. Magnetic moment of Mn in -Fe as calculated using DFT in the current study for AFM Mn
(closed squares) and FM Mn (open squares) compared to the experimental magnetic moments using diffuse
neutron scattering, as measured by Nakai 1975 (coloured triangles), Radhakrishna 1978 (coloured inverted
triangles), Kajzar 1976 (coloured hexagons), Child 1967 (coloured circles) and Collins 1965 (coloured
diamonds) where the colours represent the temperature of the sample upon measurement.

8
In the following sections, the possible factors that lead to the discrepancies between experiment and
theoretical calculations and how these differences can be captured through a mechanistic understanding
of the Fe-Mn system are explored.
3. Atomic relaxations
By taking the difference between the atomic coordinates of the relaxed and unrelaxed supercells, the
vectors corresponding to the atomic relaxations upon substitution of Fe with Mn can be calculated.
Figure 3 provides an illustrative representation of the vectors (×100) in a 250 atom supercell. Although
these relaxations are small (~10-2 Å) they are markedly different between FM and AFM states. For the
AFM relaxation, the first nearest neighbour (1st nn) Fe was repelled by the Mn atom. The repulsion
propagated along the <111> over relatively long distances (~10 Å), while Fe atoms along the the <100>
and <201> from the Mn experience a shorter-range attraction (~5 Å). In the FM case, only displacements
of Fe towards Mn are observed (compressive), with the largest magnitude of 1.3×10⁻² Å in the 1st nn Fe.
Fig. 3. Atomic relaxation vectors ×100 in compression (red) and tension (green) of Fe atoms around a Mn
substitution (purple) for the AFM and FM magnetic moment of Mn in the 250 atom supercell.
For the smaller supercells (54 and 128 atoms) the long-range movement is more constrained and
may explain the slight variance in magnetic moment and absence of FM moment for the 54 atom case.
Figure 4 shows the elastic self-interaction energy48,49. It can be seen that the supercells are well
converged by 128 atoms.

9
Fig 4. Self-interaction energy of the substitutional Mn defect in -Fe when in the FM and AFM magnetic
state.
From linear elastic theory, the relaxation volumes of FM and AFM Mn are calculated for the
different supercell sizes, see Fig. 5. The volume change due to the tensile relaxations of the AFM Mn
and compressive relaxations of the FM Mn can be seen clearly. The effect of the FM Mn on the Fe
lattice is much more localised than the AFM, where the former has self-interaction energies three orders
of magnitude smaller than the latter. These results suggest that the increased stability of the AFM state
over FM state of Mn is due to electronic rather than elastic effects.
Fig 5. Relaxation volume of the substitutional Mn defect in -Fe when in the FM and AFM magnetic
state.

10
4. Mn concentration
The interaction between neighbouring Mn species in -Fe is not well understood. Past theoretical
studies that report the binding energies between two Mn atoms are not in accord27,44,50. Within this study,
a stochastic behaviour was found in the resultant magnetic moments of the Mn. When two Mn atoms
were placed in the 54, 128 and 250 atom supercells, in different nn positions, each adopted FM or AFM
moments with varying magnitudes and no clear trend (reported in Figure S1 of the supplementary
material). The binding energies between the two Mn atoms varied by ±0.05 eV between supercells and
did not correlate with their magnetic moment. Figure 6 reports the binding energies calculated for the
250 atom supercell, and provides a comparison with past literature. The calculation of the binding energy
was done using the AFM and FM reference state, which results in a significant difference (0.14 eV) in
energy.
Fig. 6. Mn-Mn nn binding energy for the 250 atom supercells using the AFM (open square) and FM (closed
square) reference state. Comparison to Olsson (green star) and Vincent’s (blue cross) work is included.
When comparing to the work of Olsson et al.27, the average binding energies calculated from the
FM Mn in -Fe reference state are somewhat in agreement. However, the FM state is metastable
therefore the AFM state should be taken as reference. This offset does not explain the discrepancy with
11
respect to the work of Vincent et al. 44. It is more likely that the difference stems from the use of USPPs
and other theoretical parameters.
When considering the difference in atomic relaxations for AFM and FM isolated Mn atoms, it is
perhaps no surprise that there is a large variation in magnetic moment between nearest neighbour Mn
with varying supercell size. If Mn does indeed prefer to exhibit AFM behaviour, then a more complex
atomic relaxation is required. However, at certain geometries of nearest neighbour Mn and without
sufficient long-range movement allowed, it will be more favourable for AFM and FM Mn atoms to
coexist.
A more concentrated system, in which 6 Mn atoms are randomly distributed on a 128 atom BCC
lattice replacing Fe, corresponding to a Mn concentration of 4.69 at. %, is now considered. Previous
theoretical work on concentrated Fe-Mn systems conclude that there is a uniform switch from AFM to
FM moment in Mn between 2 at % and 3 at. %51,52. In the current study, without sufficient statistical
precision, this conclusion could mistakenly be made; of the 20 supercells studied, 15% displayed
exclusively FM moments for Mn. However, the magnetic moment of Mn within the other 85% of the
supercells were a mix of AFM and FM where the average moments across all supercells ranges from
0.8 B to 0.9 B. Figure 7 shows the distribution of the magnetic moments of each Mn atom plotted
against supercell energy. When taking the average of all 120 Mn atoms simulated, the magnetic moment
equates to 0.06 B (dotted line). The enthalpy of formation (Eform) of the system displays a general trend
whereby the systems with lower average magnetic moment (large dashes) are more energetically
favourable. No correlation was found (correlation coefficient = 0.013) between the nearest neighbour
species and the resultant magnetic moment of Mn, which vary between -2.2 B and 1.1 B, see Fig. S2.

12
Figure 7. Magnetic moment of each Mn atom (small dashes), across the 20 supercells (grey shading), versus
the enthalpy of formation per unit (3Mn:51Fe). The average magnetic moment per supercell and mean magnetic
moment across all supercells is denoted by the large dashes and dotted line, respectively.
The environmental effect that is thought to influence the magnetic moment of Mn26 cannot be
predicted by the nearest neighbour species or concentration of Mn in -Fe. Further, the presence of other
Mn species does not stabilise a particular spin state. Rather, a more complex effect, likely due to the
relaxation vectors around each Mn, is observed; resulting in an average moment close to zero (and
median of ~0.70 B). The interaction volumes used in diffuse neutron scattering vary greatly with
experimental parameters53; it is expected that these volumes are of the m length scale (although not
explicitly stated) in references from Section III(B)(2). Therefore, the overall average magnetic moment
is an important result for comparison to literature.
5. Effect of strain
In the past, it has been demonstrated that the lattice parameter of -Mn has a large effect on its
magnetic structure14. To-date this effect has not been investigated in the Fe-Mn system, however
pioneering work by Cable et al. has explored this effect in Ni- and Co- Mn alloys54. Two methods of
13
straining the environment around the Mn atom were used in this study, both using 128 atom supercells:
Applying tension and compression (1) hydrostatically and fixing the volume and shape of the supercell
while allowing internal relaxation of the atoms and (2) locally in the 1st nn Fe, fixing supercell shape
and atomic positions of atoms. The latter performed to investigate the influence of only the 1st nn.
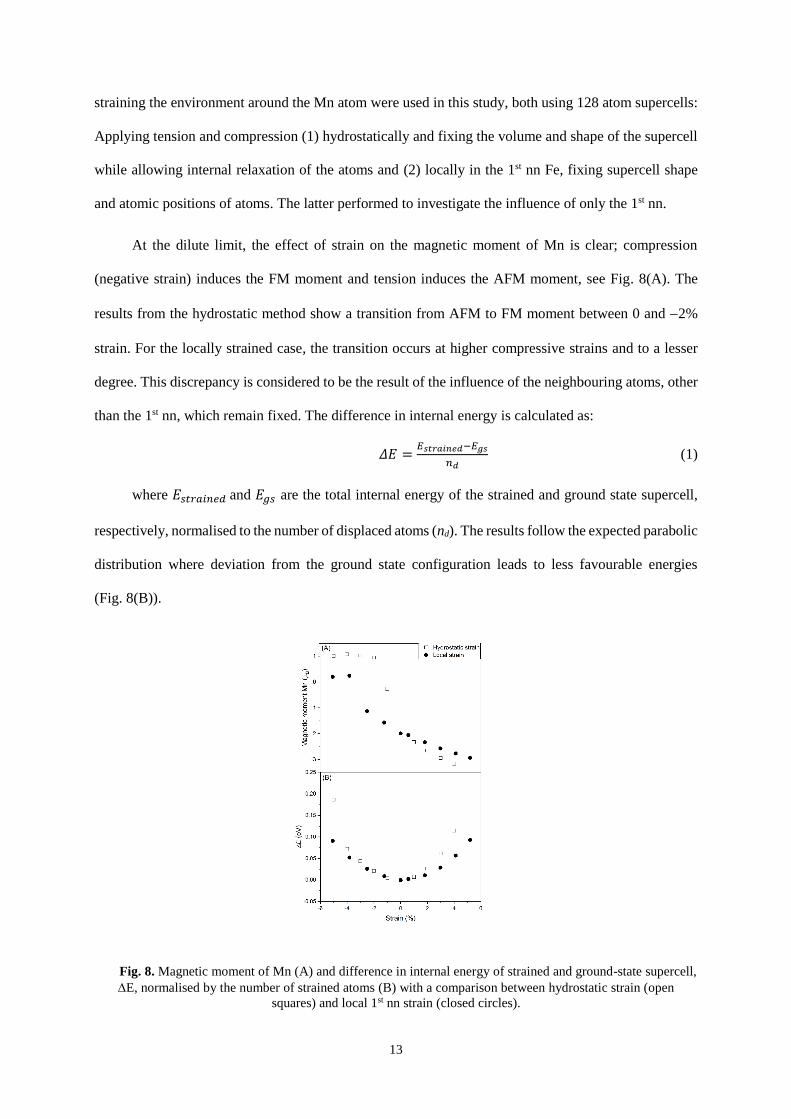
At the dilute limit, the effect of strain on the magnetic moment of Mn is clear; compression
(negative strain) induces the FM moment and tension induces the AFM moment, see Fig. 8(A). The
results from the hydrostatic method show a transition from AFM to FM moment between 0 and 2%
strain. For the locally strained case, the transition occurs at higher compressive strains and to a lesser
degree. This discrepancy is considered to be the result of the influence of the neighbouring atoms, other
than the 1st nn, which remain fixed. The difference in internal energy is calculated as:
𝛥𝐸 =𝐸𝑠𝑡𝑟𝑎𝑖𝑛𝑒𝑑−𝐸𝑔𝑠
𝑛𝑑 (1)
where 𝐸𝑠𝑡𝑟𝑎𝑖𝑛𝑒𝑑 and 𝐸𝑔𝑠 are the total internal energy of the strained and ground state supercell,
respectively, normalised to the number of displaced atoms (nd). The results follow the expected parabolic
distribution where deviation from the ground state configuration leads to less favourable energies
(Fig. 8(B)).
Fig. 8. Magnetic moment of Mn (A) and difference in internal energy of strained and ground-state supercell,
E, normalised by the number of strained atoms (B) with a comparison between hydrostatic strain (open
squares) and local 1st nn strain (closed circles).

14
These results suggest that the disagreement between observed experimental magnetic moment of
Mn is likely due to the different conditions of the samples. Non-equilibrium features such as increased
defect concentrations and residual stress, due to quenching or cold-working, are expected to have a large
impact on the measured magnetic moment of Mn in Fe. A lattice parameter change of 0.03 Å equates to
a strain of 1%. Experimentally, an increase in temperature of ~250 K leads to lattice parameter increase
of 0.01 Å for -Fe55. Without considering phonon interactions and other temperature effects, it is
postulated that it is entirely possible to observe both AFM and FM average moments in samples with
the same concentration of Mn providing the temperature is varied sufficiently or is under sufficient
elastic strain, as seen by Child et al.56 and Nakai et al.24. However, caution must be used when making
direct comparisons to experiment. This is because the approximation of the exchange-correlation
functional used by DFT introduces discrepancies to both the lattice parameter and magnitude of
magnetic moment57. Therefore, this result should be taken qualitatively and an experimental relation
between strain and magnetic moment is required to establish a quantitative relationship.
6. Effect of vacancies
Vacancies are ubiquitous in crystalline systems and vary in concentration depending on the
condition and processing of the sample58. Vacancy-solute clusters are a documented phenomenon59,60
and the binding of solute atoms to vacancies in -Fe is important for understanding solute partitioning,
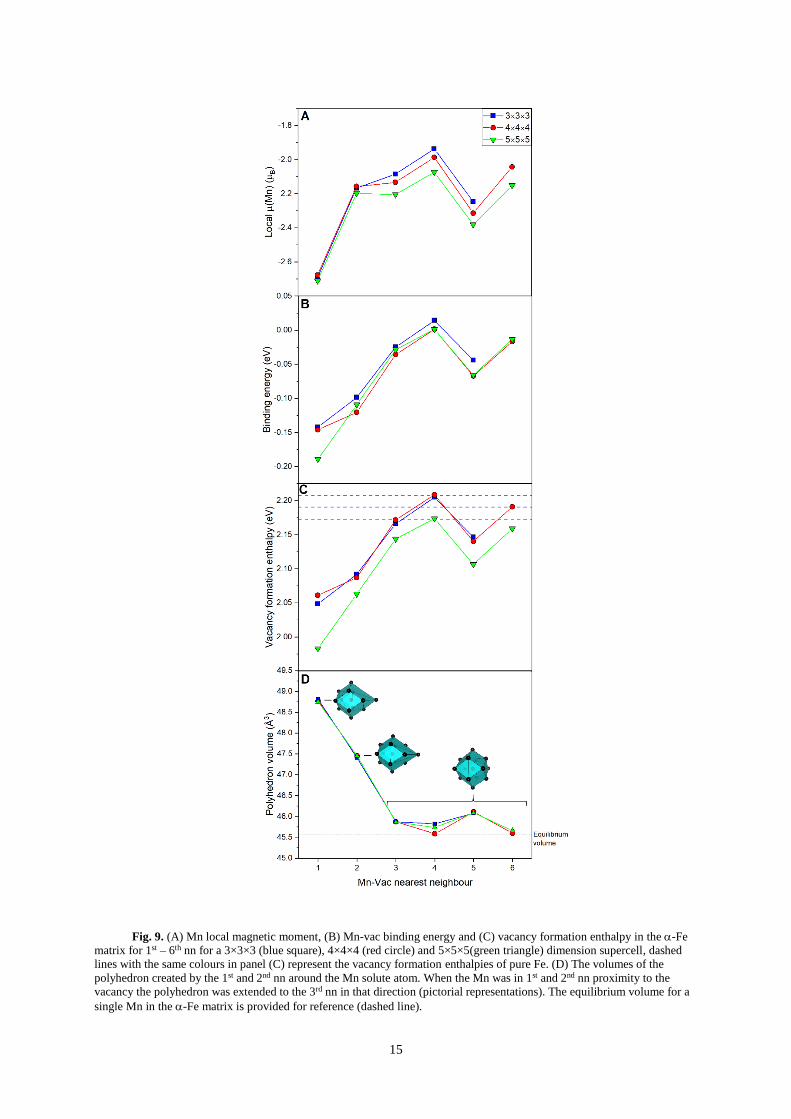
diffusivity and precipitation61–63. In Figure 9(A-C), the resultant magnetic moment, binding energy and
vacancy formation energy of Mn substitution are shown as a function of distance from a vacancy from
1st 6th nn.
15
Fig. 9. (A) Mn local magnetic moment, (B) Mn-vac binding energy and (C) vacancy formation enthalpy in the -Fe
matrix for 1st – 6th nn for a 3×3×3 (blue square), 4×4×4 (red circle) and 5×5×5(green triangle) dimension supercell, dashed
lines with the same colours in panel (C) represent the vacancy formation enthalpies of pure Fe. (D) The volumes of the
polyhedron created by the 1st and 2nd nn around the Mn solute atom. When the Mn was in 1st and 2nd nn proximity to the
vacancy the polyhedron was extended to the 3rd nn in that direction (pictorial representations). The equilibrium volume for a
single Mn in the -Fe matrix is provided for reference (dashed line).

16
The magnitudes and trend of the binding energies are in accordance with past theoretical
findings27,44,64. It is predicted that it is favourable for Mn to bind to an Fe vacancy, with a relatively long-
range attraction compared to other 3d transitional metals27,65,66. There is a clear stabilisation of the AFM
moment of Mn when in the 1st nn position and the binding energy between Mn and vacancy follows a
similar trend of the magnetic moment for all supercell sizes. This behaviour is different to many of the
other transition metals, which show little variance in magnetic moment with vacancy position27. The
vacancy formation enthalpies (Evac) follow the same trends seen in the magnetic moment and binding
energies. Compared to pure Fe, there is a significant lowering in Evac in the 1st and 2nd nn to the Mn.
Again, it must be emphasised that, when calculating the binding energy, the use of the metastable FM
Mn reference state in -Fe leads to a difference in binding energy of 0.06 eV (more favourable) to the
ground-state AFM reference state.
The non-linear trend in binding energies is interesting especially because it is expected that the
binding energy should tend to zero with increasing distance. Here, it is found that the Friedel-like
perturbations of the Fe around the vacancy dominate over those around the Mn substitution. By assessing
the volume of the polyhedron created by the 1st and 2nd nn around the Mn atom, a negative correlation
to the binding energies and magnetic moment is found, see Fig. 9(D). When Mn is in the 1st and 2nd nn
(to the vacancy) the polyhedron is extended to the 3rd nn (from Mn) in the direction of the absent site.
These findings follow the trend identified within this study i.e. the FM moment is stabilised by
compressive and AFM by tensile lattice strain. At equilibrium, without a vacancy, the 2nd nn polyhedron
volume containing Mn is calculated to be 45.60 Å3, which corresponds to the ground-state magnetic
moment of 2 B. When only using 1st nn polyhedron volumes no correlation was found.
From an applied perspective the equilibrium vacancy concentration is quite small in Fe ≤10-6
below the melting temperature2,67. However, when subject to displacive radiation damage these
concentrations can become non-trivial. It is possible that the increased stability when Mn is under local
tensile strain, in the presence of a vacancy, is the basis for solute-vacancy stabilisation seen
experimentally2 or hypothesised to occur due to nucleation of solutes from defects in RPV steels6.
17
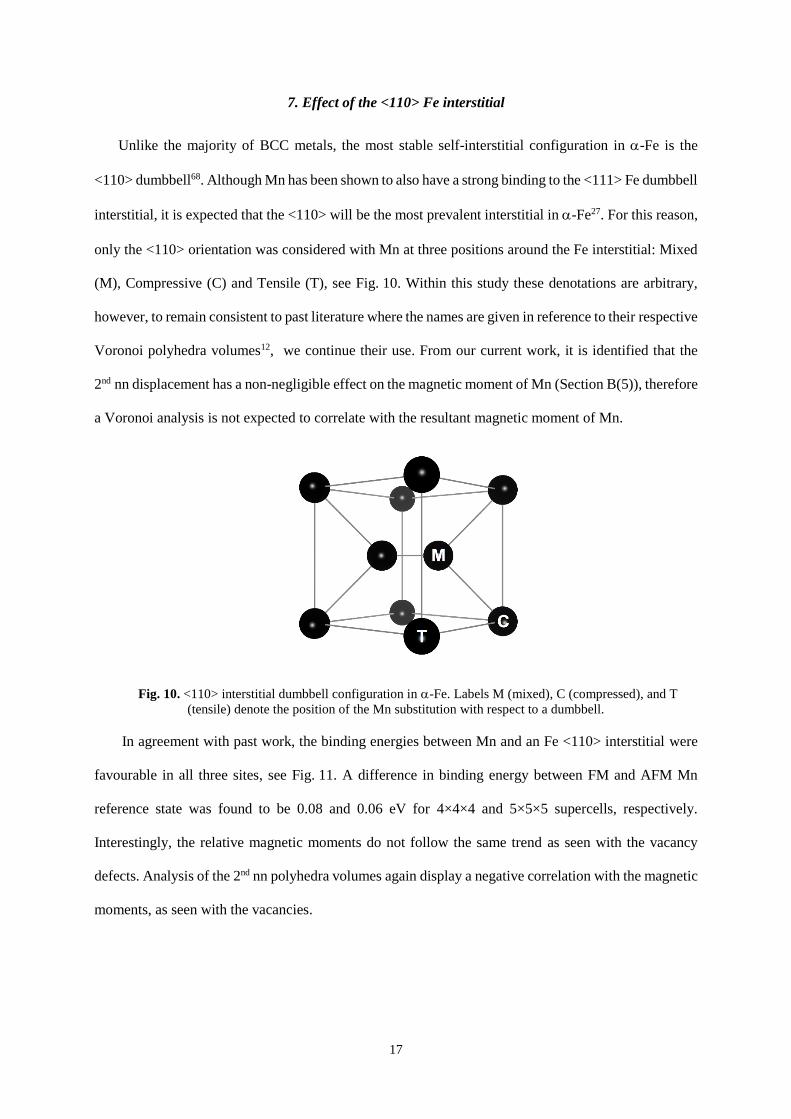
7. Effect of the <110> Fe interstitial
Unlike the majority of BCC metals, the most stable self-interstitial configuration in -Fe is the
<110> dumbbell68. Although Mn has been shown to also have a strong binding to the <111> Fe dumbbell
interstitial, it is expected that the <110> will be the most prevalent interstitial in -Fe27. For this reason,
only the <110> orientation was considered with Mn at three positions around the Fe interstitial: Mixed
(M), Compressive (C) and Tensile (T), see Fig. 10. Within this study these denotations are arbitrary,
however, to remain consistent to past literature where the names are given in reference to their respective
Voronoi polyhedra volumes12, we continue their use. From our current work, it is identified that the
2nd nn displacement has a non-negligible effect on the magnetic moment of Mn (Section B(5)), therefore
a Voronoi analysis is not expected to correlate with the resultant magnetic moment of Mn.
Fig. 10. <110> interstitial dumbbell configuration in -Fe. Labels M (mixed), C (compressed), and T
(tensile) denote the position of the Mn substitution with respect to a dumbbell.
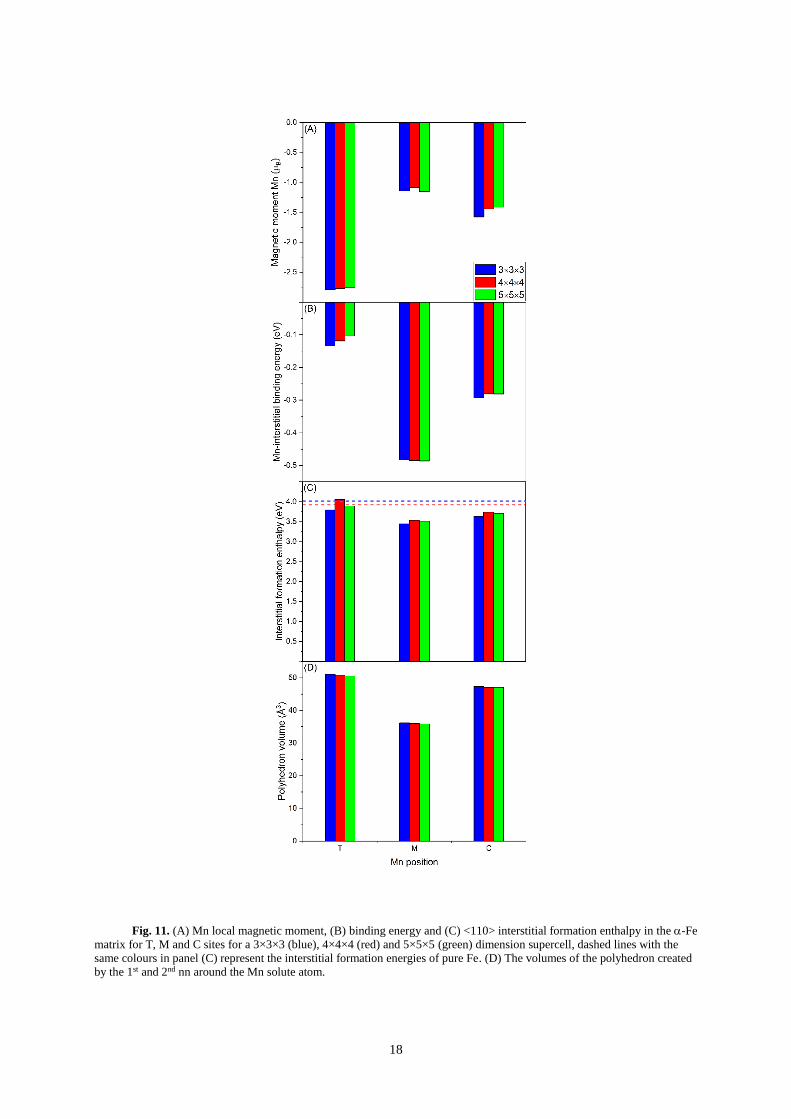
In agreement with past work, the binding energies between Mn and an Fe <110> interstitial were
favourable in all three sites, see Fig. 11. A difference in binding energy between FM and AFM Mn
reference state was found to be 0.08 and 0.06 eV for 4×4×4 and 5×5×5 supercells, respectively.
Interestingly, the relative magnetic moments do not follow the same trend as seen with the vacancy
defects. Analysis of the 2nd nn polyhedra volumes again display a negative correlation with the magnetic
moments, as seen with the vacancies.
18
Fig. 11. (A) Mn local magnetic moment, (B) binding energy and (C) <110> interstitial formation enthalpy in the -Fe
matrix for T, M and C sites for a 3×3×3 (blue), 4×4×4 (red) and 5×5×5 (green) dimension supercell, dashed lines with the
same colours in panel (C) represent the interstitial formation energies of pure Fe. (D) The volumes of the polyhedron created
by the 1st and 2nd nn around the Mn solute atom.

19
In the absence of Mn, the magnetic moment of the two Fe atoms in the <110> dumbbell
configuration, exhibit a weak AFM coupling to the matrix 0.27(2) B. Further, the 1st nn Fe atoms to
the dumbbell display a significant deviation in magnitude of their magnetic moment from the matrix.
The 4 Fe atoms in the geometrically equivalent C and T sites yield magnetic moments of ~1.72(7) and
~2.42(1) B, respectively, which vary only slightly with Mn substitution. It is likely that the introduction
of a self-interstitial atom sufficiently changes the atomic and magnetic structure so that the magnitudes
of the 2nd nn polyhedron volume vs magnetic moment relationship, determined for the undefective and
vacated cases, no longer holds true. Nevertheless, the coupling of Mn to Fe is consistently AFM.
IV. CONCLUSIONS
• The discrepancy in magnetic moment of Mn in -Fe, that exists between theory and experiment,
is likely due to susceptibility of the magnetic moment to change with strain. Here, it was found
that a hydrostatic compressive strain of 2% (0.06 Å) stabilised the FM state of Mn atoms
(relative to Fe). Strains imposed by quenching, cold working or thermal expansion are expected
to dominate over the effect due to Mn concentration, vacancies and Fe interstitial atoms.
Therefore, it is extremely important to provide experimental details pertaining to the lattice
parameter and sample conditions in future assessment of the magnetic moment of Mn in Fe.
• In the dilute case, it is possible to simulate both FM and AFM states of Mn, where the former
is metastable, by initialising the spin state on Mn to 4 and ≤ 2 B, respectively. The relaxations
of the Fe atoms around the FM and AFM Mn differ significantly. A long range tensile relaxation
in the <111> and compression in the <100> and <201> occur for the AFM case and strictly
compressive relaxations for the FM. The AFM state is the ground state for dilute Mn defects in
-Fe should be used as a reference state to calculate the binding energies of defect complexes
in future work.
• At higher Mn concentrations, Mn exhibits AFM and FM spin states in a stochastic manner with
an average moment of ~0.06 B and median of ~0.70 B. By providing a statistically significant
dataset, we show that the previous theory of a uniform switch from AFM to FM between

20
2 – 3 at. % Mn, is an artefact of inadequate statistical sampling. This randomness is likely due
to a combination of shallow energy landscape between AFM and FM spin-states and the
inability for relaxations of the surrounding atoms to occur for specific geometries and
concentrations of Mn, as to allow for exclusively one state to exist.
• A vacancy and <110> Fe interstitial were both found to stabilise the AFM moment of Mn. The
atomic relaxations due to the defects dominate over those around the Mn substitution.
Polyhedron analysis of the atoms within the 2nd nn to Mn show a negative correlation between
volume and magnetic moment with varying nn distance to the vacancy/interstitial. This result
suggests that the relationship between magnetic moment and local strain still exists when in the
presence of a vacancy or interstitial.
Acknowledgements
Mark Wenman and Daniel King were funded by EPSRC grant no. EP/P005101/1. Thomas Whiting
acknowledges support through the CDT in nuclear energy grant no. EP/L015900/1 and funding from
Rolls-Royce Plc. This research was undertaken with the assistance of resources provided by the EPSRC
Tier 2 allocation on CSD3 (Skylake and KNL) HPCs, Australian National Computational Infrastructure
provided by UNSW (Raijin) and Imperial College Tier 2 computing (Cx1 and Cx2). We would also like
to thank Dr. G. Malcolm Stocks for this discussion and contribution to the work.

21
References
1 R. Ngayam-Happy, C.S. Becquart, C. Domain, and L. Malerba, J. Nucl. Mater. 426, 198 (2012). 2 Y. Nagai, K. Takadate, Z. Tang, H. Ohkubo, H. Sunaga, H. Takizawa, and M. Hasegawa, Phys. Rev. B 67,
224202 (2003). 3 H.J. Beattie and F.L. VerSnyder, Nature 178, 208 (1956). 4 J.M. Vitek, Metall. Trans. A 18, 154 (1987). 5 Y. Matsukawa, T. Takeuchi, Y. Kakubo, T. Suzudo, H. Watanabe, H. Abe, T. Toyama, and Y. Nagai, Acta
Mater. 116, 104 (2016). 6 G.R. Odette and G.E. Lucas, JOM 53, 18 (2001). 7 R. Chaouadi and R. Gérard, J. Nucl. Mater. 345, 65 (2005). 8 P.B. Wells, T. Yamamoto, B. Miller, T. Milot, J. Cole, Y. Wu, and G.R. Odette, Acta Mater. 80, 205 (2014). 9 L. Malerba *, C.S. Becquart, M. Hou, and C. Domain, Philos. Mag. 85, 417 (2005). 10 C.S. Becquart, Nucl. Instruments Methods Phys. Res. Sect. B Beam Interact. with Mater. Atoms 228, 111
(2005). 11 N. Soneda, in Mater. Issues Gener. IV Syst. (Springer, 2008), pp. 245–262. 12 D.J. Hepburn, G.J. Ackland, and P. Olsson, Philos. Mag. 89, 3393 (2009). 13 G. Bonny, D. Terentyev, A. Bakaev, E.E. Zhurkin, M. Hou, D. Van Neck, and L. Malerba, J. Nucl. Mater.
442, 282 (2013). 14 D. Hobbs and J. Hafner, J. Phys. Condens. Matter 13, L681 (2001). 15 T. Yamada, N. Kunitomi, Y. Nakai, D.E. Cox, and G. Shirane, J. Phys. Soc. Japan 28, 615 (1970). 16 J. Hafner and D. Hobbs, Phys. Rev. B 68, 14408 (2003). 17 F. Boakye, K.G. Adanu, and A.D.C. Grassie, Mater. Lett. 18, 320 (1994). 18 V.L. Moruzzi, P.M. Marcus, K. Schwarz, and P. Mohn, Phys. Rev. B 34, 1784 (1986). 19 H.C. Herper, E. Hoffmann, and P. Entel, Phys. Rev. B 60, 3839 (1999). 20 M.I. Mendelev, S. Han, D.J. Srolovitz, G.J. Ackland, D.Y. Sun, and M. Asta, Philos. Mag. 83, 3977 (2003). 21 D. Bagayoko and J. Callaway, Phys. Rev. B 28, 5419 (1983). 22 M. Pajda, J. Kudrnovsky, I. Turek, V. Drchal, and P. Bruno, Phys. Rev. B 64, (2001). 23 V.T. Witusiewicz, F. Sommer, and E.J. Mittemeijer, J. Phase Equilibria Diffus. 25, 346 (2004). 24 Y. Nakai and N. Kunitomi, J. Phys. Soc. Japan 39, 1257 (1975). 25 H. Yamauchi, H. Watanabe, Y. Suzuki, and H. Saito, J. Phys. Soc. Japan 36, 971 (1974). 26 P. Radhakrishna and F. Livet, Solid State Commun. 25, 597 (1978). 27 P. Olsson, T.P.C. Klaver, and C. Domain, Phys. Rev. B 81, 54102 (2010). 28 G. Kresse and J. Furthmüller, Phys. Rev. B 54, 169 (1996). 29 J.P. Perdew, K. Burke, and M. Ernzerhof, Phys. Rev. Lett. 77, 3865 (1996). 30 G. Kresse and D. Joubert, Phys. Rev. B 59, 1758 (1999). 31 M. Methfessel and A.T. Paxton, Phys. Rev. B 40, 3616 (1989). 32 P.E. Blöchl, O. Jepsen, and O.K. Andersen, Phys. Rev. B 49, 16223 (1994). 33 C. Varvenne, F. Bruneval, M. Marinica, and E. Clouet, Phys. Rev. B 88, 1 (2013). 34 E. Clouet, S. Garruchet, H. Nguyen, M. Perez, and C.S. Becquart, Acta Mater. 56, 3450 (2008). 35 R. Nazarov, J.S. Majevadia, M. Patel, M.R. Wenman, D.S. Balint, J. Neugebauer, and A.P. Sutton, Phys. Rev.
B 94, 241112 (2016). 36 P.H.T. Philipsen and E.J. Baerends, Phys. Rev. B 54, 5326 (1996). 37 J. Häglund, A.F. Guillermet, G. Grimvall, and M. Körling, Phys. Rev. B 48, 11685 (1993). 38 S.A. Fuji, S., S. Ishida, J. Phys. Soc. Japan 60, 1193 (1991). 39 C. Kittel, Introduction to Solid State Physics (Wiley, 2005). 40 J.A. t Oberteuffer and J.A. Ibers, Acta Crystallogr. Sect. B Struct. Crystallogr. Cryst. Chem. 26, 1499 (1970). 41 C.B. Shoemaker, D.P. Shoemaker, T.E. Hopkins, and S. Yindepit, Acta Crystallogr. Sect. B Struct.
Crystallogr. Cryst. Chem. 34, 3573 (1978). 42 E. Rapoport and G.C. Kennedy, J. Phys. Chem. Solids 27, 93 (1966). 43 K. Lejaeghere, V. Van Speybroeck, G. Van Oost, and S. Cottenier, Crit. Rev. Solid State Mater. Sci. 39, 1
(2014). 44 E. Vincent, C.S. Becquart, and C. Domain, Nucl. Instruments Methods Phys. Res. Sect. B Beam Interact. with
Mater. Atoms 228, 137 (2005). 45 D. Vanderbilt, Phys. Rev. B 41, 7892 (1990). 46 B. Drittler, N. Stefanou, S. Blügel, R. Zeller, and P.H. Dederichs, Phys. Rev. B 40, 8203 (1989). 47 V.I. Anisimov, V.P. Antropov, A.I. Liechtenstein, V.A. Gubanov, and A. V Postnikov, Phys. Rev. B 37, 5598
(1988). 48 C. Freysoldt, B. Grabowski, T. Hickel, J. Neugebauer, G. Kresse, A. Janotti, and C.G. Van de Walle, Rev.

22
Mod. Phys. 86, 253 (2014). 49 P.A. Burr and M.W.D. Cooper, Phys. Rev. B 96, 94107 (2017). 50 A. Bakaev, D. Terentyev, X. He, and D. Van Neck, J. Nucl. Mater. 455, 5 (2014). 51 A.A. Mirzoev, M.M. Yalalov, and D.A. Mirzaev, Phys. Met. Metallogr. 101, 341 (2006). 52 N.I. Medvedeva, D.C. Van Aken, and J.E. Medvedeva, J. Phys. Condens. Matter 23, 326003 (2011). 53 D.L. Price and K. Skold, in Neutron Scatt., edited by K. Sköld and D.L.B.T.-M. in E.P. Price (Academic
Press, 1986), pp. 1–97. 54 J.W. Cable and Y. Tsunoda, Phys. Rev. B 50, 9200 (1994). 55 Z.S. Basinski, W. Hume-Rothery, and A.L. Sutton, in Proc. R. Soc. London A Math. Phys. Eng. Sci. (The
Royal Society, 1955), pp. 459–467. 56 H.R. Child and J.W. Cable, Phys. Rev. B 13, 227 (1976). 57 P. Haas, F. Tran, and P. Blaha, Phys. Rev. B 79, (2009). 58 R.W. Siegel, J. Nucl. Mater. 69, 117 (1978). 59 M. Doyama, J. Nucl. Mater. 69–70, 350 (1978). 60 M.L. Fullarton, R.E. Voskoboinikov, and S.C. Middleburgh, J. Alloys Compd. 587, 794 (2014). 61 T. Garnier, M. Nastar, P. Bellon, and D.R. Trinkle, Phys. Rev. B 88, 134201 (2013). 62 L. Messina, Z. Chang, and P. Olsson, Nucl. Instruments Methods Phys. Res. Sect. B Beam Interact. with
Mater. Atoms 303, 28 (2013). 63 L. Messina, L. Malerba, and P. Olsson, Nucl. Instruments Methods Phys. Res. Sect. B Beam Interact. with
Mater. Atoms 352, 61 (2015). 64 T. Ohnuma, N. Soneda, and M. Iwasawa, Acta Mater. 57, 5947 (2009). 65 L. Messina, M. Nastar, T. Garnier, C. Domain, and P. Olsson, Phys. Rev. B 90, 104203 (2014). 66 L. Messina, M. Nastar, N. Sandberg, and P. Olsson, Phys. Rev. B 93, 184302 (2016). 67 H.-E. Schaefer, K. Maier, M. Weller, D. Herlach, A. Seeger, and J. Diehl, Scr. Metall. 11, 803 (1977). 68 C.-C. Fu, F. Willaime, and P. Ordejón, Phys. Rev. Lett. 92, 175503 (2004).